| |
| SECURITIES AND EXCHANGE COMMISSION |
| |
| CERTIFIED SHAREHOLDER REPORT OF REGISTERED |
| |
| MANAGEMENT INVESTMENT COMPANIES |
| | |
| Investment Company Act file number: | (811-05346) |
| | |
| Exact name of registrant as specified in charter: | Putnam Variable Trust |
| | |
| Address of principal executive offices: | 100 Federal Street, Boston, Massachusetts 02110 |
| | |
| Name and address of agent for service: | Stephen Tate, Vice President |
| | |
| | Boston, Massachusetts 02110 |
| | |
| Copy to: | Bryan Chegwidden, Esq. |
| | |
| | 1211 Avenue of the Americas |
| | |
| | Boston, Massachusetts 02199 |
| | |
| Registrant’s telephone number, including area code: | (617) 292-1000 |
| | |
| Date of fiscal year end: | December 31, 2024 |
| | |
| Date of reporting period: | January 1, 2024 – December 31, 2024 |
| |
| Item 1. Report to Stockholders: |
| |
| The following is a copy of the report transmitted to stockholders pursuant to Rule 30e-1 under the Investment Company Act of 1940: |
| | |
Putnam VT Global Asset Allocation Fund | |
Class IA true |
| Annual Shareholder Report | December 31, 2024 |
|
This annual shareholder report contains important information about Putnam VT Global Asset Allocation Fund for the period January 1, 2024, to December 31, 2024.
You can find additional information about the Fund at https://www.franklintempleton.com/regulatory-fund-documents. You can also request this information by contacting us at (800) 225-1581.
This report describes changes to the Fund that occurred during the reporting period.
WHAT WERE THE FUND COSTS FOR THE LAST YEAR? (based on a hypothetical $10,000 investment)
| | |
Class Name | Costs of a $10,000 investment | Costs paid as a percentage of a $10,000 investment* |
Class IA1 | $92 | 0.85% |
| * | Reflects fee waivers and/or expense reimbursements, without which expenses would have been higher. |
| 1 | Does not reflect expenses incurred from investing through variable annuity or variable life insurance products. |
HOW DID THE FUND PERFORM LAST YEAR AND WHAT AFFECTED ITS PERFORMANCE?
For the twelve months ended December 31, 2024, Class IA shares of Putnam VT Global Asset Allocation Fund returned 16.63%. The Fund compares its performance to the Russell 3000 Index and the Putnam Balanced Blended Benchmark†, which returned 23.81% and 12.80%, respectively, for the same period.
| |
Top contributors to performance: |
| Security selection effects relative to the benchmark within these underlying strategies: |
| ↑ | Quantitative U.S. Large Cap Equity strategy |
| ↑ | Quantitative International Enhanced Equity |
| ↑ | Fundamental Global Asset Allocation equity strategy |
| |
Top detractors from performance: |
| ↓ | Security selection effects within the underlying Quantitative U.S. Small Cap Equity strategy detracted from benchmark-relative results. |
Use of derivatives and the impact on performance:
The Fund utilized futures for managing exposure to market risk, for hedging prepayment risk, for hedging interest rate risk, for gaining exposure to interest rates and for equitizing cash, which collectively detracted from performance.
| Putnam VT Global Asset Allocation Fund | PAGE 1 | 38923-ATSIA-0225 |
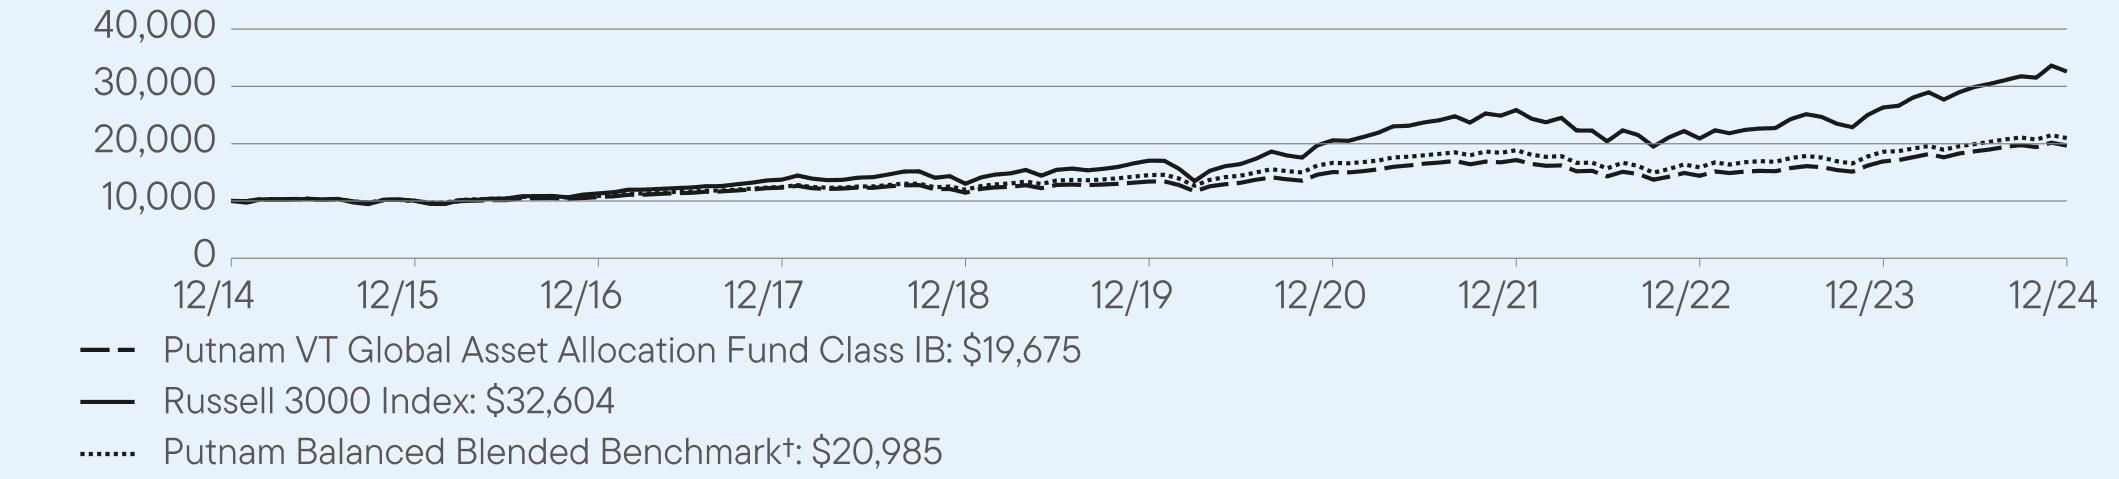
HOW DID THE FUND PERFORM OVER THE LAST 10 YEARS?
The Fund’s past performance is not necessarily an indication of how the Fund will perform in the future. The graph and table do not reflect the deduction of taxes that a shareholder would pay on Fund distributions or redemption of Fund shares.
VALUE OF A $10,000 INVESTMENT – Class IA 12/31/2014 — 12/31/2024
AVERAGE ANNUAL TOTAL RETURNS (%) Period Ended December 31, 2024
| | | |
| | 1 Year | 5 Year | 10 Year |
Class IA | 16.63 | 8.27 | 7.27 |
Russell 3000 Index | 23.81 | 13.86 | 12.55 |
Putnam Balanced Blended Benchmark† | 12.80 | 7.65 | 7.69 |
| † | The Putnam Balanced Blended Benchmark is comprised of 50% Russell 3000 Index, 35% Bloomberg U.S. Aggregate Index, 10% MSCI EAFE Index-NR, and 5% JPMorgan Developed High Yield Index. |
Performance does not reflect expenses incurred from investing through variable annuity or variable life insurance products, which if reflected, would reduce performance of the Fund.
Fund performance figures may reflect fee waivers and/or expense reimbursements, without which the performance would have been lower.
Important data provider notices and terms available at www.franklintempletondatasources.com.
KEY FUND STATISTICS (as of December 31, 2024)
| |
Total Net Assets | $102,799,336 |
Total Number of Portfolio Holdings* | 1,306 |
Total Management Fee Paid | $558,954 |
Portfolio Turnover Rate | 234% |
| * | Includes derivatives, if applicable. |
| Putnam VT Global Asset Allocation Fund | PAGE 2 | 38923-ATSIA-0225 |
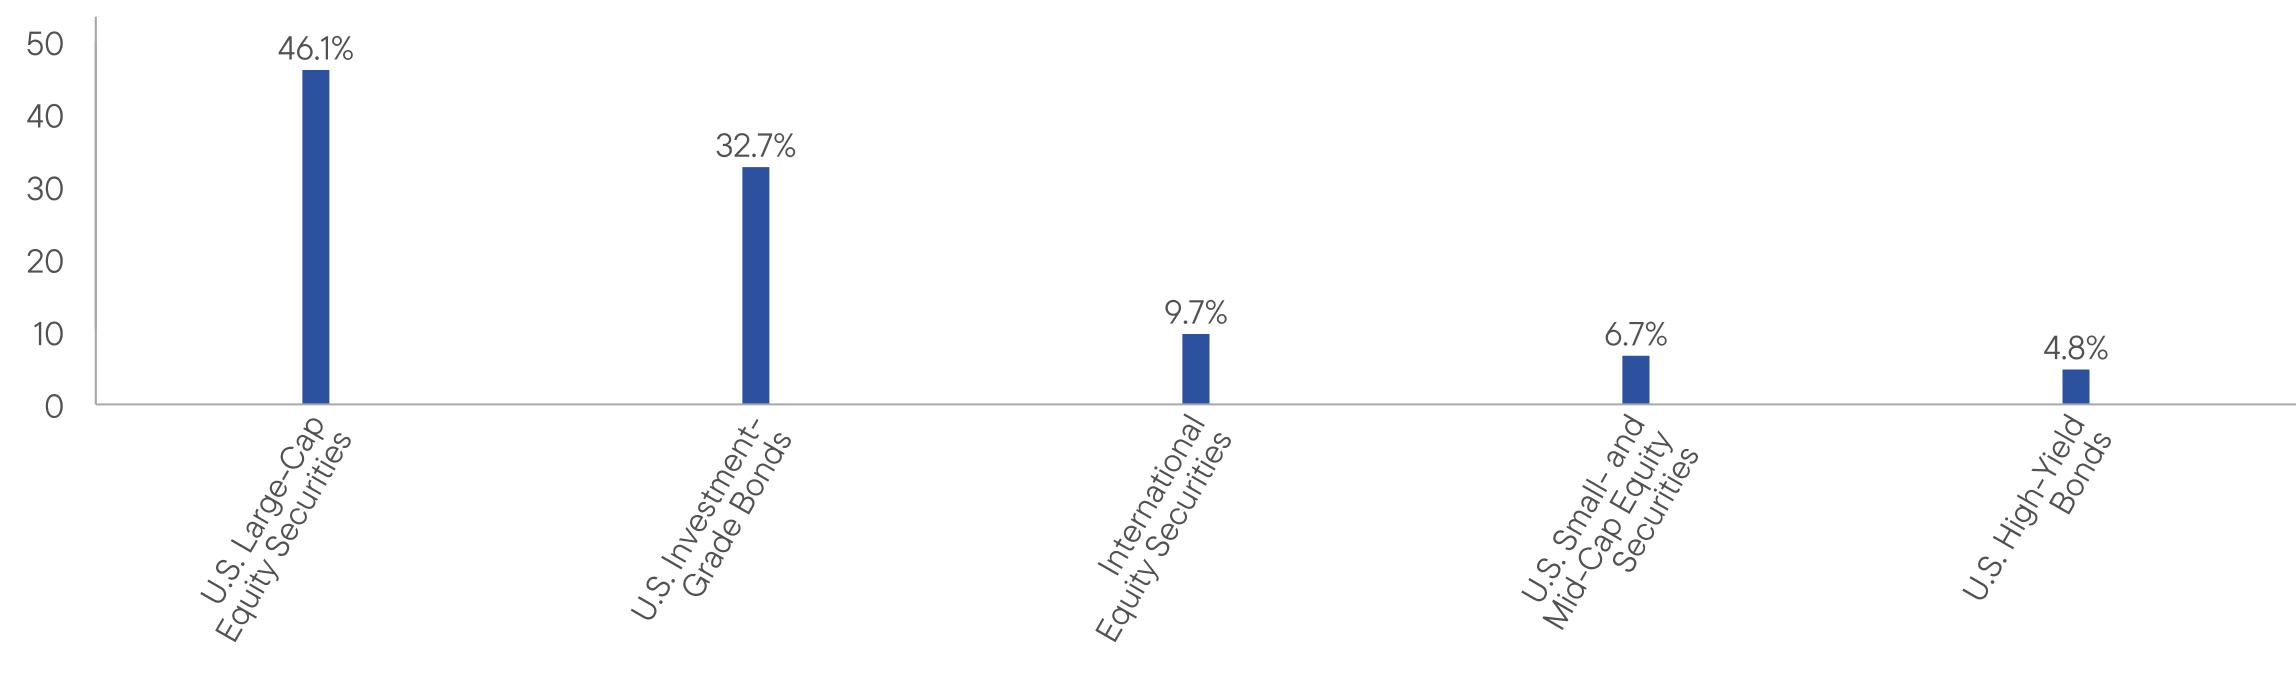
WHAT DID THE FUND INVEST IN? (as of December 31, 2024)
Portfolio Composition (% of Total Net Assets)
| U.S. Money Market Securities, if any, represent the market value weights of cash, short-term securities, and derivative notional offsets in the portfolio. Holdings and allocations may vary over time. |
HOW HAS THE FUND CHANGED?
On May 31, 2023, Franklin Resources, Inc. (“Franklin Templeton”) and Great-West Lifeco Inc., the parent company of Putnam U.S. Holdings I, LLC (“Putnam Holdings”), announced that they had entered into a definitive agreement for a subsidiary of Franklin Templeton to acquire Putnam Holdings in a stock and cash transaction (the “Transaction”). The Transaction was completed on January 1, 2024. As part of the Transaction, your Fund’s investment advisor, Putnam Investment Management, LLC (“Putnam Management”), a wholly-owned subsidiary of Putnam Holdings, and your Fund’s then-current sub-advisors, Putnam Investments Limited (“PIL”) and The Putnam Advisory Company, LLC (“PAC”), indirect, wholly-owned subsidiaries of Putnam Holdings, became indirect, wholly-owned subsidiaries of Franklin Templeton. In connection with the Transaction, shareholders of your Fund approved a new management contract with Putnam Management and new sub-advisory contracts with PIL and PAC. The new contracts were identical to the previous contracts, except for the effective dates, initial terms, updates to fund names as necessary to reflect previous name changes, and certain non-substantive changes.
Effective July 15, 2024, Putnam Management transferred its management contract for your Fund to Franklin Advisers, Inc. (“Franklin Advisers”), and Franklin Advisers replaced Putnam Management as the investment advisor to your Fund. In connection with the transfer, your Fund’s portfolio managers, along with supporting research analysts and certain other investment staff of Putnam Management, also became employees of Franklin Advisers. Putnam Management also transferred to Franklin Advisers its sub-management agreement with PIL in respect of your Fund. Franklin Advisers is a direct, wholly-owned subsidiary of Franklin Templeton. In addition, effective July 15, 2024, Franklin Advisers retained Putnam Management as a sub-advisor to your Fund pursuant to a new sub-advisory agreement.
Effective November 1, 2024 (the “Effective Date”), PIL, a sub-advisor of the Fund prior to the Effective Date, merged with and into Franklin Templeton Investment Management Limited (“FTIML”), a wholly-owned subsidiary of Franklin Templeton (the “Merger”). As of the Effective Date, PIL investment professionals became employees of FTIML, and the sub-advisory agreement between Franklin Advisers and PIL with respect to the Fund was terminated. In connection with the Merger, the Fund’s Trustees approved a new sub-advisory agreement between Franklin Advisers and FTIML, pursuant to which FTIML became a sub-advisor of the Fund on the Effective Date.
This is a summary of certain changes to the Fund since January 1, 2024. For more complete information, you may review the Fund’s current prospectus and any applicable supplements and the Fund’s next prospectus, which we expect to be available by May 1, 2025, at https://www.franklintempleton.com/regulatory-fund-documents or upon request at (800) 225-1581 or
funddocuments@putnam.com.
| |
| WHERE CAN I FIND ADDITIONAL INFORMATION ABOUT THE FUND? |
Additional information is available on https://www.franklintempleton.com/regulatory-fund-documents, including its: |
| • prospectus • proxy voting information • financial information • holdings • tax information |
| Putnam VT Global Asset Allocation Fund | PAGE 3 | 38923-ATSIA-0225 |
10000100421074312426115531356515272174481468817300201781000010048113271372113002170352059325877209072633432604100001003510875124431195814513166611886415872186032098546.132.79.76.74.8
| | |
Putnam VT Global Asset Allocation Fund | |
Class IB true |
| Annual Shareholder Report | December 31, 2024 |
|
This annual shareholder report contains important information about Putnam VT Global Asset Allocation Fund for the period January 1, 2024, to December 31, 2024.
You can find additional information about the Fund at https://www.franklintempleton.com/regulatory-fund-documents. You can also request this information by contacting us at (800) 225-1581.
This report describes changes to the Fund that occurred during the reporting period.
WHAT WERE THE FUND COSTS FOR THE LAST YEAR? (based on a hypothetical $10,000 investment)
| | |
Class Name | Costs of a $10,000 investment | Costs paid as a percentage of a $10,000 investment* |
Class IB1 | $119 | 1.10% |
| * | Reflects fee waivers and/or expense reimbursements, without which expenses would have been higher. |
| 1 | Does not reflect expenses incurred from investing through variable annuity or variable life insurance products. |
HOW DID THE FUND PERFORM LAST YEAR AND WHAT AFFECTED ITS PERFORMANCE?
For the twelve months ended December 31, 2024, Class IB shares of Putnam VT Global Asset Allocation Fund returned 16.36%. The Fund compares its performance to the Russell 3000 Index and the Putnam Balanced Blended Benchmark†, which returned 23.81% and 12.80%, respectively, for the same period.
| |
Top contributors to performance: |
| Security selection effects relative to the benchmark within these underlying strategies: |
| ↑ | Quantitative U.S. Large Cap Equity strategy |
| ↑ | Quantitative International Enhanced Equity |
| ↑ | Fundamental Global Asset Allocation equity strategy |
| |
Top detractors from performance: |
| ↓ | Security selection effects within the underlying Quantitative U.S. Small Cap Equity strategy detracted from benchmark-relative results. |
Use of derivatives and the impact on performance:
The Fund utilized futures for managing exposure to market risk, for hedging prepayment risk, for hedging interest rate risk, for gaining exposure to interest rates and for equitizing cash, which collectively detracted from performance.
| Putnam VT Global Asset Allocation Fund | PAGE 1 | 38923-ATSIB-0225 |
HOW DID THE FUND PERFORM OVER THE LAST 10 YEARS?
The Fund’s past performance is not necessarily an indication of how the Fund will perform in the future. The graph and table do not reflect the deduction of taxes that a shareholder would pay on Fund distributions or redemption of Fund shares.
VALUE OF A $10,000 INVESTMENT – Class IB 12/31/2014 — 12/31/2024
AVERAGE ANNUAL TOTAL RETURNS (%) Period Ended December 31, 2024
| | | |
| | 1 Year | 5 Year | 10 Year |
Class IB | 16.36 | 8.00 | 7.00 |
Russell 3000 Index | 23.81 | 13.86 | 12.55 |
Putnam Balanced Blended Benchmark† | 12.80 | 7.65 | 7.69 |
| † | The Putnam Balanced Blended Benchmark is comprised of 50% Russell 3000 Index, 35% Bloomberg U.S. Aggregate Index, 10% MSCI EAFE Index-NR, and 5% JPMorgan Developed High Yield Index. |
Performance does not reflect expenses incurred from investing through variable annuity or variable life insurance products, which if reflected, would reduce performance of the Fund.
Fund performance figures may reflect fee waivers and/or expense reimbursements, without which the performance would have been lower.
Important data provider notices and terms available at www.franklintempletondatasources.com.
KEY FUND STATISTICS (as of December 31, 2024)
| |
Total Net Assets | $102,799,336 |
Total Number of Portfolio Holdings* | 1,306 |
Total Management Fee Paid | $558,954 |
Portfolio Turnover Rate | 234% |
| * | Includes derivatives, if applicable. |
| Putnam VT Global Asset Allocation Fund | PAGE 2 | 38923-ATSIB-0225 |
WHAT DID THE FUND INVEST IN? (as of December 31, 2024)
Portfolio Composition (% of Total Net Assets)
| U.S. Money Market Securities, if any, represent the market value weights of cash, short-term securities, and derivative notional offsets in the portfolio. Holdings and allocations may vary over time. |
HOW HAS THE FUND CHANGED?
On May 31, 2023, Franklin Resources, Inc. (“Franklin Templeton”) and Great-West Lifeco Inc., the parent company of Putnam U.S. Holdings I, LLC (“Putnam Holdings”), announced that they had entered into a definitive agreement for a subsidiary of Franklin Templeton to acquire Putnam Holdings in a stock and cash transaction (the “Transaction”). The Transaction was completed on January 1, 2024. As part of the Transaction, your Fund’s investment advisor, Putnam Investment Management, LLC (“Putnam Management”), a wholly-owned subsidiary of Putnam Holdings, and your Fund’s then-current sub-advisors, Putnam Investments Limited (“PIL”) and The Putnam Advisory Company, LLC (“PAC”), indirect, wholly-owned subsidiaries of Putnam Holdings, became indirect, wholly-owned subsidiaries of Franklin Templeton. In connection with the Transaction, shareholders of your Fund approved a new management contract with Putnam Management and new sub-advisory contracts with PIL and PAC. The new contracts were identical to the previous contracts, except for the effective dates, initial terms, updates to fund names as necessary to reflect previous name changes, and certain non-substantive changes.
Effective July 15, 2024, Putnam Management transferred its management contract for your Fund to Franklin Advisers, Inc. (“Franklin Advisers”), and Franklin Advisers replaced Putnam Management as the investment advisor to your Fund. In connection with the transfer, your Fund’s portfolio managers, along with supporting research analysts and certain other investment staff of Putnam Management, also became employees of Franklin Advisers. Putnam Management also transferred to Franklin Advisers its sub-management agreement with PIL in respect of your Fund. Franklin Advisers is a direct, wholly-owned subsidiary of Franklin Templeton. In addition, effective July 15, 2024, Franklin Advisers retained Putnam Management as a sub-advisor to your Fund pursuant to a new sub-advisory agreement.
Effective November 1, 2024 (the “Effective Date”), PIL, a sub-advisor of the Fund prior to the Effective Date, merged with and into Franklin Templeton Investment Management Limited (“FTIML”), a wholly-owned subsidiary of Franklin Templeton (the “Merger”). As of the Effective Date, PIL investment professionals became employees of FTIML, and the sub-advisory agreement between Franklin Advisers and PIL with respect to the Fund was terminated. In connection with the Merger, the Fund’s Trustees approved a new sub-advisory agreement between Franklin Advisers and FTIML, pursuant to which FTIML became a sub-advisor of the Fund on the Effective Date.
This is a summary of certain changes to the Fund since January 1, 2024. For more complete information, you may review the Fund’s current prospectus and any applicable supplements and the Fund’s next prospectus, which we expect to be available by May 1, 2025, at https://www.franklintempleton.com/regulatory-fund-documents or upon request at (800) 225-1581 or
funddocuments@putnam.com.
| |
| WHERE CAN I FIND ADDITIONAL INFORMATION ABOUT THE FUND? |
Additional information is available on https://www.franklintempleton.com/regulatory-fund-documents, including its: |
| • prospectus • proxy voting information • financial information • holdings • tax information |
| Putnam VT Global Asset Allocation Fund | PAGE 3 | 38923-ATSIB-0225 |
10000100171069012329114341339315041171401439316909196751000010048113271372113002170352059325877209072633432604100001003510875124431195814513166611886415872186032098546.132.79.76.74.8
| |
| (a) The fund’s principal executive, financial and accounting officers are employees of Putnam Investment Management, LLC, the Fund’s investment manager, or Franklin Templeton. As such they are subject to a comprehensive Code of Ethics adopted and administered by Putnam Investment Management, LLC and Franklin Templeton which is designed to protect the interests of the firm and its clients. The Fund has adopted a Code of Ethics which incorporates the Code of Ethics of Franklin Templeton with respect to all of its officers and Trustees who are employees of Putnam Investment Management, LLC and Franklin Templeton. For this reason, the Fund has not adopted a separate code of ethics governing its principal executive, financial and accounting officers. |
| |
| (c) In connection with the acquisition of Putnam Investments by Franklin Templeton, the Putnam Investments Code of Ethics was amended effective January 1, 2024 to reflect revised compliance processes, including: (i) Compliance with the Putnam Investments Code of Ethics will be viewed as compliance with the Franklin Templeton Code for certain Putnam employees who are dual-hatted in Franklin Templeton advisory entities (ii) Certain Franklin Templeton employees are required to hold shares of Putnam mutual funds at Putnam Investor Services, Inc. and (iii) Certain provisions of the Putnam Investments Code of Ethics are amended that are no longer needed due to organizational changes. Effective March 4, 2024, the majority of legacy Putnam employees transitioned to Franklin Templeton policies outlined in the Franklin Templeton Code. |
| |
| Item 3. Audit Committee Financial Expert: |
| |
| The Funds’ Audit, Compliance and Risk Committee is comprised solely of Trustees who are “independent” (as such term has been defined by the Securities and Exchange Commission (“SEC”) in regulations implementing Section 407 of the Sarbanes-Oxley Act (the “Regulations”)). The Trustees believe that each member of the Audit, Compliance and Risk Committee also possesses a combination of knowledge and experience with respect to financial accounting matters, as well as other attributes, that qualifies him or her for service on the Committee. In addition, the Trustees have determined that each of Mr. McGreevey and Mr. Singh qualifies as an “audit committee financial expert” (as such term has been defined by the Regulations) based on their review of his or her pertinent experience and education.The SEC has stated, and the funds’ amended and restated agreement and Declaration of Trust provides, that the designation or identification of a person as an audit committee financial expert pursuant to this Item 3 of Form N-CSR does not impose on such person any duties, obligations or liability that are greater than the duties, obligations and liability imposed on such person as a member of the Audit, Compliance and Risk Committee and the Board of Trustees in the absence of such designation or identification. |
| |
| Item 4. Principal Accountant Fees and Services: |
| |
| The following table presents fees billed in each of the last two fiscal years for services rendered to the fund by the fund’s independent auditor: |
Fiscal year ended | Audit Fees | Audit-Related Fees | Tax Fees | All Other Fees |
December 31, 2024 | $119,462 | $ — | $9,616 | $ — |
December 31, 2023 | $120,835 | $ — | $10,636 | $ — |
| |
| For the fiscal years ended December 31, 2024 and December 31, 2023, the fund’s independent auditor billed aggregate non-audit fees in the amounts of $873,852 and $370,768 respectively, to the fund, the fund’s investment manager and any entity controlling, controlled by or under common control with the fund’s investment manager that provides ongoing services to the fund. |
| |
| Audit Fees represent fees billed for the fund’s last two fiscal years relating to the audit and review of the financial statements included in annual reports and registration statements, and other services that are normally provided in connection with statutory and regulatory filings or engagements. |
| |
| Audit-Related Fees represent fees billed in the fund’s last two fiscal years for services traditionally performed by the fund’s auditor, including accounting consultation for proposed transactions or concerning financial accounting and reporting standards and other audit or attest services not required by statute or regulation. |
| |
| Tax Fees represent fees billed in the fund’s last two fiscal years for tax compliance, tax planning and tax advice services. Tax planning and tax advice services include assistance with tax audits, employee benefit plans and requests for rulings or technical advice from taxing authorities. |
| |
| Pre-Approval Policies of the Audit, Compliance and Risk Committee. The Audit, Compliance and Risk Committee of the Putnam funds has determined that, as a matter of policy, all work performed for the funds by the funds’ independent auditors will be pre-approved by the Committee itself and thus will generally not be subject to pre-approval procedures. |
| |
| The Audit, Compliance and Risk Committee also has adopted a policy to pre-approve the engagement by the fund’s investment manager and certain of its affiliates of the funds’ independent auditors, even in circumstances where pre-approval is not required by applicable law. Any such requests by the fund’s investment manager or certain of its affiliates are typically submitted in writing to the Committee and explain, among other things, the nature of the proposed engagement, the estimated fees, and why this work should be performed by that particular audit firm as opposed to another one. In reviewing such requests, the Committee considers, among other things, whether the provision of such services by the audit firm are compatible with the independence of the audit firm. |
| |
| The following table presents fees billed by the fund’s independent auditor for services required to be approved pursuant to paragraph (c)(7)(ii) of Rule 2–01 of Regulation S-X. |
Fiscal year ended | Audit-Related Fees | Tax Fees | All Other Fees | Total Non-Audit Fees |
December 31, 2024 | $ — | $791,963 | $72,273 | $864,236 |
December 31, 2023 | $ — | $360,132 | $ — | $360,132 |
| |
| Item 5. Audit Committee of Listed Registrants |
| |
| The registrant’s schedule of investments in unaffiliated issuers is included in the Financial Statements and Other Important Information in Item 7 below. |
| |
| Item 7. Financial Statements and Financial Highlights for Open-End Management Investment Companies. |

Putnam
VT Global Asset Allocation
Fund
Financial Statements and Other Important Information
Annual | December 31, 2024

Table of Contents
| | Financial Statements and Other Important Information—Annual | franklintempleton.com |
Report of Independent Registered Public Accounting Firm
To the Board of Trustees of Putnam Variable Trust and Shareholders of
Putnam VT Global Asset Allocation Fund:
Opinion on the Financial Statements
We have audited the accompanying statement of assets and liabilities, including the fund's portfolio, of Putnam VT Global Asset Allocation Fund (one of the funds constituting Putnam Variable Trust, referred to hereafter as the “Fund”) as of December 31, 2024, the related statement of operations for the year ended December 31, 2024, the statement of changes in net assets for each of the two years in the period ended December 31, 2024, including the related notes, and the financial highlights for each of the five years in the period ended December 31, 2024 (collectively referred to as the “financial statements”). In our opinion, the financial statements present fairly, in all material respects, the financial position of the Fund as of December 31, 2024, the results of its operations for the year then ended, the changes in its net assets for each of the two years in the period ended December 31, 2024 and the financial highlights for each of the five years in the period ended December 31, 2024 in conformity with accounting principles generally accepted in the United States of America.
Basis for Opinion
These financial statements are the responsibility of the Fund's management. Our responsibility is to express an opinion on the Fund's financial statements based on our audits. We are a public accounting firm registered with the Public Company Accounting Oversight Board (United States) (“PCAOB”) and are required to be independent with respect to the Fund in accordance with the U.S. federal securities laws and the applicable rules and regulations of the Securities and Exchange Commission and the PCAOB.
We conducted our audits of these financial statements in accordance with the standards of the PCAOB. Those standards require that we plan and perform the audit to obtain reasonable assurance about whether the financial statements are free of material misstatement, whether due to error or fraud.
Our audits included performing procedures to assess the risks of material misstatement of the financial statements, whether due to error or fraud, and performing procedures that respond to those risks. Such procedures included examining, on a test basis, evidence regarding the amounts and disclosures in the financial statements. Our audits also included evaluating the accounting principles used and significant estimates made by management, as well as evaluating the overall presentation of the financial statements. Our procedures included confirmation of securities owned as of December 31, 2024 by correspondence with the custodian, transfer agent, agent banks and brokers; when replies were not received from brokers or agent banks, we performed other auditing procedures. We believe that our audits provide a reasonable basis for our opinion.
PricewaterhouseCoopers LLP
Boston, Massachusetts
February 18, 2025
We have served as the auditor of one or more investment companies in the Putnam Funds family of funds since at least 1957. We have not been able to determine the specific year we began serving as auditor.
| Putnam VT Global Asset Allocation Fund | 1 |
The fund’s portfolio 12/31/24 |
| | COMMON STOCKS (68.4%)* | Shares | Value |
| | Advertising and marketing services (0.1%) | | |
| | Publicis Groupe SA (France) | 806 | $85,806 |
| | Trade Desk, Inc. (The) Class A † | 482 | 56,649 |
| | | | 142,455 |
| | Automotive (1.4%) | | |
| | Carvana Co. † | 858 | 174,483 |
| | Ford Motor Co. | 6,215 | 61,529 |
| | Subaru Corp. (Japan) | 4,300 | 76,404 |
| | Tesla, Inc. † | 2,532 | 1,022,523 |
| | Toyota Motor Corp. (Japan) | 1,100 | 21,478 |
| | Volvo AB Class B (Sweden) | 3,426 | 83,259 |
| | | | 1,439,676 |
| | Basic materials (2.2%) | | |
| | Air Liquide SA (France) | 263 | 42,753 |
| | Archer-Daniels-Midland Co. | 1,149 | 58,047 |
| | Axalta Coating Systems, Ltd. † | 1,646 | 56,326 |
| | BHP Group, Ltd. (ASE Exchange) (Australia) | 4,851 | 118,339 |
| | BHP Group, Ltd. (London Exchange) (Australia) | 371 | 9,066 |
| | CF Industries Holdings, Inc. | 755 | 64,417 |
| | Cie de Saint-Gobain SA (France) | 1,262 | 112,143 |
| | CRH PLC | 645 | 59,675 |
| | DuPont de Nemours, Inc. | 815 | 62,144 |
| | Evonik Industries AG (Germany) | 1,004 | 17,452 |
| | Fortescue, Ltd. (Australia) | 5,951 | 67,012 |
| | Freeport-McMoRan, Inc. | 1,558 | 59,329 |
| | Glencore PLC (United Kingdom) | 10,568 | 46,543 |
| | HeidelbergCement AG (Germany) | 606 | 74,879 |
| | Holcim AG (Switzerland) | 1,197 | 115,253 |
| | Huntsman Corp. | 3,286 | 59,247 |
| | International Flavors & Fragrances, Inc. | 705 | 59,608 |
| | Linde PLC | 149 | 62,382 |
| | Louisiana-Pacific Corp. | 1,820 | 188,461 |
| | LyondellBasell Industries NV Class A | 878 | 65,209 |
| | Mosaic Co. (The) | 2,351 | 57,788 |
| | NewMarket Corp. | 69 | 36,456 |
| | Northern Star Resources, Inc. (Australia) | 1,218 | 11,572 |
| | Nucor Corp. | 476 | 55,554 |
| | Olin Corp. | 1,617 | 54,655 |
| | Packaging Corp. of America | 329 | 74,068 |
| | PPG Industries, Inc. | 522 | 62,353 |
| | Rio Tinto PLC (United Kingdom) | 1,268 | 74,850 |
| | ROCKWOOL International A/S Class B (Denmark) | 62 | 22,062 |
| | Sealed Air Corp. | 1,774 | 60,014 |
| | Sherwin-Williams Co. (The) | 168 | 57,108 |
| | Shin-Etsu Chemical Co., Ltd. (Japan) | 3,800 | 125,161 |
| | Westlake Corp. | 529 | 60,650 |
| | Weyerhaeuser Co. R | 2,049 | 57,679 |
| | | | 2,208,255 |
| | Building materials (0.2%) | | |
| | Mohawk Industries, Inc. † | 505 | 60,161 |
| | Owens Corning | 382 | 65,062 |
| | Trane Technologies PLC | 153 | 56,511 |
| | Vulcan Materials Co. | 238 | 61,221 |
| | | | 242,955 |
| | Capital goods (2.9%) | | |
| | ABB, Ltd. (Switzerland) | 2,388 | 128,948 |
| | Airbus SE (France) | 286 | 45,797 |
| | AISIN Corp. (Japan) | 5,100 | 56,978 |
| | Allison Transmission Holdings, Inc. | 669 | 72,292 |
| | Caterpillar, Inc. | 184 | 66,748 |
| | | | |
| 2 |
| Putnam VT Global Asset Allocation Fund |
| | COMMON STOCKS (68.4%)* cont. | Shares | Value |
| | Capital goods cont. | | |
| | Crown Holdings, Inc. | 705 | $58,296 |
| | Curtiss-Wright Corp. | 181 | 64,231 |
| | Dassault Aviation SA (France) | 123 | 25,133 |
| | Donaldson Co., Inc. | 834 | 56,170 |
| | Eaton Corp. PLC | 194 | 64,383 |
| | Flowserve Corp. | 1,237 | 71,152 |
| | GE Vernova, Inc. † | 195 | 64,141 |
| | GEA Group AG (Germany) | 823 | 40,881 |
| | Graco, Inc. | 670 | 56,474 |
| | Hitachi, Ltd. (Japan) | 800 | 19,592 |
| | Komatsu, Ltd. (Japan) | 500 | 13,621 |
| | Lockheed Martin Corp. | 1,495 | 726,480 |
| | Mitsubishi Electric Corp. (Japan) | 4,200 | 70,920 |
| | Northrop Grumman Corp. | 146 | 68,516 |
| | Parker Hannifin Corp. | 75 | 47,702 |
| | Pentair PLC | 615 | 61,894 |
| | Republic Services, Inc. | 297 | 59,750 |
| | RTX Corp. | 3,318 | 383,959 |
| | Schindler Holding AG (Switzerland) | 102 | 28,181 |
| | Smiths Group PLC (United Kingdom) | 1,161 | 24,892 |
| | Textron, Inc. | 862 | 65,934 |
| | Vertiv Holdings Co. Class A | 3,162 | 359,235 |
| | Vinci SA (France) | 938 | 96,573 |
| | Waste Management, Inc. | 300 | 60,537 |
| | | | 2,959,410 |
| | Commercial and consumer services (2.4%) | | |
| | Automatic Data Processing, Inc. | 2,783 | 814,668 |
| | Block, Inc. Class A † | 893 | 75,896 |
| | Booking Holdings, Inc. | 9 | 44,716 |
| | Ecolab, Inc. | 269 | 63,032 |
| | Euronet Worldwide, Inc. † | 599 | 61,601 |
| | Global Payments, Inc. | 541 | 60,624 |
| | Mastercard, Inc. Class A | 1,385 | 729,299 |
| | PayPal Holdings, Inc. † | 7,227 | 616,824 |
| | | | 2,466,660 |
| | Communication services (1.0%) | | |
| | American Tower Corp. R | 316 | 57,948 |
| | AT&T, Inc. | 2,423 | 55,172 |
| | Comcast Corp. Class A | 4,756 | 178,493 |
| | Crown Castle, Inc. R | 656 | 59,539 |
| | Deutsche Telekom AG (Germany) | 327 | 9,798 |
| | Juniper Networks, Inc. | 1,638 | 61,343 |
| | KDDI Corp. (Japan) | 3,400 | 108,292 |
| | Koninklijke KPN NV (Netherlands) | 13,814 | 50,372 |
| | Telstra Group, Ltd. (Australia) | 20,959 | 51,943 |
| | Ubiquiti, Inc. | 182 | 60,411 |
| | Verizon Communications, Inc. | 7,090 | 283,529 |
| | | | 976,840 |
| | Communications equipment (0.5%) | | |
| | Arista Networks, Inc. † | 772 | 85,329 |
| | Motorola Solutions, Inc. | 965 | 446,052 |
| | | | 531,381 |
| | Computers (5.8%) | | |
| | AppFolio, Inc. Class A † | 274 | 67,601 |
| | Apple, Inc. | 19,440 | 4,868,165 |
| | Check Point Software Technologies, Ltd. (Israel) † | 100 | 18,670 |
| | Cisco Systems, Inc. | 1,054 | 62,397 |
| | Dropbox, Inc. Class A † | 2,002 | 60,140 |
| | Dynatrace, Inc. † | 1,130 | 61,416 |
| | Fortinet, Inc. † | 648 | 61,223 |
| | NetApp, Inc. | 523 | 60,710 |
| | | | |
| Putnam VT Global Asset Allocation Fund |
| 3 |
| | COMMON STOCKS (68.4%)* cont. | Shares | Value |
| | Computers cont. | | |
| | RingCentral, Inc. Class A † | 1,846 | $64,628 |
| | ServiceNow, Inc. † | 344 | 364,681 |
| | Snowflake, Inc. Class A † | 188 | 29,029 |
| | Synopsys, Inc. † | 121 | 58,729 |
| | Teradata Corp. † | 1,872 | 58,313 |
| | Twilio, Inc. Class A † | 842 | 91,003 |
| | Zoom Video Communications, Inc. Class A † | 996 | 81,284 |
| | | | 6,007,989 |
| | Conglomerates (1.2%) | | |
| | 3M Co. | 6,063 | 782,673 |
| | AMETEK, Inc. | 346 | 62,370 |
| | General Electric Co. | 378 | 63,047 |
| | Marubeni Corp. (Japan) | 1,200 | 18,010 |
| | Mitsubishi Corp. (Japan) | 6,100 | 99,806 |
| | Mitsui & Co., Ltd. (Japan) | 5,200 | 107,843 |
| | Siemens AG (Germany) | 353 | 68,833 |
| | | | 1,202,582 |
| | Consumer (0.2%) | | |
| | Clorox Co. (The) | 380 | 61,716 |
| | Kimberly-Clark Corp. | 492 | 64,472 |
| | LVMH Moet Hennessy Louis Vuitton SA (France) | 25 | 16,445 |
| | Pandora A/S (Denmark) | 531 | 97,149 |
| | | | 239,782 |
| | Consumer staples (4.3%) | | |
| | Auto Trader Group PLC (United Kingdom) | 6,809 | 67,374 |
| | BellRing Brands, Inc. † | 863 | 65,018 |
| | Bunzl PLC (United Kingdom) | 99 | 4,076 |
| | Carlsberg A/S Class B (Denmark) | 130 | 12,486 |
| | Chipotle Mexican Grill, Inc. † | 1,014 | 61,144 |
| | Coca-Cola Co. (The) | 3,272 | 203,715 |
| | Coca-Cola Consolidated, Inc. | 51 | 64,259 |
| | Coca-Cola HBC AG (Italy) | 1,732 | 59,169 |
| | Colgate-Palmolive Co. | 2,140 | 194,547 |
| | Costco Wholesale Corp. | 65 | 59,558 |
| | DoorDash, Inc. Class A † | 3,820 | 640,805 |
| | Etsy, Inc. † | 1,200 | 63,468 |
| | Henkel AG & Co. KGaA Vorzug (Preference) (Germany) | 263 | 23,075 |
| | Imperial Brands PLC (United Kingdom) | 3,367 | 107,673 |
| | Ingredion, Inc. | 430 | 59,151 |
| | Keurig Dr Pepper, Inc. | 1,921 | 61,703 |
| | Koninklijke Ahold Delhaize NV (Netherlands) | 2,915 | 95,084 |
| | L’Oreal SA (France) | 27 | 9,558 |
| | Maplebear, Inc. † | 3,438 | 142,402 |
| | Marks & Spencer Group PLC (United Kingdom) | 1,102 | 5,161 |
| | Mondelez International, Inc. Class A | 6,693 | 399,773 |
| | Monster Beverage Corp. † | 1,221 | 64,176 |
| | Nestle SA (Switzerland) | 442 | 36,263 |
| | Nissin Food Products Co., Ltd. (Japan) | 1,200 | 28,990 |
| | PepsiCo, Inc. | 405 | 61,584 |
| | Philip Morris International, Inc. | 7,656 | 921,400 |
| | Recruit Holdings Co., Ltd. (Japan) | 2,100 | 145,967 |
| | Tesco PLC (United Kingdom) | 13,861 | 63,752 |
| | Tyson Foods, Inc. Class A | 1,007 | 57,842 |
| | Uber Technologies, Inc. † | 8,609 | 519,295 |
| | Unilever PLC (United Kingdom) | 1,200 | 68,185 |
| | WH Group, Ltd. (Hong Kong) | 108,000 | 83,229 |
| | | | 4,449,882 |
| | Electronics (5.9%) | | |
| | Amphenol Corp. Class A | 835 | 57,991 |
| | Broadcom, Inc. | 3,896 | 903,249 |
| | Cirrus Logic, Inc. † | 569 | 56,661 |
| | | | |
| 4 |
| Putnam VT Global Asset Allocation Fund |
| | COMMON STOCKS (68.4%)* cont. | Shares | Value |
| | Electronics cont. | | |
| | Garmin, Ltd. | 294 | $60,640 |
| | Hoya Corp. (Japan) | 900 | 111,696 |
| | Monolithic Power Systems, Inc. | 51 | 30,177 |
| | NVIDIA Corp. | 30,036 | 4,033,534 |
| | Qorvo, Inc. † | 963 | 67,343 |
| | Qualcomm, Inc. | 4,426 | 679,922 |
| | SCREEN Holdings Co., Ltd. (Japan) | 100 | 5,904 |
| | Trimble Inc. † | 874 | 61,757 |
| | | | 6,068,874 |
| | Energy (2.2%) | | |
| | Baker Hughes Co. | 1,537 | 63,048 |
| | BP PLC (United Kingdom) | 9,861 | 48,743 |
| | Cheniere Energy, Inc. | 295 | 63,387 |
| | ConocoPhillips | 605 | 59,998 |
| | Coterra Energy, Inc. | 2,602 | 66,455 |
| | DCC PLC (Ireland) | 504 | 32,294 |
| | Eneos Holdings, Inc. (Japan) | 14,300 | 75,020 |
| | Equinor ASA (Norway) | 4,556 | 108,064 |
| | Exxon Mobil Corp. | 2,925 | 314,642 |
| | Halliburton Co. | 2,293 | 62,347 |
| | HF Sinclair Corp. | 1,655 | 58,008 |
| | INPEX Corp. (Japan) | 1,400 | 17,614 |
| | Marathon Petroleum Corp. | 3,902 | 544,329 |
| | Norsk Hydro ASA (Norway) | 2,977 | 16,376 |
| | OMV AG (Austria) | 751 | 29,125 |
| | Phillips 66 | 510 | 58,104 |
| | Repsol SA (Spain) | 1,597 | 19,432 |
| | Schlumberger, Ltd. | 1,461 | 56,015 |
| | Shell PLC (London Exchange) (United Kingdom) | 910 | 28,366 |
| | TechnipFMC PLC (United Kingdom) | 12,553 | 363,284 |
| | TotalEnergies SE (France) | 451 | 25,127 |
| | Valero Energy Corp. | 485 | 59,456 |
| | Weatherford International PLC | 796 | 57,017 |
| | | | 2,226,251 |
| | Entertainment (—%) | | |
| | Sony Group Corp. (Japan) | 500 | 10,538 |
| | | | 10,538 |
| | Financials (10.1%) | | |
| | 3i Group PLC (United Kingdom) | 2,627 | 116,936 |
| | AerCap Holdings NV (Ireland) | 300 | 28,710 |
| | Affiliated Managers Group, Inc. | 336 | 62,133 |
| | AIA Group, Ltd. (Hong Kong) | 10,200 | 73,265 |
| | AIB Group PLC (Ireland) | 10,356 | 57,268 |
| | Allianz SE (Germany) | 232 | 71,308 |
| | Allstate Corp. (The) | 1,574 | 303,451 |
| | Ally Financial, Inc. | 6,355 | 228,844 |
| | American Express Co. | 216 | 64,107 |
| | American International Group, Inc. | 874 | 63,627 |
| | Ameriprise Financial, Inc. | 133 | 70,813 |
| | Annaly Capital Management, Inc. R | 1,620 | 29,646 |
| | AvalonBay Communities, Inc. R | 283 | 62,252 |
| | AXA SA (France) | 307 | 10,926 |
| | Axis Capital Holdings, Ltd. | 700 | 62,034 |
| | Banco de Sabadell SA (Spain) | 7,219 | 14,028 |
| | Banco Santander SA (Spain) | 26,097 | 120,731 |
| | Bank Hapoalim BM (Israel) | 5,282 | 63,765 |
| | Bank Leumi Le-Israel BM (Israel) | 4,395 | 52,289 |
| | Bank of America Corp. | 4,494 | 197,511 |
| | Bank of New York Mellon Corp. (The) | 6,346 | 487,563 |
| | Barclays PLC (United Kingdom) | 8,710 | 29,137 |
| | Berkshire Hathaway, Inc. Class B † | 507 | 229,813 |
| | | | |
| Putnam VT Global Asset Allocation Fund |
| 5 |
| | COMMON STOCKS (68.4%)* cont. | Shares | Value |
| | Financials cont. | | |
| | BlackRock, Inc. | 63 | $64,582 |
| | BNP Paribas SA (France) | 539 | 33,093 |
| | Brixmor Property Group, Inc. R | 2,543 | 70,797 |
| | Capital One Financial Corp. | 353 | 62,947 |
| | CBRE Group, Inc. Class A † | 492 | 64,595 |
| | Chubb, Ltd. | 223 | 61,615 |
| | Citigroup, Inc. | 13,192 | 928,585 |
| | Citizens Financial Group, Inc. | 1,485 | 64,984 |
| | Commonwealth Bank of Australia (Australia) | 90 | 8,516 |
| | Corebridge Financial, Inc. | 7,439 | 222,649 |
| | Covivio (France) R | 106 | 5,372 |
| | Credit Agricole SA (France) | 1,543 | 21,231 |
| | DBS Group Holdings, Ltd. (Singapore) | 2,820 | 90,368 |
| | Deutsche Boerse AG (Germany) | 86 | 19,811 |
| | Equitable Holdings, Inc. | 6,135 | 289,388 |
| | Equity Lifestyle Properties, Inc. R | 930 | 61,938 |
| | Equity Residential R | 827 | 59,346 |
| | Erste Group Bank AG (Czech Republic) | 1,238 | 76,627 |
| | Essex Property Trust, Inc. R | 491 | 140,151 |
| | Eurazeo SE (France) | 152 | 11,338 |
| | Euronext NV (France) | 455 | 51,045 |
| | Evercore, Inc. Class A | 213 | 59,041 |
| | Everest Group, Ltd. | 179 | 64,880 |
| | Exor NV (Netherlands) | 515 | 47,213 |
| | First Horizon Corp. | 3,097 | 62,374 |
| | First Industrial Realty Trust, Inc. R | 1,202 | 60,256 |
| | Futu Holdings, Ltd. (Hong Kong) † | 100 | 7,999 |
| | Globe Life, Inc. | 701 | 78,176 |
| | Goldman Sachs Group, Inc. (The) | 319 | 182,666 |
| | HSBC Holdings PLC (United Kingdom) | 13,783 | 135,392 |
| | Intercontinental Exchange, Inc. | 401 | 59,753 |
| | Intesa Sanpaolo SpA (Italy) | 21,003 | 84,239 |
| | Investor AB Class B (Sweden) | 4,283 | 113,444 |
| | Invitation Homes, Inc. R | 2,002 | 64,004 |
| | Jones Lang LaSalle, Inc. † | 225 | 56,957 |
| | JPMorgan Chase & Co. | 517 | 123,930 |
| | KeyCorp | 3,649 | 62,544 |
| | Klepierre SA (France) R | 477 | 13,737 |
| | Lloyds Banking Group PLC (United Kingdom) | 147,678 | 100,853 |
| | Marsh & McLennan Cos., Inc. | 302 | 64,148 |
| | MetLife, Inc. | 7,369 | 603,374 |
| | MGIC Investment Corp. | 2,520 | 59,749 |
| | Mid-America Apartment Communities, Inc. R | 409 | 63,219 |
| | Mitsubishi UFJ Financial Group, Inc. (Japan) | 5,900 | 68,881 |
| | Mizrahi Tefahot Bank, Ltd. (Israel) | 562 | 24,328 |
| | Morgan Stanley | 486 | 61,100 |
| | Muenchener Rueckversicherungs-Gesellschaft AG in Muenchen (Germany) | 252 | 127,150 |
| | NatWest Group PLC (United Kingdom) | 5,752 | 28,825 |
| | NN Group NV (Netherlands) | 921 | 40,163 |
| | Nordea Bank ABP (Finland) | 1,092 | 11,895 |
| | Northern Trust Corp. | 537 | 55,043 |
| | OneMain Holdings, Inc. | 614 | 32,008 |
| | PNC Financial Services Group, Inc. (The) | 330 | 63,641 |
| | Popular, Inc. (Puerto Rico) | 668 | 62,832 |
| | Primerica, Inc. | 224 | 60,798 |
| | Principal Financial Group, Inc. | 788 | 60,999 |
| | Progressive Corp. (The) | 266 | 63,736 |
| | Prudential Financial, Inc. | 507 | 60,095 |
| | Public Storage R | 202 | 60,487 |
| | QBE Insurance Group, Ltd. (Australia) | 1,385 | 16,448 |
| | Reinsurance Group of America, Inc. | 320 | 68,362 |
| | | | |
| 6 |
| Putnam VT Global Asset Allocation Fund |
| | COMMON STOCKS (68.4%)* cont. | Shares | Value |
| | Financials cont. | | |
| | RLI Corp. | 377 | $62,141 |
| | Robinhood Markets, Inc. Class A † | 5,388 | 200,757 |
| | Sekisui Chemical Co., Ltd. (Japan) | 1,300 | 22,259 |
| | Sekisui House, Ltd. (Japan) | 1,800 | 42,919 |
| | Simon Property Group, Inc. R | 3,459 | 595,674 |
| | SLM Corp. | 2,455 | 67,709 |
| | State Street Corp. | 2,019 | 198,165 |
| | Stifel Financial Corp. | 566 | 60,041 |
| | Sun Communities, Inc. R | 503 | 61,854 |
| | Synchrony Financial | 1,349 | 87,685 |
| | Talanx AG (Germany) | 299 | 25,430 |
| | Tokio Marine Holdings, Inc. (Japan) | 600 | 21,533 |
| | Travelers Cos., Inc. (The) | 261 | 62,872 |
| | Truist Financial Corp. | 1,353 | 58,693 |
| | UBS Group AG (Switzerland) | 1,077 | 32,974 |
| | UniCredit SpA (Italy) | 2,943 | 117,862 |
| | Unum Group | 2,041 | 149,054 |
| | VICI Properties, Inc. R | 2,122 | 61,984 |
| | Virtu Financial, Inc. Class A | 1,868 | 66,650 |
| | Webster Financial Corp. | 1,032 | 56,987 |
| | Wells Fargo & Co. | 1,059 | 74,384 |
| | Willis Towers Watson PLC | 205 | 64,214 |
| | Zions Bancorp NA | 1,225 | 66,456 |
| | Zurich Insurance Group AG (Switzerland) | 132 | 78,509 |
| | | | 10,380,680 |
| | Gaming and lottery (0.2%) | | |
| | Aristocrat Leisure, Ltd. (Australia) | 2,488 | 105,070 |
| | La Francaise des Jeux SAEM (France) | 583 | 22,452 |
| | Light & Wonder, Inc. † | 650 | 56,147 |
| | | | 183,669 |
| | Health care (6.7%) | | |
| | Abbott Laboratories | 2,394 | 270,785 |
| | AbbVie, Inc. | 2,441 | 433,766 |
| | Agilent Technologies, Inc. | 461 | 61,931 |
| | Alnylam Pharmaceuticals, Inc. † | 261 | 61,416 |
| | Amgen, Inc. | 234 | 60,990 |
| | AstraZeneca PLC (United Kingdom) | 180 | 23,468 |
| | Becton, Dickinson and Co. | 295 | 66,927 |
| | bioMerieux (France) | 194 | 20,764 |
| | Boston Scientific Corp. † | 677 | 60,470 |
| | Bristol-Myers Squibb Co. | 5,411 | 306,046 |
| | Cardinal Health, Inc. | 517 | 61,146 |
| | Chugai Pharmaceutical Co., Ltd. (Japan) | 1,100 | 48,489 |
| | Cigna Group (The) | 2,304 | 636,227 |
| | Cooper Cos., Inc. (The) † | 660 | 60,674 |
| | CSL, Ltd. (Australia) | 116 | 20,236 |
| | Daiichi Sankyo Co., Ltd. (Japan) | 4,300 | 117,662 |
| | Danaher Corp. | 278 | 63,815 |
| | Demant A/S (Denmark) † | 777 | 28,598 |
| | Dexcom, Inc. † | 815 | 63,383 |
| | Edwards Lifesciences Corp. † | 977 | 72,327 |
| | Eli Lilly and Co. | 1,488 | 1,148,736 |
| | Exelixis, Inc. † | 2,088 | 69,530 |
| | Fisher & Paykel Healthcare Corp., Ltd. (New Zealand) | 451 | 9,693 |
| | Fresenius SE & Co. KGaA (Germany) † | 1,162 | 40,334 |
| | FUJIFILM Holdings Corp. (Japan) | 2,100 | 43,448 |
| | GSK PLC (United Kingdom) | 5,158 | 87,001 |
| | HCA Healthcare, Inc. | 223 | 66,933 |
| | Hologic, Inc. † | 445 | 32,080 |
| | IDEXX Laboratories, Inc. † | 142 | 58,708 |
| | Incyte Corp. † | 809 | 55,878 |
| | | | |
| Putnam VT Global Asset Allocation Fund |
| 7 |
| | COMMON STOCKS (68.4%)* cont. | Shares | Value |
| | Health care cont. | | |
| | Insulet Corp. † | 242 | $63,179 |
| | Ipsen SA (France) | 232 | 26,592 |
| | Johnson & Johnson | 970 | 140,281 |
| | Lonza Group AG (Switzerland) | 43 | 25,380 |
| | Medpace Holdings, Inc. † | 182 | 60,466 |
| | Medtronic PLC | 4,970 | 397,004 |
| | Merck & Co., Inc. | 8,165 | 812,254 |
| | Merck KGaA (Germany) | 40 | 5,821 |
| | Natera, Inc. † | 467 | 73,926 |
| | Neurocrine Biosciences, Inc. † | 519 | 70,844 |
| | Novartis AG (Switzerland) | 2,085 | 202,990 |
| | Novo Nordisk A/S Class B (Denmark) | 2,180 | 188,094 |
| | Olympus Corp. (Japan) | 1,500 | 22,395 |
| | Omega Healthcare Investors, Inc. | 1,637 | 61,960 |
| | Otsuka Holdings Company, Ltd. (Japan) | 1,000 | 54,400 |
| | Pfizer, Inc. | 2,427 | 64,388 |
| | QIAGEN NV (Netherlands) | 1,399 | 62,297 |
| | Regeneron Pharmaceuticals, Inc. † | 87 | 61,973 |
| | Roche Holding AG (Switzerland) | 211 | 58,997 |
| | Sonova Holding AG (Switzerland) | 53 | 17,332 |
| | Tenet Healthcare Corp. † | 539 | 68,038 |
| | Thermo Fisher Scientific, Inc. | 114 | 59,306 |
| | UnitedHealth Group, Inc. | 120 | 60,703 |
| | Universal Health Services, Inc. Class B | 342 | 61,362 |
| | | | 6,871,443 |
| | Homebuilding (0.3%) | | |
| | Lennar Corp. Class A | 398 | 54,275 |
| | PulteGroup, Inc. | 521 | 56,737 |
| | Taylor Wimpey PLC (United Kingdom) | 8,219 | 12,509 |
| | Toll Brothers, Inc. | 1,384 | 174,315 |
| | | | 297,836 |
| | Household furniture and appliances (—%) | | |
| | Hoshizaki Corp. (Japan) | 400 | 15,728 |
| | Rational AG (Germany) | 20 | 17,130 |
| | | | 32,858 |
| | Lodging/Tourism (—%) | | |
| | InterContinental Hotels Group PLC (United Kingdom) | 256 | 31,852 |
| | | | 31,852 |
| | Media (1.0%) | | |
| | Informa PLC (United Kingdom) | 2,863 | 28,554 |
| | Netflix, Inc. † | 1,169 | 1,041,953 |
| | | | 1,070,507 |
| | Publishing (0.1%) | | |
| | New York Times Co. (The) Class A | 1,109 | 57,723 |
| | TOPPAN Holdings, Inc. (Japan) | 3,100 | 82,237 |
| | | | 139,960 |
| | Retail (5.2%) | | |
| | adidas AG (Germany) | 252 | 61,983 |
| | Amazon.com, Inc. † | 12,181 | 2,672,390 |
| | Associated British Foods PLC (United Kingdom) | 3,364 | 85,810 |
| | Fast Retailing Co., Ltd. (Japan) | 400 | 134,937 |
| | Gap, Inc. (The) | 2,882 | 68,102 |
| | Home Depot, Inc. (The) | 562 | 218,612 |
| | Industria de Diseno Textil SA (Spain) | 2,119 | 108,544 |
| | Next PLC (United Kingdom) | 307 | 36,417 |
| | Target Corp. | 489 | 66,103 |
| | TJX Cos., Inc. (The) | 7,608 | 919,122 |
| | Walmart, Inc. | 11,061 | 999,361 |
| | | | 5,371,381 |
| | | | |
| 8 |
| Putnam VT Global Asset Allocation Fund |
| | COMMON STOCKS (68.4%)* cont. | Shares | Value |
| | Semiconductor (0.5%) | | |
| | Applied Materials, Inc. | 375 | $60,986 |
| | ASML Holding NV (Netherlands) | 348 | 243,751 |
| | Disco Corp. (Japan) | 200 | 53,055 |
| | KLA Corp. | 99 | 62,382 |
| | Lam Research Corp. | 812 | 58,651 |
| | | | 478,825 |
| | Software (5.4%) | | |
| | Adobe, Inc. † | 1,535 | 682,584 |
| | AppLovin Corp. Class A † | 188 | 60,880 |
| | Atlassian Corp. Class A † | 413 | 100,516 |
| | Autodesk, Inc. † | 255 | 75,370 |
| | Cadence Design Systems, Inc. † | 255 | 76,617 |
| | Guidewire Software, Inc. † | 372 | 62,712 |
| | Intuit, Inc. | 98 | 61,593 |
| | Manhattan Associates, Inc. † | 205 | 55,399 |
| | Microsoft Corp. | 8,233 | 3,470,210 |
| | Nexon Co., Ltd. (Japan) | 700 | 10,413 |
| | Oracle Corp. | 379 | 63,157 |
| | Pegasystems, Inc. | 1,603 | 149,400 |
| | ROBLOX Corp. Class A † | 1,197 | 69,258 |
| | SAP SE (Germany) | 432 | 106,261 |
| | Veeva Systems, Inc. Class A † | 2,158 | 453,720 |
| | Workday, Inc. Class A † | 257 | 66,314 |
| | | | 5,564,404 |
| | Technology (0.1%) | | |
| | CACI International, Inc. Class A † | 155 | 62,629 |
| | | | 62,629 |
| | Technology services (5.2%) | | |
| | Accenture PLC Class A | 180 | 63,322 |
| | Alphabet, Inc. Class A | 10,834 | 2,050,876 |
| | DocuSign, Inc. † | 765 | 68,804 |
| | Fair Isaac Corp. † | 27 | 53,755 |
| | Fiserv, Inc. † | 311 | 63,886 |
| | Gartner, Inc. † | 122 | 59,105 |
| | Leidos Holdings, Inc. | 1,627 | 234,386 |
| | LY Corp. (Japan) | 22,500 | 59,492 |
| | Meta Platforms, Inc. Class A | 3,631 | 2,125,987 |
| | NEC Corp. (Japan) | 200 | 17,115 |
| | Pinterest, Inc. Class A † | 2,061 | 59,769 |
| | Prosus NV (China) | 2,280 | 90,573 |
| | Salesforce, Inc. | 521 | 174,186 |
| | Scout24 SE (Germany) | 185 | 16,324 |
| | VeriSign, Inc. † | 331 | 68,504 |
| | Western Union Co. (The) | 5,825 | 61,745 |
| | Zebra Technologies Corp. Class A † | 156 | 60,250 |
| | | | 5,328,079 |
| | Textiles (0.1%) | | |
| | Hermes International (France) | 36 | 86,377 |
| | | | 86,377 |
| | Toys (0.2%) | | |
| | Bandai Namco Holdings, Inc. (Japan) | 300 | 7,154 |
| | Hasbro, Inc. | 995 | 55,630 |
| | Nintendo Co., Ltd. (Japan) | 1,900 | 110,659 |
| | | | 173,443 |
| | Transportation (1.1%) | | |
| | A.P. Moeller-Maersck A/S Class B (Denmark) | 35 | 58,232 |
| | Aena SME SA (Spain) | 232 | 47,351 |
| | CSX Corp. | 2,775 | 89,549 |
| | DHL Group (Germany) | 1,437 | 50,729 |
| | FedEx Corp. | 223 | 62,737 |
| | Kirby Corp. † | 543 | 57,449 |
| | | | |
| Putnam VT Global Asset Allocation Fund |
| 9 |
| | COMMON STOCKS (68.4%)* cont. | Shares | Value |
| | Transportation cont. | | |
| | Norfolk Southern Corp. | 252 | $59,144 |
| | Qantas Airways, Ltd. (voting rights) (Australia) † | 17,073 | 94,515 |
| | SITC International Holdings Co., Ltd. (Hong Kong) | 5,000 | 13,259 |
| | Union Pacific Corp. | 1,975 | 450,379 |
| | United Parcel Service, Inc. Class B | 492 | 62,041 |
| | Westinghouse Air Brake Technologies Corp. | 315 | 59,721 |
| | | | 1,105,106 |
| | Utilities and power (1.9%) | | |
| | AES Corp. (The) | 4,723 | 60,785 |
| | American Electric Power Co., Inc. | 701 | 64,653 |
| | Constellation Energy Corp. | 318 | 71,140 |
| | Dominion Energy, Inc. | 1,211 | 65,224 |
| | Duke Energy Corp. | 616 | 66,368 |
| | E.ON SE (Germany) | 4,549 | 52,987 |
| | Edison International | 858 | 68,503 |
| | ENGIE SA (France) | 6,570 | 104,196 |
| | Eni SpA (Italy) | 1,291 | 17,659 |
| | Eversource Energy | 1,060 | 60,876 |
| | Exelon Corp. | 10,611 | 399,398 |
| | Iberdrola SA (Spain) | 8,161 | 112,460 |
| | Kansai Electric Power Co., Inc. (The) (Japan) | 2,700 | 29,926 |
| | National Fuel Gas co. | 1,066 | 64,685 |
| | NRG Energy, Inc. | 681 | 61,440 |
| | PG&E Corp. | 8,007 | 161,581 |
| | RWE AG (Germany) | 538 | 16,067 |
| | Vistra Corp. | 3,489 | 481,028 |
| | | | 1,958,976 |
| | Total common stocks (cost $43,476,720) | $70,311,555 |
| | CORPORATE BONDS AND NOTES (12.0%)* | Principal amount | Value |
| | Basic materials (0.7%) | | | |
| | ArcelorMittal SA sr. unsec. unsub. notes 7.00%, 10/15/39 (France) | | $20,000 | $21,364 |
| | Arcosa, Inc. 144A company guaranty sr. unsec. notes 6.875%, 8/15/32 | | 5,000 | 5,086 |
| | ATI, Inc. sr. unsec. notes 7.25%, 8/15/30 | | 10,000 | 10,300 |
| | ATI, Inc. sr. unsec. notes 5.125%, 10/1/31 | | 5,000 | 4,727 |
| | ATI, Inc. sr. unsec. notes 4.875%, 10/1/29 | | 5,000 | 4,767 |
| | ATI, Inc. sr. unsec. sub. notes 5.875%, 12/1/27 | | 15,000 | 14,881 |
| | Avient Corp. 144A sr. unsec. notes 6.25%, 11/1/31 | | 5,000 | 4,937 |
| | Avient Corp. 144A sr. unsec. unsub. notes 7.125%, 8/1/30 | | 10,000 | 10,258 |
| | Beacon Roofing Supply, Inc. 144A sr. unsec. unsub. notes 4.125%, 5/15/29 | | 10,000 | 9,496 |
| | Big River Steel, LLC/BRS Finance Corp. 144A sr. notes 6.625%, 1/31/29 | | 13,000 | 13,013 |
| | Boise Cascade Co. 144A company guaranty sr. unsec. notes 4.875%, 7/1/30 | | 15,000 | 14,330 |
| | Builders FirstSource, Inc. 144A company guaranty sr. unsec. bonds 6.375%, 6/15/32 | | 5,000 | 4,976 |
| | Builders FirstSource, Inc. 144A company guaranty sr. unsec. bonds 4.25%, 2/1/32 | | 5,000 | 4,420 |
| | Builders FirstSource, Inc. 144A sr. unsec. bonds 6.375%, 3/1/34 | | 5,000 | 4,941 |
| | Celanese US Holdings, LLC company guaranty sr. unsec. bonds 6.379%, 7/15/32 (Germany) | | 25,000 | 25,405 |
| | Celanese US Holdings, LLC company guaranty sr. unsec. notes 6.33%, 7/15/29 (Germany) | | 10,000 | 10,210 |
| | Celanese US Holdings, LLC company guaranty sr. unsec. notes 6.165%, 7/15/27 (Germany) | | 53,000 | 53,808 |
| | Celanese US Holdings, LLC company guaranty sr. unsec. notes 1.40%, 8/5/26 (Germany) | | 15,000 | 14,041 |
| | Cerdia Finanz GmbH 144A sr. notes 9.375%, 10/3/31 (Germany) | | 5,000 | 5,216 |
| | CF Industries, Inc. company guaranty sr. unsec. bonds 4.95%, 6/1/43 | | 50,000 | 44,130 |
| | Cleveland-Cliffs, Inc. 144A company guaranty sr. unsec. notes 7.375%, 5/1/33 | | 10,000 | 9,834 |
| | Cleveland-Cliffs, Inc. 144A company guaranty sr. unsec. notes 7.00%, 3/15/32 | | 10,000 | 9,834 |
| | Commercial Metals Co. sr. unsec. notes 4.375%, 3/15/32 | | 5,000 | 4,483 |
| | Commercial Metals Co. sr. unsec. notes 4.125%, 1/15/30 | | 5,000 | 4,600 |
| | CP Atlas Buyer, Inc. 144A sr. unsec. notes 7.00%, 12/1/28 | | 5,000 | 4,403 |
| | FMC Corp. sr. unsec. unsub. notes 5.65%, 5/18/33 | | 20,000 | 19,795 |
| | FMG Resources August 2006 Pty, Ltd. 144A sr. unsec. notes 6.125%, 4/15/32 (Australia) | | 10,000 | 9,887 |
| | Glencore Funding, LLC 144A company guaranty sr. unsec. bonds 5.634%, 4/4/34 | | 15,000 | 14,942 |
| | Glencore Funding, LLC 144A company guaranty sr. unsec. notes 5.371%, 4/4/29 | | 10,000 | 10,084 |
| | | | |
| 10 |
| Putnam VT Global Asset Allocation Fund |
| | CORPORATE BONDS AND NOTES (12.0%)* cont. | Principal amount | Value |
| | Basic materials cont. | | | |
| | Glencore Funding, LLC 144A company guaranty sr. unsec. notes 2.50%, 9/1/30 | | $34,000 | $29,492 |
| | Graphic Packaging International, LLC 144A company guaranty sr. unsec. notes 3.50%, 3/1/29 | | 5,000 | 4,585 |
| | HudBay Minerals, Inc. 144A company guaranty sr. unsec. notes 6.125%, 4/1/29 (Canada) | | 15,000 | 15,073 |
| | Huntsman International, LLC sr. unsec. bonds 2.95%, 6/15/31 | | 15,000 | 12,514 |
| | Intelligent Packaging, Ltd., Finco, Inc./Intelligent Packaging, Ltd. LLC Co-Issuer 144A sr. notes 6.00%, 9/15/28 (Canada) | | 25,000 | 24,669 |
| | International Flavors & Fragrances, Inc. sr. unsec. notes 4.45%, 9/26/28 | | 20,000 | 19,572 |
| | International Flavors & Fragrances, Inc. 144A company guaranty sr. unsec. bonds 3.468%, 12/1/50 | | 5,000 | 3,279 |
| | International Flavors & Fragrances, Inc. 144A sr. unsec. notes 2.30%, 11/1/30 | | 10,000 | 8,497 |
| | International Flavors & Fragrances, Inc. 144A sr. unsec. notes 1.832%, 10/15/27 | | 5,000 | 4,596 |
| | LSF11 A5 HoldCo, LLC 144A sr. unsec. notes 6.625%, 10/15/29 | | 15,000 | 15,443 |
| | Mauser Packaging Solutions Holding Co. 144A company guaranty notes 9.25%, 4/15/27 | | 10,000 | 10,162 |
| | Mauser Packaging Solutions Holding Co. 144A sr. bonds 7.875%, 4/15/27 | | 15,000 | 15,322 |
| | Mercer International, Inc. sr. unsec. notes 5.125%, 2/1/29 (Canada) | | 10,000 | 8,655 |
| | Mercer International, Inc. 144A sr. unsec. notes 12.875%, 10/1/28 (Canada) | | 5,000 | 5,389 |
| | Miter Brands Acquisition Holdco, Inc./MIWD Borrower, LLC 144A company guaranty sr. notes 6.75%, 4/1/32 | | 10,000 | 10,053 |
| | Novelis Corp. 144A company guaranty sr. unsec. notes 4.75%, 1/30/30 | | 15,000 | 13,862 |
| | Nutrien, Ltd. sr. unsec. bonds 5.25%, 1/15/45 (Canada) | | 20,000 | 18,458 |
| | Nutrien, Ltd. sr. unsec. bonds 4.125%, 3/15/35 (Canada) | | 25,000 | 22,174 |
| | Pactiv Evergreen Group Issuer, LLC/Pactiv Evergreen Group Issuer, Inc. 144A sr. notes 4.375%, 10/15/28 | | 5,000 | 5,001 |
| | Rain Carbon, Inc. 144A sr. notes 12.25%, 9/1/29 | | 10,000 | 10,581 |
| | SCIH Salt Holdings, Inc. 144A sr. notes 4.875%, 5/1/28 | | 20,000 | 18,837 |
| | SCIH Salt Holdings, Inc. 144A sr. unsec. notes 6.625%, 5/1/29 | | 15,000 | 14,258 |
| | Smyrna Ready Mix Concrete, LLC 144A sr. notes 8.875%, 11/15/31 | | 10,000 | 10,517 |
| | Standard Industries Solutions, Inc./NY 144A sr. unsec. notes 6.50%, 8/15/32 | | 15,000 | 15,037 |
| | TMS International Holding Corp. 144A sr. unsec. notes 6.25%, 4/15/29 | | 10,000 | 9,650 |
| | United States Steel Corp. sr. unsec. sub. bonds 6.65%, 6/1/37 | | 10,000 | 9,731 |
| | Vibrantz Technologies, Inc. 144A sr. unsec. notes 9.00%, 2/15/30 | | 15,000 | 13,789 |
| | Westlake Corp. sr. unsec. bonds 3.125%, 8/15/51 | | 40,000 | 24,922 |
| | Westlake Corp. sr. unsec. bonds 2.875%, 8/15/41 | | 20,000 | 13,500 |
| | WestRock MWV, LLC company guaranty sr. unsec. unsub. notes 8.20%, 1/15/30 | | 30,000 | 34,064 |
| | WestRock MWV, LLC company guaranty sr. unsec. unsub. notes 7.95%, 2/15/31 | | 10,000 | 11,290 |
| | WR Grace Holdings, LLC 144A sr. unsec. notes 5.625%, 8/15/29 | | 10,000 | 9,208 |
| | | | | 810,348 |
| | Capital goods (0.9%) | | | |
| | Adient Global Holdings, Ltd. 144A company guaranty sr. unsec. unsub. notes 8.25%, 4/15/31 (Ireland) | | 15,000 | 15,346 |
| | Berry Global, Inc. company guaranty sr. notes 5.50%, 4/15/28 | | 2,000 | 2,020 |
| | Berry Global, Inc. 144A company guaranty sr. notes 1.65%, 1/15/27 | | 23,000 | 21,544 |
| | Berry Global, Inc. 144A company guaranty sr. notes 1.57%, 1/15/26 | | 44,000 | 42,481 |
| | Boeing Co. (The) sr. unsec. bonds 5.705%, 5/1/40 | | 5,000 | 4,763 |
| | Boeing Co. (The) sr. unsec. notes 2.95%, 2/1/30 | | 3,000 | 2,681 |
| | Boeing Co. (The) sr. unsec. notes 2.70%, 2/1/27 | | 13,000 | 12,401 |
| | Boeing Co. (The) sr. unsec. notes 3.20%, 3/1/29 | | 5,000 | 4,610 |
| | Boeing Co. (The) sr. unsec. unsub. notes 6.388%, 5/1/31 | | 10,000 | 10,460 |
| | Boeing Co. (The) sr. unsec. unsub. notes 6.298%, 5/1/29 | | 10,000 | 10,371 |
| | Boeing Co. (The) sr. unsec. unsub. notes 6.259%, 5/1/27 | | 7,000 | 7,168 |
| | Boeing Co. (The) sr. unsec. unsub. notes 6.125%, 2/15/33 | | 90,000 | 93,094 |
| | Bombardier, Inc. 144A sr. unsec. notes 7.00%, 6/1/32 (Canada) | | 5,000 | 5,093 |
| | Bombardier, Inc. 144A sr. unsec. unsub. notes 8.75%, 11/15/30 (Canada) | | 10,000 | 10,762 |
| | Chart Industries, Inc. 144A company guaranty sr. notes 7.50%, 1/1/30 | | 15,000 | 15,614 |
| | Chart Industries, Inc. 144A company guaranty sr. unsec. notes 9.50%, 1/1/31 | | 5,000 | 5,379 |
| | Clarios Global LP 144A sr. notes 6.75%, 5/15/28 | | 5,000 | 5,095 |
| | Clean Harbors, Inc. 144A company guaranty sr. unsec. unsub. notes 6.375%, 2/1/31 | | 5,000 | 5,038 |
| | Dornoch Debt Merger Sub, Inc. 144A sr. unsec. notes 6.625%, 10/15/29 | | 5,000 | 4,055 |
| | GFL Environmental, Inc. 144A company guaranty sr. unsec. notes 4.75%, 6/15/29 (Canada) | | 10,000 | 9,612 |
| | GFL Environmental, Inc. 144A sr. notes 6.75%, 1/15/31 (Canada) | | 5,000 | 5,141 |
| | Graham Packaging Co., Inc. 144A company guaranty sr. unsec. sub. notes 7.125%, 8/15/28 | | 15,000 | 14,856 |
| | Great Lakes Dredge & Dock Corp. 144A company guaranty sr. unsec. notes 5.25%, 6/1/29 | | 15,000 | 13,994 |
| | Honeywell International, Inc. sr. unsec. bonds 3.812%, 11/21/47 | | 55,000 | 42,196 |
| | Howmet Aerospace, Inc. sr. unsec. unsub. notes 6.75%, 1/15/28 | | 35,000 | 36,621 |
| | Howmet Aerospace, Inc. sr. unsec. unsub. notes 4.85%, 10/15/31 | | 15,000 | 14,718 |
| | | | |
| Putnam VT Global Asset Allocation Fund |
| 11 |
| | CORPORATE BONDS AND NOTES (12.0%)* cont. | Principal amount | Value |
| | Capital goods cont. | | | |
| | Howmet Aerospace, Inc. sr. unsec. unsub. notes 3.00%, 1/15/29 | | $27,000 | $25,120 |
| | Johnson Controls International PLC sr. unsec. bonds 4.95%, 7/2/64 | | 65,000 | 55,006 |
| | Johnson Controls International PLC sr. unsec. notes 3.90%, 2/14/26 | | 6,000 | 5,944 |
| | Madison IAQ, LLC 144A sr. notes 4.125%, 6/30/28 | | 10,000 | 9,475 |
| | Madison IAQ, LLC 144A sr. unsec. notes 5.875%, 6/30/29 | | 15,000 | 14,180 |
| | Manitowoc Co., Inc. (The) 144A company guaranty notes 9.25%, 10/1/31 | | 10,000 | 10,263 |
| | Oshkosh Corp. sr. unsec. sub. notes 4.60%, 5/15/28 | | 9,000 | 8,889 |
| | Otis Worldwide Corp. sr. unsec. notes 2.565%, 2/15/30 | | 15,000 | 13,332 |
| | Owens-Brockway Glass Container, Inc. 144A company guaranty sr. unsec. notes 7.25%, 5/15/31 | | 15,000 | 14,617 |
| | Panther BF Aggregator 2 LP/Panther Finance Co., Inc. 144A company guaranty sr. unsec. notes 8.50%, 5/15/27 | | 15,000 | 15,051 |
| | Republic Services, Inc. sr. unsec. unsub. notes 5.00%, 11/15/29 | | 60,000 | 60,357 |
| | Ritchie Bros Holdings, Inc. 144A company guaranty sr. notes 6.75%, 3/15/28 | | 5,000 | 5,118 |
| | Ritchie Bros Holdings, Inc. 144A company guaranty sr. unsec. unsub. notes 7.75%, 3/15/31 | | 5,000 | 5,235 |
| | RTX Corp. sr. unsec. bonds 4.875%, 10/15/40 | | 20,000 | 18,448 |
| | RTX Corp. sr. unsec. notes 5.15%, 2/27/33 | | 5,000 | 4,960 |
| | RTX Corp. sr. unsec. unsub. notes 4.125%, 11/16/28 | | 5,000 | 4,869 |
| | Spirit AeroSystems, Inc. company guaranty sr. unsec. unsub. notes 4.60%, 6/15/28 | | 10,000 | 9,491 |
| | Spirit AeroSystems, Inc. 144A company guaranty sr. notes 9.75%, 11/15/30 | | 15,000 | 16,618 |
| | Spirit AeroSystems, Inc. 144A sr. unsub. notes 9.375%, 11/30/29 | | 5,000 | 5,359 |
| | Terex Corp. 144A company guaranty sr. unsec. notes 5.00%, 5/15/29 | | 10,000 | 9,531 |
| | Terex Corp. 144A sr. unsec. notes 6.25%, 10/15/32 | | 5,000 | 4,907 |
| | TransDigm, Inc. company guaranty sr. unsec. sub. notes 5.50%, 11/15/27 | | 10,000 | 9,835 |
| | TransDigm, Inc. company guaranty sr. unsec. sub. notes 4.875%, 5/1/29 | | 10,000 | 9,451 |
| | TransDigm, Inc. 144A company guaranty sr. notes 6.00%, perpetual maturity | | 15,000 | 14,713 |
| | TransDigm, Inc. 144A sr. notes 6.875%, 12/15/30 | | 10,000 | 10,156 |
| | TransDigm, Inc. 144A sr. notes 6.625%, 3/1/32 | | 10,000 | 10,103 |
| | Waste Connections, Inc. sr. unsec. bonds 5.00%, 3/1/34 | | 10,000 | 9,766 |
| | Waste Connections, Inc. sr. unsec. bonds 3.20%, 6/1/32 | | 2,000 | 1,751 |
| | Waste Connections, Inc. sr. unsec. sub. bonds 3.50%, 5/1/29 | | 30,000 | 28,401 |
| | Waste Management, Inc. company guaranty sr. unsec. notes 4.875%, 2/15/29 | | 33,000 | 33,170 |
| | WESCO Distribution, Inc. 144A company guaranty sr. unsec. notes 6.625%, 3/15/32 | | 15,000 | 15,264 |
| | WESCO Distribution, Inc. 144A company guaranty sr. unsec. notes 6.375%, 3/15/29 | | 5,000 | 5,073 |
| | | | | 879,566 |
| | Communication services (1.2%) | | | |
| | American Tower Corp. sr. unsec. bonds 2.70%, 4/15/31 R | | 5,000 | 4,320 |
| | American Tower Corp. sr. unsec. sub. notes 2.75%, 1/15/27 R | | 125,000 | 120,091 |
| | AT&T, Inc. sr. unsec. bonds 3.55%, 9/15/55 | | 41,000 | 27,602 |
| | AT&T, Inc. sr. unsec. notes 4.10%, 2/15/28 | | 15,000 | 14,680 |
| | AT&T, Inc. sr. unsec. unsub. bonds 2.55%, 12/1/33 | | 60,000 | 48,352 |
| | AT&T, Inc. sr. unsec. unsub. notes 4.75%, 5/15/46 | | 77,000 | 66,931 |
| | CCO Holdings, LLC/CCO Holdings Capital Corp. 144A sr. unsec. bonds 5.375%, 6/1/29 | | 8,000 | 7,658 |
| | CCO Holdings, LLC/CCO Holdings Capital Corp. 144A sr. unsec. bonds 4.75%, 3/1/30 | | 60,000 | 54,859 |
| | CCO Holdings, LLC/CCO Holdings Capital Corp. 144A sr. unsec. notes 4.25%, 2/1/31 | | 10,000 | 8,727 |
| | CCO Holdings, LLC/CCO Holdings Capital Corp. 144A sr. unsec. unsub. notes 4.75%, 2/1/32 | | 15,000 | 13,182 |
| | Charter Communications Operating, LLC/Charter Communications Operating Capital Corp. company guaranty sr. notes 2.25%, 1/15/29 | | 27,000 | 23,819 |
| | Charter Communications Operating, LLC/Charter Communications Operating Capital Corp. company guaranty sr. sub. bonds 4.80%, 3/1/50 | | 10,000 | 7,522 |
| | Charter Communications Operating, LLC/Charter Communications Operating Capital Corp. company guaranty sr. sub. notes 4.908%, 7/23/25 | | 11,000 | 10,991 |
| | Charter Communications Operating, LLC/Charter Communications Operating Capital Corp. sr. bonds 3.70%, 4/1/51 | | 110,000 | 68,784 |
| | Comcast Corp. company guaranty sr. unsec. notes 3.45%, 2/1/50 | | 19,000 | 13,020 |
| | Comcast Corp. company guaranty sr. unsec. unsub. bonds 3.999%, 11/1/49 | | 7,000 | 5,304 |
| | Crown Castle, Inc. sr. unsec. bonds 3.80%, 2/15/28 R | | 25,000 | 24,068 |
| | Crown Castle, Inc. sr. unsec. bonds 3.65%, 9/1/27 R | | 34,000 | 32,981 |
| | Crown Castle, Inc. sr. unsec. sub. notes 1.05%, 7/15/26 R | | 23,000 | 21,746 |
| | Crown Castle, Inc. sr. unsec. unsub. bonds 3.70%, 6/15/26 R | | 12,000 | 11,812 |
| | Deutsche Telekom International Finance BV company guaranty sr. unsec. unsub. bonds 8.75%, 6/15/30 (Netherlands) | | 73,000 | 84,869 |
| | | | |
| 12 |
| Putnam VT Global Asset Allocation Fund |
| | CORPORATE BONDS AND NOTES (12.0%)* cont. | Principal amount | Value |
| | Communication services cont. | | | |
| | DIRECTV Holdings, LLC/DIRECTV Financing Co., Inc. 144A sr. notes 8.875%, 2/1/30 | | $5,000 | $4,926 |
| | DIRECTV Holdings, LLC/DIRECTV Financing Co., Inc. 144A sr. notes 5.875%, 8/15/27 | | 10,000 | 9,754 |
| | DISH DBS Corp. 144A company guaranty sr. notes 5.25%, 12/1/26 | | 5,000 | 4,554 |
| | EchoStar Corp. company guaranty sr. sub. notes 10.75%, 11/30/29 | | 10,000 | 10,764 |
| | Frontier Communications Holdings, LLC 144A company guaranty sr. notes 8.75%, 5/15/30 | | 10,000 | 10,577 |
| | Frontier Communications Holdings, LLC 144A company guaranty sr. notes 5.875%, 10/15/27 | | 10,000 | 9,976 |
| | Level 3 Financing, Inc. 144A company guaranty sr. notes 10.50%, 5/15/30 | | 15,000 | 16,410 |
| | Rogers Communications, Inc. company guaranty sr. unsec. notes 5.00%, 2/15/29 (Canada) | | 25,000 | 24,851 |
| | Sprint Capital Corp. company guaranty sr. unsec. unsub. notes 6.875%, 11/15/28 | | 21,000 | 22,308 |
| | T-Mobile USA, Inc. company guaranty sr. bonds 2.25%, 11/15/31 | | 60,000 | 49,869 |
| | T-Mobile USA, Inc. company guaranty sr. notes 3.875%, 4/15/30 | | 7,000 | 6,590 |
| | T-Mobile USA, Inc. company guaranty sr. notes 3.75%, 4/15/27 | | 78,000 | 76,225 |
| | T-Mobile USA, Inc. company guaranty sr. unsec. bonds 5.05%, 7/15/33 | | 15,000 | 14,693 |
| | T-Mobile USA, Inc. company guaranty sr. unsec. bonds 2.875%, 2/15/31 | | 10,000 | 8,800 |
| | T-Mobile USA, Inc. company guaranty sr. unsec. notes 3.375%, 4/15/29 | | 15,000 | 14,011 |
| | TCI Communications, Inc. sr. unsec. unsub. notes 7.125%, 2/15/28 | | 65,000 | 69,437 |
| | Verizon Communications, Inc. sr. unsec. bonds 3.70%, 3/22/61 | | 47,000 | 31,908 |
| | Verizon Communications, Inc. sr. unsec. unsub. notes 4.40%, 11/1/34 | | 65,000 | 60,255 |
| | Verizon Communications, Inc. sr. unsec. unsub. notes 4.329%, 9/21/28 | | 76,000 | 74,471 |
| | Verizon Communications, Inc. sr. unsec. unsub. notes 2.10%, 3/22/28 | | 20,000 | 18,397 |
| | | | | 1,210,094 |
| | Consumer cyclicals (1.6%) | | | |
| | Alimentation Couche-Tard, Inc. 144A company guaranty sr. unsec. notes 3.55%, 7/26/27 (Canada) | | 25,000 | 24,168 |
| | Alimentation Couche-Tard, Inc. 144A sr. unsec. notes 2.95%, 1/25/30 (Canada) | | 14,000 | 12,628 |
| | Allied Universal Holdco, LLC/Allied Universal Finance Corp. 144A sr. notes 7.875%, 2/15/31 | | 15,000 | 15,350 |
| | American Builders & Contractors Supply Co., Inc. 144A sr. notes 4.00%, 1/15/28 | | 15,000 | 14,385 |
| | American Builders & Contractors Supply Co., Inc. 144A sr. unsec. notes 3.875%, 11/15/29 | | 10,000 | 9,080 |
| | Anywhere Real Estate Group, LLC/Anywhere Co-Issuer Corp. 144A company guaranty notes 7.00%, 4/15/30 | | 12,000 | 10,659 |
| | Bath & Body Works, Inc. company guaranty sr. unsec. sub. bonds 6.875%, 11/1/35 | | 20,000 | 20,492 |
| | BCPE Ulysses Intermediate, Inc. 144A sr. unsec. notes 7.75%, 4/1/27 ‡‡ | | 5,000 | 4,951 |
| | Block, Inc. sr. unsec. notes 3.50%, 6/1/31 | | 40,000 | 35,253 |
| | BMW US Capital, LLC 144A company guaranty sr. unsec. notes 3.95%, 8/14/28 | | 35,000 | 33,828 |
| | Boyd Gaming Corp. 144A sr. unsec. bonds 4.75%, 6/15/31 | | 20,000 | 18,517 |
| | Caesars Entertainment, Inc. 144A sr. notes 7.00%, 2/15/30 | | 20,000 | 20,386 |
| | Caesars Entertainment, Inc. 144A sr. unsec. notes 6.00%, 10/15/32 | | 5,000 | 4,826 |
| | Caesars Entertainment, Inc. 144A sr. unsec. notes 4.625%, 10/15/29 | | 20,000 | 18,741 |
| | Camelot Return Merger Sub, Inc. 144A sr. notes 8.75%, 8/1/28 | | 10,000 | 9,593 |
| | Carnival Corp. 144A company guaranty sr. notes 7.00%, 8/15/29 | | 5,000 | 5,205 |
| | Carnival Corp. 144A company guaranty sr. unsec. unsub. notes 10.50%, 6/1/30 | | 5,000 | 5,345 |
| | Carnival Corp. 144A sr. unsec. notes 5.75%, 3/1/27 | | 30,000 | 29,956 |
| | Carnival Holdings Bermuda, Ltd. 144A company guaranty sr. unsec. unsub. notes 10.375%, 5/1/28 (Bermuda) | | 5,000 | 5,331 |
| | Carvana Co. 144A company guaranty sr. sub. notes 9.00%, 12/1/28 ‡‡ | | 8,594 | 9,184 |
| | Churchill Downs, Inc. 144A sr. unsec. notes 5.75%, 4/1/30 | | 10,000 | 9,821 |
| | Cinemark USA, Inc. 144A company guaranty sr. unsec. notes 5.25%, 7/15/28 | | 10,000 | 9,761 |
| | Clear Channel Outdoor Holdings, Inc. 144A company guaranty sr. notes 7.875%, 4/1/30 | | 20,000 | 20,608 |
| | Clear Channel Outdoor Holdings, Inc. 144A company guaranty sr. unsec. sub. notes 7.75%, 4/15/28 | | 15,000 | 13,552 |
| | Crocs, Inc. 144A company guaranty sr. unsec. notes 4.25%, 3/15/29 | | 10,000 | 9,286 |
| | D.R. Horton, Inc. company guaranty sr. unsec. bonds 5.00%, 10/15/34 | | 10,000 | 9,661 |
| | D.R. Horton, Inc. company guaranty sr. unsec. unsub. notes 1.30%, 10/15/26 | | 60,000 | 56,501 |
| | EMRLD Borrower LP/Emerald Co-Issuer, Inc. 144A sr. notes 6.625%, 12/15/30 | | 20,000 | 20,052 |
| | FirstCash, Inc. 144A sr. unsec. notes 6.875%, 3/1/32 (Mexico) | | 30,000 | 30,160 |
| | Foundation Building Materials, Inc. 144A company guaranty sr. unsec. notes 6.00%, 3/1/29 | | 15,000 | 13,242 |
| | Global Payments, Inc. sr. unsec. notes 2.15%, 1/15/27 | | 6,000 | 5,690 |
| | Gray Television, Inc. 144A company guaranty sr. unsec. unsub. notes 5.375%, 11/15/31 | | 15,000 | 8,016 |
| | Great Canadian Gaming Corp. 144A sr. notes 8.75%, 11/15/29 (Canada) | | 15,000 | 15,369 |
| | Hanesbrands, Inc. 144A company guaranty sr. unsec. unsub. notes 9.00%, perpetual maturity | | 15,000 | 16,009 |
| | Home Depot, Inc. (The) sr. unsec. unsub. bonds 5.30%, 6/25/54 | | 20,000 | 19,178 |
| | Home Depot, Inc. (The) sr. unsec. unsub. notes 4.95%, 6/25/34 | | 20,000 | 19,742 |
| | Hyatt Hotels Corp. sr. unsec. notes 5.75%, 1/30/27 | | 22,000 | 22,344 |
| | Hyatt Hotels Corp. sr. unsec. unsub. notes 4.85%, 3/15/26 | | 47,000 | 47,003 |
| | Hyundai Capital America 144A sr. unsec. notes 6.375%, 4/8/30 (South Korea) | | 2,000 | 2,091 |
| | | | |
| Putnam VT Global Asset Allocation Fund |
| 13 |
| | CORPORATE BONDS AND NOTES (12.0%)* cont. | Principal amount | Value |
| | Consumer cyclicals cont. | | | |
| | Hyundai Capital America 144A sr. unsec. notes 5.40%, 1/8/31 (South Korea) | | $4,000 | $4,001 |
| | Hyundai Capital America 144A sr. unsec. notes 4.875%, 11/1/27 (South Korea) | | 20,000 | 19,959 |
| | Hyundai Capital America 144A sr. unsec. notes 4.55%, 9/26/29 (South Korea) | | 5,000 | 4,856 |
| | Hyundai Capital America 144A sr. unsec. notes 6.50%, 1/16/29 (South Korea) | | 35,000 | 36,547 |
| | Hyundai Capital America 144A sr. unsec. notes 5.35%, 3/19/29 (South Korea) | | 8,000 | 8,048 |
| | Interpublic Group of Cos., Inc. (The) sr. unsec. sub. bonds 4.65%, 10/1/28 | | 47,000 | 46,659 |
| | Iron Mountain, Inc. 144A company guaranty sr. unsec. sub. notes 6.25%, 1/15/33 | | 25,000 | 24,917 |
| | LBM Acquisition, LLC 144A company guaranty sr. unsec. notes 6.25%, 1/15/29 | | 10,000 | 9,209 |
| | Levi Strauss & Co. 144A sr. unsec. sub. bonds 3.50%, 3/1/31 | | 25,000 | 21,917 |
| | LGI Homes, Inc. 144A company guaranty sr. unsec. notes 8.75%, 12/15/28 | | 15,000 | 15,744 |
| | Light & Wonder International, Inc. 144A company guaranty sr. unsec. notes 7.25%, 11/15/29 | | 15,000 | 15,326 |
| | Live Nation Entertainment, Inc. 144A sr. notes 6.50%, 5/15/27 | | 5,000 | 5,059 |
| | Mattel, Inc. 144A company guaranty sr. unsec. notes 3.375%, 4/1/26 | | 5,000 | 4,902 |
| | McGraw-Hill Education, Inc. 144A sr. notes 7.375%, 9/1/31 | | 10,000 | 10,247 |
| | McGraw-Hill Education, Inc. 144A sr. notes 5.75%, 8/1/28 | | 5,000 | 4,887 |
| | McGraw-Hill Education, Inc. 144A sr. unsec. notes 8.00%, 8/1/29 | | 15,000 | 15,019 |
| | MIWD Holdco II, LLC/MIWD Finance Corp. 144A company guaranty sr. unsec. notes 5.50%, 2/1/30 | | 10,000 | 9,471 |
| | Moody’s Corp. sr. unsec. notes 2.00%, 8/19/31 | | 50,000 | 41,568 |
| | Moody’s Corp. sr. unsec. sub. bonds 5.00%, 8/5/34 | | 15,000 | 14,683 |
| | NCL Corp., Ltd. 144A company guaranty sr. notes 8.125%, 1/15/29 | | 10,000 | 10,544 |
| | NCL Corp., Ltd. 144A sr. unsec. unsub. notes 7.75%, 2/15/29 | | 10,000 | 10,508 |
| | Netflix, Inc. sr. unsec. bonds 4.90%, 8/15/34 | | 10,000 | 9,798 |
| | Netflix, Inc. sr. unsec. unsub. notes 5.875%, 11/15/28 | | 10,000 | 10,368 |
| | Netflix, Inc. 144A sr. unsec. bonds 5.375%, 11/15/29 | | 53,000 | 54,057 |
| | News Corp. 144A company guaranty sr. unsec. unsub. bonds 5.125%, 2/15/32 | | 4,000 | 3,778 |
| | News Corp. 144A sr. unsec. notes 3.875%, 5/15/29 | | 10,000 | 9,285 |
| | Nexstar Media, Inc. 144A company guaranty sr. unsec. notes 4.75%, 11/1/28 | | 10,000 | 9,335 |
| | Omnicom Group, Inc./Omnicom Capital, Inc. sr. unsec. unsub. notes 3.60%, 4/15/26 | | 65,000 | 64,127 |
| | Outfront Media Capital, LLC/Outfront Media Capital Corp. 144A company guaranty sr. notes 7.375%, 2/15/31 | | 15,000 | 15,692 |
| | Outfront Media Capital, LLC/Outfront Media Capital Corp. 144A company guaranty sr. unsec. notes 5.00%, 8/15/27 | | 10,000 | 9,739 |
| | Paramount Global sr. unsec. unsub. notes 3.70%, 6/1/28 | | 15,000 | 14,135 |
| | Paramount Global sr. unsec. unsub. notes 2.90%, 1/15/27 | | 12,000 | 11,488 |
| | Penn Entertainment, Inc. 144A sr. unsec. notes 5.625%, 1/15/27 | | 10,000 | 9,852 |
| | Prime Security Services Borrower, LLC/Prime Finance, Inc. 144A company guaranty notes 6.25%, 1/15/28 | | 15,000 | 14,935 |
| | Royal Caribbean Cruises, Ltd. 144A sr. unsec. notes 6.25%, 3/15/32 | | 5,000 | 5,064 |
| | Royal Caribbean Cruises, Ltd. 144A sr. unsec. notes 6.00%, 2/1/33 | | 20,000 | 19,967 |
| | Royal Caribbean Cruises, Ltd. 144A sr. unsec. notes 5.625%, 9/30/31 | | 10,000 | 9,843 |
| | Royal Caribbean Cruises, Ltd. 144A sr. unsec. notes 5.50%, 8/31/26 | | 10,000 | 9,997 |
| | Royal Caribbean Cruises, Ltd. 144A sr. unsec. notes 4.25%, 7/1/26 | | 5,000 | 4,909 |
| | RR Donnelley & Sons Co. 144A sr. notes 9.50%, 8/1/29 | | 20,000 | 20,332 |
| | S&P Global, Inc. company guaranty sr. unsec. bonds 2.50%, 12/1/29 | | 30,000 | 26,973 |
| | S&P Global, Inc. company guaranty sr. unsec. notes 1.25%, 8/15/30 | | 9,000 | 7,449 |
| | Scientific Games Holdings LP/Scientific Games US FinCo., Inc. 144A sr. unsec. notes 6.625%, 3/1/30 | | 15,000 | 14,367 |
| | Shift4 Payments, LLC/Shift4 Payments Finance Sub, Inc. 144A company guaranty sr. unsec. notes 4.625%, 11/1/26 | | 10,000 | 9,911 |
| | Sirius XM Radio, Inc. 144A company guaranty sr. unsec. bonds 3.875%, 9/1/31 | | 15,000 | 12,570 |
| | Sirius XM Radio, Inc. 144A company guaranty sr. unsec. notes 4.00%, 7/15/28 | | 10,000 | 9,225 |
| | Six Flags Entertainment Corp. 144A company guaranty sr. unsec. notes 7.25%, 5/15/31 | | 15,000 | 15,336 |
| | Six Flags Entertainment Corp./Six Flags Theme Parks, Inc. 144A company guaranty sr. notes 6.625%, 5/1/32 | | 5,000 | 5,072 |
| | Specialty Building Products Holdings, LLC/SBP Finance Corp. 144A sr. notes 7.75%, 10/15/29 | | 5,000 | 5,092 |
| | Standard Industries, Inc. 144A sr. unsec. bonds 3.375%, 1/15/31 | | 5,000 | 4,291 |
| | Standard Industries, Inc. 144A sr. unsec. notes 4.375%, 7/15/30 | | 10,000 | 9,170 |
| | Station Casinos, LLC 144A company guaranty sr. unsec. sub. notes 6.625%, 3/15/32 | | 15,000 | 14,921 |
| | Station Casinos, LLC 144A sr. unsec. bonds 4.625%, 12/1/31 | | 5,000 | 4,483 |
| | SugarHouse HSP Gaming Prop. Mezz LP/SugarHouse HSP Gaming Finance Corp. 144A company guaranty sr. unsub. notes 5.875%, 5/15/25 | | 15,000 | 15,005 |
| | Taylor Morrison Communities, Inc. 144A company guaranty sr. unsec. notes 5.875%, 6/15/27 | | 5,000 | 5,042 |
| | Taylor Morrison Communities, Inc. 144A sr. unsec. bonds 5.125%, 8/1/30 | | 10,000 | 9,590 |
| | Taylor Morrison Communities, Inc. 144A sr. unsec. notes 5.75%, 1/15/28 | | 5,000 | 4,971 |
| | Toll Brothers Finance Corp. company guaranty sr. unsec. unsub. notes 4.35%, 2/15/28 | | 12,000 | 11,728 |
| | | | |
| 14 |
| Putnam VT Global Asset Allocation Fund |
| | CORPORATE BONDS AND NOTES (12.0%)* cont. | Principal amount | Value |
| | Consumer cyclicals cont. | | | |
| | Veritiv Operating Co. 144A company guaranty sr. notes 10.50%, 11/30/30 | | $5,000 | $5,391 |
| | Viking Cruises, Ltd. 144A sr. unsec. notes 9.125%, 7/15/31 | | 15,000 | 16,145 |
| | Viking Cruises, Ltd. 144A sr. unsec. notes 7.00%, 2/15/29 | | 5,000 | 5,032 |
| | Walt Disney Co. (The) company guaranty sr. unsec. bonds 7.75%, 12/1/45 | | 40,000 | 50,882 |
| | Warnermedia Holdings, Inc. company guaranty sr. unsec. notes 4.279%, 3/15/32 | | 46,000 | 40,548 |
| | Warnermedia Holdings, Inc. company guaranty sr. unsec. notes 3.755%, 3/15/27 | | 20,000 | 19,272 |
| | Weekley Homes, LLC/Weekley Finance Corp. 144A sr. unsec. notes 4.875%, 9/15/28 | | 5,000 | 4,790 |
| | White Cap Buyer, LLC 144A sr. unsec. notes 6.875%, 10/15/28 | | 20,000 | 19,880 |
| | Wynn Resorts Finance, LLC/Wynn Resorts Capital Corp. 144A company guaranty sr. unsec. bonds 5.125%, 10/1/29 | | 10,000 | 9,585 |
| | Wynn Resorts Finance, LLC/Wynn Resorts Capital Corp. 144A company guaranty sr. unsec. unsub. notes 7.125%, 2/15/31 | | 25,000 | 26,053 |
| | | | | 1,679,510 |
| | Consumer staples (0.4%) | | | |
| | 1011778 BC ULC/New Red Finance, Inc. 144A bonds 4.00%, 10/15/30 (Canada) | | 15,000 | 13,429 |
| | 1011778 BC ULC/New Red Finance, Inc. 144A company guaranty sr. sub. notes 6.125%, 6/15/29 (Canada) | | 5,000 | 5,022 |
| | Aramark Services, Inc. 144A company guaranty sr. unsec. notes 5.00%, 2/1/28 | | 17,000 | 16,535 |
| | CDW, LLC/CDW Finance Corp. company guaranty sr. unsec. notes 3.25%, 2/15/29 | | 15,000 | 13,832 |
| | Chobani, LLC/Chobani Finance Corp., Inc. 144A sr. unsec. notes 7.625%, 7/1/29 | | 10,000 | 10,353 |
| | Coty, Inc./HFC Prestige Products, Inc./HFC Prestige International US, LLC 144A company guaranty sr. notes 6.625%, 7/15/30 | | 5,000 | 5,086 |
| | Coty, Inc./HFC Prestige Products, Inc./HFC Prestige International US, LLC 144A company guaranty sr. notes 4.75%, 1/15/29 | | 15,000 | 14,308 |
| | Energizer Holdings, Inc. 144A company guaranty sr. unsec. sub. notes 4.375%, 3/31/29 | | 10,000 | 9,298 |
| | EquipmentShare.com, Inc. 144A notes 9.00%, 5/15/28 | | 15,000 | 15,579 |
| | EquipmentShare.com, Inc. 144A notes 8.625%, 5/15/32 | | 10,000 | 10,463 |
| | ERAC USA Finance, LLC 144A company guaranty sr. unsec. bonds 4.20%, 11/1/46 | | 60,000 | 48,960 |
| | ERAC USA Finance, LLC 144A company guaranty sr. unsec. notes 7.00%, 10/15/37 | | 50,000 | 56,584 |
| | Fertitta Entertainment, LLC/Fertitta Entertainment Finance Co., Inc. 144A company guaranty sr. unsec. notes 6.75%, 1/15/30 | | 15,000 | 13,851 |
| | Herc Holdings, Inc. 144A company guaranty sr. unsec. notes 6.625%, 6/15/29 | | 5,000 | 5,068 |
| | Herc Holdings, Inc. 144A company guaranty sr. unsec. notes 5.50%, 7/15/27 | | 10,000 | 9,912 |
| | JBS USA LUX SA/JBS USA Food Co./JBS USA Finance, Inc. company guaranty sr. unsec. notes 3.00%, 2/2/29 (Luxembourg) | | 7,000 | 6,391 |
| | Kenvue, Inc. company guaranty sr. unsec. notes Ser. REGS, 4.90%, 3/22/33 | | 26,000 | 25,586 |
| | Kenvue, Inc. company guaranty sr. unsec. unsub. notes Ser. REGS, 5.05%, 3/22/53 | | 5,000 | 4,639 |
| | Kraft Heinz Foods Co. company guaranty sr. unsec. notes 3.00%, 6/1/26 | | 19,000 | 18,557 |
| | Mars, Inc. 144A sr. unsec. unsub. notes 4.65%, 4/20/31 | | 6,000 | 5,858 |
| | Match Group Holdings II, LLC 144A sr. unsec. unsub. notes 4.625%, 6/1/28 | | 12,000 | 11,438 |
| | Philip Morris International, Inc. sr. unsec. unsub. notes 5.125%, 2/15/30 | | 43,000 | 43,240 |
| | Philip Morris International, Inc. sr. unsec. unsub. notes 4.75%, 11/1/31 | | 15,000 | 14,677 |
| | United Rentals North America, Inc. 144A company guaranty sr. unsec. notes 6.125%, 3/15/34 | | 10,000 | 9,934 |
| | US Foods, Inc. 144A company guaranty sr. unsec. notes 7.25%, 1/15/32 | | 5,000 | 5,181 |
| | US Foods, Inc. 144A sr. unsec. notes 5.75%, 4/15/33 | | 10,000 | 9,743 |
| | Wayfair, LLC 144A company guaranty sr. sub. notes 7.25%, 10/31/29 | | 10,000 | 10,020 |
| | | | | 413,544 |
| | Energy (0.8%) | | | |
| | 6297782 LLC 144A company guaranty sr. unsec. notes 5.026%, 10/1/29 | | 20,000 | 19,661 |
| | Cenovus Energy, Inc. sr. unsec. bonds 6.75%, 11/15/39 (Canada) | | 2,000 | 2,152 |
| | Cheniere Energy Partners LP company guaranty sr. unsec. notes 4.50%, 10/1/29 | | 80,000 | 77,508 |
| | Chesapeake Energy Corp. 144A company guaranty sr. unsec. notes 6.75%, 4/15/29 | | 30,000 | 30,353 |
| | Civitas Resources, Inc. 144A company guaranty sr. unsec. notes 8.375%, 7/1/28 | | 5,000 | 5,199 |
| | Civitas Resources, Inc. 144A company guaranty sr. unsec. unsub. notes 8.75%, 7/1/31 | | 10,000 | 10,438 |
| | Columbia Pipelines Operating Co., LLC 144A sr. unsec. notes 5.927%, 8/15/30 | | 10,000 | 10,297 |
| | Coronado Finance Pty, Ltd. 144A company guaranty sr. sub. notes 9.25%, 10/1/29 (Australia) | | 5,000 | 5,077 |
| | Devon Energy Corp. sr. unsec. unsub. bonds 7.95%, 4/15/32 | | 5,000 | 5,644 |
| | Devon Energy Corp. sr. unsec. unsub. bonds 7.875%, 9/30/31 | | 5,000 | 5,644 |
| | Encino Acquisition Partners Holdings, LLC 144A company guaranty sr. unsec. notes 8.50%, 5/1/28 | | 15,000 | 15,320 |
| | Encino Acquisition Partners Holdings, LLC 144A sr. unsec. notes 8.75%, 5/1/31 | | 10,000 | 10,561 |
| | Expand Energy Corp. company guaranty sr. unsec. notes 5.375%, 3/15/30 | | 10,000 | 9,785 |
| | Expand Energy Corp. company guaranty sr. unsec. notes 5.375%, 2/1/29 | | 25,000 | 24,645 |
| | | | |
| Putnam VT Global Asset Allocation Fund |
| 15 |
| | CORPORATE BONDS AND NOTES (12.0%)* cont. | Principal amount | Value |
| | Energy cont. | | | |
| | Hess Midstream Operations LP 144A company guaranty sr. unsec. notes 5.50%, 10/15/30 | | $5,000 | $4,858 |
| | Hess Midstream Operations LP 144A company guaranty sr. unsec. notes 5.125%, 6/15/28 | | 10,000 | 9,734 |
| | Hess Midstream Operations LP 144A company guaranty sr. unsec. sub. notes 6.50%, 6/1/29 | | 5,000 | 5,053 |
| | Hess Midstream Operations LP 144A company guaranty sr. unsec. sub. notes 5.625%, 2/15/26 | | 10,000 | 9,974 |
| | Kinetik Holdings LP 144A company guaranty sr. unsec. notes 5.875%, 6/15/30 | | 15,000 | 14,776 |
| | Kraken Oil & Gas Partners, LLC 144A sr. unsec. notes 7.625%, 8/15/29 | | 20,000 | 19,269 |
| | Matador Resources Co. 144A company guaranty sr. unsec. notes 6.25%, 4/15/33 | | 20,000 | 19,432 |
| | Matador Resources Co. 144A sr. unsec. notes 6.50%, 4/15/32 | | 15,000 | 14,856 |
| | Nabors Industries, Inc. 144A company guaranty sr. unsec. notes 8.875%, 8/15/31 | | 20,000 | 18,592 |
| | Nabors Industries, Inc. 144A company guaranty sr. unsec. notes 7.375%, 5/15/27 | | 10,000 | 9,998 |
| | Occidental Petroleum Corp. sr. unsec. sub. bonds 6.20%, 3/15/40 | | 35,000 | 34,645 |
| | Occidental Petroleum Corp. sr. unsec. sub. notes 8.50%, 7/15/27 | | 10,000 | 10,710 |
| | Occidental Petroleum Corp. sr. unsec. sub. notes 7.50%, 5/1/31 | | 25,000 | 27,350 |
| | ONEOK, Inc. company guaranty sr. unsec. notes 4.75%, 10/15/31 | | 45,000 | 43,549 |
| | Ovintiv, Inc. company guaranty sr. unsec. notes 5.65%, 5/15/28 | | 46,000 | 46,660 |
| | Petrobras Global Finance BV company guaranty sr. unsec. unsub. bonds 6.50%, 7/3/33 (Brazil) | | 10,000 | 9,796 |
| | Petroleos Mexicanos company guaranty sr. unsec. unsub. notes 6.49%, 1/23/27 (Mexico) | | 20,000 | 19,413 |
| | Precision Drilling Corp. 144A company guaranty sr. unsec. notes 7.125%, 1/15/26 (Canada) | | 7,000 | 7,029 |
| | Precision Drilling Corp. 144A company guaranty sr. unsec. notes 6.875%, 1/15/29 (Canada) | | 10,000 | 9,921 |
| | Rockcliff Energy II, LLC 144A sr. unsec. notes 5.50%, 10/15/29 | | 15,000 | 14,021 |
| | Sitio Royalties Operating Partnership LP/Sitio Finance Corp. 144A sr. unsec. notes 7.875%, 11/1/28 | | 15,000 | 15,499 |
| | SM Energy Co. sr. unsec. unsub. notes 6.75%, 9/15/26 | | 10,000 | 10,006 |
| | SM Energy Co. 144A sr. unsec. notes 7.00%, 8/1/32 | | 20,000 | 19,738 |
| | Spectra Energy Partners LP sr. unsec. notes 3.375%, 10/15/26 | | 30,000 | 29,315 |
| | Targa Resources Partners LP/Targa Resources Partners Finance Corp. company guaranty sr. unsec. unsub. notes 4.875%, 2/1/31 | | 20,000 | 19,325 |
| | Transocean Aquila, Ltd. 144A company guaranty sr. notes 8.00%, 9/30/28 | | 4,538 | 4,663 |
| | Transocean Poseidon, Ltd. 144A company guaranty sr. notes 6.875%, 2/1/27 | | 6,000 | 6,023 |
| | Transocean Titan Financing, Ltd. 144A company guaranty sr. notes 8.375%, 2/1/28 (Cayman Islands) | | 5,000 | 5,107 |
| | Transocean, Inc. company guaranty sr. unsec. unsub. bonds 6.80%, 3/15/38 | | 10,000 | 8,204 |
| | Transocean, Inc. 144A company guaranty sr. notes 8.75%, 2/15/30 | | 4,250 | 4,401 |
| | Venture Global Calcasieu Pass, LLC 144A company guaranty sr. notes 3.875%, 8/15/29 | | 10,000 | 9,195 |
| | Venture Global LNG, Inc. 144A jr. unsec. sub. bonds 9.00%, 9/30/54 | | 15,000 | 15,707 |
| | Venture Global LNG, Inc. 144A sr. notes 9.875%, 2/1/32 | | 15,000 | 16,469 |
| | Venture Global LNG, Inc. 144A sr. notes 9.50%, 2/1/29 | | 15,000 | 16,588 |
| | Venture Global LNG, Inc. 144A sr. notes 8.375%, 6/1/31 | | 10,000 | 10,440 |
| | Venture Global LNG, Inc. 144A sr. notes 8.125%, 6/1/28 | | 5,000 | 5,205 |
| | Viper Energy, Inc. 144A sr. unsec. sub. notes 7.375%, 11/1/31 | | 15,000 | 15,716 |
| | Viper Energy, Inc. 144A sr. unsec. sub. notes 5.375%, 11/1/27 | | 5,000 | 4,954 |
| | Vital Energy, Inc. 144A company guaranty sr. unsec. notes 7.875%, 4/15/32 | | 15,000 | 14,447 |
| | Vital Energy, Inc. 144A company guaranty sr. unsec. notes 7.75%, 7/31/29 | | 5,000 | 4,982 |
| | | | | 817,904 |
| | Financials (3.5%) | | | |
| | Acrisure, LLC/Acrisure Finance, Inc. 144A sr. notes 7.50%, 11/6/30 | | 15,000 | 15,461 |
| | Acrisure, LLC/Acrisure Finance, Inc. 144A sr. unsec. notes 8.50%, 6/15/29 | | 15,000 | 15,704 |
| | Air Lease Corp. sr. unsec. notes 2.10%, 9/1/28 | | 65,000 | 58,671 |
| | Air Lease Corp. sr. unsec. sub. bonds 4.625%, 10/1/28 | | 23,000 | 22,629 |
| | Air Lease Corp. sr. unsec. sub. notes 5.85%, 12/15/27 | | 15,000 | 15,381 |
| | Air Lease Corp. sr. unsec. sub. notes 3.25%, 10/1/29 | | 3,000 | 2,772 |
| | Aircastle, Ltd. 144A sr. unsec. notes 6.50%, 7/18/28 | | 15,000 | 15,510 |
| | Aircastle, Ltd. 144A sr. unsec. notes 5.25%, 8/11/25 | | 25,000 | 25,015 |
| | Alliant Holdings Intermediate, LLC/Alliant Holdings Co-Issuer 144A sr. notes 7.00%, 1/15/31 | | 20,000 | 20,100 |
| | Alliant Holdings Intermediate, LLC/Alliant Holdings Co-Issuer 144A sr. unsec. notes 7.375%, 10/1/32 | | 5,000 | 5,052 |
| | Alliant Holdings Intermediate, LLC/Alliant Holdings Co-Issuer 144A sr. unsec. notes 5.875%, 11/1/29 | | 20,000 | 19,312 |
| | Ally Financial, Inc. company guaranty sr. unsec. notes 8.00%, 11/1/31 | | 34,000 | 37,635 |
| | Ally Financial, Inc. sr. unsec. notes 4.75%, 6/9/27 | | 25,000 | 24,838 |
| | American Express Co. sr. unsec. unsub. notes 5.098%, 2/16/28 | | 15,000 | 15,089 |
| | Apollo Commercial Real Estate Finance, Inc. 144A company guaranty sr. notes 4.625%, 6/15/29 | | 15,000 | 13,033 |
| | Ares Capital Corp. sr. unsec. notes 2.875%, 6/15/27 | | 26,000 | 24,742 |
| | Ares Capital Corp. sr. unsec. notes 2.15%, 7/15/26 | | 24,000 | 22,965 |
| | Ares Capital Corp. sr. unsec. sub. notes 7.00%, 1/15/27 | | 5,000 | 5,184 |
| | | | |
| 16 |
| Putnam VT Global Asset Allocation Fund |
| | CORPORATE BONDS AND NOTES (12.0%)* cont. | Principal amount | Value |
| | Financials cont. | | | |
| | Ares Capital Corp. sr. unsec. sub. notes 3.875%, 1/15/26 | | $25,000 | $24,728 |
| | Aretec Group, Inc. 144A company guaranty sr. sub. notes 10.00%, 8/15/30 | | 5,000 | 5,467 |
| | Athene Global Funding 144A notes 5.526%, 7/11/31 | | 25,000 | 25,073 |
| | Athene Global Funding 144A notes 5.349%, 7/9/27 | | 20,000 | 20,201 |
| | Athene Global Funding 144A notes 1.985%, 8/19/28 | | 40,000 | 35,780 |
| | Banco Santander SA unsec. sub. FRB 3.225%, 11/22/32 (Spain) | | 200,000 | 170,359 |
| | Bank of America Corp. jr. unsec. sub. FRN Ser. AA, 6.10%, perpetual maturity | | 74,000 | 73,988 |
| | Bank of America Corp. sr. unsec. FRN Ser. MTN, 2.496%, 2/13/31 | | 5,000 | 4,398 |
| | Bank of America Corp. unsec. sub. FRB 3.846%, 3/8/37 | | 120,000 | 106,371 |
| | Bank of America Corp. unsec. sub. notes 6.11%, 1/29/37 | | 195,000 | 202,166 |
| | Berkshire Hathaway Finance Corp. company guaranty sr. unsec. bonds 2.85%, 10/15/50 | | 10,000 | 6,282 |
| | Berkshire Hathaway Finance Corp. company guaranty sr. unsec. notes 4.30%, 5/15/43 | | 29,000 | 25,124 |
| | Blackstone Holdings Finance Co., LLC 144A company guaranty sr. unsec. unsub. bonds 1.60%, 3/30/31 | | 10,000 | 8,066 |
| | Blackstone Private Credit Fund sr. unsec. unsub. notes 3.25%, 3/15/27 | | 7,000 | 6,703 |
| | Capital One Financial Corp. unsec. sub. FRB 2.359%, 7/29/32 | | 92,000 | 74,329 |
| | Citigroup, Inc. sr. unsec. FRB 3.668%, 7/24/28 | | 204,000 | 197,659 |
| | Citigroup, Inc. sr. unsec. unsub. FRB 3.887%, 1/10/28 | | 50,000 | 49,024 |
| | Citigroup, Inc. unsec. sub. bonds 4.75%, 5/18/46 | | 10,000 | 8,799 |
| | Citigroup, Inc. unsec. sub. bonds 4.45%, 9/29/27 | | 50,000 | 49,340 |
| | CNO Financial Group, Inc. sr. unsec. notes 5.25%, 5/30/29 | | 10,000 | 9,946 |
| | CNO Global Funding 144A notes 4.95%, 9/9/29 | | 25,000 | 24,793 |
| | CNO Global Funding 144A notes 4.875%, 12/10/27 | | 10,000 | 9,959 |
| | Commonwealth Bank of Australia 144A sr. unsec. notes 3.15%, 9/19/27 (Australia) | | 75,000 | 72,439 |
| | Corebridge Financial, Inc. sr. unsec. notes 3.85%, 4/5/29 | | 20,000 | 19,104 |
| | Corebridge Global Funding 144A sr. unsec. unsub. notes 5.20%, 6/24/29 | | 15,000 | 15,093 |
| | Credit Acceptance Corp. 144A company guaranty sr. unsec. notes 9.25%, 12/15/28 | | 15,000 | 15,884 |
| | Encore Capital Group, Inc. 144A company guaranty sr. notes 8.50%, 5/15/30 | | 10,000 | 10,529 |
| | Fairfax Financial Holdings, Ltd. sr. unsec. notes 4.85%, 4/17/28 (Canada) | | 10,000 | 9,936 |
| | First-Citizens Bank & Trust Co. unsec. sub. notes 6.125%, 3/9/28 | | 26,000 | 26,771 |
| | Freedom Mortgage Corp. 144A sr. unsec. notes 12.00%, 10/1/28 | | 10,000 | 10,886 |
| | Freedom Mortgage Corp. 144A sr. unsec. sub. notes 6.625%, 1/15/27 | | 10,000 | 10,012 |
| | General Motors Financial Co., Inc. company guaranty sr. unsec. unsub. notes 4.00%, 1/15/25 | | 10,000 | 9,996 |
| | General Motors Financial Co., Inc. sr. unsec. notes 4.90%, 10/6/29 | | 23,000 | 22,669 |
| | GGAM Finance, Ltd. 144A company guaranty sr. unsec. notes 8.00%, 2/15/27 (Ireland) | | 5,000 | 5,161 |
| | GLP Capital LP/GLP Financing II, Inc. company guaranty sr. unsec. bonds 3.25%, 1/15/32 R | | 15,000 | 12,893 |
| | GLP Capital LP/GLP Financing II, Inc. company guaranty sr. unsec. unsub. notes 5.375%, 4/15/26 R | | 4,000 | 4,003 |
| | Goldman Sachs Group, Inc. (The) sr. unsec. FRB 4.223%, 5/1/29 | | 117,000 | 113,904 |
| | Goldman Sachs Group, Inc. (The) unsec. sub. notes 5.95%, 1/15/27 | | 5,000 | 5,125 |
| | HUB International, Ltd. 144A sr. notes 7.25%, 6/15/30 | | 15,000 | 15,387 |
| | Huntington Bancshares, Inc. unsec. sub. FRB 2.487%, 8/15/36 | | 41,000 | 33,224 |
| | Intercontinental Exchange, Inc. sr. unsec. bonds 1.85%, 9/15/32 | | 15,000 | 11,883 |
| | Jane Street Group/JSG Finance, Inc. 144A sr. notes 6.125%, 11/1/32 | | 20,000 | 19,828 |
| | Jefferies Financial Group, Inc. sr. unsec. notes Ser. MTN, 5.15%, 9/15/25 | | 15,000 | 15,007 |
| | Jefferson Capital Holdings, LLC 144A sr. unsec. notes 9.50%, 2/15/29 | | 15,000 | 15,954 |
| | Jones Deslauriers Insurance Management, Inc. 144A sr. notes 8.50%, 3/15/30 (Canada) | | 5,000 | 5,284 |
| | Jones Deslauriers Insurance Management, Inc. 144A sr. unsec. notes 10.50%, 12/15/30 (Canada) | | 15,000 | 16,243 |
| | JPMorgan Chase & Co. jr. unsec. sub. FRB Ser. HH, 4.60%, perpetual maturity | | 157,000 | 156,692 |
| | JPMorgan Chase & Co. jr. unsec. sub. FRB Ser. W, (CME Term SOFR 3 Month + 1.26%), 5.785%, 5/15/47 | | 13,000 | 12,363 |
| | JPMorgan Chase & Co. jr. unsec. sub. FRN 3.65%, perpetual maturity | | 17,000 | 16,534 |
| | JPMorgan Chase & Co. unsec. sub. FRB 5.717%, 9/14/33 | | 150,000 | 153,260 |
| | JPMorgan Chase & Co. unsec. sub. FRB 2.956%, 5/13/31 | | 150,000 | 134,232 |
| | KKR Group Finance Co. III, LLC 144A company guaranty sr. unsec. unsub. bonds 5.125%, 6/1/44 | | 30,000 | 27,453 |
| | Ladder Capital Finance Holdings, LLLP/Ladder Capital Finance Corp. 144A sr. unsec. notes 4.25%, 2/1/27 R | | 10,000 | 9,650 |
| | LPL Holdings, Inc. company guaranty sr. unsec. notes 6.75%, 11/17/28 | | 16,000 | 16,811 |
| | Macquarie Airfinance Holdings, Ltd. 144A sr. unsec. notes 5.15%, 3/17/30 (United Kingdom) | | 7,000 | 6,860 |
| | Marsh & McLennan Cos., Inc. sr. unsec. sub. notes 4.375%, 3/15/29 | | 22,000 | 21,621 |
| | Morgan Stanley sr. unsec. notes 5.123%, 2/1/29 | | 25,000 | 25,074 |
| | Morgan Stanley sr. unsec. unsub. FRN Ser. GMTN, 3.772%, 1/24/29 | | 185,000 | 178,472 |
| | Morgan Stanley unsec. unsub. notes 3.95%, 4/23/27 | | 40,000 | 39,212 |
| | Morgan Stanley unsec. sub. notes 5.297%, 4/20/37 | | 24,000 | 23,332 |
| | Mutual of Omaha Cos. Global Funding 144A notes 5.80%, 7/27/26 | | 15,000 | 15,198 |
| | | | |
| Putnam VT Global Asset Allocation Fund |
| 17 |
| | CORPORATE BONDS AND NOTES (12.0%)* cont. | Principal amount | Value |
| | Financials cont. | | | |
| | Nasdaq, Inc. sr. unsec. notes 5.35%, 6/28/28 | | $10,000 | $10,146 |
| | Nasdaq, Inc. sr. unsec. sub. bonds 5.55%, 2/15/34 | | 5,000 | 5,047 |
| | Nationstar Mortgage Holdings, Inc. 144A company guaranty sr. unsec. notes 7.125%, 2/1/32 | | 15,000 | 15,208 |
| | Nationstar Mortgage Holdings, Inc. 144A company guaranty sr. unsec. notes 5.75%, 11/15/31 | | 20,000 | 19,137 |
| | Neuberger Berman Group, LLC/Neuberger Berman Finance Corp. 144A sr. unsec. notes 4.875%, 4/15/45 | | 30,000 | 24,842 |
| | OneMain Finance Corp. company guaranty sr. unsec. notes 7.50%, 5/15/31 | | 15,000 | 15,412 |
| | OneMain Finance Corp. company guaranty sr. unsec. sub. notes 7.125%, 11/15/31 | | 10,000 | 10,199 |
| | OneMain Finance Corp. company guaranty sr. unsec. sub. notes 6.625%, 1/15/28 | | 5,000 | 5,066 |
| | OneMain Finance Corp. company guaranty sr. unsec. unsub. notes 5.375%, 11/15/29 | | 15,000 | 14,433 |
| | PHH Escrow Issuer, LLC 144A sr. unsec. notes 9.875%, 11/1/29 | | 25,000 | 25,138 |
| | PNC Financial Services Group, Inc. (The) unsec. sub. FRB 4.626%, 6/6/33 | | 70,000 | 65,936 |
| | PRA Group, Inc. 144A company guaranty sr. unsec. notes 8.875%, 1/31/30 | | 25,000 | 25,924 |
| | Prologis LP sr. unsec. unsub. notes 2.25%, 4/15/30 R | | 10,000 | 8,750 |
| | RHP Hotel Properties LP/RHP Finance Corp. 144A company guaranty sr. unsec. sub. notes 7.25%, 7/15/28 | | 5,000 | 5,159 |
| | RHP Hotel Properties LP/RHP Finance Corp. 144A company guaranty sr. unsec. sub. notes 6.50%, 4/1/32 | | 10,000 | 10,059 |
| | Royal Bank of Canada sr. unsec. notes Ser. GMTN, 5.20%, 8/1/28 (Canada) | | 30,000 | 30,257 |
| | Royal Bank of Canada unsec. sub. notes Ser. GMTN, 4.65%, 1/27/26 (Canada) | | 45,000 | 44,967 |
| | Toronto-Dominion Bank (The) unsec. sub. FRB 3.625%, 9/15/31 (Canada) | | 55,000 | 53,476 |
| | Truist Financial Corp. sr. unsec. unsub. FRN Ser. MTN, 4.26%, 7/28/26 | | 55,000 | 54,799 |
| | Truist Financial Corp. sr. unsec. unsub. notes Ser. MTN, 5.435%, 1/24/30 | | 15,000 | 15,138 |
| | US Bancorp unsec. sub. FRB 2.491%, 11/3/36 | | 60,000 | 48,612 |
| | VICI Properties LP sr. unsec. notes 5.125%, 11/15/31 R | | 30,000 | 29,284 |
| | VICI Properties LP sr. unsec. unsub. notes 4.75%, 2/15/28 R | | 30,000 | 29,768 |
| | VICI Properties LP/VICI Note Co., Inc. 144A company guaranty sr. unsec. notes 3.75%, 2/15/27 R | | 10,000 | 9,710 |
| | Wells Fargo & Co. sr. unsec. unsub. FRB Ser. MTN, 3.35%, 3/2/33 | | 185,000 | 162,230 |
| | Wells Fargo & Co. sr. unsec. unsub. FRN Ser. MTN, 5.574%, 7/25/29 | | 15,000 | 15,233 |
| | Wells Fargo & Co. sr. unsec. unsub. FRN Ser. MTN, 4.54%, 8/15/26 | | 22,000 | 21,961 |
| | Westpac Banking Corp. unsec. sub. bonds 2.963%, 11/16/40 (Australia) | | 25,000 | 17,809 |
| | XHR LP 144A company guaranty sr. unsec. notes 6.625%, 5/15/30 | | 5,000 | 5,023 |
| | | | | 3,630,350 |
| | Health care (0.9%) | | | |
| | AbbVie, Inc. sr. unsec. notes 4.80%, 3/15/29 | | 20,000 | 19,990 |
| | Amgen, Inc. sr. unsec. unsub. bonds 5.75%, 3/2/63 | | 10,000 | 9,599 |
| | Amgen, Inc. sr. unsec. unsub. bonds 5.65%, 3/2/53 | | 23,000 | 22,161 |
| | Amgen, Inc. sr. unsec. unsub. notes 5.25%, 3/2/30 | | 47,000 | 47,449 |
| | Amgen, Inc. sr. unsec. unsub. notes 5.15%, 3/2/28 | | 30,000 | 30,225 |
| | AthenaHealth Group, Inc. 144A sr. unsec. notes 6.50%, 2/15/30 | | 20,000 | 19,027 |
| | Bausch & Lomb Escrow Corp. 144A sr. notes 8.375%, 10/1/28 (Canada) | | 10,000 | 10,363 |
| | Bausch Health Cos., Inc. 144A company guaranty sr. notes 6.125%, 2/1/27 | | 5,000 | 4,543 |
| | Becton, Dickinson and Co. sr. unsec. notes 2.823%, 5/20/30 | | 37,000 | 33,200 |
| | Bristol-Myers Squibb Co. sr. unsec. notes 4.90%, 2/22/29 | | 20,000 | 20,104 |
| | Centene Corp. sr. unsec. bonds 3.00%, 10/15/30 | | 10,000 | 8,635 |
| | Charles River Laboratories International, Inc. 144A company guaranty sr. unsec. notes 4.00%, 3/15/31 | | 5,000 | 4,471 |
| | Charles River Laboratories International, Inc. 144A company guaranty sr. unsec. notes 3.75%, 3/15/29 | | 5,000 | 4,590 |
| | CHS/Community Health Systems, Inc. 144A company guaranty sr. notes 10.875%, 1/15/32 | | 10,000 | 10,330 |
| | CHS/Community Health Systems, Inc. 144A company guaranty sr. notes 5.625%, 3/15/27 | | 10,000 | 9,608 |
| | CHS/Community Health Systems, Inc. 144A company guaranty sr. unsec. sub. notes 6.875%, 4/1/28 | | 10,000 | 7,300 |
| | CHS/Community Health Systems, Inc. 144A sr. notes 5.25%, 5/15/30 | | 20,000 | 16,445 |
| | Concentra Escrow Issuer Corp. 144A sr. unsec. notes 6.875%, 7/15/32 | | 10,000 | 10,222 |
| | CVS Health Corp. jr. unsec. sub. bonds 7.00%, 3/10/55 | | 10,000 | 10,059 |
| | CVS Health Corp. jr. unsec. sub. bonds 6.75%, 12/10/54 | | 5,000 | 4,915 |
| | CVS Health Corp. sr. unsec. unsub. notes 4.78%, 3/25/38 | | 10,000 | 8,655 |
| | CVS Pass-Through Trust sr. notes 6.036%, 12/10/28 | | 1,417 | 1,425 |
| | CVS Pass-Through Trust 144A sr. mtge. notes 4.704%, 1/10/36 | | 31,496 | 29,221 |
| | DaVita Inc. 144A company guaranty sr. unsec. notes 6.875%, 9/1/32 | | 30,000 | 30,266 |
| | DH Europe Finance II SARL company guaranty sr. unsec. bonds 3.40%, 11/15/49 (Luxembourg) | | 15,000 | 10,636 |
| | Elanco Animal Health, Inc. sr. unsec. notes Ser. WI, 6.65%, 8/28/28 | | 10,000 | 10,163 |
| | Eli Lilly and Co. sr. unsec. unsub. bonds 4.875%, 2/27/53 | | 15,000 | 13,589 |
| | Endo Finance Holdings, Inc. 144A sr. notes 8.50%, 4/15/31 | | 5,000 | 5,304 |
| | GE HealthCare Technologies, Inc. sr. unsec. notes 4.80%, 8/14/29 | | 35,000 | 34,685 |
| | HCA, Inc. company guaranty sr. notes 4.50%, 2/15/27 | | 22,000 | 21,800 |
| | | | |
| 18 |
| Putnam VT Global Asset Allocation Fund |
| | CORPORATE BONDS AND NOTES (12.0%)* cont. | Principal amount | Value |
| | Health care cont. | | | |
| | HCA, Inc. company guaranty sr. unsec. notes 5.45%, 4/1/31 | | $35,000 | $34,942 |
| | HCA, Inc. company guaranty sr. unsec. sub. notes 3.625%, 3/15/32 | | 45,000 | 39,674 |
| | Humana, Inc. sr. unsec. unsub. notes 5.75%, 3/1/28 | | 25,000 | 25,486 |
| | Illumina, Inc. sr. unsec. sub. notes 4.65%, 9/9/26 | | 6,000 | 5,981 |
| | Medline Borrower LP 144A sr. notes 3.875%, 4/1/29 | | 15,000 | 13,904 |
| | Medline Borrower LP 144A sr. unsec. notes 5.25%, 10/1/29 | | 10,000 | 9,660 |
| | Merck & Co., Inc. sr. unsec. unsub. notes 3.70%, 2/10/45 | | 50,000 | 38,757 |
| | Novartis Capital Corp. company guaranty sr. unsec. unsub. bonds 4.00%, 11/20/45 | | 80,000 | 65,707 |
| | Pfizer Investment Enterprises PTE, Ltd. company guaranty sr. unsec. notes 5.30%, 5/19/53 (Singapore) | | 8,000 | 7,497 |
| | Pfizer Investment Enterprises PTE, Ltd. company guaranty sr. unsec. notes 4.75%, 5/19/33 (Singapore) | | 71,000 | 69,017 |
| | Pfizer Investment Enterprises PTE, Ltd. company guaranty sr. unsec. notes 4.45%, 5/19/28 (Singapore) | | 6,000 | 5,949 |
| | Royalty Pharma PLC company guaranty sr. unsec. notes 5.15%, 9/2/29 | | 20,000 | 19,966 |
| | Tenet Healthcare Corp. company guaranty sr. notes 5.125%, 11/1/27 | | 25,000 | 24,506 |
| | Tenet Healthcare Corp. company guaranty sr. notes 4.25%, 6/1/29 | | 10,000 | 9,397 |
| | Tenet Healthcare Corp. company guaranty sr. unsub. notes 6.125%, 6/15/30 | | 15,000 | 14,901 |
| | Viatris, Inc. company guaranty sr. unsec. notes 2.30%, 6/22/27 | | 25,000 | 23,449 |
| | Zoetis, Inc. sr. unsec. sub. notes 2.00%, 5/15/30 | | 9,000 | 7,748 |
| | | | | 885,521 |
| | Technology (0.7%) | | | |
| | Ahead DB Holdings, LLC 144A company guaranty sr. unsec. notes 6.625%, 5/1/28 | | 5,000 | 4,906 |
| | Apple, Inc. sr. unsec. bonds 3.95%, 8/8/52 | | 20,000 | 15,924 |
| | Apple, Inc. sr. unsec. unsub. notes 4.375%, 5/13/45 | | 64,000 | 56,545 |
| | Apple, Inc. sr. unsec. unsub. notes 3.85%, 5/4/43 | | 27,000 | 22,384 |
| | AppLovin Corp. sr. unsec. sub. notes 5.375%, 12/1/31 | | 8,000 | 8,006 |
| | AppLovin Corp. sr. unsec. sub. notes 5.125%, 12/1/29 | | 7,000 | 6,986 |
| | Atlassian Corp. sr. unsec. bonds 5.50%, 5/15/34 | | 4,000 | 4,020 |
| | Atlassian Corp. sr. unsec. notes 5.25%, 5/15/29 | | 16,000 | 16,126 |
| | Broadcom Corp./Broadcom Cayman Finance, Ltd. company guaranty sr. unsec. unsub. notes 3.875%, 1/15/27 | | 73,000 | 71,877 |
| | Broadcom Corp./Broadcom Cayman Finance, Ltd. company guaranty sr. unsec. unsub. notes 3.50%, 1/15/28 | | 90,000 | 86,701 |
| | Broadcom, Inc. sr. unsec. notes 5.05%, 7/12/29 | | 10,000 | 10,041 |
| | Cadence Design Systems, Inc. sr. unsec. sub. notes 4.30%, 9/10/29 | | 25,000 | 24,514 |
| | Cloud Software Group, Inc. 144A notes 9.00%, 9/30/29 | | 5,000 | 5,083 |
| | Cloud Software Group, Inc. 144A sr. notes 6.50%, 3/31/29 | | 10,000 | 9,828 |
| | CommScope, Inc. 144A company guaranty sr. unsec. notes 7.125%, 7/1/28 | | 10,000 | 8,814 |
| | CommScope, LLC 144A company guaranty sr. notes 6.00%, 3/1/26 | | 5,000 | 4,981 |
| | Fortress Intermediate 3, Inc. 144A sr. notes 7.50%, 6/1/31 | | 10,000 | 10,209 |
| | Gartner, Inc. 144A company guaranty sr. unsec. bonds 3.75%, 10/1/30 | | 15,000 | 13,704 |
| | Hewlett Packard Enterprise Co. sr. unsec. bonds 5.60%, 10/15/54 | | 11,000 | 10,362 |
| | Hewlett Packard Enterprise Co. sr. unsec. bonds 5.00%, 10/15/34 | | 5,000 | 4,809 |
| | Hewlett Packard Enterprise Co. sr. unsec. notes 4.85%, 10/15/31 | | 10,000 | 9,757 |
| | Hewlett Packard Enterprise Co. sr. unsec. notes 4.55%, 10/15/29 | | 34,000 | 33,155 |
| | Imola Merger Corp. 144A sr. notes 4.75%, 5/15/29 | | 10,000 | 9,491 |
| | McAfee Corp. 144A sr. unsec. notes 7.375%, 2/15/30 | | 30,000 | 29,175 |
| | Meta Platforms, Inc. sr. unsec. bonds 5.40%, 8/15/54 | | 38,000 | 36,832 |
| | Meta Platforms, Inc. sr. unsec. notes 4.95%, 5/15/33 | | 22,000 | 22,038 |
| | MSCI, Inc. 144A company guaranty sr. unsec. notes 3.625%, 9/1/30 | | 12,000 | 10,970 |
| | Oracle Corp. sr. unsec. notes 2.875%, 3/25/31 | | 45,000 | 39,618 |
| | Oracle Corp. sr. unsec. unsub. bonds 4.00%, 11/15/47 | | 50,000 | 38,147 |
| | Oracle Corp. sr. unsec. unsub. notes 5.375%, 7/15/40 | | 35,000 | 33,736 |
| | Rocket Software, Inc. 144A sr. unsec. notes 6.50%, 2/15/29 | | 10,000 | 9,428 |
| | Seagate HDD Cayman company guaranty sr. unsec. notes 3.125%, 7/15/29 (Cayman Islands) | | 5,000 | 4,519 |
| | Sensata Technologies, Inc. 144A company guaranty sr. unsec. notes 3.75%, 2/15/31 | | 20,000 | 17,507 |
| | ServiceNow, Inc. sr. unsec. notes 1.40%, 9/1/30 | | 30,000 | 24,941 |
| | TTM Technologies, Inc. 144A company guaranty sr. unsec. notes 4.00%, 3/1/29 | | 20,000 | 18,578 |
| | UKG, Inc. 144A sr. notes 6.875%, 2/1/31 | | 15,000 | 15,234 |
| | ZoomInfo Technologies, LLC/ZoomInfo Finance Corp. 144A company guaranty sr. unsec. notes 3.875%, 2/1/29 | | 15,000 | 13,658 |
| | | | | 762,604 |
| | | | |
| Putnam VT Global Asset Allocation Fund |
| 19 |
| | CORPORATE BONDS AND NOTES (12.0%)* cont. | Principal amount | Value |
| | Transportation (0.2%) | | | |
| | American Airlines, Inc./AAdvantage Loyalty IP, Ltd. 144A company guaranty sr. notes 5.75%, 4/20/29 | | $10,000 | $9,925 |
| | American Airlines, Inc./AAdvantage Loyalty IP, Ltd. 144A company guaranty sr. notes 5.50%, 4/20/26 | | 5,000 | 4,988 |
| | AS Mileage Plan IP, Ltd. 144A sr. notes 5.021%, 10/20/29 (Cayman Islands) | | 15,000 | 14,626 |
| | CSX Corp. sr. unsec. unsub. notes 4.10%, 3/15/44 | | 70,000 | 57,524 |
| | Penske Truck Leasing Co. LP/PTL Finance Corp. 144A sr. unsec. bonds 3.40%, 11/15/26 | | 16,000 | 15,582 |
| | Penske Truck Leasing Co. LP/PTL Finance Corp. 144A sr. unsec. notes 4.40%, 7/1/27 | | 10,000 | 9,873 |
| | Ryder System, Inc. sr. unsec. unsub. notes 4.95%, 9/1/29 | | 30,000 | 29,910 |
| | United Airlines, Inc. 144A company guaranty sr. notes 4.625%, 4/15/29 | | 5,000 | 4,758 |
| | Watco Cos., LLC/Watco Finance Corp. 144A sr. unsec. notes 7.125%, 8/1/32 | | 15,000 | 15,476 |
| | | | | 162,662 |
| | Utilities and power (1.1%) | | | |
| | AES Corp. (The) sr. unsec. notes 1.375%, 1/15/26 | | 24,000 | 23,128 |
| | AES Corp. (The) sr. unsec. unsub. notes 2.45%, 1/15/31 | | 25,000 | 20,847 |
| | Ameren Corp. sr. unsec. unsub. notes 5.00%, 1/15/29 | | 10,000 | 10,020 |
| | American Electric Power Co., Inc. sr. unsec. unsub. notes Ser. J, 4.30%, 12/1/28 | | 55,000 | 53,766 |
| | American Transmission Systems, Inc. 144A sr. unsec. bonds 2.65%, 1/15/32 | | 10,000 | 8,494 |
| | Calpine Corp. 144A company guaranty sr. notes 5.25%, 6/1/26 | | 2,000 | 1,999 |
| | Calpine Corp. 144A sr. unsec. notes 5.00%, 2/1/31 | | 5,000 | 4,705 |
| | Commonwealth Edison Co. 1st mtge. bonds 5.90%, 3/15/36 | | 28,000 | 29,272 |
| | Consolidated Edison Co. of New York, Inc. sr. unsec. unsub. notes 4.20%, 3/15/42 | | 45,000 | 37,686 |
| | Constellation Energy Generation, LLC sr. unsec. notes 5.60%, 3/1/28 | | 15,000 | 15,303 |
| | Duke Energy Carolinas, LLC sr. notes 4.95%, 1/15/33 | | 10,000 | 9,839 |
| | Duke Energy Corp. sr. unsec. bonds 4.20%, 6/15/49 | | 70,000 | 54,356 |
| | Duke Energy Corp. sr. unsec. notes 3.15%, 8/15/27 | | 55,000 | 52,837 |
| | Duke Energy Indiana LLC sr. bonds 6.45%, 4/1/39 | | 5,000 | 5,420 |
| | Enbridge, Inc. company guaranty sr. unsec. unsub. bonds 4.50%, 6/10/44 (Canada) | | 15,000 | 12,430 |
| | Enbridge, Inc. sr. unsec. unsub. bonds 4.25%, 12/1/26 (Canada) | | 30,000 | 29,731 |
| | Energy Transfer LP company guaranty sr. unsec. bonds 3.75%, 5/15/30 | | 30,000 | 28,005 |
| | Energy Transfer LP company guaranty sr. unsec. notes 5.50%, 6/1/27 | | 6,000 | 6,079 |
| | Energy Transfer LP company guaranty sr. unsec. notes 2.90%, 5/15/25 | | 37,000 | 36,722 |
| | Energy Transfer LP jr. unsec. sub. FRN 6.625%, perpetual maturity | | 86,000 | 84,902 |
| | Evergy Kansas Central, Inc. sr. bonds 5.70%, 3/15/53 | | 15,000 | 14,790 |
| | Evergy Missouri West, Inc. 144A sr. notes 5.15%, 12/15/27 | | 30,000 | 30,242 |
| | Eversource Energy sr. unsec. unsub. notes 5.45%, 3/1/28 | | 5,000 | 5,067 |
| | IPALCO Enterprises, Inc. sr. notes 4.25%, 5/1/30 | | 25,000 | 23,584 |
| | Kinder Morgan, Inc. company guaranty sr. unsec. notes Ser. GMTN, 7.75%, 1/15/32 | | 15,000 | 17,055 |
| | Kinder Morgan, Inc. company guaranty sr. unsec. unsub. notes 5.00%, 2/1/29 | | 5,000 | 4,985 |
| | Kinder Morgan, Inc. company guaranty sr. unsec. unsub. notes 1.75%, 11/15/26 | | 10,000 | 9,488 |
| | NextEra Energy Capital Holdings, Inc. company guaranty sr. unsec. unsub. notes 6.051%, 3/1/25 | | 15,000 | 15,028 |
| | NextEra Energy Capital Holdings, Inc. company guaranty sr. unsec. unsub. notes 5.749%, 9/1/25 | | 50,000 | 50,323 |
| | NRG Energy, Inc. 144A company guaranty sr. unsec. bonds 6.25%, 11/1/34 | | 15,000 | 14,725 |
| | NRG Energy, Inc. 144A jr. unsec. sub. FRB 10.25%, perpetual maturity | | 10,000 | 11,055 |
| | Oncor Electric Delivery Co., LLC sr. notes 3.75%, 4/1/45 | | 75,000 | 57,702 |
| | Pacific Gas and Electric Co. notes 2.10%, 8/1/27 | | 5,000 | 4,666 |
| | Pacific Gas and Electric Co. sr. notes 6.10%, 1/15/29 | | 50,000 | 51,778 |
| | Pacific Gas and Electric Co. sr. notes 5.55%, 5/15/29 | | 25,000 | 25,420 |
| | PG&E Corp. jr. unsec. sub. bonds 7.375%, 3/15/55 | | 10,000 | 10,287 |
| | PG&E Corp. sr. sub. notes 5.25%, 7/1/30 | | 15,000 | 14,692 |
| | Public Service Electric & Gas Co. sr. notes Ser. MTN, 5.50%, 3/1/40 | | 25,000 | 24,915 |
| | Puget Sound Energy, Inc. sr. bonds 5.448%, 6/1/53 | | 15,000 | 14,335 |
| | Southern Co. (The) sr. unsec. notes 5.50%, 3/15/29 | | 15,000 | 15,310 |
| | Southern Co. Gas Capital Corp. company guaranty sr. unsec. unsub. notes 4.95%, 9/15/34 | | 85,000 | 82,324 |
| | Vistra Corp. 144A jr. unsec. sub. FRN 8.00%, 10/15/51 | | 5,000 | 5,120 |
| | Vistra Corp. 144A jr. unsec. sub. FRN 7.00%, perpetual maturity | | 15,000 | 15,102 |
| | Vistra Operations Co., LLC 144A company guaranty sr. notes 6.00%, 4/15/34 | | 5,000 | 5,070 |
| | Vistra Operations Co., LLC 144A company guaranty sr. notes 4.30%, 7/15/29 | | 17,000 | 16,246 |
| | Vistra Operations Co., LLC 144A company guaranty sr. unsec. notes 6.875%, 4/15/32 | | 10,000 | 10,249 |
| | Vistra Operations Co., LLC 144A company guaranty sr. unsec. sub. notes 5.00%, 7/31/27 | | 5,000 | 4,910 |
| | Vistra Operations Co., LLC 144A sr. notes 5.05%, 12/30/26 | | 10,000 | 10,017 |
| | | | |
| 20 |
| Putnam VT Global Asset Allocation Fund |
| | CORPORATE BONDS AND NOTES (12.0%)* cont. | Principal amount | Value |
| | Utilities and power cont. | | | |
| | Vistra Operations Co., LLC 144A sr. unsec. notes 7.75%, 10/15/31 | | $15,000 | $15,750 |
| | Wisconsin Electric Power Co. sr. unsec. unsub. bonds 4.60%, 10/1/34 | | 17,000 | 16,199 |
| | | | | 1,121,975 |
| | Total corporate bonds and notes (cost $12,944,555) | $12,374,078 |
| | U.S. GOVERNMENT AND AGENCY MORTGAGE OBLIGATIONS (9.8%)* | Principal amount | Value |
| | U.S. Government Guaranteed Mortgage Obligations (2.4%) | | |
| | Government National Mortgage Association Pass-Through Certificates | | |
| | 6.50%, with due dates from 5/20/37 to 11/20/39 | $94,068 | $97,645 |
| | 5.50%, with due dates from 6/20/53 to 7/20/53 | 703,082 | 707,725 |
| | 3.00%, TBA, 1/1/55 | 1,000,000 | 867,266 |
| | 3.00%, with due dates from 8/20/49 to 4/20/51 | 843,316 | 734,009 |
| | | | 2,406,645 |
| | U.S. Government Agency Mortgage Obligations (7.4%) | | |
| | Federal Home Loan Mortgage Corporation Pass-Through Certificates | | |
| | 6.50%, 5/1/53 | 14,802 | 15,146 |
| | 3.00%, 1/1/48 | 545,447 | 473,035 |
| | Federal National Mortgage Association Pass-Through Certificates | | |
| | 5.00%, 9/1/52 | 836,489 | 811,860 |
| | 4.00%, 1/1/57 | 30,694 | 28,177 |
| | 3.00%, with due dates from 4/1/46 to 11/1/48 | 352,661 | 306,073 |
| | 2.50%, 7/1/51 | 771,732 | 629,543 |
| | Uniform Mortgage-Backed Securities | | |
| | 5.00%, TBA, 1/1/55 | 2,000,000 | 1,930,462 |
| | 3.50%, TBA, 1/1/55 | 1,000,000 | 884,573 |
| | 2.50%, TBA, 1/1/55 | 2,000,000 | 1,629,219 |
| | 2.50%, TBA, 1/1/40 | 1,000,000 | 908,203 |
| | | | 7,616,291 |
| | Total U.S. government and agency mortgage obligations (cost $10,590,033) | $10,022,936 |
| | MORTGAGE-BACKED SECURITIES (1.7%)* | Principal amount | Value |
| | Agency collateralized mortgage obligations (—%) | | | |
| | Federal Home Loan Mortgage Corporation | | | |
| | REMICs IFB Ser. 3408, Class EK, ((-4.024 x US 30 Day Average SOFR) + 25.33%), 6.832%, 4/15/37 | | $3,152 | $3,429 |
| | REMICs IFB Ser. 3065, Class DC, ((-3 x US 30 Day Average SOFR) + 19.52%), 5.724%, 3/15/35 | | 8,357 | 8,409 |
| | Government National Mortgage Association Ser. 15-H26, Class DI, IO, 1.847%, 10/20/65 W | | 83,789 | 4,096 |
| | | | | 15,934 |
| | Commercial mortgage-backed securities (0.8%) | | | |
| | Banc of America Commercial Mortgage Trust Ser. 15-UBS7, Class AS, 3.989%, 9/15/48 W | | 14,000 | 13,821 |
| | Barclays Commercial Mortgage Trust Ser. 19-C3, Class C, 4.178%, 5/15/52 | | 10,000 | 8,600 |
| | CD Commercial Mortgage Trust FRB Ser. 17-CD6, Class B, 3.911%, 11/13/50 W | | 14,000 | 12,957 |
| | CFCRE Commercial Mortgage Trust FRB Ser. 17-C8, Class B, 4.199%, 6/15/50 W | | 14,000 | 13,118 |
| | Citigroup Commercial Mortgage Trust Ser. 16-C3, Class A4, 3.154%, 11/15/49 | | 21,000 | 20,241 |
| | COMM Mortgage Trust | | | |
| | FRB Ser. 12-LC4, Class C, 5.303%, 12/10/44 W | | 29,000 | 25,970 |
| | FRB Ser. 13-CR13, Class C, 4.944%, 11/10/46 W | | 6,399 | 5,959 |
| | FRB Ser. 14-CR17, Class C, 4.779%, 5/10/47 W | | 25,000 | 22,924 |
| | FRB Ser. 15-CR26, Class C, 4.463%, 10/10/48 W | | 24,000 | 21,261 |
| | FRB Ser. 15-LC21, Class B, 4.311%, 7/10/48 W | | 11,000 | 10,871 |
| | FRB Ser. 14-UBS6, Class C, 4.259%, 12/10/47 W | | 9,833 | 9,402 |
| | Ser. 14-UBS3, Class AM, 4.012%, 6/10/47 | | 11,406 | 10,906 |
| | FRB Ser. 15-LC19, Class B, 3.829%, 2/10/48 W | | 28,000 | 27,201 |
| | FRB Ser. 15-CR22, Class AM, 3.603%, 3/10/48 W | | 13,000 | 12,740 |
| | Credit Suisse Commercial Mortgage Trust 144A FRB Ser. 07-C2, Class AX, IO, zero %, 1/15/49 W | | 455,227 | 64 |
| | CSAIL Commercial Mortgage Trust | | | |
| | Ser. 15-C1, Class B, 4.044%, 4/15/50 W | | 30,000 | 28,193 |
| | Ser. 16-C7, Class AS, 3.958%, 11/15/49 W | | 15,000 | 14,432 |
| | Ser. 16-C6, Class AS, 3.346%, 1/15/49 | | 16,000 | 15,274 |
| | Ser. 19-C17, Class AS, 3.278%, 9/15/52 | | 49,000 | 43,098 |
| | FRB Ser. 20-C19, Class XA, IO, 1.089%, 3/15/53 W | | 1,022,629 | 44,572 |
| | | | |
| Putnam VT Global Asset Allocation Fund |
| 21 |
| | MORTGAGE-BACKED SECURITIES (1.7%)* cont. | Principal amount | Value |
| | Commercial mortgage-backed securities cont. | | | |
| | CSMC Trust FRB Ser. 16-NXSR, Class XA, IO, 0.672%, 12/15/49 W | | $859,985 | $7,364 |
| | GS Mortgage Securities Trust FRB Ser. 15-GC32, Class B, 4.39%, 7/10/48 W | | 73,000 | 71,913 |
| | JPMDB Commercial Mortgage Securities Trust | | | |
| | FRB Ser. 18-C8, Class C, 4.757%, 6/15/51 W | | 11,000 | 9,469 |
| | FRB Ser. 18-C8, Class XA, IO, 0.596%, 6/15/51 W | | 878,816 | 14,033 |
| | LB-UBS Commercial Mortgage Trust 144A FRB Ser. 06-C6, Class XCL, IO, 0.435%, 9/15/39 W | | 216,572 | 486 |
| | Morgan Stanley Bank of America Merrill Lynch Trust | | | |
| | FRB Ser. 15-C24, Class B, 4.318%, 5/15/48 W | | 10,000 | 9,567 |
| | FRB Ser. 15-C22, Class C, 4.189%, 4/15/48 W | | 31,000 | 26,696 |
| | Ser. 14-C19, Class C, 4.00%, 12/15/47 | | 20,000 | 19,138 |
| | Ser. 16-C32, Class AS, 3.994%, 12/15/49 W | | 22,000 | 21,075 |
| | FRB Ser. 13-C10, Class B, 3.981%, 7/15/46 W | | 11,888 | 11,032 |
| | FRB Ser. 15-C26, Class XA, IO, 0.952%, 10/15/48 W | | 526,294 | 656 |
| | Morgan Stanley Bank of America Merrill Lynch Trust 144A FRB Ser. 12-C5, Class E, 4.642%, 8/15/45 W | | 15,000 | 14,628 |
| | Morgan Stanley Capital I Trust | | | |
| | Ser. 15-UBS8, Class B, 4.315%, 12/15/48 W | | 16,000 | 15,061 |
| | FRB Ser. 18-H3, Class XA, IO, 0.80%, 7/15/51 W | | 1,339,971 | 28,621 |
| | Ready Capital Mortgage Financing, LLC 144A | | | |
| | FRB Ser. 22-FL9, Class A, 6.806%, 6/25/37 | | 7,888 | 7,912 |
| | FRB Ser. 22-FL8, Class AS, 6.669%, 1/25/37 | | 16,000 | 15,984 |
| | FRB Ser. 21-FL7, Class A, 5.653%, 11/25/36 | | 9,799 | 9,793 |
| | Shelter Growth CRE Issuer, Ltd. 144A FRB Ser. 21-FL3, Class A, 5.592%, 9/15/36 (Cayman Islands) | | 3,738 | 3,725 |
| | Wells Fargo Commercial Mortgage Trust | | | |
| | FRB Ser. 16-NXS5, Class C, 4.974%, 1/15/59 W | | 10,000 | 9,171 |
| | FRB Ser. 15-SG1, Class B, 4.445%, 9/15/48 W | | 14,000 | 13,262 |
| | Ser. 15-LC20, Class C, 4.056%, 4/15/50 W | | 17,000 | 16,147 |
| | Ser. 15-C31, Class AS, 4.049%, 11/15/48 | | 17,000 | 16,780 |
| | FRB Ser. 20-C57, Class C, 4.023%, 8/15/53 W | | 16,000 | 14,084 |
| | WF-RBS Commercial Mortgage Trust FRB Ser. 13-C11, Class C, 4.007%, 3/15/45 W | | 47,000 | 44,758 |
| | WF-RBS Commercial Mortgage Trust 144A | | | |
| | FRB Ser. 11-C3, Class D, 5.855%, 3/15/44 (In default) † W | | 8,056 | 2,680 |
| | FRB Ser. 13-C15, Class D, 4.186%, 8/15/46 W | | 21,000 | 8,663 |
| | | | | 774,302 |
| | Residential mortgage-backed securities (non-agency) (0.9%) | | | |
| | A&D Mortgage Trust 144A Ser. 23-NQM4, Class A1, 7.472%, 9/25/68 | | 65,605 | 67,020 |
| | Chase Home Lending Mortgage Trust 144A FRB Ser. 24-11, Class A11, (US 30 Day Average SOFR + 1.25%), 5.848%, 11/25/55 | | 50,000 | 50,125 |
| | Citigroup Mortgage Loan Trust, Inc. FRB Ser. 05-2, Class 1A2A, 6.17%, 5/25/35 W | | 4,477 | 4,387 |
| | Countrywide Alternative Loan Trust | | | |
| | FRB Ser. 06-OA7, Class 1A2, (Federal Reserve US 12 Month Cumulative Avg 1 yr CMT + 0.94%), 5.765%, 6/25/46 | | 36,273 | 34,377 |
| | FRB Ser. 06-OA10, Class 4A1, (CME Term SOFR 1 Month + 0.49%), 4.833%, 8/25/46 | | 58,814 | 49,188 |
| | Ellington Financial Mortgage Trust 144A Ser. 20-2, Class A2, 1.486%, 10/25/65 W | | 18,942 | 17,722 |
| | Federal Home Loan Mortgage Corporation 144A | | | |
| | Structured Agency Credit Risk Debt FRN Ser. 22-DNA5, Class M1A, (US 30 Day Average SOFR + 2.95%), 7.684%, 6/25/42 | | 10,287 | 10,596 |
| | Structured Agency Credit Risk Trust REMICs FRB Ser. 22-DNA3, Class M1A, (US 30 Day Average SOFR + 2.00%), 6.569%, 4/25/42 | | 37,872 | 38,367 |
| | Structured Agency Credit Risk Trust REMICs FRB Ser. 22-DNA1, Class M1B, (US 30 Day Average SOFR + 1.85%), 6.419%, 1/25/42 | | 74,000 | 75,115 |
| | Structured Agency Credit Risk Debt FRN Ser. 22-DNA2, Class M1A, (US 30 Day Average SOFR + 1.30%), 5.869%, 2/25/42 | | 36,456 | 36,531 |
| | Seasoned Credit Risk Transfer Trust FRB Ser. 17-2, Class 2, 4.00%, 8/25/56 W | | 21,432 | 21,294 |
| | Federal National Mortgage Association | | | |
| | Connecticut Avenue Securities FRB Ser. 16-C01, Class 2M2, (US 30 Day Average SOFR + 7.06%), 11.633%, 8/25/28 | | 14,016 | 14,649 |
| | Connecticut Avenue Securities FRB Ser. 16-C01, Class 1M2, (US 30 Day Average SOFR + 6.86%), 11.433%, 8/25/28 | | 22,933 | 24,072 |
| | Connecticut Avenue Securities FRB Ser. 16-C03, Class 2M2, (US 30 Day Average SOFR + 6.01%), 10.583%, 10/25/28 | | 2,731 | 2,852 |
| | Connecticut Avenue Securities FRB Ser. 16-C05, Class 2M2, (US 30 Day Average SOFR + 4.56%), 9.133%, 1/25/29 | | 35,601 | 36,762 |
| | | | |
| 22 |
| Putnam VT Global Asset Allocation Fund |
| | MORTGAGE-BACKED SECURITIES (1.7%)* cont. | Principal amount | Value |
| | Residential mortgage-backed securities (non-agency) cont. | | | |
| | Federal National Mortgage Association | | | |
| | Connecticut Avenue Securities FRB Ser. 16-C07, Class 2M2, (US 30 Day Average SOFR + 4.46%), 9.033%, 5/25/29 | | $57,832 | $60,148 |
| | Connecticut Avenue Securities FRB Ser. 16-C06, Class 1M2, (US 30 Day Average SOFR + 4.36%), 8.933%, 4/25/29 | | 24,889 | 25,791 |
| | Connecticut Avenue Securities FRB Ser. 17-C02, Class 2M2C, (US 30 Day Average SOFR + 3.76%), 8.333%, 9/25/29 | | 56,000 | 58,194 |
| | Connecticut Avenue Securities FRB Ser. 17-C01, Class 1M2, (US 30 Day Average SOFR + 3.66%), 8.233%, 7/25/29 | | 47,002 | 48,400 |
| | Connecticut Avenue Securities Trust FRB Ser. 18-C05, Class 1M2, (US 30 Day Average SOFR + 2.46%), 7.033%, 1/25/31 | | 11,691 | 11,953 |
| | Federal National Mortgage Association 144A | | | |
| | Connecticut Avenue Securities Trust FRB Ser. 24-R06, Class 1A1, (US 30 Day Average SOFR + 1.15%), 5.719%, 9/25/44 | | 10,587 | 10,629 |
| | Connecticut Avenue Securities FRB Ser. 21-R02, Class 2M1, (US 30 Day Average SOFR + 0.90%), 5.469%, 11/25/41 | | 2,600 | 2,599 |
| | Long Beach Mortgage Loan Trust FRB Ser. 04-1, Class A2, (CME Term SOFR 1 Month + 0.91%), 5.253%, 2/25/34 | | 12,778 | 12,661 |
| | New Century Home Equity Loan Trust FRB Ser. 03-4, Class M1, (CME Term SOFR 1 Month + 1.24%), 5.578%, 10/25/33 | | 20,226 | 20,053 |
| | Park Place Securities, Inc. Asset-Backed Pass-Through Certificates FRB Ser. 04-WCW2, Class M3, (CME Term SOFR 1 Month + 1.16%), 5.503%, 10/25/34 | | 10,026 | 9,866 |
| | RMF Buyout Issuance Trust 144A Ser. 20-HB1, Class A1, 1.719%, 10/25/50 W | | 44,445 | 42,306 |
| | Verus Securitization Trust 144A Ser. 20-5, Class A2, 2.578%, 5/25/65 | | 24,097 | 23,364 |
| | Visio Trust 144A Ser. 20-1, Class A3, 3.521%, 8/25/55 W | | 117,000 | 106,859 |
| | WaMu Mortgage Pass-Through Certificates Trust FRB Ser. 05-AR9, Class A1C3, (CME Term SOFR 1 Month + 1.07%), 5.413%, 7/25/45 | | 13,719 | 13,605 |
| | | | | 929,485 |
| | Total mortgage-backed securities (cost $1,773,652) | $1,719,721 |
| | FOREIGN GOVERNMENT AND AGENCY BONDS AND NOTES (0.3%)* | Principal amount | Value |
| | Bulgaria (Republic of) sr. unsec. bonds Ser. 30Y, 1.375%, 9/23/50 (Bulgaria) | EUR | 6,000 | $3,815 |
| | Indonesia (Republic of) sr. unsec. unsub. bonds Ser. REGS, 4.35%, 1/8/27 (Indonesia) | | $200,000 | 197,771 |
| | Mexico (Government of) sr. unsec. bonds Ser. MTNA, 6.75%, 9/27/34 (Mexico) | | 60,000 | 60,979 |
| | Romania (Government of) 144A sr. unsec. notes 6.375%, 1/30/34 (Romania) | | 16,000 | 15,343 |
| | Uruguay (Oriental Republic of) sr. unsec. unsub. bonds 7.875%, 1/15/33 (Uruguay) | | 25,000 | 29,094 |
| | Uruguay (Oriental Republic of) sr. unsec. unsub. bonds 7.625%, 3/21/36 (Uruguay) | | 10,000 | 11,705 |
| | Total foreign government and agency bonds and notes (cost $324,862) | $318,707 |
| | SENIOR LOANS (0.3%)*c | Principal amount | Value |
| | American Airlines, Inc. bank term loan FRN (CME Term SOFR 3 Month + 4.75%), 9.629%, 4/20/28 | | $15,167 | $15,596 |
| | Ascend Learning, LLC bank term loan FRN (CME Term SOFR 1 Month + 5.75%), 10.207%, 11/18/29 | | 5,000 | 4,972 |
| | Bausch + Lomb Corp. bank term loan FRN Ser. B, (CME Term SOFR 1 Month + 3.25%), 7.689%, 5/5/27 | | 4,949 | 4,974 |
| | Clear Channel Outdoor Holdings, Inc. bank term loan FRN Ser. B, (CME Term SOFR 1 Month + 4.00%), 8.472%, 8/21/28 | | 3,031 | 3,055 |
| | Cloud Software Group, Inc. bank term loan FRN (CME Term SOFR 1 Month + 3.50%), 7.829%, 3/29/29 | | 3,668 | 3,683 |
| | Connect Finco SARL bank term loan FRN Ser. B, (CME Term SOFR 1 Month + 4.50%), 8.857%, 9/13/29 | | 9,925 | 8,742 |
| | CP Atlas Buyer, Inc. bank term loan FRN Ser. B1, (CME Term SOFR 1 Month + 3.75%), 8.207%, 11/23/27 | | 10,489 | 10,247 |
| | DexKo Global, Inc. bank term loan FRN (CME Term SOFR 3 Month + 3.75%), 8.34%, 10/4/28 | | 4,974 | 4,715 |
| | DIRECTV Financing, LLC bank term loan FRN Ser. B, (CME Term SOFR 1 Month + 5.25%), 10.097%, 8/2/29 | | 6,618 | 6,511 |
| | Endo Finance Holdings, Inc. bank term loan FRN (CME Term SOFR 1 Month + 4.00%), 8.357%, 4/23/31 | | 12,968 | 13,078 |
| | Fertitta Entertainment, LLC/NV bank term loan FRN Ser. B, (CME Term SOFR 1 Month + 3.50%), 7.857%, 1/27/29 | | 9,924 | 9,973 |
| | Fortress Intermediate 3, Inc. bank term loan FRN Class B, (CME Term SOFR 1 Month + 3.50%), 7.857%, 5/8/31 | | 9,975 | 10,019 |
| | Foundation Building Materials, Inc. bank term loan FRN Ser. B2, (CME Term SOFR 1 Month + 4.00%), 8.329%, 1/27/31 | | 14,925 | 14,729 |
| | Herens US Holdco Corp. bank term loan FRN Ser. B, (CME Term SOFR 3 Month + 3.93%), 8.354%, 4/30/28 | | 4,950 | 4,866 |
| | Hexion Holdings Corp. bank term loan FRN Class B, (CME Term SOFR 1 Month + 7.44%), 11.895%, 3/15/30 | | 10,588 | 10,094 |
| | Idera, Inc. bank term loan FRN (CME Term SOFR 1 Month + 3.50%), 8.071%, 3/2/28 | | 9,950 | 9,791 |
| | IRB Holding Corp. bank term loan FRN Class B, (CME Term SOFR 1 Month + 2.50%), 6.857%, 3/10/28 | | 9,776 | 9,798 |
| | Klockner-Pentaplast of America, Inc. bank term loan FRN (CME Term SOFR 6 Month + 4.73%), 9.723%, 2/4/26 | | 9,662 | 8,865 |
| | LBM Acquisition, LLC bank term loan FRN Ser. B, (CME Term SOFR 1 Month + 3.75%), 8.297%, 5/30/31 | | 4,962 | 4,928 |
| | | | |
| Putnam VT Global Asset Allocation Fund |
| 23 |
| | SENIOR LOANS (0.3%)*c cont. | Principal amount | Value |
| | Madison IAQ, LLC bank term loan FRN (CME Term SOFR 1 Month + 2.75%), 7.889%, 6/15/28 | | $4,886 | $4,909 |
| | Mattress Firm, Inc. bank term loan FRN Ser. B, (CME Term SOFR 3 Month + 4.25%), 8.924%, 9/21/28 | | 9,790 | 9,798 |
| | Medline Borrower LP bank term loan FRN Class B, (CME Term SOFR 1 Month + 2.25%), 6.607%, 10/23/28 | | 4,509 | 4,530 |
| | Nouryon USA, LLC bank term loan FRN Class B, (CME Term SOFR 3 Month + 3.25%), 7.657%, 4/3/28 | | 12,375 | 12,487 |
| | Nouryon USA, LLC bank term loan FRN Class B2, (CME Term SOFR 3 Month + 2.25%), 10.25%, 4/3/28 | | 4,950 | 5,013 |
| | PetSmart, LLC bank term loan FRN Ser. B, (CME Term SOFR 1 Month + 3.75%), 8.207%, 1/29/28 | | 8,643 | 8,625 |
| | Rocket Software, Inc. bank term loan FRN (CME Term SOFR 1 Month + 4.25%), 8.607%, 10/5/28 | | 8,955 | 9,033 |
| | Scientific Games Holdings LP bank term loan FRN Class B, (CME Term SOFR 1 Month + 3.00%), 7.59%, 4/4/29 | | 4,975 | 4,993 |
| | TK Elevator US Newco, Inc. bank term loan FRN Ser. B, (CME Term SOFR 1 Month + 3.50%), 8.588%, 4/15/30 | | 14,303 | 14,425 |
| | Treasure Holdco, Inc. bank term loan FRN Ser. B, (CME Term SOFR 1 Month + 4.25%), 8.764%, 10/10/31 | | 10,000 | 10,035 |
| | United Airlines, Inc. bank term loan FRN Class B, (CME Term SOFR 1 Month + 2.00%), 6.635%, 2/24/31 | | 8,329 | 8,367 |
| | Verde Purchaser, LLC bank term loan FRN (CME Term SOFR 1 Month + 4.50%), 9.104%, 12/2/30 | | 3,724 | 3,740 |
| | Vertiv Group Corp. bank term loan FRN Class B2, (CME Term SOFR 1 Month + 1.75%), 6.194%, 3/2/27 | | 14,081 | 14,116 |
| | Vibrantz Technologies, Inc. bank term loan FRN (CME Term SOFR 3 Month + 4.25%), 9.058%, 4/21/29 | | 14,873 | 14,692 |
| | VM Consolidated, Inc. bank term loan FRN Ser. B, (CME Term SOFR 1 Month + 2.25%), 6.595%, 3/27/28 | | 12,755 | 12,825 |
| | White Cap Buyer, LLC bank term loan FRN Class B, (CME Term SOFR 1 Month + 3.25%), 7.607%, 10/19/29 | | 9,653 | 9,683 |
| | Zegona Finance, LLC bank term loan FRN (CME Term SOFR 1 Month + 4.25%), 9.401%, 7/16/29 | | 4,988 | 5,031 |
| | Total senior loans (cost $310,161) | $310,938 |
| | CONVERTIBLE PREFERRED STOCKS (0.1%)* | Shares | Value |
| | Apollo Global Management, Inc. $3.38 cv. pfd. | 156 | $13,558 |
| | Boeing Co. (The) $3.00 cv. pfd. † | 374 | 22,773 |
| | Hewlett Packard Enterprise Co. $3.81 cv. pfd. | 193 | 12,103 |
| | PG&E Corp. $3.00 cv. pfd. † | 145 | 7,220 |
| | Total convertible preferred stocks (cost $43,400) | $55,654 |
| | CONVERTIBLE BONDS AND NOTES (—%)* | Principal amount | Value |
| | Anywhere Real Estate Group, LLC/Anywhere Co-Issuer Corp. company guaranty cv. sr. unsec. notes 0.25%, 6/15/26 | | $11,000 | $9,776 |
| | Chefs’ Warehouse, Inc. (The) cv. sr. unsec. unsub. notes 2.375%, 12/15/28 | | 5,000 | 6,443 |
| | Guidewire Software, Inc. 144A cv. sr. unsec. notes 1.25%, 11/1/29 | | 12,000 | 11,766 |
| | Nabors Industries, Inc. company guaranty cv. sr. unsec. unsub. notes 1.75%, 6/15/29 | | 5,000 | 3,641 |
| | Uber Technologies, Inc. cv. sr. unsec. notes Ser. 2028, 0.875%, 12/1/28 | | 10,000 | 11,050 |
| | Wrangler Holdco Corp. 144A company guaranty cv. sr. notes unsec. sub. 6.625%, 4/1/32 | | 5,000 | 5,095 |
| | Total convertible bonds and notes (cost $48,731) | $47,771 |
| | SHORT-TERM INVESTMENTS (13.2%)* | Principal amount/shares | Value |
| | Putnam Short Term Investment Fund Class P 4.56% L | Shares 12,768,794 | $12,768,794 |
| | U.S. Treasury Bills 4.552%, 1/9/25 # | $300,000 | 299,755 |
| | U.S. Treasury Bills 4.628%, 1/16/25 # | 400,000 | 399,343 |
| | U.S. Treasury Bills 4.308%, 2/13/25 # | 100,000 | 99,505 |
| | Total short-term investments (cost $13,567,241) | $13,567,397 |
| | TOTAL INVESTMENTS |
| | Total investments (cost $83,079,355) | $108,728,757 |
| | Key to holding’s currency abbreviations |
| | EUR | Euro |
| | USD/$ | United States Dollar |
| | Key to holding’s abbreviations |
| | CME | Chicago Mercantile Exchange |
| | CMT | U.S. Constant Maturity Treasury |
| | FRB | Floating Rate Bonds: The rate shown is the current interest rate at the close of the reporting period. Rates may be subject to a cap or floor. For certain securities, the rate may represent a fixed rate currently in place at the close of the reporting period. |
| | FRN | Floating Rate Notes: The rate shown is the current interest rate or yield at the close of the reporting period. Rates may be subject to a cap or floor. For certain securities, the rate may represent a fixed rate currently in place at the close of the reporting period. |
| | IFB | Inverse Floating Rate Bonds, which are securities that pay interest rates that vary inversely to changes in the market interest rates. As interest rates rise, inverse floaters produce less current income. The rate shown is the current interest rate at the close of the reporting period. Rates may be subject to a cap or floor. |
| | IO | Interest Only |
| | REMICs | Real Estate Mortgage Investment Conduits |
| | SOFR | Secured Overnight Financing Rate |
| | TBA | To Be Announced Commitments |
| 24 |
| Putnam VT Global Asset Allocation Fund |
| | Notes to the fund’s portfolio |
| | Unless noted otherwise, the notes to the fund’s portfolio are for the close of the fund’s reporting period, which ran from January 1, 2024 through December 31, 2024 (the reporting period). Within the following notes to the portfolio, references to “Franklin Advisers” represent Franklin Advisers, Inc., the fund’s investment manager, a direct wholly-owned subsidiary of Franklin Resources, Inc., and references to “ASC 820” represent Accounting Standards Codification 820 Fair Value Measurements and Disclosures. |
| * | Percentages indicated are based on net assets of $102,799,336. |
| † | This security is non-income-producing. |
| ‡‡ | Income may be received in cash or additional securities at the discretion of the issuer. The rate shown in parenthesis is the rate paid in kind, if applicable. |
| # | This security, in part or in entirety, was pledged and segregated with the broker to cover margin requirements for futures contracts at the close of the reporting period. Collateral at period end totaled $713,491 and is included in Investments in securities on the Statement of assets and liabilities (Notes 1 and 9). |
| c | Senior loans are exempt from registration under the Securities Act of 1933, as amended, but contain certain restrictions on resale and cannot be sold publicly. These loans pay interest at rates which adjust periodically. The interest rates shown for senior loans are the current interest rates at the close of the reporting period. Senior loans are also subject to mandatory and/or optional prepayment which cannot be predicted. As a result, the remaining maturity may be substantially less than the stated maturity shown (Notes 1 and 7). |
| L | Affiliated company (Note 5). The rate quoted in the security description is the annualized 7-day yield of the fund at the close of the reporting period. |
| R | Real Estate Investment Trust. |
| W | The rate shown represents the weighted average coupon associated with the underlying mortgage pools. Rates may be subject to a cap or floor. |
| | Unless otherwise noted, the rates quoted in Short-term investments security descriptions represent the weighted average yield to maturity. |
| | Debt obligations are considered secured unless otherwise indicated. |
| | 144A after the name of an issuer represents securities exempt from registration under Rule 144A of the Securities Act of 1933, as amended. These securities may be resold in transactions exempt from registration, normally to qualified institutional buyers. |
| | See Note 1 to the financial statements regarding TBA commitments. |
| | The dates shown on debt obligations are the original maturity dates. |
| | FORWARD CURRENCY CONTRACTS at 12/31/24 (aggregate face value $1,871,854) |
| | Counterparty | Currency | Contract type* | Delivery date | Value | Aggregate face value | Unrealized appreciation/ (depreciation) |
| | Bank of America N.A. |
| | | Australian Dollar | Buy | 1/22/25 | $10,460 | $11,644 | $(1,184) |
| | | Canadian Dollar | Buy | 1/22/25 | 11,835 | 12,645 | (810) |
| | | Singapore Dollar | Buy | 2/19/25 | 5,209 | 5,417 | (208) |
| | | Swedish Krona | Buy | 3/19/25 | 6,181 | 6,304 | (123) |
| | Barclays Bank PLC |
| | | Australian Dollar | Buy | 1/22/25 | 32,929 | 35,584 | (2,655) |
| | | Hong Kong Dollar | Buy | 2/19/25 | 44,651 | 44,665 | (14) |
| | | New Zealand Dollar | Sell | 1/22/25 | 9,121 | 10,259 | 1,138 |
| | | Swedish Krona | Buy | 3/19/25 | 45,787 | 46,717 | (930) |
| | | Swiss Franc | Buy | 3/19/25 | 17,884 | 18,479 | (595) |
| | Citibank, N.A. |
| | | Australian Dollar | Buy | 1/22/25 | 74,709 | 83,186 | (8,477) |
| | | Hong Kong Dollar | Sell | 2/19/25 | 1,327 | 1,326 | (1) |
| | Goldman Sachs International |
| | | Israeli Shekel | Sell | 1/22/25 | 198,354 | 190,587 | (7,767) |
| | HSBC Bank USA, National Association |
| | | Danish Krone | Sell | 3/19/25 | 7,086 | 7,242 | 156 |
| | | Hong Kong Dollar | Buy | 2/19/25 | 13,488 | 13,480 | 8 |
| | | Singapore Dollar | Buy | 2/19/25 | 5,576 | 5,681 | (105) |
| | | Swiss Franc | Buy | 3/19/25 | 17,551 | 18,137 | (586) |
| | JPMorgan Chase Bank N.A. |
| | | Danish Krone | Sell | 3/19/25 | 36,503 | 37,305 | 802 |
| | | Norwegian Krone | Sell | 3/19/25 | 187,984 | 194,203 | 6,219 |
| | | Swiss Franc | Buy | 3/19/25 | 5,887 | 6,084 | (197) |
| | Morgan Stanley & Co. International PLC |
| | | Australian Dollar | Buy | 1/22/25 | 23,954 | 25,175 | (1,221) |
| | | Canadian Dollar | Buy | 1/22/25 | 70 | 74 | (4) |
| | | Euro | Sell | 3/19/25 | 15,797 | 16,122 | 325 |
| | | Israeli Shekel | Buy | 1/22/25 | 2,532 | 2,523 | 9 |
| | | Japanese Yen | Buy | 2/19/25 | 2,482 | 2,597 | (115) |
| | |
| Putnam VT Global Asset Allocation Fund |
| 25 |
| | FORWARD CURRENCY CONTRACTS at 12/31/24 (aggregate face value $1,871,854) cont. |
| | Counterparty | Currency | Contract type* | Delivery date | Value | Aggregate face value | Unrealized appreciation/ (depreciation) |
| | Morgan Stanley & Co. International PLC cont. |
| | | Singapore Dollar | Buy | 2/19/25 | $4,989 | $5,188 | $(199) |
| | | Swedish Krona | Buy | 3/19/25 | 106,721 | 108,879 | (2,158) |
| | | Swiss Franc | Buy | 3/19/25 | 96,528 | 99,753 | (3,225) |
| | NatWest Markets PLC |
| | | Australian Dollar | Buy | 1/22/25 | 61,091 | 67,019 | (5,928) |
| | | Danish Krone | Sell | 3/19/25 | 50,577 | 51,147 | 570 |
| | | Euro | Buy | 3/19/25 | 31,491 | 31,473 | 18 |
| | | New Zealand Dollar | Buy | 1/22/25 | 168 | 168 | — |
| | | Swedish Krona | Buy | 3/19/25 | 112,656 | 114,032 | (1,376) |
| | State Street Bank and Trust Co. |
| | | Australian Dollar | Buy | 1/22/25 | 51,250 | 57,055 | (5,805) |
| | | British Pound | Sell | 3/19/25 | 20,269 | 20,951 | 682 |
| | | Euro | Sell | 3/19/25 | 47,600 | 48,156 | 556 |
| | | Hong Kong Dollar | Sell | 2/19/25 | 27,556 | 27,544 | (12) |
| | | Japanese Yen | Buy | 2/19/25 | 30,138 | 29,355 | 783 |
| | | Singapore Dollar | Buy | 2/19/25 | 117,386 | 120,119 | (2,733) |
| | | Swedish Krona | Buy | 3/19/25 | 23,805 | 24,287 | (482) |
| | | Swiss Franc | Buy | 3/19/25 | 60,538 | 62,558 | (2,020) |
| | UBS AG |
| | | Australian Dollar | Buy | 1/22/25 | 22,902 | 25,496 | (2,594) |
| | | Euro | Sell | 3/19/25 | 30,036 | 30,448 | 412 |
| | | Israeli Shekel | Sell | 1/22/25 | 14,035 | 13,199 | (836) |
| | | Japanese Yen | Buy | 2/19/25 | 13,621 | 14,245 | (624) |
| | | Swiss Franc | Buy | 3/19/25 | 101,083 | 104,296 | (3,213) |
| | WestPac Banking Corp. |
| | | Canadian Dollar | Buy | 1/22/25 | 19,702 | 21,050 | (1,348) |
| | Unrealized appreciation | 11,678 |
| | Unrealized (depreciation) | (57,545) |
| | Total | $(45,867) |
| * | The exchange currency for all contracts listed is the United States Dollar. |
| | FUTURES CONTRACTS OUTSTANDING at 12/31/24 |
| | | Number of contracts | Notional amount | Value | Expiration date | Unrealized appreciation/ (depreciation) |
| | Russell 2000 Index E-Mini (Long) | 26 | $2,899,205 | $2,924,740 | Mar-25 | $(184,554) |
| | S&P 500 Index E-Mini (Long) | 1 | 294,082 | 296,788 | Mar-25 | (10,967) |
| | S&P 500 Index E-Mini (Short) | 33 | 9,704,690 | 9,793,988 | Mar-25 | 362,051 |
| | U.S. Treasury Bond 30 yr (Long) | 16 | 1,821,500 | 1,821,500 | Mar-25 | (65,387) |
| | U.S. Treasury Bond Ultra 30 yr (Long) | 15 | 1,783,594 | 1,783,594 | Mar-25 | (94,246) |
| | U.S. Treasury Note 2 yr (Long) | 25 | 5,140,234 | 5,140,234 | Mar-25 | (5,287) |
| | U.S. Treasury Note 5 yr (Long) | 40 | 4,252,188 | 4,252,188 | Mar-25 | (36,342) |
| | U.S. Treasury Note 10 yr (Long) | 21 | 2,283,750 | 2,283,750 | Mar-25 | (38,098) |
| | Unrealized appreciation | | | | | 362,051 |
| | Unrealized (depreciation) | | | | | (434,881) |
| | Total | $(72,830) |
| | TBA SALE COMMITMENTS OUTSTANDING at 12/31/24 (proceeds receivable $2,024,063) |
| | Agency | Principal amount | Settlement date | Value |
| | Uniform Mortgage-Backed Securities, 6.50%, 1/1/55 | $1,000,000 | 1/14/25 | $1,020,781 |
| | Uniform Mortgage-Backed Securities, 5.50%, 1/1/55 | 1,000,000 | 1/14/25 | 986,905 |
| | Total | $2,007,686 |
| 26 |
| Putnam VT Global Asset Allocation Fund |
| | CENTRALLY CLEARED INTEREST RATE SWAP CONTRACTS OUTSTANDING at 12/31/24 |
| | Notional amount | Value | Upfront premium received (paid) | Termination date | Payments made by fund | Payments received by fund | Unrealized appreciation/ (depreciation) |
| | | $1,415,000 | $5,185E | $(3,458) | 3/19/27 | 3.85% — Annually | US SOFR — Annually | $1,726 |
| | | 4,014,000 | 14,707E | 9,765 | 3/19/27 | US SOFR — Annually | 3.85% — Annually | (4,942) |
| | | 1,716,000 | 21,272E | (10,984) | 3/19/30 | 3.75% — Annually | US SOFR — Annually | 10,287 |
| | | 372,000 | 9,539E | (4,517) | 3/19/35 | 3.75% — Annually | US SOFR — Annually | 5,022 |
| | | 2,042,000 | 52,361E | 24,705 | 3/19/35 | US SOFR — Annually | 3.75% — Annually | (27,656) |
| | | 809,000 | 51,695E | 29,016 | 3/19/55 | US SOFR — Annually | 3.55% — Annually | (22,678) |
| | Total | $44,527 | $(38,241) |
| E | Extended effective date. |
| | OTC TOTAL RETURN SWAP CONTRACTS OUTSTANDING at 12/31/24 |
| | Swap counterparty/ Notional amount | Value | Upfront premium received (paid) | Termination date | Payments received (paid) by fund | Total return received by or paid by fund | Unrealized appreciation/ (depreciation) |
| | Barclays Bank PLC |
| | | $3,177,636 | $3,032,567 | $— | 12/11/25 | (US SOFR plus 0.40%) — Monthly | A basket (BCPUDEAL) of common stocks — Monthly* | $(150,128) |
| | | 3,176,394 | 3,017,238 | — | 12/11/25 | US SOFR plus 0.25% — Monthly | A basket (BCPUDEAS) of common stocks — Monthly* | 164,854 |
| | Goldman Sachs International |
| | | 4,228,620 | 4,131,702 | — | 12/15/25 | (US SOFR plus 0.40%) — Monthly | A basket (GSGLPWDL) of common stocks — Monthly* | (102,689) |
| | | 3,910,455 | 3,816,705 | — | 12/15/25 | US SOFR minus 0.25% — Monthly | A basket (GSGLPWDS) of common stocks — Monthly* | 97,318 |
| | Upfront premium received | — | Unrealized appreciation | 262,172 |
| | Upfront premium (paid) | — | Unrealized (depreciation) | (252,817) |
| | Total | $— | Total | $9,355 |
| * | The 50 largest components, and any individual component greater than 1% of basket value, are shown below. |
| | A BASKET (BCPUDEAL) OF COMMON STOCKS |
| | Common stocks | Sector | Shares | Value | Percentage value |
| | Cheniere Energy, Inc. | Energy | 172 | $36,876 | 1.22% |
| | Unum Group | Financials | 501 | 36,619 | 1.21% |
| | Pegasystems, Inc. | Technology | 389 | 36,212 | 1.19% |
| | Vistra Corp. | Utilities and power | 258 | 35,582 | 1.17% |
| | Equitable Holdings, Inc. | Financials | 753 | 35,511 | 1.17% |
| | General Motors Co. | Consumer cyclicals | 664 | 35,362 | 1.17% |
| | DoorDash, Inc. Class A | Consumer staples | 210 | 35,233 | 1.16% |
| | Booking Holdings, Inc. | Consumer cyclicals | 7 | 34,984 | 1.15% |
| | Allison Transmission Holdings, Inc. | Capital goods | 321 | 34,635 | 1.14% |
| | DocuSign, Inc. | Technology | 381 | 34,272 | 1.13% |
| | Vornado Realty Trust | Financials | 814 | 34,228 | 1.13% |
| | O’Reilly Automotive, Inc. | Consumer cyclicals | 28 | 33,649 | 1.11% |
| | NRG Energy, Inc. | Utilities and power | 372 | 33,525 | 1.11% |
| | Valero Energy Corp. | Energy | 273 | 33,483 | 1.10% |
| | Wintrust Financial Corp. | Financials | 268 | 33,365 | 1.10% |
| | Natera, Inc. | Health care | 208 | 32,851 | 1.08% |
| | Freeport-McMoRan, Inc. | Basic materials | 845 | 32,185 | 1.06% |
| | Tapestry, Inc. | Consumer cyclicals | 491 | 32,053 | 1.06% |
| | Johnson Controls International PLC | Capital goods | 405 | 31,958 | 1.05% |
| | Manhattan Associates, Inc. | Technology | 114 | 30,870 | 1.02% |
| | MGIC Investment Corp. | Financials | 1,292 | 30,627 | 1.01% |
| | Ventas, Inc. | Health care | 511 | 30,078 | 0.99% |
| | Qualcomm, Inc. | Technology | 196 | 30,065 | 0.99% |
| | Pure Storage, Inc. Class A | Technology | 489 | 30,034 | 0.99% |
| | Synchrony Financial | Financials | 462 | 30,031 | 0.99% |
| | |
| Putnam VT Global Asset Allocation Fund |
| 27 |
| | A BASKET (BCPUDEAL) OF COMMON STOCKS cont. |
| | Common stocks | Sector | Shares | Value | Percentage value |
| | Procore Technologies, Inc. | Technology | 398 | $29,838 | 0.98% |
| | Cadence Design Systems, Inc. | Technology | 98 | 29,383 | 0.97% |
| | Southwest Airlines Co. | Transportation | 867 | 29,159 | 0.96% |
| | Constellation Energy Corp. | Utilities and power | 129 | 28,834 | 0.95% |
| | Arista Networks, Inc. | Technology | 256 | 28,305 | 0.93% |
| | Louisiana-Pacific Corp. | Basic materials | 272 | 28,202 | 0.93% |
| | Fair Isaac Corp. | Technology | 14 | 27,737 | 0.91% |
| | American International Group, Inc. | Financials | 380 | 27,681 | 0.91% |
| | Autonation, Inc. | Consumer cyclicals | 161 | 27,413 | 0.90% |
| | Toll Brothers, Inc. | Consumer cyclicals | 213 | 26,834 | 0.88% |
| | Jefferies Financial Group, Inc. | Financials | 342 | 26,832 | 0.88% |
| | Coinbase Global, Inc. Class A | Financials | 107 | 26,631 | 0.88% |
| | NVR, Inc. | Consumer cyclicals | 3 | 25,459 | 0.84% |
| | Uber Technologies, Inc. | Consumer staples | 422 | 25,446 | 0.84% |
| | Synopsys, Inc. | Technology | 52 | 25,317 | 0.83% |
| | Jacobs Solutions, Inc. | Capital goods | 188 | 25,060 | 0.83% |
| | eBay, Inc. | Technology | 399 | 24,741 | 0.82% |
| | Axis Capital Holdings, Ltd. | Financials | 278 | 24,599 | 0.81% |
| | Cirrus Logic, Inc. | Technology | 247 | 24,580 | 0.81% |
| | Netflix, Inc. | Consumer cyclicals | 28 | 24,566 | 0.81% |
| | J.M. Smucker Co. (The) | Consumer staples | 218 | 23,991 | 0.79% |
| | Textron, Inc. | Capital goods | 312 | 23,848 | 0.79% |
| | TransUnion | Consumer cyclicals | 252 | 23,378 | 0.77% |
| | Affiliated Managers Group, Inc. | Financials | 123 | 22,812 | 0.75% |
| | CAVA Group, Inc. | Consumer staples | 202 | 22,802 | 0.75% |
| | A BASKET (BCPUDEAS) OF COMMON STOCKS |
| | Common stocks | Sector | Shares | Value | Percentage value |
| | Ciena Corp. | Technology | 471 | $39,944 | 1.32% |
| | DT Midstream, Inc. | Energy | 372 | 36,971 | 1.23% |
| | AppLovin Corp. Class A | Technology | 114 | 36,843 | 1.22% |
| | Norwegian Cruise Line Holdings, Ltd. | Consumer cyclicals | 1,383 | 35,597 | 1.18% |
| | SoFi Technologies, Inc. | Financials | 2,276 | 35,045 | 1.16% |
| | Chesapeake Energy Corp. | Energy | 345 | 34,326 | 1.14% |
| | Royal Caribbean Cruises, Ltd. | Consumer cyclicals | 149 | 34,297 | 1.14% |
| | Kinsale Capital Group, Inc. | Financials | 73 | 33,762 | 1.12% |
| | Globant SA (Argentina) | Technology | 157 | 33,671 | 1.12% |
| | Take-Two Interactive Software, Inc. | Technology | 181 | 33,333 | 1.10% |
| | BWX Technologies, Inc. | Capital goods | 299 | 33,286 | 1.10% |
| | NortonLifeLock, Inc. | Technology | 1,201 | 32,883 | 1.09% |
| | Digital Realty Trust, Inc. | Financials | 183 | 32,479 | 1.08% |
| | Tyler Technologies, Inc. | Technology | 56 | 32,196 | 1.07% |
| | Domino’s Pizza, Inc. | Consumer staples | 77 | 32,162 | 1.07% |
| | Tesla, Inc. | Consumer cyclicals | 79 | 32,091 | 1.06% |
| | Lithia Motors, Inc. | Consumer cyclicals | 90 | 32,070 | 1.06% |
| | Aon PLC | Financials | 89 | 31,821 | 1.05% |
| | Jack Henry & Associates, Inc. | Technology | 180 | 31,468 | 1.04% |
| | RPM International, Inc. | Basic materials | 251 | 30,840 | 1.02% |
| | Ross Stores, Inc. | Consumer cyclicals | 195 | 29,505 | 0.98% |
| | Carnival Corp. | Consumer cyclicals | 1,157 | 28,843 | 0.96% |
| | Watsco, Inc. | Consumer staples | 61 | 28,749 | 0.95% |
| | RB Global, Inc. | Consumer cyclicals | 314 | 28,319 | 0.94% |
| | Equifax, Inc. | Consumer cyclicals | 109 | 27,725 | 0.92% |
| | Texas Instruments, Inc. | Technology | 139 | 26,087 | 0.86% |
| | Generac Holdings, Inc. | Capital goods | 167 | 25,943 | 0.86% |
| | |
| 28 |
| Putnam VT Global Asset Allocation Fund |
| | A BASKET (BCPUDEAS) OF COMMON STOCKS cont. |
| | Common stocks | Sector | Shares | Value | Percentage value |
| | PTC, Inc. | Technology | 135 | $24,872 | 0.82% |
| | e.l.f. Beauty, Inc. | Consumer staples | 195 | 24,507 | 0.81% |
| | Universal Health Services, Inc. Class B | Health care | 135 | 24,270 | 0.80% |
| | D.R. Horton, Inc. | Consumer cyclicals | 170 | 23,743 | 0.79% |
| | Avantor, Inc. | Health care | 1,108 | 23,353 | 0.77% |
| | Stanley Black & Decker, Inc. | Consumer cyclicals | 288 | 23,105 | 0.77% |
| | Entegris, Inc. | Technology | 233 | 23,055 | 0.76% |
| | Amdocs, Ltd. | Technology | 271 | 23,036 | 0.76% |
| | T Rowe Price Group, Inc. | Financials | 203 | 23,010 | 0.76% |
| | CarMax, Inc. | Consumer cyclicals | 280 | 22,854 | 0.76% |
| | LPL Financial Holdings, Inc. | Financials | 70 | 22,713 | 0.75% |
| | Fox Corp. Class B | Consumer cyclicals | 496 | 22,682 | 0.75% |
| | Atmos Energy Corp. | Utilities and power | 161 | 22,427 | 0.74% |
| | IBM Corp. | Technology | 100 | 22,006 | 0.73% |
| | Brown-Forman Corp. Class B | Consumer staples | 567 | 21,530 | 0.71% |
| | Healthcare Realty Trust, Inc. | Financials | 1,270 | 21,525 | 0.71% |
| | Monolithic Power Systems, Inc. | Technology | 36 | 21,229 | 0.70% |
| | Albemarle Corp. | Basic materials | 247 | 21,226 | 0.70% |
| | Micron Technology, Inc. | Technology | 243 | 20,473 | 0.68% |
| | Coherent Corp. | Capital goods | 215 | 20,378 | 0.68% |
| | Affirm Holdings, Inc. | Consumer cyclicals | 332 | 20,246 | 0.67% |
| | Block, Inc. Class A | Consumer cyclicals | 237 | 20,181 | 0.67% |
| | Bunge Global SA | Basic materials | 248 | 19,269 | 0.64% |
| | A BASKET (GSGLPWDL) OF COMMON STOCKS |
| | Common stocks | Sector | Shares | Value | Percentage value |
| | Sekisui Chemical Co., Ltd. (Japan) | Financials | 1,698 | $29,329 | 0.71% |
| | ConocoPhillips | Energy | 281 | 27,819 | 0.67% |
| | Endesa SA (Spain) | Utilities and power | 1,254 | 26,964 | 0.65% |
| | BP PLC (United Kingdom) | Energy | 5,410 | 26,627 | 0.64% |
| | Osaka Gas Co., Ltd. (Japan) | Utilities and power | 1,209 | 26,610 | 0.64% |
| | SS&C Technologies Holdings, Inc. | Technology | 349 | 26,430 | 0.64% |
| | Veralto Corp. | Capital goods | 254 | 25,849 | 0.63% |
| | Rio Tinto PLC (United Kingdom) | Basic materials | 433 | 25,627 | 0.62% |
| | Novozymes A/S Class B (Denmark) | Basic materials | 452 | 25,598 | 0.62% |
| | ENGIE SA (France) | Utilities and power | 1,613 | 25,564 | 0.62% |
| | Iberdrola SA (Spain) | Utilities and power | 1,846 | 25,422 | 0.62% |
| | Automatic Data Processing, Inc. | Consumer cyclicals | 86 | 25,186 | 0.61% |
| | AT&T, Inc. | Communication services | 1,100 | 25,055 | 0.61% |
| | Holcim AG (Switzerland) | Basic materials | 259 | 24,997 | 0.60% |
| | VeriSign, Inc. | Technology | 118 | 24,413 | 0.59% |
| | Consolidated Edison, Inc. | Utilities and power | 273 | 24,396 | 0.59% |
| | SSE PLC (United Kingdom) | Utilities and power | 1,200 | 24,102 | 0.58% |
| | Amadeus IT Holding SA (Spain) | Consumer cyclicals | 338 | 23,881 | 0.58% |
| | TotalEnergies SE (France) | Energy | 432 | 23,865 | 0.58% |
| | Exor NV (Netherlands) | Financials | 260 | 23,858 | 0.58% |
| | PepsiCo, Inc. | Consumer staples | 155 | 23,603 | 0.57% |
| | Exxon Mobil Corp. | Energy | 216 | 23,233 | 0.56% |
| | Loblaw Cos, Ltd. (Canada) | Consumer staples | 176 | 23,100 | 0.56% |
| | Hartford Financial Services Group, Inc. (The) | Financials | 209 | 22,867 | 0.55% |
| | Central Japan Railway Co. (Japan) | Transportation | 1,183 | 22,318 | 0.54% |
| | Danone SA (France) | Consumer staples | 329 | 22,155 | 0.54% |
| | Altria Group, Inc. | Consumer staples | 424 | 22,148 | 0.54% |
| | Lockheed Martin Corp. | Capital goods | 45 | 21,927 | 0.53% |
| | MSCI, Inc. | Technology | 36 | 21,569 | 0.52% |
| | |
| Putnam VT Global Asset Allocation Fund |
| 29 |
| | A BASKET (GSGLPWDL) OF COMMON STOCKS cont. |
| | Common stocks | Sector | Shares | Value | Percentage value |
| | George weston, Ltd. (Canada) | Consumer staples | 137 | $21,241 | 0.51% |
| | CLP Holdings, Ltd. (Hong Kong) | Utilities and power | 2,522 | 21,197 | 0.51% |
| | Telenor ASA (Norway) | Communication services | 1,891 | 21,130 | 0.51% |
| | Allegion PLC (Ireland) | Capital goods | 160 | 20,870 | 0.51% |
| | Eni SpA (Italy) | Utilities and power | 1,525 | 20,670 | 0.50% |
| | Fortum OYJ (Finland) | Utilities and power | 1,467 | 20,528 | 0.50% |
| | Leidos Holdings, Inc. | Technology | 141 | 20,384 | 0.49% |
| | Novartis AG (Switzerland) | Health care | 207 | 20,265 | 0.49% |
| | Netflix, Inc. | Consumer cyclicals | 23 | 20,213 | 0.49% |
| | Elisa Oyj (Finland) | Communication services | 462 | 19,987 | 0.48% |
| | SEI Investments Co. | Financials | 242 | 19,954 | 0.48% |
| | TOPPAN Holdings, Inc. (Japan) | Consumer cyclicals | 745 | 19,939 | 0.48% |
| | Graco, Inc. | Capital goods | 231 | 19,444 | 0.47% |
| | Oversea-Chinese Banking Corp., Ltd. (Singapore) | Financials | 1,571 | 19,225 | 0.47% |
| | Givaudan SA (Switzerland) | Basic materials | 4 | 19,086 | 0.46% |
| | Verisk Analytics, Inc. | Consumer cyclicals | 67 | 18,582 | 0.45% |
| | Intertek Group PLC (United Kingdom) | Consumer cyclicals | 305 | 18,086 | 0.44% |
| | GoDaddy, Inc. Class A | Technology | 91 | 17,899 | 0.43% |
| | Philip Morris International, Inc. | Consumer staples | 148 | 17,827 | 0.43% |
| | Jack Henry & Associates, Inc. | Technology | 101 | 17,765 | 0.43% |
| | Aristocrat Leisure, Ltd. (Australia) | Consumer cyclicals | 419 | 17,752 | 0.43% |
| | A BASKET (GSGLPWDS) OF COMMON STOCKS |
| | Common stocks | Sector | Shares | Value | Percentage value |
| | Hermes International (France) | Consumer cyclicals | 11 | $26,867 | 0.70% |
| | Erste Group Bank AG (Czech Republic) | Financials | 416 | 25,710 | 0.67% |
| | Keppel, Ltd. (Singapore) | Capital goods | 5,084 | 25,490 | 0.67% |
| | London Stock Exchange Group PLC (United Kingdom) | Financials | 179 | 25,247 | 0.66% |
| | Visa, Inc. Class A | Financials | 78 | 24,669 | 0.65% |
| | RELX PLC (United Kingdom) | Consumer cyclicals | 522 | 23,738 | 0.62% |
| | Wilmar International, Ltd. (Singapore) | Basic materials | 10,356 | 23,532 | 0.62% |
| | Galderma Group AG (Switzerland) | Health care | 210 | 23,332 | 0.61% |
| | Pernod Ricard SA (France) | Consumer staples | 207 | 23,320 | 0.61% |
| | Sempra | Utilities and power | 265 | 23,235 | 0.61% |
| | Paychex, Inc. | Technology | 166 | 23,208 | 0.61% |
| | Imperial Brands PLC (United Kingdom) | Consumer staples | 716 | 22,907 | 0.60% |
| | Waste Connections, Inc. | Capital goods | 132 | 22,617 | 0.59% |
| | Walmart, Inc. | Consumer cyclicals | 246 | 22,223 | 0.58% |
| | Realty Income Corp. | Financials | 415 | 22,178 | 0.58% |
| | Entergy Corp. | Utilities and power | 285 | 21,635 | 0.57% |
| | Commonwealth Bank of Australia (Australia) | Financials | 227 | 21,571 | 0.57% |
| | Infrastructure Wireless Italiane SpA (Italy) | Basic materials | 2,116 | 21,508 | 0.56% |
| | Chesapeake Energy Corp. | Energy | 214 | 21,328 | 0.56% |
| | Metso Oyj (Finland) | Capital goods | 2,280 | 21,204 | 0.56% |
| | Martin Marietta Materials, Inc. | Basic materials | 41 | 21,003 | 0.55% |
| | Allianz SE (Germany) | Financials | 68 | 20,960 | 0.55% |
| | Orange SA (France) | Communication services | 2,064 | 20,578 | 0.54% |
| | Equifax, Inc. | Consumer cyclicals | 80 | 20,403 | 0.53% |
| | Heineken NV (Netherlands) | Consumer staples | 280 | 19,922 | 0.52% |
| | Dominion Energy, Inc. | Utilities and power | 369 | 19,884 | 0.52% |
| | FirstEnergy Corp. | Utilities and power | 496 | 19,733 | 0.52% |
| | Cellnex Telecom, SA 144A (Spain) | Communication services | 622 | 19,654 | 0.51% |
| | Thomson Reuters Corp. (Canada) | Consumer cyclicals | 122 | 19,501 | 0.51% |
| | Swisscom AG (Switzerland) | Communication services | 35 | 19,355 | 0.51% |
| | Westlake Corp. | Basic materials | 169 | 19,333 | 0.51% |
| | |
| 30 |
| Putnam VT Global Asset Allocation Fund |
| | A BASKET (GSGLPWDS) OF COMMON STOCKS cont. |
| | Common stocks | Sector | Shares | Value | Percentage value |
| | Blackstone, Inc. | Financials | 109 | $18,875 | 0.49% |
| | Magna International, Inc. (Canada) | Consumer cyclicals | 444 | 18,533 | 0.49% |
| | Occidental Petroleum Corp. | Energy | 371 | 18,337 | 0.48% |
| | EssilorLuxottica SA (France) | Health care | 75 | 18,301 | 0.48% |
| | Toyota Motor Corp. (Japan) | Consumer cyclicals | 879 | 17,603 | 0.46% |
| | SMC Corp. (Japan) | Technology | 44 | 17,463 | 0.46% |
| | Costco Wholesale Corp. | Consumer staples | 19 | 17,424 | 0.46% |
| | Japan Tobacco, Inc. (Japan) | Consumer staples | 671 | 17,408 | 0.46% |
| | AXA SA (France) | Financials | 488 | 17,345 | 0.45% |
| | Alliant Energy Corp. | Utilities and power | 289 | 17,116 | 0.45% |
| | SAP SE (Germany) | Technology | 69 | 16,801 | 0.44% |
| | U-Haul Holding Co. (non-voting) | Consumer cyclicals | 258 | 16,556 | 0.43% |
| | Ferrovial SE (Netherlands) | Basic materials | 391 | 16,452 | 0.43% |
| | Diamondback Energy, Inc. | Energy | 100 | 16,419 | 0.43% |
| | Swiss Life Holding AG (Switzerland) | Financials | 21 | 16,227 | 0.43% |
| | Alexandria Real Estate Equities, Inc. | Financials | 166 | 16,210 | 0.42% |
| | Snam SpA (Italy) | Utilities and power | 3,609 | 15,984 | 0.42% |
| | Mastercard, Inc. Class A | Consumer cyclicals | 30 | 15,952 | 0.42% |
| | Johnson Controls International PLC | Capital goods | 202 | 15,920 | 0.42% |
| | OTC CREDIT DEFAULT CONTRACTS OUTSTANDING — PROTECTION SOLD at 12/31/24 |
| | Swap counterparty/ Referenced debt* | Rating*** | Upfront premium received (paid)** | | Notional amount | Value | Termination date | Payments received by fund | Unrealized appreciation/ (depreciation) |
| | Bank of America N.A. |
| | CMBX NA BBB–.6 Index | CCC/P | $273 | | $1,753 | $242 | 5/11/63 | 300 bp — Monthly | $33 |
| | CMBX NA BBB–.6 Index | CCC/P | 482 | | 3,505 | 484 | 5/11/63 | 300 bp — Monthly | — |
| | CMBX NA BBB–.6 Index | CCC/P | 926 | | 6,573 | 907 | 5/11/63 | 300 bp — Monthly | 23 |
| | CMBX NA BBB–.6 Index | CCC/P | 912 | | 7,011 | 968 | 5/11/63 | 300 bp — Monthly | (51) |
| | Citigroup Global Markets, Inc. |
| | CMBX NA BB.6 Index | CCC-/P | 2,434 | | 7,165 | 1,778 | 5/11/63 | 500 bp — Monthly | 663 |
| | CMBX NA BBB–.10 Index | BB–/P | 3,907 | | 13,000 | 2,285 | 11/17/59 | 300 bp — Monthly | 1,630 |
| | Goldman Sachs International |
| | CMBX NA A.13 Index | A-/P | (5) | | 1,000 | 73 | 12/16/72 | 200 bp — Monthly | (78) |
| | JPMorgan Securities LLC |
| | CMBX NA BB.6 Index | CCC-/P | 3,089 | | 3,071 | 762 | 5/11/63 | 500 bp — Monthly | 2,330 |
| | Morgan Stanley & Co. International PLC |
| | CMBX NA BB.6 Index | CCC-/P | 1,602 | | 4,606 | 1,143 | 5/11/63 | 500 bp — Monthly | 463 |
| | Upfront premium received | 13,625 | Unrealized appreciation | 5,142 |
| | Upfront premium (paid) | (5) | Unrealized (depreciation) | (129) |
| | Total | $13,620 | Total | $5,013 |
| * | Payments related to the referenced debt are made upon a credit default event. |
| ** | Upfront premium is based on the difference between the original spread on issue and the market spread on day of execution. |
| *** | Ratings for an underlying index represent the average of the ratings of all the securities included in that index. The Moody’s, Standard & Poor’s or Fitch ratings are believed to be the most recent ratings available at December 31, 2024. Securities rated by Fitch are indicated by “/F.” Securities rated by Putnam are indicated by “/P.” The Putnam rating categories are comparable to the Standard & Poor’s classifications. |
| Putnam VT Global Asset Allocation Fund |
| 31 |
| | OTC CREDIT DEFAULT CONTRACTS OUTSTANDING — PROTECTION PURCHASED at 12/31/24 |
| | Swap counterparty/ Referenced debt* | | Upfront premium received (paid)** | | Notional amount | Value | Termination date | Payments (paid) by fund | Unrealized appreciation/ (depreciation) |
| | Citigroup Global Markets, Inc. |
| | CMBX NA BB.10 Index | | $(3,248) | | $7,000 | $2,910 | 11/17/59 | (500 bp) — Monthly | $(345) |
| | CMBX NA BB.10 Index | | (1,612) | | 4,000 | 1,663 | 11/17/59 | (500 bp) — Monthly | 47 |
| | CMBX NA BB.10 Index | | (1,612) | | 4,000 | 1,663 | 11/17/59 | (500 bp) — Monthly | 47 |
| | CMBX NA BB.10 Index | | (806) | | 2,000 | 831 | 11/17/59 | (500 bp) — Monthly | 23 |
| | CMBX NA BB.6 Index | | (3,830) | | 14,842 | 3,684 | 5/11/63 | (500 bp) — Monthly | (161) |
| | CMBX NA BBB–.6 Index | | (700) | | 4,820 | 665 | 5/11/63 | (300 bp) — Monthly | (38) |
| | CMBX NA BBB–.6 Index | | (2,545) | | 3,505 | 484 | 5/11/63 | (300 bp) — Monthly | (2,063) |
| | CMBX NA BBB–.6 Index | | (556) | | 876 | 121 | 5/11/63 | (300 bp) — Monthly | (435) |
| | JPMorgan Securities LLC |
| | CMBX NA BBB–.6 Index | | (4,906) | | 9,640 | 1,330 | 5/11/63 | (300 bp) — Monthly | (3,581) |
| | Merrill Lynch International |
| | CMBX NA BB.10 Index | | (114) | | 2,000 | 831 | 11/17/59 | (500 bp) — Monthly | 716 |
| | Morgan Stanley & Co. International PLC |
| | CMBX NA BBB–.10 Index | | (7,761) | | 24,000 | 4,219 | 11/17/59 | (300 bp) — Monthly | (3,558) |
| | CMBX NA BBB–.12 Index | | (1,590) | | 5,000 | 893 | 8/17/61 | (300 bp) — Monthly | (701) |
| | Upfront premium received | — | Unrealized appreciation | 833 |
| | Upfront premium (paid) | (29,280) | Unrealized (depreciation) | (10,882) |
| | Total | $(29,280) | Total | $(10,049) |
| * | Payments related to the referenced debt are made upon a credit default event. |
| ** | Upfront premium is based on the difference between the original spread on issue and the market spread on day of execution. |
| | CENTRALLY CLEARED CREDIT DEFAULT CONTRACTS OUTSTANDING — PROTECTION SOLD at 12/31/24 |
| | Referenced debt* | Rating*** | Upfront premium received (paid)** | | Notional amount | Value | Termination date | Payments received by fund | Unrealized appreciation/ (depreciation) |
| | CDX NA HY Series 43 Index | B+/P | $(90,998) | | $1,248,000 | $96,044 | 12/20/29 | 500 bp — Quarterly | $8,062 |
| | CDX NA IG Series 43 Index | BBB+/P | (114,959) | | 5,088,000 | 113,564 | 12/20/29 | 100 bp — Quarterly | 300 |
| | Total | $(205,957) | $8,362 |
| * | Payments related to the referenced debt are made upon a credit default event. |
| ** | Upfront premium is based on the difference between the original spread on issue and the market spread on day of execution. |
| *** | Ratings for an underlying index represent the average of the ratings of all the securities included in that index. The Moody’s, Standard & Poor’s or Fitch ratings are believed to be the most recent ratings available at December 31, 2024. Securities rated by Fitch are indicated by “/F.” Securities rated by Putnam are indicated by “/P.” The Putnam rating categories are comparable to the Standard & Poor’s classifications. |
| 32 |
| Putnam VT Global Asset Allocation Fund |
| | ASC 820 establishes a three-level hierarchy for disclosure of fair value measurements. The valuation hierarchy is based upon the transparency of inputs to the valuation of the fund’s investments. The three levels are defined as follows: |
| | Level 1: Valuations based on quoted prices for identical securities in active markets. |
| | Level 2: Valuations based on quoted prices in markets that are not active or for which all significant inputs are observable, either directly or indirectly. |
| | Level 3: Valuations based on inputs that are unobservable and significant to the fair value measurement. |
| | The following is a summary of the inputs used to value the fund’s net assets as of the close of the reporting period: |
| | | Valuation inputs |
| | Investments in securities: | Level 1 | Level 2 | Level 3 |
| | Common stocks*: | | | |
| | Basic materials | $1,380,236 | $828,019 | $— |
| | Capital goods | 2,407,894 | 551,516 | — |
| | Communication services | 756,435 | 220,405 | — |
| | Conglomerates | 908,090 | 294,492 | — |
| | Consumer cyclicals | 10,591,457 | 1,338,492 | — |
| | Consumer staples | 3,757,999 | 691,883 | — |
| | Energy | 1,826,090 | 400,161 | — |
| | Financials | 8,426,722 | 1,953,958 | — |
| | Health care | 5,829,749 | 1,041,694 | — |
| | Technology | 23,418,170 | 624,011 | — |
| | Transportation | 841,020 | 264,086 | — |
| | Utilities and power | 1,641,748 | 317,228 | — |
| | Total common stocks | 61,785,610 | 8,525,945 | — |
| | Convertible bonds and notes | — | 47,771 | — |
| | Convertible preferred stocks | 55,654 | — | — |
| | Corporate bonds and notes | — | 12,374,078 | — |
| | Foreign government and agency bonds and notes | — | 318,707 | — |
| | Mortgage-backed securities | — | 1,719,721 | — |
| | Senior loans | — | 310,938 | — |
| | U.S. government and agency mortgage obligations | — | 10,022,936 | — |
| | Short-term investments | — | 13,567,397 | — |
| | Totals by level | $61,841,264 | $46,887,493 | $— |
| | | Valuation inputs |
| | Other financial instruments: | Level 1 | Level 2 | Level 3 |
| | Forward currency contracts | $— | $(45,867) | $— |
| | Futures contracts | (72,830) | — | — |
| | TBA sale commitments | — | (2,007,686) | — |
| | Interest rate swap contracts | — | (82,768) | — |
| | Total return swap contracts | — | 9,355 | — |
| | Credit default contracts | — | 224,943 | — |
| | Totals by level | $(72,830) | $(1,902,023) | $— |
| * | Common stock classifications are presented at the sector level, which may differ from the fund’s portfolio presentation. |
The accompanying notes are an integral part of these financial statements.
| Putnam VT Global Asset Allocation Fund |
| 33 |
Financial statements
Statement of assets and liabilities
12/31/24
| Assets | |
| Investment in securities, at value (Note 1): | |
| Unaffiliated issuers (identified cost $70,310,561) | $95,959,963 |
| Affiliated issuers (identified cost $12,768,794) (Note 5) | 12,768,794 |
| Cash | 1,521 |
| Foreign currency (cost $2,531) (Note 1) | 2,333 |
| Dividends, interest and other receivables | 336,103 |
| Foreign tax reclaim | 45,988 |
| Receivable for shares of the fund sold | 19,813 |
| Receivable for investments sold | 80,015 |
| Receivable for sales of TBA securities (Note 1) | 2,028,396 |
| Receivable for variation margin on futures contracts (Note 1) | 40,641 |
| Receivable for variation margin on centrally cleared swap contracts (Note 1) | 3,751 |
| Unrealized appreciation on forward currency contracts (Note 1) | 11,678 |
| Unrealized appreciation on OTC swap contracts (Note 1) | 268,147 |
| Premium paid on OTC swap contracts (Note 1) | 29,285 |
| Deposits with broker (Note 1) | 327,810 |
| Receivable from broker (Note 1) | 718 |
| Total assets | 111,924,956 |
| | |
| Liabilities | |
| Payable for investments purchased | 5,392 |
| Payable for purchases of TBA securities (Note 1) | 6,355,326 |
| Payable for shares of the fund repurchased | 37,210 |
| Payable for compensation of Manager (Note 2) | 44,629 |
| Payable for custodian fees (Note 2) | 64,791 |
| Payable for investor servicing fees (Note 2) | 12,260 |
| Payable for Trustee compensation and expenses (Note 2) | 82,054 |
| Payable for administrative services (Note 2) | 882 |
| Payable for distribution fees (Note 2) | 7,350 |
| Payable for variation margin on futures contracts (Note 1) | 20,454 |
| Payable for variation margin on centrally cleared swap contracts (Note 1) | 5,046 |
| Unrealized depreciation on OTC swap contracts (Note 1) | 263,828 |
| Premium received on OTC swap contracts (Note 1) | 13,625 |
| Unrealized depreciation on forward currency contracts (Note 1) | 57,545 |
| TBA sale commitments, at value (proceeds receivable $2,024,063) (Note 1) | 2,007,686 |
| Other accrued expenses | 147,542 |
| Total liabilities | 9,125,620 |
| Net assets | $102,799,336 |
| | |
| Represented by | |
| Paid-in capital (Unlimited shares authorized) (Notes 1 and 4) | $64,724,159 |
| Total distributable earnings (Note 1) | 38,075,177 |
| Total — Representing net assets applicable to capital shares outstanding | $102,799,336 |
| | |
| Computation of net asset value Class IA | |
| Net assets | $68,410,045 |
| Number of shares outstanding | 3,422,154 |
| Net asset value, offering price and redemption price per share (net assets divided by number of shares outstanding) | $19.99 |
| | |
| Computation of net asset value Class IB | |
| Net assets | $34,389,291 |
| Number of shares outstanding | 1,690,710 |
| Net asset value, offering price and redemption price per share (net assets divided by number of shares outstanding) | $20.34 |
The accompanying notes are an integral part of these financial statements.
| 34 | Putnam VT Global Asset Allocation Fund |
Statement of operations
Year ended 12/31/24
| Investment income | |
| Interest (net of foreign tax of $11 ) (including interest income of $696,731 from investments in affiliated issuers) (Note 5) | $1,730,702 |
| Dividends (net of foreign tax of $39,678) | 1,100,280 |
| Securities lending (net of expenses) (Notes 1 and 5) | 110 |
| Total investment income | 2,831,092 |
| | |
| Expenses | |
| Compensation of Manager (Note 2) | 601,772 |
| Investor servicing fees (Note 2) | 72,755 |
| Custodian fees (Note 2) | 89,881 |
| Trustee compensation and expenses (Note 2) | 4,716 |
| Distribution fees (Note 2) | 85,077 |
| Administrative services (Note 2) | 1,921 |
| Auditing and tax fees | 129,281 |
| Other | 26,291 |
| Fees waived and reimbursed by Manager (Note 2) | (42,818) |
| Total expenses | 968,876 |
| Expense reduction (Note 2) | (968) |
| Net expenses | 967,908 |
| Net investment income | 1,863,184 |
| | |
| Realized and unrealized gain (loss) | |
| Net realized gain (loss) on: | |
| Securities from unaffiliated issuers (Notes 1 and 3) | 13,723,721 |
| Foreign currency transactions (Note 1) | (1,616) |
| Forward currency contracts (Note 1) | (11,008) |
| Futures contracts (Note 1) | (1,825,223) |
| Swap contracts (Note 1) | 688,960 |
| Written options (Note 1) | 48,125 |
| Total net realized gain | 12,622,959 |
| Change in net unrealized appreciation (depreciation) on: | |
| Securities from unaffiliated issuers and TBA sale commitments | 1,863,854 |
| Assets and liabilities in foreign currencies | (3,083) |
| Forward currency contracts | (32,215) |
| Futures contracts | (353,335) |
| Swap contracts | (98,910) |
| Written options | (22,059) |
| Total change in net unrealized appreciation | 1,354,252 |
| Net gain on investments | 13,977,211 |
| Net increase in net assets resulting from operations | $15,840,395 |
The accompanying notes are an integral part of these financial statements.
| Putnam VT Global Asset Allocation Fund | 35 |
Statement of changes in net assets
| | Year ended 12/31/24 | Year ended 12/31/23 |
| Increase in net assets | | |
| Operations: | | |
| Net investment income | $1,863,184 | $1,749,614 |
| Net realized gain (loss) on investments and foreign currency transactions | 12,622,959 | (132,641) |
| Change in net unrealized appreciation of investments and assets and liabilities in foreign currencies | 1,354,252 | 14,279,687 |
| Net increase in net assets resulting from operations | 15,840,395 | 15,896,660 |
| Distributions to shareholders (Note 1): | | |
| From ordinary income | | |
| Net investment income | | |
| Class IA | (1,703,708) | (1,231,765) |
| Class IB | (704,262) | (480,710) |
| Decrease from capital share transactions (Note 4) | (10,868,207) | (11,027,900) |
| Total increase in net assets | 2,564,218 | 3,156,285 |
| Net assets: | | |
| Beginning of year | 100,235,118 | 97,078,833 |
| End of year | $102,799,336 | $100,235,118 |
The accompanying notes are an integral part of these financial statements.
| 36 | Putnam VT Global Asset Allocation Fund |
Financial highlights
(For a common share outstanding throughout the period)
| INVESTMENT OPERATIONS: | LESS DISTRIBUTIONS: | RATIOS AND SUPPLEMENTAL DATA: |
| Period ended | Net asset value, beginning of period | Net investment income (loss)a | Net realized and unrealized gain (loss) on investments | Total from investment operations | From net investment income | From net realized gain on investments | Total distributions | Net asset value, end of period | Total return at net asset value (%)b,c | Net assets, end of period (in thousands) | Ratio of expenses to average net assets (%)b,d | Ratio of net investment income (loss) to average net assets (%) | Portfolio turnover (%)e |
| Class IA |
| 12/31/24 | $17.56 | .36 | 2.52 | 2.88 | (.45) | — | (.45) | $19.99 | 16.63 | $68,410 | .85f | 1.88f | 234 |
| 12/31/23 | 15.19 | .30 | 2.36 | 2.66 | (.29) | — | (.29) | 17.56 | 17.78 | 68,403 | .86f | 1.87f | 262 |
| 12/31/22 | 20.05 | .25 | (3.20) | (2.95) | (.29) | (1.62) | (1.91) | 15.19 | (15.82) | 66,140 | .86f | 1.56f | 262 |
| 12/31/21 | 18.21 | .22 | 2.30 | 2.52 | (.18) | (.50) | (.68) | 20.05 | 14.25 | 89,120 | .84 | 1.13 | 306 |
| 12/31/20 | 16.95 | .22 | 1.72 | 1.94 | (.36) | (.32) | (.68) | 18.21 | 12.58 | 87,732 | .86 | 1.32 | 320 |
| Class IB |
| 12/31/24 | $17.86 | .31 | 2.58 | 2.89 | (.41) | — | (.41) | $20.34 | 16.36 | $34,389 | 1.10f | 1.62f | 234 |
| 12/31/23 | 15.44 | .26 | 2.41 | 2.67 | (.25) | — | (.25) | 17.86 | 17.48 | 31,832 | 1.11f | 1.62f | 262 |
| 12/31/22 | 20.34 | .22 | (3.26) | (3.04) | (.24) | (1.62) | (1.86) | 15.44 | (16.03) | 30,939 | 1.11f | 1.30f | 262 |
| 12/31/21 | 18.47 | .17 | 2.34 | 2.51 | (.14) | (.50) | (.64) | 20.34 | 13.95 | 40,953 | 1.09 | .88 | 306 |
| 12/31/20 | 17.17 | .18 | 1.75 | 1.93 | (.31) | (.32) | (.63) | 18.47 | 12.31 | 38,431 | 1.11 | 1.06 | 320 |
| a | Per share net investment income (loss) has been determined on the basis of weighted average number of shares outstanding during the period. |
| b | The charges and expenses at the insurance company separate account level are not reflected. |
| c | Total return assumes dividend reinvestment. |
| d | Includes amounts paid through expense offset and/or brokerage/service arrangements, if any (Note 2). Also excludes acquired fund fees and expenses, if any. |
| e | Portfolio turnover includes TBA purchase and sale commitments. |
| f | Reflects an involuntary contractual expense limitation in effect during the period. As a result of such limitation, the expenses of each class reflect a reduction of the following amounts: |
| | Percentage of average net assets |
| December 31, 2024 | 0.04% |
| December 31, 2023 | 0.07 |
| December 31, 2022 | 0.05 |
The accompanying notes are an integral part of these financial statements.
| Putnam VT Global Asset Allocation Fund |
| 37 |
Notes to financial statements 12/31/24
Unless otherwise noted, the “reporting period” represents the period from January 1, 2024 through December 31, 2024. The following table defines commonly used references within the Notes to financial statements:
| References to | Represent |
| 1940 Act | Investment Company Act of 1940, as amended |
| Franklin Advisers | Franklin Advisers, Inc., a direct wholly-owned subsidiary of Franklin Templeton, and the fund’s investment manager for periods on or after July 15, 2024 |
| Franklin Distributors | Franklin Distributors, LLC, an indirect wholly-owned subsidiary of Franklin Templeton, and the fund’s distributor and principal underwriter for periods on or after August 2, 2024 |
| Franklin Templeton | Franklin Resources, Inc. |
| Franklin Templeton Services | Franklin Templeton Services, LLC, a wholly-owned subsidiary of Franklin Templeton |
| FTIML | Franklin Templeton Investment Management Limited |
| JPMorgan | JPMorgan Chase Bank, N.A. |
| OTC | Over-the-counter |
| PAC | The Putnam Advisory Company, LLC, an indirect wholly-owned subsidiary of Franklin Templeton |
| PIL | Putnam Investments Limited, an indirect wholly-owned subsidiary of Franklin Templeton |
| PSERV | Putnam Investor Services, Inc., a wholly-owned subsidiary of Franklin Templeton |
| Putnam Management | Putnam Investment Management, LLC, an indirect wholly-owned subsidiary of Franklin Templeton, and the fund’s investment manager for periods prior to July 15, 2024 |
| Putnam Retail Management | Putnam Retail Management Limited Partnership, an indirect wholly-owned subsidiary of Franklin Templeton, and the fund’s distributor and principal underwriter for periods prior to August 2, 2024 |
| SEC | Securities and Exchange Commission |
| State Street | State Street Bank and Trust Company |
Putnam VT Global Asset Allocation Fund (the fund) is a diversified series of Putnam Variable Trust (the Trust), a Massachusetts business trust registered under the 1940 Act, as an open-end management investment company. The goal of the fund is to seek long-term return consistent with preservation of capital. The fund invests a majority of its assets in a diversified portfolio of equity securities (growth or value stocks or both) of both U.S. and foreign companies of any size. The fund’s investment manager may consider, among other factors, a company’s valuation, financial strength, growth potential, competitive position in its industry, projected future earnings, cash flows and dividends when deciding whether to buy or sell equity investments. The fund also invests in a diversified portfolio of fixed-income investments, including both U.S. and foreign government obligations, corporate obligations and securitized debt instruments (such as mortgage-backed investments). The fund’s investment manager may consider, among other factors, credit, interest rate and prepayment risks, as well as general market conditions, when deciding whether to buy or sell fixed-income investments. The fund’s investment manager may also select other investments that do not fall within these asset classes. Franklin Advisers may also use to a significant extent derivatives, such as futures, options, certain foreign currency transactions, warrants and swap contracts, for both hedging and non-hedging purposes.
The fund offers class IA and class IB shares of beneficial interest. Class IA shares are offered at net asset value and are not subject to a distribution fee. Class IB shares are offered at net asset value and pay an ongoing distribution fee, which is identified in Note 2.
In the normal course of business, the fund enters into contracts that may include agreements to indemnify another party under given circumstances. The fund’s maximum exposure under these arrangements is unknown as this would involve future claims that may be, but have not yet been, made against the fund. However, the fund’s management team expects the risk of material loss to be remote.
The fund has entered into contractual arrangements with an investment adviser, administrator, distributor, shareholder servicing agent and custodian, who each provide services to the fund. Unless expressly stated otherwise, shareholders are not parties to, or intended beneficiaries of these contractual arrangements, and these contractual arrangements are not intended to create any shareholder right to enforce them against the service providers or to seek any remedy under them against the service providers, either directly or on behalf of the fund.
Under the Trust’s Agreement and Declaration of Trust, any claims asserted by a shareholder against or on behalf of the Trust (or its series), including claims against Trustees and Officers, must be brought in courts located within the Commonwealth of Massachusetts.
Note 1: Significant accounting policies
The fund follows the accounting and reporting guidance in Financial Accounting Standards Board (FASB) Accounting Standards Codification Topic 946, Financial Services – Investment Companies (ASC 946) and applies the specialized accounting and reporting guidance in U.S. Generally Accepted Accounting Principles (U.S. GAAP), including, but not limited to, ASC 946. The following is a summary of significant accounting policies consistently followed by the fund in the preparation of its financial statements. The preparation of financial statements is in conformity with accounting principles generally accepted in the United States of America and requires management to make estimates and assumptions that affect the reported amounts of assets and liabilities in the financial statements and the reported amounts of increases and decreases in net assets from operations. Actual results could differ from those estimates. Subsequent events after the Statement of assets and liabilities date through the date that the financial statements were issued have been evaluated in the preparation of the financial statements.
Investment income, realized and unrealized gains and losses and expenses of the fund are borne pro-rata based on the relative net assets of each class to the total net assets of the fund, except that each class bears expenses unique to that class (including the distribution fees applicable to such classes). Each class votes as a class only with respect to its own distribution plan or other matters on which a class vote is required by law or determined by the Trustees. If the fund were liquidated, shares of each class would receive their pro-rata share of the net assets of the fund. In addition, the Trustees declare separate dividends on each class of shares.
Security valuation Portfolio securities and other investments are valued using policies and procedures adopted by the Board of Trustees (Trustees). The Trustees have formed a Pricing Committee to oversee the implementation of these procedures. Under compliance policies and procedures approved by the Trustees, the Trustees have designated the fund’s investment manager as the valuation designee and has responsibility for oversight of valuation. The investment manager is assisted by the fund’s administrator in performing this responsibility, including leading the cross-functional Valuation Committee (VC). The VC is responsible for making fair value determinations, evaluating the effectiveness of the pricing policies of the fund and reporting to the Trustees.
Investments for which market quotations are readily available are valued at the last reported sales price on their principal exchange, or official closing price for certain markets, and are classified as Level 1 securities under Accounting Standards Codification 820 Fair Value Measurements and Disclosures (ASC 820). If no sales are reported, as in the case of some securities that are traded OTC, a security is valued at the average of the last reported bid and ask prices, the “mid price” (prior to July 22, 2024, the most recent bid price was used), and is generally categorized as a Level 2 security.
Investments in open-end investment companies (excluding exchange-traded funds), if any, which can be classified as Level 1 or Level 2 securities, are valued based on their net asset value. The net asset value of such investment companies equals the total value of their assets less their liabilities and divided by the number of their outstanding shares.
Market quotations are not considered to be readily available for certain debt obligations (including short-term investments with remaining maturities of 60 days or less) and other investments; such investments are valued on the basis of valuations furnished by an independent pricing service approved by the Trustees or dealers selected by the fund’s investment manager. Such services or dealers determine valuations for normal institutional-size trading units of such securities using methods based on market transactions for comparable securities and various relationships, generally recognized by institutional traders, between securities (which consider such factors as security prices, yields, maturities and ratings). These securities will generally be categorized as Level 2.
Many securities markets and exchanges outside the U.S. close prior to the scheduled close of the New York Stock Exchange and therefore the closing prices
| 38 |
| Putnam VT Global Asset Allocation Fund |
for securities in such markets or on such exchanges may not fully reflect events that occur after such close but before the scheduled close of the New York Stock Exchange. Reliable prices are not readily available for equity securities in these circumstances, where the value of a security has been affected by events after the close of the exchange or market on which the security is principally traded, but before the fund calculates its net asset value. To address this, the fund will fair value these securities as determined in accordance with procedures approved by the Trustees. This includes using an independent third-party pricing service to adjust the value of such securities to the latest indications of fair value at 4:00 p.m. (Eastern Time). These securities, which would generally be classified as Level 1 securities, will be transferred to Level 2 of the fair value hierarchy when they are valued at fair value. At the close of the reporting period, fair value pricing was used for certain foreign securities in the portfolio. Securities quoted in foreign currencies, if any, are translated into U.S. dollars at the current exchange rate.
To the extent a pricing service or dealer is unable to value a security or provides a valuation that the fund’s investment manager does not believe accurately reflects the security’s fair value, the security will be valued at fair value by the fund’s investment manager, which has been designated as valuation designee pursuant to Rule 2a–5 under the 1940 Act, in accordance with policies and procedures approved by the Trustees. Certain investments, including certain restricted and illiquid securities and derivatives, are also valued at fair value following procedures approved by the Trustees. These valuations consider such factors as significant market or specific security events such as interest rate or credit quality changes, various relationships with other securities, discount rates, U.S. Treasury, U.S. swap and credit yields, index levels, convexity exposures, recovery rates, sales and other multiples and resale restrictions. These securities are classified as Level 2 or as Level 3 depending on the priority of the significant inputs.
To assess the continuing appropriateness of fair valuations, the Valuation Committee reviews and affirms the reasonableness of such valuations on a regular basis after considering all relevant information that is reasonably available. Such valuations and procedures are reviewed periodically by the Trustees. Certain securities may be valued on the basis of a price provided by a single source. The fair value of securities is generally determined as the amount that the fund could reasonably expect to realize from an orderly disposition of such securities over a reasonable period of time. By its nature, a fair value price is a good faith estimate of the value of a security in a current sale and does not reflect an actual market price, which may be different by a material amount.
Security transactions and related investment income Security transactions are recorded on the trade date (the date the order to buy or sell is executed). Gains or losses on securities sold are determined on the identified cost basis.
Interest income, net of any applicable withholding taxes, if any, is recorded on the accrual basis. Amortization and accretion of premiums and discounts on debt securities, if any, is recorded on the accrual basis.
Dividend income, net of any applicable withholding taxes, is recognized on the ex-dividend date except that certain dividends from foreign securities, if any, are recognized as soon as the fund is informed of the ex-dividend date. Non-cash dividends, if any, are recorded at the fair value of the securities received. Dividends representing a return of capital or capital gains, if any, are reflected as a reduction of cost and/or as a realized gain.
The fund may have earned certain fees in connection with its senior loan purchasing activities. These fees, if any, are treated as market discount and are amortized into income in the Statement of operations.
Securities purchased or sold on a delayed delivery basis may be settled at a future date beyond customary settlement time; interest income is accrued based on the terms of the securities. Losses may arise due to changes in the fair value of the underlying securities or if the counterparty does not perform under the contract.
Stripped securities The fund may invest in stripped securities which represent a participation in securities that may be structured in classes with rights to receive different portions of the interest and principal. Interest-only securities receive all of the interest and principal-only securities receive all of the principal. If the interest-only securities experience greater than anticipated prepayments of principal, the fund may fail to recoup fully its initial investment in these securities. Conversely, principal-only securities increase in value if prepayments are greater than anticipated and decline if prepayments are slower than anticipated. The fair value of these securities is highly sensitive to changes in interest rates.
Foreign currency translation The accounting records of the fund are maintained in U.S. dollars. The fair value of foreign securities, currency holdings, and other assets and liabilities is recorded in the books and records of the fund after translation to U.S. dollars based on the exchange rates on that day. The cost of each security is determined using historical exchange rates. Income and withholding taxes are translated at prevailing exchange rates when earned or incurred. The fund does not isolate that portion of realized or unrealized gains or losses resulting from changes in the foreign exchange rate on investments from fluctuations arising from changes in the market prices of the securities. Such gains and losses are included with the net realized and unrealized gain or loss on investments. Net realized gains and losses on foreign currency transactions represent net realized exchange gains or losses on disposition of foreign currencies, currency gains and losses realized between the trade and settlement dates on securities transactions and the difference between the amount of investment income and foreign withholding taxes recorded on the fund’s books and the U.S. dollar equivalent amounts actually received or paid. Net unrealized appreciation and depreciation of assets and liabilities in foreign currencies arise from changes in the value of assets and liabilities other than investments at the period end, resulting from changes in the exchange rate.
Options contracts The fund uses options contracts for hedging duration and convexity, for isolating prepayment risk, for gaining exposure to interest rates, for hedging against changes in values of securities it owns, owned or expects to own, for hedging prepayment risk, for generating additional income for the portfolio, for enhancing returns on securities owned, for enhancing the return on a security owned, for gaining exposure to securities and for managing downside risks.
The potential risk to the fund is that the change in value of options contracts may not correspond to the change in value of the hedged instruments. In addition, losses may arise from changes in the value of the underlying instruments if there is an illiquid secondary market for the contracts, if interest or exchange rates move unexpectedly or if the counterparty to the contract is unable to perform. Realized gains and losses on purchased options are included in realized gains and losses on investment securities. If a written call option is exercised, the premium originally received is recorded as an addition to sales proceeds. If a written put option is exercised, the premium originally received is recorded as a reduction to the cost of investments.
Exchange-traded options are valued at the last sale price. OTC traded options are valued using quotations from an independent pricing service.
Options on swaps are similar to options on securities except that the premium paid or received is to buy or grant the right to enter into a previously agreed upon interest rate or credit default contract. Forward premium swap option contracts include premiums that have extended settlement dates. The delayed settlement of the premiums is factored into the daily valuation of the option contracts. In the case of interest rate cap and floor contracts, in return for a premium, ongoing payments between two parties are based on interest rates exceeding a specified rate, in the case of a cap contract, or falling below a specified rate in the case of a floor contract.
Written option contracts outstanding at period end, if any, are listed after the fund’s portfolio.
Futures contracts The fund uses futures contracts for managing exposure to market risk, for hedging prepayment risk, for hedging interest rate risk, for gaining exposure to interest rates and for equitizing cash.
The potential risk to the fund is that the change in value of futures contracts may not correspond to the change in value of the hedged instruments. In addition, losses may arise from changes in the value of the underlying instruments, if there is an illiquid secondary market for the contracts, if interest or exchange rates move unexpectedly or if the counterparty to the contract is unable to perform. With futures, there is minimal counterparty credit risk to the fund since futures are exchange traded and the exchange’s clearinghouse, as counterparty to all exchange traded futures, guarantees the futures against default. Risks may exceed amounts recognized on the Statement of assets and liabilities. When the contract is closed, the fund records a realized gain or loss equal to the difference between the value of the contract at the time it was opened and the value at the time it was closed.
Futures contracts are valued at the quoted daily settlement prices established by the exchange on which they trade. The fund and the broker agree to exchange an amount of cash equal to the daily fluctuation in the value of the futures contract. Such receipts or payments are known as “variation margin.”
Futures contracts outstanding at period end, if any, are listed after the fund’s portfolio.
Forward currency contracts The fund buys and sells forward currency contracts, which are agreements between two parties to buy and sell currencies at a set price on a future date. These contracts are used for hedging foreign exchange risk and for gaining exposure to currencies.
| Putnam VT Global Asset Allocation Fund |
| 39 |
The U.S. dollar value of forward currency contracts is determined using current forward currency exchange rates supplied by a quotation service. The fair value of the contract will fluctuate with changes in currency exchange rates. The contract is marked to market daily and the change in fair value is recorded as an unrealized gain or loss. The fund records a realized gain or loss equal to the difference between the value of the contract at the time it was opened and the value at the time it was closed when the contract matures or by delivery of the currency. The fund could be exposed to risk if the value of the currency changes unfavorably, if the counterparties to the contracts are unable to meet the terms of their contracts or if the fund is unable to enter into a closing position. Risks may exceed amounts recognized on the Statement of assets and liabilities.
Forward currency contracts outstanding at period end, if any, are listed after the fund’s portfolio.
Interest rate swap contracts The fund entered into OTC and/or centrally cleared interest rate swap contracts, which are arrangements between two parties to exchange cash flows based on a notional principal amount, for hedging interest rate risk, for gaining exposure on interest rates and for hedging prepayment risk.
An OTC and centrally cleared interest rate swap can be purchased or sold with an upfront premium. For OTC interest rate swap contracts, an upfront payment received by the fund is recorded as a liability on the fund’s books. An upfront payment made by the fund is recorded as an asset on the fund’s books. OTC and centrally cleared interest rate swap contracts are marked to market daily based upon quotations from an independent pricing service or market makers. Any change is recorded as an unrealized gain or loss on OTC interest rate swaps. Daily fluctuations in the value of centrally cleared interest rate swaps are settled through a central clearing agent and are recorded in variation margin on the Statement of assets and liabilities and recorded as unrealized gain or loss. Payments, including upfront premiums, received or made are recorded as realized gains or losses at the reset date or the closing of the contract. Certain OTC and centrally cleared interest rate swap contracts may include extended effective dates. Payments related to these swap contracts are accrued based on the terms of the contract.
The fund could be exposed to credit or market risk due to unfavorable changes in the fluctuation of interest rates or if the counterparty defaults, in the case of OTC interest rate contracts, or the central clearing agency or a clearing member defaults, in the case of centrally cleared interest rate swap contracts, on its respective obligation to perform under the contract. The fund’s maximum risk of loss from counterparty risk or central clearing risk is the fair value of the contract. This risk may be mitigated for OTC interest rate swap contracts by having a master netting arrangement between the fund and the counterparty and for centrally cleared interest rate swap contracts through the daily exchange of variation margin. There is minimal counterparty risk with respect to centrally cleared interest rate swap contracts due to the clearinghouse guarantee fund and other resources that are available in the event of a clearing member default. Risk of loss may exceed amounts recognized on the Statement of assets and liabilities.
OTC and centrally cleared interest rate swap contracts outstanding, including their respective notional amounts at period end, if any, are listed after the fund’s portfolio.
At the close of the reporting period, the fund has deposited cash valued at $122,930 in a segregated account to cover margin requirements on open centrally cleared interest rate swap contracts.
Total return swap contracts The fund entered into OTC and/or centrally cleared total return swap contracts, which are arrangements to exchange a market-linked return for a periodic payment, both based on a notional principal amount, for hedging sector exposure, for managing exposure to specific sectors or industries, for managing exposure to specific securities, for gaining exposure to a basket of securities, for gaining exposure to specific markets or countries and for gaining exposure to specific sectors or industries.
To the extent that the total return of the security, index or other financial measure underlying the transaction exceeds or falls short of the offsetting interest rate obligation, the fund will receive a payment from or make a payment to the counterparty. OTC and/or centrally cleared total return swap contracts are marked to market daily based upon quotations from an independent pricing service or market maker. Any change is recorded as an unrealized gain or loss on OTC total return swaps. Daily fluctuations in the value of centrally cleared total return swaps are settled through a central clearing agent and are recorded in variation margin on the Statement of assets and liabilities and recorded as unrealized gain or loss. Payments received or made are recorded as realized gains or losses. Certain OTC and/or centrally cleared total return swap contracts may include extended effective dates. Payments related to these swap contracts are accrued based on the terms of the contract. The fund could be exposed to credit or market risk due to unfavorable changes in the fluctuation of interest rates or in the price of the underlying security or index, the possibility that there is no liquid market for these agreements or that the counterparty may default on its obligation to perform. The fund’s maximum risk of loss from counterparty risk or central clearing risk is the fair value of the contract. This risk may be mitigated for OTC total return swap contracts by having a master netting arrangement between the fund and the counterparty and for centrally cleared total return swap contracts through the daily exchange of variation margin. There is minimal counterparty risk with respect to centrally cleared total return swap contracts due to the clearinghouse guarantee fund and other resources that are available in the event of a clearing member default. Risk of loss may exceed amounts recognized on the Statement of assets and liabilities.
OTC and/or centrally cleared total return swap contracts outstanding, including their respective notional amounts at period end, if any, are listed after the fund’s portfolio.
Credit default contracts The fund entered into OTC and/or centrally cleared credit default contracts for hedging credit risk, for hedging market risk and for gaining exposure on individual names and/or baskets of securities.
In OTC and centrally cleared credit default contracts, the protection buyer typically makes a periodic stream of payments to a counterparty, the protection seller, in exchange for the right to receive a contingent payment upon the occurrence of a credit event on the reference obligation or all other equally ranked obligations of the reference entity. Credit events are contract specific but may include bankruptcy, failure to pay, restructuring and obligation acceleration. For OTC credit default contracts, an upfront payment received by the fund is recorded as a liability on the fund’s books. An upfront payment made by the fund is recorded as an asset on the fund’s books. Centrally cleared credit default contracts provide the same rights to the protection buyer and seller except the payments between parties, including upfront premiums, are settled through a central clearing agent through variation margin payments. Upfront and periodic payments received or paid by the fund for OTC and centrally cleared credit default contracts are recorded as realized gains or losses at the reset date or close of the contract. The OTC and centrally cleared credit default contracts are marked to market daily based upon quotations from an independent pricing service or market makers. Any change in value of OTC credit default contracts is recorded as an unrealized gain or loss. Daily fluctuations in the value of centrally cleared credit default contracts are recorded in variation margin on the Statement of assets and liabilities and recorded as unrealized gain or loss. Upon the occurrence of a credit event, the difference between the par value and fair value of the reference obligation, net of any proportional amount of the upfront payment, is recorded as a realized gain or loss.
In addition to bearing the risk that the credit event will occur, the fund could be exposed to market risk due to unfavorable changes in interest rates or in the price of the underlying security or index or the possibility that the fund may be unable to close out its position at the same time or at the same price as if it had purchased the underlying reference obligations. In certain circumstances, the fund may enter into offsetting OTC and centrally cleared credit default contracts which would mitigate its risk of loss. Risks of loss may exceed amounts recognized on the Statement of assets and liabilities. The fund’s maximum risk of loss from counterparty risk, either as the protection seller or as the protection buyer, is the fair value of the contract. This risk may be mitigated for OTC credit default contracts by having a master netting arrangement between the fund and the counterparty and for centrally cleared credit default contracts through the daily exchange of variation margin. Counterparty risk is further mitigated with respect to centrally cleared credit default swap contracts due to the clearinghouse guarantee fund and other resources that are available in the event of a clearing member default. Where the fund is a seller of protection, the maximum potential amount of future payments the fund may be required to make is equal to the notional amount.
OTC and centrally cleared credit default contracts outstanding, including their respective notional amounts at period end, if any, are listed after the fund’s portfolio.
At the close of the reporting period, the fund has deposited cash valued at $204,880 in a segregated account to cover margin requirements on open centrally cleared credit default contracts.
TBA commitments The fund may enter into TBA (to be announced) commitments to purchase securities for a fixed unit price at a future date beyond customary settlement time. Although the unit price and par amount have been established, the actual securities have not been specified. However, it is anticipated that the amount of the commitments will not significantly differ from the principal amount. The fund holds, and maintains until settlement date, cash or high-grade debt obligations in an amount sufficient to meet the purchase price, or
| 40 |
| Putnam VT Global Asset Allocation Fund |
the fund may enter into offsetting contracts for the forward sale of other securities it owns. Income on the securities will not be earned until settlement date.
The fund may also enter into TBA sale commitments to hedge its portfolio positions, to sell mortgage-backed securities it owns under delayed delivery arrangements or to take a short position in mortgage-backed securities. Proceeds of TBA sale commitments are not received until the contractual settlement date. During the time a TBA sale commitment is outstanding, either equivalent deliverable securities or an offsetting TBA purchase commitment deliverable on or before the sale commitment date are held as “cover” for the transaction, or other liquid assets in an amount equal to the notional value of the TBA sale commitment are segregated. If the TBA sale commitment is closed through the acquisition of an offsetting TBA purchase commitment, the fund realizes a gain or loss. If the fund delivers securities under the commitment, the fund realizes a gain or a loss from the sale of the securities based upon the unit price established at the date the commitment was entered into.
TBA commitments, which are accounted for as purchase and sale transactions, may be considered securities themselves, and involve a risk of loss due to changes in the value of the security prior to the settlement date as well as the risk that the counterparty to the transaction will not perform its obligations. Counterparty risk is mitigated by having a master agreement between the fund and the counterparty.
Unsettled TBA commitments are valued at their fair value according to the procedures described under “Security valuation” above. The contract is marked to market daily and the change in fair value is recorded by the fund as an unrealized gain or loss. Based on market circumstances, Franklin Advisers will determine whether to take delivery of the underlying securities or to dispose of the TBA commitments prior to settlement.
TBA purchase commitments outstanding at period end, if any, are listed within the fund’s portfolio and TBA sale commitments outstanding at period end, if any, are listed after the fund’s portfolio.
Master agreements The fund is a party to ISDA (International Swaps and Derivatives Association, Inc.) Master Agreements that govern OTC derivative and foreign exchange contracts and Master Securities Forward Transaction Agreements that govern transactions involving mortgage-backed and other asset-backed securities that may result in delayed delivery (Master Agreements) with certain counterparties entered into from time to time. The Master Agreements may contain provisions regarding, among other things, the parties’ general obligations, representations, agreements, collateral requirements, events of default and early termination. With respect to certain counterparties, in accordance with the terms of the Master Agreements, collateral pledged to the fund is held in a segregated account by the fund’s custodian and, with respect to those amounts which can be sold or repledged, is presented in the fund’s portfolio.
Collateral pledged by the fund is segregated by the fund’s custodian and identified in the fund’s portfolio. Collateral can be in the form of cash or debt securities issued by the U.S. Government or related agencies or other securities as agreed to by the fund and the applicable counterparty. Collateral requirements are determined based on the fund’s net position with each counterparty.
With respect to ISDA Master Agreements, termination events applicable to the fund may occur upon a decline in the fund’s net assets below a specified threshold over a certain period of time. Termination events applicable to counterparties may occur upon a decline in the counterparty’s long-term or short-term credit ratings below a specified level. In each case, upon occurrence, the other party may elect to terminate early and cause settlement of all derivative and foreign exchange contracts outstanding, including the payment of any losses and costs resulting from such early termination, as reasonably determined by the terminating party. Any decision by one or more of the fund’s counterparties to elect early termination could impact the fund’s future derivative activity.
At the close of the reporting period, the fund had a net liability position of $53,714 on open derivative contracts subject to the Master Agreements. There was no collateral pledged by the fund at period end for these agreements.
Securities lending The fund may lend securities, through its agent, to qualified borrowers in order to earn additional income. The loans are collateralized by cash in an amount at least equal to the fair value of the securities loaned. The fair value of securities loaned is determined daily and any additional required collateral is allocated to the fund on the next business day. The remaining maturities of the securities lending transactions are considered overnight and continuous. The risk of borrower default will be borne by the fund’s agent; the fund will bear the risk of loss with respect to the investment of the cash collateral. Income from securities lending, if any, is net of expenses and is included in investment income on the Statement of operations. Cash collateral is invested in Putnam Cash Collateral Pool, LLC, a limited liability company that is managed by an affiliate of Franklin Advisers. Investments in Putnam Cash Collateral Pool, LLC are valued at its closing net asset value each business day. There are no management fees charged to Putnam Cash Collateral Pool, LLC. At the close of the reporting period, the fund had no securities out on loan.
Interfund lending The fund, along with other Putnam funds, may participate in an interfund lending program pursuant to an exemptive order issued by the SEC. This program allows the fund to borrow from or lend to other Putnam funds that permit such transactions. Interfund lending transactions are subject to each fund’s investment policies and borrowing and lending limits. Interest earned or paid on the interfund lending transaction will be based on the average of certain current market rates. During the reporting period, the fund did not utilize the program.
Lines of credit Prior to January 31, 2025, the fund participated, along with other Putnam funds, in a $320 million syndicated unsecured committed line of credit, provided by State Street ($160 million) and JPMorgan ($160 million), and a $235.5 million unsecured uncommitted line of credit, provided by State Street. Borrowings could be made for temporary or emergency purposes, including the funding of shareholder redemption requests and trade settlements. Interest is charged to the fund based on the fund’s borrowing at a rate equal to 1.25% plus the higher of (1) the Federal Funds rate and (2) the Overnight Bank Funding Rate for the committed line of credit and 1.30% plus the higher of (1) the Federal Funds rate and (2) the Overnight Bank Funding Rate for the uncommitted line of credit. A closing fee equal to 0.04% of the committed line of credit and 0.04% of the uncommitted line of credit was paid by the participating funds and a $75,000 fee was paid by the participating funds to State Street as agent of the syndicated committed line of credit. In addition, a commitment fee of 0.21% per annum on any unutilized portion of the committed line of credit is allocated to the participating funds based on their relative net assets and paid quarterly. During the reporting period, the fund had no borrowings against these arrangements.
Effective January 31, 2025, the fund, together with other U.S. registered and foreign investment funds managed by an affiliate of Franklin Templeton are borrowers in a joint syndicated senior unsecured credit facility totaling $2.995 billion, which matures on January 30, 2026.
Federal taxes It is the policy of the fund to distribute all of its taxable income within the prescribed time period and otherwise comply with the provisions of the Internal Revenue Code of 1986, as amended (the Code), applicable to regulated investment companies.
The fund is subject to the provisions of Accounting Standards Codification 740 Income Taxes (ASC 740). ASC 740 sets forth a minimum threshold for financial statement recognition of the benefit of a tax position taken or expected to be taken in a tax return. The fund did not have a liability to record for any unrecognized tax benefits in the accompanying financial statements. No provision has been made for federal taxes on income, capital gains or unrealized appreciation on securities held nor for excise tax on income and capital gains. Each of the fund’s federal tax returns for the prior three fiscal years remains subject to examination by the Internal Revenue Service.
The fund may also be subject to taxes imposed by governments of countries in which it invests. Such taxes are generally based on either income or gains earned or repatriated. The fund accrues and applies such taxes to net investment income, net realized gains and net unrealized gains as income and/or capital gains are earned. In some cases, the fund may be entitled to reclaim all or a portion of such taxes, and such reclaim amounts, if any, are reflected as an asset and other income on the fund’s books. In many cases, however, the fund may not receive such amounts for an extended period of time, depending on the country of investment.
Distributions to shareholders Distributions to shareholders from net investment income, if any, are recorded by the fund on the ex-dividend date. Distributions from capital gains, if any, are recorded on the ex-dividend date and paid at least annually. The amount and character of income and gains to be distributed are determined in accordance with income tax regulations, which may differ from generally accepted accounting principles. These differences include temporary and/or permanent differences from losses on wash sale transactions, from foreign currency gains and losses, from unrealized gains and losses on certain futures contracts, from realized gains and losses on passive foreign investment companies, from unrealized gains and losses on passive foreign investment companies, from straddle loss deferrals, from income on swap contracts and from interest-only securities. Reclassifications are made to the fund’s capital accounts to reflect income and gains available for distribution (or available capital loss carryovers) under income tax regulations. At the close of the reporting period, the fund reclassified $723,467 to increase undistributed net investment income and $723,467 to decrease accumulated net realized gain.
| Putnam VT Global Asset Allocation Fund |
| 41 |
Tax cost of investments includes adjustments to net unrealized appreciation (depreciation) which may not necessarily be final tax cost basis adjustments, but closely approximate the tax basis unrealized gains and losses that may be realized and distributed to shareholders. The tax basis components of distributable earnings and the federal tax cost as of the close of the reporting period were as follows:
| Unrealized appreciation | $27,438,106 |
| Unrealized depreciation | (3,678,877) |
| Net unrealized appreciation | 23,759,229 |
| Undistributed ordinary income | 2,382,961 |
| Undistributed long-term gains | 10,068,531 |
| Undistributed short-term gains | 1,866,250 |
| Cost for federal income tax purposes | $82,994,675 |
Expenses of the Trust Expenses directly charged or attributable to any fund will be paid from the assets of that fund. Generally, expenses of the Trust will be allocated among and charged to the assets of each fund on a basis that the Trustees deem fair and equitable, which may be based on the relative assets of each fund or the nature of the services performed and relative applicability to each fund.
Beneficial interest At the close of the reporting period, insurance companies or their separate accounts were record owners of all but a de minimis number of the shares of the fund. Approximately 39.3% of the fund is owned by accounts of one insurance company.
Note 2: Management fee, administrative services and other transactions
Effective July 15, 2024, Putnam Management transferred its management contract with the fund to Franklin Advisers. As a result of the transfer, Franklin Advisers replaced Putnam Management as the investment adviser of the fund. In connection with the transfer, the fund’s portfolio managers, along with supporting research analysts and certain other investment staff of Putnam Management, also became employees of Franklin Advisers.
In addition, Putnam Management transferred to Franklin Advisers the sub-management contract between Putnam Management and PIL in respect of the fund, and the sub-advisory contract among Putnam Management, PIL and PAC in respect of the fund.
The fund pays Franklin Advisers a management fee (based on the fund’s average net assets and computed and paid monthly) at annual rates that may vary based on the average of the aggregate net assets of all open-end mutual funds sponsored by Putnam Management (including open-end funds managed by affiliates of Putnam Management that have been deemed to be sponsored by Putnam Management for this purpose) (excluding net assets of such funds that are invested in, or that are invested in by, other such funds to the extent necessary to avoid “double counting” of those assets). Such annual rates may vary as follows:
| 0.750% | of the first $5 billion, |
| 0.700% | of the next $5 billion, |
| 0.650% | of the next $10 billion, |
| 0.600% | of the next $10 billion, |
| 0.550% | of the next $50 billion, |
| 0.530% | of the next $50 billion, |
| 0.520% | of the next $100 billion and |
| 0.515% | of any excess thereafter. |
For the reporting period, the management fee represented an effective rate (excluding the impact from any expense waivers in effect) of 0.579% of the fund’s average net assets.
Franklin Advisers has contractually agreed, through April 30, 2026, to waive fees and/or reimburse the fund’s expenses to the extent necessary to limit the cumulative expenses of the fund, exclusive of brokerage, interest, taxes, investment-related expenses, extraordinary expenses, acquired fund fees and expenses and payments under the fund’s investor servicing contract, investment management contract and distribution plan, on a fiscal year-to-date basis to an annual rate of 0.20% of the fund’s average net assets over such fiscal year-to-date period. During the reporting period, the fund’s expenses were reduced by $42,818 as a result of this limit.
Effective July 15, 2024, Franklin Advisers retained Putnam Management as sub-advisor for the fund pursuant to a new sub-advisory agreement. Pursuant to the agreement, Putnam Management makes investment decisions for such fund assets as may be designated from time to time for its management by Franklin Advisers (the “portfolio management services”) and provides certain other advisory and related services (together, the “other services”). With respect to the portfolio management services, Franklin Advisers pays a monthly fee to Putnam Management for its services at the annual rate of 0.25% of the average net asset value of the portion of the fund’s assets managed by Putnam Management. With respect to the other services, Franklin Advisers pays a monthly fee to Putnam Management based on the costs of Putnam Management in providing these services to the fund, which may include a mark-up not to exceed 15% over such costs.
Effective November 1, 2024, FTIML is authorized by the Trustees to manage a separate portion of the assets of the fund as determined by Franklin Advisers from time to time. FTIML did not manage any portion of the assets of the fund during the reporting period. If Franklin Advisers were to engage the services of FTIML, Franklin Advisers (and not the fund) would pay a monthly sub-management fee to FTIML for its services at an annual rate of 0.25% of the average net assets of the equity and asset allocation portion of the fund managed by FTIML and 0.20% of the average net assets of the fixed-income portion of the fund managed by FTIML.
Prior to November 1, 2024, PIL was authorized by the Trustees to manage a separate portion of the assets of the fund as determined by Franklin Advisers from time to time. PIL did not manage any portion of the assets of the fund during the reporting period. If Franklin Advisers had engaged the services of PIL, Franklin Advisers (and not the fund) would have paid a quarterly sub-management fee to PIL for its services at an annual rate of 0.25% of the average net assets of the equity and asset allocation portion of the fund managed by FTIML and 0.20% of the average net assets of the fixed-income portion of the fund managed by PIL. Effective November 1, 2024, PIL merged into FTIML, and PIL investment professionals became employees of FTIML.
PAC is authorized by the Trustees to manage a separate portion of the assets of the fund, as designated from time to time Franklin Advisers or PIL (prior to November 1, 2024). PAC did not manage any portion of the assets of the fund during the reporting period. If Franklin Advisers were to engage the services of PAC, Franklin Advisers (and not the fund) would pay a monthly sub-advisory fee to PAC for its services at the annual rate of 0.25% of the average net assets of the portion of the fund’s assets for which PAC is engaged as sub-advisor.
Effective June 1, 2024, Franklin Templeton Services provides certain administrative services to the fund. The fee for those services is paid by the fund’s investment manager based on the fund’s average daily net assets and is not an additional expense of the fund.
The fund reimburses Franklin Advisers an allocated amount for the compensation and related expenses of certain officers of the fund and their staff who provide administrative services to the fund. The aggregate amount of all such reimbursements is determined annually by the Trustees.
Custodial functions for the fund’s assets are provided by State Street. Custodian fees are based on the fund’s asset level, the number of its security holdings and transaction volumes.
PSERV, an affiliate of Franklin Advisers, provides investor servicing agent functions to the fund. PSERV was paid a monthly fee for investor servicing at an annual rate of 0.07% of the fund’s average daily net assets. During the reporting period, the expenses for each class of shares related to investor servicing fees were as follows:
| Class IA | $48,935 |
| Class IB | 23,820 |
| Total | $72,755 |
The fund has entered into expense offset arrangements with PSERV and State Street whereby PSERV’s and State Street’s fees are reduced by credits allowed on cash balances. For the reporting period, the fund’s expenses were reduced by $968 under the expense offset arrangements.
Each Independent Trustee of the fund receives an annual Trustee fee, of which $75, as a quarterly retainer, has been allocated to the fund, and an additional fee for each Trustees meeting attended. Trustees also are reimbursed for expenses they incur relating to their services as Trustees.
The fund has adopted a Trustee Fee Deferral Plan (the Deferral Plan) which allows the Trustees to defer the receipt of all or a portion of Trustees fees payable from July 1, 1995 through December 31, 2023. The deferred fees remain invested in certain Putnam funds until distribution in accordance with the Deferral Plan.
The fund has adopted an unfunded noncontributory defined benefit pension plan (the Pension Plan) covering all Trustees of the fund who have served as a Trustee for at least five years and were first elected prior to 2004. Benefits under the Pension Plan are equal to 50% of the Trustee’s average annual attendance and retainer fees for the three years ended December 31, 2005. The retirement benefit is payable during a Trustee’s lifetime, beginning the year following retirement, for the number of years of service through December 31, 2006. Pension
| 42 |
| Putnam VT Global Asset Allocation Fund |
expense for the fund is included in Trustee compensation and expenses in the Statement of operations. Accrued pension liability is included in Payable for Trustee compensation and expenses in the Statement of assets and liabilities. The Trustees have terminated the Pension Plan with respect to any Trustee first elected after 2003.
The fund has adopted a distribution plan (the Plan) with respect to its class IB shares pursuant to Rule 12b–1 under the 1940 Act. The purpose of the Plan is to compensate Franklin Distributors, or prior to August 2, 2024, Putnam Retail Management, for services provided and expenses incurred in distributing shares of the fund. The Plan provides for payment by the fund to Franklin Distributors and to Putnam Retail Management at an annual rate of up to 0.35% of the average net assets attributable to the fund’s class IB shares. The Trustees have approved payment by the fund at an annual rate of 0.25% of the average net assets attributable to the fund’s class IB shares. The expenses related to distribution fees during the reporting period are included in Distribution fees in the Statement of operations and were paid out as follows:
| Franklin Distributors | $36,839 |
| Putnam Retail Management | 48,238 |
| Total | $85,077 |
Note 3: Purchases and sales of securities
During the reporting period, the cost of purchases and the proceeds from sales, excluding short-term investments, were as follows:
| | Cost of purchases | Proceeds from sales |
| Investments in securities, including TBA commitments (Long-term) | $219,778,289 | $237,053,278 |
| U.S. government securities (Long-term) | — | — |
| Total | $219,778,289 | $237,053,278 |
The fund may purchase or sell investments from or to other Putnam funds in the ordinary course of business, which can reduce the fund’s transaction costs, at prices determined in accordance with SEC requirements and policies approved by the Trustees. During the reporting period, purchases or sales of long-term securities from or to other Putnam funds, if any, did not represent more than 5% of the fund’s total cost of purchases and/or total proceeds from sales.
Note 4: Capital shares
At the close of the reporting period, there were an unlimited number of shares of beneficial interest authorized. Subscriptions and redemptions are presented at the omnibus level. Transactions in capital shares were as follows:
| | Class IA shares | Class IB shares |
| | Year ended 12/31/24 | Year ended 12/31/23 | Year ended 12/31/24 | Year ended 12/31/23 |
| | Shares | Amount | Shares | Amount | Shares | Amount | Shares | Amount |
| Shares sold | 28,082 | $524,743 | 42,329 | $683,912 | 330,182 | $6,433,962 | 127,924 | $2,109,385 |
| Shares issued in connection with reinvestment of distributions | 92,342 | 1,703,708 | 79,264 | 1,231,765 | 37,441 | 704,262 | 30,348 | 480,710 |
| | 120,424 | 2,228,451 | 121,593 | 1,915,677 | 367,623 | 7,138,224 | 158,272 | 2,590,095 |
| Shares repurchased | (593,757) | (11,282,310) | (579,637) | (9,323,982) | (458,996) | (8,952,572) | (379,468) | (6,209,690) |
| Net decrease | (473,333) | $(9,053,859) | (458,044) | $(7,408,305) | (91,373) | $(1,814,348) | (221,196) | $(3,619,595) |
Note 5: Affiliated transactions
Transactions during the reporting period with any company which is under common ownership or control were as follows:
| Name of affiliate | Fair value as of 12/31/23 | Purchase cost | Sale proceeds | Investment income | Shares outstanding and fair value as of 12/31/24 |
| Short-term investments | | | | | |
| Putnam Cash Collateral Pool, LLC * | $— | $846,248 | $846,248 | $2,497 | $— |
| Putnam Short Term Investment Fund Class P ‡ | 7,887,915 | 26,118,897 | 21,238,018 | 696,731 | 12,768,794 |
| Total Short-term investments | $7,887,915 | $26,965,145 | $22,084,266 | $699,228 | $12,768,794 |
| * No management fees are charged to Putnam Cash Collateral Pool, LLC (Note 1). Investment income shown is included in securities lending income on the Statement of operations. There were no realized or unrealized gains or losses during the period. |
| ‡ Management fees charged to Putnam Short Term Investment Fund have been waived by Putnam Management and Franklin Advisers, as applicable. There were no realized or unrealized gains or losses during the period. |
Note 6: Market, credit and other risks
In the normal course of business, the fund trades financial instruments and enters into financial transactions where risk of potential loss exists due to changes in the market (market risk) or failure of the contracting party to the transaction to perform (credit risk). The fund may be exposed to additional credit risk that an institution or other entity with which the fund has unsettled or open transactions will default. Investments in foreign securities involve certain risks, including those related to economic instability, unfavorable political developments, and currency fluctuations. The fund may invest a significant portion of its assets in securitized debt instruments, including mortgage-backed and asset-backed investments. The yields and values of these investments are sensitive to changes in interest rates, the rate of principal payments on the underlying assets and the market’s perception of the issuers. The market for these investments may be volatile and limited, which may make them difficult to buy or sell.
Note 7: Senior loan commitments
Senior loans are purchased or sold on a when-issued or delayed delivery basis and may be settled a month or more after the trade date, which from time to time can delay the actual investment of available cash balances; interest income is accrued based on the terms of the securities. Senior loans can be acquired through an agent, by assignment from another holder of the loan, or as a participation interest in another holder’s portion of the loan. When the fund invests in a loan or participation, the fund is subject to the risk that an intermediate participant between the fund and the borrower will fail to meet its obligations to the fund, in addition to the risk that the borrower under the loan may default on its obligations.
| Putnam VT Global Asset Allocation Fund |
| 43 |
Note 8: Summary of derivative activity
The volume of activity for the reporting period for any derivative type that was held during the period is listed below and was based on an average of the holdings at the end of each fiscal quarter:
| Purchased equity option contracts (contract amount) | $700 |
| Written equity option contracts (contract amount) | $500 |
| Futures contracts (number of contracts) | 200 |
| Forward currency contracts (contract amount) | $2,500,000 |
| Centrally cleared interest rate swap contracts (notional) | $10,800,000 |
| OTC total return swap contracts (notional) | $14,300,000 |
| OTC credit default contracts (notional) | $190,000 |
| Centrally cleared credit default contracts (notional) | $6,000,000 |
The following is a summary of realized and change in unrealized gains or losses of derivative instruments in the Statement of operations for the reporting period (Note 1):
| Fair value of derivative instruments as of the close of the reporting period |
| | Asset derivatives | Liability derivatives |
| Derivatives not accounted for as hedging instruments under ASC 815 | Statement of assets and liabilities location | Fair value | Statement of assets and liabilities location | Fair value |
| Credit contracts | Receivables, Net assets — Unrealized appreciation | $233,550* | Payables | $8,607 |
| Foreign exchange contracts | Receivables | 11,678 | Payables | 57,545 |
| Equity contracts | Receivables, Net assets — Unrealized appreciation | 624,223* | Payables, Net assets — Unrealized depreciation | 448,338* |
| Interest rate contracts | Receivables, Net assets — Unrealized appreciation | 35,994* | Payables, Net assets — Unrealized depreciation | 358,122* |
| Total | | $905,445 | | $872,612 |
| * Includes cumulative appreciation/depreciation of futures contracts and/or centrally cleared swaps as reported in the fund’s portfolio. Only current day’s variation margin is reported within the Statement of assets and liabilities. |
The following is a summary of realized and change in unrealized gains or losses of derivative instruments in the Statement of operations for the reporting period (Note 1):
| Amount of realized gain or (loss) on derivatives recognized in net gain or (loss) on investments |
| Derivatives not accounted for as hedging instruments under ASC 815 | Options | Futures | Forward currency contracts | Swaps | Total |
| Credit contracts | $— | $— | $— | $226,680 | $226,680 |
| Foreign exchange contracts | — | — | (11,008) | — | $(11,008) |
| Equity contracts | (219,340) | (1,850,783) | — | 480,610 | $(1,589,513) |
| Interest rate contracts | — | 25,560 | — | (18,330) | $7,230 |
| Total | $(219,340) | $(1,825,223) | $(11,008) | $688,960 | $(1,366,611) |
| Change in unrealized appreciation or (depreciation) on derivatives recognized in net gain or (loss) on investments |
| Derivatives not accounted for as hedging instruments under ASC 815 | Options | Futures | Forward currency contracts | Swaps | Total |
| Credit contracts | $— | $— | $— | $(80,194) | $(80,194) |
| Foreign exchange contracts | — | — | (32,215) | — | $(32,215) |
| Equity contracts | 94,426 | 382,785 | — | 17,775 | $494,986 |
| Interest rate contracts | — | (736,120) | — | (36,491) | $(772,611) |
| Total | $94,426 | $(353,335) | $(32,215) | $(98,910) | $(390,034) |
| 44 |
| Putnam VT Global Asset Allocation Fund |
Note 9: Offsetting of financial and derivative assets and liabilities
The following table summarizes any derivatives, repurchase agreements and reverse repurchase agreements, at the end of the reporting period, that are subject to an enforceable master netting agreement or similar agreement. For securities lending transactions or borrowing transactions associated with securities sold short, if any, see Note 1. For financial reporting purposes, the fund does not offset financial assets and financial liabilities that are subject to the master netting agreements in the Statement of assets and liabilities.
| | | | | | | | | | |
| | Bank of America N.A. | Barclays Bank PLC | Barclays Capital, Inc. (clearing broker) | BofA Securities, Inc. | Citibank, N.A. | Citigroup Global Markets, Inc. | Credit Suisse Securities (USA), LLC (clearing broker) | Goldman Sachs International | HSBC Bank USA, National Association |
| Assets: | | | | | | | | | |
| Centrally cleared interest rate swap contracts § | $— | $— | $1,098 | $— | $— | $— | $— | $— | $— |
| OTC Total return swap contracts *# | — | 164,854 | — | — | — | — | — | 97,318 | — |
| OTC Credit default contracts — protection sold *# | — | — | — | — | — | — | — | — | — |
| OTC Credit default contracts — protection purchased *# | — | — | — | — | — | 11,984 | — | — | — |
| Centrally cleared credit default contracts § | — | — | 2,653 | — | — | — | — | — | — |
| Futures contracts § | — | — | — | 40,641 | — | — | — | — | — |
| Forward currency contracts # | — | 1,138 | — | — | — | — | — | — | 164 |
| Total Assets | $— | $165,992 | $3,751 | $40,641 | $— | $11,984 | $— | $97,318 | $164 |
| Liabilities: | | | | | | | | | |
| Centrally cleared interest rate swap contracts § | — | — | 5,046 | — | — | — | — | — | — |
| OTC Total return swap contracts *# | — | 150,128 | — | — | — | — | — | 102,689 | — |
| OTC Credit default contracts — protection sold *# | 2,588 | — | — | — | — | 4,048 | — | 73 | — |
| OTC Credit default contracts — protection purchased *# | — | — | — | — | — | — | — | — | — |
| Centrally cleared credit default contracts § | — | — | — | — | — | — | — | — | — |
| Futures contracts § | — | — | — | 1,150 | — | — | — | — | — |
| Forward currency contracts # | 2,325 | 4,194 | — | — | 8,478 | — | — | 7,767 | 691 |
| Total Liabilities | $4,913 | $154,322 | $5,046 | $1,150 | $8,478 | $4,048 | $— | $110,529 | $691 |
| Total Financial and Derivative Net Assets | $(4,913) | $11,670 | $(1,295) | $39,491 | $(8,478) | $7,936 | $— | $(13,211) | $(527) |
| Total collateral received (pledged) †## | $— | $— | $— | $— | $— | $— | $— | $— | $— |
| Net amount | $(4,913) | $11,670 | $(1,295) | $39,491 | $(8,478) | $7,936 | $— | $(13,211) | $(527) |
| Controlled collateral received (including TBA commitments) ** | $— | $— | $— | $— | $— | $— | $— | $— | $— |
| Uncontrolled collateral received | $— | $— | $— | $— | $— | $— | $— | $— | $— |
| Collateral (pledged) (including TBA commitments) ** | $— | $— | $— | $— | $— | $— | $— | $— | $— |
| Putnam VT Global Asset Allocation Fund |
| 45 |
Note 9: Offsetting of financial and derivative assets and liabilities cont.
| | | | | | | | | | |
| | JPMorgan Chase Bank N.A. | JPMorgan Securities LLC | Merrill Lynch International | Morgan Stanley & Co. International PLC | NatWest Markets PLC | State Street Bank and Trust Co. | UBS AG | WestPac Banking Corp. | Total |
| Assets: | | | | | | | | | |
| Centrally cleared interest rate swap contracts § | $— | $— | $— | $— | $— | $— | $— | $— | $1,098 |
| OTC Total return swap contracts *# | — | — | — | — | — | — | — | — | 262,172 |
| OTC Credit default contracts — protection sold *# | — | — | — | — | — | — | — | — | — |
| OTC Credit default contracts — protection purchased *# | — | 1,325 | 830 | 5,092 | — | — | — | — | 19,231 |
| Centrally cleared credit default contracts § | — | — | — | — | — | — | — | — | 2,653 |
| Futures contracts § | — | — | — | — | — | — | — | — | 40,641 |
| Forward currency contracts # | 7,021 | — | — | 334 | 588 | 2,021 | 412 | — | 11,678 |
| Total Assets | $7,021 | $1,325 | $830 | $5,426 | $588 | $2,021 | $412 | $— | $337,473 |
| Liabilities: | | | | | | | | | |
| Centrally cleared interest rate swap contracts § | — | — | — | — | — | — | — | — | 5,046 |
| OTC Total return swap contracts *# | — | — | — | — | — | — | — | — | 252,817 |
| OTC Credit default contracts — protection sold *# | — | 759 | — | 1,139 | — | — | — | — | 8,607 |
| OTC Credit default contracts — protection purchased *# | — | — | — | — | — | — | — | — | — |
| Centrally cleared credit default contracts § | — | — | — | — | — | — | — | — | — |
| Futures contracts § | — | 19,304 | — | — | — | — | — | — | 20,454 |
| Forward currency contracts # | 197 | — | — | 6,922 | 7,304 | 11,052 | 7,267 | 1,348 | 57,545 |
| Total Liabilities | $197 | $20,063 | $— | $8,061 | $7,304 | $11,052 | $7,267 | $1,348 | $344,469 |
| Total Financial and Derivative Net Assets | $6,824 | $(18,738) | $830 | $(2,635) | $(6,716) | $(9,031) | $(6,855) | $(1,348) | $(6,996) |
| Total collateral received (pledged) †## | $— | $— | $— | $— | $— | $— | $— | $— | |
| Net amount | $6,824 | $(18,738) | $830 | $(2,635) | $(6,716) | $(9,031) | $(6,855) | $(1,348) | |
| Controlled collateral received (including TBA commitments) ** | $— | $— | $— | $— | $— | $— | $— | $— | $— |
| Uncontrolled collateral received | $— | $— | $— | $— | $— | $— | $— | $— | $— |
| Collateral (pledged) (including TBA commitments) ** | $— | $— | $— | $— | $— | $— | $— | $— | $— |
| * | Excludes premiums, if any. Included in unrealized appreciation and depreciation on OTC swap contracts on the Statement of assets and liabilities. |
| ** | Included with Investments in securities on the Statement of assets and liabilities. |
| † | Additional collateral may be required from certain brokers based on individual agreements. |
| # | Covered by master netting agreement (Note 1). |
| ## | Any over-collateralization of total financial and derivative net assets is not shown. Collateral may include amounts related to unsettled agreements. |
| § | Includes current day’s variation margin only as reported on the Statement of assets and liabilities, which is not collateralized. Cumulative appreciation/(depreciation) for futures contracts and centrally cleared swap contracts is represented in the tables listed after the fund’s portfolio. Collateral pledged for initial margin on futures contracts and centrally cleared swap contracts, which is not included in the table above, amounted to $713,491 and $327,810, respectively. |
Note 10: Operating segments
The fund has adopted the Financial Accounting Standards Board (FASB) Accounting Standards Update (ASU) 2023-07, Segment Reporting (Topic 280) – Improvements to Reportable Segment Disclosures. The update is limited to disclosure requirements and does not impact the fund’s financial position or results of operations.
The fund operates as a single operating segment, which is an investment portfolio. The fund’s investment manager serves as the Chief Operating Decision Maker (CODM), evaluating fund-wide results and performance under a unified investment strategy. The CODM uses these measures to assess fund performance and allocate resources effectively. Internal reporting provided to the CODM aligns with the accounting policies and measurement principles used in the financial statements.
For information regarding segment assets, segment profit or loss, and significant expenses, refer to the Statement of assets and liabilities and the Statement of operations, along with the related notes to the financial statements. The fund’s portfolio provides details of the fund’s investments that generate returns such as interest, dividends, and realized and unrealized gains or losses. Performance metrics, including portfolio turnover and expense ratios, are disclosed in the Financial highlights.
| 46 |
| Putnam VT Global Asset Allocation Fund |
Federal tax information (Unaudited)
Pursuant to §852 of the Internal Revenue Code, as amended, the fund hereby designates $11,075,384 as a capital gain dividend with respect to the taxable year ended December 31, 2024, or, if subsequently determined to be different, the net capital gain of such year.
The fund designated $651,110 of income eligible as qualifying for the dividends received deduction for corporations.
| Putnam VT Global Asset Allocation Fund |
| 47 |
Changes in and disagreements with accountants
Not applicable
Results of any shareholder votes
Not applicable
Remuneration paid to directors, officers, and others
Remuneration paid to directors, officers, and others is included in the Notes to financial statements above.
| 48 |
| Putnam VT Global Asset Allocation Fund |
Board approval of management and subadvisory agreements (Unaudited)
At its meeting on September 27, 2024, the Board of Trustees of your fund, including all of the Trustees who are not “interested persons” (as this term is defined in the Investment Company Act of 1940, as amended (the “1940 Act”)) of the Putnam mutual funds, closed-end funds and exchange-traded funds (collectively, the “funds”) (the “Independent Trustees”), approved a new Sub-Advisory Agreement with respect to your fund (the “New FTIML Sub-Advisory Agreement”) between Franklin Advisers, Inc. (“Franklin Advisers”) and its affiliate, Franklin Templeton Investment Management Limited (“FTIML”), and an amended and restated Sub-Advisory Contract with respect to your fund (the “Amended PAC Sub-Advisory Contract”) between Franklin Advisers and its affiliate, The Putnam Advisory Company, LLC (“PAC”). Franklin Advisers, FTIML, and PAC are each direct or indirect, wholly-owned subsidiaries of Franklin Resources, Inc. (“Franklin Templeton”). (Because FTIML and PAC are affiliates of Franklin Advisers and Franklin Advisers remains fully responsible for all services provided by FTIML and PAC, the Trustees did not attempt to evaluate FTIML and PAC as separate entities.)
The Board of Trustees, with the assistance of its Contract Committee (which consists solely of Independent Trustees) and its independent legal counsel (as that term is defined in Rule 0-1(a)(6)(i) under the 1940 Act), requested and evaluated all information it deemed reasonably necessary under the circumstances in connection with its review of the New FTIML Sub-Advisory Agreement and the Amended PAC Sub-Advisory Contract. At its September 2024 meeting, the Contract Committee met with representatives of Franklin Templeton, and separately in executive session, to consider the information provided. At the September Trustees’ meetings, the Contract Committee also met in executive session with the other Independent Trustees to discuss its observations and recommendations. Throughout this process, the Contract Committee was assisted by the members of the Board of Trustees’ independent staff and by independent legal counsel for the Independent Trustees.
Considerations in connection with the Trustees’ approval of the New FTIML Sub-Advisory Agreement
The Trustees considered the proposed New FTIML Sub-Advisory Agreement in connection with the planned November 1, 2024 merger (the “Merger”) of Putnam Investments Limited (“PIL”), an affiliate of Franklin Advisers and a sub-adviser to your fund prior to the Merger, with and into FTIML. The Trustees considered that, in connection with the Merger, PIL investment professionals would become employees of FTIML, and, upon consummation of the Merger, PIL would cease to exist as a separate legal entity.
The Trustees noted that Franklin Templeton viewed the Merger as a further step in the integration of the legacy Putnam and Franklin Templeton organizations, offering potential operational efficiencies and enhanced investment resources for the funds. The Trustees also considered, among other factors, that:
• The Merger and the New FTIML Sub-Advisory Agreement would not result in any reduction or material change in the nature or the level of the sub-advisory services provided to the funds;
• The PIL portfolio managers who are responsible for the day-to-day management of the applicable funds would be the same immediately prior to, and immediately after, the Merger, and these investment personnel would have access to the same research and other resources to support their respective investment advisory functions and operate under the same conditions both immediately before and after the Merger;
• Despite a change in the sub-advisory fee structure for certain funds, the New FTIML Sub-Advisory Agreement would not result in an increase in the advisory fee rates payable by each fund, as Franklin Advisers would be responsible for overseeing the investment advisory services provided to the applicable funds by FTIML under the New FTIML Sub-Advisory Agreement and would compensate FTIML for such services out of the fees it receives under each fund’s Management Contract with Franklin Advisers; and
• The terms of the New FTIML Sub-Advisory Agreement were substantially similar to those under the sub-management contract between Franklin Advisers and PIL with respect to the fund (the “PIL Sub-Management Contract”). 1
The Trustees also considered that, prior to the Merger, counsel to Franklin Advisers and FTIML had provided a legal opinion that the Merger and the appointment of FTIML as sub-adviser to the funds would not result in an “assignment” under the 1940 Act of the PIL Sub-Management Contract and that the New FTIML Sub-Advisory Agreement did not require shareholder approval.
The Trustees also took into account that they had most recently approved the fund’s PIL Sub-Management Contract in June 2024. Because, other than the parties to the contract, the revised sub-advisory fee structure for certain funds, and certain other non-substantive changes to contractual terms, the New FTIML Sub-Advisory Agreement was substantially similar to the PIL Sub-Management Contract, the Trustees relied to a considerable extent on their previous approval of the PIL Sub-Management Contract.
Considerations in connection with the Trustees’ approval of the Amended PAC Sub-Advisory Contract
With respect to the proposed Amended PAC Sub-Advisory Contract, the Trustees considered that the contract was being amended and restated to remove PIL as a party to the contract, revise the sub-advisory fee structure for certain funds, and make certain other non-substantive changes to contractual terms. The Trustees noted that removing PIL from the sub-advisory contract with respect to the fund among Franklin Advisers, PIL, and PAC (the “PAC Sub-Advisory Contract”) would have no impact on the management of the funds, since Franklin Advisers, and not PIL, had been (under the PAC Sub-Advisory Contract), and would continue to be (under the Amended PAC Sub-Advisory Contract), responsible for overseeing any services provided by PAC to the applicable funds. The Trustees also considered that the Amended PAC Sub-Advisory Contract would not result in an increase in the advisory fee rates payable by each fund, as Franklin Advisers would compensate PAC for such services out of the fees it receives under each fund’s Management Contract with Franklin Advisers.
1 The New PIL Sub-Management Contract was operative until the effective date of the Merger, November 1, 2024, and was replaced by the New FTIML Sub-Advisory Agreement effective as of that date.
| Putnam VT Global Asset Allocation Fund |
| 49 |
Board of Trustees’ Conclusions
After considering the factors described above, as well as other factors, the Board of Trustees, including all of the Independent Trustees, concluded that the fees payable under the New FTIML Sub-Advisory Agreement and the Amended PAC Sub-Advisory Contract represented reasonable compensation in light of the nature and quality of the services that would be provided to the funds, and determined to approve the New FTIML Sub-Advisory Agreement and the Amended PAC Sub-Advisory Contract for your fund. These conclusions were based on a comprehensive consideration of all information provided to the Trustees and were not the result of any single factor.
| 50 |
| Putnam VT Global Asset Allocation Fund |
| |
 | | |
| © 2024 Franklin Templeton. All rights reserved. | 38923-AFSOI 2/25 |
| |
| Item 8. Changes in and Disagreements with Accountants for Open-End Management Investment Companies. |
| |
| Included in Item 7 above. |
| |
| Item 9. Proxy Disclosure for Open-End Management Investment Companies. |
| |
| Included in Item 7 above. |
| |
| Item 10. Remuneration Paid to Directors, Officers, and Others of Open-End Management Investment Companies. |
| |
| Included in Item 7 above. |
| |
| Item 11. Statement Regarding Basis for Approval of Investment Advisory Contract. |
| |
| Included in Item 7 above. |
| |
| Item 12. Disclosure of Proxy Voting Policies and Procedures For Closed-End Management Investment Companies: |
| |
| Item 13. Portfolio Managers of Closed-End Investment Companies |
| |
| Item 14. Purchases of Equity Securities by Closed-End Management Investment Companies and Affiliated Purchasers: |
| |
| Item 15. Submission of Matters to a Vote of Security Holders: |
| |
| Item 16. Controls and Procedures: |
| |
| (a) The registrant’s principal executive officer and principal financial officer have concluded, based on their evaluation of the effectiveness of the design and operation of the registrant’s disclosure controls and procedures as of a date within 90 days of the filing date of this report, that the design and operation of such procedures are generally effective to provide reasonable assurance that information required to be disclosed by the registrant in this report is recorded, processed, summarized and reported within the time periods specified in the Commission’s rules and forms. |
| |
| (b) Changes in internal control over financial reporting: Not applicable |
| |
| Item 17. Disclosures of Securities Lending Activities for Closed-End Investment Companies: |
| |
| Item 18. Recovery of Erroneously Awarded Compensation. |
| |
| (a)(1) The Code of Ethics of The Putnam Funds and Franklin Templeton are filed herewith. |
| |
| (a)(2) Any policy required by the listing standards adopted pursuant to Rule 10D-1 under the Exchange Act (17 CFR 240.10D-1) by the registered national securities exchange or registered national securities association upon which the registrant’s securities are listed. |
| |
| Pursuant to the requirements of the Securities Exchange Act of 1934 and the Investment Company Act of 1940, the registrant has duly caused this report to be signed on its behalf by the undersigned, thereunto duly authorized. |
| |
| By (Signature and Title): |
| |
| Jeffrey White
Principal Accounting Officer |
| |
| Pursuant to the requirements of the Securities Exchange Act of 1934 and the Investment Company Act of 1940, this report has been signed below by the following persons on behalf of the registrant and in the capacities and on the dates indicated. |
| |
| By (Signature and Title): |
| |
| Jonathan S. Horwitz
Principal Executive Officer |
| |
| By (Signature and Title): |
| |
| Jeffrey White
Principal Financial Officer |