UNITED STATES
SECURITIES AND EXCHANGE COMMISSION
Washington, D.C. 20549
FORM N-CSR
CERTIFIED SHAREHOLDER REPORT OF REGISTERED MANAGEMENT INVESTMENT
COMPANIES
Investment Company Act file number 811-5349
Goldman Sachs Trust
(Exact name of registrant as specified in charter)
4900 Sears Tower, Chicago, Illinois 60606-6303
(Address of principal executive offices) (Zip code)
| Howard B. Surloff, Esq. | Copies to: | |
| Goldman, Sachs & Co. | Jeffrey A. Dalke, Esq. | |
| One New York Plaza | Drinker Biddle & Reath LLP | |
| New York, New York 10004 | One Logan Square | |
| 18th and Cherry Streets | ||
| Philadelphia, PA 19103 | ||
| (Name and address of agents for service) | ||
Registrant’s telephone number, including area code: (312) 655-4400
Date of fiscal year end: October 31
Date of reporting period: April 30, 2005
| ITEM 1. | REPORTS TO STOCKHOLDERS. | |
| The Semi-Annual Report to Stockholders is filed herewith. |
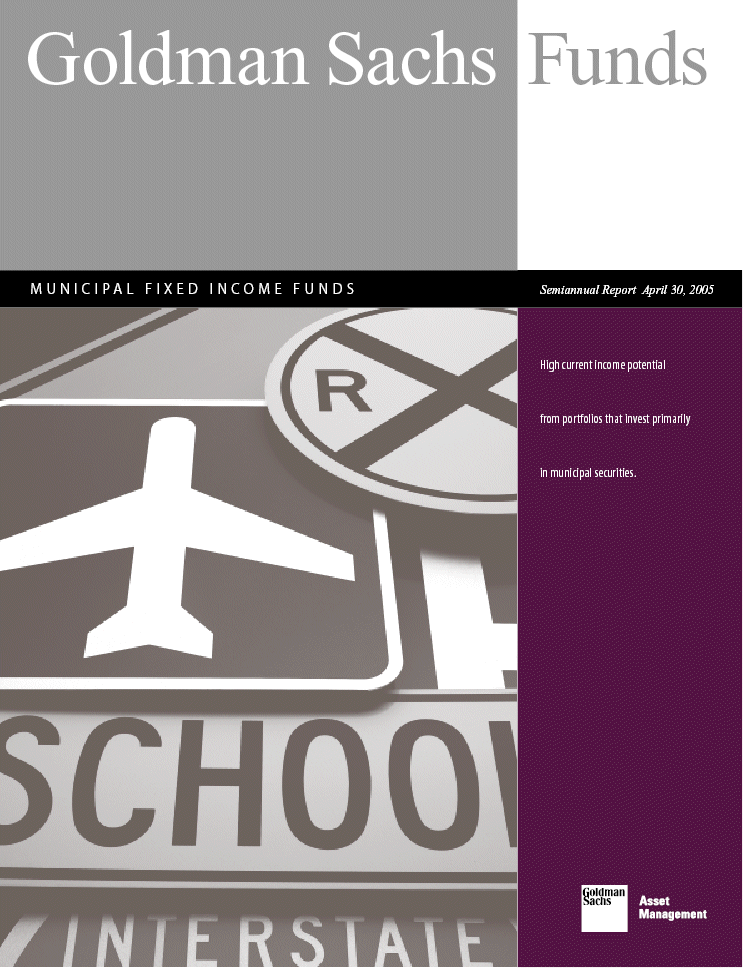
| Goldman SachsFundsM U N I C I P A L F I X E D I N C O M E F U N D SSemiannual Report April 30, 2005High current income potential from portfolios that invest primarily in municipal securities. |
| Goldman Sachs Municipal Fixed Income FundsGOLDMAN SACHS SHORT DURATION TAX-FREE FUND GOLDMAN SACHS MUNICIPAL INCOME FUND GOLDMAN SACHS HIGH YIELD MUNICIPAL FUNDNOT FDIC-INSURED May Lose Value No Bank Guarantee |

| G O L D M A N S A C H S M U N I C I PA L F I X E D I N C O M E F U N D SWhat Distinguishes Goldman Sachs’ Fixed Income Investment Process?At Goldman Sachs Asset Management (GSAM), the goal of our fixed income investment process is to provide consistent,strong performance by actively managing our portfolios within a research-intensive, risk-managed framework.A key element of our fixed income investment philosophy is to evaluate the broadest global opportunity set to capture relative value across sectors and instruments. Our globally integrated investment process involves managing dynamically along the risk/return spectrum, as we continue to develop value-added strategies through:1R I G O R O U S S E C U R I T Y S E L E C T I O NAssess relative value among states, sectors and sub-sectorsLeverage the vast resources of Goldman Sachs in selecting securities for each portfolio2P R E C I S E P O R T F O L I O C O N S T R U C T I O NTeam approach to decision makingManage risk by avoiding significant sector and interest rate betsCareful management of yield curve strategies — while closely managing portfolio durationR E S U LT Fixed Income portfolios that:Include domestic and global investment options, tax-free income opportunities, and access to areas of specialization such as high yieldCapitalize on GSAM’s industry renowned credit research capabilitiesUse a risk-managed framework to seek total return, recognizing the importance of investors’ capital accumulation goals as well as their need for income1 |
| P O R T F O L I O R E S U LT SShort Duration Tax-Free FundDear Shareholder, This report provides an overview on the performance of the Goldman Sachs Short Duration Tax-FreeFund during the six-month reporting period that ended April 30, 2005. Performance Review Over the six-month period that ended April 30, 2005, the Fund’s A, B, C,Institutional and Service Shares generated cumulative total returns, without sales charges, of - -0.03%, -0.33%, -0.40%, 0.07% and -0.08%, respectively. These returns compare to the -0.16% cumulative total return of the Fund’s benchmark, the Lehman Brothers 1-3 Year Municipal Bond Index, over the same time period.*During the reporting period, the Fund’s defensive duration and maturity structure, as well as its slight overweight in lower rated bonds contributed to performance. On average the Fund’s duration was 0.20 years shorter than its benchmark, which was beneficial as yields rose in the wake of interest rate tightening by the Federal Reserve Board (the “Fed”). The maturity structure of the portfolio has greater dispersion than the benchmark. This helped performance as yields on longer maturity bonds rose less than securities with short maturities. Lower rated sectors such as health care, electric utilities, and tobacco outperformed those with higher ratings during the six months ended April 30, 2005, helping performance as the Fund had increased exposure to these bonds. There were a few detractors to performance as well. California bonds performed extremely well during the period and the Fund was somewhat underweight this state. In addition, more aggressive shortening of the duration of the portfolio could have further reduced exposure to rising interest rates. Municipal Market Review The overall municipal market posted positive returns over the past six months. The Fed began tightening monetary policy in June of 2004. Since then, the Fed has raised overnight rates eight times, moving the fed funds rate from 1.00% to 3.00%. The front end of the muni yield curve followed suit, with yields on short maturity munis rising by as much as 80 basis points during the reporting period. In contrast, municipal bonds further out on the yield curve actually rallied, with yields on longer bonds declining by as much as 23 basis points. The net result was a flattening of the municipal yield curve as measured by the spread between two and 30-year munis (from 267 basis points at the beginning of the reporting period to 164 basis points by the end of the period). Supply for the municipal market remained strong. Issuers have sold $128 billion in newsupply during the first four months of 2005, an impressive 9% over the same period in 2004. An increase in refundings has been the primary driver of the increased supply, as issuers moved to refinance higher cost debt in the event that interest rates moved higher. We believe this trend could reverse as interest rates move higher. Improving credit fundamentals and strong demand for yield caused lower rated securities to outperform higher quality bonds over the past six months.*Unlike the Fund’s total return, the Index’s performance does not reflect any deduction for fees or expenses.2 |
| P O R T F O L I O R E S U LT SInvestment ObjectiveThe Fund seeks a high level of current income, consistent with relatively low volatility of principal, that isexempt from regular federal income tax. Investment StrategiesIn seeking to meet the Fund’s objective, we invest at least 80% of the Fund’s net assets in municipal securities, for which the interest is exempt from regular federal income tax. In addition, the Fund may invest in derivative securities, including futures and swaps, primarily for duration management purposes or to take advantage of temporary opportunities inthe marketplace. Derivatives are not used for speculative purposes.Portfolio Composition The duration of the Fund ranged between 1.90 to 2.40 years over the past six months, ending the period at 2.08 years. The overall credit quality of the Fund remained very strong at AA/Aa2. From an overall risk perspective, the Fund continued to be well diversified. The Fund holds more than 225 different securities, with exposure to over 40 different states/territories. As of April 30, 2005, the Fund’s top five state allocations were in California, New York, Pennsylvania, Texas and Virginia. At the end of the reporting period, its largest subsector weights were in State and Local, Hospital, and Pre-Refunded bonds. Although allowed by prospectus, the Fund continues to avoid bonds that would be subject to the Alternative Minimum Tax (AMT). Portfolio Highlights We continued to favor a “modified barbell” maturity distribution relative to the benchmark. With a traditional barbell strategy, we would focus the portfolio on the short and long end of the yield curve. In contrast, with a modified barbell, we also look for select opportunities in the 5-10 year segment of the yield curve. Although the yield curve flattened from a historically steep level, we believe this broader term structure continues to offer additional yield over a more laddered portfolio. In addition to yield enhancement opportunities, we believe a broader maturity distribution is advantageous from a total return perspective, as we feel it expands the Fund’s ability to take advantage of market opportunities.We thank you for your investment and look forward to your continued confidence.Goldman Sachs U.S. Fixed Income-Municipal Investment Management TeamMay 9, 20053 |
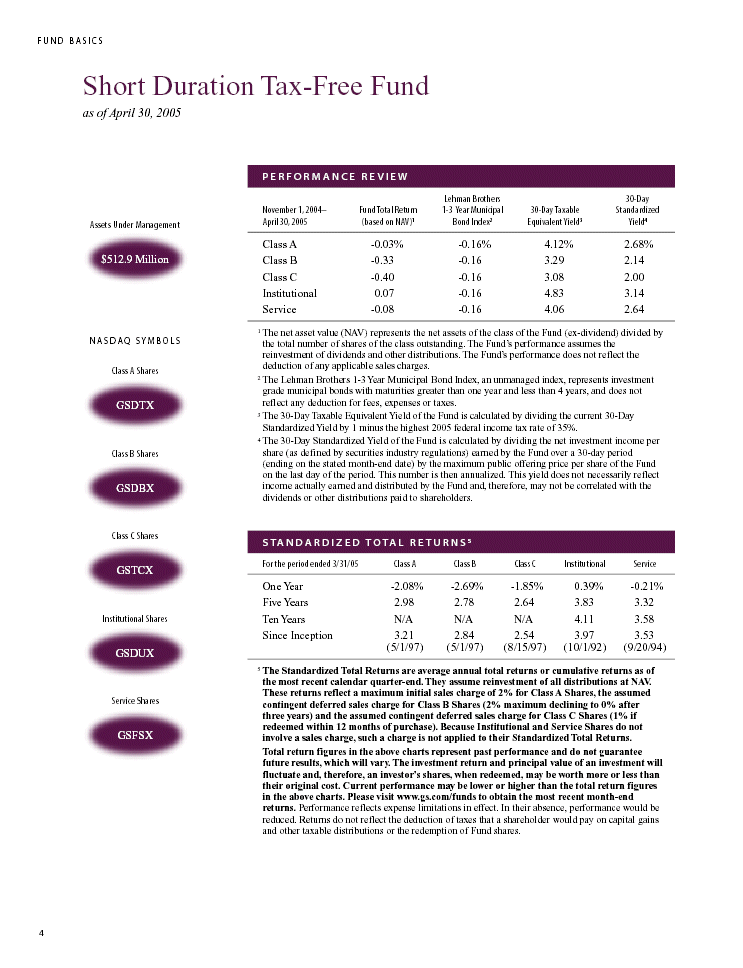
| F U N D B A S I C SShort Duration Tax-Free Fundas of April 30, 2005P E R F O R M A N C E R E V I EW Lehman Brothers30-DaNovemb1, 2004-Fund Total Return 1-3 Year Municipal30-Day Taxable Standardized Assets Under ManagementApril 30, 2005(based on NAV)1Bond Index2Equivalent Yield3 Yield4Class A-0.03%-0.16%4.12%2.68% $512.9 MillionClass B-0.33-0.163.292.14 Class C -0.40-0.163.082.00 Institutional 0.07-0.164.833.14 Service-0.08-0.164.062.641 The net asset value (NAV) represents the net assets of the class of the Fund (exdividend)divided by N A S D A Q S Y M B O L S the total number of shares of the class outstanding. The Fund’s performance assumes the reinvestment of dividends and other distributions. The Fund’s performance does not reflect the deduction of any applicable sales charges.Class A Share2The Lehman Brothers 1-3 Year Municipal Bond Index, an unmanaged index, represents investment grade municipal bonds with maturities greater than one year and less than 4 years, and does not GSDTXreflect any deduction for fees, expenses or taxes.3The 30-Day Taxable Equivalent Yield of the Fund is calculated by dividing the current 30-Day Standardized Yield by 1 minus the highest 2005 federal income tax rate of 35%.4 The 30-Day Standardized Yield of the Fund is calculated by dividing the net investment income per Class B Sharesshare (as defined by securities industry regulations) earned by the Fund over a 30-day period (ending on the stated month-end date) by the maximum public offering price per share of the Fund on the last day of the period. This number is then annualized. This yield does not necessarily reflect GSDBXincome actually earned and distributed by the Fund and, therefore, may not be correlated with the dividends or other distributions paid to shareholders.Class C SharesS TA N DA R D I Z E D T O TA L R E T U R N S 5For the period ended 3/31/05Class AClass BClass CInstitutionalServiceGSTCXOne Year-2.08%-2.69%-1.85%0.39%-0.21% Five Years2.982.782.643.833.32 Institutional SharesTen YearsN/AN/AN/A4.113.58 Since Inception3.212.842.543.973.53 (5/1/97)(5/1/97) (8/15/97) (10/1/92) (9/20/94) GSDUX5 The Standardized Total Returns are average annual total returns or cumulative returns as of the most recent calendar quarter-end. They assume reinvestment of all distributions at NAV. These returns reflect a maximum initial sales charge of 2% for Class A Shares, the assumed Service Sharescontingent deferred sales charge for Class B Shares (2% maximum declining to 0% after three years) and the assumed contingent deferred sales charge for Class C Shares (1% if redeemed within 12 months of purchase). Because Institutional and Service Shares do not GSFSXinvolve a sales charge, such a charge is not applied to their Standardized Total Returns.Total return figures in the above charts represent past performance and do not guarantee future results, which will vary. The investment return and principal value of an investment will fluctuate and, therefore, an investor’s shares, when redeemed, may be worth more or less than their original cost. Current performance may be lower or higher than the total return figures in the above charts. Please visit www.gs.com/funds to obtain the most recent month-end returns. Performance reflects expense limitations in effect. In their absence, performance would be reduced. Returns do not reflect the deduction of taxes that a shareholder would pay on capital gains and other taxable distributions or the redemption of Fund shares.4 |
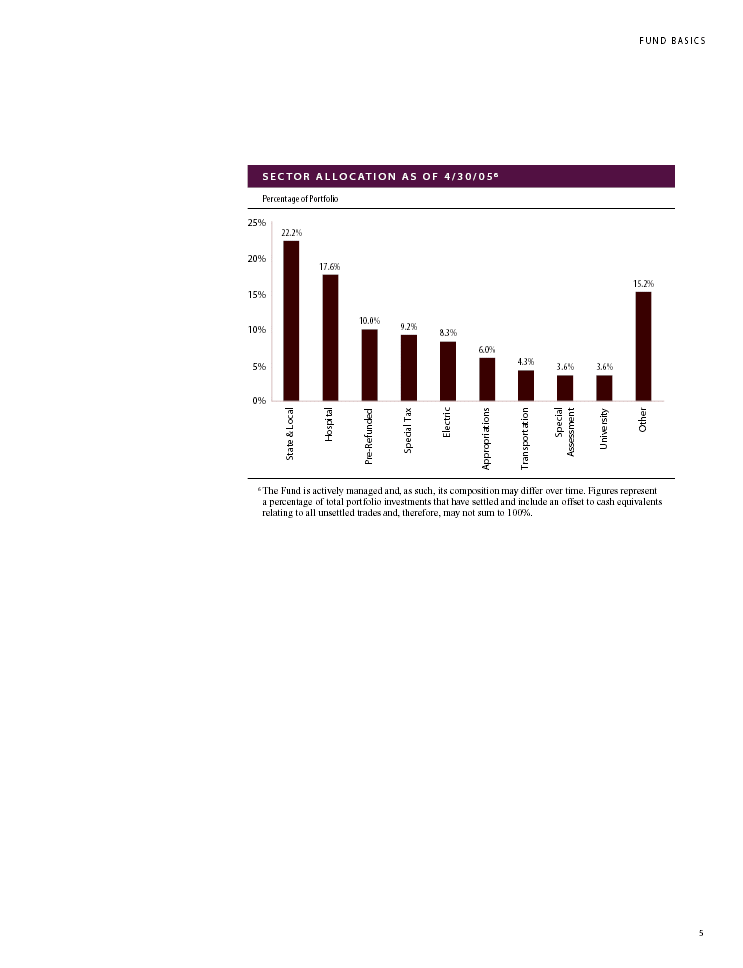
| F U N D B A S I C SS E C T O R A L L O C AT I O N A S O F 4 / 3 0 / 0 5 6 Percentage of Portfolio6The Fund is actively managed and, as such, its composition may differ over time. Figures represent a percentage of total portfolio investments that have settled and include an offset to cash equivalents relating to all unsettled trades and, therefore, may not sum to 100%.5 |
| P O R T F O L I O R E S U LT SMunicipal Income FundDear Shareholder, This report provides an overview on the performance of the Goldman Sachs Municipal Income Fund during the six-monthreporting period that ended April 30, 2005.Performance Review Over the six-month period that ended April 30, 2005, the Fund’s Class A, B, C, Institutional and Service Shares generated cumulative total returns, without sales charges, of 2.57%, 2.19%, 2.19%, 2.84% and 2.57%, respectively. These returns compare to the 1.93% cumulative total return of the Fund’s benchmark, the Lehman Brothers Aggregate Municipal Bond Index, over the same time period.*The Fund had several trades in place that worked well over the past six months. For example, an overweight in “A” and “BBB” rated securities helped performance, as improving credit fundamentals allowed credit spreads to compress over the reporting period. In particular, an overweight to the tobacco-backed sector benefited the Fund as a series of favorable court decisions enabled the sector to outperform the overall municipal market. A tactical overweight to the 30-year portion of the yield curve also contributed positively to the Fund as longer-dated securities rallied significantly during the reporting period. Conversely, the Fund’s exposure to shorter maturities, 1-3 year bonds, detracted from performance as a series of Fed tightenings pressured the front end of the curve.Municipal Market Review The overall municipal market posted positive returns over the past six months. The Fed began tightening monetary policy in June of 2004. Since then, the Fed has raised overnight rates eight times, moving the fed funds rate from 1.00% to 3.00%. The front end of the muni yield curve followed suit, with yields on short maturity munis rising by as much as 80 basis points during the reporting period. In contrast, municipal bonds further out on the yield curve actually rallied, with yields on longer bonds declining by as much as 23 basis points. The net result was a flattening of the municipal yield curve as measured by the spread between two and 30-year munis (from 267 basis points at the beginning of the reporting period to 164 basis points) by the end of the period.Supply for the municipal market remained strong. Issuers have sold $128 billion in new supply during the first four months of 2005, an impressive 9% over the same period in 2004. An increase in refundings has been the primary driver of the increased supply, as issuers moved to refinance higher cost debt in the event that interest rates moved higher. We believe this trend could reverse as interest rates move higher. Improving credit fundamentals and strong demand for yield caused lower-rated securities to outperform higher quality bonds over the past six months.*Unlike the Fund’s total return, the Index’s performance does not reflect any deduction for fees or expenses.6 |
| P O R T F O L I O R E S U LT SInvestment ObjectiveThe Fund seeks a high level of current income that is exempt from regular federal income tax, consistent with preservation of capital.Investment StrategiesIn seeking to meet the Fund’s objective, we invest at least 80% of the Fund’s net assets in municipal securities, for which the interest is exempt from regular federal income tax. In addition, the Fund may invest in derivative securities, including futures and swaps, primarily for duration management purposes or to take advantage of temporary opportunities in the marketplace. Derivatives are not used for speculative purposes.Portfolio Composition The Fund’s duration during the period was generally between 6.75 and 7.75 years and its average credit quality remained strong at AA/Aa2. The Fund has maintained an overweight in A and BBB rated credits relative to the benchmark. We have focused on managing the risk in the portfolio by maintaining strong diversification. As of the end of the reporting period, the portfolio had exposure to more than 220 individual positions and over 40 states/territories. The Fund’s top five exposures were to California, Illinois, Texas, New York, and Washington. At the end of the reporting period, its largest subsector weights were in Hospital, State and Local, and Pre-Refunded bonds.Portfolio Highlights The Fund’s net assets grew by approximately $97 million over the past six months. We took advantage of the inflows to increase exposure to the 30-year portion of the curve. Property & Casualty companies were strong buyers in the 20-25 year portion of the curve early in the reporting period. This sharp demand caused the spread between 20-year and 30-year munis to reach historically wide levels. The Fund was able to take advantage of this technical imbalance by focusing new purchases in the long end of the market. The Fund benefited from this overweight position, particularly over the second half of the reporting period as the long end of the curve outperformed the overall municipal market.We thank you for your investment and look forward to your continued confidence.Goldman Sachs U.S. Fixed Income-Municipal Investment Management Team May 9, 20057 |
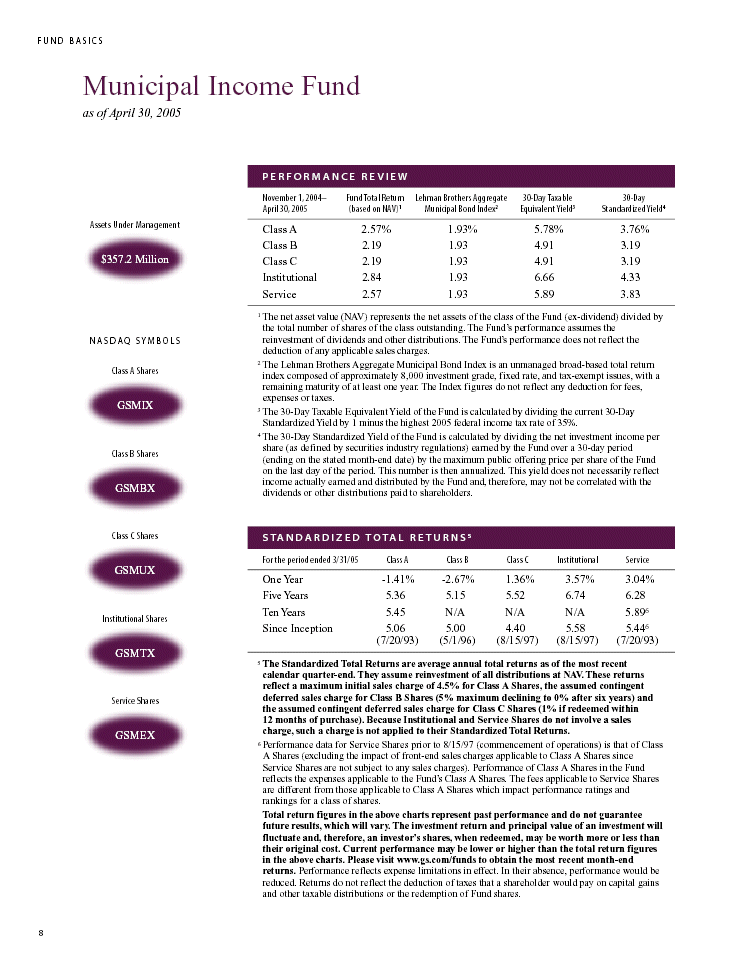
| F U N D B A S I C SMunicipal Income Fundas of April 30, 2005P E R F O R M A N C E R E V I E W November 1, 2004- Fund Total Return Lehman Brothers Aggregate 30-Day Taxable30-Day April 30, 2005(based on NAV)1Municipal Bond Index2 Equivalent Yield3Standardized Yield4Assets Under ManagementClass A2.57%1.93%5.78%3.76% Class B2.191.934.913.19 $357.2 MillionClass C 2.191.934.913.19 Institutional 2.841.936.664.33 Service2.571.935.893.831The net asset value (NAV) represents the net assets of the class of the Fund (ex-dividend) divided by the total number of shares of the class outstanding. The Fund’s performance assumes the N A S D A Q S Y M B O L S reinvestment of dividends and other distributions. The Fund’s performance does not reflect the deduction of any applicable sales charges.2The Lehman Brothers Aggregate Municipal Bond Index is an unmanaged broad-based totalreturn Class A Shares index composed of approximately 8,000 investment grade, fixed rate, and tax-exempt issues, with a remaining maturity of at least one year. The Index figures do not reflect any deduction for fees, expenses or taxes.GSMIX3The 30-Day Taxable Equivalent Yield of the Fund is calculated by dividing the current 30-Day Standardized Yield by 1 minus the highest 2005 federal income tax rate of 35%.4The 30-Day Standardized Yield of the Fund is calculated by dividing the net investment income per share (as defined by securities industry regulations) earned by the Fund over a 30-day periodClass B Shares(ending on the stated month-end date) by the maximum public offering price per share of the Fund on the last day of the period. This number is then annualized. This yield does not necessarily reflect income actually earned and distributed by the Fund and, therefore, may not be correlated with theGSMBX dividends or other distributions paid to shareholders.Class C SharesS TA N D A R D I Z E D T O TA L R E T U R N S 5For the period ended 3/31/05Class AClass BClass CInstitutionalServiceGSMUXOne Year-1.41%-2.67%1.36%3.57%3.04% Five Years5.365.155.526.746.28 Ten Years5.45N/AN/AN/A5.896Institutional SharesSince Inception5.065.004.405.585.446 (7/20/93) (5/1/96) (8/15/97) (8/15/97) (7/20/93)GSMTX 5 The Standardized Total Returns are average annual total returns as of the most recent calendar quarter-end. They assume reinvestment of all distributions at NAV. These returns reflect a maximum initial sales charge of 4.5% for Class A Shares, the assumed contingent deferred sales charge for Class B Shares (5% maximum declining to 0% after six years) and Service Shares the assumed contingent deferred sales charge for Class C Shares (1% if redeemed within 12 months of purchase). Because Institutional and Service Shares do not involve a sales GSMEXcharge, such a charge is not applied to their Standardized Total Returns.6Performance data for Service Shares prior to 8/15/97 (commencement of operations) isthat of Class A Shares (excluding the impact of front-end sales charges applicable to Class A Shares since Service Shares are not subject to any sales charges). Performance of Class A Shares in the Fund reflects the expenses applicable to the Fund’s Class A Shares. The fees applicable to Service Shares are different from those applicable to Class A Shares which impact performance ratings and rankings for a class of shares.Total return figures in the above charts represent past performance and do not guarantee future results, which will vary. The investment return and principal value of an investment will fluctuate and, therefore, an investor’s shares, when redeemed, may be worth more or less than their original cost. Current performance may be lower or higher than the total return figures in the above charts. Please visit www.gs.com/funds to obtain the most recent month-end returns. Performance reflects expense limitations in effect. In their absence, performance would be reduced. Returns do not reflect the deduction of taxes that a shareholder would pay on capital gains and other taxable distributions or the redemption of Fund shares.8 |
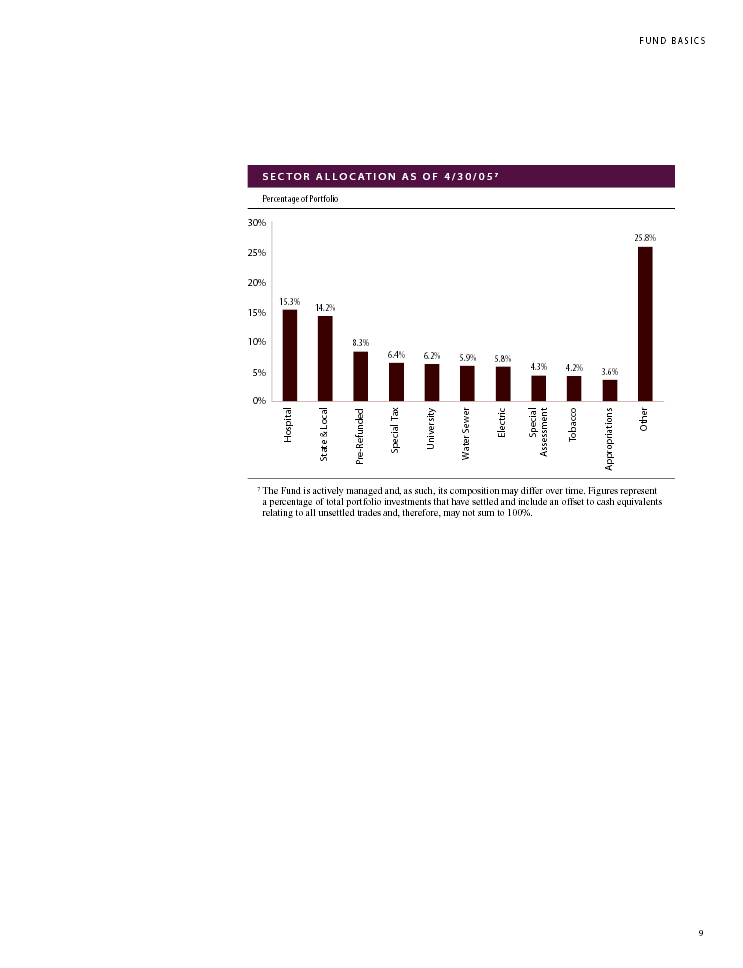
| F U N D B A S I C SS E C T O R A L L O C AT I O N A S O F 4 / 3 0 / 0 5 7Percentage ofPortfolio7 The Fund is actively managed and, as such, its composition may differ over time. Figures represent a percentage of total portfolioinvestments that have settled and include an offset to cash equivalents relating to all unsettled trades and, therefore, may not sum to 100%.9 |
| P O R T F O L I O R E S U LT SHigh Yield Municipal FundDear Shareholder, This report provides an overview on the performance of the Goldman Sachs High Yield Municipal Fund during the six-month reporting period that ended April 30, 2005. Performance Review Over the six-month period that ended April 30, 2005, the Fund’s Class A, B, C and Institutional Shares generated cumulative total returns, without sales charges, of 4.81%, 4.42%, 4.42% and 4.92%, respectively. These returns compare to the 7.13% and 1.93% cumulative total returns of the Fund’s benchmarks, the Lehman Brothers High Yield Municipal Bond Index and the Lehman Brothers Aggregate Municipal Bond Index, respectively, over the same time period.* Individual security selection positively contributed to results over the reporting period. The Fund maintained an overweight to the Tobacco Settlement Revenue sector and strategically added to these positions over the six-month period. This sector outperformed the Lehman Brothers Aggregate Municipal Bond Index by over 600 basis points. The Fund underperformed the Lehman Brothers High Yield Municipal Index. This was due to the Fund’s short duration and underweight to the riskiest securities versus the index. For example, the Fund maintained an underweight to “unsecured” airline credits, some of which did very well over the period. Municipal Market Review The overall municipal market posted positive returns over the past six months. The Fed began tightening monetary policy in June of 2004. Since then, the Fed has raised overnight rates eight times, moving the fed funds rate from 1.00% to 3.00%. The front end of the muni yield curve followed suit, with yields on short maturity munis rising by as much as 80 basis points during the reporting period. In contrast, municipal bonds further out on the yield curve actually rallied, with yields on longer bonds declining by as much as 23 basis points. The net result was a flattening of the municipal yield curve as measured by the spread between two and 30-year munis (from 267 basis points at the beginning of the reporting period to 164 basis points by the end of the period). The below investment grade portion of the municipal market significantly outperformed the investment grade sector over the review period. This was driven by both technical and fundamental factors. The technical side was fueled by very strong demand from high yield mutual fund investors. Supply of high yield municipals continues to be strong, but has been overwhelmed by demand. The fundamental side has continued to improve as well. There have been several high profile ratings upgrades to both large and small issuers over the last several months in the healthcare, utilities, and general obligation sectors. *Unlike the Fund’s total return, the Indices’ performance does not reflect any deduction for fees or expenses.10 |
| P O R T F O L I O R E S U LT SInvestment Objective The Fund seeks a high level of current income that is exempt from regular federal income tax and may also consider the potential for capital appreciation.Investment StrategiesIn seeking to meet the Fund’s objective, we invest at least 80% of the Fund’s net assets in municipal securities, for which the interest is exempt from regular federal income tax. In addition, the Fund may invest in derivative securities, including futures and swaps, primarily for duration management purposes or to take advantage of temporary opportunities in the marketplace.Derivatives are not used for speculative purposes.Portfolio Composition During the reporting period, the Fund maintained a BBB- average credit quality and its duration was between 6.7 and 8.2 years. The Fund continued to focus on achieving excess return by having good sector and individual security selection. The largest sectors in the Fund remain unchanged, with the Special Assessment, Tobacco Settlement Revenue, Electric Utility, Airlines, and Primary Care Hospital bonds constituting the largest portion of portfolio. At the end of the reporting period, the Fund had more than 740 individual securities with exposure to over 40 states/territories. The top five state allocations were Florida, California, Texas, Pennsylvania, and New Jersey. Portfolio Highlights Given the current market environment of tightening spreads between high yield municipals and investment grade municipals, the Fund is even more focused on maintaining its value discipline and avoiding pitfalls commonly associated with a tight spread environment. The Fund continues to avoid the riskiest sectors that have historically exhibited the highest default rates. These include multifamily housing, assisted living, and other types of industrial revenue bonds (aquariums, amusement parks, etc.). Through many different market cycles, we believe our approach towards risk-management provides shareholders with the appropriate value in the high yield municipal asset class.We thank you for your investment and look forward to your continued confidence.Goldman Sachs U.S. Fixed Income-Municipal Investment Management TeamMay 9, 200511 |
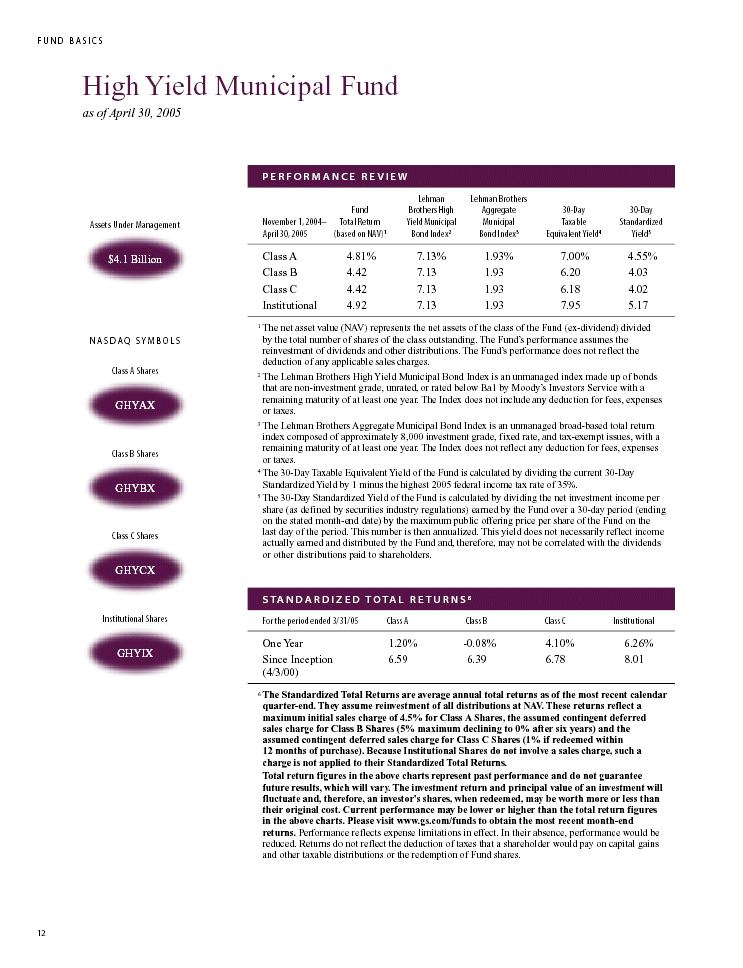
| F U N D B A S I C SHigh Yield Municipal Fundas of April 30, 2005P E R F O R M A N C E R E V I E W LehmanLehman BrothersFund Brothers High Aggregate30-Day 30-Day Assets Under ManagementNovember 1, 2004- Total Return Yield Municipal MunicipalTaxableStandardized April 30, 2005(based on NAV)1Bond Index2Bond Index3Equivalent Yield4Yield5$4.1 BillionClass A4.81%7.13%1.93%7.00%4.55% Class B4.427.131.936.204.03 Class C 4.427.131.936.184.02 Institutional 4.927.131.937.955.171 The net asset value (NAV) represents the net assets of the class of the Fund (ex-dividend) divided N A S D A Q S Y M B O L S by the total number of shares of the class outstanding. The Fund’s performance assumes the reinvestment of dividends and other distributions. The Fund’s performance does not reflect the deduction of any applicable sales charges.Class A Shares2The Lehman Brothers High Yield Municipal Bond Index is an unmanaged index made up of bonds that are non-investment grade, unrated, or rated below Ba1 by Moody’s Investors Service with a remaining maturity of at least one year. The Index does not include any deduction for fees, expensesGHYAX or taxes.3 The Lehman Brothers Aggregate Municipal Bond Index is an unmanaged broad-based total return index composed of approximately 8,000 investment grade, fixed rate, and tax-exempt issues, with a remaining maturity of at least one year. The Index does not reflect any deduction for fees, expensesClass B Shares or taxes.4 The 30-Day Taxable Equivalent Yield of the Fund is calculated by dividing the current 30-Day GHYBXStandardized Yield by 1 minus the highest 2005 federal income tax rate of 35%.5The 30-Day Standardized Yield of the Fund is calculated by dividing the net investment income per share (as defined by securities industry regulations) earned by the Fund over a 30-day period (ending on the stated month-end date) by the maximum public offering price per share of the Fund on the last day of the period. This number is then annualized. This yield does not necessarily reflect incomeClass C Shares actually earned and distributed by the Fund and, therefore, may not be correlated with the dividends or other distributions paid to shareholders.GHYCXS TA N D A R D I Z E D T O TA L R E T U R N S 6Institutional SharesFor the period ended 3/31/05Class AClass BClass CInstitutionalOne Year1.20%-0.08%4.10% 6.26% GHYIXSince Inception6.56.396.788.01 (4/3/00)6 The Standardized Total Returns are average annual total returns as of the most recent calendar quarter-end. They assume reinvestment of all distributions at NAV. These returns reflect a maximum initial sales charge of 4.5% for Class A Shares, the assumed contingent deferred sales charge for Class B Shares (5% maximum declining to 0% after six years) and the assumed contingent deferred sales charge for Class C Shares (1% if redeemed within 12 months of purchase). Because Institutional Shares do not involve a sales charge, such a charge is not applied to their Standardized Total Returns.Total return figures in the above charts represent past performance and do not guarantee future results, which will vary. The investment return and principal value of an investment will fluctuate and, therefore, an investor’s shares, when redeemed, may be worth more or less than their original cost. Current performance may be lower or higher than the total return figures in the above charts. Please visit www.gs.com/funds to obtain the most recent month-end returns. Performance reflects expense limitations in effect. In their absence, performance would be reduced. Returns do not reflect the deduction of taxes that a shareholder would pay on capital gains and other taxable distributions or the redemption of Fund shares. 12 |
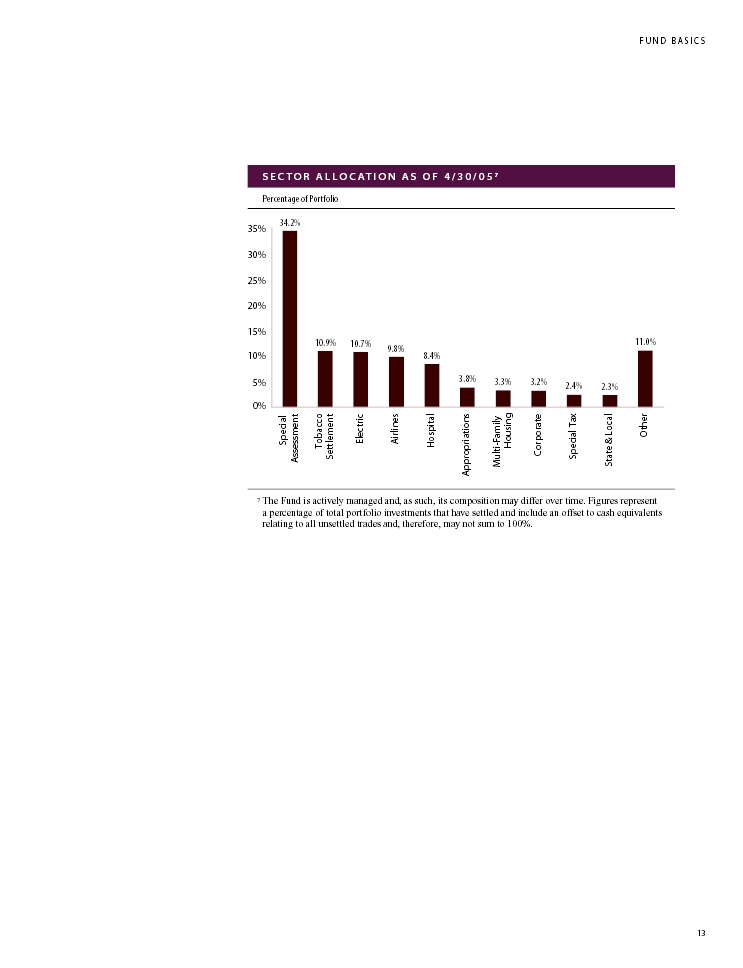
| F U N D B A S I C SS E C T O R A L L O C AT I O N A S O F 4 / 3 0 / 0 5 7 Percentage of Portfolio7The Fund is actively managed and, as such, its composition may differ over time. Figures represent a percentage of total portfolio investments that have settled and include an offset to cash equivalents relating to all unsettled trades and, therefore, may not sum to 100%.13 |
| Principal | Interest | Maturity | ||||||||||||||
| Amount | Rate | Date | Value | |||||||||||||
Municipal Debt Obligations – 97.4% | ||||||||||||||||
| Alabama – 2.2% | ||||||||||||||||
| Alabama 21st Century Authority RB for Tobacco Settlement Revenue Series 2001 (A-/Baa1) | ||||||||||||||||
| $ | 2,135,000 | 5.25 | % | 12/01/2005 | $ | 2,169,630 | ||||||||||
| Birmingham Jefferson Alabama Civic Center Authority Special Tax Refunding Series 2002 A (FSA) (AAA/Aaa) | ||||||||||||||||
| 3,000,000 | 5.25 | 01/01/2007 | 3,116,190 | |||||||||||||
| Greenville Alabama GO Bonds Refunding Warrants Series 2005 (XLCA) (AAA/Aaa) | ||||||||||||||||
| 300,000 | 5.00 | 01/01/2007 | 309,822 | |||||||||||||
| 680,000 | 5.00 | 01/01/2008 | 715,006 | |||||||||||||
| 710,000 | 5.00 | 01/01/2009 | 756,541 | |||||||||||||
| Jefferson County Alabama Limited Obligation School Warrants RB Series 2004 A (A/A2) | ||||||||||||||||
| 4,000,000 | 5.00 | 01/01/2008 | 4,173,600 | |||||||||||||
| $ | 11,240,789 | |||||||||||||||
| Alaska(a) – 0.2% | ||||||||||||||||
| North Slope Boro Alaska GO Bonds for Capital Appreciation Series 2003 A (MBIA) (AAA/Aaa) | ||||||||||||||||
| $ | 1,200,000 | 0.00 | % | 06/30/2005 | $ | 1,194,036 | ||||||||||
| Arizona – 2.4% | ||||||||||||||||
| Arizona State Transportation Board Excise Tax RB for Maricopa County Regional Area Road Fund Series 2001 (AA/Aa2) | ||||||||||||||||
| $ | 2,000,000 | 5.00 | % | 07/01/2005 | $ | 2,007,360 | ||||||||||
| Arizona State Transportation Board RB GANS Series 2001 (MBIA) (AAA/Aaa) | ||||||||||||||||
| 1,950,000 | 5.25 | 01/01/2006 | 1,982,799 | |||||||||||||
| Maricopa County Arizona Community College District GO Bonds Project Series 1994 C (AA+/Aaa) | ||||||||||||||||
| 3,235,000 | 5.25 | 07/01/2005 | 3,248,134 | |||||||||||||
| Phoenix Arizona Civic Improvement Corp. Water System RB Junior Lien Series 1996 (AA/Aaa)(b) | ||||||||||||||||
| 2,150,000 | 5.90 | 07/01/2006 | 2,228,346 | |||||||||||||
| Salt River Agricultural Improvement & Power District Electric System RB for Salt River Project Series 2001 A (AA/Aa2) | ||||||||||||||||
| 2,000,000 | 5.25 | 01/01/2006 | 2,033,780 | |||||||||||||
| University Medical Center Corp. Hospital RB Series 2004 (BBB+/A3) | ||||||||||||||||
| 500,000 | 5.00 | 07/01/2005 | 501,590 | |||||||||||||
| 500,000 | 5.00 | 07/01/2006 | 509,445 | |||||||||||||
| $ | 12,511,454 | |||||||||||||||
| Arkansas – 0.9% | ||||||||||||||||
| Little Rock Arkansas School District GO Bonds for Little Rock School District Series 2001 C (FSA) (Aaa) | ||||||||||||||||
| $ | 1,565,000 | 5.00 | % | 02/01/2009 | $ | 1,673,783 | ||||||||||
| Springdale Arkansas Sales & Use Tax RB Series 2004 (MBIA) (Aaa) | ||||||||||||||||
| 3,000,000 | 4.00 | 07/01/2016 | 3,046,950 | |||||||||||||
| $ | 4,720,733 | |||||||||||||||
| California – 13.7% | ||||||||||||||||
| California Health Facilities Financing Authority RB for Catholic Healthcare West Series 2004 H (A-/Baa1)(c) | ||||||||||||||||
| $ | 5,000,000 | 4.45 | % | 07/01/2011 | $ | 5,121,500 | ||||||||||
| California State Economic Recovery GO Bonds Series 2004 A (AA-/Aa3) | ||||||||||||||||
| 300,000 | 5.00 | 01/01/2009 | 319,986 | |||||||||||||
| California State Economic Recovery GO Bonds Series 2004 B (AA-/Aa3)(c) | ||||||||||||||||
| 20,000,000 | 5.00 | 07/01/2007 | 20,846,200 | |||||||||||||
| California State GO Bonds Refunded Series 1998 (A/A3) | ||||||||||||||||
| 1,100,000 | 6.00 | 02/01/2008 | 1,185,569 | |||||||||||||
| California State GO Bonds Series 2004 (A/A3) | ||||||||||||||||
| 5,000,000 | 4.00 | 02/01/2009 | 5,154,050 | |||||||||||||
| 1,000,000 | 4.00 | 02/01/2010 | 1,034,010 | |||||||||||||
| California State GO Bonds Variable Purpose Series 2004 (A/A3) | ||||||||||||||||
| 2,000,000 | 2.50 | 04/01/2006 | 1,996,440 | |||||||||||||
| 6,500,000 | 5.00 | 04/01/2011 | 7,066,735 | |||||||||||||
| California Statewide Communities Development Authority RB for Daughters of Charity Health Series 2005 F (BBB+) | ||||||||||||||||
| 1,000,000 | 5.00 | 07/01/2006 | 1,020,950 | |||||||||||||
| 1,160,000 | 5.00 | 07/01/2007 | 1,200,461 | |||||||||||||
| 1,000,000 | 5.00 | 07/01/2008 | 1,048,400 | |||||||||||||
| Golden State Tobacco Securitization Corp. California Tobacco Settlement RB Series 2003 B (A-/Baa1) | ||||||||||||||||
| 2,000,000 | 5.00 | 06/01/2010 | 2,132,960 | |||||||||||||
| Kings River Conservation District Revenue COPS for Partnership Peaking Project Series 2004 (Baa1) | ||||||||||||||||
| 1,000,000 | 5.00 | 05/01/2007 | 1,033,880 | |||||||||||||
| 1,000,000 | 4.00 | 05/01/2008 | 1,016,640 | |||||||||||||
| Los Angeles California Waste Water System RB Series 2003 (FSA) (AAA/Aaa) | ||||||||||||||||
| 3,000,000 | 5.00 | 06/01/2007 | 3,134,550 | |||||||||||||
| Metropolitan Water District RB for Southern California Waterworks Refunded Balance Series 1996 C (AAA/Aa2)(b) | ||||||||||||||||
| 8,775,000 | 5.00 | 01/01/2007 | 9,115,821 | |||||||||||||
| Santa Clara County Financing Authority Special Obligation RB for Measure B Transportation Improvement Program Series 2003 (A2) | ||||||||||||||||
| 400,000 | 5.00 | 08/01/2005 | 402,224 | |||||||||||||
| Tobacco Securitization Authority of Southern California Tobacco Settlement RB for Asset Backed Bonds Senior Series 2002 A (BBB/Baa3) | ||||||||||||||||
| 6,625,000 | 5.25 | 06/01/2027 | 6,688,070 | |||||||||||||
| Truckee-Donner Public Utility District of California COPS Series A (ACA) (A) | ||||||||||||||||
| 1,000,000 | 3.50 | 01/01/2006 | 1,002,100 | |||||||||||||
| $ | 70,520,546 | |||||||||||||||
| Colorado – 1.1% | ||||||||||||||||
| Colorado Department of Transportation RANS RB Series A (MBIA) (AAA/Aaa) | ||||||||||||||||
| $ | 1,000,000 | 5.50 | % | 06/15/2006 | $ | 1,029,930 | ||||||||||
14
| Principal | Interest | Maturity | ||||||||||||||
| Amount | Rate | Date | Value | |||||||||||||
Municipal Debt Obligations – (continued) | ||||||||||||||||
| Colorado – (continued) | ||||||||||||||||
| Eagle Bend Metropolitan District No. 2 GO Bonds Refunding & Improvement Series 2003 (Radian) (AA) | ||||||||||||||||
| $ | 420,000 | 3.00 | % | 12/01/2005 | $ | 419,735 | ||||||||||
| 430,000 | 3.25 | 12/01/2006 | 431,832 | |||||||||||||
| 440,000 | 3.50 | 12/01/2007 | 440,312 | |||||||||||||
| 455,000 | 4.00 | 12/01/2008 | 463,495 | |||||||||||||
| 480,000 | 4.00 | 12/01/2009 | 488,630 | |||||||||||||
| East Quincy Highlands Metropolitan District GO Bonds Series 2002 (LOC – U.S. Bank N.A.) (Aa1)(c) | ||||||||||||||||
| 2,290,001 | 2.25 | 12/01/2006 | 2,287,367 | |||||||||||||
| $ | 5,561,301 | |||||||||||||||
| Connecticut – 1.2% | ||||||||||||||||
| Connecticut State GO Bonds Series 2003 C (AA/Aa3) | ||||||||||||||||
| $ | 1,000,000 | 4.00 | % | 05/01/2005 | $ | 1,000,000 | ||||||||||
| Connecticut State Special Obligation Rate Reduction RB Series 2004 A (AAA/Aaa) | ||||||||||||||||
| 4,760,000 | 5.00 | 12/30/2009 | 5,149,082 | |||||||||||||
| $ | 6,149,082 | |||||||||||||||
| Florida – 4.2% | ||||||||||||||||
| Escambia County Florida Health Facilities Authority RB Ascension Health Credit Series 2003 A (AA/Aa2) | ||||||||||||||||
| $ | 1,700,000 | 2.50 | % | 11/15/2005 | $ | 1,695,512 | ||||||||||
| Florida State Board Education GO Bonds for Public Education Series 1998 B (AAA/Aa1) | ||||||||||||||||
| 2,000,000 | 6.00 | 06/01/2006 | 2,068,340 | |||||||||||||
| Huntington Community Development District RB for Special Assessment Series 2004 B | ||||||||||||||||
| 5,290,000 | 5.00 | 05/01/2009 | 5,307,034 | |||||||||||||
| Leesburg Florida Hospital RB for Leesburg Regional Medical Center Project Series 2003 A (A-/A3) | ||||||||||||||||
| 1,820,000 | 5.00 | 07/01/2008 | 1,888,723 | |||||||||||||
| Meadow Pointe II Community Development District RB for Capital Improvement Series 2004 (Baa3) | ||||||||||||||||
| 585,000 | 2.00 | 05/01/2005 | 585,000 | |||||||||||||
| 300,000 | 2.00 | 05/01/2006 | 293,724 | |||||||||||||
| 610,000 | 2.38 | 05/01/2007 | 586,381 | |||||||||||||
| 625,000 | 2.80 | 05/01/2008 | 602,894 | |||||||||||||
| 300,000 | 3.00 | 05/01/2009 | 288,408 | |||||||||||||
| Meadow Pointe III Community Development District RB for Capital Improvement Series 2004 B | ||||||||||||||||
| 1,500,000 | 5.00 | 05/01/2009 | 1,509,315 | |||||||||||||
| Miami Dade County Florida School Board COPS Series 2003 A (MBIA) (AAA/Aaa)(c) | ||||||||||||||||
| 6,000,000 | 5.00 | 08/01/2008 | 6,331,680 | |||||||||||||
| Tampa Palms Florida Open Space & Transportation Community Development District Revenue for Special Assessment Refunding Capital Improvement Area 7 Project Series 2004 (MBIA) (AAA/Aaa) | ||||||||||||||||
| 500,000 | 3.13 | 05/01/2009 | 502,335 | |||||||||||||
| $ | 21,659,346 | |||||||||||||||
| Georgia – 3.3% | ||||||||||||||||
| Atlanta Georgia RB for Airport and Marina Improvements Series 2000 A (FGIC) (AAA/Aaa)(b) | ||||||||||||||||
| $ | 2,500,000 | 5.50 | % | 01/01/2010 | $ | 2,783,400 | ||||||||||
| Bartow County Georgia GO Bonds Sales Tax Series 2003 (MBIA) (AAA/Aaa) | ||||||||||||||||
| 4,000,000 | 5.00 | 02/01/2006 | 4,069,320 | |||||||||||||
| Dekalb County Development Authority RB for Dekalb Senior Center Project Series 2004 | ||||||||||||||||
| 1,400,000 | 4.85 | 06/01/2009 | 1,420,762 | |||||||||||||
| Gwinnett County Georgia School District GO Bonds Refunding Series 2002 (AA+/Aaa) | ||||||||||||||||
| 1,835,000 | 4.50 | 02/01/2006 | 1,859,699 | |||||||||||||
| Newton County Georgia Water Revenue GO Bonds Series 2004 (MBIA) (Aaa) | ||||||||||||||||
| 1,000,000 | 3.00 | 07/01/2005 | 1,000,590 | |||||||||||||
| 1,020,000 | 3.00 | 07/01/2006 | 1,023,672 | |||||||||||||
| South Georgia Governmental Services Authority RB for Telecommunications/ Cable Project Series 2004 (FGIC) (AAA/Aaa) | ||||||||||||||||
| 2,485,000 | 3.00 | 01/01/2007 | 2,493,747 | |||||||||||||
| 2,055,000 | 4.00 | 01/01/2008 | 2,113,958 | |||||||||||||
| $ | 16,765,148 | |||||||||||||||
| Idaho – 0.5% | ||||||||||||||||
| Boise-Kuna Idaho Irrigation District RB (AMBAC) (AAA/Aaa) | ||||||||||||||||
| $ | 2,750,000 | 5.00 | % | 07/01/2006 | $ | 2,818,063 | ||||||||||
| Illinois – 4.0% | ||||||||||||||||
| Chicago Illinois Park District Harbour Facilities RB for Airport and Marina Improvements Series 2000 (XLCA) (AAA/Aaa)(b) | ||||||||||||||||
| $ | 4,610,000 | 5.65 | % | 01/01/2011 | $ | 5,188,417 | ||||||||||
| Chicago Illinois Tax Increment RB for Central Loop Redevelopment Series 2000 A (ACA) (A) | ||||||||||||||||
| 1,000,000 | 6.50 | 12/01/2006 | 1,047,590 | |||||||||||||
| Illinois Development Finance Authority RB for Revolving Fund Master Trust Series 2002 (Aaa) | ||||||||||||||||
| 2,500,000 | 5.00 | 03/01/2007 | 2,596,175 | |||||||||||||
| Illinois Educational Facilities Authority RB for Loyola University Chicago Series 1991 A (ETM) (AAA) | ||||||||||||||||
| 1,500,000 | 7.00 | 07/01/2007 | 1,594,380 | |||||||||||||
| Illinois Health Facilities Authority RB for Hospital Sisters Services Inc. Series 1998 A (MBIA) (Aaa) | ||||||||||||||||
| 4,375,000 | 5.25 | 06/01/2009 | 4,742,281 | |||||||||||||
| Illinois Health Facilities Authority RB for University of Chicago Hospital & Health Series 2003 (MBIA) (AAA/Aaa) | ||||||||||||||||
| 1,400,000 | 4.00 | 08/15/2005 | 1,405,012 | |||||||||||||
| 1,325,000 | 5.00 | 08/15/2006 | 1,360,510 | |||||||||||||
15
| Principal | Interest | Maturity | ||||||||||||||
| Amount | Rate | Date | Value | |||||||||||||
Municipal Debt Obligations – (continued) | ||||||||||||||||
| Illinois – (continued) | ||||||||||||||||
| Illinois State GO Bonds First Series 2002 (MBIA) (AAA/Aaa) | ||||||||||||||||
| $ | 2,000,000 | 5.00 | % | 07/01/2005 | $ | 2,007,340 | ||||||||||
| Metropolitan Pier and Exposition Authority Hospitality Facilities RB for McCormick Place Series 1996 (ETM) (AAA/Aaa) | ||||||||||||||||
| 500,000 | 5.75 | 07/01/2006 | 508,990 | |||||||||||||
| $ | 20,450,695 | |||||||||||||||
| Indiana – 1.1% | ||||||||||||||||
| Indiana Health Facilities Financing Authority Hospital RB for Community Foundation Northwest Industry Series 2001 A (BBB-) | ||||||||||||||||
| $ | 500,000 | 5.50 | % | 08/01/2006 | $ | 509,755 | ||||||||||
| Lawrenceburg Indiana PCRB for Indiana Michigan Power Co. Project Series 2003 F (BBB/Baa2)(c) | ||||||||||||||||
| 5,000,000 | 2.63 | 10/01/2006 | 4,952,500 | |||||||||||||
| $ | 5,462,255 | |||||||||||||||
| Kansas(c) – 0.9% | ||||||||||||||||
| Burlington Kansas PCRB Refunding Kansas Gas & Electric Co. Project Series 2004 B (MBIA) (AAA/Aaa) | ||||||||||||||||
| $ | 4,500,000 | 2.65 | % | 06/01/2006 | $ | 4,494,285 | ||||||||||
| Kentucky(d) – 0.4% | ||||||||||||||||
| Kentucky Economic Development Finance Authority RB for Norton Healthcare Inc. Series 2000 C (MBIA) (AAA/Aaa) | ||||||||||||||||
| $ | 1,775,000 | 0.00/5.25 | % | 10/01/2007 | $ | 1,807,820 | ||||||||||
| Louisiana – 0.4% | ||||||||||||||||
| Jefferson Parish Hospital Service District No. 001 RB for West Jefferson Medical Center Series 1998 A (FSA) (AAA/Aaa) | ||||||||||||||||
| $ | 1,755,000 | 5.00 | % | 01/01/2008 | $ | 1,843,048 | ||||||||||
| Maine – 0.4% | ||||||||||||||||
| Maine State COPS Series 2003 C (AA-) | ||||||||||||||||
| $ | 1,000,000 | 3.50 | % | 06/01/2007 | $ | 1,012,990 | ||||||||||
| 1,000,000 | 4.00 | 06/01/2008 | 1,031,230 | |||||||||||||
| $ | 2,044,220 | |||||||||||||||
| Maryland – 4.6% | ||||||||||||||||
| Anne Arundel County GO Bonds Series 2003 (AA+/Aa1) | ||||||||||||||||
| $ | 5,000,000 | 5.00 | % | 03/01/2006 | $ | 5,096,300 | ||||||||||
| Maryland State GO Bonds State & Local Facilities Loan 2nd Series 2001 (AAA/Aaa) | ||||||||||||||||
| 3,000,000 | 5.00 | 07/15/2005 | 3,014,070 | |||||||||||||
| 15,000,000 | 5.25 | 03/01/2006 | 15,320,550 | |||||||||||||
| $ | 23,430,920 | |||||||||||||||
| Massachusetts – 1.2% | ||||||||||||||||
| Boston Massachusetts GO BANS Series 2002 A (SP-1+/MIG1) | ||||||||||||||||
| $ | 1,000,000 | 3.50 | % | 02/01/2006 | $ | 1,005,810 | ||||||||||
| Massachusetts State GO Bonds Consumer Loan Series 1996 A (MBIA) (AAA/Aaa)(b) | ||||||||||||||||
| 2,000,000 | 5.13 | 01/01/2006 | 2,052,340 | |||||||||||||
| Massachusetts State Health & Educational Facilities Authority RB for Harvard Pilgrim Health Series 1998 A (FSA) (AAA/Aaa) | ||||||||||||||||
| $ | 2,000,000 | 5.25 | % | 07/01/2009 | $ | 2,145,860 | ||||||||||
| Massachusetts State Health & Educational Facilities Authority RB for Partners Healthcare Series 2003 E (AA-/Aa3) | ||||||||||||||||
| 700,000 | 3.00 | 07/01/2005 | 700,231 | |||||||||||||
| $ | 5,904,241 | |||||||||||||||
| Minnesota – 1.0% | ||||||||||||||||
| Dakota County Minnesota GO Bonds Series 2003 A (AA+/Aaa) | ||||||||||||||||
| $ | 1,895,000 | 5.00 | % | 02/01/2007 | $ | 1,967,598 | ||||||||||
| Duluth Minnesota Economic Development Authority Health Care Facilities RB for Benedictine Health Systems-Saint Mary’s Series 2004 (A-) | ||||||||||||||||
| 400,000 | 4.50 | 02/15/2006 | 403,960 | |||||||||||||
| Minneapolis Minnesota Health Care Systems RB for Fairview Health Services Series 2002 B (MBIA) (AAA/Aaa) | ||||||||||||||||
| 1,430,000 | 5.13 | 05/15/2008 | 1,516,958 | |||||||||||||
| Minnesota State GO Bonds Series 1996 (AAA/Aa1) | ||||||||||||||||
| 1,000,000 | 5.50 | 05/01/2005 | 1,000,000 | |||||||||||||
| $ | 4,888,516 | |||||||||||||||
| Mississippi – 1.1% | ||||||||||||||||
| Mississippi State GO Bonds Refunding Series 1978 (ETM) (AAA/Aaa) | ||||||||||||||||
| $ | 5,200,000 | 6.20 | % | 02/01/2008 | $ | 5,615,740 | ||||||||||
| Missouri – 0.1% | ||||||||||||||||
| Cameron Missouri IDA Health Facilities RB for Cameron Community Hospital Series 2000 (ACA) (A) | ||||||||||||||||
| $ | 675,000 | 5.88 | % | 12/01/2006 | $ | 698,180 | ||||||||||
| Montana(c) – 0.2% | ||||||||||||||||
| Forsyth Montana PCRB Refunding Portland General Series 1998 A-RMKT 5/1/03 (BBB+/Baa2) | ||||||||||||||||
| $ | 1,000,000 | 5.20 | % | 05/01/2009 | $ | 1,055,950 | ||||||||||
| Nevada – 1.1% | ||||||||||||||||
| Carson City Hospital RB for Carson-Tahoe Hospital Project Series 2002 (BBB+) | ||||||||||||||||
| $ | 725,000 | 5.25 | % | 09/01/2005 | $ | 729,901 | ||||||||||
| Clark County Airport RB Sub Lien Series 1998 A (MBIA) (AAA/Aaa) | ||||||||||||||||
| 1,250,000 | 6.00 | 07/01/2008 | 1,354,288 | |||||||||||||
| Nevada Department of Business and Industry Capital Appreciation RB for Las Vegas Monorail Series 2000 (AMBAC) (AAA/Aaa)(a) | ||||||||||||||||
| 800,000 | 0.00 | 01/01/2007 | 761,952 | |||||||||||||
| Nevada State GO Bonds Series 1995 C (ETM) (AA/Aa2) | ||||||||||||||||
| 1,475,001 | 6.50 | 05/01/2005 | 1,475,000 | |||||||||||||
| Washoe County Gas and Water Facilities RB for Sierra Pacific Power Co. Series 1987 (AMBAC) (AAA/Aaa) | ||||||||||||||||
| 1,300,000 | 6.30 | 12/01/2014 | 1,318,876 | |||||||||||||
| $ | 5,640,017 | |||||||||||||||
16
| Principal | Interest | Maturity | ||||||||||||||
| Amount | Rate | Date | Value | |||||||||||||
Municipal Debt Obligations – (continued) | ||||||||||||||||
| New Hampshire – 0.4% | ||||||||||||||||
| New Hampshire Health and Education Facilities Authority RB for Southern New Hampshire Medical Center Series 2004 A (A-) | ||||||||||||||||
| $ | 490,000 | 3.00 | % | 10/01/2006 | $ | 487,775 | ||||||||||
| 1,475,000 | 4.00 | 10/01/2008 | 1,507,996 | |||||||||||||
| $ | 1,995,771 | |||||||||||||||
| New Jersey – 4.6% | ||||||||||||||||
| Burlington Township School District GO Bonds Refunding Series 2004 (FGIC) (Aaa) | ||||||||||||||||
| $ | 1,245,000 | 5.00 | % | 01/15/2009 | $ | 1,331,926 | ||||||||||
| New Jersey Economic Development Authority RB for Cigarette Tax Series 2004 (BBB/Baa2) | ||||||||||||||||
| 3,750,000 | 5.00 | 06/15/2007 | 3,883,688 | |||||||||||||
| New Jersey Economic Development Authority RB for Market Transition Facility Series 2001 A (MBIA) (AAA/Aaa) | ||||||||||||||||
| 2,900,000 | 5.00 | 07/01/2005 | 2,910,904 | |||||||||||||
| New Jersey Health Care Facilities Financing Authority RB for South Jersey Hospital Series 2002 (Baa1) | ||||||||||||||||
| 2,555,000 | 5.00 | 07/01/2005 | 2,563,099 | |||||||||||||
| New Jersey State Educational Facilities Authority RB for Fairleigh Dickinson University Series 2002 D (ACA) (A) | ||||||||||||||||
| 335,000 | 5.00 | 07/01/2005 | 335,958 | |||||||||||||
| 355,000 | 5.00 | 07/01/2006 | 361,908 | |||||||||||||
| New Jersey State Educational Facilities Authority RB for Fairleigh Dickinson University Series 2004 C (BBB-) | ||||||||||||||||
| 1,300,000 | 5.00 | 07/01/2007 | 1,333,332 | |||||||||||||
| 1,405,000 | 5.00 | 07/01/2008 | 1,447,066 | |||||||||||||
| New Jersey State Transportation Trust Fund Authority RB for Transportation Systems Series 1995 B (MBIA) (AAA/Aaa)(b) | ||||||||||||||||
| 2,000,000 | 5.75 | 06/15/2005 | 2,047,860 | |||||||||||||
| New Jersey State Transportation Trust Fund Authority RB for Transportation Systems Series 2005 B (MBIA) (AAA/Aaa) | ||||||||||||||||
| 5,000,000 | 5.25 | 12/15/2013 | 5,598,300 | |||||||||||||
| New Jersey State Turnpike Authority RB Series 2000 A Prerefunded (ETM) (MBIA) (AAA/Aaa) | ||||||||||||||||
| 630,000 | 5.50 | 01/01/2007 | 657,978 | |||||||||||||
| Tobacco Settlement Financing Corp. RB Series 2003 (BBB/Baa3) | ||||||||||||||||
| 1,000,000 | 4.38 | 06/01/2019 | 1,005,330 | |||||||||||||
| $ | 23,477,349 | |||||||||||||||
| New Mexico – 1.5% | ||||||||||||||||
| Farmington PCRB for Public Service Co. San Juan Series 2003 A (BBB/Baa2)(c) | ||||||||||||||||
| $ | 2,700,000 | 2.10 | % | 04/01/2006 | $ | 2,669,787 | ||||||||||
| New Mexico State GO Bonds Capital Projects Series 2003 (AA+/Aa1) | ||||||||||||||||
| 3,350,000 | 5.00 | 03/01/2006 | 3,412,310 | |||||||||||||
| New Mexico State University RB Refunding & Improvement Series 2003 (FSA) (AAA/Aaa) | ||||||||||||||||
| 1,000,000 | 5.00 | 04/01/2008 | 1,056,140 | |||||||||||||
| University of New Mexico RB for FHA Insured Hospital Mortgage Series 2004 (FSA) (AAA/Aaa) | ||||||||||||||||
| 515,000 | 5.00 | 01/01/2009 | 549,495 | |||||||||||||
| $ | 7,687,732 | |||||||||||||||
| New York – 7.5% | ||||||||||||||||
| New York City Health & Hospital Corp. RB for Health System Series 2003 A (AMBAC) (AAA/Aaa) | ||||||||||||||||
| $ | 5,000,000 | 5.00 | % | 02/15/2006 | $ | 5,090,000 | ||||||||||
| New York City IDA Civic Facilities RB for Polytechnical University Project (BB+/Ba3) | ||||||||||||||||
| 200,000 | 5.10 | 11/01/2005 | 200,248 | |||||||||||||
| New York City IDA Civic Facility RB for Polytechnical University Project (BB+/Ba3) | ||||||||||||||||
| 250,000 | 5.20 | 11/01/2007 | 249,998 | |||||||||||||
| New York GO Bonds Prerefunded Balance Series 1996 F (ETM) (A/A1) | ||||||||||||||||
| 920,000 | 7.00 | 02/01/2006 | 949,495 | |||||||||||||
| New York GO Bonds Refunding Series 1996 A (MBIA-IBC) (AAA/Aaa) | ||||||||||||||||
| 500,000 | 6.25 | 08/01/2008 | 527,935 | |||||||||||||
| New York GO Bonds Refunding Series 2002 C (A/A1) | ||||||||||||||||
| 2,500,000 | 5.25 | 08/01/2010 | 2,720,200 | |||||||||||||
| New York GO Bonds Unrefunded Balance Series 1996 F (A/A1) | ||||||||||||||||
| 1,080,000 | 7.00 | 02/01/2006 | 1,113,653 | |||||||||||||
| New York State Dormitory Authority Lease RB for Court Facilities Series 2003 A (A/A2) | ||||||||||||||||
| 4,090,000 | 5.00 | 05/15/2007 | 4,240,921 | |||||||||||||
| New York State Dormitory Authority RB for City University System Construction 5th Generation Series 2003 A (AA-/A2) | ||||||||||||||||
| 1,250,000 | 5.00 | 01/01/2006 | 1,268,587 | |||||||||||||
| 3,250,000 | 5.00 | 01/01/2007 | 3,356,405 | |||||||||||||
| New York State Dormitory Authority RB for North Shore Long Island Jewish Group Series 2003 (A3) | ||||||||||||||||
| 250,000 | 4.00 | 05/01/2005 | 250,000 | |||||||||||||
| 575,000 | 5.00 | 05/01/2006 | 584,062 | |||||||||||||
| 460,000 | 5.00 | 05/01/2007 | 474,863 | |||||||||||||
| New York State Power Authority Revenue & General Purpose RB Series 1998 A (AA-/Aa2) | ||||||||||||||||
| 2,000,000 | 5.50 | 02/15/2006 | 2,044,600 | |||||||||||||
| New York State Thruway Authority Service Contract RB for Local Highway & Bridge Series 2002 (AA-/A2) | ||||||||||||||||
| 2,000,000 | 5.00 | 04/01/2006 | 2,040,400 | |||||||||||||
New York State Urban Development Corp. RB for Correctional & Youth Facilities Services Series 2003 A (AA-)(c) | ||||||||||||||||
| 5,750,000 | 5.25 | 01/01/2009 | 6,143,415 | |||||||||||||
17
| Principal | Interest | Maturity | ||||||||||||||
| Amount | Rate | Date | Value | |||||||||||||
Municipal Debt Obligations – (continued) | ||||||||||||||||
| New York – (continued) | ||||||||||||||||
| Otsego County New York Industrial Development Agency Civic Facilities RB for Hartwick College Project Series 2002 A (Ba1) | ||||||||||||||||
| $ | 610,000 | 4.75 | % | 07/01/2005 | $ | 611,086 | ||||||||||
| Saratoga County New York Industrial Development Agency Civic Facilities RB for Saratoga Hospital Project Series 2004 A (BBB+) | ||||||||||||||||
| 285,000 | 3.00 | 12/01/2005 | 285,142 | |||||||||||||
| 500,000 | 5.00 | 12/01/2007 | 521,185 | |||||||||||||
| Tobacco Settlement Financing Corp. RB Series B-1 (AA-/A2) | ||||||||||||||||
| 1,000,000 | 5.00 | 06/01/2010 | 1,068,690 | |||||||||||||
| Triborough Bridge & Tunnel Authority Revenues & General Purpose RB Series 1997 SR (ETM) (AA-/Aa2) | ||||||||||||||||
| 4,860,000 | 5.00 | 01/01/2007 | 4,967,843 | |||||||||||||
| $ | 38,708,728 | |||||||||||||||
| North Carolina – 0.6% | ||||||||||||||||
| North Carolina Eastern Municipal Power RB Refunding Series 1996 A (MBIA) (AAA/Aaa) | ||||||||||||||||
| $ | 2,000,000 | 6.00 | % | 01/01/2006 | $ | 2,043,100 | ||||||||||
| North Carolina Eastern Municipal Power RB Refunding Series 2003 C (BBB/Baa2) | ||||||||||||||||
| 1,190,000 | 5.00 | 01/01/2008 | 1,235,494 | |||||||||||||
| $ | 3,278,594 | |||||||||||||||
| Ohio – 2.1% | ||||||||||||||||
| Cleveland Ohio City School District RANS RB Series 1997 (AMBAC) (AAA/Aaa) | ||||||||||||||||
| $ | 2,000,000 | 5.50 | % | 06/01/2006 | $ | 2,058,260 | ||||||||||
| Lakewood Ohio Hospital Improvement RB for Lakewood Hospital Association Series 2003 (A/A1) | ||||||||||||||||
| 1,000,000 | 5.00 | 02/15/2006 | 1,011,090 | |||||||||||||
| Ohio GO Bonds for Higher Educational Capital Facilities Series 2000 A (AA+/Aa1) | ||||||||||||||||
| 1,775,000 | 5.00 | 02/01/2007 | 1,840,551 | |||||||||||||
| Ohio State Air Quality Development Authority RB for Ohio Edison Project Series 1999 B (BBB-/Baa1)(c) | ||||||||||||||||
| 3,750,000 | 2.25 | 06/01/2005 | 3,745,050 | |||||||||||||
| Ohio State Common Schools GO Bonds Series 2003 (AA+/Aa1) | ||||||||||||||||
| 1,000,000 | 4.00 | 06/15/2005 | 1,001,530 | |||||||||||||
| Ohio State Water Development Authority RB for Refunding Water Development Pure Water (AMBAC) (AAA/Aaa) | ||||||||||||||||
| 1,000,000 | 5.00 | 06/01/2006 | 1,023,870 | |||||||||||||
| $ | 10,680,351 | |||||||||||||||
| Oklahoma – 2.4% | ||||||||||||||||
| Comanche County Hospital Authority RB Series 2004 (Radian) (AA/Aa3) | ||||||||||||||||
| $ | 400,000 | 3.75 | % | 07/01/2006 | $ | 402,424 | ||||||||||
| 1,565,000 | 4.25 | 07/01/2008 | 1,605,878 | |||||||||||||
| 1,000,000 | 4.50 | 07/01/2009 | 1,040,310 | |||||||||||||
| Grand River Dam Authority RB Series 1993 (BBB+/A2) | ||||||||||||||||
| 750,000 | 5.75 | 06/01/2006 | 770,752 | |||||||||||||
| Oklahoma Development Finance Authority RB for Hillcrest Healthcare Systems Series 1999 A (AAA/Aaa)(b) | ||||||||||||||||
| 7,500,000 | 5.63 | 08/15/2009 | 8,303,100 | |||||||||||||
| $ | 12,122,464 | |||||||||||||||
| Oregon(b) – 0.6% | ||||||||||||||||
| Marion County GO Bonds for School District No. 103C Woodburn Series 1995 A (FGIC) (AAA/Aaa) | ||||||||||||||||
| $ | 3,100,000 | 5.65 | % | 11/01/2005 | $ | 3,148,174 | ||||||||||
| Pennsylvania – 6.3% | ||||||||||||||||
| Delaware River Port Authority Pennsylvania & New Jersey RB Refunding Port District Project Series 2001 A (FSA) (AAA/Aaa) | ||||||||||||||||
| $ | 5,085,000 | 5.25 | % | 01/01/2008 | $ | 5,399,151 | ||||||||||
| Harrisburg Pennsylvania Authority RB for Pooled Bond Program Series 1996 I (MBIA) (AAA/Aaa)(b) | ||||||||||||||||
| 3,000,000 | 5.63 | 04/01/2006 | 3,139,470 | |||||||||||||
| Lycoming County Authority Hospital RB for Williamsport Hospital Obligation Group Series 1995 (CONNIE LEE) (AAA) | ||||||||||||||||
| 795,000 | 6.00 | 11/15/2005 | 799,563 | |||||||||||||
| Montgomery County Pennsylvania Higher Education & Health Authority Hospital RB for Abington Memorial Hospital RMKT-7/15/03 Series 1993 A (AMBAC) (AAA/Aaa) | ||||||||||||||||
| 1,985,000 | 6.00 | 06/01/2006 | 2,050,465 | |||||||||||||
| 2,105,000 | 6.00 | 06/01/2007 | 2,231,511 | |||||||||||||
| 2,230,000 | 6.00 | 06/01/2008 | 2,416,852 | |||||||||||||
| Pennsylvania GO Bonds First Series 2001 (AA/Aa2) | ||||||||||||||||
| 1,000,000 | 5.00 | 01/15/2010 | 1,081,960 | |||||||||||||
| Pennsylvania GO Bonds First Series 2002 (AA/Aa2) | ||||||||||||||||
| 2,000,000 | 5.00 | 02/01/2006 | 2,033,620 | |||||||||||||
| Pennsylvania Hills Township GO Bonds Series 1995 (AMBAC) (AAA/Aaa) | ||||||||||||||||
| 750,000 | 5.00 | 12/01/2006 | 759,630 | |||||||||||||
| Pennsylvania State Higher Educational Facilities Authority RB for University of Pennsylvania Health Systems Series 2005 A (A/A3) | ||||||||||||||||
| 1,900,000 | 4.00 | 08/15/2006 | 1,924,586 | |||||||||||||
| 2,300,000 | 5.00 | 08/15/2008 | 2,416,127 | |||||||||||||
| Pennsylvania State Higher Educational Facilities Authority RB for Widener University Series 2003 (BBB+) | ||||||||||||||||
| 795,000 | 5.00 | 07/15/2008 | 821,966 | |||||||||||||
| 1,000,000 | 5.00 | 07/15/2009 | 1,038,230 | |||||||||||||
| Pennsylvania State IDA RB for Economic Development Prerefunded Balance Series 1996 (ETM) (AMBAC) (AAA/Aaa) | ||||||||||||||||
| 815,000 | 6.00 | 07/01/2007 | 869,572 | |||||||||||||
| Pennsylvania State IDA RB for Economic Development Unrefunded Balance Series 1996 (AMBAC) (AAA/Aaa) | ||||||||||||||||
| 3,185,000 | 6.00 | 07/01/2007 | 3,391,356 | |||||||||||||
18
| Principal | Interest | Maturity | ||||||||||||||
| Amount | Rate | Date | Value | |||||||||||||
Municipal Debt Obligations – (continued) | ||||||||||||||||
| Pennsylvania – (continued) | ||||||||||||||||
| Philadelphia Pennsylvania Gas Works RB for Eighteenth Series 2004 (AGC) (AAA/Aa1) | ||||||||||||||||
| $ | 1,185,000 | 5.00 | % | 08/01/2008 | $ | 1,247,509 | ||||||||||
| Philadelphia Water and Wastewater RB Series 1999 (AMBAC) (AAA/Aaa) | ||||||||||||||||
| 750,000 | 5.00 | 12/15/2006 | 775,838 | |||||||||||||
| $ | 32,397,406 | |||||||||||||||
| Puerto Rico – 4.7% | ||||||||||||||||
| Puerto Rico Commonwealth GO Bonds Refunding for Public Improvement Series 2003 C (MBIA) (AAA/Aaa)(c) | ||||||||||||||||
| $ | 5,000,000 | 5.00 | % | 07/01/2008 | $ | 5,385,050 | ||||||||||
| Puerto Rico Commonwealth GO Bonds Series 1993 (MBIA-IBC) (AAA/Aaa) | ||||||||||||||||
| 4,000,000 | 5.50 | 07/01/2008 | 4,309,040 | |||||||||||||
| Puerto Rico Commonwealth Highway & Transportation Authority RB Series 2003 A (A/Baa1) | ||||||||||||||||
| 3,000,000 | 5.00 | 07/01/2005 | 3,010,230 | |||||||||||||
| Puerto Rico Commonwealth Highway & Transportation Authority RB Series 2004 J (A/Baa1) | ||||||||||||||||
| 2,845,000 | 5.00 | 07/01/2006 | 2,913,451 | |||||||||||||
| Puerto Rico Public Buildings Authority RB GTD for Government Facilities Series 1997 B (ETM) (MBIA) (AAA/Aaa) | ||||||||||||||||
| 3,000,000 | 4.55 | 07/01/2005 | 3,010,230 | |||||||||||||
| Puerto Rico Public Finance Corp. RB Commonwealth Appropriations Series 2004 A (LOC-Government Bank for Puerto Rico) (BBB+/Baa2)(c) | ||||||||||||||||
| 5,000,000 | 5.75 | 02/01/2012 | 5,555,900 | |||||||||||||
| $ | 24,183,901 | |||||||||||||||
| Rhode Island – 1.5% | ||||||||||||||||
| Rhode Island State Health & Educational Building Corp. RB for Hospital Financing Series 2003 A (BBB/Baa2) | ||||||||||||||||
| $ | 525,000 | 3.20 | % | 09/15/2006 | $ | 515,970 | ||||||||||
| 485,000 | 4.00 | 09/15/2008 | 486,950 | |||||||||||||
| 585,000 | 4.30 | 09/15/2009 | 588,797 | |||||||||||||
| 610,000 | 4.50 | 09/15/2010 | 615,276 | |||||||||||||
| 635,000 | 4.75 | 09/15/2011 | 641,845 | |||||||||||||
| Rhode Island State Health & Educational Building Corp. RB for Hospital Financing-Memorial Hospital Series 2003 (LOC-Fleet Bank) (AA) | ||||||||||||||||
| 1,560,000 | 4.00 | 07/01/2006 | 1,581,684 | |||||||||||||
| 1,560,000 | 4.00 | 07/01/2007 | 1,590,685 | |||||||||||||
| 1,540,000 | 4.00 | 07/01/2008 | 1,572,032 | |||||||||||||
| $ | 7,593,239 | |||||||||||||||
| South Carolina – 0.5% | ||||||||||||||||
| South Carolina Jobs Economic Development Authority Hospital Facilities RB for Palmetto Health Alliance Refunding Series 2003 A (BBB+/Baa1) | ||||||||||||||||
| 290,000 | 4.25 | 08/01/2005 | 290,580 | |||||||||||||
| 370,000 | 4.50 | 08/01/2006 | 373,855 | |||||||||||||
| South Carolina State Public Service Authority RB Refunding Series 2002 D (FSA) (AAA/Aaa) | ||||||||||||||||
| 2,000,000 | 5.00 | 01/01/2009 | 2,141,120 | |||||||||||||
| $ | 2,805,555 | |||||||||||||||
| Tennessee – 0.8% | ||||||||||||||||
| Johnson City Health and Educational Facilities Board Hospital RB for First Mortgage Mountain States Series 2001 B (Baa2)(c) | ||||||||||||||||
| $ | 1,175,000 | 5.25 | % | 07/01/2005 | $ | 1,178,948 | ||||||||||
| Shelby County Health Educational & Housing Facilities Board RB PA 1277 A (RITES) (AA)(c)(e) | ||||||||||||||||
| 2,250,000 | 10.42 | 10/01/2008 | 2,676,960 | |||||||||||||
| Shelby County Health Educational & Housing Facilities Board RB PA 1277 B (RITES) (AA)(e) | ||||||||||||||||
| 320,000 | 10.42 | 09/01/2008 | 385,459 | |||||||||||||
| $ | 4,241,367 | |||||||||||||||
| Texas – 5.7% | ||||||||||||||||
| Brazoria County Texas Health Facilities Development Corp. RB for Brazosport Memorial Hospital Series 2004 (Radian) (AA) | ||||||||||||||||
| $ | 965,000 | 5.00 | % | 07/01/2007 | $ | 999,277 | ||||||||||
| 1,065,000 | 5.00 | 07/01/2009 | 1,126,269 | |||||||||||||
| Fort Worth Texas Water & Sewer RB for Refunding & Improvement Series 1998 (AA/Aa2) | ||||||||||||||||
| 5,000,000 | 5.00 | 02/15/2007 | 5,180,700 | |||||||||||||
| Fort Worth Texas Water & Sewer RB for Refunding & Improvement Series 2003 (AA/Aa2) | ||||||||||||||||
| 4,000,000 | 5.00 | 02/15/2006 | 4,070,720 | |||||||||||||
| Harris County Texas Health Facilities Development Corp. RB for Christus Health Series 1999 A (MBIA) (AAA/Aaa) | ||||||||||||||||
| 3,000,000 | 5.25 | 07/01/2007 | 3,128,430 | |||||||||||||
| Harris County Texas RB Refunding Tollroad Series 2004 B2 (FGIC) (AAA/Aaa)(c) | ||||||||||||||||
| 10,000,000 | 5.00 | 08/15/2009 | 10,673,000 | |||||||||||||
| Odessa Texas Junior College District RB Refunding Series 1995 A (AAA/Aaa)(b) | ||||||||||||||||
| 1,905,000 | 8.13 | 06/01/2005 | 1,970,018 | |||||||||||||
| Sam Rayburn Texas Municipal Power Agency RB Refunding (Radian) (AA/Baa2) | ||||||||||||||||
| 2,000,000 | 5.00 | 10/01/2008 | 2,107,380 | |||||||||||||
| $ | 29,255,794 | |||||||||||||||
| U.S. Virgin Islands – 0.6% | ||||||||||||||||
| Virgin Islands Public Finance Authority RB Senior Lien Matching Fund Loan Note Series 2004 A (BBB) | ||||||||||||||||
| $ | 2,000,000 | 5.00 | % | 10/01/2006 | $ | 2,062,820 | ||||||||||
| 1,100,000 | 5.00 | 10/01/2008 | 1,155,792 | |||||||||||||
| $ | 3,218,612 | |||||||||||||||
19
| Principal | Interest | Maturity | ||||||||||||||
| Amount | Rate | Date | Value | |||||||||||||
Municipal Debt Obligations – (continued) | ||||||||||||||||
| Utah – 1.3% | ||||||||||||||||
| Utah Building Ownership Authority Lease RB for Capital Appreciation Series 1998 B (FSA) (AAA/Aaa)(a) | ||||||||||||||||
| $ | 2,000,000 | 0.00 | % | 05/15/2005 | $ | 1,998,300 | ||||||||||
| Utah County Utah Hospital RB for IHC Health Services Inc. Series 2002 (AAA/Aaa) | ||||||||||||||||
| 3,000,000 | 5.00 | 07/01/2005 | 3,011,250 | |||||||||||||
| Utah State GO Bonds Series 2002 A (AA+/Aa1) | ||||||||||||||||
| 1,500,000 | 5.00 | 05/15/2005 | 1,500,990 | |||||||||||||
| $ | 6,510,540 | |||||||||||||||
| Virginia – 5.0% | ||||||||||||||||
| Chesapeake Virginia Hospital Authority Facility RB for Refunding Chesapeake General Hospital Series 2004 A (A3) | ||||||||||||||||
| $ | 2,075,000 | 5.00 | % | 07/01/2006 | $ | 2,109,943 | ||||||||||
| 2,425,000 | 5.00 | 07/01/2008 | 2,526,850 | |||||||||||||
| Loudoun County GO Bonds for Public Improvement Series 2001 C (AA+/Aaa) | ||||||||||||||||
| 1,250,000 | 5.25 | 11/01/2006 | 1,296,475 | |||||||||||||
| Virginia College Building Authority Educational Facilities RB for 21st Century College & Equipment Series 2004 A (AA+/Aa1) | ||||||||||||||||
| 8,000,000 | 5.00 | 02/01/2009 | 8,570,720 | |||||||||||||
| Virginia Commonwealth Transportation Board RANS RB for Federal Highway Reimbursement Series 2000 (AA/Aa2) | ||||||||||||||||
| 1,000,000 | 5.50 | 10/01/2006 | 1,037,140 | |||||||||||||
| Virginia Commonwealth Transportation Board RB for US Route 58 Corridor Development Program Series 1999 B (AA+/Aa1)(b) | ||||||||||||||||
| 9,000,000 | 5.75 | 05/15/2009 | 10,030,950 | |||||||||||||
| $ | 25,572,078 | |||||||||||||||
| Washington – 1.9% | ||||||||||||||||
| Clark County Washington School District No. 037 Vancouver GO Bonds Refunding Series 2003 B (Aa1) | ||||||||||||||||
| $ | 1,790,000 | 4.00 | % | 06/01/2005 | $ | 1,791,772 | ||||||||||
| Washington State Health Care Facilities Authority RB for Multicare Health Systems Series 1998 (MBIA) (Aaa) | ||||||||||||||||
| 2,000,000 | 5.00 | 08/15/2005 | 2,012,760 | |||||||||||||
| Washington State Public Power Supply RB Refunding Series 1997 A (AMBAC) (AAA/Aaa) | ||||||||||||||||
| 1,000,000 | 5.00 | 07/01/2006 | 1,024,170 | |||||||||||||
| Washington State Public Power Supply System Nuclear Project No. 2 RB Series 1990 C (MBIA-IBC) (AAA/Aaa)(a) | ||||||||||||||||
| 5,000,000 | 0.00 | 07/01/2005 | 4,978,150 | |||||||||||||
| $ | 9,806,852 | |||||||||||||||
| West Virginia – 0.3% | ||||||||||||||||
| West Virginia Higher Education Political Community RB for University Facilities Refunding Series 2003 A (MBIA) (AAA/Aaa) | ||||||||||||||||
| $ | 1,680,000 | 5.00 | % | 04/01/2006 | $ | 1,715,011 | ||||||||||
| Wisconsin – 2.5% | ||||||||||||||||
| Badger Power Marketing Authority Inc. Transmission Delivery Facilities RB Series 1993 Prerefunded (ETM) (AMBAC) (AAA/Aaa) | ||||||||||||||||
| $ | 200,000 | 5.30 | % | 10/01/2008 | $ | 208,348 | ||||||||||
| Badger Power Marketing Authority Inc. Transmission Delivery Facilities RB Series 1993 Unrefunded Balance (AMBAC) (AAA/Aaa) | ||||||||||||||||
| 990,000 | 5.30 | 10/01/2008 | 1,027,967 | |||||||||||||
| Milwaukee Wisconsin GO Bonds for Promissory Notes Series 2005 N1 (FSA) (AAA/Aaa) | ||||||||||||||||
| 1,415,000 | 5.00 | 02/15/2010 | 1,528,313 | |||||||||||||
| 2,630,000 | 5.00 | 02/15/2011 | 2,863,412 | |||||||||||||
| Wisconsin GO Bonds Series 2000 A (AA-/Aa3) | ||||||||||||||||
| 2,000,000 | 5.50 | 05/01/2005 | 2,000,000 | |||||||||||||
| Wisconsin State Health & Educational Facilities Authority RB for Fort Healthcare Inc. Project Series 2004 (BBB+) | ||||||||||||||||
| 665,000 | 4.00 | 05/01/2007 | 671,470 | |||||||||||||
| 695,000 | 4.00 | 05/01/2008 | 702,423 | |||||||||||||
| 715,000 | 4.00 | 05/01/2009 | 719,719 | |||||||||||||
| Wisconsin State Health & Educational Facilities Authority RB for Gundersen Lutheran Hospital Series 2003 A (FSA) (AAA/Aaa) | ||||||||||||||||
| 1,000,000 | 5.00 | 02/15/2007 | 1,035,260 | |||||||||||||
| Wisconsin State Health & Educational Facilities Authority RB for Wheaton Franciscan Services Series 2003 A (A/A2) | ||||||||||||||||
| 500,000 | 4.00 | 08/15/2005 | 501,340 | |||||||||||||
| 1,555,000 | 4.00 | 08/15/2006 | 1,567,502 | |||||||||||||
| $ | 12,825,754 | |||||||||||||||
| Wyoming – 0.4% | ||||||||||||||||
| Platte County PCRB for Basin Electric Power Series 1994 (AMBAC-TCRS) (AAA/Aaa) | ||||||||||||||||
| $ | 1,975,000 | 4.95 | % | 01/01/2006 | $ | 2,005,040 | ||||||||||
| TOTAL MUNICIPAL DEBT OBLIGATIONS | ||||||||||||||||
| (Cost $502,210,092) | $ | 499,706,697 | ||||||||||||||
Other Municipals(c)(f) – 2.2% | ||||||||||||||||
| MMA Financial CDD Senior Securitization Trust RB for Various States Bartram Springs Passthru Series 2003 B (A1) | ||||||||||||||||
| $ | 6,190,000 | 3.38 | % | 11/01/2008 | $ | 6,095,045 | ||||||||||
| Municipal Mortgage & Equity LLC RB for 1999 A Tax-Exempt MF Hsg. Certificates Series 1999 | ||||||||||||||||
| 5,000,000 | 4.95 | 08/15/2005 | 5,022,300 | |||||||||||||
| TOTAL OTHER MUNICIPALS | ||||||||||||||||
| (Cost $11,190,000) | $ | 11,117,345 | ||||||||||||||
| TOTAL INVESTMENTS – 99.6% | ||||||||||||||||
| (Cost $513,400,092) | $ | 510,824,042 | ||||||||||||||
20
| The percentage shown for each investment category reflects the value of investments in that category as a percentage of net assets. |
| (a) | Security issued with a zero coupon. Income is recognized through the accretion of discount. | |
| (b) | Pre-Refunded security. Maturity date disclosed is prerefunding date. | |
| (c) | Securities with “Put” features with resetting interest rates. Maturity dates disclosed are the next interest reset dates. | |
| (d) | This security is issued with a zero coupon rate which increases to the stated rate at a set date in the future. | |
| (e) | Inverse variable rate security. Interest rate disclosed is that which is in effect at April 30, 2005. | |
| (f) | Securities are exempt from registration under Rule 144A of the Securities Act of 1933. Under procedures approved by the Board of Trustees, such securities have been determined to be liquid by the Investment Adviser and may be resold, normally to qualified institutional buyers in transactions exempt from registration. Total market value of Rule 144A securities amounts to $11,117,345, which represents approximately 2.2% of net assets as of April 30, 2005. |
| Investment Abbreviations: | ||||||
| ACA | — | Insured by American Capital Access | ||||
| AGC | — | Insured by ACE Guaranty Corp. | ||||
| AMBAC | — | Insured by American Municipal Bond Assurance Corp. | ||||
| AMBAC-TCRS | — | Insured by American Municipal Bond Assurance Corp. – Transferable Custodial Receipts | ||||
| BANS | — | Bond Anticipation Notes | ||||
| COPS | — | Certificates of Participation | ||||
| CONNIE LEE | — | College Construction Loan Insurance Association | ||||
| ETM | — | Escrow to Maturity | ||||
| FGIC | — | Insured by Financial Guaranty Insurance Co. | ||||
| FHA | — | Insured by Federal Housing Administration | ||||
| FSA | — | Insured by Financial Security Assurance Co. | ||||
| GANS | — | Grant Anticipation Notes | ||||
| GO | — | General Obligation | ||||
| GTD | — | Guaranteed | ||||
| IDA | — | Industrial Development Authority | ||||
| LIBOR | — | London Inter-Bank Offered Rate | ||||
| LOC | — | Letter of Credit | ||||
| MBIA | — | Insured by Municipal Bond Investors Assurance | ||||
| MBIA-IBC | — | Insured by Municipal Bond Investors Assurance – Insured Bond Certificates | ||||
| MF Hsg. | — | Multi-Family Housing | ||||
| PCRB | — | Pollution Control Revenue Bond | ||||
| Radian | — | Insured by Radian Asset Assurance | ||||
| RANS | — | Revenue Anticipation Notes | ||||
| RB | — | Revenue Bond | ||||
| RITES | — | Residual Interest Tax Exempt Securities | ||||
| RMKT | — | Remarketed | ||||
| XLCA | — | Insured by XL Capital Assurance | ||||
| Security ratings disclosed, if any, are issued by Standard & Poor’s/ Moody’s Investors Service/ Fitch. A brief description of the ratings is available in the Fund’s Statement of Additional Information. |
21
| ADDITIONAL INVESTMENT INFORMATION |
SWAP CONTRACTS — At April 30, 2005, the Fund had an outstanding swap contract with the following terms:
| Rate Type | ||||||||||||||||||||
| Notional | Payments | Payments | ||||||||||||||||||
| Swap | Amount | Termination | Made by | Received by | Unrealized | |||||||||||||||
| Swap Type | Counterparty | (000s) | Date | the Fund | the Fund | Loss | ||||||||||||||
Interest Rate | Salomon Smith Barney | $ | 5,000 | 02/23/2025 | 5.05 | % | 3 month LIBOR floating | $ | (71,320 | ) | ||||||||||
22
| Principal | Interest | Maturity | ||||||||||||||
| Amount | Rate | Date | Value | |||||||||||||
Municipal Debt Obligations – 96.7% | ||||||||||||||||
| Alabama – 3.0% | ||||||||||||||||
| Alabama State Municipal Electric Authority Power Supply RB Series 2003 A (MBIA) (Aaa) | ||||||||||||||||
| $ | 1,000,000 | 5.00 | % | 09/01/2033 | $ | 1,045,430 | ||||||||||
| Alabama State Public School & College Authority RB for Capital Improvement Series 1999 D (AA/Aa3) | ||||||||||||||||
| 1,150,000 | 5.75 | 08/01/2019 | 1,278,524 | |||||||||||||
| Birmingham Alabama GO Bonds for Capital Improvement Warrants Series 2000 A (AA/Aa3) | ||||||||||||||||
| 1,000,000 | 5.55 | 08/01/2021 | 1,094,600 | |||||||||||||
| Huntsville Alabama GO Refunding Warrants Series 2005 A (FSA) (AAA/Aaa) | ||||||||||||||||
| 1,000,000 | 5.75 | 02/01/2015 | 1,177,080 | |||||||||||||
| Jefferson County Alabama Limited Obligation School Warrants RB Series 2004 A (A/A2) | ||||||||||||||||
| 3,500,000 | 5.25 | 01/01/2011 | 3,785,635 | |||||||||||||
| Montgomery Alabama GO Bonds Warrants Series 1997 A (AA/Aa3) | ||||||||||||||||
| 1,000,000 | 5.10 | 10/01/2009 | 1,058,300 | |||||||||||||
| Tuscaloosa GO Bonds Warrants Series 2000 (AA-/Aa3) | ||||||||||||||||
| 1,000,000 | 5.65 | 01/01/2017 | 1,102,400 | |||||||||||||
| $ | 10,541,969 | |||||||||||||||
| Alaska – 3.2% | ||||||||||||||||
| Alaska State Housing Finance Corp. RB for General Housing Series 2005 A (FGIC) (AAA/Aaa) | ||||||||||||||||
| $ | 4,000,000 | 5.25 | % | 12/01/2034 | $ | 4,292,280 | ||||||||||
| Alaska State Housing Finance Corp. RB for General Mortgage Series 1997 A (MBIA) (AAA/Aaa) | ||||||||||||||||
| 2,000,000 | 6.00 | 06/01/2027 | 2,083,020 | |||||||||||||
| Alaska State Housing Finance Corp. RB Series 1999 A (MBIA) (AAA/AAA) | ||||||||||||||||
| 2,490,000 | 6.00 | 06/01/2049 | 2,619,829 | |||||||||||||
| Anchorage Alaska Water RB Refunding Series 2004 (MBIA) (AAA/Aaa) | ||||||||||||||||
| 1,000,000 | 5.13 | 05/01/2029 | 1,060,980 | |||||||||||||
| Northern Tobacco Securitization Corp. RB for Alaska Asset Backed Bonds Series 2001 (BBB/Baa3) | ||||||||||||||||
| 1,500,000 | 5.50 | 06/01/2029 | 1,460,940 | |||||||||||||
| $ | 11,517,049 | |||||||||||||||
| Arizona – 2.6% | ||||||||||||||||
| Arizona School Facilities Board RB for State School Trust Series 2004 A (AMBAC) (AAA/Aaa) | ||||||||||||||||
| $ | 3,410,000 | 5.75 | % | 07/01/2018 | $ | 3,942,915 | ||||||||||
| Coconino County PCRB for Nevada Power Co. Project Series 1995 E (B-) | ||||||||||||||||
| 325,000 | 5.35 | 10/01/2022 | 322,715 | |||||||||||||
| Maricopa County MF Hsg. IDA RB for Place Five and Greenery Apartments Series 1996 A (ETM) (AAA) | ||||||||||||||||
| 875,000 | 5.85 | 01/01/2008 | 909,099 | |||||||||||||
| Maricopa County United School District No. 41 GO Bonds Series 1995 (FSA) (AAA/Aaa) | ||||||||||||||||
| 2,500,000 | 6.25 | 07/01/2015 | 2,717,000 | |||||||||||||
| Northern Arizona University RB Series 2003 (FGIC) (AAA/Aaa) | ||||||||||||||||
| 1,235,000 | 5.50 | 06/01/2025 | 1,379,766 | |||||||||||||
| $ | 9,271,495 | |||||||||||||||
| Arkansas – 2.7% | ||||||||||||||||
| Arkansas Development Finance Authority Hospital RB for Washington Regional Medical Center Series 2000 (BBB/Baa2) | ||||||||||||||||
| $ | 4,000,000 | 7.25 | % | 02/01/2020 | $ | 4,480,000 | ||||||||||
| Paragould Sales and Use Tax RB Series 2001 (AMBAC) (AAA/Aaa) | ||||||||||||||||
| 1,000,000 | 5.10 | 06/01/2018 | 1,063,800 | |||||||||||||
| 480,000 | 5.05 | 06/01/2021 | 481,301 | |||||||||||||
| University of Arkansas RB for Construction UAMS Campus Series 2004 B (MBIA) (Aaa) | ||||||||||||||||
| 1,000,000 | 5.00 | 11/01/2027 | 1,054,080 | |||||||||||||
| University of Arkansas RB for Fayetteville Campus Series 2002 (FGIC) (Aaa)(a) | ||||||||||||||||
| 1,185,000 | 5.50 | 12/01/2012 | 1,351,623 | |||||||||||||
| University of Arkansas RB for Parking Construction UAMS Campus Series 2004 (MBIA) (Aaa) | ||||||||||||||||
| 1,200,000 | 5.00 | 07/01/2034 | 1,243,944 | |||||||||||||
| $ | 9,674,748 | |||||||||||||||
| California – 10.7% | ||||||||||||||||
| Abag Finance Authority RB for Non-Profit Corp. San Diego Hospital Association Series 2001 A (BBB+/Baa1) | ||||||||||||||||
| $ | 1,000,000 | 6.13 | % | 08/15/2020 | $ | 1,101,350 | ||||||||||
| Abag Finance Authority RB for Non-Profit Corps. Samsum-Santa Barbara Series 2002 A (A) | ||||||||||||||||
| 1,500,000 | 5.50 | 04/01/2021 | 1,598,235 | |||||||||||||
| California Infrastructure & Economic Development Bank RB for LA County Department of Public Social Services Series 2003 (AMBAC) (AAA/Aaa) | ||||||||||||||||
| 1,505,000 | 5.75 | 09/01/2023 | 1,724,835 | |||||||||||||
| California State Economic Recovery GO Bonds Series 2004 A (AA-/Aa3) | ||||||||||||||||
| 125,000 | 5.00 | 01/01/2009 | 133,328 | |||||||||||||
| California State Economic Recovery RB for Drivers Series 2004 448 (RITES) (AA-)(b) | ||||||||||||||||
| 625,000 | 15.00 | (d) | 07/01/2008 | 769,850 | ||||||||||||
| 940,000 | 16.82 | 07/01/2014 | 1,392,140 | |||||||||||||
| California State GO Bonds Series 2000 (FGIC) (AAA/Aaa) | ||||||||||||||||
| 1,280,000 | 5.25 | 09/01/2030 | 1,349,082 | |||||||||||||
| California State GO Bonds Series 2003 (A/A3) | ||||||||||||||||
| 1,000,000 | 5.25 | 02/01/2033 | 1,055,520 | |||||||||||||
| California State Public Works Board Lease RB for UCLA Replacement Hospital Series 2002 A (FSA) (AAA/Aaa) | ||||||||||||||||
| 2,000,000 | 5.38 | 10/01/2019 | 2,186,800 | |||||||||||||
| California State University Fresno Association, Inc. RB for Senior Auxiliary Organization Event Center Series 2002 (Baa3)(a) | ||||||||||||||||
| 1,000,000 | 6.00 | 07/01/2012 | 1,180,160 | |||||||||||||
| Golden State Tobacco Securitization Corp. California Tobacco Settlement RB Series 2003 A-1 (BBB/Baa3) | ||||||||||||||||
| 1,225,000 | 6.75 | 06/01/2039 | 1,303,277 | |||||||||||||
| Golden State Tobacco Securitization Corp. California Tobacco Settlement RB Series 2003 A-3 (BBB/Baa3) | ||||||||||||||||
| 350,000 | 7.88 | 06/01/2042 | 403,648 | |||||||||||||
| Golden State Tobacco Securitization Corp. California Tobacco Settlement RB Series 2003 A-5 (BBB/Baa3) | ||||||||||||||||
| 650,000 | 7.88 | 06/01/2042 | 749,632 | |||||||||||||
| Golden State Tobacco Securitization Corp. California Tobacco Settlement RB Series 2003 B (A-/Baa1) | ||||||||||||||||
| 9,000,000 | 5.50 | 06/01/2043 | 9,604,710 | |||||||||||||
23
| Principal | Interest | Maturity | ||||||||||||||
| Amount | Rate | Date | Value | |||||||||||||
Municipal Debt Obligations – (continued) | ||||||||||||||||
| California – (continued) | ||||||||||||||||
| Kaweah Delta Health Care District RB Series 2004 (A3) | ||||||||||||||||
| $ | 325,000 | 6.00 | % | 08/01/2034 | $ | 353,412 | ||||||||||
| Kings River Conservation District California Revenue COPS for Peaking Project Series 2004 (Baa1) | ||||||||||||||||
| 300,000 | 5.00 | 05/01/2011 | 321,453 | |||||||||||||
| 300,000 | 5.00 | 05/01/2012 | 321,732 | |||||||||||||
| 285,000 | 5.00 | 05/01/2015 | 303,687 | |||||||||||||
| Los Angeles Unified School District GO Bonds for Election of 1997 Series 2002 E (MBIA) (AAA/Aaa) | ||||||||||||||||
| 1,000,000 | 5.13 | 01/01/2027 | 1,057,890 | |||||||||||||
| Menlo Park GO Bonds Series 2002 (Aa1) | ||||||||||||||||
| 1,000,000 | 5.25 | 08/01/2027 | 1,070,370 | |||||||||||||
| Metropolitan Water District Waterworks RB Refunding Series 2001 A (AA+/Aa2) | ||||||||||||||||
| 1,000,000 | 5.10 | 07/01/2025 | 1,063,350 | |||||||||||||
| Palo Alto Improvement Bond Act of 1915 for Special Assessment University Avenue Area off Street Parking Series 2002 A (BBB) | ||||||||||||||||
| 955,000 | 5.25 | 09/02/2015 | 976,077 | |||||||||||||
| Placentia California COPS Improvement Project Series 2004 | ||||||||||||||||
| 1,000,000 | 5.45 | 07/01/2025 | 1,001,780 | |||||||||||||
| San Diego Unified School District GO Bonds for Election 1998 Series 2002 D (FGIC) (AAA/Aaa) | ||||||||||||||||
| 1,000,000 | 5.25 | 07/01/2024 | 1,120,520 | |||||||||||||
| San Gabriel Unified School District GO Bonds Series 2002 A (FSA) (AAA/Aaa) | ||||||||||||||||
| 500,000 | 5.38 | 08/01/2021 | 568,369 | |||||||||||||
| Santa Clara County Financing Authority Special Obligation RB for Measure B Transportation Improvement Program Series 2003 (A2) | ||||||||||||||||
| 200,000 | 5.00 | 08/01/2005 | 201,112 | |||||||||||||
| Tobacco Securitization Authority RB for Southern California Tobacco Settlement Asset Backed Bonds Series 2002 A (BBB/ Baa3) | ||||||||||||||||
| 3,000,000 | 5.63 | 06/01/2043 | 2,884,710 | |||||||||||||
| Torrance California COPS Refunding & Public Improvement Project Series 2005 B (AMBAC) (AAA/Aaa) | ||||||||||||||||
| 310,000 | 5.25 | 06/01/2034 | 332,890 | |||||||||||||
| University of California RB for Multiple Purpose Projects Series 2001 M (FGIC)(AAA/Aaa) | ||||||||||||||||
| 1,000,000 | 5.13 | 09/01/2022 | 1,056,320 | |||||||||||||
| 1,000,000 | 5.13 | 09/01/2023 | 1,076,180 | |||||||||||||
| $ | 38,262,419 | |||||||||||||||
| Colorado – 1.6% | ||||||||||||||||
| Aurora Centretech Metropolitan District GO Bonds Series 1998 C (LOC-BNP Paribas) (AA)(d) | ||||||||||||||||
| $ | 2,000,000 | 4.88 | % | 12/01/2008 | $ | 2,079,600 | ||||||||||
| Colorado Health Facilities Authority RB for Hospital Poudre Valley Health Care Series 2005 F (BBB+/Baa2) | ||||||||||||||||
| 1,000,000 | 5.00 | 03/01/2025 | 1,008,430 | |||||||||||||
| Colorado Health Facilities Authority RB for Portercare Adventist Health System Series 2001 (A/A2) | ||||||||||||||||
| 500,000 | 6.50 | 11/15/2031 | 555,575 | |||||||||||||
| Denver City & County GO Bonds for Various Purposes Series 1999 B (AA+/Aa1) | ||||||||||||||||
| 1,000,000 | 5.63 | 08/01/2007 | 1,059,350 | |||||||||||||
| La Plata County School District No. 9-R Durango GO Bonds Series 2002 (MBIA) (Aaa) | ||||||||||||||||
| 1,000,000 | 5.25 | 11/01/2025 | 1,075,540 | |||||||||||||
| $ | 5,778,495 | |||||||||||||||
| Connecticut – 0.8% | ||||||||||||||||
| Connecticut State GO Bonds Residual Certificates Series 2001 515 (RITES) (Aa3)(b)(c) | ||||||||||||||||
| $ | 1,335,000 | 13.85 | % | 12/15/2013 | $ | 1,917,007 | ||||||||||
| Mashantucket Western Pequot Tribe RB Series 1996 A (ETM) (AAA/Aaa)(e) | ||||||||||||||||
| 1,000,000 | 6.50 | 09/01/2005 | 1,013,300 | |||||||||||||
| $ | 2,930,307 | |||||||||||||||
| District Of Columbia – 0.5% | ||||||||||||||||
| District of Columbia Tobacco Settlement Financing Corp. RB for Asset Backed Bonds Series 2001 (BBB/Baa3) | ||||||||||||||||
| $ | 840,000 | 6.25 | % | 05/15/2024 | $ | 859,043 | ||||||||||
| 1,000,000 | 6.50 | 05/15/2033 | 1,060,520 | |||||||||||||
| $ | 1,919,563 | |||||||||||||||
| Florida – 5.1% | ||||||||||||||||
| Bridgewater Wesley Chapel Community Development District RB for Capital Improvement Series 2005 | ||||||||||||||||
| $ | 2,500,000 | 5.75 | % | 05/01/2035 | $ | 2,528,925 | ||||||||||
| Crossings at Fleming Island Community Development District RB for Special Assignment Series 2000 B (MBIA) (AAA/Aaa) | ||||||||||||||||
| 1,765,000 | 5.80 | 05/01/2016 | 1,982,395 | |||||||||||||
| Diamond Hill Community Development District Tax Allocation for Capital Improvement Series 2004 | ||||||||||||||||
| 1,750,000 | 6.00 | 05/01/2034 | 1,780,065 | |||||||||||||
| Florida State GO Bonds Department of Transportation Right of Way Series 1997 B (AAA/Aa1) | ||||||||||||||||
| 1,000,000 | 5.50 | 07/01/2011 | 1,060,560 | |||||||||||||
| High Ridge Quantum Community Development District Special Assessment for Boynton Beach Series 2005 A | ||||||||||||||||
| 1,960,000 | 5.75 | 05/01/2035 | 1,960,059 | |||||||||||||
| Hollywood Community Redevelopment Agency RB for Beach CRA Series 2004 (Baa2) | ||||||||||||||||
| 300,000 | 5.63 | 03/01/2024 | 320,955 | |||||||||||||
| Keys Cove Community Development District Special Assessment Series 2004 | ||||||||||||||||
| 1,225,000 | 5.88 | 5/01/2035 | 1,241,966 | |||||||||||||
| Meadow Pointe III Community Development District RB for Capital Improvement Series 2004 A | ||||||||||||||||
| 1,000,000 | 6.00 | 05/01/2035 | 1,028,560 | |||||||||||||
| Palm Beach County GO Bonds Series 1999 A (AAA/Aaa) | ||||||||||||||||
| 1,000,000 | 5.45 | 08/01/2013 | 1,082,320 | |||||||||||||
24
| Principal | Interest | Maturity | ||||||||||||||
| Amount | Rate | Date | Value | |||||||||||||
Municipal Debt Obligations – (continued) | ||||||||||||||||
| Florida – (continued) | ||||||||||||||||
| Port Everglades Authority RB Series 1986 (ETM) (AAA/Aaa) | ||||||||||||||||
| $ | 2,785,000 | 7.13 | % | 11/01/2016 | $ | 3,432,680 | ||||||||||
| Tampa Palms Open Space and Transportation Community Development District Revenue Special Assessment for Capital Improvement Area 7 Project Series 2004 (MBIA) (AAA/Aaa) | ||||||||||||||||
| 250,000 | 4.00 | 05/01/2013 | 259,177 | |||||||||||||
| 1,400,000 | 4.50 | 05/01/2018 | 1,490,860 | |||||||||||||
| $ | 18,168,522 | |||||||||||||||
| Georgia – 2.5% | ||||||||||||||||
| Augusta Georgia Water & Sewer RB Series 2004 (FSA) (AAA/Aaa) | ||||||||||||||||
| $ | 7,000,000 | 5.25 | % | 10/01/2039 | $ | 7,549,150 | ||||||||||
| Chatham County Hospital Authority RB for Hospital Improvement Memorial Health University Series 2004 A (A-/A3) | ||||||||||||||||
| 325,000 | 5.50 | 01/01/2034 | 344,721 | |||||||||||||
| Georgia State GO Bonds Series 1992 B (AAA/Aaa) | ||||||||||||||||
| 1,000,000 | 6.00 | 03/01/2012 | 1,165,070 | |||||||||||||
| $ | 9,058,941 | |||||||||||||||
| Hawaii – 1.4% | ||||||||||||||||
| Hawaii State Airport Systems RB Series 2000 B (AMT) (FGIC) (AAA/Aaa) | ||||||||||||||||
| $ | 3,500,000 | 6.63 | % | 07/01/2017 | $ | 4,009,040 | ||||||||||
| Hawaii State GO Bonds Refunding Series 1997 (FGIC) (AAA/Aaa) | ||||||||||||||||
| 1,000,000 | 6.00 | 03/01/2008 | 1,083,740 | |||||||||||||
| $ | 5,092,780 | |||||||||||||||
| Illinois – 6.5% | ||||||||||||||||
| Chicago Illinois GO Bonds and Refunding Project Series 2000 C (FGIC) (AAA/Aaa) | ||||||||||||||||
| $ | 2,180,000 | 5.50 | % | 01/01/2019 | $ | 2,392,506 | ||||||||||
| Chicago Illinois Ohare International Airport RB for General Airport 3rd Lien Series 2003 A-1 (XLCA) (AAA/Aaa) | ||||||||||||||||
| 490,000 | 5.25 | 01/01/2034 | 519,327 | |||||||||||||
| Chicago Illinois Tax Increment for Near South Redevelopment Project Series 2001 A (ACA) (A) | ||||||||||||||||
| 750,000 | 5.00 | 11/15/2011 | 785,257 | |||||||||||||
| 1,250,000 | 6.25 | 11/15/2013 | 1,392,750 | |||||||||||||
| Chicago Illinois Tax Increment Junior Lien for Central Loop Redevelopment Project Series 2000 A (ACA) (A) | ||||||||||||||||
| 2,000,000 | 6.50 | 12/01/2008 | 2,175,360 | |||||||||||||
| Chicago Midway Airport RB Series 1996 A (MBIA) (AAA/Aaa)(a) | ||||||||||||||||
| 2,500,000 | 5.50 | 01/01/2007 | 2,634,925 | |||||||||||||
| Illinois Development Finance Authority PCRB for Amerencips Series 2000 A (A/A2)(d) | ||||||||||||||||
| 2,300,000 | 5.50 | 02/28/2014 | 2,387,285 | |||||||||||||
| Illinois Educational Facilities Authority Student Housing RB for Educational Advancement Fund University Center Project Series 2002 (Baa2) | ||||||||||||||||
| 2,000,000 | 6.25 | 05/01/2030 | 2,150,340 | |||||||||||||
| 1,500,000 | 6.25 | 05/01/2034 | 1,554,090 | |||||||||||||
| Illinois State GO First Series 2002 (MBIA) (AAA/Aaa) | ||||||||||||||||
| 3,000,000 | 5.38 | 07/01/2019 | 3,289,620 | |||||||||||||
| Lake County Community Consolidated School District No. 041 GO Bonds Series 1999 A (FSA) (AAA/Aaa) | ||||||||||||||||
| 2,725,000 | 9.00 | 11/01/2016 | 3,954,602 | |||||||||||||
| $ | 23,236,062 | |||||||||||||||
| Indiana – 0.2% | ||||||||||||||||
| Indianapolis Airport Authority RB for Special Facilities Federal Express Corp. Project Series 2004 (AMT) (BBB/Baa2) | ||||||||||||||||
| $ | 640,000 | 5.10 | % | 01/15/2017 | $ | 675,181 | ||||||||||
| Iowa – 0.4% | ||||||||||||||||
| Tobacco Settlement Authority RB for Iowa Asset Backed Bonds Series 2001 B (BBB/ Baa3) | ||||||||||||||||
| $ | 1,400,000 | 5.60 | % | 06/01/2035 | $ | 1,328,068 | ||||||||||
| Kansas – 0.3% | ||||||||||||||||
| Wichita Hospital RB for Refunding and Improvement Facilities Series 2001 III (A+) | ||||||||||||||||
| $ | 1,000,000 | 5.50 | % | 11/15/2025 | $ | 1,057,370 | ||||||||||
| Kentucky – 1.9% | ||||||||||||||||
| Kentucky Economic Development Finance Authority RB for Norton Healthcare Inc. Series 2000 C (MBIA) (AAA/Aaa)(f) | ||||||||||||||||
| $ | 3,250,000 | 0.00/5.00 | % | 10/01/2018 | $ | 3,583,353 | ||||||||||
| Russell Kentucky RB for Bon Secours Health Systems Series 2000 (ETM) (AAA/A3) | ||||||||||||||||
| 3,000,000 | 5.85 | 11/15/2005 | 3,053,400 | |||||||||||||
| $ | 6,636,753 | |||||||||||||||
| Louisiana – 0.9% | ||||||||||||||||
| Louisiana State Offshore Terminal Authority Deepwater Port RB for Loop LLC Project Series 2003 C (A/A3) | ||||||||||||||||
| $ | 1,000,000 | 5.25 | % | 09/01/2015 | $ | 1,063,670 | ||||||||||
| 500,000 | 5.25 | 09/01/2016 | 528,970 | |||||||||||||
| New Orleans Levee District Public Improvement RB Series 1995 (FSA) (AAA/Aaa) | ||||||||||||||||
| 1,430,000 | 5.95 | 11/01/2015 | 1,499,055 | |||||||||||||
| $ | 3,091,695 | |||||||||||||||
| Maryland – 1.7% | ||||||||||||||||
| Anne Arundel County Special Obligation RB for Arundel Mills Project Series 2004 (AA+/Aa1) | ||||||||||||||||
| $ | 1,500,000 | 5.13 | % | 07/01/2029 | $ | 1,598,625 | ||||||||||
| Frederick County Special Tax for Lake Linganore Village Community Development Series 2001 A (Radian) (AA) | ||||||||||||||||
| 500,000 | 5.60 | 07/01/2020 | 551,745 | |||||||||||||
| 1,000,000 | 5.70 | 07/01/2029 | �� | 1,095,270 | ||||||||||||
| Maryland State Department of Transportation RB Series 2004 PA 1259 (RITES)(b) | ||||||||||||||||
| 575,000 | 10.32 | 05/01/2014 | 824,205 | |||||||||||||
25
| Principal | Interest | Maturity | ||||||||||||||
| Amount | Rate | Date | Value | |||||||||||||
Municipal Debt Obligations – (continued) | ||||||||||||||||
| Maryland – (continued) | ||||||||||||||||
| Maryland State Health & Higher Educational Facilities Authority RB for Medstar Health Series 2004 (BBB/Baa1) | ||||||||||||||||
| $ | 500,000 | 5.38 | % | 08/15/2024 | $ | 524,345 | ||||||||||
| 750,000 | 5.50 | 08/15/2033 | 790,035 | |||||||||||||
| Maryland State Health and Higher Educational Facilities Authority RB for Maryland Institute College of Art Series 2001 (Baa1) | ||||||||||||||||
| 500,000 | 5.50 | 06/01/2032 | 523,055 | |||||||||||||
| $ | 5,907,280 | |||||||||||||||
| Massachusetts – 2.9% | ||||||||||||||||
| Massachusetts Bay Transportation Authority (AAA/Aa1) | ||||||||||||||||
| $ | 1,000,000 | 5.00 | % | 07/01/2028 | $ | 1,054,020 | ||||||||||
| Massachusetts State GO Bonds for Consolidated Loan Series 2000 A (AAA/Aa2)(a) | ||||||||||||||||
| 1,000,000 | 6.00 | 02/01/2010 | 1,127,530 | |||||||||||||
| 1,000,000 | 6.00 | 02/01/2010 | 1,127,530 | |||||||||||||
| Massachusetts State GO Bonds Series 1996 D (AMBAC) (AAA/Aaa) | ||||||||||||||||
| 3,000,000 | 4.50 | 11/01/2015 | 3,077,550 | |||||||||||||
| Massachusetts State Health and Educational Facilities Authority RB for Harvard Pilgrim Health Series 1998 A (FSA) (AAA/Aaa) | ||||||||||||||||
| 3,750,000 | 5.25 | 07/01/2012 | 4,000,087 | |||||||||||||
| $ | 10,386,717 | |||||||||||||||
| Michigan – 0.9% | ||||||||||||||||
| Michigan State Hospital Finance Authority RB for Ascension Health Credit Series 1999 A (MBIA) (AAA/Aaa)(a) | ||||||||||||||||
| $ | 2,000,000 | 6.13 | % | 11/15/2009 | $ | 2,266,720 | ||||||||||
| Pontiac Tax Increment Finance Authority RB for Tax Increment Development Area No. 3 Series 2002 (ACA) (A) | ||||||||||||||||
| 1,000,000 | 5.38 | 06/01/2017 | 1,059,350 | |||||||||||||
| $ | 3,326,070 | |||||||||||||||
| Mississippi – 0.6% | ||||||||||||||||
| Mississippi Business Finance Corp. PCRB for Systems Energy Resources Inc. Project Series 1998 (BBB-/Ba1) | ||||||||||||||||
| $ | 1,950,000 | 5.88 | % | 04/01/2022 | $ | 1,970,261 | ||||||||||
| Missouri – 2.0% | ||||||||||||||||
| Cameron IDA Health Facilities RB Insured by Cameron Community Hospital Series 2000 (ACA) (A) | ||||||||||||||||
| $ | 1,800,000 | 6.25 | % | 12/01/2021 | $ | 1,974,294 | ||||||||||
| Missouri State Environmental Improvement & Energy Resource Authority RB for Kansas City Power & Light Series 1993 (BBB/ A2) | ||||||||||||||||
| 515,000 | 4.00 | 01/02/2012 | 519,779 | |||||||||||||
| Missouri State Health and Educational Facilities Authority RB for St. Lukes Episcopal-Presbyterian Hospital Series 2001 (FSA) (AAA/Aaa) | ||||||||||||||||
| 1,000,000 | 5.50 | 12/01/2015 | 1,107,410 | |||||||||||||
| Truman State University Housing System RB Series 2004 (AMBAC) (Aaa) | ||||||||||||||||
| 3,340,000 | 5.00 | 06/01/2030 | 3,488,697 | |||||||||||||
| $ | 7,090,180 | |||||||||||||||
| Montana(d) – 0.3% | ||||||||||||||||
| Forsyth Montana PCRB Refunding Portland General Series 1998 A-RMKT 5/1/03 (BBB+/Baa2) | ||||||||||||||||
| $ | 1,000,000 | 5.20 | % | 05/01/2009 | $ | 1,055,950 | ||||||||||
| Nevada – 2.3% | ||||||||||||||||
| Clark County Industrial Development RB for Southwest Gas Corp. Project Series 2003 C (BBB-/Baa2)(d) | ||||||||||||||||
| $ | 765,000 | 5.45 | % | 03/01/2013 | $ | 816,599 | ||||||||||
| Las Vegas New Convention and Visitors Authority RB Series 1999 (AMBAC) (AAA/Aaa)(a) | ||||||||||||||||
| 2,500,000 | 6.00 | 07/01/2009 | 2,813,125 | |||||||||||||
| Nevada Department of Business and Industry RB for Las Vegas Monorail Project 1st Tier Series 2000 (AMBAC) (AAA/Aaa) | ||||||||||||||||
| 2,500,000 | 5.63 | 01/01/2032 | 2,760,100 | |||||||||||||
| Washoe County GO Bonds for Reno Sparks Convention Series 2000 A (FSA) (AAA/Aaa)(a) | ||||||||||||||||
| 1,585,000 | 6.38 | 01/01/2010 | 1,810,688 | |||||||||||||
| $ | 8,200,512 | |||||||||||||||
| New Hampshire – 0.6% | ||||||||||||||||
| New Hampshire Health & Educational Facilities Authority RB for Southern New Hampshire Medical Center Series 2004 A (Radian) (AA) | ||||||||||||||||
| $ | 100,000 | 5.00 | % | 10/01/2013 | $ | 107,299 | ||||||||||
| 200,000 | 5.00 | 10/01/2015 | 214,250 | |||||||||||||
| 100,000 | 5.00 | 10/01/2018 | 104,735 | |||||||||||||
| New Hampshire Health and Educational Facilities Authority RB for Healthcare Systems Covenant Health Series 2002 (A-) | ||||||||||||||||
| 500,000 | 6.00 | 07/01/2022 | 547,025 | |||||||||||||
| New Hampshire Municipal Bond Bank RB Series 2003 (MBIA) (AAA/Aaa) | ||||||||||||||||
| 1,000,000 | 5.25 | 08/15/2019 | 1,113,400 | |||||||||||||
| $ | 2,086,709 | |||||||||||||||
| New Jersey – 4.4% | ||||||||||||||||
| New Jersey Economic Development Authority RB for Cigarette Tax Series 2004 (Radian) (AA/Aa3) | ||||||||||||||||
| $ | 1,085,000 | 5.50 | % | 06/15/2016 | $ | 1,204,090 | ||||||||||
| New Jersey Health Care Facilities Financing Authority RB for Palisades Medical Center of New York Healthcare Series 2002 (BBB-/Baa3) | ||||||||||||||||
| 500,000 | 6.50 | 07/01/2021 | 537,810 | |||||||||||||
| New Jersey State Educational Facilities Authority RB for Fairleigh Dickinson University Series 2002 D (ACA) (A) | ||||||||||||||||
| 625,000 | 5.25 | 07/01/2032 | 642,062 | |||||||||||||
| New Jersey State GO Bonds Refunding Series 1999 F (AA-/Aa3) | ||||||||||||||||
| 1,000,000 | 5.50 | 08/01/2011 | 1,120,730 | |||||||||||||
| New Jersey State Transportation Trust Fund Authority RB for Transportation System Series 2003 C (AAA/Aaa)(a) | ||||||||||||||||
| 1,000,000 | 5.50 | 06/15/2013 | 1,147,780 | |||||||||||||
| 2,000,000 | 5.50 | 06/15/2013 | 2,295,560 | |||||||||||||
| Tobacco Settlement Financing Corp. RB for New Jersey Asset Backed Bonds Series 2002 (BBB/ Baa3) | ||||||||||||||||
| 1,000,000 | 5.75 | 06/01/2032 | 999,270 | |||||||||||||
| 2,370,000 | 6.00 | 06/01/2037 | 2,368,246 | |||||||||||||
| Tobacco Settlement Financing Corp. RB Series 2003 (BBB/Baa3) | ||||||||||||||||
| 300,000 | 6.75 | 06/01/2039 | 317,976 | |||||||||||||
| University of Medicine & Dentistry of New Jersey COPS Series 2004 (MBIA) (AAA/Aaa) | ||||||||||||||||
| 5,000,000 | 5.00 | 06/15/2036 | 5,215,400 | |||||||||||||
| $ | 15,848,924 | |||||||||||||||
26
| Principal | Interest | Maturity | ||||||||||||||
| Amount | Rate | Date | Value | |||||||||||||
Municipal Debt Obligations – (continued) | ||||||||||||||||
| New Mexico – 1.9% | ||||||||||||||||
| Farmington PCRB for Southern California Edison Co. Series 1993 A (MBIA) (AAA/Aaa) | ||||||||||||||||
| $ | 3,000,000 | 5.88 | % | 06/01/2023 | $ | 3,008,130 | ||||||||||
| Farmington PCRB Public Service Co. New Mexico Series 1997 D (BBB/ Baa2) | ||||||||||||||||
| 3,530,000 | 6.38 | 04/01/2022 | 3,807,705 | |||||||||||||
| $ | 6,815,835 | |||||||||||||||
| New York – 5.9% | ||||||||||||||||
| Brookhaven New York GO Bonds Series 1995 (FGIC) (AAA/Aaa) | ||||||||||||||||
| $ | 500,000 | 5.50 | % | 10/01/2013 | $ | 528,980 | ||||||||||
| Metropolitan Transportation Authority RB for Refunding Transportation Series 2002 F (MBIA) (AAA/Aaa) | ||||||||||||||||
| 1,000,000 | 5.25 | 11/15/2027 | 1,075,190 | |||||||||||||
| Metropolitan Transportation Authority RB Series 2002 PA 1027 (RITES) (AMBAC)(b) | ||||||||||||||||
| 1,000,000 | 7.78 | 11/15/2015 | 1,257,120 | |||||||||||||
| New York City GO Bonds Prerefunded Series 1996 G (A/A1)(a) | ||||||||||||||||
| 3,900,000 | 5.75 | 02/01/2006 | 4,046,874 | |||||||||||||
| New York City GO Bonds Series 1997 C (MBIA-IBC) (AAA/Aaa) | ||||||||||||||||
| 1,000,000 | 5.38 | 11/15/2017 | 1,056,420 | |||||||||||||
| New York City IDA Civic Facility RB for Polytechnical University Project Series 2000 (BB+/Ba3) | ||||||||||||||||
| 1,250,000 | 6.00 | 11/01/2020 | 1,257,350 | |||||||||||||
| New York City Transitional Finance Authority RB for Future Tax Secured Series 2002 C (FGIC) (AAA/Aaa) | ||||||||||||||||
| 1,000,000 | 5.25 | 08/01/2014 | 1,106,990 | |||||||||||||
| New York City Transitional Finance Authority RB Series 2002 R PA 1043 (RITES) (AAA)(b) | ||||||||||||||||
| 1,000,000 | 7.78 | 11/01/2026 | 1,214,580 | |||||||||||||
| New York State Dormitory Authority RB for Montefiore Hospital Series 2004 (FGIC, FHA) (AAA/Aaa) | ||||||||||||||||
| 2,500,000 | 5.00 | 08/01/2029 | 2,613,600 | |||||||||||||
| New York State Dormitory Authority RB for North Shore University Hospital Series 1998 (MBIA) (AAA/Aaa) | ||||||||||||||||
| 1,500,000 | 5.50 | 11/01/2014 | 1,732,635 | |||||||||||||
| New York State Environmental Facilities Corp. State Clean Water & Drinking RB for Revolving Funds Pooled Funding Program Series 2002 F (AAA/Aaa) | ||||||||||||||||
| 500,000 | 5.25 | 11/15/2020 | 546,405 | |||||||||||||
| New York State GO Bonds Refunding Series 1998 F (AA/A1) | ||||||||||||||||
| 500,000 | 5.25 | 09/15/2013 | 537,415 | |||||||||||||
| Tobacco Settlement Financing Corp. RB for New York Asset Backed Bonds Series 2003 A-1 (AA-/A2) | ||||||||||||||||
| 2,600,000 | 5.50 | 06/01/2019 | 2,895,230 | |||||||||||||
| Triborough Bridge & Tunnel Authority RB for General Purpose Series 1999 A (AAA/Aa2)(a) | ||||||||||||||||
| 1,000,000 | 5.25 | 07/01/2009 | 1,093,780 | |||||||||||||
| $ | 20,962,569 | |||||||||||||||
| North Carolina – 3.0% | ||||||||||||||||
| Charlotte North Carolina Water & Sewer System RB Series 2001 (AAA/Aa1) | ||||||||||||||||
| $ | 1,000,000 | 5.13 | % | 06/01/2026 | $ | 1,062,370 | ||||||||||
| North Carolina Capital Facilities Finance Agency RB for Duke University Project Series 2002 A (AA+/Aa1) | ||||||||||||||||
| 2,000,000 | 5.13 | 07/01/2042 | 2,088,180 | |||||||||||||
| North Carolina Eastern Municipal Power Agency Power System RB Series 2003 C (BBB/Baa2) | ||||||||||||||||
| 500,000 | 5.38 | 01/01/2016 | 532,375 | |||||||||||||
| 850,000 | 5.38 | 01/01/2017 | 906,176 | |||||||||||||
| North Carolina Eastern Municipal Power Agency Power System RB Series 2003 D (BBB/ Baa2) | ||||||||||||||||
| 600,000 | 5.13 | 01/01/2023 | 617,760 | |||||||||||||
| North Carolina Medical Care Community Hospital RB for Northeast Medical Center Project Series 2000 (AMBAC) (AAA/Aaa) | ||||||||||||||||
| 3,000,000 | 5.50 | 11/01/2025 | 3,262,590 | |||||||||||||
| North Carolina Municipal Power Agency No. 1 Catawba Electric RB Series 2003 A (BBB+/A3) | ||||||||||||||||
| 450,000 | 5.50 | 01/01/2013 | 499,446 | |||||||||||||
| Winston-Salem North Carolina Water & Sewer Systems RB Refunding Series 2001 (AAA/Aa2)(a) | ||||||||||||||||
| 1,500,000 | 5.25 | 06/01/2011 | 1,680,000 | |||||||||||||
| $ | 10,648,897 | |||||||||||||||
| Ohio – 0.6% | ||||||||||||||||
| Cleveland Cuyahoga County Port Authority RB for Rock and Roll Hall of Fame Series 1997 (ETM) | ||||||||||||||||
| $ | 600,000 | 5.45 | % | 12/01/2005 | $ | 609,858 | ||||||||||
| Ohio State Building Authority RB Refunding for State Facilities Adult Correction Series 2001 A (FSA) (AAA/Aaa) | ||||||||||||||||
| 1,000,000 | 5.50 | 10/01/2013 | 1,118,760 | |||||||||||||
| Pickerington Local School District GO Bonds for School Facilities Construction & Improvement Series 2001 (FGIC) (AAA/Aaa) | ||||||||||||||||
| 500,000 | 5.25 | 12/01/2020 | 544,240 | |||||||||||||
| $ | 2,272,858 | |||||||||||||||
| Oregon – 0.6% | ||||||||||||||||
| Klamath Falls Intermediate Community Hospital Authority RB for Merle West Medical Center Project Series 2002 (BBB) | ||||||||||||||||
| $ | 2,000,000 | 6.13 | % | 09/01/2022 | $ | 2,133,280 | ||||||||||
| Pennsylvania – 1.1% | ||||||||||||||||
| Montgomery County Higher Education & Health Authority RB for Catholic Health Systems East Series 2004 C (A/A2) | ||||||||||||||||
| $ | 150,000 | 5.38 | % | 11/15/2034 | $ | 157,234 | ||||||||||
| Pennsylvania Economic Development Financing Authority Exempt Facilities RB for Amtrak Project Series 2001 A (AMT) (BBB/A3) | ||||||||||||||||
| 2,000,000 | 6.25 | 11/01/2031 | 2,077,860 | |||||||||||||
| Pennsylvania Intergovernmental Cooperative Authority Special Tax Revenue Refunding for Philadelphia Funding Program Series 1999 (FGIC) (AAA/Aaa) | ||||||||||||||||
| 1,000,000 | 5.25 | 06/15/2015 | 1,071,560 | |||||||||||||
| Pennsylvania State Higher Educational Facilities Authority RB for Philadelphia University Series 2004 A (BBB/Baa2) | ||||||||||||||||
| 400,000 | 5.25 | 06/01/2032 | 408,672 | |||||||||||||
| St. Mary Hospital Authority RB for Catholic Health East Series 2004 B (A/A2) | ||||||||||||||||
| 225,000 | 5.38 | 11/15/2034 | 235,852 | |||||||||||||
| $ | 3,951,178 | |||||||||||||||
| Puerto Rico – 0.7% | ||||||||||||||||
| Puerto Rico Commonwealth Highway and Transportation Authority RB Series 1996 Y (XLCA) (AAA/Aaa) | ||||||||||||||||
| $ | 2,500,000 | 5.00 | % | 07/01/2036 | $ | 2,667,375 | ||||||||||
27
| Principal | Interest | Maturity | ||||||||||||||
| Amount | Rate | Date | Value | |||||||||||||
Municipal Debt Obligations – (continued) | ||||||||||||||||
| South Carolina – 3.2% | ||||||||||||||||
| Grand Strand Water & Sewer Authority South Carolina Waterworks & Sewer Systems RB Series 2001 (FSA) (AAA/Aaa) | ||||||||||||||||
| $ | 5,000,000 | 5.00 | % | 06/01/2031 | $ | 5,195,950 | ||||||||||
| Greenville County School District Installment Purpose Refunding RB for Building Equity Sooner Tomorrow Series 2002 (AA-/Aa3) | ||||||||||||||||
| 1,000,000 | 6.00 | 12/01/2021 | 1,133,460 | |||||||||||||
| Lancaster County School District GO Bonds Series 1999 (FSA) (AAA/Aaa) | ||||||||||||||||
| 1,000,000 | 5.10 | 03/01/2015 | 1,075,180 | |||||||||||||
| Medical University Hospital Authority RB for Hospital Facilities Series 2004 A (MBIA, FHA) (AAA/Aaa) | ||||||||||||||||
| 4,000,000 | 5.00 | 08/15/2031 | 4,150,080 | |||||||||||||
| $ | 11,554,670 | |||||||||||||||
| Tennessee – 3.3% | ||||||||||||||||
| Elizabethton Health and Educational Board RB First Mortgage Series 2000 B (MBIA) (AAA/Aaa) | ||||||||||||||||
| $ | 2,000,000 | 6.25 | % | 07/01/2015 | $ | 2,396,560 | ||||||||||
| Hallsdale Powell Utility District RB for Knox County Water & Sewer Improvement Series 2004 B (FGIC) (AAA/Aaa) | ||||||||||||||||
| 1,260,000 | 5.00 | 04/01/2034 | 1,311,698 | |||||||||||||
| Johnson City Health and Educational Facilities Board Hospital for Mountain States Health RB First Mortgage Series 2000 A (MBIA) (AAA/Aaa) | ||||||||||||||||
| 3,000,000 | 6.25 | 07/01/2016 | 3,629,700 | |||||||||||||
| McMinnville Housing Authority RB First Mortgage for Beersheba Heights Tower Series 1997 (A2) | ||||||||||||||||
| 695,000 | 6.00 | 10/01/2009 | 729,604 | |||||||||||||
| Shelby County Health Educational & Housing Facilities Board RB PA 1277 A (RITES) (AA)(b)(d) | ||||||||||||||||
| 810,000 | 10.42 | 10/01/2008 | 963,706 | |||||||||||||
| Shelby County Health Educational & Housing Facilities Board RB PA 1277 B (RITES) (AA)(b) | ||||||||||||||||
| 120,000 | 10.42 | 09/01/2008 | 144,547 | |||||||||||||
| Sullivan County Health Educational and Housing Facilities Board RB for Wellmont Health Systems Project Series 2002 (BBB+) | ||||||||||||||||
| 300,000 | 5.25 | 09/01/2005 | 301,812 | |||||||||||||
| Tennessee Housing Development Agency RB for Homeownership Program 1 Series 2000 (AMT) (AA/Aa2) | ||||||||||||||||
| 2,130,000 | 5.85 | 07/01/2011 | 2,249,642 | |||||||||||||
| $ | 11,727,269 | |||||||||||||||
| Texas – 6.3% | ||||||||||||||||
| Brazos River Authority PCRB for Texas Utility Co. Series 1999 A (AMT) (BBB/ Baa2) | ||||||||||||||||
| $ | 700,000 | 7.70 | % | 04/01/2033 | $ | 824,796 | ||||||||||
| Brazos River Authority PCRB for TXU Electric Co. Project Series 1999 C (AMT) (BBB/Baa2) | ||||||||||||||||
| 1,200,000 | 7.70 | 03/01/2032 | 1,413,936 | |||||||||||||
| Brazos River Authority PCRB for TXU Electric Co. Project Series 2001 C (AMT) (BBB/Baa2)(d) | ||||||||||||||||
| 790,000 | 5.75 | 11/01/2011 | 855,570 | |||||||||||||
| Brazos River Authority RB for Reliant Energy Inc. Project Series 1999 A (BBB-/Ba2) | ||||||||||||||||
| 1,250,000 | 5.38 | 04/01/2019 | 1,280,175 | |||||||||||||
| Fort Bend County Municipal Utilities District No. 30 GO Bonds Series 2004 (FSA) (AAA/Aaa) | ||||||||||||||||
| 2,015,000 | 5.75 | 09/01/2027 | 2,266,794 | |||||||||||||
| Frisco Independent School District GO Bonds Series 2002 (PSF-GTD) (Aaa) | ||||||||||||||||
| 1,000,000 | 5.13 | 08/15/2030 | 1,046,580 | |||||||||||||
| Grand Prairie Independent School District GO Bonds Series 2003 (FSA) (AAA/Aaa) | ||||||||||||||||
| 1,000,000 | 5.38 | 02/15/2018 | 1,109,430 | |||||||||||||
| Gregg County Health Facilities Development Corp. RB for Good Shepherd Medical Center Project Series 2000 (Radian) (AA) | ||||||||||||||||
| 3,000,000 | 6.38 | 10/01/2025 | 3,387,810 | |||||||||||||
| Gulf Coast Waste Disposal Authority Texwaste Disposal RB for Valero Energy Corp. Project Series 2001 (AMT) (BBB-/Baa3) | ||||||||||||||||
| 1,000,000 | 6.65 | 04/01/2032 | 1,090,390 | |||||||||||||
| Harris County Hospital District RB (MBIA) (AAA/Aaa) | ||||||||||||||||
| 2,050,000 | 6.00 | 02/15/2016 | 2,308,690 | |||||||||||||
| Hidalgo County Health Services RB for Mission Hospital Inc. Project Series 2005 (BBB/Baa2) | ||||||||||||||||
| 700,000 | 5.00 | 08/15/2019 | 711,893 | |||||||||||||
| Mesquite Independent School District GO Bonds Refunding Series 2002 (PSF-GTD) (AAA) | ||||||||||||||||
| 1,160,000 | 5.50 | 08/15/2021 | 1,282,774 | |||||||||||||
| Metropolitan Health Facilities Development Corp. RB for Wilson N. Jones Memorial Hospital Project Series 2001 (B1) | ||||||||||||||||
| 1,300,000 | 6.63 | 01/01/2011 | 1,309,087 | |||||||||||||
| University of Texas RB for Fing System Series 2003 B (AAA/Aaa) | ||||||||||||||||
| 1,000,000 | 5.25 | 08/15/2020 | 1,089,520 | |||||||||||||
| Waxahachie Independent School District GO Bonds Capital Appreciating Prerefunded Series 2000 (PSF-GTD) (Aaa)(a)(c) | ||||||||||||||||
| 1,775,000 | 0.00 | 08/15/2010 | 1,235,081 | |||||||||||||
| Waxahachie Independent School District GO Bonds Capital Appreciating Unrefunded Balance Series 2000 (PSF-GTD) (Aaa)(c) | ||||||||||||||||
| 80,000 | 0.00 | 08/15/2013 | 57,632 | |||||||||||||
| Williamson County GO Bonds for Road Series 2002 (FSA) (AAA/Aaa) | ||||||||||||||||
| 1,040,000 | 5.25 | 02/15/2027 | 1,103,783 | |||||||||||||
| $ | 22,373,941 | |||||||||||||||
| U.S. Virgin Islands – 0.3% | ||||||||||||||||
| Virgin Islands Public Finance Authority RB for Senior Lien Matching Fund Loan Note Series 2004 A (BBB) | ||||||||||||||||
| $ | 500,000 | 5.00 | % | 10/01/2014 | $ | 542,130 | ||||||||||
| 500,000 | 5.25 | 10/01/2016 | 545,310 | |||||||||||||
| $ | 1,087,440 | |||||||||||||||
| Utah – 0.6% | ||||||||||||||||
| Tooele County Hazardous Waste Treatment RB for Union Pacific Project Series 1992 A (AMT) (BBB/Baa2) | ||||||||||||||||
| $ | 2,000,000 | 5.70 | % | 11/01/2026 | $ | 2,088,740 | ||||||||||
| Vermont – 0.6% | ||||||||||||||||
| Vermont State Student Assistance Corp. Education Loan RB for Finance Program Series 1993 D (AMT) (FSA) (AAA/Aaa) | ||||||||||||||||
| $ | 2,000,000 | 9.50 | % | 12/15/2005 | $ | 2,070,860 | ||||||||||
28
| Principal | Interest | Maturity | ||||||||||||||
| Amount | Rate | Date | Value | |||||||||||||
Municipal Debt Obligations – (continued) | ||||||||||||||||
| Virginia – 1.1% | ||||||||||||||||
| Bristol Virginia Utilities System RB Refunding Series 2003 (MBIA) (AAA/Aaa) | ||||||||||||||||
| $ | 1,850,000 | 5.25 | % | 07/15/2026 | $ | 1,991,396 | ||||||||||
| Chesapeake IDA PCRB for Virginia Project Series 1985 (BBB+/A3) | ||||||||||||||||
| 750,000 | 5.25 | 02/01/2008 | 766,140 | |||||||||||||
| Virginia Commonwealth Transportation Board RB for Northern Virginia Transportation District Program Series 1999 A (AA+/Aa1)(a) | ||||||||||||||||
| 1,000,000 | 5.50 | 05/15/2009 | 1,105,110 | |||||||||||||
| $ | 3,862,646 | |||||||||||||||
| Washington – 5.2% | ||||||||||||||||
| Chelan County Public Utilities District No. 001 RB for Chelan Hydro Project Series 1997 D (AMT) (MBIA) (AAA/Aaa) | ||||||||||||||||
| $ | 2,500,000 | 6.35 | % | 07/01/2028 | $ | 2,685,525 | ||||||||||
| King County Sewer RB Series 1999-2 (FGIC) (AAA/Aaa)(a) | ||||||||||||||||
| 3,965,000 | 6.25 | 01/01/2009 | 4,451,030 | |||||||||||||
| Tacoma Washington GO Bonds Series 2004 (MBIA) (AAA/Aaa) | ||||||||||||||||
| 4,000,000 | 5.00 | 12/01/2030 | 4,188,920 | |||||||||||||
| Vancouver Downtown Redevelopment Authority RB for Conference Center Project Series 2003 A (ACA) (A) | ||||||||||||||||
| 3,025,000 | 6.00 | 01/01/2034 | 3,290,655 | |||||||||||||
| Washington Housing Finance Commission RB for Single Family Program Series 2000 5-NR (FNMA, FHLMC, GNMA) (Aaa) | ||||||||||||||||
| 345,000 | 5.70 | 06/01/2016 | 356,316 | |||||||||||||
| Washington Public Power Supply System RB for Nuclear Project No. 2 Series 1996 A (AMBAC) (AAA/Aaa) | ||||||||||||||||
| 2,500,000 | 5.70 | 07/01/2011 | 2,626,825 | |||||||||||||
| Washington State GO Bonds Series 2000 B (AA/Aa1)(a) | ||||||||||||||||
| 1,000,000 | 6.00 | 01/01/2010 | 1,122,080 | |||||||||||||
| $ | 18,721,351 | |||||||||||||||
| West Virginia – 0.3% | ||||||||||||||||
| West Virginia State GO Bonds for State Road Series 2000 (FGIC) (AAA/Aaa) | ||||||||||||||||
| $ | 1,000,000 | 5.63 | % | 06/01/2018 | $ | 1,109,340 | ||||||||||
| Wisconsin – 2.0% | ||||||||||||||||
| Badger Tobacco Asset Securitization Corp. RB Asset Backed Bonds Series 2002 (BBB/ Baa3) | ||||||||||||||||
| $ | 1,000,000 | 6.38 | % | 06/01/2032 | $ | 1,021,210 | ||||||||||
| Wisconsin State GO Bonds Series 1999 C (AA-/Aa3)(a) | ||||||||||||||||
| 5,380,000 | 6.25 | 05/01/2010 | 6,166,179 | |||||||||||||
| $ | 7,187,389 | |||||||||||||||
| TOTAL MUNICIPAL DEBT OBLIGATIONS | ||||||||||||||||
| (Cost $321,802,402) | $ | 345,349,658 | ||||||||||||||
Other Municipals(d)(e) – 1.3% | ||||||||||||||||
| GMAC Municipal Mortgage Trust Series A (A3) | ||||||||||||||||
| $ | 525,000 | 4.15 | % | 10/31/2009 | $ | 523,294 | ||||||||||
| GMAC Municipal Mortgage Trust Series A-1 (A3) | ||||||||||||||||
| 375,000 | 4.90 | 10/31/2014 | 377,261 | |||||||||||||
| GMAC Municipal Mortgage Trust Series A-2 (A3) | ||||||||||||||||
| 1,350,000 | 5.30 | 10/31/2019 | 1,363,622 | |||||||||||||
| GMAC Municipal Mortgage Trust Series B (BAA1) | ||||||||||||||||
| 1,350,000 | 5.60 | 10/31/2019 | 1,390,594 | |||||||||||||
| Municipal Mortgage & Equity LLC RB for 1999 A Tax-Exempt MF Hsg. Certificates Series 1999 | ||||||||||||||||
| 1,000,000 | 4.95 | 08/15/2005 | 1,004,460 | |||||||||||||
| TOTAL OTHER MUNICIPALS | ||||||||||||||||
| (Cost $4,600,000) | $ | 4,659,231 | ||||||||||||||
| TOTAL INVESTMENTS – 98.0% | ||||||||||||||||
| (Cost $326,402,402) | $ | 350,008,889 | ||||||||||||||
| The percentage shown for each investment category reflects the value of investments in that category as a percentage of net assets. | ||||
| (a) | Pre-Refunded security. Maturity date disclosed is prerefunding date. | |||
| (b) | Inverse variable rate security. Interest rate disclosed is that which is in effect at April 30, 2005. | |||
| (c) | Security issued with a zero coupon. Income is recognized through the accretion of discount. | |||
| (d) | Securities with “Put” features with resetting interest rates. Maturity dates disclosed are the next interest reset dates. | |||
| (e) | Securities are exempt from registration under Rule 144A of the Securities Act of 1933. Under procedures approved by the Board of Trustees, such securities have been determined to be liquid by the Investment Adviser and may be resold, normally to qualified institutional buyers in transactions exempt from registration. Total market value of Rule 144A securities amounts to $5,672,531, which represents approximately 1.6% of net assets as of April 30, 2005. | |||
| (f) | This security is issued with a zero coupon rate which increases to the stated rate at a set date in the future. | |||
| Investment Abbreviations: | ||||||
| ACA | — | Insured by American Capital Access | ||||
| AMBAC | — | Insured by American Municipal Bond Assurance Corp. | ||||
| AMT | — | Alternative Minimum Tax | ||||
| COPS | — | Certificates of Participation | ||||
| CRA | — | Community Reinvestment Act | ||||
| ETM | — | Escrow to Maturity | ||||
| FGIC | — | Insured by Financial Guaranty Insurance Co. | ||||
| FHA | — | Insured by Federal Housing Administration | ||||
| FHLMC | — | Insured by Federal Home Loan Mortgage Corp. | ||||
| FNMA | — | Insured by Federal National Mortgage Association | ||||
| FSA | — | Insured by Financial Security Assurance Co. | ||||
| GNMA | — | Insured by Government National Mortgage Association | ||||
| GO | — | General Obligation | ||||
| IDA | — | Industrial Development Authority | ||||
| LIBOR | — | London Inter-Bank Offered Rate | ||||
| LOC | — | Letter of Credit | ||||
| MBIA | — | Insured by Municipal Bond Investors Assurance | ||||
| MBIA-IBC | — | Insured by Municipal Bond Investors Assurance-Insured Bond Certificates | ||||
| MF Hsg. | — | Multi-Family Housing | ||||
| PCRB | — | Pollution Control Revenue Bond | ||||
| PSF-GTD | — | Guaranteed by Permanent School Fund | ||||
| Radian | — | Insured by Radian Asset Assurance | ||||
| RB | — | Revenue Bond | ||||
| RITES | — | Residual Interest Tax Exempt Securities | ||||
| RMKT | — | Remarketed | ||||
| XLCA | — | Insured by XL Capital Assurance | ||||
| Security ratings disclosed, if any, are issued by Standard & Poor’s/ Moody’s Investors Service. A brief description of the ratings is available in the Fund’s Statement of Additional Information. |
29
Statement of Investments (continued)
| ADDITIONAL INVESTMENT INFORMATION |
SWAP CONTRACTS �� At April 30, 2005, the Fund had outstanding swap contracts with the following terms:
| Rate Type | ||||||||||||||||||||
| Notional | Payments | |||||||||||||||||||
| Amount | Termination | Made by | Payments Received | Unrealized | ||||||||||||||||
| Swap Type | Swap Counterparty | (000s) | Date | the Fund | by the Fund | Loss | ||||||||||||||
Interest Rate | Salomon Smith Barney | $ | 5,000 | 02/23/2025 | 5.05 | % | 3 month LIBOR Floating | $ | (71,320 | ) | ||||||||||
Interest Rate | Merrill Lynch | 5,000 | 05/18/2025 | 4.95 | % | 3 month LIBOR Floating | (773 | ) | ||||||||||||
TOTAL | $ | (72,093 | ) | |||||||||||||||||
30
| Principal | Interest | Maturity | ||||||||||||
| Amount | Rate | Date | Value | |||||||||||
Municipal Debt Obligations – 94.7% | ||||||||||||||
| Alabama – 0.1% | ||||||||||||||
| Butler Industrial Development Board Solid Waste Disposal RB for Georgia Pacific Corp. Project Series 2004 (AMT) (BB+) | ||||||||||||||
| $ | 5,000,000 | 5.75 | % | 09/01/2028 | $ | 5,063,450 | ||||||||
| Alaska – 0.5% | ||||||||||||||
| Alaska State Housing Finance Corp. RB for General Mortgage Series 1997 A (MBIA) (AAA/Aaa) | ||||||||||||||
| $ | 5,000,000 | 6.00 | % | 06/01/2027 | $ | 5,207,550 | ||||||||
| Northern Tobacco Securitization Corp. RB for Alaska Asset Backed Bonds Series 2001 (BBB/Baa3) | ||||||||||||||
| 8,690,000 | 5.50 | 06/01/2029 | 8,463,712 | |||||||||||
| Northern Tobacco Securitization Corporate Settlement RB for Asset Backed Bonds Series 2000 (BBB/Baa3) | ||||||||||||||
| 5,000,000 | 6.20 | 06/01/2022 | 5,117,800 | |||||||||||
| $ | 18,789,062 | |||||||||||||
| Arizona – 0.9% | ||||||||||||||
| Apache County IDA PCRB for Tuscon Electric Power Co. Project Series 1998 A (B+/Ba1) | ||||||||||||||
| $ | 5,000,000 | 5.85 | % | 03/01/2028 | $ | 5,004,850 | ||||||||
| Apache County IDA PCRB for Tuscon Electric Power Co. Project Series 1998 B (B+/Ba1) | ||||||||||||||
| 5,000,000 | 5.88 | 03/01/2033 | 5,003,300 | |||||||||||
| Coconino County PCRB for Nevada Power Co. Project Series 1995 E (B-) | ||||||||||||||
| 1,500,000 | 5.35 | 10/01/2022 | 1,489,455 | |||||||||||
| Coconino County PCRB for Nevada Power Co. Series 1997 B (AMT) (B-) | ||||||||||||||
| 2,500,000 | 5.80 | 11/01/2032 | 2,500,575 | |||||||||||
| Maricopa County PCRB for El Paso Electric Co. RMTK- 8/24/00 Series 1985 A (BBB-/Baa3)(a) | ||||||||||||||
| 8,000,000 | 6.38 | 08/01/2005 | 8,071,280 | |||||||||||
| Maricopa County PCRB for Public Service Palo Verde Series 2003 A (BBB/Baa2)(a) | ||||||||||||||
| 4,000,000 | 4.00 | 07/01/2009 | 4,038,000 | |||||||||||
| Maricopa County PCRB for Southern California Edison Co. Series 2000 A (BBB+/A3)(a) | ||||||||||||||
| 2,250,000 | 2.90 | 03/02/2009 | 2,190,150 | |||||||||||
| Pima County IDA RB for Tuscon Electric Power Co. Project Series 1997 B (B+/Ba1) | ||||||||||||||
| 6,000,000 | 6.00 | 09/01/2029 | 6,008,460 | |||||||||||
| University Medical Center Corp. RB Series 2004 (BBB+/A3) | ||||||||||||||
| 2,150,000 | 5.00 | 07/01/2024 | 2,211,941 | |||||||||||
| Yavapai County IDA Hospital Facilities RB for Regional Medical Center 2003 A (Baa2) | ||||||||||||||
| 1,250,000 | 6.00 | 08/01/2033 | 1,332,613 | |||||||||||
| $ | 37,850,624 | |||||||||||||
| Arkansas – 0.3% | ||||||||||||||
| Independence County PCRB Refunding for Entergy Ark Inc. Project Series 2005 (A-/Baa1) | ||||||||||||||
| $ | 10,730,000 | 5.00 | % | 01/01/2021 | $ | 10,949,106 | ||||||||
| Little River County RB for Georgia Pacific Corp. Project Series 1998 (AMT) (Ba3) | ||||||||||||||
| 3,010,000 | 5.60 | % | 10/01/2026 | 3,008,104 | ||||||||||
| $ | 13,957,210 | |||||||||||||
| California – 11.1% | ||||||||||||||
| Abag Finance Authority for Nonprofit Corps. Community Facilities District Special Tax No. 2004-2 Windemere Ranch Series 2004 | ||||||||||||||
| $ | 3,855,000 | 6.00 | % | 09/01/2027 | $ | 4,100,795 | ||||||||
| 4,900,000 | 6.00 | 09/01/2034 | 5,219,872 | |||||||||||
| Abag Finance Authority RB for Non-Profit Corps. Samsum-Santa Barbara Series 2002 A (A) | ||||||||||||||
| 2,000,000 | 5.50 | 04/01/2021 | 2,130,980 | |||||||||||
| 2,750,000 | 5.60 | 04/01/2026 | 2,902,735 | |||||||||||
| Brentwood California Infrastructure Refunding Authority RB CIFP Series 2004-1 | ||||||||||||||
| 1,350,000 | 5.75 | 09/02/2024 | 1,391,715 | |||||||||||
| 2,200,000 | 5.80 | 09/02/2028 | 2,267,892 | |||||||||||
| 2,500,000 | 5.88 | 09/02/2034 | 2,577,425 | |||||||||||
| California County Tobacco Securitization Agency RB for Alameda County Asset Backed Bonds Series 2002 (Baa3) | ||||||||||||||
| 555,000 | 5.75 | 06/01/2029 | 556,837 | |||||||||||
| California County Tobacco Securitization Agency RB for Fresno County Funding Corp Asset Backed Bonds Series 2002 (BBB/Baa3) | ||||||||||||||
| 385,000 | 6.00 | 06/01/2035 | 385,816 | |||||||||||
| California Department Water Resources Power Supply RB for Drivers Series 2002 310 (AMBAC) (RITES) (AAA)(b) | ||||||||||||||
| 5,000,000 | 7.70 | 05/01/2014 | 6,262,900 | |||||||||||
| California Educational Facilities Authority RB for Dominican University Series 2001 (Baa3) | ||||||||||||||
| 1,445,000 | 5.75 | 12/01/2030 | 1,500,777 | |||||||||||
| California Educational Facilities Authority RB for Golden Gate University Series 2005 (Baa3) | ||||||||||||||
| 2,000,000 | 5.00 | 10/01/2036 | 1,996,760 | |||||||||||
| California Educational Facilities Authority RB for Pepperdine University Series 2000 (A-1) | ||||||||||||||
| 6,000,000 | 5.75 | 09/15/2030 | 6,523,920 | |||||||||||
| California Financing Authority PCRB for Drivers Series 2004 475 (AMT) (FGIC) (Aaa)(a)(b) | ||||||||||||||
| 7,500,000 | 7.67 | 06/01/2007 | 7,535,100 | |||||||||||
| California PCRB Financing Authority Solid Waste Disposal for Waste Management Inc. Project Series 2005 A-1 (AMT) (BBB)(a) | ||||||||||||||
| 4,000,000 | 4.70 | 04/01/2012 | 4,100,240 | |||||||||||
| California Special Districts Association Finance Corp. COPS for Special Districts Finance Program Series 2005 RR (XLCA) (AAA) | ||||||||||||||
| 500,000 | 5.00 | 08/01/2025 | 524,065 | |||||||||||
| 1,000,000 | 5.00 | 08/01/2035 | 1,035,620 | |||||||||||
| California State Department Water Resources Power Supply RB Series 2003 PA 1152 R (FSA) (RITES)(b) | ||||||||||||||
| 18,250,000 | 7.29 | 05/01/2011 | 22,279,235 | |||||||||||
31
April 30, 2005 (Unaudited)
| Principal | Interest | Maturity | ||||||||||||
| Amount | Rate | Date | Value | |||||||||||
Municipal Debt Obligations – (continued) | ||||||||||||||
| California – (continued) | ||||||||||||||
| California State Economic Recovery GO Bonds for Rols RR II Series 2004 R 281 (RITES) (AA-)(a)(b) | ||||||||||||||
| $ | 6,250,000 | 14.56 | % | 07/01/2008 | $ | 7,698,500 | ||||||||
| California State Economic Recovery GO Bonds Residuals Series 2004 933 (RITES) (Aa3)(b) | ||||||||||||||
| 6,250,000 | 15.15 | 07/01/2014 | 9,256,250 | |||||||||||
| California State Economic Recovery RB for Drivers Series 2004 448 (RITES) (AA-)(a)(b) | ||||||||||||||
| 625,000 | 15.00 | 07/01/2008 | 769,850 | |||||||||||
| California State Economic Recovery RB for Drivers Series 2004 448 (RITES) (AA-)(b) | ||||||||||||||
| 4,060,000 | 16.82 | 07/01/2014 | 6,012,860 | |||||||||||
| California State GO Bonds Refunding Series 2001 (XLCA) (AAA/Aaa) | ||||||||||||||
| 3,250,000 | 5.50 | 03/01/2011 | 3,642,372 | |||||||||||
| California State GO Bonds Series 2003 (A/A3) | ||||||||||||||
| 2,000,000 | 5.25 | 02/01/2015 | 2,213,880 | |||||||||||
| California State GO Bonds Series 2004 (A/A3) | ||||||||||||||
| 20,000,000 | 4.00 | 02/01/2010 | 20,680,200 | |||||||||||
| California Statewide Communities Development Authority RB for Notre Dame De Namur University Series 2003 | ||||||||||||||
| 3,000,000 | 6.63 | 10/01/2033 | 3,076,830 | |||||||||||
| California Statewide Financing Authority Tobacco Settlement RB Asset Backed Pooled Tobacco Security Series 2002 A (Baa3) | ||||||||||||||
| 2,500,000 | 6.00 | 05/01/2037 | 2,498,275 | |||||||||||
| California University Fresno Association Inc. RB for AUX Organization Event Center Series 2002 (Ba1)(d) | ||||||||||||||
| 970,000 | 6.75 | 07/01/2012 | 1,140,749 | |||||||||||
| Carlsbad Improvement Bond Act 1915 for Special Assessment District No. 2003-01 Series 2004 | ||||||||||||||
| 3,315,000 | 6.00 | 09/02/2034 | 3,433,776 | |||||||||||
| Chino Community Facilities District Special Tax No. 03-3 Improvement Area 1 Series 2004 | ||||||||||||||
| 655,000 | 5.50 | 09/01/2022 | 660,175 | |||||||||||
| 565,000 | 5.55 | 09/01/2023 | 569,452 | |||||||||||
| 365,000 | 5.60 | 09/01/2024 | 368,132 | |||||||||||
| 1,300,000 | 5.70 | 09/01/2029 | 1,314,872 | |||||||||||
| 1,420,000 | 5.75 | 09/01/2034 | 1,442,294 | |||||||||||
| Chula Vista Community Facilities District RB No. 99-1-Otay Series 2000 | ||||||||||||||
| 1,185,000 | 7.63 | 09/01/2029 | 1,268,211 | |||||||||||
| Chula Vista Community Facilities District Special Tax No. 07-I-Otay Ranch Village Eleven Series 2004 | ||||||||||||||
| 1,700,000 | 5.70 | 09/01/2024 | 1,749,385 | |||||||||||
| 2,300,000 | 5.80 | 09/01/2028 | 2,369,897 | |||||||||||
| 3,150,000 | 5.88 | 09/01/2034 | 3,253,572 | |||||||||||
| Golden State Tobacco Securitization Corp. California Tobacco Settlement RB Enhanced Asset Backed Bonds Series 2003 B (A-/Baa1) | ||||||||||||||
| 3,810,000 | 5.63 | 06/01/2038 | 4,138,308 | |||||||||||
| Golden State Tobacco Securitization Corp. California Tobacco Settlement RB Series 2003 A-1 (BBB/Baa3) | ||||||||||||||
| 20,485,000 | 6.75 | 06/01/2039 | 21,793,991 | |||||||||||
| Golden State Tobacco Securitization Corp. California Tobacco Settlement RB Series 2003 A-2 (BBB/Baa3) | ||||||||||||||
| 6,000,000 | 7.90 | 06/01/2042 | 6,929,400 | |||||||||||
| Golden State Tobacco Securitization Corp. California Tobacco Settlement RB Series 2003 A-3 (BBB/Baa3) | ||||||||||||||
| 2,650,000 | 7.88 | 06/01/2042 | 3,056,192 | |||||||||||
| Golden State Tobacco Securitization Corp. California Tobacco Settlement RB Series 2003 A-4 (BBB/Baa3) | ||||||||||||||
| 3,000,000 | 7.80 | 06/01/2042 | 3,445,320 | |||||||||||
| Golden State Tobacco Securitization Corp. California Tobacco Settlement RB Series 2003 A-5 (BBB/Baa3) | ||||||||||||||
| 8,330,000 | 7.88 | 06/01/2042 | 9,606,822 | |||||||||||
| Golden State Tobacco Securitization Corp. California Tobacco Settlement RB Series 2003 B (A-/Baa1) | ||||||||||||||
| 75,535,000 | 5.50 | 06/01/2043 | 80,610,197 | |||||||||||
| Hawthorne Community Redevelopment Agency Tax Allocation for Hawthorne Plaza Project Series 2001 | ||||||||||||||
| 2,375,000 | 6.88 | 07/01/2020 | 2,443,922 | |||||||||||
| HI Desert California Memorial Health Care District RB Refunding Series 1998 | ||||||||||||||
| 2,250,000 | 5.50 | 10/01/2015 | 2,267,235 | |||||||||||
| 2,000,000 | 5.50 | 10/01/2019 | 2,008,500 | |||||||||||
| Kaweah Delta Health Care District RB Series 2004 (A3) | ||||||||||||||
| 3,675,000 | 6.00 | 08/01/2034 | 3,996,268 | |||||||||||
| Kings River Conservation District California Revenue COPS for Peaking Project Series 2004 (Baa1) | ||||||||||||||
| 1,000,000 | 4.50 | 05/01/2009 | 1,036,200 | |||||||||||
| 1,455,000 | 5.00 | 05/01/2010 | 1,553,474 | |||||||||||
| 2,700,000 | 5.00 | 05/01/2011 | 2,893,077 | |||||||||||
| 2,715,000 | 5.00 | 05/01/2012 | 2,911,675 | |||||||||||
| 2,345,000 | 5.00 | 05/01/2015 | 2,498,762 | |||||||||||
| Lake Elsinore Improvement Bond Act 1915 for Special Assessment District No. 93-1 Series 2000 | ||||||||||||||
| 1,925,000 | 7.00 | 09/02/2030 | 2,051,357 | |||||||||||
| Lincoln Special Tax for Community Facilities District No. 2003-1 Series 2004 | ||||||||||||||
| 3,800,000 | 5.95 | 09/01/2028 | 3,878,964 | |||||||||||
| 3,300,000 | 6.00 | 09/01/2034 | 3,370,983 | |||||||||||
| Long Beach Special Tax for Community Facilities District #6 Pike Series 2002 | ||||||||||||||
| 5,000,000 | 6.30 | 10/01/2032 | 5,115,000 | |||||||||||
| Los Angeles Community College District GO Bonds Series 2001 II-R-71-A (MBIA) (RITES)(b) | ||||||||||||||
| 1,665,000 | 12.90 | 08/01/2014 | 2,352,462 | |||||||||||
| Los Angeles Community College District GO Bonds Series 2001 II-R-71-B (MBIA) (RITES)(b) | ||||||||||||||
| 1,670,000 | 12.93 | 08/01/2015 | 2,359,526 | |||||||||||
| Los Angeles Regional Airports Improvement Corp. RB for Facilities Sublease Continental Airlines Series 1994 (AMT) (B) | ||||||||||||||
| 975,000 | 9.25 | 08/01/2024 | 983,707 | |||||||||||
| Los Angeles Regional Airports Improvement Corp. RB Series 2002 C (AMT) (B-/Caa2) | ||||||||||||||
| 7,140,000 | 7.00 | 12/01/2012 | 7,311,146 | |||||||||||
| 25,855,000 | 7.50 | 12/01/2024 | 27,028,300 | |||||||||||
32
| Principal | Interest | Maturity | ||||||||||||
| Amount | Rate | Date | Value | |||||||||||
Municipal Debt Obligations – (continued) | ||||||||||||||
| California – (continued) | ||||||||||||||
| Oakley Public Finance Authority RB Series 2004 | ||||||||||||||
| $ | 1,430,000 | 5.88 | % | 09/02/2024 | $ | 1,456,527 | ||||||||
| 2,000,000 | 6.00 | 09/02/2028 | 2,144,540 | |||||||||||
| 2,515,000 | 6.00 | 09/02/2034 | 2,562,383 | |||||||||||
| Oceanside Community Development Commerce Tax Allocation for Downtown Redevelopment Project Series 2002 (Baa3) | ||||||||||||||
| 1,500,000 | 5.75 | 09/01/2025 | 1,563,615 | |||||||||||
| Orange County Community Facilities District Special Tax for No. 1 Ladera Ranch Series 2000 A | ||||||||||||||
| 1,000,000 | 6.20 | 08/15/2023 | 1,093,970 | |||||||||||
| Palo Alto Improvement Bond Act 1915 Special Assessment for University Avenue Area Off Shore Parking Series 2002 A (BBB) | ||||||||||||||
| 1,005,000 | 5.25 | 09/02/2016 | 1,026,738 | |||||||||||
| 1,055,000 | 5.25 | 09/02/2017 | 1,078,031 | |||||||||||
| Sacramento County Sanitation District Financing Authority RB for Sacramento Regional County Series 2004 A (AMBAC) (AAA/Aaa) | ||||||||||||||
| 32,930,000 | 5.00 | 12/01/2035 | 34,749,053 | |||||||||||
| San Leandro Community Facilities District No. 1 Special Tax Series 2000 | ||||||||||||||
| 1,690,000 | 6.40 | 09/01/2019 | 1,761,605 | |||||||||||
| Santa Clara County Financing Authority Special Obligation RB for Measure B Transportation Improvement Program Series 2003 (A2) | ||||||||||||||
| 1,060,000 | 5.00 | 08/01/2005 | 1,065,894 | |||||||||||
| Soledad Improvement Bond Act 1915 for Special Assessment District No. 1 The Vineyards Series 2000 | ||||||||||||||
| 1,985,000 | 7.25 | 09/02/2030 | 2,034,010 | |||||||||||
| Tobacco Securitization Authority of Southern California Tobacco Settlement RB for Asset Backed Bonds Senior Series 2002 A (BBB/Baa3) | ||||||||||||||
| 19,845,000 | 5.25 | 06/01/2027 | 20,033,924 | |||||||||||
| Tobacco Securitization Authority RB for Southern California Tobacco Settlement Asset Backed Bonds Series 2002 A (BBB/Baa3) | ||||||||||||||
| 8,895,000 | 5.63 | 06/01/2043 | 8,553,165 | |||||||||||
| Upland Community Facilities District Special Tax for 2003-2 San Antonio Improvement Series 2004 1-A | ||||||||||||||
| 4,000,000 | 6.00 | 09/01/2034 | 4,145,320 | |||||||||||
| Valley Health System Hospital RB Refunding & Improvement Project Series 1996 A (B+) | ||||||||||||||
| 2,240,000 | 6.50 | 05/15/2015 | 2,244,189 | |||||||||||
| 4,990,000 | 6.50 | 05/15/2025 | 4,999,331 | |||||||||||
| Valley Health Systems COPS Refunding Project Series 1993 (B+) | ||||||||||||||
| 11,065,000 | 6.88 | 05/15/2023 | 11,171,335 | |||||||||||
| $ | 454,036,634 | |||||||||||||
| Colorado – 0.8% | ||||||||||||||
| Colorado Health Facilities Authority RB for Hospital Poudre Valley Health Care Series 2005 F (BBB+/Baa2) | ||||||||||||||
| $ | 10,000,000 | 5.00 | % | 03/01/2025 | $ | 10,084,300 | ||||||||
| Eagle Bend Metropolitan GO Bonds District No. 2 Series 2004 (Radian) (AA/Aa3) | ||||||||||||||
| 1,000,000 | 5.00 | 12/01/2020 | 1,040,090 | |||||||||||
| McKay Landing Metropolitan GO Bonds District No. 2 Series 2000 | ||||||||||||||
| 1,500,000 | 7.50 | 12/01/2019 | 1,631,955 | |||||||||||
| McKay Landing Metropolitan Go Bonds District No. 2 Subseries 2004 A | ||||||||||||||
| 2,000,000 | 7.50 | 12/01/2034 | 2,015,600 | |||||||||||
| Saddle Rock South Metropolitan GO Bonds Mill Levy Obligation Series 2000 | ||||||||||||||
| 3,000,000 | 7.20 | 12/01/2019 | 3,233,340 | |||||||||||
| Tablerock Metropolitan District Colorado GO Bonds | ||||||||||||||
| 2,750,000 | 7.00 | 12/01/2033 | 2,878,260 | |||||||||||
| Vista Ridge Metropolitan District GO Bonds Series 2001 | ||||||||||||||
| 9,795,000 | 7.50 | 12/01/2031 | 10,211,679 | |||||||||||
| $ | 31,095,224 | |||||||||||||
| Connecticut – 0.4% | ||||||||||||||
| Bridgeport Senior Living Facilities RB for 3030 Park Retirement Community Project Series 2005 | ||||||||||||||
| $ | 7,000,000 | 7.25 | % | 04/01/2035 | $ | 7,282,660 | ||||||||
| Connecticut State GO Bonds Residual Certificates Series 2001 515 (RITES) (Aa3)(b) | ||||||||||||||
| 3,485,000 | 13.85 | 12/15/2013 | 5,004,321 | |||||||||||
| Connecticut State Health and Educational Facility Authority RB for St. Mary’s Hospital Corp. Series 1997 E (Ba1) | ||||||||||||||
| 695,000 | 5.88 | 07/01/2022 | 660,382 | |||||||||||
| University of Connecticut GO Bonds Series 2004 PA 1255 (MBIA) (RITES)(b) | ||||||||||||||
| 2,660,000 | 10.36 | 01/15/2011 | 3,788,691 | |||||||||||
| $ | 16,736,054 | |||||||||||||
| Delaware – 0.4% | ||||||||||||||
| Delaware River & Bay Authority RB Refunding Series 2005 (MBIA) (AAA/Aaa) | ||||||||||||||
| $ | 3,400,000 | 5.00 | % | 01/01/2024 | $ | 3,627,868 | ||||||||
| 3,000,000 | 5.00 | 01/01/2025 | 3,196,140 | |||||||||||
| 2,500,000 | 5.00 | 01/01/2026 | 2,655,275 | |||||||||||
| 3,000,000 | 5.00 | 01/01/2027 | 3,178,980 | |||||||||||
| 2,000,000 | 5.00 | 01/01/2028 | 2,117,700 | |||||||||||
| Delaware State Health Facilities Authority RB for Beebe Medical Center Project Series 2004 A (BBB/Baa1) | ||||||||||||||
| 1,250,000 | 5.50 | 06/01/2024 | 1,315,588 | |||||||||||
| $ | 16,091,551 | |||||||||||||
| District Of Columbia – 0.3% | ||||||||||||||
| District of Columbia Housing Finance Agency Mortgage RB for Single Family Series 1997 B (GNMA/FNMA) (AMT) (AAA) | ||||||||||||||
| $ | 1,435,000 | 6.35 | % | 06/01/2028 | $ | 1,437,640 | ||||||||
| District of Columbia Tobacco Settlement Financing Corp. RB for Asset Backed Bonds Series 2001 (BBB/Baa3) | ||||||||||||||
| 1,680,000 | 6.25 | 05/15/2024 | 1,718,086 | |||||||||||
| 6,000,000 | 6.50 | 05/15/2033 | 6,363,120 | |||||||||||
33
April 30, 2005 (Unaudited)
| Principal | Interest | Maturity | ||||||||||||
| Amount | Rate | Date | Value | |||||||||||
Municipal Debt Obligations – (continued) | ||||||||||||||
| District Of Columbia – (continued) | ||||||||||||||
| Washington D.C. Metropolitan Area Transportation Authority Gross Revenue RB for Rols RR II Series 2003 R 245 (MBIA) (RITES) (AAA)(b) | ||||||||||||||
| $ | 2,785,000 | 13.82 | % | 01/01/2010 | $ | 3,731,343 | ||||||||
| $ | 13,250,189 | |||||||||||||
| Florida – 31.1% | ||||||||||||||
| Amelia National Community Development District RB for Capital Improvement Series 2004 A | ||||||||||||||
| $ | 3,360,000 | 6.30 | % | 05/01/2035 | $ | 3,493,157 | ||||||||
| Anthem Park Community Development District RB for Capital Improvement Series 2004 | ||||||||||||||
| 2,800,000 | 5.80 | 05/01/2036 | 2,821,896 | |||||||||||
| Arborwood Community Development District RB for School Site Acquisition Project Series 2005 | ||||||||||||||
| 6,115,000 | 5.50 | 05/01/2014 | 6,204,218 | |||||||||||
| Ballantrae Community Development District RB for Capital Improvement Series 2004 | ||||||||||||||
| 5,000,000 | 6.00 | 05/01/2035 | 5,166,000 | |||||||||||
| Beacon Tradeport Community Development District RB Special Assessment Project Series 2002 A (Radian) (AA) | ||||||||||||||
| 1,990,000 | 5.25 | 05/01/2016 | 2,178,254 | |||||||||||
| Bellalago Educational Facilities Benefits District RB for Capital Improvement Series 2004 A | ||||||||||||||
| 7,000,000 | 6.00 | 05/01/2033 | 7,243,180 | |||||||||||
| Bellalago Educational Facilities Benefits District RB for Capital Improvement Series 2004 B | ||||||||||||||
| 6,220,000 | 5.80 | 05/01/2034 | 6,323,439 | |||||||||||
| Bluewaters Community Development District Special Assessment Series 2004 | ||||||||||||||
| 3,000,000 | 6.00 | 05/01/2035 | 3,060,330 | |||||||||||
| Bonita Springs Vasari Community Development District RB for Capital Improvement Series 2001 A | ||||||||||||||
| 7,850,000 | 6.95 | 05/01/2032 | 8,478,078 | |||||||||||
| Bonnet Creek Resort Community Development District RB Special Assessment Series 2002 | ||||||||||||||
| 1,000,000 | 7.13 | 05/01/2012 | 1,071,820 | |||||||||||
| Bonnet Creek Resort Community Development District Special Assessment RB Series 2002 | ||||||||||||||
| 10,000,000 | 7.38 | 05/01/2034 | 10,775,300 | |||||||||||
| 2,000,000 | 7.50 | 05/01/2034 | 2,157,280 | |||||||||||
| Brandy Creek Community Development District Special Assessment Series 2003 A | ||||||||||||||
| 3,510,000 | 6.35 | 05/01/2034 | 3,690,274 | |||||||||||
| Brandy Creek Community Development District Special Assessment Series 2003 B | ||||||||||||||
| 2,945,000 | 5.40 | 05/01/2009 | 2,987,143 | |||||||||||
| Bridgewater Community Development District Special Assessment Series 2004 A | ||||||||||||||
| 9,485,000 | 6.00 | 05/01/2035 | 9,721,461 | |||||||||||
| Bridgewater Wesley Chapel Community Development District RB for Capital Improvement Series 2005 | ||||||||||||||
| 3,595,000 | 5.75 | 05/01/2035 | 3,636,594 | |||||||||||
| Briger Community Development District Special Assessment RB Series 2002 A | ||||||||||||||
| 2,965,000 | 6.75 | 05/01/2033 | 3,163,892 | |||||||||||
| Brighton Lakes Community Development District Special Assessment Series 2004 A | ||||||||||||||
| 1,500,000 | 6.13 | 05/01/2035 | 1,518,060 | |||||||||||
| Brooks of Bonita Springs II Community Development District RB for Capital Improvement Series 2000 A | ||||||||||||||
| 5,900,000 | 7.00 | 05/01/2031 | 6,243,026 | |||||||||||
| Brooks of Bonita Springs II Community Development District RB for Capital Improvement Series 2003 A | ||||||||||||||
| 1,645,000 | 6.13 | 05/01/2034 | 1,688,362 | |||||||||||
| Capital Region Community Development District RB for Capital Improvement Series 2002 A | ||||||||||||||
| 12,120,000 | 6.70 | 05/01/2032 | 13,051,301 | |||||||||||
| Capital Region Community Development District Special Assessment for Capital Improvement Series 2001 A-1 | ||||||||||||||
| 1,095,000 | 6.70 | 05/01/2031 | 1,163,010 | |||||||||||
| Capital Region Community Development District Special Assessment for Capital Improvement Series 2001 A-2 | ||||||||||||||
| 2,910,000 | 6.85 | 05/01/2031 | 3,131,218 | |||||||||||
| Capital Trust Agency RB for Seminole Tribe Convention Series 2002 A(e) | ||||||||||||||
| 6,400,000 | 10.00 | 10/01/2033 | 7,180,096 | |||||||||||
| Capital Trust Agency RB for Seminole Tribe Convention Series 2003 A(e) | ||||||||||||||
| 3,000,000 | 8.95 | 10/01/2033 | 3,376,440 | |||||||||||
| Celebration Community Development District Special Assessment Series 2003 A | ||||||||||||||
| 3,000,000 | 6.40 | 05/01/2034 | 3,188,580 | |||||||||||
| Century Gardens Community Development District Special Assessment Series 2004 | ||||||||||||||
| 2,395,000 | 5.90 | 05/01/2034 | 2,441,583 | |||||||||||
| CFM Community Development District RB for Capital Improvement Series 2004 A | ||||||||||||||
| 20,000,000 | 6.25 | 05/01/2035 | 21,059,800 | |||||||||||
| CFM Community Development District RB for Capital Improvement Series 2004 B | ||||||||||||||
| 1,725,000 | 5.88 | 05/01/2014 | 1,785,892 | |||||||||||
| City Center Community Development District RB BANS Series 2004 | ||||||||||||||
| 3,700,000 | 5.25 | 11/01/2005 | 3,691,897 | |||||||||||
| Colonial Country Club Community Development District Florida Capital Improvement RB Series 2003 | ||||||||||||||
| 11,410,000 | 6.40 | 05/01/2033 | 12,127,233 | |||||||||||
| Concorde Estates Community Development District RB for Capital Improvement Series 2004 A | ||||||||||||||
| 2,350,000 | 5.85 | 05/01/2035 | 2,385,015 | |||||||||||
| Concorde Estates Community Development District RB for Capital Improvement Series 2004 B | ||||||||||||||
| 1,300,000 | 5.00 | 05/01/2011 | 1,308,060 | |||||||||||
| Connerton West Community Development District for Special Assessment Capital Improvement Series 2004 A-1 | ||||||||||||||
| 3,015,000 | 5.95 | 05/01/2035 | 3,078,586 | |||||||||||
34
| Principal | Interest | Maturity | ||||||||||||
| Amount | Rate | Date | Value | |||||||||||
Municipal Debt Obligations – (continued) | ||||||||||||||
| Florida – (continued) | ||||||||||||||
| Connerton West Community Development District for Special Assessment Capital Improvement Series 2004 A-2 | ||||||||||||||
| $ | 2,290,000 | 5.85 | % | 05/01/2024 | $ | 2,320,732 | ||||||||
| 1,590,000 | 5.95 | 05/01/2036 | 1,612,260 | |||||||||||
| Cory Lakes Community Development District for Special Assessment Series 2001 A | ||||||||||||||
| 570,000 | 8.38 | 05/01/2017 | 646,010 | |||||||||||
| Cory Lakes Community Development District for Special Assessment Series 2001 B | ||||||||||||||
| 835,000 | 8.38 | 05/01/2017 | 922,182 | |||||||||||
| Country Greens Community Development District Special Assessment RB Series 2003 | ||||||||||||||
| 6,100,000 | 6.63 | 05/01/2034 | 6,490,644 | |||||||||||
| Covington Park Community Development District RB for Capital Improvement Series 2004 A | ||||||||||||||
| 1,145,000 | 6.25 | 05/01/2034 | 1,195,014 | |||||||||||
| Covington Park Community Development District RB for Capital Improvement Series 2004 B | ||||||||||||||
| 2,000,000 | 5.30 | 11/01/2009 | 2,025,680 | |||||||||||
| Crossings at Fleming Island Community Development District RB for Special Assessment Series 2000 C | ||||||||||||||
| 5,305,000 | 7.05 | 05/01/2015 | 5,674,865 | |||||||||||
| Cutler Cay Community Development District Special Assessment Series 2004 | ||||||||||||||
| 5,000,000 | 6.13 | 05/01/2024 | 5,215,850 | |||||||||||
| 2,480,000 | 6.30 | 05/01/2034 | 2,588,078 | |||||||||||
| Diamond Hill Community Development District Tax Allocation for Capital Improvement Series 2004 | ||||||||||||||
| 1,790,000 | 6.00 | 05/01/2034 | 1,820,752 | |||||||||||
| Double Branch Community Development District Special Assessment Series 2002 A | ||||||||||||||
| 11,100,000 | 6.70 | 05/01/2034 | 12,056,265 | |||||||||||
| Double Branch Community Development District Special Assessment Series 2003 B | ||||||||||||||
| 4,220,000 | 5.38 | 05/01/2008 | 4,284,144 | |||||||||||
| Dupree Lakes Community Development District RB for Capital Improvement Series 2005 | ||||||||||||||
| 8,000,000 | 5.00 | 11/01/2010 | 7,970,000 | |||||||||||
| East Park Development District Special Assessment Series 2002 | ||||||||||||||
| 5,300,000 | 6.85 | 05/01/2033 | 5,725,166 | |||||||||||
| Fishhawk Community Development District II Special Assessment RB Series 2003 A | ||||||||||||||
| 3,000,000 | 6.25 | 05/01/2034 | 3,146,310 | |||||||||||
| Fishhawk Community Development District II Special Assessment RB Series 2003 B | ||||||||||||||
| 1,160,000 | 5.00 | 11/01/2007 | 1,170,916 | |||||||||||
| Fishhawk Community Development District II Special Assessment RB Series 2004 A | ||||||||||||||
| 2,500,000 | 6.13 | 05/01/2034 | 2,599,800 | |||||||||||
| Fleming Island Plantation Community Development District RB for Special Assessment Series 2000 B | ||||||||||||||
| 5,255,000 | 7.30 | 05/01/2015 | 5,733,152 | |||||||||||
| Gateway Services Community Development District Special Assessment for Stoneybrook Project Series 2003 | ||||||||||||||
| 5,525,000 | 5.50 | 07/01/2008 | 5,632,351 | |||||||||||
| Gateway Services Community Development District Special Assessment for Sun City Center-Fort Meyers Project Series 2003 A | ||||||||||||||
| 2,670,000 | 6.50 | 05/01/2033 | 2,821,603 | |||||||||||
| Gateway Services Community Development District Special Assessment for Sun City Center-Fort Meyers Project Series 2003 B | ||||||||||||||
| 1,425,000 | 5.50 | 05/01/2010 | 1,454,526 | |||||||||||
| Gateway Services District Water & Sewer RB Refunding Series 2003 | ||||||||||||||
| 2,315,000 | 6.00 | 10/01/2019 | 2,338,358 | |||||||||||
| Grand Hampton Community Development District RB for Capital Improvement Series 2003 | ||||||||||||||
| 5,200,000 | 6.15 | 05/01/2034 | 5,364,580 | |||||||||||
| Grand Haven Community Development District Special Assessment Series 2002 | ||||||||||||||
| 1,300,000 | 6.13 | 11/01/2007 | 1,319,669 | |||||||||||
| Grand Haven Community Development District Special Assessment Series 2003 | ||||||||||||||
| 2,235,000 | 5.20 | 11/01/2007 | 2,260,457 | |||||||||||
| Grand Haven Community Development District Special Assessment Series 2004 B | ||||||||||||||
| 2,000,000 | 5.00 | 05/01/2009 | 2,003,800 | |||||||||||
| Greyhawk Landing Community Development District Special Assessment Series 2002 A | ||||||||||||||
| 3,025,000 | 7.00 | 05/01/2033 | 3,285,725 | |||||||||||
| Greyhawk Landing Community Development District Special Assessment Series 2002 B | ||||||||||||||
| 1,725,000 | 6.25 | 05/01/2009 | 1,768,936 | |||||||||||
| Griffin Lakes Community Development District Special Assessment Series 2002 A | ||||||||||||||
| 4,550,000 | 6.70 | 05/01/2033 | 4,835,512 | |||||||||||
| Habitat Community Development RB Series 2004 | ||||||||||||||
| 4,745,000 | 5.85 | 05/01/2035 | 4,841,181 | |||||||||||
| Halifax Hospital Medical Center RB Series 1999 A | ||||||||||||||
| 955,000 | 7.25 | 10/01/2024 | 1,040,769 | |||||||||||
| Hamal Community Development District Special Assessment Series 2001 | ||||||||||||||
| 3,725,000 | 6.75 | 05/01/2031 | 3,957,924 | |||||||||||
| Harbor Bay Community Development District Special Assessment for Capital Improvement Series 2001 A | ||||||||||||||
| 2,340,000 | 7.00 | 05/01/2033 | 2,524,439 | |||||||||||
| Harbour Isles Community Development District Special Assessment Series 2004 | ||||||||||||||
| 4,365,000 | 6.13 | 05/01/2035 | 4,509,045 | |||||||||||
| Harbour Lake Estates Community Development District Special Assessment Series 2001 | ||||||||||||||
| 305,000 | 6.40 | 02/01/2006 | 307,538 | |||||||||||
| Harbourage at Braden River Community Development District Special Assessment for Capital Improvement Series 2003 A | ||||||||||||||
| 3,000,000 | 6.13 | 05/01/2034 | 3,100,410 | |||||||||||
35
April 30, 2005 (Unaudited)
| Principal | Interest | Maturity | ||||||||||||
| Amount | Rate | Date | Value | |||||||||||
Municipal Debt Obligations – (continued) | ||||||||||||||
| Florida – (continued) | ||||||||||||||
| Heritage Harbor South Community Development District RB for Capital Improvement Series 2002 A | ||||||||||||||
| $ | 4,000,000 | 6.50 | % | 05/01/2034 | $ | 4,253,240 | ||||||||
| Heritage Harbor South Community Development District RB for Capital Improvement Series 2003 A | ||||||||||||||
| 1,235,000 | 6.20 | 05/01/2035 | 1,284,141 | |||||||||||
| Heritage Harbor South Community Development District RB for Capital Improvement Series 2003 B | ||||||||||||||
| 2,540,000 | 5.25 | 11/01/2008 | 2,575,433 | |||||||||||
| Heritage Harbour Market Place Community Development District BANS Series 2004 | ||||||||||||||
| 5,000,000 | 5.50 | 10/01/2005 | 4,989,900 | |||||||||||
| Heritage Isle at Viera Community Development District Special Assessment Series 2004 A | ||||||||||||||
| 3,180,000 | 6.00 | 05/01/2035 | 3,269,612 | |||||||||||
| Heritage Isle at Viera Community Development District Special Assessment Series 2004 B | ||||||||||||||
| 2,500,000 | 5.00 | 11/01/2009 | 2,507,700 | |||||||||||
| Heritage Isles Community Development District RB for Special Assessment Series 2002 | ||||||||||||||
| 2,210,000 | 5.90 | 11/01/2006 | 2,232,873 | |||||||||||
| Heritage Lake Park Community Development District Special Assessment Series 2004 B | ||||||||||||||
| 6,000,000 | 5.10 | 11/01/2009 | 6,048,000 | |||||||||||
| Heritage Lake Park Community Development Special Assessment Series 2005 | ||||||||||||||
| 1,700,000 | 5.70 | 05/01/2036 | 1,703,451 | |||||||||||
| Heritage Landing Community Development District Revenue Notes Special Assessment BANS Series 2004 | ||||||||||||||
| 5,000,000 | 5.00 | 08/01/2005 | 4,995,150 | |||||||||||
| Heritage Palms Community Development District RB for Capital Improvement Series 1999 | ||||||||||||||
| 985,000 | 6.25 | 11/01/2007 | 987,955 | |||||||||||
| Heritage Park Community Development District RB for Special Assessment Series 2004 A | ||||||||||||||
| 5,900,000 | 6.30 | 05/01/2035 | 6,122,430 | |||||||||||
| Hollywood Community Redevelopment Agency RB for Beach CRA Series 2004 (Baa2) | ||||||||||||||
| 2,700,000 | 5.63 | 03/01/2024 | 2,888,595 | |||||||||||
| Hypoluxo/ Haverhill Community Development District Special Assessment Series 2002 A | ||||||||||||||
| 1,385,000 | 6.75 | 05/01/2033 | 1,484,526 | |||||||||||
| Indian Trace Development District Special Assessment for Isles at Weston Project Series 2003 | ||||||||||||||
| 1,960,000 | 5.50 | 05/01/2033 | 1,976,366 | |||||||||||
| Indigo Community Development District for Capital Improvement Special Assessment Series 2005 | ||||||||||||||
| 9,000,000 | 5.75 | 05/01/2036 | 9,064,080 | |||||||||||
| Indigo Community Development District RB for Capital Improvement Series 1999 B | ||||||||||||||
| 1,875,000 | 6.40 | 05/01/2006 | 1,887,281 | |||||||||||
| Islands at Doral Florida Special Assessment Series 2003 | ||||||||||||||
| 1,820,000 | 6.38 | 05/01/2035 | 1,929,873 | |||||||||||
| Islands at Doral III Community Development District Special Assessment Series 2004 A | ||||||||||||||
| 11,000,000 | 5.90 | 05/01/2035 | 11,311,190 | |||||||||||
| Islands at Doral Ne Community Development District Special Assessment Series 2004 | ||||||||||||||
| 1,835,000 | 6.25 | 05/01/2034 | 1,940,916 | |||||||||||
| Julington Creek Plantation Community Development District Special Assessment Series 2002 (MBIA) (AAA/Aaa) | ||||||||||||||
| 2,970,000 | 4.75 | 05/01/2019 | 3,088,087 | |||||||||||
| Keys Cove Community Development District Special Assessment Series 2004 | ||||||||||||||
| 1,220,000 | 5.88 | 05/01/2035 | 1,236,897 | |||||||||||
| Killarney Community Development District Special Assessment Series 2004 A | ||||||||||||||
| 2,535,000 | 6.00 | 05/01/2035 | 2,611,303 | |||||||||||
| Killarney Community Development District Special Assessment Series 2004 B | ||||||||||||||
| 5,120,000 | 5.13 | 05/01/2009 | 5,166,080 | |||||||||||
| Laguna Lakes Community Development District Florida Special Assessment RB Series 2003 A | ||||||||||||||
| 2,465,000 | 6.40 | 05/01/2033 | 2,600,230 | |||||||||||
| Laguna Lakes Community Development District Florida Special Assessment RB Series 2003 B | ||||||||||||||
| 870,000 | 5.25 | 11/01/2007 | 879,901 | |||||||||||
| Lake Powell Residential Golf Community Development District Special Assessment Series 2000 A | ||||||||||||||
| 2,840,000 | 7.45 | 05/01/2022 | 3,060,185 | |||||||||||
| 4,150,000 | 7.50 | 05/01/2032 | 4,484,033 | |||||||||||
| Lakes by the Bay South Community Development District Special Assessment RB Series 2004 A | ||||||||||||||
| 7,955,000 | 6.10 | 05/01/2023 | 8,411,140 | |||||||||||
| 4,000,000 | 6.25 | 05/01/2034 | 4,218,240 | |||||||||||
| Lakes by the Bay South Community Development District Special Assessment RB Series 2004 B | ||||||||||||||
| 6,500,000 | 5.30 | 05/01/2009 | 6,567,405 | |||||||||||
| Lakewood Ranch Community Development District No. 4 Special Assessment RB Series 2004 | ||||||||||||||
| 2,190,000 | 5.95 | 05/01/2034 | 2,254,408 | |||||||||||
| Lakewood Ranch Community Development District No. 5 Special Assessment RB Series 2001 A | ||||||||||||||
| 4,855,000 | 6.70 | 05/01/2031 | 5,162,176 | |||||||||||
| Lakewood Ranch Community Development District No. 5 Special Assessment RB Series 2003 | ||||||||||||||
| 2,065,000 | 5.30 | 11/01/2007 | 2,089,119 | |||||||||||
| Lakewood Ranch Community Development District No. 6 RB for Capital Improvement Series 2004 A | ||||||||||||||
| 5,930,000 | 6.13 | 05/01/2034 | 6,178,586 | |||||||||||
| Lee County IDA Health Care Facilities RB for Shell Point Village Project Series 1999 A (BBB-) | ||||||||||||||
| 7,000,000 | 5.50 | 11/15/2029 | 7,008,960 | |||||||||||
| Lexington Oaks Community Development District Special Assessment Series 2002 A | ||||||||||||||
| 2,500,000 | 6.70 | 05/01/2033 | 2,668,025 | |||||||||||
36
| Principal | Interest | Maturity | ||||||||||||
| Amount | Rate | Date | Value | |||||||||||
Municipal Debt Obligations – (continued) | ||||||||||||||
| Florida – (continued) | ||||||||||||||
| Live Oak Community Development District No. 001 Special Assessment Series 2003 A | ||||||||||||||
| $ | 4,500,000 | 6.30 | % | 05/01/2034 | $ | 4,721,850 | ||||||||
| Live Oak Community Development District No. 001 Special Assessment Series 2003 B | ||||||||||||||
| 5,580,000 | 5.30 | 05/01/2008 | 5,644,505 | |||||||||||
| Live Oak Community Development District No. 002 Special Assessment Series 2004 A | ||||||||||||||
| 6,230,000 | 5.85 | 05/01/2035 | 6,345,816 | |||||||||||
| Live Oak Community Development District No. 002 Special Assessment Series 2004 B | ||||||||||||||
| 7,220,000 | 5.00 | 11/01/2009 | 7,270,684 | |||||||||||
| Longleaf Community Development District Special Assessment Series 2001 | ||||||||||||||
| 1,075,000 | 7.25 | 05/01/2009 | 1,106,390 | |||||||||||
| Maple Ridge Community Development District Special Assessment Series 2000 A | ||||||||||||||
| 1,550,000 | 7.15 | 05/01/2031 | 1,684,509 | |||||||||||
| Marshall Creek Community Development District Special Assessment Series 2002 | ||||||||||||||
| 2,965,000 | 6.63 | 05/01/2032 | 3,144,175 | |||||||||||
| Meadow Pines Community Development District Special Assessment RB Series 2004 A | ||||||||||||||
| 7,095,000 | 6.25 | 05/01/2034 | 7,360,424 | |||||||||||
| Meadow Pointe II Community Development District RB for Capital Improvement Series 2004 (Baa3) | ||||||||||||||
| 685,000 | 3.70 | 05/01/2011 | 673,430 | |||||||||||
| 710,000 | 3.88 | 05/01/2012 | 696,986 | |||||||||||
| 300,000 | 4.00 | 05/01/2013 | 293,967 | |||||||||||
| 1,745,000 | 4.60 | 05/01/2018 | 1,739,922 | |||||||||||
| Meadow Pointe III Community Development District RB for Capital Improvement Series 2001 A | ||||||||||||||
| 2,965,000 | 6.85 | 05/01/2033 | 3,162,202 | |||||||||||
| Meadow Pointe III Community Development District RB for Capital Improvement Series 2003 A | ||||||||||||||
| 3,970,000 | 6.40 | 05/01/2034 | 4,210,860 | |||||||||||
| Meadow Pointe III Community Development District RB for Capital Improvement Series 2003 B | ||||||||||||||
| 2,385,000 | 5.25 | 11/01/2007 | 2,412,141 | |||||||||||
| Meadow Pointe III Community Development District RB for Capital Improvement Series 2004 A | ||||||||||||||
| 1,000,000 | 6.00 | 05/01/2035 | 1,028,560 | |||||||||||
| Meadow Pointe IV Community Development District RB for Capital Improvement Series 2003 A | ||||||||||||||
| 2,790,000 | 6.30 | 05/01/2034 | 2,939,683 | |||||||||||
| Meadow Pointe IV Community Development District Tax Allocation for Capital Improvement Series 2004 A | ||||||||||||||
| 3,005,000 | 6.00 | 05/01/2036 | 3,079,254 | |||||||||||
| Mediterra North Community Development District RB for Capital Improvement Series 2001 A | ||||||||||||||
| 4,805,000 | 6.80 | 05/01/2031 | 5,140,341 | |||||||||||
| Mediterra South Community Development District RB for Capital Improvement Series 1999 A | ||||||||||||||
| 475,000 | 6.95 | 05/01/2031 | 501,296 | |||||||||||
| Mediterra South Community Development District RB for Capital Improvement Series 2001 | ||||||||||||||
| 1,600,000 | 6.85 | 05/01/2031 | 1,713,168 | |||||||||||
| Mediterra South Community Development District RB for Capital Improvement Series 2003 A | ||||||||||||||
| 5,035,000 | 6.38 | 05/01/2034 | 5,316,960 | |||||||||||
| Mediterra South Community Development District RB for Capital Improvement Series 2003 B | ||||||||||||||
| 4,520,000 | 5.50 | 05/01/2010 | 4,623,689 | |||||||||||
| Miami Beach Health Facilities Authority Hospital RB for Mount Sinai Medical Center Florida Project Series 1998 (BB+) | ||||||||||||||
| 3,100,000 | 5.38 | 11/15/2028 | 3,069,682 | |||||||||||
| Miami Beach Health Facilities Authority Hospital RB for Mount Sinai Medical Center Series 2001 A (BB+/Ba2) | ||||||||||||||
| 5,645,000 | 6.13 | 11/15/2011 | 6,010,006 | |||||||||||
| Miami Beach Health Facilities Authority Hospital RB for Mount Sinai Medical Center Series 2004 (BB+/Ba2) | ||||||||||||||
| 13,600,000 | 6.75 | 11/15/2029 | 15,101,712 | |||||||||||
| Middle Village Community Development District Special Assessment Series 2004 A | ||||||||||||||
| 6,000,000 | 5.80 | 05/01/2022 | 6,166,560 | |||||||||||
| 15,620,000 | 6.00 | 05/01/2035 | 16,090,631 | |||||||||||
| Middle Village Community Development District Special Assessment Series 2004 B | ||||||||||||||
| 2,750,000 | 5.00 | 05/01/2009 | 2,767,270 | |||||||||||
| Middle Village Community Development District Special Assessment Series 2004 C | ||||||||||||||
| 830,000 | 5.13 | 05/01/2009 | 837,619 | |||||||||||
| Monterra Community Development District Revenue BANS Series 2005 | ||||||||||||||
| 28,000,000 | 5.00 | 06/01/2006 | 28,000,000 | |||||||||||
| Narcoossee Community Development District Special Assessment Series 2002 A | ||||||||||||||
| 5,045,000 | 6.85 | 05/01/2033 | 5,459,850 | |||||||||||
| Narcoossee Community Development District Special Assessment Series 2002 B | ||||||||||||||
| 185,000 | 5.75 | 05/01/2008 | 188,349 | |||||||||||
| Oak Creek Community Development District Special Assessment Series 2004 | ||||||||||||||
| 1,775,000 | 5.80 | 05/01/2035 | 1,811,103 | |||||||||||
| Oakstead Community Development District RB for Capital Improvement Series 2002 A | ||||||||||||||
| 4,735,000 | 6.88 | 05/01/2033 | 5,092,114 | |||||||||||
| Oakstead Community Development District RB for Capital Improvement Series 2002 B | ||||||||||||||
| 2,160,000 | 5.90 | 05/01/2007 | 2,174,213 | |||||||||||
| Oakstead Community Development District RB for Capital Improvement Series 2003 | ||||||||||||||
| 580,000 | 5.20 | 11/01/2007 | 585,835 | |||||||||||
| Old Palm Community Development District | ||||||||||||||
| 3,815,000 | 5.38 | 05/01/2014 | 3,883,098 | |||||||||||
| Old Palm Community Development District Special Assessment for Palm Beach Gardens Series 2004 A | ||||||||||||||
| 6,815,000 | 5.90 | 05/01/2035 | 7,003,571 | |||||||||||
37
April 30, 2005 (Unaudited)
| Principal | Interest | Maturity | ||||||||||||
| Amount | Rate | Date | Value | |||||||||||
Municipal Debt Obligations – (continued) | ||||||||||||||
| Florida – (continued) | ||||||||||||||
| Orlando Urban Community Development District Special Assessment for Capital Improvement Series 2004 | ||||||||||||||
| $ | 1,000,000 | 6.00 | % | 05/01/2020 | $ | 1,044,930 | ||||||||
| 4,500,000 | 6.25 | 05/01/2034 | 4,738,455 | |||||||||||
| Orlando Urban Community Development District Special Assessment Series 2001 A | ||||||||||||||
| 7,930,000 | 6.95 | 05/01/2033 | 8,509,842 | |||||||||||
| Overoaks Community Development District Special Assessment for Capital Improvement Series 2004 A | ||||||||||||||
| 2,305,000 | 6.13 | 05/01/2035 | 2,405,221 | |||||||||||
| Overoaks Community Development District Special Assessment for Capital Improvement Series 2004 B | ||||||||||||||
| 6,880,000 | 5.13 | 05/01/2009 | 6,935,246 | |||||||||||
| Palm Beach County Plantation Community Development District Special Assessment RB Series 2004 A | ||||||||||||||
| 7,250,000 | 6.25 | 05/01/2034 | 7,515,640 | |||||||||||
| Palma Sola Trace Community Development District RB for Capital Improvement Series 2005 | ||||||||||||||
| 4,000,000 | 5.75 | 05/01/2035 | 4,043,200 | |||||||||||
| Panther Trace Community Development District Special Assessment Series 2002 A | ||||||||||||||
| 1,680,000 | 7.25 | 05/01/2033 | 1,864,296 | |||||||||||
| Panther Trace II Community Development District Special Assessment Series 2005 A | ||||||||||||||
| 7,875,000 | 5.60 | 05/01/2035 | 7,921,620 | |||||||||||
| Panther Trace II Community Development District Special Assessment Series 2005 B | ||||||||||||||
| 2,495,000 | 5.00 | 11/01/2010 | 2,520,399 | |||||||||||
| Park Place Community Development District Special Assessment Series 2003 | ||||||||||||||
| 4,505,000 | 6.38 | 05/01/2034 | 4,747,504 | |||||||||||
| Parklands Lee Community Development District Special Assessment Series 2004 A | ||||||||||||||
| 4,000,000 | 5.80 | 05/01/2035 | 4,061,560 | |||||||||||
| Parklands Lee Community Development District Special Assessment Series 2004 B | ||||||||||||||
| 5,000,000 | 5.13 | 05/01/2011 | 5,036,000 | |||||||||||
| Parklands West Community Development District Special Assessment Series 2001 A | ||||||||||||||
| 3,420,000 | 6.90 | 05/01/2032 | 3,645,275 | |||||||||||
| Parklands West Community Development District Special Assessment Series 2001 B | ||||||||||||||
| 265,000 | 6.00 | 05/01/2006 | 266,844 | |||||||||||
| Parkway Center Community Development District Special Assessment Series 2000 A | ||||||||||||||
| 490,505 | 8.25 | 05/01/2031 | 493,634 | |||||||||||
| Pier Park Community Development District RB for Capital Improvement Series 2002 1 | ||||||||||||||
| 14,670,000 | 7.15 | 05/01/2034 | 15,539,051 | |||||||||||
| Pier Park Community Development District RB for Capital Improvement Series 2002 2 | ||||||||||||||
| 1,330,000 | 7.15 | 05/01/2034 | 1,330,000 | |||||||||||
| Pine Island Community Development District Special Assessment Series 2004 | ||||||||||||||
| 5,435,000 | 5.30 | 11/01/2010 | 5,452,229 | |||||||||||
| 9,720,000 | 5.75 | 05/01/2035 | 9,838,584 | |||||||||||
| Poinciana Community Development District Special Assessment Series 2000 A | ||||||||||||||
| 5,865,000 | 7.13 | 05/01/2031 | 6,212,912 | |||||||||||
| Principal One Community Development District Jacksonville Special Assessment Series 2005 | ||||||||||||||
| 1,000,000 | 5.65 | 05/01/2035 | 1,005,640 | |||||||||||
| Renaissance Community Development District RB for Capital Improvement Series 2002 A | ||||||||||||||
| 7,335,000 | 7.00 | 05/01/2033 | 7,917,252 | |||||||||||
| Renaissance Community Development District RB for Capital Improvement Series 2002 B | ||||||||||||||
| 1,205,000 | 6.25 | 05/01/2008 | 1,240,306 | |||||||||||
| Reunion East Community Development District Special Assessment Series 2002 A | ||||||||||||||
| 20,190,000 | 7.20 | 05/01/2022 | 21,832,255 | |||||||||||
| 2,325,000 | 7.38 | 05/01/2033 | 2,520,486 | |||||||||||
| Reunion East Community Development District Special Assessment Series 2002 B | ||||||||||||||
| 2,465,000 | 5.90 | 11/01/2007 | 2,502,246 | |||||||||||
| Reunion East Community Development District Special Assessment Series 2003 | ||||||||||||||
| 4,450,000 | 5.20 | 11/01/2007 | 4,492,364 | |||||||||||
| Reunion East Community Development District Special Assessment Series 2005 | ||||||||||||||
| 9,000,000 | 5.80 | 05/01/2036 | 9,144,630 | |||||||||||
| Reunion West Community Development District Special Assessment Series 2004 | ||||||||||||||
| 22,000,000 | 6.25 | 05/01/2036 | 23,087,460 | |||||||||||
| Rivercrest Community Development District Special Assessment Series 2001 | ||||||||||||||
| 5,485,000 | 7.00 | 05/01/2032 | 5,894,071 | |||||||||||
| Riverside Park Community Development District Special Assessment Series 2004 | ||||||||||||||
| 2,025,000 | 6.13 | 05/01/2034 | 2,080,141 | |||||||||||
| Saddlebrook Community Development District Special Assessment Series 2001 A | ||||||||||||||
| 5,055,000 | 6.90 | 05/01/2033 | 5,403,947 | |||||||||||
| Saddlebrook Community Development District Special Assessment Series 2001 B | ||||||||||||||
| 110,000 | 6.25 | 05/01/2009 | 113,835 | |||||||||||
| Sampson Creek Community Development District Capital Improvement Special Assessment Series 2000 A | ||||||||||||||
| 2,285,000 | 6.95 | 05/01/2031 | 2,386,591 | |||||||||||
| Seven Oaks Community Development District I RB Special Assessment Series 2002 | ||||||||||||||
| 2,300,000 | 5.60 | 11/01/2007 | 2,314,766 | |||||||||||
| Seven Oaks Community Development District II RB Special Assessment Series 2003 A | ||||||||||||||
| 4,760,000 | 6.40 | 05/01/2034 | 5,041,840 | |||||||||||
38
| Principal | Interest | Maturity | ||||||||||||
| Amount | Rate | Date | Value | |||||||||||
Municipal Debt Obligations – (continued) | ||||||||||||||
| Florida – (continued) | ||||||||||||||
| Seven Oaks Community Development District II RB Special Assessment Series 2003 B | ||||||||||||||
| $ | 3,010,000 | 5.30 | % | 11/01/2008 | $ | 3,054,277 | ||||||||
| Seven Oaks Community Development District II RB Special Assessment Series 2004 A | ||||||||||||||
| 5,000,000 | 5.88 | 05/01/2035 | 5,063,850 | |||||||||||
| Seven Oaks Community Development District II RB Special Assessment Series 2004 B | ||||||||||||||
| 3,000,000 | 5.00 | 05/01/2009 | 3,021,990 | |||||||||||
| South Bay Community Development District RB for Capital Improvement Series 2005 A | ||||||||||||||
| 22,755,000 | 5.95 | 05/01/2036 | 23,196,219 | |||||||||||
| South Bay Community Development District RB for Capital Improvement Series 2005 B-1 | ||||||||||||||
| 5,500,000 | 5.13 | 11/01/2009 | 5,517,985 | |||||||||||
| South Bay Community Development District RB for Capital Improvement Series 2005 B-2 | ||||||||||||||
| 6,000,000 | 5.38 | 05/01/2013 | 6,070,920 | |||||||||||
| South Fork Community Development District RB Special Assessment Series 2004 A-1 | ||||||||||||||
| 525,000 | 5.90 | 05/01/2034 | 531,358 | |||||||||||
| South Fork Community Development District RB Special Assessment Series 2004 A-2 | ||||||||||||||
| 1,825,000 | 5.90 | 05/01/2035 | 1,841,261 | |||||||||||
| South Fork Community Development RB Series 2003 | ||||||||||||||
| 2,525,000 | 6.15 | 05/01/2033 | 2,612,845 | |||||||||||
| South Village Community Development District RB for Capital Improvement Series 2005 A | ||||||||||||||
| 13,500,000 | 5.70 | 05/01/2035 | 13,664,160 | |||||||||||
| South-Dade Venture Community Development District Special Assessment Series 2004 | ||||||||||||||
| 2,815,000 | 6.00 | 05/01/2024 | 2,906,290 | |||||||||||
| Southern Hills Plantation I Community Development District RB for Capital Improvement Series 2004 | ||||||||||||||
| 8,395,000 | 5.80 | 05/01/2035 | 8,524,199 | |||||||||||
| Southern Hills Plantation II Community Development District Capital Improvement Special Assessment Series 2004 | ||||||||||||||
| 3,610,000 | 5.85 | 05/01/2034 | 3,635,342 | |||||||||||
| Spicewood Community Development District Special Assessment Series 2003 A | ||||||||||||||
| 3,000,000 | 6.10 | 05/01/2034 | 3,104,610 | |||||||||||
| St. Johns Forest Community Development District RB for Capital Improvement Series 2003 A | ||||||||||||||
| 5,160,000 | 6.13 | 05/01/2034 | 5,564,492 | |||||||||||
| St. Johns Forest Community Development District RB for Capital Improvement Series 2003 B | ||||||||||||||
| 650,000 | 5.30 | 05/01/2010 | 662,097 | |||||||||||
| Sterling Hill Community Development District RB for Capital Improvement Series 2003 A | ||||||||||||||
| 4,000,000 | 6.20 | 05/01/2035 | 4,154,840 | |||||||||||
| Sterling Hill Community Development District RB for Capital Improvement Series 2003 B | ||||||||||||||
| 3,000,000 | 5.50 | 11/01/2010 | 3,042,150 | |||||||||||
| Stonegate Community Development District RB Special Assessment Series 2004 | ||||||||||||||
| 2,250,000 | 6.13 | 05/01/2034 | 2,329,470 | |||||||||||
| Stonelake Ranch Community Development District Special Assessment Series 2004 A | ||||||||||||||
| 3,615,000 | 5.90 | 05/01/2034 | 3,707,580 | |||||||||||
| Sumter County IDA RB for North Sumter Utility Co. LLC Project Series 2002 (AMT) | ||||||||||||||
| 6,870,000 | 6.80 | 10/01/2032 | 7,033,094 | |||||||||||
| Sumter County IDA RB for North Sumter Utility Co. LLC Project Series 2003 (AMT) | ||||||||||||||
| 4,625,000 | 6.90 | 10/01/2034 | 4,752,419 | |||||||||||
| Sumter Landing Community Development District Special Assessment Series 2003 | ||||||||||||||
| 10,000,000 | 6.95 | 05/01/2033 | 10,699,200 | |||||||||||
| Suncoast Community Development District RB for Capital Improvement Series 2004 A | ||||||||||||||
| 5,440,000 | 5.88 | 05/01/2034 | 5,518,173 | |||||||||||
| Tern Bay Community Development District BANS Series 2005 | ||||||||||||||
| 5,000,000 | 5.00 | 01/30/2006 | 4,985,600 | |||||||||||
| The Quarry Community Development District BANS Special Assessment Series 2004 | ||||||||||||||
| 50,000,000 | 5.00 | 11/01/2005 | 49,890,500 | |||||||||||
| Thousand Oaks Community Development District Special Assessment BANS Series 2004 | ||||||||||||||
| 2,700,000 | 5.00 | 08/01/2005 | 2,695,599 | |||||||||||
| Tomoka Community Development District Series 2004 A | ||||||||||||||
| 8,250,000 | 6.10 | 05/01/2035 | 8,541,720 | |||||||||||
| Town Center at Palm Coast Community Development District Special Assessment for Capital Improvement Series 2005 | ||||||||||||||
| 10,000,000 | 6.00 | 05/01/2036 | 10,207,700 | |||||||||||
| Turnbull Creek Community Development District Special Assessment Series 2005 | ||||||||||||||
| 7,000,000 | 5.80 | 05/01/2035 | 7,100,100 | |||||||||||
| University Place Community Development District Special Assessment Series 2001 A | ||||||||||||||
| 1,710,000 | 7.00 | 05/01/2032 | 1,849,126 | |||||||||||
| University Place Community Development District Special Assessment Series 2001 B | ||||||||||||||
| 135,000 | 6.10 | 05/01/2007 | 135,000 | |||||||||||
| Venetian Community Development District RB for Capital Improvement Series 2002 A | ||||||||||||||
| 4,000,000 | 6.75 | 05/01/2034 | 4,295,400 | |||||||||||
| Verona Walk Community Development District RB for Capital Improvement Series 2004 | ||||||||||||||
| 7,820,000 | 5.85 | 05/01/2035 | 7,907,428 | |||||||||||
| Village Center Community Development District Recreational RB SubSeries 1998 B | ||||||||||||||
| 2,050,000 | 8.25 | 01/01/2017 | 2,189,953 | |||||||||||
| Village Center Community Development District Recreational RB SubSeries 1998 C | ||||||||||||||
| 2,165,000 | 7.38 | 01/01/2019 | 2,315,273 | |||||||||||
| Village Center Community Development District Recreational RB SubSeries 2003 | ||||||||||||||
| 4,005,000 | 6.35 | 01/01/2018 | 4,283,628 | |||||||||||
39
April 30, 2005 (Unaudited)
| Principal | Interest | Maturity | ||||||||||||
| Amount | Rate | Date | Value | |||||||||||
Municipal Debt Obligations – (continued) | ||||||||||||||
| Florida – (continued) | ||||||||||||||
| Village Center Community Development District Recreational RB SubSeries 2004 B | ||||||||||||||
| $ | 5,570,000 | 5.88 | % | 01/01/2015 | $ | 5,814,579 | ||||||||
| Village Community Development District No. 3 Special Assessment Series 2002 | ||||||||||||||
| 7,600,000 | 6.50 | 05/01/2032 | 8,167,416 | |||||||||||
| Village Community Development District No. 4 Special Assessment Series 2000 | ||||||||||||||
| 3,275,000 | 7.15 | 05/01/2018 | 3,589,040 | |||||||||||
| Village Community Development District No. 4 Special Assessment Series 2002 | ||||||||||||||
| 4,580,000 | 6.88 | 05/01/2022 | 4,955,789 | |||||||||||
| 6,220,000 | 6.95 | 05/01/2032 | 6,791,120 | |||||||||||
| Village Community Development District No. 4 Special Assessment Series 2003 | ||||||||||||||
| 500,000 | 6.50 | 05/01/2033 | 536,320 | |||||||||||
| Village Community Development District No. 5 Special Assessment Series 2002 A | ||||||||||||||
| 18,930,000 | 6.50 | 05/01/2033 | 20,445,914 | |||||||||||
| Village Community Development District No. 5 Special Assessment Series 2002 B | ||||||||||||||
| 750,000 | 5.40 | 05/01/2007 | 758,730 | |||||||||||
| Village Community Development District No. 5 Special Assessment Series 2003 A | ||||||||||||||
| 4,455,000 | 6.00 | 05/01/2022 | 4,687,417 | |||||||||||
| 23,000,000 | 6.10 | 05/01/2034 | 24,211,410 | |||||||||||
| Village Community Development District No. 5 Special Assessment Series 2003 B | ||||||||||||||
| 8,085,000 | 5.00 | 05/01/2008 | 8,170,378 | |||||||||||
| Village Community Development District No. 6 Special Assessment RB Series 2004 | ||||||||||||||
| 5,710,000 | 5.63 | 05/01/2022 | 5,845,213 | |||||||||||
| 44,535,000 | 5.80 | 05/01/2035 | 45,683,558 | |||||||||||
| Villages of Westport Community Development District RB for Capital Improvement Series 2005 A | ||||||||||||||
| 10,000,000 | 5.70 | 05/01/2035 | 10,091,300 | |||||||||||
| Villasol Community Development District Special Assessment RB Series 2003 A | ||||||||||||||
| 4,160,000 | 6.60 | 05/01/2034 | 4,449,453 | |||||||||||
| Villasol Community Development District Special Assessment RB Series 2003 B | ||||||||||||||
| 1,220,000 | 5.38 | 05/01/2008 | 1,237,568 | |||||||||||
| Vista Lakes Community Development District RB for Capital Improvement Series 2002 A | ||||||||||||||
| 3,705,000 | 6.75 | 05/01/2034 | 3,957,977 | |||||||||||
| Vizcaya Community Development District Special Assessment Series 2002 | ||||||||||||||
| 1,315,000 | 5.90 | 05/01/2007 | 1,332,687 | |||||||||||
| Vizcaya Community Development District Special Assessment Series 2003 B | ||||||||||||||
| 3,325,000 | 5.40 | 11/01/2007 | 3,366,562 | |||||||||||
| Walnut Creek Community Development District Special Assessment Series 2000 A | ||||||||||||||
| 4,030,000 | 7.30 | 05/01/2021 | 4,391,169 | |||||||||||
| Waterchase Community Development District RB for Capital Improvement Series 2001 A | ||||||||||||||
| 2,905,000 | 6.70 | 05/01/2032 | 3,091,559 | |||||||||||
| Waterlefe Community Development District RB for Capital Improvement Series 2001 A | ||||||||||||||
| 965,000 | 6.95 | 05/01/2031 | 1,037,095 | |||||||||||
| Westchester Community Development District No. 1 Special Assessment for Community Infrastructure Series 2003 | ||||||||||||||
| 3,000,000 | 6.00 | 05/01/2023 | 3,130,230 | |||||||||||
| 24,250,000 | 6.13 | 05/01/2035 | 25,305,602 | |||||||||||
| Westside Community Development District BANS Series 2005 | ||||||||||||||
| 4,000,000 | 5.00 | 02/01/2006 | 3,979,400 | |||||||||||
| World Commerce Community Development District Special Assessment Series 2004 A-1 | ||||||||||||||
| 1,000,000 | 6.25 | 05/01/2022 | 1,031,260 | |||||||||||
| 500,000 | 6.50 | 05/01/2036 | 522,305 | |||||||||||
| World Commerce Community Development District Special Assessment Series 2004 A-2 | ||||||||||||||
| 3,000,000 | 6.13 | 05/01/2035 | 3,130,440 | |||||||||||
| Wyndam Park Community Development District Special Assessment Series 2003 | ||||||||||||||
| 2,500,000 | 6.38 | 05/01/2034 | 2,634,575 | |||||||||||
| $ | 1,267,397,216 | |||||||||||||
| Georgia – 0.6% | ||||||||||||||
| Atlanta Tax Allocation RB for Atlantic Station Project Series 2001 | ||||||||||||||
| $ | 10,000,000 | 7.75 | % | 12/01/2014 | $ | 10,930,100 | ||||||||
| Chatham County Hospital Authority RB for Hospital Improvement Memorial Health University Series 2004 A (A-/A3) | ||||||||||||||
| 3,675,000 | 5.50 | 01/01/2034 | 3,897,999 | |||||||||||
| Dekalb County Development Authority RB for Dekalb Senior Center Project Series 2004 | ||||||||||||||
| 5,845,000 | 4.85 | 06/01/2009 | 5,931,681 | |||||||||||
| Fulton County Residential Care Facilities RB for Canterbury Court Project Series 2004 A | ||||||||||||||
| 1,750,000 | 6.13 | 02/15/2034 | 1,766,608 | |||||||||||
| Tift County IDA RB for Beverly Enterprises Project Series 2000 | ||||||||||||||
| 830,000 | 7.50 | 07/01/2010 | 833,121 | |||||||||||
| $ | 23,359,509 | |||||||||||||
| Guam – 0.1% | ||||||||||||||
| Guam Government GO Bonds Series 1993 A (B) | ||||||||||||||
| $ | 5,000,000 | 5.38 | % | 11/15/2013 | $ | 5,006,250 | ||||||||
| Hawaii – 0.3% | ||||||||||||||
| Hawaii Airport System RB Series 2001 II-R-59 (AMT) (FGIC) (RITES) (Aaa)(b)(c) | ||||||||||||||
| $ | 2,500,000 | 13.45 | % | 07/01/2015 | $ | 3,601,800 | ||||||||
| Hawaii Department of Transport Special Facilities RB for Continental Airlines Inc. Series 1997 (AMT) (B/Caa2) | ||||||||||||||
| 6,855,000 | 5.63 | 11/15/2027 | 4,938,479 | |||||||||||
40
| Principal | Interest | Maturity | ||||||||||||
| Amount | Rate | Date | Value | |||||||||||
Municipal Debt Obligations – (continued) | ||||||||||||||
| Hawaii – (continued) | ||||||||||||||
| Hawaii Department of Transport Special Facilities RB for Continental Airlines Inc. Series 2000 (AMT) (B/Caa2) | ||||||||||||||
| $ | 460,000 | 7.00 | % | 06/01/2020 | $ | 402,541 | ||||||||
| Hawaii Improvement District RB No. 17 Special Assessment Kaloko Subdivision Series 2001 | ||||||||||||||
| 3,225,000 | 7.38 | 08/01/2011 | 3,367,771 | |||||||||||
| $ | 12,310,591 | |||||||||||||
| Illinois – 1.6% | ||||||||||||||
| Chicago Illinois Special Assessment for Lake Shore East Series 2003 | ||||||||||||||
| $ | 4,000,000 | 6.75 | % | 12/01/2032 | $ | 4,220,800 | ||||||||
| Chicago Illinois Tax Increment for Allocation Sub-Central Loop Redevelopment Series 2000 A | ||||||||||||||
| 250,000 | 6.50 | 12/01/2005 | 252,540 | |||||||||||
| Chicago Illinois Tax Increment for Central Loop Redevelopment Series 2000 A | ||||||||||||||
| 6,550,000 | 6.50 | 12/01/2007 | 7,043,018 | |||||||||||
| Chicago Illinois Tax Increment Junior Lien for Central Loop Redevelopment Project Series 2000 A (ACA) (A) | ||||||||||||||
| 2,000,000 | 6.50 | 12/01/2008 | 2,175,360 | |||||||||||
| Chicago Illinois Tax Increment RB for Central Loop Redevelopment Series 2000 A (ACA) (A) | ||||||||||||||
| 250,000 | 6.50 | 12/01/2006 | 261,898 | |||||||||||
| Chicago Single Family Mortgage RB for Collateral Series 2001 A (FHLMC/FNMA/GNMA) (AMT) (AAA/Aaa) | ||||||||||||||
| 3,015,000 | 6.25 | 10/01/2032 | 3,045,060 | |||||||||||
| Illinois Development Finance Authority PCRB for Amerencips Series 2000 A (A/A2)(a) | ||||||||||||||
| 6,050,000 | 5.50 | 02/28/2014 | 6,279,597 | |||||||||||
| Illinois Educational Facilities Authority Student Housing RB for Educational Advancement Fund University Center Project Series 2002 (Baa2) | ||||||||||||||
| 8,000,000 | 6.25 | 05/01/2030 | 8,601,360 | |||||||||||
| 7,840,000 | 6.25 | 05/01/2034 | 8,122,710 | |||||||||||
| Illinois Finance Authority Student Housing RB for MJH Educational Assistance IV-SR Series 2004 A (Baa2) | ||||||||||||||
| 6,905,000 | 5.00 | 06/01/2024 | 6,944,773 | |||||||||||
| 5,760,000 | 5.13 | 06/01/2035 | 5,761,843 | |||||||||||
| Illinois Finance Authority Student Housing RB for MJH Educational Assistance IV-Subseries 2004 B (Baa3) | ||||||||||||||
| 2,075,000 | 5.00 | 06/01/2024 | 2,066,078 | |||||||||||
| 4,000,000 | 5.38 | 06/01/2035 | 4,001,240 | |||||||||||
| Illinois Health Facilities Authority RB for Loyola University Health Systems Series 2001 A (Baa1) | ||||||||||||||
| 2,000,000 | 6.00 | 07/01/2021 | 2,166,360 | |||||||||||
| Lincolnshire Special Service Area No. 1 Special Tax for Sedgebrook Project Series 2004 | ||||||||||||||
| 1,805,000 | 6.25 | 03/01/2034 | 1,902,380 | |||||||||||
| Ottawa Illinois Health Care Facilities RB for Ottawa Community Hospital Series 2004 (Radian) (AA) | ||||||||||||||
| 1,900,000 | 5.13 | 08/15/2019 | 2,008,357 | |||||||||||
| 1,100,000 | 5.00 | 08/15/2021 | 1,137,895 | |||||||||||
| $ | 65,991,269 | |||||||||||||
| Indiana – 0.3% | ||||||||||||||
| Indiana Health Facility Financing Authority Hospital RB for Community Foundation Northwest Industry Series 2001 A (BBB-) | ||||||||||||||
| $ | 1,500,000 | 6.38 | % | 08/01/2031 | $ | 1,587,405 | ||||||||
| Indianapolis Airport Authority RB for Special Facilities Federal Express Corp. Project Series 2004 (AMT) (BBB/Baa2) | ||||||||||||||
| 7,360,000 | 5.10 | 01/15/2017 | 7,764,579 | |||||||||||
| Indianapolis Airport Authority RB for Special Facilities United Air Lines Project Series 1995 A (AMT)(f) | ||||||||||||||
| 10,000,000 | 6.50 | 11/15/2031 | 952,400 | |||||||||||
| Jasper County Industrial Economic Development RB for Georgia Pacific Corp. Project Series 2000 (AMT) (Ba3) | ||||||||||||||
| 2,500,000 | 6.70 | 04/01/2029 | 2,630,350 | |||||||||||
| $ | 12,934,734 | |||||||||||||
| Iowa – 1.6% | ||||||||||||||
| Tobacco Settlement Authority RB for Iowa Asset Backed Bonds Series 2001 B (BBB/Baa3) | ||||||||||||||
| $ | 39,410,000 | 5.60 | % | 06/01/2035 | $ | 37,385,114 | ||||||||
| Tobacco Settlement Authority RB Series 2001 B (BBB/Baa3) | ||||||||||||||
| 28,240,000 | 5.30 | 06/01/2025 | 26,733,679 | |||||||||||
| $ | 64,118,793 | |||||||||||||
| Kansas – 0.1% | ||||||||||||||
| Olathe Senior Living Facilities RB Refunding for Aberdeen Village Inc. Series 2005 A | ||||||||||||||
| $ | 3,500,000 | 5.60 | % | 05/15/2028 | $ | 3,524,710 | ||||||||
| Kentucky – 0.2% | ||||||||||||||
| Kenton County Airport Board RB for Special Facilities Delta Airlines Project Series 1992 A (AMT) (C/Ca) | ||||||||||||||
| $ | 45,000 | 6.13 | % | 02/01/2022 | $ | 34,291 | ||||||||
| Kentucky Economic Development Finance Authority RB for Appalachian Regional Health Care Series 1997 (BB-) | ||||||||||||||
| 500,000 | 5.70 | 10/01/2010 | 494,145 | |||||||||||
| Kentucky Economic Development Finance Authority RB for Norton Healthcare Inc. Series 2000 B (MBIA) (AAA/Aaa)(g) | ||||||||||||||
| 2,000,000 | 0.00 | 10/01/2022 | 872,860 | |||||||||||
| Kentucky Economic Development Finance Authority RB for Norton Healthcare Inc. Series 2000 C (MBIA) (AAA/Aaa)(h) | ||||||||||||||
| 6,750,000 | 0.00/6.00 | 10/01/2018 | 7,442,347 | |||||||||||
| $ | 8,843,643 | |||||||||||||
| Louisiana – 2.0% | ||||||||||||||
| Hodge Utility RB Series 2003 (AMT) (B) | ||||||||||||||
| $ | 6,750,000 | 7.45 | % | 03/01/2024 | $ | 8,129,430 | ||||||||
| Louisiana State Gas & Fuels Tax RB Series 2005 A (FGIC) (AAA/Aaa) | ||||||||||||||
| 25,000,000 | 5.00 | 05/01/2035 | 26,264,000 | |||||||||||
| Louisiana State Offshore Terminal Authority Deepwater Port RB for Loop LLC Project Series 2003 C (A/A3) | ||||||||||||||
| 5,000,000 | 5.25 | 09/01/2015 | 5,318,350 | |||||||||||
| 3,500,000 | 5.25 | 09/01/2016 | 3,702,790 | |||||||||||
41
April 30, 2005 (Unaudited)
| Principal | Interest | Maturity | ||||||||||||
| Amount | Rate | Date | Value | |||||||||||
Municipal Debt Obligations – (continued) | ||||||||||||||
| Louisiana – (continued) | ||||||||||||||
| Saint Charles Parish PCRB Series 1999 A (BBB-/Baa2)(a) | ||||||||||||||
| $ | 2,000,000 | 4.90 | % | 06/01/2005 | $ | 2,001,840 | ||||||||
| Tobacco Settlement Financing Corp. RB for Louisiana Asset Backed Bonds Series 2001 B (BBB/Baa3) | ||||||||||||||
| 14,450,000 | 5.50 | 05/15/2030 | 14,238,308 | |||||||||||
| 19,150,000 | 5.88 | 05/15/2039 | 19,083,549 | |||||||||||
| West Feliciana Parish PCRB for Gulf State Utilities Co. Series 1984 (BBB-/Ba1) | ||||||||||||||
| 1,500,000 | 7.70 | 12/01/2014 | 1,505,745 | |||||||||||
| $ | 80,244,012 | |||||||||||||
| Maryland – 1.0% | ||||||||||||||
| Baltimore Maryland Special Obligation RB for Clipper Mill Project Series 2004 | ||||||||||||||
| $ | 4,627,000 | 6.25 | % | 09/01/2033 | $ | 4,810,692 | ||||||||
| Baltimore Maryland Special Obligation RB for Harborview Lot No. 2 Series 2003 | ||||||||||||||
| 3,000,000 | 6.50 | 07/01/2031 | 3,170,400 | |||||||||||
| Baltimore Maryland Special Obligation RB for Strathdale Manor Project Series 2003 | ||||||||||||||
| 3,750,000 | 7.00 | 07/01/2033 | 4,037,737 | |||||||||||
| Maryland State Department of Transportation RB Series 2004 PA 1259 (RITES)(b) | ||||||||||||||
| 5,825,000 | 10.32 | 05/01/2014 | 8,349,555 | |||||||||||
| Maryland State Health & Higher Educational Facilities Authority RB for Medstar Health Series 2004 (BBB/Baa1) | ||||||||||||||
| 1,000,000 | 5.75 | 08/15/2016 | 1,114,790 | |||||||||||
| 4,500,000 | 5.38 | 08/15/2024 | 4,719,105 | |||||||||||
| 10,750,000 | 5.50 | 08/15/2033 | 11,323,835 | |||||||||||
| Westminster Maryland Economic Development RB for Carroll Lutheran Village Series 2004 A | ||||||||||||||
| 4,000,000 | 6.25 | 05/01/2034 | 4,163,080 | |||||||||||
| $ | 41,689,194 | |||||||||||||
| Massachusetts – 0.5% | ||||||||||||||
| Massachusetts GO Bonds Series 2001 II-R-101(FSA) (AAA/Aaa)(b) | ||||||||||||||
| $ | 2,500,000 | 16.08 | % | 12/01/2014 | $ | 3,499,425 | ||||||||
| Massachusetts Health and Educational Facilities Authority RB for Civic Investments Series 2002 A | ||||||||||||||
| 3,000,000 | 9.00 | 12/15/2015 | 3,454,230 | |||||||||||
| Massachusetts Health and Educational Facilities Authority RB for Civic Investments Series 2002 B | ||||||||||||||
| 2,000,000 | 9.20 | 12/15/2031 | 2,326,460 | |||||||||||
| Massachusetts Health and Educational Facilities Authority RB for Saint Memorial Medical Center Series 1993 A (Ba2) | ||||||||||||||
| 530,000 | 5.75 | 10/01/2006 | 532,263 | |||||||||||
| 5,400,000 | 6.00 | 10/01/2023 | 5,421,060 | |||||||||||
| Massachusetts State Development Finance Agency RB for First Mortgage Brokhaven Series 2005 A (Radian) (AA) | ||||||||||||||
| 2,975,000 | 4.50 | 03/01/2018 | 3,000,734 | |||||||||||
| 1,250,000 | 5.00 | 03/01/2035 | 1,260,562 | |||||||||||
| Massachusetts State Development Finance Agency RB for Hampshire College Series 2004 (BBB/Baa2) | ||||||||||||||
| 1,000,000 | 5.63 | 10/01/2024 | 1,071,990 | |||||||||||
| 1,000,000 | 5.70 | 10/01/2034 | 1,062,000 | |||||||||||
| $ | 21,628,724 | |||||||||||||
| Michigan – 1.1% | ||||||||||||||
| Flint Michigan Hospital Building Authority RB for Hurley Medical Center Refunding Series 2003 (BBB-/Baa3) | ||||||||||||||
| $ | 3,205,000 | 5.50 | % | 07/01/2008 | $ | 3,281,279 | ||||||||
| Flint Michigan Hospital Building Authority RB for Hurley Medical Center Series 1998 B (Baa3) | ||||||||||||||
| 1,250,000 | 5.38 | 07/01/2028 | 1,185,713 | |||||||||||
| Michigan State Hospital Finance Authority RB for Marquette General Hospital Obligation Group Series 2005 A (Baa1) | ||||||||||||||
| 1,530,000 | 5.00 | 05/15/2026 | 1,554,113 | |||||||||||
| 2,000,000 | 5.00 | 05/15/2034 | 2,006,220 | |||||||||||
| Michigan State Hospital Finance Authority RB Series 2005 (MBIA) (AAA/Aaa) | ||||||||||||||
| 3,000,000 | 5.00 | 11/15/2036 | 3,115,050 | |||||||||||
| Midland County Economic Development RB for Obligation-Midland Series 2000 B (BB-/Ba3) | ||||||||||||||
| 5,000,000 | 6.75 | 07/23/2009 | 5,180,200 | |||||||||||
| Midland County Economic Development RB for Sub-Ltd. Obligation Series 2000 A (AMT) (BB-/Ba3) | ||||||||||||||
| 11,150,000 | 6.88 | 07/23/2009 | 11,624,321 | |||||||||||
| Wayne Charter County Special Airport Facilities RB for Northwest Airlines Inc. Series 1995 | ||||||||||||||
| 13,250,000 | 6.75 | 12/01/2015 | 11,354,190 | |||||||||||
| Wayne Charter County Special Airport Facilities RB for Northwest Airlines Inc. Series 1999 (AMT) | ||||||||||||||
| 8,235,000 | 6.00 | 12/01/2029 | 6,436,311 | |||||||||||
| $ | 45,737,397 | |||||||||||||
| Minnesota – 0.8% | ||||||||||||||
| Becker PCRB for Northern States Power Series 2000 A (A-/A2) | ||||||||||||||
| $ | 10,000,000 | 8.50 | % | 04/01/2030 | $ | 12,273,500 | ||||||||
| Duluth Economic Development Authority Health Care Facilities RB for St. Luke’s Hospital Series 2002 (BB) | ||||||||||||||
| 7,500,000 | 7.25 | 06/15/2032 | 7,966,950 | |||||||||||
| Minneapolis and St. Paul Metropolitan Airports Special Facilities RB for Northwest Airlines Project Series 2001 A (AMT) | ||||||||||||||
| 3,100,000 | 7.00 | 04/01/2025 | 2,852,093 | |||||||||||
| Minneapolis and St. Paul Metropolitan Airports Special Facilities RB for Northwest Airlines Project Series 2005 (AMT) | ||||||||||||||
| 5,000,000 | 7.38 | 04/01/2025 | 4,783,650 | |||||||||||
| St. Paul Housing and Redevelopment Hospital Authority RB for Healtheast Project Series 1993 A (BB+/Ba1) | ||||||||||||||
| 4,175,000 | 6.63 | 11/01/2017 | 4,199,841 | |||||||||||
| $ | 32,076,034 | |||||||||||||
42
| Principal | Interest | Maturity | ||||||||||||
| Amount | Rate | Date | Value | |||||||||||
Municipal Debt Obligations – (continued) | ||||||||||||||
| Mississippi – 0.5% | ||||||||||||||
| Mississippi Business Finance Corp. PCRB for Systems Energy Resources Inc. Project Series 1998 (BBB-/Ba1) | ||||||||||||||
| $ | 13,635,000 | 5.88 | % | 04/01/2022 | $ | 13,776,668 | ||||||||
| Mississippi Home Corp. Housing RB for Mississippi Valley State Student Housing Project Series 2003 8A (ACA) (A) | ||||||||||||||
| 5,000,000 | 5.50 | 12/01/2035 | 5,085,200 | |||||||||||
| $ | 18,861,868 | |||||||||||||
| Missouri – 0.5% | ||||||||||||||
| Kansas City IDA Health Facilities RB for First Mortgage Bishop Spencer Series 2004 A | ||||||||||||||
| $ | 2,150,000 | 5.50 | % | 01/01/2009 | $ | 2,184,034 | ||||||||
| 1,000,000 | 6.25 | 01/01/2024 | 1,039,330 | |||||||||||
| 2,500,000 | 6.50 | 01/01/2035 | 2,597,125 | |||||||||||
| Kansas City IDA RB for Air Cargo Series 2002 (AMT) (Baa3) | ||||||||||||||
| 1,295,000 | 6.25 | 01/01/2030 | 1,325,653 | |||||||||||
| Missouri State Environmental Improvement & Energy Resource Authority RB for Kansas City Power & Light Series 1993 (BBB/A2) | ||||||||||||||
| 5,845,000 | 4.00 | 01/02/2012 | 5,899,241 | |||||||||||
| St. Louis IDA MF Hsg. for Vaughn Elderly Apartments Project Series 2004 (AMT)(a) | ||||||||||||||
| 2,610,000 | 4.00 | 12/20/2006 | 2,647,767 | |||||||||||
| St. Louis IDA MF Hsg. RB for Bluemeyer Elderly Apartments Project Series 2004 (AMT)(a) | ||||||||||||||
| 6,500,000 | 3.13 | 08/20/2006 | 6,492,850 | |||||||||||
| $ | 22,186,000 | |||||||||||||
| Montana(a) – 0.3% | ||||||||||||||
| Forsyth Montana PCRB Refunding Portland General Series 1998 A-RMKT 5/1/03 (BBB+/Baa2) | ||||||||||||||
| $ | 10,500,000 | 5.20 | % | 05/01/2009 | $ | 11,087,475 | ||||||||
| Nevada – 1.9% | ||||||||||||||
| Clark County Improvement District No. 142-LOC Special Assessment Series 2003 | ||||||||||||||
| $ | 1,460,000 | 5.80 | % | 08/01/2015 | $ | 1,504,822 | ||||||||
| 5,000,000 | 6.10 | 08/01/2018 | 5,151,650 | |||||||||||
| 4,000,000 | 6.38 | 08/01/2023 | 4,120,960 | |||||||||||
| Clark County Industrial Development RB for Nevada Power Co. Project Series 1995 A (AMT) (B-) | ||||||||||||||
| 10,380,000 | 5.60 | 10/01/2030 | 10,187,658 | |||||||||||
| Clark County Industrial Development RB for Nevada Power Co. Project Series 1995 B (AMT) (B-) | ||||||||||||||
| 13,665,000 | 5.90 | 10/01/2030 | 13,671,422 | |||||||||||
| Clark County Industrial Development RB for Nevada Power Co. Project Series 1995 C (B-) | ||||||||||||||
| 710,000 | 5.50 | 10/01/2030 | 701,473 | |||||||||||
| Clark County Industrial Development RB for Southwest Gas Corp. Project Series 2003 C (BBB-/Baa2)(a) | ||||||||||||||
| 4,835,000 | 5.45 | 03/01/2013 | 5,161,121 | |||||||||||
| Clark County School District GO Bonds Series 2003 PA 1220 (MBIA) (RITES) (AAA)(b) | ||||||||||||||
| 4,475,000 | 16.25 | 06/15/2012 | 6,807,728 | |||||||||||
| Henderson Local Improvement Districts No. T-14 Special Assessment Series 2003 | ||||||||||||||
| 1,980,000 | 5.55 | 03/01/2017 | 2,041,301 | |||||||||||
| Henderson Local Improvement Districts No. T-16 Special Assessment Series 2005 | ||||||||||||||
| 620,000 | 4.50 | 03/01/2008 | 632,226 | |||||||||||
| 1,060,000 | 4.90 | 03/01/2017 | 1,052,421 | |||||||||||
| 1,555,000 | 5.00 | 03/01/2020 | 1,537,257 | |||||||||||
| 820,000 | 5.10 | 03/01/2022 | 815,359 | |||||||||||
| 1,200,000 | 5.13 | 03/01/2025 | 1,188,852 | |||||||||||
| Las Vegas Local Improvement Bonds Special Assessment District No. 808 Summerlin Area Series 2001 | ||||||||||||||
| 1,145,000 | 5.70 | 06/01/2008 | 1,176,064 | |||||||||||
| 1,990,000 | 6.75 | 06/01/2021 | 2,050,735 | |||||||||||
| Las Vegas Local Improvement Bonds Special Assessment for Special Improvement District No. 607 Series 2004 | ||||||||||||||
| 1,335,000 | 5.90 | 06/01/2017 | 1,375,304 | |||||||||||
| 1,375,000 | 5.90 | 06/01/2018 | 1,416,484 | |||||||||||
| 500,000 | 6.00 | 06/01/2019 | 515,100 | |||||||||||
| 5,000,000 | 6.25 | 06/01/2024 | 5,150,750 | |||||||||||
| North Las Vegas Local Improvement Special Assessment for Special Improvement District No. 60-Aliante Series 2003 | ||||||||||||||
| 1,000,000 | 6.13 | 12/01/2017 | 1,030,260 | |||||||||||
| 1,500,000 | 6.40 | 12/01/2022 | 1,545,360 | |||||||||||
| Washoe County Water Facilities RB for Sierra Pacific Power Co. Series 2001 (AMT) (BB/Ba2)(a) | ||||||||||||||
| 8,000,000 | 5.00 | 07/01/2009 | 8,041,920 | |||||||||||
| $ | 76,876,227 | |||||||||||||
| New Hampshire – 0.1% | ||||||||||||||
| New Hampshire Health & Educational Facilities Authority RB for Southern New Hampshire Medical Center Series 2004 A (Radian) (AA) | ||||||||||||||
| $ | 900,000 | 5.00 | % | 10/01/2013 | $ | 965,691 | ||||||||
| 1,800,000 | 5.00 | 10/01/2015 | 1,928,250 | |||||||||||
| 500,000 | 5.00 | 10/01/2018 | 523,675 | |||||||||||
| New Hampshire Health & Educational Facilities Authority RB for Speare Memorial Hospital Series 2004 | ||||||||||||||
| 1,000,000 | 5.50 | 07/01/2025 | 1,014,550 | |||||||||||
| 1,400,000 | 5.88 | 07/01/2034 | 1,433,530 | |||||||||||
| $ | 5,865,696 | |||||||||||||
| New Jersey – 4.8% | ||||||||||||||
| New Jersey Economic Development Authority RB for First Mortgage of The Presbyterian Home Series 2001 A | ||||||||||||||
| $ | 1,500,000 | 6.25 | % | 11/01/2020 | $ | 1,555,230 | ||||||||
| New Jersey Economic Development Authority Retirement RB for Seabrook Village Inc. Series 2000 A | ||||||||||||||
| 2,500,000 | 8.00 | 11/15/2015 | 2,808,050 | |||||||||||
| New Jersey Economic Development Authority Special Facilities RB for Continental Airlines Inc. Project Series 1998 (AMT) (CCC+/Caa2) | ||||||||||||||
| 7,480,000 | 5.50 | 04/01/2028 | 4,954,677 | |||||||||||
43
April 30, 2005 (Unaudited)
| Principal | Interest | Maturity | ||||||||||||
| Amount | Rate | Date | Value | |||||||||||
Municipal Debt Obligations – (continued) | ||||||||||||||
| New Jersey – (continued) | ||||||||||||||
| New Jersey Economic Development Authority Special Facilities RB for Continental Airlines Inc. Project Series 1999 (AMT) (B/Caa2) | ||||||||||||||
| $ | 900,000 | 6.63 | % | 09/15/2012 | $ | 837,810 | ||||||||
| 5,190,000 | 6.25 | 09/15/2019 | 4,428,368 | |||||||||||
| 4,060,000 | 6.40 | 09/15/2023 | 3,453,842 | |||||||||||
| 10,635,000 | 6.25 | 09/15/2029 | 8,644,128 | |||||||||||
| New Jersey Health Care Facilities Financing Authority RB for Palisades Medical Center of New York Healthcare Series 2002 (BBB-/Baa3) | ||||||||||||||
| 820,000 | 6.50 | 07/01/2021 | 882,008 | |||||||||||
| 500,000 | 6.63 | 07/01/2031 | 538,395 | |||||||||||
| New Jersey Health Care Facilities Financing Authority RB for South Jersey Hospital Series 2002 (Baa1) | ||||||||||||||
| 2,000,000 | 6.00 | 07/01/2032 | 2,126,380 | |||||||||||
| New Jersey Health Care Facilities Financing Authority RB for St. Peters University Hospital Series 2000 A (BBB+/Baa1) | ||||||||||||||
| 1,500,000 | 6.88 | 07/01/2030 | 1,665,900 | |||||||||||
| New Jersey State Educational Facilities Authority RB for Fairleigh Dickinson Series 2004 C | ||||||||||||||
| 1,000,000 | 5.50 | 07/01/2023 | 1,052,070 | |||||||||||
| Tobacco Settlement Financing Corp. RB for New Jersey Asset Backed Bonds Series 2002 (BBB/Baa3) | ||||||||||||||
| 62,770,000 | 5.75 | 06/01/2032 | 62,724,178 | |||||||||||
| 20,725,000 | 6.00 | 06/01/2037 | 20,709,664 | |||||||||||
| 20,300,000 | 6.13 | 06/01/2042 | 20,441,288 | |||||||||||
| Tobacco Settlement Financing Corp. RB Series 2003 (BBB/Baa3) | ||||||||||||||
| 7,630,000 | 6.75 | 06/01/2039 | 8,087,190 | |||||||||||
| 5,130,000 | 7.00 | 06/01/2041 | 5,536,347 | |||||||||||
| 32,345,000 | 6.25 | 06/01/2043 | 32,731,846 | |||||||||||
| Union County Utilities Authority RB for Ogden Martin Series 1998 A (AMBAC) (AMT) (AAA/Aaa) | ||||||||||||||
| 6,970,000 | 5.50 | 06/01/2009 | 7,473,025 | |||||||||||
| 3,625,000 | 5.50 | 06/01/2010 | 3,913,840 | |||||||||||
| $ | 194,564,236 | |||||||||||||
| New Mexico – 0.5% | ||||||||||||||
| Farmington PCRB for El Paso Electric Co. Project Series 2002 A (BBB-/Baa3)(a) | ||||||||||||||
| $ | 7,500,000 | 6.38 | % | 08/01/2005 | $ | 7,566,825 | ||||||||
| Farmington PCRB for Public Service Co. San Juan Series 1996 B (BBB/Baa2) | ||||||||||||||
| 2,500,000 | 6.30 | 12/01/2016 | 2,674,825 | |||||||||||
| Farmington PCRB for Southern California Edison Co. Series 1993 A (MBIA) (AAA/Aaa) | ||||||||||||||
| 5,000,000 | 5.88 | 06/01/2023 | 5,013,550 | |||||||||||
| Farmington PCRB for Tucson Electric Power Co. San Juan Series 1997 A (B+/Ba1) | ||||||||||||||
| 3,000,000 | 6.95 | 10/01/2020 | 3,159,060 | |||||||||||
| $ | 18,414,260 | |||||||||||||
| New York – 3.3% | ||||||||||||||
| Metropolitan Transportation Authority RB Series 2002 PA 1027 (RITES) (AMBAC)(b) | ||||||||||||||
| $ | 5,000,000 | 7.78 | % | 11/15/2015 | $ | 6,285,600 | ||||||||
| Nassau County IDA Civic Facility RB for North Shore Health System Project Series 2001 A (A3) | ||||||||||||||
| 400,000 | 6.25 | 11/01/2021 | 435,508 | |||||||||||
| Nassau County IDA Civic Facility RB for North Shore Health System Project Series 2001 B (A3) | ||||||||||||||
| 1,135,000 | 5.88 | 11/01/2011 | 1,245,413 | |||||||||||
| Nassau County IDA Civic Facility RB for North Shore Health System Project Series 2001 C (A3) | ||||||||||||||
| 720,000 | 5.63 | 11/01/2010 | 777,542 | |||||||||||
| Nassau County IDA Civic Facility RB for North Shore Health System Project Series 2001 D (A3) | ||||||||||||||
| 1,000,000 | 5.63 | 11/01/2009 | 1,070,020 | |||||||||||
| New York City IDA Civic Facility RB for Polytechnical University Project (BB+/Ba3) | ||||||||||||||
| 150,000 | 5.20 | 11/01/2007 | 149,999 | |||||||||||
| New York City IDA Civic Facility RB for Polytechnical University Project Series 2000 (BB+/Ba3) | ||||||||||||||
| 2,000,000 | 6.00 | 11/01/2020 | 2,011,760 | |||||||||||
| New York City IDA Civic Facility RB for Staten Island University Hospital Series 2000 (Ba3) | ||||||||||||||
| 1,000,000 | 6.38 | 07/01/2031 | 1,001,090 | |||||||||||
| New York City IDA RB for Liberty 7 World Trade Center Project Series 2005 B | ||||||||||||||
| 20,000,000 | 6.75 | 03/01/2015 | 20,426,800 | |||||||||||
| New York City IDA Special Facilities RB for British Airways PLC Project Series 1998 (AMT) (BB-/Ba2) | ||||||||||||||
| 4,135,000 | 5.25 | 12/01/2032 | 3,526,907 | |||||||||||
| 1,530,000 | 7.63 | 12/01/2032 | 1,598,972 | |||||||||||
| New York City IDA Special Facilities RB for Continental Airlines Inc. Series 2003 (AMT) (CCC+) | ||||||||||||||
| 2,265,000 | 7.25 | 11/01/2008 | 2,244,456 | |||||||||||
| 4,055,000 | 8.00 | 11/01/2012 | 3,833,556 | |||||||||||
| 2,685,000 | 8.38 | 11/01/2016 | 2,498,017 | |||||||||||
| New York City Transitional Finance Authority RB Series 2002 R PA 1043 (RITES) (AAA)(b) | ||||||||||||||
| 8,000,000 | 7.78 | 11/01/2026 | 9,716,640 | |||||||||||
| New York Convention Center Operating Corp. COPS for Yale Building Acquisition Project Series 2003 | ||||||||||||||
| 4,000,000 | 5.25 | 06/01/2008 | 4,086,280 | |||||||||||
| New York GO Bonds Series 2003 A (A/A1) | ||||||||||||||
| 4,000,000 | 5.00 | 08/01/2012 | 4,338,040 | |||||||||||
| New York GO Bonds Series 2003 D (A/A1) | ||||||||||||||
| 6,520,000 | 5.25 | 10/15/2018 | 7,036,123 | |||||||||||
| New York GO Bonds Series 2005 M (A/A1) | ||||||||||||||
| 4,000,000 | 5.00 | 04/01/2025 | 4,177,840 | |||||||||||
| New York State Dormitory Authority RB for New York Methodist Hospital Series 2004 (A3) | ||||||||||||||
| 1,000,000 | 5.25 | 07/01/2024 | 1,050,360 | |||||||||||
| New York State Dormitory Authority RB for North Shore Long Island Jewish Group Series 2003 (A3) | ||||||||||||||
| 6,620,000 | 5.00 | 05/01/2018 | 6,926,043 | |||||||||||
44
| Principal | Interest | Maturity | ||||||||||||
| Amount | Rate | Date | Value | |||||||||||
Municipal Debt Obligations – (continued) | ||||||||||||||
| New York – (continued) | ||||||||||||||
| New York State Energy Research and Development Authority RB for Brooklyn Union Gas-B-RMKT-5/13/92 Series 1989 (MBIA) (AMT) (AAA/Aaa) | ||||||||||||||
| $ | 6,830,000 | 6.75 | % | 02/01/2024 | $ | 6,894,612 | ||||||||
| New York State Environmental Facilities Corp. PCRB Series 2004 PA 1261 (MBIA) (RITES)(b) | ||||||||||||||
| 5,465,000 | 18.29 | 06/15/2011 | 8,799,306 | |||||||||||
| New York State Urban Development Corp. RB for Correctional & Youth Facilities Services Series 2003 PA 1218 (RITES)(a)(b) | ||||||||||||||
| 3,625,000 | 11.00 | 01/01/2009 | 4,617,090 | |||||||||||
| Port Authority of New York & New Jersey RB for Delta Air Lines Inc. Project Series 1992 1R (CC/Ca) | ||||||||||||||
| 7,000,000 | 6.95 | 06/01/2008 | 6,999,790 | |||||||||||
| Saratoga County IDA Civic Facility RB for Saratoga Hospital Project Series 2004 A (BBB+) | ||||||||||||||
| 975,000 | 5.00 | 12/01/2008 | 1,023,048 | |||||||||||
| 1,205,000 | 5.00 | 12/01/2012 | 1,285,482 | |||||||||||
| Saratoga County IDA Civic Facility RB for Saratoga Hospitals Project Series 2004 A (BBB+) | ||||||||||||||
| 300,000 | 5.00 | 12/01/2014 | 318,024 | |||||||||||
| Tobacco Settlement Financing Corp. RB for New York Asset Backed Bonds Series A/1 (AA-1/A2) | ||||||||||||||
| 18,160,000 | 5.50 | 06/01/2018 | 20,130,178 | |||||||||||
| Yonkers IDA Civic Facility RB for St. Joseph Hospital Yonkers Series 1998 A | ||||||||||||||
| 500,000 | 6.15 | 03/01/2015 | 449,450 | |||||||||||
| Yonkers IDA Civic Facility RB for St. Joseph Hospital Yonkers Series 1998 C | ||||||||||||||
| 750,000 | 6.15 | 03/01/2015 | 684,360 | |||||||||||
| 800,000 | 6.20 | 03/01/2020 | 710,368 | |||||||||||
| $ | 136,348,674 | |||||||||||||
| North Carolina – 0.9% | ||||||||||||||
| Charlotte Special Facilities RB for Charlotte/ Douglas International US Airways Airport Series 1998 (AMT)(f) | ||||||||||||||
| $ | 2,460,000 | 5.60 | % | 07/01/2027 | $ | 1,461,019 | ||||||||
| Charlotte Special Facilities RB for Douglas International Airport US Airways Series 2000 (AMT) | ||||||||||||||
| 3,000,000 | 7.75 | 02/01/2028 | 2,101,830 | |||||||||||
| North Carolina Eastern Municipal Power Agency Power System RB Series 2003 C (BBB/Baa2) | ||||||||||||||
| 6,495,000 | 5.38 | 01/01/2016 | 6,915,551 | |||||||||||
| 4,850,000 | 5.38 | 01/01/2017 | 5,170,536 | |||||||||||
| North Carolina Eastern Municipal Power Agency Power System RB Series 2003 D (BBB/Baa2) | ||||||||||||||
| 3,400,000 | 5.13 | 01/01/2023 | 3,500,640 | |||||||||||
| North Carolina Medical Care Community Retirement Facilities RB 1st Mortgage for Givens Estates Project Series 2003 A | ||||||||||||||
| 3,000,000 | 6.50 | 07/01/2032 | 3,146,310 | |||||||||||
| North Carolina Medical Care Community Retirement Facilities RB Refunding 1st Mortgage for United Church Project Series 2005 A | ||||||||||||||
| 2,750,000 | 5.25 | 09/01/2021 | 2,775,713 | |||||||||||
| North Carolina Medical Care Community Retirement Facilities RB Refunding 1st Mortgage for United Church Project Series 2005 B(a) | ||||||||||||||
| 1,500,000 | 4.30 | 09/01/2008 | 1,502,685 | |||||||||||
| North Carolina Municipal Power Agency No. 1 Catawba Electric RB Series 1998 A (MBIA) (AAA/Aaa) | ||||||||||||||
| 1,000,000 | 5.50 | 01/01/2014 | 1,138,620 | |||||||||||
| North Carolina Municipal Power Agency No. 1 Catawba Electric RB Series 1999 B (BBB+/A3) | ||||||||||||||
| 1,750,000 | 6.38 | 01/01/2013 | 1,964,865 | |||||||||||
| 5,000,000 | 6.50 | 01/01/2020 | 5,631,300 | |||||||||||
| North Carolina Municipal Power Agency No. 1 Catawba Electric RB Series 2003 A (BBB+/A3) | ||||||||||||||
| 2,550,000 | 5.50 | 01/01/2013 | 2,830,194 | |||||||||||
| $ | 38,139,263 | |||||||||||||
| Ohio – 1.4% | ||||||||||||||
| Cleveland Airport Special RB for Continental Airlines Inc. Series 1998 (AMT) (B-/Caa2) | ||||||||||||||
| $ | 24,965,000 | 5.38 | 09/15/2027 | $ | 17,804,039 | |||||||||
| Cleveland Airport Special RB for Continental Airlines Inc. Series 1999 (AMT) (B-/Caa2) | ||||||||||||||
| 5,530,000 | 5.50 | 12/01/2008 | 5,204,836 | |||||||||||
| 13,460,000 | 5.70 | 12/01/2019 | 10,730,043 | |||||||||||
| Cuyahoga County Health Care Facilities RB Refunding for Benjamin Rose Institute Project Series 1998 | ||||||||||||||
| 2,600,000 | 5.50 | 12/01/2017 | 2,596,490 | |||||||||||
| 3,000,000 | 5.50 | 12/01/2028 | 2,847,930 | |||||||||||
| Ohio Water Development Authority PCRB for Cleveland Electric Series 1998 A (BBB-/Baa2)(a) | ||||||||||||||
| 16,255,000 | 3.75 | 10/01/2008 | 16,321,808 | |||||||||||
| Pinnacle Community Infrastructure Financing Authority RB for Ohio Facilities Series 2004 A | ||||||||||||||
| 2,500,000 | 6.25 | 12/01/2036 | 2,593,650 | |||||||||||
| $ | 58,098,796 | |||||||||||||
| Oklahoma – 3.0% | ||||||||||||||
| Langston Economic Development Authority RB Series 2005 (ACA) (A) | ||||||||||||||
| $ | 1,150,000 | 4.50 | % | 05/01/2020 | $ | 1,136,407 | ||||||||
| Langston Economic Development Authority RB Series 2005 (ACA) (A) | ||||||||||||||
| 3,500,000 | 4.75 | 05/01/2025 | 3,477,635 | |||||||||||
| 2,000,000 | 5.00 | 05/01/2030 | 2,006,240 | |||||||||||
| 5,500,000 | 5.00 | 05/01/2035 | 5,499,945 | |||||||||||
| Oklahoma Development Finance Authority RB for Hillcrest Healthcare Systems Series 1999 A (AAA/Aaa)(d) | ||||||||||||||
| 18,240,000 | 5.63 | 08/15/2009 | 20,193,140 | |||||||||||
| Tulsa Municipal Airport Trust RB for American Airlines Series 2000 B (AMT) (B-/Caa2)(a) | ||||||||||||||
| 16,100,000 | 6.00 | 12/01/2008 | 15,411,725 | |||||||||||
| Tulsa Municipal Airport Trust RB for American Airlines Series 2001 A (AMT) (B-/Caa2)(a) | ||||||||||||||
| 2,450,000 | 5.38 | 12/01/2006 | 2,382,257 | |||||||||||
45
April 30, 2005 (Unaudited)
| Principal | Interest | Maturity | ||||||||||||
| Amount | Rate | Date | Value | |||||||||||
Municipal Debt Obligations – (continued) | ||||||||||||||
| Oklahoma – (continued) | ||||||||||||||
| Tulsa Municipal Airport Trust RB for American Airlines Series 2001 B (AMT) (B-/Caa2)(a) | ||||||||||||||
| $ | 27,195,000 | 5.65 | % | 12/01/2008 | $ | 25,738,164 | ||||||||
| Tulsa Municipal Airport Trust RB VRDN Refunding Series 2000 A RMKT 12/1/04 (AMT) (B-/Caa2)(a) | ||||||||||||||
| 45,500,000 | 7.75 | 12/01/2014 | 46,876,375 | |||||||||||
| $ | 122,721,888 | |||||||||||||
| Oregon – 0.1% | ||||||||||||||
| Oregon State Economic Development RB for Georgia Pacific Corp. Series 1995 CLVII (AMT) (BB+/Ba3) | ||||||||||||||
| $ | 195,000 | 6.35 | % | 08/01/2025 | $ | 196,125 | ||||||||
| Oregon State Facilities Authority RB for Linfield College Project Series 2005 A (Baa1) | ||||||||||||||
| 1,000,000 | 5.00 | 10/01/2025 | 1,021,950 | |||||||||||
| Portland Multifamily RB for Pacific Tower Series 2001 C (AMT) | ||||||||||||||
| 2,650,000 | 7.00 | 12/01/2034 | 2,677,693 | |||||||||||
| $ | 3,895,768 | |||||||||||||
| Pennsylvania – 5.1% | ||||||||||||||
| Allegheny County Airport RB for Pittsburgh International Airport Series 1997 A-1 (MBIA) (AMT) (AAA/Aaa) | ||||||||||||||
| $ | 2,000,000 | 5.75 | % | 01/01/2009 | $ | 2,138,260 | ||||||||
| Allegheny County Hospital Development Authority RB for Health Systems Series 2000 B (B/B1) | ||||||||||||||
| 16,460,000 | 9.25 | 11/15/2022 | 19,415,558 | |||||||||||
| 14,360,000 | 9.25 | 11/15/2030 | 16,900,858 | |||||||||||
| Allegheny County Hospital Development Authority RB for Ohio Valley General Hospital Project Series 2005 A (Baa2) | ||||||||||||||
| 2,300,000 | 5.00 | 04/01/2025 | 2,308,809 | |||||||||||
| 3,000,000 | 5.13 | 04/01/2035 | 3,005,640 | |||||||||||
| Allegheny County Redevelopment Authority for Pittsburgh Mills Project Series 2004 | ||||||||||||||
| 1,000,000 | 5.10 | 07/01/2014 | 1,035,220 | |||||||||||
| 2,000,000 | 5.60 | 07/01/2023 | 2,105,280 | |||||||||||
| Chester County Health & Education RB for Jenners Pond Inc. Project Series 2002 | ||||||||||||||
| 3,000,000 | 7.63 | 07/01/2034 | 3,253,200 | |||||||||||
| Chester Economic Development Authority RB GTD Series 2004 | ||||||||||||||
| 8,640,000 | 7.00 | 03/01/2019 | 9,571,478 | |||||||||||
| Cumberland County IDA RB for Beverly Enterprises Inc. Series 1998 | ||||||||||||||
| 1,660,000 | 5.50 | 10/01/2008 | 1,676,783 | |||||||||||
| Cumberland County Municipal Authority Retirement Community RB for Wesley Affiliated Services Series 2002 A | ||||||||||||||
| 5,000,000 | 7.25 | 01/01/2035 | 5,347,100 | |||||||||||
| Delaware County IDA RB Refunding for Residential Recovery Facilities Series 1997 A (BBB/Ba2) | ||||||||||||||
| 18,445,000 | 6.10 | 07/01/2013 | 19,313,391 | |||||||||||
| Gettysburg Area IDA RB for Beverly Enterprises Project Series 2000 | ||||||||||||||
| 2,300,000 | 7.50 | 07/01/2011 | 2,308,717 | |||||||||||
| Lehigh County General Purpose Authority RB for Saint Lukes Bethlehem Hospital Series 2003 (BBB/Baa2) | ||||||||||||||
| 11,500,000 | 5.38 | 08/15/2033 | 11,812,110 | |||||||||||
| Montgomery County Higher Education & Health Authority RB for Catholic Health Systems East Series 2004 C (A/A2) | ||||||||||||||
| 1,550,000 | 5.38 | 11/15/2034 | 1,624,757 | |||||||||||
| Montgomery County IDA RB for Whitemarsh Continued Care Project Series 2005 | ||||||||||||||
| 1,720,000 | 5.13 | 02/01/2012 | 1,753,402 | |||||||||||
| 1,775,000 | 5.30 | 02/01/2013 | 1,816,854 | |||||||||||
| 2,000,000 | 6.13 | 02/01/2028 | 2,088,100 | |||||||||||
| New Morgan IDA Solid Waste Disposal RB for New Morgan Landfill Co. Inc. Project Series 1994 (AMT) (BB-/Caa1) | ||||||||||||||
| 8,115,000 | 6.50 | 04/01/2019 | 8,115,893 | |||||||||||
| Pennsylvania Economic Development Financing Authority Exempt Facilities RB for Amtrak Project Series 2001 A (AMT) (BBB/A3) | ||||||||||||||
| 5,000,000 | 6.38 | 11/01/2041 | 5,189,450 | |||||||||||
| Pennsylvania Economic Development Financing Authority Exempt Facilities RB for Reliant Energy Series 2002 A (AMT) (B+/B1) | ||||||||||||||
| 5,500,000 | 6.75 | 12/01/2036 | 5,937,745 | |||||||||||
| Pennsylvania Economic Development Financing Authority Exempt Facilities RB for Reliant Energy Series 2002 B Converted 12/22/04 (AMT) (B+/B1) | ||||||||||||||
| 36,500,000 | 6.75 | 12/01/2036 | 39,405,035 | |||||||||||
| Pennsylvania Economic Development Financing Authority Exempt Facilities RB for Reliant Energy Series 2003 A (AMT) (B+/B1) | ||||||||||||||
| 2,000,000 | 6.75 | 12/01/2036 | 2,159,180 | |||||||||||
| Pennsylvania Economic Development Financing Authority Exempt Facilities RB for Reliant Energy Seward Series 2001 A (AMT) (B+/B1) | ||||||||||||||
| 7,500,000 | 6.75 | 12/01/2036 | 8,096,925 | |||||||||||
| Pennsylvania State Higher Educational Facilities Authority RB for Philadelphia University Series 2004 A (BBB/Baa2) | ||||||||||||||
| 3,000,000 | 5.13 | 06/01/2025 | 3,055,470 | |||||||||||
| 1,950,000 | 5.25 | 06/01/2032 | 1,992,276 | |||||||||||
| Philadelphia Gas Works RB Eighteenth Series 2004 (AGC) (AAA/Aa1) | ||||||||||||||
| 1,000,000 | 5.25 | 08/01/2021 | 1,066,250 | |||||||||||
| Philadelphia Gas Works RB Eighteenth Series 2004 (CIFG) (AAA/Aaa) | ||||||||||||||
| 1,790,000 | 5.00 | 08/01/2011 | 1,944,513 | |||||||||||
| 3,195,000 | 5.00 | 08/01/2014 | 3,499,100 | |||||||||||
| 3,350,000 | 5.00 | 08/01/2015 | 3,638,870 | |||||||||||
| Philadelphia Gas Works RB Fifth Series 2004 A/1 (AGC) (AAA/Aa1) | ||||||||||||||
| 3,340,000 | 5.25 | 09/01/2018 | 3,618,823 | |||||||||||
| Scranton Lackawanna Health & Welfare Authority RB for Moses Taylor Hospital Project Series 1997 (B-) | ||||||||||||||
| 500,000 | 6.15 | 07/01/2014 | 450,860 | |||||||||||
| 4,825,000 | 6.20 | 07/01/2017 | 4,247,496 | |||||||||||
| 6,155,000 | 6.25 | 07/01/2020 | 5,329,184 | |||||||||||
46
| Principal | Interest | Maturity | ||||||||||||
| Amount | Rate | Date | Value | |||||||||||
Municipal Debt Obligations – (continued) | ||||||||||||||
| Pennsylvania – (continued) | ||||||||||||||
| St. Mary Hospital Authority RB for Catholic Health East Series 2004 B (A/A2) | ||||||||||||||
| $ | 2,275,000 | 5.38 | % | 11/15/2034 | $ | 2,384,723 | ||||||||
| $ | 207,607,310 | |||||||||||||
| Puerto Rico – 1.5% | ||||||||||||||
| Childrens Trust Fund RB for Tobacco Settlement Series 2000 II-R-39 (RITES) (AAA/Aa3)(b)(d) | ||||||||||||||
| $ | 3,535,000 | 8.35 | % | 07/01/2010 | $ | 4,064,614 | ||||||||
| Puerto Rico Commonwealth GO Bonds Series 2003 PA 1138R (MBIA) (RITES) (AAA)(a)(b) | ||||||||||||||
| 7,500,000 | 6.80 | 07/01/2008 | 8,655,150 | |||||||||||
| Puerto Rico Industrial Medical & Environmental PCRB Financing Authority Special Facilities for American Airlines Series 1985 A (CCC/Caa2)(a) | ||||||||||||||
| 5,400,000 | 6.45 | 12/01/2025 | 3,852,846 | |||||||||||
| Puerto Rico Public Finance Corp. RB Commonwealth Appropriations Series 2004 A (LOC-Government Bank for Puerto Rico) (BBB+/Baa2)(a) | ||||||||||||||
| 37,750,000 | 5.75 | 02/01/2012 | 41,947,045 | |||||||||||
| Puerto Rico Public Finance Corp. RB for Residential Certificates Series 2001 520 (MBIA) (Aaa)(b) | ||||||||||||||
| 3,225,000 | 12.81 | 08/01/2016 | 4,497,843 | |||||||||||
| $ | 63,017,498 | |||||||||||||
| Rhode Island – 1.2% | ||||||||||||||
| Providence Redevelopment Agency RB Refunding for Public Safety Building Project Series 2005 A (AMBAC) (AAA/Aaa) | ||||||||||||||
| $ | 1,825,000 | 5.00 | % | 04/01/2025 | $ | 1,922,601 | ||||||||
| 3,605,000 | 5.00 | 04/01/2026 | 3,785,935 | |||||||||||
| 2,785,000 | 5.00 | 04/01/2027 | 2,922,495 | |||||||||||
| Rhode Island State Health & Educational Building Corp. RB for Hospital Financing Series 2003 A (BBB/Baa2) | ||||||||||||||
| 2,840,000 | 6.00 | 09/15/2033 | 2,887,201 | |||||||||||
| Tobacco Settlement Financing Corp. RB for Rhode Island Asset Backed Bonds Series 2002 A (BBB/Baa3) | ||||||||||||||
| 4,955,000 | 6.00 | 06/01/2023 | 4,997,960 | |||||||||||
| 7,500,000 | 6.13 | 06/01/2032 | 7,547,925 | |||||||||||
| 23,515,000 | 6.25 | 06/01/2042 | 23,684,543 | |||||||||||
| $ | 47,748,660 | |||||||||||||
| South Carolina – 1.7% | ||||||||||||||
| Connector 2000 Association, Inc. Toll Road RB for Capital Appreciation Series 1998 B (B-)(g) | ||||||||||||||
| $ | 15,000,000 | 0.00 | % | 01/01/2033 | $ | 1,577,700 | ||||||||
| Greenville County Airport RB for Donaldson Industrial Air Park Project Series 2001 (AMT) (Baa3) | ||||||||||||||
| 4,550,000 | 6.13 | 10/01/2017 | 4,875,598 | |||||||||||
| Lancaster County Assessment RB for Edgewater Improvement Direct Series 2003 A | ||||||||||||||
| 1,000,000 | 6.88 | 11/01/2035 | 1,037,380 | |||||||||||
| Lancaster County Assessment RB for Edgewater Improvement Direct Series 2003 B | ||||||||||||||
| 1,499,000 | 6.13 | 11/01/2014 | 1,542,666 | |||||||||||
| Medical University Hospital Authority RB Series 2002 A (AAA/Baa2)(d) | ||||||||||||||
| 3,000,000 | 6.50 | 08/15/2012 | 3,588,720 | |||||||||||
| South Carolina Jobs Economic Development Authority RB for Palmetto Health Alliance Series 2000 A(d) | ||||||||||||||
| 8,750,000 | 7.13 | 12/15/2010 | 10,577,437 | |||||||||||
| South Carolina Jobs Economic Development Authority RB for Palmetto Health Alliance Series 2000 A (BBB+/Baa1) | ||||||||||||||
| 10,000,000 | 6.25 | 08/01/2031 | 10,884,300 | |||||||||||
| Tobacco Settlement Management Authority RB Series 2001 B (BBB/Baa3) | ||||||||||||||
| 2,225,000 | 6.00 | 05/15/2022 | 2,260,400 | |||||||||||
| 20,070,000 | 6.38 | 05/15/2028 | 20,621,323 | |||||||||||
| York County Industrial RB Exempt Facility Hoechst Celanese Series 1994 (AMT) (B-/B2) | ||||||||||||||
| 11,430,000 | 5.70 | 01/01/2024 | 11,156,480 | |||||||||||
| $ | 68,122,004 | |||||||||||||
| Tennessee – 0.7% | ||||||||||||||
| Elizabethton Health and Educational Facilities Board RB Series 2001 PA 813 (RITES)(b) | ||||||||||||||
| $ | 6,000,000 | 12.48 | % | 07/01/2033 | $ | 8,365,560 | ||||||||
| Johnson City Health and Educational Board Retirement Facilities RB for Appalachian Christian Village Project Series 2004 A | ||||||||||||||
| 1,000,000 | 6.25 | 02/15/2032 | 1,013,780 | |||||||||||
| Metropolitan Knoxville Airport Authority Special Purpose RB for Northwest Airlines Project Series 2002 (AMT) | ||||||||||||||
| 2,500,000 | 8.00 | 04/01/2032 | 2,495,025 | |||||||||||
| Shelby County Health Educational & Housing Facilities Board Hospital RB for Methodist Healthcare Series 2002 (ETM) (A-/A3) | ||||||||||||||
| 935,000 | 6.00 | 09/01/2020 | 1,081,701 | |||||||||||
| Shelby County Health Educational & Housing Facilities Board Hospital RB Refunded for Methodist Healthcare Series 2002 (A-/A3)(d) | ||||||||||||||
| 1,565,000 | 6.00 | 09/01/2012 | 1,829,000 | |||||||||||
| Shelby County Health Educational & Housing Facilities Board RB PA 1277 A (RITES) (AA)(a)(b) | ||||||||||||||
| 9,190,000 | 10.42 | 10/01/2008 | 10,933,894 | |||||||||||
| Shelby County Health Educational & Housing Facilities Board RB PA 1277 B (RITES) (AA)(b) | ||||||||||||||
| 1,310,000 | 10.42 | 09/01/2008 | 1,577,974 | |||||||||||
| $ | 27,296,934 | |||||||||||||
| Texas – 7.4% | ||||||||||||||
| Alliance Airport Authority Inc. Special Facilities RB for American Airlines Inc. Project Series 1991 (AMT) (CCC/Caa2) | ||||||||||||||
| $ | 13,990,000 | 7.00 | % | 12/01/2011 | $ | 12,216,068 | ||||||||
| 39,105,000 | 7.50 | 12/01/2029 | 30,619,215 | |||||||||||
| Bexar County Health Facilities Development Corp. RB for Army Retirement Residence Project Series 2002 (BBB-) | ||||||||||||||
| 1,200,000 | 6.13 | 07/01/2022 | 1,274,040 | |||||||||||
| 1,000,000 | 6.30 | 07/01/2032 | 1,067,530 | |||||||||||
47
April 30, 2005 (Unaudited)
| Principal | Interest | Maturity | ||||||||||||
| Amount | Rate | Date | Value | |||||||||||
Municipal Debt Obligations – (continued) | ||||||||||||||
| Texas – (continued) | ||||||||||||||
| Brazos River Authority PCRB for Texas Utility Co. Series 1999 A (AMT) (BBB/Baa2) | ||||||||||||||
| $ | 10,500,000 | 7.70 | % | 04/01/2033 | $ | 12,371,940 | ||||||||
| Brazos River Authority PCRB for TXU Electric Co. Project Series 1999 C (AMT) (BBB/Baa2) | ||||||||||||||
| 6,800,000 | 7.70 | 03/01/2032 | 8,012,304 | |||||||||||
| Brazos River Authority PCRB for TXU Electric Co. Project Series 2001 C (AMT) (BBB/Baa2)(a) | ||||||||||||||
| 18,365,000 | 5.75 | 11/01/2011 | 19,889,295 | |||||||||||
| Brazos River Authority PCRB for TXU Energy Co. LLC Project Series 2003 C (AMT) (BBB/Baa2) | ||||||||||||||
| 1,435,000 | 6.75 | 10/01/2038 | 1,567,996 | |||||||||||
| Brazos River Authority PCRB for TXU Energy Co. LLC Project Series 2003 D (BBB/Baa2)(a) | ||||||||||||||
| 3,025,000 | 5.40 | 10/01/2014 | 3,275,016 | |||||||||||
| Brazos River Authority RB for Reliant Energy Inc. Project Series 1999 A (BBB-/Ba2) | ||||||||||||||
| 6,250,000 | 5.38 | 04/01/2019 | 6,400,875 | |||||||||||
| Brazos River Authority RB for Reliant Energy Inc. Project Series 1999 B (BBB-/WR) | ||||||||||||||
| 10,000,000 | 7.75 | 12/01/2018 | 11,179,000 | |||||||||||
| Dallas County Flood Control District GO Bonds Series 2002(e) | ||||||||||||||
| 6,000,000 | 7.25 | 04/01/2032 | 6,240,540 | |||||||||||
| Dallas Fort Worth International Airport Facility Improvement Corp. RB for American Airlines Inc. Series 1992 (AMT) (CCC/Caa2) | ||||||||||||||
| 1,885,000 | 7.25 | 11/01/2030 | 1,418,463 | |||||||||||
| Dallas Fort Worth International Airport Facility Improvement Corp. RB for American Airlines Inc. Series 1995 (CCC/Caa2) | ||||||||||||||
| 35,575,000 | 6.00 | 11/01/2014 | 28,373,553 | |||||||||||
| Dallas Fort Worth International Airport Facility Improvement Corp. RB for American Airlines Inc. Series 1995 (AMT) (CCC/Caa2) | ||||||||||||||
| 37,550,000 | 6.38 | 05/01/2035 | 25,674,812 | |||||||||||
| Dallas Fort Worth International Airport Facility Improvement Corp. RB Refunding for American Airlines Inc. Series 2000 B (AMT) (CCC/Caa2)(a) | ||||||||||||||
| 11,170,000 | 6.05 | 11/01/2005 | 11,014,067 | |||||||||||
| Dallas Fort Worth International Airport Facility Improvement Corp. RB Refunding for American Airlines Inc. Series 2000 C (AMT) (CCC/Caa2)(a) | ||||||||||||||
| 15,860,000 | 6.15 | 11/01/2007 | 14,770,101 | |||||||||||
| Georgetown Health Facilities Development Corp. RB for Georgetown Hospital Healthcare System Series 1999 (BB) | ||||||||||||||
| 3,000,000 | 6.25 | 08/15/2029 | 2,993,670 | |||||||||||
| Gulf Coast Waste Disposal Authority Texwaste Disposal RB for Valero Energy Corp. Project Series 2001 (AMT) (BBB-/Baa3) | ||||||||||||||
| 1,500,000 | 6.65 | 04/01/2032 | 1,635,585 | |||||||||||
| Harris County Health Facilities Development Corp. Hospital RB for Memorial Hermann Healthcare System Series 2004 A (A/A2) | ||||||||||||||
| 2,595,000 | 5.00 | 12/01/2020 | 2,713,436 | |||||||||||
| 435,000 | 5.00 | 12/01/2021 | 452,439 | |||||||||||
| 1,000,000 | 5.13 | 12/01/2022 | 1,044,190 | |||||||||||
| 1,000,000 | 5.13 | 12/01/2023 | 1,039,470 | |||||||||||
| Houston Airport System Special Facilities RB for Continental Airlines Series 1998 B (AMT) (B-/Caa2) | ||||||||||||||
| 1,000,000 | 5.70 | 07/15/2029 | 754,670 | |||||||||||
| Houston Airport System Special Facilities RB for Continental Airlines Series 2001 E (AMT) (B-/Caa2) | ||||||||||||||
| 3,400,000 | 6.75 | 07/01/2021 | 2,970,342 | |||||||||||
| 20,765,000 | 6.75 | 07/01/2029 | 17,992,872 | |||||||||||
| Houston Health Facilities Development Corp. Retirement Facility RB for Buckingham Senior Living Community Series 2004 A | ||||||||||||||
| 1,500,000 | 7.13 | 02/15/2034 | 1,587,240 | |||||||||||
| Houston Texas GO Bonds Rols RR II Series 2003 R 242 (MBIA) (AAA)(b) | ||||||||||||||
| 6,455,000 | 10.53 | 03/01/2010 | 8,540,481 | |||||||||||
| Matagorda County Navigation District No. 1 RB for Reliant Energy Project Series 1999 B (AMT) (BBB-/Ba2) | ||||||||||||||
| 11,000,000 | 5.95 | 05/01/2030 | 11,194,150 | |||||||||||
| Metropolitan Health Facilities Development Corp. RB for Wilson N. Jones Memorial Hospital Project Series 2001 (B1) | ||||||||||||||
| 4,200,000 | 7.20 | 01/01/2021 | 4,304,370 | |||||||||||
| 5,000,000 | 7.25 | 01/01/2031 | 5,102,850 | |||||||||||
| Port Corpus Christi Authority RB for Celanese Project Series 2002 B (AMT) (B-/B2) | ||||||||||||||
| 8,500,000 | 6.70 | 11/01/2030 | 8,965,290 | |||||||||||
| Red River Authority PCRB for Celanese Project Series 2002 B (AMT) (B-/B2) | ||||||||||||||
| 4,500,000 | 6.70 | 11/01/2030 | 4,741,875 | |||||||||||
| Red River Authority PCRB for Hoechst Celanese Corp. Project Series 1994 (B-/B2) | ||||||||||||||
| 3,000,000 | 5.20 | 05/01/2007 | 3,006,990 | |||||||||||
| Sabine River Authority PCRB for TXU Energy Co. LLC Project Series 2003 B (BBB/Baa2) | ||||||||||||||
| 3,000,000 | 6.15 | 08/01/2022 | 3,363,990 | |||||||||||
| Sabine River Authority PCRB VRDN for TXU Electric Co. Project Series 2001 A (BBB/Baa2)(a) | ||||||||||||||
| 16,000,000 | 5.50 | 11/01/2011 | 17,291,680 | |||||||||||
| Tom Green County Health Facilities Development Corp. Hospital RB for Shannon Health Systems Project Series 2001 (Baa3) | ||||||||||||||
| 2,000,000 | 6.75 | 05/15/2021 | 2,162,960 | |||||||||||
| Weslaco Health Facilities RB for Knapp Medical Center Project Series 2002 (BBB+) | ||||||||||||||
| 4,395,000 | 6.00 | 06/01/2017 | 4,793,275 | |||||||||||
| $ | 302,016,640 | |||||||||||||
48
| Principal | Interest | Maturity | ||||||||||||
| Amount | Rate | Date | Value | |||||||||||
Municipal Debt Obligations – (continued) | ||||||||||||||
| U. S. Virgin Islands – 0.3% | ||||||||||||||
| Virgin Islands Public Finance Authority RB for Senior Lien Matching Fund Loan Note Series 2004 A (BBB) | ||||||||||||||
| $ | 2,225,000 | 5.00 | % | 10/01/2010 | $ | 2,377,902 | ||||||||
| 1,045,000 | 5.00 | 10/01/2012 | 1,125,977 | |||||||||||
| 1,000,000 | 5.00 | 10/01/2014 | 1,084,260 | |||||||||||
| 1,250,000 | 5.25 | 10/01/2016 | 1,363,275 | |||||||||||
| 1,000,000 | 5.25 | 10/01/2018 | 1,080,070 | |||||||||||
| 1,000,000 | 5.25 | 10/01/2019 | 1,076,850 | |||||||||||
| 1,720,000 | 5.25 | 10/01/2020 | 1,845,268 | |||||||||||
| 1,000,000 | 5.25 | 10/01/2021 | 1,070,440 | |||||||||||
| 500,000 | 5.25 | 10/01/2022 | 534,420 | |||||||||||
| 500,000 | 5.25 | 10/01/2023 | 534,025 | |||||||||||
| Virgin Islands Public Finance Authority RB for Subordinated Lien-Fund Loan Notes Series 1998 D | ||||||||||||||
| 1,100,000 | 6.00 | 10/01/2005 | 1,108,250 | |||||||||||
| $ | 13,200,737 | |||||||||||||
| Utah – 0.2% | ||||||||||||||
| Tooele County Hazardous Waste Treatment RB for Union Pacific Project Series 1992 A (AMT) (BBB/Baa2) | ||||||||||||||
| $ | 6,350,000 | 5.70 | % | 11/01/2026 | $ | 6,631,750 | ||||||||
| Virginia – 1.2% | ||||||||||||||
| Amelia County IDA Solid Waste Disposal VRDN RB Refunding for Waste Management Project Series 2002 (AMT) (BBB)(a) | ||||||||||||||
| $ | 3,000,000 | 4.05 | % | 04/01/2008 | $ | 3,005,610 | ||||||||
| Bedford County IDA RB for Nekoosa Packaging Corp. Project Series 1998 (AMT) (Ba3) | ||||||||||||||
| 320,000 | 5.60 | 12/01/2025 | 321,152 | |||||||||||
| Celebrate North Community Development Authority Special Assessment Project Series 2003 B | ||||||||||||||
| 5,000,000 | 6.75 | 03/01/2034 | 5,218,700 | |||||||||||
| Chesapeake Hospital Authority Facilities RB Refunding for Chesapeake General Hospital Series 2004 A (A3) | ||||||||||||||
| 2,385,000 | 5.00 | 07/01/2009 | 2,501,507 | |||||||||||
| 2,600,000 | 5.25 | 07/01/2011 | 2,774,252 | |||||||||||
| 2,740,000 | 5.25 | 07/01/2012 | 2,942,404 | |||||||||||
| 2,890,000 | 5.25 | 07/01/2013 | 3,103,802 | |||||||||||
| 3,045,000 | 5.25 | 07/01/2014 | 3,271,457 | |||||||||||
| Chesapeake IDA PCRB for Virginia Project Series 1985 (BBB+/A3) | ||||||||||||||
| 3,250,000 | 5.25 | 02/01/2008 | 3,319,940 | |||||||||||
| Goochland County IDA RB for Nekoosa Packaging Corp. Series 1998 (AMT) (Ba3) | ||||||||||||||
| 560,000 | 5.65 | 12/01/2025 | 562,559 | |||||||||||
| Henrico County IDA RB for Solid Waste Browning Ferris Project Series 1995 (AMT) (BB-/Caa1)(a) | ||||||||||||||
| 3,500,000 | 5.30 | 12/01/2005 | 3,512,670 | |||||||||||
| Henrico County IDA RB for Solid Waste Browning Series 1997 A (AMT) (BB-/Caa1) | ||||||||||||||
| 3,750,000 | 5.88 | 03/01/2017 | 3,593,662 | |||||||||||
| Loudoun County IDA Hospital RB for Loudoun Hospital Center Series 2002 A (BBB) | ||||||||||||||
| 1,000,000 | 6.10 | 06/01/2032 | 1,079,940 | |||||||||||
| Loudoun County IDA Residential Care Facility RB for Falcons Landing Series 2004 A | ||||||||||||||
| 2,750,000 | 6.00 | 08/01/2024 | 2,865,748 | |||||||||||
| Norfolk Redevelopment & Housing Authority RB for First Mortgage Retirement Community Series 2004 A | ||||||||||||||
| 500,000 | 6.00 | 01/01/2025 | 507,130 | |||||||||||
| 1,100,000 | 6.13 | 01/01/2035 | 1,108,712 | |||||||||||
| Pocahontas Parkway Association Toll Road RB for Capital Appreciation 1st Tier Series 1998 SubSeries C (B3)(g) | ||||||||||||||
| 2,300,000 | 0.00 | 08/15/2005 | 2,250,251 | |||||||||||
| Pocahontas Parkway Association Toll Road RB Senior Series 1998 A (BB/Ba2) | ||||||||||||||
| 6,600,000 | 5.50 | 08/15/2028 | 6,400,614 | |||||||||||
| $ | 48,340,110 | |||||||||||||
| Washington – 1.2% | ||||||||||||||
| King County GO Bonds for Sewer Improvements Series 2005 (FGIC) (AAA/Aaa) | ||||||||||||||
| $ | 31,110,000 | 5.00 | % | 01/01/2035 | $ | 32,514,305 | ||||||||
| Skagit County Public Hospital District No. 1 RB for Skagit Valley Hospital Series 2005 (Baa3) | ||||||||||||||
| 600,000 | 5.50 | 12/01/2015 | 638,016 | |||||||||||
| Skagit County Public Hospital District No. 1 RB for Skagit Valley Hospital Series 2005(BAA3) | ||||||||||||||
| 1,175,000 | 5.38 | 12/01/2022 | 1,210,791 | |||||||||||
| 1,500,000 | 5.50 | 12/01/2030 | 1,545,255 | |||||||||||
| Tobacco Settlement Authority RB for Asset Backed Bonds Series 2002 (BBB/Baa3) | ||||||||||||||
| 10,015,000 | 6.50 | 06/01/2026 | 10,465,274 | |||||||||||
| Vancouver Downtown Redevelopment Authority RB for Conference Center Project Series 2003 A (ACA) (A) | ||||||||||||||
| 900,000 | 5.25 | 01/01/2028 | 925,146 | |||||||||||
| 1,800,000 | 5.25 | 01/01/2034 | 1,831,194 | |||||||||||
| $ | 49,129,981 | |||||||||||||
| Wisconsin – 0.7% | ||||||||||||||
| Badger Tobacco Asset Securitization Corp. RB Asset Backed Bonds Series 2002 (BBB/Baa3) | ||||||||||||||
| $ | 1,660,000 | 6.13 | % | 06/01/2027 | $ | 1,699,126 | ||||||||
| 16,090,000 | 6.38 | 06/01/2032 | 16,431,269 | |||||||||||
| Wisconsin Health & Educational Facilities Authority RB for Aurora Health Care Series 1999 B (BBB+) | ||||||||||||||
| 1,500,000 | 5.63 | 02/15/2020 | 1,541,220 | |||||||||||
| Wisconsin Health & Educational Facilities Authority RB for Beaver Dam Community Hospitals Inc. Series 2004 A | ||||||||||||||
| 2,500,000 | 6.75 | 08/15/2034 | 2,594,725 | |||||||||||
| Wisconsin Health & Educational Facilities Authority RB for Fort Healthcare Inc. Project Series 2004 (BBB+) | ||||||||||||||
| 3,000,000 | 5.75 | 05/01/2029 | 3,139,230 | |||||||||||
| 2,750,000 | 6.10 | 05/01/2034 | 2,962,795 | |||||||||||
| $ | 28,368,365 | |||||||||||||
49
April 30, 2005 (Unaudited)
| Principal | Interest | Maturity | ||||||||||||
| Amount | Rate | Date | Value | |||||||||||
Municipal Debt Obligations – (continued) | ||||||||||||||
| Wyoming – 0.1% | ||||||||||||||
| Converse County RB for Memorial Hospital Project Series 2000 | ||||||||||||||
| $ | 3,605,000 | 9.00 | % | 12/01/2025 | $ | 4,063,808 | ||||||||
| TOTAL MUNICIPAL DEBT OBLIGATIONS | ||||||||||||||
| (Cost $3,661,188,718) | $ | 3,864,336,022 | ||||||||||||
Other Municipals(a)(e) – 2.8% | ||||||||||||||
| Charter Mac Equity Issuer Trust Series 2004 A-4-1 (A3) | ||||||||||||||
| $ | 9,000,000 | 5.75 | % | 04/30/2015 | $ | 9,424,710 | ||||||||
| GMAC Municipal Mortgage Trust (A3) | ||||||||||||||
| 7,500,000 | 4.80 | 04/30/2015 | 7,577,700 | |||||||||||
| GMAC Municipal Mortgage Trust (Baa1) | ||||||||||||||
| 5,000,000 | 5.50 | 04/30/2015 | 5,064,000 | |||||||||||
| GMAC Municipal Mortgage Trust (Baa2) | ||||||||||||||
| 9,500,000 | 5.70 | 04/30/2025 | 9,616,090 | |||||||||||
| GMAC Municipal Mortgage Trust Series A (A3) | ||||||||||||||
| 6,475,000 | 4.15 | 10/31/2009 | 6,453,956 | |||||||||||
| GMAC Municipal Mortgage Trust Series A-1 (A3) | ||||||||||||||
| 9,625,000 | 4.90 | 10/31/2014 | 9,683,039 | |||||||||||
| GMAC Municipal Mortgage Trust Series A-2 (A3) | ||||||||||||||
| 16,650,000 | 5.30 | 10/31/2019 | 16,817,999 | |||||||||||
| GMAC Municipal Mortgage Trust Series B (BAA1) | ||||||||||||||
| 16,650,000 | 5.60 | 10/31/2019 | 17,150,665 | |||||||||||
| Municipal Mortgage & Equity LLC RB for 1999 A Tax-Exempt MF Hsg. Certificates Series 1999 | ||||||||||||||
| 10,000,000 | 4.95 | 08/15/2005 | 10,044,600 | |||||||||||
| Municipal Mortgage & Equity LLC Tax-Exempt Special Purpose Entity Series A-2 (A3) | ||||||||||||||
| 6,000,000 | 4.90 | 09/30/2014 | 5,941,860 | |||||||||||
| Municipal Mortgage & Equity LLC Tax-Exempt Special Purpose Entity Series B-2 (Baa2) | ||||||||||||||
| 4,000,000 | 5.20 | 09/30/2014 | 3,947,200 | |||||||||||
| Municipal Mortgage & Equity LLC Tax-Exempt Special Purpose Entity Series C (Baa2) | ||||||||||||||
| 5,000,000 | 4.70 | 09/30/2009 | 4,877,650 | |||||||||||
| Municipal Mortgage & Equity LLC Tax-Exempt Special Purpose Entity Series C-1 (Baa2) | ||||||||||||||
| 3,000,000 | 5.40 | 09/30/2014 | 2,962,890 | |||||||||||
| Municipal Mortgage & Equity LLC Tax-Exempt Special Purpose Entity Series C-2 (Baa2) | ||||||||||||||
| 3,000,000 | 5.80 | 09/30/2019 | 2,965,230 | |||||||||||
| TOTAL OTHER MUNICIPALS | ||||||||||||||
| (Cost $111,808,753) | $ | 112,527,589 | ||||||||||||
Short Term Investments(c) – 1.8% | ||||||||||||||
| California – 0.7% | ||||||||||||||
| California Housing Finance Agency RB VRDN for Home Mortgage Series 2001 U (AMT) (MBIA) (SPA-Bank of New York) (A-1+/VMIG1) | ||||||||||||||
| $ | 8,000,000 | 2.00 | % | 05/02/2005 | $ | 8,000,000 | ||||||||
| California Housing Finance Agency RB VRDN for Home Mortgage Series 2002 J (AMT) (MBIA) (SPA-Lloyds TSB Bank PLC) (A-1+/VMIG1) | ||||||||||||||
| 400,000 | 2.02 | 05/02/2005 | 400,000 | |||||||||||
| California Housing Finance Agency RB VRDN for Home Mortgage Series 2003 U (AMT) (FSA) (Dexia Credit Local) (A-1+/VMIG1) | ||||||||||||||
| 6,450,000 | 2.90 | 05/02/2005 | 6,450,000 | |||||||||||
| California Housing Finance Agency RB VRDN MF Hsg. Series 2000 A (LOC-HELABA and California State Teachers Retirement) (AMT) (A-1+/Aa3)(a) | ||||||||||||||
| 4,520,000 | 2.92 | 05/02/2005 | 4,520,000 | |||||||||||
| California State Economic Recovery RB VRDN Series 2004 C-6 (LOC-Citibank N.A.) (A-1+/VMIG1) | ||||||||||||||
| 8,750,000 | 2.00 | 05/02/2005 | 8,750,000 | |||||||||||
| $ | 28,120,000 | |||||||||||||
| Kansas – 0.0% | ||||||||||||||
| Kansas State Department of Transportation Highway RB VRDN Series 2000 B-1 (A-1+/VMIG1) | ||||||||||||||
| $ | 600,000 | 2.32 | % | 05/02/2005 | $ | 600,000 | ||||||||
| Massachusetts(a) – 0.1% | ||||||||||||||
| Massachusetts State Development Finance Agency RB VRDN for Boston University Series 2002 R-2 (SPA-Societe Generale) (XLCA) (A-1+/Aaa) | ||||||||||||||
| $ | 4,020,000 | 2.22 | % | 05/04/2005 | $ | 4,020,000 | ||||||||
| New York – 0.6% | ||||||||||||||
| Jay Street Development Corp. Cities Facilities Lease RB VRDN for Jay Street Project Series 2001 A-2 (LOC-Landesbank Hessen-Thueringen) (A-1+/VMIG1) | ||||||||||||||
| $ | 1,350,000 | 2.24 | % | 05/02/2005 | $ | 1,350,000 | ||||||||
| New York City Municipal Water Finance Authority Water & Sewer System RB VRDN Series 2003 Subseries F-2 (SPA-Bayerische Landesbank) (A-1+/VMIG1) | ||||||||||||||
| 5,810,000 | 2.04 | 05/02/2005 | 5,810,000 | |||||||||||
| New York City Transitional Finance Authority RB VRDN for Recovery Series 2002 1 Subseries 1-D (LOC-Landesbank Hessen-Thueringen) (A-1+/VMIG1) | ||||||||||||||
| 8,265,000 | 1.97 | 05/02/2005 | 8,265,000 | |||||||||||
| New York GO Bonds VRDN Subseries 1993 A-10 (LOC-Morgan Guaranty Trust) (A-1+/VMIG1) | ||||||||||||||
| 1,050,000 | 2.32 | 04/29/2005 | 1,050,000 | |||||||||||
| New York GO Bonds VRDN Subseries 1993 E2 (LOC-JP Morgan Chase Bank) (A-1+/VMIG1) | ||||||||||||||
| 1,360,000 | 2.28 | 05/02/2005 | 1,360,000 | |||||||||||
| New York GO Bonds VRDN Subseries 1993 E2 (LOC-JP Morgan Chase Bank) (A-1+/Aa2)(a) | ||||||||||||||
| 820,000 | 2.29 | 05/04/2005 | 820,000 | |||||||||||
| Port Authority of New York & New Jersey Special Obligation RB VRDN for Versatile Structure Obligation Series 1994 2 (SPA-Morgan Guaranty Trust) (A-1+/VMIG1) | ||||||||||||||
| 4,200,000 | 2.03 | 05/02/2005 | 4,200,000 | |||||||||||
| $ | 22,855,000 | |||||||||||||
50
| Principal | Interest | Maturity | ||||||||||||
| Amount | Rate | Date | Value | |||||||||||
Short Term Investments(c) – (continued) | ||||||||||||||
| North Carolina – 0.1% | ||||||||||||||
| University of North Carolina at Chapel Hill RB VRDN for Updates Series 2001 A (SPA-Landesbank Hessen-Thueringen) (A-1+/VMIG1) | ||||||||||||||
| $ | 5,030,000 | 2.23 | % | 05/02/2005 | $ | 5,030,000 | ||||||||
| Texas – 0.3% | ||||||||||||||
| Gulf Coast Waste Disposal Authority Environmental Facilities RB VRDN for Exxonmobil Project Series 2003 (AMT) (A-1+/VMIG1) | ||||||||||||||
| 5,650,000 | 2.10 | % | 05/02/2005 | $ | 5,650,000 | |||||||||
| Harris County Industry Development Corp. PCRB Series 1984 (A-1+/Aaa) | ||||||||||||||
| 6,500,000 | 2.19 | 05/02/2005 | 6,500,000 | |||||||||||
| North Central Texas Health Facility Development Corp. RB VRDN for Presbyterian Medical Center Series 1985 C (MBIA) (SPA-Chase Manhattan Bank) (A-1+/VMIG1) | ||||||||||||||
| 1,355,000 | 2.23 | 05/02/2005 | 1,355,000 | |||||||||||
| $ | 13,505,000 | |||||||||||||
| TOTAL SHORT TERM INVESTMENTS | ||||||||||||||
| (Cost $74,130,000) | $ | 74,130,000 | ||||||||||||
| TOTAL INVESTMENTS – 99.3% | ||||||||||||||
| (Cost $3,847,127,471) | $ | 4,050,993,611 | ||||||||||||
| The percentage shown for each investment category reflects the value of investments in that category as a percentage of total net assets. |
| (a) | Securities with “Put” features with resetting interest rates. Maturity dates disclosed are the next interest reset dates. | |
| (b) | Inverse variable rate security. Interest rate disclosed is that which is in effect at April 30, 2005. | |
| (c) | Variable rate security. Interest rate disclosed is that which is in effect at April 30, 2005. | |
| (d) | Pre-Refunded security. Maturity date disclosed is prerefunding date. | |
| (e) | Securities are exempt from registration under Rule 144A of the Securities Act of 1933. Under procedures approved by the Board of Trustees, such securities have been determined to be liquid by the Investment Adviser and may be resold, normally to qualified institutional buyers in transactions exempt from registration. Total market value of Rule 144A securities amounts to $129,324,665, which represents approximately 3.3% of net assets as of April 30, 2005. | |
| (f) | Security is currently in default. | |
| (g) | Security issued with a zero coupon. Income is recognized through the accretion of discount. | |
| (h) | This security is issued with a zero coupon rate which increases to the stated rate at a set date in the future. |
51
April 30, 2005 (Unaudited)
| Investment Abbreviations: | ||||||
| ACA | — | Insured by American Capital Access | ||||
| AGC | — | Insured by ACE Guaranty Corp. | ||||
| AMBAC | — | Insured by American Municipal Bond Assurance Corp. | ||||
| AMT | — | Alternative Minimum Tax | ||||
| BANS | — | Bond Anticipation Notes | ||||
| COPS | — | Certificates of Participation | ||||
| CRA | — | Community Reinvestment Act | ||||
| ETM | — | Escrow to Maturity | ||||
| FGIC | — | Insured by Financial Guaranty Insurance Co. | ||||
| FHLMC | — | Insured by Federal Home Loan Mortgage Corp. | ||||
| FNMA | — | Insured by Federal National Mortgage Association | ||||
| FSA | — | Insured by Financial Security Assurance Co. | ||||
| GNMA | — | Insured by Government National Mortgage Association | ||||
| GO | — | General Obligation | ||||
| GTD | — | Guaranteed | ||||
| IDA | — | Industrial Development Authority | ||||
| LIBOR | — | London Inter-Bank Offered Rate | ||||
| LOC | — | Letter of Credit | ||||
| MBIA | — | Insured by Municipal Bond Investors Assurance | ||||
| MF Hsg. | — | Multi-Family Housing | ||||
| PCRB | — | Pollution Control Revenue Bond | ||||
| Radian | — | Insured by Radian Asset Assurance | ||||
| RB | — | Revenue Bond | ||||
| RMKT | — | Remarketed | ||||
| RITES | — | Residual Interest Tax Exempt Securities | ||||
| SPA | — | Stand-by Purchase Agreement | ||||
| VRDN | — | Variable Rate Demand Notes | ||||
| XLCA | — | Insured by XL Capital Assurance | ||||
| Security ratings disclosed, if any, are issued by Standard & Poor’s/ Moody’s Investors Service. A brief description of the ratings is available in the Fund’s Statement of Additional Information. |
52
| ADDITIONAL INVESTMENT INFORMATION |
SWAP CONTRACTS — At April 30, 2005, the Fund had outstanding swap contracts with the following terms:
| Rate Type | ||||||||||||||||||||
| Notional | Payments | Payments | ||||||||||||||||||
| Swap | Amount | Termination | Made by | Received by | Unrealized | |||||||||||||||
| Swap Type | Counterparty | (000s) | Date | the Fund | the Fund | Gain (Loss) | ||||||||||||||
Interest Rate | Morgan Stanley | $ | 75,000 | 06/24/2015 | 5.00 | % | 3-month LIBOR Floating | $ | (1,909,644 | ) | ||||||||||
Interest Rate | Salomon Smith Barney | 45,000 | 02/23/2025 | 5.05 | % | 3-month LIBOR Floating | (641,884 | ) | ||||||||||||
Interest Rate | Merrill Lynch | 45,000 | 05/18/2025 | 4.95 | % | 3-month LIBOR Floating | (6,957 | ) | ||||||||||||
Interest Rate | JP Morgan | 50,000 | 05/14/2035 | 4.87 | % | 3-month LIBOR Floating | 1,033,606 | |||||||||||||
TOTAL | $ | (1,524,879 | ) | |||||||||||||||||
53
| Short Duration | Municipal | High Yield | |||||||||||||
| Tax-Free Fund | Income Fund | Municipal Fund | |||||||||||||
| Assets: | |||||||||||||||
| Investment in securities, at value (identified cost $513,400,092, $326,402,402, and $3,847,127,471, respectively) | $ | 510,824,042 | $ | 350,008,889 | $ | 4,050,993,611 | |||||||||
| Cash | — | — | 48,343,432 | ||||||||||||
| Receivables: | |||||||||||||||
| Interest, net of allowances | 7,464,038 | 6,280,458 | 87,872,371 | ||||||||||||
| Investment securities sold | 12,170,649 | — | 6,425,528 | ||||||||||||
| Fund shares sold | 444,732 | 2,945,706 | 21,497,438 | ||||||||||||
| Swap contracts, at value | — | — | 1,033,606 | ||||||||||||
| Reimbursement from adviser | 37,098 | 43,423 | 81,991 | ||||||||||||
| Other assets | 25,202 | 15,131 | 71,326 | ||||||||||||
Total assets | 530,965,761 | 359,293,607 | 4,216,319,303 | ||||||||||||
| Liabilities: | |||||||||||||||
| Due to custodian | 276,623 | 529,697 | — | ||||||||||||
| Payables: | |||||||||||||||
| Investment securities purchased | — | — | 124,433,344 | ||||||||||||
| Fund shares repurchased | 17,227,896 | 681,245 | 1,985,205 | ||||||||||||
| Income distribution | 222,670 | 495,850 | 3,599,264 | ||||||||||||
| Amounts owed to affiliates | 249,057 | 252,413 | 2,611,834 | ||||||||||||
| Swap contracts, at value | 71,320 | 72,093 | 2,558,485 | ||||||||||||
| Accrued expenses | 65,797 | 86,805 | 95,977 | ||||||||||||
Total liabilities | 18,113,363 | 2,118,103 | 135,284,109 | ||||||||||||
| Net Assets: | |||||||||||||||
| Paid-in capital | 521,609,442 | 339,971,463 | 3,909,462,843 | ||||||||||||
| Accumulated undistributed (distributions in excess of) net investment income | 18,789 | (50,415 | ) | (67,174 | ) | ||||||||||
| Accumulated net realized loss on investment transactions | (6,128,463 | ) | (6,279,938 | ) | (30,701,736 | ) | |||||||||
| Net unrealized gain (loss) on investments | (2,647,370 | ) | 23,534,394 | 202,341,261 | |||||||||||
NET ASSETS | $ | 512,852,398 | $ | 357,175,504 | $ | 4,081,035,194 | |||||||||
| Net assets: | |||||||||||||||
| Class A | $ | 173,765,357 | $ | 206,470,428 | $ | 1,853,427,541 | |||||||||
| Class B | 3,622,088 | 14,138,277 | 49,006,432 | ||||||||||||
| Class C | 12,290,980 | 6,877,995 | 72,259,565 | ||||||||||||
| Institutional | 323,119,469 | 129,350,148 | 2,106,341,656 | ||||||||||||
| Service | 54,504 | 338,656 | — | ||||||||||||
| Shares outstanding: | |||||||||||||||
| Class A | 16,922,932 | 13,101,132 | 166,448,633 | ||||||||||||
| Class B | 353,051 | 897,082 | 4,400,788 | ||||||||||||
| Class C | 1,197,071 | 436,294 | 6,489,242 | ||||||||||||
| Institutional | 31,483,406 | 8,209,500 | 189,120,724 | ||||||||||||
| Service | 5,313 | 21,369 | — | ||||||||||||
| Total shares outstanding, $0.001 par value (unlimited number of shares authorized) | 49,961,773 | 22,665,377 | 366,459,387 | ||||||||||||
Net asset value, offering and redemption price per share:(a) | |||||||||||||||
| Class A | $ | 10.27 | $ | 15.76 | $ | 11.14 | |||||||||
| Class B | 10.26 | 15.76 | 11.14 | ||||||||||||
| Class C | 10.27 | 15.76 | 11.14 | ||||||||||||
| Institutional | 10.26 | 15.76 | 11.14 | ||||||||||||
| Service | 10.26 | 15.85 | — | ||||||||||||
| (a) | Maximum public offering price per share for Class A Shares of Short Duration Tax-Free (NAV per share multiplied by 1.0204) and for Class A Shares of Municipal Income and High Yield Municipal Funds (NAV per share multiplied by 1.0471) is $10.48, $16.50 and $11.66, respectively. At redemption, Class B and Class C Shares may be subject to a contingent deferred sales charge, assessed on the amount equal to the lesser of the current net asset value or the original purchase price of the shares. |
54
| Short Duration | Municipal | High Yield | |||||||||||||
| Tax-Free Fund | Income Fund | Municipal Fund | |||||||||||||
| Investment income: | |||||||||||||||
| Interest, net of allowances | $ | 8,793,548 | $ | 8,710,627 | $ | 102,484,031 | |||||||||
Total income | 8,793,548 | 8,710,627 | 102,484,031 | ||||||||||||
| Expenses: | |||||||||||||||
| Management fees | 1,145,336 | 969,259 | 9,520,840 | ||||||||||||
Distribution and Service fees(a) | 328,717 | 378,849 | 2,654,571 | ||||||||||||
Transfer Agent fees(a) | 268,546 | 252,017 | 2,030,045 | ||||||||||||
| Custody and accounting fees | 100,315 | 86,058 | 261,310 | ||||||||||||
| Registration fees | 29,365 | 28,874 | 53,826 | ||||||||||||
| Printing fees | 24,437 | 24,437 | 24,437 | ||||||||||||
| Professional fees | 19,033 | 19,033 | 19,033 | ||||||||||||
| Trustee fees | 4,593 | 4,593 | 4,593 | ||||||||||||
| Service Share fees | 135 | 834 | — | ||||||||||||
| Other | 21,762 | 19,285 | 46,220 | ||||||||||||
Total expenses | 1,942,239 | 1,783,239 | 14,614,875 | ||||||||||||
| Less — expense reductions | (338,010 | ) | (268,403 | ) | (362,966 | ) | |||||||||
Net expenses | 1,604,229 | 1,514,836 | 14,251,909 | ||||||||||||
NET INVESTMENT INCOME | 7,189,319 | 7,195,791 | 88,232,122 | ||||||||||||
| Realized and unrealized gain (loss) on investment and swap transactions: | |||||||||||||||
| Net realized gain (loss) from: | |||||||||||||||
| Investment transactions | (1,431,129 | ) | 445,987 | 13,137,695 | |||||||||||
| Swap contracts | (93,143 | ) | (66,143 | ) | (6,899,255 | ) | |||||||||
| Net change in unrealized gain (loss) on: | |||||||||||||||
| Investments | (5,478,823 | ) | 1,252,522 | 70,198,225 | |||||||||||
| Swap contracts | (71,320 | ) | (72,093 | ) | 2,579,438 | ||||||||||
Net realized and unrealized gain (loss) on investment and swap transactions | (7,074,415 | ) | 1,560,273 | 79,016,103 | |||||||||||
NET INCREASE IN NET ASSETS RESULTING FROM OPERATIONS | $ | 114,904 | $ | 8,756,064 | $ | 167,248,225 | |||||||||
| (a) | Class specific Distribution and Service, and Transfer Agent fees were as follows: |
| Distribution and Service Fees | Transfer Agent Fees | |||||||||||||||||||||||||||||||
| Fund | Class A | Class B | Class C | Class A | Class B | Class C | Institutional | Service | ||||||||||||||||||||||||
| Short Duration Tax-Free | $ | 232,678 | $ | 19,716 | $ | 76,323 | $ | 176,835 | $ | 3,746 | $ | 14,501 | $ | 73,453 | $ | 11 | ||||||||||||||||
| Municipal Income | 277,107 | 70,552 | 31,190 | 210,601 | 13,405 | 5,926 | 22,018 | 67 | ||||||||||||||||||||||||
| High Yield Municipal | 2,087,632 | 241,052 | 325,887 | 1,586,600 | 45,800 | 61,919 | 335,726 | — | ||||||||||||||||||||||||
55
| Short Duration Tax-Free Fund | |||||||||||||
| For the | |||||||||||||
| Six Months | |||||||||||||
| Ended | For the | ||||||||||||
| April 30, 2005 | Year Ended | ||||||||||||
| (Unaudited) | October 31, 2004 | ||||||||||||
| From operations: | |||||||||||||
| Net investment income | $ | 7,189,319 | $ | 13,563,951 | |||||||||
| Net realized gain (loss) from investment and swap transactions | (1,524,272 | ) | (2,573,578 | ) | |||||||||
| Net change in unrealized gain (loss) on investment and swap transactions | (5,550,143 | ) | (1,976,948 | ) | |||||||||
Net increase in net assets resulting from operations | 114,904 | 9,013,425 | |||||||||||
| Distributions to shareholders: | |||||||||||||
| From net investment income | |||||||||||||
| Class A Shares | (2,116,626 | ) | (3,525,305 | ) | |||||||||
| Class B Shares | (32,888 | ) | (66,644 | ) | |||||||||
| Class C Shares | (115,466 | ) | (253,162 | ) | |||||||||
| Institutional Shares | (4,900,695 | ) | (9,811,734 | ) | |||||||||
| Service Shares | (587 | ) | (1,008 | ) | |||||||||
Total distributions to shareholders | (7,166,262 | ) | (13,657,853 | ) | |||||||||
| From share transactions: | |||||||||||||
| Proceeds from sales of shares | 82,504,934 | 400,943,541 | |||||||||||
| Proceeds received in connection with merger | — | — | |||||||||||
| Reinvestment of dividends and distributions | 5,852,778 | 11,221,016 | |||||||||||
Cost of shares repurchased(a) | (189,125,686 | ) | (467,237,648 | ) | |||||||||
Net increase (decrease) in net assets resulting from share transactions | (100,767,974 | ) | (55,073,091 | ) | |||||||||
NET INCREASE (DECREASE) | (107,819,332 | ) | (59,717,519 | ) | |||||||||
| Net assets: | |||||||||||||
| Beginning of period | 620,671,730 | 680,389,249 | |||||||||||
| End of period | $ | 512,852,398 | $ | 620,671,730 | |||||||||
Accumulated undistributed (distributions in excess of) net investment income | $ | 18,789 | $ | (4,268 | ) | ||||||||
| (a) | Net of $9,102 and $2,607 in redemption fees remitted to the Municipal Income Fund for the periods ended April 30, 2005 and October 31, 2004, respectively. |
56
| Municipal Income Fund | High Yield Municipal Fund | |||||||||||||||
| For the | For the | |||||||||||||||
| Six Months | Six Months | |||||||||||||||
| Ended | For the | Ended | For the | |||||||||||||
| April 30, 2005 | Year Ended | April 30, 2005 | Year Ended | |||||||||||||
| (Unaudited) | October 31, 2004 | (Unaudited) | October 31, 2004 | |||||||||||||
| $ | 7,195,791 | $ | 10,496,431 | $ | 88,232,122 | $ | 133,824,220 | |||||||||
| 379,844 | (870,272 | ) | 6,238,440 | (23,734,821 | ) | |||||||||||
| 1,180,429 | 4,844,703 | 72,777,663 | 76,026,983 | |||||||||||||
| 8,756,064 | 14,470,862 | 167,248,225 | 186,116,382 | |||||||||||||
| (4,534,104 | ) | (7,059,611 | ) | (42,423,856 | ) | (60,929,553 | ) | |||||||||
| (235,961 | ) | (503,363 | ) | (1,047,089 | ) | (1,953,931 | ) | |||||||||
| (104,070 | ) | (184,775 | ) | (1,412,775 | ) | (2,184,666 | ) | |||||||||
| (2,443,942 | ) | (2,688,075 | ) | (46,035,689 | ) | (66,279,416 | ) | |||||||||
| (6,627 | ) | (12,672 | ) | — | — | |||||||||||
| (7,324,704 | ) | (10,448,496 | ) | (90,919,409 | ) | (131,347,566 | ) | |||||||||
| 226,653,158 | 111,920,683 | 1,218,545,623 | 1,703,304,968 | |||||||||||||
| 59,489,535 | — | — | — | |||||||||||||
| 4,718,214 | 7,074,276 | 70,502,932 | 99,515,255 | |||||||||||||
| (195,137,805 | ) | (101,589,530 | ) | (413,160,453 | ) | (645,107,399 | ) | |||||||||
| 95,723,102 | 17,405,429 | 875,888,102 | 1,157,712,824 | |||||||||||||
| 97,154,462 | 21,427,795 | 952,216,918 | 1,212,481,640 | |||||||||||||
| 260,021,042 | 238,593,247 | 3,128,818,276 | 1,916,336,636 | |||||||||||||
| $ | 357,175,504 | $ | 260,021,042 | $ | 4,081,035,194 | $ | 3,128,818,276 | |||||||||
| $ | (50,415 | ) | $ | 78,498 | $ | (67,174 | ) | $ | 2,620,113 | |||||||
57
| 1. ORGANIZATION |
| 2. SIGNIFICANT ACCOUNTING POLICIES |
A. Investment Valuation — Portfolio securities for which accurate market quotations are readily available are valued at market value on the basis of quotations furnished by a pricing service or provided by dealers in such securities. Portfolio securities for which accurate market quotations are not readily available are valued at fair value based on yield equivalents, pricing matrices or other sources, under valuation procedures established by the Trust’s Board of Trustees. Short-term debt obligations maturing in sixty days or less are valued at amortized cost which approximates value.
B. Security Transactions and Investment Income — Security transactions are reflected as of the trade date. Realized gains and losses on sales of portfolio securities are calculated using the identified cost basis. Interest income is recorded on the basis of interest accrued, premium amortized and discount accreted. Market discounts, original issue discount and market premiums on debt securities are amortized to interest income over the life of the security with a corresponding adjustment in the cost basis of that security.
C. Expenses — Expenses incurred by the Trust that do not specifically relate to an individual Fund of the Trust are allocated to the Funds on a straight-line or pro rata basis depending upon the nature of the expense.
D. Federal Taxes — It is each Fund’s policy to comply with the requirements of the Internal Revenue Code applicable to regulated investment companies and to distribute each year substantially all of its investment company taxable and tax-exempt income and capital gains to its shareholders. Accordingly, no federal tax provisions are required. Dividends and distributions to shareholders are recorded on the ex-dividend date. Income distributions are declared daily and paid monthly. Capital gain distributions, if any, are declared and paid annually for all funds.
E. Segregation Transactions — As set forth in the prospectus, the Funds may enter into certain derivative transactions to seek to increase total return. Interest rate swaps, futures contracts, written options, when-issued securities and forward commitments represent examples of such transactions. As a result of entering into these transactions, the Funds are required
| 2. SIGNIFICANT ACCOUNTING POLICIES (continued) |
F. Swap Contracts — The Funds may enter into swap transactions for hedging purposes or to seek to increase total return. A swap is an agreement that obligates two parties to exchange a series of cash flows at specified intervals based upon or calculated by reference to changes in specified prices or rates for a specified amount of an underlying asset or notional principal amount. The payment flows are usually netted against each other, with the difference being paid by one party to the other.
| 3. AGREEMENTS |
| 3. AGREEMENTS (continued) |
| Management Fee | ||||||||||||||||
| Other | ||||||||||||||||
| Contractual | Waiver | Net | Expense | |||||||||||||
| Fund | Annual Rate | Annual Rate | Annual Rate | Limit | ||||||||||||
| Short Duration Tax-Free | 0.40 | % | 0.05 | % | 0.35 | % | 0.004 | % | ||||||||
| Municipal Income | 0.55 | 0.05 | 0.50 | 0.004 | ||||||||||||
| High Yield Municipal | 0.55 | — | 0.55 | 0.004 | ||||||||||||
| Contingent Deferred Sales Charge | ||||||||||||
| Sales Load | ||||||||||||
| Fund | Class A | Class B | Class C | |||||||||
| Short Duration Tax-Free | $ | 1,600 | $ | — | $ | — | ||||||
| Municipal Income | 42,300 | — | — | |||||||||
| High Yield Municipal | 111,800 | — | — | |||||||||
Effective November 15, 2004, the Class B and Class C Shares of the Goldman Sachs Municipal Income Fund began charging a 2% redemption fee on the redemption of shares (including by exchange) held for 30 calendar days or less.
| 3. AGREEMENTS (continued) |
| Fee Waivers | ||||||||||||||||||||
| Class B | Other | Custody | ||||||||||||||||||
| Distribution | Expense | Fee | Total Expense | |||||||||||||||||
| Fund | Management | and Service | Reimbursement | Reduction | Reductions | |||||||||||||||
| Short Duration Tax-Free | $ | 143 | $ | 3 | $ | 188 | $ | 4 | $ | 338 | ||||||||||
| Municipal Income | 88 | — | 175 | 5 | 268 | |||||||||||||||
| High Yield Municipal | — | — | 340 | 23 | 363 | |||||||||||||||
At April 30, 2005, the amounts owed to affiliates were as follows (in thousands):
| Management | Distribution and | Transfer | ||||||||||||||
| Fund | Fees | Service Fees | Agent Fees | Total | ||||||||||||
| Short Duration Tax-Free | $ | 156 | $ | 51 | $ | 42 | $ | 249 | ||||||||
| Municipal Income | 150 | 61 | 41 | 252 | ||||||||||||
| High Yield Municipal | 1,765 | 476 | 371 | 2,612 | ||||||||||||
| 4. PORTFOLIO SECURITIES TRANSACTIONS |
| Fund | Purchases | Sales and Maturities | ||||||||
| Short Duration Tax-Free | $ | 87,023 | $ | 183,288 | ||||||
| Municipal Income | 196,404 | 105,174 | ||||||||
| High Yield Municipal | 1,230,990 | 453,329 | ||||||||
| 5. LINE OF CREDIT FACILITY |
| 6. ADDITIONAL TAX INFORMATION |
| Short Duration | Municipal | High Yield | |||||||||||
| Tax-Free | Income | Municipal | |||||||||||
| Capital loss carryforward: | |||||||||||||
| Expiring 2007 | $ | (183,057 | ) | $ | (1,187,567 | ) | $ | — | |||||
| Expiring 2008 | (1,858,014 | ) | (3,726,522 | ) | — | ||||||||
| Expiring 2010 | — | — | (1,488,279 | ) | |||||||||
| Expiring 2011 | — | (872,080 | ) | (11,577,969 | ) | ||||||||
| Expiring 2012 | (2,563,121 | ) | (873,613 | ) | (23,410,699 | ) | |||||||
| Total capital loss carryforward | $ | (4,604,192 | ) | $ | (6,659,782 | ) | $ | (36,476,947 | ) | ||||
| Timing differences (income distribution payable) | (207,686 | ) | (263,580 | ) | (3,007,255 | ) | |||||||
At April 30, 2005, the Funds’ aggregate security unrealized gains and losses based on cost for U.S. federal income tax purposes was as follows:
| Short Duration | Municipal | High Yield | |||||||||||
| Tax-Free | Income | Municipal | |||||||||||
| Tax Cost | $ | 513,406,691 | $ | 326,298,860 | $ | 3,844,990,237 | |||||||
| Gross unrealized gain | 1,749,313 | 23,837,384 | 214,544,615 | ||||||||||
| Gross unrealized loss | (4,331,962 | ) | (127,355 | ) | (8,541,241 | ) | |||||||
| Net unrealized security gain (loss) | $ | (2,582,649 | ) | $ | 23,710,029 | $ | 206,003,374 | ||||||
The difference between book-basis and tax-basis unrealized gains (losses) is attributable primarily to wash sales and accretion of market discount for book accounting purposes.
| 7. OTHER MATTERS |
| Acquired Fund’s Shares | ||||||||||||
| Exchanged Shares of | Value of | Outstanding as of | ||||||||||
| Survivor/Acquired Fund | Survivor Issued | Exchanged Shares | February 25, 2005 | |||||||||
| Goldman Sachs Municipal Income Class A/ Expedition Tax-Free Investment Grade Bond Class A | 22,516 | $ | 354,853 | 33,157 | ||||||||
| Goldman Sachs Municipal Income Class B/ Expedition Tax-Free Investment Grade Bond Class B | 13,804 | 217,561 | 20,322 | |||||||||
| Goldman Sachs Municipal Income Institutional Class/ Expedition Tax-Free Investment Grade Bond Institutional Class | 3,740,766 | 58,917,121 | 5,500,562 | |||||||||
| 7. OTHER MATTERS (continued) |
The following chart shows the Survivor Fund’s and Acquired Fund’s aggregate net assets (immediately before and after the completion of the acquisition) and the Acquired Fund’s unrealized appreciation.
| Survivor Fund’s | ||||||||||||||||
| Survivor Fund’s | Acquired Fund’s | Acquired Fund’s | Aggregate Net Assets | |||||||||||||
| Aggregate Net Assets | Aggregate Net Assets | Unrealized | Immediately After | |||||||||||||
| Survivor/Acquired Fund | Before Acquisition | Before Acquisition | Appreciation | Acquisition | ||||||||||||
| Goldman Sachs Municipal Income/Expedition Tax-Free Investment Grade Bond | $ | 380,232,783 | $ | 59,489,535 | $ | 3,814,099 | $ | 439,722.318 | ||||||||
Legal Proceedings — Purported class and derivative action lawsuits were filed in April and May 2004 in the United States District Court for the Southern District of New York against GSAM and certain related parties, including certain Goldman Sachs Funds and the Trustees and Officers of the Trust. In June 2004, these lawsuits were consolidated into one action and in November 2004 a consolidated and amended complaint was filed against GSAM, Goldman Sachs and certain related parties including certain Goldman Sachs Funds and the Trustees and Officers of the Trust. The amended complaint alleges violations of the Act and the Investment Advisers Act of 1940. The consolidated and amended complaint also asserts claims involving common law breach of fiduciary duty, and unjust enrichment. The consolidated and amended complaint alleges, among other things, that between April 2, 1999 and January 9, 2004 (the “Class Period”), GSAM and other defendants made improper and excessive brokerage commission and other payments to brokers that sold shares of the Goldman Sachs Funds; and omitted statements of fact in registration statements and reports filed pursuant to the Act which were necessary to prevent such registration statements and reports from being materially false and misleading. The consolidated and amended complaint further alleges that the Trust’s Officers and Trustees breached their fiduciary duties by, among other things, permitting the payments to occur. The consolidated and amended complaint also alleges that GSAM used 12b-1 fees for improper purposes and made improper use of soft dollars. Based on currently available information, GSAM believes that the likelihood that the purported class action lawsuits will have a material adverse financial impact on the Funds is remote, and the pending actions are not likely to materially affect its ability to provide investment management services to its clients, including the Goldman Sachs Funds.
| 8. SUBSEQUENT EVENTS |
| Fund | Asset Level | Fee | ||||||
Short Duration Tax-Free1 | Up to $1 billion | 0.40 | % | |||||
| Next $1 billion | 0.36 | |||||||
| Over $2 billion | 0.34 | |||||||
Municipal Income1 | Up to $1 billion | 0.55 | ||||||
| Next $1 billion | 0.50 | |||||||
| Over $2 billion | 0.48 | |||||||
| High Yield Municipal | Up to $2 billion | 0.55 | ||||||
| Over $2 billion | 0.50 | |||||||
Also on the above meeting date, the Board of Trustees approved a contractual reduction in Transfer Agent fees to an annual rate of 0.16% of the average daily net asset for Class A, Class B and Class C Shares, effective July 1, 2005.
Notes to Financial Statements (continued)
| 9. SUMMARY OF SHARE TRANSACTIONS |
| Short Duration Tax-Free Fund | ||||||||||||||||
| For the Six Months Ended | For the Year Ended | |||||||||||||||
| April 30, 2005 (Unaudited) | October 31, 2004 | |||||||||||||||
| Shares | Dollars | Shares | Dollars | |||||||||||||
Class A Shares | ||||||||||||||||
| Shares sold | 5,086,614 | $ | 52,513,337 | 14,508,608 | $ | 151,166,293 | ||||||||||
| Shares issued in connection with merger | — | — | — | — | ||||||||||||
| Reinvestment of dividends and distributions | 173,275 | 1,784,995 | 288,089 | 2,996,642 | ||||||||||||
Shares converted from Class B(a) | 490 | 5,072 | — | — | ||||||||||||
| Shares repurchased | (6,476,898 | ) | (66,733,944 | ) | (16,259,173 | ) | (169,276,864 | ) | ||||||||
| (1,216,519 | ) | (12,430,540 | ) | (1,462,476 | ) | (15,113,929 | ) | |||||||||
Class B Shares | ||||||||||||||||
| Shares sold | 11,264 | 116,469 | 104,933 | 1,091,111 | ||||||||||||
| Shares issued in connection with merger | — | — | — | — | ||||||||||||
| Reinvestment of dividends and distributions | 2,153 | 22,163 | 4,334 | 45,062 | ||||||||||||
Shares converted to Class A(a) | (491 | ) | (5,072 | ) | — | — | ||||||||||
| Shares repurchased | (104,759 | ) | (1,081,750 | ) | (290,441 | ) | (3,022,813 | ) | ||||||||
| (91,833 | ) | (948,190 | ) | (181,174 | ) | (1,886,640 | ) | |||||||||
Class C Shares | ||||||||||||||||
| Shares sold | 112,200 | 1,157,984 | 431,310 | 4,487,734 | ||||||||||||
| Reinvestment of dividends and distributions | 6,202 | 63,899 | 10,635 | 110,634 | ||||||||||||
| Shares repurchased | (680,961 | ) | (7,023,274 | ) | (1,558,986 | ) | (16,221,989 | ) | ||||||||
| (562,559 | ) | (5,801,391 | ) | (1,117,041 | ) | (11,623,621 | ) | |||||||||
Institutional Shares | ||||||||||||||||
| Shares sold | 2,783,476 | 28,717,144 | 23,370,659 | 244,198,403 | ||||||||||||
| Shares issued in connection with merger | — | — | — | — | ||||||||||||
| Reinvestment of dividends and distributions | 386,643 | 3,981,134 | 776,004 | 8,067,671 | ||||||||||||
| Shares repurchased | (11,088,266 | ) | (114,286,718 | ) | (26,765,813 | ) | (278,695,977 | ) | ||||||||
| (7,918,147 | ) | (81,588,440 | ) | (2,619,150 | ) | (26,429,903 | ) | |||||||||
Service Shares | ||||||||||||||||
| Shares sold | — | — | — | — | ||||||||||||
| Reinvestment of dividends and distributions | 57 | 587 | 97 | 1,007 | ||||||||||||
| Shares repurchased | — | — | (1,913 | ) | (20,005 | ) | ||||||||||
| 57 | 587 | (1,816 | ) | (18,998 | ) | |||||||||||
NET INCREASE (DECREASE) | (9,789,001 | ) | $ | (100,767,974 | ) | (5,381,657 | ) | $ | (55,073,091 | ) | ||||||
| Municipal Income Fund | High Yield Municipal Fund | |||||||||||||||||||||||||||||||
| For the Six Months Ended | For the Year Ended | For the Six Months Ended | For the Year Ended | |||||||||||||||||||||||||||||
| April 30, 2005 (Unaudited) | October 31, 2004 | April 30, 2005 (Unaudited) | October 31, 2004 | |||||||||||||||||||||||||||||
| Shares | Dollars | Shares | Dollars | Shares | Dollars | Shares | Dollars | |||||||||||||||||||||||||
| 8,086,982 | $ | 126,879,219 | 4,550,850 | $ | 70,787,735 | 48,667,001 | $ | 535,389,069 | 85,551,728 | $ | 923,498,749 | |||||||||||||||||||||
| 22,516 | 354,853 | — | — | — | — | — | — | |||||||||||||||||||||||||
| 248,490 | 3,896,003 | 369,876 | 5,743,839 | 2,819,755 | 31,093,894 | 3,986,170 | 43,002,989 | |||||||||||||||||||||||||
| 9,286 | 144,700 | 1,048 | 16,288 | 1,177 | 12,929 | — | — | |||||||||||||||||||||||||
| (6,697,889 | ) | (104,795,261 | ) | (3,929,735 | ) | (60,985,842 | ) | (23,868,240 | ) | (263,233,921 | ) | (34,753,246 | ) | (377,292,580 | ) | |||||||||||||||||
| 1,669,385 | 26,479,514 | 992,039 | 15,562,020 | 27,619,693 | 303,261,971 | 54,784,652 | 589,209,158 | |||||||||||||||||||||||||
| 70,163 | 1,099,753 | 105,293 | 1,635,858 | 298,595 | 3,278,945 | 734,523 | 7,918,474 | |||||||||||||||||||||||||
| 13,804 | 217,561 | — | — | — | — | — | — | |||||||||||||||||||||||||
| 10,565 | 165,568 | 20,680 | 321,049 | 57,521 | 634,152 | 93,211 | 1,005,845 | |||||||||||||||||||||||||
| (9,286 | ) | (144,700 | ) | (1,048 | ) | (16,288 | ) | (1,177 | ) | (12,929 | ) | — | — | |||||||||||||||||||
| (88,574 | ) | (1,390,866 | ) | (207,315 | ) | (3,215,589 | ) | (382,095 | ) | (4,216,185 | ) | (680,251 | ) | (7,299,776 | ) | |||||||||||||||||
| (3,328 | ) | (52,684 | ) | (82,390 | ) | (1,274,970 | ) | (27,156 | ) | (316,017 | ) | 147,483 | 1,624,543 | |||||||||||||||||||
| 93,798 | 1,471,895 | 156,637 | 2,425,715 | 1,106,052 | 12,156,561 | 2,469,058 | 26,608,765 | |||||||||||||||||||||||||
| 4,644 | 72,818 | 8,634 | 134,076 | 75,776 | 835,564 | 104,708 | 1,129,455 | |||||||||||||||||||||||||
| (34,396 | ) | (539,304 | ) | (92,442 | ) | (1,427,503 | ) | (314,090 | ) | (3,454,980 | ) | (763,976 | ) | (8,223,575 | ) | |||||||||||||||||
| 64,046 | 1,005,409 | 72,829 | 1,132,288 | 867,738 | 9,537,145 | 1,809,790 | 19,514,645 | |||||||||||||||||||||||||
| 6,220,110 | 97,202,148 | 2,378,397 | 37,024,049 | 60,608,823 | 667,721,048 | 68,860,580 | 745,278,980 | |||||||||||||||||||||||||
| 3,740,766 | 58,917,121 | — | — | — | — | — | — | |||||||||||||||||||||||||
| 37,231 | 583,526 | 56,324 | 874,928 | 3,440,131 | 37,939,322 | 5,039,666 | 54,376,966 | |||||||||||||||||||||||||
| (5,648,703 | ) | (88,412,374 | ) | (2,319,939 | ) | (35,960,596 | ) | (12,955,221 | ) | (142,255,367 | ) | (23,530,406 | ) | (252,291,468 | ) | |||||||||||||||||
| 4,349,404 | 68,290,421 | 114,782 | 1,938,381 | 51,093,733 | 563,405,003 | 50,369,840 | 547,364,478 | |||||||||||||||||||||||||
| 9 | 143 | 3,027 | 47,326 | — | — | — | — | |||||||||||||||||||||||||
| 19 | 299 | 25 | 384 | — | — | — | — | |||||||||||||||||||||||||
| — | — | — | — | — | — | — | — | |||||||||||||||||||||||||
| 28 | 442 | 3,052 | 47,710 | — | — | — | — | |||||||||||||||||||||||||
| 6,079,535 | $ | 95,723,102 | 1,100,312 | $ | 17,405,429 | 79,554,008 | $ | 875,888,102 | 107,111,765 | $ | 1,157,712,824 | |||||||||||||||||||||
| Income (loss) from | Distributions | |||||||||||||||||||||||
| investment operations | to shareholders | |||||||||||||||||||||||
| Net asset | ||||||||||||||||||||||||
| value, | Net | Net realized | Total from | From net | ||||||||||||||||||||
| beginning | investment | and unrealized | investment | investment | ||||||||||||||||||||
| Year - Share Class | of period | income(c) | gain (loss) | operations | income | |||||||||||||||||||
| FOR THE SIX MONTHS ENDED APRIL 30, (Unaudited) | ||||||||||||||||||||||||
| 2005 - A | $ | 10.39 | $ | 0.12 | $ | (0.12 | ) | $ | — | $ | (0.12 | ) | ||||||||||||
| 2005 - B | 10.38 | 0.09 | (0.12 | ) | (0.03 | ) | (0.09 | ) | ||||||||||||||||
| 2005 - C | 10.39 | 0.08 | (0.12 | ) | (0.04 | ) | (0.08 | ) | ||||||||||||||||
| 2005 - Institutional | 10.39 | 0.14 | (0.13 | ) | 0.01 | (0.14 | ) | |||||||||||||||||
| 2005 - Service | 10.38 | 0.11 | (0.12 | ) | (0.01 | ) | (0.11 | ) | ||||||||||||||||
| FOR THE YEARS ENDED OCTOBER 31, | ||||||||||||||||||||||||
| 2004 - A | 10.45 | 0.19 | (0.06 | ) | 0.13 | (0.19 | ) | |||||||||||||||||
| 2004 - B | 10.44 | 0.12 | (0.05 | ) | 0.07 | (0.13 | ) | |||||||||||||||||
| 2004 - C | 10.45 | 0.11 | (0.06 | ) | 0.05 | (0.11 | ) | |||||||||||||||||
| 2004 - Institutional | 10.44 | 0.23 | (0.05 | ) | 0.18 | (0.23 | ) | |||||||||||||||||
| 2004 - Service | 10.44 | 0.17 | (0.05 | ) | 0.12 | (0.18 | ) | |||||||||||||||||
| 2003 - A | 10.36 | 0.17 | 0.10 | 0.27 | (0.18 | ) | ||||||||||||||||||
| 2003 - B | 10.35 | 0.11 | 0.10 | 0.21 | (0.12 | ) | ||||||||||||||||||
| 2003 - C | 10.36 | 0.10 | 0.09 | 0.19 | (0.10 | ) | ||||||||||||||||||
| 2003 - Institutional | 10.36 | 0.21 | 0.09 | 0.30 | (0.22 | ) | ||||||||||||||||||
| 2003 - Service | 10.34 | 0.15 | 0.12 | 0.27 | (0.17 | ) | ||||||||||||||||||
| 2002 - A | 10.26 | 0.26 | (d) | 0.12 | (d) | 0.38 | (0.28 | ) | ||||||||||||||||
| 2002 - B | 10.25 | 0.21 | (d) | 0.10 | (d) | 0.31 | (0.21 | ) | ||||||||||||||||
| 2002 - C | 10.26 | 0.18 | (d) | 0.12 | (d) | 0.30 | (0.20 | ) | ||||||||||||||||
| 2002 - Institutional | 10.25 | 0.31 | (d) | 0.12 | (d) | 0.43 | (0.32 | ) | ||||||||||||||||
| 2002 - Service | 10.24 | 0.26 | (d) | 0.10 | (d) | 0.36 | (0.26 | ) | ||||||||||||||||
| 2001 - A | 9.94 | 0.38 | 0.33 | 0.71 | (0.39 | ) | ||||||||||||||||||
| 2001 - B | 9.94 | 0.32 | 0.32 | 0.64 | (0.33 | ) | ||||||||||||||||||
| 2001 - C | 9.94 | 0.29 | 0.34 | 0.63 | (0.31 | ) | ||||||||||||||||||
| 2001 - Institutional | 9.94 | 0.42 | 0.32 | 0.74 | (0.43 | ) | ||||||||||||||||||
| 2001 - Service | 9.92 | 0.38 | 0.32 | 0.70 | (0.38 | ) | ||||||||||||||||||
| 2000 - A | 9.93 | 0.39 | (0.01 | ) | 0.38 | (0.37 | ) | |||||||||||||||||
| 2000 - B | 9.93 | 0.33 | (0.01 | ) | 0.32 | (0.31 | ) | |||||||||||||||||
| 2000 - C | 9.93 | 0.32 | (0.01 | ) | 0.31 | (0.30 | ) | |||||||||||||||||
| 2000 - Institutional | 9.93 | 0.43 | (0.01 | ) | 0.42 | (0.41 | ) | |||||||||||||||||
| 2000 - Service | 9.92 | 0.38 | (0.02 | ) | 0.36 | (0.36 | ) | |||||||||||||||||
| (a) | Assumes investment at the net asset value at the beginning of the period, reinvestment of all dividends and distributions, a complete redemption of the investment at the net asset value at the end of the period and no sales or redemption charges. Total return would be reduced if a sales or redemption charge were taken into account. Total returns for periods less than one full year are not annualized. Returns do not reflect the deduction of taxes that a shareholder would pay on capital gains and other taxable distributions or the redemption of Fund shares. |
| (b) | Annualized. |
| (c) | Calculated based on the average shares outstanding methodology. |
| (d) | As required, effective November 1, 2001, the Fund has adopted the provisions of the AICPA Audit and Accounting Guide for Investment Companies and began amortizing all premium and discounts on debt securities. The effect of this change for the year ended October 31, 2002 was an impact of less than $0.01 per share to net investment income and net realized and unrealized gains and losses, and an impact to the ratio of net investment income to average net assets with and without expense reductions by less than 0.01%. Per share amounts, ratios and supplemental data for periods prior to November 1, 2001 have not been restated to reflect this change in presentation. |
66
| Ratios assuming no | ||||||||||||||||||||||||||||||||||
| expense reductions | ||||||||||||||||||||||||||||||||||
| Ratio of | Ratio of | Ratio of | ||||||||||||||||||||||||||||||||
| Net assets | Ratio of | net investment | total | net investment | ||||||||||||||||||||||||||||||
| Net asset | at end of | net expenses | income | expenses | income | Portfolio | ||||||||||||||||||||||||||||
| value, end | Total | period | to average | to average | to average | to average | turnover | |||||||||||||||||||||||||||
| of period | return(a) | (in 000s) | net assets | net assets | net assets | net assets | rate | |||||||||||||||||||||||||||
| $ | 10.27 | (0.03 | )% | $ | 173,765 | 0.79 | %(b) | 2.28 | %(b) | 0.91 | %(b) | 2.16 | %(b) | 15 | % | |||||||||||||||||||
| 10.26 | (0.33 | ) | 3,622 | 1.39 | (b) | 1.68 | (b) | 1.66 | (b) | 1.41 | (b) | 15 | ||||||||||||||||||||||
| 10.27 | (0.40 | ) | 12,291 | 1.54 | (b) | 1.53 | (b) | 1.66 | (b) | 1.41 | (b) | 15 | ||||||||||||||||||||||
| 10.26 | 0.07 | 323,119 | 0.39 | (b) | 2.68 | (b) | 0.51 | (b) | 2.56 | (b) | 15 | |||||||||||||||||||||||
| 10.26 | (0.08 | ) | 55 | 0.89 | (b) | 2.18 | (b) | 1.01 | (b) | 2.06 | (b) | 15 | ||||||||||||||||||||||
| 10.39 | 1.25 | 188,487 | 0.79 | 1.80 | 0.90 | 1.69 | 37 | |||||||||||||||||||||||||||
| 10.38 | 0.64 | 4,619 | 1.39 | 1.20 | 1.65 | 0.94 | 37 | |||||||||||||||||||||||||||
| 10.39 | 0.49 | 18,283 | 1.54 | 1.04 | 1.65 | 0.93 | 37 | |||||||||||||||||||||||||||
| 10.39 | 1.75 | 409,228 | 0.39 | 2.20 | 0.50 | 2.09 | 37 | |||||||||||||||||||||||||||
| 10.38 | 1.15 | 55 | 0.89 | 1.70 | 1.00 | 1.59 | 37 | |||||||||||||||||||||||||||
| 10.45 | 2.62 | 204,838 | 0.80 | 1.66 | 0.92 | 1.54 | 43 | |||||||||||||||||||||||||||
| 10.44 | 2.01 | 6,536 | 1.40 | 1.09 | 1.67 | 0.82 | 43 | |||||||||||||||||||||||||||
| 10.45 | 1.86 | 30,057 | 1.55 | 0.94 | 1.67 | 0.82 | 43 | |||||||||||||||||||||||||||
| 10.44 | 2.93 | 438,884 | 0.40 | 1.99 | 0.52 | 1.87 | 43 | |||||||||||||||||||||||||||
| 10.44 | 2.62 | 74 | 0.90 | 1.45 | 1.02 | 1.33 | 43 | |||||||||||||||||||||||||||
| 10.36 | 3.72 | 118,906 | 0.79 | 2.57 | (d) | 1.02 | 2.34 | (d) | 31 | |||||||||||||||||||||||||
| 10.35 | 3.10 | 5,111 | 1.39 | 2.01 | (d) | 1.77 | 1.63 | (d) | 31 | |||||||||||||||||||||||||
| 10.36 | 2.94 | 27,937 | 1.54 | 1.80 | (d) | 1.77 | 1.57 | (d) | 31 | |||||||||||||||||||||||||
| 10.36 | 4.23 | 103,273 | 0.39 | 3.00 | (d) | 0.62 | 2.77 | (d) | 31 | |||||||||||||||||||||||||
| 10.34 | 3.62 | 72 | 0.89 | 2.53 | (d) | 1.12 | 2.30 | (d) | 31 | |||||||||||||||||||||||||
| 10.26 | 7.27 | 38,891 | 0.79 | 3.73 | 1.25 | 3.27 | 69 | |||||||||||||||||||||||||||
| 10.25 | 6.53 | 2,382 | 1.39 | 3.22 | 2.00 | 2.61 | 69 | |||||||||||||||||||||||||||
| 10.26 | 6.48 | 3,842 | 1.54 | 2.94 | 2.00 | 2.48 | 69 | |||||||||||||||||||||||||||
| 10.25 | 7.60 | 48,114 | 0.39 | 4.19 | 0.85 | 3.73 | 69 | |||||||||||||||||||||||||||
| 10.24 | 7.18 | 41 | 0.89 | 3.75 | 1.35 | 3.29 | 69 | |||||||||||||||||||||||||||
| 9.94 | 3.93 | 19,451 | 0.79 | 3.95 | 1.19 | 3.55 | 66 | |||||||||||||||||||||||||||
| 9.94 | 3.31 | 2,026 | 1.39 | 3.36 | 1.94 | 2.81 | 66 | |||||||||||||||||||||||||||
| 9.94 | 3.15 | 1,581 | 1.54 | 3.19 | 1.94 | 2.79 | 66 | |||||||||||||||||||||||||||
| 9.94 | 4.34 | 40,301 | 0.39 | 4.36 | 0.79 | 3.96 | 66 | |||||||||||||||||||||||||||
| 9.92 | 3.72 | 44 | 0.89 | 3.86 | 1.29 | 3.46 | 66 | |||||||||||||||||||||||||||
| Income (loss) from | Distributions | |||||||||||||||||||||||
| investment operations | to shareholders | |||||||||||||||||||||||
| Net asset | ||||||||||||||||||||||||
| value, | Net | Net realized | Total from | From net | ||||||||||||||||||||
| beginning | investment | and unrealized | investment | investment | ||||||||||||||||||||
| Year - Share Class | of period | income(c) | gain (loss) | operations | income | |||||||||||||||||||
| FOR THE SIX MONTHS ENDED APRIL 30, (Unaudited) | ||||||||||||||||||||||||
| 2005 - A | $ | 15.68 | $ | 0.31 | $ | 0.09 | $ | 0.40 | $ | (0.32 | ) | |||||||||||||
| 2005 - B | 15.68 | 0.25 | 0.09 | 0.34 | (0.26 | ) | ||||||||||||||||||
| 2005 - C | 15.68 | 0.25 | 0.09 | 0.34 | (0.26 | ) | ||||||||||||||||||
| 2005 - Institutional | 15.67 | 0.34 | 0.10 | 0.44 | (0.35 | ) | ||||||||||||||||||
| 2005 - Service | 15.76 | 0.31 | 0.09 | 0.40 | (0.31 | ) | ||||||||||||||||||
| FOR THE YEARS ENDED OCTOBER 31, | ||||||||||||||||||||||||
| 2004 - A | 15.41 | 0.65 | 0.27 | 0.92 | (0.65 | ) | ||||||||||||||||||
| 2004 - B | 15.41 | 0.54 | 0.26 | 0.80 | (0.53 | ) | ||||||||||||||||||
| 2004 - C | 15.41 | 0.54 | 0.26 | 0.80 | (0.53 | ) | ||||||||||||||||||
| 2004 - Institutional | 15.40 | 0.72 | 0.26 | 0.98 | (0.71 | ) | ||||||||||||||||||
| 2004 - Service | 15.49 | 0.65 | 0.25 | 0.90 | (0.63 | ) | ||||||||||||||||||
| 2003 - A | 15.29 | 0.64 | 0.13 | 0.77 | (0.65 | ) | ||||||||||||||||||
| 2003 - B | 15.29 | 0.53 | 0.12 | 0.65 | (0.53 | ) | ||||||||||||||||||
| 2003 - C | 15.30 | 0.53 | 0.11 | 0.64 | (0.53 | ) | ||||||||||||||||||
| 2003 - Institutional | 15.29 | 0.71 | 0.11 | 0.82 | (0.71 | ) | ||||||||||||||||||
| 2003 - Service | 15.37 | 0.63 | 0.12 | 0.75 | (0.63 | ) | ||||||||||||||||||
| 2002 - A | 15.32 | 0.65 | (d) | (0.01 | )(d) | 0.64 | (0.67 | ) | ||||||||||||||||
| 2002 - B | 15.32 | 0.54 | (d) | (0.01 | )(d) | 0.53 | (0.56 | ) | ||||||||||||||||
| 2002 - C | 15.33 | 0.54 | (d) | (0.01 | )(d) | 0.53 | (0.56 | ) | ||||||||||||||||
| 2002 - Institutional | 15.32 | 0.71 | (d) | (0.01 | )(d) | 0.70 | (0.73 | ) | ||||||||||||||||
| 2002 - Service | 15.39 | 0.64 | (d) | — | (d)(e) | 0.64 | (0.66 | ) | ||||||||||||||||
| 2001 - A | 14.48 | 0.67 | 0.82 | 1.49 | (0.65 | ) | ||||||||||||||||||
| 2001 - B | 14.49 | 0.56 | 0.81 | 1.37 | (0.54 | ) | ||||||||||||||||||
| 2001 - C | 14.50 | 0.56 | 0.81 | 1.37 | (0.54 | ) | ||||||||||||||||||
| 2001 - Institutional | 14.48 | 0.73 | 0.82 | 1.55 | (0.71 | ) | ||||||||||||||||||
| 2001 - Service | 14.53 | 0.61 | 0.88 | 1.49 | (0.63 | ) | ||||||||||||||||||
| 2000 - A | 14.07 | 0.67 | 0.41 | 1.08 | (0.67 | ) | ||||||||||||||||||
| 2000 - B | 14.08 | 0.57 | 0.40 | 0.97 | (0.56 | ) | ||||||||||||||||||
| 2000 - C | 14.08 | 0.57 | 0.41 | 0.98 | (0.56 | ) | ||||||||||||||||||
| 2000 - Institutional | 14.07 | 0.72 | 0.42 | 1.14 | (0.73 | ) | ||||||||||||||||||
| 2000 - Service | 14.09 | 0.68 | 0.42 | 1.10 | (0.66 | ) | ||||||||||||||||||
| (a) | Assumes investment at the net asset value at the beginning of the period, reinvestment of all dividends and distributions, a complete redemption of the investment at the net asset value at the end of the period and no sales or redemption charges. Total return would be reduced if a sales or redemption charge were taken into account. Total returns for periods less than one full year are not annualized. Returns do not reflect the deduction of taxes that a shareholder would pay on capital gains and other taxable distributions or the redemption of Fund shares. |
| (b) | Annualized. |
| (c) | Calculated based on the average shares outstanding methodology. |
| (d) | As required, effective November 1, 2001, the Fund has adopted the provisions of the AICPA Audit and Accounting Guide for Investment Companies and began amortizing all premium and discounts on debt securities. The effect of this change for the year ended October 31, 2002 was an impact of less than $0.01 per share to net investment income and net realized and unrealized gains and losses, and an impact to the ratio of net investment income to average net assets with and without expense reductions by less than 0.01%. Per share amounts, ratios and supplemental data for periods prior to November 1, 2001 have not been restated to reflect this change in presentation. |
| (e) | Less than $0.005 per share. |
68
| Ratios assuming no | ||||||||||||||||||||||||||||||||||
| expense reductions | ||||||||||||||||||||||||||||||||||
| Ratio of | Ratio of | Ratio of | ||||||||||||||||||||||||||||||||
| Net assets | Ratio of | net investment | total | net investment | ||||||||||||||||||||||||||||||
| Net asset | at end of | net expenses | income | expenses | income | Portfolio | ||||||||||||||||||||||||||||
| value, end | Total | period | to average | to average | to average | to average | turnover | |||||||||||||||||||||||||||
| of period | return(a) | (in 000s) | net assets | net assets | net assets | net assets | rate | |||||||||||||||||||||||||||
| $ | 15.76 | 2.57 | % | $ | 206,471 | 0.94 | %(b) | 4.01 | %(b) | 1.09 | %(b) | 3.86 | %(b) | 31 | % | |||||||||||||||||||
| 15.76 | 2.19 | 14,138 | 1.69 | (b) | 3.26 | (b) | 1.84 | (b) | 3.11 | (b) | 31 | |||||||||||||||||||||||
| 15.76 | 2.19 | 6,878 | 1.69 | (b) | 3.25 | (b) | 1.84 | (b) | 3.10 | (b) | 31 | |||||||||||||||||||||||
| 15.76 | 2.84 | 129,350 | 0.54 | (b) | 4.39 | (b) | 0.69 | (b) | 4.24 | (b) | 31 | |||||||||||||||||||||||
| 15.85 | 2.57 | 339 | 1.04 | (b) | 3.90 | (b) | 1.19 | (b) | 3.75 | (b) | 31 | |||||||||||||||||||||||
| 15.68 | 6.09 | 179,223 | 0.94 | 4.21 | 1.12 | 4.03 | 32 | |||||||||||||||||||||||||||
| 15.68 | 5.30 | 14,117 | 1.69 | 3.46 | 1.87 | 3.28 | 32 | |||||||||||||||||||||||||||
| 15.68 | 5.30 | 5,838 | 1.69 | 3.46 | 1.87 | 3.28 | 32 | |||||||||||||||||||||||||||
| 15.67 | 6.52 | 60,506 | 0.54 | 4.61 | 0.72 | 4.43 | 32 | |||||||||||||||||||||||||||
| 15.76 | 5.95 | 337 | 1.04 | 4.11 | 1.22 | 3.93 | 32 | |||||||||||||||||||||||||||
| 15.41 | 5.10 | 160,856 | 0.95 | 4.17 | 1.13 | 3.99 | 54 | |||||||||||||||||||||||||||
| 15.41 | 4.32 | 15,143 | 1.70 | 3.44 | 1.88 | 3.26 | 54 | |||||||||||||||||||||||||||
| 15.41 | 4.25 | 4,615 | 1.70 | 3.45 | 1.88 | 3.27 | 54 | |||||||||||||||||||||||||||
| 15.40 | 5.45 | 57,696 | 0.55 | 4.58 | 0.73 | 4.40 | 54 | |||||||||||||||||||||||||||
| 15.49 | 4.97 | 283 | 1.05 | 4.11 | 1.23 | 3.93 | 54 | |||||||||||||||||||||||||||
| 15.29 | 4.30 | 119,161 | 0.94 | 4.27 | (d) | 1.11 | 4.10 | (d) | 39 | |||||||||||||||||||||||||
| 15.29 | 3.52 | 16,903 | 1.69 | 3.53 | (d) | 1.86 | 3.36 | (d) | 39 | |||||||||||||||||||||||||
| 15.30 | 3.52 | 6,155 | 1.69 | 3.54 | (d) | 1.86 | 3.37 | (d) | 39 | |||||||||||||||||||||||||
| 15.29 | 4.71 | 76,733 | 0.54 | 4.69 | (d) | 0.71 | 4.52 | (d) | 39 | |||||||||||||||||||||||||
| 15.37 | 4.24 | 270 | 1.04 | 4.21 | (d) | 1.21 | 4.04 | (d) | 39 | |||||||||||||||||||||||||
| 15.32 | 10.48 | 80,735 | 0.94 | 4.47 | 1.18 | 4.23 | 22 | |||||||||||||||||||||||||||
| 15.32 | 9.57 | 11,902 | 1.69 | 3.72 | 1.93 | 3.48 | 22 | |||||||||||||||||||||||||||
| 15.33 | 9.64 | 5,300 | 1.69 | 3.72 | 1.93 | 3.48 | 22 | |||||||||||||||||||||||||||
| 15.32 | 10.91 | 100,970 | 0.54 | 4.86 | 0.78 | 4.62 | 22 | |||||||||||||||||||||||||||
| 15.39 | 10.48 | 67 | 1.04 | 4.30 | 1.28 | 4.06 | 22 | |||||||||||||||||||||||||||
| 14.48 | 7.87 | 67,315 | 0.94 | 4.74 | 1.28 | 4.40 | 67 | |||||||||||||||||||||||||||
| 14.49 | 7.07 | 8,776 | 1.69 | 3.99 | 2.03 | 3.65 | 67 | |||||||||||||||||||||||||||
| 14.50 | 7.07 | 3,292 | 1.69 | 3.99 | 2.03 | 3.65 | 67 | |||||||||||||||||||||||||||
| 14.48 | 8.30 | 56,376 | 0.54 | 5.10 | 0.88 | 4.76 | 67 | |||||||||||||||||||||||||||
| 14.53 | 7.98 | 1 | 1.04 | 4.82 | 1.38 | 4.48 | 67 | |||||||||||||||||||||||||||
| Income (loss) from | Distributions | |||||||||||||||||||||||||||||||
| investment operations | to shareholders | |||||||||||||||||||||||||||||||
| Net asset | ||||||||||||||||||||||||||||||||
| value, | Net | Net realized | Total from | From net | From net | |||||||||||||||||||||||||||
| beginning | investment | and unrealized | investment | investment | realized | Total | ||||||||||||||||||||||||||
| Year - Share Class | of period | income(c) | gain (loss) | operations | income | gains | distributions | |||||||||||||||||||||||||
| FOR THE SIX MONTHS ENDED APRIL 30, (Unaudited) | ||||||||||||||||||||||||||||||||
| 2005 - A | $ | 10.90 | $ | 0.27 | $ | 0.25 | $ | 0.52 | $ | (0.28 | ) | $ | — | $ | (0.28 | ) | ||||||||||||||||
| 2005 - B | 10.90 | 0.23 | 0.25 | 0.48 | (0.24 | ) | — | (0.24 | ) | |||||||||||||||||||||||
| 2005 - C | 10.90 | 0.23 | 0.25 | 0.48 | (0.24 | ) | — | (0.24 | ) | |||||||||||||||||||||||
| 2005 - Institutional | 10.91 | 0.29 | 0.24 | 0.53 | (0.30 | ) | — | (0.30 | ) | |||||||||||||||||||||||
| FOR THE YEARS ENDED OCTOBER 31, | ||||||||||||||||||||||||||||||||
| 2004 - A | 10.66 | 0.54 | 0.23 | 0.77 | (0.53 | ) | — | (0.53 | ) | |||||||||||||||||||||||
| 2004 - B | 10.66 | 0.46 | 0.23 | 0.69 | (0.45 | ) | — | (0.45 | ) | |||||||||||||||||||||||
| 2004 - C | 10.66 | 0.46 | 0.23 | 0.69 | (0.45 | ) | — | (0.45 | ) | |||||||||||||||||||||||
| 2004 - Institutional | 10.66 | 0.59 | 0.23 | 0.82 | (0.57 | ) | — | (0.57 | ) | |||||||||||||||||||||||
| 2003 - A | 10.34 | 0.54 | 0.33 | 0.87 | (0.55 | ) | — | (0.55 | ) | |||||||||||||||||||||||
| 2003 - B | 10.34 | 0.47 | 0.32 | 0.79 | (0.47 | ) | — | (0.47 | ) | |||||||||||||||||||||||
| 2003 - C | 10.34 | 0.47 | 0.32 | 0.79 | (0.47 | ) | — | (0.47 | ) | |||||||||||||||||||||||
| 2003 - Institutional | 10.34 | 0.59 | 0.32 | 0.91 | (0.59 | ) | — | (0.59 | ) | |||||||||||||||||||||||
| 2002 - A | 10.57 | 0.57 | (d) | (0.19 | )(d) | 0.38 | (0.58 | ) | (0.03 | ) | (0.61 | ) | ||||||||||||||||||||
| 2002 - B | 10.57 | 0.49 | (d) | (0.19 | )(d) | 0.30 | (0.50 | ) | (0.03 | ) | (0.53 | ) | ||||||||||||||||||||
| 2002 - C | 10.57 | 0.49 | (d) | (0.19 | )(d) | 0.30 | (0.50 | ) | (0.03 | ) | (0.53 | ) | ||||||||||||||||||||
| 2002 - Institutional | 10.57 | 0.61 | (d) | (0.19 | )(d) | 0.42 | (0.62 | ) | (0.03 | ) | (0.65 | ) | ||||||||||||||||||||
| 2001 - A | 10.18 | 0.59 | 0.41 | 1.00 | (0.61 | ) | — | (0.61 | ) | |||||||||||||||||||||||
| 2001 - B | 10.18 | 0.51 | 0.41 | 0.92 | (0.53 | ) | — | (0.53 | ) | |||||||||||||||||||||||
| 2001 - C | 10.18 | 0.52 | 0.40 | 0.92 | (0.53 | ) | — | (0.53 | ) | |||||||||||||||||||||||
| 2001 - Institutional | 10.18 | 0.64 | 0.40 | 1.04 | (0.65 | ) | — | (0.65 | ) | |||||||||||||||||||||||
| FOR THE PERIOD ENDED OCTOBER 31, | ||||||||||||||||||||||||||||||||
| 2000 - A (commenced April 3, 2000) | 10.00 | 0.33 | 0.17 | 0.50 | (0.32 | ) | — | (0.32 | ) | |||||||||||||||||||||||
| 2000 - B (commenced April 3, 2000) | 10.00 | 0.29 | 0.17 | 0.46 | (0.28 | ) | — | (0.28 | ) | |||||||||||||||||||||||
| 2000 - C (commenced April 3, 2000) | 10.00 | 0.29 | 0.17 | 0.46 | (0.28 | ) | — | (0.28 | ) | |||||||||||||||||||||||
| 2000 - Institutional (commenced April 3, 2000) | 10.00 | 0.36 | 0.16 | 0.52 | (0.34 | ) | — | (0.34 | ) | |||||||||||||||||||||||
| (a) | Assumes investment at the net asset value at the beginning of the period, reinvestment of all dividends and distributions, a complete redemption of the investment at the net asset value at the end of the period and no sales or redemption charges. Total return would be reduced if a sales or redemption charge were taken into account. Total returns for periods less than one full year are not annualized. Returns do not reflect the deduction of taxes that a shareholder would pay on capital gains and other taxable distributions or the redemption of Fund shares. |
| (b) | Annualized. |
| (c) | Calculated based on the average shares outstanding methodology. |
| (d) | As required, effective November 1, 2001, the Fund has adopted the provisions of the AICPA Audit and Accounting Guide for Investment Companies and began amortizing all premiums and discounts on debt securities. The effect of this change for the year ended October 31, 2002 was an impact of less than $0.01 per share to net investment income and net realized and unrealized gains and losses, and a decrease to the ratio of net investment income to average net assets with and without expense reductions by 0.04%. Per share amounts, ratios and supplemental data for periods prior to November 1, 2001 have not been restated to reflect this change in presentation. |
70
| Ratios assuming no | ||||||||||||||||||||||||||||||||||
| expense reductions | ||||||||||||||||||||||||||||||||||
| Ratio of | Ratio of | Ratio of | ||||||||||||||||||||||||||||||||
| Net assets | Ratio of | net investment | total | net investment | ||||||||||||||||||||||||||||||
| Net asset | at end of | net expenses | income | expenses | income | Portfolio | ||||||||||||||||||||||||||||
| value, end | Total | period | to average | to average | to average | to average | turnover | |||||||||||||||||||||||||||
| of period | return(a) | (in 000s) | net assets | net assets | net assets | net assets | rate | |||||||||||||||||||||||||||
| $ | 11.14 | 4.81 | % | $ | 1,853,427 | 0.99 | %(b) | 4.93 | %(b) | 1.01 | %(b) | 4.91 | %(b) | 13 | % | |||||||||||||||||||
| 11.14 | 4.42 | 49,006 | 1.74 | (b) | 4.20 | (b) | 1.76 | (b) | 4.18 | (b) | 13 | |||||||||||||||||||||||
| 11.14 | 4.42 | 72,260 | 1.74 | (b) | 4.18 | (b) | 1.76 | (b) | 4.16 | (b) | 13 | |||||||||||||||||||||||
| 11.14 | 4.92 | 2,106,342 | 0.59 | (b) | 5.33 | (b) | 0.61 | (b) | 5.31 | (b) | 13 | |||||||||||||||||||||||
| 10.90 | 7.40 | 1,513,843 | 0.99 | 5.03 | 1.01 | 5.01 | 41 | |||||||||||||||||||||||||||
| 10.90 | 6.60 | 48,286 | 1.74 | 4.29 | 1.76 | 4.27 | 41 | |||||||||||||||||||||||||||
| 10.90 | 6.60 | 61,299 | 1.74 | 4.28 | 1.76 | 4.26 | 41 | |||||||||||||||||||||||||||
| 10.91 | 7.93 | 1,505,390 | 0.59 | 5.44 | 0.61 | 5.42 | 41 | |||||||||||||||||||||||||||
| 10.66 | 8.59 | 895,711 | 1.00 | 5.21 | 1.03 | 5.18 | 54 | |||||||||||||||||||||||||||
| 10.66 | 7.78 | 45,620 | 1.75 | 4.50 | 1.78 | 4.47 | 54 | |||||||||||||||||||||||||||
| 10.66 | 7.78 | 40,624 | 1.75 | 4.48 | 1.78 | 4.45 | 54 | |||||||||||||||||||||||||||
| 10.66 | 9.02 | 934,382 | 0.60 | 5.64 | 0.63 | 5.61 | 54 | |||||||||||||||||||||||||||
| 10.34 | 3.66 | 585,882 | 0.99 | 5.41 | (d) | 1.04 | 5.36 | (d) | 52 | |||||||||||||||||||||||||
| 10.34 | 2.88 | 40,428 | 1.74 | 4.70 | (d) | 1.79 | 4.65 | (d) | 52 | |||||||||||||||||||||||||
| 10.34 | 2.88 | 30,696 | 1.74 | 4.68 | (d) | 1.79 | 4.63 | (d) | 52 | |||||||||||||||||||||||||
| 10.34 | 4.07 | 470,905 | 0.59 | 5.84 | (d) | 0.64 | 5.79 | (d) | 52 | |||||||||||||||||||||||||
| 10.57 | 10.05 | 303,622 | 0.99 | 5.68 | 1.08 | 5.59 | 61 | |||||||||||||||||||||||||||
| 10.57 | 9.23 | 32,403 | 1.74 | 4.91 | 1.83 | 4.82 | 61 | |||||||||||||||||||||||||||
| 10.57 | 9.23 | 20,359 | 1.74 | 4.94 | 1.83 | 4.85 | 61 | |||||||||||||||||||||||||||
| 10.57 | 10.48 | 277,301 | 0.59 | 6.09 | 0.68 | 6.00 | 61 | |||||||||||||||||||||||||||
| 10.18 | 5.06 | 121,702 | 0.99 | (b) | 5.71 | (b) | 1.27 | (b) | 5.43 | (b) | 52 | |||||||||||||||||||||||
| 10.18 | 4.60 | 10,039 | 1.74 | (b) | 4.99 | (b) | 2.02 | (b) | 4.71 | (b) | 52 | |||||||||||||||||||||||
| 10.18 | 4.60 | 10,213 | 1.74 | (b) | 4.95 | (b) | 2.02 | (b) | 4.67 | (b) | 52 | |||||||||||||||||||||||
| 10.18 | 5.30 | 128,997 | 0.59 | (b) | 6.14 | (b) | 0.87 | (b) | 5.86 | (b) | 52 | |||||||||||||||||||||||
Fund Expenses (Unaudited) — Six Month Period Ended April 30, 2005
As a shareholder of Class A, Class B, Class C, Institutional or Service Shares of the Funds you incur two types of costs: (1) transaction costs, including sales charges (loads) on purchase payments (with respect to Class A Shares), or contingent deferred sales charges (loads) on redemptions (with respect to Class B and Class C Shares), and redemption fees (with respect to Municipal Income Fund only); and (2) ongoing costs, including management fees; distribution and service (12b-1) fees (with respect to Class A, Class B and Class C Shares); and other Fund expenses. This Example is intended to help you understand your ongoing costs (in dollars) of investing in Class A, Class B, Class C, Institutional and Service Shares of the Funds and to compare these costs with the ongoing costs of investing in other mutual funds.
The Example is based on an investment of $1,000 invested at the beginning of the period and held for the entire period from November 1, 2004 through April 30, 2005.
Actual Expenses — The first line under each share class in the table below provides information about actual account values and actual expenses. You may use the information in this line, together with the amount you invested, to estimate the expenses that you paid over the period. Simply divide your account value by $1,000 (for example, an $8,600 account value divided by $1,000=8.6), then multiply the result by the number in the first line under the heading entitled “Expenses Paid” to estimate the expenses you paid on your account during this period.
Hypothetical Example for Comparison Purposes — The second line under each share class in the table below provides information about hypothetical account values and hypothetical expenses based on the Funds’ actual expense ratio and an assumed rate of return of 5% per year before expenses, which is not the Funds’ actual return. The hypothetical account values and expenses may not be used to estimate the actual ending account balance or expenses you paid for the period. You may use this information to compare the ongoing costs of investing in the Funds and other funds. To do so, compare this 5% hypothetical example with the 5% hypothetical examples that appear in the shareholder reports of the other funds.
Please note that the expenses shown in the table are meant to highlight your ongoing costs only and do not reflect any transactional costs, such as sales charges (loads), redemption fees, or exchange fees. Therefore, the second line of the table is useful in comparing ongoing costs only, and will not help you determine the relative total costs of owning different funds. In addition, if these transactional costs were included, your costs would have been higher.
| Short Duration Tax-Free Fund | Municipal Income Fund | |||||||||||||||||||||||
| Expenses | Expenses | |||||||||||||||||||||||
| Beginning | Ending | Paid for the | Beginning | Ending | Paid for the | |||||||||||||||||||
| Account Value | Account Value | 6 months ended | Account Value | Account Value | 6 months ended | |||||||||||||||||||
| Share Class | 11/1/04 | 4/30/05 | 4/30/05* | 11/1/04 | 4/30/05 | 4/30/05* | ||||||||||||||||||
Class A | ||||||||||||||||||||||||
| Actual | $ | 1,000 | $ | 999.70 | $ | 3.93 | $ | 1,000 | $ | 1,025.70 | $ | 4.73 | ||||||||||||
| Hypothetical 5% return | 1,000 | 1,020.87 | + | 3.97 | 1,000 | 1,020.12 | + | 4.72 | ||||||||||||||||
Class B | ||||||||||||||||||||||||
| Actual | 1,000 | 996.70 | 6.90 | 1,000 | 1,021.90 | 8.48 | ||||||||||||||||||
| Hypothetical 5% return | 1,000 | 1,017.89 | + | 6.97 | 1,000 | 1,016.41 | + | 8.46 | ||||||||||||||||
Class C | ||||||||||||||||||||||||
| Actual | 1,000 | 996.00 | 7.64 | 1,000 | 1,021.90 | 8.48 | ||||||||||||||||||
| Hypothetical 5% return | 1,000 | 1,017.14 | + | 7.72 | 1,000 | 1,016.41 | + | 8.45 | ||||||||||||||||
Institutional | ||||||||||||||||||||||||
| Actual | 1,000 | 1,000.70 | 1.95 | 1,000 | 1,028.40 | 2.71 | ||||||||||||||||||
| Hypothetical 5% return | 1,000 | 1,022.85 | + | 1.97 | 1,000 | 1,022.13 | + | 2.70 | ||||||||||||||||
Service | ||||||||||||||||||||||||
| Actual | 1,000 | 999.20 | 4.39 | 1,000 | 1,025.70 | 5.23 | ||||||||||||||||||
| Hypothetical 5% return | 1,000 | 1,020.40 | + | 4.44 | 1,000 | 1,019.63 | + | 5.21 | ||||||||||||||||
[Additional columns below]
[Continued from above table, first column(s) repeated]
| High Yield Municipal Fund | ||||||||||||
| Expenses | ||||||||||||
| Beginning | Ending | Paid for the | ||||||||||
| Account Value | Account Value | 6 months ended | ||||||||||
| Share Class | 11/1/04 | 4/30/05 | 4/30/05* | |||||||||
Class A | ||||||||||||
| Actual | $ | 1,000 | $ | 1,048.10 | $ | 5.04 | ||||||
| Hypothetical 5% return | 1,000 | 1,019.87 | + | 4.97 | ||||||||
Class B | ||||||||||||
| Actual | 1,000 | 1,044.20 | 8.84 | |||||||||
| Hypothetical 5% return | 1,000 | 1,016.15 | + | 8.72 | ||||||||
Class C | ||||||||||||
| Actual | 1,000 | 1,044.20 | 8.83 | |||||||||
| Hypothetical 5% return | 1,000 | 1,016.15 | + | 8.71 | ||||||||
Institutional | ||||||||||||
| Actual | 1,000 | 1,049.20 | 3.01 | |||||||||
| Hypothetical 5% return | 1,000 | 1,021.85 | + | 2.97 | ||||||||
Service | ||||||||||||
| Actual | N/A | N/A | N/A | |||||||||
| Hypothetical 5% return | N/A | N/A | N/A | |||||||||
| * | Expenses for each share class are calculated using the fund’s expense ratio for each class, which represents the ongoing expenses as a percentage of net assets for the six months ended 4/30/05. Expenses are calculated by multiplying the expense ratio by the average account value for the period; then multiplying the result by the number of days in the most recent fiscal half year; and then dividing that result by the number of days in the fiscal year. The annualized expense ratios for the period were as follows: |
| Fund | Class A | Class B | Class C | Institutional | Service | |||||||||||||||
| Short Duration Tax-Free | 0.79 | % | 1.39 | % | 1.54 | % | 0.39 | % | 0.89 | % | ||||||||||
| Municipal Income | 0.94 | 1.69 | 1.69 | 0.54 | 1.04 | |||||||||||||||
| High Yield Municipal | 0.99 | 1.74 | 1.74 | 0.59 | N/A | |||||||||||||||
| + | Hypothetical expenses are based on each Fund’s actual annualized expense ratios and an assumed rate of return of 5% per year before expenses. |
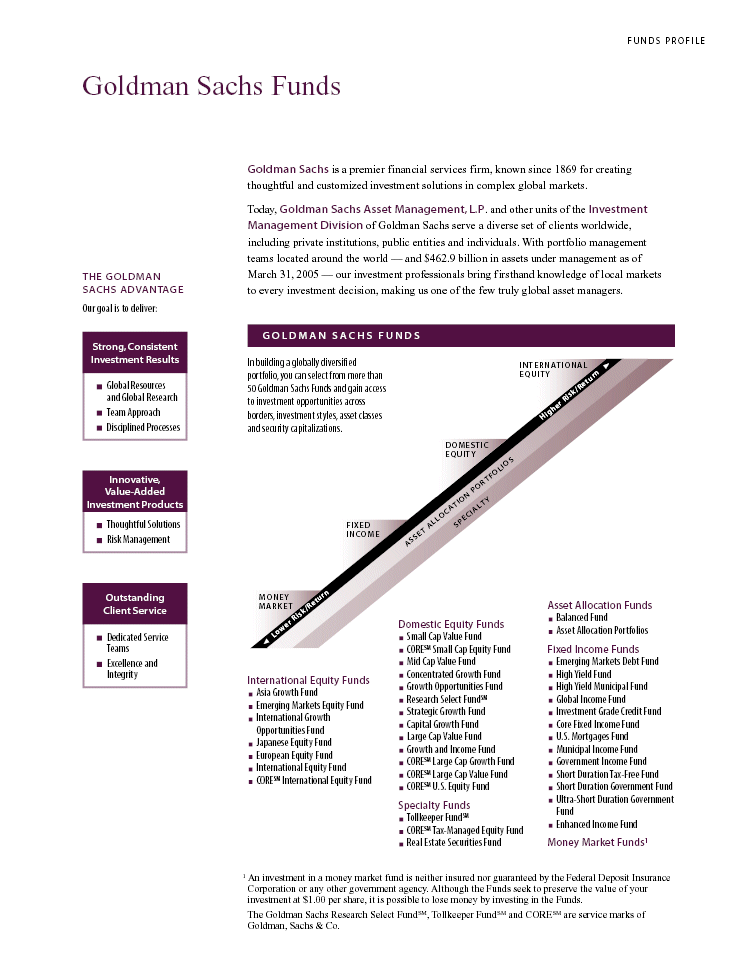
| F U N D S P R O F I L EGoldman Sachs FundsGoldman Sachs is a premier financial services firm, known since 1869 for creating thoughtful and customized investment solutions in complex global markets.Today, Goldman Sachs Asset Management, L.P. and other units of the Investment Management Division of Goldman Sachs serve a diverse set of clients worldwide, including private institutions, public entities and individuals. With portfolio management teams located around the world — and $462.9 billion in assets under management as of THEGOLDMANMarch 31, 2005 — our investment professionals bring firsthand knowledge of local markets SACHS ADVANTAGE to every investment decision, making us one of the few truly global asset managers. Our goal is to deliver:G O L D M A N S A C H S F U N D S Strong, Consistent Investment Results In building a globally diversified portfolio, you can select from more than Global Resources 50 Goldman Sachs Funds and gain access and GlobalResearch to investment opportunities across Team Approachborders, investment styles, asset classes Disciplined Processes and security capitalizations.Innovative, Value-Added Investment ProductsThoughtfulSolutions Risk ManagementOutstanding Asset Allocation FundsClient Service Balanced FundDomestic Equity FundsAsset Allocation Portfolios Dedicated Service Small Cap Value Fund Teams CORESM Small Cap Equity Fund Fixed Income Funds Excellence and Mid Cap Value FundEmerging Markets Debt Fund Integrity Concentrated Growth Fund High Yield FundInternational Equity FundsGrowth Opportunities FundHigh Yield Municipal Fund Asia Growth Fund Research Select FundSM Global Income Fund Emerging Markets Equity Fund Strategic Growth FundInvestment Grade Credit Fund International Growth Capital Growth FundCore Fixed Income Fund Opportunities Fund Large Cap Value Fund U.S. Mortgages Fund Japanese Equity Fund Growth and Income FundMunicipal Income Fund European Equity Fund CORESM Large Cap Growth FundGovernment Income Fund International Equity Fund CORESM Large Cap Value Fund Short Duration Tax-Free Fund CORESM International Equity Fund CORESM U.S. Equity Fund Short Duration Government Fund Ultra-Short Duration GovernmentSpecialty FundsFund Tollkeeper FundSMEnhanced Income Fund CORESM Tax-Managed Equity Fund Real Estate Securities Fund Money Market Funds11An investment in a money market fund is neither insured nor guaranteed by the Federal Deposit Insurance Corporation or any other government agency. Although the Funds seek to preserve the value of your investment at $1.00 per share, it is possible to lose money by investing in the Funds.The Goldman Sachs Research Select FundSM, Tollkeeper FundSM and CORESM are service marks of Goldman, Sachs & Co. |
| GOLDMAN SACHS ASSET MANAGEMENT, L.P. 32 OLD SLIP, 32ND FLOOR, NEW YORK, NEW YORK 10005TRUSTEESOFFICERSAshok N. Bakhru, Chairman Kaysie P. Uniacke, President John P. Coblentz, Jr.James A. Fitzpatrick, Vice President Patrick T. Harker James A. McNamara, Vice President Mary Patterson McPhersonJohn M. Perlowski, Treasurer Alan A. Shuch Howard B. Surloff, Secretary Wilma J. Smelcer Richard P. Strubel Kaysie P. UniackeGOLDMAN, SACHS & CO. GOLDMAN SACHS ASSET MANAGEMENT, L.P.Distributor and Transfer Agent Investment Adviser Visit our Web site at www.gs.com/funds to obtain the most recent month-end returns. The reports concerning the Funds included in this shareholder report may contain certain forward-looking statements about the factors that may affect the performance of the Funds in the future. These statements are based on Fund management’s predictions and expectations concerning certain future events and their expected impact on the Funds, such as performance of the economy as a whole and of specific industry sectors, changes in the levels of interest rates, the impact of developing world events, and other factors that may influence the future performance of the Funds. Management believes these forward-looking statements to be reasonable, although they are inherently uncertain and difficult to predict. Actual events may cause adjustments in portfolio management strategies from those currently expected to be employed.A description of the policies and procedures that the Funds use to determine how to vote proxies relating to portfolio securities and information regarding how a Fund voted proxies relating to portfolio securities during the most recent 12-month period ended June 30 is available (I) without charge, upon request by calling 1-800-526-7384 (for Retail Shareholders) or 1-800-621-2550 (for Institutional Shareholders); and (II) on the Securities and Exchange Commission Web site at http://www.sec.gov.The Funds file their complete schedule of portfolio holdings with the Securities and Exchange Commission (“SEC”) for the first and third quarters of each fiscal year on Form N-Q. Beginning the fiscal quarter ended January 31, 2005 and every first and third fiscal quarter thereafter, the Funds’ Form N-Q will become available on the SEC’s website at http://www.sec.gov within 60 days after the Funds’ first and third fiscal quarters. When available, the Funds’ Forms N-Q may be reviewed and copied at the SEC’s Public Reference Room in Washington, D.C. and information on the operation of the Public Reference Room may be obtained by calling 1-800-SEC-0330. When available, Form N-Q may be obtained upon request and without charge by calling 1-800-526-7384 (for Retail Shareholders) or 1-800-621-2550 (for Institutional Shareholders).The Funds may make substantial investments in derivative instruments, including options, financial futures, Eurodollar futures contracts, swaps, option on swaps, structured securities and other derivative investments. Derivative instruments may involve a high degree of financial risk. These risks include the risk that a small movement in the price of the underlying security or bechmark may result in a disproportionately large movement, unfavorable or favorable, in the price of the derivative instrument; risks of default by a counterparty, and the risks that transactions may not be liquid.Under normal conditions, the Goldman Sachs Short Duration Tax-Free Fund will invest at least 80% of its net assets in tax-exempt securities. Although it does not expect to do so, the Fund may invest up to 20% of its net assets in private activity bonds that may subject certain investors to the federal alternative minimum tax. Investment income may be subject to state income taxes.T he Goldman Sachs Municipal Income Fund may include securities whose income may be subject to the federal alternative minimum tax and state income taxes.Income from the Goldman Sachs High Yield Municipal Fund may be subject to state and local income taxes and the alternative minimum tax. Also, market discount over a de minimus threshold is subject to federal taxes. High yield, lower rated securities involve greater price volatility and present greater risks than higher rated fixed income securities. At times, the Fund may be unable to sell certain of its portfolio securities without a substantial drop in price, if at all.This material is not authorized for distribution to prospective investors unless preceded or accompanied by a current Prospectus. Please consider a Fund’s objectives, risks, and charges and expenses, and read the Prospectus carefully before investing. The Prospectus contains this and other information about the Funds.C1Copyright 2005 Goldman, Sachs & Co. All rights reserved. Date of first use: June 29, 2005 / 05-1041MFISAR / 19.2K/06-05 |
| ITEM 2. | CODE OF ETHICS. — Not applicable to the Semi-Annual Report for the period ended April 30, 2005 | ||
| ITEM 3. | AUDIT COMMITTEE FINANCIAL EXPERT. — Not applicable to the Semi-Annual Report for the period ended April 30, 2005 |
| ITEM 4. | PRINCIPAL ACCOUNTANT FEES AND SERVICES. — Not applicable to the Semi-Annual Report for the period ended April 30, 2005 |
| ITEM 5. | AUDIT COMMITTEE OF LISTED REGISTRANTS. | |
| Not applicable. |
| ITEM 6. | SCHEDULE OF INVESTMENTS. | |
| Schedule of Investments is included as part of the Report to Shareholders filed under Item 1. |
| ITEM 7. | DISCLOSURE OF PROXY VOTING POLICIES AND PROCEDURES FOR CLOSED-END MANAGEMENT INVESTMENT COMPANIES. | |
| Not applicable. |
| ITEM 8. | PORTFOLIO MANAGERS OF CLOSED END MANAGEMENT INVESTMENT COMPANIES. | |
| Not applicable. |
| ITEM 9. | PURCHASES OF EQUITY SECURITIES BY CLOSED-END MANAGEMENT INVESTMENT COMPANY AND AFFILIATED PURCHASERS. | |
| Not applicable. |
| ITEM 10. | SUBMISSION OF MATTERS TO A VOTE OF SECURITY HOLDERS. There have been no material changes to the procedures by which shareholders may recommend nominees to the registrant’s board of trustees. | |
| ITEM 11. | CONTROLS AND PROCEDURES. | |
| (a) | The registrant’s principal executive and principal financial officers or persons performing similar functions have concluded that the registrant’s disclosure controls and procedures (as defined in Rule 30a-3(c) under the Investment Company Act of 1940, as amended (the “1940 Act”)) are effective as of a date within 90 days of the filing of this report that includes the disclosure required by this paragraph, based on the evaluation of these controls and procedures required by Rule 30a-3(b) under the 1940 Act and 15d-15(b) under the Securities Exchange Act of 1934, as amended. | ||
| (b) | There were no changes in the registrant’s internal control over financial reporting (as defined in Rule 30a-3(d) under the 1940 Act) that occurred during the registrant’s second fiscal quarter of the period covered by this report that has materially affected, or is reasonably likely to materially affect the registrant’s internal control over financial reporting. | ||
| ITEM 12. | EXHIBITS. |
| (a)(1) | Goldman Sachs Trust’s Code of Ethics for Principal Executive and Senior Financial Officers is incorporated by reference to Exhibit 11(a)(1) of the registrant’s Form N-CSR filed on March 8, 2004 for its Real Estate Securities Fund (Accession Number 0000950123-04-0002984). | ||
| (a)(2) | Exhibit 99.CERT | Certifications pursuant to Section 302 of the Sarbanes-Oxley Act of 2002 filed herewith. | ||
| (b) | Exhibit 99.906CERT | Certifications pursuant to Section 906 of the Sarbanes-Oxley Act of 2002 filed herewith. |
SIGNATURES
| Pursuant to the requirements of the Securities Exchange Act of 1934 and the Investment Company Act of 1940, the registrant has duly caused this report to be signed on its behalf by the undersigned, thereunto duly authorized. |
| Goldman Sachs Trust | ||||||
| By: | /s/ Kaysie P. Uniacke | |||||
| Kaysie P. Uniacke | ||||||
| President/Principal Executive Officer | ||||||
| Goldman Sachs Trust | ||||||
| Date: | July 8, 2005 | |||||
| Pursuant to the requirements of the Securities Exchange Act of 1934 and the Investment Company Act of 1940, this report has been signed below by the following persons on behalf of the registrant and in the capacities and on the dates indicated. |
| By: | /s/ Kaysie P. Uniacke | |||||
| Kaysie P. Uniacke | ||||||
| President/Principal Executive Officer | ||||||
| Goldman Sachs Trust | ||||||
| Date: | July 8, 2005 | |||||
| By: | /s/ John M. Perlowski | |||||
| John M. Perlowski | ||||||
| Treasurer/Principal Financial Officer | ||||||
| Goldman Sachs Trust | ||||||
| Date: | July 8, 2005 |