UNITED STATES
SECURITIES AND EXCHANGE COMMISSION
Washington, D.C. 20549
FORM N-CSR
CERTIFIED SHAREHOLDER REPORT OF REGISTERED MANAGEMENT INVESTMENT
COMPANIES
Investment Company Act file number 811-5349
Goldman Sachs Trust
(Exact name of registrant as specified in charter)
71 South Wacker Drive, Suite 500, Chicago, Illinois 60606
(Address of principal executive offices) (Zip code)
| Peter V. Bonanno | Copies to: | |
| Goldman, Sachs & Co. | Jeffrey A. Dalke, Esq. | |
| One New York Plaza | Drinker Biddle & Reath LLP | |
| New York, New York 10004 | One Logan Square | |
| 18th and Cherry Streets | ||
| Philadelphia, PA 19103 | ||
| (Name and address of agents for service) | ||
Registrant’s telephone number, including area code: (312) 655-4400
Date of fiscal year end: August 31
Date of reporting period: February 28, 2006
| ITEM 1. | REPORTS TO STOCKHOLDERS. | |
| The Semi–Annual Report to Stockholders is filed herewith. |
| BALANCED FUND | Semiannual Report February 28, 2006 |
 | Long-term capital growth opportunities and current income through a carefully constructed mix of equity and fixed income securities. | ||
 | Asset Management |
Goldman Sachs Balanced Fund
| The Balanced Fund invests in equity investments considered to have capital appreciation and/or dividend-paying ability and invests in fixed income securities. The Fund’s equity investments will be subject to market risk so that the value of the securities in which it invests may go up or down in response to the prospects of individual companies, particular industry sectors and/or general economic conditions. Foreign securities may be more volatile than investments in U.S. securities and will be subject to fluctuation and sudden economic and political developments. Investments in fixed income securities are subject to the risks associated with debt securities including credit and interest rate risk. The Fund’s balanced objective seeks to reduce the volatility associated with investing in a single market. There is no guarantee however, that market cycles will move in opposition to one another or that a balanced investment program will successfully reduce volatility. |
NOT FDIC-INSURED | May Lose Value | No Bank Guarantee | ||
What Differentiates Goldman Sachs’
Balanced Fund Investment Process?
The Balanced Fund is a diversified investment portfolio that utilizes an asset allocation process of strategically selecting different asset classes — such as stocks and bonds. The Fund then adjusts its holdings over time. Goldman Sachs’ approach to asset allocation combines our global presence, extensive market knowledge and risk management expertise.
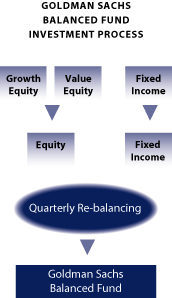 |  The Goldman Sachs Balanced Fund provides exposure to the wealth-building opportunities of stocks and the regular income potential of bonds.  When selecting stocks for the Fund’s equity portion, we employ two distinct, complementary strategies — value and growth. This approach provides diversified equity participation — and limits potential performance swings that can result from styles moving in and out of favor in different market environments. Diversification does not protect an investor from market risk and does not ensure a profit.  In equity investing, we take an intensive, hands-on approach to research, including meeting with company management to gain an in-depth understanding of a company’s long-term business objectives. We also meet with a company’s customers, competitors and suppliers so that we have insight into industry-wide trends. In fixed income investing, we believe that a total return investment philosophy provides the most complete picture of performance. We emphasize fundamental credit expertise. Our team scrutinizes factors that could impact a bond’s performance over time — similar to the evaluation of company stocks. Additionally, we identify, monitor and measure a fund’s risk profile.  The Fund’s portfolio comprises the ideas of four experienced Goldman Sachs investment teams: Goldman Sachs Value Team: A group of investment professionals with an average of 18 years of investment experience, focused on quality equity investments selling at compelling valuations. Goldman Sachs Growth Team: A group of investment professionals with nearly 270 years combined investment experience, focused on the long-term ownership of growing equity investments. Goldman Sachs Global Fixed Income Team: Broad, deep capabilities across global fixed income markets, with a total return investment philosophy. Quantitative Research Team: Actively manages the equity vs. fixed income allocation, reallocating on a quarterly basis to provide an additional level of active management. | |
Balanced Fund
Dear Shareholder,
This report provides an overview on the performance of the Goldman Sachs Balanced Fund during the six-month reporting period that ended February 28, 2006.
Performance Review
| For the six-month period that ended February 28, 2006, the Fund’s Class A, B, C, Institutional and Service Shares generated cumulative total returns, without sales charges, of 3.53%, 3.17%, 3.18%, 3.78% and 3.38%, respectively. These returns compare to the 5.93% and -0.11% cumulative total returns of the Fund’s benchmarks, the S&P 500 Index (with dividends reinvested) and the Lehman Brothers Aggregate Bond Index, respectively. | |
| The Fund generally allocates a portion of its assets in both equity and fixed income securities. As the benchmark returns indicate, the equity market, as measured by the S&P 500 Index, significantly outperformed the fixed income market, as measured by the Lehman Brothers Aggregate Bond Index, over the six-month reporting period. Therefore, the Fund’s allocation to fixed income securities caused it to lag the equity benchmark. Conversely, its allocation to equities helped it to outperform the fixed income benchmark. |
Asset Allocation
| n | Equities — As of February 28, 2006, the Fund was 56.3% invested in growth and value equities. As bottom-up stock pickers, both the Growth and Value equity teams focus on the real worth of the business and, to the extent that they find several businesses in related industries that have long-term appreciation potential, they may develop an overweight in a particular sector. With this in mind, at the end of the reporting period, the Fund’s largest sector weightings were in the Financial, Technology and Energy sectors. Conversely, the smallest sector weightings were in REITs, Basic Materials and Consumer Discretionary. |
| EQUITY SECTOR ALLOCATION AS OF 2/28/06 |
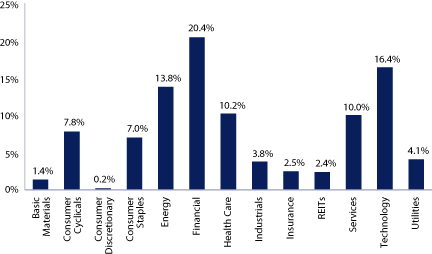
The percentage shown for each investment sector reflects the value of investments in that sector as a percentage of the Fund’s market value in equity securities.
| n | Fixed Income — As of February 28, 2006, the Fund was 43.7% invested in fixed income securities. Over the six-month reporting period, the fixed income portion of the portfolio held overweight exposures versus the Lehman Brothers Aggregate Bond Index to Treasuries and agencies, and underweights to the mortgage pass-throughs and investment grade corporates. In addition, the portfolio had an overall short duration bias. We based this portfolio positioning on an aggressive Federal Reserve Board (the “Fed”) that continued to raise rates, historically tight spreads, diminishing fundamentals, and unattractive valuations. Over the period, we searched for value in the lower quality investment grade corporate, high yield corporate and emerging market debt segments, as we believed these riskier segments offered more attractive risk-reward opportunities. |
| FIXED INCOME SECTOR ALLOCATION AS OF 2/28/06 |
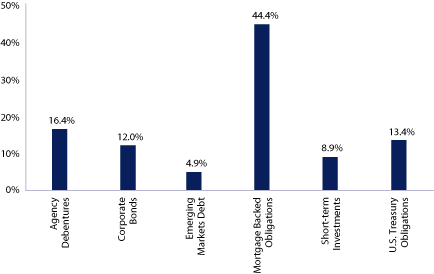
| The percentage shown for each investment sector reflects the value of investments in that sector as a percentage of the Fund’s market value in fixed income securities. Short-term investments include repurchase agreements. |
Portfolio Highlights
| In the equity portion of the portfolio, Fund holdings in Financials, Consumer Discretionary and Media enhanced results during the reporting period. In contrast, exposure to Energy, Consumer Cyclicals and Technology stocks detracted from results. | |
| Over the six-month period, there were a number of holdings that generated strong results for the Fund. |
| VALUE EQUITY |
| n | Burlington Resources, Inc. — While we are positive on the fundamentals for North American natural gas and supply/demand trends, Energy companies differ widely in their capital allocation disciplines and effectiveness in growing their reserves. We continue to favor Energy companies with strong, shareholder-oriented management teams, quality reserves, high returns on invested capital, and low cost structures. Burlington Resources has a management team that we believe is executing well, from both an operating and a financial standpoint. The stock rose sharply during the reporting period and enhanced results. |
| n | J.C. Penney Co., Inc. — In Consumer Cyclicals, J.C. Penney was a positive contributor to performance. We believe recent progress in the company’s turnaround, including share buybacks and improved operating results, lifted the stock to higher levels. While the turnaround has been impressive to date, we feel company management remains keenly focused on improving operating margins and store productivity. |
| n | KeyCorp — While we have been concerned about valuation trends among regional banks, we believe KeyCorp stands out among its peers. Due to its diversified business mix, which includes an asset management segment, the company’s earnings are less dependent on the mortgage market. Furthermore, KeyCorp’s dividend yield is quite high relative to its peer group and the company’s shares trade at an attractive valuation. |
| GROWTH EQUITY |
| n | Moody’s Corp. — Ratings agency Moody’s Corp. performed well during the period. Its business meets our investment criteria as it operates in an industry environment that can be characterized as quasi-monopolistic or a “partnership-monopoly.” This is because most issuers tend to have at least two ratings, from Moody’s and from Standard & Poor’s. As a result, the two firms rate approximately 90% of the debt issuance in the U.S. We believe Moody’s growth is supported by favorable secular trends such as the globalization of capitalism, deregulation and financial innovation. |
| n | First Data Corp. — First Data’s shares rose as the company announced that it would be spinning off its Western Union business. This is a strategic move that we believe will allow the company to shift its focus towards the credit and debit card- processing business, which has had lackluster performance. First Data’s stock hit a 52-week high on the heels of this announcement. We believe that the decision to spin off Western Union is a good opportunity for First Data to turn around its card and merchant divisions. |
| n | QUALCOMM, Inc. — Shares of QUALCOMM rose on the back of increased earnings. During the company’s fiscal first quarter, earnings were driven by strong sales of both low-cost cell phones in emerging markets, and high-end handsets in developed nations, both of which use the company’s CDMA (code division multiple access) technology. |
| FIXED INCOME |
| During the six-month reporting period, the yield curve flattened and inverted, with shorter-term interest rates moving higher than longer-term rates. In response to strengthening economic data and rising inflation concerns, the Fed raised the overnight lending rate in four consecutive 25 basis point moves over the reporting period, bringing the federal funds rate to 4.50%. To date, this marks fourteen consecutive 25 basis point rate hikes since June 2004, when the federal funds rate stood at 1.00%. While this has put upward pressure on short-term rates, longer-term rates have actually declined, due to strong pension-related and foreign central bank demand for long-maturity Treasuries. The Fed continues to suggest it will continue raising rates through 2006, although many in the market believe they will pause at 5.00%, due to the recent increase in global governmental interest rates (e.g., Japan, European Central Bank) and a slowing U.S. housing market. | |
| The primary contributors to the Fund’s fixed income performance over the period were security selection of emerging market debt, investment grade corporates, and high yield corporates. The Fund’s short duration and term structure strategies also enhanced returns, as rates sold off considerably over the short to intermediate regions of the curve during the reporting period. Conversely, an overall underweight to the mortgage sector detracted from returns, as mortgages outperformed the Lehman Brothers Aggregate Bond Index over the period. Finally, in addition to strong security selection of investment grade corporates, the Fund’s underweight to this sector contributed to returns, as corporates underperformed the Lehman Brothers Aggregate Bond Index over the period. | |
| We thank you for your investment and look forward to your continued confidence. | |
| Goldman Sachs Value Investment Team, Goldman Sachs Growth Equity Investment Team, Goldman Sachs Fixed Income Investment Team | |
| New York, March 17, 2006 |
Balanced Fund
| PERFORMANCE REVIEW |
| Fund Total Return | S&P 500 | Lehman Brothers | ||||||||||||
| September 1, 2005–February 28, 2006 | (based on NAV)1 | Index2 | Aggregate Bond Index2 | |||||||||||
| Class A | 3.53 | % | 5.93 | % | -0.11 | % | ||||||||
| Class B | 3.17 | 5.93 | -0.11 | |||||||||||
| Class C | 3.18 | 5.93 | -0.11 | |||||||||||
| Institutional | 3.78 | 5.93 | -0.11 | |||||||||||
| Service | 3.38 | 5.93 | -0.11 | |||||||||||
| 1 | The net asset value (NAV) represents the net assets of the class of the Fund (ex-dividend) divided by the total number of shares of the class outstanding. The Fund’s performance reflects the reinvestment of dividends and other distributions. The Fund’s performance does not reflect the deduction of any applicable sales charges. |
| 2 | The S&P 500 Index is the Standard & Poor’s 500 Composite Index of 500 stocks, an unmanaged index of common stock prices. The Lehman Brothers Aggregate Bond Index represents an unmanaged diversified portfolio of fixed income securities, including U.S. Treasuries, investment-grade corporate bonds, and mortgage-backed and asset-backed securities. The Index figures do not reflect any deduction for fees, expenses or taxes. It is not possible to invest directly in an unmanaged index. |
| STANDARDIZED TOTAL RETURNS3 |
| For the period ended 12/31/05 | One Year | Five Years | Ten Years | Since Inception | Inception Date | |||||||||||||||
| Class A | -2.66 | % | 1.56 | % | 5.48 | % | 7.11 | % | 10/12/94 | |||||||||||
| Class B | -2.79 | 1.54 | n/a | 5.13 | 5/1/96 | |||||||||||||||
| Class C | 1.27 | 1.94 | n/a | 2.47 | 8/15/97 | |||||||||||||||
| Institutional | 4.44 | 3.32 | n/a | 3.76 | 8/15/97 | |||||||||||||||
| Service | 2.67 | 2.61 | 5.95 | 4 | 7.53 | 4 | 10/12/94 | |||||||||||||
| 3 | The Standardized Total Returns are average annual total returns as of the most recent calendar quarter-end. They assume reinvestment of all distributions at NAV. These returns reflect a maximum initial sales charge of 5.5% for Class A Shares, the assumed contingent deferred sales charge for Class B Shares (5% maximum declining to 0% after six years) and the assumed contingent deferred sales charge for Class C Shares (1% if redeemed within 12 months of purchase). Because Institutional and Service Shares do not involve a sales charge, such a charge is not applied to their Standardized Total Returns. |
| 4 | Performance data for Service Shares prior to 8/15/97 (commencement of operations) is that of the Class A Shares (excluding the impact of front-end sales charges applicable to Class A Shares since Service Shares are not subject to any sales charges). Performance of Class A Shares of the Balanced Fund reflects the expenses applicable to the Fund’s Class A Shares. The fees applicable to Service Shares are different from those applicable to Class A Shares which impact performance ratings and rankings for a class of shares. |
| The returns represent past performance. Past performance does not guarantee future results. The Fund’s investment return and principal value will fluctuate so that an investor’s shares, when redeemed, may be worth more or less than their original cost. Current performance may be lower or higher than the performance quoted above. Please visit our Web site at: www.gs.com/funds to obtain the most recent month-end returns. Performance reflects expense limitations in effect. In their absence, performance would be reduced. Returns do not reflect the deduction of taxes that a shareholder would pay on Fund distributions or the redemption of Fund shares. |
| TOP 10 EQUITY HOLDINGS AS OF 2/28/065 |
| Holding | % of Net Assets | Line of Business | ||||||
| Microsoft Corp. | 1.7 | % | Computer Software | |||||
| J.P. Morgan Chase & Co. | 1.5 | Banks | ||||||
| Bank of America Corp. | 1.4 | Banks | ||||||
| Freddie Mac | 1.2 | Financials | ||||||
| Exxon Mobil Corp. | 1.2 | Oil & Gas | ||||||
| First Data Corp. | 1.2 | Computer Services | ||||||
| Cisco Systems, Inc. | 1.1 | Networking/Telecommunication Equipment | ||||||
| Pfizer, Inc. | 1.1 | Drugs & Medicine | ||||||
| United Technologies Corp. | 1.0 | Aerospace & Defense | ||||||
| ConocoPhillips | 0.9 | Energy Resources | ||||||
| 5 | The top 10 equity holdings may not be representative of the Fund’s future investments. |
Statement of Investments
| Shares | Description | Value | ||||||||
Common Stocks – 55.8% | ||||||||||
| Aerospace & Defense – 1.4% | ||||||||||
| 7,265 | General Dynamics Corp. | $ | 895,557 | |||||||
| 37,083 | United Technologies Corp. | 2,169,355 | ||||||||
| 3,064,912 | ||||||||||
| Audio & Visual Equipment – 0.1% | ||||||||||
| 2,710 | Harman International Industries, Inc. | 299,049 | ||||||||
| Banks – 4.3% | ||||||||||
| 65,631 | Bank of America Corp. | 3,009,181 | ||||||||
| 38,347 | Citigroup, Inc. | 1,778,151 | ||||||||
| 82,350 | J.P. Morgan Chase & Co. | 3,387,879 | ||||||||
| 18,700 | Wells Fargo & Co. | 1,200,540 | ||||||||
| 9,375,751 | ||||||||||
| Beverages – 1.4% | ||||||||||
| 11,210 | Fortune Brands, Inc. | 869,336 | ||||||||
| 26,710 | PepsiCo, Inc. | 1,578,828 | ||||||||
| 13,600 | The Coca-Cola Co. | 570,792 | ||||||||
| 3,018,956 | ||||||||||
| Biotechnology – 0.9% | ||||||||||
| 22,970 | Amgen, Inc.* | 1,734,005 | ||||||||
| 8,680 | MedImmune, Inc.* | 316,733 | ||||||||
| 2,050,738 | ||||||||||
| Broadcasting & Cable/Satellite TV – 0.6% | ||||||||||
| 21,940 | Univision Communications, Inc.* | 733,893 | ||||||||
| 22,970 | XM Satellite Radio Holdings, Inc.* | 507,407 | ||||||||
| 1,241,300 | ||||||||||
| Chemical – 0.3% | ||||||||||
| 14,513 | Rohm & Haas Co. | 722,022 | ||||||||
| Commercial Services – 1.5% | ||||||||||
| 10,990 | ARAMARK Corp. Class B | 312,775 | ||||||||
| 6,890 | Iron Mountain, Inc.* | 301,093 | ||||||||
| 13,110 | Moody’s Corp. | 878,370 | ||||||||
| 35,540 | The McGraw-Hill Companies, Inc. | 1,886,819 | ||||||||
| 3,379,057 | ||||||||||
| Computer Hardware – 0.6% | ||||||||||
| 18,950 | Dell, Inc.* | 549,550 | ||||||||
| 53,340 | EMC Corp.* | 747,827 | ||||||||
| 1,297,377 | ||||||||||
| Computer Services – 1.2% | ||||||||||
| 56,618 | First Data Corp. | 2,555,170 | ||||||||
| Computer Software – 3.0% | ||||||||||
| 46,028 | Activision, Inc.* | 575,350 | ||||||||
| 21,830 | Electronic Arts, Inc.* | 1,134,505 | ||||||||
| 2,092 | International Business Machines Corp. | 167,862 | ||||||||
| 141,566 | Microsoft Corp. | 3,808,125 | ||||||||
| 63,480 | Oracle Corp.* | 788,422 | ||||||||
| 6,474,264 | ||||||||||
| Diversified Energy – 0.5% | ||||||||||
| 52,900 | The Williams Companies, Inc. | 1,141,053 | ||||||||
| Drugs & Medicine – 2.2% | ||||||||||
| 20,926 | Abbott Laboratories | 924,511 | ||||||||
| 8,700 | Eli Lilly & Co. | 483,894 | ||||||||
| 91,553 | Pfizer, Inc. | 2,397,773 | ||||||||
| 12,500 | Schering-Plough Corp. | 231,250 | ||||||||
| 16,930 | Wyeth | 843,114 | ||||||||
| 4,880,542 | ||||||||||
| Electrical Utilities – 2.3% | ||||||||||
| 1,945 | Dominion Resources, Inc. | 146,070 | ||||||||
| 2,700 | Edison International | 119,772 | ||||||||
| 27,428 | Entergy Corp. | 1,988,804 | ||||||||
| 21,548 | Exelon Corp. | 1,230,606 | ||||||||
| 7,930 | FirstEnergy Corp. | 405,065 | ||||||||
| 33,584 | PPL Corp. | 1,067,971 | ||||||||
| 4,958,288 | ||||||||||
| Energy – 1.0% | ||||||||||
| 16,440 | Energy Transfer Partners LP | 587,237 | ||||||||
| 37,715 | Enterprise Products Partners LP | 915,720 | ||||||||
| 18,977 | Magellan Midstream Partners LP | 597,586 | ||||||||
| 5,161 | Williams Partners LP | 170,829 | ||||||||
| 2,271,372 | ||||||||||
| Energy Resources – 2.0% | ||||||||||
| 11,028 | Burlington Resources, Inc. | 994,505 | ||||||||
| 11,034 | Chevron Corp. | 623,200 | ||||||||
| 32,641 | ConocoPhillips | 1,989,796 | ||||||||
| 9,500 | EOG Resources, Inc. | 640,300 | ||||||||
| 3,500 | Linn Energy LLC* | 72,695 | ||||||||
| 4,320,496 | ||||||||||
| Environmental & Other Services – 0.3% | ||||||||||
| 22,677 | Waste Management, Inc. | 754,237 | ||||||||
| Financials – 1.4% | ||||||||||
| 17,210 | Golden West Financial Corp. | 1,222,426 | ||||||||
| 11,200 | Merrill Lynch & Co., Inc. | 864,752 | ||||||||
| 61,800 | The Charles Schwab Corp. | 1,001,778 | ||||||||
| 3,088,956 | ||||||||||
| Food & Beverage – 0.5% | ||||||||||
| 16,554 | Kraft Foods, Inc. | 498,110 | ||||||||
| 9,349 | Unilever NV | 650,597 | ||||||||
| 1,148,707 | ||||||||||
8
| Shares | Description | Value | ||||||||
Common Stocks – (continued) | ||||||||||
| Foods – 0.5% | ||||||||||
| 5,160 | The Hershey Co. | $ | 263,934 | |||||||
| 13,210 | Wm. Wrigley Jr. Co. | 839,363 | ||||||||
| 1,103,297 | ||||||||||
| Gaming/Lodging – 1.3% | ||||||||||
| 17,250 | Carnival Corp. | 890,962 | ||||||||
| 36,840 | Cendant Corp. | 612,281 | ||||||||
| 11,280 | Harrah’s Entertainment, Inc. | 811,258 | ||||||||
| 8,940 | Marriott International, Inc. | 611,496 | ||||||||
| 2,925,997 | ||||||||||
| Home Products – 0.6% | ||||||||||
| 40,442 | Newell Rubbermaid, Inc. | 1,005,792 | ||||||||
| 4,544 | The Clorox Co. | 276,957 | ||||||||
| 1,282,749 | ||||||||||
| Household/Personal Care – 0.5% | ||||||||||
| 17,850 | The Procter & Gamble Co. | 1,069,750 | ||||||||
| Insurance – 0.2% | ||||||||||
| 10,443 | Willis Group Holdings Ltd. | 359,657 | ||||||||
| Internet & Online – 0.7% | ||||||||||
| 2,200 | Google, Inc.* | 797,764 | ||||||||
| 21,120 | Yahoo!, Inc.* | 677,107 | ||||||||
| 1,474,871 | ||||||||||
| Manufacturing – 0.3% | ||||||||||
| 9,020 | Rockwell Automation, Inc. | 614,893 | ||||||||
| Medical Products – 1.7% | ||||||||||
| 21,430 | Baxter International, Inc. | 811,126 | ||||||||
| 3,500 | C.R. Bard, Inc. | 229,215 | ||||||||
| 4,370 | Fisher Scientific International, Inc.* | 297,859 | ||||||||
| 20,360 | Medtronic, Inc. | 1,098,422 | ||||||||
| 17,910 | Stryker Corp. | 827,800 | ||||||||
| 7,610 | Zimmer Holdings, Inc.* | 526,460 | ||||||||
| 3,790,882 | ||||||||||
| Motor Vehicle – 0.3% | ||||||||||
| 10,253 | Autoliv, Inc. | 549,048 | ||||||||
| Movies & Entertainment – 1.5% | ||||||||||
| 38,838 | The Walt Disney Co. | 1,087,076 | ||||||||
| 88,436 | Time Warner, Inc. | 1,530,827 | ||||||||
| 14,796 | Viacom, Inc. Class B* | 591,248 | ||||||||
| 3,209,151 | ||||||||||
| Networking/Telecommunication Equipment – 1.1% | ||||||||||
| 119,280 | Cisco Systems, Inc.* | 2,414,227 | ||||||||
| Oil & Gas – 2.4% | ||||||||||
| 23,560 | Canadian Natural Resources Ltd. | 1,285,434 | ||||||||
| 43,168 | Exxon Mobil Corp. | 2,562,884 | ||||||||
| 20,070 | Suncor Energy, Inc. | 1,500,232 | ||||||||
| 5,348,550 | ||||||||||
| Oil Services – 0.2% | ||||||||||
| 10,927 | BJ Services Co. | 342,124 | ||||||||
| Oil Well Services & Equipment – 1.6% | ||||||||||
| 21,692 | Baker Hughes, Inc. | 1,474,405 | ||||||||
| 16,890 | Schlumberger Ltd. | 1,942,350 | ||||||||
| 3,416,755 | ||||||||||
| Paper & Packaging – 0.5% | ||||||||||
| 42,844 | Packaging Corp. of America | 977,272 | ||||||||
| Parts & Equipment – 0.2% | ||||||||||
| 12,298 | American Standard Companies, Inc. | 486,755 | ||||||||
| Pharmaceuticals – 0.1% | ||||||||||
| 5,050 | Omnicare, Inc. | 307,293 | ||||||||
| Pharmacy Benefit Manager – 0.6% | ||||||||||
| 16,050 | Caremark Rx, Inc.* | 798,488 | ||||||||
| 10,360 | Medco Health Solutions, Inc.* | 577,259 | ||||||||
| 1,375,747 | ||||||||||
| Producer Goods – 0.2% | ||||||||||
| 6,300 | W.W. Grainger, Inc. | 466,452 | ||||||||
| Property Insurance – 1.3% | ||||||||||
| 9,400 | American International Group, Inc. | 623,784 | ||||||||
| 12,484 | PartnerRe Ltd. | 756,655 | ||||||||
| 13,670 | The Allstate Corp. | 748,843 | ||||||||
| 9,289 | XL Capital Ltd. | 627,472 | ||||||||
| 2,756,754 | ||||||||||
| Publishing – 0.4% | ||||||||||
| 15,340 | Lamar Advertising Co.* | 782,647 | ||||||||
| Regional Banks – 0.6% | ||||||||||
| 29,689 | KeyCorp | 1,106,509 | ||||||||
| 1,900 | M&T Bank Corp. | 213,560 | ||||||||
| 1,320,069 | ||||||||||
| REITs – 1.3% | ||||||||||
| 14,165 | Apartment Investment & Management Co. | 627,651 | ||||||||
| 13,130 | Developers Diversified Realty Corp. | 658,995 | ||||||||
| 28,095 | iStar Financial, Inc. | 1,070,419 | ||||||||
| 14,613 | Plum Creek Timber Co., Inc. | 542,873 | ||||||||
| 2,899,938 | ||||||||||
| Retail Apparel – 0.8% | ||||||||||
| 31,162 | J. C. Penney Co., Inc. | 1,827,340 | ||||||||
| Retailing – 1.8% | ||||||||||
| 21,470 | Lowe’s Companies, Inc. | 1,463,825 | ||||||||
| 18,370 | PETCO Animal Supplies, Inc.* | 357,480 | ||||||||
| 19,040 | Target Corp. | 1,035,776 | ||||||||
9
Statement of Investments (continued)
| Shares | Description | Value | ||||||||
Common Stocks – (continued) | ||||||||||
| Retailing – (continued) | ||||||||||
| 23,540 | Wal-Mart Stores, Inc. | $ | 1,067,774 | |||||||
| 3,924,855 | ||||||||||
| Semiconductors – 1.5% | ||||||||||
| 17,690 | Intel Corp. | 364,414 | ||||||||
| 33,400 | Linear Technology Corp. | 1,231,124 | ||||||||
| 37,430 | QUALCOMM, Inc. | 1,767,070 | ||||||||
| 3,362,608 | ||||||||||
| Specialty Financials – 4.8% | ||||||||||
| 15,342 | AllianceBernstein Holding LP | 986,030 | ||||||||
| 17,910 | American Capital Strategies Ltd. | 639,387 | ||||||||
| 11,380 | American Express Co. | 613,154 | ||||||||
| 16,778 | Countrywide Financial Corp. | 578,505 | ||||||||
| 11,820 | Fannie Mae | 646,318 | ||||||||
| 39,850 | Freddie Mac | 2,685,492 | ||||||||
| 9,100 | Lehman Brothers Holdings, Inc. | 1,328,145 | ||||||||
| 18,608 | Morgan Stanley | 1,110,153 | ||||||||
| 46,005 | Washington Mutual, Inc. | 1,964,414 | ||||||||
| 10,551,598 | ||||||||||
| Technology Services – 0.2% | ||||||||||
| 5,920 | Cognizant Technology Solutions Corp.* | 341,051 | ||||||||
| Telecommunications – 0.9% | ||||||||||
| 37,490 | American Tower Corp.* | 1,193,307 | ||||||||
| 18,120 | Crown Castle International Corp.* | 568,062 | ||||||||
| 9,820 | NeuStar, Inc.* | 282,816 | ||||||||
| 2,044,185 | ||||||||||
| Telephone – 0.6% | ||||||||||
| 37,918 | Verizon Communications, Inc. | 1,277,837 | ||||||||
| Tobacco – 0.4% | ||||||||||
| 12,345 | Altria Group, Inc. | 887,606 | ||||||||
| Transports – 0.2% | ||||||||||
| 4,355 | United Parcel Service, Inc. Class B | 325,362 | ||||||||
| Trust/Processors – 0.3% | ||||||||||
| 17,327 | Bank of New York Co., Inc. | 593,276 | ||||||||
| Wireless – 0.7% | ||||||||||
| 58,080 | AT&T, Inc. | 1,602,427 | ||||||||
| TOTAL COMMON STOCKS | ||||||||||
| (Cost $97,222,049) | $ | 122,055,270 | ||||||||
| Principal | Interest | Maturity | ||||||||||||||
| Amount• | Rate | Date | Value | |||||||||||||
Corporate Bonds – 5.2% | ||||||||||||||||
| Aerospace/Defense – 0.1% | ||||||||||||||||
| Alliant Techsystems, Inc. | ||||||||||||||||
| $ | 125,000 | 8.50 | % | 05/15/2011 | $ | 130,625 | ||||||||||
| Bombardier Capital, Inc.(a) | ||||||||||||||||
| 75,000 | 6.13 | 06/29/2006 | 75,000 | |||||||||||||
| Bombardier, Inc.(a) | ||||||||||||||||
| 50,000 | 6.30 | 05/01/2014 | 45,125 | |||||||||||||
| 250,750 | ||||||||||||||||
| Automotive – 0.4% | ||||||||||||||||
| DaimlerChrysler NA Holding Corp.(b) | ||||||||||||||||
| 450,000 | 4.96 | 09/10/2007 | 451,344 | |||||||||||||
| Dana Corp. | ||||||||||||||||
| 50,000 | 5.85 | 01/15/2015 | 30,625 | |||||||||||||
| Ford Motor Credit Co. | ||||||||||||||||
| 175,000 | 6.63 | 06/16/2008 | 162,925 | |||||||||||||
| General Motors Acceptance Corp. | ||||||||||||||||
| 150,000 | 6.88 | 09/15/2011 | 134,306 | |||||||||||||
| 779,200 | ||||||||||||||||
| Banks – 0.9% | ||||||||||||||||
| ANZ Capital Trust I(a)(c) | ||||||||||||||||
| 125,000 | 4.48 | 01/15/2010 | 120,075 | |||||||||||||
| Astoria Financial Corp. | ||||||||||||||||
| 150,000 | 5.75 | 10/15/2012 | 150,439 | |||||||||||||
| Bank United Corp. | ||||||||||||||||
| 50,000 | 8.88 | 05/01/2007 | 51,622 | |||||||||||||
| Greenpoint Bank | ||||||||||||||||
| 125,000 | 9.25 | 10/01/2010 | 144,145 | |||||||||||||
| GreenPoint Financial Corp. | ||||||||||||||||
| 125,000 | 3.20 | 06/06/2008 | 119,678 | |||||||||||||
| HBOS Capital Funding LP(a)(b)(c) | ||||||||||||||||
| 225,000 | 6.07 | 06/30/2014 | 228,945 | |||||||||||||
| Mizuho JGB Investment LLC(a)(b)(c) | ||||||||||||||||
| 100,000 | 9.87 | 06/30/2008 | 109,260 | |||||||||||||
| Popular N.A. Capital Trust I | ||||||||||||||||
| 125,000 | 6.56 | 09/15/2034 | 128,485 | |||||||||||||
| Popular North America, Inc. | ||||||||||||||||
| 150,000 | 3.88 | 10/01/2008 | 144,575 | |||||||||||||
| Popular North America, Inc. Series E | ||||||||||||||||
| 100,000 | 6.13 | 10/15/2006 | 100,501 | |||||||||||||
| Resona Bank Ltd.(c) | ||||||||||||||||
| EUR175,000 | 4.13 | 09/27/2012 | 207,408 | |||||||||||||
| Resona Bank Ltd.(a)(b)(c) | ||||||||||||||||
| $ | 175,000 | 5.85 | 04/15/2016 | 173,716 | ||||||||||||
| Sovereign Bancorp, Inc.(b) | ||||||||||||||||
| 125,000 | 5.13 | 08/25/2006 | 125,097 | |||||||||||||
| Washington Mutual, Inc. | ||||||||||||||||
| 100,000 | 8.25 | 04/01/2010 | 110,194 | |||||||||||||
| 1,914,140 | ||||||||||||||||
| Electric – 0.3% | ||||||||||||||||
| CenterPoint Energy, Inc. Series B | ||||||||||||||||
| 25,000 | 7.25 | 09/01/2010 | 26,608 | |||||||||||||
| FirstEnergy Corp. Series C | ||||||||||||||||
| 260,000 | 7.38 | 11/15/2031 | 303,055 | |||||||||||||
10
| Principal | Interest | Maturity | ||||||||||||||
| Amount• | Rate | Date | Value | |||||||||||||
Corporate Bonds – (continued) | ||||||||||||||||
| Electric – (continued) | ||||||||||||||||
| TXU Corp. | ||||||||||||||||
| $ | 325,000 | 4.80 | % | 11/15/2009 | $ | 312,285 | ||||||||||
| 641,948 | ||||||||||||||||
| Energy – Integrated – 0.1% | ||||||||||||||||
| Amerada Hess Corp. | ||||||||||||||||
| 150,000 | 7.13 | 03/15/2033 | 173,080 | |||||||||||||
| Entertainment – 0.0% | ||||||||||||||||
| Time Warner Entertainment Co. | ||||||||||||||||
| 25,000 | 8.38 | 03/15/2023 | 29,439 | |||||||||||||
| Food & Beverage – 0.0% | ||||||||||||||||
| Tyson Foods, Inc. | ||||||||||||||||
| 50,000 | 7.25 | 10/01/2006 | 50,547 | |||||||||||||
| Gaming – 0.2% | ||||||||||||||||
| Caesars Entertainment, Inc. | ||||||||||||||||
| 125,000 | 8.88 | 09/15/2008 | 135,000 | |||||||||||||
| 50,000 | 7.50 | 09/01/2009 | 52,962 | |||||||||||||
| Harrahs Operating Co., Inc. | ||||||||||||||||
| 250,000 | 5.50 | 07/01/2010 | 248,993 | |||||||||||||
| MGM Mirage, Inc. | ||||||||||||||||
| 50,000 | 8.50 | 09/15/2010 | 54,188 | |||||||||||||
| 491,143 | ||||||||||||||||
| Life Insurance – 0.1% | ||||||||||||||||
| Prudential Funding LLC(a) | ||||||||||||||||
| 200,000 | 6.60 | 05/15/2008 | 205,741 | |||||||||||||
| Media – Cable – 0.4% | ||||||||||||||||
| Comcast Cable Communications Holdings, Inc. | ||||||||||||||||
| 40,000 | 8.38 | 03/15/2013 | 45,881 | |||||||||||||
| 125,000 | 9.46 | 11/15/2022 | 161,967 | |||||||||||||
| Cox Communications, Inc. | ||||||||||||||||
| 325,000 | 4.63 | 01/15/2010 | 313,531 | |||||||||||||
| Cox Enterprises, Inc.(a) | ||||||||||||||||
| 250,000 | 4.38 | 05/01/2008 | 243,188 | |||||||||||||
| Rogers Cable, Inc. | ||||||||||||||||
| 100,000 | 5.50 | 03/15/2014 | 94,875 | |||||||||||||
| 859,442 | ||||||||||||||||
| Media – Non Cable – 0.2% | ||||||||||||||||
| Clear Channel Communications, Inc. | ||||||||||||||||
| 375,000 | 8.00 | 11/01/2008 | 396,375 | |||||||||||||
| Noncaptive – Financial – 0.1% | ||||||||||||||||
| PHH Corp. | ||||||||||||||||
| 275,000 | 6.00 | 03/01/2008 | 277,143 | |||||||||||||
| Pipelines – 0.3% | ||||||||||||||||
| CenterPoint Energy Resources Corp. Series B | ||||||||||||||||
| 75,000 | 7.88 | 04/01/2013 | 84,883 | |||||||||||||
| 225,000 | 5.95 | 01/15/2014 | 229,550 | |||||||||||||
| Energy Transfer Partners | ||||||||||||||||
| 150,000 | 5.65 | (a) | 08/01/2012 | 148,330 | ||||||||||||
| 250,000 | 5.95 | 02/01/2015 | 250,928 | |||||||||||||
| 713,691 | ||||||||||||||||
| Property/Casualty Insurance – 0.7% | ||||||||||||||||
| ACE INA Holdings, Inc. | ||||||||||||||||
| 150,000 | 8.30 | 08/15/2006 | 152,083 | |||||||||||||
| ACE Ltd. | ||||||||||||||||
| 200,000 | 6.00 | 04/01/2007 | 201,439 | |||||||||||||
| Arch Capital Group Ltd. | ||||||||||||||||
| 150,000 | 7.35 | 05/01/2034 | 169,186 | |||||||||||||
| Aspen Insurance Holdings Ltd | ||||||||||||||||
| 100,000 | 6.00 | 08/15/2014 | 98,657 | |||||||||||||
| CNA Financial Corp. | ||||||||||||||||
| 65,000 | 6.75 | 11/15/2006 | 65,543 | |||||||||||||
| 30,000 | 6.95 | 01/15/2018 | 31,637 | |||||||||||||
| 50,000 | 7.25 | 11/15/2023 | 54,761 | |||||||||||||
| Endurance Specialty Holdings Ltd. | ||||||||||||||||
| 175,000 | 6.15 | 10/15/2015 | 177,089 | |||||||||||||
| Liberty Mutual Group(a) | ||||||||||||||||
| 100,000 | 5.75 | 03/15/2014 | 98,422 | |||||||||||||
| 50,000 | 7.00 | 03/15/2034 | 53,228 | |||||||||||||
| QBE Insurance Group Ltd.(a)(b) | ||||||||||||||||
| 225,000 | 5.65 | 07/01/2023 | 221,278 | |||||||||||||
| Royal & Sun Alliance Insurance Group PLC(b)(c) | ||||||||||||||||
| GBP50,000 | 8.50 | 12/08/2014 | 103,511 | |||||||||||||
| SAFECO Corp. | ||||||||||||||||
| $ | 150,000 | 4.20 | 02/01/2008 | 147,001 | ||||||||||||
| �� | 1,573,835 | |||||||||||||||
| REITs – 0.4% | ||||||||||||||||
| Arden Realty, Inc. | ||||||||||||||||
| 75,000 | 9.15 | 03/01/2010 | 85,764 | |||||||||||||
| iStar Financial, Inc. | ||||||||||||||||
| 75,000 | 5.65 | 09/15/2011 | 74,956 | |||||||||||||
| 50,000 | 6.50 | 12/15/2013 | 51,599 | |||||||||||||
| iStar Financial, Inc. Series B | ||||||||||||||||
| 50,000 | 5.13 | 04/01/2011 | 48,892 | |||||||||||||
| 75,000 | 5.70 | 03/01/2014 | 74,762 | |||||||||||||
| Simon Property Group LP | ||||||||||||||||
| 150,000 | 7.00 | (d) | 06/15/2008 | 155,273 | ||||||||||||
| Summit Properties Partnership | ||||||||||||||||
| 250,000 | 7.20 | 08/15/2007 | 255,125 | |||||||||||||
| 746,371 | ||||||||||||||||
| Technology – 0.1% | ||||||||||||||||
| Computer Associates, Inc.(a) | ||||||||||||||||
| 250,000 | 5.25 | 12/01/2009 | 242,500 | |||||||||||||
| Tobacco – 0.1% | ||||||||||||||||
| Altria Group, Inc. | ||||||||||||||||
| 150,000 | 7.20 | 02/01/2007 | 152,330 | |||||||||||||
| 25,000 | 7.00 | 11/04/2013 | 27,165 | |||||||||||||
| 25,000 | 7.75 | 01/15/2027 | 29,661 | |||||||||||||
| 209,156 | ||||||||||||||||
11
Statement of Investments (continued)
| Principal | Interest | Maturity | ||||||||||||||
| Amount• | Rate | Date | Value | |||||||||||||
Corporate Bonds – (continued) | ||||||||||||||||
| Wireless Telecommunications – 0.2% | ||||||||||||||||
| America Movil SA de CV | ||||||||||||||||
| $ | 100,000 | 4.13 | % | 03/01/2009 | $ | 96,749 | ||||||||||
| 200,000 | 5.50 | 03/01/2014 | 197,522 | |||||||||||||
| 100,000 | 6.38 | 03/01/2035 | 101,382 | |||||||||||||
| 395,653 | ||||||||||||||||
| Wirelines Telecommunications – 0.7% | ||||||||||||||||
| Ameritech Capital Funding | ||||||||||||||||
| 50,000 | 6.25 | 05/18/2009 | 50,876 | |||||||||||||
| Deutsche Telekom International Finance BV | ||||||||||||||||
| 200,000 | 8.25 | 06/15/2030 | 251,360 | |||||||||||||
| Qwest Corp. | ||||||||||||||||
| 50,000 | 8.88 | 03/15/2012 | 56,125 | |||||||||||||
| SBC Communications, Inc. | ||||||||||||||||
| 200,000 | 4.13 | 09/15/2009 | 192,187 | |||||||||||||
| Sprint Capital Corp. | ||||||||||||||||
| 150,000 | 6.88 | 11/15/2028 | 163,177 | |||||||||||||
| Telecom Italia Capital | ||||||||||||||||
| 100,000 | 4.00 | 01/15/2010 | 94,597 | |||||||||||||
| 225,000 | 4.95 | 09/30/2014 | 211,386 | |||||||||||||
| TPSA Finance BV | ||||||||||||||||
| 175,000 | 7.75 | (a) | 12/10/2008 | 185,325 | ||||||||||||
| 275,000 | 7.63 | 01/30/2011 | 300,208 | |||||||||||||
| 1,505,241 | ||||||||||||||||
| TOTAL CORPORATE BONDS | ||||||||||||||||
| (Cost $11,422,756) | $ | 11,455,395 | ||||||||||||||
Emerging Market Debt – 1.7% | ||||||||||||||||
| Brazil Inflation Linked Credit Linked Note | ||||||||||||||||
| BRL910,000 | 10.40 | % | 05/15/2009 | $ | 446,622 | |||||||||||
| 1,530,000 | 6.00 | 08/15/2010 | 644,999 | |||||||||||||
| Central Bank of Argentina(b) | ||||||||||||||||
| $ | 628,320 | 2.00 | 02/04/2018 | 302,374 | ||||||||||||
| Egyptian Pound Credit-Linked Notes | ||||||||||||||||
| 183,000 | 8.30 | 05/04/2006 | 188,325 | |||||||||||||
| 1,152,000 | 8.30 | 06/08/2006 | 1,176,065 | |||||||||||||
| Ministry Finance of Russia | ||||||||||||||||
| 320,000 | 3.00 | 05/14/2008 | 304,000 | |||||||||||||
| Republic of Argentina | ||||||||||||||||
| 230,000 | 2.00 | 01/03/2016 | 129,561 | |||||||||||||
| 1,869,436 | 0.00 | (e) | 12/15/2035 | 38,956 | ||||||||||||
| Republic of Guatemala(a)(d) | ||||||||||||||||
| 10,000 | 8.13 | 10/06/2019 | 11,460 | |||||||||||||
| Russian Federation(b) | ||||||||||||||||
| 100,000 | 5.00 | 03/31/2030 | 112,875 | |||||||||||||
| State of Qatar | ||||||||||||||||
| 270,000 | 9.75 | 06/15/2030 | 415,800 | |||||||||||||
| TOTAL EMERGING MARKET DEBT | ||||||||||||||||
| (Cost 3,636,623) | $ | 3,771,037 | ||||||||||||||
Mortgage-Backed Obligations – 19.4% | ||||||||||||||||
| Adjustable Rate FNMA(b) – 1.9% | ||||||||||||||||
| $ | 236,670 | 5.88 | % | 09/01/2032 | $ | 239,969 | ||||||||||
| 1,000,000 | 3.85 | 10/01/2033 | 979,638 | |||||||||||||
| 573,370 | 4.38 | 12/01/2033 | 565,224 | |||||||||||||
| 621,496 | 4.22 | 01/01/2034 | 612,423 | |||||||||||||
| 1,008,747 | 4.25 | 02/01/2034 | 995,544 | |||||||||||||
| 773,373 | 4.63 | 01/01/2035 | 762,873 | |||||||||||||
| 4,155,671 | ||||||||||||||||
| FHLMC – 3.7% | ||||||||||||||||
| 141,078 | 8.00 | 07/01/2015 | 149,958 | |||||||||||||
| 36,451 | 7.00 | 12/01/2015 | 37,399 | |||||||||||||
| 123,637 | 6.50 | 07/01/2016 | 126,243 | |||||||||||||
| 988,504 | 5.50 | 11/01/2025 | 985,346 | |||||||||||||
| 63,202 | 7.50 | 03/01/2027 | 66,216 | |||||||||||||
| 187,042 | 6.50 | 12/01/2029 | 192,082 | |||||||||||||
| 285,756 | 7.00 | �� | 04/01/2031 | 295,756 | ||||||||||||
| 465,423 | 6.50 | 12/01/2031 | 477,535 | |||||||||||||
| 284,891 | 7.00 | 07/01/2032 | 294,514 | |||||||||||||
| 66,501 | 6.50 | 12/01/2032 | 68,195 | |||||||||||||
| 1,816,406 | 6.50 | 01/01/2033 | 1,862,716 | |||||||||||||
| 530,950 | 6.50 | 04/01/2033 | 544,766 | |||||||||||||
| 1,009,232 | 6.50 | 04/01/2034 | 1,032,565 | |||||||||||||
| 945,474 | 4.58 | 08/01/2035 | 935,159 | |||||||||||||
| 994,225 | 4.69 | (b) | 09/01/2035 | 980,441 | ||||||||||||
| 8,048,891 | ||||||||||||||||
| FNMA – 1.5% | ||||||||||||||||
| 111,762 | 7.00 | 01/01/2016 | 114,633 | |||||||||||||
| 17,373 | 7.00 | 02/01/2016 | 17,819 | |||||||||||||
| 928,745 | 5.00 | 12/01/2017 | 918,569 | |||||||||||||
| 883,482 | 5.50 | 08/01/2023 | 883,499 | |||||||||||||
| 993,268 | 4.50 | 10/01/2023 | 948,855 | |||||||||||||
| 62,337 | 6.50 | 12/01/2029 | 64,054 | |||||||||||||
| 94,589 | 7.00 | 11/01/2030 | 97,793 | |||||||||||||
| 191,896 | 7.50 | 03/01/2031 | 200,104 | |||||||||||||
| 3,245,326 | ||||||||||||||||
| Floater(b)(i) – 0.2% | ||||||||||||||||
| IMPAC Secured Assets Corp. Series 2004-3, Class 1A4 | ||||||||||||||||
| 504,948 | 4.98 | 11/25/2034 | 506,310 | |||||||||||||
| Home Equity(b)(i) – 2.2% | ||||||||||||||||
| Countrywide Home Equity Loan Trust Series 2002-E, Class A | ||||||||||||||||
| 327,116 | 4.83 | 10/15/2028 | 327,652 | |||||||||||||
| Countrywide Home Equity Loan Trust Series 2003-A, Class A | ||||||||||||||||
| 832,837 | 4.92 | 03/15/2029 | 834,995 | |||||||||||||
| Countrywide Home Equity Loan Trust Series 2003-D, Class A | ||||||||||||||||
| 492,670 | 4.83 | 06/15/2029 | 493,044 | |||||||||||||
| Countrywide Home Equity Loan Trust Series 2004-N, Class 2A | ||||||||||||||||
| 713,109 | 4.85 | 02/15/2034 | 714,668 | |||||||||||||
| Countrywide Home Equity Loan Trust Series 2004-S, Class 1A | ||||||||||||||||
| 722,058 | 4.81 | 02/15/2030 | 722,746 | |||||||||||||
| Impac CMB Trust Series 2004-10, Class 2A | ||||||||||||||||
| 610,242 | 4.90 | 03/25/2035 | 611,153 | |||||||||||||
12
| Principal | Interest | Maturity | ||||||||||||||
| Amount• | Rate | Date | Value | |||||||||||||
Mortgage-Backed Obligations – (continued) | ||||||||||||||||
| Home Equity(b)(i) – (continued) | ||||||||||||||||
| Indymac Index Mortgage Loan Trust, Series 2006-AR2, Class 1A1A | ||||||||||||||||
| $ | 1,000,000 | 4.80 | % | 07/25/2040 | $ | 1,000,000 | ||||||||||
| 4,704,258 | ||||||||||||||||
| Interest Only(g)(i) – 0.2% | ||||||||||||||||
| ABN AMRO Mortgage Corp. Series 2003-8, Class A2 | ||||||||||||||||
| 339,989 | 5.50 | 06/25/2033 | 42,233 | |||||||||||||
| Countrywide Home Loan Trust Series 2003-42, Class 2X1(b) | ||||||||||||||||
| 1,700,596 | 0.38 | 10/25/2033 | 10,956 | |||||||||||||
| CS First Boston Mortgage Securities Corp. Series 2003-11, Class 1A2 | ||||||||||||||||
| 27,331 | 5.50 | 06/25/2033 | 1,950 | |||||||||||||
| CS First Boston Mortgage Securities Corp. Series 2003-19, Class 1A2(b) | ||||||||||||||||
| 370,622 | 5.25 | 07/25/2033 | 41,490 | |||||||||||||
| CS First Boston Mortgage Securities Corp. Series 2003-AR18, Class 2X(b) | ||||||||||||||||
| 226,371 | 0.78 | 07/25/2033 | 2,222 | |||||||||||||
| CS First Boston Mortgage Securities Corp. Series 2003-AR20, Class 2X(b) | ||||||||||||||||
| 247,970 | 0.60 | 08/25/2033 | 2,132 | |||||||||||||
| CS First Boston Mortgage Securities Corp. Series 2003-C3, Class ASP(a)(b) | ||||||||||||||||
| 1,796,875 | 1.82 | 05/15/2038 | 94,206 | |||||||||||||
| FHLMC Series 2575, Class IB | ||||||||||||||||
| 256,373 | 5.50 | 08/15/2030 | 27,573 | |||||||||||||
| Master Adjustable Rate Mortgages Trust Series 2003-2, Class 3AX(b) | ||||||||||||||||
| 215,269 | 0.68 | 08/25/2033 | 3,107 | |||||||||||||
| Master Adjustable Rate Mortgages Trust Series 2003-2, Class 4AX(b) | ||||||||||||||||
| 73,789 | 1.16 | 07/25/2033 | 1,494 | |||||||||||||
| Prudential Commercial Mortgage Trust Series 2003-PWR1, Class X2(a)(b) | ||||||||||||||||
| 3,563,802 | 1.52 | 02/11/2036 | 180,428 | |||||||||||||
| Washington Mutual Series 2003-AR04, Class X1(b) | ||||||||||||||||
| 449,488 | 1.18 | 01/25/2008 | 6,750 | |||||||||||||
| Washington Mutual Series 2003-AR07, Class X(b) | ||||||||||||||||
| 909,329 | 0.94 | 06/25/2008 | 12,719 | |||||||||||||
| Washington Mutual Series 2003-AR12, Class X(b) | ||||||||||||||||
| 939,792 | 0.49 | 02/25/2034 | 7,838 | |||||||||||||
| 435,098 | ||||||||||||||||
| Inverse Floaters(b)(i) – 0.2% | ||||||||||||||||
| FNMA Series 1993-248, Class SA | ||||||||||||||||
| 236,052 | 5.12 | 08/25/2023 | 225,091 | |||||||||||||
| GNMA Series 2001-48, Class SA | ||||||||||||||||
| 37,946 | 11.64 | 10/16/2031 | 42,085 | |||||||||||||
| GNMA Series 2001-51, Class SA | ||||||||||||||||
| 59,822 | 12.70 | 10/16/2031 | 70,232 | |||||||||||||
| GNMA Series 2001-51, Class SB | ||||||||||||||||
| 75,070 | 11.64 | 10/16/2031 | 83,745 | |||||||||||||
| GNMA Series 2001-59, Class SA | ||||||||||||||||
| 55,011 | 11.47 | 11/16/2024 | 61,114 | |||||||||||||
| GNMA Series 2002-13, Class SB | ||||||||||||||||
| 25,094 | 16.24 | 02/16/2032 | 30,283 | |||||||||||||
| 512,550 | ||||||||||||||||
| Manufactured Housing(i) – 0.1% | ||||||||||||||||
| Mid-State Trust Series 4, Class A | ||||||||||||||||
| 265,538 | 8.33 | 04/01/2030 | 276,035 | |||||||||||||
| Non-Agency CMOs(i) – 6.4% | ||||||||||||||||
| Asset Securitization Corp. Series 1997-D4, Class A1D | ||||||||||||||||
| 386,891 | 7.49 | 04/14/2029 | 394,876 | |||||||||||||
| Bear Stearns Commercial Mortgage Securities, Inc. Series 2003-T10, Class X2(a)(b) | ||||||||||||||||
| 2,868,733 | 1.26 | 03/13/2040 | 125,454 | |||||||||||||
| Countrywide Alternative Loan Trust Series 2005-31 Class 2A1(b) | ||||||||||||||||
| 907,595 | 4.88 | 08/25/2035 | 910,272 | |||||||||||||
| Countrywide Alternative Loan Trust Series 2005-38, Class A3(b) | ||||||||||||||||
| 882,063 | 4.93 | 09/25/2035 | 886,302 | |||||||||||||
| Countrywide Alternative Loan Trust Series 2005-59, Class 1A1 | ||||||||||||||||
| 992,361 | 4.90 | 11/20/2035 | 996,590 | |||||||||||||
| CS First Boston Mortgage Securities Corp. Series 1997-C2, Class A3 | ||||||||||||||||
| 1,000,000 | 6.55 | 01/17/2035 | 1,017,618 | |||||||||||||
| First Union National Bank Commercial Mortgage Trust Series 2000-C2, Class A2 | ||||||||||||||||
| 600,000 | 7.20 | 10/15/2032 | 643,201 | |||||||||||||
| Master Adjustable Rate Mortgages Trust Series 2004-9, Class 2A1(b) | ||||||||||||||||
| 325,483 | 4.96 | 11/25/2034 | 326,635 | |||||||||||||
| Structured Adjustable Rate Mortgage Loan Series 2004-6, Class 3A2(b) | ||||||||||||||||
| 592,401 | 4.72 | 06/25/2034 | 579,728 | |||||||||||||
| Structured Asset Mortgage Investments, Inc. Series 2006-AR1, Class 3A1(b) | ||||||||||||||||
| 1,000,000 | 4.84 | 02/25/2036 | 999,687 | |||||||||||||
| Structured Asset Securities Corp. Series 2003-34A, Class 3A3(b) | ||||||||||||||||
| 249,500 | 4.70 | 11/25/2033 | 247,832 | |||||||||||||
| Washington Mutual Series 2005-AR11, Class A1A(b) | ||||||||||||||||
| 1,877,519 | 4.90 | 08/25/2045 | 1,886,998 | |||||||||||||
| Washington Mutual Series 2005-AR19, Class A1A1 | ||||||||||||||||
| 986,948 | 4.85 | 12/25/2045 | 987,107 | |||||||||||||
| Washington Mutual Series 2005-AR8, Class 2A1A(b) | ||||||||||||||||
| 1,290,694 | 4.87 | 07/25/2045 | 1,293,614 | |||||||||||||
| Wells Fargo Mortgage Backed Securities Trust Series 2005-AR16, Class 1A1 | ||||||||||||||||
| 869,952 | 4.98 | 10/25/2035 | 867,454 | |||||||||||||
| Wells Fargo Mortgage Backed Securities Trust Series 2005-AR16, Class 6A3 | ||||||||||||||||
| 937,623 | 5.00 | 10/25/2035 | 926,171 | |||||||||||||
| Wells Fargo Mortgage Backed Securities Trust Series 2006-AR2, Class 2A3 | ||||||||||||||||
| 1,000,000 | 5.09 | 10/25/2035 | 993,281 | |||||||||||||
| 14,082,820 | ||||||||||||||||
13
Statement of Investments (continued)
| Principal | Interest | Maturity | ||||||||||||||
| Amount• | Rate | Date | Value | |||||||||||||
Mortgage-Backed Obligations – (continued) | ||||||||||||||||
| PAC(i) – 0.3% | ||||||||||||||||
| FNMA Series 1993-76, Class PJ | ||||||||||||||||
| $ | 290,608 | 6.00 | % | 06/25/2008 | $ | 292,020 | ||||||||||
| FNMA Series 1994-75, Class J | ||||||||||||||||
| 258,619 | 7.00 | 10/25/2023 | 259,143 | |||||||||||||
| 551,163 | ||||||||||||||||
| Principal Only(e)(f)(i) – 0.4% | ||||||||||||||||
| FHLMC Series 235, Class PO | ||||||||||||||||
| 797,935 | 0.00 | 02/01/2036 | 595,306 | |||||||||||||
| FNMA Series 363, Class 1 | ||||||||||||||||
| 490,123 | 0.00 | 11/01/2035 | 368,904 | |||||||||||||
| 964,210 | ||||||||||||||||
| Sequential Fixed Rate(i) – 2.3% | ||||||||||||||||
| CS First Boston Mortgage Securities Corp. Series 2002-5, Class PPA1 | ||||||||||||||||
| 469,966 | 6.50 | 03/25/2032 | 472,211 | |||||||||||||
| FNMA REMIC Trust Series 2002-24, Class AE | ||||||||||||||||
| 401,240 | 6.00 | 04/25/2016 | 401,147 | |||||||||||||
| GE Capital Commercial Mortgage Corp. Series 2005-C4, Class A4 | ||||||||||||||||
| 1,000,000 | 5.33 | 11/10/2045 | 1,007,355 | |||||||||||||
| GMAC Commercial Mortgage Securities Inc. Series 2002-C1, Class A2 | ||||||||||||||||
| 1,000,000 | 6.28 | 11/15/2039 | 1,048,061 | |||||||||||||
| LB-UBS Commercial Mortgage Trust Series 2005-C7, Class A4 | ||||||||||||||||
| 1,000,000 | 5.20 | 11/15/2030 | 993,361 | |||||||||||||
| LB-UBS Commercial Mortgage Trust Series 2006-C1, Class A4 | ||||||||||||||||
| 1,000,000 | 5.16 | 02/15/2031 | 991,719 | |||||||||||||
| 4,913,854 | ||||||||||||||||
| TOTAL MORTGAGE-BACKED OBLIGATIONS | ||||||||||||||||
| (Cost $42,580,609) | $ | 42,396,186 | ||||||||||||||
Agency Debentures – 7.2% | ||||||||||||||||
| FFCB | ||||||||||||||||
| $ | 1,200,000 | 4.50 | % | 08/08/2011 | $ | 1,161,400 | ||||||||||
| 1,000,000 | 4.40 | 04/25/2012 | 973,035 | |||||||||||||
| 2,000,000 | 4.55 | 08/10/2012 | 1,961,930 | |||||||||||||
| 900,000 | 4.70 | 08/10/2015 | 886,272 | |||||||||||||
| FHLB | ||||||||||||||||
| 1,000,000 | 5.38 | 02/15/2007 | 1,003,227 | |||||||||||||
| 700,000 | 3.38 | 02/15/2008 | 679,324 | |||||||||||||
| 1,000,000 | 4.08 | 04/26/2010 | 968,320 | |||||||||||||
| 700,000 | 4.52 | 08/10/2010 | 688,423 | |||||||||||||
| 1,200,000 | 7.38 | 02/13/2015 | 1,413,953 | |||||||||||||
| FHLMC | ||||||||||||||||
| 1,100,000 | 4.13 | 10/18/2010 | 1,063,761 | |||||||||||||
| FNMA | ||||||||||||||||
| 1,000,000 | 3.25 | 07/12/2006 | 994,159 | |||||||||||||
| 3,000,000 | 3.86 | 02/22/2008 | 2,941,870 | |||||||||||||
| 1,000,000 | 4.75 | 12/15/2010 | 992,408 | |||||||||||||
| TOTAL AGENCY DEBENTURES | ||||||||||||||||
| (Cost $15,958,596) | $ | 15,728,082 | ||||||||||||||
U.S. Treasury Obligations – 5.9% | ||||||||||||||||
| U.S. Treasury Bonds | ||||||||||||||||
| $ | 3,800,000 | 4.50 | % | 02/15/2009 | $ | 3,783,079 | ||||||||||
| 500,000 | 4.25 | 08/15/2015 | 487,070 | |||||||||||||
| 300,000 | 8.88 | 08/15/2017 | 410,976 | |||||||||||||
| 450,000 | 8.88 | 02/15/2019 | 631,102 | |||||||||||||
| U.S. Treasury Inflation Protected Securities | ||||||||||||||||
| 1,416,688 | 1.88 | 07/15/2015 | 1,402,960 | |||||||||||||
| U.S. Treasury Interest-Only Stripped Securities(e)(g) | ||||||||||||||||
| 1,000,000 | 0.00 | 08/15/2014 | 675,713 | |||||||||||||
| U.S. Treasury Principal-Only Stripped Securities(e)(f) | ||||||||||||||||
| 1,300,000 | 0.00 | 02/15/2019 | 710,320 | |||||||||||||
| 2,200,000 | 0.00 | 05/15/2020 | 1,130,360 | |||||||||||||
| 200,000 | 0.00 | 08/15/2020 | 101,608 | |||||||||||||
| 1,800,000 | 0.00 | 11/15/2021 | 863,226 | |||||||||||||
| 3,850,000 | 0.00 | 11/15/2022 | 1,761,337 | |||||||||||||
| 200,000 | 0.00 | 11/15/2024 | 83,720 | |||||||||||||
| 600,000 | 0.00 | 02/15/2025 | 248,646 | |||||||||||||
| 1,360,000 | 0.00 | 08/15/2025 | 551,868 | |||||||||||||
| TOTAL U.S. TREASURY OBLIGATIONS | ||||||||||||||||
| (Cost $12,921,310) | $ | 12,841,985 | ||||||||||||||
| Expiration | ||||||||||||||
| Units | Description | Date | Value | |||||||||||
Warrants* – 0.0% | ||||||||||||||
| 280 | Hayes Lemmerz International, Inc. | 06/03/2006 | $ | 8 | ||||||||||
| 130,000 | United Mexican States | 09/01/2006 | 9,750 | |||||||||||
| TOTAL WARRANTS | ||||||||||||||
| (Cost $5,175) | $ | 9,758 | ||||||||||||
| TOTAL INVESTMENTS BEFORE REPURCHASE AGREEMENT – 95.2% | ||||||||||||||
| (Cost $183,747,118) | $ | 208,257,713 | ||||||||||||
14
| Principal | Interest | Maturity | ||||||||||||||
| Amount• | Rate | Date | Value | |||||||||||||
Repurchase Agreement – 3.9% | ||||||||||||||||
| Joint Repurchase Agreement Account II(h) | ||||||||||||||||
| $ | 8,500,000 | 4.57 | % | 03/01/2006 | $ | 8,500,000 | ||||||||||
| Maturity Value: $8,501,079 | ||||||||||||||||
| (Cost $8,500,000) | ||||||||||||||||
| TOTAL INVESTMENTS – 99.1% | ||||||||||||||||
| (Cost $192,247,118) | $ | 216,757,713 | ||||||||||||||
| The percentage shown for each investment category reflects the value of investments in that category as a percentage of net assets. |
| * | Non-income producing security. | |
| • | The principal amount of each security is stated in the currency in which the bond is denominated. See below. |
| Currency Description | ||||||||||
| BRL | = | Brazilian Real | ||||||||
| CLP | = | Chilean Peso | ||||||||
| EUR | = | Euro Currency | ||||||||
| GBP | = | British Pounds | ||||||||
| MXN | = | Mexican Peso | ||||||||
| (a) | Securities are exempt from registration under Rule 144A of the Securities Act of 1933. Under procedures approved by the Board of Trustees, such securities have been determined to be liquid by the Investment Adviser and may be resold, normally to qualified institutional buyers in transactions exempt from registration. Total market value of Rule 144A securities amounts to $2,561,681, which represents approximately 1.2% of net assets as of February 28, 2006. | |
| (b) | Variable rate security. Interest rate disclosed is that which is in effect at February 28, 2006. | |
| (c) | Perpetual Maturity. Maturity date presented represents the next call date. | |
| (d) | Securities with “Put” features with resetting interest rates. Maturity dates disclosed are the next interest reset dates. | |
| (e) | Security issued with a zero coupon. Income is recognized through the accretion of discount. | |
| (f) | Represents security with notional or nominal principal amount. The actual effective yield of this security is different than the stated interest rate due to the amortization of related premiums or accretion of discounts. | |
| (g) | Interest Only Security. Represents security with notional or nominal principal amount. The actual effective yield of this security is different than the stated interest rate due to the amortization of related premiums or accretion of discounts. | |
| (h) | Joint repurchase agreement was entered into on February 28, 2006. Additional information appears on page 18. | |
| (i) | Collateralized Mortgage Obligations which represent 12.3% of net assets as of February 28, 2006. |
| Investment Abbreviations: | ||||||
| CMOs | — | Collateralized Mortgage Obligations | ||||
| FFCB | — | Federal Farm Credit Bank | ||||
| FHLB | — | Federal Home Loan Bank | ||||
| FHLMC | — | Federal Home Loan Mortgage Corp. | ||||
| FNMA | — | Federal National Mortgage Association | ||||
| GNMA | — | Government National Mortgage Association | ||||
| LIBOR | — | London Interbank Offered Rate | ||||
| PAC | — | Planned Amortization Class | ||||
| REITs | — | Real Estate Investment Trust | ||||
| REMIC | — | Real Estate Mortgage Investment Conduit | ||||
15
Statement of Investments (continued)
| ADDITIONAL INVESTMENT INFORMATION |
FORWARD FOREIGN CURRENCY CONTRACTS — At February 28, 2006, the Fund had outstanding forward foreign currency exchange contracts, both to purchase and sell foreign currencies as follows:
| Open Forward Foreign Currency | Expiration | Value on | Current | Unrealized | ||||||||||||
| Purchase Contracts | Date | Settlement Date | Value | Gain | ||||||||||||
| Mexican Peso | 04/12/2006 | $ | 2,156,244 | $ | 2,198,002 | $ | 41,758 | |||||||||
| Open Forward Foreign Currency | Expiration | Value on | Current | Unrealized | ||||||||||||
| Sale Contracts | Date | Settlement Date | Value | Gain/(Loss) | ||||||||||||
| Brazilian Real | 04/25/2006 | $ | 610,000 | $ | 654,203 | $ | (44,203 | ) | ||||||||
| Brazilian Real | 05/15/2006 | 820,000 | 833,236 | (13,236 | ) | |||||||||||
| British Pound | 05/15/2006 | 100,942 | 101,798 | (856 | ) | |||||||||||
| Euro | 03/27/2006 | 381,121 | 379,787 | 1,334 | ||||||||||||
| Mexican Peso | 04/12/2006 | 2,253,169 | 2,284,905 | (31,736 | ) | |||||||||||
TOTAL OPEN FORWARD FOREIGN CURRENCY SALE CONTRACTS | $ | 4,165,232 | $ | 4,253,929 | $ | (88,697 | ) | |||||||||
FUTURES CONTRACTS — At February 28, 2006, futures contracts were open as follows:
| Number of | ||||||||||||||||
| Contracts | Settlement | Unrealized | ||||||||||||||
| Type | Long (Short) | Month | Market Value | Gain (Loss) | ||||||||||||
| Euro | 13 | March 2006 | $ | 3,091,319 | $ | (3,900 | ) | |||||||||
| Euro | 14 | June 2006 | 3,322,550 | (8,373 | ) | |||||||||||
| Euro | 7 | September 2006 | 1,660,312 | (5,449 | ) | |||||||||||
| Euro | (5 | ) | December 2006 | (1,186,500 | ) | 10,200 | ||||||||||
| Euro | 4 | March 2007 | 950,000 | (6,283 | ) | |||||||||||
| Euro | 4 | June 2007 | 950,550 | (4,646 | ) | |||||||||||
| Euro | 4 | September 2007 | 950,850 | (1,214 | ) | |||||||||||
| S&P 500 Index | 98 | March 2006 | 6,283,760 | 73,059 | ||||||||||||
| 2 Year U.S. Treasury Notes | 15 | March 2006 | 3,065,391 | (2,996 | ) | |||||||||||
| 2 Year U.S. Treasury Notes | 4 | June 2006 | 817,500 | 801 | ||||||||||||
| 5 Year U.S. Treasury Notes | (33 | ) | March 2006 | (3,472,734 | ) | 14,517 | ||||||||||
| 5 Year U.S. Treasury Notes | (18 | ) | June 2006 | (1,893,375 | ) | 1,156 | ||||||||||
| 10 Year U.S. Treasury Notes | (108 | ) | June 2006 | (11,653,875 | ) | (9,369 | ) | |||||||||
| U.S. Treasury Bonds | 72 | June 2006 | 8,142,750 | 34,220 | ||||||||||||
Total | $ | 10,210,998 | $ | 91,723 | ||||||||||||
16
| ADDITIONAL INVESTMENT INFORMATION (continued) |
SWAP CONTRACTS — At February 28, 2006, the following swap contracts were open as follows:
INTEREST RATE SWAP CONTRACTS
| Rate Type | ||||||||||||||
| Notional | Payments | Payments | ||||||||||||
| Swap | Amount | Termination | received by | made by | Unrealized | |||||||||
| Counterparty | (000s) | Date | the Fund | the Fund | Gain (Loss) | |||||||||
| J.P Morgan | Brazilian Interbank | |||||||||||||
| Securities, Inc. | BRL 5,400 | 01/02/2008 | 16.21% | Lending Rate | $ | 133,506 | ||||||||
| Banc of America | 3 month LIBOR | |||||||||||||
| Securities LLC | $ | 4,000 | 10/14/2008 | 3.51% | floating | (117,613 | ) | |||||||
| Banc of America | 3 month LIBOR | |||||||||||||
| Securities LLC | 7,710 | 02/16/2009 | floating | 5.07% | (5,003 | ) | ||||||||
| Banc of America | 3 month LIBOR | |||||||||||||
| Securities LLC | 6,000 | 02/16/2009 | floating | 5.05% | (1,749 | ) | ||||||||
| Banc of America | 3 month LIBOR | |||||||||||||
| Securities LLC | 6,860 | 02/17/2009 | floating | 5.10% | (8,173 | ) | ||||||||
| Banc of America | 3 month LIBOR | |||||||||||||
| Securities LLC | 5,160 | 02/27/2009 | floating | 5.09% | 5,837 | |||||||||
| Banc of America | 3 month LIBOR | |||||||||||||
| Securities LLC | 4,000 | 10/06/2010 | 4.70% | floating | (2,478 | ) | ||||||||
| Salomon Smith | Brazilian Interbank | |||||||||||||
| Barney, Inc. | CLP 317,000 | 02/10/2011 | 3.32% | Lending Rate | (2,544 | ) | ||||||||
| Banc of America | 3 month LIBOR | |||||||||||||
| Securities LLC | $ | 4,000 | 04/06/2012 | 4.74% | floating | (20,022 | ) | |||||||
| Banc of America | 3 month LIBOR | |||||||||||||
| Securities LLC | 5,000 | 04/19/2012 | 4.55% | floating | (78,747 | ) | ||||||||
| Banc of America | 3 month LIBOR | |||||||||||||
| Securities LLC | 11,200 | 09/24/2012 | 4.52% | floating | (215,310 | ) | ||||||||
| Banc of America | 3 month LIBOR | |||||||||||||
| Securities LLC | 8,320 | 02/14/2014 | 5.11% | floating | 20,039 | |||||||||
| Banc of America | 3 month LIBOR | |||||||||||||
| Securities LLC | 6,460 | 02/17/2014 | 5.10% | floating | 11,885 | |||||||||
| Banc of America | 3 month LIBOR | |||||||||||||
| Securities LLC | 7,380 | 02/17/2014 | 5.14% | floating | 29,832 | |||||||||
| Banc of America | 3 month LIBOR | |||||||||||||
| Securities LLC | 5,550 | 02/27/2014 | 5.09% | floating | 7,317 | |||||||||
| Salomon Smith | Mexican Interbank | |||||||||||||
| Barney Inc. | MXN 5,070 | 10/14/2015 | 9.60% | Equilibrium Floating | 35,528 | |||||||||
| Banc of America | 3 month LIBOR | |||||||||||||
| Securities LLC | $ | 10,000 | 11/12/2019 | floating | 5.07% | (115,693 | ) | |||||||
| Banc of America | 3 month LIBOR | |||||||||||||
| Securities LLC | 3,500 | 02/14/2022 | floating | 5.15% | (1,201 | ) | ||||||||
| Banc of America | 3 month LIBOR | |||||||||||||
| Securities LLC | 2,720 | 02/15/2022 | floating | 5.16% | (17,455 | ) | ||||||||
| Banc of America | 3 month LIBOR | |||||||||||||
| Securities LLC | 3,110 | 02/17/2022 | floating | 5.19% | (29,208 | ) | ||||||||
| Banc of America | 3 month LIBOR | |||||||||||||
| Securities LLC | 2,330 | 02/28/2022 | floating | 5.11% | 5,134 | |||||||||
TOTAL | $ | (366,118 | ) | |||||||||||
17
Statement of Investments (continued)
| ADDITIONAL INVESTMENT INFORMATION (continued) |
CREDIT DEFAULT SWAP CONTRACTS
| Notional | ||||||||||||||||
| Swap Counterparty & | Amount | Interest | Termination | Unrealized | ||||||||||||
| Referenced Obligation | (000s) | Rate | Date | Loss | ||||||||||||
Buy: | ||||||||||||||||
| Salomon Smith Barney, Inc. Core Investment Grade Bond Trust | $ | 15,200 | 0.45 | % | 12/20/2010 | $ | (23,377 | ) | ||||||||
| Salomon Smith Barney, Inc. Brazilian Government International | 700 | 1.30 | % | 02/20/2011 | (8,208 | ) | ||||||||||
TOTAL | $ | (31,585 | ) | |||||||||||||
TOTAL RETURN INDEX SWAP CONTRACTS
| Rate Type | ||||||||||||||||
| Notional | Payments | Payments | ||||||||||||||
| Swap | Amount | Termination | received by | made by | Unrealized | |||||||||||
| Counterparty | (000s) | Date | the Fund | the Fund | Gain | |||||||||||
| Banc of America Securities LLC | 1,000 | 01/31/2007 | If positive spread, as defined in the swap contract | If negative spread, as defined in the swap contract | $ | 1,162 | ||||||||||
| Merrill Lynch International | BRL 2,270 | 05/15/2045 | Inflation Linked Brazilian Local Bonds Index + 6.00% | N/A | 68,441 | |||||||||||
TOTAL | $ | 69,603 | ||||||||||||||
| N/A | — | Not Applicable. The Fund does not make periodic payments in accordance with the swap contract. |
JOINT REPURCHASE AGREEMENT ACCOUNT II — At February 28, 2006, the Fund had an undivided interest in the following Joint Repurchase Agreement Account II which equaled $8,500,000 in principal amount.
| Principal | Interest | Maturity | Maturity | |||||||||||||
| Repurchase Agreements | Amount | Rate | Date | Value | ||||||||||||
| Banc of America Securities LLC | $ | 3,019,900,000 | 4.56 | % | 03/01/2006 | $ | 3,020,282,521 | |||||||||
| Barclays Capital PLC | 3,000,000,000 | 4.57 | 03/01/2006 | 3,000,380,833 | ||||||||||||
| Credit Suisse First Boston LLC | 500,000,000 | 4.57 | 03/01/2006 | 500,063,472 | ||||||||||||
| Deutsche Bank Securities, Inc. | 3,020,000,000 | 4.57 | 03/01/2006 | 3,020,383,372 | ||||||||||||
| Greenwich Capital Markets | 300,000,000 | 4.58 | 03/01/2006 | 300,038,167 | ||||||||||||
| J.P. Morgan Securities, Inc. | 400,000,000 | 4.56 | 03/01/2006 | 400,050,667 | ||||||||||||
| Morgan Stanley & Co. | 2,925,000,000 | 4.57 | 03/01/2006 | 2,925,371,312 | ||||||||||||
| UBS Securities LLC | 1,500,000,000 | 4.57 | 03/01/2006 | 1,500,190,417 | ||||||||||||
| Wachovia Capital Markets | 400,000,000 | 4.58 | 03/01/2006 | 400,050,889 | ||||||||||||
TOTAL | $ | 15,064,900,000 | $ | 15,066,811,650 | ||||||||||||
18
Statement of Assets and Liabilities
| Assets: | |||||||||
| Investment in securities, at value (identified cost $192,247,118) | $ | 216,757,713 | |||||||
Cash(a) | 4,289,505 | ||||||||
| Foreign currencies, at value (identified cost $29,912) | 30,165 | ||||||||
| Receivables: | |||||||||
| Investment securities sold, at value | 1,061,655 | ||||||||
| Dividends and interest, at value | 689,476 | ||||||||
| Swap contracts, at value | 318,681 | ||||||||
| Fund shares sold | 178,612 | ||||||||
| Reimbursement from investment adviser | 22,224 | ||||||||
| Forward foreign currency exchange contracts, at value | 43,092 | ||||||||
| Other assets | 2,066 | ||||||||
Total assets | 223,393,189 | ||||||||
| Liabilities: | |||||||||
| Payables: | |||||||||
| Investment securities purchased, at value | 3,187,860 | ||||||||
| Swap contracts, at value | 646,781 | ||||||||
| Fund shares repurchased | 479,594 | ||||||||
| Amounts owed to affiliates | 200,351 | ||||||||
| Variation margin | 59,717 | ||||||||
| Forward foreign currency exchange contracts, at value | 90,031 | ||||||||
| Accrued expenses | 121,268 | ||||||||
Total liabilities | 4,785,602 | ||||||||
| Net Assets: | |||||||||
| Paid-in capital | 193,607,076 | ||||||||
| Accumulated net investment loss | (106,004 | ) | |||||||
| Accumulated net realized gain on investment, futures, swaps and foreign currency related transactions | 876,606 | ||||||||
| Net unrealized gain on investments, futures, swaps and translation of assets and liabilities denominated in foreign currencies | 24,229,909 | ||||||||
NET ASSETS | $ | 218,607,587 | |||||||
| Net Assets: | |||||||||
| Class A | $ | 184,746,946 | |||||||
| Class B | 25,546,954 | ||||||||
| Class C | 6,231,184 | ||||||||
| Institutional | 2,081,337 | ||||||||
| Service | 1,166 | ||||||||
| Shares outstanding: | |||||||||
| Class A | 9,067,663 | ||||||||
| Class B | 1,263,615 | ||||||||
| Class C | 308,542 | ||||||||
| Institutional | 100,901 | ||||||||
| Service | 57 | ||||||||
| Total shares outstanding, $0.001 par value (unlimited number of shares authorized) | 10,740,778 | ||||||||
Net asset value, offering and redemption price per share:(b) | |||||||||
| Class A | $ | 20.37 | |||||||
| Class B | 20.22 | ||||||||
| Class C | 20.20 | ||||||||
| Institutional | 20.63 | ||||||||
| Service | 20.37 | ||||||||
| (a) | Includes restricted cash of $2,270,000 relating to initial margin requirements and collateral on futures transactions. |
| (b) | Maximum public offering price per share (NAV per share multiplied by 1.0582) for Class A Shares is $21.56. At redemption, Class B and Class C Shares may be subject to a contingent deferred sales charge, assessed on the amount equal to the lesser of the current NAV or the original purchase price of the shares. |
19
Statement of Operations
| Investment income: | |||||||
| Interest (including securities lending income of $617) | $ | 2,235,153 | |||||
Dividends(a) | 1,161,347 | ||||||
Total income | 3,396,500 | ||||||
| Expenses: | |||||||
| Management fees | 711,102 | ||||||
Distribution and Service fees(b) | 392,848 | ||||||
Transfer agent fees(c) | 206,346 | ||||||
| Custody and accounting fees | 92,003 | ||||||
| Registration fees | 15,973 | ||||||
| Professional fees | 15,623 | ||||||
| Trustee fees | 7,138 | ||||||
| Printing fees | 1,414 | ||||||
| Other | 34,765 | ||||||
Total expenses | 1,477,212 | ||||||
| Less — expense reductions | (100,254 | ) | |||||
Net expenses | 1,376,958 | ||||||
NET INVESTMENT INCOME | 2,019,542 | ||||||
| Realized and unrealized gain (loss) on investment, futures, swaps and foreign currency transactions: | |||||||
| Net realized gain (loss) from: | |||||||
| Investment transactions | 4,797,313 | ||||||
| Futures transactions | 681,454 | ||||||
| Swap contracts | (256,856 | ) | |||||
| Foreign currency related transactions | 20,752 | ||||||
| Net change in unrealized gain (loss) on: | |||||||
| Investments | 233,821 | ||||||
| Futures | (161,848 | ) | |||||
| Swap contracts | 155,759 | ||||||
| Translation of assets and liabilities denominated in foreign currencies | (64,548 | ) | |||||
Net realized and unrealized gain on investment, futures, swaps and foreign currency transactions | 5,405,847 | ||||||
NET INCREASE IN NET ASSETS RESULTING FROM OPERATIONS | $ | 7,425,389 | |||||
| (a) | Foreign taxes withheld on dividends were $18,479. |
| (b) | Class A, Class B and Class C Shares had Distribution and Service fees of $230,354, $132,122 and $30,372, respectively. |
| (c) | Class A, Class B, Class C, Institutional Class and Service Class had Transfer agent fees of $175,068, $25,103, $5,771, $404 and $-, respectively. |
20
Statements of Changes in Net Assets
| For the | |||||||||||
| Six Months Ended | For the | ||||||||||
| February 28, 2006 | Year Ended | ||||||||||
| (Unaudited) | August 31, 2005 | ||||||||||
| From operations: | |||||||||||
| Net investment income | $ | 2,019,542 | $ | 3,915,129 | |||||||
| Net realized gain from investment, futures, swaps and foreign currency related transactions | 5,242,663 | 8,693,247 | |||||||||
| Payments by affiliates to reimburse certain security claims | — | 46,137 | |||||||||
| Net change in unrealized gain (loss) on investments, futures, swaps and translation of assets and liabilities denominated in foreign currencies | 163,184 | 5,669,176 | |||||||||
Net increase in net assets resulting from operations | 7,425,389 | 18,323,689 | |||||||||
| Distributions to shareholders: | |||||||||||
| From net investment income: | |||||||||||
| Class A Shares | (1,955,588 | ) | (3,571,386 | ) | |||||||
| Class B Shares | (181,130 | ) | (369,146 | ) | |||||||
| Class C Shares | (41,602 | ) | (72,134 | ) | |||||||
| Institutional Shares | (24,343 | ) | (505,685 | ) | |||||||
| Service Shares | (11 | ) | (58 | ) | |||||||
Total distributions to shareholders | (2,202,674 | ) | (4,518,409 | ) | |||||||
| From share transactions: | |||||||||||
| Proceeds from sales of shares | 12,462,923 | 127,175,180 | |||||||||
| Reinvestment of dividends and distributions | 2,126,249 | 4,384,774 | |||||||||
| Cost of shares repurchased | (33,961,171 | ) | (121,041,765 | ) | |||||||
Net increase (decrease) in net assets resulting from share transactions | (19,371,999 | ) | 10,518,189 | ||||||||
TOTAL INCREASE (DECREASE) | (14,149,284 | ) | 24,323,469 | ||||||||
| Net assets: | |||||||||||
| Beginning of period | 232,756,871 | 208,433,402 | |||||||||
| End of period | $ | 218,607,587 | $ | 232,756,871 | |||||||
Accumulated undistributed net investment income (loss) | $ | (106,004 | ) | $ | 77,128 | ||||||
21
Notes to Financial Statements
| 1. ORGANIZATION |
Goldman Sachs Trust (the “Trust”) is a Delaware statutory trust registered under the Investment Company Act of 1940, as amended, (the “Act”) as an open-end management investment company. The Trust includes the Goldman Sachs Balanced Fund (the “Fund”). The Fund is a diversified portfolio offering five classes of shares — Class A, Class B, Class C, Institutional and Service. Class A Shares of the Fund are sold with front-end sales charge of up to 5.50%. Class B Shares of the Fund are sold with contingent deferred sales charge that decline from 5.00% to zero, depending upon the period of time the shares are held. Class C Shares of the Fund are sold with a contingent deferred sales charge of 1.00% during the first 12 months. Institutional and Service Class Shares of the Fund are not subject to a sales charge. Such sales loads are paid directly to Goldman Sachs & Co. (“Goldman Sachs”) as distributor of the Fund.
| 2. SIGNIFICANT ACCOUNTING POLICIES |
The following is a summary of the significant accounting policies consistently followed by the Fund. The preparation of financial statements in conformity with U.S. generally accepted accounting principles requires management to make estimates and assumptions that may affect the reported amounts. Actual results could differ from those estimates.
A. Investment Valuation — Investments in equity securities and investment companies traded on a U.S. securities exchange or the NASDAQ system are valued daily at their last sale or official closing price on the principal exchange or system on which they are traded. If no sale occurs, such securities and investment companies are valued at the last bid price. Debt securities are valued at prices supplied by independent pricing services, broker/dealer-supplied valuations or matrix pricing systems. Unlisted equity securities for which market quotations are available are valued at the last sale price on valuation date, or if no sale occurs, at the last bid price. Investments in investment companies (other than those that are exchange traded) are valued at the net asset value per share on the valuation date. Short-term debt obligations maturing in sixty days or less are valued at amortized cost, which approximates market value. Securities for which quotations are not readily available or are deemed not to reflect market value by the Investment Adviser are valued at fair value using methods approved by the Trust’s Board of Trustees.
B. Security Transactions and Investment Income — Security transactions are reflected as of the trade date. Realized gains and losses on sales of portfolio securities are calculated using the identified cost basis. Dividend income is recorded on the ex-dividend date, net of foreign withholding taxes, if any, which are reduced by any amounts reclaimable by the Fund, where applicable. Interest income is recorded on the basis of interest accrued, premium amortized and discount accreted.
C. Federal Taxes — It is the Fund’s policy to comply with the requirements of the Internal Revenue Code (the “Code”) applicable to regulated investment companies and to distribute each year substantially all of its investment company taxable income and capital gains to its shareholders. Accordingly, no federal tax provisions are required. Dividends and distributions to shareholders are recorded on the ex-dividend date. Income distributions, if any, are declared and paid quarterly. Capital gains distributions, if any, are declared and paid annually.
| 2. SIGNIFICANT ACCOUNTING POLICIES (continued) |
REIT to distribute at least 95% of its taxable income to investors. In many cases, however, because of “non-cash” expenses such as property depreciation, a REIT’s cash flow will exceed its taxable income. The REIT may distribute this excess cash to offer a more competitive yield. This portion of the distribution is deemed a return of capital and is generally not taxable to shareholders.
D. Expenses — Expenses incurred by the Trust that do not specifically relate to an individual Fund of the Trust are allocated to the Fund on a straight-line and/or pro rata basis depending upon the nature of the expense.
E. Foreign Currency Translations — The books and records of the Fund are maintained in U.S. dollars. Amounts denominated in foreign currencies are translated into U.S. dollars on the following basis: (i) investment valuations, foreign currency and other assets and liabilities initially expressed in foreign currencies are converted each business day into U.S. dollars based upon current exchange rates; and (ii) purchases and sales of foreign investments, income and expenses are converted into U.S. dollars based upon currency exchange rates prevailing on the respective dates of such transactions.
F. Segregation Transactions — As set forth in the prospectus, the Fund may enter into derivative transactions to seek to increase total return. Forward foreign currency exchange contracts, futures contracts, swap contracts, written options, mortgage dollar rolls, when-issued securities and forward commitments represent examples of such transactions. As a result of entering into these transactions, the Fund is required to segregate or physically move liquid assets, on the books of their custodian or to respective counterparty, with a current value equal to or greater than the market value of the corresponding transactions.
G. Forward Sales Contracts — The Fund may enter into forward security sales of mortgage-backed securities in which the Fund sells securities in the current month for delivery of securities defined by pool stipulated characteristics on a specified future date. The value of the contract is recorded as an asset and a liability on the Fund’s records with the difference between its market value and expected cash proceeds recorded as an unrealized gain or loss. Gains or losses are realized upon delivery of the security sold.
H. Repurchase Agreements — Repurchase agreements involve the purchase of securities subject to the seller’s agreement to repurchase them at a mutually agreed upon date and price. During the term of a repurchase agreement, the value of the underlying securities held as collateral on behalf of the Fund, including accrued interest, is required to exceed the value of the repurchase agreement, including accrued interest. If the seller defaults or becomes insolvent, realization of the collateral by the Fund may be delayed or limited and there may be a decline in the value of the collateral during the period while the Fund seeks to assert its rights. The underlying securities for all repurchase agreements are held in safekeeping at the Fund’s custodian or designated subcustodians under triparty repurchase agreements.
Notes to Financial Statements (continued)
| 2. SIGNIFICANT ACCOUNTING POLICIES (continued) |
I. Forward Foreign Currency Exchange Contracts — The Fund may enter into forward foreign currency exchange contracts for the purchase or sale of a specific foreign currency at a fixed price on a future date as a hedge or cross-hedge against either specific transactions or portfolio positions. The Fund may also purchase and sell forward contracts to seek to increase total return. All commitments are “marked-to-market” daily at the applicable translation rates and any resulting unrealized gains or losses are recorded in the Fund’s financial statements. The Fund records realized gains or losses at the time a forward contract is offset by entry into a closing transaction or extinguished by delivery of the currency. Risks may arise upon entering into these contracts from the potential inability of counterparties to meet the terms of their contracts and from unanticipated movements in the value of a foreign currency relative to the U.S. dollar.
J. Futures Contracts — The Fund may enter into futures transactions to hedge against changes in interest rates, securities currency exchange rates or to seek to increase total return. Futures contracts are valued at the last settlement price at the end of each day on the board of trade or exchange upon which they are traded. Upon entering into a futures contract, the Fund is required to deposit with a broker or the Fund’s custodian bank on behalf of the broker an amount of cash or securities equal to the minimum “initial margin” requirement of the associated futures exchange. Subsequent payments for futures contracts (“variation margin”) are paid or received by the Fund, dependent on the fluctuations in the value of the contracts, and are recorded for financial reporting purposes as unrealized gains or losses. When contracts are closed, the Fund realizes a gain or loss which is reported in the Statement of Operations.
K. Swap Contracts — The Fund may enter into swap transactions for hedging purposes or to seek to increase total return. Risks may arise as a result of the failure of the counterparty to the swap contract to comply with the terms of the swap contract. The loss incurred by the failure of a counterparty is generally limited to the net interest payment to be received by the Fund, and/or the termination value at the end of the contract. Therefore, the Fund considers the creditworthiness of each counterparty to a swap contract in evaluating potential credit risk. Additionally, risks may arise from unanticipated movements in interest rates or in the value of the underlying reference asset or index.
| 2. SIGNIFICANT ACCOUNTING POLICIES (continued) |
event occurs, the maximum payout amount for a sale contract is limited to the notional amount of the swap contract (“maximum payout amount”).
L. Mortgage Dollar Rolls — The Fund may enter into mortgage “dollar rolls” in which the Fund sells securities in the current month for delivery and simultaneously contract with the same counterparty to repurchase similar (same type, coupon and maturity) but not identical securities on a specified future date. For financial reporting and tax reporting purposes, the Fund treats mortgage dollar rolls as two separate transactions; one involving the purchase of a security and a separate transaction involving a sale.
| 3. AGREEMENTS |
GSAM, an affiliate of Goldman Sachs, serves as investment adviser pursuant to an Investment Management Agreement (the “Agreement”) with the Trust on behalf of the Fund. Under the Agreement, GSAM manages the Fund, subject to the general supervision of the Trust’s Board of Trustees.
| Average Daily Net Assets | Annual Rate | |||
| Up to $1 billion | 0.65 | % | ||
| Next $1 billion | 0.59 | |||
| Over $2 billion | 0.56 | |||
GSAM has voluntarily agreed to limit certain “Other Expenses” of the Fund (excluding Management fees, Distribution and Service fees, Transfer Agency fees and expenses, Service Share fees, taxes, interest, brokerage fees and litigation, indemnification, shareholder meeting and other extraordinary expenses exclusive of any expense offset arrangements) to the extent such expenses exceed, on an annual basis, 0.064% of the average daily net assets of the Fund. Such expense reimbursements, if any, are computed daily and paid monthly. In addition, the Fund is not obligated to reimburse GSAM for prior fiscal year expense reimbursements, if any.
Notes to Financial Statements (continued)
| 3. AGREEMENTS (continued) |
For the six months ended February 28, 2006, GSAM reimbursed approximately $96,900. In addition, the Fund has entered into certain offset arrangements with the custodian resulting in a reduction in the Fund’s expenses. For the six months ended February 28, 2006, custody fees were reduced by approximately $3,400.
| 4. PORTFOLIO SECURITIES TRANSACTIONS |
The cost of purchases and proceeds from sales and maturities of long-term securities for the six months ended February 28, 2006, were $211,854,318 and $220,881,236, respectively. Included in these amounts are the cost of purchases and proceeds from sales and maturities of U.S. Government and agency obligations in the amounts of $165,562,718 and $166,400,171, respectively. For the six months ended February 28, 2006, Goldman Sachs earned approximately $11,600 of brokerage commissions from portfolio transactions, including futures transactions, executed on behalf of the Fund.
| 5. SECURITIES LENDING |
Pursuant to exemptive relief granted by the SEC and the terms and conditions contained therein, the Fund may lend its securities through a securities lending agent, Boston Global Advisers (“BGA”), a wholly-owned subsidiary of Goldman Sachs, to certain qualified borrowers including Goldman Sachs and affiliates. In accordance with the Fund’s securities lending procedures, the loans are collateralized at all times with cash and/or securities with a market value at least equal to the securities on loan. The market value of the loaned securities is determined at the close of business of the Fund, at their last sale price or official closing price on the principal exchange or system on which they are traded, and any additional required collateral is delivered to the Fund on the next business day. As with other extensions of credit, the Fund bears the risk of delay on recovery or loss of rights in the collateral should the borrower of the securities fail financially.
| 5. SECURITIES LENDING (continued) |
with securities lending transactions in the Enhanced Portfolio of Boston Global Investment Trust, a Delaware statutory trust. The Enhanced Portfolio is exempt from registration under Section 3(c)(7) of the Act and is managed by GSAM, for which GSAM receives an investment advisory fee of up to 0.10% of the average daily net assets of the Enhanced Portfolio. The Enhanced Portfolio invests in high quality money market instruments. The Fund bears the risk of incurring a loss from the investment of cash collateral due to either credit or market factors.
| 6. LINE OF CREDIT FACILITY |
The Fund participates in a $350,000,000 committed, unsecured revolving line of credit facility together with other registered investment companies having management or investment advisory agreements with GSAM. Under the most restrictive arrangement, the Fund must own securities having a market value in excess of 300% of the Fund’s total bank borrowings. This facility is to be used solely for temporary or emergency purposes. The interest rate on borrowings is based on the federal funds rate. This committed facility also requires a fee to be paid by the Fund based on the amount of the commitment that has not been utilized. During the six months ended February 28, 2006, the Fund did not have any borrowings under this facility.
| 7. TAX INFORMATION |
As of the Fund’s most recent fiscal year end, August 31, 2005, the Fund’s capital loss carryforward and certain timing differences on a tax basis were as follows.
| Capital loss carryforward — Expiring August 31, 2011 | $(1,237,356 | ) | ||
| Timing differences (deferred straddle losses and swap receivable) | (522,256 | ) | ||
At February 28, 2006, the Fund’s aggregate security unrealized gains and losses based on cost for U.S. federal income tax purposes were as follows:
| Tax Cost | $ | 194,821,093 | ||
| Gross unrealized gain | 23,943,028 | |||
| Gross unrealized loss | (2,006,408 | ) | ||
Net unrealized security gain | $ | 21,936,620 | ||
The difference between book-basis and tax-basis unrealized gains (losses) is attributable primarily to wash sales, net marked-to-market gains (losses) on Section 1256 futures and foreign currency contracts recognized for tax purposes and differing treatment of amortization of market premium, and differences related to the tax treatment of partnership investments.
Notes to Financial Statements (continued)
| 8. OTHER MATTERS |
Legal Proceedings — Purported class and derivative action lawsuits were filed in April and May 2004 in the United States District Court for the Southern District of New York against Goldman Sachs Group, Inc. (“GSG”), GSAM and certain related parties, including certain Goldman Sachs Funds including this Fund, and the Trustees and Officers of the Trust. In June 2004, these lawsuits were consolidated into one action and in November 2004 a consolidated and amended complaint was filed against GSG, GSAM, Goldman Sachs Asset Management International (“GSAMI”), Goldman Sachs and certain related parties including certain Goldman Sachs Funds including this Fund and the Trustees and Officers of the Trust. This Fund, along with certain other investment portfolios of the Trust, were named as nominal defendants in the amended complaint. Plaintiffs filed a second amended consolidated complaint on April 15, 2005. The second amended consolidated complaint alleges violations of the Act and the Investment Advisers Act of 1940. The second complaint also asserts claims involving common law breach of fiduciary duty and unjust enrichment. The complaint alleges, among other things, that between April 2, 1999 and January 9, 2004 (the “Class Period”), GSAM and other defendants made improper and excessive brokerage commission and other payments to brokers that sold shares of the Goldman Sachs Funds and omitted statements of fact in registration statements and reports filed pursuant to the Act which were necessary to prevent such registration statements and reports from being materially false and misleading. The complaint further alleges that the Goldman Sachs Funds paid excessive and improper advisory fees to Goldman Sachs. The complaint also alleges that GSAM and GSAMI used 12b-1 fees for improper purposes and made improper use of soft dollars. The complaint further alleges that the Trust’s Officers and Trustees breached their fiduciary duties in connection with the foregoing. On January 13, 2006, all claims against the defendants were dismissed by the U.S. District Court. On February 22, 2006 the plaintiffs appealed this decision.
Subsequent Event — Effective May 1, 2006, the Fund will change portfolio managers for the equity portion of the Fund. Additionally, effective May 1, 2006, the Investment Adviser has voluntarily agreed to waive a portion of its management fees equal to 0.10% of the Fund’s average daily net assets. As a result of the voluntary fee reduction commitment, the management fee will be reduced to 0.55% of the Fund’s average daily net assets. Prior to the fee reduction commitment, the management fee for the Fund as an annual percentage rate of average daily net assets was 0.65%.
| 9. SUMMARY OF SHARE TRANSACTIONS |
Share activity is as follows:
| For the Six Months Ended | For the Year Ended | |||||||||||||||
| February 28, 2006 | August 31, 2005 | |||||||||||||||
| Shares | Dollars | Shares | Dollars | |||||||||||||
Class A Shares | ||||||||||||||||
| Shares sold | 525,120 | $ | 10,459,179 | 2,138,228 | $ | 41,281,758 | ||||||||||
| Reinvestments of dividends and distributions | 96,372 | 1,909,347 | 182,039 | 3,493,184 | ||||||||||||
Shares converted from Class B(a) | 45,262 | 897,795 | 39,835 | 776,769 | ||||||||||||
| Shares repurchased | (1,435,242 | ) | (28,455,563 | ) | (1,619,164 | ) | (31,412,748 | ) | ||||||||
| (768,488 | ) | (15,189,242 | ) | 740,938 | 14,138,963 | |||||||||||
Class B Shares | ||||||||||||||||
| Shares sold | 54,026 | 1,066,352 | 216,624 | 4,147,362 | ||||||||||||
| Reinvestments of dividends and distributions | 8,357 | 164,515 | 17,477 | 332,843 | ||||||||||||
Shares converted to Class A(a) | (45,590 | ) | (897,795 | ) | (40,137 | ) | (776,769 | ) | ||||||||
| Shares repurchased | (228,026 | ) | (4,488,799 | ) | (399,435 | ) | (7,682,174 | ) | ||||||||
| (211,233 | ) | (4,155,727 | ) | (205,471 | ) | (3,978,738 | ) | |||||||||
Class C Shares | ||||||||||||||||
| Shares sold | 44,938 | 887,842 | 83,750 | 1,617,080 | ||||||||||||
| Reinvestments of dividends and distributions | 1,641 | 32,269 | 3,172 | 60,368 | ||||||||||||
| Shares repurchased | (46,578 | ) | (924,778 | ) | (92,601 | ) | (1,787,640 | ) | ||||||||
| 1 | (4,667 | ) | (5,679 | ) | (110,192 | ) | ||||||||||
Institutional Shares | ||||||||||||||||
| Shares sold | 2,488 | 49,550 | 4,061,025 | 80,122,432 | ||||||||||||
| Reinvestments of dividends and distributions | 1,003 | 20,107 | 25,451 | 498,321 | ||||||||||||
| Shares repurchased | (4,570 | ) | (92,031 | ) | (4,098,443 | ) | (80,152,626 | ) | ||||||||
| (1,079 | ) | (22,374 | ) | (11,967 | ) | 468,127 | ||||||||||
Service Shares | ||||||||||||||||
| Shares sold | — | — | 333 | 6,548 | ||||||||||||
| Reinvestments of dividends and distributions | — | 11 | 3 | 58 | ||||||||||||
| Shares repurchased | — | — | (334 | ) | (6,577 | ) | ||||||||||
| — | 11 | 2 | 29 | |||||||||||||
NET INCREASE (DECREASE) | (980,799 | ) | $ | (19,371,999 | ) | 517,823 | $ | 10,518,189 | ||||||||
| (a) | Class B Shares automatically convert to Class A Shares at the end of the calendar quarter that is eight years after the initial purchase date of either the Fund or another Goldman Sachs Fund. |
Financial Highlights
| Income (loss) from | Distributions | |||||||||||||||||||||||||||||||
| investment operations | to shareholders | |||||||||||||||||||||||||||||||
| Net asset | ||||||||||||||||||||||||||||||||
| value, | Net | Net realized | Total from | From net | From net | |||||||||||||||||||||||||||
| beginning | investment | and unrealized | investment | investment | realized | Total | ||||||||||||||||||||||||||
| Year - Share Class | of period | income(a) | gain (loss) | operations | income | gains | distributions | |||||||||||||||||||||||||
| FOR THE SIX MONTHS ENDED FEBRUARY 28, (Unaudited) | ||||||||||||||||||||||||||||||||
| 2006 - A | $ | 19.88 | $ | 0.19 | $ | 0.51 | $ | 0.70 | $ | (0.21 | ) | $ | — | $ | (0.21 | ) | ||||||||||||||||
| 2006 - B | 19.73 | 0.12 | 0.50 | 0.62 | (0.13 | ) | — | (0.13 | ) | |||||||||||||||||||||||
| 2006 - C | 19.71 | 0.12 | 0.50 | 0.62 | (0.13 | ) | — | (0.13 | ) | |||||||||||||||||||||||
| 2006 - Institutional | 20.12 | 0.24 | 0.51 | 0.75 | (0.24 | ) | — | (0.24 | ) | |||||||||||||||||||||||
| 2006 - Service | 19.89 | 0.16 | 0.51 | 0.67 | (0.19 | ) | — | (0.19 | ) | |||||||||||||||||||||||
| FOR THE YEARS ENDED AUGUST 31, | ||||||||||||||||||||||||||||||||
| 2005 - A | 18.63 | 0.36 | (e) | 1.26 | 1.62 | (0.37 | ) | — | (0.37 | ) | ||||||||||||||||||||||
| 2005 - B | 18.49 | 0.21 | (e) | 1.26 | 1.47 | (0.23 | ) | — | (0.23 | ) | ||||||||||||||||||||||
| 2005 - C | 18.47 | 0.21 | (e) | 1.26 | 1.47 | (0.23 | ) | — | (0.23 | ) | ||||||||||||||||||||||
| 2005 - Institutional | 18.66 | 0.47 | (e) | 1.44 | 1.91 | (0.45 | ) | — | (0.45 | ) | ||||||||||||||||||||||
| 2005 - Service | 18.67 | 0.33 | (e) | 1.27 | 1.60 | (0.38 | ) | — | (0.38 | ) | ||||||||||||||||||||||
| 2004 - A | 17.21 | 0.31 | 1.48 | 1.79 | (0.37 | ) | — | (0.37 | ) | |||||||||||||||||||||||
| 2004 - B | 17.08 | 0.17 | 1.47 | 1.64 | (0.23 | ) | — | (0.23 | ) | |||||||||||||||||||||||
| 2004 - C | 17.07 | 0.17 | 1.47 | 1.64 | (0.24 | ) | — | (0.24 | ) | |||||||||||||||||||||||
| 2004 - Institutional | 17.24 | 0.38 | 1.48 | 1.86 | (0.44 | ) | — | (0.44 | ) | |||||||||||||||||||||||
| 2004 - Service | 17.25 | 0.28 | 1.49 | 1.77 | (0.35 | ) | — | (0.35 | ) | |||||||||||||||||||||||
| 2003 - A | 16.28 | 0.40 | 0.96 | 1.36 | (0.43 | ) | — | (0.43 | ) | |||||||||||||||||||||||
| 2003 - B | 16.16 | 0.28 | 0.95 | 1.23 | (0.31 | ) | — | (0.31 | ) | |||||||||||||||||||||||
| 2003 - C | 16.15 | 0.28 | 0.94 | 1.22 | (0.30 | ) | — | (0.30 | ) | |||||||||||||||||||||||
| 2003 - Institutional | 16.31 | 0.47 | 0.95 | 1.42 | (0.49 | ) | — | (0.49 | ) | |||||||||||||||||||||||
| 2003 - Service | 16.30 | 0.39 | 0.97 | 1.36 | (0.41 | ) | — | (0.41 | ) | |||||||||||||||||||||||
| 2002 - A | 18.34 | 0.47 | (f) | (2.03 | ) (f) | (1.56 | ) | (0.50 | ) | — | (0.50 | ) | ||||||||||||||||||||
| 2002 - B | 18.21 | 0.33 | (f) | (2.01 | ) (f) | (1.68 | ) | (0.37 | ) | — | (0.37 | ) | ||||||||||||||||||||
| 2002 - C | 18.19 | 0.33 | (f) | (2.00 | ) (f) | (1.67 | ) | (0.37 | ) | — | (0.37 | ) | ||||||||||||||||||||
| 2002 - Institutional | 18.38 | 0.54 | (f) | (2.04 | ) (f) | (1.50 | ) | (0.57 | ) | — | (0.57 | ) | ||||||||||||||||||||
| 2002 - Service | 18.35 | 0.44 | (f) | (2.02 | ) (f) | (1.58 | ) | (0.47 | ) | — | (0.47 | ) | ||||||||||||||||||||
| 2001 - A | 21.42 | 0.54 | (2.62 | ) | (2.08 | ) | (0.74 | ) | (0.26 | ) | (1.00 | ) | ||||||||||||||||||||
| 2001 - B | 21.27 | 0.39 | (2.60 | ) | (2.21 | ) | (0.59 | ) | (0.26 | ) | (0.85 | ) | ||||||||||||||||||||
| 2001 - C | 21.25 | 0.39 | (2.60 | ) | (2.21 | ) | (0.59 | ) | (0.26 | ) | (0.85 | ) | ||||||||||||||||||||
| 2001 - Institutional | 21.46 | 0.62 | (2.62 | ) | (2.00 | ) | (0.82 | ) | (0.26 | ) | (1.08 | ) | ||||||||||||||||||||
| 2001 - Service | 21.41 | 0.55 | (2.65 | ) | (2.10 | ) | (0.70 | ) | (0.26 | ) | (0.96 | ) | ||||||||||||||||||||
| (a) | Calculated based on average shares outstanding methodology. |
| (b) | Assumes investment at the net asset value at the beginning of the period, reinvestment of all dividends and distributions, a complete redemption of the investment at the net asset value at the end of the period and no sales or redemption charges. Total return would be reduced if a sales or redemption charge were taken into account. Total returns for periods less than one full year are not annualized. Returns do not reflect the deduction of taxes that a shareholder would pay on Fund distributions or the redemption of Fund shares. |
| (c) | Includes the effect of mortgage dollar roll transactions. |
| (d) | Annualized. |
| (e) | Reflects income recognized from a special dividend which amounted to $0.04 per share and 0.20% of average net assets. |
| (f) | As required, effective September 1, 2001, the Portfolio has adopted the provisions of the AICPA Audit and Accounting Guide for Investment Companies and began amortizing premium and discount on all debt securities and reclassifying all paydown losses to income. The effect of this change for the year ended August 31, 2002 was to decrease net investment income per share by $0.02, increase net realized gains and losses per share by $0.02, and decrease the ratio of net investment income to average net assets by 0.14%. Per share ratios and supplemental data for periods prior to September 1, 2001 have not been restated to reflect this change in presentation. |
| (g) | The effects of rounding net asset value in connection with a significant transaction during the period resulted in an increase in total return and expense ratio of 0.88% and 0.06% respectively. |
30
| Ratios assuming no | ||||||||||||||||||||||||||||||||||
| expense reductions | ||||||||||||||||||||||||||||||||||
| Ratio of | Ratio of | |||||||||||||||||||||||||||||||||
| Net assets | Ratio of | net investment | Ratio of | net investment | ||||||||||||||||||||||||||||||
| Net asset | at end of | net expenses | income to | total expenses | income | Portfolio | ||||||||||||||||||||||||||||
| value, end | Total | period | to average | average | to average | to average | turnover | |||||||||||||||||||||||||||
| of period | return(b) | (in 000s) | net assets | net assets | net assets | net assets | rate(c) | |||||||||||||||||||||||||||
| $ | 20.37 | 3.53 | % | $ | 184,747 | 1.15 | %(d) | 1.95 | %(d) | 1.24 | %(d) | 1.86 | %(d) | 101 | % | |||||||||||||||||||
| 20.22 | 3.17 | 25,547 | 1.90 | (d) | 1.20 | (d) | 1.99 | (d) | 1.11 | (d) | 101 | |||||||||||||||||||||||
| 20.20 | 3.18 | 6,232 | 1.90 | (d) | 1.21 | (d) | 1.99 | (d) | 1.12 | (d) | 101 | |||||||||||||||||||||||
| 20.63 | 3.78 | 2,081 | 0.75 | (d) | 2.36 | (d) | 0.84 | (d) | 2.27 | (d) | 101 | |||||||||||||||||||||||
| 20.37 | 3.38 | 1 | 1.25 | (d) | 1.60 | (d) | 1.34 | (d) | 1.51 | (d) | 101 | |||||||||||||||||||||||
| 19.88 | 8.80 | 195,531 | 1.14 | 1.84 | (e) | 1.31 | 1.67 | (e) | 228 | |||||||||||||||||||||||||
| 19.73 | 8.00 | 29,093 | 1.89 | 1.10 | (e) | 2.06 | 0.93 | (e) | 228 | |||||||||||||||||||||||||
| 19.71 | 8.00 | 6,080 | 1.89 | 1.09 | (e) | 2.06 | 0.92 | (e) | 228 | |||||||||||||||||||||||||
| 20.12 | 10.36 | (g) | 2,052 | 0.80 | (g) | 2.14 | (e) | 0.93 | 2.01 | (e) | 228 | |||||||||||||||||||||||
| 19.89 | 8.66 | 1 | 1.24 | 1.68 | (e) | 1.41 | 1.51 | (e) | 228 | |||||||||||||||||||||||||
| 18.63 | 10.47 | 169,436 | 1.15 | 1.68 | 1.30 | 1.53 | 208 | |||||||||||||||||||||||||||
| 18.49 | 9.67 | 31,067 | 1.90 | 0.93 | 2.05 | 0.78 | 208 | |||||||||||||||||||||||||||
| 18.47 | 9.63 | 5,803 | 1.90 | 0.93 | 2.05 | 0.78 | 208 | |||||||||||||||||||||||||||
| 18.66 | 10.88 | 2,127 | 0.75 | 2.08 | 0.90 | 1.93 | 208 | |||||||||||||||||||||||||||
| 18.67 | 10.34 | 1 | 1.25 | 1.63 | 1.40 | 1.48 | 208 | |||||||||||||||||||||||||||
| 17.21 | 8.54 | 130,111 | 1.16 | 2.43 | 1.38 | 2.21 | 192 | |||||||||||||||||||||||||||
| 17.08 | 7.73 | 28,204 | 1.91 | 1.69 | 2.13 | 1.47 | 192 | |||||||||||||||||||||||||||
| 17.07 | 7.72 | 5,746 | 1.91 | 1.69 | 2.13 | 1.47 | 192 | |||||||||||||||||||||||||||
| 17.24 | 8.95 | 2,150 | 0.76 | 2.85 | 0.98 | 2.63 | 192 | |||||||||||||||||||||||||||
| 17.25 | 8.53 | 12 | 1.26 | 2.36 | 1.48 | 2.14 | 192 | |||||||||||||||||||||||||||
| 16.28 | (8.67 | ) | 100,541 | 1.16 | 2.61 | (f) | 1.38 | 2.39 | (f) | 169 | ||||||||||||||||||||||||
| 16.16 | (9.38 | ) | 23,871 | 1.91 | 1.86 | (f) | 2.13 | 1.64 | (f) | 169 | ||||||||||||||||||||||||
| 16.15 | (9.34 | ) | 5,377 | 1.91 | 1.86 | (f) | 2.13 | 1.64 | (f) | 169 | ||||||||||||||||||||||||
| 16.31 | (8.33 | ) | 2,157 | 0.76 | 3.01 | (f) | 0.98 | 2.79 | (f) | 169 | ||||||||||||||||||||||||
| 16.30 | (8.79 | ) | 10 | 1.26 | 2.49 | (f) | 1.48 | 2.27 | (f) | 169 | ||||||||||||||||||||||||
| 18.34 | (9.95 | ) | 109,350 | 1.15 | 2.78 | 1.34 | 2.59 | 187 | ||||||||||||||||||||||||||
| 18.21 | (10.62 | ) | 28,316 | 1.90 | 2.03 | 2.09 | 1.84 | 187 | ||||||||||||||||||||||||||
| 18.19 | (10.63 | ) | 7,113 | 1.90 | 2.03 | 2.09 | 1.84 | 187 | ||||||||||||||||||||||||||
| 18.38 | (9.56 | ) | 2,379 | 0.75 | 3.18 | 0.94 | 2.99 | 187 | ||||||||||||||||||||||||||
| 18.35 | (10.06 | ) | 16 | 1.25 | 2.84 | 1.44 | 2.65 | 187 | ||||||||||||||||||||||||||
Fund Expenses (Unaudited) — Six Month Period Ended February 28, 2006
| As a shareholder of Class A, Class B, Class C, Institutional or Service Shares of the Funds you incur two types of costs: (1) transaction costs, including sales charges (loads) on purchase payments (with respect to Class A Shares), contingent deferred sales charges (loads) on redemptions (with respect to Class B and Class C Shares), and redemption fees (with respect to Class A, Class B, Class C, Institutional and Service Shares, if any; and (2) ongoing costs, including management fees; distribution and service (12b-1) fees (with respect to Class A, Class B and Class C Shares); and other Fund expenses. This Example is intended to help you understand your ongoing costs (in dollars) of investing in Class A, Class B, Class C, Institutional and Service Shares of the Fund and to compare these costs with the ongoing costs of investing in other mutual funds. | |
| The Example is based on an investment of $1,000 invested at the beginning of the period and held for the entire period from September 1, 2005 through February 28, 2006. | |
| Actual Expenses — The first line under each share class in the table below provides information about actual account values and actual expenses. You may use the information in this line, together with the amount you invested, to estimate the expenses that you paid over the period. Simply divide your account value by $1,000 (for example, an $8,600 account value divided by $1,000=8.6), then multiply the result by the number in the first line under the heading entitled “Expenses Paid” to estimate the expenses you paid on your account during this period. | |
| Hypothetical Example for Comparison Purposes — The second line under each share class in the table below provides information about hypothetical account values and hypothetical expenses based on the Funds’ actual expense ratio and an assumed rate of return of 5% per year before expenses, which are not the Funds’ actual returns. The hypothetical account values and expenses may not be used to estimate the actual ending account balance or expenses you paid for the period. You may use this information to compare the ongoing costs of investing in the Funds and other funds. To do so, compare this 5% hypothetical example with the 5% hypothetical examples that appear in the shareholder reports of the other funds. | |
| Please note that the expenses shown in the table are meant to highlight your ongoing costs only and do not reflect any transactional costs, such as sales charges (loads), redemption fees or exchange fees. Therefore, the second line of the table is useful in comparing ongoing costs only, and will not help you determine the relative total costs of owning different funds. In addition, if these transactional costs were included, your costs would have been higher. |
| Expenses Paid for the | ||||||||||||
| Beginning Account Value | Ending Account Value | 6 months ended | ||||||||||
| Share Class | 9/1/05 | 2/28/06 | 2/28/06* | |||||||||
Class A | ||||||||||||
| Actual | $ | 1,000.00 | $ | 1,035.30 | $ | 5.81 | ||||||
| Hypothetical 5% return | 1,000.00 | 1,019.09 | + | 5.76 | ||||||||
Class B | ||||||||||||
| Actual | 1,000.00 | 1,031.70 | 9.58 | |||||||||
| Hypothetical 5% return | 1,000.00 | 1,015.37 | + | 9.50 | ||||||||
Class C | ||||||||||||
| Actual | 1,000.00 | 1,031.80 | 9.58 | |||||||||
| Hypothetical 5% return | 1,000.00 | 1,015.37 | + | 9.50 | ||||||||
Institutional | ||||||||||||
| Actual | 1,000.00 | 1,037.80 | 3.80 | |||||||||
| Hypothetical 5% return | 1,000.00 | 1,021.07 | + | 3.77 | ||||||||
Service | ||||||||||||
| Actual | 1,000.00 | 1,033.80 | 6.27 | |||||||||
| Hypothetical 5% return | 1,000.00 | 1,018.63 | + | 6.22 | ||||||||
| * | Expenses for each share class are calculated using the Fund’s annualized expense ratio for each class, which represents the ongoing expenses as a percentage of net assets for the six months ended February 28, 2006. Expenses are calculated by multiplying the annualized expense ratio by the average account value for the period; then multiplying the result by the number of days in the most recent fiscal half year; and then dividing that result by the number of days in the fiscal year. The annualized net expense ratios for the period were 1.15%, 1.90%, 1.90%, 0.75% and 1.24% for Class A, Class B, Class C, Institutional Class and Service Class, respectively. | |
| + | Hypothetical expenses are based on the Fund’s actual annualized expense ratios and an assumed rate of return of 5% per year before expenses. |
Goldman Sachs Funds

Goldman Sachs is a premier financial services firm, known since 1869 for creating thoughtful and customized investment solutions in complex global markets.
Today, The Investment Management Division of Goldman Sachs serves a diverse set of clients worldwide, including private institutions, public entities and individuals. With portfolio management teams located around the world — and $526.4 billion in assets under management as of December 31, 2005 — our investment professionals bring firsthand knowledge of local markets to every investment decision, making us one of the few truly global asset managers.
| GOLDMAN SACHS FUNDS |
In building a globally diversified portfolio, you can select from more than 50 Goldman Sachs Funds and gain access to investment opportunities across borders, investment styles, asset classes and security capitalizations.
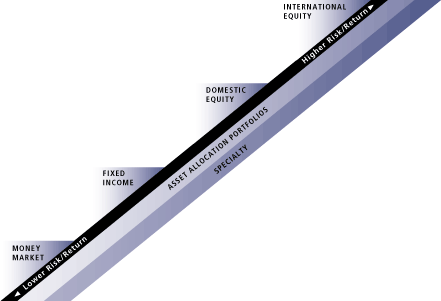
| International Equity Funds ▪ Asia Equity Fund2 ▪ Emerging Markets Equity Fund ▪ International Small Cap Fund2 ▪ Japanese Equity Fund ▪ European Equity Fund ▪ International Equity Fund ▪ Structured International Equity Fund2 | Domestic Equity Funds ▪ Small Cap Value Fund ▪ Structured Small Cap Equity Fund2 ▪ Small/ Mid Cap Growth Fund ▪ Growth Opportunities Fund ▪ Mid Cap Value Fund ▪ Concentrated Growth Fund ▪ Research Select FundSM ▪ Strategic Growth Fund ▪ Capital Growth Fund ▪ Large Cap Value Fund ▪ Growth and Income Fund ▪ Structured Large Cap Growth Fund2 ▪ Structured Large Cap Value Fund2 ▪ Structured U.S. Equity Fund2 Asset Allocation Funds ▪ Balanced Fund ▪ Asset Allocation Portfolios | Specialty Funds ▪ Tollkeeper FundSM ▪ Structured Tax-Managed Equity Fund2 ▪ U.S. Equity Dividend and Premium Fund ▪ Real Estate Securities Fund Fixed Income Funds ▪ Emerging Markets Debt Fund ▪ High Yield Fund ▪ High Yield Municipal Fund ▪ Global Income Fund ▪ Investment Grade Credit Fund ▪ Core Fixed Income Fund ▪ Government Income Fund ▪ U.S. Mortgages Fund ▪ Municipal Income Fund ▪ California Intermediate AMT-Free Municipal Fund ▪ New York Intermediate AMT-Free Municipal Fund ▪ Short Duration Tax-Free Fund ▪ Short Duration Government Fund ▪ Ultra-Short Duration Government Fund ▪ Enhanced Income Fund Money Market Funds1 |
| 1 | An investment in a money market fund is neither insured nor guaranteed by the Federal Deposit Insurance Corporation or any other government agency. Although the Funds seek to preserve the value of your investment at $1.00 per share, it is possible to lose money by investing in the Funds. |
| 2 | Effective December 30, 2005, the Asia Growth Fund was renamed the Asia Equity Fund and the International Growth Opportunities Fund was renamed the International Small Cap Fund. Also effective December 30, 2005, the CORESM International Equity, CORESM Small Cap Equity, CORESM Large Cap Growth, CORESM Large Cap Value and CORESM U.S. Equity Funds were renamed, respectively, the Structured International Equity, Structured Small Cap Equity, Structured Large Cap Growth, Structured Large Cap Value and Structured U.S. Equity Funds. Effective January 6, 2006, the CORESM Tax-Managed Equity Fund was renamed the Structured Tax-Managed Equity Fund. |
| The Goldman Sachs Research Select FundSM, Tollkeeper FundSM and CORESM are registered service marks of Goldman, Sachs & Co. |
| TRUSTEES Ashok N. Bakhru, Chairman John P. Coblentz, Jr. Patrick T. Harker Mary Patterson McPherson Alan A. Shuch Wilma J. Smelcer Richard P. Strubel Kaysie P. Uniacke | OFFICERS Kaysie P. Uniacke, President James A. Fitzpatrick, Vice President James A. McNamara, Vice President John M. Perlowski, Treasurer Howard B. Surloff, Secretary |
| GOLDMAN, SACHS & CO. Distributor and Transfer Agent | GOLDMAN SACHS ASSET MANAGEMENT, L.P. Investment Adviser |
Visit our Web site at www.gs.com/funds to obtain the most recent month-end returns
The reports concerning the Fund included in this shareholder report may contain certain forward-looking statements about the factors that may affect the performance of the Fund in the future. These statements are based on Fund management’s predictions and expectations concerning certain future events and their expected impact on the Fund, such as performance of the economy as a whole and of specific industry sectors, changes in the levels of interest rates, the impact of developing world events, and other factors that may influence the future performance of the Fund. Management believes these forward-looking statements to be reasonable, although they are inherently uncertain and difficult to predict. Actual events may cause adjustments in portfolio management strategies from those currently expected to be employed.
A description of the policies and procedures that the Fund uses to determine how to vote proxies relating to portfolio securities and information regarding how a Fund voted proxies relating to portfolio securities during the most recent 12-month period ended June 30 is available (I) without charge, upon request by calling 1-800-526-7384 (for Retail Shareholders) or 1-800-621-2550 (for Institutional Shareholders); and (II) on the Securities and Exchange Commission Web site at http://www.sec.gov.
The Fund files its complete schedule of portfolio holdings with the Securities and Exchange Commission (“SEC”) for the first and third quarters of each fiscal year on Form N-Q. Beginning the fiscal quarter ended November 30, 2004 and every first and third fiscal quarter thereafter, the Fund’s Form N-Q will become available on the SEC’s website at http://www.sec.gov within 60 days after the Fund’s first and third fiscal quarters. When available, the Fund’s Forms N-Q may be reviewed and copied at the SEC’s Public Reference Room in Washington, D.C. and information on the operation of the Public Reference Room may also be obtained by calling 1-800-SEC-0330. When available, Form N-Q may be obtained upon request and without charge by calling 1-800-526-7384 (for Retail Shareholders) or 1-800-621-2550 (for Institutional Shareholders).
Holdings and allocations may not be representative of current or future investments. Holdings and allocations may not include the Fund’s entire investment portfolio, which may change at any time. Fund holdings should not be relied on in making investment decisions and should not be construed as research or investment advice regarding particular securities.
This material is not authorized for distribution to prospective investors unless preceded or accompanied by a current Prospectus. Please consider a Fund’s objectives, risks, and charges and expenses, and read the Prospectus carefully before investing. The Prospectus contains this and other information about the Funds.
| Copyright 2006 Goldman, Sachs & Co. All rights reserved. | 06-459 / BALSAR / 10.5K / 04-06 |
| ITEM 2. | CODE OF ETHICS. Not applicable to the Semi–Annual Report for the period ended February 28, 2006 | ||
| ITEM 3. | AUDIT COMMITTEE FINANCIAL EXPERT. Not applicable to the Semi–Annual Report for the period ended February 28, 2006 |
| ITEM 4. | PRINCIPAL ACCOUNTANT FEES AND SERVICES. Not applicable to the Semi–Annual Report for the period ended February 28, 2006 | |
| ITEM 5. | AUDIT COMMITTEE OF LISTED REGISTRANTS. | |
| Not applicable. |
| ITEM 6. | SCHEDULE OF INVESTMENTS. | |
| Schedule of Investments is included as part of the Report to Shareholders filed under Item 1. |
| ITEM 7. | DISCLOSURE OF PROXY VOTING POLICIES AND PROCEDURES FOR CLOSED-END MANAGEMENT INVESTMENT COMPANIES. | |
| Not applicable. |
| ITEM 8. | PORTFOLIO MANAGERS OF CLOSED END MANAGEMENT INVESTMENT COMPANIES. | |
| Not applicable. |
| ITEM 9. | PURCHASES OF EQUITY SECURITIES BY CLOSED-END MANAGEMENT INVESTMENT COMPANY AND AFFILIATED PURCHASERS. | |
| Not applicable. |
| ITEM 10. | SUBMISSION OF MATTERS TO A VOTE OF SECURITY HOLDERS. There have been no material changes to the procedures by which shareholders may recommend nominees to the registrant’s board of trustees. | |
| ITEM 11. | CONTROLS AND PROCEDURES. | |
| (a) | The registrant’s principal executive and principal financial officers or persons performing similar functions have concluded that the registrant’s disclosure controls and procedures (as defined in Rule 30a-3(c) under the Investment Company Act of 1940, as amended (the “1940 Act”)) are effective as of a date within 90 days of the filing of this report that includes the disclosure required by this paragraph, based on the evaluation of these controls and procedures required by Rule 30a-3(b) under the 1940 Act and 15d-15(b) under the Securities Exchange Act of 1934, as amended. | ||
| (b) | There were no changes in the registrant’s internal control over financial reporting (as defined in Rule 30a-3(d) under the 1940 Act) that occurred during the registrant’s second fiscal quarter of the period covered by this report that has materially affected, or is reasonably likely to materially affect the registrant’s internal control over financial reporting. | ||
| ITEM 12. | EXHIBITS. |
| (a)(1) | Goldman Sachs Trust’s Code of Ethics for Principal Executive and Senior Financial Officers is incorporated by reference to Exhibit 11(a)(1) of the registrant’s Form N-CSR filed on March 8, 2004 for its Real Estate Securities Fund (Accession Number 0000950123-04-0002984). | ||
| (a)(2) | Exhibit 99.CERT | Certifications pursuant to Section 302 of the Sarbanes-Oxley Act of 2002 filed herewith. | ||
| (b) | Exhibit 99.906CERT | Certifications pursuant to Section 906 of the Sarbanes-Oxley Act of 2002 filed herewith. |
SIGNATURES
| Pursuant to the requirements of the Securities Exchange Act of 1934 and the Investment Company Act of 1940, the registrant has duly caused this report to be signed on its behalf by the undersigned, thereunto duly authorized. |
| Goldman Sachs Trust | ||||||
| By: | /s/ Kaysie P. Uniacke | |||||
| Kaysie P. Uniacke | ||||||
| President/Principal Executive Officer | ||||||
| Goldman Sachs Trust | ||||||
| Date: | May 5, 2006 | |||||
| Pursuant to the requirements of the Securities Exchange Act of 1934 and the Investment Company Act of 1940, this report has been signed below by the following persons on behalf of the registrant and in the capacities and on the dates indicated. |
| By: | /s/ Kaysie P. Uniacke | |||||
| Kaysie P. Uniacke | ||||||
| President/Principal Executive Officer | ||||||
| Goldman Sachs Trust | ||||||
| Date: | May 5, 2006 | |||||
| By: | /s/ John M. Perlowski | |||||
| John M. Perlowski | ||||||
| Treasurer/Principal Financial Officer | ||||||
| Goldman Sachs Trust | ||||||
| Date: | May 5, 2006 |