UNITED STATES
SECURITIES AND EXCHANGE COMMISSION
Washington, D.C. 20549
FORM N-CSR
CERTIFIED SHAREHOLDER REPORT OF REGISTERED MANAGEMENT INVESTMENT
COMPANIES
Investment Company Act file number 811-5349
Goldman Sachs Trust
(Exact name of registrant as specified in charter)
71 South Wacker Drive, Suite 500, Chicago, Illinois 60606
(Address of principal executive offices) (Zip code)
| Peter V. Bonanno | Copies to: | |
| Goldman, Sachs & Co. | Jeffrey A. Dalke, Esq. | |
| One New York Plaza | Drinker Biddle & Reath LLP | |
| New York, New York 10004 | One Logan Square | |
| 18th and Cherry Streets | ||
| Philadelphia, PA 19103 | ||
| (Name and address of agents for service) | ||
Registrant’s telephone number, including area code: (312) 655-4400
Date of fiscal year end: August 31
Date of reporting period: February 28, 2006
| ITEM 1. | REPORTS TO STOCKHOLDERS. | |
| The Semi–Annual Report to Stockholders is filed herewith. |
| STRUCTURED EQUITY FUNDS | Semiannual Report February 28, 2006 |
 | Long-term capital growth potential through diversified portfolios of equity investments using a proprietary quantitative approach to stock selection and portfolio construction. | ||
 | Asset Management |
Goldman Sachs Structured Equity Funds
| n GOLDMAN SACHS STRUCTURED LARGE CAP VALUE FUND | |
| n GOLDMAN SACHS STRUCTURED U.S. EQUITY FUND | |
| n GOLDMAN SACHS STRUCTURED LARGE CAP GROWTH FUND | |
| n GOLDMAN SACHS STRUCTURED SMALL CAP EQUITY FUND | |
| n GOLDMAN SACHS STRUCTURED INTERNATIONAL EQUITY FUND | |
| The Structured Large Cap Value Fund invests in a broadly diversified portfolio of large-capitalization U.S. equity investments and is subject to market risk so that the value of the securities in which it invests may go up or down in response to the prospects of individual companies, particular industry sectors and/or general economic conditions. |
The Structured U.S. Equity Fund invests in a broadly diversified portfolio of U.S. equity investments and is subject to market risk so that the value of the securities in which it invests may go up or down in response to the prospects of individual companies, particular industry sectors and/or general economic conditions.
The Structured Large Cap Growth Fund invests in a broadly diversified portfolio of large-capitalization U.S. equity investments and is subject to market risk so that the value of the securities in which it invests may go up or down in response to the prospects of individual companies, particular industry sectors and/or general economic conditions.
The Structured Small Cap Equity Fund invests in a broadly diversified portfolio of small-capitalization U.S. equity investments and is subject to market risk so that the value of the securities in which it invests may go up or down in response to the prospects of individual companies, particular industry sectors and/or general economic conditions. Stocks of smaller companies are often more volatile and less liquid and present greater risks than stocks of larger companies. At times, the Fund may be unable to sell certain of its portfolio securities without a substantial drop in price, if at all.
The Structured International Equity Fund invests in a broadly diversified portfolio of equity investments in companies that are organized outside the United States or whose securities are principally traded outside the United States and is subject to market risk so that the value of the securities in which it invests may go up or down in response to the prospects of individual companies, particular industry sectors and/or general economic conditions. Foreign and emerging market securities may be more volatile than investments in U.S. securities and will be subject to the risks of currency fluctuations and sudden economic or political developments. At times, the Fund may be unable to sell certain of its portfolio securities without a substantial drop in price, if at all.
Effective December 30, 2005, the CORESM Large Cap Value, CORESM U.S. Equity, CORESM Large Cap Growth, CORESM Small Cap Equity and CORESM International Equity Funds were renamed, respectively, the Structured Large Cap Value, Structured U.S. Equity, Structured Large Cap Growth, Structured Small Cap Equity and Structured International Equity Funds.
NOT FDIC-INSURED | May Lose Value | No Bank Guarantee | ||
Domestic Structured Investment Process
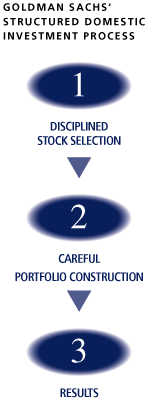

| n Comprehensive — We calculate expected excess returns for more than 3,000 stocks on a daily basis. n Rigorous — We evaluate stocks based on fundamental investment criteria that have outperformed historically. | n Objective — Our stock selection process is free from the emotion that can lead to biased investment decisions. |

| n Our computer optimization process allocates risk to our best investment ideas and constructs funds that neutralize systematic risks and deliver better returns. | n We use a unique, proprietary risk model that is more precise, more focused and faster to respond because it identifies , tracks and manages risk specific to our process, using daily data. |

| Fully invested, well-diversified portfolio that: n Maintains style, sector, risk and capitalization characteristics similar to the benchmark. n Offers broad access to a clearly defined equity universe. | n Aims to generate excess returns that are positive, consistent and repeatable. |
Structured Large Cap Value Fund
Dear Shareholder,
This report provides an overview on the performance of the Goldman Sachs Structured Large Cap Value Fund during the six-month reporting period that ended February 28, 2006.
Performance Review
| Over the six-month period that ended February 28, 2006, the Fund’s Class A, B, C, Institutional and Service Shares generated cumulative total returns, without sales charges, of 8.74%, 8.30%, 8.39%, 8.94%, and 8.63%, respectively. These returns compare to the 7.33% cumulative total return of the Fund’s benchmark, the Russell 1000 Value Index (with dividends reinvested), over the same time period. | |
| Returns to the Structured investment themes were positive overall during the reporting period. Momentum was the biggest positive contributor to relative returns as companies with strong momentum characteristics outperformed their industry counterparts. Management Impact and Earnings Quality also enhanced results, as did Valuation and Analyst Sentiment, albeit less significantly. On the downside, Profitability was the only theme to detract from excess returns for the period. |
Portfolio Positioning
| In managing the Structured products, we take minimal size and sector bets. We strive to add value versus each Fund’s respective index through individual stock selection. Our quantitative process seeks out stocks with good momentum that also appear to be good values. We prefer stocks about which fundamental research analysts are becoming more positive and companies with strong profit margins and sustainable earnings that use their capital to enhance shareholder value. Over the long term, these factors have contributed positively to the Fund’s returns and they typically work well at various times and under different market environments. |
Portfolio Highlights
| Stock selection was positive overall among sectors during the reporting period. The Fund’s holdings in the Industrials and Energy sectors outperformed their peers in the benchmark the most. In contrast, holdings in the Telecommunications Services and Health Care sectors lagged their peers in the benchmark the most. In terms of individual stocks, overweights in Archer-Daniels-Midland Co. and Merrill Lynch & Co., Inc. contributed the most to relative returns. In contrast, overweights in Tyson Foods, Inc. and Energizer Holdings, Inc. detracted the most for the period. | |
| We thank you for your investment and look forward to your continued confidence. | |
| Goldman Sachs Quantitative Equity Investment Team | |
| New York, March 17, 2006 |
Structured Large Cap Value Fund
| PERFORMANCE REVIEW |
| September 1, 2005–February 28, 2006 | Fund Total Return (based on NAV)1 | Russell 1000 Value Index2 | ||||||||
| Class A | 8.74 | % | 7.33 | % | ||||||
| Class B | 8.30 | 7.33 | ||||||||
| Class C | 8.39 | 7.33 | ||||||||
| Institutional | 8.94 | 7.33 | ||||||||
| Service | 8.63 | 7.33 | ||||||||
| 1 | The net asset value (NAV) represents the net assets of the class of the Fund (ex-dividend) divided by the total number of shares of the class outstanding. The Fund’s performance reflects the reinvestment of dividends and other distributions. The Fund’s performance does not reflect the deduction of any applicable sales charges. |
| 2 | The Russell 1000 Value Index is an unmanaged market capitalization weighted index of the 1000 largest U.S. companies with lower price-to-book ratios and lower forecasted growth values. The Index is unmanaged and the figures for the Index do not include any deduction for fees, expenses or taxes. It is not possible to invest directly in an unmanaged index. |
| STANDARDIZED TOTAL RETURNS3 |
| For the period ended 12/31/05 | One Year | Five Years | Since Inception | Inception Date | ||||||||||||
| Class A | 2.25 | % | 4.04 | % | 4.74 | % | 12/31/98 | |||||||||
| Class B | 2.34 | 4.10 | 4.79 | 12/31/98 | ||||||||||||
| Class C | 6.44 | 4.44 | 4.80 | 12/31/98 | ||||||||||||
| Institutional | 8.71 | 5.65 | 5.99 | 12/31/98 | ||||||||||||
| Service | 8.14 | 5.13 | 5.49 | 12/31/98 | ||||||||||||
| 3 | The Standardized Total Returns are average annual total returns or cumulative total returns (only if the performance period is one year or less) as of the most recent calendar quarter-end. They assume reinvestment of all distributions at NAV. These returns reflect a maximum initial sales charge of 5.5% for Class A Shares, the assumed contingent deferred sales charge for Class B Shares (5% maximum declining to 0% after six years) and the assumed contingent deferred sales charge for Class C Shares (1% if redeemed within 12 months of purchase). Because Institutional and Service Shares do not involve a sales charge, such a charge is not applied to their Standardized Total Returns. |
| The returns represent past performance. Past performance does not guarantee future results. The Fund’s investment return and principal value will fluctuate so that an investor’s shares, when redeemed, may be worth more or less than their original cost. Current performance may be lower or higher than the performance quoted above. Please visit our Web site at: www.gs.com/funds to obtain the most recent month-end returns. Performance reflects expense limitations in effect. In their absence, performance would be reduced. Returns do not reflect the deduction of taxes that a shareholder would pay on Fund distributions or the redemption of Fund shares. |
| TOP 10 HOLDINGS AS OF 2/28/064 |
| Holding | % of Net Assets | Line of Business | ||||||
| Bank of America Corp. | 4.5 | % | Banks | |||||
| Exxon Mobil Corp. | 4.1 | Oil & Gas | ||||||
| J.P. Morgan Chase & Co. | 3.7 | Diversified Financials | ||||||
| Hewlett-Packard Co. | 2.9 | Computers & Peripherals | ||||||
| Merrill Lynch & Co., Inc. | 2.6 | Diversified Financials | ||||||
| Time Warner, Inc. | 2.5 | Media | ||||||
| Citigroup, Inc. | 2.3 | Diversified Financials | ||||||
| Devon Energy Corp. | 1.9 | Oil & Gas | ||||||
| Anadarko Petroleum Corp. | 1.9 | Oil & Gas | ||||||
| Archer-Daniels-Midland Co. | 1.9 | Food Products | ||||||
| 4 | The top 10 holdings may not be representative of the Fund’s future investments. |
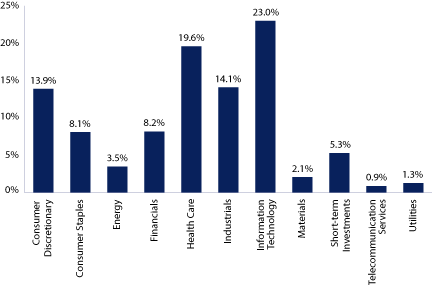
| SECTOR ALLOCATION AS OF 2/28/065 |
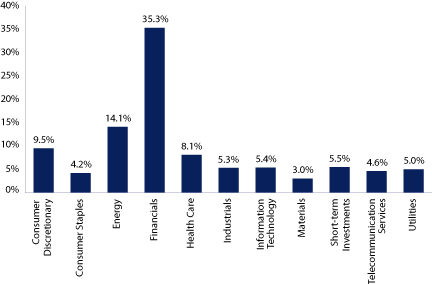
| 5 | The percentage shown for each investment category reflects the value of investments in that category as a percentage of market value. Short-term investments include repurchase agreements and securities lending collateral. |
Structured U.S. Equity Fund
Dear Shareholder,
This report provides an overview on the performance of the Goldman Sachs Structured U.S. Equity Fund during the six-month reporting period that ended February 28, 2006.
Performance Review
| Over the six-month period that ended February 28, 2006, the Fund’s Class A, B, C, Institutional and Service Shares generated cumulative total returns, without sales charges, of 7.31%, 6.90%, 6.94%, 7.53%, and 7.24%, respectively. These returns compare to the 5.93% cumulative total return of the Fund’s benchmark, the S&P 500 Index (with dividends reinvested), over the same time period. | |
| The returns to the Structured investment themes were positive overall during the reporting period. Momentum was the largest positive contributor to relative returns as companies with strong momentum characteristics outperformed their industry counterparts. Other themes that enhanced results were Earnings Quality, Management Impact, Valuation and Analyst Sentiment. On the downside, Profitability was the only theme to detract from excess returns for the period. |
Portfolio Positioning
| In managing the Structured products, we take minimal size and sector bets. We strive to add value versus each Fund’s respective index through individual stock selection. Our quantitative process seeks out stocks with good momentum that also appear to be good values. We prefer stocks about which fundamental research analysts are becoming more positive and companies with strong profit margins and sustainable earnings that use their capital to enhance shareholder value. Over the long term, these factors have contributed positively to the Fund’s returns and they typically work well at various times and under different market environments. |
Portfolio Highlights
| Stock selection was positive overall among sectors, most notably in the Information Technology and Financials sectors. On the downside, the Fund’s holdings in the Telecommunications Services sector lagged their peers in the benchmark the most. In terms of individual stocks, overweights in Archer-Daniels-Midland Co. and Merrill Lynch & Co., Inc. contributed the most to excess returns, while overweights in Intel Corp. and Tyson Foods, Inc. detracted the most from performance during the period. | |
| We thank you for your investment and look forward to your continued confidence. | |
| Goldman Sachs Quantitative Equity Investment Team | |
| New York, March 17, 2006 |
Structured U.S. Equity Fund

| PERFORMANCE REVIEW |
| September 1, 2005–February 28, 2006 | Fund Total Return (based on NAV)1 | S&P 500 Index2 | ||||||||
| Class A | 7.31 | % | 5.93 | % | ||||||
| Class B | 6.90 | 5.93 | ||||||||
| Class C | 6.94 | 5.93 | ||||||||
| Institutional | 7.53 | 5.93 | ||||||||
| Service | 7.24 | 5.93 | ||||||||
| 1 | The net asset value (NAV) represents the net assets of the class of the Fund (ex-dividend) divided by the total number of shares of the class outstanding. The Fund’s performance reflects the reinvestment of dividends and other distributions. The Fund’s performance does not reflect the deduction of any applicable sales charges. |
| 2 | The S&P 500 Index is the Standard & Poor’s 500 Composite Index of 500 stocks, an unmanaged index of common stock prices. The Index is unmanaged and the figures for the Index do not include any deduction for fees, expenses or taxes. It is not possible to invest directly in an unmanaged index. |
| STANDARDIZED TOTAL RETURNS3 |
| For the period ended 12/31/05 | One Year | Five Years | Ten Years | Since Inception | Inception Date | |||||||||||||||
| Class A | 0.71 | % | 0.84% | 8.38 | % | 9.56 | % | 5/24/91 | ||||||||||||
| Class B | 0.77 | 0.84 | n/a | 7.70 | 5/1/96 | |||||||||||||||
| Class C | 4.76 | 1.23 | n/a | 4.61 | 8/15/97 | |||||||||||||||
| Institutional | 6.98 | 2.39 | 9.50 | 10.50 | 6/15/95 | |||||||||||||||
| Service | 6.43 | 1.88 | 8.954 | 9.95 | 4 | 5/24/91 | ||||||||||||||
| 3 | The Standardized Total Returns are average annual total returns or cumulative total returns (only if the performance period is one year or less) as of the most recent calendar quarter-end. They assume reinvestment of all distributions at NAV. These returns reflect a maximum initial sales charge of 5.5% for Class A Shares, the assumed contingent deferred sales charge for Class B Shares (5% maximum declining to 0% after six years) and the assumed contingent deferred sales charge for Class C Shares (1% if redeemed within 12 months of purchase). Because Institutional and Service shares do not involve a sales charge, such a charge is not applied to their Standardized Total Returns. |
| 4 | Performance data for Service Shares prior to June 7, 1996 (commencement of operations) is that of Class A Shares (excluding the impact of front-end sales charges applicable to Class A Shares since Service Shares are not subject to any sales charges). Performance of Class A Shares of the Structured U.S. Equity Fund reflects the expenses applicable to the Fund’s Class A Shares. The fees applicable to Service Shares are different from those applicable to Class A Shares which impact performance ratings and rankings for a class of shares. |
| The returns represent past performance. Past performance does not guarantee future results. The Fund’s investment return and principal value will fluctuate so that an investor’s shares, when redeemed, may be worth more or less than their original cost. Current performance may be lower or higher than the performance quoted above. Please visit our Web site at: www.gs.com/funds to obtain the most recent month-end returns. Performance reflects expense limitations in effect. In their absence, performance would be reduced. Returns do not reflect the deduction of taxes that a shareholder would pay on Fund distributions or the redemption of Fund shares. |
| TOP 10 HOLDINGS AS OF 2/28/065 |
| Holding | % of Net Assets | Line of Business | ||||||
| General Electric Co. | 4.1 | % | Industrial Conglomerates | |||||
| Bank of America Corp. | 3.4 | Banks | ||||||
| The Procter & Gamble Co. | 3.0 | Household Products | ||||||
| J.P. Morgan Chase & Co. | 2.8 | Diversified Financials | ||||||
| Pfizer, Inc. | 2.7 | Pharmaceuticals | ||||||
| Hewlett-Packard Co. | 2.5 | Computers & Peripherals | ||||||
| Intel Corp. | 2.3 | Semiconductor Equipment | ||||||
| Merrill Lynch & Co., Inc. | 2.3 | Diversified Financials | ||||||
| Time Warner, Inc. | 2.2 | Media | ||||||
| Merck & Co., Inc. | 1.9 | Pharmaceuticals | ||||||
| 5 | The top 10 holdings may not be representative of the Fund’s future investments. |
| SECTOR ALLOCATION AS OF 2/28/066 |
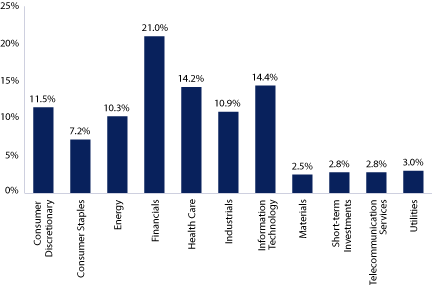
| 6 | The percentage shown for each investment category reflects the value of investments in that category as a percentage of market value. Short-term investments include repurchase agreements and securities lending collateral. |
Structured Large Cap Growth Fund
Dear Shareholder,
This report provides an overview on the performance of the Goldman Sachs Structured Large Cap Growth Fund during the six-month reporting period that ended February 28, 2006.
Performance Review
| Over the six-month period that ended February 28, 2006, the Fund’s Class A, B, C, Institutional and Service Shares generated cumulative total returns, without sales charges, of 6.81%, 6.35%, 6.44%, 6.98%, and 7.00%, respectively. These returns compare to the 5.10% cumulative total return of the Fund’s benchmark, the Russell 1000 Growth Index (with dividends reinvested), over the same time period. | |
| Over the six-month reporting period, returns to the Structured investment themes were positive overall. Momentum was the largest positive contributor to relative returns, as companies with strong momentum characteristics outperformed their industry counterparts. Other themes that enhanced results were Earnings Quality, Management Impact and Valuation. Analyst Sentiment and Profitability also added value for the period, albeit less significantly. |
Portfolio Positioning
| In managing the Structured products, we take minimal size and sector bets. We strive to add value versus each Fund’s respective index through individual stock selection. Our quantitative process seeks out stocks with good momentum that also appear to be good values. We prefer stocks about which fundamental research analysts are becoming more positive and companies with strong profit margins and sustainable earnings that use their capital to enhance shareholder value. Over the long term, these factors have contributed positively to the Fund’s returns and they typically work well at various times and under different market environments. |
Portfolio Highlights
| During the period, the Fund’s stock selection was positive overall among sectors. The Fund’s holdings in the Information Technology and Materials sectors outperformed their peers in the benchmark the most. On the downside, the Fund’s holdings in the Telecommunications Services sector underperformed the most relative to their peers in the benchmark. Specific examples of stocks that contributed to relative results were overweights in Western Digital Corp. and Circuit City Stores, Inc. Conversely, overweights in McAfee, Inc. and Intel Corp. detracted from relative performance during the period. | |
| We thank you for your investment and look forward to your continued confidence. |
Goldman Sachs Quantitative Equity Investment Team
New York, March 17, 2006
Structured Large Cap Growth Fund
| PERFORMANCE REVIEW |
| September 1, 2005–February 28, 2006 | Fund Total Return (based on NAV)1 | Russell 1000 Growth Index2 | ||||||||
| Class A | 6.81 | % | 5.10 | % | ||||||
| Class B | 6.35 | 5.10 | ||||||||
| Class C | 6.44 | 5.10 | ||||||||
| Institutional | 6.98 | 5.10 | ||||||||
| Service | 7.00 | 5.10 | ||||||||
| 1 | The net asset value (NAV) represents the net assets of the class of the Fund (ex-dividend) divided by the total number of shares of the class outstanding. The Fund’s performance reflects the reinvestment of dividends and other distributions. The Fund’s performance does not reflect the deduction of any applicable sales charges. |
| 2 | The Russell 1000 Growth Index is an unmanaged market capitalization weighted index of the 1000 largest U.S. companies with higher price-to-book ratios and higher forecasted growth values. The Index is unmanaged and the figures for the Index do not include any deduction for fees, expenses or taxes. It is not possible to invest directly in an unmanaged index. |
| STANDARDIZED TOTAL RETURNS3 |
| For the period ended 12/31/05 | One Year | Five Years | Ten Years | Since Inception | Inception Date | |||||||||||||||
| Class A | -0.27 | % | -3.85 | % | 6.96 | % | 9.53 | % | 11/11/91 | |||||||||||
| Class B | -0.24 | -3.86 | n/a | 3.67 | 5/1/97 | |||||||||||||||
| Class C | 3.67 | -3.48 | n/a | 1.77 | 8/15/97 | |||||||||||||||
| Institutional | 5.95 | -2.35 | 7.93 | 10.24 | 11/11/91 | |||||||||||||||
| Service | 5.67 | -2.82 | 7.49 | 4 | 9.92 | 4 | 11/11/91 | |||||||||||||
| 3 | The Standardized Total Returns are average annual total returns or cumulative total returns (only if the performance period is one year or less) as of the most recent calendar quarter-end. They assume reinvestment of all distributions at NAV. These returns reflect a maximum initial sales charge of 5.5% for Class A Shares, the assumed contingent deferred sales charge for Class B Shares (5% maximum declining to 0% after six years) and the assumed contingent deferred sales charge for Class C Shares (1% if redeemed within 12 months of purchase). Because Institutional and Service Shares do not involve a sales charge, such a charge is not applied to their Standardized Total Returns. |
| 4 | Performance data for Institutional and Service Shares prior to May 1, 1997 (commencement of operations) is that of Class A Shares. Class A Share performance for such period is that of a predecessor separate account (which converted into Class A Shares) adjusted to reflect the higher fees and expenses applicable to the Fund’s Class A Shares. Although the predecessor separate account was managed by Goldman Sachs Asset Management in a manner and pursuant to investment objectives in all material respects equivalent to management and investment objectives of the Structured Large Cap Growth Fund, the separate account was not registered under the Investment Company Act of 1940 (the “Act”) and was not subject to certain investment restrictions imposed by the Act. If it had registered under the Act, performance might have been adversely affected. The fees applicable to Institutional and Service Shares are different from those applicable to Class A Shares, which impacts performance ratings and rankings for a class of shares. |
| The returns represent past performance. Past performance does not guarantee future results. The Fund’s investment return and principal value will fluctuate so that an investor’s shares, when redeemed, may be worth more or less than their original cost. Current performance may be lower or higher than the performance quoted above. Please visit our Web site at: www.gs.com/funds to obtain the most recent month-end returns. Performance reflects expense limitations in effect. In their absence, performance would be reduced. Returns do not reflect the deduction of taxes that a shareholder would pay on Fund distributions or the redemption of Fund shares. |
| TOP 10 HOLDINGS AS OF 2/28/065 |
| Holding | % of Net Assets | Line of Business | ||||||
| The Procter & Gamble Co. | 3.9 | % | Household Products | |||||
| Johnson & Johnson | 3.7 | Pharmaceuticals | ||||||
| General Electric Co. | 3.5 | Industrial Conglomerates | ||||||
| Cisco Systems, Inc. | 3.5 | Communications Equipment | ||||||
| Google, Inc. | 2.5 | Internet Software & Services | ||||||
| Amgen, Inc. | 2.5 | Biotechnology | ||||||
| The Boeing Co. | 2.4 | Aerospace & Defense | ||||||
| Genentech, Inc. | 2.2 | Biotechnology | ||||||
| Microsoft Corp. | 2.2 | Software | ||||||
| Texas Instruments, Inc. | 2.1 | Semiconductor Equipment & Products | ||||||
| 5 | The top 10 holdings may not be representative of the Fund’s future investments. |
| SECTOR ALLOCATION AS OF 2/28/066 |
| 6 | The percentage shown for each investment category reflects the value of investments in that category as a percentage of market value. Short-term investments include repurchase agreements and securities lending collateral. |
Structured Small Cap Equity Fund
Dear Shareholder,
This report provides an overview on the performance of the Goldman Sachs Structured Small Cap Equity Fund during the six-month reporting period that ended February 28, 2006.
Performance Review
| Over the six-month period that ended February 28, 2006, the Fund’s Class A, B, C, Institutional and Service Shares generated cumulative total returns, without sales charges, of 7.70%, 7.27%, 7.32%, 7.90%, and 7.64%, respectively. These returns compare to the 10.24% cumulative total return of the Fund’s benchmark, the Russell 2000 Index (with dividends reinvested), over the same time period. | |
| Over the six-month reporting period, returns to the Structured investment themes were mixed. Momentum was the largest positive contributor to relative returns, as companies with strong momentum characteristics outperformed their industry counterparts. Earnings Quality and Management Impact also enhanced results, as did Analyst Sentiment and Valuation, albeit to a lesser extent. On the downside, Profitability detracted for the reporting period. Despite good results for most of the Structured themes, the majority of the performance shortfall during the reporting period was the result of stock specific/residual factors. Among these factors were stock-specific events, one of which occurred in December when Comtech Telecommunications, which the Fund held at an overweight relative to the benchmark, issued an earnings projection well below Wall Street forecasts, causing the stock price to drop. Although the effect of stock-specific risks and the long-only and other benchmark constraints can be relatively large over shorter periods of time, we expect that in the long term our Structured investment themes should explain most of the Fund’s excess returns. |
Portfolio Positioning
| In managing the Structured products, we take minimal size and sector bets. We strive to add value versus each Fund’s respective index through individual stock selection. Our quantitative process seeks out stocks with good momentum that also appear to be good values. We prefer stocks about which fundamental research analysts are becoming more positive and companies with strong profit margins and sustainable earnings that use their capital to enhance shareholder value. Over the long term, these factors have contributed positively to the Fund’s returns and they typically work well at various times and under different market environments. |
Portfolio Highlights
| Stock selection was negative overall among sectors. The Fund’s holdings in the Health Care and Consumer Staples sectors lagged their peers in the benchmark the most. Conversely, the Fund’s holdings in the Industrials sector outperformed their peers in the benchmark most for the period. Examples of stocks that detracted from relative performance were overweights in Mentor Corp. and USANA Health Sciences, Inc. On the upside, overweights in Western Digital Corp. and Choice Hotels International, Inc. contributed the most to relative returns for the period. | |
| We thank you for your investment and look forward to your continued confidence. | |
| Goldman Sachs Quantitative Equity Investment Team | |
| New York, March 17, 2006 |
Structured Small Cap Equity Fund
| PERFORMANCE REVIEW |
| September 1, 2005–February 28, 2006 | Fund Total Return (based on NAV)1 | Russell 2000 Index2 | ||||||||
| Class A | 7.70 | % | 10.24 | % | ||||||
| Class B | 7.27 | 10.24 | ||||||||
| Class C | 7.32 | 10.24 | ||||||||
| Institutional | 7.90 | 10.24 | ||||||||
| Service | 7.64 | 10.24 | ||||||||
| 1 | The net asset value (NAV) represents the net assets of the class of the Fund (ex-dividend) divided by the total number of shares of the class outstanding. The Fund’s performance reflects the reinvestment of dividends and other distributions. The Fund’s performance does not reflect the deduction of any applicable sales charge. |
| 2 | The Russell 2000 Index is an unmanaged index of common stock prices that measures the performance of the 2000 smallest companies in the Russell 3000 Index. The Index is unmanaged and the figures for the Index do not include any deduction for fees, expenses or taxes. It is not possible to invest directly in an unmanaged index. |
| STANDARDIZED TOTAL RETURNS3 |
| For the period ended 12/31/05 | One Year | Five Years | Since Inception | Inception Date | ||||||||||||
| Class A | 1.53 | % | 8.03 | % | 7.20 | % | 8/15/97 | |||||||||
| Class B | 1.32 | 8.08 | 7.12 | 8/15/97 | ||||||||||||
| Class C | 5.64 | 8.45 | 7.16 | 8/15/97 | ||||||||||||
| Institutional | 7.90 | 9.69 | 8.34 | 8/15/97 | ||||||||||||
| Service | 7.35 | 9.15 | 7.83 | 8/15/97 | ||||||||||||
| 3 | The Standardized Total Returns are average annual total returns or cumulative total returns (only if the performance period is one year or less) as of the most recent calendar quarter-end. They assume reinvestment of all distributions at NAV. These returns reflect a maximum initial sales charge of 5.5% for Class A Shares, the assumed contingent deferred sales charge for Class B Shares (5% maximum declining to 0% after six years) and the assumed contingent deferred sales charge for Class C Shares (1% if redeemed within 12 months of purchase). Because Institutional and Service Shares do not involve a sales charge, such a charge is not applied to their Standardized Total Returns. |
| The returns represent past performance. Past performance does not guarantee future results. The Fund’s investment return and principal value will fluctuate so that an investor’s shares, when redeemed, may be worth more or less than their original cost. Current performance may be lower or higher than the performance quoted above. Please visit our Web site at: www.gs.com/funds to obtain the most recent month-end returns. Performance reflects expense limitations in effect. In their absence, performance would be reduced. Returns do not reflect the deduction of taxes that a shareholder would pay on Fund distributions or the redemption of Fund shares. |
| TOP 10 HOLDINGS AS OF 2/28/064 |
| Holding | % of Net Assets | Line of Business | ||||||
| Arbitron, Inc. | 1.4 | % | Commercial Services & Supplies | |||||
| Choice Hotels International, Inc. | 1.4 | Hotels, Restaurants & Leisure | ||||||
| Veritas DGC, Inc. | 1.4 | Energy Equipment & Services | ||||||
| SVB Financial Group | 1.3 | Banks | ||||||
| Bank of Hawaii Corp. | 1.3 | Banks | ||||||
| Komag, Inc. | 1.3 | Computers & Peripherals | ||||||
| New Century Financial Corp. | 1.3 | Real Estate | ||||||
| Administaff, Inc. | 1.3 | Commercial Services & Supplies | ||||||
| Stewart Information Services Corp. | 1.2 | Insurance | ||||||
| Ryerson Tull, Inc. | 1.2 | Metals & Mining | ||||||
| 4 | The top 10 holdings may not be representative of the Fund’s future investments. |
| SECTOR ALLOCATION AS OF 2/28/065 |
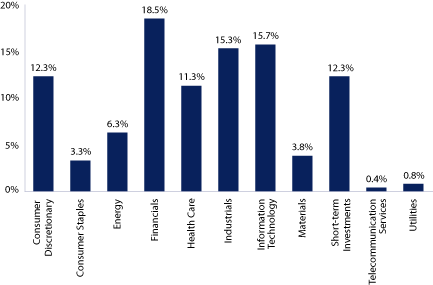
| 5 | The percentage shown for each investment category reflects the value of investments in that category as a percentage of market value. Short-term investments include repurchase agreements and securities lending collateral. |
International Structured Investment Process


| n Comprehensive — We forecast returns on over 5,000 stocks, 21 countries and 9 currencies on a daily basis. n Rigorous — We evaluate stocks, countries, and currencies based on fundamental investment criteria that have outperformed historically. | n Objective — Our stock and equity market selection process is free from emotion that can lead to biased investment decisions. |

| n Our computer optimization process allocates risk to our best investment ideas and constructs funds that neutralize systematic risks and deliver better returns. | We use unique, proprietary risk models that are more precise, more focused and faster to respond because they identify, track and manage risk specific to our process, using daily data. |

| Fully invested, well-diversified International portfolio that: n Blends top-down market views with bottom-up stock selection. n Maintains style, sector, risk and capitalization characteristics similar to the benchmark. | Aims to achieve excess returns by taking intentional country bets and many small diversified stock positions. |
Structured International Equity Fund
Dear Shareholder,
This report provides an overview on the performance of the Goldman Sachs Structured International Equity Fund during the six-month reporting period that ended February 28, 2006.
Performance Review
| Over the six-month period that ended February 28, 2006, the Fund’s Class A, B, C, Institutional and Service Shares generated cumulative total returns, without sales charges, of 14.04%, 13.65%, 13.66%, 14.36%, and 14.00%, respectively. These returns compare to the 15.23% cumulative total return of the Fund’s benchmark, the Morgan Stanley Capital International (MSCI) Europe, Australasia, Far East (EAFE) Index (unhedged, with dividends reinvested), over the same time period. | |
| During the six-month reporting period, the Fund generated positive returns, but underperformed its benchmark. While the Fund’s country and currency selection enhanced results, stock selection detracted from relative performance. |
Portfolio Positioning
| In managing the Structured International products, we take minimal size and sector bets. We strive to add value versus the Fund’s index through stock and country/currency selection. Our quantitative process seeks out stocks, countries, and currencies with good momentum that also appear to be good values. We prefer stocks about which fundamental research analysts are becoming more positive and companies with strong profit margins and sustainable earnings that use their capital to enhance shareholder value. We also prefer countries and currencies that exhibit strong economic growth, countries with favorable risk/return tradeoffs, and currencies that are associated with positive expected fund flows. Over the long term, these factors have contributed positively to the Fund’s returns and they typically work well at various times and under different market environments. |
Regional Allocations
| In terms of countries, overweight positions in Norway and Hong Kong and an underweight in Switzerland were least successful for the period. On the upside, an underweight in the UK and an overweight in Japan were most successful over the reporting period. |
Sector Allocations
| Our strategy is sector-neutral within countries. Any deviations in sector weights at the Fund level are the result of our country allocation decisions. During the period, the Fund’s holdings in the Materials, Industrials and Information Technology sectors lagged their peers in the benchmark the most. Conversely, holdings in the Telecommunications Services sector contributed the most to relative performance. |
Stock Selection
| Within countries, stock selection was the weakest in Japan, Germany and Hong Kong. In contrast, stock selection was strongest in France and Belgium for the period. | |
| As always, we thank you for your investment and look forward to your continued confidence. | |
| Goldman Sachs Quantitative Equity Investment Team | |
| New York, March 17, 2006 |
Structured International Equity Fund
| PERFORMANCE REVIEW |
| September 1, 2005–February 28, 2006 | Fund Total Return (based on NAV)1 | MSCI EAFE Index2 | ||||||||
| Class A | 14.04 | % | 15.23 | % | ||||||
| Class B | 13.65 | 15.23 | ||||||||
| Class C | 13.66 | 15.23 | ||||||||
| Institutional | 14.36 | 15.23 | ||||||||
| Service | 14.00 | 15.23 | ||||||||
| 1 | The net asset value (NAV) represents the net assets of the class of the Fund (ex-dividend) divided by the total number of shares of the class outstanding. The Fund’s performance reflects the reinvestment of dividends and other distributions. The Fund’s performance does not reflect the deduction of any applicable sales charges. |
| 2 | The Morgan Stanley Capital International (MSCI) Europe, Australasia, Far East (EAFE) Index (unhedged) is a market capitalization-weighted composite of securities in 21 developed markets. The Index is unmanaged and the figures for the Index do not include any deduction for fees, expenses or taxes. It is not possible to invest directly in an unmanaged index. |
| STANDARDIZED TOTAL RETURNS3 |
| For the period ended 12/31/05 | One Year | Five Years | Since Inception | Inception Date | ||||||||||||
| Class A | 8.36 | % | 4.38 | % | 3.43 | % | 8/15/97 | |||||||||
| Class B | 8.74 | 4.60 | 3.58 | 8/15/97 | ||||||||||||
| Class C | 12.79 | 4.97 | 3.60 | 8/15/97 | ||||||||||||
| Institutional | 15.13 | 6.16 | 4.77 | 8/15/97 | ||||||||||||
| Service | 14.54 | 5.64 | 4.26 | 8/15/97 | ||||||||||||
| 3 | The Standardized Total Returns are average annual total returns or cumulative total returns (only if the performance period is one year or less) of the most recent calendar quarter-end. They assume reinvestment of all distributions at NAV. These returns reflect a maximum initial sales charge of 5.5% for Class A Shares, the assumed contingent deferred sales charge for Class B Shares (5% maximum declining to 0% after six years) and the assumed contingent deferred sales charge for Class C Shares (1% if redeemed within 12 months of purchase). Because Institutional and Service Shares do not involve a sales charge, such a charge is not applied to their Standardized Total Returns. The Fund will charge a 2% redemption fee on the redemption of shares (including by exchange) held for 30 calendar days or less. Performance figures do not reflect the deduction of the redemption fee. If reflected, the redemption fee would reduce the performance quoted. |
| The returns represent past performance. Past performance does not guarantee future results. The Fund’s investment return and principal value will fluctuate so that an investor’s shares, when redeemed, may be worth more or less than their original cost. Current performance may be lower or higher than the performance quoted above. Please visit our Web site at: www.gs.com/funds to obtain the most recent month-end returns. Performance reflects expense limitations in effect. In their absence, performance would be reduced. Returns do not reflect the deduction of taxes that a shareholder would pay on Fund distributions or the redemption of Fund shares. |
| TOP 10 HOLDINGS AS OF 2/28/064 |
| Holding | % of Net Assets | Line of Business | ||||||
| Norsk Hydro ASA | 4.2 | % | Oil & Gas | |||||
| Fortis | 3.5 | Diversified Financials | ||||||
| BASF AG | 3.0 | Chemicals | ||||||
| BNP Paribas SA | 3.0 | Banks | ||||||
| Deutsche Bank AG | 2.8 | Banks | ||||||
| Honda Motor Co. Ltd. | 2.7 | Automobiles | ||||||
| Aegon NV | 2.5 | Insurance | ||||||
| Nippon Steel Corp. | 2.1 | Metals & Mining | ||||||
| Bouygues SA | 2.0 | Wireless Telecommunication Services | ||||||
| Daiwa Securities Group, Inc. | 2.0 | Diversified Financials | ||||||
| 4 | The top 10 holdings may not be representative of the Fund’s future investments. |
Statement of Investments
| Shares | Description | Value | ||||||||
Common Stocks – 95.6% | ||||||||||
| Aerospace & Defense – 3.1% | ||||||||||
| 230,700 | Northrop Grumman Corp. | $ | 14,787,870 | |||||||
| 137,500 | The Boeing Co. | 9,994,875 | ||||||||
| 24,782,745 | ||||||||||
| Airlines – 0.2% | ||||||||||
| 114,700 | Southwest Airlines Co. | 1,923,519 | ||||||||
| Auto Components – 0.1% | ||||||||||
| 47,900 | ArvinMeritor, Inc. | 801,846 | ||||||||
| Banks – 10.7% | ||||||||||
| 794,948 | Bank of America Corp. | 36,448,366 | ||||||||
| 139,500 | Bank of Hawaii Corp. | 7,449,300 | ||||||||
| 29,550 | BB&T Corp. | 1,168,111 | ||||||||
| 66,100 | Comerica, Inc. | 3,788,852 | ||||||||
| 50,300 | Downey Financial Corp. | 3,196,565 | ||||||||
| 44,800 | Golden West Financial Corp. | 3,182,144 | ||||||||
| 296,900 | U.S. Bancorp | 9,177,179 | ||||||||
| 177,000 | UnionBanCal Corp. | 12,228,930 | ||||||||
| 131,900 | Washington Mutual, Inc. | 5,632,130 | ||||||||
| 63,300 | Wells Fargo & Co. | 4,063,860 | ||||||||
| 86,335,437 | ||||||||||
| Biotechnology – 1.6% | ||||||||||
| 147,000 | Genentech, Inc.* | 12,596,430 | ||||||||
| Building Products – 0.1% | ||||||||||
| 9,600 | USG Corp.*(a) | 811,008 | ||||||||
| Chemicals – 1.8% | ||||||||||
| 17,500 | Ashland, Inc. | 1,142,225 | ||||||||
| 155,350 | Monsanto Co. | 13,030,758 | ||||||||
| 16,700 | The Lubrizol Corp. | 722,442 | ||||||||
| 14,895,425 | ||||||||||
| Commercial Services & Supplies – 0.2% | ||||||||||
| 48,300 | Republic Services, Inc. | 1,877,421 | ||||||||
| Communications Equipment – 0.2% | ||||||||||
| 87,300 | Cisco Systems, Inc.* | 1,766,952 | ||||||||
| Computers & Peripherals – 3.1% | ||||||||||
| 722,850 | Hewlett-Packard Co. | 23,716,708 | ||||||||
| 69,450 | Western Digital Corp.* | 1,545,263 | ||||||||
| 25,261,971 | ||||||||||
| Diversified Financials – 13.3% | ||||||||||
| 258,500 | AmeriCredit Corp.* | 7,625,750 | ||||||||
| 53,500 | Ameriprise Financial, Inc. | 2,433,180 | ||||||||
| 400,700 | Citigroup, Inc. | 18,580,459 | ||||||||
| 26,400 | IndyMac Bancorp, Inc.(a) | 1,024,848 | ||||||||
| 725,700 | J.P. Morgan Chase & Co. | 29,855,298 | ||||||||
| 275,550 | Merrill Lynch & Co., Inc. | 21,275,215 | ||||||||
| 185,900 | Moody’s Corp. | 12,455,300 | ||||||||
| 81,100 | Principal Financial, Inc. | 3,951,192 | ||||||||
| 114,200 | SLM Corp. | 6,442,022 | ||||||||
| 179,800 | TD Ameritrade Holding Corp.* | 3,912,448 | ||||||||
| 107,555,712 | ||||||||||
| Diversified Telecommunication Services – 4.3% | ||||||||||
| 385,880 | AT&T, Inc. | 10,646,429 | ||||||||
| 287,500 | CenturyTel, Inc. | 10,344,250 | ||||||||
| 277,900 | Sprint Nextel Corp. | 6,677,937 | ||||||||
| 114,700 | Telewest Global, Inc.* | 2,735,595 | ||||||||
| 140,800 | Verizon Communications, Inc. | 4,744,960 | ||||||||
| 35,149,171 | ||||||||||
| Electric Utilities – 5.1% | ||||||||||
| 178,200 | American Electric Power Co., Inc. | 6,504,300 | ||||||||
| 162,500 | Edison International | 7,208,500 | ||||||||
| 163,500 | FirstEnergy Corp. | 8,351,580 | ||||||||
| 36,200 | Northeast Utilities | 710,244 | ||||||||
| 360,400 | PG&E Corp. | 13,713,220 | ||||||||
| 16,700 | Progress Energy, Inc. | 741,146 | ||||||||
| 75,400 | TXU Corp. | 3,950,206 | ||||||||
| 41,179,196 | ||||||||||
| Electrical Equipment – 0.5% | ||||||||||
| 81,900 | Energizer Holdings, Inc.* | 4,474,197 | ||||||||
| Electronic Equipment & Instruments – 0.2% | ||||||||||
| 61,300 | Avnet, Inc.* | 1,540,469 | ||||||||
| Energy Equipment & Services – 0.4% | ||||||||||
| 10,100 | Helmerich & Payne, Inc. | 664,277 | ||||||||
| 20,900 | Schlumberger Ltd. | 2,403,500 | ||||||||
| 3,067,777 | ||||||||||
| Food & Drug Retailing – 0.1% | ||||||||||
| 36,600 | Safeway, Inc. | 889,746 | ||||||||
| Food Products – 2.7% | ||||||||||
| 474,900 | Archer-Daniels-Midland Co. | 15,063,828 | ||||||||
| 42,500 | Dean Foods Co.* | 1,592,475 | ||||||||
| 379,092 | Tyson Foods, Inc. | 5,129,115 | ||||||||
| 21,785,418 | ||||||||||
| Healthcare Providers & Services – 2.9% | ||||||||||
| 321,200 | AmerisourceBergen Corp. | 14,771,988 | ||||||||
| 37,600 | Express Scripts, Inc.* | 3,281,352 | ||||||||
| 107,400 | McKesson Corp. | 5,813,562 | ||||||||
| 23,866,902 | ||||||||||
| Hotels, Restaurants & Leisure – 0.3% | ||||||||||
| 62,700 | Darden Restaurants, Inc. | 2,629,638 | ||||||||
| Household Durables – 0.4% | ||||||||||
| 34,200 | American Greetings Corp. | 717,516 | ||||||||
| 24,100 | Whirlpool Corp. | 2,163,939 | ||||||||
| 2,881,455 | ||||||||||
| Household Products – 1.5% | ||||||||||
| 66,300 | Colgate-Palmolive Co. | 3,612,024 | ||||||||
| 139,700 | Procter & Gamble Co. | 8,372,221 | ||||||||
| 11,984,245 | ||||||||||
| Industrial Conglomerates – 0.1% | ||||||||||
| 22,900 | General Electric Co. | 752,723 | ||||||||
19
Statement of Investments (continued)
| Shares | Description | Value | ||||||||
Common Stocks – (continued) | ||||||||||
| Insurance – 8.6% | ||||||||||
| 9,800 | AMBAC Financial Group, Inc. | $ | 736,470 | |||||||
| 13,500 | American International Group, Inc. | 895,860 | ||||||||
| 50,600 | CNA Financial Corp.* | 1,564,552 | ||||||||
| 228,900 | Genworth Financial, Inc. | 7,283,598 | ||||||||
| 13,600 | Lincoln National Corp. | 772,072 | ||||||||
| 145,100 | Loews Corp. | 13,386,926 | ||||||||
| 223,750 | MBIA, Inc. | 13,143,075 | ||||||||
| 281,650 | MetLife, Inc.(a) | 14,116,298 | ||||||||
| 79,500 | Old Republic International Corp. | 1,692,555 | ||||||||
| 142,300 | The Chubb Corp. | 13,625,225 | ||||||||
| 42,700 | W.R. Berkley Corp. | 2,471,903 | ||||||||
| 69,688,534 | ||||||||||
| Internet Software & Services – 1.6% | ||||||||||
| 35,675 | Google, Inc.* | 12,936,469 | ||||||||
| IT Consulting & Services – 0.3% | ||||||||||
| 40,600 | Accenture Ltd. | 1,325,996 | ||||||||
| 18,700 | Computer Sciences Corp.* | 1,016,158 | ||||||||
| 2,342,154 | ||||||||||
| Machinery – 0.6% | ||||||||||
| 29,600 | Caterpillar, Inc. | 2,163,168 | ||||||||
| 58,500 | SPX Corp. | 2,881,125 | ||||||||
| 5,044,293 | ||||||||||
| Media – 6.3% | ||||||||||
| 243,850 | CBS Corp. Class B | 5,964,571 | ||||||||
| 144,600 | Clear Channel Communications, Inc. | 4,092,180 | ||||||||
| 38,700 | Hearst-Argyle Television, Inc. | 923,769 | ||||||||
| 1,137,400 | Liberty Media Corp. Series A* | 9,372,176 | ||||||||
| 344,300 | The Walt Disney Co. | 9,636,957 | ||||||||
| 1,147,200 | Time Warner, Inc. | 19,858,032 | ||||||||
| 41,000 | Univision Communications, Inc.* | 1,371,450 | ||||||||
| 51,219,135 | ||||||||||
| Metals & Mining – 1.2% | ||||||||||
| 110,050 | Freeport-McMoRan Copper & Gold, Inc. Series B | 5,571,832 | ||||||||
| 35,350 | Newmont Mining Corp. | 1,870,722 | ||||||||
| 28,200 | Southern Copper Corp. | 2,246,130 | ||||||||
| 9,688,684 | ||||||||||
| Multiline Retail – 0.4% | ||||||||||
| 40,445 | Dillard’s, Inc. | 997,778 | ||||||||
| 31,400 | Federated Department Stores, Inc. | 2,230,656 | ||||||||
| 3,228,434 | ||||||||||
| Oil & Gas – 13.8% | ||||||||||
| 154,600 | Anadarko Petroleum Corp. | 15,330,136 | ||||||||
| 97,650 | Apache Corp. | 6,534,738 | ||||||||
| 106,600 | Burlington Resources, Inc. | 9,613,188 | ||||||||
| 50,734 | Chevron Corp. | 2,865,456 | ||||||||
| 261,550 | Devon Energy Corp. | 15,334,677 | ||||||||
| 177,600 | EOG Resources, Inc. | 11,970,240 | ||||||||
| 54,100 | Equitable Resources, Inc. | 1,967,076 | ||||||||
| 554,460 | Exxon Mobil Corp. | 32,918,290 | ||||||||
| 15,000 | Pioneer Natural Resources Co. | 631,350 | ||||||||
| 31,400 | Pogo Producing Co. | 1,565,604 | ||||||||
| 172,800 | Sunoco, Inc. | 12,804,480 | ||||||||
| 11,300 | Ultra Petroleum Corp.* | 588,052 | ||||||||
| 112,123,287 | ||||||||||
| Pharmaceuticals – 3.7% | ||||||||||
| 7,800 | Allergan, Inc. | 844,428 | ||||||||
| 432,100 | Merck & Co., Inc. | 15,063,006 | ||||||||
| 543,500 | Pfizer, Inc. | 14,234,265 | ||||||||
| 30,141,699 | ||||||||||
| Real Estate – 3.2% | ||||||||||
| 20,100 | AMB Property Corp. | 1,078,365 | ||||||||
| 32,100 | Camden Property Trust | 2,113,785 | ||||||||
| 44,000 | CBL & Associates Properties, Inc. | 1,874,400 | ||||||||
| 28,300 | Health Care Property Investors, Inc. | 777,401 | ||||||||
| 73,800 | HRPT Properties Trust | 791,136 | ||||||||
| 21,300 | Kimco Realty Corp. | 765,309 | ||||||||
| 267,600 | ProLogis | 14,054,352 | ||||||||
| 53,600 | Public Storage, Inc. | 4,181,872 | ||||||||
| 25,636,620 | ||||||||||
| Road & Rail – 0.5% | ||||||||||
| 25,650 | Burlington Northern Santa Fe Corp. | 2,017,116 | ||||||||
| 42,900 | GATX Corp. | 1,703,130 | ||||||||
| 3,720,246 | ||||||||||
| Specialty Retail – 2.0% | ||||||||||
| 203,100 | AutoNation, Inc.* | 4,246,821 | ||||||||
| 192,308 | Circuit City Stores, Inc. | 4,621,161 | ||||||||
| 137,700 | Payless ShoeSource, Inc.* | 3,263,490 | ||||||||
| 118,200 | United Rentals, Inc.*(a) | 3,853,320 | ||||||||
| 15,984,792 | ||||||||||
| Textiles & Apparel – 0.2% | ||||||||||
| 38,600 | Coach, Inc.* | 1,378,792 | ||||||||
| Wireless Telecommunication Services – 0.3% | ||||||||||
| 40,600 | United States Cellular Corp.* | 2,230,970 | ||||||||
| TOTAL COMMON STOCKS | ||||||||||
| (Cost $690,595,175) | $ | 774,173,512 | ||||||||
20
| Principal | Interest | Maturity | ||||||||||||||
| Amount | Rate | Date | Value | |||||||||||||
Repurchase Agreement – 3.8% | ||||||||||||||||
| Joint Repurchase Agreement Account II(b) | ||||||||||||||||
| $ | 30,800,000 | 4.57 | % | 03/01/2006 | $ | 30,800,000 | ||||||||||
| Maturity Value: $30,803,908 | ||||||||||||||||
| (Cost $30,800,000) | ||||||||||||||||
| TOTAL INVESTMENTS BEFORE SECURITIES LENDING COLLATERAL | ||||||||||||||||
| (Cost $721,395,175) | $ | 804,973,512 | ||||||||||||||
| Shares | Description | Value | ||||||||
Securities Lending Collateral – 1.7% | ||||||||||
| 13,839,325 | Boston Global Investment Trust – Enhanced Portfolio | $ | 13,839,325 | |||||||
| (Cost $13,839,325) | ||||||||||
| TOTAL INVESTMENTS – 101.1% | ||||||||||
| (Cost $735,234,500) | $ | 818,812,837 | ||||||||
| The percentage shown for each investment category reflects the value of investments in that category as a percentage of net assets. |
| * | Non-income producing security. | |
| (a) | All or portion of security is on loan. | |
| (b) | Joint repurchase agreement was entered into on February 28, 2006. Additional information appears on page 33. |
| ADDITIONAL INVESTMENT INFORMATION |
FUTURES CONTRACTS — At February 28, 2006, the following futures contracts were open as follows:
| Number of | Settlement | Unrealized | ||||||||||||
| Type | Contracts Long | Month | Market Value | Loss | ||||||||||
| S&P 500 Index | 522 | March 2006 | $ | 33,470,640 | $ | (78,111 | ) | |||||||
21
Statement of Investments
| Shares | Description | Value | ||||||||
Common Stocks – 98.9% | ||||||||||
| Aerospace & Defense – 3.8% | ||||||||||
| 270,500 | Northrop Grumman Corp. | $ | 17,339,050 | |||||||
| 123,800 | Raytheon Co. | 5,372,920 | ||||||||
| 206,000 | The Boeing Co. | 14,974,140 | ||||||||
| 37,686,110 | ||||||||||
| Banks – 5.5% | ||||||||||
| 730,584 | Bank of America Corp. | 33,497,276 | ||||||||
| 49,500 | Bank of Hawaii Corp. | 2,643,300 | ||||||||
| 61,900 | Golden West Financial Corp. | 4,396,757 | ||||||||
| 129,200 | Hudson City Bancorp, Inc. | 1,667,972 | ||||||||
| 82,500 | U.S. Bancorp | 2,550,075 | ||||||||
| 14,000 | UnionBanCal Corp. | 967,260 | ||||||||
| 129,240 | Wachovia Corp.(a) | 7,246,487 | ||||||||
| 12,200 | Zions Bancorp. | 1,006,744 | ||||||||
| 53,975,871 | ||||||||||
| Biotechnology – 3.1% | ||||||||||
| 173,400 | Amgen, Inc.* | 13,089,966 | ||||||||
| 48,400 | Celgene Corp.* | 1,839,200 | ||||||||
| 150,100 | Genentech, Inc.* | 12,862,069 | ||||||||
| 33,200 | Genzyme Corp.* | 2,302,088 | ||||||||
| 30,093,323 | ||||||||||
| Chemicals – 1.8% | ||||||||||
| 212,000 | Monsanto Co. | 17,782,560 | ||||||||
| Commercial Services & Supplies – 0.4% | ||||||||||
| 80,800 | Global Payments, Inc. | 4,206,448 | ||||||||
| Communications Equipment – 1.9% | ||||||||||
| 523,200 | Cisco Systems, Inc.* | 10,589,568 | ||||||||
| 253,500 | Corning, Inc.* | 6,187,935 | ||||||||
| 99,100 | Tellabs, Inc.* | 1,455,779 | ||||||||
| 18,233,282 | ||||||||||
| Computers & Peripherals – 3.1% | ||||||||||
| 744,700 | Hewlett-Packard Co. | 24,433,607 | ||||||||
| 277,700 | Western Digital Corp.* | 6,178,825 | ||||||||
| 30,612,432 | ||||||||||
| Diversified Financials – 9.5% | ||||||||||
| 143,500 | AmeriCredit Corp.* | 4,233,250 | ||||||||
| 44,500 | Ameriprise Financial, Inc. | 2,023,860 | ||||||||
| 147,170 | Citigroup, Inc. | 6,824,273 | ||||||||
| 679,400 | J.P. Morgan Chase & Co.(a) | 27,950,516 | ||||||||
| 286,300 | Merrill Lynch & Co., Inc. | 22,105,223 | ||||||||
| 240,700 | Moody’s Corp. | 16,126,900 | ||||||||
| 111,400 | Principal Financial, Inc. | 5,427,408 | ||||||||
| 116,700 | SLM Corp. | 6,583,047 | ||||||||
| 90,200 | TD Ameritrade Holding Corp. | 1,962,752 | ||||||||
| 93,237,229 | ||||||||||
| Diversified Telecommunications – 2.6% | ||||||||||
| 89,100 | AT&T, Inc. | 2,458,269 | ||||||||
| 48,700 | BellSouth Corp. | 1,537,946 | ||||||||
| 194,300 | CenturyTel, Inc. | 6,990,914 | ||||||||
| 249,530 | Sprint Nextel Corp. | 5,996,206 | ||||||||
| 262,900 | Verizon Communications, Inc. | 8,859,730 | ||||||||
| 25,843,065 | ||||||||||
| Electric Utilities – 3.0% | ||||||||||
| 143,400 | American Electric Power Co., Inc. | 5,234,100 | ||||||||
| 82,510 | Edison International | 3,660,144 | ||||||||
| 434,200 | PG&E Corp. | 16,521,310 | ||||||||
| 78,800 | TXU Corp. | 4,128,332 | ||||||||
| 29,543,886 | ||||||||||
| Electrical Equipment – 1.1% | ||||||||||
| 29,500 | Emerson Electric Co. | 2,413,395 | ||||||||
| 144,900 | Energizer Holdings, Inc.* | 7,915,887 | ||||||||
| 10,329,282 | ||||||||||
| Energy Equipment & Services – 1.5% | ||||||||||
| 50,200 | Helmerich & Payne, Inc. | 3,301,654 | ||||||||
| 102,500 | Schlumberger Ltd. | 11,787,500 | ||||||||
| 15,089,154 | ||||||||||
| Food & Drug Retailing – 0.7% | ||||||||||
| 146,300 | Safeway, Inc. | 3,556,553 | ||||||||
| 104,630 | SUPERVALU, Inc. | 3,306,308 | ||||||||
| 6,862,861 | ||||||||||
| Food Products – 1.8% | ||||||||||
| 340,551 | Archer-Daniels-Midland Co. | 10,802,278 | ||||||||
| 493,900 | Tyson Foods, Inc. | 6,682,467 | ||||||||
| 17,484,745 | ||||||||||
| Healthcare Equipment & Supplies – 0.5% | ||||||||||
| 26,300 | Becton, Dickinson and Co. | 1,679,255 | ||||||||
| 26,700 | Guidant Corp. | 2,049,492 | ||||||||
| 28,700 | St. Jude Medical, Inc.* | 1,308,720 | ||||||||
| 5,037,467 | ||||||||||
| Healthcare Providers & Services – 4.0% | ||||||||||
| 370,300 | AmerisourceBergen Corp. | 17,030,097 | ||||||||
| 72,400 | Express Scripts, Inc.* | 6,318,348 | ||||||||
| 71,200 | Humana, Inc.* | 3,678,904 | ||||||||
| 219,200 | McKesson Corp. | 11,865,296 | ||||||||
| 38,892,645 | ||||||||||
| Hotels, Restaurants & Leisure – 1.0% | ||||||||||
| 23,400 | Brinker International, Inc. | 974,610 | ||||||||
| 156,500 | Darden Restaurants, Inc. | 6,563,610 | ||||||||
| 35,600 | Marriott International, Inc. | 2,435,040 | ||||||||
| 9,973,260 | ||||||||||
| Household Durables – 0.5% | ||||||||||
| 56,200 | Whirlpool Corp. | 5,046,198 | ||||||||
22
| Shares | Description | Value | ||||||||
Common Stocks – (continued) | ||||||||||
| Household Products – 3.2% | ||||||||||
| 19,500 | Colgate-Palmolive Co. | $ | 1,062,360 | |||||||
| 498,469 | Procter & Gamble Co. | 29,873,247 | ||||||||
| 30,935,607 | ||||||||||
| Industrial Conglomerates – 4.1% | ||||||||||
| 1,231,820 | General Electric Co. | 40,489,923 | ||||||||
| Insurance – 5.7% | ||||||||||
| 3,162 | Alleghany Corp.* | 910,656 | ||||||||
| 132,400 | Genworth Financial, Inc. | 4,212,968 | ||||||||
| 169,410 | Loews Corp. | 15,629,767 | ||||||||
| 263,700 | MBIA, Inc. | 15,489,738 | ||||||||
| 63,310 | Prudential Financial, Inc. | 4,877,402 | ||||||||
| 152,600 | The Chubb Corp. | 14,611,450 | ||||||||
| 55,731,981 | ||||||||||
| Internet Software & Services – 1.5% | ||||||||||
| 41,550 | Google, Inc.* | 15,066,861 | ||||||||
| IT Consulting & Services – 1.9% | ||||||||||
| 85,200 | Accenture Ltd. | 2,782,632 | ||||||||
| 285,600 | Computer Sciences Corp.* | 15,519,504 | ||||||||
| 18,302,136 | ||||||||||
| Machinery – 0.8% | ||||||||||
| 95,300 | Caterpillar, Inc. | 6,964,524 | ||||||||
| 19,500 | SPX Corp. | 960,375 | ||||||||
| 7,924,899 | ||||||||||
| Media – 5.8% | ||||||||||
| 240,981 | CBS Corp. Class B | 5,894,395 | ||||||||
| 274,300 | Clear Channel Communications, Inc.(a) | 7,762,690 | ||||||||
| 49,237 | Comcast Corp.* | 1,321,029 | ||||||||
| 1,188,800 | Liberty Media Corp. Series A* | 9,795,712 | ||||||||
| 117,300 | The McGraw-Hill Cos., Inc. | 6,227,457 | ||||||||
| 1,225,390 | Time Warner, Inc. | 21,211,501 | ||||||||
| 126,881 | Viacom, Inc. Class B* | 5,070,165 | ||||||||
| 57,282,949 | ||||||||||
| Metals & Mining – 0.7% | ||||||||||
| 70,700 | Freeport-McMoRan Copper & Gold, Inc. Series B | 3,579,541 | ||||||||
| 20,700 | Newmont Mining Corp. | 1,095,444 | ||||||||
| 28,900 | Nucor Corp. | 2,486,845 | ||||||||
| 7,161,830 | ||||||||||
| Multiline Retail – 0.1% | ||||||||||
| 31,300 | BJ’s Wholesale Club, Inc.* | 990,958 | ||||||||
| Oil & Gas – 8.9% | ||||||||||
| 155,500 | Anadarko Petroleum Corp. | 15,419,380 | ||||||||
| 195,900 | Burlington Resources, Inc. | 17,666,262 | ||||||||
| 277,900 | Devon Energy Corp. | 16,293,277 | ||||||||
| 104,700 | EOG Resources, Inc. | 7,056,780 | ||||||||
| 271,916 | Exxon Mobil Corp. | 16,143,653 | ||||||||
| 201,500 | Sunoco, Inc. | 14,931,150 | ||||||||
| 87,510,502 | ||||||||||
| Pharmaceuticals – 6.8% | ||||||||||
| 46,600 | Allergan, Inc. | 5,044,916 | ||||||||
| 296,350 | Johnson & Johnson | 17,084,577 | ||||||||
| 524,100 | Merck & Co., Inc. | 18,270,126 | ||||||||
| 1,019,700 | Pfizer, Inc. | 26,705,943 | ||||||||
| 67,105,562 | ||||||||||
| Real Estate – 0.7% | ||||||||||
| 38,600 | Archstone-Smith Trust | 1,829,640 | ||||||||
| 20,100 | Developers Diversified Realty Corp. (REIT) | 1,008,819 | ||||||||
| 28,700 | Kimco Realty Corp. | 1,031,191 | ||||||||
| 56,300 | ProLogis | 2,956,876 | ||||||||
| 6,826,526 | ||||||||||
| Road & Rail – 0.9% | ||||||||||
| 43,900 | Burlington Northern Santa Fe Corp. | 3,452,296 | ||||||||
| 98,500 | Norfolk Southern Corp. | 5,041,230 | ||||||||
| 8,493,526 | ||||||||||
| Semiconductor Equipment & Products – 4.3% | ||||||||||
| 184,990 | Freescale Semiconductor, Inc. Class B* | 5,002,130 | ||||||||
| 1,105,800 | Intel Corp. | 22,779,480 | ||||||||
| 470,900 | Texas Instruments, Inc. | 14,056,365 | ||||||||
| 41,837,975 | ||||||||||
| Software – 2.0% | ||||||||||
| 185,100 | Autodesk, Inc. | 6,969,015 | ||||||||
| 26,800 | Intuit Inc.* | 1,301,944 | ||||||||
| 255,640 | Microsoft Corp. | 6,876,716 | ||||||||
| 85,500 | Symantec Corp.* | 1,444,095 | ||||||||
| 118,100 | Synopsys, Inc.* | 2,582,847 | ||||||||
| 19,174,617 | ||||||||||
| Specialty Retail – 2.1% | ||||||||||
| 424,130 | AutoNation, Inc.* | 8,868,558 | ||||||||
| 474,431 | Circuit City Stores, Inc. | 11,400,577 | ||||||||
| 20,269,135 | ||||||||||
| Textiles & Apparel – 1.7% | ||||||||||
| 459,900 | Coach, Inc.* | 16,427,628 | ||||||||
| Tobacco – 1.6% | ||||||||||
| 222,600 | Altria Group, Inc. | 16,004,940 | ||||||||
| Wireless Telecommunication Services – 0.3% | ||||||||||
| 43,610 | United States Cellular Corp.* | 2,396,369 | ||||||||
| TOTAL COMMON STOCKS | ||||||||||
| (Cost $842,389,588) | $ | 969,863,742 | ||||||||
23
Statement of Investments (continued)
| Principal | Interest | Maturity | ||||||||||||||
| Amount | Rate | Date | Value | |||||||||||||
Repurchase Agreement – 1.1% | ||||||||||||||||
| Joint Repurchase Agreement Account II(b) | ||||||||||||||||
| $ | 11,000,000 | 4.57 | % | 03/01/2006 | $ | 11,000,000 | ||||||||||
| Maturity Value: $11,001,396 | ||||||||||||||||
| (Cost $11,000,000) | ||||||||||||||||
| TOTAL INVESTMENTS BEFORE SECURITIES LENDING COLLATERAL | ||||||||||||||||
| (Cost $853,389,588) | $ | 980,863,742 | ||||||||||||||
| Shares | Description | Value | ||||||||
Securities Lending Collateral – 1.7% | ||||||||||
| 16,552,800 | Boston Global Investment Trust – Enhanced Portfolio | $ | 16,552,800 | |||||||
| (Cost $16,552,800) | ||||||||||
| TOTAL INVESTMENTS – 101.7% | ||||||||||
| (Cost $869,942,388) | $ | 997,416,542 | ||||||||
| The percentage shown for each investment category reflects the value of investments in that category as a percentage of net assets. |
| * | Non-income producing security. | |
| (a) | All or portion of security is on loan. | |
| (b) | Joint repurchase agreement was entered into on February 28, 2006. Additional information appears on page 33. |
| Investment Abbreviation: | ||||||
| REIT | — | Real Estate Investment Trust | ||||
| ADDITIONAL INVESTMENT INFORMATION |
FUTURES CONTRACTS — At February 28, 2006, the following futures contracts were open as follows:
| Number of | Settlement | Market | Unrealized | |||||||||||
| Type | Contracts Long | Month | Value | Loss | ||||||||||
| S&P 500 Index | 182 | March 2006 | $ | 11,669,840 | $ | (15,413 | ) | |||||||
24
Statement of Investments
| Shares | Description | Value | ||||||||
Common Stocks – 96.7% | ||||||||||
| Aerospace & Defense – 4.2% | ||||||||||
| 127,400 | Lockheed Martin Corp. | $ | 9,283,638 | |||||||
| 4,700 | Northrop Grumman Corp. | 301,270 | ||||||||
| 21,000 | Raytheon Co. | 911,400 | ||||||||
| 12,700 | Rockwell Collins, Inc. | 675,005 | ||||||||
| 217,750 | The Boeing Co. | 15,828,247 | ||||||||
| 26,999,560 | ||||||||||
| Airlines – 0.3% | ||||||||||
| 116,200 | Southwest Airlines Co. | 1,948,674 | ||||||||
| Auto Components – 0.5% | ||||||||||
| 55,700 | Autoliv, Inc. | 2,982,735 | ||||||||
| Banks – 0.2% | ||||||||||
| 14,600 | UnionBanCal Corp. | 1,008,714 | ||||||||
| Biotechnology – 5.1% | ||||||||||
| 215,000 | Amgen, Inc.* | 16,230,350 | ||||||||
| 40,000 | Celgene Corp.* | 1,520,000 | ||||||||
| 165,150 | Genentech, Inc.* | 14,151,703 | ||||||||
| 16,900 | Genzyme Corp.* | 1,171,846 | ||||||||
| 33,073,899 | ||||||||||
| Chemicals – 1.8% | ||||||||||
| 141,750 | Monsanto Co. | 11,889,990 | ||||||||
| Commercial Services & Supplies – 1.9% | ||||||||||
| 72,400 | CheckFree Corp.* | 3,580,904 | ||||||||
| 99,900 | Global Payments, Inc. | 5,200,794 | ||||||||
| 15,900 | Republic Services, Inc. | 618,033 | ||||||||
| 30,800 | The Brink’s Co. | 1,508,276 | ||||||||
| 14,000 | The Corporate Executive Board Co. | 1,400,000 | ||||||||
| 12,308,007 | ||||||||||
| Communications Equipment – 5.2% | ||||||||||
| 1,133,800 | Cisco Systems, Inc.* | 22,948,112 | ||||||||
| 425,800 | Corning, Inc.* | 10,393,778 | ||||||||
| 33,341,890 | ||||||||||
| Computers & Peripherals – 3.4% | ||||||||||
| 205,200 | EMC Corp.* | 2,876,904 | ||||||||
| 299,750 | Hewlett-Packard Co. | 9,834,798 | ||||||||
| 8,600 | International Business Machines Corp. | 690,064 | ||||||||
| 402,500 | Western Digital Corp.* | 8,955,625 | ||||||||
| 22,357,391 | ||||||||||
| Diversified Financials – 4.3% | ||||||||||
| 193,300 | AmeriCredit Corp.*(a) | 5,702,350 | ||||||||
| 26,500 | Ameriprise Financial, Inc. | 1,205,220 | ||||||||
| 56,800 | J.P. Morgan Chase & Co. | 2,336,752 | ||||||||
| 101,600 | Merrill Lynch & Co., Inc. | 7,844,536 | ||||||||
| 165,852 | Moody’s Corp. | 11,112,084 | ||||||||
| 28,200,942 | ||||||||||
| Diversified Telecommunication Services – 0.8% | ||||||||||
| 117,100 | CenturyTel, Inc. | 4,213,258 | ||||||||
| 46,547 | Sprint Nextel Corp. | 1,118,524 | ||||||||
| 5,331,782 | ||||||||||
| Electric Utilities – 1.3% | ||||||||||
| 221,000 | PG&E Corp. | 8,409,050 | ||||||||
| Electrical Equipment – 1.5% | ||||||||||
| 41,000 | Emerson Electric Co. | 3,354,210 | ||||||||
| 112,500 | Energizer Holdings, Inc.* | 6,145,875 | ||||||||
| 9,500,085 | ||||||||||
| Electronic Equipment & Instruments – 0.3% | ||||||||||
| 37,000 | Agilent Technologies, Inc.* | 1,332,000 | ||||||||
| 16,700 | Jabil Circuit, Inc.* | 632,095 | ||||||||
| 1,964,095 | ||||||||||
| Energy Equipment & Services – 0.4% | ||||||||||
| 28,450 | Helmerich & Payne, Inc. | 1,871,157 | ||||||||
| 9,800 | Unit Corp.* | 521,066 | ||||||||
| 2,392,223 | ||||||||||
| Food & Drug Retailing – 1.5% | ||||||||||
| 40,100 | CVS Corp. | 1,136,033 | ||||||||
| 101,700 | Safeway, Inc. | 2,472,327 | ||||||||
| 112,400 | SUPERVALU, Inc. | 3,551,840 | ||||||||
| 42,100 | The Kroger Co.* | 843,684 | ||||||||
| 40,050 | Walgreen Co. | 1,796,643 | ||||||||
| 9,800,527 | ||||||||||
| Food Products – 1.2% | ||||||||||
| 181,800 | Archer-Daniels-Midland Co. | 5,766,696 | ||||||||
| 32,400 | Pilgrim’s Pride Corp. | 747,144 | ||||||||
| 106,900 | Tyson Foods, Inc. | 1,446,357 | ||||||||
| 7,960,197 | ||||||||||
| Healthcare Equipment & Supplies – 2.6% | ||||||||||
| 29,900 | Advanced Medical Optics, Inc.* | 1,329,952 | ||||||||
| 99,700 | Baxter International, Inc. | 3,773,645 | ||||||||
| 28,000 | Becton, Dickinson and Co. | 1,787,800 | ||||||||
| 24,500 | Edwards Lifesciences Corp.* | 1,013,075 | ||||||||
| 30,600 | Guidant Corp. | 2,348,856 | ||||||||
| 7,800 | Intuitive Surgical, Inc.* | 703,560 | ||||||||
| 12,600 | Millipore Corp.* | 873,558 | ||||||||
| 13,300 | Respironics, Inc.* | 483,588 | ||||||||
| 100,600 | St. Jude Medical, Inc.* | 4,587,360 | ||||||||
| 16,901,394 | ||||||||||
| Healthcare Providers & Services – 5.4% | ||||||||||
| 98,900 | Aetna, Inc. | 5,043,900 | ||||||||
| 243,200 | AmerisourceBergen Corp. | 11,184,768 | ||||||||
| 97,800 | Express Scripts, Inc.* | 8,535,006 | ||||||||
| 27,100 | Humana, Inc.* | 1,400,257 | ||||||||
| 168,300 | McKesson Corp. | 9,110,079 | ||||||||
| 35,274,010 | ||||||||||
25
Statement of Investments (continued)
| Shares | Description | Value | ||||||||
Common Stocks – (continued) | ||||||||||
| Hotels, Restaurants & Leisure – 2.6% | ||||||||||
| 106,900 | Darden Restaurants, Inc. | $ | 4,483,386 | |||||||
| 72,650 | Marriott International, Inc. | 4,969,260 | ||||||||
| 93,400 | Starbucks Corp.* | 3,392,288 | ||||||||
| 84,150 | Yum! Brands, Inc. | 4,013,955 | ||||||||
| 16,858,889 | ||||||||||
| Household Durables – 0.7% | ||||||||||
| 72,800 | Toro Co. | 3,358,264 | ||||||||
| 14,000 | Whirlpool Corp. | 1,257,060 | ||||||||
| 4,615,324 | ||||||||||
| Household Products – 4.5% | ||||||||||
| 62,600 | Colgate-Palmolive Co. | 3,410,448 | ||||||||
| 425,629 | Procter & Gamble Co. | 25,507,946 | ||||||||
| 28,918,394 | ||||||||||
| Industrial Conglomerates – 4.6% | ||||||||||
| 89,500 | 3M Co. | 6,586,305 | ||||||||
| 700,700 | General Electric Co. | 23,032,009 | ||||||||
| 29,618,314 | ||||||||||
| Insurance – 3.5% | ||||||||||
| 104,200 | Loews Corp. | 9,613,492 | ||||||||
| 171,400 | MBIA, Inc. | 10,068,036 | ||||||||
| 54,500 | W.R. Berkley Corp. | 3,155,005 | ||||||||
| 22,836,533 | ||||||||||
| Internet Software & Services – 3.3% | ||||||||||
| 45,125 | Google, Inc.* | 16,363,228 | ||||||||
| 220,100 | McAfee, Inc.* | 5,119,526 | ||||||||
| 21,482,754 | ||||||||||
| IT Consulting & Services – 1.4% | ||||||||||
| 170,150 | Computer Sciences Corp.* | 9,245,951 | ||||||||
| Leisure Equipment & Products – 0.1% | ||||||||||
| 12,200 | Polaris Industries, Inc. | 610,610 | ||||||||
| Machinery – 0.5% | ||||||||||
| 45,000 | Caterpillar, Inc. | 3,288,600 | ||||||||
| Media – 4.8% | ||||||||||
| 93,059 | CBS Corp. Class B | 2,276,223 | ||||||||
| 86,200 | Clear Channel Communications, Inc. | 2,439,460 | ||||||||
| 1,123,300 | Liberty Media Corp. Series A* | 9,255,992 | ||||||||
| 32,550 | Regal Entertainment Group(a) | 619,101 | ||||||||
| 60,400 | The McGraw-Hill Cos., Inc. | 3,206,636 | ||||||||
| 575,300 | Time Warner, Inc. | 9,958,443 | ||||||||
| 89,459 | Viacom, Inc. Class B* | 3,574,782 | ||||||||
| 31,330,637 | ||||||||||
| Metals & Mining – 0.3% | ||||||||||
| 27,700 | Southern Copper Corp.(a) | 2,206,305 | ||||||||
| Multiline Retail – 0.5% | ||||||||||
| 24,900 | Dillard’s, Inc. | 614,283 | ||||||||
| 15,100 | Nordstrom, Inc. | 573,800 | ||||||||
| 42,500 | Wal-Mart Stores, Inc. | 1,927,800 | ||||||||
| 3,115,883 | ||||||||||
| Oil & Gas – 3.2% | ||||||||||
| 5,600 | Anadarko Petroleum Corp. | 555,296 | ||||||||
| 128,400 | Devon Energy Corp. | 7,528,092 | ||||||||
| 63,300 | EOG Resources, Inc. | 4,266,420 | ||||||||
| 116,050 | Sunoco, Inc. | 8,599,305 | ||||||||
| 20,949,113 | ||||||||||
| Pharmaceuticals – 6.9% | ||||||||||
| 97,300 | Allergan, Inc.(a) | 10,533,698 | ||||||||
| 16,500 | Barr Pharmaceuticals, Inc.* | 1,108,470 | ||||||||
| 412,900 | Johnson & Johnson | 23,803,685 | ||||||||
| 266,000 | Merck & Co., Inc. | 9,272,760 | ||||||||
| 44,718,613 | ||||||||||
| Real Estate – 0.3% | ||||||||||
| 26,600 | ProLogis | 1,397,032 | ||||||||
| 25,700 | Ventas, Inc. | 796,700 | ||||||||
| 2,193,732 | ||||||||||
| Road & Rail – 1.6% | ||||||||||
| 92,200 | J.B. Hunt Transportation Services, Inc. | 2,181,452 | ||||||||
| 154,600 | Norfolk Southern Corp. | 7,912,428 | ||||||||
| 10,093,880 | ||||||||||
| Semiconductor Equipment & Products – 5.9% | ||||||||||
| 57,700 | Advanced Micro Devices, Inc.* | 2,231,259 | ||||||||
| 231,200 | Freescale Semiconductor, Inc. Class B* | 6,251,648 | ||||||||
| 508,650 | Intel Corp. | 10,478,190 | ||||||||
| 67,200 | LSI Logic Corp.* | 655,200 | ||||||||
| 318,700 | Micron Technology, Inc.* | 4,943,037 | ||||||||
| 453,850 | Texas Instruments, Inc. | 13,547,422 | ||||||||
| 38,106,756 | ||||||||||
| Software – 4.1% | ||||||||||
| 234,700 | Autodesk, Inc. | 8,836,455 | ||||||||
| 100,600 | Cadence Design Systems, Inc.* | 1,785,650 | ||||||||
| 11,900 | Intuit Inc.* | 578,102 | ||||||||
| 519,700 | Microsoft Corp. | 13,979,930 | ||||||||
| 66,200 | Symantec Corp.* | 1,118,118 | ||||||||
| 26,298,255 | ||||||||||
| Specialty Retail – 3.2% | ||||||||||
| 186,700 | AutoNation, Inc.* | 3,903,897 | ||||||||
| 57,400 | Chico’s FAS, Inc.* | 2,700,670 | ||||||||
| 401,823 | Circuit City Stores, Inc. | 9,655,807 | ||||||||
| 24,000 | Lowe’s Companies, Inc. | 1,636,320 | ||||||||
| 50,550 | Men’s Wearhouse, Inc.* | 1,583,226 | ||||||||
| 65,500 | Payless ShoeSource, Inc.* | 1,552,350 | ||||||||
| 21,032,270 | ||||||||||
26
| Shares | Description | Value | ||||||||
Common Stocks – (continued) | ||||||||||
| Textiles & Apparel – 1.7% | ||||||||||
| 317,550 | Coach, Inc.* | $ | 11,342,886 | |||||||
| Tobacco – 1.1% | ||||||||||
| 100,350 | Altria Group, Inc. | 7,215,165 | ||||||||
| Wireless Telecommunication Services – 0.1% | ||||||||||
| 9,400 | Telephone & Data Systems, Inc. Special Shares | 337,460 | ||||||||
| TOTAL COMMON STOCKS | ||||||||||
| (Cost $562,254,331) | $ | 628,061,489 | ||||||||
| Principal | Interest | Maturity | ||||||||||||||
| Amount | Rate | Date | Value | |||||||||||||
Repurchase Agreement – 2.6% | ||||||||||||||||
| Joint Repurchase Agreement Account II(b) | ||||||||||||||||
| $ | 16,600,000 | 4.57 | % | 03/01/2006 | $ | 16,600,000 | ||||||||||
| Maturity Value: $16,602,106 | ||||||||||||||||
| (Cost $16,600,000) | ||||||||||||||||
| TOTAL INVESTMENTS BEFORE SECURITIES LENDING COLLATERAL | ||||||||||||||||
| (Cost $578,854,331) | $ | 644,661,489 | ||||||||||||||
| Shares | Description | Value | ||||||||
Securities Lending Collateral – 2.9% | ||||||||||
| 18,741,150 | Boston Global Investment Trust – Enhanced Portfolio | $ | 18,741,150 | |||||||
| (Cost $18,741,150) | ||||||||||
| TOTAL INVESTMENTS – 102.2% | ||||||||||
| (Cost $597,595,481) | $ | 663,402,639 | ||||||||
| The percentage shown for each investment category reflects the value of investments in that category as a percentage of net assets. |
| * | Non-income producing security. | |
| (a) | All or portion of security is on loan. | |
| (b) | Joint repurchase agreement was entered into on February 28, 2006. Additional information appears on page 33. |
| ADDITIONAL INVESTMENT INFORMATION |
FUTURES CONTRACTS — At February 28, 2006, the following futures contracts were open as follows:
| Number of | Settlement | Market | Unrealized | |||||||||||
| Type | Contracts Long | Month | Value | Loss | ||||||||||
| S&P 500 Index | 295 | March 2006 | $ | 18,915,400 | $ | (15,024 | ) | |||||||
27
Statement of Investments
| Shares | Description | Value | ||||||||
Common Stocks – 96.8% | ||||||||||
| Aerospace & Defense – 2.1% | ||||||||||
| 165,100 | AAR Corp.* | $ | 4,178,681 | |||||||
| 2,025 | Aeroflex, Inc.* | 26,325 | ||||||||
| 44,900 | Innovative Solutions & Support, Inc.* | 633,539 | ||||||||
| 65,300 | Kaman Corp. | 1,482,963 | ||||||||
| 75,950 | Triumph Group, Inc.* | 3,178,508 | ||||||||
| 96,750 | United Industrial Corp.(a) | 4,998,105 | ||||||||
| 14,498,121 | ||||||||||
| Airlines – 1.2% | ||||||||||
| 217,650 | Alaska Air Group, Inc.* | 6,975,683 | ||||||||
| 98,400 | Mesa Air Group, Inc.*(a) | 1,123,728 | ||||||||
| 8,099,411 | ||||||||||
| Banks – 6.9% | ||||||||||
| 175,350 | Bank of Hawaii Corp. | 9,363,690 | ||||||||
| 5,900 | Capitol Bancorp Ltd. | 255,706 | ||||||||
| 62,200 | City National Corp. | 4,724,712 | ||||||||
| 71,750 | Corus Bankshares, Inc.(a) | 4,308,588 | ||||||||
| 31,450 | First Charter Corp. | 770,840 | ||||||||
| 9,850 | First Citizens BancShares, Inc. | 1,843,526 | ||||||||
| 60,300 | FirstFed Financial Corp.*(a) | 3,618,603 | ||||||||
| 18,575 | IBERIABANK Corp. | 1,072,892 | ||||||||
| 52,500 | Irwin Financial Corp. | 1,052,100 | ||||||||
| 76,300 | Nara Bancorp, Inc. | 1,332,961 | ||||||||
| 123,210 | PFF Bancorp, Inc. | 3,872,490 | ||||||||
| 17,600 | PrivateBancorp, Inc. | 667,568 | ||||||||
| 17,600 | Provident Bankshares Corp. | 640,112 | ||||||||
| 183,850 | SVB Financial Group* | 9,374,511 | ||||||||
| 46,400 | United Community Financial Corp. | 567,936 | ||||||||
| 45,900 | Westcorp | 3,297,915 | ||||||||
| 76,800 | Wilshire Bancorp, Inc. | 1,478,400 | ||||||||
| 48,242,550 | ||||||||||
| Biotechnology – 2.7% | ||||||||||
| 117,050 | Alkermes, Inc.* | 2,974,241 | ||||||||
| 114,100 | Applera Corp. – Celera Genomics Group* | 1,311,009 | ||||||||
| 9,200 | Cephalon, Inc.* | 731,216 | ||||||||
| 98,350 | Kos Pharmaceuticals, Inc.* | 4,314,614 | ||||||||
| 70,800 | Millennium Pharmaceuticals, Inc.* | 741,984 | ||||||||
| 68,600 | OraSure Technologies, Inc.* | 653,072 | ||||||||
| 46,600 | PDL BioPharma Inc.* | 1,459,046 | ||||||||
| 27,600 | Serologicals Corp.* | 667,644 | ||||||||
| 16,800 | Techne Corp.* | 999,096 | ||||||||
| 85,100 | United Therapeutics Corp.* | 5,245,564 | ||||||||
| 19,097,486 | ||||||||||
| Building Products – 0.8% | ||||||||||
| 153,050 | Griffon Corp.* | 3,599,736 | ||||||||
| 21,400 | Universal Forest Products, Inc. | 1,323,162 | ||||||||
| 12,000 | USG Corp.*(a) | 1,013,760 | ||||||||
| 5,936,658 | ||||||||||
| Chemicals – 0.3% | ||||||||||
| 39,967 | A. Schulman, Inc. | 936,427 | ||||||||
| 19,100 | Arch Chemicals, Inc. | 539,002 | ||||||||
| 37,000 | Innospec, Inc. | 862,100 | ||||||||
| 2,337,529 | ||||||||||
| Commercial Services & Supplies – 6.8% | ||||||||||
| 184,600 | Administaff, Inc. | 8,759,270 | ||||||||
| 258,350 | Arbitron, Inc. | 10,127,320 | ||||||||
| 37,852 | Casella Waste Systems, Inc.* | 535,606 | ||||||||
| 47,000 | Cenveo, Inc.* | 662,230 | ||||||||
| 224,300 | CSG Systems International, Inc.* | 4,930,114 | ||||||||
| 26,500 | FTI* | 740,410 | ||||||||
| 101,800 | Global Payments, Inc. | 5,299,708 | ||||||||
| 18,655 | John H. Harland Co. | 675,124 | ||||||||
| 58,700 | Labor Ready, Inc.* | 1,442,259 | ||||||||
| 25,227 | NCO Group, Inc.* | 566,851 | ||||||||
| 84,200 | Pre-Paid Legal Services, Inc.(a) | 3,040,462 | ||||||||
| 330,800 | Spherion Corp.* | 3,301,384 | ||||||||
| 42,700 | StarTek, Inc. | 841,190 | ||||||||
| 96,200 | The Brink’s Co.(a) | 4,710,914 | ||||||||
| 62,700 | The Standard Register Co. | 1,029,534 | ||||||||
| 31,550 | Universal Technical Institute, Inc.* | 972,055 | ||||||||
| 47,634,431 | ||||||||||
| Communications Equipment – 1.2% | ||||||||||
| 55,300 | ADTRAN, Inc. | 1,521,856 | ||||||||
| 104,500 | Audiovox Corp.* | 1,334,465 | ||||||||
| 102,400 | Comtech Telecommunications Corp.* | 3,208,192 | ||||||||
| 74,700 | Ditech Communications Corp.* | 770,157 | ||||||||
| 35,300 | DSP Group, Inc.* | 949,570 | ||||||||
| 28,100 | InterDigital Communications Corp.* | 723,575 | ||||||||
| 8,507,815 | ||||||||||
| Computers & Peripherals – 2.9% | ||||||||||
| 109,800 | Hypercom Corp.* | 844,362 | ||||||||
| 190,900 | Intergraph Corp.* | 6,922,034 | ||||||||
| 199,900 | Komag, Inc.*(a) | 9,363,316 | ||||||||
| 28,200 | Synaptics, Inc.* | 662,418 | ||||||||
| 124,500 | Western Digital Corp.* | 2,770,125 | ||||||||
| 20,562,255 | ||||||||||
| Construction & Engineering – 0.6% | ||||||||||
| 300 | Comfort Systems USA, Inc. | 3,297 | ||||||||
| 93,000 | EMCOR Group, Inc.* | 4,053,870 | ||||||||
| 4,057,167 | ||||||||||
| Construction Materials – 0.1% | ||||||||||
| 12,600 | Eagle Materials, Inc. | 682,038 | ||||||||
| Distributors – 1.1% | ||||||||||
| 69,375 | Brightpoint, Inc.* | 1,962,619 | ||||||||
| 149,400 | Handleman Co. | 1,468,602 | ||||||||
| 68,700 | WESCO International, Inc.* | 3,937,884 | ||||||||
| 7,369,105 | ||||||||||
28
| Shares | Description | Value | ||||||||
Common Stocks – (continued) | ||||||||||
| Diversified Financials – 3.3% | ||||||||||
| 126,800 | AmeriCredit Corp.* | $ | 3,740,600 | |||||||
| 37,300 | Apollo Investment Corp. | 700,867 | ||||||||
| 148,000 | CBIZ, Inc.* | 1,074,480 | ||||||||
| 151,100 | CompuCredit Corp.*(a) | 5,711,580 | ||||||||
| 2,025 | Financial Federal Corp. | 56,558 | ||||||||
| 17,900 | Greenhill & Co., Inc.(a) | 1,168,870 | ||||||||
| 126,750 | Investment Technology Group, Inc.* | 5,764,590 | ||||||||
| 22,700 | optionsXpress Holdings, Inc. | 698,706 | ||||||||
| 67,700 | Portfolio Recovery Associates, Inc.* | 3,311,207 | ||||||||
| 750 | Stifel Financial Corp.* | 28,748 | ||||||||
| 34,200 | World Acceptance Corp.* | 881,676 | ||||||||
| 23,137,882 | ||||||||||
| Diversified Telecommunication Services – 0.4% | ||||||||||
| 72,300 | Commonwealth Telephone Enterprises, Inc. | 2,333,844 | ||||||||
| 1,233 | TALK America Holdings, Inc.* | 10,517 | ||||||||
| 57,400 | Time Warner Telecom, Inc.* | 724,962 | ||||||||
| 3,069,323 | ||||||||||
| Electric Utilities – 0.4% | ||||||||||
| 189,500 | Sierra Pacific Resources*(a) | 2,698,480 | ||||||||
| Electrical Equipment – 1.5% | ||||||||||
| 78,200 | A.O. Smith Corp. | 3,620,660 | ||||||||
| 24,700 | Acuity Brands, Inc. | 975,403 | ||||||||
| 17,900 | Brady Corp. | 661,942 | ||||||||
| 21,700 | Encore Wire Corp.* | 676,823 | ||||||||
| 28,000 | II-VI, Inc.* | 509,320 | ||||||||
| 19,200 | LaBarge, Inc.* | 321,408 | ||||||||
| 38,400 | The Genlyte Group, Inc.* | 2,376,192 | ||||||||
| 42,900 | Woodward Governor Co. | 1,379,235 | ||||||||
| 10,520,983 | ||||||||||
| Electronic Equipment & Instruments – 3.8% | ||||||||||
| 30,100 | Avnet, Inc.* | 756,413 | ||||||||
| 92,000 | Coherent, Inc.* | 2,986,320 | ||||||||
| 251,650 | Exar Corp.* | 3,133,042 | ||||||||
| 80,200 | Itron, Inc.* | 4,768,692 | ||||||||
| 91,800 | Lexar Media, Inc.*(a) | 615,060 | ||||||||
| 72,350 | Methode Electronics, Inc. | 887,735 | ||||||||
| 106,950 | Plexus Corp.* | 3,589,242 | ||||||||
| 13,400 | Rofin-Sinar Technologies, Inc.* | 705,912 | ||||||||
| 40,900 | Tech Data Corp.* | 1,698,577 | ||||||||
| 50,900 | Technitrol, Inc. | 1,113,692 | ||||||||
| 147,300 | Teledyne Technologies, Inc.* | 4,880,049 | ||||||||
| 52,000 | TTM Technologies, Inc.* | 671,320 | ||||||||
| 17,550 | Varian, Inc.* | 700,245 | ||||||||
| 26,506,299 | ||||||||||
| Energy Equipment & Services – 3.6% | ||||||||||
| 129,100 | Cal Dive International, Inc.* | 4,545,611 | ||||||||
| 71,050 | Hornbeck Offshore Services, Inc.* | 2,284,968 | ||||||||
| 88,600 | Parker Drilling Co.* | 819,550 | ||||||||
| 98,200 | RPC, Inc. | 2,080,858 | ||||||||
| 20,600 | TETRA Technologies, Inc.* | 774,560 | ||||||||
| 121,550 | Universal Compression Holdings, Inc.* | 5,317,812 | ||||||||
| 230,400 | Veritas DGC, Inc.* | 9,706,752 | ||||||||
| 25,530,111 | ||||||||||
| Food & Drug Retailing – 2.2% | ||||||||||
| 96,725 | Flowers Foods, Inc. | 2,659,937 | ||||||||
| 174,181 | Longs Drug Stores Corp. | 6,683,325 | ||||||||
| 165,750 | Pathmark Stores, Inc.* | 1,667,445 | ||||||||
| 20,900 | SUPERVALU, Inc. | 660,440 | ||||||||
| 477,500 | Terra Industries, Inc.*(a) | 3,385,475 | ||||||||
| 11,600 | The Pantry, Inc.* | 686,372 | ||||||||
| 15,742,994 | ||||||||||
| Food Products – 1.2% | ||||||||||
| 64,400 | Del Monte Foods Co. | 700,672 | ||||||||
| 926 | Seaboard Corp. | 1,383,444 | ||||||||
| 143,600 | USANA Health Sciences, Inc.*(a) | 6,196,340 | ||||||||
| 8,280,456 | ||||||||||
| Gas Utilities – 0.1% | ||||||||||
| 16,600 | Nicor, Inc. | 712,638 | ||||||||
| Healthcare Equipment & Supplies – 6.3% | ||||||||||
| 27,700 | 1-800 Contacts, Inc.*(a) | 374,227 | ||||||||
| 19,200 | Advanced Medical Optics, Inc.* | 854,016 | ||||||||
| 255,900 | Applera Corp. – Applied Biosystems Group | 7,234,293 | ||||||||
| 26,800 | ArthroCare Corp.* | 1,210,556 | ||||||||
| 13,500 | Bio-Rad Laboratories, Inc.* | 773,685 | ||||||||
| 31,350 | CNS, Inc. | 651,766 | ||||||||
| 19,700 | Computer Programs and Systems, Inc. | 905,412 | ||||||||
| 143,800 | Haemonetics Corp.* | 7,448,840 | ||||||||
| 16,500 | Hologic, Inc.* | 789,195 | ||||||||
| 147,200 | Immucor, Inc.* | 4,389,504 | ||||||||
| 12,500 | LCA-Vision, Inc. | 545,000 | ||||||||
| 170,800 | Mentor Corp. | 7,351,232 | ||||||||
| 92,700 | Molecular Devices Corp.* | 2,950,641 | ||||||||
| 26,400 | STERIS Corp. | 653,928 | ||||||||
| 81,900 | SurModics, Inc.*(a) | 3,174,444 | ||||||||
| 49,700 | Ventana Medical Systems, Inc.* | 1,802,619 | ||||||||
| 109,200 | Viasys Healthcare, Inc.* | 3,186,456 | ||||||||
| 44,295,814 | ||||||||||
| Healthcare Providers & Services – 2.1% | ||||||||||
| 76,600 | Cantel Medical Corp.* | 1,311,392 | ||||||||
| 96,300 | Genesis HealthCare Corp.* | 3,827,925 | ||||||||
| 40,158 | Gentiva Health Services, Inc.* | 669,032 | ||||||||
| 176,450 | Kindred Healthcare, Inc.* | 3,814,849 | ||||||||
| 67,150 | Odyssey HealthCare, Inc.* | 1,263,763 | ||||||||
| 146,700 | Stewart Enterprises, Inc. | 743,769 | ||||||||
| 79,650 | Sunrise Senior Living, Inc.* | 2,824,389 | ||||||||
| 14,455,119 | ||||||||||
29
Statement of Investments (continued)
| Shares | Description | Value | ||||||||
Common Stocks – (continued) | ||||||||||
| Hotels, Restaurants & Leisure – 4.3% | ||||||||||
| 23,900 | Bob Evans Farms, Inc. | $ | 697,163 | |||||||
| 218,500 | Choice Hotels International, Inc. | 9,729,805 | ||||||||
| 65,850 | Dave & Buster’s, Inc.* | 1,185,300 | ||||||||
| 171,500 | Domino’s Pizza, Inc. | 4,373,250 | ||||||||
| 87,800 | Landry’s Restaurants, Inc.(a) | 2,710,386 | ||||||||
| 45,838 | Lone Star Steakhouse & Saloon, Inc. | 1,235,792 | ||||||||
| 188,300 | Papa John’s International, Inc.* | 6,195,070 | ||||||||
| 365,300 | Six Flags, Inc.*(a) | 3,853,915 | ||||||||
| 29,980,681 | ||||||||||
| Household Durables – 1.3% | ||||||||||
| 252,700 | American Greetings Corp. | 5,301,646 | ||||||||
| 76,300 | Furniture Brands International, Inc. | 1,886,136 | ||||||||
| 68,600 | Kimball International, Inc. Class B | 972,062 | ||||||||
| 35,147 | Universal Electronics, Inc.* | 631,240 | ||||||||
| 8,791,084 | ||||||||||
| Insurance – 4.0% | ||||||||||
| 30,200 | Argonaut Group, Inc.* | 1,102,904 | ||||||||
| 24,081 | FBL Financial Group, Inc. | 824,052 | ||||||||
| 274,200 | Fremont General Corp. | 6,504,024 | ||||||||
| 113,000 | LandAmerica Financial Group, Inc.(a) | 7,537,100 | ||||||||
| 20,100 | Odyssey Re Holdings Corp.(a) | 471,948 | ||||||||
| 183,550 | Stewart Information Services Corp. | 8,617,672 | ||||||||
| 61,900 | Zenith National Insurance Corp. | 3,187,850 | ||||||||
| 28,245,550 | ||||||||||
| Internet & Catalog Retail – 0.1% | ||||||||||
| 32,788 | Coldwater Creek, Inc.* | 736,735 | ||||||||
| Internet Software & Services – 2.9% | ||||||||||
| 177,050 | Digital Insight Corp.* | 5,851,503 | ||||||||
| 79,897 | J2 Global Communications, Inc.* | 3,483,509 | ||||||||
| 318,600 | United Online, Inc. | 3,826,386 | ||||||||
| 120,600 | Websense, Inc.* | 7,454,286 | ||||||||
| 20,615,684 | ||||||||||
| IT Consulting & Services – 0.4% | ||||||||||
| 145,200 | Agilysys, Inc. | 2,074,908 | ||||||||
| 30,500 | ProQuest Co.* | 649,650 | ||||||||
| 2,724,558 | ||||||||||
| Machinery – 3.0% | ||||||||||
| 18,900 | Albany International Corp. | 702,513 | ||||||||
| 42,750 | Barnes Group, Inc. | 1,640,745 | ||||||||
| 117,400 | JLG Industries, Inc. | 6,925,426 | ||||||||
| 50,800 | NACCO Industries, Inc. | 7,051,040 | ||||||||
| 50,700 | Reliance Steel & Aluminum Co. | 4,177,173 | ||||||||
| 23,500 | Sun Hydraulics Corp. | 534,390 | ||||||||
| 21,031,287 | ||||||||||
| Media – 0.5% | ||||||||||
| 17,700 | John Wiley & Sons, Inc. | 666,405 | ||||||||
| 72,250 | Catalina Marketing Corp. | 1,602,505 | ||||||||
| 2,650 | Cox Radio, Inc.* | 36,650 | ||||||||
| 57,500 | NetFlix, Inc.*(a) | 1,541,575 | ||||||||
| 3,847,135 | ||||||||||
| Metals & Mining – 3.8% | ||||||||||
| 32,800 | Brush Engineered Materials, Inc.* | 571,048 | ||||||||
| 80,050 | Chaparral Steel Co.* | 3,667,091 | ||||||||
| 66,600 | Commercial Metals Co. | 3,016,314 | ||||||||
| 126,550 | Quanex Corp. | 7,854,958 | ||||||||
| 336,500 | Ryerson Tull, Inc.(a) | 8,493,260 | ||||||||
| 248,100 | USEC, Inc. | 3,086,364 | ||||||||
| 26,689,035 | ||||||||||
| Multi-Utilities – 0.4% | ||||||||||
| 137,400 | Avista Corp. | 2,693,040 | ||||||||
| Multiline Retail – 0.3% | ||||||||||
| 23,400 | Burlington Coat Factory Warehouse Corp. | 1,053,936 | ||||||||
| 14,000 | Dillard’s, Inc. | 345,380 | ||||||||
| 40,400 | Stein Mart, Inc. | 673,872 | ||||||||
| 2,073,188 | ||||||||||
| Office Electronics – 0.3% | ||||||||||
| 149,700 | IKON Office Solutions, Inc. | 1,968,555 | ||||||||
| Oil & Gas – 3.3% | ||||||||||
| 54,350 | Berry Petroleum Co. | 3,671,343 | ||||||||
| 30,300 | Encore Acquisition Co.* | 928,392 | ||||||||
| 18,600 | Equitable Resources, Inc. | 676,296 | ||||||||
| 47,800 | Harvest Natural Resources, Inc.* | 430,678 | ||||||||
| 163,450 | KCS Energy, Inc.* | 3,857,420 | ||||||||
| 19,700 | Pogo Producing Co. | 982,242 | ||||||||
| 94,600 | St. Mary Land & Exploration Co. | 3,631,694 | ||||||||
| 15,400 | Stone Energy Corp.* | 637,560 | ||||||||
| 197,100 | Swift Energy Co.* | 7,639,596 | ||||||||
| 84,200 | TransMontaigne, Inc.* | 634,868 | ||||||||
| 23,090,089 | ||||||||||
| Paper & Forest Products – 0.1% | ||||||||||
| 74,800 | Buckeye Technologies, Inc.* | 658,988 | ||||||||
| Personal Products – 0.2% | ||||||||||
| 43,600 | Parlux Fragrances, Inc.*(a) | 1,508,124 | ||||||||
| Pharmaceuticals – 1.4% | ||||||||||
| 221,750 | Alpharma, Inc. | 6,707,937 | ||||||||
| 65,500 | Endo Pharmaceuticals Holdings, Inc.* | 2,064,560 | ||||||||
| 75,250 | Perrigo Co. | 1,195,723 | ||||||||
| 9,968,220 | ||||||||||
| Real Estate – 6.2% | ||||||||||
| 13,400 | Acadia Realty Trust | 293,862 | ||||||||
| 13,553 | Brookfield Homes Corp.(a) | 673,720 | ||||||||
30
| Shares | Description | Value | ||||||||
Common Stocks – (continued) | ||||||||||
| Real Estate – (continued) | ||||||||||
| 26,300 | Capital Lease Funding, Inc. | $ | 285,092 | |||||||
| 175,700 | Commercial Net Lease Realty | 3,997,175 | ||||||||
| 39,300 | Cousins Properties, Inc. | 1,205,331 | ||||||||
| 48,200 | Entertainment Properties Trust | 1,993,070 | ||||||||
| 40,500 | Equity One, Inc. | 911,250 | ||||||||
| 190,750 | FelCor Lodging Trust, Inc. | 3,786,388 | ||||||||
| 60,600 | Highwoods Properties, Inc. | 1,960,410 | ||||||||
| 231,200 | HRPT Properties Trust | 2,478,464 | ||||||||
| 86,200 | Inland Real Estate Corp. | 1,326,618 | ||||||||
| 109,650 | National Health Investors, Inc. | 2,918,883 | ||||||||
| 43,700 | Nationwide Health Properties, Inc. | 984,124 | ||||||||
| 238,900 | New Century Financial Corp.(a) | 9,257,375 | ||||||||
| 52,100 | New Plan Excel Realty Trust | 1,305,105 | ||||||||
| 67,400 | NorthStar Realty Finance Corp. | 688,828 | ||||||||
| 36,400 | PS Business Parks, Inc. | 1,936,116 | ||||||||
| 22,900 | Ramco-Gershenson Properties Trust | 665,474 | ||||||||
| 333,350 | Senior Housing Properties Trust | 5,976,965 | ||||||||
| 36,800 | Trammell Crow Co.* | 1,195,264 | ||||||||
| 43,839,514 | ||||||||||
| Road & Rail – 0.9% | ||||||||||
| 137,700 | Dollar Thrifty Automotive Group, Inc.* | 5,560,326 | ||||||||
| 26,300 | GATX Corp. | 1,044,110 | ||||||||
| 6,604,436 | ||||||||||
| Semiconductor Equipment & Products – 3.2% | ||||||||||
| 427,000 | Cirrus Logic, Inc.* | 3,240,930 | ||||||||
| 30,700 | Cohu, Inc. | 648,384 | ||||||||
| 19,000 | Cymer, Inc.* | 854,620 | ||||||||
| 119,100 | Genesis Microchip, Inc.*(a) | 2,560,650 | ||||||||
| 130,400 | LSI Logic Corp.* | 1,271,400 | ||||||||
| 318,450 | MPS Group, Inc.* | 4,821,333 | ||||||||
| 25,400 | Netlogic Microsystems, Inc.* | 897,890 | ||||||||
| 112,000 | Photronics, Inc.* | 1,967,840 | ||||||||
| 127,200 | PortalPlayer Inc.*(a) | 3,213,072 | ||||||||
| 21,900 | Supertex, Inc.* | 737,373 | ||||||||
| 58,800 | Trident Microsystems, Inc.* | 1,642,872 | ||||||||
| 39,504 | Triquint Semiconductor, Inc.* | 187,249 | ||||||||
| 39,600 | Zoran Corp.* | 783,288 | ||||||||
| 22,826,901 | ||||||||||
| Software – 2.6% | ||||||||||
| 62,400 | ANSYS, Inc.* | 2,959,008 | ||||||||
| 69,600 | Blackbaud, Inc. | 1,273,680 | ||||||||
| 242,400 | Entrust, Inc.* | 896,880 | ||||||||
| 132,000 | Lawson Software, Inc.*(a) | 1,049,400 | ||||||||
| 7,400 | MicroStrategy, Inc.* | 678,432 | ||||||||
| 213,900 | Novell, Inc.* | 2,034,189 | ||||||||
| 22,500 | Quality Systems, Inc.*(a) | 1,557,450 | ||||||||
| 103,872 | SeaChange International, Inc.*(a) | 935,887 | ||||||||
| 66,071 | Sybase, Inc.* | 1,409,294 | ||||||||
| 114,500 | Synopsys, Inc.* | 2,504,115 | ||||||||
| 30,500 | The Ultimate Software Group, Inc.* | 713,700 | ||||||||
| 138,889 | Tradestation Group, Inc.*(a) | 2,205,557 | ||||||||
| 18,217,592 | ||||||||||
| Specialty Retail – 4.9% | ||||||||||
| 77,900 | Building Materials Holding Corp. | 5,242,670 | ||||||||
| 119,300 | Charlotte Russe Holdings, Inc.* | 2,171,260 | ||||||||
| 62,900 | Charming Shoppes, Inc.* | 842,231 | ||||||||
| 249,057 | Circuit City Stores, Inc. | 5,984,840 | ||||||||
| 82,900 | Dress Barn, Inc.*(a) | 3,579,622 | ||||||||
| 215,700 | Payless ShoeSource, Inc.* | 5,112,090 | ||||||||
| 76,400 | Sonic Automotive, Inc. | 2,023,836 | ||||||||
| 175,000 | Stage Stores, Inc. | 5,103,000 | ||||||||
| 5,700 | The Cato Corp. | 118,959 | ||||||||
| 104,900 | The Wet Seal, Inc.*(a) | 557,019 | ||||||||
| 17,600 | United Auto Group, Inc. | 761,024 | ||||||||
| 91,400 | United Rentals, Inc.* | 2,979,640 | ||||||||
| 34,476,191 | ||||||||||
| Textiles & Apparel – 1.1% | ||||||||||
| 42,750 | Charles & Colvard Ltd.(a) | 599,355 | ||||||||
| 2,400 | DHB Industries, Inc.* | 11,160 | ||||||||
| 160,650 | Guess?, Inc.* | 5,813,923 | ||||||||
| 84,200 | Hartmarx Corp.* | 730,014 | ||||||||
| 30,350 | Perry Ellis International, Inc.* | 668,003 | ||||||||
| 450 | Steven Madden, Ltd.* | 14,423 | ||||||||
| 13,875 | Stride Rite Corp. | 192,863 | ||||||||
| 8,029,741 | ||||||||||
| TOTAL COMMON STOCKS | ||||||||||
| (Cost $583,329,582) | $ | 680,590,993 | ||||||||
31
Statement of Investments (continued)
| Principal | Interest | Maturity | ||||||||||||||
| Amount | Rate | Date | Value | |||||||||||||
Repurchase Agreement – 1.2% | ||||||||||||||||
| Joint Repurchase Agreement Account II(b) | ||||||||||||||||
| $ | 8,200,000 | 4.57 | % | 03/01/2006 | $ | 8,200,000 | ||||||||||
| Maturity Value: $8,201,041 | ||||||||||||||||
| (Cost $8,200,000) | ||||||||||||||||
| TOTAL INVESTMENTS BEFORE SECURITIES LENDING COLLATERAL | ||||||||||||||||
| (Cost $591,529,582) | $ | 688,790,993 | ||||||||||||||
| Shares | Description | Value | ||||||||
Securities Lending Collateral – 12.5% | ||||||||||
| 87,723,500 | Boston Global Investment Trust – Enhanced Portfolio | $ | 87,723,500 | |||||||
| (Cost $87,723,500) | ||||||||||
| TOTAL INVESTMENTS – 110.5% | ||||||||||
| (Cost $679,253,082) | $ | 776,514,493 | ||||||||
| The percentage shown for each investment category reflects the value of investments in that category as a percentage of net assets. |
| * | Non-income producing security. | |
| (a) | All or portion of security is on loan. | |
| (b) | Joint repurchase agreement was entered into on February 28, 2006. Additional information appears on page 33. |
| ADDITIONAL INVESTMENT INFORMATION |
FUTURES CONTRACTS — At February 28, 2006, the following futures contracts were open as follows:
| Number of | Settlement | Market | Unrealized | |||||||||||||
| Type | Contracts Long | Month | Value | Gain | ||||||||||||
| Russell 2000 Index | 130 | March 2006 | $ | 9,516,000 | $ | 21,159 | ||||||||||
32
| ADDITIONAL INVESTMENT INFORMATION |
JOINT REPURCHASE AGREEMENT ACCOUNT II —
| Fund | Principal Amount | |||
| Structured Large Cap Value | $ | 30,800,000 | ||
| Structured U.S. Equity | 11,000,000 | |||
| Structured Large Cap Growth | 16,600,000 | |||
| Structured Small Cap Equity | 8,200,000 | |||
| Principal | Interest | Maturity | Maturity | |||||||||||||
| Repurchase Agreements | Amount | Rate | Date | Value | ||||||||||||
| Banc of America Securities LLC | $ | 3,019,900,000 | 4.56 | % | 03/01/2006 | $ | 3,020,282,521 | |||||||||
| Barclays Capital PLC | 3,000,000,000 | 4.57 | 03/01/2006 | 3,000,380,833 | ||||||||||||
| Credit Suisse First Boston LLC | 500,000,000 | 4.57 | 03/01/2006 | 500,063,472 | ||||||||||||
| Deutsche Bank Securities, Inc. | 3,020,000,000 | 4.57 | 03/01/2006 | 3,020,383,372 | ||||||||||||
| Greenwich Capital Markets | 300,000,000 | 4.58 | 03/01/2006 | 300,038,167 | ||||||||||||
| J.P. Morgan Securities, Inc. | 400,000,000 | 4.56 | 03/01/2006 | 400,050,667 | ||||||||||||
| Morgan Stanley & Co. | 2,925,000,000 | 4.57 | 03/01/2006 | 2,925,371,312 | ||||||||||||
| UBS Securities LLC | 1,500,000,000 | 4.57 | 03/01/2006 | 1,500,190,417 | ||||||||||||
| Wachovia Capital Markets | 400,000,000 | 4.58 | 03/01/2006 | 400,050,889 | ||||||||||||
TOTAL | $ | 15,064,900,000 | $ | 15,066,811,650 | ||||||||||||
33
Statement of Investments
| Shares | Description | Value | ||||||||
Common Stocks – 97.4% | ||||||||||
| Australia – 2.1% | ||||||||||
| 1,117 | APN News & Media Ltd. (Media) | $ | 3,926 | |||||||
| 27,278 | Aristocrat Leisure Ltd.(a) (Hotels, Restaurants & Leisure) | 242,617 | ||||||||
| 33,734 | Australia & New Zealand Banking Group Ltd. (Banks) | 641,595 | ||||||||
| 52,134 | Australian Gas Light Co. Ltd. (Gas Utilities) | 738,700 | ||||||||
| 43,317 | Australian Stock Exchange Ltd. (Diversified Financials) | 1,039,051 | ||||||||
| 595,345 | AXA Asia Pacific Holdings Ltd. (Insurance) | 2,570,839 | ||||||||
| 23,270 | BHP Billiton Ltd. (Metals & Mining) | 418,726 | ||||||||
| 85,586 | Brambles Industries Ltd.(a) (Commercial Services & Supplies) | 637,575 | ||||||||
| 95,204 | CFS Gandel Retail Trust (Real Estate) | 137,661 | ||||||||
| 26,809 | Challenger Financial Services Group Ltd. (Diversified Financials) | 76,900 | ||||||||
| 14,453 | Cochlear Ltd. (Healthcare Equipment & Supplies) | 524,061 | ||||||||
| 125,233 | Commonwealth Bank of Australia (Banks) | 4,157,264 | ||||||||
| 213,402 | Commonwealth Property Office Fund (Real Estate) | 213,196 | ||||||||
| 14,878 | CSL Ltd. (Pharmaceuticals) | 579,956 | ||||||||
| 1,060,618 | DB RREEF Trust (Real Estate) | 1,107,829 | ||||||||
| 84,878 | General Property Trust (Real Estate) | 260,857 | ||||||||
| 270,232 | ING Industrial Fund (Real Estate) | 458,454 | ||||||||
| 239,221 | Investa Property Group (Real Estate) | 356,321 | ||||||||
| 88,714 | Leighton Holdings Ltd. (Construction & Engineering) | 1,195,447 | ||||||||
| 16,836 | Macquarie Infrastructure Group (Transportation Infrastructure) | 43,515 | ||||||||
| 23,920 | National Australia Bank Ltd. (Banks) | 649,232 | ||||||||
| 581,954 | Qantas Airways Ltd. (Airlines) | 1,763,627 | ||||||||
| 140,589 | Rio Tinto Ltd.(a) (Metals & Mining) | 7,365,489 | ||||||||
| 300,494 | Santos Ltd. (Oil & Gas) | 2,525,683 | ||||||||
| 197,301 | Stockland (Real Estate) | 982,781 | ||||||||
| 152,837 | Suncorp-Metway Ltd. (Banks) | 2,313,949 | ||||||||
| 70,321 | Symbion Health Ltd. (Air Freight & Couriers) | 173,840 | ||||||||
| 556,284 | Telstra Corp. Ltd.(a) (Diversified Telecommunication Services) | 1,582,945 | ||||||||
| 2,512 | Westfield Group (Real Estate) | 33,111 | ||||||||
| 104,741 | Westpac Banking Corp. (Banks) | 1,829,082 | ||||||||
| 107,049 | Woolworths Ltd. (Food & Drug Retailing) | 1,457,925 | ||||||||
| 36,082,154 | ||||||||||
| Austria – 2.3% | ||||||||||
| 7,346 | Andritz AG (Machinery) | 950,219 | ||||||||
| 13,877 | Boehler-Uddeholm AG (Metals & Mining) | 2,603,352 | ||||||||
| 4,560 | Flughafen Wien AG* (Transportation Infrastructure) | 367,769 | ||||||||
| 18,482 | Oesterreichische Elektrizitaetswirtschafts AG (Verbund)(a) (Electric Utilities) | 8,596,034 | ||||||||
| 466,638 | Telekom Austria AG(a) (Diversified Telecommunication Services) | 10,673,548 | ||||||||
| 140,115 | voestalpine AG(a) (Metals & Mining) | 16,330,462 | ||||||||
| 39,521,384 | ||||||||||
| Belgium – 4.1% | ||||||||||
| 34,186 | Bekaert NV (Electrical Equipment) | 3,511,394 | ||||||||
| 1,826 | Cofinimmo (Real Estate) | 289,467 | ||||||||
| 6,366 | Compagnie Maritime Belge SA (Marine) | 206,267 | ||||||||
| 66,733 | Delhaize Group (Food & Drug Retailing) | 4,451,847 | ||||||||
| 69,087 | Dexia (Banks) | 1,715,852 | ||||||||
| 1,640,528 | Fortis (Diversified Financials) | 58,437,548 | ||||||||
| 68,612,375 | ||||||||||
34
| Shares | Description | Value | ||||||||
Common Stocks – (continued) | ||||||||||
| Denmark – 0.2% | ||||||||||
| 40,000 | Danske Bank A/S (Banks) | $ | 1,426,280 | |||||||
| 115,700 | H. Lundbeck A/S (Pharmaceuticals) | 2,382,471 | ||||||||
| 3,808,751 | ||||||||||
| Finland – 0.9% | ||||||||||
| 193,200 | Metso Corp. (Machinery) | 7,119,219 | ||||||||
| 462,900 | Nokia Oyj (Communications Equipment) | 8,613,605 | ||||||||
| 15,732,824 | ||||||||||
| France – 8.4% | ||||||||||
| 549,516 | BNP Paribas SA(a) (Banks) | 50,855,962 | ||||||||
| 655,412 | Bouygues SA(a) (Wireless Telecommunication Services) | 34,425,629 | ||||||||
| 204,038 | Business Objects SA* (Software) | 7,572,871 | ||||||||
| 323,886 | Cap Gemini SA(a) (IT Consulting & Services) | 15,968,643 | ||||||||
| 4,582 | Pinault-Printemps-Redoute SA* (Multiline Retail) | 527,863 | ||||||||
| 114,246 | Schneider Electric SA(a) (Electrical Equipment) | 11,673,986 | ||||||||
| 36,770 | Societe BIC SA (Commercial Services & Supplies) | 2,242,911 | ||||||||
| 37,258 | Societe Generale Series A (Banks) | 5,276,242 | ||||||||
| 194,686 | Sodexho Alliance SA(a) (Hotels, Restaurants & Leisure) | 8,283,462 | ||||||||
| 3,062 | Unibail (Real Estate) | 501,865 | ||||||||
| 125,976 | Vivendi Universal SA (Media) | 3,810,726 | ||||||||
| 141,140,160 | ||||||||||
| Germany – 9.9% | ||||||||||
| 675,854 | BASF AG(a) (Chemicals) | 50,970,459 | ||||||||
| 151,805 | DaimlerChrysler AG (Automobiles) | 8,417,325 | ||||||||
| 431,720 | Deutsche Bank AG(a) (Banks) | 47,638,267 | ||||||||
| 49,681 | Fresenius Medical Care AG(a) (Health Care Providers & Services) | 5,342,704 | ||||||||
| 319,252 | Merck KGaA(a) (Pharmaceuticals) | 31,968,738 | ||||||||
| 11,169 | Muenchener Rueckversicherungs-Gesellschaft AG (Insurance) | 1,513,848 | ||||||||
| 109,250 | RWE AG(a) (Multi-Utilities) | 9,369,511 | ||||||||
| 101,559 | Schering AG (Pharmaceuticals) | 7,308,494 | ||||||||
| 129,585 | ThyssenKrupp AG (Metals & Mining) | 3,287,114 | ||||||||
| 37,660 | TUI AG(a) (Hotels, Restaurants & Leisure) | 743,339 | ||||||||
| 5,416 | Wincor Nixdorf AG (Computers & Peripherals) | 690,589 | ||||||||
| 167,250,388 | ||||||||||
| Hong Kong – 3.8% | ||||||||||
| 423,500 | ASM Pacific Technology Ltd. (Semiconductor Equipment & Products) | 2,364,016 | ||||||||
| 1,088,500 | Boc Hong Kong Holdings Ltd. (Banks) | 2,186,058 | ||||||||
| 2,525,000 | Cathay Pacific Airways Ltd. (Airlines) | 4,663,772 | ||||||||
| 1,001,000 | Cheung Kong (Holdings) Ltd. (Real Estate) | 10,505,446 | ||||||||
| 1,573,000 | CLP Holdings Ltd. (Electric Utilities) | 8,983,226 | ||||||||
| 72,000 | Esprit Holdings Ltd. (Specialty Retail) | 550,648 | ||||||||
| 204,000 | Henderson Land Development Co. Ltd. (Real Estate) | 1,088,969 | ||||||||
| 604,000 | Hong Kong Electric Holdings Ltd. (Electric Utilities) | 2,773,481 | ||||||||
| 444,000 | Hong Kong Exchanges & Clearing Ltd. (Diversified Financials) | 2,269,606 | ||||||||
| 556,000 | Hutchison Whampoa Ltd. (Industrial Conglomerates) | 5,274,249 | ||||||||
| 2,000 | Kerry Properties Ltd. (Real Estate) | 6,369 | ||||||||
| 24,000 | Li & Fung Ltd. (Distributors) | 48,336 | ||||||||
| 746,000 | Link REIT* (Real Estate) | 1,629,913 | ||||||||
| 608,000 | New World Development Co., Ltd. (Real Estate) | 974,103 | ||||||||
| 15,900 | Orient Overseas International Ltd. (Marine) | 58,731 | ||||||||
| 810,000 | SCMP Group Ltd. (Media) | 301,790 | ||||||||
| 232,000 | Shangri-La Asia Ltd. (Hotels, Restaurants & Leisure) | 370,910 | ||||||||
| 1,240,000 | Sino Land Co. Ltd. (Real Estate) | 1,856,954 | ||||||||
| 335,500 | SmarTone Telecommunications Holdings Ltd. (Wireless Telecommunication Services) | 378,405 | ||||||||
| 172,000 | Swire Pacific Ltd. Series A (Diversified Financials) | 1,642,244 | ||||||||
| 581,000 | Television Broadcasts Ltd. (Media) | 3,269,010 | ||||||||
| 8,000 | Texwinca Holdings Ltd. (Textiles & Apparel) | 6,290 | ||||||||
| 909,600 | The Bank of East Asia Ltd. (Banks) | 3,122,195 | ||||||||
| 2,120,000 | The Wharf (Holdings) Ltd. (Real Estate) | 7,810,405 | ||||||||
| 194,500 | Wing Hang Bank Ltd. (Banks) | 1,497,919 | ||||||||
| 190,500 | Yue Yuen Industrial (Holdings) Ltd. (Specialty Retail) | 590,641 | ||||||||
| 64,223,686 | ||||||||||
35
Statement of Investments (continued)
| Shares | Description | Value | ||||||||
Common Stocks – (continued) | ||||||||||
| Italy – 2.8% | ||||||||||
| 2,893,776 | Banca Monte dei Paschi di Siena S.p.A.(a) (Banks) | $ | 14,967,688 | |||||||
| 26,504 | Benetton Group S.p.A. (Textiles & Apparel) | 337,711 | ||||||||
| 1,692,105 | Fiat S.p.A.*(a) (Automobiles) | 18,317,534 | ||||||||
| 286,004 | Finmeccanica S.p.A. (Aerospace & Defense) | 6,258,255 | ||||||||
| 483,753 | Intesa Banca S.p.A. (Banks) | 2,659,841 | ||||||||
| 203,251 | Italcementi S.p.A.(a) (Construction Materials) | 4,160,734 | ||||||||
| 46,701,763 | ||||||||||
| Japan – 29.0% | ||||||||||
| 29,800 | Aderans Co., Ltd. (Personal Products) | 823,879 | ||||||||
| 64,000 | Aisin Seiki Co., Ltd. (Auto Components) | 2,271,288 | ||||||||
| 75,000 | Ajinomoto Co., Inc. (Food Products) | 798,580 | ||||||||
| 900,200 | Alps Electric Co., Ltd.(a) (Electronic Equipment & Instruments) | 14,076,067 | ||||||||
| 645,000 | AMADA Co., Ltd. (Machinery) | 6,087,467 | ||||||||
| 120,600 | Aoyama Trading Co., Ltd. (Specialty Retail) | 3,714,925 | ||||||||
| 36,200 | Autobacs Seven Co., Ltd. (Specialty Retail) | 1,817,660 | ||||||||
| 43,000 | Canon Sales Co., Inc. (Office Electronics) | 919,481 | ||||||||
| 223,000 | Central Glass Co., Ltd. (Building Products) | 1,257,093 | ||||||||
| 254 | Central Japan Railway Co. (Road & Rail) | 2,487,412 | ||||||||
| 836,000 | Dai Nippon Printing Co., Ltd. (Commercial Services & Supplies) | 14,775,748 | ||||||||
| 7,000 | DAIICHI SANKYO Co. Ltd. (Pharmaceuticals) | 144,529 | ||||||||
| 2,824,000 | Daiwa Securities Group, Inc. (Diversified Financials) | 33,526,958 | ||||||||
| 870 | East Japan Railway Co. (Road & Rail) | 6,189,091 | ||||||||
| 214,000 | FUJI ELECTRIC HOLDINGS Co. Ltd. (Electrical Equipment) | 1,000,479 | ||||||||
| 7,500 | Fuji Soft ABC, Inc. (Software) | 211,450 | ||||||||
| 7,700 | GLORY Ltd. (Machinery) | 172,925 | ||||||||
| 629,000 | Gunze Ltd. (Textiles & Apparel) | 4,011,759 | ||||||||
| 805,000 | Hankyu Department Stores, Inc.(a) (Multiline Retail) | 7,105,519 | ||||||||
| 4,447,000 | Hitachi Ltd. (Electronic Equipment & Instruments) | 30,978,462 | ||||||||
| 103,000 | Hitachi Software Engineering Co., Ltd.(a) (Software) | 1,912,786 | ||||||||
| 107,200 | Hokkaido Electric Power Co., Inc. (Electric Utilities) | 2,516,156 | ||||||||
| 768,100 | Honda Motor Co. Ltd. (Automobiles) | 44,864,939 | ||||||||
| 224 | Japan Prime Realty Investment Corp. (Real Estate) | 691,903 | ||||||||
| 20 | Japan Real Estate Investment Corp. (Real Estate) | 179,704 | ||||||||
| 23 | Japan Retail Fund Investment Corp. (Real Estate) | 180,804 | ||||||||
| 36,000 | Kaken Pharmaceutical Co., Ltd. (Pharmaceuticals) | 297,155 | ||||||||
| 34,000 | Kansai Electric Power Co., Inc, (Electric Utilities) | 791,173 | ||||||||
| 36,000 | Kao Corp. (Household Products) | 977,849 | ||||||||
| 94,000 | Kirin Brewery Co., Ltd. (Beverages) | 1,237,058 | ||||||||
| 585,000 | Kubota Corp. (Machinery) | 5,721,203 | ||||||||
| 19,000 | Kyowa Hakko Kogyo Co. Ltd. (Pharmaceuticals) | 144,182 | ||||||||
| 71,300 | Kyushu Electric Power Co., Inc. (Electric Utilities) | 1,719,879 | ||||||||
| 52,100 | Lawson, Inc. (Food & Drug Retailing) | 1,945,300 | ||||||||
| 150,700 | Makita Corp. (Household Durables) | 4,382,667 | ||||||||
| 681,000 | Matsushita Electric Industrial Co., Ltd. (Household Durables) | 14,321,025 | ||||||||
| 13,000 | Matsushita Electric Works Ltd. (Electrical Equipment) | 151,442 | ||||||||
| 1,325,000 | Mitsubishi Chemical Holdings Corp.* (Chemicals) | 8,104,186 | ||||||||
36
| Shares | Description | Value | ||||||||
Common Stocks – (continued) | ||||||||||
| Japan – (continued) | ||||||||||
| 1,926,000 | Mitsubishi Heavy Industries Ltd. (Machinery) | $ | 9,045,958 | |||||||
| 1,798,000 | Mitsui Chemicals, Inc. (Chemicals) | 14,400,879 | ||||||||
| 261,000 | Mitsui Trust Holdings, Inc. (Diversified Financials) | 3,826,713 | ||||||||
| 91,500 | Namco Bandai Holdings, Inc. (Leisure Equipment & Products) | 1,136,685 | ||||||||
| 8,900 | Nintendo Co., Ltd. (Household Durables) | 1,312,551 | ||||||||
| 62 | Nippon Building Fund, Inc. (Real Estate) | 600,381 | ||||||||
| 2,391,000 | Nippon Oil Corp. (Oil & Gas) | 18,130,110 | ||||||||
| 8,898,000 | Nippon Steel Corp.(a) (Metals & Mining) | 35,461,385 | ||||||||
| 5,831 | Nippon Telephone & Telegraph Corp. (Diversified Telecommunication Services) | 25,177,786 | ||||||||
| 1,164,000 | Nippon Yusen Kabushiki Kaisha (Marine) | 7,572,073 | ||||||||
| 376,000 | Nishi-Nippon City Bank Ltd. (Banks) | 1,927,135 | ||||||||
| 251,000 | Nisshin Seifun Group, Inc. (Food Products) | 2,547,613 | ||||||||
| 4,300 | Nomura Research Institute Ltd. (IT Consulting & Services) | 491,072 | ||||||||
| 39,600 | Q.P. Corp. (Food Products) | 378,935 | ||||||||
| 62,300 | Santen Pharmaceutical Co., Ltd. (Pharmaceuticals) | 1,453,414 | ||||||||
| 459,000 | Seino Transportation Co., Ltd.(a) (Road & Rail) | 4,480,782 | ||||||||
| 101,700 | Shimachu Co., Ltd. (Specialty Retail) | 2,992,452 | ||||||||
| 560,000 | Shionogi & Co., Ltd. (Pharmaceuticals) | 7,721,979 | ||||||||
| 87,200 | Showa Shell Sekiyu KK (Oil & Gas) | 991,741 | ||||||||
| 2,121,000 | Sompo Japan Insurance, Inc. (Insurance) | 30,804,491 | ||||||||
| 559,300 | Sony Corp. (Household Durables) | 26,187,440 | ||||||||
| 182,000 | Sumitomo Chemical Co., Ltd. (Chemicals) | 1,419,218 | ||||||||
| 1,159,400 | Sumitomo Electric Industries Ltd. (Electrical Equipment) | 17,422,317 | ||||||||
| 2,202 | Sumitomo Mitsui Financial Group, Inc. (Banks) | 24,048,888 | ||||||||
| 39,600 | Suzuken Co., Ltd. (Health Care Providers & Services) | 1,177,226 | ||||||||
| 619,000 | The Bank of Fukuoka Ltd. (Banks) | 5,251,663 | ||||||||
| 643,000 | The Bank of Yokohama Ltd. (Banks) | 5,185,194 | ||||||||
| 130,000 | The Chiba Bank Ltd. (Banks) | 1,094,989 | ||||||||
| 159,000 | Tokyu Land Corp.(a) (Real Estate) | 1,386,856 | ||||||||
| 894,000 | Toppan Printing Co., Ltd.(a) (Commercial Services & Supplies) | 11,420,711 | ||||||||
| 59,000 | Toyo Suisan Kaisha Ltd. (Food Products) | 860,246 | ||||||||
| 91,000 | UNY Co., Ltd.(a) (Multiline Retail) | 1,384,287 | ||||||||
| 43 | West Japan Railway Co. (Road & Rail) | 174,295 | ||||||||
| 489,977,648 | ||||||||||
| Netherlands – 8.8% | ||||||||||
| 2,577,765 | Aegon NV (Insurance) | 42,508,431 | ||||||||
| 304,955 | ASML Holding NV* (Semiconductor Equipment & Products) | 6,307,346 | ||||||||
| 278,705 | European Aeronautic Defence & Space Co.* (Aerospace & Defense) | 10,217,265 | ||||||||
| 107,581 | James Hardie Industries NV (Construction Materials) | 705,208 | ||||||||
| 722,367 | Koninklijke (Royal) KPN NV (Diversified Telecommunication Services) | 7,478,398 | ||||||||
| 43,502 | Koninklijke (Royal) Philips Electronics NV* (Household Durables) | 1,415,701 | ||||||||
| 156,240 | Koninklijke DSM NV (Chemicals) | 6,497,835 | ||||||||
| 33,577 | Rodamco Europe NV (Real Estate) | 3,078,200 | ||||||||
| 143,700 | Royal Dutch Shell PLC (Oil & Gas) | 9,057,411 | ||||||||
| 698,053 | Royal Dutch Shell PLC ADR Series B(a) (Oil & Gas) | 21,044,561 | ||||||||
| 142,834 | Royal Dutch Shell PLC Series B(a) (Oil & Gas) | 4,490,777 | ||||||||
| 151,762 | TNT NV (Air Freight & Couriers) | 4,936,606 | ||||||||
| 366,873 | Unilever NV (Food Products) | 25,467,490 | ||||||||
| 140,310 | VNU NV* (Media) | 4,546,322 | ||||||||
| 147,751,551 | ||||||||||
| Norway – 6.4% | ||||||||||
| 608,480 | Norsk Hydro ASA (Oil & Gas) | 71,273,066 | ||||||||
| 596,300 | Orkla ASA (Beverages) | 25,991,435 | ||||||||
| 378,100 | Statoil ASA (Oil & Gas) | 9,682,675 | ||||||||
| 22,200 | Storebrand ASA (Insurance) | 245,063 | ||||||||
| 107,192,239 | ||||||||||
37
Statement of Investments (continued)
| Shares | Description | Value | ||||||||
Common Stocks – (continued) | ||||||||||
| Singapore – 1.9% | ||||||||||
| 199,000 | Allgreen Properties Ltd. (Real Estate) | $ | 167,089 | |||||||
| 481,575 | Ascendas Real Estate Investment Trust (Real Estate) | 640,355 | ||||||||
| 827,000 | Capitaland Ltd. (Real Estate) | 2,130,443 | ||||||||
| 142,000 | CapitaMall Trust (Real Estate) | 203,428 | ||||||||
| 24,000 | City Developments Ltd. (Real Estate) | 139,918 | ||||||||
| 297,112 | Cycle & Carriage Ltd. (Distributors) | 1,873,388 | ||||||||
| 703,000 | Datacraft Asia Ltd.* (Communications Equipment) | 805,509 | ||||||||
| 289,000 | DBS Group Holdings Ltd. (Banks) | 2,906,749 | ||||||||
| 48,500 | Fraser & Neave Ltd. (Beverages) | 568,516 | ||||||||
| 165,000 | Olam International Ltd. (Distributors) | 186,273 | ||||||||
| 101,000 | Overseas Union Enterprise Ltd. (Hotels, Restaurants & Leisure) | 739,100 | ||||||||
| 1,884,880 | SembCorp Industries Ltd. (Construction & Engineering) | 3,607,138 | ||||||||
| 338,000 | SembCorp Logistics Ltd. (Commercial Services & Supplies) | 359,332 | ||||||||
| 492,000 | Singapore Airlines Ltd. (Airlines) | 4,465,409 | ||||||||
| 80,000 | Singapore Exchange Ltd. (Diversified Financials) | 187,294 | ||||||||
| 69,000 | Singapore Petroleum Co. (Oil & Gas) | 214,184 | ||||||||
| 1,752,290 | Singapore Telecommunications Ltd. (Diversified Telecommunication Services) | 2,809,074 | ||||||||
| 2,452,000 | ST Assembly Test Services Ltd.* (Semiconductor Equipment & Products) | 1,710,502 | ||||||||
| 250,000 | Suntec Real Estate Investment Trust (Real Estate) | 182,807 | ||||||||
| 789,000 | United Overseas Bank Ltd. (Banks) | 7,262,014 | ||||||||
| 475,200 | United Overseas Land Ltd. (Hotels, Restaurants & Leisure) | 781,058 | ||||||||
| 118,000 | Wing Tai Holdings Ltd. (Real Estate) | 108,318 | ||||||||
| 32,047,898 | ||||||||||
| Spain – 3.3% | ||||||||||
| 916,764 | Endesa SA (Electric Utilities) | 30,698,030 | ||||||||
| 197,251 | Indra Sistemas SA (IT Consulting & Services) | 3,925,229 | ||||||||
| 41,761 | NH Hoteles SA (Hotels, Restaurants & Leisure) | 674,286 | ||||||||
| 756,693 | Repsol SA (Oil & Gas) | 21,150,689 | ||||||||
| 56,448,234 | ||||||||||
| Sweden – 0.9% | ||||||||||
| 272,000 | Electrolux AB – Series B (Household Durables) | 7,522,834 | ||||||||
| 312,000 | Skanska AB Series B (Construction & Engineering) | 5,023,111 | ||||||||
| 42,000 | SSAB Svenskt Stal AB (Metals & Mining) | 1,887,093 | ||||||||
| 113,200 | Swedish Match AB Co. (Tobacco) | 1,515,837 | ||||||||
| 15,948,875 | ||||||||||
| Switzerland – 4.5% | ||||||||||
| 15,800 | Credit Suisse Group (Banks) | 875,086 | ||||||||
| 2,701 | Rieter Holding AG (Machinery) | 1,048,076 | ||||||||
| 172,464 | Roche Holding AG(a) (Pharmaceuticals) | 25,481,002 | ||||||||
| 5,488 | Serono SA* (Biotechnology) | 3,894,030 | ||||||||
| 402,843 | STMicroelectronics NV* (Semiconductor Equipment & Products) | 6,827,175 | ||||||||
| 17,433 | Swisscom AG (Diversified Telecommunication Services) | 5,235,321 | ||||||||
| 1,528 | Valora Holding AG* (Specialty Retail) | 310,498 | ||||||||
| 139,654 | Zurich Financial Services AG (Insurance) | 32,978,413 | ||||||||
| 76,649,601 | ||||||||||
| United Kingdom – 8.1% | ||||||||||
| 61,300 | Alliance Unichem PLC (Health Care Providers & Services) | 941,930 | ||||||||
| 259,996 | Arriva PLC (Road & Rail) | 2,747,309 | ||||||||
| 392,643 | AstraZeneca PLC (Pharmaceuticals) | 18,133,358 | ||||||||
| 204,110 | Barclays PLC (Banks) | 2,390,743 | ||||||||
| 209,380 | BG Group PLC (Oil & Gas) | 2,452,425 | ||||||||
| 671,785 | BHP Billiton PLC (Metals & Mining) | 11,289,815 | ||||||||
| 535,891 | Brambles Industries PLC (Commercial Services & Supplies) | 3,872,297 | ||||||||
| 1,150,448 | British Airways PLC* (Airlines) | 6,620,392 | ||||||||
| 3,792,088 | BT Group PLC (Diversified Telecommunication Services) | 13,677,373 | ||||||||
38
| Shares | Description | Value | ||||||||
Common Stocks – (continued) | ||||||||||
| United Kingdom – (continued) | ||||||||||
| 109,315 | Compass Group PLC (Hotels, Restaurants & Leisure) | $ | 416,108 | |||||||
| 67,220 | Davis Service Group PLC (Industrial Conglomerates) | 580,506 | ||||||||
| 1,459,496 | Dixons Group PLC (Specialty Retail) | 4,401,101 | ||||||||
| 172,742 | First Choice Holidays PLC (Hotels, Restaurants & Leisure) | 683,618 | ||||||||
| 36,389 | GlaxoSmithKline PLC ADR (Pharmaceuticals) | 1,849,289 | ||||||||
| 1,746,649 | HBOS PLC (Banks) | 32,527,985 | ||||||||
| 70,380 | IMI PLC (Machinery) | 645,211 | ||||||||
| 302,475 | Kelda Group PLC (Water Utilities) | 4,224,090 | ||||||||
| 13,861 | Man Group PLC (Diversified Financials) | 561,496 | ||||||||
| 354,734 | Mitchells & Butler PLC (Hotels, Restaurants & Leisure) | 2,462,712 | ||||||||
| 1,882,237 | Royal & Sun Alliance Insurance Group PLC (Insurance) | 4,291,791 | ||||||||
| 60,760 | Schroders PLC (Diversified Financials) | 1,225,061 | ||||||||
| 685,975 | Tate & Lyle PLC (Food Products) | 7,193,057 | ||||||||
| 350,915 | Trinity Mirror PLC (Media) | 3,550,673 | ||||||||
| 964,896 | Unilever PLC (Food Products) | 9,927,727 | ||||||||
| 136,666,067 | ||||||||||
| TOTAL COMMON STOCKS | ||||||||||
| (Cost $1,427,502,892) | $ | 1,645,755,598 | ||||||||
Preferred Stock – 0.0% | ||||||||||
| Germany – 0.0% | ||||||||||
| 2,172 | RWE AG (Electric Utilities) | $ | 171,010 | |||||||
| (Cost $134,534) | ||||||||||
| Principal | Interest | Maturity | ||||||||||||||
| Amount | Rate | Date | Value | |||||||||||||
Short-Term Obligation – 10.1% | ||||||||||||||||
| State Street Bank & Trust Euro – Time Deposit | ||||||||||||||||
| $ | 170,066,000 | 4.20 | % | 03/01/2006 | $ | 170,066,000 | ||||||||||
| (Cost $170,066,000) | ||||||||||||||||
| TOTAL INVESTMENTS BEFORE SECURITIES LENDING COLLATERAL | ||||||||||||||||
| (Cost $1,597,703,426) | $ | 1,815,992,608 | ||||||||||||||
| Shares | Description | Value | ||||||||
Securities Lending Collateral – 7.0% | ||||||||||
| 118,069,939 | Boston Global Investment Trust – Enhanced Portfolio | $ | 118,069,939 | |||||||
| (Cost $118,069,939) | ||||||||||
| TOTAL INVESTMENTS – 114.5% | ||||||||||
| (Cost $1,715,773,365) | $ | 1,934,062,547 | ||||||||
| The percentage shown for each investment category reflects the value of investments in that category as a percentage of net assets. |
| * | Non-income producing security. | |
| (a) | All or portion of security is on loan. |
| Investment Abbreviations: | ||||||
| ADR | — | American Depositary Receipt | ||||
| REIT | — | Real Estate Investment Trust | ||||
39
Statement of Investments (continued)
| ADDITIONAL INVESTMENT INFORMATION |
FUTURES CONTRACTS — At February 28, 2006, the following futures contracts were open as follows:
| Number of | Settlement | Market | Unrealized | |||||||||||||
| Type | Contracts Long | Month | Value | Gain (Loss) | ||||||||||||
| FTSE 100 Index | 73 | March 2006 | $ | 7,381,401 | $ | (76,708) | ||||||||||
| SPI 200 Index | 21 | March 2006 | 1,919,437 | 50,342 | ||||||||||||
| 40 S&P/MIB Index | 4 | March 2006 | 899,153 | 8,983 | ||||||||||||
| TOPIX Index | 43 | March 2006 | 6,159,043 | 245,951 | ||||||||||||
| DAX Index | 7 | March 2006 | 1,210,816 | 268 | ||||||||||||
| Dow Jones Euro Stoxx 50 Index | 106 | March 2006 | 4,772,714 | 18,768 | ||||||||||||
| CAC 40 – 10 EURO Index | 23 | March 2006 | 1,371,874 | 5,990 | ||||||||||||
| IBEX 35 Index | 5 | March 2006 | 701,521 | 18,078 | ||||||||||||
| Hang Seng Index | 6 | March 2006 | 612,498 | 10,286 | ||||||||||||
| $ | 25,028,457 | $ | 281,958 | |||||||||||||
40
| As a % of | ||||||
| Net Assets | ||||||
Investments Industry Classifications† | ||||||
| Aerospace & Defense | 1.0 | % | ||||
| Air Freight & Couriers | 0.3 | |||||
| Airlines | 1.0 | |||||
| Auto Components | 0.1 | |||||
| Automobiles | 4.2 | |||||
| Banks | 13.3 | |||||
| Beverages | 1.6 | |||||
| Biotechnology | 0.2 | |||||
| Building Products | 0.1 | |||||
| Chemicals | 4.8 | |||||
| Commercial Services & Supplies | 2.0 | |||||
| Communications Equipment | 0.6 | |||||
| Construction & Engineering | 0.6 | |||||
| Construction Materials | 0.3 | |||||
| Distributors | 0.1 | |||||
| Diversified Financials | 6.1 | |||||
| Diversified Telecommunications Services | 3.9 | |||||
| Electric Utilities | 3.3 | |||||
| Electric Equipment | 2.0 | |||||
| Electric Equipment & Instruments | 2.7 | |||||
| Food & Drug Retailing | 0.5 | |||||
| Food Products | 2.8 | |||||
| Health Care Providers & Services | 0.4 | |||||
| Hotels, Restaurants & Leisure | 0.9 | |||||
| Household Durables | 2.8 | |||||
| Household Products | 0.5 | |||||
| Industrial Conglomerates | 0.3 | |||||
| Insurance | 6.8 | |||||
| IT Consulting & Services | 1.2 | |||||
| Leisure Equipment & Products | 0.1 | |||||
| Machinery | 1.8 | |||||
| Marine | 0.5 | |||||
| Media | 0.9 | |||||
| Metals & Mining | 4.7 | |||||
| Multiline Retail | 0.5 | |||||
| Multi-Utilities | 0.6 | |||||
| Office Electronics | 0.1 | |||||
| Oil & Gas | 9.5 | |||||
| Pharmaceuticals | 5.8 | |||||
| Real Estate | 2.2 | |||||
| Road & Rail | 1.0 | |||||
| Semiconductor Equipment & Products | 1.0 | |||||
| Short-term Investments# | 17.1 | |||||
| Software | 0.6 | |||||
| Specialty Retail | 0.9 | |||||
| Textiles & Apparel | 0.3 | |||||
| Tobacco | 0.1 | |||||
| Water Utilities | 0.3 | |||||
| Wireless Telecommunications Services | 2.1 | |||||
| TOTAL INVESTMENTS | 114.5 | % | ||||
| † | Industry concentrations greater than one-tenth of one percent are disclosed. | |
| # | Short-term Investments include short-term obligations and securities lending collateral. |
41
GOLDMAN SACHS STRUCTURED EQUITY FUNDS
Statements of Assets and Liabilities
| Structured Large Cap | |||||||||
| Value Fund | |||||||||
| Assets: | |||||||||
| Investment in securities, at value (identified cost $721,395,175, $853,389,588, $578,854,331, $591,529,582 and $1,597,703,426, respectively) | $ | 804,973,512 | |||||||
| Securities lending collateral, at value (cost $13,839,325, $16,552,800, $18,741,150, $87,723,500 and $118,069,939, respectively) | 13,839,325 | ||||||||
Cash(a) | 2,193,663 | ||||||||
| Foreign currencies, at value (identified cost $729,079, Structured International Equity only) | — | ||||||||
| Receivables: | |||||||||
| Investment securities sold, at value | — | ||||||||
| Fund shares sold | 3,438,974 | ||||||||
Due from broker(b) | — | ||||||||
| Dividends and interest, at value | 985,219 | ||||||||
| Reimbursement from adviser | 32,422 | ||||||||
| Securities lending income | 1,543 | ||||||||
| Foreign tax reclaims, at value | — | ||||||||
| Other assets | 16,883 | ||||||||
Total assets | 825,481,541 | ||||||||
| Liabilities: | |||||||||
| Payables: | |||||||||
| Investment securities purchased, at value | — | ||||||||
| Payable upon return of securities loaned | 13,839,325 | ||||||||
| Fund shares repurchased | 1,034,779 | ||||||||
| Amounts owed to affiliates | 439,651 | ||||||||
| Due to Custodian | — | ||||||||
| Variation margin | 295,212 | ||||||||
| Accrued expenses | 112,819 | ||||||||
Total liabilities | 15,721,786 | ||||||||
| Net Assets: | |||||||||
| Paid-in capital | 690,992,409 | ||||||||
| Accumulated undistributed net investment income | 2,183,971 | ||||||||
| Accumulated net realized gain (loss) on investment, futures and foreign currency related transactions | 33,083,149 | ||||||||
| Net unrealized gain on investments, futures and translation of assets and liabilities denominated in foreign currencies | 83,500,226 | ||||||||
NET ASSETS | $ | 809,759,755 | |||||||
| Net Assets: | |||||||||
| Class A | $ | 261,736,256 | |||||||
| Class B | 19,963,078 | ||||||||
| Class C | 21,339,230 | ||||||||
| Institutional | 506,391,582 | ||||||||
| Service | 329,609 | ||||||||
| Shares Outstanding: | |||||||||
| Class A | 19,395,191 | ||||||||
| Class B | 1,491,681 | ||||||||
| Class C | 1,592,698 | ||||||||
| Institutional | 37,536,853 | ||||||||
| Service | 24,355 | ||||||||
| Total shares of beneficial interest outstanding, $.001 par value (unlimited number of shares authorized) | 60,040,778 | ||||||||
Net asset value, offering and redemption price per share:(c) | |||||||||
| Class A | $13.49 | ||||||||
| Class B | 13.38 | ||||||||
| Class C | 13.40 | ||||||||
| Institutional | 13.49 | ||||||||
| Service | 13.53 | ||||||||
| (a) | Includes restricted cash of $2,140,000, $1,225,000, $1,014,000 and $1,120,000, respectively for the Structured Large Cap Value, Structured U.S. Equity, Structured Large Cap Growth and Structured Small Cap Equity Funds relating to initial margin requirements on futures transactions. |
| (b) | Includes $1,040,383 for the Structured International Equity Fund relating to initial margin requirements on futures transactions. |
| (c) | Maximum public offering price per share (NAV per share multiplied by 1.0582) for Class A Shares of the Structured Large Cap Value, Structured U.S. Equity, Structured Large Cap Growth, Structured Small Cap Equity and Structured International Equity Funds is $14.28, $32.96, $14.18, $15.31 and $13.90, respectively. At redemption, Class B and Class C Shares may be subject to a contingent deferred sales charge, assessed on the amount equal to the lesser of the current NAV or the original purchase price of the shares. |
42
| Structured U.S. | Structured Large Cap | Structured Small Cap | Structured International | |||||||||||||||
| Equity Fund | Growth Fund | Equity Fund | Equity Fund | |||||||||||||||
| $ | 980,863,742 | $ | 644,661,489 | $ | 688,790,993 | $ | 1,815,992,608 | |||||||||||
| 16,552,800 | 18,741,150 | 87,723,500 | 118,069,939 | |||||||||||||||
| 1,286,284 | 1,082,895 | 1,120,000 | — | |||||||||||||||
| — | — | — | 730,644 | |||||||||||||||
| — | — | 468,355 | 66,003,460 | |||||||||||||||
| 1,159,529 | 2,905,904 | 15,006,142 | 6,020,851 | |||||||||||||||
| — | 665,418 | — | 10,714,623 | |||||||||||||||
| 1,442,240 | 906,932 | 321,139 | 1,366,412 | |||||||||||||||
| 66,530 | 47,518 | 57,114 | 34,579 | |||||||||||||||
| 1,148 | 2,423 | 43,403 | 30,244 | |||||||||||||||
| — | — | — | 66,529 | |||||||||||||||
| 18,685 | 10,284 | 11,217 | 18,387 | |||||||||||||||
| 1,001,390,958 | 669,024,013 | 793,541,863 | 2,019,048,276 | |||||||||||||||
| — | — | — | 209,453,641 | |||||||||||||||
| 16,552,800 | 18,741,150 | 87,723,500 | 118,069,939 | |||||||||||||||
| 3,051,932 | 716,205 | 1,823,507 | 744,440 | |||||||||||||||
| 687,634 | 402,372 | 542,354 | 1,187,450 | |||||||||||||||
| — | — | 422,974 | — | |||||||||||||||
| 104,618 | — | 108,859 | — | |||||||||||||||
| 153,437 | 131,967 | 137,292 | 200,926 | |||||||||||||||
| 20,550,421 | 19,991,694 | 90,758,486 | 329,656,396 | |||||||||||||||
| 875,517,960 | 845,243,180 | 582,153,156 | 1,421,168,815 | |||||||||||||||
| 3,995,093 | 974,611 | 1,755,618 | 991,286 | |||||||||||||||
| (26,131,257 | ) | (262,977,606 | ) | 21,592,033 | 48,811,320 | |||||||||||||
| 127,458,741 | 65,792,134 | 97,282,570 | 218,420,459 | |||||||||||||||
| $ | 980,840,537 | $ | 649,032,319 | $ | 702,783,377 | $ | 1,689,391,880 | |||||||||||
| $ | 522,637,752 | $ | 213,017,334 | $ | 192,364,263 | $ | 449,665,183 | |||||||||||
| 92,726,436 | 54,886,078 | 18,625,208 | 9,567,539 | |||||||||||||||
| 37,569,369 | 26,514,705 | 27,043,983 | 6,066,744 | |||||||||||||||
| 317,315,858 | 354,384,314 | 431,659,426 | 1,191,727,322 | |||||||||||||||
| 10,591,122 | 229,888 | 33,090,497 | 32,365,092 | |||||||||||||||
| 16,777,400 | 15,896,803 | 13,295,843 | 34,214,099 | |||||||||||||||
| 3,151,629 | 4,368,807 | 1,390,904 | 735,959 | |||||||||||||||
| 1,282,625 | 2,109,703 | 2,011,832 | 466,402 | |||||||||||||||
| 9,990,202 | 25,774,160 | 28,900,816 | 88,944,776 | |||||||||||||||
| 342,926 | 17,282 | 2,313,958 | 2,456,853 | |||||||||||||||
| 31,544,782 | 48,166,755 | 47,913,353 | 126,818,089 | |||||||||||||||
| $31.15 | $ | 13.40 | $ | 14.47 | $ | 13.14 | ||||||||||||
| 29.42 | 12.56 | 13.39 | 13.00 | |||||||||||||||
| 29.29 | 12.57 | 13.44 | 13.01 | |||||||||||||||
| 31.76 | 13.75 | 14.94 | 13.40 | |||||||||||||||
| 30.88 | 13.30 | 14.30 | 13.17 | |||||||||||||||
43
Statements of Operations
| Structured Large Cap | |||||||
| Value Fund(a) | |||||||
| Investment income: | |||||||
Dividends(b) | $ | 7,700,400 | |||||
| Interest (including securities lending income of $19,334, $22,817, $12,879, $278,804 and $180,247, respectively) | 399,394 | ||||||
Total income | 8,099,794 | ||||||
| Expenses: | |||||||
| Management fees | 2,165,436 | ||||||
Distribution and Service fees(c) | 482,125 | ||||||
Transfer Agent fees(c) | 341,593 | ||||||
| Custody and accounting fees | 93,401 | ||||||
| Service share fees | 1,803 | ||||||
| Registration fees | 39,860 | ||||||
| Professional fees | 25,825 | ||||||
| Printing fees | 30,900 | ||||||
| Trustee fees | 6,990 | ||||||
| Other | 19,725 | ||||||
Total expenses | 3,207,658 | ||||||
| Less — expense reductions | (181,746 | ) | |||||
Net expenses | 3,025,912 | ||||||
NET INVESTMENT INCOME | 5,073,882 | ||||||
| Realized and unrealized gain (loss) on investment, futures and foreign currency related transactions: | |||||||
| Net realized gain from: | |||||||
| Investment transactions | 35,949,113 | ||||||
| Futures transactions | 1,006,773 | ||||||
| Foreign currency related transactions | — | ||||||
| Net change in unrealized gain (loss) on: | |||||||
| Investments | 21,435,623 | ||||||
| Futures | 109,248 | ||||||
| Translation of assets and liabilities denominated in foreign currencies | — | ||||||
Net realized and unrealized gain on investment, futures and foreign currency transactions | 58,500,757 | ||||||
NET INCREASE IN NET ASSETS RESULTING FROM OPERATIONS | $ | 63,574,639 | |||||
| (a) | Effective December 30, 2005, the CORE Large Cap Value Fund, CORE U.S. Equity Fund, CORE Large Cap Growth Fund, CORE Small Cap Equity Fund and CORE International Equity Fund changed their names to Structured Large Cap Value Fund, Structured U.S. Equity Fund, Structured Large Cap Growth Fund, Structured Small Cap Equity Fund and Structured International Equity Fund, respectively. |
| (b) | For the Structured Small Cap Equity and Structured International Equity Funds, foreign taxes withheld on dividends were $1,453 and $239,249, respectively. |
| (c) | Class specific Distribution and Service and Transfer Agent fees were as follows: |
| Distribution and Service Fees | Transfer Agent Fees | |||||||||||||||||||||||||||||||
| Fund | Class A | Class B | Class C | Class A | Class B | Class C | Institutional | Service | ||||||||||||||||||||||||
| Structured Large Cap Value Fund | $ | 277,583 | $ | 98,532 | $ | 106,010 | $ | 210,963 | $ | 18,721 | $ | 20,142 | $ | 91,623 | $ | 144 | ||||||||||||||||
| Structured U.S. Equity Fund | 613,330 | 489,756 | 190,351 | 466,131 | 93,054 | 36,167 | 56,452 | 2,102 | ||||||||||||||||||||||||
| Structured Large Cap Growth Fund | 238,993 | 294,488 | 143,067 | 181,634 | 55,953 | 27,183 | 65,115 | 44 | ||||||||||||||||||||||||
| Structured Small Cap Equity Fund | 199,378 | 92,140 | 127,914 | 151,526 | 17,507 | 24,304 | 67,165 | 7,463 | ||||||||||||||||||||||||
| Structured International Equity Fund | 431,481 | 42,046 | 26,140 | 327,925 | 7,989 | 4,967 | 173,624 | 5,306 | ||||||||||||||||||||||||
44
| Structured U.S. | Structured Large Cap | Structured Small Cap | Structured International | |||||||||||||
| Equity Fund(a) | Growth Fund(a) | Equity Fund(a) | Equity Fund(a) | |||||||||||||
| $ | 8,004,835 | $ | 3,569,073 | $ | 3,332,911 | $ | 5,177,230 | |||||||||
| 165,488 | 278,921 | 516,337 | 1,600,349 | |||||||||||||
| 8,170,323 | 3,847,994 | 3,849,248 | 6,777,579 | |||||||||||||
| 2,988,241 | 1,964,637 | 2,450,764 | 5,256,771 | |||||||||||||
| 1,293,437 | 676,548 | 419,432 | 499,667 | |||||||||||||
| 653,906 | 329,929 | 267,965 | 519,811 | |||||||||||||
| 97,205 | 86,542 | 87,776 | 362,358 | |||||||||||||
| 26,279 | 558 | 93,286 | 66,319 | |||||||||||||
| 29,313 | 22,913 | 16,406 | 52,583 | |||||||||||||
| 38,630 | 33,003 | 26,225 | 31,688 | |||||||||||||
| 33,952 | 28,400 | 29,150 | 33,448 | |||||||||||||
| 6,990 | 6,990 | 6,990 | 6,990 | |||||||||||||
| 48,932 | 12,312 | 21,021 | 15,106 | |||||||||||||
| 5,216,885 | 3,161,832 | 3,419,015 | 6,844,741 | |||||||||||||
| (467,413 | ) | (289,109 | ) | (174,793 | ) | (278,052 | ) | |||||||||
| 4,749,472 | 2,872,723 | 3,244,222 | 6,566,689 | |||||||||||||
| 3,420,851 | 975,271 | 605,026 | 210,890 | |||||||||||||
| 26,779,403 | 18,793,998 | 34,460,703 | 60,690,138 | |||||||||||||
| 205,873 | 433,454 | 935,023 | 6,189,466 | |||||||||||||
| — | — | — | 87,111 | |||||||||||||
| 35,015,835 | 21,692,373 | 9,782,278 | 104,802,512 | |||||||||||||
| (34,334 | ) | 15,137 | (56,835 | ) | (22,030 | ) | ||||||||||
| — | — | — | (162,345 | ) | ||||||||||||
| 61,966,777 | 40,934,962 | 45,121,169 | 171,584,852 | |||||||||||||
| $ | 65,387,628 | $ | 41,910,233 | $ | 45,726,195 | $ | 171,795,742 | |||||||||
45
Statements of Changes in Net Assets
| Structured Large Cap Value Fund(c) | |||||||||||
| For the | |||||||||||
| Six Months Ended | For the | ||||||||||
| February 28, 2006 | Year Ended | ||||||||||
| (Unaudited) | August 31, 2005 | ||||||||||
| From operations: | |||||||||||
| Net investment income | $ | 5,073,882 | $ | 4,870,818 | |||||||
| Net realized gain on investment, futures and foreign currency related transactions | 36,955,886 | 25,961,507 | |||||||||
| Net increase from payments by affiliates for voluntary reimbursements | — | 18,876 | |||||||||
| Net change in unrealized gain (loss) on investments, futures and translation of assets and liabilities denominated in foreign currencies | 21,544,871 | 33,596,127 | |||||||||
Net increase in net assets resulting from operations | 63,574,639 | 64,447,328 | |||||||||
| Distributions to shareholders: | |||||||||||
| From net investment income | |||||||||||
| Class A Shares | (940,912 | ) | (1,025,718 | ) | |||||||
| Class B Shares | (9,157 | ) | (11,169 | ) | |||||||
| Class C Shares | (13,055 | ) | (14,127 | ) | |||||||
| Institutional Shares | (2,847,586 | ) | (2,753,498 | ) | |||||||
| Service Shares | (2,624 | ) | (4,526 | ) | |||||||
| From net realized gains | |||||||||||
| Class A Shares | (4,285,315 | ) | (2,342,830 | ) | |||||||
| Class B Shares | (363,911 | ) | (451,577 | ) | |||||||
| Class C Shares | (405,173 | ) | (405,671 | ) | |||||||
| Institutional Shares | (9,199,305 | ) | (3,867,997 | ) | |||||||
| Service Shares | (11,795 | ) | (12,197 | ) | |||||||
Total distributions to shareholders | (18,078,833 | ) | (10,889,310 | ) | |||||||
| From share transactions: | |||||||||||
| Proceeds from sales of shares | 307,515,125 | 316,236,675 | |||||||||
| Proceeds received in connection with merger | — | — | |||||||||
| Reinvestment of dividends and distributions | 17,929,053 | 10,736,120 | |||||||||
| Cost of shares repurchased | (174,440,696 | ) | (99,518,657 | ) | |||||||
Net increase in net assets resulting from share transactions | 151,003,482 | 227,454,138 | |||||||||
TOTAL INCREASE | 196,499,288 | 281,012,156 | |||||||||
| Net assets: | |||||||||||
| Beginning of period | 613,260,467 | 332,248,311 | |||||||||
| End of period | $ | 809,759,755 | $ | 613,260,467 | |||||||
Accumulated undistributed net investment income | $ | 2,183,971 | $ | 923,423 | |||||||
| (a) | Net of $3,180 in redemption fees remitted to the Structured International Equity Fund. |
| (b) | Net of $6,445 in redemption fees remitted to the Structured International Equity Fund. |
| (c) | Effective December 30, 2005, the CORE Large Cap Value Fund, CORE U.S. Equity Fund, CORE Large Cap Growth Fund, CORE Small Cap Equity Fund and CORE International Equity Fund changed their names to Structured Large Cap Value Fund, Structured U.S. Equity Fund, Structured Large Cap Growth Fund, Structured Small Cap Equity Fund and Structured International Equity Fund, respectively. |
46
| GOLDMAN SACHS STRUCTURED EQUITY FUNDS |
| Structured U.S. Equity Fund(c) | Structured Large Cap Growth Fund(c) | Structured Small Cap Equity Fund(c) | Structured International Equity Fund(c) | |||||||||||||||||||||||||||||
| For the | For the | For the | For the | |||||||||||||||||||||||||||||
| Six Months Ended | For the | Six Months Ended | For the | Six Months Ended | For the | Six Months Ended | For the | |||||||||||||||||||||||||
| February 28, 2006 | Year Ended | February 28, 2006 | Year Ended | February 28, 2006 | Year Ended | February 28, 2006 | Year Ended | |||||||||||||||||||||||||
| (Unaudited) | August 31, 2005 | (Unaudited) | August 31, 2005 | (Unaudited) | August 31, 2005 | (Unaudited) | August 31, 2005 | |||||||||||||||||||||||||
| $ | 3,420,851 | $ | 7,033,430 | $ | 975,271 | $ | 1,077,659 | $ | 605,026 | $ | (101,205 | ) | $ | 210,890 | $ | 13,698,655 | ||||||||||||||||
| 26,985,276 | 104,510,572 | 19,227,452 | 23,507,224 | 35,395,726 | 41,546,526 | 66,966,715 | 73,385,628 | |||||||||||||||||||||||||
| — | 23,962 | — | 400,102 | — | 110,026 | — | — | |||||||||||||||||||||||||
| 34,981,501 | (13,872,021 | ) | 21,707,510 | 20,077,834 | 9,725,443 | 57,076,950 | 104,618,137 | 69,369,356 | ||||||||||||||||||||||||
| 65,387,628 | 97,695,943 | 41,910,233 | 45,062,819 | 45,726,195 | 98,632,297 | 171,795,742 | 156,453,639 | |||||||||||||||||||||||||
| (1,717,006 | ) | (3,420,217 | ) | (61,768 | ) | — | — | — | (2,922,097 | ) | (1,196,017 | ) | ||||||||||||||||||||
| — | (41,912 | ) | — | — | — | — | (10,166 | ) | — | |||||||||||||||||||||||
| — | (52,661 | ) | — | — | — | — | (7,525 | ) | — | |||||||||||||||||||||||
| (1,696,849 | ) | (1,704,060 | ) | (1,056,728 | ) | — | — | — | (9,610,748 | ) | (4,841,952 | ) | ||||||||||||||||||||
| (30,886 | ) | (71,315 | ) | — | — | — | — | (228,125 | ) | (1,256 | ) | |||||||||||||||||||||
| — | — | — | — | (11,827,515 | ) | (6,678,795 | ) | (2,262,969 | ) | — | ||||||||||||||||||||||
| — | — | — | — | (1,546,298 | ) | (1,107,652 | ) | (56,886 | ) | — | ||||||||||||||||||||||
| — | — | — | — | (2,159,938 | ) | (1,181,208 | ) | (35,333 | ) | — | ||||||||||||||||||||||
| — | — | — | — | (23,891,296 | ) | (8,958,753 | ) | (5,464,148 | ) | — | ||||||||||||||||||||||
| — | — | — | — | (2,922,036 | ) | (2,176,185 | ) | (176,662 | ) | — | ||||||||||||||||||||||
| (3,444,741 | ) | (5,290,165 | ) | (1,118,496 | ) | — | (42,347,083 | ) | (20,102,593 | ) | (20,774,659 | ) | (6,039,225 | ) | ||||||||||||||||||
| 117,655,824 | 166,333,532 | 231,703,484 | 262,095,454 | 227,004,384 | 333,222,428 | 608,761,174 | 635,895,579 | |||||||||||||||||||||||||
| — | 125,038,947 | — | — | — | — | — | 45,116,496 | |||||||||||||||||||||||||
| 2,815,777 | 5,032,901 | 1,112,044 | — | 38,670,220 | 18,095,444 | 19,338,652 | 5,426,787 | |||||||||||||||||||||||||
| (105,626,348 | ) | (187,054,388 | ) | (150,717,090 | ) | (123,313,314 | ) | (132,927,658 | ) | (206,052,053 | ) | (115,792,383 | )(a) | (212,498,117 | )(b) | |||||||||||||||||
| 14,845,253 | 109,350,992 | 82,098,438 | 138,782,140 | 132,746,946 | 145,265,819 | 512,307,443 | 473,940,745 | |||||||||||||||||||||||||
| 76,788,140 | 201,756,770 | 122,890,175 | 183,844,959 | 136,126,058 | 223,795,523 | 663,328,526 | 624,355,159 | |||||||||||||||||||||||||
| 904,052,397 | 702,295,627 | 526,142,144 | 342,297,185 | 566,657,319 | 342,861,796 | 1,026,063,354 | 401,708,195 | |||||||||||||||||||||||||
| $ | 980,840,537 | $ | 904,052,397 | $ | 649,032,319 | $ | 526,142,144 | $ | 702,783,377 | $ | 566,657,319 | $ | 1,689,391,880 | $ | 1,026,063,354 | |||||||||||||||||
| $ | 3,995,093 | $ | 4,018,983 | $ | 974,611 | $ | 1,117,836 | $ | 755,618 | $ | 1,150,592 | $ | 991,286 | $ | 13,559,057 | |||||||||||||||||
47
Notes to Financial Statements
| 1. ORGANIZATION |
Goldman Sachs Trust (the “Trust”) is a Delaware statutory trust registered under the Investment Company Act of 1940, as amended, (the “Act”) as an open-end management investment company. The Trust includes the Structured Large Cap Value Fund, Structured U.S. Equity Fund, Structured Large Cap Growth Fund, Structured Small Cap Equity Fund and the Structured International Equity Fund (formerly CORE Large Cap Value Fund, CORE U.S. Equity Fund, CORE Large Cap Growth Fund, CORE Small Cap Equity Fund and CORE International Equity Fund) collectively, the “Funds” or individually a “Fund”. Each Fund is a diversified portfolio offering five classes of shares — Class A, Class B, Class C, Institutional and Service. Class A shares of the Funds are sold with front-end sales charge of up to 5.50%. Class B shares of the Funds are sold with contingent deferred sales charge that declines from 5.00% to zero, depending upon the period of time the shares are held. Class C shares of the Funds are sold with a contingent deferred sales charge of 1.00% during the first 12 months. Institutional and Service Class shares of the Funds are not subject to a sales charge. Such sales loads are paid directly to Goldman Sachs & Co. (“Goldman Sachs”) as distributor of the Funds. Effective December 30, 2005, CORE Large Cap Value Fund, CORE U.S. Equity Fund, CORE Large Cap Growth Fund, CORE Small Cap Equity Fund and CORE International Equity Fund, changed their names to Structured Large Cap Value Fund, Structured U.S. Equity Fund, Structured Large Cap Growth Fund, Structured Small Cap Equity Fund and the Structured International Equity Fund, respectively.
| 2. SIGNIFICANT ACCOUNTING POLICIES |
The following is a summary of the significant accounting policies consistently followed by the Funds. The preparation of financial statements in conformity with U.S. generally accepted accounting principles requires management to make estimates and assumptions that may affect the reported amounts. Actual results could differ from those estimates.
A. Investment Valuation — Investments in equity securities and investment companies traded on a U.S. securities exchange or the NASDAQ system or for investments in securities traded on a foreign securities exchange for which an independent fair value service is not available are valued daily at their last sale price or official closing price on the principal exchange or system on which they are traded. If no sale occurs, such securities are valued at the last bid price. Debt securities are valued at prices supplied by independent pricing services, broker/dealer-supplied valuations or matrix pricing systems. Unlisted equity securities for which market quotations are available are valued at the last sale price on valuation date, or if no sale occurs, at the last bid price. Investments in investment companies (other than those that are exchange traded) are valued at the net asset value per share on the valuation date. Short-term debt obligations maturing in sixty days or less are valued at amortized cost, which approximates market value. Securities for which quotations are not readily available or are deemed not to reflect market value by the investment adviser are valued at fair value using methods approved by the Trust’s Board of Trustees.
B. Security Transactions and Investment Income — Security transactions are reflected as of the trade date. Realized gains and losses on sales of portfolio securities are calculated using the identified-cost basis. Dividend income is recorded on the ex-dividend date, net of foreign withholding taxes, if any, which are reduced by any amounts reclaimable by the Funds, where applicable. Interest income is recorded on the basis of interest accrued, premium amortized and discount accreted. In addition, it is the Funds’ policy to accrue for estimated capital gains taxes on foreign securities held by the Funds, which are subject to taxes.
| 2. SIGNIFICANT ACCOUNTING POLICIES (continued) |
Net investment income (other than class-specific expenses) and unrealized and realized gains or losses are allocated daily to each class of shares of the respective Fund based upon the relative proportion of net assets of each class.
C. Expenses — Expenses incurred by the Trust that do not specifically relate to an individual Fund of the Trust are allocated to the Funds on a straight-line and/or pro-rata basis depending upon the nature of the expense.
D. Federal Taxes — It is each Fund’s policy to comply with the requirements of the Internal Revenue Code (the “Code”) applicable to regulated investment companies and to distribute each year substantially all of its investment company taxable income and capital gains to its shareholders. Accordingly, no federal tax provisions are required. Dividends and distributions to shareholders are recorded on the ex-dividend date. Income distributions, if any, are declared and paid quarterly for the Structured Large Cap Value Fund and annually for all other funds. Capital gains distributions, if any, are declared and paid annually for all Funds.
E. Foreign Currency Translations — The books and records of the Funds are maintained in U.S. dollars. Amounts denominated in foreign currencies are translated into U.S. dollars on the following basis: (i) investment valuations, foreign currency and other assets and liabilities initially expressed in foreign currencies are converted each business day into U.S. dollars based upon current exchange rates; and (ii) purchases and sales of foreign investments, income and expenses are converted into U.S. dollars based upon currency exchange rates prevailing on the respective dates of such transactions.
F. Futures Contracts — The Funds may enter into futures transactions to hedge against changes in interest rates, securities prices, and/or currency exchange rates (for Structured International Equity Fund only) or to seek to increase total return. Futures contracts are valued at the last settlement price at the end of each day on the board of trade or exchange upon which they are traded. Upon entering into a futures contract, the Funds are required to deposit with a broker or the Funds’ custodian bank on behalf of the broker an amount of cash or securities equal to the minimum “initial margin” requirement of the associated futures exchange. Subsequent payments for futures contracts (“variation margin”) are paid or received by the Funds, dependent on the fluctuations in the value of the contracts, and are recorded for financial reporting purposes as unrealized gains or losses. When contracts are closed, the Funds realize a gain or loss which is reported in the Statement of Operations.
Notes to Financial Statements (continued)
| 2. SIGNIFICANT ACCOUNTING POLICIES (continued) |
The use of futures contracts involve, to varying degrees, elements of market and counterparty risk which may exceed the amounts recognized in the Statement of Assets and Liabilities. Changes in the value of a futures contract may not directly correlate with changes in the value of the underlying securities. The risk may decrease the effectiveness of the Funds’ strategies and potentially result in a loss.
G. Segregation Transactions — As set forth in the prospectus, the Funds may enter into certain derivative transactions to seek to increase total return. Forward foreign currency exchange contracts, futures contracts, written options, when-issued securities and forward commitments represent examples of such transactions. As a result of entering into these transactions, the Funds are required to segregate or physically move liquid assets, on the books of their custodian or to respective counterparty, with a current value equal to or greater than the market value of the corresponding transactions.
H. Repurchase Agreements — Repurchase agreements involve the purchase of securities subject to the seller’s agreement to repurchase them at a mutually agreed upon date and price. During the term of a repurchase agreement, the value of the underlying securities held as collateral on behalf of the Funds, including accrued interest, is required to exceed the value of the repurchase agreement, including accrued interest. If the seller defaults or becomes insolvent, realization of the collateral by the Funds may be delayed or limited and there may be a decline in the value of the collateral during the period while the Funds seek to assert their rights. The underlying securities for all repurchase agreements are held in safekeeping at the Fund’s custodian or designated subcustodians under triparty repurchase agreements.
| 3. AGREEMENTS |
GSAM, an affiliate of Goldman Sachs, serves as investment adviser pursuant to an Investment Management Agreement (the “Agreement”) with the Trust on behalf of the Funds. Under the Agreement, GSAM manages the Funds, subject to the general supervision of the Trust’s Board of Trustees. As compensation for the services rendered pursuant to the Agreement, the assumption of the expenses related thereto and administering the Funds’ business affairs, including providing facilities, GSAM is entitled to a fee (“Management fee”) computed daily and payable monthly, equally to an annual percentage rate of each Fund’s average daily net assets.
| 3. AGREEMENTS (continued) |
GSAM has entered into a fee reduction commitment for the Funds which was implemented on a voluntary basis beginning July 1, 2005 and on a contractual basis as of December 29, 2005 to achieve the rates listed below.
| Management Fee | Average Daily | |||||
| Fund | Annual Rate | Net Assets | ||||
| Structured Large Cap Value | 0.60 | % | First $1 Billion | |||
| 0.54 | Next $1 Billion | |||||
| 0.51 | Over $2 Billion | |||||
| Structured U.S. Equity | 0.65 | First $1 Billion | ||||
| 0.59 | Next $1 Billion | |||||
| 0.56 | Over $2 Billion | |||||
| Structured Large Cap Growth | 0.65 | First $1 Billion | ||||
| 0.59 | Next $1 Billion | |||||
| 0.56 | Over $2 Billion | |||||
| Structured Small Cap Equity | 0.85 | First $2 Billion | ||||
| 0.77 | Over $2 Billion | |||||
| Structured International Equity | 0.85 | First $1 Billion | ||||
| 0.77 | Next $1 Billion | |||||
| 0.73 | Over $2 Billion | |||||
Additionally, effective December 29, 2005, GSAM has voluntarily agreed to waive a portion of its Management fees equal to 0.09%, 0.14%, 0.14%, 0.04% and 0.04% based on the average daily net assets of Structured Large Cap Value, Structured U.S. Equity, Structured Large Cap Growth, Structured Small Cap Equity and Structured International Equity, respectively.
Notes to Financial Statements (continued)
| 3. AGREEMENTS (continued) |
Goldman Sachs serves as Distributor of the shares of the Funds pursuant to a Distribution Agreement. Goldman Sachs may retain a portion of the Class A sales load and Class B and Class C contingent deferred sales charges. During the six months ended February 28, 2006, Goldman Sachs advised the Funds that it retained the following approximate amounts:
| Contingent Deferred | ||||||||||||
| Sales Load | Sales Charge | |||||||||||
| Fund | Class A | Class B | Class C | |||||||||
| Structured Large Cap Value | $ | 62,900 | $ | — | $ | — | ||||||
| Structured U.S. Equity | 33,100 | — | — | |||||||||
| Structured Large Cap Growth | 11,100 | 100 | — | |||||||||
| Structured Small Cap Equity | 24,700 | 100 | — | |||||||||
| Structured International Equity | 92,900 | 100 | — | |||||||||
Class A, Class B, Class C, Institutional and Service shares of International Equity charge a 2% redemption fee on the redemption of shares (including by exchange) held for 30 calendar days or less. Redemption fees are reimbursed to the Fund and reflected as a reduction in share redemptions on the Statement of Changes in Net Assets. Redemption fees are credited to Paid-in capital and are allocated to each share class of the Fund on a pro rata basis.
| Management Fee | Other Expense | Custody Fee | Total Expense | |||||||||||||
| Fund | Waiver | Reimbursement | Reduction | Reductions | ||||||||||||
| Structured Large Cap Value | $ | 116 | $ | 64 | $ | 2 | $ | 182 | ||||||||
| Structured U.S. Equity | 230 | 236 | 1 | 467 | ||||||||||||
| Structured Large Cap Growth | 149 | 138 | 2 | 289 | ||||||||||||
| Structured Small Cap Equity | 63 | 105 | 7 | 175 | ||||||||||||
| Structured International Equity | 198 | 69 | 11 | 278 | ||||||||||||
| 3. AGREEMENTS (continued) |
As of February 28, 2006, the amounts owed to affiliates of the Trust were as follows (in thousands):
| Management | Distribution and | Transfer | ||||||||||||||
| Fund | Fees | Service Fees | Agent Fees | Total | ||||||||||||
| Structured Large Cap Value | $ | 304 | $ | 79 | $ | 57 | $ | 440 | ||||||||
| Structured U.S. Equity | 381 | 201 | 106 | 688 | ||||||||||||
| Structured Large Cap Growth | 247 | 103 | 52 | 402 | ||||||||||||
| Structured Small Cap Equity | 423 | 71 | 48 | 542 | ||||||||||||
| Structured International Equity | 992 | 94 | 101 | 1,187 | ||||||||||||
| 4. PORTFOLIO SECURITIES TRANSACTIONS |
The cost of purchases and proceeds of sales and maturities of long-term securities for the six months ended February 28, 2006, were as follows:
| Fund | Purchases | Sales and Maturities | ||||||
| Structured Large Cap Value | $ | 581,101,997 | $ | 443,842,722 | ||||
| Structured U.S. Equity | 449,574,307 | 432,760,544 | ||||||
| Structured Large Cap Growth | 378,749,456 | 323,799,851 | ||||||
| Structured Small Cap Equity | 419,833,444 | 345,527,953 | ||||||
| Structured International Equity | 994,885,633 | 468,099,944 | ||||||
During the year ended August 31, 2005, GSAM voluntarily agreed to reimburse the CORE U.S. Equity, CORE Large Cap Growth, CORE Small Cap Equity, and CORE Large Cap Value Funds for $23,962, $400,102, $110,026 and $18,876, respectively, for certain class action settlements in which the Funds were eligible to participate.
| 5. SECURITIES LENDING |
Pursuant to exemptive relief granted by the SEC and the terms and conditions contained therein, the Funds may lend their securities through a securities lending agent, Boston Global Advisers (“BGA”), a wholly-owned subsidiary of Goldman Sachs, to certain qualified borrowers including Goldman Sachs and affiliates. In accordance with the Funds’ security lending procedures, the loans are collateralized at all times with cash and/or securities with a market value at least equal to the securities on loan. The market value of the loaned securities is determined at the close of business of the Fund, at their last sale price or official closing price on the principal exchange or system on which they are traded, and any additional required collateral is delivered to the Fund on the next business day. As with other extensions of credit, the Funds bear the risk of delay on recovery or loss of rights in the collateral should the borrower of the securities fail financially.
Notes to Financial Statements (continued)
| 5. SECURITIES LENDING (continued) |
money market instruments. The Funds bear the risk of incurring a loss from the investment of cash collateral due to either credit or market factors.
| Earnings of BGA | Earnings Received | |||||||||||||||||||
| Relating to | by the Funds | Amount Payable to | ||||||||||||||||||
| Market Value of | Cash Collateral | Securities Loaned | From Lending to | Goldman Sachs | ||||||||||||||||
| Securities on | Received for Loans | for the Six | Goldman Sachs for | Upon Return of | ||||||||||||||||
| Loan as of | Outstanding as of | Months Ended | Six Months Ended | Securities Loaned as | ||||||||||||||||
| Fund | February 28, 2006 | February 28, 2006 | February 28, 2006 | February 28, 2006 | of February 28, 2006 | |||||||||||||||
| Structured Large Cap Value | $ | 13,361,448 | $ | 13,839,325 | $ | 3,411 | $ | 2,107 | $ | — | ||||||||||
| Structured U.S. Equity | 16,050,094 | 16,552,800 | 4,026 | 453 | — | |||||||||||||||
| Structured Large Cap Growth | 17,928,869 | 18,741,150 | 2,273 | 722 | 104,325 | |||||||||||||||
| Structured Small Cap Equity | 84,157,357 | 87,723,500 | 49,198 | 32,460 | 12,929,356 | |||||||||||||||
| Structured International Equity | 111,270,914 | 118,069,939 | 31,804 | 34,479 | 20,372,625 | |||||||||||||||
| 6. LINE OF CREDIT FACILITY |
The Funds participate in a $350,000,000 committed, unsecured revolving line of credit facility together with other registered investment companies having management or investment advisory agreements with GSAM. Under the most restrictive arrangement, the Funds must own securities having a market value in excess of 300% of each Fund’s total bank borrowings. This facility is to be used solely for temporary or emergency purposes. The interest rate on borrowings is based on the federal funds rate. The committed facility also requires a fee to be paid by the Funds based on the amount of the commitment which has not been utilized. During the six months ended February 28, 2006, the Funds did not have any borrowings under this facility.
| 7. TAX INFORMATION |
As of the Funds’ most recent fiscal year end, August 31, 2005, the Funds’ capital loss carryforwards on a tax basis and timing differences were as follows.
| �� | |||||||||||||||||||||
| Structured Large | Structured U.S. | Structured Large | Structured | Structured | |||||||||||||||||
| Cap Value | Equity | Cap Growth | Small Cap Equity | International Equity | |||||||||||||||||
| Capital loss carryforward*: | |||||||||||||||||||||
| Expiring 2009 | $ | — | $ | (4,428,298 | ) | $ | — | $ | — | $ | — | ||||||||||
| Expiring 2010 | — | (22,415,823 | ) | (133,308,431 | ) | — | (2,626,726 | ) | |||||||||||||
| Expiring 2011 | — | (24,495,433 | ) | (145,633,770 | ) | — | (7,115,820 | ) | |||||||||||||
| Total capital loss carryforward | $ | — | $ | (51,339,554 | ) | $ | (278,942,201 | ) | $ | — | $ | (9,742,546 | ) | ||||||||
| Timing differences (post-October losses) | $ | — | $ | — | $ | — | $ | — | $ | (862,069 | ) | ||||||||||
| * | Expiration occurs on August 31 of the year indicated. Due to fund mergers, utilization of these losses may be limited under the Internal Revenue Code. |
| 7. TAX INFORMATION (continued) |
At February 28, 2006, the Funds’ aggregate security unrealized gains and losses based on cost for U.S. federal income tax purposes were as follows:
| Structured | Structured | |||||||||||||||||||
| Structured Large | Structured U.S. | Structured Large | Small Cap | International | ||||||||||||||||
| Cap Value | Equity | Cap Growth | Equity | Equity | ||||||||||||||||
| Tax Cost | $ | 735,652,875 | $ | 871,700,446 | $ | 600,888,499 | $ | 680,739,722 | $ | 1,716,355,034 | ||||||||||
| Gross unrealized gain | 88,171,147 | 136,616,104 | 73,087,086 | 106,386,003 | 221,751,636 | |||||||||||||||
| Gross unrealized loss | (5,011,185 | ) | (10,900,008 | ) | (10,572,946 | ) | (10,611,232 | ) | (4,044,123 | ) | ||||||||||
| Net unrealized security gain | $ | 83,159,962 | $ | 125,716,096 | $ | 62,514,140 | $ | 95,774,771 | $ | 217,707,513 | ||||||||||
The difference between book-basis and tax-basis unrealized gains (losses) is attributable primarily to wash sales, net mark-to-market gains (losses) on Section 1256 contracts and differences related to passive foreign investment company investments.
| 8. OTHER MATTERS |
As of February 28, 2006, Goldman, Sachs & Co. Profit Sharing Master Trust was the beneficial owner of approximately 38% and 11% of the outstanding Institutional shares of the Structured U.S. Equity Fund and Structured Small Cap Equity Fund, respectively. In addition, the following Goldman Sachs Asset Allocation Portfolios were beneficial owners of the Funds with amounts greater than 5% as of February 28, 2006 (as a percentage of outstanding Institutional shares):
| Goldman Sachs | Goldman Sachs | Goldman Sachs | Goldman Sachs | |||||||||||||
| Balanced Strategy | Growth and Income | Growth Strategy | Aggressive Growth | |||||||||||||
| Fund | Portfolio | Strategy Portfolio | Portfolio | Strategy Portfolio | ||||||||||||
| Structured Large Cap Value | 5 | % | 24 | % | 23 | % | 8 | % | ||||||||
| Structured Large Cap Growth | — | 19 | 21 | 7 | ||||||||||||
| Structured International Equity | — | 15 | 15 | 7 | ||||||||||||
Mergers and Reorganizations — At a meeting held on August 5, 2004, the Board of Trustees of the Trust approved an Agreement and Plan of Reorganization (“the Agreement”) providing for the tax-free acquisition of the Golden Oak International Equity into the Goldman Sachs Structured International Equity Fund. The acquisition was completed on September 28, 2004.
| Acquired Fund’s | ||||||||||||
| Exchanged Shares | Value of | Shares Outstanding | ||||||||||
| Survivor/Acquired Fund | of Survivor Issued | Exchanged Shares | as of September 28, 2004 | |||||||||
| Goldman Sachs Structured International Equity Class A/ Golden Oak International Equity Class A | 143,778 | $ | 1,370,167 | 174,727 | ||||||||
| Goldman Sachs Structured International Equity Institutional Class/ Golden Oak International Equity Institutional Class | 4,500,559 | 43,746,329 | 5,554,976 | |||||||||
Notes to Financial Statements (continued)
| 8. OTHER MATTERS (continued) |
The following chart shows the Survivor Fund’s and Acquired Fund’s aggregate net assets (immediately before and after the completion of the acquisition) and the Acquired Fund’s unrealized appreciation and capital loss carryforwards. Utilization of the Acquired Fund’s capital loss carryforward may be limited under the Internal Revenue Code.
| Survivor Fund’s | ||||||||||||||||||||
| Survivor Fund’s | Acquired Fund’s | Aggregate | ||||||||||||||||||
| Aggregate | Aggregate | Acquired | Acquired | Net Assets | ||||||||||||||||
| Net Assets | Net Assets | Fund’s | Fund’s | immediately | ||||||||||||||||
| before | before | Unrealized | Capital Loss | after | ||||||||||||||||
| Survivor/Acquired Funds | acquisition | acquisition | Appreciation | Carryforward | acquisition | |||||||||||||||
| Goldman Sachs Structured International Equity/ Golden Oak International Equity | $ | 414,212,685 | $ | 45,116,496 | $ | 3,622,910 | $ | (4,590,913 | ) | $ | 459,329,181 | |||||||||
At a meeting held on November 4, 2004, the Board of Trustees of the Trust approved an Agreement and Plan of Reorganization (“the Agreement”) providing for the tax-free acquisition of the Expedition Equity Fund into the Goldman Sachs Structured U.S. Equity Fund. The acquisition was completed on February 28, 2005.
| Acquired Fund’s | ||||||||||||
| Exchanged Shares | Value of | Shares Outstanding as | ||||||||||
| Survivor/Acquired Fund | of Survivor Issued | Exchanged Shares | of February 25, 2005 | |||||||||
| Goldman Sachs Structured U.S. Equity Class A/ Expedition Equity Class A | 234,940 | $ | 6,634,688 | 799,756 | ||||||||
| Goldman Sachs Structured U.S. Equity Class B/ Expedition Equity Class B | 522,540 | 13,993,554 | 1,770,335 | |||||||||
| Goldman Sachs Structured U.S. Equity Institutional Class/ Expedition Equity Institutional Class | 3,631,659 | 104,410,705 | 12,455,438 | |||||||||
The following chart shows the Survivor Fund’s and Acquired Fund’s aggregate net assets (immediately before and after the completion of the acquisition) and the Acquired Fund’s unrealized appreciation.
| Survivor Fund’s | ||||||||||||||||||||
| Survivor Fund’s | Acquired Fund’s | Aggregate | ||||||||||||||||||
| Aggregate | Aggregate | Acquired | Acquired | Net Assets | ||||||||||||||||
| Net Assets | Net Assets | Fund’s | Funds’ | immediately | ||||||||||||||||
| before | before | Unrealized | Capital Loss | after | ||||||||||||||||
| Survivor/Acquired Fund | acquisition | acquisition | Appreciation | Carryforward | acquisition | |||||||||||||||
| Goldman Sachs Structured U.S. Equity/Expedition Equity | $ | 791,212,862 | $ | 125,038,947 | $ | 18,353,229 | $ | (79,989,096 | ) | $ | 916,251,809 | |||||||||
Legal Proceedings — Purported class and derivative action lawsuits were filed in April and May 2004 in the United States District Court for the Southern District of New York against the Goldman Sachs Group, Inc. (“GSG”), GSAM and certain related parties, including certain Goldman Sachs Funds including these Funds, and the Trustees and Officers of the Goldman Sachs Trust. In June 2004, these lawsuits were consolidated into one action and in November 2004 a consolidated and amended complaint was filed against GSG, GSAM, Goldman Sachs Asset Management International (“GSAMI”), Goldman Sachs and certain related parties including certain Goldman Sachs Funds and the Trustees and Officers of the Trust. The Funds in this report, along with certain other investment portfolios of the Trust, were named as nominal defendants in the amended complaint. Plaintiffs filed a second amended consolidated complaint on April 15, 2005. The second amended
| 8. OTHER MATTERS (continued) |
complaint alleges violations of the Act and the Investment Advisers Act of 1940. The complaint also asserts claims involving common law breach of fiduciary duty, aiding and abetting breach of fiduciary duty and unjust enrichment. The complaint alleges, among other things, that between April 2, 1999 and January 9, 2004 (the ”Class Period”), GSAM and other defendants made improper and excessive brokerage commission and other payments to brokers that sold shares of the Goldman Sachs Funds and omitted statements of fact in registration statements and reports filed pursuant to the Act which were necessary to prevent such registration statements and reports from being materially false and misleading. The complaint further alleges that the Goldman Sachs Funds paid excessive and improper advisory fees to Goldman Sachs. The complaint also alleges that GSAM and GSAMI used 12b-1 fees for improper purposes and made improper use of soft dollars. The complaint further alleges that the Trust’s officers and trustees breached their fiduciary duties in connection with the foregoing. On January 13, 2006, all claims against the defendants were dismissed by the U.S. district Court. On February 22, 2006, the plaintiffs appealed this decision.
| 9. SUBSEQUENT EVENT |
At a meeting held on December 14, 2005, the Board of Trustees of the Trust approved an Agreement and Plan of Reorganization which provides for the reorganization of the First Funds’ Core Equity Portfolio into the Structured U.S. Equity Fund as well as the First Funds’ Capital Appreciation Portfolio into the Structured Small Cap Equity Fund. On April 7, 2006, the Board of Trustees of the Trust approved certain amendments to this Agreement and Plan of Reorganization. It is expected that the reorganization will take place in June 2006.
Notes to Financial Statements (continued)
| 10. SUMMARY OF SHARE TRANSACTIONS |
Share activity is as follows:
| Structured Large Cap Value | ||||||||||||||||
| For the Six Months Ended | For the Year Ended | |||||||||||||||
| February 28, 2006 | August 31, 2005 | |||||||||||||||
| Shares | Dollars | Shares | Dollars | |||||||||||||
Class A Shares | ||||||||||||||||
| Shares sold | 7,678,726 | $ | 100,070,316 | 8,442,890 | $ | 102,286,779 | ||||||||||
| Shares issued in connection with merger | — | — | — | — | ||||||||||||
Shares converted from Class B(a) | 39,663 | 510,184 | 29,581 | 360,703 | ||||||||||||
| Reinvestment of dividends and distributions | 398,231 | 5,163,763 | 275,453 | 3,308,458 | ||||||||||||
| Shares repurchased | (3,408,859 | ) | (45,254,870 | ) | (3,064,759 | ) | (36,828,135 | ) | ||||||||
| 4,707,761 | 60,489,393 | 5,683,165 | 69,127,805 | |||||||||||||
Class B Shares | ||||||||||||||||
| Shares sold | 115,322 | 1,488,244 | 223,430 | 2,676,204 | ||||||||||||
| Shares issued in connection with merger | — | — | — | — | ||||||||||||
| Reinvestment of dividends and distributions | 25,104 | 323,580 | 33,408 | 399,119 | ||||||||||||
Shares converted to Class A(a) | (40,004 | ) | (510,184 | ) | (29,825 | ) | (360,703 | ) | ||||||||
| Shares repurchased | (235,623 | ) | (3,044,298 | ) | (392,351 | ) | (4,713,426 | ) | ||||||||
| (135,201 | ) | (1,742,658 | ) | (165,338 | ) | (1,998,806 | ) | |||||||||
Class C Shares | ||||||||||||||||
| Shares sold | 249,763 | 3,228,860 | 574,083 | 6,868,263 | ||||||||||||
| Reinvestment of dividends and distributions | 29,848 | 385,021 | 32,914 | 393,527 | ||||||||||||
| Shares repurchased | (327,133 | ) | (4,259,430 | ) | (504,742 | ) | (6,075,965 | ) | ||||||||
| (47,522 | ) | (645,549 | ) | 102,255 | 1,185,825 | |||||||||||
Institutional Shares | ||||||||||||||||
| Shares sold | 15,573,339 | 202,592,105 | 16,747,719 | 204,004,866 | ||||||||||||
| Shares issued in connection with merger | — | — | — | — | ||||||||||||
| Reinvestment of dividends and distributions | 929,588 | 12,043,567 | 552,422 | 6,619,164 | ||||||||||||
| Shares repurchased | (9,298,899 | ) | (121,218,636 | ) | (4,428,406 | ) | (51,716,817 | ) | ||||||||
| 7,204,028 | 93,417,036 | 12,871,735 | 158,907,213 | |||||||||||||
Service Shares | ||||||||||||||||
| Shares sold | 10,162 | 135,600 | 33,319 | 400,563 | ||||||||||||
| Reinvestment of dividends and distributions | 1,009 | 13,122 | 1,317 | 15,852 | ||||||||||||
| Shares repurchased | (49,588 | ) | (663,462 | ) | (15,480 | ) | (184,314 | ) | ||||||||
| (38,417 | ) | (514,740 | ) | 19,156 | 232,101 | |||||||||||
NET INCREASE | 11,690,649 | $ | 151,003,482 | 18,510,973 | $ | 227,454,138 | ||||||||||
| (a) | Class B Shares will automatically convert to Class A Shares at the end of the calendar quarter that is eight years after the initial purchase date of either the Fund or another Goldman Sachs Fund. |
| 10. SUMMARY OF SHARE TRANSACTIONS (continued) |
| Structured U.S. Equity | Structured Large Cap Growth | |||||||||||||||||||||||||||||||
| For the Six Months Ended | For the Year Ended | For the Six Months Ended | For the Year Ended | |||||||||||||||||||||||||||||
| February 28, 2006 | August 31, 2005 | February 28, 2006 | August 31, 2005 | |||||||||||||||||||||||||||||
| Shares | Dollars | Shares | Dollars | Shares | Dollars | Shares | Dollars | |||||||||||||||||||||||||
| 1,925,578 | $ | 58,489,213 | 3,817,252 | $ | 106,115,210 | 5,405,069 | $ | 69,811,756 | 6,107,993 | $ | 73,626,115 | |||||||||||||||||||||
| — | — | 234,940 | 6,634,688 | — | — | — | — | |||||||||||||||||||||||||
| 184,972 | 5,492,499 | 195,024 | 5,372,733 | 212,111 | 2,707,290 | 88,745 | 1,052,643 | |||||||||||||||||||||||||
| 54,043 | 1,639,135 | 116,505 | 3,286,613 | 4,541 | 59,855 | — | — | |||||||||||||||||||||||||
| (1,769,082 | ) | (53,127,715 | ) | (3,412,663 | ) | (94,828,489 | ) | (3,013,556 | ) | (39,796,626 | ) | (3,768,736 | ) | (44,490,893 | ) | |||||||||||||||||
| 395,511 | 12,493,132 | 951,058 | 26,580,755 | 2,608,165 | 32,782,275 | 2,428,002 | 30,187,865 | |||||||||||||||||||||||||
| 63,929 | 1,825,695 | 200,079 | 5,224,404 | 64,695 | 792,445 | 177,675 | 2,011,348 | |||||||||||||||||||||||||
| — | — | 522,540 | 13,993,554 | — | — | — | — | |||||||||||||||||||||||||
| — | — | 1,419 | 38,000 | — | — | — | — | |||||||||||||||||||||||||
| (195,760 | ) | (5,492,499 | ) | (205,980 | ) | (5,372,733 | ) | (225,677 | ) | (2,707,290 | ) | (94,046 | ) | (1,052,643 | ) | |||||||||||||||||
| (662,575 | ) | (18,750,528 | ) | (1,307,824 | ) | (34,212,836 | ) | (1,021,539 | ) | (12,378,109 | ) | (2,003,340 | ) | (22,604,976 | ) | |||||||||||||||||
| (794,406 | ) | (22,417,332 | ) | (789,766 | ) | (20,329,611 | ) | (1,182,521 | ) | (14,292,954 | ) | (1,919,711 | ) | (21,646,271 | ) | |||||||||||||||||
| 97,745 | 2,773,387 | 301,821 | 7,880,311 | 116,241 | 1,428,660 | 158,700 | 1,793,715 | |||||||||||||||||||||||||
| — | — | 1,789 | 47,717 | — | — | — | — | |||||||||||||||||||||||||
| (216,195 | ) | (6,165,793 | ) | (493,515 | ) | (12,925,965 | ) | (518,590 | ) | (6,428,829 | ) | (764,504 | ) | (8,662,729 | ) | |||||||||||||||||
| (118,450 | ) | (3,392,406 | ) | (189,905 | ) | (4,997,937 | ) | (402,349 | ) | (5,000,169 | ) | (605,804 | ) | (6,869,014 | ) | |||||||||||||||||
| 1,692,119 | 52,287,513 | 1,504,363 | 43,409,655 | 12,029,279 | 159,659,389 | 14,878,459 | 184,619,266 | |||||||||||||||||||||||||
| — | — | 3,631,659 | 104,410,705 | — | — | — | — | |||||||||||||||||||||||||
| 37,172 | 1,148,613 | 55,473 | 1,591,529 | 77,883 | 1,052,189 | — | — | |||||||||||||||||||||||||
| (810,018 | ) | (24,847,279 | ) | (1,462,411 | ) | (41,242,690 | ) | (6,811,828 | ) | (92,090,649 | ) | (4,008,711 | ) | (47,339,167 | ) | |||||||||||||||||
| 919,273 | 28,588,847 | 3,729,084 | 108,169,199 | 5,295,334 | 68,620,929 | 10,869,748 | 137,280,099 | |||||||||||||||||||||||||
| 76,076 | 2,280,016 | 134,243 | 3,703,952 | 871 | 11,234 | 3,781 | 45,010 | |||||||||||||||||||||||||
| 932 | 28,029 | 2,468 | 69,042 | — | — | — | — | |||||||||||||||||||||||||
| (91,715 | ) | (2,735,033 | ) | (139,080 | ) | (3,844,408 | ) | (1,872 | ) | (22,877 | ) | (18,179 | ) | (215,549 | ) | |||||||||||||||||
| (14,707 | ) | (426,988 | ) | (2,369 | ) | (71,414 | ) | (1,001 | ) | (11,643 | ) | (14,398 | ) | (170,539 | ) | |||||||||||||||||
| 387,221 | $ | 14,845,253 | 3,698,102 | $ | 109,350,992 | 6,317,628 | $ | 82,098,438 | 10,757,837 | $ | 138,782,140 | |||||||||||||||||||||
Notes to Financial Statements (continued)
| 10. SUMMARY OF SHARE TRANSACTIONS (continued) |
| Structured Small Cap Equity | ||||||||||||||||
| For the Six Months Ended | For the Year Ended | |||||||||||||||
| February 28, 2006 | August 31, 2005 | |||||||||||||||
| Shares | Dollars | Shares | Dollars | |||||||||||||
Class A Shares | ||||||||||||||||
| Shares sold | 4,468,259 | $ | 63,806,505 | 5,800,199 | $ | 77,871,561 | ||||||||||
| Shares issued in connection with merger | — | — | — | — | ||||||||||||
Shares converted from Class B(a) | 53,477 | 749,597 | 14,332 | 186,045 | ||||||||||||
| Reinvestment of dividends and distributions | 813,060 | 11,244,622 | 477,055 | 6,249,416 | ||||||||||||
| Shares repurchased | (2,685,284 | ) | (37,970,301 | ) | (5,013,806 | ) | (67,263,693 | ) | ||||||||
| 2,649,512 | 37,830,423 | 1,277,780 | 17,043,329 | |||||||||||||
Class B Shares | ||||||||||||||||
| Shares sold | 76,418 | 1,020,463 | 204,747 | 2,590,389 | ||||||||||||
| Shares issued in connection with merger | — | — | — | — | ||||||||||||
| Reinvestment of dividends and distributions | 106,848 | 1,369,787 | 81,647 | 1,005,077 | ||||||||||||
Shares converted to Class A(a) | (57,480 | ) | (749,597 | ) | (15,234 | ) | (186,045 | ) | ||||||||
| Shares repurchased | (173,280 | ) | (2,304,502 | ) | (531,641 | ) | (6,667,472 | ) | ||||||||
| (47,494 | ) | (663,849 | ) | (260,481 | ) | (3,258,051 | ) | |||||||||
Class C Shares | ||||||||||||||||
| Shares sold | 432,941 | 5,766,108 | 637,975 | 8,111,339 | ||||||||||||
| Reinvestment of dividends and distributions | 152,758 | 1,965,990 | 85,890 | 1,060,746 | ||||||||||||
| Shares repurchased | (399,603 | ) | (5,292,036 | ) | (701,355 | ) | (8,821,128 | ) | ||||||||
| 186,096 | 2,440,062 | 22,510 | 350,957 | |||||||||||||
Institutional Shares | ||||||||||||||||
| Shares sold | 10,356,620 | 151,044,343 | 16,915,181 | 233,298,330 | ||||||||||||
| Shares issued in connection with merger | — | — | — | — | ||||||||||||
| Reinvestment of dividends and distributions | 1,580,760 | 22,541,641 | 646,629 | 8,684,223 | ||||||||||||
| Shares repurchased | (5,033,223 | ) | (75,108,616 | ) | (7,148,812 | ) | (99,558,812 | ) | ||||||||
| 6,904,157 | 98,477,368 | 10,412,998 | 142,423,741 | |||||||||||||
Service Shares | ||||||||||||||||
| Shares sold | 384,311 | 5,366,965 | 857,491 | 11,350,809 | ||||||||||||
| Reinvestment of dividends and distributions | 113,254 | 1,548,180 | 84,436 | 1,095,982 | ||||||||||||
| Shares repurchased | (851,356 | ) | (12,252,203 | ) | (1,786,301 | ) | (23,740,948 | ) | ||||||||
| (353,791 | ) | (5,337,058 | ) | (844,374 | ) | (11,294,157 | ) | |||||||||
NET INCREASE | 9,338,480 | $ | 132,746,946 | 10,608,433 | $ | 145,265,819 | ||||||||||
| 10. SUMMARY OF SHARE TRANSACTIONS (continued) |
| Structured International Equity | ||||||||||||||||
| For the Six Months Ended | For the Year Ended | |||||||||||||||
| February 28, 2006 | August 31, 2005 | |||||||||||||||
| Shares | Dollars | Shares | Dollars | |||||||||||||
| 12,078,405 | $ | 150,269,805 | 16,693,893 | $ | 179,600,914 | |||||||||||
| — | — | 143,778 | 1,370,167 | |||||||||||||
| 28,803 | 350,612 | 11,411 | 119,709 | |||||||||||||
| 408,328 | 4,969,353 | 107,079 | 1,120,041 | |||||||||||||
| (3,403,274 | ) | (41,520,629 | ) | (5,577,909 | ) | (60,404,374 | ) | |||||||||
| 9,112,262 | 114,069,141 | 11,378,252 | 121,806,457 | |||||||||||||
| 181,927 | 2,240,190 | 193,712 | 2,067,416 | |||||||||||||
| — | — | — | — | |||||||||||||
| 5,222 | 62,977 | — | — | |||||||||||||
| (29,163 | ) | (350,612 | ) | (11,549 | ) | (119,709 | ) | |||||||||
| (122,474 | ) | (1,489,964 | ) | (165,944 | ) | (1,755,991 | ) | |||||||||
| 35,512 | 462,591 | 16,219 | 191,716 | |||||||||||||
| 68,008 | 834,988 | 136,148 | 1,452,028 | |||||||||||||
| 3,061 | 36,944 | — | — | |||||||||||||
| (22,802 | ) | (274,556 | ) | (117,796 | ) | (1,251,939 | ) | |||||||||
| 48,267 | 597,376 | 18,352 | 200,089 | |||||||||||||
| 34,994,066 | 447,319,513 | 39,786,594 | 430,630,065 | |||||||||||||
| — | — | 4,500,559 | 43,746,329 | |||||||||||||
| 1,135,451 | 14,079,590 | 404,691 | 4,305,919 | |||||||||||||
| (5,603,532 | ) | (70,917,700 | ) | (13,240,749 | ) | (147,797,277 | ) | |||||||||
| 30,525,985 | 390,481,403 | 31,451,095 | 330,885,036 | |||||||||||||
| 657,658 | 8,096,678 | 2,010,483 | 22,145,156 | |||||||||||||
| 15,544 | 189,788 | 78 | 827 | |||||||||||||
| (128,575 | ) | (1,589,534 | ) | (113,395 | ) | (1,288,536 | ) | |||||||||
| 544,627 | 6,696,932 | 1,897,166 | 20,857,447 | |||||||||||||
| 40,266,653 | $ | 512,307,443 | 44,761,084 | $ | 473,940,745 | |||||||||||
Financial Highlights
| Income (loss) from | Distributions | |||||||||||||||||||||||||||||||
| investment operations | to shareholders | |||||||||||||||||||||||||||||||
| Net asset | Net | |||||||||||||||||||||||||||||||
| value, | investment | Net realized | Total from | From net | From net | |||||||||||||||||||||||||||
| beginning | income | and unrealized | investment | investment | realized | Total | ||||||||||||||||||||||||||
| Year - Share Class | of period | (loss)(a) | gain (loss) | operations | income | gains | distributions | |||||||||||||||||||||||||
| FOR THE SIX MONTHS ENDED FEBRUARY 28, (Unaudited) | ||||||||||||||||||||||||||||||||
| 2006 - A | $ | 12.69 | $ | 0.08 | $ | 1.02 | $ | 1.10 | $ | (0.06 | ) | $ | (0.24 | ) | $ | (0.30 | ) | |||||||||||||||
| 2006 - B | 12.59 | 0.03 | 1.01 | 1.04 | (0.01 | ) | (0.24 | ) | (0.25 | ) | ||||||||||||||||||||||
| 2006 - C | 12.60 | 0.03 | 1.02 | 1.05 | (0.01 | ) | (0.24 | ) | (0.25 | ) | ||||||||||||||||||||||
| 2006 - Institutional | 12.69 | 0.11 | 1.01 | 1.12 | (0.08 | ) | (0.24 | ) | (0.32 | ) | ||||||||||||||||||||||
| 2006 - Service | 12.73 | 0.07 | 1.02 | 1.09 | (0.05 | ) | (0.24 | ) | (0.29 | ) | ||||||||||||||||||||||
| FOR THE YEARS ENDED AUGUST 31, | ||||||||||||||||||||||||||||||||
| 2005 - A | 11.15 | 0.12 | 1.76 | 1.88 | (0.09 | ) | (0.25 | ) | (0.34 | ) | ||||||||||||||||||||||
| 2005 - B | 11.06 | 0.03 | 1.76 | 1.79 | (0.01 | ) | (0.25 | ) | (0.26 | ) | ||||||||||||||||||||||
| 2005 - C | 11.07 | 0.03 | 1.76 | 1.79 | (0.01 | ) | (0.25 | ) | (0.26 | ) | ||||||||||||||||||||||
| 2005 - Institutional | 11.14 | 0.17 | 1.77 | 1.94 | (0.14 | ) | (0.25 | ) | (0.39 | ) | ||||||||||||||||||||||
| 2005 - Service | 11.18 | 0.11 | 1.77 | 1.88 | (0.08 | ) | (0.25 | ) | (0.33 | ) | ||||||||||||||||||||||
| 2004 - A | 9.48 | 0.04 | 1.75 | 1.79 | (0.12 | ) | — | (0.12 | ) | |||||||||||||||||||||||
| 2004 - B | 9.40 | (0.04 | ) | 1.74 | 1.70 | (0.04 | ) | — | (0.04 | ) | ||||||||||||||||||||||
| 2004 - C | 9.42 | (0.04 | ) | 1.73 | 1.69 | (0.04 | ) | — | (0.04 | ) | ||||||||||||||||||||||
| 2004 - Institutional | 9.47 | 0.09 | 1.74 | 1.83 | (0.16 | ) | — | (0.16 | ) | |||||||||||||||||||||||
| 2004 - Service | 9.50 | 0.03 | 1.76 | 1.79 | (0.11 | ) | — | (0.11 | ) | |||||||||||||||||||||||
| 2003 - A | 8.74 | 0.10 | 0.74 | 0.84 | (0.10 | ) | — | (0.10 | ) | |||||||||||||||||||||||
| 2003 - B | 8.67 | 0.03 | 0.73 | 0.76 | (0.03 | ) | — | (0.03 | ) | |||||||||||||||||||||||
| 2003 - C | 8.68 | 0.03 | 0.74 | 0.77 | (0.03 | ) | — | (0.03 | ) | |||||||||||||||||||||||
| 2003 - Institutional | 8.74 | 0.13 | 0.73 | 0.86 | (0.13 | ) | — | (0.13 | ) | |||||||||||||||||||||||
| 2003 - Service | 8.74 | 0.09 | 0.74 | 0.83 | (0.07 | ) | — | (0.07 | ) | |||||||||||||||||||||||
| 2002 - A | 10.31 | 0.07 | (1.57 | ) | (1.50 | ) | (0.07 | ) | — | (0.07 | ) | |||||||||||||||||||||
| 2002 - B | 10.24 | — | (c) | (1.56 | ) | (1.56 | ) | (0.01 | ) | — | (0.01 | ) | ||||||||||||||||||||
| 2002 - C | 10.25 | — | (c) | (1.56 | ) | (1.56 | ) | (0.01 | ) | — | (0.01 | ) | ||||||||||||||||||||
| 2002 - Institutional | 10.31 | 0.11 | (1.57 | ) | (1.46 | ) | (0.11 | ) | — | (0.11 | ) | |||||||||||||||||||||
| 2002 - Service | 10.31 | 0.07 | (1.58 | ) | (1.51 | ) | (0.06 | ) | — | (0.06 | ) | |||||||||||||||||||||
| 2001 - A | 10.81 | 0.07 | (0.42 | ) | (0.35 | ) | (0.09 | ) | (0.06 | ) | �� | (0.15 | ) | |||||||||||||||||||
| 2001 - B | 10.75 | (0.01 | ) | (0.42 | ) | (0.43 | ) | (0.02 | ) | (0.06 | ) | (0.08 | ) | |||||||||||||||||||
| 2001 - C | 10.76 | (0.01 | ) | (0.42 | ) | (0.43 | ) | (0.02 | ) | (0.06 | ) | (0.08 | ) | |||||||||||||||||||
| 2001 - Institutional | 10.82 | 0.11 | (0.43 | ) | (0.32 | ) | (0.13 | ) | (0.06 | ) | (0.19 | ) | ||||||||||||||||||||
| 2001 - Service | 10.81 | 0.06 | (0.42 | ) | (0.36 | ) | (0.08 | ) | (0.06 | ) | (0.14 | ) | ||||||||||||||||||||
| (a) | Calculated based on the average shares outstanding methodology. |
| (b) | Assumes investment at the net asset value at the beginning of the period, reinvestment of all dividends and distributions, a complete redemption of the investment at the net asset value at the end of the period and no sales or redemption charges. Total return would be reduced if a sales or redemption charge were taken into account. Total returns for periods less than one full year are not annualized. Returns do not reflect the deduction of taxes that a shareholder would pay on Fund distributions or the redemption of Fund shares. |
| (c) | Amount is less than $0.005 per share. |
| (d) | Annualized. |
62
| Ratios assuming no | ||||||||||||||||||||||||||||||||||
| expense reductions | ||||||||||||||||||||||||||||||||||
| Ratio of | Ratio of | |||||||||||||||||||||||||||||||||
| Net assets, | Ratio of | net investment | Ratio of | net investment | ||||||||||||||||||||||||||||||
| Net asset | end of | net expenses | income (loss) | total expenses | income (loss) | Portfolio | ||||||||||||||||||||||||||||
| value, end | Total | period | to average | to average | to average | to average | turnover | |||||||||||||||||||||||||||
| of period | return(b) | (in 000s) | net assets | net assets | net assets | net assets | rate | |||||||||||||||||||||||||||
| $ | 13.49 | 8.74 | % | $ | 261,736 | 1.05 | %(d) | 1.19 | %(d) | 1.10 | %(d) | 1.14 | %(d) | 63 | % | |||||||||||||||||||
| 13.38 | 8.30 | 19,963 | 1.80 | (d) | 0.44 | (d) | 1.85 | (d) | 0.39 | (d) | 63 | |||||||||||||||||||||||
| 13.40 | 8.39 | 21,339 | 1.80 | (d) | 0.44 | (d) | 1.85 | (d) | 0.39 | (d) | 63 | |||||||||||||||||||||||
| 13.49 | 8.94 | 506,392 | 0.65 | (d) | 1.59 | (d) | 0.70 | (d) | 1.54 | (d) | 63 | |||||||||||||||||||||||
| 13.53 | 8.63 | 330 | 1.15 | (d) | 1.09 | (d) | 1.20 | (d) | 1.04 | (d) | 63 | |||||||||||||||||||||||
| 12.69 | 17.13 | 186,441 | 1.10 | 0.99 | 1.14 | 0.95 | 132 | |||||||||||||||||||||||||||
| 12.59 | 16.32 | 20,479 | 1.85 | 0.22 | 1.89 | 0.18 | 132 | |||||||||||||||||||||||||||
| 12.60 | 16.32 | 20,666 | 1.85 | 0.22 | 1.89 | 0.18 | 132 | |||||||||||||||||||||||||||
| 12.69 | 17.69 | 384,875 | 0.70 | 1.39 | 0.74 | 1.35 | 132 | |||||||||||||||||||||||||||
| 12.73 | 17.06 | 799 | 1.20 | 0.87 | 1.24 | 0.83 | 132 | |||||||||||||||||||||||||||
| 11.15 | 18.93 | 100,374 | 1.10 | 0.95 | 1.15 | 0.90 | 154 | |||||||||||||||||||||||||||
| 11.06 | 18.09 | 19,819 | 1.85 | 0.19 | 1.90 | 0.14 | 154 | |||||||||||||||||||||||||||
| 11.07 | 17.97 | 17,027 | 1.85 | 0.19 | 1.90 | 0.14 | 154 | |||||||||||||||||||||||||||
| 11.14 | 19.41 | 194,541 | 0.70 | 1.36 | 0.75 | 1.31 | 154 | |||||||||||||||||||||||||||
| 11.18 | 18.89 | 487 | 1.20 | 0.84 | 1.25 | 0.79 | 154 | |||||||||||||||||||||||||||
| 9.48 | 9.70 | 79,866 | 1.11 | 1.13 | 1.22 | 1.02 | 102 | |||||||||||||||||||||||||||
| 9.40 | 8.83 | 18,077 | 1.86 | 0.38 | 1.97 | 0.27 | 102 | |||||||||||||||||||||||||||
| 9.42 | 8.95 | 13,798 | 1.86 | 0.37 | 1.97 | 0.26 | 102 | |||||||||||||||||||||||||||
| 9.47 | 10.03 | 145,059 | 0.71 | 1.52 | 0.82 | 1.41 | 102 | |||||||||||||||||||||||||||
| 9.50 | 9.58 | 327 | 1.21 | 1.02 | 1.32 | 0.91 | 102 | |||||||||||||||||||||||||||
| 8.74 | (14.61 | ) | 76,472 | 1.11 | 0.76 | 1.20 | 0.67 | 112 | ||||||||||||||||||||||||||
| 8.67 | (15.28 | ) | 18,828 | 1.86 | 0.00 | 1.95 | (0.09 | ) | 112 | |||||||||||||||||||||||||
| 8.68 | (15.26 | ) | 12,533 | 1.86 | 0.01 | 1.95 | (0.08 | ) | 112 | |||||||||||||||||||||||||
| 8.74 | (14.25 | ) | 108,613 | 0.71 | 1.15 | 0.80 | 1.06 | 112 | ||||||||||||||||||||||||||
| 8.74 | (14.70 | ) | 281 | 1.21 | 0.72 | 1.30 | 0.63 | 112 | ||||||||||||||||||||||||||
| 10.31 | (3.32 | ) | 89,861 | 1.10 | 0.64 | 1.17 | 0.57 | 70 | ||||||||||||||||||||||||||
| 10.24 | (4.08 | ) | 22,089 | 1.85 | (0.11 | ) | 1.92 | (0.18 | ) | 70 | ||||||||||||||||||||||||
| 10.25 | (4.07 | ) | 15,222 | 1.85 | (0.11 | ) | 1.92 | (0.18 | ) | 70 | ||||||||||||||||||||||||
| 10.31 | (3.03 | ) | 132,684 | 0.70 | 1.04 | 0.77 | 0.97 | 70 | ||||||||||||||||||||||||||
| 10.31 | (3.43 | ) | 56 | 1.20 | 0.52 | 1.27 | 0.45 | 70 | ||||||||||||||||||||||||||
Financial Highlights
| Income (loss) from | Distributions | |||||||||||||||||||||||||||||||
| investment operations | to shareholders | |||||||||||||||||||||||||||||||
| Net asset | Net | |||||||||||||||||||||||||||||||
| value, | investment | Net realized | Total from | From net | From net | |||||||||||||||||||||||||||
| beginning | income | and unrealized | investment | investment | realized | Total | ||||||||||||||||||||||||||
| Year - Share Class | of period | (loss)(a) | gain (loss) | operations | income | gains | distributions | |||||||||||||||||||||||||
| FOR THE SIX MONTHS ENDED FEBRUARY 28, (Unaudited) | ||||||||||||||||||||||||||||||||
| 2006 - A | $ | 29.13 | $ | 0.11 | $ | 2.02 | $ | 2.13 | $ | (0.11 | ) | $ | — | $ | (0.11 | ) | ||||||||||||||||
| 2006 - B | 27.52 | — | (d) | 1.90 | 1.90 | — | — | — | ||||||||||||||||||||||||
| 2006 - C | 27.39 | — | (d) | 1.90 | 1.90 | — | — | — | ||||||||||||||||||||||||
| 2006 - Institutional | 29.72 | 0.18 | 2.04 | 2.22 | (0.18 | ) | — | (0.18 | ) | |||||||||||||||||||||||
| 2006 - Service | 28.88 | 0.10 | 1.99 | 2.09 | (0.09 | ) | — | (0.09 | ) | |||||||||||||||||||||||
| FOR THE YEARS ENDED AUGUST 31, | ||||||||||||||||||||||||||||||||
| 2005 - A | 25.81 | 0.26 | (c) | 3.28 | 3.54 | (0.22 | ) | — | (0.22 | ) | ||||||||||||||||||||||
| 2005 - B | 24.39 | 0.05 | (c) | 3.09 | 3.14 | (0.01 | ) | — | (0.01 | ) | ||||||||||||||||||||||
| 2005 - C | 24.30 | 0.05 | (c) | 3.07 | 3.12 | (0.03 | ) | — | (0.03 | ) | ||||||||||||||||||||||
| 2005 - Institutional | 26.32 | 0.36 | (c) | 3.37 | 3.73 | (0.33 | ) | — | (0.33 | ) | ||||||||||||||||||||||
| 2005 - Service | 25.60 | 0.23 | (c) | 3.25 | 3.48 | (0.20 | ) | — | (0.20 | ) | ||||||||||||||||||||||
| 2004 - A | 22.57 | 0.11 | 3.20 | 3.31 | (0.07 | ) | — | (0.07 | ) | |||||||||||||||||||||||
| 2004 - B | 21.42 | (0.08 | ) | 3.05 | 2.97 | — | — | — | ||||||||||||||||||||||||
| 2004 - C | 21.34 | (0.08 | ) | 3.04 | 2.96 | — | — | — | ||||||||||||||||||||||||
| 2004 - Institutional | 23.00 | 0.21 | 3.27 | 3.48 | (0.16 | ) | — | (0.16 | ) | |||||||||||||||||||||||
| 2004 - Service | 22.40 | 0.08 | 3.19 | 3.27 | (0.07 | ) | — | (0.07 | ) | |||||||||||||||||||||||
| 2003 - A | 20.18 | 0.09 | 2.31 | 2.40 | (0.01 | ) | — | (0.01 | ) | |||||||||||||||||||||||
| 2003 - B | 19.28 | (0.06 | ) | 2.20 | 2.14 | — | — | — | ||||||||||||||||||||||||
| 2003 - C | 19.20 | (0.06 | ) | 2.20 | 2.14 | — | — | — | ||||||||||||||||||||||||
| 2003 - Institutional | 20.57 | 0.17 | 2.37 | 2.54 | (0.11 | ) | — | (0.11 | ) | |||||||||||||||||||||||
| 2003 - Service | 20.03 | 0.07 | 2.30 | 2.37 | — | — | — | |||||||||||||||||||||||||
| 2002 - A | 24.30 | 0.04 | (4.16 | ) | (4.12 | ) | — | — | — | |||||||||||||||||||||||
| 2002 - B | 23.39 | (0.13 | ) | (3.98 | ) | (4.11 | ) | — | — | — | ||||||||||||||||||||||
| 2002 - C | 23.29 | (0.12 | ) | (3.97 | ) | (4.09 | ) | — | — | — | ||||||||||||||||||||||
| 2002 - Institutional | 24.68 | 0.14 | (4.25 | ) | (4.11 | ) | — | — | — | |||||||||||||||||||||||
| 2002 - Service | 24.15 | 0.02 | (4.14 | ) | (4.12 | ) | — | — | — | |||||||||||||||||||||||
| 2001 - A | 36.77 | 0.01 | (8.96 | ) | (8.95 | ) | (0.06 | ) | (3.46 | ) | (3.52 | ) | ||||||||||||||||||||
| 2001 - B | 35.71 | (0.19 | ) | (8.67 | ) | (8.86 | ) | — | (3.46 | ) | (3.46 | ) | ||||||||||||||||||||
| 2001 - C | 35.59 | (0.19 | ) | (8.65 | ) | (8.84 | ) | — | (3.46 | ) | (3.46 | ) | ||||||||||||||||||||
| 2001 - Institutional | 37.30 | 0.13 | (9.09 | ) | (8.96 | ) | (0.20 | ) | (3.46 | ) | (3.66 | ) | ||||||||||||||||||||
| 2001 - Service | 36.54 | (0.01 | ) | (8.91 | ) | (8.92 | ) | (0.01 | ) | (3.46 | ) | (3.47 | ) | |||||||||||||||||||
| (a) | Calculated based on the average shares outstanding methodology. |
| (b) | Assumes investment at the net asset value at the beginning of the period, reinvestment of all dividends and distributions, a complete redemption of the investment at the net asset value at the period of the year and no sales or redemption charges. Total return would be reduced if a sales or redemption charge were taken into account. Total returns for periods less than one full year are not annualized. Returns do not reflect the deduction of taxes that a shareholder would pay on Fund distributions or the redemption of Fund shares. |
| (c) | Reflects income recognized from a special dividend which amounted to $0.10 per share and .037% of average net assets. |
| (d) | Amount is less than $0.005 |
| (e) | Annualized. |
64
| Ratios assuming no expense reductions | ||||||||||||||||||||||||||||||||||
| Ratio of | Ratio of | |||||||||||||||||||||||||||||||||
| Net assets, | Ratio of | net investment | Ratio of | net investment | ||||||||||||||||||||||||||||||
| Net asset | end of | net expenses | income (loss) | total expenses | income (loss) | Portfolio | ||||||||||||||||||||||||||||
| value, end | Total | period | to average | to average | to average | to average | turnover | |||||||||||||||||||||||||||
| of period | return(b) | (in 000s) | net assets | net assets | net assets | net assets | rate | |||||||||||||||||||||||||||
| $ | 31.15 | 7.31 | % | $ | 522,638 | 1.04 | %(e) | 0.73 | %(e) | 1.15 | %(e) | 0.63 | %(e) | 47 | % | |||||||||||||||||||
| 29.42 | 6.90 | 92,727 | 1.79 | (e) | (0.02 | )(e) | 1.90 | (e) | (0.12 | )(e) | 47 | |||||||||||||||||||||||
| 29.29 | 6.94 | 37,569 | 1.79 | (e) | (0.02 | ) (e) | 1.90 | (e) | (0.12 | )(e) | 47 | |||||||||||||||||||||||
| 31.76 | 7.53 | 317,316 | 0.64 | (e) | 1.13 | (e) | 0.75 | (e) | 1.03 | (e) | 47 | |||||||||||||||||||||||
| 30.88 | 7.24 | 10,591 | 1.14 | (e) | 0.63 | (e) | 1.25 | (e) | 0.53 | (e) | 47 | |||||||||||||||||||||||
| 29.13 | 13.75 | 477,204 | 1.09 | 0.93 | (c) | 1.19 | 0.83 | (c) | 142 | |||||||||||||||||||||||||
| 27.52 | 12.87 | 108,595 | 1.84 | 0.19 | (c) | 1.94 | 0.09 | (c) | 142 | |||||||||||||||||||||||||
| 27.39 | 12.86 | 38,380 | 1.84 | 0.20 | (c) | 1.94 | 0.10 | (c) | 142 | |||||||||||||||||||||||||
| 29.72 | 14.16 | 269,545 | 0.69 | 1.23 | (c) | 0.79 | 1.13 | (c) | 142 | |||||||||||||||||||||||||
| 28.88 | 13.61 | 10,328 | 1.15 | 0.84 | (c) | 1.25 | 0.74 | (c) | 142 | |||||||||||||||||||||||||
| 25.81 | 14.71 | 398,346 | 1.13 | 0.43 | 1.25 | 0.31 | 112 | |||||||||||||||||||||||||||
| 24.39 | 13.87 | 115,492 | 1.88 | (0.32 | ) | 2.00 | (0.44 | ) | 112 | |||||||||||||||||||||||||
| 24.30 | 13.87 | 38,656 | 1.88 | (0.32 | ) | 2.00 | (0.44 | ) | 112 | |||||||||||||||||||||||||
| 26.32 | 15.18 | 140,587 | 0.73 | 0.83 | 0.85 | 0.71 | 112 | |||||||||||||||||||||||||||
| 25.60 | 14.60 | 9,215 | 1.23 | 0.33 | 1.35 | 0.21 | 112 | |||||||||||||||||||||||||||
| 22.57 | 11.90 | 351,673 | 1.15 | 0.44 | 1.26 | 0.33 | 74 | |||||||||||||||||||||||||||
| 21.42 | 11.10 | 118,993 | 1.90 | (0.31 | ) | 2.01 | (0.42 | ) | 74 | |||||||||||||||||||||||||
| 21.34 | 11.15 | 36,546 | 1.90 | (0.31 | ) | 2.01 | (0.42 | ) | 74 | |||||||||||||||||||||||||
| 23.00 | 12.40 | 131,457 | 0.75 | 0.84 | 0.86 | 0.73 | 74 | |||||||||||||||||||||||||||
| 22.40 | 11.83 | 7,717 | 1.25 | 0.34 | 1.36 | 0.23 | 74 | |||||||||||||||||||||||||||
| 20.18 | (16.95 | ) | 340,934 | 1.14 | 0.19 | 1.24 | 0.09 | 74 | ||||||||||||||||||||||||||
| 19.28 | (17.57 | ) | 125,243 | 1.89 | (0.57 | ) | 1.99 | (0.67 | ) | 74 | ||||||||||||||||||||||||
| 19.20 | (17.56 | ) | 36,223 | 1.89 | (0.56 | ) | 1.99 | (0.66 | ) | 74 | ||||||||||||||||||||||||
| 20.57 | (16.65 | ) | 163,439 | 0.74 | 0.59 | 0.84 | 0.49 | 74 | ||||||||||||||||||||||||||
| 20.03 | (17.06 | ) | 6,484 | 1.24 | 0.09 | 1.34 | (0.01 | ) | 74 | |||||||||||||||||||||||||
| 24.30 | (25.96 | ) | 471,445 | 1.14 | 0.04 | 1.23 | (0.05 | ) | 54 | |||||||||||||||||||||||||
| 23.39 | (26.49 | ) | 184,332 | 1.89 | (0.70 | ) | 1.98 | (0.79 | ) | 54 | ||||||||||||||||||||||||
| 23.29 | (26.53 | ) | 45,841 | 1.89 | (0.70 | ) | 1.98 | (0.79 | ) | 54 | ||||||||||||||||||||||||
| 24.68 | (25.66 | ) | 255,400 | 0.74 | 0.45 | 0.83 | 0.36 | 54 | ||||||||||||||||||||||||||
| 24.15 | (26.02 | ) | 8,319 | 1.24 | (0.05 | ) | 1.33 | (0.14 | ) | 54 | ||||||||||||||||||||||||
Financial Highlights
| Income (loss) from | Distributions | |||||||||||||||||||||||||||||||
| investment operations | to shareholders | |||||||||||||||||||||||||||||||
| Net asset | ||||||||||||||||||||||||||||||||
| value, | Net | Net realized | Total from | From net | From net | |||||||||||||||||||||||||||
| beginning | investment | and unrealized | investment | investment | realized | Total | ||||||||||||||||||||||||||
| Year - Share Class | of period | income (loss)(a) | gain (loss) | operations | income | gains | distributions | |||||||||||||||||||||||||
| FOR THE SIX MONTHS ENDED FEBRUARY 28, (Unaudited) | ||||||||||||||||||||||||||||||||
| 2006 - A | $ | 12.55 | $ | 0.01 | $ | 0.84 | $ | 0.85 | $ | — | (g) | $ | — | $ | — | (g) | ||||||||||||||||
| 2006 - B | 11.81 | (0.05 | ) | 0.80 | 0.75 | — | — | — | ||||||||||||||||||||||||
| 2006 - C | 11.81 | (0.06 | ) | 0.82 | 0.76 | — | — | — | ||||||||||||||||||||||||
| 2006 - Institutional | 12.89 | 0.11 | 0.79 | 0.90 | (0.04 | ) | — | (0.04 | ) | |||||||||||||||||||||||
| 2006 - Service | 12.43 | — | (g) | 0.87 | 0.87 | — | — | — | ||||||||||||||||||||||||
| FOR THE YEARS ENDED AUGUST 31, | ||||||||||||||||||||||||||||||||
| 2005 - A | 11.13 | 0.04 | (c) | 1.38 | (d) | 1.42 | — | — | — | |||||||||||||||||||||||
| 2005 - B | 10.55 | (0.04 | )(c) | 1.30 | (d) | 1.26 | — | — | — | |||||||||||||||||||||||
| 2005 - C | 10.55 | (0.04 | )(c) | 1.30 | (d) | 1.26 | — | — | — | |||||||||||||||||||||||
| 2005 - Institutional | 11.38 | 0.08 | (c) | 1.43 | (d) | 1.51 | — | — | — | |||||||||||||||||||||||
| 2005 - Service | 11.04 | 0.04 | (c) | 1.35 | (d) | 1.39 | — | — | — | |||||||||||||||||||||||
| 2004 - A | 10.33 | (0.01 | ) | 0.81 | 0.80 | — | — | — | ||||||||||||||||||||||||
| 2004 - B | 9.87 | (0.09 | ) | 0.77 | 0.68 | — | — | — | ||||||||||||||||||||||||
| 2004 - C | 9.87 | (0.09 | ) | 0.77 | 0.68 | — | — | — | ||||||||||||||||||||||||
| 2004 - Institutional | 10.52 | 0.03 | 0.83 | 0.86 | — | — | — | |||||||||||||||||||||||||
| 2004 - Service | 10.26 | (0.02 | ) | 0.80 | 0.78 | — | — | — | ||||||||||||||||||||||||
| 2003 - A | 9.06 | (0.01 | ) | 1.28 | 1.27 | — | — | — | ||||||||||||||||||||||||
| 2003 - B | 8.72 | (0.07 | ) | 1.22 | 1.15 | — | — | — | ||||||||||||||||||||||||
| 2003 - C | 8.72 | (0.07 | ) | 1.22 | 1.15 | — | — | — | ||||||||||||||||||||||||
| 2003 - Institutional | 9.19 | 0.03 | 1.30 | 1.33 | — | — | — | |||||||||||||||||||||||||
| 2003 - Service | 9.01 | (0.02 | ) | 1.27 | 1.25 | — | — | — | ||||||||||||||||||||||||
| 2002 - A | 11.51 | (0.03 | ) | (2.38 | ) | (2.41 | ) | — | (0.04 | ) | (0.04 | ) | ||||||||||||||||||||
| 2002 - B | 11.16 | (0.11 | ) | (2.29 | ) | (2.40 | ) | — | (0.04 | ) | (0.04 | ) | ||||||||||||||||||||
| 2002 - C | 11.17 | (0.11 | ) | (2.30 | ) | (2.41 | ) | — | (0.04 | ) | (0.04 | ) | ||||||||||||||||||||
| 2002 - Institutional | 11.63 | 0.01 | (2.41 | ) | (2.40 | ) | — | (0.04 | ) | (0.04 | ) | |||||||||||||||||||||
| 2002 - Service | 11.45 | (0.04 | ) | (2.36 | ) | (2.40 | ) | — | (0.04 | ) | (0.04 | ) | ||||||||||||||||||||
| 2001 - A | 22.66 | (0.09 | ) | (9.97 | ) | (10.06 | ) | (0.02 | ) | (1.07 | ) | (1.09 | ) | |||||||||||||||||||
| 2001 - B | 22.14 | (0.20 | ) | (9.71 | ) | (9.91 | ) | — | (1.07 | ) | (1.07 | ) | ||||||||||||||||||||
| 2001 - C | 22.15 | (0.20 | ) | (9.71 | ) | (9.91 | ) | — | (1.07 | ) | (1.07 | ) | ||||||||||||||||||||
| 2001 - Institutional | 22.87 | (0.02 | ) | (10.06 | ) | (10.08 | ) | (0.09 | ) | (1.07 | ) | (1.16 | ) | |||||||||||||||||||
| 2001 - Service | 22.55 | (0.10 | ) | (9.93 | ) | (10.03 | ) | — | (1.07 | ) | (1.07 | ) | ||||||||||||||||||||
| (a) | Calculated based on the average shares outstanding methodology. |
| (b) | Assumes investment at the net asset value at the beginning of the period, reinvestment of all dividends and distributions, a complete redemption of the investment at the net asset value at the end of the period and no sales or redemption charges. Total return would be reduced if a sales or redemption charge were taken into account. Total returns for periods less than one full year are not annualized. Returns do not reflect the deduction of taxes that a shareholder would pay on Fund distributions or the redemption of Fund shares. |
| (c) | Reflects income recognized from a special dividend which amounted to $0.03 per share and 0.30% of average net assets. |
| (d) | Reflects an increase of $0.01 due to payments by affiliates during the period to reimburse certain security claims. |
| (e) | Performance has not been restated to reflect the impact of security claims recorded during the period. If restated, the performance would have been 12.67%, 11.85%, 11.85%, 13.18% and 12,50% for Class A, Class B, Class C, Institutional and Service Shares, respectively. |
| (f) | Annualized. |
| (g) | Amount is less than $0.005 per share. |
66
| Ratios assuming no | ||||||||||||||||||||||||||||||||||
| expense reductions | ||||||||||||||||||||||||||||||||||
| Ratio of | Ratio of | |||||||||||||||||||||||||||||||||
| Net assets | Ratio of | net investment | Ratio of | net investment | ||||||||||||||||||||||||||||||
| Net asset | at end of | net expenses | income (loss) | total expenses | income (loss) | Portfolio | ||||||||||||||||||||||||||||
| value, end | Total | period | to average | to average | to average | to average | turnover | |||||||||||||||||||||||||||
| of period | return(b) | (in 000s) | net assets | net assets | net assets | net assets | rate | |||||||||||||||||||||||||||
| $ | 13.40 | 6.81 | % | $ | 213,017 | 1.06 | %(f) | 0.22 | %(f) | 1.15 | %(f) | 0.12 | %(f) | 55 | % | |||||||||||||||||||
| 12.56 | 6.35 | 54,886 | 1.81 | (f) | (0.53 | )(f) | 1.90 | (f) | (0.63 | )(f) | 55 | |||||||||||||||||||||||
| 12.57 | 6.44 | 26,515 | 1.81 | (f) | (0.53 | )(f) | 1.90 | (f) | (0.63 | )(f) | 55 | |||||||||||||||||||||||
| 13.75 | 6.98 | 354,384 | 0.66 | (f) | 0.62 | (f) | 0.75 | (f) | 0.52 | (f) | 55 | |||||||||||||||||||||||
| 13.30 | 7.00 | 230 | 1.16 | (f) | 0.12 | (f) | 1.25 | (f) | 0.02 | (f) | 55 | |||||||||||||||||||||||
| 12.55 | 12.76 | (e) | 166,792 | 1.11 | 0.37 | (c) | 1.24 | 0.24 | (c) | 146 | ||||||||||||||||||||||||
| 11.81 | 11.94 | (e) | 65,545 | 1.86 | (0.32 | )(c) | 1.99 | (0.45 | )(c) | 146 | ||||||||||||||||||||||||
| 11.81 | 11.94 | (e) | 29,672 | 1.86 | (0.32 | )(c) | 1.99 | (0.45 | )(c) | 146 | ||||||||||||||||||||||||
| 12.89 | 13.27 | (e) | 263,906 | 0.71 | 0.65 | (c) | 0.84 | 0.52 | (c) | 146 | ||||||||||||||||||||||||
| 12.43 | 12.59 | (e) | 227 | 1.21 | 0.38 | (c) | 1.34 | 0.25 | (c) | 146 | ||||||||||||||||||||||||
| 11.13 | 7.74 | 120,872 | 1.15 | (0.10 | ) | 1.29 | (0.24 | ) | 149 | |||||||||||||||||||||||||
| 10.55 | 6.89 | 78,810 | 1.90 | (0.85 | ) | 2.04 | (0.99 | ) | 149 | |||||||||||||||||||||||||
| 10.55 | 6.89 | 32,901 | 1.90 | (0.85 | ) | 2.04 | (0.99 | ) | 149 | |||||||||||||||||||||||||
| 11.38 | 8.17 | 109,353 | 0.75 | 0.31 | 0.89 | 0.17 | 149 | |||||||||||||||||||||||||||
| 11.04 | 7.60 | 361 | 1.25 | (0.20 | ) | 1.39 | (0.34 | ) | 149 | |||||||||||||||||||||||||
| 10.33 | 14.02 | 127,317 | 1.18 | (0.07 | ) | 1.31 | (0.20 | ) | 119 | |||||||||||||||||||||||||
| 9.87 | 13.19 | 91,084 | 1.93 | (0.82 | ) | 2.06 | (0.95 | ) | 119 | |||||||||||||||||||||||||
| 9.87 | 13.19 | 36,553 | 1.93 | (0.82 | ) | 2.06 | (0.95 | ) | 119 | |||||||||||||||||||||||||
| 10.52 | 14.47 | 114,524 | 0.78 | 0.33 | 0.91 | 0.20 | 119 | |||||||||||||||||||||||||||
| 10.26 | 13.87 | 410 | 1.28 | (0.17 | ) | 1.41 | (0.30 | ) | 119 | |||||||||||||||||||||||||
| 9.06 | (21.04 | ) | 139,593 | 1.17 | (0.32 | ) | 1.27 | (0.42 | ) | 113 | ||||||||||||||||||||||||
| 8.72 | (21.61 | ) | 99,959 | 1.92 | (1.06 | ) | 2.02 | (1.16 | ) | 113 | ||||||||||||||||||||||||
| 8.72 | (21.68 | ) | 41,627 | 1.92 | (1.07 | ) | 2.02 | (1.17 | ) | 113 | ||||||||||||||||||||||||
| 9.19 | (20.74 | ) | 131,590 | 0.77 | 0.08 | 0.87 | (0.02 | ) | 113 | |||||||||||||||||||||||||
| 9.01 | (21.06 | ) | 409 | 1.27 | (0.41 | ) | 1.37 | (0.51 | ) | 113 | ||||||||||||||||||||||||
| 11.51 | (45.97 | ) | 246,785 | 1.16 | (0.57 | ) | 1.24 | (0.65 | ) | 68 | ||||||||||||||||||||||||
| 11.16 | (46.37 | ) | 167,469 | 1.91 | (1.32 | ) | 1.99 | (1.40 | ) | 68 | ||||||||||||||||||||||||
| 11.17 | (46.35 | ) | 77,398 | 1.91 | (1.32 | ) | 1.99 | (1.40 | ) | 68 | ||||||||||||||||||||||||
| 11.63 | (45.73 | ) | 201,935 | 0.76 | (0.15 | ) | 0.84 | (0.23 | ) | 68 | ||||||||||||||||||||||||
| 11.45 | (46.05 | ) | 1,316 | 1.26 | (0.68 | ) | 1.34 | (0.76 | ) | 68 | ||||||||||||||||||||||||
Financial Highlights
| Income (loss) from | Distributions | |||||||||||||||||||||||||||||||
| investment operations | to shareholders | |||||||||||||||||||||||||||||||
| Net asset | ||||||||||||||||||||||||||||||||
| value, | Net | Net realized | Total from | From net | From net | |||||||||||||||||||||||||||
| beginning | investment | and unrealized | investment | investment | realized | Total | ||||||||||||||||||||||||||
| Year - Share Class | of period | income (loss)(a) | gain (loss) | operations | income | gains | distributions | |||||||||||||||||||||||||
| FOR THE SIX MONTHS ENDED FEBRUARY 28, (Unaudited) | ||||||||||||||||||||||||||||||||
| 2006 - A | $ | 14.55 | $ | — | (c) | $ | 1.06 | $ | 1.06 | $ | — | $ | (1.14 | ) | $ | (1.14 | ) | |||||||||||||||
| 2006 - B | 13.60 | (0.05 | ) | 0.98 | 0.93 | — | (1.14 | ) | (1.14 | ) | ||||||||||||||||||||||
| 2006 - C | 13.64 | (0.05 | ) | 0.99 | 0.94 | — | (1.14 | ) | (1.14 | ) | ||||||||||||||||||||||
| 2006 - Institutional | 14.95 | 0.03 | 1.10 | 1.13 | — | (1.14 | ) | (1.14 | ) | |||||||||||||||||||||||
| 2006 - Service | 14.40 | — | (c) | 1.04 | 1.04 | — | (1.14 | ) | (1.14 | ) | ||||||||||||||||||||||
| FOR THE YEARS ENDED AUGUST 31, | ||||||||||||||||||||||||||||||||
| 2005 - A | 12.24 | (0.02 | ) | 3.02 | 3.00 | — | (0.69 | ) | (0.69 | ) | ||||||||||||||||||||||
| 2005 - B | 11.56 | (0.11 | ) | 2.84 | 2.73 | — | (0.69 | ) | (0.69 | ) | ||||||||||||||||||||||
| 2005 - C | 11.60 | (0.11 | ) | 2.84 | 2.73 | — | (0.69 | ) | (0.69 | ) | ||||||||||||||||||||||
| 2005 - Institutional | 12.52 | 0.04 | 3.08 | 3.12 | — | (0.69 | ) | (0.69 | ) | |||||||||||||||||||||||
| 2005 - Service | 12.13 | (0.03 | ) | 2.99 | 2.96 | — | (0.69 | ) | (0.69 | ) | ||||||||||||||||||||||
| 2004 - A | 11.61 | (0.04 | ) | 1.38 | 1.34 | (0.02 | ) | (0.69 | ) | (0.71 | ) | |||||||||||||||||||||
| 2004 - B | 11.06 | (0.13 | ) | 1.32 | 1.19 | — | (0.69 | ) | (0.69 | ) | ||||||||||||||||||||||
| 2004 - C | 11.10 | (0.13 | ) | 1.32 | 1.19 | — | (0.69 | ) | (0.69 | ) | ||||||||||||||||||||||
| 2004 - Institutional | 11.84 | 0.01 | 1.41 | 1.42 | (0.05 | ) | (0.69 | ) | (0.74 | ) | ||||||||||||||||||||||
| 2004 - Service | 11.53 | (0.05 | ) | 1.36 | 1.31 | (0.02 | ) | (0.69 | ) | (0.71 | ) | |||||||||||||||||||||
| 2003 - A | 9.36 | 0.02 | 2.23 | 2.25 | — | — | — | |||||||||||||||||||||||||
| 2003 - B | 8.99 | (0.05 | ) | 2.12 | 2.07 | — | — | — | ||||||||||||||||||||||||
| 2003 - C | 9.01 | (0.05 | ) | 2.14 | 2.09 | — | — | — | ||||||||||||||||||||||||
| 2003 - Institutional | 9.51 | 0.06 | 2.27 | 2.33 | — | — | — | |||||||||||||||||||||||||
| 2003 - Service | 9.30 | 0.01 | 2.22 | 2.23 | — | — | — | |||||||||||||||||||||||||
| 2002 - A | 10.59 | — | (c) | (0.83 | ) | (0.83 | ) | — | (0.40 | ) | (0.40 | ) | ||||||||||||||||||||
| 2002 - B | 10.26 | (0.08 | ) | (0.79 | ) | (0.87 | ) | — | (0.40 | ) | (0.40 | ) | ||||||||||||||||||||
| 2002 - C | 10.29 | (0.07 | ) | (0.81 | ) | (0.88 | ) | — | (0.40 | ) | (0.40 | ) | ||||||||||||||||||||
| 2002 - Institutional | 10.76 | 0.04 | (0.85 | ) | (0.81 | ) | (0.04 | ) | (0.40 | ) | (0.44 | ) | ||||||||||||||||||||
| 2002 - Service | 10.55 | 0.01 | (0.84 | ) | (0.83 | ) | (0.02 | ) | (0.40 | ) | (0.42 | ) | ||||||||||||||||||||
| 2001 - A | 12.90 | 0.01 | (1.12 | ) | (1.11 | ) | — | (1.20 | ) | (1.20 | ) | |||||||||||||||||||||
| 2001 - B | 12.63 | (0.07 | ) | (1.10 | ) | (1.17 | ) | — | (1.20 | ) | (1.20 | ) | ||||||||||||||||||||
| 2001 - C | 12.66 | (0.07 | ) | (1.10 | ) | (1.17 | ) | — | (1.20 | ) | (1.20 | ) | ||||||||||||||||||||
| 2001 - Institutional | 13.03 | 0.05 | (1.12 | ) | (1.07 | ) | — | (1.20 | ) | (1.20 | ) | |||||||||||||||||||||
| 2001 - Service | 12.87 | — | (c) | (1.12 | ) | (1.12 | ) | — | (1.20 | ) | (1.20 | ) | ||||||||||||||||||||
| (a) | Calculated based on the average shares outstanding methodology. |
| (b) | Assumes investment at the net asset value at the beginning of the period, reinvestment of all dividends and distributions, a complete redemption of the investment at the net asset value at the end of the period and no sales or redemption charges. Total return would be reduced if a sales or redemption charge were taken into account. Total returns for periods less than one full year are not annualized. Returns do not reflect the deduction of taxes that a shareholder would pay on Fund distributions or the redemption of Fund shares. |
| (c) | Amount is less than $0.005 per share. |
| (d) | Annualized. |
68
| Ratios assuming no | ||||||||||||||||||||||||||||||||||
| expense reductions | ||||||||||||||||||||||||||||||||||
| Ratio of | Ratio of | |||||||||||||||||||||||||||||||||
| Net assets | Ratio of | net investment | Ratio of | net investment | ||||||||||||||||||||||||||||||
| Net asset | at end of | net expenses | income (loss) | total expenses | income (loss) | Portfolio | ||||||||||||||||||||||||||||
| value, end | Total | period | to average | to average | to average | to average | turnover | |||||||||||||||||||||||||||
| of period | return(b) | (in 000s) | net assets | net assets | net assets | net assets | rate | |||||||||||||||||||||||||||
| $ | 14.47 | 7.70 | % | $ | 192,364 | 1.29 | %(d) | 0.04 | %(d) | 1.36 | %(d) | (0.02 | )%(d) | 60 | % | |||||||||||||||||||
| 13.39 | 7.27 | 18,625 | 2.04 | (d) | (0.71 | )(d) | 2.11 | (d) | (0.77 | )(d) | 60 | |||||||||||||||||||||||
| 13.44 | 7.32 | 27,044 | 2.04 | (d) | (0.71 | )(d) | 2.11 | (d) | (0.77 | )(d) | 60 | |||||||||||||||||||||||
| 14.94 | 7.90 | 431,659 | 0.89 | (d) | 0.44 | (d) | 0.96 | (d) | 0.38 | (d) | 60 | |||||||||||||||||||||||
| 14.30 | 7.64 | 33,090 | 1.39 | (d) | (0.06 | )(d) | 1.46 | (d) | (0.12 | )(d) | 60 | |||||||||||||||||||||||
| 14.55 | 24.97 | 154,877 | 1.33 | (0.15 | ) | 1.41 | (0.23 | ) | 149 | |||||||||||||||||||||||||
| 13.60 | 24.07 | 19,555 | 2.08 | (0.89 | ) | 2.16 | (0.97 | ) | 149 | |||||||||||||||||||||||||
| 13.64 | 24.09 | 24,901 | 2.08 | (0.90 | ) | 2.16 | (0.98 | ) | 149 | |||||||||||||||||||||||||
| 14.95 | 25.57 | 328,912 | 0.93 | 0.25 | 1.01 | 0.17 | 149 | |||||||||||||||||||||||||||
| 14.40 | 24.86 | 38,412 | 1.43 | (0.26 | ) | 1.51 | (0.34 | ) | 149 | |||||||||||||||||||||||||
| 12.24 | 11.87 | 114,684 | 1.33 | (0.30 | ) | 1.43 | (0.40 | ) | 153 | |||||||||||||||||||||||||
| 11.56 | 11.08 | 19,642 | 2.08 | (1.04 | ) | 2.18 | (1.14 | ) | 153 | |||||||||||||||||||||||||
| 11.60 | 11.05 | 20,915 | 2.08 | (1.05 | ) | 2.18 | (1.15 | ) | 153 | |||||||||||||||||||||||||
| 12.52 | 12.31 | 145,003 | 0.93 | 0.10 | 1.03 | — | 153 | |||||||||||||||||||||||||||
| 12.13 | 11.79 | 42,618 | 1.43 | (0.40 | ) | 1.53 | (0.50 | ) | 153 | |||||||||||||||||||||||||
| 11.61 | 24.04 | 89,340 | 1.34 | 0.25 | 1.52 | 0.07 | 149 | |||||||||||||||||||||||||||
| 11.06 | 23.03 | 19,408 | 2.09 | (0.51 | ) | 2.27 | (0.69 | ) | 149 | |||||||||||||||||||||||||
| 11.10 | 23.09 | 16,463 | 2.09 | (0.51 | ) | 2.27 | (0.69 | ) | 149 | |||||||||||||||||||||||||
| 11.84 | 24.50 | 111,957 | 0.94 | 0.65 | 1.12 | 0.47 | 149 | |||||||||||||||||||||||||||
| 11.53 | 23.87 | 40,775 | 1.44 | 0.15 | 1.62 | (0.03 | ) | 149 | ||||||||||||||||||||||||||
| 9.36 | (8.20 | ) | 57,014 | 1.34 | 0.01 | 1.58 | (0.23 | ) | 136 | |||||||||||||||||||||||||
| 8.99 | (8.88 | ) | 16,854 | 2.09 | (0.74 | ) | 2.33 | (0.98 | ) | 136 | ||||||||||||||||||||||||
| 9.01 | (8.95 | ) | 11,504 | 2.09 | (0.74 | ) | 2.33 | (0.98 | ) | 136 | ||||||||||||||||||||||||
| 9.51 | (7.93 | ) | 57,683 | 0.94 | 0.39 | 1.18 | 0.15 | 136 | ||||||||||||||||||||||||||
| 9.30 | (8.27 | ) | 28,999 | 1.44 | 0.15 | 1.68 | (0.09 | ) | 136 | |||||||||||||||||||||||||
| 10.59 | (8.64 | ) | 50,093 | 1.33 | 0.09 | 1.59 | (0.17 | ) | 85 | |||||||||||||||||||||||||
| 10.26 | (9.35 | ) | 16,125 | 2.08 | (0.66 | ) | 2.34 | (0.92 | ) | 85 | ||||||||||||||||||||||||
| 10.29 | (9.32 | ) | 8,885 | 2.08 | (0.66 | ) | 2.34 | (0.92 | ) | 85 | ||||||||||||||||||||||||
| 10.76 | (8.28 | ) | 62,794 | 0.93 | 0.48 | 1.19 | 0.22 | 85 | ||||||||||||||||||||||||||
| 10.55 | (8.75 | ) | 201 | 1.43 | 0.03 | 1.69 | (0.23 | ) | 85 | |||||||||||||||||||||||||
Financial Highlights
| Income (loss) from | Distributions | |||||||||||||||||||||||||||||||
| investment operations | to shareholders | |||||||||||||||||||||||||||||||
| Net asset | Net | |||||||||||||||||||||||||||||||
| value, | investment | Net realized | Total from | From net | From net | |||||||||||||||||||||||||||
| beginning | income | and unrealized | investment | investment | realized | Total | ||||||||||||||||||||||||||
| Year-Share Class | of period | (loss)(a) | gain (loss) | operations | income | gains | distributions | |||||||||||||||||||||||||
| FOR THE SIX MONTHS ENDED FEBRUARY 28, (Unaudited) | ||||||||||||||||||||||||||||||||
| 2006 - A | $ | 11.70 | $ | (0.01 | ) | $ | 1.64 | $ | 1.63 | $ | (0.11 | ) | $ | (0.08 | ) | $ | (0.19 | ) | ||||||||||||||
| 2006 - B | 11.53 | (0.06 | ) | 1.63 | 1.57 | (0.01 | ) | (0.08 | ) | (0.09 | ) | |||||||||||||||||||||
| 2006 - C | 11.54 | (0.06 | ) | 1.63 | 1.57 | (0.02 | ) | (0.08 | ) | (0.10 | ) | |||||||||||||||||||||
| 2006 - Institutional | 11.93 | 0.01 | 1.69 | 1.70 | (0.14 | ) | (0.08 | ) | (0.22 | ) | ||||||||||||||||||||||
| 2006 - Service | 11.73 | (0.02 | ) | 1.65 | 1.63 | (0.11 | ) | (0.08 | ) | (0.19 | ) | |||||||||||||||||||||
| FOR THE YEARS ENDED AUGUST 31, | ||||||||||||||||||||||||||||||||
| 2005 - A | 9.49 | 0.18 | 2.10 | 2.28 | (0.07 | ) | — | (0.07 | ) | |||||||||||||||||||||||
| 2005 - B | 9.37 | 0.08 | 2.08 | 2.16 | — | — | — | |||||||||||||||||||||||||
| 2005 - C | 9.37 | 0.08 | 2.09 | 2.17 | — | — | — | |||||||||||||||||||||||||
| 2005 - Institutional | 9.68 | 0.22 | 2.14 | 2.36 | (0.11 | ) | — | (0.11 | ) | |||||||||||||||||||||||
| 2005 - Service | 9.54 | 0.29 | 1.98 | 2.27 | (0.08 | ) | — | (0.08 | ) | |||||||||||||||||||||||
| 2004 - A | 7.66 | 0.10 | 1.80 | 1.90 | (0.07 | ) | — | (0.07 | ) | |||||||||||||||||||||||
| 2004 - B | 7.56 | 0.04 | 1.80 | 1.84 | (0.03 | ) | — | (0.03 | ) | |||||||||||||||||||||||
| 2004 - C | 7.56 | 0.04 | 1.79 | 1.83 | (0.02 | ) | — | (0.02 | ) | |||||||||||||||||||||||
| 2004 - Institutional | 7.80 | 0.15 | 1.84 | 1.99 | (0.11 | ) | — | (0.11 | ) | |||||||||||||||||||||||
| 2004 - Service | 7.70 | 0.15 | 1.77 | 1.92 | (0.08 | ) | — | (0.08 | ) | |||||||||||||||||||||||
| 2003 - A | 7.35 | 0.08 | 0.28 | 0.36 | (0.05 | ) | — | (0.05 | ) | |||||||||||||||||||||||
| 2003 - B | 7.24 | 0.04 | 0.28 | 0.32 | — | (d) | — | — | (d) | |||||||||||||||||||||||
| 2003 - C | 7.25 | 0.04 | 0.28 | 0.32 | (0.01 | ) | — | (0.01 | ) | |||||||||||||||||||||||
| 2003 - Institutional | 7.49 | 0.12 | 0.29 | 0.41 | (0.10 | ) | — | (0.10 | ) | |||||||||||||||||||||||
| 2003 - Service | 7.39 | 0.10 | 0.27 | 0.37 | (0.06 | ) | — | (0.06 | ) | |||||||||||||||||||||||
| 2002 - A | 8.38 | 0.03 | (1.06 | ) | (1.03 | ) | — | — | — | |||||||||||||||||||||||
| 2002 - B | 8.29 | (0.01 | ) | (1.04 | ) | (1.05 | ) | — | — | — | ||||||||||||||||||||||
| 2002 - C | 8.30 | (0.01 | ) | (1.04 | ) | (1.05 | ) | — | — | — | ||||||||||||||||||||||
| 2002 - Institutional | 8.50 | 0.08 | (1.07 | ) | (0.99 | ) | (0.02 | ) | — | (0.02 | ) | |||||||||||||||||||||
| 2002 - Service | 8.41 | 0.05 | (1.07 | ) | (1.02 | ) | — | — | — | |||||||||||||||||||||||
| 2001 - A | 11.32 | — | (d) | (2.35 | ) | (2.35 | ) | (0.04 | ) | (0.55 | ) | (0.59 | ) | |||||||||||||||||||
| 2001 - B | 11.22 | (0.04 | ) | (2.34 | ) | (2.38 | ) | — | (0.55 | ) | (0.55 | ) | ||||||||||||||||||||
| 2001 - C | 11.23 | (0.04 | ) | (2.34 | ) | (2.38 | ) | — | (0.55 | ) | (0.55 | ) | ||||||||||||||||||||
| 2001 - Institutional | 11.48 | 0.07 | (2.39 | ) | (2.32 | ) | (0.11 | ) | (0.55 | ) | (0.66 | ) | ||||||||||||||||||||
| 2001 - Service | 11.36 | 0.02 | (2.36 | ) | (2.34 | ) | (0.06 | ) | (0.55 | ) | (0.61 | ) | ||||||||||||||||||||
| (a) | Calculated based on the average shares outstanding methodology. |
| (b) | Assumes investment at the net asset value at the beginning of the period, reinvestment of all dividends and distributions, a complete redemption of the investment at the net asset value at the end of the period and no sales or redemption charges. Total return would be reduced if a sales or redemption charge were taken into account. Total returns for periods less than one full year are not annualized. Returns do not reflect the deduction of taxes that a shareholder would pay on Fund distributions or the redemption of Fund shares. |
| (c) | Annualized. |
| (d) | Amount is less than $0.005 per share. |
70
| Ratios assuming no | ||||||||||||||||||||||||||||||||||
| expense reductions | ||||||||||||||||||||||||||||||||||
| Ratio of | Ratio of | |||||||||||||||||||||||||||||||||
| Net assets | Ratio of | net investment | Ratio of | net investment | ||||||||||||||||||||||||||||||
| Net asset | at end of | net expenses | income (loss) | total expenses | income (loss) | Portfolio | ||||||||||||||||||||||||||||
| value, end | Total | period | to average | to average | to average | to average | turnover | |||||||||||||||||||||||||||
| of period | return(b) | (in 000s) | net assets | net assets | net assets | net assets | rate | |||||||||||||||||||||||||||
| $ | 13.14 | 14.04 | % | $ | 449,665 | 1.31 | %(c) | (0.23 | )%(c) | 1.36 | %(c) | (0.28 | )%(c) | 38 | % | |||||||||||||||||||
| 13.00 | 13.65 | 9,568 | 2.06 | (c) | (0.98 | )(c) | 2.11 | (c) | (1.03 | )(c) | 38 | |||||||||||||||||||||||
| 13.01 | 13.66 | 6,067 | 2.06 | (c) | (0.98 | )(c) | 2.11 | (c) | (1.03 | )(c) | 38 | |||||||||||||||||||||||
| 13.40 | 14.36 | 1,191,727 | 0.91 | (c) | 0.17 | (c) | 0.96 | (c) | 0.12 | (c) | 38 | |||||||||||||||||||||||
| 13.17 | 14.00 | 32,365 | 1.41 | (c) | (0.33 | )(c) | 1.46 | (c) | (0.38 | )(c) | 38 | |||||||||||||||||||||||
| 11.70 | 24.12 | 293,591 | 1.39 | 1.64 | 1.40 | 1.63 | 73 | |||||||||||||||||||||||||||
| 11.53 | 23.05 | 8,075 | 2.14 | 0.75 | 2.15 | 0.74 | 73 | |||||||||||||||||||||||||||
| 11.54 | 23.16 | 4,824 | 2.14 | 0.75 | 2.15 | 0.74 | 73 | |||||||||||||||||||||||||||
| 11.93 | 24.51 | 697,144 | 0.99 | 1.96 | 1.00 | 1.95 | 73 | |||||||||||||||||||||||||||
| 11.73 | 23.93 | 22,429 | 1.49 | 2.33 | 1.50 | 2.32 | 73 | |||||||||||||||||||||||||||
| 9.49 | 24.85 | 130,291 | 1.59 | 1.08 | 1.68 | 0.99 | 99 | |||||||||||||||||||||||||||
| 9.37 | 24.31 | 6,408 | 2.16 | 0.45 | 2.25 | 0.36 | 99 | |||||||||||||||||||||||||||
| 9.37 | 24.28 | 3,747 | 2.16 | 0.43 | 2.25 | 0.34 | 99 | |||||||||||||||||||||||||||
| 9.68 | 25.71 | 261,118 | 1.01 | 1.65 | 1.10 | 1.56 | 99 | |||||||||||||||||||||||||||
| 9.54 | 25.08 | 144 | 1.51 | 1.55 | 1.60 | 1.46 | 99 | |||||||||||||||||||||||||||
| 7.66 | 5.00 | 95,015 | 1.67 | 1.12 | 1.84 | 0.95 | 122 | |||||||||||||||||||||||||||
| 7.56 | 4.45 | 5,574 | 2.17 | 0.56 | 2.34 | 0.39 | 122 | |||||||||||||||||||||||||||
| 7.56 | 4.38 | 3,646 | 2.17 | 0.64 | 2.34 | 0.47 | 122 | |||||||||||||||||||||||||||
| 7.80 | 5.64 | 158,021 | 1.02 | 1.73 | 1.19 | 1.56 | 122 | |||||||||||||||||||||||||||
| 7.70 | 5.14 | 31 | 1.52 | 1.45 | 1.69 | 1.28 | 122 | |||||||||||||||||||||||||||
| 7.35 | (12.29 | ) | 72,405 | 1.67 | 0.38 | 1.82 | 0.23 | 115 | ||||||||||||||||||||||||||
| 7.24 | (12.67 | ) | 6,434 | 2.17 | (0.07 | ) | 2.32 | (0.22 | ) | 115 | ||||||||||||||||||||||||
| 7.25 | (12.65 | ) | 3,963 | 2.17 | (0.07 | ) | 2.32 | (0.22 | ) | 115 | ||||||||||||||||||||||||
| 7.49 | (11.68 | ) | 188,858 | 1.02 | 1.02 | 1.17 | 0.87 | 115 | ||||||||||||||||||||||||||
| 7.39 | (12.13 | ) | 18 | 1.52 | 0.60 | 1.67 | 0.45 | 115 | ||||||||||||||||||||||||||
| 8.38 | (21.50 | ) | 108,955 | 1.66 | — | 1.77 | (0.11 | ) | 93 | |||||||||||||||||||||||||
| 8.29 | (21.93 | ) | 8,575 | 2.16 | (0.47 | ) | 2.27 | (0.58 | ) | 93 | ||||||||||||||||||||||||
| 8.30 | (21.91 | ) | 5,114 | 2.16 | (0.44 | ) | 2.27 | (0.55 | ) | 93 | ||||||||||||||||||||||||
| 8.50 | (21.02 | ) | 291,596 | 1.01 | 0.70 | 1.12 | 0.59 | 93 | ||||||||||||||||||||||||||
| 8.41 | (21.37 | ) | 21 | 1.51 | 0.21 | 1.62 | 0.10 | 93 | ||||||||||||||||||||||||||
Fund Expenses (Unaudited) — Six Month Period Ended February 28, 2006
As a shareholder of Class A, Class B, Class C, Institutional or Service Shares of the Funds you incur two types of costs: (1) transaction costs, including sales charges (loads) on purchase payments (with respect to Class A Shares), contingent deferred sales charges (loads) on redemptions (with respect to Class B and Class C Shares), and redemption fees (with respect to Class A, Class B, Class C, Institutional and Service Shares, if any); and (2) ongoing costs, including management fees; distribution and service (12b-1) fees (with respect to Class A, Class B and Class C Shares); and other Fund expenses. This Example is intended to help you understand your ongoing costs (in dollars) of investing in Class A, Class B, Class C, Institutional and Service Shares of the Fund and to compare these costs with the ongoing costs of investing in other mutual funds.
The Example is based on an investment of $1,000 invested at the beginning of the period and held for the entire period from September 1, 2005 through February 28, 2006.
Actual Expenses — The first line under each share class in the table below provides information about actual account values and actual expenses. You may use the information in this line, together with the amount you invested, to estimate the expenses that you paid over the period. Simply divide your account value by $1,000 (for example, an $8,600 account value divided by $1,000=8.6), then multiply the result by the number in the first line under the heading entitled “Expenses Paid” to estimate the expenses you paid on your account for this period.
Hypothetical Example for Comparison Purposes — The second line under each share class in the table below provides information about hypothetical account values and hypothetical expenses based on the Funds’ actual expense ratio and an assumed rate of return of 5% per year before expenses, which are not the Funds’ actual returns. The hypothetical account values and expenses may not be used to estimate the actual ending account balance or expenses you paid for the period. You may use this information to compare the ongoing costs of investing in the Funds and other funds. To do so, compare this 5% hypothetical example with the 5% hypothetical examples that appear in the shareholder reports of the other funds.
Please note that the expenses shown in the table are meant to highlight your ongoing costs only and do not reflect any transactional costs, such as sales charges (loads), redemption fees, or exchange fees. Therefore, the second line of the table is useful in comparing ongoing costs only, and will not help you determine the relative total costs of owning different funds. In addition, if these transactional costs were included, your costs would have been higher.
| Structured Large Cap Value Fund | Structured U.S. Equity Fund | Structured Large Cap Growth Fund | Structured Small Cap Equity Fund | Structured International Equity Fund | ||||||||||||||||||||||||||||||||||||||||||||||||||||||||
| Expenses | Expenses | Expenses | Expenses | Expenses | ||||||||||||||||||||||||||||||||||||||||||||||||||||||||
| Beginning | Ending | Paid for the | Beginning | Ending | Paid for the | Beginning | Ending | Paid for the | Beginning | Ending | Paid for the | Beginning | Ending | Paid for the | ||||||||||||||||||||||||||||||||||||||||||||||
| Account Value | Account Value | 6 months ended | Account Value | Account Value | 6 months ended | Account Value | Account Value | 6 months ended | Account Value | Account Value | 6 months ended | Account Value | Account Value | 6 months ended | ||||||||||||||||||||||||||||||||||||||||||||||
| Share Class | 9/1/05 | 2/28/06 | 2/28/06* | 9/1/05 | 2/28/06 | 2/28/06* | 9/1/05 | 2/28/06 | 2/28/06* | 9/1/05 | 2/28/06 | 2/28/06* | 9/1/05 | 2/28/06 | 2/28/06* | |||||||||||||||||||||||||||||||||||||||||||||
Class A | ||||||||||||||||||||||||||||||||||||||||||||||||||||||||||||
| Actual | $ | 1,000.00 | $ | 1087.40 | $ | 5.44 | $ | 1,000.00 | $ | 1,073.10 | $ | 5.35 | $ | 1,000.00 | $ | 1,068.10 | $ | 5.41 | $ | 1,000.00 | $ | 1,077.00 | $ | 6.64 | $ | 1,000.00 | $ | 1,140.40 | $ | 6.95 | ||||||||||||||||||||||||||||||
| Hypothetical 5% return | 1,000.00 | 1,019.59 | + | 5.26 | 1,000.00 | 1,019.64 | + | 5.21 | 1,000.00 | 1,019.54 | + | 5.31 | 1,000.00 | 1,018.40 | + | 6.46 | 1,000.00 | 1,018.30 | + | 6.56 | ||||||||||||||||||||||||||||||||||||||||
Class B | ||||||||||||||||||||||||||||||||||||||||||||||||||||||||||||
| Actual | 1,000.00 | 1,083.00 | 9.30 | 1,000.00 | 1,069.00 | 9.18 | 1,000.00 | 1,063.50 | 9.26 | 1,000.00 | 1,072.70 | 10.49 | 1,000.00 | 1,136.50 | 10.91 | |||||||||||||||||||||||||||||||||||||||||||||
| Hypothetical 5% return | 1,000.00 | 1,015.87 | + | 9.00 | 1,000.00 | 1,015.92 | + | 8.95 | 1,000.00 | 1,015.82 | + | 9.05 | 1,000.00 | 1,014.68 | + | 10.19 | 1,000.00 | 1,014.58 | + | 10.29 | ||||||||||||||||||||||||||||||||||||||||
Class C | ||||||||||||||||||||||||||||||||||||||||||||||||||||||||||||
| Actual | 1,000.00 | 1,083.90 | 9.30 | 1,000.00 | 1,069.40 | 9.19 | 1,000.00 | 1,064.40 | 9.27 | 1,000.00 | 1,073.20 | 10.49 | 1,000.00 | 1,136.60 | 10.92 | |||||||||||||||||||||||||||||||||||||||||||||
| Hypothetical 5% return | 1,000.00 | 1,015.87 | + | 9.00 | 1,000.00 | 1,015.92 | + | 8.95 | 1,000.00 | 1,015.82 | + | 9.05 | 1,000.00 | 1,014.68 | + | 10.19 | 1,000.00 | 1,014.58 | + | 10.29 | ||||||||||||||||||||||||||||||||||||||||
Institutional | ||||||||||||||||||||||||||||||||||||||||||||||||||||||||||||
| Actual | 1,000.00 | 1,089.40 | 3.37 | 1,000.00 | 1,075.30 | 3.29 | 1,000.00 | 1,069.80 | 3.39 | 1,000.00 | 1,079.00 | 4.59 | 1,000.00 | 1,143.60 | 4.84 | |||||||||||||||||||||||||||||||||||||||||||||
| Hypothetical 5% return | 1,000.00 | 1,021.58 | + | 3.26 | 1,000.00 | 1,021.63 | + | 3.21 | 1,000.00 | 1,021.53 | + | 3.31 | 1,000.00 | 1,020.39 | + | 4.46 | 1,000.00 | 1,020.29 | + | 4.56 | ||||||||||||||||||||||||||||||||||||||||
Service | ||||||||||||||||||||||||||||||||||||||||||||||||||||||||||||
| Actual | 1,000.00 | 1,086.30 | 5.95 | 1,000.00 | 1,072.40 | 5.86 | 1,000.00 | 1,070.00 | 5.95 | 1,000.00 | 1,076.40 | 7.16 | 1,000.00 | 1,140.00 | 7.48 | |||||||||||||||||||||||||||||||||||||||||||||
| Hypothetical 5% return | 1,000.00 | 1,019.10 | + | 5.76 | 1,000.00 | 1,019.15 | + | 5.71 | 1,000.00 | 1,019.05 | + | 5.81 | 1,000.00 | 1,017.91 | + | 6.96 | 1,000.00 | 1,017.81 | + | 7.06 | ||||||||||||||||||||||||||||||||||||||||
| * | Expenses for each share class are calculated using each Fund’s annualized expense ratio for each class, which represents the ongoing expenses as a percentage of net assets for the six months ended February 28, 2006. Expenses are calculated by multiplying the annualized expense ratio by the average account value for the period; then multiplying the result by the number of days in the most recent fiscal half year; and then dividing that result by the number of days in the fiscal year. The annualized net expense ratios for the period were as follows: |
| Fund | Class A | Class B | Class C | Institutional | Service | |||||||||||||||
| Structured Large Cap Value Fund | 1.05 | % | 1.80 | % | 1.80 | % | 0.65 | % | 1.15 | % | ||||||||||
| Structured U.S. Equity Fund | 1.04 | 1.79 | 1.79 | 0.64 | 1.14 | |||||||||||||||
| Structured Large Cap Growth Fund | 1.06 | 1.81 | 1.81 | 0.66 | 1.16 | |||||||||||||||
| Structured Small Cap Equity Fund | 1.29 | 2.04 | 2.04 | 0.89 | 1.39 | |||||||||||||||
| Structured International Equity Fund | 1.31 | 2.06 | 2.06 | 0.91 | 1.41 | |||||||||||||||
| + | Hypothetical expenses are based on each Fund’s actual expense ratios and an assumed rate of return of 5% per year before expenses. |
Goldman Sachs Funds

Goldman Sachs is a premier financial services firm, known since 1869 for creating thoughtful and customized investment solutions in complex global markets.
Today, The Investment Management Division of Goldman Sachs serves a diverse set of clients worldwide, including private institutions, public entities and individuals. With portfolio management teams located around the world — and $526.4 billion in assets under management as of December 31, 2005 — our investment professionals bring firsthand knowledge of local markets to every investment decision, making us one of the few truly global asset managers.
| GOLDMAN SACHS FUNDS |
In building a globally diversified portfolio, you can select from more than 50 Goldman Sachs Funds and gain access to investment opportunities across borders, investment styles, asset classes and security capitalizations.
| International Equity Funds ▪ Asia Equity Fund2 ▪ Emerging Markets Equity Fund ▪ International Small Cap Fund2 ▪ Japanese Equity Fund ▪ European Equity Fund ▪ International Equity Fund ▪ Structured International Equity Fund2 | Domestic Equity Funds ▪ Small Cap Value Fund ▪ Structured Small Cap Equity Fund2 ▪ Small/ Mid Cap Growth Fund ▪ Growth Opportunities Fund ▪ Mid Cap Value Fund ▪ Concentrated Growth Fund ▪ Research Select FundSM ▪ Strategic Growth Fund ▪ Capital Growth Fund ▪ Large Cap Value Fund ▪ Growth and Income Fund ▪ Structured Large Cap Growth Fund2 ▪ Structured Large Cap Value Fund2 ▪ Structured U.S. Equity Fund2 Asset Allocation Funds ▪ Balanced Fund ▪ Asset Allocation Portfolios | Specialty Funds ▪ Tollkeeper FundSM ▪ Structured Tax-Managed Equity Fund2 ▪ U.S. Equity Dividend and Premium Fund ▪ Real Estate Securities Fund Fixed Income Funds ▪ Emerging Markets Debt Fund ▪ High Yield Fund ▪ High Yield Municipal Fund ▪ Global Income Fund ▪ Investment Grade Credit Fund ▪ Core Fixed Income Fund ▪ Government Income Fund ▪ U.S. Mortgages Fund ▪ Municipal Income Fund ▪ California Intermediate AMT-Free Municipal Fund ▪ New York Intermediate AMT-Free Municipal Fund ▪ Short Duration Tax-Free Fund ▪ Short Duration Government Fund ▪ Ultra-Short Duration Government Fund ▪ Enhanced Income Fund Money Market Funds1 |
| 1 | An investment in a money market fund is neither insured nor guaranteed by the Federal Deposit Insurance Corporation or any other government agency. Although the Funds seek to preserve the value of your investment at $1.00 per share, it is possible to lose money by investing in the Funds. |
| 2 | Effective December 30, 2005, the Asia Growth Fund was renamed the Asia Equity Fund and the International Growth Opportunities Fund was renamed the International Small Cap Fund. Also effective December 30, 2005, the CORESM International Equity, CORESM Small Cap Equity, CORESM Large Cap Growth, CORESM Large Cap Value and CORESM U.S. Equity Funds were renamed, respectively, the Structured International Equity, Structured Small Cap Equity, Structured Large Cap Growth, Structured Large Cap Value and Structured U.S. Equity Funds. Effective January 6, 2006, the CORESM Tax-Managed Equity Fund was renamed the Structured Tax-Managed Equity Fund. The Goldman Sachs Research Select FundSM, CORESM and Tollkeeper FundSM are registered service m arks of Goldman, Sachs & Co. |
| TRUSTEES Ashok N. Bakhru, Chairman John P. Coblentz, Jr. Patrick T. Harker Mary Patterson McPherson Alan A. Shuch Wilma J. Smelcer Richard P. Strubel Kaysie P. Uniacke | OFFICERS Kaysie P. Uniacke, President James A. Fitzpatrick, Vice President James A. McNamara, Vice President John M. Perlowski, Treasurer Howard B. Surloff, Secretary |
| GOLDMAN, SACHS & CO. Distributor and Transfer Agent | GOLDMAN SACHS ASSET MANAGEMENT, L.P. Investment Adviser |
Visit our Web site at www.gs.com/funds to obtain the most recent month-end returns
The reports concerning the Funds included in this shareholder report may contain certain forward-looking statements about the factors that may affect the performance of the Funds in the future. These statements are based on Fund management’s predictions and expectations concerning certain future events and their expected impact on the Funds, such as performance of the economy as a whole and of specific industry sectors, changes in the levels of interest rates, the impact of developing world events, and other factors that may influence the future performance of the Funds. Management believes these forward-looking statements to be reasonable, although they are inherently uncertain and difficult to predict. Actual events may cause adjustments in portfolio management strategies from those currently expected to be employed.
A description of the policies and procedures that the Funds use to determine how to vote proxies relating to portfolio securities and information regarding how a Fund voted proxies relating to portfolio securities during the most recent 12-month period ended June 30 is available (I) without charge, upon request by calling 1-800-526-7384 (for Retail Shareholders) or 1-800-621-2550 (for Institutional Shareholders); and (II) on the Securities and Exchange Commission Web site at http://www.sec.gov.
The Funds file their complete schedule of portfolio holdings with the Securities and Exchange Commission (“SEC”) for the first and third quarters of each fiscal year on Form N-Q. Beginning the fiscal quarter ended November 30, 2004 and every first and third fiscal quarter thereafter, the Funds’ Form N-Q will become available on the SEC’s website at http://www.sec.gov within 60 days after the Funds’ first and third fiscal quarters. When available, the Funds’ Forms N-Q may be reviewed and copied at the SEC’s Public Reference Room in Washington, D.C. and information on the operation of the Public Reference Room may also be obtained by calling 1-800-SEC-0330. When available, Form N-Q may be obtained upon request and without charge by calling 1-800-526-7384 (for Retail Shareholders) or 1-800-621-2550 (for Institutional Shareholders).
Holdings and allocations shown are unaudited, and may not be representative of current or future investments. Holdings and allocations may not include the Fund’s entire investment portfolio, which may change at any time. Fund holdings should not be relied on in making investment decisions and should not be construed as research or investment advice regarding particular securities.
The Global Industry Classification Standard (GICS) was developed by and is the exclusive property and a service mark of Morgan Stanley Capital International Inc. (MSCI) and Standard & Poor’s, a division of The McGraw-Hill Companies, Inc. (S&P) and is licensed for use by Goldman Sachs. Neither MSCI, S&P nor any other party involved in making or compiling the GICS or any GICS classifications makes any express or implied warranties or representations with respect to such standard or classification (or the results to be obtained by the use thereof), and all such parties hereby expressly disclaim all warranties of originality, accuracy, completeness, merchantability or fitness for a particular purpose with respect to any of such standard or classification. Without limiting any of the foregoing, in no event shall MSCI, S&P, any of their affiliates or any third party involved in making or compiling the GICS or any GICS classifications have any liability for any direct, indirect, special, punitive, consequential or any other damages (including lost profits) even if notified of the possibility of such damages.
This material is not authorized for distribution to prospective investors unless preceded or accompanied by a current Prospectus. Please consider a Fund’s objectives, risks, and charges and expenses, and read the Prospectus carefully before investing. The Prospectus contains this and other information about the Funds.
| Copyright 2006 Goldman, Sachs & Co. All rights reserved. | 06-642 / STRUCTSAR / 90.2K / 04-06 |
| ITEM 2. | CODE OF ETHICS. Not applicable to the Semi–Annual Report for the period ended February 28, 2006 | ||
| ITEM 3. | AUDIT COMMITTEE FINANCIAL EXPERT. Not applicable to the Semi–Annual Report for the period ended February 28, 2006 |
| ITEM 4. | PRINCIPAL ACCOUNTANT FEES AND SERVICES. Not applicable to the Semi–Annual Report for the period ended February 28, 2006 | |
| ITEM 5. | AUDIT COMMITTEE OF LISTED REGISTRANTS. | |
| Not applicable. |
| ITEM 6. | SCHEDULE OF INVESTMENTS. | |
| Schedule of Investments is included as part of the Report to Shareholders filed under Item 1. |
| ITEM 7. | DISCLOSURE OF PROXY VOTING POLICIES AND PROCEDURES FOR CLOSED-END MANAGEMENT INVESTMENT COMPANIES. | |
| Not applicable. |
| ITEM 8. | PORTFOLIO MANAGERS OF CLOSED END MANAGEMENT INVESTMENT COMPANIES. | |
| Not applicable. |
| ITEM 9. | PURCHASES OF EQUITY SECURITIES BY CLOSED-END MANAGEMENT INVESTMENT COMPANY AND AFFILIATED PURCHASERS. | |
| Not applicable. |
| ITEM 10. | SUBMISSION OF MATTERS TO A VOTE OF SECURITY HOLDERS. There have been no material changes to the procedures by which shareholders may recommend nominees to the registrant’s board of trustees. | |
| ITEM 11. | CONTROLS AND PROCEDURES. | |
| (a) | The registrant’s principal executive and principal financial officers or persons performing similar functions have concluded that the registrant’s disclosure controls and procedures (as defined in Rule 30a-3(c) under the Investment Company Act of 1940, as amended (the “1940 Act”)) are effective as of a date within 90 days of the filing of this report that includes the disclosure required by this paragraph, based on the evaluation of these controls and procedures required by Rule 30a-3(b) under the 1940 Act and 15d-15(b) under the Securities Exchange Act of 1934, as amended. | ||
| (b) | There were no changes in the registrant’s internal control over financial reporting (as defined in Rule 30a-3(d) under the 1940 Act) that occurred during the registrant’s second fiscal quarter of the period covered by this report that has materially affected, or is reasonably likely to materially affect the registrant’s internal control over financial reporting. | ||
| ITEM 12. | EXHIBITS. |
| (a)(1) | Goldman Sachs Trust’s Code of Ethics for Principal Executive and Senior Financial Officers is incorporated by reference to Exhibit 11(a)(1) of the registrant’s Form N-CSR filed on March 8, 2004 for its Real Estate Securities Fund (Accession Number 0000950123-04-0002984). | ||
| (a)(2) | Exhibit 99.CERT | Certifications pursuant to Section 302 of the Sarbanes-Oxley Act of 2002 filed herewith. | ||
| (b) | Exhibit 99.906CERT | Certifications pursuant to Section 906 of the Sarbanes-Oxley Act of 2002 filed herewith. |
SIGNATURES
| Pursuant to the requirements of the Securities Exchange Act of 1934 and the Investment Company Act of 1940, the registrant has duly caused this report to be signed on its behalf by the undersigned, thereunto duly authorized. |
| Goldman Sachs Trust | ||||||
| By: | /s/ Kaysie P. Uniacke | |||||
| Kaysie P. Uniacke | ||||||
| President/Principal Executive Officer | ||||||
| Goldman Sachs Trust | ||||||
| Date: | May 5, 2006 | |||||
| Pursuant to the requirements of the Securities Exchange Act of 1934 and the Investment Company Act of 1940, this report has been signed below by the following persons on behalf of the registrant and in the capacities and on the dates indicated. |
| By: | /s/ Kaysie P. Uniacke | |||||
| Kaysie P. Uniacke | ||||||
| President/Principal Executive Officer | ||||||
| Goldman Sachs Trust | ||||||
| Date: | May 5, 2006 | |||||
| By: | /s/ John M. Perlowski | |||||
| John M. Perlowski | ||||||
| Treasurer/Principal Financial Officer | ||||||
| Goldman Sachs Trust | ||||||
| Date: | May 5, 2006 |