Exhibit 17(ttt)

PROSPECTUS MARCH 1, 2006
AXA ENTERPRISE MULTIMANAGER FUNDS TRUST
AXA Enterprise Multimanager Growth Fund
AXA Enterprise Multimanager Core Equity Fund
AXA Enterprise Multimanager Value Fund
AXA Enterprise Multimanager Mid Cap Growth Fund
AXA Enterprise Multimanager Mid Cap Value Fund
AXA Enterprise Multimanager International Equity Fund
AXA Enterprise Multimanager Technology Fund
AXA Enterprise Multimanager Health Care Fund
AXA Enterprise Multimanager Core Bond Fund
The Securities and Exchange Commission has not approved any fund’s shares or determined whether this Prospectus is accurate or complete. Anyone who tells you otherwise is committing a crime.
ENTERPRISE
Fund Distributors, Inc.
An AXA Financial Company
INTRODUCTION
AXA Enterprise Multimanager Funds Trust (“Trust”) is comprised of distinct mutual funds, each with its own investment strategy and risk/reward profile. This prospectus describes Class A, Class B, Class C, Class P and Class Y shares of each of the AXA Enterprise Multimanager Funds.* Each fund is a diversified fund, except AXA Enterprise Multimanager Technology Fund and AXA Enterprise Multimanager Health Care Fund, which are non-diversified funds. AXA Enterprise Multimanager Technology Fund and AXA Enterprise Multimanager Health Care Fund are sometimes referred to as “sector funds.” Information on each fund, including investment objectives, investment strategies and investment risks, can be found on the pages following this introduction. In addition, a Glossary of Terms can also be found at the back of this prospectus. The investment objective of a fund is not a fundamental policy and may be changed without a shareholder vote. Each fund (except the AXA Enterprise Multimanager Growth Fund and AXA Enterprise Multimanager Value Fund) has a policy to invest at least 80% of its net assets (plus borrowings for investment purposes) in a particular type of investment. These policies may not be changed without providing at least sixty (60) days’ written notice to shareholders of the relevant fund.
The investment manager to each fund is AXA Equitable Life Insurance Company (“AXA Equitable”). The day-to-day portfolio management of each fund is provided by one or more investment sub-advisers. Information regarding AXA Equitable and the sub-advisers is included under “Management Team” in this prospectus. AXA Equitable may allocate a fund’s assets to additional sub-advisers subject to approval of the Trust’s board of trustees. In addition, AXA Equitable may, subject to the approval of the Trust’s board of trustees, appoint, dismiss and replace sub-advisers and amend sub-advisory agreements without obtaining shareholder approval. If a new sub-adviser is retained for a fund, shareholders would receive notice of such action. However, AXA Equitable may not enter into a sub-advisory agreement with an “affiliated person” of AXA Equitable (as that term is defined in Section 2(a)(3) of the Investment Company Act of 1940, as amended (“1940 Act”)) (“Affiliated Adviser”), such as Alliance Capital Management L.P. and AXA Rosenberg Investment Management LLC, unless the sub-advisory agreement with the Affiliated Adviser is approved by the affected fund’s shareholders.
The distributor for each fund is Enterprise Fund Distributors, Inc. (the “Distributor”).
An investment in a fund is not a deposit of a bank and is not insured or guaranteed by the Federal Deposit Insurance Corporation or any other government agency. Because you could lose money by investing in these funds, be sure to read all risk disclosures carefully before investing.
| * | On December 13, 2004, all Class A shares of the Trust then outstanding were renamed Class P shares and the Trust began offering new Class A shares, as described in this Prospectus. Class P shares are no longer available for purchase, except through exchanges of Class P shares of another fund and through dividend reinvestments, as described in this Prospectus. Also on that date, Class Z shares of the Trust were renamed Class Y shares. |
Table of
CONTENTS
| | |
Goals, Strategies & Risks | | |
| |
AXA Enterprise Multimanager Growth Fund | | 1 |
AXA Enterprise Multimanager Core Equity Fund | | 3 |
AXA Enterprise Multimanager Value Fund | | 5 |
AXA Enterprise Multimanager Mid Cap Growth Fund | | 7 |
AXA Enterprise Multimanager Mid Cap Value Fund | | 9 |
AXA Enterprise Multimanager International Equity Fund | | 11 |
AXA Enterprise Multimanager Technology Fund | | 13 |
AXA Enterprise Multimanager Health Care Fund | | 16 |
AXA Enterprise Multimanager Core Bond Fund | | 19 |
| |
Fund Fees & Expenses | | |
| |
Fund Fees & Expenses | | 22 |
| |
More About Investment Strategies & Risks | | |
| |
More About Investment Strategies & Risks | | 25 |
| |
Management Team | | |
| |
The Manager and the Sub-advisers | | 28 |
| |
Fund Services | | |
| |
Investing in the Funds | | 46 |
How Sales Charges are Calculated | | 48 |
Ways to Reduce or Eliminate Sales Charges | | 53 |
It’s Easy to Open an Account | | 55 |
Buying Shares | | 56 |
Selling Shares | | 57 |
Selling Shares in Writing | | 59 |
Exchanging Shares | | 60 |
Restrictions on Buying, Selling and Exchanging Shares | | 61 |
How Fund Shares are Priced | | 63 |
Dividends and Other Distributions | | 64 |
Tax Consequences | | 64 |
Additional Information | | 65 |
| |
Glossary of Terms | | 67 |
| |
Description of Benchmarks | | 68 |
| |
Financial Highlights | | 70 |
AXA ENTERPRISE MULTIMANAGER GROWTH FUND
| | |
Manager: | | AXA Equitable |
| |
Sub-advisers: | | Alliance Capital Management L.P. RCM Capital Management LLC TCW Investment Management Company |
Key Terms
| • | | Growth Investing — An investment style that emphasizes companies with strong earnings growth. Growth investing is generally considered more aggressive than “value” investing. |
| • | | Large Cap Companies — Companies with market capitalization in excess of $5 billion. |
Investment Goal
Long-term growth of capital.
Principal Investment Strategies
Under normal circumstances, the fund intends to invest primarily in equity securities of U.S. large capitalization companies. Large capitalization companies are companies with market capitalization in excess of $5 billion at the time of investment.
The fund intends to invest primarily in common stocks, but it may also invest in other securities that the sub-advisers believe provide opportunities for capital growth, such as preferred stocks, warrants and securities convertible into common stock. The fund also may invest, to a limited extent, in foreign securities, including depositary receipts of foreign based companies, including companies in developing countries.
Utilizing a due diligence process covering a number of key factors, AXA Equitable selects sub-advisers to manage the fund’s assets. These key factors include, but are not limited to, the sub-adviser’s reputation, organizational stability, investment personnel, long-term performance, investment philosophy and style and correlation with other sub-advisers retained for other allocated portions of the fund. AXA Equitable normally allocates the fund’s assets to three or more sub-advisers. AXA Equitable monitors the sub-advisers and may dismiss, replace or add sub-advisers subject to the approval of the Trust’s board of trustees.
The sub-advisers focus on identifying companies expected to grow at a faster rate than the U.S. economy. This process involves researching and evaluating individual companies for potential investment. The sub-advisers may sell a security for a variety of reasons, including to seek more attractive growth prospects.
For temporary defensive purposes, the fund may invest, without limit, in cash, money market instruments or high quality short-term debt securities, including repurchase agreements. To the extent that the fund is invested in these instruments, the fund will not be pursuing its investment goal.
Principal Investment Risks
An investment in the fund is not guaranteed; you may lose money by investing in the fund. When you sell your shares of the fund, they could be worth more or less than what you paid for them.
The principal risks presented by the fund are:
| • | | Equity Risk — Stocks and other equity securities generally fluctuate in value more than bonds and may decline in value over short or extended periods. The value of such securities will change based on changes in a company’s financial condition and in overall market and economic conditions. |
| • | | Foreign Investing and Emerging Markets Risk — The value of a fund’s investments in foreign securities may fall due to adverse political, social and economic developments abroad and due to decreases in foreign currency values relative to the U.S. dollar. Foreign markets also may be less liquid and more volatile than U.S. markets. These risks are greater generally for investments in emerging market issuers than for issuers in more developed countries. |
| • | | Investment Style Risk — The sub-advisers primarily use a particular style or set of styles – in this case “growth” styles – to select investments for the fund. Those styles may be out of favor or may not produce the best results over short or longer time periods. They may also increase the volatility of the fund’s share price. Growth stocks tend to be more volatile than value stocks, so in a declining market, their prices may decrease more than value stocks. |
| • | | Issuer-Specific Risk — The value of an individual security or particular type of security can be more volatile than the market as a whole and can perform differently from the market as a whole. The fund could lose all of its investment in a company’s securities. |
| • | | Large Capitalization Risk — Larger more established companies may be unable to respond quickly to new competitive challenges such as changes in technology and consumer tastes. Many larger companies also may not be able to attain the high growth rate of successful smaller companies, especially during extended periods of economic expansion. |
1
| • | | Portfolio Management Risk — The risk that the strategies used by a fund’s sub-advisers and their securities selections fail to produce the intended result. |
| • | | Sub-Adviser Selection Risk — The risk that AXA Equitable’s process for selecting or replacing a sub-adviser and its decision to select or replace a sub-adviser does not produce the intended result. |
More information about the risks of an investment in the fund is provided below in “More About Investment Strategies & Risks.”
FUND PERFORMANCE
The following information gives some indication of the risks of an investment in the fund by showing yearly changes in the fund’s performance and by comparing the fund’s performance with a broad measure of market performance. Both the bar chart and table below assume reinvestment of dividends and other distributions and include the effect of expense limitations that were in place during the period shown. Since AXA Equitable may add to, dismiss or replace the sub-advisers in a fund, the fund’s historical performance may cover periods when portions of the fund were advised by different sub-advisers. Past performance (before and after taxes) is not an indication of future performance.
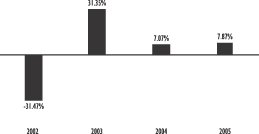
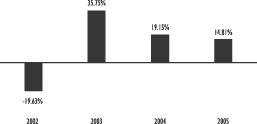
Calendar Year Annual Total Returns (Class Y)
The following bar chart illustrates the calendar year annual total returns for the fund’s Class Y shares. The inception date for the Class Y shares is December 31, 2001. The returns for the fund’s Class A, B, C and P shares would be lower than the Class Y returns shown in the bar chart because those other classes have higher total expenses. In addition, the Class Y returns shown in the bar chart do not reflect sales charges, which would apply to Class A, B, C and P shares; if such sales charges were reflected, the returns shown would be lower.
| | |
Best quarter (% and time period) | | Worst quarter (% and time period) |
13.89% (2003 2nd Quarter) | | –19.11% (2002 2nd Quarter) |
Average Annual Total Returns for the periods ended December 31, 2005
The table below shows how the average annual total returns (adjusted to reflect applicable sales charges) for each class of the fund (before and after taxes) for the one-year and since-inception periods compare to those of a broad-based
index. The table also shows hypothetical total returns that have been calculated to reflect return after taxes on distributions and return after taxes on distributions and assumed sale of fund shares.
After-tax returns are calculated using the historical highest individual federal marginal income tax rates and do not reflect the impact of state and local taxes. Actual after-tax returns to an investor depend on the investor’s own tax situation and may differ from those shown. After-tax returns shown are not relevant to investors who hold their fund shares through tax-deferred arrangements, such as 401(k) plans or individual retirement accounts. In some cases, the after-tax returns may exceed the return before taxes due to an assumed tax benefit from any losses on a sale of fund shares at the end of the measurement period.
| | | | |
| | | |
Average Annual Total Returns
(For the periods ended December 31, 2005) | | 1 Year | | Since Inception* |
Class A—Return Before Taxes | | 2.30% | | 1.90% |
Return After Taxes on Distributions | | 2.30% | | 1.90% |
Return After Taxes on Distributions
& Sale of Fund Shares | | 1.50% | | 1.62% |
Class B—Return Before Taxes | | 1.84% | | –0.76% |
Return After Taxes on Distributions | | 1.84% | | –0.77% |
Return After Taxes on Distributions
& Sale of Fund Shares | | 1.20% | | –0.65% |
Class C—Return Before Taxes | | 5.85% | | –0.03% |
Return After Taxes on Distributions | | 5.85% | | –0.04% |
Return After Taxes on Distributions
& Sale of Fund Shares | | 3.80% | | –0.03% |
Class P—Return Before Taxes | | 1.69% | | –0.67% |
Return After Taxes on Distributions | | 1.69% | | –0.74% |
Return After Taxes on Distributions & Sale of Fund Shares | | 1.10% | | –0.61% |
Class Y—Return Before Taxes | | 7.87% | | 0.98% |
Return After Taxes on Distributions | | 7.87% | | 0.87% |
Return After Taxes on Distributions
& Sale of Fund Shares | | 5.12% | | 0.76% |
Russell 1000 Growth Index** | | 5.26% | | 1.15% |
| * | The inception date for the fund’s Class A shares is December 13, 2004. The fund’s Class A shares have no operating history or performance information of their own prior to that date. The performance shown for the fund’s Class A shares for periods prior to that date is the performance of the fund’s Class P shares adjusted to reflect the fees and expenses of the fund’s Class A shares. The inception date for the fund’s Class B, Class C, Class P and Class Y shares is December 31, 2001. |
| ** | Index returns do not reflect any deductions for expenses, brokerage commissions, sales charges or taxes. For more information on this index, see the following section “Description of Benchmarks.” |
2
AXA ENTERPRISE MULTIMANAGER CORE EQUITY FUND
| | |
Manager: | | AXA Equitable |
| |
Sub-advisers: | | Alliance Capital Management L.P. (Bernstein Unit) Janus Capital Management LLC Thornburg Investment Management, Inc. |
Key Terms
| • | | Core Investing — An investment style that includes both the strategies used when seeking either growth companies (those with strong earnings growth) or value companies (those that may be temporarily out of favor or have earnings or assets not fully reflected in their stock price). |
| • | | Large Cap Companies — Companies with market capitalization in excess of $5 billion. |
Investment Goal
Long-term growth of capital.
Principal Investment Strategies
Under normal circumstances, the fund intends to invest at least 80% of its net assets, plus borrowings for investment purposes, in equity securities, including at least 65% of its total assets in equity securities of U.S. large capitalization companies. Large capitalization companies are companies with market capitalization in excess of $5 billion at the time of investment.
The fund intends to invest primarily in common stocks, but it may also invest in other securities that the sub-advisers believe provide opportunities for capital growth, such as preferred stocks, warrants and securities convertible into common stock. The fund also may invest, to a limited extent, in foreign securities, including depositary receipts of foreign based companies, including companies in developing countries.
Utilizing a due diligence process covering a number of key factors, AXA Equitable selects sub-advisers to manage the fund’s assets. These key factors include, but are not limited to, the sub-adviser’s reputation, organizational stability, investment personnel, long-term performance, investment philosophy and style and correlation with other sub-advisers retained for other allocated portions of the fund. AXA Equitable normally allocates the fund’s assets to three or more sub-advisers. AXA Equitable monitors the sub-advisers and may dismiss, replace or add sub-advisers subject to the approval of the Trust’s board of trustees.
Each sub-adviser generally chooses investments that include either companies with above average growth prospects, companies selling at reasonable valuations, or both. Among other things, these processes involve researching and evaluating individual companies for potential investment. Each sub-adviser may sell a security for a variety of reasons, such as to invest in a company offering superior investment opportunities.
For temporary defensive purposes, the fund may invest, without limit, in cash, money market instruments or high quality short-term debt securities, including repurchase agreements. To the extent that the fund is invested in these instruments, the fund will not be pursuing its investment goal.
Principal Investment Risks
An investment in the fund is not guaranteed; you may lose money by investing in the fund. When you sell your shares of the fund, they could be worth more or less than what you paid for them.
The principal risks presented by the fund are:
| • | | Equity Risk — Stocks and other equity securities generally fluctuate in value more than bonds and may decline in value over short or extended periods. The value of such securities will change based on changes in a company’s financial condition and in overall market and economic conditions. |
| • | | Foreign Investing and Emerging Markets Risk — The value of a fund’s investments in foreign securities may fall due to adverse political, social and economic developments abroad and due to decreases in foreign currency values relative to the U.S. dollar. Foreign markets also may be less liquid and more volatile than U.S. markets. These risks are greater generally for investments in emerging market issuers than for issuers in more developed countries. |
| • | | Issuer-Specific Risk — The value of an individual security or particular type of security can be more volatile than the market as a whole and can perform differently from the market as a whole. The fund could lose all of its investment in a company’s securities. |
| • | | Large-Capitalization Risk — Larger more established companies may be unable to respond quickly to new competitive challenges such as changes in technology and consumer tastes. Many larger companies also may not be able to attain the high growth rate of successful smaller companies, especially during extended periods of economic expansion. |
3
| • | | Portfolio Management Risk — The risk that the strategies used by a fund’s sub-advisers and their securities selections fail to produce the intended result. |
| • | | Sub-Adviser Selection Risk — The risk that AXA Equitable’s process for selecting or replacing a sub-adviser and its decision to select or replace a sub-adviser does not produce the intended result. |
More information about the risks of an investment in the fund is provided below in “More About Investment Strategies & Risks.”
FUND PERFORMANCE
The following information gives some indication of the risks of an investment in the fund by showing yearly changes in the fund’s performance and by comparing the fund’s performance with a broad measure of market performance. Both the bar chart and table below assume reinvestment of dividends and other distributions and include the effect of expense limitations that were in place during the period shown. Since AXA Equitable may add to, dismiss or replace the sub-advisers in a fund, the fund’s historical performance may cover periods when portions of the fund were advised by different sub-advisers. Past performance (before and after taxes) is not an indication of future performance.
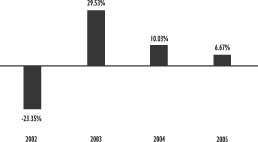
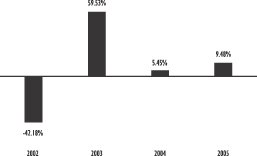
Calendar Year Annual Total Returns (Class Y)
The following bar chart illustrates the calendar year annual total returns for the fund’s Class Y shares. The inception date for the Class Y shares is December 31, 2001. The returns for the fund’s Class A, B, C and P shares would be lower than the Class Y returns shown in the bar chart because those other classes have higher total expenses. In addition, the Class Y returns shown in the bar chart do not reflect sales charges, which would apply to Class A, B, C and P shares; if such sales charges were reflected, the returns shown would be lower.
| | |
Best quarter (% and time period) | | Worst quarter (% and time period) |
16.26% (2003 2nd Quarter) | | –16.07% (2002 3rd Quarter) |
Average Annual Total Returns
for the periods ended December 31, 2005
The table below shows how the average annual total returns (adjusted to reflect applicable sales charges) for each class of the fund (before and after taxes) for the one-year and since-inception periods compare to those of a broad-based index. The table also shows hypothetical total returns that have been calculated to reflect return after taxes on distributions and return after taxes on distributions and assumed sale of fund shares.
After-tax returns are calculated using the historical highest individual federal marginal income tax rates and do not reflect the impact of state and local taxes. Actual after-tax returns to an investor depend on the investor’s own tax situation and may differ from those shown. After-tax returns shown are not relevant to investors who hold their fund shares through tax-deferred arrangements, such as 401(k) plans or individual retirement accounts. In some cases, the after-tax returns may exceed the return before taxes due to an assumed tax benefit from any losses on a sale of fund shares at the end of the measurement period.
| | | | |
| | | |
Average Annual Total Returns
(For the periods ended December 31, 2005) | | 1 Year | | Since Inception* |
Class A—Return Before Taxes | | 1.19% | | 2.44% |
Return After Taxes on Distributions | | 0.64% | | 1.90% |
Return After Taxes on Distributions & Sale of Fund Shares | | 1.51% | | 2.08% |
Class B—Return Before Taxes | | 0.63% | | 2.19% |
Return After Taxes on Distributions | | 0.04% | | 1.98% |
Return After Taxes on Distributions & Sale of Fund Shares | | 1.20% | | 1.82% |
Class C—Return Before Taxes | | 4.63% | | 2.88% |
Return After Taxes on Distributions | | 4.04% | | 2.68% |
Return After Taxes on Distributions & Sale of Fund Shares | | 3.80% | | 2.42% |
Class P—Return Before Taxes | | 0.57% | | 2.21% |
Return After Taxes on Distributions | | 0.02% | | 1.92% |
Return After Taxes on Distributions & Sale of Fund Shares | | 1.11% | | 1.78% |
Class Y—Return Before Taxes | | 6.67% | | 3.90% |
Return After Taxes on Distributions | | 5.99% | | 3.52% |
Return After Taxes on Distributions & Sale of Fund Shares | | 5.12% | | 3.19% |
Standard and Poor’s 500 Index** | | 4.91% | | 3.92% |
| * | The inception date for the fund’s Class A shares is December 13, 2004. The fund’s Class A shares have no operating history or performance information of their own prior to that date. The performance shown for the fund’s Class A shares for periods prior to that date is the performance of the fund’s Class P shares adjusted to reflect the fees and expenses of the fund’s Class A shares. The inception date for the fund’s Class B, Class C, Class P and Class Y shares is December 31, 2001. |
| ** | Index returns do not reflect any deductions for expenses, brokerage commissions, sales charges or taxes. For more information on this index, see the following section “Description of Benchmarks.” |
4
AXA ENTERPRISE MULTIMANAGER VALUE FUND
| | |
Manager: | | AXA Equitable |
| |
Sub-advisers: | | Alliance Capital Management L.P. Institutional Capital Corporation MFS Investment Management |
Key Terms
| • | | Value Investing — An investment style that focuses on companies that may be temporarily out of favor or have earnings or assets not fully reflected in their stock prices. |
| • | | Large Cap Companies — Companies with market capitalization in excess of $5 billion. |
Investment Goal
Long-term growth of capital.
Principal Investment Strategies
Under normal circumstances, the fund intends to invest primarily in equity securities of U.S. large capitalization companies. Large capitalization companies are companies with market capitalization in excess of $5 billion at the time of investment.
The fund intends to invest primarily in common stocks, but it may also invest in other securities that the sub-advisers believe provide opportunities for capital growth, such as preferred stocks, warrants and securities convertible into common stock. The fund also may invest, to a limited extent, in foreign securities, including depositary receipts of foreign based companies, including companies in developing countries.
Utilizing a due diligence process covering a number of key factors, AXA Equitable selects sub-advisers to manage the fund’s assets. These key factors include, but are not limited to, the sub-adviser’s reputation, organizational stability, investment personnel, long-term performance, investment philosophy and style and correlation with other sub-advisers retained for other allocated portions of the fund. AXA Equitable normally allocates the fund’s assets to three or more sub-advisers. AXA Equitable monitors the sub-advisers and may dismiss, replace or add sub-advisers subject to the approval of the Trust’s board of trustees.
The sub-advisers focus primarily on stocks that are currently under-priced using certain financial measurements, including the stock’s price-to-earnings and price-to-book ratios and dividend income potential. This process involves researching and evaluating individual companies for potential investment. This approach often leads the fund to focus on “strong companies” in out-of-favor sectors or out-of-favor companies exhibiting a catalyst for change. The sub-advisers may sell a security for a variety of reasons, such as because it becomes overvalued or shows deteriorating fundamentals.
For temporary defensive purposes, the fund may invest, without limit, in cash, money market instruments or high quality short-term debt securities, including repurchase agreements. To the extent that the fund is invested in these instruments, the fund will not be pursuing its investment goal.
Principal Investment Risks
An investment in the fund is not guaranteed; you may lose money by investing in the fund. When you sell your shares of the fund, they could be worth more or less than what you paid for them.
The principal risks presented by the fund are:
| • | | Equity Risk — Stocks and other equity securities generally fluctuate in value more than bonds and may decline in value over short or extended periods. The value of such securities will change based on changes in a company’s financial condition and in overall market and economic conditions. |
| • | | Foreign Investing and Emerging Markets Risk – The value of a fund’s investments in foreign securities may fall due to adverse political, social and economic developments abroad and due to decreases in foreign currency values relative to the U.S. dollar. Foreign markets also may be less liquid and more volatile than U.S. markets. These risks are greater generally for investments in emerging market issuers than for issuers in more developed countries. |
| • | | Investment Style Risk — The sub-advisers primarily use a particular style or set of styles – in this case “value” styles – to select investments for the fund. Those styles may be out of favor or may not produce the best results over short or longer time periods. They may also increase the volatility of the fund’s share price. |
| • | | Issuer-Specific Risk — The value of an individual security or particular type of security can be more volatile than the market as a whole and can perform differently from the market as a whole. The fund could lose all of its investment in a company’s securities. |
5
| • | | Large-Capitalization Risk — Larger more established companies may be unable to respond quickly to new competitive challenges such as changes in technology and consumer tastes. Many larger companies also may not be able to attain the high growth rate of successful smaller companies, especially during extended periods of economic expansion. |
| • | | Portfolio Management Risk — The risk that the strategies used by a fund’s sub-advisers and their securities selections fail to produce the intended result. |
| • | | Sub-Adviser Selection Risk — The risk that AXA Equitable’s process for selecting or replacing a sub-adviser and its decision to select or replace a sub-adviser does not produce the intended result. |
More information about the risks of an investment in the fund is provided below in “More About Investment Strategies & Risks.”
FUND PERFORMANCE
The following information gives some indication of the risks of an investment in the fund by showing yearly changes in the fund’s performance and by comparing the fund’s performance with a broad measure of market performance. Both the bar chart and table below assume reinvestment of dividends and other distributions and include the effect of expense limitations that were in place during the period shown. Since AXA Equitable may add to, dismiss or replace the sub-advisers in a fund, the fund’s historical performance may cover periods when portions of the fund were advised by different sub-advisers. Past performance (before and after taxes) is not an indication of future performance.
Calendar Year Annual Total Returns (Class Y)
The following bar chart illustrates the calendar year annual total returns for the fund’s Class Y shares. The inception date for the Class Y shares is December 31, 2001. The returns for the fund’s Class A, B, C and P shares would be lower than the Class Y returns shown in the bar chart because those other classes have higher total expenses. In addition, the Class Y returns shown in the bar chart do not reflect sales charges, which would apply to Class A, B, C and P shares; if such sales charges were reflected, the returns shown would be lower.

| | |
Best quarter (% and time period) | | Worst quarter (% and time period) |
16.02% (2003 2nd Quarter) | | –17.25% (2002 3rd Quarter) |
Average Annual Total Returns
for the periods ended December 31, 2005
The table below shows how the average annual total returns (adjusted to reflect applicable sales charges) for each class of the fund (before and after taxes) for the one-year and since-inception periods compare to those of a broad-based index. The table also shows hypothetical total returns that have been calculated to reflect return after taxes on distributions and return after taxes on distributions and assumed sale of fund shares.
After-tax returns are calculated using the historical highest individual federal marginal income tax rates and do not reflect the impact of state and local taxes. Actual after-tax returns to an investor depend on the investor’s own tax situation and may differ from those shown. After-tax returns shown are not relevant to investors who hold their fund shares through tax-deferred arrangements, such as 401(k) plans or individual retirement accounts. In some cases, the after-tax returns may exceed the return before taxes due to an assumed tax benefit from any losses on a sale of fund shares at the end of the measurement period.
| | | | |
| | | |
Average Annual Total Returns
(For the periods ended December 31, 2005) | | 1 Year | | Since Inception* |
Class A—Return Before Taxes | | 1.16% | | 2.82% |
Return After Taxes on Distributions | | 0.19% | | 1.46% |
Return After Taxes on Distributions & Sale of Fund Shares | | 1.21% | | 1.92% |
Class B—Return Before Taxes | | 0.64% | | 5.13% |
Return After Taxes on Distributions | | –0.32% | | 4.71% |
Return After Taxes on Distributions & Sale of Fund Shares | | 0.89% | | 4.23% |
Class C—Return Before Taxes | | 4.64% | | 5.79% |
Return After Taxes on Distributions | | 3.68% | | 5.38% |
Return After Taxes on Distributions & Sale of Fund Shares | | 3.49% | | 4.81% |
Class P—Return Before Taxes | | 0.54% | | 5.03% |
Return After Taxes on Distributions | | –0.50% | | 4.39% |
Return After Taxes on Distributions & Sale of Fund Shares | | 0.80% | | 4.00% |
Class Y—Return Before Taxes | | 6.71% | | 6.85% |
Return After Taxes on Distributions | | 5.52% | | 6.11% |
Return After Taxes on Distributions & Sale of Fund Shares | | 4.84% | | 5.52% |
Russell 1000 Value Index** | | 7.05% | | 8.19% |
| * | The inception date for the fund’s Class A shares is December 13, 2004. The fund’s Class A shares have no operating history or performance information of their own prior to that date. The performance shown for the fund’s Class A shares for periods prior to that date is the performance of the fund’s Class P shares adjusted to reflect the fees and expenses of the fund’s Class A shares. The inception date for the fund’s Class B, Class C, Class P and Class Y shares is December 31, 2001. |
| ** | Index returns do not reflect any deductions for expenses, brokerage commissions, sales charges or taxes. For more information on this index, see the following section “Description of Benchmarks.” |
6
AXA ENTERPRISE MULTIMANAGER MID CAP GROWTH FUND
| | |
Manager: | | AXA Equitable |
| |
Sub-advisers: | | Alliance Capital Management L.P. Franklin Advisers, Inc. Provident Investment Counsel, Inc. |
Key Terms
| • | | Growth Investing — An investment style that emphasizes companies with strong earnings growth. Growth investing is generally considered more aggressive than “value” investing. |
| • | | Mid Cap Companies — Companies with market capitalization within the range of companies in the Russell Midcap Growth Index. |
Investment Goal
Long-term growth of capital.
Principal Investment Strategies
Under normal circumstances, the fund intends to invest at least 80% of its net assets, plus borrowings for investment purposes, in equity securities of U.S. mid-capitalization companies. Mid-capitalization companies are companies with market capitalization within the range of companies in the Russell Midcap Growth Index at the time of investment. The market capitalization of companies included in this index currently ranges from approximately $885 million to $16 billion.
The fund intends to invest primarily in common stocks, but it may also invest in other securities that the sub-advisers believe provide opportunities for capital growth, such as preferred stocks, warrants and securities convertible into common stock.
Utilizing a due diligence process covering a number of key factors, AXA Equitable selects sub-advisers to manage the fund’s assets. These key factors include, but are not limited to, the sub-adviser’s reputation, organizational stability, investment personnel, long-term performance, investment philosophy and style and correlation with other sub-advisers retained for other allocated portions of the fund. AXA Equitable normally allocates the fund’s assets to three or more sub-advisers. AXA Equitable monitors the sub-advisers and may dismiss, replace or add sub-advisers subject to the approval of the Trust’s board of trustees.
The sub-advisers utilize an aggressive, growth-oriented investment style that emphasizes companies that are either in or entering into the growth phase of their business cycle. In choosing investments, sub-advisers utilize a process that involves researching and evaluating individual companies for potential investment. The sub-advisers may sell a security for a variety of reasons, such as to invest in a company offering superior investment opportunities.
For temporary defensive purposes, the fund may invest, without limit, in cash, money market instruments or high quality short-term debt securities, including repurchase agreements. To the extent that the fund is invested in these instruments, the fund will not be pursuing its investment goal.
Principal Investment Risks
An investment in the fund is not guaranteed; you may lose money by investing in the fund. When you sell your shares of the fund, they could be worth more or less than what you paid for them.
The principal risks presented by the fund are:
| • | | Equity Risk — Stocks and other equity securities generally fluctuate in value more than bonds and may decline in value over short or extended periods. The value of such securities will change based on changes in a company’s financial condition and in overall market and economic conditions. |
| • | | Investment Style Risk — The sub-advisers primarily use a particular style or set of styles – in this case “growth” styles – to select investments for the fund. Those styles may be out of favor or may not produce the best results over short or longer time periods. They may also increase the volatility of the fund’s share price. Growth stocks tend to be more volatile than value stocks, so in a declining market, their prices may decrease more than value stocks. |
| • | | Issuer-Specific Risk — The value of an individual security or particular type of security can be more volatile than the market as a whole and can perform differently from the market as a whole. The fund could lose all of its investment in a company’s securities. |
| • | | Liquidity Risk — The risk that certain securities may be difficult or impossible to sell at the time and price that the seller would like. This may result in a loss or may be costly to a fund. |
| • | | Mid-Capitalization Risk — Risk is greater for the common stocks of mid-capitalization companies because they generally are more vulnerable than larger companies to adverse business or economic developments and they may have more limited resources. The securities of mid-capitalization companies also |
7
| | may trade less frequently and in smaller volume than securities of larger companies. As a result, the value of such securities may be more volatile than the securities of larger companies, and the fund may experience difficulty in purchasing or selling such securities at the desired time and price. |
| • | | Portfolio Management Risk — The risk that the strategies used by a fund’s sub-advisers and their securities selections fail to produce the intended result. |
| • | | Sub-Adviser Selection Risk — The risk that AXA Equitable’s process for selecting or replacing a sub-adviser and its decision to select or replace a sub-adviser does not produce the intended result. |
More information about the risks of an investment in the fund is provided below in “More About Investment Strategies & Risks.”
FUND PERFORMANCE
The following information gives some indication of the risks of an investment in the fund by showing yearly changes in the fund’s performance and by comparing the fund’s performance with a broad measure of market performance. Both the bar chart and table below assume reinvestment of dividends and other distributions and include the effect of expense limitations that were in place during the period shown. Since AXA Equitable may add to, dismiss or replace the sub-advisers in a fund, the fund’s historical performance may cover periods when portions of the fund were advised by different sub-advisers. Past performance (before and after taxes) is not an indication of future performance.
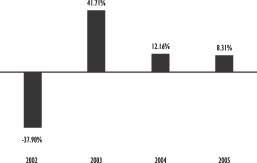
Calendar Year Annual Total Returns (Class Y)
The following bar chart illustrates the calendar year annual total returns for the fund’s Class Y shares. The inception date for the Class Y shares is December 31, 2001. The returns for the fund’s Class A, B, C and P shares would be lower than the Class Y returns shown in the bar chart because those other classes have higher total expenses. In addition, the Class Y returns shown in the bar chart do not reflect sales charges, which would apply to Class A, B, C and P shares; if such sales charges were reflected, the returns shown would be lower.
| | |
Best quarter (% and time period) | | Worst quarter (% and time period) |
20.53% (2003 2nd Quarter) | | –22.35% (2002 2nd Quarter) |
Average Annual Total Returns
for the periods ended December 31, 2005
The table below shows how the average annual total returns (adjusted to reflect applicable sales charges) for each class of the fund (before and after taxes) for the one-year and since- inception periods compare to those of a broad-based index. The table also shows hypothetical total returns that have been calculated to reflect return after taxes on distributions and return after taxes on distributions and assumed sale of fund shares.
After-tax returns are calculated using the historical highest individual federal marginal income tax rates and do not reflect the impact of state and local taxes. Actual after-tax returns to an investor depend on the investor’s own tax situation and may differ from those shown. After-tax returns shown are not relevant to investors who hold their fund shares through tax-deferred arrangements, such as 401(k) plans or individual retirement accounts. In some cases, the after-tax returns may exceed the return before taxes due to an assumed tax benefit from any losses on a sale of fund shares at the end of the measurement period.
| | | | |
| | | |
Average Annual Total Returns (For the periods ended December 31,
2005) | | 1 Year | | Since Inception* |
Class A—Return Before Taxes | | 2.72% | | 5.22% |
Return After Taxes on Distributions* | | 2.72% | | 5.22% |
Return After Taxes on Distributions & Sale of Fund Shares | | 1.77% | | 4.44% |
Class B—Return Before Taxes | | 2.20% | | –0.08% |
Return After Taxes on Distributions | | 2.20% | | –0.08% |
Return After Taxes on Distributions & Sale of Fund Shares | | 1.43% | | –0.06% |
Class C—Return Before Taxes | | 6.32% | | 0.64% |
Return After Taxes on Distributions | | 6.32% | | 0.64% |
Return After Taxes on Distributions & Sale of Fund Shares | | 4.11% | | 0.55% |
Class P—Return Before Taxes | | 2.22% | | 0.02% |
Return After Taxes on Distributions | | 2.22% | | 0.02% |
Return After Taxes on Distributions & Sale of Fund Shares | | 1.44% | | 0.02% |
Class Y—Return Before Taxes | | 8.31% | | 1.68% |
Return After Taxes on Distributions | | 8.31% | | 1.68% |
Return After Taxes on Distributions & Sale of Fund Shares | | 5.40% | | 1.44% |
Russell Midcap Growth Index** | | 12.10% | | 7.61% |
| * | The inception date for the fund’s Class A shares is December 13, 2004. The fund’s Class A shares have no operating history or performance information of their own prior to that date. The performance shown for the fund’s Class A shares for periods prior to that date is the performance of the fund’s Class P shares adjusted to reflect the fees and expenses of the fund’s Class A shares. The inception date for the fund’s Class B, Class C, Class P and Class Y shares is December 31, 2001. |
| ** | Index returns do not reflect any deductions for expenses, brokerage commissions, sales charges or taxes. For more information on this index, see the following section “Description of Benchmarks.” |
8
AXA ENTERPRISE MULTIMANAGER MID CAP VALUE FUND
| | |
Manager: | | AXA Equitable |
| |
Sub-advisers: | | AXA Rosenberg Investment Management LLC TCW Investment Management Company Wellington Management Company, LLP |
Key Terms
| • | | Value Investing — An investment style that focuses on companies that may be temporarily out of favor or have earnings or assets not fully reflected in their stock prices. |
| • | | Mid Cap Companies — Companies with market capitalization within the range of companies in the Russell Midcap Value Index. |
Investment Goal
Long-term growth of capital.
Principal Investment Strategies
Under normal circumstances, the fund intends to invest at least 80% of its net assets, plus borrowings for investment purposes, in equity securities of U.S. mid-capitalization companies. Mid-capitalization companies are companies with market capitalization within the range of companies in the Russell Midcap Value Index at the time of investment. The market capitalization of companies included in this index currently ranges from approximately $658 million to $16 billion.
The fund intends to invest primarily in common stocks, but it may also invest in other securities that the sub-advisers believe provide opportunities for capital growth, such as preferred stocks, warrants and securities convertible into common stock.
Utilizing a due diligence process covering a number of key factors, AXA Equitable selects sub-advisers to manage the fund’s assets. These key factors include, but are not limited to, the sub-adviser’s reputation, organizational stability, investment personnel, long-term performance, investment philosophy and style and correlation with other sub-advisers retained for other allocated portions of the fund. AXA Equitable normally allocates the fund’s assets to three or more sub-advisers. AXA Equitable monitors the sub-advisers and may dismiss, replace or add sub-advisers subject to the approval of the Trust’s board of trustees.
The sub-advisers utilize a value-oriented investment style that emphasizes companies deemed to be currently under-priced according to certain financial measurements, which may include price-to-earnings and price-to-book ratios and dividend income potential. This process involves researching and evaluating individual companies for potential investment by the fund. This approach will often lead the fund to focus on “strong companies” in out-of-favor sectors or out-of-favor companies exhibiting a catalyst for change. The sub-advisers may sell a security for a variety of reasons, such as because it becomes overvalued or shows deteriorating fundamentals.
For temporary defensive purposes, the fund may invest, without limit, in cash, money market instruments or high quality short-term debt securities, including repurchase agreements. To the extent that the fund is invested in these instruments, the fund will not be pursuing its investment goal.
Principal Investment Risks
An investment in the fund is not guaranteed; you may lose money by investing in the fund. When you sell your shares of the fund, they could be worth more or less than what you paid for them.
The principal risks presented by the fund are:
| • | | Equity Risk — Stocks and other equity securities generally fluctuate in value more than bonds and may decline in value over short or extended periods. The value of such securities will change based on changes in a company’s financial condition and in overall market and economic conditions. |
| • | | Investment Style Risk — The sub-advisers primarily use a particular style or set of styles – in this case “value” styles – to select investments for the fund. Those styles may be out of favor or may not produce the best results over short or longer time periods. They may also increase the volatility of the fund’s share price. |
| • | | Issuer-Specific Risk — The value of an individual security or particular type of security can be more volatile than the market as a whole and can perform differently from the market as a whole. The fund could lose all of its investment in a company’s securities. |
| • | | Liquidity Risk — The risk that certain securities may be difficult or impossible to sell at the time and price that the seller would like. This may result in a loss or may be costly to a fund. |
| • | | Mid-Capitalization Risk — Risk is greater for the common stocks of mid-capitalization companies because they generally are more vulnerable than larger companies to adverse business or economic developments and they may have more limited |
9
| | resources. The securities of mid-capitalization companies also may trade less frequently and in smaller volume than securities of larger companies. As a result, the value of such securities may be more volatile than the securities of larger companies, and the fund may experience difficulty in purchasing or selling such securities at the desired time and price. |
| • | | Portfolio Management Risk — The risk that the strategies used by a fund’s sub-advisers and their securities selections fail to produce the intended result. |
| • | | Sub-Adviser Selection Risk — The risk that AXA Equitable’s process for selecting or replacing a sub-adviser and its decision to select or replace a sub-adviser does not produce the intended result. |
More information about the risks of an investment in the fund is provided below in “More About Investment Strategies & Risks.”
FUND PERFORMANCE
The following information gives some indication of the risks of an investment in the fund by showing yearly changes in the fund’s performance and by comparing the fund’s performance with a broad measure of market performance. Both the bar chart and table below assume reinvestment of dividends and other distributions and include the effect of expense limitations that were in place during the period shown. Since AXA Equitable may add to, dismiss or replace the sub-advisers in a fund, the fund’s historical performance may cover periods when portions of the fund were advised by different sub-advisers. Past performance (before and after taxes) is not an indication of future performance.
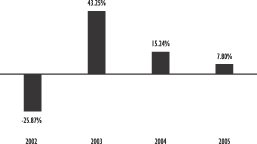
Calendar Year Annual Total Returns (Class Y)
The following bar chart illustrates the calendar year annual total returns for the fund’s Class Y shares. The inception date for the Class Y shares is December 31, 2001. The returns for the fund’s Class A, B, C and P shares would be lower than the Class Y returns shown in the bar chart because those other classes have higher total expenses. In addition, the Class Y returns shown in the bar chart do not reflect sales charges, which would apply to Class A, B, C and P shares; if such sales charges were reflected, the returns shown would be lower.
| | |
Best quarter (% and time period) | | Worst quarter (% and time period) |
19.66% (2003 2nd Quarter) | | –20.69% (2002 3rd Quarter) |
Average Annual Total Returns
for the periods ended December 31, 2005
The table below shows how the average annual total returns (adjusted to reflect applicable sales charges) for each class of the fund (before and after taxes) for the one-year and since- inception periods compare to those of a broad-based index. The table also shows hypothetical total returns that have been calculated to reflect return after taxes on distributions and return after taxes on distributions and assumed sale of fund shares.
After-tax returns are calculated using the historical highest individual federal marginal income tax rates and do not reflect the impact of state and local taxes. Actual after-tax returns to an investor depend on the investor’s own tax situation and may differ from those shown. After-tax returns shown are not relevant to investors who hold their fund shares through tax-deferred arrangements, such as 401(k) plans or individual retirement accounts. In some cases, the after-tax returns may exceed the return before taxes due to an assumed tax benefit from any losses on a sale of fund shares at the end of the measurement period.
| | | | |
| | | |
Average Annual Total Returns (For the periods ended December 31, 2005) | | 1 Year | | Since Inception* |
Class A—Return Before Taxes | | 2.24% | | 4.42% |
Return After Taxes on Distributions | | 0.49% | | 2.71% |
Return After Taxes on Distributions & Sale of Fund Shares | | 3.38% | | 3.58% |
Class B—Return Before Taxes | | 2.07% | | 5.51% |
Return After Taxes on Distributions | | 0.20% | | 5.03% |
Return After Taxes on Distributions & Sale of Fund Shares | | 3.39% | | 4.68% |
Class C—Return Before Taxes | | 5.82% | | 6.10% |
Return After Taxes on Distributions | | 3.95% | | 5.62% |
Return After Taxes on Distributions & Sale of Fund Shares | | 5.83% | | 5.19% |
Class P—Return Before Taxes | | 1.68% | | 5.43% |
Return After Taxes on Distributions | | –0.06% | | 4.90% |
Return After Taxes on Distributions & Sale of Fund Shares | | 3.00% | | 4.56% |
Class Y—Return Before Taxes | | 7.80% | | 7.17% |
Return After Taxes on Distributions | | 5.97% | | 6.60% |
Return After Taxes on Distributions & Sale of Fund Shares | | 7.08% | | 6.05% |
Russell Midcap Value Index** | | 12.65% | | 14.83% |
| * | The inception date for the fund’s Class A shares is December 13, 2004. The fund’s Class A shares have no operating history or performance information of their own prior to that date. The performance shown for the fund’s Class A shares for periods prior to that date is the performance of the fund’s Class P shares adjusted to reflect the fees and expenses of the fund’s Class A shares. The inception date for the fund’s Class B, Class C, Class P and Class Y shares is December 31, 2001. |
| ** | Index returns do not reflect any deductions for expenses, brokerage commissions, sales charges or taxes. For more information on this index, see the following section “Description of Benchmarks.” |
10
AXA ENTERPRISE MULTIMANAGER INTERNATIONAL EQUITY FUND
| | |
Manager: | | AXA Equitable |
| |
Sub-advisers: | | Alliance Capital Management L.P. (Bernstein Unit) J.P. Morgan Investment Management Inc. Marsico Capital Management, LLC |
Key Term
| • | | International Investing — Focuses primarily on companies organized or headquartered outside the U.S. |
Investment Goal
Long-term growth of capital.
Principal Investment Strategies
Under normal circumstances, the fund intends to invest at least 80% of its net assets, plus borrowings for investment purposes, in equity securities of companies, including at least 65% of its total assets in equity securities of foreign companies (companies organized or headquartered outside of the U.S.). Foreign securities include securities issued by companies in countries with either developed or developing economies. The fund does not limit its investment to issuers within a specific market capitalization range.
The fund intends to invest primarily in common stocks, but it may also invest in other securities that the sub-advisers believe provide opportunities for capital growth, such as preferred stocks, warrants and securities convertible into common stock. The fund also may invest, to a limited extent, in illiquid securities.
Utilizing a due diligence process covering a number of key factors, AXA Equitable selects sub-advisers to manage the fund’s assets. These key factors include, but are not limited to, the sub-adviser’s reputation, organizational stability, investment personnel, long-term performance, investment philosophy and style and correlation with other sub-advisers retained for other allocated portions of the fund. AXA Equitable normally allocates the fund’s assets to three or more sub-advisers. AXA Equitable monitors the sub-advisers and may dismiss, replace or add sub-advisers subject to the approval of the Trust’s board of trustees.
Each of the sub-advisers utilizes an approach that concentrates its efforts on identifying foreign companies with good prospects for future growth. Other factors, such as country and regional factors, are considered by the sub-advisers. While the sub-advisers believe that the identification, research and selection of individual stocks is of great importance to the fund’s success, regional issues or political and economic considerations also play a role in the overall success of the fund. The sub-advisers may sell a security for a variety of reasons, such as to invest in a company offering superior investment opportunities.
For temporary defensive purposes, the fund may invest, without limit, in U.S. securities, cash, money market instruments or high quality short-term debt securities, including repurchase agreements. To the extent that the fund is invested in cash instruments, the fund will not be pursuing its investment goal.
Principal Investment Risks
An investment in the fund is not guaranteed; you may lose money by investing in the fund. When you sell your shares of the fund, they could be worth more or less than what you paid for them.
The principal risks presented by the fund are:
| • | | Currency Risk — The risk that fluctuations in the exchange rates between the U.S. dollar and foreign currencies may negatively affect an investment. A change in the value of any such currency against the U.S. dollar will result in a change in the U.S. dollar value of a fund’s assets and income. |
| • | | Equity Risk — Stocks and other equity securities generally fluctuate in value more than bonds and may decline in value over short or extended periods. The value of such securities will change based on changes in a company’s financial condition and in overall market and economic conditions. |
| • | | Foreign Investing and Emerging Markets Risks — The value of the fund’s investments in foreign securities may fall due to adverse political, social and economic developments abroad and decreases in foreign currency values relative to the U.S. dollar. Foreign markets also may be less liquid and more volatile than U.S. markets. These risks are greater generally for investments in emerging market issuers than for issuers in more developed countries. |
| • | | Issuer-Specific Risk — The value of an individual security or particular type of security can be more volatile than the market as a whole and can perform differently from the market as a whole. The fund could lose all of its investment in a company’s securities. |
| • | | Large-Capitalization Risk — To the extent the fund invests in securities of large-capitalization issuers, it will be exposed to the risks of investing in such issuers. Larger more established companies may be unable to respond quickly to new competitive challenges such as changes in technology and consumer tastes. Many larger companies also may not be able to attain the high growth rate of successful smaller companies, especially during extended periods of economic expansion. |
| • | | Liquidity Risk — The risk that certain securities may be difficult or impossible to sell at the time and price that the seller would like. This may result in a loss or may be costly to a fund. |
11
| • | | Portfolio Management Risk — The risk that the strategies used by a fund’s sub-advisers and their securities selections fail to produce the intended result. |
| • | | Small- and Mid-Capitalization Risk — To the extent the fund invests in securities of small- and mid-capitalization issuers, it will be exposed to the risks of investing in such issuers. Risk is greater for the securities of small- and mid-capitalization companies because they generally are more vulnerable than larger companies to adverse business or economic developments and they may have more limited resources. The securities of small- and mid-capitalization companies also may trade less frequently and in smaller volume than larger companies. As a result, the value of such securities may be more volatile than the securities of larger companies, and the fund may experience difficulty in purchasing or selling such securities at the desired time and price. In general, these risks are greater for small-capitalization companies than for mid-capitalization companies. |
| • | | Sub-Adviser Selection Risk — The risk that AXA Equitable’s process for selecting or replacing a sub-adviser and its decision to select or replace a sub-adviser does not produce the intended result. |
More information about the risks of an investment in the fund is provided below in “More About Investment Strategies & Risks.”
FUND PERFORMANCE
The following information gives some indication of the risks of an investment in the fund by showing yearly changes in the fund’s performance and by comparing the fund’s performance with a broad measure of market performance. Both the bar chart and table below assume reinvestment of dividends and other distributions and include the effect of expense limitations that were in place during the period shown. Since AXA Equitable may add to, dismiss or replace the sub-advisers in a fund, the fund’s historical performance may cover periods when portions of the fund were advised by different sub-advisers. Past performance (before and after taxes) is not an indication of future performance.
Calendar Year Annual Total Returns (Class Y)
The following bar chart illustrates the calendar year annual total returns for the fund’s Class Y shares. The inception date for the Class Y shares is December 31, 2001. The returns for the fund’s Class A, B, C and P shares would be lower than the Class Y returns shown in the bar chart because those other classes have higher total expenses. In addition, the Class Y returns shown in the bar chart do not reflect sales charges, which would apply to Class A, B, C and P shares; if such sales charges were reflected, the returns shown would be lower.
| | |
Best quarter (% and time period) | | Worst quarter (% and time period) |
24.54% (2003 2nd Quarter) | | –22.89% (2002 3rd Quarter) |
Average Annual Total Returns
for the periods ended December 31, 2005
The table below shows how the average annual total returns (adjusted to reflect applicable sales charges) for each class of the fund (before and after taxes) for the one-year and since-inception periods compare to those of a broad-based index. The table also shows hypothetical total returns that have been calculated to reflect return after taxes on distributions and return after taxes on distributions and assumed sale of fund shares.
After-tax returns are calculated using the historical highest individual federal marginal income tax rates and do not reflect the impact of state and local taxes. Actual after-tax returns to an investor depend on the investor’s own tax situation and may differ from those shown. After-tax returns shown are not relevant to investors who hold their fund shares through tax-deferred arrangements, such as 401(k) plans or individual retirement accounts. In some cases, the after-tax returns may exceed the return before taxes due to an assumed tax benefit from any losses on a sale of fund shares at the end of the measurement period.
| | | | |
| | | |
Average Annual Total Returns (For the periods ended December 31, 2005) | | 1 Year | | Since Inception* |
Class A—Return Before Taxes | | 8.89% | | 12.50% |
Return After Taxes on Distributions | | 7.72% | | 11.04% |
Return After Taxes on Distributions & Sale of Fund Shares | | 6.33% | | 10.03% |
Class B—Return Before Taxes | | 8.61% | | 8.85% |
Return After Taxes on Distributions | | 7.59% | | 8.53% |
Return After Taxes on Distributions & Sale of Fund Shares | | 6.18% | | 7.53% |
Class C—Return Before Taxes | | 12.61% | | 9.43% |
Return After Taxes on Distributions | | 11.59% | | 9.11% |
Return After Taxes on Distributions & Sale of Fund Shares | | 8.78% | | 8.04% |
Class P—Return Before Taxes | | 8.14% | | 8.67% |
Return After Taxes on Distributions | | 6.90% | | 8.08% |
Return After Taxes on Distributions & Sale of Fund Shares | | 5.85% | | 7.19% |
Class Y—Return Before Taxes | | 14.81% | | 10.53% |
Return After Taxes on Distributions | | 13.40% | | 9.83% |
Return After Taxes on Distributions & Sale of Fund Shares | | 10.21% | | 8.76% |
Morgan Stanley Capital
International EAFE Index** | | 13.54% | | 12.30% |
| * | The inception date for the fund’s Class A shares is December 13, 2004. The fund’s Class A shares have no operating history or performance information of their own prior to that date. The performance shown for the fund’s Class A shares for periods prior to that date is the performance of the fund’s Class P shares adjusted to reflect the fees and expenses of the fund’s Class A shares. The inception date for the fund’s Class B, Class C, Class P and Class Y shares is December 31, 2001. |
| ** | Index returns do not reflect any deductions for expenses, brokerage commissions, sales charges or taxes. For more information on this index, see the following section “Description of Benchmarks.” |
12
AXA ENTERPRISE MULTIMANAGER TECHNOLOGY FUND
| | |
Manager: | | AXA Equitable |
| |
Sub-advisers: | | Firsthand Capital Management, Inc. RCM Capital Management LLC, Wellington Management Company, LLP |
Key Term
| • | | Sector Fund — A fund that invests in only a subset of the overall equity market, in this case the Technology Sector. |
Investment Goal
Long-term growth of capital.
Principal Investment Strategies
Under normal circumstances, the fund intends to invest at least 80% of its net assets, plus borrowings for investment purposes, in equity securities of companies principally engaged in the technology sector. Such companies include, among others, those in the internet products and services, computer, electronic, hardware and components, communication, software, e-commerce, information service, healthcare equipment and services, including medical devices, biotechnology, chemical products and synthetic materials, defense and aerospace industries, environmental services, nanotechnology, energy equipment and services, and electronic manufacturing services. The fund does not limit its investment to issuers with a specific market capitalization range. While the fund can invest in securities of U.S. and foreign companies, the majority of fund assets are expected to be invested in securities of U.S. companies.
The fund intends to invest primarily in common stocks, but it may also invest in other securities that the sub-advisers believe provide opportunities for capital growth, such as preferred stocks, warrants and securities convertible into common stock. The fund is non-diversified, which means that it may invest in a limited number of issuers.
Utilizing a due diligence process covering a number of key factors, AXA Equitable selects sub-advisers to manage the fund’s assets. These key factors include, but are not limited to, the sub-adviser’s reputation, organizational stability, investment personnel, long-term performance, investment philosophy and style and correlation with other sub-advisers retained for other allocated portions of the fund. AXA Equitable normally allocates the fund’s assets to three or more sub-advisers. AXA Equitable monitors the sub-advisers and may dismiss, replace or add sub-advisers subject to the approval of the Trust’s board of trustees.
The sub-advisers select securities based upon fundamental analysis, such as an analysis of earnings, cash flows, competitive position and management’s abilities. The sub-advisers may sell a security for a variety of reasons, such as to invest in a company with more attractive growth prospects.
For temporary defensive purposes, the fund may invest, without limit, in cash, money market instruments or high quality short-term debt securities, including repurchase agreements. To the extent that the fund is invested in these instruments, the fund will not be pursuing its investment goal.
Principal Investment Risks
An investment in the fund is not guaranteed; you may lose money by investing in the fund. When you sell your shares of the fund, they could be worth more or less than what you paid for them.
The principal risks presented by the fund are:
| • | | Equity Risk — Stocks and other equity securities generally fluctuate in value more than bonds and may decline in value over short or extended periods. The value of such securities will change based on changes in a company’s financial condition and in overall market and economic conditions. |
| • | | Technology Sector Risk — The value of the fund’s shares is particularly vulnerable to factors affecting the technology sector, such as dependency on consumer and business acceptance as new technology evolves, large and rapid price movements resulting from competition, rapid obsolescence of products and services and short product cycles. Many technology companies are small and at an earlier stage of development and, therefore, may be subject to risks such as those arising out of limited product lines, markets and financial and managerial resources. |
| • | | Issuer-Specific Risk — The value of an individual security or particular type of security can be more volatile than the market as a whole and can perform differently from the market as a whole. The fund could lose all of its investment in a company’s securities. |
13
| • | | Large-Capitalization Risk — To the extent the fund invests in securities of large-capitalization issuers, it will be exposed to the risks of investing in such issuers. Larger more established companies may be unable to respond quickly to new competitive challenges such as changes in technology and consumer tastes. Many larger companies also may not be able to attain the high growth rate of successful smaller companies, especially during extended periods of economic expansion. |
| • | | Non-Diversification Risk — As a non-diversified mutual fund, more of the fund’s assets may be focused in the common stocks of a small number of issuers, which may make the value of the fund’s shares more sensitive to changes in the market value of a single issuer or industry than shares of a diversified mutual fund. |
| • | | Sector Concentration Risk — Since the fund invests primarily in a particular sector, it could experience greater volatility than stock funds investing in a broader range of industries. |
| • | | Small- and Mid-Capitalization Risk — To the extent the fund invests in securities of small- and mid-capitalization issuers, it will be exposed to the risks of investing in such issuers. Many companies in the technology sector have relatively small market capitalization. Risk is greater for the common stocks of those companies because they generally are more vulnerable than larger companies to adverse business or economic developments and they may have more limited resources. The securities of small- and mid-capitalization companies also may trade less frequently and in smaller volume than larger companies. As a result, the value of such securities may be more volatile than the securities of larger companies, and the fund may experience difficulty in purchasing or selling such securities at the desired time and price. In general, these risks are greater for small-capitalization companies than for mid-capitalization companies. |
| • | | Foreign Investing Risk — The value of the fund’s investments in foreign securities may fall due to adverse political, social and economic developments abroad and decreases in foreign currency values relative to the U.S. dollar. Foreign markets also may be less liquid and more volatile than U.S. markets. |
| • | | Portfolio Management Risk — The risk that the strategies used by a fund’s sub-advisers and their securities selections fail to produce the intended result. |
| • | | Sub-Adviser Selection Risk — The risk that AXA Equitable’s process for selecting or replacing a sub-adviser and its decision to select or replace a sub-adviser does not produce the intended result. |
More information about the risks of an investment in the fund is provided below in “More About Investment Strategies & Risks.”
FUND PERFORMANCE
The following information gives some indication of the risks of an investment in the fund by showing yearly changes in the fund’s performance and by comparing the fund’s performance with a broad measure of market performance. Both the bar chart and table below assume reinvestment of dividends and other distributions and include the effect of expense limitations that were in place during the period shown. Since AXA Equitable may add to, dismiss or replace the sub-advisers in a fund, the fund’s historical performance may cover periods when portions of the fund were advised by different sub- advisers. Past performance (before and after taxes) is not an indication of future performance.
Calendar Year Annual Total Returns (Class Y)
The following bar chart illustrates the calendar year annual total returns for the fund’s Class Y shares. The inception date for the Class Y shares is December 31, 2001. The returns for the fund’s Class A, B, C and Class P shares would be lower than the Class Y returns shown in the bar chart because those other classes have higher total expenses. In addition, the Class Y returns shown in the bar chart do not reflect sales charges, which would apply to Class A, B, C and Class P shares; if such sales charges were reflected, the returns shown would be lower.
| | |
Best quarter (% and time period) | | Worst quarter (% and time period) |
27.53% (2003 2nd Quarter) | | –26.99% (2002 2nd Quarter) |
14
Average Annual Total Returns
for the periods ended December 31, 2005
The table below shows how the average annual total returns (adjusted to reflect applicable sales charges) for each class of the fund (before and after taxes) for the one-year and since-inception periods compare to those of a broad-based index. The table also shows hypothetical total returns that have been calculated to reflect return after taxes on distributions and return after taxes on distributions and assumed sale of fund shares.
After-tax returns are calculated using the historical highest individual federal marginal income tax rates and do not reflect the impact of state and local taxes. Actual after-tax returns to an investor depend on the investor’s own tax situation and may differ from those shown. After-tax returns shown are not relevant to investors who hold their fund shares through tax-deferred arrangements, such as 401(k) plans or individual retirement accounts. In some cases, the after-tax returns may exceed the return before taxes due to an assumed tax benefit from any losses on a sale of fund shares at the end of the measurement period.
| | | | |
| | | |
Average Annual Total Returns (For the periods ended December 31, 2005) | | 1 Year | | Since Inception* |
Class A—Return Before Taxes | | 3.92% | | 4.62% |
Return After Taxes on Distributions | | 1.75% | | 2.54% |
Return After Taxes on Distributions & Sale of Fund Shares | | 2.87% | | 2.88% |
Class B—Return Before Taxes | | 3.44% | | –0.13% |
Return After Taxes on Distributions | | 1.12% | | –0.69% |
Return After Taxes on Distributions & Sale of Fund Shares | | 2.58% | | –0.39% |
Class C—Return Before Taxes | | 7.43% | | 0.58% |
Return After Taxes on Distributions | | 5.11% | | 0.03% |
Return After Taxes on Distributions & Sale of Fund Shares | | 5.18% | | 0.21% |
Class P—Return Before Taxes | | 3.20% | | –0.08% |
Return After Taxes on Distributions | | 1.05% | | –0.63% |
Return After Taxes on Distributions & Sale of Fund Shares | | 2.40% | | –0.35% |
Class Y—Return Before Taxes | | 9.48% | | 1.58% |
Return After Taxes on Distributions | | 7.21% | | 1.00% |
Return After Taxes on Distributions & Sale of Fund Shares | | 6.49% | | 1.04% |
Russell 1000 Technology Index**,# | | 2.32% | | –1.27% |
Russell 1000 Index** | | 6.27% | | 4.77% |
| # | We believe that this index reflects more closely the market sectors in which the fund invests. |
| * | The inception date for the fund’s Class A shares is December 13, 2004. The fund’s Class A shares have no operating history or performance information of their own prior to that date. The performance shown for the fund’s Class A shares for periods prior to that date is the performance of the fund’s Class P shares adjusted to reflect the fees and expenses of the fund’s Class A shares. The inception date for the fund’s Class B, Class C, Class P and Class Y shares is December 31, 2001. |
| ** | Index returns do not reflect any deductions for expenses, brokerage commissions, sales charges or taxes. For more information on this index, see the following section “Description of Benchmarks.” |
15
AXA ENTERPRISE MULTIMANAGER HEALTH CARE FUND
| | |
Manager: | | AXA Equitable |
| |
Sub-advisers: | | A I M Capital Management, Inc. RCM Capital Management LLC Wellington Management Company, LLP |
Key Term
| • | | Sector Fund — A fund that invests in only a subset of the overall equity market, in this case the Health Care Sector. |
Investment Goal
Long-term growth of capital.
Principal Investment Strategies
Under normal circumstances, the fund intends to invest at least 80% of its net assets, plus borrowings for investment purposes, in equity securities of companies primarily engaged in the research, development, production or distribution of products or services related to health care, medicine or the life sciences (collectively termed “health sciences”). While the fund can invest in securities of U.S. and foreign companies of any size, the majority of fund assets are expected to be invested in securities of U.S. companies.
The health sciences sector consists of four main areas: pharmaceutical, health care services companies, product and device providers and biotechnology firms. The fund’s allocation among these four areas will vary depending on the relative potential within each area and the outlook for the overall health sciences sector.
The fund intends to invest primarily in common stocks, but it may also invest in other securities that the sub-advisers believe provide opportunities for capital growth, such as preferred stocks, warrants and securities convertible into common stock. The fund is a non-diversified fund, which means that it may invest in a limited number of issuers.
Utilizing a due diligence process covering a number of key factors, AXA Equitable selects sub-advisers to manage the fund’s assets. These key factors include, but are not limited to, the sub-adviser’s reputation, organizational stability, investment personnel, long-term performance, investment philosophy and style and correlation with other sub-advisers retained for other allocated portions of the fund. AXA Equitable normally allocates the fund’s assets to three or more sub-advisers. AXA Equitable monitors the sub-advisers and may dismiss, replace or add sub-advisers subject to the approval of the Trust’s board of trustees.
The sub-advisers select securities through fundamental analysis, such as an analysis of earnings, cash flows, competitive position and management’s abilities. The sub-advisers may sell a security for a variety of reasons, such as to invest in a company with more attractive growth prospects.
For temporary defensive purposes, the fund may invest, without limit, in cash, money market instruments or high quality short-term debt securities, including repurchase agreements. To the extent that the fund is invested in these instruments, the fund will not be pursuing its investment goal.
Principal Investment Risks
An investment in the fund is not guaranteed; you may lose money by investing in the fund. When you sell your shares of the fund, they could be worth more or less than what you paid for them.
The principal risks presented by the fund are:
| • | | Equity Risk — Stocks and other equity securities generally fluctuate in value more than bonds and may decline in value over short or extended periods. The value of such securities will change based on changes in a company’s financial condition and in overall market and economic conditions. |
| • | | Health Care Sector Risk — The value of the fund’s shares is particularly vulnerable to factors affecting the health care sector, such as substantial government regulation. Also, the products and services offered by health care companies may be subject to rapid obsolescence caused by scientific advances and technological innovations. |
| • | | Issuer-Specific Risk — The value of an individual security or particular type of security can be more volatile than the market as a whole and can perform differently from the market as a whole. The fund could lose all of its investment in a company’s securities. |
| • | | Large-Capitalization Risk — To the extent the fund invests in securities of large-capitalization issuers, it will be exposed to the risks of investing in such issuers. Larger more established companies may be unable to respond quickly to new competitive challenges such as changes in technology and consumer tastes. Many larger companies also may not be able to attain the high growth rate of successful smaller companies, especially during extended periods of economic expansion. |
16
| • | | Non-Diversification Risk — As a non-diversified mutual fund, more of the fund’s assets may be focused in the common stocks of a small number of issuers, which may make the value of the fund’s shares more sensitive to changes in the market value of a single issuer or industry than shares of a diversified mutual fund. |
| • | | Sector Concentration Risk — Since the fund invests primarily in a particular sector, it could experience greater volatility than stock funds investing in a broader range of industries. |
| • | | Foreign Investing Risk — The value of the fund’s investments in foreign securities may fall due to adverse political, social and economic developments abroad and decreases in foreign currency values relative to the U.S. dollar. Foreign markets also may be less liquid and more volatile than U.S. markets. |
| • | | Portfolio Management Risk — The risk that the strategies used by a fund’s sub-advisers and their securities selections fail to produce the intended result. |
| • | | Small- and Mid-Capitalization Risk — To the extent the fund invests in securities of small- and mid-capitalization issuers, it will be exposed to the risks of investing in such issuers. Many companies in the health care sector have relatively small market capitalization. Risk is greater for the common stocks of those companies because they generally are more vulnerable than larger companies to adverse business or economic developments and they may have more limited resources. The securities of small- and mid-capitalization companies also may trade less frequently and in smaller volume than larger companies. As a result, the value of such securities may be more volatile than the securities of larger companies, and the fund may experience difficulty in purchasing or selling such securities at the desired time and price. In general, these risks are greater for small-capitalization companies than for mid-capitalization companies. |
| • | | Sub-Adviser Selection Risk — The risk that AXA Equitable’s process for selecting or replacing a sub-adviser and its decision to select or replace a sub-adviser does not produce the intended result. |
More information about the risks of an investment in the fund is provided below in “More About Investment Strategies & Risks.”
FUND PERFORMANCE
The following information gives some indication of the risks of an investment in the fund by showing yearly changes in the fund’s performance and by comparing the fund’s performance with a broad measure of market performance. Both the bar chart and table below assume reinvestment of dividends and other distributions and include the effect of expense limitations that were in place during the period shown. Since AXA Equitable may add to, dismiss or replace the sub-advisers in a fund, the fund’s historical performance may cover periods when portions of the fund were advised by different sub-advisers. Past performance (before and after taxes) is not an indication of future performance.
Calendar Year Annual Total Returns (Class Y)
The following bar chart illustrates the calendar year annual total returns for the fund’s Class Y shares. The inception date for the Class Y shares is December 31, 2001. The returns for the fund’s Class A, B, C and P shares would be lower than the Class Y returns shown in the bar chart because those other classes have higher total expenses. In addition, the Class Y returns shown in the bar chart do not reflect sales charges, which would apply to Class A, B, C and P shares; if such sales charges were reflected, the returns shown would be lower.
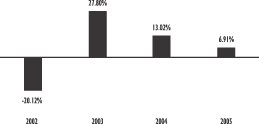
| | |
Best quarter (% and time period) | | Worst quarter (% and time period) |
18.23% (2003 2nd Quarter) | | –13.13% (2002 2nd Quarter) |
17
Average Annual Total Returns
for the periods ended December 31, 2005
The table below shows how the average annual total returns (adjusted to reflect applicable sales charges) for each class of the fund (before and after taxes) for the one-year and since-inception periods compare to those of a broad-based index. The table also shows hypothetical total returns that have been calculated to reflect return after taxes on distributions and return after taxes on distributions and assumed sale of fund shares.
After-tax returns are calculated using the historical highest individual federal marginal income tax rates and do not reflect the impact of state and local taxes. Actual after-tax returns to an investor depend on the investor’s own tax situation and may differ from those shown. After-tax returns shown are not relevant to investors who hold their fund shares through tax-deferred arrangements, such as 401(k) plans or individual retirement accounts. In some cases, the after-tax returns may exceed the return before taxes due to an assumed tax benefit from any losses on a sale of fund shares at the end of the measurement period.
| | | | | | |
| | | |
Average Annual Total Returns (For the periods ended December 31, 2005) | | 1 Year | | | Since Inception* | |
Class A—Return Before Taxes | | 1.49 | % | | 4.25 | % |
Return After Taxes on Distributions | | 0.13 | % | | 2.11 | % |
Return After Taxes on Distributions & Sale of Fund Shares | | 1.61 | % | | 3.07 | % |
Class B—Return Before Taxes | | 0.85 | % | | 3.69 | % |
Return After Taxes on Distributions | | –0.60 | % | | 3.10 | % |
Return After Taxes on Distributions & Sale of Fund Shares | | 1.25 | % | | 3.01 | % |
Class C—Return Before Taxes | | 4.94 | % | | 4.38 | % |
Return After Taxes on Distributions | | 3.49 | % | | 3.80 | % |
Return After Taxes on Distributions & Sale of Fund Shares | | 3.90 | % | | 3.61 | % |
Class P—Return Before Taxes | | 0.77 | % | | 3.62 | % |
Return After Taxes on Distributions | | –0.58 | % | | 3.01 | % |
Return After Taxes on Distributions & Sale of Fund Shares | | 1.14 | % | | 2.92 | % |
Class Y—Return Before Taxes | | 6.91 | % | | 5.39 | % |
Return After Taxes on Distributions | | 5.49 | % | | 4.74 | % |
Return After Taxes on Distributions & Sale of Fund Shares | | 5.17 | % | | 4.43 | % |
Russell 1000 Healthcare Index**,# | | 8.49 | % | | 1.31 | % |
Russell 1000 Index** | | 6.27 | % | | 4.77 | % |
| # | We believe that this index reflects more closely the market sectors in which the fund invests. |
| * | The inception date for the fund’s Class A shares is December 13, 2004. The fund’s Class A shares have no operating history or performance information of their own prior to that date. The performance shown for the fund’s Class A shares for periods prior to that date is the performance of the fund’s Class P shares adjusted to reflect the fees and expenses of the fund’s Class A shares. The inception date for the fund’s Class B, Class C, Class P and Class Y shares is December 31, 2001. |
| ** | Index returns do not reflect any deductions for expenses, brokerage commissions, sales charges or taxes. For more information on this index, see the following section “Description of Benchmarks.” |
18
AXA ENTERPRISE MULTIMANAGER CORE BOND FUND
| | |
Manager: | | AXA Equitable |
| |
Sub-advisers: | | BlackRock Advisors, Inc. Pacific Investment Management Company LLC |
Key Term
| • | | Investment Grade Bonds — Bonds rated Baa or higher by Moody’s or BBB or higher by Standard & Poor’s. |
Investment Goal
To seek a balance of a high current income and capital appreciation, consistent with a prudent level of risk.
Principal Investment Strategies
Under normal circumstances, the fund intends to invest at least 80% of its net assets, plus borrowings for investment purposes, in investment grade bonds. For purposes of this investment policy, a debt security is considered a “bond.” Debt securities represent an issuer’s obligation to repay a loan of money that generally pays interest to the holder. Bonds, notes and debentures are examples of debt securities. The fund focuses on U.S. government and corporate debt securities and mortgage- and asset-backed securities.
The fund may also invest in securities rated below investment grade (i.e., Ba or lower by Moody’s Investors Service, Inc. or BB or lower by Standard & Poor’s Ratings Service) or, if unrated, determined by the sub-adviser to be of comparable quality (“junk bonds”). The fund may invest in securities denominated in foreign currencies and U.S. dollar-denominated securities of foreign issuers, including issuers located in emerging markets. The fund normally will seek to hedge most of its exposure to foreign currency to reduce the risk of loss due to fluctuations in currency exchange rates.
Utilizing a due diligence process covering a number of key factors, AXA Equitable selects sub-advisers to manage the fund’s assets. These key factors include, but are not limited to, the sub-adviser’s reputation, organizational stability, investment personnel, long-term performance, investment philosophy and style and correlation with other sub-advisers retained for other allocated portions of the Fund. AXA Equitable normally allocates the fund’s assets to two or more sub-advisers. AXA Equitable monitors the sub-advisers and may dismiss, replace or add sub-advisers subject to the approval of the Trust’s board of trustees.
The fund’s sub-advisers evaluate several sectors of the bond market and individual securities within these sectors. The sub-advisers select bonds from several sectors including: U.S. Treasuries and agency securities, commercial and residential mortgage-backed securities, asset-backed securities, corporate bonds and bonds of foreign issuers. Securities are purchased for the fund when the sub-advisers determine that they have the potential for above-average total return.
The fund may purchase bonds of any maturity, but generally the fund’s overall effective duration will be of an intermediate-term nature (similar to that of five- to seven-year U.S. Treasury notes) and have a comparable duration to that of the Lehman Brothers Aggregate Bond Index (currently approximately 4.58 years). Effective duration is a measure of the expected change in value from changes in interest rates. Typically, a bond with a low (short) duration means that its value is less sensitive to interest rate changes, while bonds with a high (long) duration are more sensitive.
The fund’s sub-advisers may, when consistent with the fund’s investment objective, use derivative securities. Derivative securities include futures and options contracts, options on futures contracts, foreign currencies, securities and bond indices, structured notes, swaps (including long and short credit default swaps) and indexed securities. The fund will typically use derivatives as a substitute for taking a position in the underlying asset and/or in an attempt to reduce risk to the fund as a whole (hedge), but they may also be used to maintain liquidity, commit cash pending investment or for speculation to increase returns. The fund may also enter into interest rate transactions as a hedging technique. In these transactions, the fund exchanges its right to pay or receive interest with another party for their right to pay or receive interest.
For temporary defensive purposes, the fund may invest, without limit, in cash, money market instruments or high quality short-term debt securities, including repurchase agreements. To the extent that the fund is invested in these instruments, the fund will not be pursuing its investment goal.
Principal Investment Risks
An investment in the fund is not guaranteed; you may lose money by investing in the fund. When you sell your shares of
19
the fund, they could be worth more or less than what you paid for them.
The principal risks presented by the fund are:
| • | | Credit/Default Risk — The risk that the issuer of a security or the counter-party to a contract will default or otherwise become unable to honor a financial obligation. Securities rated below investment grade may involve a substantial risk of default. For more information see “Credit Quality Risk” in “More About Investment Strategies and Risks.” |
| • | | Currency Risk — The risk that fluctuations in the exchange rates between the U.S. dollar and foreign currencies may negatively affect an investment. A change in the value of any such currency against the U.S. dollar will result in a change in the U.S. dollar value of a fund’s assets and income. |
| • | | Interest Rate Risk — The risk of market losses attributable to changes in interest rates. In general, the prices of fixed-income securities rise when interest rates fall, and fall when interest rates rise. |
| • | | Investment Grade Securities Risk — Debt securities generally are rated by national bond rating agencies. Securities rated BBB and higher by S&P and Baa or higher by Moody’s (or, if unrated, determined by the sub-adviser to be of comparable quality) are considered investment grade securities, but securities rated BBB or Baa (or, if unrated, determined by the sub-adviser to be of comparable quality) are somewhat riskier than higher rated obligations because they are regarded as having only an adequate capacity to pay principal and interest, and are considered to lack outstanding investment characteristics. |
| • | | Foreign Investing and Emerging Markets Risk — The value of the fund’s investments in foreign securities may fall due to adverse political, social and economic developments abroad and decreases in foreign currency values relative to the U.S. dollar. Foreign markets also may be less liquid and more volatile than U.S. markets. These risks are greater generally for investments in emerging market issuers than for issuers in more developed countries. |
| • | | Issuer-Specific Risk — The value of an individual security or particular type of security can be more volatile than the market as a whole and can perform differently from the market as a whole. The fund could lose all of its investment in a company’s securities. |
| • | | Liquidity Risk — The risk that certain securities may be difficult or impossible to sell at the time and the price that the seller would like. This may result in a loss or may be costly to a fund. |
| • | | Lower-Rated Securities Risk — Bonds rated below investment grade (i.e., BB or lower by S&P or Ba or lower by Moody’s) are speculative in nature, involve greater risk of default by the issuing entity and may be subject to greater market fluctuations than higher rated fixed income securities. For more information, see “Lower-Rated Securities Risk” in “More About Investment Strategies & Risks.” |
| • | | Mortgage-Backed and Asset-Backed Securities Risk — The risk that the principal on mortgage- or asset-backed securities may be prepaid at any time which will reduce the yield and market value. If interest rates fall, the rate of prepayments tends to increase as borrowers are motivated to pay off debt and refinance at new lower rates. Rising interest rates tend to extend the duration of mortgage-related securities, making them more sensitive to changes in interest rates. As a result, in a period of rising interest rates, a fund that holds mortgage-related securities may exhibit additional volatility. This is known as extension risk. |
| • | | Derivatives Risk — Derivatives are financial contracts whose value is based on the value of an underlying asset, reference rate or index. The fund’s investment in derivatives may rise or fall more rapidly than other investments. These transactions are subject to changes in the underlying security on which such transactions are based. Even a small investment in derivative securities can have a significant impact on the fund’s exposure to stock market values, interest rates or currency exchange rates. Derivatives are subject to a number of risks such as liquidity risk, interest rate risk, market risk, credit risk and portfolio management risk depending on the type of underlying asset, reference rate or index. They also involve the risk of mispricing or improper valuation and the risk that changes in the value of a derivative may not correlate well with the underlying asset, rate or index. These types of transactions will be used primarily as a substitute for taking a position in the underlying asset and/or for hedging purposes. When a derivative security is used as a hedge against an offsetting position that the fund also holds, any loss generated by the derivative security should be substantially offset by gains on the hedged instrument, and vice versa. To the extent that the fund uses a derivative security for purposes other than as a hedge, the fund is directly exposed to the risks of that derivative security and any loss generated by the derivative security will not be offset by a gain. |
| • | | Portfolio Management Risk — The risk that the strategies used by a fund’s sub-advisers and their securities selections fail to produce the intended result. |
| • | | Sub-Adviser Selection Risk — The risk that AXA Equitable’s process for selecting or replacing a sub-adviser and its decision to select or replace a sub-adviser does not produce the intended result. |
More information about the risks of an investment in the fund is provided below in “More About Investment Strategies & Risks.”
FUND PERFORMANCE
The following information gives some indication of the risks of an investment in the fund by showing yearly changes in the fund’s performance and by comparing the fund’s performance with a broad measure of market performance. Both the bar chart and table below assume reinvestment of dividends and other distributions and include the effect of expense limitations that were in place during the period shown. Since AXA Equitable may add to, dismiss or replace the sub-advisers in a fund, the fund’s historical performance may cover periods when portions of the fund were advised by different sub-advisers. Past performance (before and after taxes) is not an indication of future performance.
20
Calendar Year Annual Total Returns (Class Y)
The following bar chart illustrates the calendar year annual total returns for the fund’s Class Y shares. The inception date for the Class Y shares is December 31, 2001. The returns for the fund’s Class A, B, C and Class P shares would be lower than the Class Y returns shown in the bar chart because those other classes have higher total expenses. In addition, the Class Y returns shown in the bar chart do not reflect sales charges, which would apply to Class A, B, C and Class P shares; if such sales charges were reflected, the returns shown would be lower.
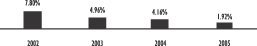
| | |
Best quarter (% and time period) | | Worst quarter (% and time period) |
3.28% (2002 3rd Quarter) | | –2.26% (2004 2nd Quarter) |
Average Annual Total Returns
for the periods ended December 31, 2005
The table below shows how the average annual total returns (adjusted to reflect applicable sales charges) for each class of the fund (before and after taxes) for the one-year and since-inception periods compare to those of a broad-based index. The table also shows hypothetical total returns that have been calculated to reflect return after taxes on distributions and return after taxes on distributions and assumed sale of fund shares.
After-tax returns are calculated using the historical highest individual federal marginal income tax rates and do not reflect the impact of state and local taxes. Actual after-tax returns to an investor depend on the investor’s own tax situation and may differ from those shown. After-tax returns shown are not relevant to investors who hold their fund shares through tax-deferred arrangements, such as 401(k) plans or individual retirement accounts. In some cases, the after-tax returns may exceed the return before taxes due to an assumed tax benefit from any losses on a sale of fund shares at the end of the measurement period.
| | | | |
| | | |
Average Annual Total Returns (For the periods ended December 31, 2005) | | 1 Year | | Since Inception* |
Class A—Return Before Taxes | | –3.35% | | –3.11% |
Return After Taxes on Distributions | | –4.41% | | –4.60% |
Return After Taxes on Distributions & Sale of Fund Shares | | –2.18% | | –3.46% |
Class B—Return Before Taxes | | –3.93% | | 2.99% |
Return After Taxes on Distributions | | –4.84% | | 1.53% |
Return After Taxes on Distributions & Sale of Fund Shares | | –2.55% | | 1.70% |
Class C—Return Before Taxes | | –0.09% | | 3.63% |
Return After Taxes on Distributions | | –1.00% | | 2.21% |
Return After Taxes on Distributions & Sale of Fund Shares | | –0.06% | | 2.27% |
Class P—Return Before Taxes | | –2.89% | | 3.22% |
Return After Taxes on Distributions | | –4.02% | | 1.55% |
Return After Taxes on Distributions & Sale of Fund Shares | | –1.88% | | 1.76% |
Class Y—Return Before Taxes | | 1.92% | | 4.69% |
Return After Taxes on Distributions | | 0.64% | | 2.90% |
Return After Taxes on Distributions & Sale of Fund Shares | | 1.24% | | 2.95% |
Lehman Brothers Aggregate
Bond Index** | | 2.43% | | 5.24% |
| * | The inception date for the fund’s Class A shares is December 13, 2004. The fund’s Class A shares have no operating history or performance information of their own prior to that date. The performance shown for the fund’s Class A shares for periods prior to that date is the performance of the fund’s Class P shares adjusted to reflect the fees and expenses of the fund’s Class A shares. The inception date for the fund’s Class B, Class C, Class P and Class Y shares is December 31, 2001. |
| ** | Index returns do not reflect any deductions for expenses, brokerage commissions, sales charges or taxes. For more information on this index, see the following section “Description of Benchmarks.” |
21
FUND FEES & EXPENSES
The following tables describe the fees and expenses that you may pay if you buy and hold shares of each fund.
Shareholder Fees
(fees paid directly from your investment)
| | | | | | | | | | | | | | |
| | | CLASS A | | | CLASS B | | | CLASS C | | | CLASS P | | | CLASS Y |
| Maximum sales charge (load)1 | | 4.75% | | | 5.00% | | | 1.00% | | | 5.50% | | | None |
Maximum sales charge (load) imposed on
purchases (as a percentage of offering price) | | 4.75% | 2 | | None | | | None | | | 5.50% | 2 | | None |
Maximum deferred sales charge (load)
(as a percentage of original purchase
price or redemption proceeds, whichever is lower) | | None | 3 | | 5.00% | 4 | | 1.00% | 5 | | None | 6 | | None |
Redemption fee (as a percentage of amount
redeemed, if applicable)7 | | 2.00% | | | 2.00% | | | 2.00% | | | 2.00% | | | 2.00% |
| 1 | This sales charge includes both the maximum sales charge imposed at the time of purchase and the maximum applicable deferred sales charge. |
| 2 | This sales charge varies depending upon how much you invest. See “Fund Services.” The maximum sales charge imposed on purchases of Class P shares of the AXA Enterprise Multimanager Core Bond Fund is 4.50% of the offering price. |
| 3 | If you buy $1,000,000 or more ($100,000 or more for certain employee benefit plans and $500,000 or more for certain individual retirement accounts) of Class A shares and redeem those shares within one year of the date of purchase, a contingent deferred sales charge of 1.00% generally will apply to the redemptions of those shares. See “Fund Services.” |
| 4 | This sales charge is imposed if you redeem Class B shares within one year of your purchase. A graduated reduced sales charge is imposed if you redeem your shares within six years of purchase. Class B shares automatically convert to Class A shares about eight years after the end of the calendar month in which you purchased them and will be subject to lower expenses. See “Fund Services.” |
| 5 | This sales charge is imposed if you redeem Class C shares within one year of your purchase. See “Fund Services.” |
| 6 | If you buy $1,000,000 or more of Class P shares and redeem those shares within one year of the date of purchase, a contingent deferred sales charge of 1.00% generally will apply to the redemptions on those shares. |
| 7 | If you redeem or exchange shares of a fund after holding them one month or less, a fee of 2.00% of the current net asset value of the shares being redeemed or exchanged generally will be assessed and retained by the fund for the benefit of the remaining shareholders. See “Purchase and Redemption Restrictions on Market-Timers and Active Traders.” |
22
FUND FEES & EXPENSES
Annual Fund Operating Expenses
(expenses that are deducted from fund assets, as a percentage of average daily net assets)
| | | | | | | | | | | | | | | | | | | | |
| | | AXA Enterprise Multimanager Growth Fund | | AXA Enterprise Multimanager Core Equity Fund |
| | | CLASS A | | CLASS B | | CLASS C | | CLASS P | | CLASS Y | | CLASS A* | | CLASS B | | CLASS C | | CLASS P | | CLASS Y |
| Management fee | | 1.00% | | 1.00% | | 1.00% | | 1.00% | | 1.00% | | 1.00% | | 1.00% | | 1.00% | | 1.00% | | 1.00% |
Distribution and/or service (12b-1) fees (including 0.25% service fee) | | 0.45% | | 1.00% | | 1.00% | | 0.25% | | 0.00% | | 0.45% | | 1.00% | | 1.00% | | 0.25% | | 0.00% |
| Other expenses | | 3.55% | | 3.55% | | 3.55% | | 3.55% | | 3.55% | | 3.12% | | 3.12% | | 3.12% | | 3.12% | | 3.12% |
| Total operating expenses | | 5.00% | | 5.55% | | 5.55% | | 4.80% | | 4.55% | | 4.57% | | 5.12% | | 5.12% | | 4.37% | | 4.12% |
| Waiver/expense reimbursement* | | (3.35)% | | (3.35)% | | (3.35)% | | (3.35)% | | (3.35)% | | (2.92)% | | (2.92)% | | (2.92)% | | (2.92)% | | (2.92)% |
| Net operating expenses** | | 1.65% | | 2.20% | | 2.20% | | 1.45% | | 1.20% | | 1.65% | | 2.20% | | 2.20% | | 1.45% | | 1.20% |
| | | AXA Enterprise Multimanager Value Fund | | AXA Enterprise Multimanager
Mid Cap Growth Fund |
| | | CLASS A | | CLASS B | | CLASS C | | CLASS P | | CLASS Y | | CLASS A* | | CLASS B | | CLASS C | | CLASS P | | CLASS Y |
| Management fee | | 1.00% | | 1.00% | | 1.00% | | 1.00% | | 1.00% | | 1.20% | | 1.20% | | 1.20% | | 1.20% | | 1.20% |
Distribution and/or service (12b-1) fees (including 0.25% service fee) | | 0.45% | | 1.00% | | 1.00% | | 0.25% | | 0.00% | | 0.45% | | 1.00% | | 1.00% | | 0.25% | | 0.00% |
| Other expenses | | 1.93% | | 1.93% | | 1.93% | | 1.93% | | 1.93% | | 3.15% | | 3.15% | | 3.15% | | 3.15% | | 3.15% |
| Total operating expenses | | 3.38% | | 3.93% | �� | 3.93% | | 3.18% | | 2.93% | | 4.80% | | 5.35% | | 5.35% | | 4.60% | | 4.35% |
| Waiver/expense reimbursement* | | (1.73)% | | (1.73)% | | (1.73)% | | (1.73)% | | (1.73)% | | (2.90)% | | (2.90)% | | (2.90)% | | (2.90)% | | (2.90)% |
| Net operating expenses** | | 1.65% | | 2.20% | | 2.20% | | 1.45% | | 1.20% | | 1.90% | | 2.45% | | 2.45% | | 1.70% | | 1.45% |
| | | AXA Enterprise Multimanager
Mid Cap Value Fund | | AXA Enterprise Multimanager
International Equity Fund |
| | | CLASS A | | CLASS B | | CLASS C | | CLASS P | | CLASS Y | | CLASS A* | | CLASS B | | CLASS C | | CLASS P | | CLASS Y |
| Management fee | | 1.20% | | 1.20% | | 1.20% | | 1.20% | | 1.20% | | 1.15% | | 1.15% | | 1.15% | | 1.15% | | 1.15% |
Distribution and/or service (12b-1) fees (including 0.25% service fee) | | 0.45% | | 1.00% | | 1.00% | | 0.25% | | 0.00% | | 0.45% | | 1.00% | | 1.00% | | 0.25% | | 0.00% |
| Other expenses | | 2.70% | | 2.70% | | 2.70% | | 2.70% | | 2.70% | | 2.10% | | 2.10% | | 2.10% | | 2.10% | | 2.10% |
| Total operating expenses | | 4.35% | | 4.90% | | 4.90% | | 4.15% | | 3.90% | | 3.70% | | 4.25% | | 4.25% | | 3.50% | | 3.25% |
| Waiver/expense reimbursement* | | (2.45)% | | (2.45)% | | (2.45)% | | (2.45)% | | (2.45)% | | (1.70)% | | (1.70)% | | (1.70)% | | (1.70)% | | (1.70)% |
| Net operating expenses** | | 1.90% | | 2.45% | | 2.45% | | 1.70% | | 1.45% | | 2.00% | | 2.55% | | 2.55% | | 1.80% | | 1.55% |
| | | AXA Enterprise Multimanager Technology Fund | | AXA Enterprise Multimanager Health Care Fund |
| | | CLASS A | | CLASS B | | CLASS C | | CLASS P | | CLASS Y | | CLASS A* | | CLASS B | | CLASS C | | CLASS P | | CLASS Y |
| Management fee | | 1.30% | | 1.30% | | 1.30% | | 1.30% | | 1.30% | | 1.30% | | 1.30% | | 1.30% | | 1.30% | | 1.30% |
Distribution and/or service (12b-1) fees (including 0.25% service fee) | | 0.45% | | 1.00% | | 1.00% | | 0.25% | | 0.00% | | 0.45% | | 1.00% | | 1.00% | | 0.25% | | 0.00% |
| Other expenses | | 2.68% | | 2.68% | | 2.68% | | 2.68% | | 2.68% | | 4.32% | | 4.32% | | 4.32% | | 4.32% | | 4.32% |
| Total operating expenses | | 4.43% | | 4.98% | | 4.98% | | 4.23% | | 3.98% | | 6.07% | | 6.62% | | 6.62% | | 5.87% | | 5.62% |
| Waiver/expense reimbursement* | | (2.28)% | | (2.28)% | | (2.28)% | | (2.28)% | | (2.28)% | | (3.92)% | | (3.92)% | | (3.92)% | | (3.92)% | | (3.92)% |
| Net operating expenses** | | 2.15% | | 2.70% | | 2.70% | | 1.95% | | 1.70% | | 2.15% | | 2.70% | | 2.70% | | 1.95% | | 1.70% |
| | | AXA Enterprise Multimanager Core Bond Fund | | |
| | | CLASS A | | CLASS B | | CLASS C | | CLASS P | | CLASS Y | | | | | | | | | | |
| Management fee | | 0.70% | | 0.70% | | 0.70% | | 0.70% | | 0.70% | | | | | | | | | | |
Distribution and/or service (12b-1) fees (including 0.25% service fee) | | 0.45% | | 1.00% | | 1.00% | | 0.25% | | 0.00% | | | | | | | | | | |
| Other expenses | | 1.22% | | 1.22% | | 1.22% | | 1.22% | | 1.22% | | | | | | | | | | |
| Total operating expenses | | 2.37% | | 2.92% | | 2.92% | | 2.17% | | 1.92% | | | | | | | | | | |
| Waiver/expense reimbursement* | | (1.12)% | | (1.12)% | | (1.12)% | | (1.12)% | | (1.12)% | | | | | | | | | | |
| Net operating expenses | | 1.25% | | 1.80% | | 1.80% | | 1.05% | | 0.80% | | | | | | | | | | |
| * | Pursuant to a contract, the Manager has agreed to make payments or waive its management, administrative or other fees to limit the expenses of each fund through February 28, 2007 (unless the board of trustees consents to an earlier revision or termination of this arrangement) (“Expense Limitation Agreement”) so that the Total Operating Expenses of the fund (exclusive of taxes, interest, brokerage commissions, capitalized expenses and extraordinary expenses) do not exceed the amount shown above under Net Operating Expenses. The Manager may be reimbursed the amount of any such payments and waivers in the future provided that the payments or waivers are reimbursed within 3 years of the payment or waiver being made and the combination of the fund’s expense ratio and such reimbursements do not exceed the fund’s expense cap. The Manager may discontinue these arrangements at any time after February 28, 2007. For more information on the Expense Limitation Agreement, see “Management Team — The Manager and the Sub-advisers — Expense Limitation Agreement”. |
| ** | A portion of the brokerage commissions that the fund pays is used to reduce the fund’s expenses. Including this reduction, the Net Operating Expenses for each of the fund’s Class A, Class B, Class C, Class P and Class Y shares for the fiscal year ended October 31, 2005 were 1.63%, 2.18%, 2.18%, 1.43% and 1.18% for Growth Fund, 1.61%, 2.16%, 2.16%, 1.41% and 1.16% for Core Equity Fund, 1.56%, 2.11%, 2.11%, 1.36% and 1.11% for Value Fund, 1.86%, 2.41%, 2.41%, 1.66% and 1.41% for Mid Cap Growth Fund, 1.88%, 2.43%, 2.43%, 1.68% and 1.43% for Mid Cap Value Fund, 2.06%, 2.61%, 2.61%, 1.86% and 1.61% for International Equity Fund, 1.40%, 1.95%, 1.95%, 1.20% and 0.95% for Technology Fund, 2.12%, 2.67%, 2.67%, 1.92% and 1.67% for Health Care Fund and 2.37%, 2.92%, 2.92%, 2.17% and 1.92% for Core Bond Fund. |
23
FUND FEES & EXPENSES
Example
This example is intended to help you compare the direct and indirect cost of investing in each fund with the cost of investing in other mutual funds.
The example assumes that:
| • | | You invest $10,000 in the fund for the time periods indicated; |
| • | | Your investment has a 5% return each year; |
| • | | The fund’s operating expenses remain the same; and |
| • | | The expense limitation currently in place is not renewed. |
This example should not be considered a representation of past or future expenses of the funds. Actual expenses may be higher or lower than those shown. Similarly, the annual rate of return assumed in the example is not an estimate or guarantee of future investment performance. Based on these assumptions, your costs would be:
| | | | | | | | | | | | | | | | | | | | | | | | | | | | | | | | | | | | | | | | | | |
| | | AXA Multimanager Growth Fund | | AXA Enterprise Multimanager Core Equity Fund |
| | | CLASS A | | CLASS B | | CLASS C | | CLASS P | | CLASS Y | | CLASS A | | CLASS B | | CLASS C | | CLASS P | | CLASS Y |
| | | (1) | | (2) | | (1) | | (2) | | | | | (1) | | (2) | | (1) | | (2) | | |
| 1 year | | $ | 635 | | $ | 723 | | $ | 223 | | $ | 323 | | $ | 223 | | $ | 689 | | $ | 122 | | $ | 635 | | $ | 723 | | $ | 223 | | $ | 323 | | $ | 223 | | $ | 689 | | $ | 122 |
| 3 years | | $ | 1619 | | $ | 1758 | | $ | 1358 | | $ | 1358 | | $ | 1358 | | $ | 1631 | | $ | 1071 | | $ | 1538 | | $ | 1674 | | $ | 1274 | | $ | 1274 | | $ | 1274 | | $ | 1550 | | $ | 985 |
| 5 years | | $ | 2604 | | $ | 2680 | | $ | 2480 | | $ | 2480 | | $ | 2480 | | $ | 2576 | | $ | 2029 | | $ | 2450 | | $ | 2523 | | $ | 2323 | | $ | 2323 | | $ | 2323 | | $ | 2422 | | $ | 1863 |
| 10 years | | $ | 5065 | | $ | 5130 | | $ | 5130 | | $ | 5233 | | $ | 5233 | | $ | 4955 | | $ | 4460 | | $ | 4763 | | $ | 4828 | | $ | 4828 | | $ | 4935 | | $ | 4935 | | $ | 4649 | | $ | 4127 |
| | | | | | | | | | | | | | | | | | | | | | | | | | | | | | | | | | | | | | | | | | | |
| | | AXA Enterprise Multimanager Value Fund | | AXA Enterprise Multimanager
Mid Cap Growth Fund |
| | | CLASS A | | CLASS B | | CLASS C | | CLASS P | | CLASS Y | | CLASS A | | CLASS B | | CLASS C | | CLASS P | | CLASS Y |
| | | | (1) | | (2) | | (1) | | (2) | | | | | (1) | | (2) | | (1) | | (2) | | |
| 1 year | | $ | 635 | | $ | 723 | | $ | 223 | | $ | 323 | | $ | 223 | | $ | 689 | | $ | 122 | | $ | 659 | | $ | 748 | | $ | 248 | | $ | 348 | | $ | 248 | | $ | 713 | | $ | 148 |
| 3 years | | $ | 1311 | | $ | 1440 | | $ | 1040 | | $ | 1040 | | $ | 1040 | | $ | 1323 | | $ | 743 | | $ | 1603 | | $ | 1742 | | $ | 1342 | | $ | 1342 | | $ | 1342 | | $ | 1615 | | $ | 1054 |
| 5 years | | $ | 2009 | | $ | 2074 | | $ | 1874 | | $ | 1874 | | $ | 1874 | | $ | 1980 | | $ | 1390 | | $ | 2552 | | $ | 2627 | | $ | 2427 | | $ | 2427 | | $ | 2427 | | $ | 2524 | | $ | 1973 |
| 10 years | | $ | 3857 | | $ | 3920 | | $ | 3920 | | $ | 4039 | | $ | 4039 | | $ | 3730 | | $ | 3128 | | $ | 4940 | | $ | 5004 | | $ | 5004 | | $ | 5109 | | $ | 5109 | | $ | 4828 | | $ | 4322 |
| | | | | | | | | | | | | | | | | | | | | | | | | | | | | | | | | | | | | | | | | | | |
| | | AXA Enterprise Multimanager
Mid Cap Value Fund | | AXA Enterprise Multimanager
International Equity Fund |
| | | CLASS A | | CLASS B | | CLASS C | | CLASS P | | CLASS Y | | CLASS A | | CLASS B | | CLASS C | | CLASS P | | CLASS Y |
| | | (1) | | (2) | | (1) | | (2) | | | | | (1) | | (2) | | (1) | | (2) | | |
| 1 year | | $ | 659 | | $ | 748 | | $ | 248 | | $ | 348 | | $ | 248 | | $ | 713 | | $ | 148 | | $ | 668 | | $ | 758 | | $ | 258 | | $ | 358 | | $ | 258 | | $ | 732 | | $ | 158 |
| 3 years | | $ | 1519 | | $ | 1654 | | $ | 1254 | | $ | 1254 | | $ | 1254 | | $ | 1530 | | $ | 964 | | $ | 1404 | | $ | 1535 | | $ | 1135 | | $ | 1135 | | $ | 1135 | | $ | 1425 | | $ | 842 |
| 5 years | | $ | 2390 | | $ | 2462 | | $ | 2262 | | $ | 2262 | | $ | 2262 | | $ | 2362 | | $ | 1799 | | $ | 2159 | | $ | 2226 | | $ | 2026 | | $ | 2026 | | $ | 2026 | | $ | 2138 | | $ | 1550 |
| 10 years | | $ | 4618 | | $ | 4682 | | $ | 4682 | | $ | 4791 | | $ | 4791 | | $ | 4502 | | $ | 3967 | | $ | 4133 | | $ | 4196 | | $ | 4196 | | $ | 4312 | | $ | 4312 | | $ | 4017 | | $ | 3433 |
| | | | | | | | | | | | | | | | | | | | | | | | | | | | | | | | | | | | | | | | | | | |
| | | AXA Enterprise Multimanager Technology Fund | | AXA Enterprise Multimanager Health Care Fund |
| | | CLASS A | | CLASS B | | CLASS C | | CLASS P | | CLASS Y | | CLASS A | | CLASS B | | CLASS C | | CLASS P | | CLASS Y |
| | | (1) | | (2) | | (1) | | (2) | | | | | (1) | | (2) | | (1) | | (2) | | |
| 1 year | | $ | 683 | | $ | 773 | | $ | 273 | | $ | 373 | | $ | 273 | | $ | 737 | | $ | 173 | | $ | 683 | | $ | 773 | | $ | 273 | | $ | 373 | | $ | 273 | | $ | 737 | | $ | 173 |
| 3 years | | $ | 1556 | | $ | 1692 | | $ | 1292 | | $ | 1292 | | $ | 1292 | | $ | 1567 | | $ | 1003 | | $ | 1859 | | $ | 2006 | | $ | 1606 | | $ | 1606 | | $ | 1606 | | $ | 1870 | | $ | 1327 |
| 5 years | | $ | 2439 | | $ | 2512 | | $ | 2312 | | $ | 2312 | | $ | 2312 | | $ | 2410 | | $ | 1851 | | $ | 3011 | | $ | 3095 | | $ | 2895 | | $ | 2895 | | $ | 2895 | | $ | 2984 | | $ | 2466 |
| 10 years | | $ | 4690 | | $ | 4755 | | $ | 4755 | | $ | 4862 | | $ | 4862 | | $ | 4575 | | $ | 4047 | | $ | 5784 | | $ | 5849 | | $ | 5849 | | $ | 5941 | | $ | 5941 | | $ | 5685 | | $ | 5254 |
| | | | | | | | | | | | | | | | | | | | | | | | | | | | | | | | | | | | | | | | | | | |
| | | AXA Enterprise Multimanager Core Bond | | |
| | | CLASS A | | CLASS B | | CLASS C | | CLASS P | | CLASS Y | | | | | | | | | | |
| | | | (1) | | (2) | | (1) | | (2) | | | | | | | | | | | | | | | | |
| 1 year | | $ | 596 | | $ | 683 | | $ | 183 | | $ | 283 | | $ | 183 | | $ | 552 | | $ | 82 | | | | | | | | | | | | | | | | | | | | | |
| 3 years | | $ | 1077 | | $ | 1198 | | $ | 798 | | $ | 798 | | $ | 798 | | $ | 995 | | $ | 494 | | | | | | | | | | | | | | | | | | | | | |
| 5 years | | $ | 1584 | | $ | 1639 | | $ | 1439 | | $ | 1439 | | $ | 1439 | | $ | 1464 | | $ | 933 | | | | | | | | | | | | | | | | | | | | | |
| 10 years | | $ | 2971 | | $ | 3032 | | $ | 3032 | | $ | 3163 | | $ | 3163 | | $ | 2756 | | $ | 2152 | | | | | | | | | | | | | | | | | | | | | |
| (1) | Assumes redemption at end of period. |
| (2) | Assumes no redemption at end of period. |
24
MORE ABOUT INVESTMENT STRATEGIES & RISKS
Additional Risks
The funds have principal investment strategies that come with inherent risks. Each fund’s principal risks are described in its principal risks section. The following is a list of additional risks to which each fund may be subject by investing in various types of securities or engaging in various practices. Unless otherwise indicated, each risk applies to all the funds.
Credit Quality Risk. The actual or perceived reduction in the creditworthiness of debt issuers generally will have adverse effects on the values of their debt securities. It is possible that the issuer of a security will not be able to make interest and principal payments when due. Discontinuation of these payments could substantially adversely affect the price of the bond. Lower rated bonds involve greater risks of default or downgrade and are more volatile than investment-grade securities. Lower rated bonds involve a greater risk of price declines than investment-grade securities due to actual or perceived changes to an issuer’s creditworthiness. In addition, issuers of lower rated bonds may be more susceptible than other issuers to economic downturns. Lower rated bonds are especially subject to the risk that the issuer may not be able to pay interest and ultimately repay principal upon maturity.
Currency Risk. The risk that fluctuations in the exchange rates between the U.S. dollar and foreign currencies may negatively affect an investment. A change in the value of any such currency against the U.S. dollar will result in a change in the U.S. dollar value of a fund’s asset and income.
Derivatives Risk. Derivatives are financial contracts whose value is based on the value of an underlying asset, reference rate or index. A fund’s investment in derivatives may rise or fall more rapidly than other investments. These transactions are subject to changes in the underlying security on which such transactions are based. Even a small investment in derivative securities can have a significant impact on a fund’s exposure to stock market values, interest rates or currency exchange rates. Derivatives are subject to a number of risks such as liquidity risk, interest rate risk, market risk, credit risk and portfolio management risk depending on the type of underlying asset, reference rate or index. They also involve the risk of mispricing or improper valuation and the risk that changes in the value of a derivative may not correlate well with the underlying asset, rate or index. These types of transactions will be used primarily as a substitute for taking a position in the underlying asset and/or for hedging purposes. When a derivative security is used as a hedge against an offsetting position that a fund also holds, any loss generated by the derivative security should be substantially offset by gains on the hedged instrument, and vice versa. To the extent that a fund uses a derivative security for purposes other than as a hedge, that fund is directly exposed to the risks of that derivative security and any loss generated by the derivative security will not be offset by a gain.
Foreign Investing and Emerging Markets Risks. The value of a fund’s investments in foreign securities may fall due to adverse political, social and economic developments abroad and due to decreases in foreign currency values relative to the U.S. dollar. Foreign markets also may be less liquid and more volatile than U.S. markets. These risks are greater generally for investments in emerging market issuers than for issuers in more developed countries.
Illiquid and Restricted Securities Risk. Illiquid securities are securities that a fund cannot sell on an open market. This means that a fund might not be able to sell an illiquid security when it desires and that it might be difficult to value such a security. Restricted securities are securities that are subject to contractual restrictions on resale. Such a restriction could limit a security’s liquidity.
Initial Public Offering (“IPO”) Risk. A fund that purchases securities issued in an IPO is subject to the risk that the value of the securities may rise or fall more rapidly than other investments. Prior to an IPO, there is generally no public market for an issuer’s common stock. There can be no assurance that an active trading market will develop or be sustained following the IPO, therefore, the market price for the securities may be subject to significant fluctuations and a fund may be affected by such fluctuations. In addition, securities issued in an IPO are often issued by a company that may be in the early stages of development with a history of little or no revenues and such company may operate at a loss following the offering. A fund’s ability to obtain shares of an IPO security may be substantially limited in the event of high demand for the securities and there is no guarantee that the fund will receive an allocation of shares. To the extent a fund invests in IPOs, a significant portion of its returns may be attributable to its investments in IPOs, which have a magnified impact on funds with small asset bases. There is no guarantee that as those funds’ assets grow they will continue to experience substantially similar performance by investing in IPOs.
Information Risk. The risk that key information about a security is inaccurate or unavailable.
Interest Rate Risk. When interest rates decline, the value of a fund’s debt securities generally rises. Conversely, when interest
25
MORE ABOUT INVESTMENT STRATEGIES & RISKS (cont’d)
rates rise, the value of a fund’s debt securities generally declines. The magnitude of the decline will often be greater for longer-term debt securities than shorter-term debt securities.
Lending Risk. Each fund may lend portfolio securities with a value of up to 33 1/3% of a fund’s total assets, including collateral received for securities lent. If a fund lends securities, there is a risk that the securities will not be available to the fund on a timely basis, and the fund, therefore, may lose the opportunity to sell the securities at a desirable price. In addition, as with other extensions of secured credit, there is the risk of possible delay in receiving additional collateral or in the recovery of the securities or possible loss of rights in the collateral should the borrower fail financially.
Leverage Risk. The risk associated with securities or practices (e.g. borrowing) that multiply small price movements into large changes in value.
Liquidity Risk. The risk that certain securities may be difficult or impossible to sell at the time and the price that the seller would like. This may result in a loss or may be costly to a fund.
Lower-Rated Securities Risk. Lower rated bonds are especially subject to the risk that the issuer may not be able to pay interest and ultimately to repay principal upon maturity. Bonds rated below investment grade (i.e., BB or lower by S&P or Ba or lower by Moody’s) are speculative in nature, involve greater risk of default by the issuing entity and may be subject to greater market fluctuations than higher rated fixed income securities. They are usually issued by companies without long track records of sales and earnings, or by those companies with questionable credit strength and tend to be more greatly affected by economic downturn than issuers of higher grade securities. The retail secondary market for these “junk bonds” may be less liquid than that of higher rated securities and adverse conditions could make it difficult at times to sell certain securities or could result in lower prices than those used in calculating the portfolio’s net asset value. A fund investing in “junk bonds” may also be subject to greater credit risk because it may invest in debt securities issued in connection with corporate restructuring by highly leveraged issuers or in debt securities not current in the payment of interest or principal or in default. Only the Health Care Fund, Technology Fund and Core Bond Fund currently are permitted to invest more than 5% of their assets in lower rated bonds.
Market Risk. The risk that the value of a security may move up and down, sometimes rapidly and unpredictably based upon overall economic conditions and other factors.
Multiple Sub-Adviser Risk. Each of the funds employs multiple sub-advisers. Each sub-adviser independently chooses and maintains a portfolio of securities for the fund and each is responsible for investing a specific allocated portion of the fund’s assets. Because each sub-adviser will be managing its allocated portion of the fund independently from the other sub-adviser(s), the same security may be held in different portions of a fund, or may be acquired for one portion of a fund at a time when a sub-adviser to another portion deems it appropriate to dispose of the security from that other portion. Similarly, under some market conditions, one sub-adviser may believe that temporary, defensive investments in short-term instruments or cash are appropriate when the other sub-adviser(s) believes continued exposure to the equity or debt markets is appropriate for its allocated portion of the fund. Because each sub-adviser directs the trading for its own portion of the fund, and does not aggregate its transactions with those of the other sub-advisers, the fund may incur higher brokerage costs than would be the case if a single sub-adviser were managing the entire fund.
Opportunity Risk. The risk of missing out on an investment opportunity because the assets necessary to take advantage of it are tied up in less profitable investments.
Political Risk. The risk of losses directly attributable to government or political actions.
Portfolio Turnover Risk. High portfolio turnover may result in increased transaction costs to a fund, which may result in higher fund expenses and lower total returns. The sale of fund securities may result in the recognition of capital gain, which can create adverse tax results for shareholders when distributed to them, or loss. Depending on the frequency of sales, any such net gain may be short-term capital gain. Unlike long-term capital gain, short-term capital gain is taxable to individuals at the same rates as ordinary income.
Securities Risk. The risk that the value of a security may move up and down, sometimes rapidly and unpredictably based upon changes in a company’s financial condition as well as overall market and economic conditions.
Special Situations Risk. The Core Equity Fund and International Equity Fund may use aggressive investment techniques, including seeking to benefit from “special situations,” such as mergers, reorganizations or other unusual events expected to affect a particular issuer. There is a risk that the “special situation” might not occur, which could have a negative impact on the price of the issuer’s securities and fail to produce the expected gains or produce a loss for the fund.
Repurchase Agreements Risk. A fund may enter into repurchase agreements under which it purchases a security that a seller has agreed to repurchase from the fund at a later date at the same price plus interest. If a seller defaults and the security declines in value, the fund might incur a loss. If the seller declares bankruptcy, a fund may not be able to sell the security at the desired time.
26
MORE ABOUT INVESTMENT STRATEGIES & RISKS (cont’d)
Short Sale Risk. A “short sale” is the sale by a fund of a security which has been borrowed from a third party on the expectation that the market price will drop. If the price of the security rises, the fund may have to cover short positions at a higher price than the short sale price, resulting in a loss.
Unseasoned Companies Risk. The Mid Cap Growth Fund, Mid Cap Value Fund, International Equity Fund, Technology Fund and Health Care Fund can invest in small unseasoned companies. These are companies that have been in operation less than three years, including operation of any predecessors. These securities may have limited liquidity and their prices may be very volatile.
Valuation Risk. The risk that a fund has valued certain securities at a higher price than it can sell them for.
Additional Investment Strategies
The following is a list of additional investment strategies. Unless otherwise indicated, each investment strategy applies to all the funds. For further information about investment strategies, see the funds’ Statement of Additional Information (“SAI”).
Derivatives. The funds can use “derivative” instruments to seek enhanced returns or to try to hedge investment risks, although it is not anticipated that they will do so to a significant degree. In general terms, a derivative instrument is an investment contract whose value depends on (or is derived from) the value of an underlying asset, reference rate or index. Options, futures contracts and forward contracts are examples of “derivatives.”
Foreign Investing. The funds may invest in foreign securities, including depositary receipts of foreign based companies, including companies based in developing countries.
Initial Public Offerings (“IPOs”). Each of the funds that may invest in equity securities may participate in the IPO market, and a significant portion of those funds’ returns may be attributable to their investment in IPOs, which have a magnified impact on funds with small asset bases. There is no guarantee that as those funds’ assets grow they will continue to experience substantially similar performance by investing in IPOs.
Portfolio Turnover. The funds do not restrict the frequency of trading to limit expenses or to minimize the tax effect that a fund’s distributions may have on shareholders. The funds may engage in active and frequent trading of portfolio securities to achieve their principal investment strategies. Frequent trading can result in a portfolio turnover in excess of 100% (high portfolio turnover).
Securities Lending. For purposes of realizing additional income, a fund may lend its portfolio securities with a value of up to 33 1/3% of the fund’s total assets (including collateral received for securities lent) to broker-dealers approved by the Trust’s board of trustees. Generally, any such loan of portfolio securities will be continuously secured by collateral at least equal to the value of the security loaned. Such collateral will be in the form of cash, marketable securities issued or guaranteed by the U.S. Government or its agencies, or a standby letter of credit issued by qualified banks. Loans will only be made to firms deemed by the Manager to be of good standing and will not be made unless, in the judgment of the sub-adviser, the consideration to be earned from such loans would justify the risk.
Short Sales. The funds may engage in short sales. A “short sale” is the sale by a fund of a security that has been borrowed from a third party on the expectation that the market price will drop. If the price of the security drops, the fund will make a profit by purchasing the security in the open market at a lower price than at which it sold the security. If the price of the security rises, the fund may have to cover short positions at a higher price than the short sale price, resulting in a loss. The funds generally will only engage in covered short sales. In a covered short sale, a fund either (1) borrows and sells securities it already owns (also known as a short sale “against the box”), or (2) deposits in a segregated account cash, U.S. government securities, or other liquid securities in an amount equal to the market value of the securities sold short.
27
MANAGEMENT TEAM
The Manager and the Sub-advisers
The Manager
AXA Equitable, through its AXA Funds Management Group unit, 1290 Avenue of the Americas, New York, New York 10104, serves as the manager of each fund. AXA Equitable is an investment adviser registered under the Investment Advisers Act of 1940, as amended, and a wholly owned subsidiary of AXA Financial, Inc., a subsidiary of AXA, a French insurance holding company.
As manager, AXA Equitable has a variety of responsibilities for the general management and administration of the Trust and the funds, including the selection of sub-advisers. AXA Equitable plays an active role in monitoring each fund and sub-adviser and uses portfolio analytics systems to strengthen its evaluation of performance, style, risk levels, diversification and other criteria. AXA Equitable also monitors each sub-adviser’s portfolio management team to ensure that investment activities remain consistent with the funds’ investment style and objectives.
Beyond performance analysis, AXA Equitable monitors significant changes that may impact the sub-adviser’s overall business. AXA Equitable monitors continuity in the sub-adviser’s operations and changes in investment personnel and senior management. AXA Equitable also performs due diligence reviews with each sub-adviser no less frequently than annually.
In its capacity as manager, AXA Equitable obtains detailed, comprehensive information concerning fund and sub-adviser performance and fund operations that is used to oversee and monitor the sub-advisers and the fund operations. A team is responsible for conducting ongoing investment reviews with each sub-adviser and for developing the criteria by which fund performance is measured.
AXA Equitable selects sub-advisers from a pool of candidates, including its affiliates, to manage the funds. AXA Equitable may appoint, dismiss and replace sub-advisers and amend sub-advisory agreements subject to the approval of the Trust’s board of trustees. AXA Equitable also has discretion to allocate each fund’s assets among the fund’s sub-advisers. AXA Equitable recommends sub-advisers for each fund to the board of trustees based upon its continuing quantitative and qualitative evaluation of each sub-adviser’s skills in managing assets pursuant to specific investment styles and strategies. Unlike many other mutual funds, the funds are not associated with any one portfolio manager, and seek to benefit from different specialists selected from the investment management industry. Short-term investment performance, by itself, is not a significant factor in selecting or terminating a sub-adviser, and AXA Equitable does not expect to recommend frequent changes of sub-advisers.
AXA Equitable has received an exemptive order from the SEC to permit it and the board of trustees to appoint, dismiss and replace a fund’s sub-advisers and to amend the sub-advisory agreements between AXA Equitable and the sub-advisers without obtaining shareholder approval. Accordingly, AXA Equitable is able, subject to the approval of the board of trustees, to appoint, dismiss and replace sub-advisers and to amend sub-advisory agreements without obtaining shareholder approval. If a new sub-adviser is retained for a fund, shareholders would receive notice of such action. However, AXA Equitable may not enter into a sub-advisory agreement with an Affiliated Adviser unless the sub-advisory agreement with the Affiliated Adviser, including compensation, is also approved by the affected fund’s shareholders. Alliance Capital Management L.P. and AXA Rosenberg Investment Management LLC, two of the current sub-advisers, are affiliates of AXA Equitable.
The Sub-advisers
Each fund’s investments are selected by one or more sub-advisers, which act independently of one another. The following describes each fund’s sub-advisers, portfolio managers and each portfolio manager’s business experience. Information about the portfolio managers’ compensation, other accounts they manage and their ownership of securities of the funds is available in the Trust’s SAI.
A I M Capital Management, Inc. (“AIM”) serves as a sub-adviser to AXA Enterprise Multimanager Health Care Fund. AIM is an indirect wholly owned subsidiary of A I M Management Group Inc. (“AIM Management”). AIM Management is a wholly owned subsidiary of AMVESCAP PLC, one of the world’s largest investment services companies. As of December 31, 2005, AIM Management had approximately $128 billion in assets under management.
Alliance Capital Management L.P. (“Alliance Capital”) serves as a sub-adviser to AXA Enterprise Multimanager Growth Fund, AXA Enterprise Multimanager Value Fund and AXA Enterprise Multimanager Mid Cap Growth Fund. In addition, Alliance Capital, through its Bernstein Investment Research and Management unit (“Bernstein Unit”), serves as a sub-adviser to AXA Enterprise Multimanager Core Equity Fund and AXA Enterprise Multimanager International Equity Fund.
28
MANAGEMENT TEAM
The Manager and the Sub-advisers (cont’d)
Alliance Capital, a limited partnership, is a majority owned subsidiary of AXA Financial, Inc. As of December 31, 2005, Alliance Capital had approximately $879 billion in assets under management.
AXA Rosenberg Investment Management LLC (“AXA Rosenberg”) serves as a sub-adviser to AXA Enterprise Multimanager Mid Cap Value Fund. AXA Rosenberg is a wholly owned subsidiary of AXA Rosenberg Group LLC (“AXA Rosenberg Group”). AXA Investment Managers, S.A., a French société anonyme and investment arm of AXA, a French insurance holding company that includes AXA Equitable among its subsidiaries, holds a majority interest in AXA Rosenberg Group. As of December 31, 2005, AXA Rosenberg Group had approximately $84.3 billion in assets under management.
BlackRock Advisors, Inc. (“BAI”) serves as a sub-adviser to AXA Enterprise Multimanager Core Bond Fund. BAI is a wholly owned subsidiary of BlackRock, Inc., which is a majority owned indirect subsidiary of The PNC Financial Services Group, Inc., a publicly traded diversified financial services company. As of December 31, 2005, BAI had approximately $452 billion in assets under management.
Firsthand Capital Management, Inc. (“Firsthand”) serves as a sub-adviser to AXA Enterprise Multimanager Technology Fund. Kevin M. Landis is the controlling shareholder of Firsthand. As of December 31, 2005, Firsthand had approximately $1 billion in assets under management.
Franklin Advisers, Inc. (“Franklin”) serves as a sub-adviser to AXA Enterprise Multimanager Mid Cap Growth Fund. Franklin is a wholly owned subsidiary of Franklin Resources, Inc., which is a publicly traded, global investment management organization listed on the New York Stock Exchange. As of December 31, 2005, Franklin, together with its affiliates, had approximately $464 billion in assets under management.
Institutional Capital Corporation (“ICAP”) serves as a sub-adviser to AXA Enterprise Multimanager Value Fund. ICAP is an employee owned money management firm. Robert H. Lyon is the controlling shareholder of ICAP. As of December 31, 2005, ICAP had approximately $13 billion in assets under management.
Janus Capital Management LLC (“Janus”) serves as a sub-adviser to AXA Enterprise Multimanager Core Equity Fund. Janus is a direct subsidiary of Janus Capital Group Inc. (“JCG”), a publicly traded company with principal operations in financial asset management businesses. JCG owns approximately 95% of Janus, with the remaining 5% held by Janus Management Holdings Corporation. As of December 31, 2005, JCG had approximately $148.5 billion in assets under management.
J.P. Morgan Investment Management Inc. (“J.P. Morgan”) serves as a sub-adviser to AXA Enterprise Multimanager International Equity Fund. J.P. Morgan is an indirect wholly owned subsidiary of JPMorgan Chase & Co., a publicly held bank holding. As of December 31, 2005, J.P. Morgan had approximately $846.9 billion in assets under management.
Marsico Capital Management, LLC (“Marsico”) serves as a sub-adviser to AXA Enterprise Multimanager International Equity Fund. Marsico is an indirect wholly owned subsidiary of Bank of America Corporation. As of December 31, 2005, Marsico had approximately $63 billion in assets under management.
MFS Investment Management (“MFS”) serves as a sub-adviser to AXA Enterprise Multimanager Value Fund. MFS is a subsidiary of Sun Life of Canada (U.S.) Financial Services Holdings, Inc., which in turn is an indirect wholly owned subsidiary of Sun Life, Inc., a diversified financial services organization. As of December 31, 2005, MFS had approximately $162.5 billion in assets under management.
Pacific Investment Management Company LLC (“PIMCO”) serves as a sub-adviser to AXA Enterprise Multimanager Core Bond Fund. PIMCO, a Delaware limited liability company, is a majority owned subsidiary of Allianz Global Investors of America L.P., (“AGI LP”). Allianz Aktiengesellschaft (“Allianz AG”) is the indirect majority owner of AGI LP. Allianz AG is a European-based, multinational insurance and financial services holding company. As of December 31, 2005, PIMCO had approximately $594.1 billion in assets under management.
Provident Investment Counsel, Inc. (“Provident”) serves as a sub-adviser to AXA Enterprise Multimanager Mid Cap Growth Fund. Provident is a wholly owned subsidiary of Old Mutual Asset Managers (US) LLC. As of December 31, 2005, Provident had approximately $4.4 billion in assets under management.
RCM Capital Management LLC (“RCM”) serves as a sub-adviser to AXA Enterprise Multimanager Growth Fund, AXA Enterprise Multimanager Technology Fund and AXA Enterprise Multimanager Health Care Fund. RCM is an indirect wholly owned subsidiary of Allianz AG, a European-based, multinational insurance and financial services holding company. As of December 31, 2005, RCM had approximately $20 billion in assets under management.
TCW Investment Management Company (“TCW”) serves as a sub-adviser to AXA Enterprise Multimanager Growth Fund and AXA Enterprise Multimanager Mid Cap Value Fund.
29
MANAGEMENT TEAM
The Manager and the Sub-advisers (cont’d)
TCW is a wholly owned subsidiary of The TCW Group, Inc. Société Générale Asset Management, S.A. (“SGAM”) holds a majority interest in the TCW Group, Inc. SGAM is a wholly owned subsidiary of Société Générale, S.A., a publicly held financial firm headquartered in Paris, France. As of December 31, 2005, TCW had approximately $125 billion in assets under management or committed to management.
Thornburg Investment Management, Inc. (“Thornburg”) serves as a sub-adviser to AXA Enterprise Multimanager Core Equity Fund. Thornburg is an employee owned investment management firm. H. Garrett Thornburg, Jr. is the controlling shareholder of Thornburg. As of December 31, 2005, Thornburg had approximately $18.7 billion in assets under management.
Wellington Management Company, LLP (“Wellington Management”) serves as a sub-adviser to AXA Enterprise Multimanager Mid Cap Value Fund, AXA Enterprise Multimanager Health Care Fund and AXA Enterprise Multimanager Technology Fund. Wellington Management is a limited liability partnership whose sole business is investment management. Wellington Management is owned by 95 partners, all active within the firm. As of December 31, 2005, Wellington Management had approximately $521 billion in assets under management.
30
MANAGEMENT TEAM
The Manager and the Sub-advisers (cont’d)
| | | | |
| Fund | | Sub-Adviser(s) and Portfolio Manager(s) | | Business Experience |
| AXA Enterprise Multimanager Growth Fund | | Alliance Capital Management L.P. 1345 Avenue of the Americas New York, NY 10105 Portfolio Manager William D. Baird | | The management of and decisions for the fund are made by the US Disciplined Growth Team. The US Disciplined Growth Team relies heavily on the fundamental analysis and research of Alliance Capital’s large internal research staff. While all members work jointly to determine the investment strategy, including security selection, William D. Baird is primarily responsible for day-to-day management of the fund. Mr. Baird is a senior vice president and Portfolio Manager. He has had portfolio management responsibility for more than 5 years prior thereto. Mr. Baird joined Alliance Capital in 1994 as a quantitative analyst and became a member of the US Disciplined Growth Team in 1995. |
| | |
| | | RCM Capital Management LLC Four Embarcadero Center San Francisco, CA 94111 Portfolio Managers Scott T. Migliori Seth A. Reicher | | Scott T. Migliori, Director and Co-Chief Investment Officer, U.S. Large Cap Select Growth Equities and Seth A. Reicher, Managing Director and Co-Chief Investment Officer of RCM are primarily responsible for the day-to-day management of the portfolio. Mr. Migliori is a Senior Portfolio Manager on the U.S. Large Cap Equity Portfolio Management Team. He joined RCM in 2003 as a Director and Senior Portfolio Manager. Prior to joining RCM, Mr. Migliori was an equity research analyst, then Portfolio Manager and Analyst, and senior co-manager at Provident Investment Counsel, Inc. from 1995 to 2003. Mr. Reicher has been a Managing Director and Co-Chief Investment Officer of RCM since 2000. Mr. Reicher joined RCM as an Analyst in 1993. |
| | |
| | | TCW Investment Management Company 865 South Figueroa Street Suite 1800 Los Angeles, CA 90017 Portfolio Managers Craig C. Blum Stephen A. Burlingame | | Craig C. Blum, Managing Director, U.S. Equities and Stephen A. Burlingame, Managing Director, U.S. Equities of TCW are primarily responsible for the day-to-day management of the portfolio. Mr. Blum previously served as a Managing Director, U.S. Equities, TCW Concentrated Core Equities. In 2003 he served as a Senior Vice President, U.S. TCW Concentrated Core Equities and from 2001 to 2002 he was Vice President, U.S. Equities, Central Research Analyst. Mr. Blum joined TCW in 1999. Mr. Burlingame previously served as a Managing Director, U.S. Equities TCW Concentrated Core Equities and in 2003 he served as a Senior Vice President, U.S. Equities, TCW Concentrated Core Equities, from 2001 to 2002 he was Vice President, U.S. Equities, Central Research Analyst. Mr. Burlingame joined TCW in 2000. |
31
MANAGEMENT TEAM
The Manager and the Sub-advisers (cont’d)
| | | | |
| Fund | | Sub-Adviser(s) and Portfolio Manager(s) | | Business Experience |
| AXA Enterprise Multimanager Core Equity Fund | | Alliance Capital Management L.P. (Bernstein Investment Research and Management unit) 1345 Avenue of the Americas New York, NY 10105 Portfolio Management Team | | The management of and investment decisions for the fund are made by the US Value Investment Policy Group, comprised of Senior US Value Investment Team members. The US Value Investment Policy Group relies heavily on the fundamental analysis and research of Alliance Capital’s large internal research staff. No one person is principally responsible for making recommendations for the fund. The members of the US Value Investment Policy Group with the most significant responsibility for the day-to-day management of the fund are Marilyn Fedak, John Mahedy, Chris Marx and John Phillips. Ms. Fedak has been Chief Investment Officer - US Value Equities and Chairman of the US Value Equity Investment Policy Group since 1993. In 2003, she became head of the Bernstein value equities business. She serves on Alliance Capital’s Executive Committee, a group of senior professionals responsible for managing the firm, enacting key strategic initiatives and allocating resources. Ms. Fedak served on the board of directors of Sanford C. Bernstein & Co., Inc. from 1994 until the combination with Alliance Capital in 2000. Mr. Mahedy was named Co-Chief Investment Officer - US Value Equities in 2003. He continues to serve as Director of Research - US Value Equities, a position he has held since 2001. Mr. Marx is a senior portfolio manager and member of the US Value Equity Investment Policy Group. He joined Alliance Capital in 1997 as a research analyst and has covered a variety of industries both domestically and internationally, including chemicals, food, supermarkets, beverages and tobacco. He has had portfolio management responsibilities for the past five years. Mr. Phillips is a senior portfolio manager and member of the US Value Equity Investment Policy Group. He is also chairman of Bernstein’s Proxy Voting Committee. Mr. Phillips joined Bernstein in 1994 and has had portfolio management responsibilities since that time. |
| | |
| | | Janus Capital Management LLC 151 Detroit Street Denver, CO 80206 Portfolio Manager E. Marc Pinto | | E. Marc Pinto is primarily responsible for day-to-day management of the fund. Mr. Pinto manages institutional separate accounts in the Large Cap Growth discipline. Mr. Pinto has been a portfolio manager with Janus since 1994. |
| | |
| | | Thornburg Investment
Management, Inc. 119 East Marcy Street Santa Fe, NM 87501 Portfolio Managers Connor Browne, CFA William V. Fries, CFA Ed Maran, CFA | | Connor Browne, William V. Fries and Ed Maran are primarily responsible for day-to-day management of the fund. Connor Browne joined Thornburg in August 2001 as an Associate Portfolio Manager and has had portfolio management responsibilities since that time. Mr. Fries has been a Managing Director and Portfolio Manager of Thornburg since 1995. Ed Maran joined Thornburg in October 2002 as Associate Portfolio Manager and has had portfolio management responsibilities since that time. From February 2001 to May 2002 Mr. Maran was a Senior Analyst at USAA. |
32
MANAGEMENT TEAM
The Manager and the Sub-advisers (cont’d)
| | | | |
| Fund | | Sub-Adviser(s) and
Portfolio Manager(s) | | Business Experience |
| AXA Enterprise Multimanager Value Fund | | Alliance Capital Management L.P. 1345 Avenue of the Americas New York, NY 10105 Portfolio Manager Aryeh Glatter | | The management of and investment decisions for the fund are made by the Relative Value Investment Team. The Relative Value Investment Team relies heavily on the fundamental analysis and research of Alliance Capital’s large internal research staff. While all members of the team work jointly to determine the investment strategy, including security selection, Aryeh Glatter is primarily responsible for day-to-day management of the fund. Mr. Glatter is Vice President and US Relative Value Portfolio Manager. He has had portfolio management responsibility for more than 5 years prior thereto. Mr. Glatter joined Alliance Capital in 1993. |
| | |
| | | Institutional Capital Corporation 225 West Wacker Drive Suite 2400 Chicago, IL 60606 Portfolio Manager Robert H. Lyon | | Robert H. Lyon is primarily responsible for day-to-day management of the fund. Mr. Lyon has been President and Chief Investment Officer of ICAP since 1992. |
| | |
| | | MFS Investment Management 500 Boylston Street Boston, MA 02116 Portfolio Manager Steven R. Gorham | | Steven R. Gorham is primarily responsible for day-to-day management of the fund. Mr. Gorham is a portfolio manager with MFS and has been employed in the investment management area of MFS since 1992. |
33
MANAGEMENT TEAM
The Manager and the Sub-advisers (cont’d)
| | | | |
| Fund | | Sub-Adviser(s) and Portfolio Manager(s) | | Business Experience |
| AXA Enterprise Multimanager Mid Cap Growth Fund | | Alliance Capital Management L.P. 1345 Avenue of the Americas New York, NY 10105 Portfolio Managers Bruce K. Aronow N. Kumar Kirpalani Samantha S. Lau | | The management of and investment decisions for the fund are made by Alliance Capital’s US Small/SMID Cap Growth Investment Team, which is responsible for management of all of Alliance Capital’s US Small/SMID Cap Growth accounts. The US Small/SMID Cap Growth Investment Team relies heavily on the fundamental analysis and research of the US Small/SMID Cap Growth Team. In addition, the team draws upon the research of Alliance Capital’s industry analysts as well as other portfolio management teams. The four members of the US Small/SMID Cap Growth Investment Team with the most significant responsibility for the day-to-day management of the fund are Bruce K. Aronow, N. Kumar Kirpalani and Samantha S. Lau. Mr. Aronow, Senior Vice President, Portfolio Manager/Research Analyst, serves as team leader for the Small/SMID Cap Growth product and is also responsible for research and portfolio management for the Small/SMID Cap Growth consumer/commercial sectors. Mr. Aronow joined Alliance Capital in 1999 and has had portfolio management responsibilities since that time. Mr. Kirpalani joined Alliance Capital as an Investment Professional in 1999 and is responsible for research and portfolio management for the Small Cap/SMID Growth industrials sector. Ms. Lau joined Alliance Capital as an Investment Professional in 1999 and is responsible for research and portfolio management for the Small Cap/SMID Growth technology sector. |
| | |
| | | Franklin Advisers, Inc. One Franklin Parkway San Mateo, CA 94403 Portfolio Management Team | | Edward B. Jamieson, Executive Vice President, Chief Investment Officer-Franklin Equity Group and Portfolio Manager, and Michael McCarthy, Senior Vice President, Director of Research and Portfolio Manager are primarily responsible for the day-to-day management of the fund. Members of the team work jointly to determine investment strategy and security selection for the fund. Mr. Jamieson has had portfolio management responsibilities with Franklin and its predecessor since 1987. Mr. McCarthy joined Franklin in 1992 and has had portfolio management responsibilities since that time. |
| | |
| | | Provident Investment
Counsel, Inc. 300 North Lake Avenue Pasadena, CA 91101 Portfolio Management Team | | Richard S. Campagna, James M. Landreth, Evelyn D. Lapham and John J. Yoon are primarily responsible for the day-to-day management of the fund. Members of the team work jointly to determine investment strategy and security selection for the fund. Mr. Campagna, a Senior Vice President, Portfolio Manager and Analyst, joined Provident in 2005 as an investment professional. From 2001 to 2005 Mr. Campagna was a Portfolio Manager, Managing Director and Head of Research at Shaker Investments, LLC. Mr. Landreth, a Senior Vice President, Portfolio Manager and Analyst, joined Provident in 1993 as an investment professional. Ms. Lapham, a Managing Director, Co-Lead Portfolio Manager and Analyst joined Provident in 1997 as an investment professional. Mr. Yoon, a Senior Vice President, Co-Lead Portfolio Manager and Analyst joined Provident in 1995 as an investment professional. |
34
MANAGEMENT TEAM
The Manager and the Sub-advisers (cont’d)
| | | | |
| Fund | | Sub-Adviser(s) and Portfolio Manager(s) | | Business Experience |
| AXA Enterprise Multimanager Mid Cap Value Fund | | AXA Rosenberg Investment Management LLC 4 Orinda Way Building E Orinda, CA 94563 Portfolio Engineer William E. Ricks | | Investment decisions arise from AXA Rosenberg’s automatic expert system processing which combines proprietary software programs and comprehensive databases to replicate the decisions financial experts might make in a perfect world. A team of personnel employed by AXA Rosenberg is jointly responsible for monitoring the recommendations for all accounts that are generated by the investment model and for the day-to-day operations of the accounts. Dr. Ricks is primarily responsible for the day-to-day management of the fund and is the Chief Executive Officer and Chief Investment Officer of AXA Rosenberg. Dr. Ricks has held these positions since 1998. He joined AXA Rosenberg’s predecessor in 1989. He is responsible for overseeing the implementation of AXA Rosenberg’s investment strategies, which are primarily driven by stock selection and portfolio construction models. To that end, he has overall responsibility for the various aspects of AXA Rosenberg’s investment process, including trading, operations, portfolio engineering, and portfolio construction. |
| | |
| | | TCW Investment Management Company 865 South Figueroa Street Suite 1800 Los Angeles, CA 90017 Portfolio Managers Nicholas F. Galluccio Susan I. Suvall | | Nicholas F. Galluccio and Susan I. Suvall are primarily responsible for the day-to-day management of the fund. Mr. Galluccio has been a Group Managing Director of TCW since 1997 and joined TCW in 1982. Ms. Suvall has been a Managing Director of TCW since 1998 and joined TCW in 1985. |
| | |
| | | Wellington Management
Company, LLP 75 State Street Boston, MA 02109 Portfolio Manager James N. Mordy | | James N. Mordy is primarily responsible for day-to-day management of the fund. Mr. Mordy, a Senior Vice President of Wellington Management, has served as Portfolio Manager of the fund since 2002. Mr. Mordy joined Wellington Management in 1985 as an investment professional. |
35
MANAGEMENT TEAM
The Manager and the Sub-advisers (cont’d)
| | | | |
| Fund | | Sub-Adviser(s) and Portfolio Manager(s) | | Business Experience |
| AXA Enterprise Multimanager International Equity Fund | | Alliance Capital Management, L.P. (Bernstein Investment Research and Management unit) 1345 Avenue of the Americas New York, NY 10105 Portfolio Management Team | | The management of and investment decisions for the fund are made by the Global Value Investment Policy Group, comprised of senior Global Value Investment Team members. The Global Value Investment Policy Group relies heavily on the fundamental analysis and research of the Adviser’s large internal research staff. No one person is principally responsible for making recommendations for the fund. The four members of the portfolio management team are: Sharon Fay, Kevin Simms, Giulio Martini and Henry D’Auria. Ms. Fay was appointed CIO-Global Value equities in 2003, assuming oversight for all portfolio-management and research activities relating to cross-border and non-US value investment portfolios. In addition to her role as CIO of Global Value Equities and Chairman of the Global Investment Policy Group, Ms. Fay serves as Co-CIO-European and UK Value equities; previously the CIO for both services from 1999 to 2004. She also serves on the firm’s Executive Committee, the group of senior professionals responsible for managing the firm, enacting key strategic initiatives and allocating resources. Ms. Fay joined Bernstein in 1990 as a research analyst. Mr. Simms was named Co-CIO-International Value equities in 2003, which he has assumed in addition to his role as director of research-Global and International Value equities, a position he has held since 2000. He joined Bernstein in 1992. Mr. Martini was appointed to head the newly created quantitative strategies team within the value-equities unit. Mr. Martini was named chief international economist with responsibility for currency strategies and senior portfolio manager on the international and global value equities team in 1992. Mr. Martini joined Bernstein in 1985. Mr. D’Auria was named Co-CIO of International Value equities in 2003, adding to his responsibilities as CIO-Emerging Markets Value equities, which he assumed in 2002. Mr. D’Auria was one of the chief architects of Bernstein’s global research department, which he managed from 1998 through 2002. Mr. D’Auria joined the firm in 1991. |
| | |
| | | J.P. Morgan Investment Management Inc. 522 Fifth Avenue New York, NY 10036 Portfolio Management Team | | Howard Williams and James Fisher are primarily responsible for the day-to-day management of the fund. Mr. Williams joined J.P. Morgan as a portfolio manager in 1994 and has had portfolio management responsibilities since that time. He is currently a Managing Director and the head of J.P. Morgan’s Global Portfolios Group. Mr. Fisher joined J.P. Morgan in 1985 as a trainee portfolio manager and has had portfolio management responsibilities since that time. He is currently a Managing Director and Portfolio Manager in J.P. Morgan’s Global Portfolios Group. |
| | |
| | | Marsico Capital Management, LLC 1200 17th Street Suite 1600 Denver, CO 80202 Portfolio Manager James G. Gendelman | | James G. Gendelman is primarily responsible for day-to-day management of the fund. Mr. Gendelman has been associated with Marsico as a Portfolio Manager and Senior Analyst since 2000. |
36
MANAGEMENT TEAM
The Manager and the Sub-advisers (cont’d)
| | | | |
| Fund | | Sub-Adviser(s) and Portfolio Manager(s) | | Business Experience |
| AXA Enterprise Multimanager Technology Fund | | Firsthand Capital Management, Inc. 125 South Market Suite 1200 San Jose, CA 95113 Portfolio Manager Kevin M. Landis | | Kevin M. Landis is primarily responsible for day-to-day management of the fund. Mr. Landis has been the Chief Investment Officer, Chief Executive Officer and Portfolio Manager of Firsthand for the past five years. Mr. Landis co-founded the firm in 1993. |
| | |
| | | RCM Capital Management LLC Four Embarcadero Center San Francisco, CA 94111 Portfolio Managers Huachen Chen Walter C. Price | | Huachen Chen and Walter C. Price are primarily responsible for day-to-day management of the fund. Mr. Chen is a Managing Director, Senior Analyst and Portfolio Manager and has been associated with RCM as an investment professional since 1994. Mr. Price has been a Managing Director, Senior Analyst and Portfolio Manager of RCM since 1978. He joined RCM in 1974 as a Senior Securities Analyst. |
| | |
| | | Wellington Management
Company, LLP 75 State Street Boston, MA 02109 Portfolio Managers John F. Averill Bruce L. Glazer Anita M. Killian Vikram Murthy Scott E. Simpson Eric Stromquist | | John F. Averill, Bruce L. Glazer, Anita M. Killian, Vikram Murthy, Scott E. Simpson and Eric Stromquist are primarily responsible for day-to-day management of the fund. Mr. Averill, a Senior Vice President of Wellington Management, joined the firm as an investment professional in 1994. Mr. Averill has been involved in portfolio management and securities analysis for the fund since 2003. Mr. Glazer, a Senior Vice President of Wellington Management, joined the firm as an investment professional in 1997. Mr. Glazer has been involved in portfolio management and securities analysis for the fund since 2003. Ms. Killian, a Vice President of Wellington Management, joined the firm as an investment professional in 2000. Ms. Killian has been involved in portfolio management and securities analysis for the fund since 2003. Mr. Murthy, a Vice President of Wellington Management, joined the firm as an investment professional in 2001. Mr. Murthy has been involved in portfolio management and securities analysis for the fund since 2003. Mr. Simpson, a Senior Vice President of Wellington Management, joined the firm as an investment professional in 1995. Mr. Simpson has been involved in portfolio management and securities analysis for the fund since 2003. Mr. Stromquist, a Senior Vice President of Wellington Management, joined the firm as an investment professional in 1989. Mr. Stromquist has been involved in portfolio management and securities analysis for the Fund since 2003. |
37
MANAGEMENT TEAM
The Manager and the Sub-advisers (cont’d)
| | | | |
| Fund | | Sub-Adviser(s) and Portfolio Manager(s) | | Business Experience |
| AXA Enterprise Multimanager Health Care Fund | | A I M Capital Management, Inc. 11 Greenway Plaza Suite 100 Houston, TX 77046 Portfolio Manager Derek M. Taner | | Derek M. Taner, Portfolio Manager, has been primarily responsible for the fund since 2005 and has been associated with AIM and/or its affiliates as an investment professional since 2005. From 2000 to 2005, he was a portfolio manager and analyst for Franklin Advisers, Inc. |
| | |
| | | RCM Capital Management LLC Four Embarcadero Center San Francisco, CA 94111 Portfolio Manager Michael Dauchot | | Dr. Michael Dauchot re-joined RCM in 2005 as Senior Analyst and Lead Portfolio Manager. From 2004 - October 2005, he was a Principal and Healthcare Analyst at Pequot Capital Management. From 1999 to 2004, he served as a Senior Analyst and Sector Fund Manager on the Healthcare team at RCM. |
| | |
| | | Wellington Management Company, LLP 75 State Street Boston, MA 02109 Portfolio Managers Robert L. Deresiewicz Ann C. Gallo Jean M. Hynes Kirk J. Mayer Joseph H. Schwartz | | Robert L. Deresiewicz, Ann C. Gallo, Jean M. Hynes, Kirk J. Mayer and Joseph H. Schwartz are primarily responsible for day-to-day management of the fund. Mr. Deresiewicz, a Vice President of Wellington Management, joined the firm as an investment professional in 2000. Mr. Deresiewicz has been involved in portfolio management and securities analysis for the Fund since 2004. Ms. Gallo, a Senior Vice President of Wellington Management, joined the firm as an investment professional in 1998. Ms. Gallo has been involved in portfolio management and securities analysis for the Fund since its inception. Ms. Hynes, a Senior Vice President of Wellington Management, joined the firm in 1991 and has been an investment professional since 1993. Ms. Hynes has been involved in portfolio management and securities analysis for the Fund since its inception. Mr. Mayer, a Vice President of Wellington Management, joined the firm as an investment professional in 1998. Mr. Mayer has been involved in portfolio management and securities analysis for the Fund since its inception. Mr. Schwartz, a Senior Vice President of Wellington Management, joined the firm as an investment professional in 1983. Mr. Schwartz has been involved in portfolio management and securities analysis for the Fund since its inception. |
38
MANAGEMENT TEAM
The Manager and the Sub-advisers (cont’d)
| | | | |
| Fund | | Sub-Adviser(s) and Portfolio Manager(s) | | Business Experience |
| AXA Enterprise Multimanager Core Bond Fund | | BlackRock Advisors, Inc. 100 Bellevue Parkway Wilmington, DE 19809 Portfolio Managers Scott M. Amero Keith T. Anderson | | Scott M. Amero and Keith T. Anderson are primarily responsible for day-to-day management of the fund. Messrs. Anderson and Amero lead BlackRock Advisors’ Fixed Income Team, which consists of 50 portfolio managers including eight lead sector specialists in the major fixed-income sectors, as well as 28 credit research analysts and over 250 quantitative research analysts. The Fixed Income Team, using an approach that leverages the individual expertise of the team members, manages the fund utilizing BlackRock Advisors’ risk management analytics to regularly evaluate the composition of the fund. Mr. Anderson is a Managing Director at BlackRock Advisors, and has been a Managing Director of BlackRock since joining the firm in 1988. Mr. Amero is a Managing Director at BlackRock Advisors, and has been a Managing Director of BlackRock since joining the firm in 1990. Mr. Anderson is responsible for global fixed income strategy, asset allocation and the overall management of client portfolios. In this capacity, he coordinates BlackRock Advisors’ team of portfolio managers and credit analysts who specialize in the government, agency, corporate and mortgage sectors and sub-sectors, worldwide. He is the Chief Investment Officer for Fixed Income, a member of BlackRock’s Management Committee and Chairman of the Investment Strategy Group. Mr. Amero is a senior strategist and portfolio manager with responsibility for overseeing all fixed income sector strategy and the overall management of client portfolios. He is also the head of Global Credit research and a member of BlackRock’s Management Committee and Investment Strategy Group. |
| | |
| | | Pacific Investment Management Company LLC 840 Newport Center Drive Newport Beach, CA 92660 Portfolio Management Team | | Paul A. McCulley is primarily responsible for day-to-day management of the fund. William H. Gross heads PIMCO’s investment committee, which is responsible for the development of major investment themes and which sets targets for various portfolio characteristics in accounts managed by PIMCO, including the fund. Mr. McCulley is managing director, generalist portfolio manager, member of the investment committee and head of PIMCO’s Short-Term Desk. Mr. McCulley joined the firm in 1999. William H. Gross is managing director and chief investment officer and was a founding partner of PIMCO in 1971. |
Management Fees
Each fund pays a fee to AXA Equitable for management services. For the fiscal year ended October 31, 2005, the Core Equity Fund, Growth Fund and Value Fund each paid a management fee at an annual rate of 1.00% of the average net assets of the fund; the Mid Cap Growth Fund and Mid Cap Value Fund each paid a management fee at an annual rate of 1.20% of the average net assets of the fund; the International Equity Fund paid a management fee at an annual rate of 1.15% of the average net assets of the fund; the Technology Fund and Health Care Fund each paid a management fee at an annual rate of 1.30% of the average net assets of the fund; the Core Bond Fund paid a management fee at an annual rate of 0.70% of the average net assets of the fund.
39
MANAGEMENT TEAM
The Manager and the Sub-advisers (cont’d)
The sub-advisers are paid by AXA Equitable. Changes to the sub-advisory fees may be negotiated, which could result in an increase or decrease in the amount of the management fee retained by AXA Equitable, without shareholder approval.
A discussion of the basis for the decision by the Trust’s board of trustees to approve the investment management agreement with AXA Equitable and the investment advisory agreements with the sub-advisers is available in the Trust’s Annual Report to Shareholders dated October 31, 2005, except with respect to the investment advisory agreement with J.P. Morgan Investment Management Inc. with regard to the International Equity Fund, which is available in the Trust’s Semi-Annual Report to Shareholders dated April 30, 2005.
AXA Equitable also provides administrative services to the Trust, including coordination of the Trust’s audit, financial statements and tax returns, expense management and budgeting, legal administrative services and compliance monitoring, portfolio accounting services (including daily net asset value accounting), operations risk management, and oversight of the Trust’s proxy voting policies and procedures and anti-money laundering program. For administrative services, in addition to the management fee, each fund pays AXA Equitable a fee at an annual rate of 0.15% of the fund’s total average net assets plus $35,000 per fund and an additional $35,000 for each portion of the fund for which separate administrative services are provided (e.g., portions of a fund allocated to separate sub-advisers and/or managed in a discrete style).
Expense Limitation Agreement
In the interest of limiting until February 28, 2007 (unless the board of trustees consents to an earlier revision or termination of this arrangement) the expenses of each fund, the Manager has entered into an expense limitation agreement with the Trust with respect to the funds (“Expense Limitation Agreement”). Pursuant to that Expense Limitation Agreement, the Manager has agreed to waive or limit its management, administration and other fees and to assume other expenses so that the total annual operating expenses of each fund (other than interest, taxes, brokerage commissions, other expenditures which are capitalized in accordance with generally accepted accounting principles, and other extraordinary expenses not incurred in the ordinary course of each fund’s business), are limited to the following respective expense ratios:
| | | | | | | | | | |
| | | Total Expenses Limited to (% of daily net assets) |
| FUNDS | | CLASS A | | CLASS B | | CLASS C | | CLASS P | | CLASS Y |
| AXA Enterprise Multimanager Core Equity Fund | | 1.65% | | 2.20% | | 2.20% | | 1.45% | | 1.20% |
| AXA Enterprise Multimanager Growth Fund | | 1.65% | | 2.20% | | 2.20% | | 1.45% | | 1.20% |
| AXA Enterprise Multimanager Value Fund | | 1.65% | | 2.20% | | 2.20% | | 1.45% | | 1.20% |
| AXA Enterprise Multimanager Mid Cap Growth Fund | | 1.90% | | 2.45% | | 2.45% | | 1.70% | | 1.45% |
| AXA Enterprise Multimanager Mid Cap Value Fund | | 1.90% | | 2.45% | | 2.45% | | 1.70% | | 1.45% |
| AXA Enterprise Multimanager International Equity Fund | | 2.00% | | 2.55% | | 2.55% | | 1.90% | | 1.55% |
| AXA Enterprise Multimanager Technology Fund | | 2.15% | | 2.70% | | 2.70% | | 1.95% | | 1.70% |
| AXA Enterprise Multimanager Health Care Fund | | 2.15% | | 2.70% | | 2.70% | | 1.95% | | 1.70% |
| AXA Enterprise Multimanager Core Bond Fund | | 1.25% | | 1.80% | | 1.80% | | 1.05% | | 0.80% |
AXA Equitable may be reimbursed the amount of any such payments or waivers in the future provided that the payments or waivers are reimbursed within three years of the payment or waivers being made and the combination of the fund’s expense ratio and such reimbursements do not exceed the fund’s expense cap. If the actual expense ratio is less than the expense cap and AXA Equitable has recouped all eligible previous payments made, the fund will be charged such lower expenses.
Legal Proceedings
AIM Capital Management, Inc.
On October 8, 2004, INVESCO Funds Group, Inc. (IFG) (the former investment advisor to certain AIM funds), AIM and A I M Distributors, Inc. (ADI) (the distributor of the retail AIM funds) reached final settlements with certain regulators,
40
MANAGEMENT TEAM
The Manager and the Sub-advisers (cont’d)
including the SEC, the New York Attorney General and the Colorado Attorney General, to resolve civil enforcement actions and/or investigations related to market timing and related activity in the AIM funds, including those formerly advised by IFG. As part of the settlements, a $325 million fair fund ($110 million of which is civil penalties) has been created to compensate shareholders harmed by market timing and related activity in funds formerly advised by IFG. Additionally, AIM and ADI created a $50 million fair fund ($30 million of which is civil penalties) to compensate shareholders harmed by market timing and related activity in funds advised by AIM, which was done pursuant to the terms of the settlements. These two fair funds may increase as a result of contributions from third parties who reach final settlements with the SEC or other regulators to resolve allegations of market timing and/or late trading that also may have harmed applicable AIM funds. These two fair funds will be distributed in accordance with a methodology to be determined by AIM’s independent distribution consultant, in consultation with AIM and the independent trustees of the AIM funds and acceptable to the staff of the SEC.
Civil lawsuits, including a regulatory proceeding and purported class action and shareholder derivative suits, have been filed against certain of the AIM funds, IFG, AIM, ADI and/or related entities and individuals, depending on the lawsuit, alleging among other things: (i) that the defendants permitted improper market timing and related activity in the funds; (ii) that certain funds inadequately employed fair value pricing; (iii) that the defendants charged excessive advisory and/or distribution fees and failed to pass on to shareholders the perceived savings generated by economies of scale and that the defendants adopted unlawful distribution plans; and (iv) that the defendants improperly used the assets of the funds to pay brokers to aggressively promote the sale of the funds over other mutual funds and that the defendants concealed such payments from investors by disguising them as brokerage commissions.
Additional civil lawsuits related to the above or other matters may be filed by regulators or private litigants against the AIM funds, IFG, AIM, ADI and/or related entities and individuals in the future. You can find more detailed information concerning all of the above matters, including the parties to the civil lawsuits and summaries of the various allegations and remedies sought in such lawsuits, in the fund’s Statement of Additional Information.
As a result of the matters discussed above, investors in the AIM funds might react by redeeming their investments. This might require the funds to sell investments to provide for sufficient liquidity and could also have an adverse effect on the investment performance of the funds.
Franklin Advisers, Inc.
Distribution of settlement monies. Under the terms of the SEC’s Orders and the California Attorney General’s Office (“CAGO”) settlement agreement, which have been disclosed in previous filings, the Company has retained an Independent Distribution Consultant (“IDC”) to develop a plan for the distribution of the respective settlement monies.
The SEC’s Order and the CAGO settlement concerning marketing support payments provide that the distributions of the settlement monies are to be made to the relevant funds, not to individual shareholders. The distribution plan pertaining to the distribution of the monies owed under the CAGO settlement agreement was approved by the CAGO, and the monies have been disbursed to the relevant funds in accordance with the terms and conditions of that settlement. The SEC has not yet approved the distribution plan pertaining to the SEC marketing support payments. When approved, disbursements of settlement monies under the SEC Order will be made promptly in accordance with the terms and conditions of that Order.
The IDC continues to develop a methodology and Plan of Distribution under the SEC’s Order that resolved its market timing investigation.
Working with Regulators. As disclosed in the Company’s fiscal second quarter 10-Q filing, on April 12, 2005, the Attorney General of West Virginia filed a complaint in the Circuit Court of Marshall County, West Virginia against a number of companies engaged in the mutual fund industry, including the Company and its subsidiary, Franklin Advisers, Inc., and certain other parties alleging violations of the West Virginia Consumer Credit and Protection Act and seeking, among other things, civil penalties and attorneys’ fees and costs. To the extent applicable to the Company, the complaint arises from activity that occurred in 2001 and duplicates, in whole or in part, the allegations asserted in the February 4, 2004 Massachusetts Administrative Complaint concerning one instance of market timing and the SEC’s findings regarding market timing in its August 2, 2004 Order.
For details on previous settlements and interactions with regulators, please reference the Company’s most recent filings at http://www.franklintempleton.com/retail/jsp_cm/global_nav/company/sec_filings.jsp.
41
MANAGEMENT TEAM
The Manager and the Sub-advisers (cont’d)
Class action and derivative lawsuits. The Company and certain of the Franklin Templeton mutual funds, current and former officers, employees and directors have been named in multiple class action and derivative lawsuits, which are described in the Company’s filings with the SEC. The Company believes that all of the claims made in each of the lawsuits are without merit and intends to defend itself vigorously.
Janus Capital Management LLC
In the fall of 2003, the SEC, NYAG, the Colorado Attorney General, and the Colorado Division of Securities (“CDS”) announced that they were investigating alleged frequent trading practices in the mutual fund industry. On August 18, 2004, Janus Capital announced that it had reached final settlements with the SEC, the NYAG, the COAG, and the CDS related to such regulators’ investigations into Janus Capital’s frequent trading arrangements.
A number of civil lawsuits were brought against Janus Capital and certain of its affiliates, the Janus funds, and related entities and individuals based on allegations similar to those announced by the above regulators and were filed in several state and federal jurisdictions. Such lawsuits alleged a variety of theories for recovery including, but not limited to, the federal securities laws, other federal statutes (including ERISA), and various common law doctrines. The Judicial Panel on Multidistrict Litigation transferred these actions to the United States District Court for the District of Maryland (the “Court”) for coordinated proceedings. On September 29, 2004, five consolidated amended complaints were filed in that Court that generally include: (i) claims by a putative class of investors in the Janus funds asserting claims on behalf of the investor class; (ii) derivative claims by investors in the Janus funds ostensibly on behalf of the Janus funds; (iii) claims on behalf of participants in the Janus 401(k) plan; (iv) claims brought on behalf of shareholders of Janus Capital Group Inc. (‘‘JCGI’’) on a derivative basis against the Board of Directors of JCGI; and (v) claims by a putative class of shareholders of JCGI asserting claims on behalf of the shareholders. Each of the five complaints initially named JCGI and/or Janus Capital as a defendant. In addition, the following were also named as defendants in one or more of the actions: Janus Investment Fund (‘‘JIF’’), Janus Aspen Series (‘‘JAS’’), Janus Adviser Series (‘‘JAD’’), Janus Distributors LLC, Enhanced Investment Technologies, LLC (‘‘INTECH’’), Bay Isle Financial LLC (‘‘Bay Isle’’), Perkins, Wolf, McDonnell and Company, LLC (‘‘Perkins’’), the Advisory Committee of the Janus 401(k) plan, and the current or former directors of JCGI.
On August 25, 2005, the Court entered orders dismissing most of the claims asserted against Janus Capital and its affiliates by fund investors (actions (i) and (ii) described above), except certain claims under Section 10(b) of the Securities Exchange Act of 1934 and under Section 36(b) of the Investment Company Act of 1940. As a result, JCGI, Janus Capital, the Advisory Committee of the Janus 401(k) plan, and the current or former directors of JCGI are the remaining defendants in one or more of the actions. The complaint in the 401(k) plan class action (action (iii) described above) was voluntarily dismissed, but was recently refiled using a new named plaintiff and asserting claims similar to the initial complaint.
The Attorney General’s Office for the State of West Virginia filed a separate market timing related civil action against Janus Capital and several other non-affiliated mutual fund companies, claiming violations under the West Virginia Consumer Credit and Protection Act. The civil action requests certain monetary penalties, among other relief. This action has been moved to federal court and transferred to the Multidistrict litigation case in the U.S. District Court of Baltimore, Maryland described above. In addition, the Auditor of the State of West Virginia, in his capacity as securities commissioner, has issued an order indicating an intent to initiate administrative proceedings against most of the defendants in the market timing cases (including Janus Capital) and seeking disgorgement and other monetary relief based on similar market timing allegations.
In addition to the ‘‘market timing’’ actions described above, Janus Capital is a defendant in a consolidated lawsuit in the U.S. District Court for the District of Colorado challenging the investment advisory fees charged by Janus Capital to certain Janus funds. The action was filed in 2004 by fund investors asserting breach of fiduciary duty under Section 36(b) of the Investment Company Act of 1940. The plaintiffs seek declaratory and injunctive relief and an unspecified amount of damages.
A lawsuit was also filed against Janus Capital and certain affiliates in the U.S. District Court for the District of Colorado alleging that Janus Capital failed to ensure that certain Janus funds participated in securities class action settlements for which the funds were eligible. The complaint asserts claims under Sections 36(a), 36(b), and 47(b) of the Investment Company Act, breach of fiduciary duty and negligence.
In 2001, Janus Capital’s predecessor was also named as a defendant in a class action suit in the U.S. District Court for the Southern District of New York, alleging that certain underwriting firms and institutional investors violated antitrust laws in
42
MANAGEMENT TEAM
The Manager and the Sub-advisers (cont’d)
connection with initial public offerings. The U.S. District Court dismissed the plaintiff’s antitrust claims in November, 2003, however the U.S. Court of Appeals recently vacated that decision and remanded it for further proceedings.
Additional lawsuits may be filed against certain of the Janus funds, Janus Capital, and related parties in the future. Janus Capital does not currently believe that these pending actions will materially affect its ability to continue providing services it has agreed to provide to the Janus funds.
MFS Investment Management
On March 31, 2004, MFS settled an administrative proceeding with the SEC regarding disclosure of brokerage allocation practices in connection with MFS fund sales (the term “MFS funds” means the open-end registered management investment companies sponsored by MFS). The brokerage allocation practices which were the subject of this proceeding were discontinued by MFS in November 2003. In addition, in February 2004, MFS reached agreement with the SEC, the NYAG and the Bureau of Securities Regulation of the State of New Hampshire to settle administrative proceedings alleging false and misleading information in certain MFS open-end retail fund prospectuses regarding market timing and related matters.
Since December 2003, MFS, MFS Fund Distributors, Inc., MFS Service Center, Inc., MFS Corporation Retirement Committee, Sun Life Financial Inc., various MFS funds, certain current and/or former Trustees of these MFS funds, and certain officers of MFS have been named as defendants in multiple lawsuits filed in federal and state courts. The lawsuits variously have been commenced as class actions or individual actions on behalf of investors who purchased, held or redeemed shares of the MFS funds during specified periods, as ERISA actions by participants in certain retirement plan accounts on behalf of those accounts, or as derivative actions on behalf of the MFS funds. The lawsuits relating to market timing and related matters have been transferred to, and consolidated before, the United States District Court for the District of Maryland, as part of a multi-district litigation of market timing and related claims involving several other fund complexes (In re Mutual Funds Investment Litigation (Alger, Columbia, Janus, MFS, One Group, Putnam, Allianz Dresdner), No. 1:04-md-15863 (transfer began March 19, 2004)). The market timing cases related to the MFS complex are Riggs v. MFS et al., Case No. 04-CV-01162-JFM (direct), Hammerslough v. MFS et al., Case No. 04-MD-01620 (derivative) and Anita Walker v. MFS et al., Case No. 1:04-CV-01758 (ERISA) and Reaves v. MFS Series Trust I, et al., Case No. 1:05-CV-02220-JFM (Class B Shares). The plaintiffs in these consolidated lawsuits generally seek injunctive relief including removal of the named Trustees, adviser and distributor, rescission of contracts and 12b-1 Plans, disgorgement of fees and profits, monetary damages, punitive damages, attorney’s fees and costs and other equitable and declaratory relief. Two lawsuits alleging improper brokerage allocation practices and excessive compensation are pending in the United States District Court for the District of Massachusetts (Forsythe v. Sun Life Financial Inc., et al., No. 04cv10584 (GAO) (a consolidated action) and Marcus Dumond, et al. v. Massachusetts Financial Servs. Co., et al., No. 04cv11458 (GAO)). The plaintiffs in these lawsuits generally seek compensatory damages, punitive damages, recovery of fees, rescission of contracts, an accounting, restitution, declaratory relief, equitable and/or injunctive relief and attorney’s fees and costs. The various lawsuits generally allege that some or all of the defendants (i) permitted or acquiesced in market timing and/or late trading in some of the MFS funds, inadequately disclosed MFS’ internal policies concerning market timing and such matters, (ii) received excessive compensation as fiduciaries to the MFS funds, or (iii) permitted or acquiesced in the improper use of fund assets by MFS to support the distribution of MFS fund shares and inadequately disclosed MFS’ use of fund assets in this manner. The actions assert that some or all of the defendants violated the federal securities laws, including the Securities Act of 1933 and the Securities Exchange Act of 1934, the Investment Company Act of 1940 and the Investment Advisers Act of 1940, the Employee Retirement Income Security Act of 1974, as well as fiduciary duties and other violations of common law. Insofar as any of the actions is appropriately brought derivatively on behalf of any of the MFS funds, any recovery will inure to the benefit of the MFS funds. In February, March, and April 2005, the defendants filed separate motions to dismiss all claims of the various lawsuits. The parties continue to brief the issues for the courts and various hearing dates have been scheduled. Additional lawsuits based on similar allegations may be filed in the future.
Any potential resolution of these matters may include, but not be limited to, judgments or settlements for damages against MFS, the MFS funds, or any other named defendant. It is not clear whether any amounts paid in connection with the above regulatory settlements will be sufficient to compensate shareholders for all of the damage they allegedly sustained, whether certain shareholders or putative class members may have additional claims to compensation, or whether the damages that may be awarded in any of the actions will exceed these amounts. In the event the MFS funds incur any losses, costs or expenses in connection with such lawsuits, the Boards of Trustees of the affected MFS funds may pursue claims on behalf of such funds
43
MANAGEMENT TEAM
The Manager and the Sub-advisers (cont’d)
against any party that may have liability to the funds in respect thereof. There can be no assurance that these regulatory actions and lawsuits, or the adverse publicity associated with these developments, will not result in increased fund redemptions, reduced sales of fund shares, or other adverse consequences to the MFS funds.
Pacific Investment Management Company LLC
On June 1, 2004, the Attorney General of the State of New Jersey announced that it had dismissed PIMCO from a complaint filed by the New Jersey Attorney General on February 17, 2004, and that it had entered into a settlement agreement (the “New Jersey Settlement”) with PIMCO’s parent company, AGI (formerly known as Allianz Dresdner Asset Management of America L.P.), PEA Capital LLC (an entity affiliated with PIMCO through common ownership) (“PEA”) and AGID, in connection with the same matter. In the New Jersey Settlement, AGI, PEA and AGID neither admitted nor denied the allegations or conclusions of law, but did agree to pay New Jersey a civil fine of $15 million and $3 million for investigative costs and further potential enforcement initiatives against unrelated parties. They also undertook to implement certain governance changes. The complaint relating to the New Jersey Settlement alleged, among other things, that AGI, PEA and AGID had failed to disclose that they improperly allowed certain hedge funds to engage in “market timing” in certain funds. The complaint sought injunctive relief, civil monetary penalties, restitution and disgorgement of profits.
Since February 2004, PIMCO, AGI, PEA, AGID, and certain of their affiliates, including the PIMCO Funds, Allianz Funds (formerly known as PIMCO Funds: Multi-Manager Series), and various Trustees, have been named as defendants in 14 lawsuits filed in U.S. District Court in the Southern District of New York, the Central District of California and the Districts of New Jersey and Connecticut. Ten of those lawsuits concern “market timing,” and they have been transferred to and consolidated for pre-trial proceedings in the U.S. District Court for the District of Maryland; four of those lawsuits concern “revenue sharing” and have been consolidated into a single action in the U.S. District Court for the District of Connecticut. The lawsuits have been commenced as putative class actions on behalf of investors who purchased, held or redeemed shares of the various series of the PIMCO Funds and the Allianz Funds during specified periods, or as derivative actions on behalf of the PIMCO Funds and Allianz Funds.
The market timing actions in the District of Maryland generally allege that certain hedge funds were allowed to engage in “market timing” in certain of the Allianz Funds and Funds of the PIMCO Funds and this alleged activity was not disclosed. Pursuant to tolling agreements entered into with the derivative and class action plaintiffs, PIMCO, the Trustees, and certain employees of PIMCO who were previously named as defendants have all been dropped as defendants in the market timing actions; the plaintiffs continue to assert claims on behalf of the shareholders of the PIMCO Funds or on behalf of the PIMCO Funds themselves against other defendants. The revenue sharing action in the District of Connecticut generally alleges that fund assets were inappropriately used to pay brokers to promote the Allianz Funds and PIMCO Funds, including directing fund brokerage transactions to such brokers, and that such alleged arrangements were not fully disclosed to shareholders. The market timing and revenue sharing lawsuits seek, among other things, unspecified compensatory damages plus interest and, in some cases, punitive damages, the rescission of investment advisory contracts, the return of fees paid under those contracts and restitution.
PIMCO has learned that, on April 11, 2005, the Attorney General of the State of West Virginia filed a complaint in the Circuit Court of Marshall County, West Virginia (the “West Virginia Complaint”) against Allianz Global Investors Fund Management LLC (formerly PA Fund Management LLC) (“AGIF”), PEA and AGID alleging, among other things, that they improperly allowed broker-dealers, hedge funds and investment advisers to engage in frequent trading of various open-end funds advised or distributed by Allianz Global Investors Fund Management LLC and certain of its affiliates in violation of the funds’ stated restrictions on “market timing.” On May 31, 2005, AGIF, PEA and AGID, along with the other mutual fund defendants in the action, removed the action to the U.S. District Court for the District of West Virginia. The West Virginia Complaint also names numerous other defendants unaffiliated with Allianz Global Investors Fund Management in separate claims alleging improper market timing and/or late trading of open-end investment companies advised or distributed by such other defendants. The West Virginia Complaint seeks injunctive relief, civil monetary penalties, investigative costs and attorney’s fees.
Under Section 9(a) of the Investment Company Act of 1940, as amended (“1940 Act”), if the New Jersey Settlement or any of the lawsuits described above were to result in a court injunction against AGI, PEA, AGID and/or their affiliates, PIMCO could, in the absence of exemptive relief granted by the SEC, be barred from serving as an investment adviser, and AGID could be
44
MANAGEMENT TEAM
The Manager and the Sub-advisers (cont’d)
barred from serving as principal underwriter, to any registered investment company, including the PIMCO Funds. In connection with an inquiry from the SEC concerning the status of the New Jersey Settlement under Section 9(a), PEA, AGID, AGI and certain of their affiliates (including PIMCO) (together, the “Applicants”) have sought exemptive relief from the SEC under Section 9(c) of the 1940 Act. The SEC has granted the Applicants a temporary exemption from the provisions of Section 9(a) with respect to the New Jersey Settlement until the earlier of (i) September 13, 2006 and (ii) the date on which the SEC takes final action on their application for a permanent order. There is no assurance that the SEC will issue a permanent order.
If the West Virginia Complaint were to result in a court injunction against AGIF, PEA or AGID, the Applicants would, in turn, seek exemptive relief under Section 9(c) with respect to that matter, although there is no assurance that such exemptive relief would be granted.
It is possible that these matters and/or other developments resulting from these matters could result in increased PIMCO Fund redemptions or other adverse consequences to the PIMCO Funds. However, PIMCO and AGID believe that these matters are not likely to have a material adverse effect on the PIMCO Funds or on PIMCO’s or AGID’s ability to perform their respective investment advisory or distribution services relating to the PIMCO Funds.
The foregoing speaks only as of the date of this prospectus. While there may be additional litigation or regulatory developments in connection with the matters discussed above, the foregoing disclosure of litigation and regulatory matters will be updated only if those developments are material.
45
FUND SERVICES
Investing in the Funds
Choosing a Share Class
Each fund offers Class A, Class B, Class C and Class Y shares to the public. This prospectus also describes Class P shares of the funds. However, Class P shares are no longer available for investment except through exchanges of Class P shares of another fund and through dividend reinvestments. These funds are not designed for market-timers, see the section entitled “Purchase and Redemption Restrictions on Market-Timers & Active Traders.” Each class of shares has different costs associated with buying, selling and holding fund shares. Your broker or other financial professional can assist you in selecting which class of shares best meets your needs based on such factors as the size of your investment and the length of time you intend to hold your shares.
The table below summarizes the key features of each class of shares. They are described in more detail below. Information regarding the sales charges for each class of shares of the funds as well as additional information regarding each class of shares of the funds also is available free of charge and in a clear and prominent format at www.axaenterprise.com in the “Funds — Fund Information and Details” portion of the website. From the website description, a hyperlink will take you directly to this disclosure. Additional information regarding sales loads is available in the SAI.
| | | | | | | | | | |
| | | Class A | | Class B | | Class C | | Class P | | Class Y |
• Availability? | | • Generally available through most investment dealers. | | • Available only to investors making a single purchase of less than $100,000. | | • Available only to investors making a single purchase of less than $1,000,000. | | • No longer available for investment, except through reinvestment of dividends and distributions and exchanges from Class P shares of another fund. | | • Available only to certain types of investors purchasing $1,000,000 or more. |
• Initial Sales Charge? | | • Yes, payable at time of purchase. Lower sales charges available for larger investments. If certain employee benefit plans qualified under Sections 401, 403 and 408 of the Internal Revenue Code, or participants of such plans, invest $100,000 or more ($500,000 or more, in the case of Traditional Individual Retirement Accounts (“IRAs”), IRA rollovers, Coverdell Education Savings Accounts or Roth IRAs) or if you invest $1,000,000 or more in Class A shares, no initial sales charge applies to those shares. See “Fund Services — How Sales Charges are Calculated.” | | • No. Entire purchase is invested in shares of a fund. | | • No. Entire purchase is invested in shares of a fund. | | • Yes, payable at the time of purchase. Lower sales charges available for larger investments. | | • No. Entire purchase is invested in shares of a fund. |
46
FUND SERVICES
Investing in the Funds (cont’d)
| | | | | | | | | | |
| | | Class A | | Class B | | Class C | | Class P | | Class Y |
• Contingent Deferred Sales Charge (“CDSC”)? | | • No. (However, under certain circumstances, we will charge a CDSC if you sell shares within twelve months of purchasing them and you did not pay an initial sales charge on such purchase. If the entire plan or you redeem the shares within 12 months of the end of the calendar month of their purchase, the plans or you will be charged a CDSC of 1%. The dealer discount or agency fee as a percentage of the offering price for these purchases of less than $5,000,000 of Class A shares will be 1%. See “Fund Services — How Sales Charges are Calculated.”) | | • Yes, payable if you redeem your shares within six years of purchase. Amount of CDSC gradually decreases over time. | | • Yes, payable if you redeem your shares within one year of purchase. | | • No. (However, we will charge a CDSC if you sell within one year of purchasing shares, on which no initial sales charge was imposed because the original purchase price exceeded $1 million.) | | • No. |
• Distribution and Service Fees? | | • 0.20% distribution fee and 0.25% service fee. | | • 0.75% distribution fee and 0.25% service fee. | | • 0.75% distribution fee and 0.25% service fee. | | • 0.25% service fee. | | • No. |
• Conversion to Class A shares? | | • (Not applicable.) | | • Yes, automatically after eight years. | | • No. | | • No. | | • No. |
47
FUND SERVICES
How Sales Charges are Calculated
Class A Shares
The price that you pay when you buy Class A shares (the “offering price”) is their net asset value plus a sales charge (sometimes called a “front-end sales charge”), which varies depending upon the size of your purchase. No initial sales charge applies to Class A shares you receive through reinvestment of dividends or distributions.
Class A Sales Charges
| | | | | | |
| | | | |
| Your Investment* | | As a % of Offering Price | | As a % of Your Investment | | Dealer Discount or
Agency Fee as a % of
Offering Price** |
| Up to $99,999 | | 4.75% | | 4.99% | | 4.00% |
| $100,000 up to $249,999*** | | 3.75% | | 3.90% | | 3.00% |
| $250,000 up to $499,999*** | | 2.50% | | 2.56% | | 2.00% |
| $500,000 up to $999,999*** | | 2.00% | | 2.04% | | 1.50% |
| $1,000,000 and up*** | | None | | None | | 1% of the first $4.99 million;
0.75% of amounts from
$5-19.99 million; 0.50% of
amounts from $20 million
to $100 million; 0.25% of
amounts in excess of $100
million. |
| * | In determining the amount of your investment and the applicable sales charge, we will include all shares you are currently purchasing in all of the AXA Enterprise Funds. For more information on reducing or eliminating sales charges, please see “Ways to Reduce or Eliminate Sales Charges.” |
| ** | The Distributor will compensate dealers in connection with purchases of Class A shares. From time to time, the Distributor may hold special promotions for specified periods during which the Distributor may reallow dealers up to the full sales charges shown above. In addition, the Distributor may sponsor sales contests and provide to all qualifying dealers, from its own profits and resources, additional compensation, as described below in the section entitled “Compensation to Securities Dealers.” |
| *** | If certain employee benefit plans qualified under Sections 401, 403 and 408 of the Internal Revenue Code, or participants of such plans, invest $100,000 or more ($500,000 or more, in the case of Traditional Individual Retirement Accounts (”IRAs”), IRA rollovers, Coverdell Education Savings Accounts or Roth IRAs) or if you invest $1,000,000 or more in Class A shares, no initial sales charge applies to those shares. However, if the entire plan or you redeem the shares within 12 months of the end of the calendar month of their purchase, the plans or you will be charged a CDSC of 1%. The dealer discount or agency fee as a percentage of the offering price for these purchases of less than $5,000,000 of Class A shares will be 1%. |
48
FUND SERVICES
How Sales Charges are Calculated (cont’d)
Class B Shares
Class B shares are sold at net asset value, without any sales charges at the time of purchase. However, there may be a CDSC on shares that is payable upon redemption. The holding period for purposes of timing the conversion to Class A shares and determining the CDSC will continue to run after an exchange to Class B shares of another AXA Enterprise Fund. The funds will not accept single purchase orders for Class B shares over $100,000. The amount of the CDSC declines as you hold your shares over time, according to the following schedule.
| | |
Holding period after
purchase | | % deducted
when shares are sold |
| Up to one year | | 5.00% |
| Over one year up to two years | | 4.00% |
| Over two years up to three years | | 4.00% |
| Over three years up to four years | | 3.00% |
| Over four years up to five years | | 2.00% |
| Over five years up to six years | | 1.00% |
| More than six years | | None |
Your Class B shares will automatically convert to Class A shares of the same fund eight years after the end of the calendar month in which your purchase order for Class B shares was accepted. A pro rata portion of any Class B shares acquired through reinvestment of dividends or distributions will convert along with Class B shares that were purchased. Class A shares are subject to lower expenses than Class B shares. The conversion of Class B to Class A is not a taxable event for federal income tax purposes.
How the CDSC is Applied to Your Shares
The CDSC is a sales charge you pay when you redeem certain fund shares. The CDSC:
| • | | is calculated based on the number of shares you are selling; |
| • | | is based on either your original purchase price or the then-current net asset value of the shares being sold, whichever is lower; |
| • | | is deducted from the proceeds of the redemption, not from the amount remaining in your account, unless otherwise directed by you; |
| • | | for year one applies to redemptions through the day one year after the date on which your purchase was accepted, and so on for subsequent years; and |
| • | | is applied to your shares at the time of sale based on the schedule applicable to those shares when you bought them. |
A CDSC Will Not be Charged On
| • | | increases in net asset value above the purchase price; |
| • | | shares you acquired by reinvesting your dividends or capital gains distributions; or |
| • | | exchanges of shares of one fund for shares of the same class of another AXA Enterprise Fund. |
To keep your CDSC as low as possible, each time you request to sell shares we will first sell any shares in your account that carry no CDSC. If there are not enough of these shares available to meet your request, we will sell the shares in the order purchased.
49
FUND SERVICES
How Sales Charges are Calculated (cont’d)
Class C Shares
Class C shares are sold at net asset value. However, there is a CDSC on shares that is payable on redemptions made within one year of the date of purchase. The holding period for purposes of determining the CDSC will continue to run after an exchange to Class C shares of another AXA Enterprise Fund. The funds will not accept single purchase orders for Class C shares over $1,000,000. For more information regarding the application of the CDSC to Class C shares, see “How the CDSC is Applied to Your Shares” and “A CDSC Will Not Be Charged On.”
Class C Contingent Deferred Sales Charges
| | |
| | |
| Holding Period After Purchase | | % Deducted when Shares are Sold |
| One year | | 1.00% |
| Thereafter | | 0.00% |
Class P Shares
Please note that Class P shares are no longer available for investment, except through reinvestment of dividends and distributions and through exchanges of Class P shares of another fund.
Class P Sales Charges for:
| | | | | | |
| All Funds (other than the AXA Enterprise Multimanager Core Bond Fund) |
| | | | |
| Your Investment | | As a % of Offering Price | | As a % of Your Investment | | Dealer Discount or
Agency Fee as a % of
Offering Price |
| Less than $50,000 | | 5.50% | | 5.82% | | 5.00% |
| $50,000 up to $99,999 | | 4.75% | | 4.99% | | 4.25% |
| $100,000 up to $249,999 | | 3.75% | | 3.90% | | 3.25% |
| $250,000 up to $499,999 | | 2.75% | | 2.83% | | 2.50% |
| $500,000 up to $999,999 | | 2.00% | | 2.04% | | 1.75% |
| $1,000,000 and up* | | None | | None | | None |
| * | A contingent deferred sales charge of 1.00% generally will apply to redemptions of your shares made within one year of the date of purchase. |
Class P Sales Charges for AXA Enterprise Multimanager Core Bond Fund:
| | | | | | |
| | | | |
| Your Investment | | As a % of Offering Price | | As a % of Your Investment | | Dealer Discount or
Agency Fee as a % of
Offering Price |
| Less than $100,000 | | 4.50% | | 4.71% | | 4.00% |
| $100,000 up to $249,999 | | 3.50% | | 3.63% | | 3.00% |
| $250,000 up to $499,999 | | 2.50% | | 2.56% | | 2.25% |
| $500,000 up to $999,999 | | 1.75% | | 1.78% | | 1.50% |
| $1,000,000 and up* | | None | | None | | None |
| * | A contingent deferred sales charge of 1.00% generally will apply to redemptions of your shares made within one year of the date of purchase. |
50
FUND SERVICES
How Sales Charges are Calculated (cont’d)
Class Y Shares
Investors who purchase Class Y shares do not pay sales charges. The ongoing expenses for Class Y shares are the lowest of all the classes because there are no ongoing 12b-1 distribution or service fees.
Class Y shares are sold at net asset value and have no sales charge. The minimum investment amount for purchasing Class Y shares generally is $1,000,000. Only specific types of investors can purchase Class Y shares. You may be eligible to purchase Class Y shares if you:
| • | | Are a corporation, bank, savings institution, trust company, insurance company, pension fund, employee benefit plan, professional firm, trust, estate or educational, religious or charitable organization; |
| • | | Are an investment company registered under the 1940 Act; |
| • | | Are an employee of AXA Financial, Inc. or its subsidiaries or an immediate family member of such employee (not subject to $1,000,000 minimum investment amount); |
| • | | Are a wrap account client of an eligible broker-dealer (not subject to $1,000,000 minimum investment amount); |
| • | | Are a present or former trustee of the Trust or a spouse or minor child of any such trustee or any trust, IRA or retirement plan account for the benefit of any such person or relative or the estate of any such person or relative (not subject to $1,000,000 minimum investment amount); or |
| • | | Are a financial institutional buyer. |
Compensation to Securities Dealers
The funds are distributed by Enterprise Fund Distributors, Inc. (the “Distributor). As noted in the Prospectus, for distribution and shareholder services, investors pay sales charges (front-end or deferred) and the funds, on behalf of Class A, Class B, Class C and Class P shares, pay ongoing 12b-1 fees (consisting of the annual service and/or distribution fees of a plan adopted by a fund pursuant to Rule 12b-1 under the 1940 Act) to the Distributor. The sales charges are detailed in the section entitled “Fund Services — How Sales Charges are Calculated.” The Distributor pays a portion of or the entire sales charge paid on the purchase of Class A and Class P shares to the selling dealers. The Distributor may also pay sales commissions to selling dealers when they sell Class B and Class C shares at a rate equal to or in excess of the amounts the dealers receive for sales of Class A or Class P shares. The Distributor may also pay selling dealers on an ongoing basis for services and distribution. The Class A, Class B, Class C and Class P shares each pay an annual service fee of 0.25% of their average daily net assets to compensate the Distributor for providing services to shareholders of those classes and/or maintaining shareholder accounts for those classes. In addition to this service fee, Class A shares pay an annual distribution fee of 0.20% of their average daily net assets, and Class B and Class C shares pay an annual distribution fee of 0.75% of their average daily net assets. The compensation the Distributor receives is for services rendered and expenses borne in connection with activities primarily intended to result in the sale of shares, including printing and mailing of Trust prospectuses, statements of additional information (including any supplements thereto) and shareholder reports, compensation to financial intermediaries and broker-dealers and holding seminars and sales meetings with wholesale and retail sales personnel designed to promote the distribution of shares. Because these distribution fees are paid out of the funds’ assets on an ongoing basis, the fees for Class B and Class C shares will increase the cost of your investment and may cost you more over time than paying the front-end sales charge on Class A or Class P shares.
From time to time, the Distributor also may accept financial support from sub-advisers for marketing, education and training programs.
In addition to the sales charges paid by investors and the distribution and service fees paid by the funds, the Distributor (or one of its affiliates) may make payments out of its own resources to provide additional compensation to selling dealers and other persons, including affiliates who sell shares of the funds and other mutual funds distributed by the Distributor (collectively, “Dealers”). Such payments, which are sometimes referred to as “revenue sharing,” may be calculated by reference to the gross sales price of shares sold by such persons, the net asset value of shares held by the customers of such persons, or otherwise. Additional payments to these Dealers, may, but are not normally expected to, exceed in the aggregate 0.25% of total sales and/or 0.12% of the average daily net asset value of the fund shares attributable to a particular Dealer.
The additional payments to such Dealers are negotiated based on a number of factors including, but not limited to, reputation in the industry, ability to attract and retain assets, target markets, customer relationships and quality of service. No one factor is
51
FUND SERVICES
How Sales Charges are Calculated (cont’d)
determinative of the type or amount of additional compensation to be provided. The amount of these payments, as determined from time to time by the Distributor in its sole discretion, may be different for different Dealers. These additional payments are made by the Distributor and its affiliates and do not increase the amount paid by you or the funds as shown under the heading “Fund Fees and Expenses.”
Such payments are intended to provide additional compensation to Dealers for various services, including without limitation, providing periodic and ongoing education and training of Dealer personnel regarding the funds; disseminating to Dealer personnel information and product marketing materials regarding the funds; explaining to clients the features and characteristics of the funds; conducting due diligence regarding the funds; providing reasonable access to sales meetings, sales representatives and management representatives of the Dealer; granting reasonable access to the Dealer’s financial advisors and consultants; furnishing marketing support and other services. Additional compensation also may include non-cash compensation, financial assistance to Dealers in connection with conferences, seminars for the public and advertising campaigns, technical and systems support and reimbursement of ticket charges (fees that a Dealer firm charges its representatives for effecting transactions in fund shares) and other similar charges. The Distributor and its affiliates may make other payments or allow other promotional incentives to Dealers to the extent permitted by SEC and NASD rules and by other applicable laws and regulations.
In some instances, these incentives may be made available only to Dealers whose representatives have sold or may sell a significant number of shares. The Dealers receiving additional payments include those that may recommend that their clients consider or select an AXA Enterprise Fund for investment purposes, including those that may include one or more AXA Enterprise Funds on a “preferred” or “recommended” list of mutual funds. These payments may create an incentive for a Dealer firm or its representatives to recommend or offer shares of AXA Enterprise Funds to its customers over shares of other funds. In addition, these payments may result in greater access by the Distributor or its affiliates to, without limitation, the Dealer, its representatives, advisors and consultants and sales meetings, than other funds which do not make such payments or which make lower such payments.
In addition to the Dealer compensation described above, the funds and/or the Distributor may pay fees to the Dealers and their affiliated persons for maintaining fund share balances and/or for subaccounting, administrative or transaction processing services related to the maintenance of accounts for retirement and benefit plans and other omnibus accounts (“subaccounting fees”). Such subaccounting fees paid by the funds may differ depending on the fund and are designed to be equal to or less than the fees the funds would pay to their transfer agent for similar services. Because these subaccounting fees are directly related to the number of accounts and assets for which the Dealers provide services, the fees will increase with the success of the Dealers’ sales activities.
The funds’ portfolio transactions are not used as a form of sales-related compensation to Dealers that sell shares of the funds and the sale of such shares is not considered as a factor in the selection of broker-dealers to execute the funds’ portfolio transactions. The sub-advisers place each fund’s portfolio transactions with broker-dealer firms based on the firm’s ability to provide the best net results from the transaction to the fund. To the extent that a sub-adviser determines that a Dealer can provide a fund with the best net results, the sub-adviser may place the fund’s portfolio transactions with the Dealer even though it sells or has sold shares of the fund.
You can find further information in the SAI about the payments made by the Distributor and its affiliates and services provided by your Dealer. Your Dealer may charge you fees or commissions in addition to those disclosed in this Prospectus. You can also ask your Dealer about any payments it receives from the Distributor and any services your Dealer provides, as well as about fees and/or commissions it charges.
52
FUND SERVICES
Ways to Reduce or Eliminate Sales Charges
You may qualify for a reduction or waiver of the sales charge. If you think you qualify for any of the sales charge waivers described below, you or your financial advisor may need to notify and/or provide certain documentation to us. You or your financial advisor also will need to notify us of the existence of other accounts in which there are holdings eligible to be aggregated to meet certain sales load breakpoints. Information you may need to provide to us includes:
| • | | Information or records regarding shares of the funds held in all accounts at any financial intermediary; |
| • | | Information or records regarding shares of the funds held in any account at any financial intermediary by related parties of the shareholder, such as immediate family members; and/or |
| • | | Any other information that may be necessary for us to determine your eligibility for a reduction or waiver of a sales charge. |
Reducing Sales Charges — Class A Shares Only
There are a number of ways you can lower your sales charges on Class A shares, including:
| • | | Letter of Intent — You are entitled to a reduced sales charge if you execute a Letter of Intent to purchase $100,000 or more of Class A shares at the public offering price within a period of 13 months. Your discount will be determined based on the schedule in the table that appears above in the section entitled “How Sales Charges are Calculated — Class A Shares.” The minimum initial investment under a Letter of Intent is 5% of the amount stated in the Letter of Intent. Class A shares purchased with the first 5% of such amount will be held in escrow (while remaining registered in your name) to secure payment of the higher sales charge that would apply to the shares actually purchased if the full amount stated is not purchased, and such escrowed shares will be involuntarily redeemed to pay the additional sales charge, if necessary. When the full amount has been purchased, the escrow will be released. If you wish to enter into a Letter of Intent, you should complete the appropriate portion of the new account application. At your request, purchases made during the previous 90 days may be included. |
| • | | Rights of Accumulation — You are entitled to a reduced sales charge on additional purchases of a class of shares of a fund if the value of your existing aggregate holdings of a particular fund at the time of the additional purchase calculated at the then applicable net asset value per share or initial purchase price less any redemption, whichever is higher, plus the amount of the additional purchase equals $100,000 or more. Your discount will be determined based on the schedule in the Class A sales charges table above. For purposes of determining the discount, we will aggregate holdings of fund shares of your spouse, immediate family or accounts you control, whether as a single investor or trustee provided that you notify us of the applicable accounts at the time of your additional investment by providing us with appropriate documentation, including the account numbers for all accounts that you are seeking to aggregate. |
Eliminating Sales Charges and the CDSC — Class A Shares Only
Class A shares may be offered without a front-end sales charge or a CDSC to the following individuals and institutions:
| • | | Any government entity that is prohibited from paying a sales charge or commission to purchase mutual fund shares; |
| • | | Representatives and employees, or their immediate family members of broker dealers and other intermediaries that have entered into selling or service arrangements with the Manager or the Distributor; |
| • | | Financial institutions and other financial institutions’ trust departments for funds over which they exercise exclusive discretionary investment authority and which are held in fiduciary, agency, advisory, custodial or similar capacity; |
| • | | Direct referrals by the Manager’s employees; |
| • | | Clients of fee-based/fee-only financial advisors; and |
| • | | State-sponsored Texas 529 qualified tuition savings plan. |
The CDSC will not apply to Class A shares for which the selling dealer is not permitted to receive a sales load or redemption fee imposed on a shareholder with whom such dealer has a fiduciary relationship in accordance with
53
FUND SERVICES
Ways to Reduce or Eliminate Sales Charges (cont’d)
provisions of the Employee Retirement Income Security Act and regulations thereunder, provided that the dealer agrees to certain reimbursement arrangements with the Distributor that are described in the SAI. If the dealer agrees to these reimbursement arrangements, no CDSC will be imposed with respect to Class A shares purchased for $1,000,000 or more.
Eliminating the CDSC
As long as we are notified at the time you sell, the CDSC for any shares may generally be eliminated in the following cases:
| • | | Distributions to participants or beneficiaries of and redemptions (other than redemption of the entire plan account) by plans qualified under Internal Revenue Code (“IRC”) Section 401(a) or from custodial accounts under IRC Section 403(b)(7), IRAs under IRC Section 408(a), participant-directed non-qualified deferred compensation plans under the IRC Section 457 and other employee benefit plans (“plans”), and returns of excess contributions made to these plans; |
| • | | The liquidation of a shareholder’s account if the aggregate net asset value of shares held in the account is less than the required minimum; |
| • | | Redemptions through a systematic withdrawal plan for applicable share classes (however, for Class B shares the amount or percentage you specify in the plan may not exceed, on an annualized basis, 10% of the value of your fund account based upon the value of your fund account on the day you establish your plan); |
| • | | Redemptions of shares of a shareholder (including a registered joint owner) who has died or has become totally disabled (as evidenced by a determination by the federal Social Security Administration); |
| • | | Redemptions made pursuant to any IRA systematic withdrawal based on the shareholder’s life expectancy in accordance with the requirements of the IRC, including substantially equal periodic payments described in IRC Section 72 prior to age 59½ and required minimum distributions after age 70½; or |
| • | | Required minimum distributions from an IRA. |
Repurchasing Fund Shares
If you redeem shares of a fund on which you paid an initial sales charge or are charged a CDSC upon redemption, you will be eligible for a reinstatement privilege if you reinvest the proceeds in shares of the same class of the same fund within 180 days of redemption. Specifically, when you reinvest, the fund, if instructed, will waive any initial sales charge or credit your account with the amount of the CDSC that you previously paid. The reinvested shares will keep their original cost and purchase date for purposes of calculating any future CDSCs. Please note: For federal income tax purposes, a redemption is treated as a sale that involves tax consequences, even if the proceeds are later reinvested. Please consult your tax advisor to determine how a redemption would affect you. The fund may modify or terminate the reinstatement privilege at any time.
If you think you may be eligible for a sales charge elimination or reduction, contact your financial professional or AXA Enterprise Multimanager Funds Trust. Check the SAI for details.
54
FUND SERVICES
It’s Easy to Open an Account
To open an account with AXA Enterprise Funds
| 1. | Read the Prospectus carefully. |
| 2. | Determine how much you wish to invest. The following chart shows the investment minimums for various types of accounts. |
| | | | |
| Type of Account | | Minimum to Open an Account* | | Minimum for Subsequent
Investments* |
| Individual Retail Accounts | | $2000 | | $50 |
| Individual Retirement Accounts (IRAs) | | $ 250 | | $50 |
| Automatic Bank Draft Plan | | $ 250 | | $50** |
| Accounts established in a wrap program with which the AXA Enterprise Funds, AXA Equitable or the Distributor has an agreement. | | $1000 | | $50 |
| Coverdell Education Savings Accounts | | $ 250 | | $50 |
| Corporate retirement accounts, such as 401(k) and 403(b) plans | | No minimum requirement. | | No minimum requirement. |
| * | Does not apply to Class Y shares. |
| ** | The Distributor offers an automatic bank draft plan with a minimum initial investment of $250 through which a fund will, following the initial investment, deduct $50 or more on a monthly basis from the investor’s demand deposit account to invest directly in the funds’ Class A, Class B or Class C shares. |
| 3. | (a) Call your broker or other financial professional who can assist you in all the steps necessary to open an account; or |
(b) complete the appropriate part of the account application, carefully following the instructions. If you have any questions, please call your financial professional or AXA Enterprise Funds Trust at 1-800-432-4320. For more information on AXA Enterprise Funds’ investment programs, refer to the section entitled “Additional Investor Services” in the Prospectus.
| 4. | Use the following sections as your guide for purchasing shares. |
To conform to regulations under the USA PATRIOT Act of 2001, the funds are required to obtain, verify, and record information that identifies each person who opens an account. A new account application includes your name, street address, date of birth and other identification information. The regulations require completion of this information before an account is opened, and you may also be requested to provide other identification documents. In addition, the funds may confirm your identity through the use of identity verification reports provided by consumer reporting agencies. Your personal information will be treated with the utmost confidentiality. If you fail to provide the required information or provide inaccurate information, this may lead to a delay in the processing of your account application and investment. If the funds cannot complete the identification process, your investment and the application may be returned.
A fund will deduct a $35 annual fee from accounts with a balance of less than $1500. This does not apply to Automatic Bank Draft Plan Accounts, Automatic Investment Plan Accounts, Retirement Accounts or Savings Plan Accounts.
Each fund reserves the right to close any fund account whose balance drops to $500 or less due to redemption activity. The fund will not close an account whose balance drops below $500 due to market movement. If an account is closed, its shares will be sold at the NAV, on the day the account is closed. A shareholder will be given at least 45 days’ notice before a fund closes an account with a balance of $500 or less so that the shareholder has an opportunity to increase the account balance.
55
FUND SERVICES
Buying Shares
| | | | |
| | | Opening an Account | | Adding to an Account |
| Through Your Broker or other Financial Professional |
| | | • Call your broker or other financial professional. Your broker or other financial professional can assist you in all the steps necessary to buy shares. | | • Call your broker or other financial professional. |
| By Mail |

| | • Payment for shares must be made with a check in U.S. dollars drawn from a U.S. financial institution, payable to “AXA Enterprise Multimanager Funds Trust.” Cash, third party checks, “starter” checks, traveler’s checks, credit cards, credit card checks or money orders will not be accepted. | | • Payment for shares must be made with a check in U.S. dollars drawn from a U.S. financial institution, payable to “AXA Enterprise Multimanager Funds Trust.” Cash, third party checks, “starter” checks, traveler’s checks, credit cards, credit card checks or money orders will not be accepted. |
| | | • Mail the check with your completed application to: By Regular mail AXA Enterprise Shareholder Services P.O. Box 219731 Kansas City, MO 64121-9731 By Overnight Mail: AXA Enterprise Shareholder Services 330 West 9th Street
Kansas City, Missouri 64105 | | • Fill out detachable investment slip from an account statement. If no slip is available, include with the check a letter specifying the fund name, your class of shares, your account number and the registered account name(s). |
| By Wire |

| | • Call AXA Enterprise Shareholder Services at
1-800-368-3527 to obtain an account number and wire transfer instructions. Your bank may charge you a fee for such a transfer. | | • Visit www.axaenterprise.com to add shares to your account by wire. • Instruct your bank to transfer funds to State Street Bank & Trust ABA # 011000028,
Account # 99047144, Attn: Custody. • Specify the fund name, your class of shares, your account number and the registered account name(s). Your bank may charge you a fee for such a transfer. |
| Automatic Investing Through Automatic Clearing House (“ACH”) |
| Automatic Bank Draft Plan | | • Indicate on your application that you would like to begin an automatic investment plan through ACH and the amount of the monthly investment (subject to $250 initial investment, and $50 minimum subsequently). • Send a check marked “Void” or a deposit slip from your bank account with your application. | | • Please call AXA Enterprise Shareholder Services at 1-800-368-3527 for an ACH Form. A signature guarantee may be required to add this privilege. • Your bank account may be debited monthly for automatic investment into one or more of the funds for each class. Not available for Class Y shares. |
56
FUND SERVICES
Selling Shares
To Sell Some or All of Your Shares
Certain restrictions may apply. See section entitled “Restrictions on Buying, Selling and Exchanging Shares.” In addition, when a shareholder redeems or exchanges shares of an AXA Enterprise Fund (with the exceptions noted herein) which have been held for one month or less, the Trust will assess and retain for the benefit of the remaining shareholders, a short-term trading fee of 2% of the current net asset value of the shares being redeemed or exchanged. For more information, see “Purchase and Redemption Restrictions on Market-Timers and Active Traders.”
| | | | |
| Through Your Broker or other Financial Professional |
| | | • Call your broker or other financial professional. Your broker or other financial professional can assist you in all the steps necessary to sell shares. Your broker or financial professional may charge you for its services. |
| By Mail |
| | • Write a letter to request a redemption specifying the name of the fund, the class of shares, your account number, the exact registered account name(s), the number of shares or the dollar amount to be redeemed and the method by which you wish to receive your proceeds. Additional materials may be required (see section entitled “Selling Shares in Writing” and in particular, the section on signature guarantees). • The request must be signed by all of the owners of the shares including the capacity in which they are signing, if appropriate. • Mail your request to: |
| | | • AXA Enterprise Shareholder Services • P.O. Box 219731 • Kansas City, MO 64121-9731 | | |
| | | • Your proceeds (less any applicable CDSC) will be delivered by the method you choose. If you choose to have your proceeds delivered by mail, they will generally be mailed to you on the business day after the request is received. You may also choose to redeem by wire or through ACH (see below). |
| By Wire |
| | • Fill out the “Telephone Exchange Privilege and/or Telephone Redemption Privilege” and “Bank Account of Record” sections on your account application. • Call AXA Enterprise Shareholder Services at 1-800-368-3527, visit www.axaenterprise.com or indicate in your redemption request letter that you wish to have your proceeds wired to your bank. • If you submit a written request, your proceeds may be wired to the bank currently on file. If written instructions are to send the wire to any other bank, or redemption proceeds are greater than $50,000, a medallion guarantee is required. On a telephone request, your proceeds may be wired only to a bank previously designated by you in writing. To change the name of the single designated bank account to receive wire redemption proceeds, you must send a written request with signature(s) guaranteed to AXA Enterprise Shareholder Services. • Proceeds (less any applicable CDSC) will generally be wired on the next business day. A wire fee (currently $10) will be deducted from the proceeds. Your bank may also charge you a fee. |
| By Systematic Withdrawal Plan |

| | • Please refer to the section entitled “Additional Investor Services” or call AXA Enterprise Shareholder Services at 1-800-368-3527 or your financial professional for more information. • Because withdrawal payments may have tax consequences, you should consult your tax adviser before establishing such a plan. |
57
FUND SERVICES
| | | | |
| By Telephone |
| | • If you have authorized this service, you may redeem your shares by telephone by calling 1-800-368-3527. • If you make a telephone redemption request, you must furnish the name and address of record of the registered owner, the account number and tax ID number, the amount to be redeemed, and the name of the person making the request. |
| | | • Checks for telephone redemptions will be issued only to the registered shareowner(s) and mailed to the last address of record or exchanged into another AXA Enterprise fund. All telephone redemption instructions are recorded and are limited to requests of $50,000 or less. If you have previously linked your bank account to your AXA Enterprise Fund account, you can have the proceeds sent via the ACH system to your bank. • Proceeds (less any applicable CDSC) will generally be sent on the next business day. |
| Participate in the Bank Purchase and Redemption Plan |
| | | • You may initiate an ACH Purchase or Redemption directly to a bank account when you have established proper instructions, including all applicable bank information, on the account. |
58
FUND SERVICES
Selling Shares in Writing
To redeem your shares in writing, all owners of the shares must sign the redemption request in the exact names in which the shares are registered and indicate any special capacity in which they are signing. If a written request to sell is required, a letter of instruction signed by the authorized owner is necessary. In certain situations a signature guarantee or additional documentation may be required.
A medallion guarantee is necessary if:
| • | | Total redemption proceeds exceed $50,000; |
| • | | A proceeds check for any amount is mailed to an address other than the address of record or not sent to the registered owner(s); or |
| • | | Wire instructions indicate that wire proceeds should be sent to a bank other than the bank currently on file. |
A medallion guarantee can be obtained from one of the following sources:
| • | | A financial professional or securities dealer; |
| • | | A federal savings bank, cooperative or other type of bank; |
| • | | A savings and loan or other thrift institution; |
| • | | A securities exchange or clearing agency. |
The table shows account types for which additional documentation may be necessary. Please call your financial professional or AXA Enterprise Shareholder Services regarding requirements for other account types.
| | |
| | |
| Seller (Account Type) | | Requirements for written requests |
| Individual, joint, sole proprietorship, UGMA/UTMA (minor accounts) | | • The signatures on the letter must include all persons authorized to sign, including title, if applicable. • Medallion guarantee, if applicable (see above). |
| Corporate or association accounts | | • The signature on the letter must include all trustees authorized to sign, including title. |
| Owners or trustees of trust accounts | | • The signature on the letter must include all trustees authorized to sign, including title. • If the names of the trustees are not registered on the account, include a copy of the trust document certified within the past 60 days. • Medallion guarantee, if applicable (see above). |
| Power of Attorney (POA) | | • The signatures on the letter must include the attorney-in-fact, indicating such title. • Medallion guarantee, if applicable (see above). • Certified copy of the POA document stating it is still in full force and effect, specifying the exact fund and account number, and certified within 60 days of receipt of instructions.* |
| Qualified retirement benefit plans | | • The signature on the letter must include all trustees authorized to sign, including title. • Medallion guarantee, if applicable (see above). |
| IRAs | | • Additional documentation and distribution forms required. |
| * | Certification may be made on court documents by the court, usually certified by the clerk of court. POA certification may be made by a commercial bank, broker/member of a domestic stock exchange or practicing attorney. |
59
FUND SERVICES
Exchanging Shares
How to Exchange Fund Shares
Shares of each fund generally may be exchanged for shares of the same class of any other AXA Enterprise Fund, which currently includes funds of the Trust and funds comprising AXA Enterprise Funds Trust and The Enterprise Group of Funds, Inc., series of mutual funds for which AXA Equitable or Enterprise Capital Management, Inc. (“Enterprise Capital”), an affiliate of AXA Equitable, serves as the investment manager and for which AXA Equitable or Enterprise Capital has retained one or more sub-advisers to provide day-to-day management, without paying a sales charge or a CDSC. Shares of each AXA Enterprise Fund also may be acquired in exchange for shares of the same class of any other AXA Enterprise Fund without paying a sales charge or CDSC. For more information about any AXA Enterprise Fund that is not described in this prospectus, including each fund’s investment policies and strategies, risks, charges and expenses, visit www.axaenterprise.com or call 1-800-432-4320 for a prospectus. Please read the prospectus carefully before investing.
If an exchange results in opening a new account, you are subject to the applicable minimum investment requirement. All exchanges also are subject to the eligibility requirements of the AXA Enterprise Fund into which you are exchanging. The exchange privilege may be exercised only in those states where shares of the fund may be legally sold. The funds may also discontinue or modify the exchange privilege on a prospective basis at any time upon notice to shareholders in accordance with applicable law. For federal income tax purposes, an exchange of fund shares for shares of another AXA Enterprise Fund is treated as a sale on which gain or loss may be recognized. In addition, when a shareholder redeems or exchanges shares of an AXA Enterprise Fund (with the exceptions noted herein) which have been held for one month or less, the Trust will assess and retain for the benefit of the remaining shareholders, a short-term trading fee of 2% of the current net asset value of the shares being redeemed or exchanged. For more information, see “Purchase and Redemption Restrictions on Market-Timers and Active Traders.”
| | | | |
| Through Your Broker or other Financial Professional |
| | | • Call your broker or other financial professional. Your broker or other financial professional can assist you in all the steps necessary to sell shares. |
| By Mail |
| | • Write a letter to request a redemption specifying the name of the fund from which you are exchanging, the account name(s) and address, the account number, the dollar amount or number of shares to be exchanged and the fund into which you are exchanging. • The request must be signed by all of the owners of the shares including the capacity in which they are signing, if appropriate. • Mail your request to: |
| | | AXAEnterprise Shareholder Services P.O.Box 219731 KansasCity, MO 64121-9731 | | |
| By Telephone |
| | • If you have authorized this service, you may exchange by telephone by calling 1-800-368-3527. • If you make a telephone exchange request, you must furnish the name of the fund from which you are exchanging, the name and address of the registered owner, the account number and tax ID number, the dollar amount or number of shares to be exchanged, the fund into which you are exchanging, and the name of the person making the request. |
| By Website |
| | | • Log into your account portfolio and select “View Account” for the fund from which you would like to make the exchange. On the next screen, choose “Fund Exchange.” Instructions on the following Exchange Request page will guide you through the final process. Previously outlined exchange guidelines apply to any online exchanges. |
60
FUND SERVICES
Restrictions on Buying, Selling and Exchanging Shares
Purchase and Exchange Restrictions
The funds reserve the right to suspend or change the terms of purchasing, selling or exchanging shares.
Purchase and Redemption Restrictions on Market-Timers and Active Traders
Frequent exchanges or purchases and redemptions of AXA Enterprise Fund shares, including market timing and other program trading or short-term trading strategies, may be disruptive to the AXA Enterprise Funds. Such activity may adversely affect fund performance and the interests of long-term investors by requiring the fund to maintain larger amounts of cash or to liquidate portfolio holdings at a disadvantageous time or price. For example, to accomodate frequent trades by investors, a fund may have to sell portfolio securities to have the cash necessary to redeem the market timer’s shares. This can happen when it is not advantageous to sell any securities, so the fund’s performance may be hurt. When large dollar amounts are involved, frequent trading can also make it difficult to use long-term investment strategies because a fund cannot predict how much cash it will have to invest. In addition, disruptive exchanges or purchases and redemptions of fund shares may impede efficient fund management and impose increased transaction costs, such as brokerage and tax costs, by requiring the portfolio manager to effect more frequent purchases and sales of portfolio securities. Similarly, a fund may bear increased administrative costs as a result of the asset level and investment volatility that accompanies patterns of excessive or short-term trading. Funds that invest a significant portion of their assets in foreign securities (e.g., the International Equity Fund) tend to be subject to the risks associated with market timing and short-term trading strategies to a greater extent than funds that do not. Securities trading in overseas markets present time zone arbitrage opportunities when events affecting portfolio securities values occur after the close of the overseas market but prior to the close of the U.S. market. Securities of small- and mid-capitalization companies and high yield securities also present arbitrage opportunities because the market for such securities may be less liquid than the market for the securities of larger companies and higher quality bonds, which could result in pricing inefficiencies.
The Trust and the AXA Enterprise Funds discourage frequent exchanges and purchases and redemptions of AXA Enterprise Fund shares by fund shareholders and will not make special arrangements to accommodate such transactions in AXA Enterprise Fund shares. As a general matter, each AXA Enterprise Fund and the Trust reserve the right to refuse or limit any purchase or exchange order by a particular purchaser (or group of related purchasers) if the transaction is deemed harmful to the AXA Enterprise Fund’s other shareholders or would disrupt the management of the AXA Enterprise Fund.
The Trust’s Board has adopted certain procedures to discourage what it considers to be disruptive trading activity. The Trust seeks to apply such policies and procedures to all shareholders uniformly. It should be recognized, however, that such procedures are subject to limitations:
| • | | They do not eliminate the possibility that disruptive trading activity, including market timing, will occur or that fund performance will be affected by such activity. |
| • | | The design of such procedures involves inherently subjective judgments, which AXA Equitable, on behalf of the Trust, seeks to make in a fair and reasonable manner consistent with the interests of all shareholders. |
| • | | The limits on AXA Equitable’s ability, on behalf of the Trust, to monitor and detect potentially disruptive trading activity and to impose the trading restrictions and redemption fees described herein, particularly in omnibus account arrangements, which means that some shareholders may be treated differently than others, resulting in the risk that some shareholders may be able to engage in frequent purchases and redemptions, while others will bear the effect of that activity. |
If AXA Equitable, on behalf of the Trust, determines that a shareholder’s exchange or purchase and redemption patterns involving the AXA Enterprise Funds are disruptive to the AXA Enterprise Funds, it may, among other things, refuse or limit any purchase or exchange order. AXA Equitable may also refuse to act on exchange or purchase instructions of an agent acting under a power of attorney who is acting on behalf of more than one owner. In making these determinations, AXA Equitable may consider the combined exchange or purchase and redemption activity of shareholders that it believes are under common ownership, control or direction. AXA Equitable currently considers exchanges into and out of (or vice versa) an AXA Enterprise Fund in less than two-week intervals or exchanges of shares held for less than seven days as potentially disruptive transfer activity.
61
FUND SERVICES
In addition, when a shareholder redeems or exchanges shares of an AXA Enterprise Fund (with the exceptions described below) which have been held for one month or less, the Trust will assess and retain for the benefit of the remaining shareholders, a short-term trading fee of 2% of the current net asset value of the shares being redeemed or exchanged. If the short-term trading fee is $50 or less, it may not be assessed on a redemption or exchange; however, during the 30-day period following a purchase or exchange, the fund reserves the right to collect short-term trading fees relating to a series of transactions by a shareholder if, in the aggregate, the fees total more than $50. The AXA Enterprise Funds will use the “first in, first out” method to determine the shareholder’s holding period. Under this method, the date of redemption or exchange will be compared with the earliest purchase date of shares held in the shareholder’s account. The AXA Enterprise Funds reserve the right to modify or discontinue the short-term trading fee at any time or from time to time.
The AXA Enterprise Funds will not assess a redemption fee with respect to certain transactions. At this time, the following shares of the AXA Enterprise Funds will not be subject to the redemption fees:
1. Shares purchased by the reinvestment of dividends or capital gain distributions:
2. Shares redeemed or exchanged by the AXA Enterprise Allocation Funds or the portfolios of the Texas 529 qualified tuition savings plans;
3. Shares redeemed or exchanged through an automatic, nondiscretionary rebalancing or asset reallocation program approved by AXA Equitable; and
4. Shares redeemed by an AXA Enterprise Fund to cover various fees (e.g., account fees).
Consistent with seeking to discourage disruptive trading activity, the Trust may also, in its sole discretion and without further notice, change what it considers potentially disruptive trading activity and its monitoring procedures and thresholds, change the amount of its short-term trading fee, as well as change its procedures to restrict this activity.
Selling Restrictions
The table below describes restrictions placed on selling shares of any fund described in this Prospectus.
| | |
| | |
| Restriction | | Situation |
| The fund may suspend the right of redemption or postpone payment for more than 7 days: | | • When the New York Stock Exchange is closed (other than a weekend/holiday). • During an emergency. • Any other period permitted by the SEC. |
| Each fund reserves the right to suspend account services or refuse transaction requests: | | • With a notice of dispute between registered owners. • With suspicion/evidence of a fraudulent act. |
| A fund may pay the redemption price in whole or part by a distribution in kind of readily marketable securities in lieu of cash or may take up to 7 days to pay a redemption request in order to raise capital: | | • When it is detrimental for a fund to make cash payments as determined in the sole discretion of AXA Equitable. |
| A fund may withhold redemption proceeds until the check or funds have cleared: | | • When redemptions are made within 10 calendar days of purchase by check of the shares being redeemed. |
If you hold certificates representing your shares, they must be sent with your request for it to be honored. The Distributor recommends that certificates be sent by registered mail.
62
FUND SERVICES
How Fund Shares are Priced
“Net asset value” is the price of one share of a fund without a sales charge, and is calculated each business day using the following formula:
| | |
| Net Asset Value = | | Total market value of securities + Cash and other assets – Liabilities
|
| | Number of outstanding shares |
The net asset value of fund shares is determined according to this schedule:
| • | | A share’s net asset value is determined as of the close of regular trading on the New York Stock Exchange (“Exchange”) on the days the Exchange is open for trading. This is normally 4:00 p.m. Eastern Time. |
| • | | The price you pay or receive for purchasing, redeeming or exchanging a share will be based upon the net asset value next calculated after your order is received “in good order” by the Transfer Agent or an approved financial intermediary (plus or minus applicable sales charges). We consider investments to be received in good order when all required documents and your check or wired funds are received by us, the Transfer Agent or an approved financial intermediary. |
| • | | Requests received by the Transfer Agent or an approved financial intermediary after the Exchange closes will be processed based upon the net asset value determined at the close of regular trading on the next day that the Exchange is open. |
| • | | A fund heavily invested in foreign securities may have net asset value changes on days when you cannot buy or sell its shares because foreign securities sometimes trade on days when a fund’s shares are not priced. |
Generally, fund securities are valued as follows:
| • | | Equity securities — most recent sales price or official closing price or if there is no sale or official closing price, latest available bid price. |
| • | | Debt securities (other than short-term obligations) — based upon pricing service valuations. |
| • | | Short-term obligations (with maturities of 60 days or less) — amortized cost (which approximates market value). |
| • | | Securities traded on foreign exchanges — most recent sales or bid price on the foreign exchange or market, unless a significant event or circumstance occurs after the close of that market or exchange that will materially affect its value. In that case, fair value as determined by or under the direction of the Trust’s board of trustees at the close of regular trading on the Exchange. Foreign currency is converted into U.S. dollar equivalent daily at current exchange rates. |
| • | | Options — last sales price or, if not available, previous day’s sales price. Options not traded on an exchange or actively traded are valued according to fair value methods. |
| • | | Futures — last sales price or, if there is no sale, latest available bid price. |
| • | | Investment Company Securities — shares of open-end mutual funds held by a fund will be valued at the net asset value of the shares of such funds as described in the funds’ prospectuses. |
| • | | Other Securities — other securities and assets for which market quotations are not readily available or for which valuation cannot be provided are valued at their fair value as determined in good faith under the direction of the Trust’s board of trustees. For example, a security whose trading has been halted during the trading day may be fair valued based on the available information at the time of the close of the trading market. Similarly, securities for which there is no ready market (e.g., securities of certain small capitalization issuers and certain issuers located in emerging markets) also may be fair valued. Some methods for valuing these securities may include: fundamental analysis (earnings multiple, etc.), matrix pricing, discounts from market prices of similar securities, or discounts applied due to the nature and duration of restrictions on the disposition on the securities. |
Events or circumstances affecting the values of fund securities that occur between the closing of the principal markets and the time the net asset value is determined, such as foreign securities trading on foreign exchanges that may close before the time the net asset value is determined, may be reflected in the Trust’s calculation of net asset values for each applicable fund when the Trust deems that the particular event or circumstance would materially affect such fund’s net asset value. Such events or circumstances may be company specific, such as an earnings report, country or region specific, such as a natural disaster, or global in nature. Such events or circumstances also may include significant price movements in the U.S. securities markets.
The effect of fair value pricing as described above is that securities may not be priced on the basis of quotations from the primary market in which they are traded, but rather may be priced by another method that the Trust’s board of trustees believes reflects fair value. As such, fair value pricing is based on subjective judgments and it is possible that fair value may differ materially from the value realized on a sale. This policy is intended to assure that the fund’s net asset value fairly reflects security values as of the time of pricing. Also, fair valuation of a fund’s portfolio securities can serve to reduce arbitrage opportunities available to short-term traders, but there is no assurance that fair value pricing policies will prevent dilution of the fund’s NAV by those traders.
63
FUND SERVICES
Dividends and Other Distributions
The funds generally distribute most or all of their net investment income and their net realized gains, if any, annually. The Core Bond Fund normally pays income dividends monthly and distributes its net realized gains, if any, annually.
Depending on your investment goals and priorities, you may choose to:
| • | | Reinvest all distributions; |
| • | | Reinvest all distributions in the same class of another AXA Enterprise Fund; |
| • | | Receive income dividends in cash while reinvesting distributions from net capital gains in additional shares of the same class of the fund or in the same class of another AXA Enterprise Fund; or |
| • | | Receive all distributions in cash. |
Unless you indicate otherwise, distributions will automatically be reinvested in shares of the same class of the fund at net asset value.
For more information or to change your distribution option, contact the Trust in writing, contact your broker or call 800-432-4320.
Tax Consequences
Each fund intends to meet all requirements of the Internal Revenue Code necessary to continue to qualify for treatment as a “regulated investment company” and thus does not expect to pay any federal income tax on net income and capital gains it distributes to its shareholders.
Fund distributions paid to you, whether in cash or reinvested in additional shares, are generally taxable to you (unless you invest through a tax-exempt vehicle such as an IRA or 401(K) plan). Distributions derived from net investment income or the excess of net short-term capital gain over net long-term capital loss are taxable at ordinary income tax rates, except that a fund’s dividends attributable to “qualified dividend income” (i.e., dividends received on stock of most U.S. and certain foreign corporations with respect to which the fund satisfies certain holding period, debt-financing and other restrictions) generally are subject to a 15% maximum federal income tax rate for individual shareholders who satisfy those restrictions with respect to the fund shares on which the dividends were paid. Distributions of gains from investments that a fund owned for more than one year and that it designates as capital gain dividends generally are taxable to you as long-term capital gain, regardless of how long you have held fund shares, and also are subject to a 15% maximum federal income tax rate for individual shareholders to the extent the distributions are attributable to net capital gain the fund recognizes on sales or exchanges of capital assets through its last taxable year beginning before January 1, 2009.
An exchange of shares of a fund for shares of another AXA Enterprise Fund is treated as a sale, and any resulting gain or loss will be subject to federal income tax; any such gain an individual shareholder recognizes on a redemption or exchange of his or her fund shares that have been held for more than one year will qualify for the 15% maximum federal income tax rate. If you purchase shares of a fund shortly before it declares a capital gain distribution or a dividend, a portion of the purchase price may be returned to you as a taxable distribution even though it represents, in effect, a partial return of your investment.
If you receive more than $10 in a year in dividends from a fund, you will receive a Form 1099 in January of the following year to help you report the prior year’s distributions and redemption proceeds, if any, on your federal income tax return. Be sure to keep that form as a permanent record. A fee may be charged for any duplicate information requested.
You should consult your tax adviser about any federal, state and local taxes that may apply to the distributions you receive.
64
FUND SERVICES
Additional Information
Additional Investor Services
Automatic Bank Draft Plan
An Automatic Bank Draft Plan is available for investors who wish to purchase shares of one or more of the AXA Enterprise Funds for each class (except Class Y) in amounts of $50 or more on a regular basis by having the amount of the investment automatically deducted from the investor’s checking account. The minimum initial investment for this Plan is $250. Forms authorizing this service are available from the Trust. To join the Automatic Investment Program, please refer to the section entitled “Buying Shares.”
Automatic Dollar Cost Averaging Plan
You may have your shares automatically invested on a monthly basis into the same class of one or more of the AXA Enterprise Funds. As long as you maintain a balance of $2,000 in the account from which you are transferring your shares, you may transfer $50 or more to an established account in another AXA Enterprise Fund or you may open a new account with $250 or more. This policy also applies to Class Y shares if you are not subject to the minimum. To join the Automatic Investment Program, please refer to the section entitled “Buying Shares.”
Automatic Reinvestment Plan
Dividends and capital gains distributions may be automatically reinvested in the same class of shares without a sales charge. This does not apply to the AXA Enterprise Money Market Fund dividends invested in another AXA Enterprise Fund, which may be subject to a sales charge.
Dividend Diversification Program
This program allows you to have all dividends and any other distributions automatically invested in shares of the same class of another AXA Enterprise Fund, subject to the eligibility requirements of that other AXA Enterprise Fund and to state securities law requirements. Shares will be purchased at the selected AXA Enterprise Fund’s net asset value without a front-end sales charge or CDSC on the dividend record date. Before establishing a Dividend Diversification Program into any other AXA Enterprise Fund, please carefully read the relevant information about it in the Prospectus.
Automatic Exchange Plan
AXA Enterprise Funds have an automatic exchange plan under which shares of a class of an AXA Enterprise Fund are automatically exchanged each month for shares for the same class of other AXA Enterprise Funds. There is no fee for exchanges made under this plan, but there may be a sales charge or tax consequences in certain circumstances. Please refer to the SAI for more information.
Systematic Withdrawal Plan
If you have at least $5,000 in your account, you may participate in a systematic withdrawal plan. Under this plan, you may arrange monthly, quarterly, semi-annual or annual automatic withdrawals of at least $100 from any AXA Enterprise Fund. The proceeds of each withdrawal will be mailed to you or as you otherwise direct in writing, including to a life insurance company, including an affiliate of the Manager. The $5,000 minimum account size is not applicable to Individual Retirement Accounts. The maximum annual rate at which Class B shares may be sold under a systematic withdrawal plan is 10% of the net asset value of the account. The funds process sales through a systematic withdrawal plan on the 15th day of the month or the following business day if the 15th is not a business day. Any income or capital gain dividends will be automatically reinvested at net asset value. A sufficient number of full and fractional shares will be redeemed to make the designated payment. Depending upon the size of the payments requested and fluctuations in the net asset value of the shares redeemed, sales for the purpose of making such payments may reduce or even exhaust the account. You should not purchase Class A shares while participating in a systematic withdrawal plan because you may be redeeming shares upon which a sales charge was already paid unless you
65
FUND SERVICES
purchased shares at net asset value. The AXA Enterprise Fund will not knowingly permit additional investments of less than $2,000 if you are making systematic withdrawals at the same time. The AXA Enterprise Fund will waive the CDSC on redemptions of shares made pursuant to a systematic withdrawal plan if the proceeds do not exceed 10% annually of the net asset value of the account. The AXA Enterprise Fund may amend the terms of the systematic withdrawal plan on 30 days’ notice. You or the AXA Enterprise Funds may terminate the plan at any time.
Automatic Bank Purchase Plan
If you have your bank account linked to your AXA Enterprise account, you can call Shareholder Services at 1-800-368-3527 prior to 4:00 p.m. Eastern Standard Time and purchase shares at that day’s closing price. The money will be taken from your bank account within one to five days.
AXA Enterprise Funds-Related Web Site
Visit www.axaenterprise.com to review your account balance and recent transaction, to view daily prices and performance information or to order duplicate account statements and tax information.
Transactions Through Processing Organizations
You may purchase or sell AXA Enterprise Fund shares through an organization that provides recordkeeping and consulting services to 401(k) plans or other employee benefit plans or other omnibus accounts (“Processing Organization”). Processing Organizations may charge you a fee for this service and may require different minimum initial and subsequent investments than the AXA Enterprise Funds. Processing Organizations may also impose other charges or restrictions different from those applicable to shareholders who invest in the AXA Enterprise Funds directly. A Processing Organization, rather than its customers, may be the shareholder of record of your shares. The AXA Enterprise Funds are not responsible for the failure of any Processing Organization to carry out its obligations to its customers. Certain Processing Organizations may receive compensation from AXA Equitable or its affiliates and certain Processing Organizations may receive compensation from the AXA Enterprise Funds for shareholder recordkeeping and similar services.
66
GLOSSARY OF TERMS
Bid price — The price a prospective buyer is ready to pay. This term is used by traders who maintain firm bid and offer prices in a given security by standing ready to buy or sell security units at publicly quoted prices.
Capital gain distributions — Payments to a fund’s shareholders of profits earned from selling securities in that fund’s portfolio. Capital gain distributions are usually paid once a year.
Core investing — An investment style that includes both the strategies used when seeking either growth companies (those with strong earnings growth) or value companies (those that may be temporarily out of favor or have earnings or assets not fully reflected in their stock price).
Derivative — A financial instrument whose value and performance are based on the value and performance of another security or financial instrument.
Diversification — The strategy of investing in a wide range of companies to reduce the risk if an individual company suffers losses.
Duration — A measure of how much a bond’s price fluctuates with changes in interest rates.
Earnings growth — A pattern of increasing rate of growth in earnings per share from one period to another, which usually causes a stock’s price to rise.
Fundamental analysis — An analysis of the balance sheet and income statements of a company in order to forecast its future stock price movements. Fundamental analysis considers past records of assets, earnings, sales, products, management and markets in predicting future trends in these indicators of a company’s success or failure. By appraising a company’s prospects, analysts using such an approach assess whether a particular stock or group of stocks is undervalued or overvalued at its current market price.
Growth investing — An investment style that emphasizes companies with strong earnings growth. Growth investing is generally considered more aggressive than “value” investing.
Interest rate — Rate of interest charged for the use of money, usually expressed as an annual rate.
Market capitalization — Market price of a company’s shares multiplied by number of shares outstanding. A common measure of the relative size of a company.
Net asset value (NAV) — The market value of one share of a fund on any given day without taking into account any front-end sales charge or CDSC. It is determined by dividing a fund’s total net assets by the number of shares outstanding.
Price-to-book value ratio — Current market price of a stock divided by its book value, or net asset value.
Price-to-earnings ratio — Current market price of a stock divided by its earnings per share. Also known as the “multiple,” the price-to-earnings ratio gives investors an idea of how much they are paying for a company’s earning power and is a useful tool for evaluating the costs of different securities.
Value investing — An investment style that focuses on companies that may be temporarily out of favor or have earnings or assets not fully reflected in their stock prices.
Volatility — The general variability of a portfolio’s value resulting from price fluctuations of its investments. In most cases, the more diversified a portfolio is, the less volatile it will be.
Yield — The rate at which a fund earns income, expressed as a percentage. Mutual fund yield calculations are standardized, based upon a formula developed by the Securities and Exchange Commission.
67
DESCRIPTION OF BENCHMARKS
Each Fund’s performance is compared to that of a broad-based securities market index.
Broad-based securities indices are unmanaged and are not subject to fees and expenses typically associated with managed investment company portfolios. Investments cannot be made directly in a broad-based securities index.
Russell 3000 Index
Composed of 3,000 large U.S. securities, as determined by total market capitalization. This index is capitalization weighted and represents approximately 98% of the investable U.S. equity market.
Russell 1000 Growth Index
Contains those Russell 1000 securities (1,000 largest securities in the Russell 3000 Index) with a greater-than-average growth orientation. Securities in this index tend to exhibit higher price-to-book and price-to-earnings ratios, lower dividend yields and higher forecasted growth values than the Value universe.
Russell 1000 Value Index
Contains those Russell 1000 securities (1,000 largest securities in the Russell 3000 Index) with a less-than-average growth orientation. It represents the universe of stocks from which value managers typically select. Securities in this index tend to exhibit lower price-to-book and price-to-earnings ratios, higher dividend yields and lower forecasted growth values than the Growth universe.
Standard & Poor’s 500 Index
Contains 500 of the largest U.S. industrial, transportation, utility and financial companies deemed by Standard and Poor’s to be representative of the larger capitalization portion of the U.S. stock market. The index is capitalization weighted, thereby giving greater weight to companies with the largest market capitalizations.
Russell 1000 Index
Contains 1,000 of the largest companies in the Russell 3000 Index, representing approximately 92% of the total market capitalization of the Russell 3000 Index.
Russell Midcap Growth Index
Contains the bottom 800 companies in the Russell 1000 Index with a greater-than-average growth orientation. Securities in this index tend to exhibit higher price-to-book and price-earnings ratios, lower dividend yields and higher forecasted growth values than the Value universe.
Russell Midcap Value Index
Contains the bottom 800 companies in the Russell 1000 Index with a less-than-average growth orientation. Securities in this index tend to exhibit lower price-to-book and price-earnings ratios, lower dividend yields and lower forecasted growth values than the Growth universe.
68
DESCRIPTION OF BENCHMARKS (cont’d)
Russell 1000 Technology Index
Contains those Russell 1000 securities (1,000 largest securities in the Russell 3000 Index) that are deemed technology companies by the Russell sector classification scheme. This sector includes securities in the following industries: computer hardware, computer software, communications technology, electrical & electronics, semiconductors, and scientific equipment & suppliers. The index is market value weighted.
Russell 1000 Healthcare Index
Contains those Russell 1000 securities (1,000 largest securities in the Russell 3000 Index) that are deemed healthcare companies by the Russell sector classification scheme.
Morgan Stanley Capital International EAFE Index
Contains a market capitalization weighted sampling of securities deemed by Morgan Stanley Capital International to be representative of the market structure of the developed equity markets in Europe, Australasia and the Far East. To construct the index, MSCI targets at least 60% coverage of the market capitalization of each industry within each country in the EAFE index. Companies with less than 40% of their market capitalization publicly traded are float-adjusted to include only a fraction of their market capitalization in the broader EAFE index. EAFE index assumes dividends reinvested net of withholding taxes and do not reflect any fees and expenses.
Lehman Brothers Aggregate Bond Index
Covers the U.S. investment-grade fixed-rate bond market, including government and credit securities, taxable municipal securities, agency mortgage passthrough securities, asset-backed securities, and commercial mortgage-based securities. To qualify for inclusion in the Lehman Brothers Aggregate Bond Index, a bond must have at least one year remaining to final maturity, $200 million in par value outstanding, rated Baa3 or better by Moody’s, and rated BBB- or better by S&P (and if neither is available for CMBS, then Fitch is used) have a fixed coupon rate, and be U.S. dollar denominated.
69
FINANCIAL HIGHLIGHTS
The following financial highlights tables are intended to help you understand each fund’s financial performance for the periods shown. Certain information reflects financial results for a single fund share. The total returns in the tables represent the rate that a shareholder would have earned (or lost) on an investment in the fund (assuming reinvestment of all dividends and distributions).
The financial information in the tables below has been audited by PricewaterhouseCoopers LLP, an independent registered public accounting firm, whose report, along with the Trust’s financial statements, is included in the Trust’s Annual Report. The information should be read in conjunction with the financial statements contained in the Trust’s Annual Report which are incorporated by reference into the Trust’s SAI and available upon request.
AXA ENTERPRISE MULTIMANAGER GROWTH FUND
| | | | | | | | | | | | | | | | | | | | | | | | | | | | | | | | | | | | |
| | | Class A
(New Class)
| | | Class B
| | | Class C
| |
| | | December 13,
2004* to
October 31,
2005(c)(e)
| | | Year Ended October 31,
| | | December 31, 2001* to October 31, 2002(c)
| | | Year Ended October 31,
| | | December 31, 2001* to October 31, 2002(c)
| |
| | | | 2005(c)(e)
| | | 2004(c)
| | | 2003(c)
| | | | 2005(c)(e)
| | | 2004(c)
| | | 2003(c)
| | |
Net asset value, beginning of period | | $ | 9.53 | | | $ | 8.63 | | | $ | 8.57 | | | $ | 7.00 | | | $ | 10.00 | | | $ | 8.62 | | | $ | 8.56 | | | $ | 7.00 | | | $ | 10.00 | |
| | |
|
|
| |
|
|
| |
|
|
| |
|
|
| |
|
|
| |
|
|
| |
|
|
| |
|
|
| |
|
|
|
Income (loss) from investment operations: | | | | | | | | | | | | | | | | | | | | | | | | | | | | | | | | | | | | |
Net investment loss | | | (0.07 | ) | | | (0.13 | ) | | | (0.13 | ) | | | (0.10 | ) | | | (0.10 | ) | | | (0.13 | ) | | | (0.13 | ) | | | (0.10 | ) | | | (0.10 | ) |
Net realized and unrealized gain (loss) on investments | | | 0.30 | | | | 1.06 | | | | 0.19 | | | | 1.68 | | | | (2.90 | ) | | | 1.06 | | | | 0.19 | | | | 1.67 | | | | (2.90 | ) |
| | |
|
|
| |
|
|
| |
|
|
| |
|
|
| |
|
|
| |
|
|
| |
|
|
| |
|
|
| |
|
|
|
Total from investment operations | | | 0.23 | | | | 0.93 | | | | 0.06 | | | | 1.58 | | | | (3.00 | ) | | | 0.93 | | | | 0.06 | | | | 1.57 | | | | (3.00 | ) |
| | |
|
|
| |
|
|
| |
|
|
| |
|
|
| |
|
|
| |
|
|
| |
|
|
| |
|
|
| |
|
|
|
Redemption fees | | | — | # | | | — | | | | — | | | | — | | | | — | | | | — | | | | — | | | | — | | | | — | |
| | |
|
|
| |
|
|
| |
|
|
| |
|
|
| |
|
|
| |
|
|
| |
|
|
| |
|
|
| |
|
|
|
Less distributions: | | | | | | | | | | | | | | | | | | | | | | | | | | | | | | | | | | | | |
Dividends from net investment income | | | — | | | | — | | | | — | | | | (0.01 | ) | | | — | | | | — | | | | — | | | | (0.01 | ) | | | — | |
| | |
|
|
| |
|
|
| |
|
|
| |
|
|
| |
|
|
| |
|
|
| |
|
|
| |
|
|
| |
|
|
|
Net asset value, end of period | | $ | 9.76 | | | $ | 9.56 | | | $ | 8.63 | | | $ | 8.57 | | | $ | 7.00 | | | $ | 9.55 | | | $ | 8.62 | | | $ | 8.56 | | | $ | 7.00 | |
| | |
|
|
| |
|
|
| |
|
|
| |
|
|
| |
|
|
| |
|
|
| |
|
|
| |
|
|
| |
|
|
|
Total return (b)† | | | 2.41 | % | | | 10.78 | % | | | 0.70 | % | | | 22.52 | % | | | (30.00 | )% | | | 10.66 | % | | | 0.82 | % | | | 22.37 | % | | | (30.00 | )% |
| | |
|
|
| |
|
|
| |
|
|
| |
|
|
| |
|
|
| |
|
|
| |
|
|
| |
|
|
| |
|
|
|
Ratios/Supplemental Data: | | | | | | | | | | | | | | | | | | | | | | | | | | | | | | | | | | | | |
Net assets, end of period (000’s) | | $ | 372 | | | $ | 159 | | | $ | 2,544 | | | $ | 2,497 | | | $ | 1,732 | | | $ | 266 | | | $ | 265 | | | $ | 325 | | | $ | 243 | |
Ratio of expenses to average net assets: | | | | | | | | | | | | | | | | | | | | | | | | | | | | | | | | | | | | |
After waivers and reimbursements (a) | | | 1.65 | % | | | 2.20 | % | | | 2.20 | % | | | 2.20 | % | | | 2.20 | % | | | 2.20 | % | | | 2.20 | % | | | 2.20 | % | | | 2.20 | % |
After waivers, reimbursements and fees paid indirectly (a) | | | 1.63 | % | | | 2.18 | % | | | 2.16 | % | | | 2.17 | % | | | 2.15 | % | | | 2.18 | % | | | 2.16 | % | | | 2.17 | % | | | 2.15 | % |
Before waivers, reimbursements and fees paid indirectly (a) | | | 5.00 | % | | | 5.55 | % | | | 5.98 | % | | | 6.73 | % | | | 7.46 | % | | | 5.55 | % | | | 5.98 | % | | | 6.73 | % | | | 7.46 | % |
Ratio of net investment loss to average net assets: | | | | | | | | | | | | | | | | | | | | | | | | | | | | | | | | | | | | |
After waivers and reimbursements (a) | | | (0.87 | )% | | | (1.42 | )% | | | (1.56 | )% | | | (1.41 | )% | | | (1.49 | )% | | | (1.42 | )% | | | (1.56 | )% | | | (1.41 | )% | | | (1.49 | )% |
After waivers, reimbursements and fees paid indirectly (a) | | | (0.85 | )% | | | (1.40 | )% | | | (1.52 | )% | | | (1.38 | )% | | | (1.44 | )% | | | (1.40 | )% | | | (1.52 | )% | | | (1.38 | )% | | | (1.44 | )% |
Before waivers, reimbursements and fees paid indirectly (a) | | | (4.22 | )% | | | (4.77 | )% | | | (5.34 | )% | | | (5.94 | )% | | | (6.75 | )% | | | (4.77 | )% | | | (5.34 | )% | | | (5.94 | )% | | | (6.75 | )% |
Portfolio turnover rate (d) | | | 40 | % | | | 40 | % | | | 51 | % | | | 31 | % | | | 26 | % | | | 40 | % | | | 51 | % | | | 31 | % | | | 26 | % |
Effect of contractual expense limitation during the period: | | | | | | | | | | | | | | | | | | | | | | | | | | | | | | | | | | | | |
Per share benefit to net investment loss | | $ | 0.28 | | | $ | 0.30 | | | $ | 0.33 | | | $ | 0.34 | | | $ | 0.34 | | | $ | 0.30 | | | $ | 0.33 | | | $ | 0.34 | | | $ | 0.34 | |
70
AXA ENTERPRISE MULTIMANAGER GROWTH FUND (cont’d)
| | | | | | | | | | | | | | | | | | | | | | | | | | | | | | | | |
| | | Class P (formerly Class A)
| | | Class Y (formerly Class Z)
| |
| | | Year Ended October 31,
| | | December 31, 2001* to October 31, 2002(c)
| | | Year Ended October 31,
| | | December 31, 2001* to October 31, 2002(c)
| |
| | | 2005(c)(e)
| | | 2004(c)
| | | 2003(c)
| | | | 2005(c)(e)
| | | 2004(c)
| | | 2003(c)
| | |
Net asset value, beginning of period | | $ | 8.77 | | | $ | 8.64 | | | $ | 7.05 | | | $ | 10.00 | | | $ | 8.79 | | | $ | 8.65 | | | $ | 7.06 | | | $ | 10.00 | |
| | |
|
|
| |
|
|
| |
|
|
| |
|
|
| |
|
|
| |
|
|
| |
|
|
| |
|
|
|
Income (loss) from investment operations: | | | | | | | | | | | | | | | | | | | | | | | | | | | | | | | | |
Net investment loss | | | (0.06 | ) | | | (0.07 | ) | | | (0.05 | ) | | | (0.05 | ) | | | (0.04 | ) | | | (0.05 | ) | | | (0.03 | ) | | | (0.03 | ) |
Net realized and unrealized gain (loss) on investments | | | 1.07 | | | | 0.20 | | | | 1.69 | | | | (2.90 | ) | | | 1.08 | | | | 0.20 | | | | 1.69 | | | | (2.91 | ) |
| | |
|
|
| |
|
|
| |
|
|
| |
|
|
| |
|
|
| |
|
|
| |
|
|
| |
|
|
|
Total from investment operations | | | 1.01 | | | | 0.13 | | | | 1.64 | | | | (2.95 | ) | | | 1.04 | | | | 0.15 | | | | 1.66 | | | | (2.94 | ) |
| | |
|
|
| |
|
|
| |
|
|
| |
|
|
| |
|
|
| |
|
|
| |
|
|
| |
|
|
|
Redemption fees | | | — | | | | — | | | | — | | | | — | | | | — | | | | — | | | | — | | | | — | |
| | |
|
|
| |
|
|
| |
|
|
| |
|
|
| |
|
|
| |
|
|
| |
|
|
| |
|
|
|
Less distributions: | | | | | | | | | | | | | | | | | | | | | | | | | | | | | | | | |
Dividends from net investment income | | | — | | | | — | | | | (0.05 | ) | | | — | | | | (0.01 | ) | | | (0.01 | ) | | | (0.07 | ) | | | — | |
| | |
|
|
| |
|
|
| |
|
|
| |
|
|
| |
|
|
| |
|
|
| |
|
|
| |
|
|
|
Net asset value, end of period | | $ | 9.78 | | | $ | 8.77 | | | $ | 8.64 | | | $ | 7.05 | | | $ | 9.82 | | | $ | 8.79 | | | $ | 8.65 | | | $ | 7.06 | |
| | |
|
|
| |
|
|
| |
|
|
| |
|
|
| |
|
|
| |
|
|
| |
|
|
| |
|
|
|
Total return (b)† | | | 11.52 | % | | | 1.50 | % | | | 23.38 | % | | | (29.50 | )% | | | 11.83 | % | | | 1.72 | % | | | 23.66 | % | | | (29.40 | )% |
| | |
|
|
| |
|
|
| |
|
|
| |
|
|
| |
|
|
| |
|
|
| |
|
|
| |
|
|
|
Ratios/Supplemental Data: | | | | | | | | | | | | | | | | | | | | | | | | | | | | | | | | |
Net assets, end of period (000’s) | | $ | 3,774 | | | $ | 2,146 | | | $ | 2,199 | | | $ | 1,429 | | | $ | 6,191 | | | $ | 5,682 | | | $ | 6,028 | | | $ | 4,567 | |
Ratio of expenses to average net assets: | | | | | | | | | | | | | | | | | | | | | | | | | | | | | | | | |
After waivers and reimbursements (a) | | | 1.45 | % | | | 1.45 | % | | | 1.45 | % | | | 1.45 | % | | | 1.20 | % | | | 1.20 | % | | | 1.20 | % | | | 1.20 | % |
After waivers, reimbursements and fees paid indirectly (a) | | | 1.43 | % | | | 1.41 | % | | | 1.42 | % | | | 1.40 | % | | | 1.18 | % | | | 1.16 | % | | | 1.17 | % | | | 1.15 | % |
Before waivers, reimbursements and fees paid indirectly (a) | | | 4.80 | % | | | 5.23 | % | | | 5.98 | % | | | 6.71 | % | | | 4.55 | % | | | 4.98 | % | | | 5.73 | % | | | 6.46 | % |
Ratio of net investment loss to average net assets: | | | | | | | | | | | | | | | | | | | | | | | | | | | | | | | | |
After waivers and reimbursements (a) | | | (0.67 | )% | | | (0.81 | )% | | | (0.66 | )% | | | (0.74 | )% | | | (0.42 | )% | | | (0.56 | )% | | | (0.41 | )% | | | (0.49 | )% |
After waivers, reimbursements and fees paid indirectly (a) | | | (0.65 | )% | | | (0.77 | )% | | | (0.63 | )% | | | (0.69 | )% | | | (0.40 | )% | | | (0.52 | )% | | | (0.38 | )% | | | (0.44 | )% |
Before waivers, reimbursements and fees paid indirectly (a) | | | (4.02 | )% | | | (4.59 | )% | | | (5.19 | )% | | | (6.00 | )% | | | (3.77 | )% | | | (4.34 | )% | | | (4.94 | )% | | | (5.75 | )% |
Portfolio turnover rate (d) | | | 40 | % | | | 51 | % | | | 31 | % | | | 26 | % | | | 40 | % | | | 51 | % | | | 31 | % | | | 26 | % |
Effect of contractual expense limitation during the period: | | | | | | | | | | | | | | | | | | | | | | | | | | | | | | | | |
Per share benefit to net investment loss | | $ | 0.31 | | | $ | 0.33 | | | $ | 0.34 | | | $ | 0.34 | | | $ | 0.31 | | | $ | 0.33 | | | $ | 0.34 | | | $ | 0.36 | |
71
AXA ENTERPRISE MULTIMANAGER CORE EQUITY FUND
| | | | | | | | | | | | | | | | | | | | | | | | | | | | | | | | | | | | |
| | | Class A
(New Class)
| | | Class B
| | | Class C
| |
| | | December 13,
2004* to
October 31,
2005(c)(e)
| | | Year Ended October 31,
| | | December 31,
2001* to
October 31, 2002(c)
| | | Year Ended October 31,
| | | December 31,
2001* to October 31, 2002(c)
| |
| | | | 2005(c)(e)
| | | 2004(c)
| | | 2003(c)
| | | | 2005(c)(e)
| | | 2004(c)
| | | 2003(c)
| | |
Net asset value, beginning of period | | $ | 10.56 | | | $ | 9.78 | | | $ | 9.21 | | | $ | 7.70 | | | $ | 10.00 | | | $ | 9.78 | | | $ | 9.21 | | | $ | 7.69 | | | $ | 10.00 | |
| | |
|
|
| |
|
|
| |
|
|
| |
|
|
| |
|
|
| |
|
|
| |
|
|
| |
|
|
| |
|
|
|
Income (loss) from investment operations: | | | | | | | | | | | | | | | | | | | | | | | | | | | | | | | | | | | | |
Net investment income (loss) | | | 0.03 | | | | (0.02 | ) | | | (0.07 | ) | | | (0.05 | ) | | | (0.05 | ) | | | (0.02 | ) | | | (0.07 | ) | | | (0.05 | ) | | | (0.05 | ) |
Net realized and unrealized gain (loss) on investments and foreign currency transactions | | | 0.35 | | | | 0.96 | | | | 0.64 | | | | 1.61 | | | | (2.25 | ) | | | 0.96 | | | | 0.64 | | | | 1.62 | | | | (2.26 | ) |
| | |
|
|
| |
|
|
| |
|
|
| |
|
|
| |
|
|
| |
|
|
| |
|
|
| |
|
|
| |
|
|
|
Total from investment operations | | | 0.38 | | | | 0.94 | | | | 0.57 | | | | 1.56 | | | | (2.30 | ) | | | 0.94 | | | | 0.57 | | | | 1.57 | | | | (2.31 | ) |
| | |
|
|
| |
|
|
| |
|
|
| |
|
|
| |
|
|
| |
|
|
| |
|
|
| |
|
|
| |
|
|
|
Less distributions: | | | | | | | | | | | | | | | | | | | | | | | | | | | | | | | | | | | | |
Dividends from net investment income | | | — | | | | — | | | | — | | | | (0.05 | ) | | | — | | | | — | | | | — | | | | (0.05 | ) | | | — | |
| | |
|
|
| |
|
|
| |
|
|
| |
|
|
| |
|
|
| |
|
|
| |
|
|
| |
|
|
| |
|
|
|
Net asset value, end of period | | $ | 10.94 | | | $ | 10.72 | | | $ | 9.78 | | | $ | 9.21 | | | $ | 7.70 | | | $ | 10.72 | | | $ | 9.78 | | | $ | 9.21 | | | $ | 7.69 | |
| | |
|
|
| |
|
|
| |
|
|
| |
|
|
| |
|
|
| |
|
|
| |
|
|
| |
|
|
| |
|
|
|
Total return (b)† | | | 3.60 | % | | | 9.61 | % | | | 6.19 | % | | | 20.37 | % | | | 23.00 | % | | | 9.61 | % | | | 6.19 | % | | | 20.53 | % | | | 23.10 | % |
| | |
|
|
| |
|
|
| |
|
|
| |
|
|
| |
|
|
| |
|
|
| |
|
|
| |
|
|
| |
|
|
|
Ratios/Supplemental Data: | | | | | | | | | | | | | | | | | | | | | | | | | | | | | | | | | | | | |
Net assets, end of period (000’s) | | $ | 401 | | | $ | 229 | | | $ | 2,987 | | | $ | 2,765 | | | $ | 2,010 | | | $ | 363 | | | $ | 392 | | | $ | 408 | | | $ | 293 | |
Ratio of expenses to average net assets: | | | | | | | | | | | | | | | | | | | | | | | | | | | | | | | | | | | | |
After waivers and reimbursements (a) | | | 1.65 | % | | | 2.20 | % | | | 2.20 | % | | | 2.20 | % | | | 2.20 | % | | | 2.20 | % | | | 2.20 | % | | | 2.20 | % | | | 2.20 | % |
After waivers, reimbursements and fees paid
indirectly (a) | | | 1.61 | % | | | 2.16 | % | | | 2.15 | % | | | 2.19 | % | | | 2.13 | % | | | 2.16 | % | | | 2.15 | % | | | 2.19 | % | | | 2.13 | % |
Before waivers, reimbursements and fees paid
indirectly (a) | | | 4.57 | % | | | 5.12 | % | | | 5.55 | % | | | 6.31 | % | | | 6.83 | % | | | 5.12 | % | | | 5.55 | % | | | 6.31 | % | | | 6.83 | % |
Ratio of net investment income (loss) to average net assets: | | | | | | | | | | | | | | | | | | | | | | | | | | | | | | | | | | | | |
After waivers and reimbursements (a) | | | 0.27 | % | | | (0.28 | )% | | | (0.78 | )% | | | (0.62 | )% | | | (0.69 | )% | | | (0.28 | )% | | | (0.78 | )% | | | (0.62 | )% | | | (0.69 | )% |
After waivers, reimbursements and fees paid
indirectly (a) | | | 0.31 | % | | | (0.24 | )% | | | (0.73 | )% | | | (0.61 | )% | | | (0.62 | )% | | | (0.24 | )% | | | (0.73 | )% | | | (0.61 | )% | | | (0.62 | )% |
Before waivers, reimbursements and fees paid
indirectly (a) | | | (2.65 | )% | | | (3.20 | )% | | | (4.13 | )% | | | (4.73 | )% | | | (5.31 | )% | | | (3.20 | )% | | | (4.13 | )% | | | (4.73 | )% | | | (5.31 | )% |
Portfolio turnover rate (d) | | | 48 | % | | | 48 | % | | | 52 | % | | | 56 | % | | | 39 | % | | | 48 | % | | | 52 | % | | | 56 | % | | | 39 | % |
Effect of contractual expense limitation during
the period: | | | | | | | | | | | | | | | | | | | | | | | | | | | | | | | | | | | | |
Per share benefit to net investment
income (loss) | | $ | 0.28 | | | $ | 0.30 | | | $ | 0.32 | | | $ | 0.34 | | | $ | 0.33 | | | $ | 0.30 | | | $ | 0.32 | | | $ | 0.34 | | | $ | 0.33 | |
72
AXA ENTERPRISE MULTIMANAGER CORE EQUITY FUND (cont’d)
| | | | | | | | | | | | | | | | | | | | | | | | | | | | | | | | |
| | | Class P (formerly Class A)
| | | Class Y (formerly Class Z)
| |
| | | Year Ended October 31,
| | | December 31,
2001* to
October 31, 2002(c)
| | | Year Ended October 31,
| | | December 31,
2001* to October 31, 2002(c)
| |
| | | 2005(c)(e)
| | | 2004(c)
| | | 2003(c)
| | | | 2005(c)(e)
| | | 2004(c)
| | | 2003(c)
| | |
Net asset value, beginning of period | | $ | 9.92 | | | $ | 9.27 | | | $ | 7.75 | | | $ | 10.00 | | | $ | 9.95 | | | $ | 9.28 | | | $ | 7.76 | | | $ | 10.00 | |
| | |
|
|
| |
|
|
| |
|
|
| |
|
|
| |
|
|
| |
|
|
| |
|
|
| |
|
|
|
Income (loss) from investment operations: | | | | | | | | | | | | | | | | | | | | | | | | | | | | | | | | |
Net investment income (loss) | | | 0.05 | | | | — | # | | | 0.01 | | | | — | # | | | 0.08 | | | | 0.03 | | | | 0.03 | | | | 0.02 | |
Net realized and unrealized gain (loss) on investments and foreign currency transactions | | | 0.98 | | | | 0.65 | | | | 1.62 | | | | (2.25 | ) | | | 0.99 | | | | 0.65 | | | | 1.62 | | | | (2.26 | ) |
| | |
|
|
| |
|
|
| |
|
|
| |
|
|
| |
|
|
| |
|
|
| |
|
|
| |
|
|
|
Total from investment operations | | | 1.03 | | | | 0.65 | | | | 1.63 | | | | (2.25 | ) | | | 1.07 | | | | 0.68 | | | | 1.65 | | | | (2.24 | ) |
| | |
|
|
| |
|
|
| |
|
|
| |
|
|
| |
|
|
| |
|
|
| |
|
|
| |
|
|
|
Less distributions: | | | | | | | | | | | | | | | | | | | | | | | | | | | | | | | | |
Dividends from net investment income | | | (0.02 | ) | | | — | | | | (0.11 | ) | | | — | | | | (0.05 | ) | | | (0.01 | ) | | | (0.13 | ) | | | — | |
| | |
|
|
| |
|
|
| |
|
|
| |
|
|
| |
|
|
| |
|
|
| |
|
|
| |
|
|
|
Net asset value, end of period | | $ | 10.93 | | | $ | 9.92 | | | | 9.27 | | | | 7.75 | | | $ | 10.97 | | | $ | 9.95 | | | $ | 9.28 | | | $ | 7.76 | |
| | |
|
|
| |
|
|
| |
|
|
| |
|
|
| |
|
|
| |
|
|
| |
|
|
| |
|
|
|
Total return (b)† | | | 10.41 | % | | | 7.01 | % | | | 21.29 | % | | | (22.50 | )% | | | 10.76 | % | | | 7.29 | % | | | 21.57 | % | | | (22.40 | )% |
| | |
|
|
| |
|
|
| |
|
|
| |
|
|
| |
|
|
| |
|
|
| |
|
|
| |
|
|
|
Ratios/Supplemental Data: | | | | | | | | | | | | | | | | | | | | | | | | | | | | | | | | |
Net assets, end of period (000’s) | | $ | 4,165 | | | $ | 2,317 | | | $ | 2,011 | | | $ | 1,335 | | | $ | 7,315 | | | $ | 6,949 | | | $ | 6,776 | | | $ | 5,248 | |
Ratio of expenses to average net assets: | | | | | | | | | | | | | | | | | | | | | | | | | | | | | | | | |
After waivers and reimbursements (a) | | | 1.45 | % | | | 1.45 | % | | | 1.45 | % | | | 1.45 | % | | | 1.20 | % | | | 1.20 | % | | | 1.20 | % | | | 1.20 | % |
After waivers, reimbursements and fees paid indirectly (a) | | | 1.41 | % | | | 1.40 | % | | | 1.44 | % | | | 1.38 | % | | | 1.16 | % | | | 1.15 | % | | | 1.19 | % | | | 1.13 | % |
Before waivers, reimbursements and fees paid indirectly (a) | | | 4.37 | % | | | 4.80 | % | | | 5.56 | % | | | 6.08 | % | | | 4.12 | % | | | 4.55 | % | | | 5.31 | % | | | 5.83 | % |
Ratio of net investment income (loss) to average net assets: | | | | | | | | | | | | | | | | | | | | | | | | | | | | | | | | |
After waivers and reimbursements (a) | | | 0.47 | % | | | (0.03 | )% | | | 0.13 | % | | | 0.06 | % | | | 0.72 | % | | | 0.22 | % | | | 0.38 | % | | | 0.31 | % |
After waivers, reimbursements and fees paid indirectly (a) | | | 0.51 | % | | | 0.02 | % | | | 0.14 | % | | | 0.13 | % | | | 0.76 | % | | | 0.27 | % | | | 0.39 | % | | | 0.38 | % |
Before waivers, reimbursements and fees paid indirectly (a) | | | (2.45 | )% | | | (3.38 | )% | | | (3.98 | )% | | | (4.56 | )% | | | (2.20 | )% | | | (3.13 | )% | | | (3.73 | )% | | | (4.31 | )% |
Portfolio turnover rate (d) | | | 48 | % | | | 52 | % | | | 56 | % | | | 39 | % | | | 48 | % | | | 52 | % | | | 56 | % | | | 39 | % |
Effect of contractual expense limitation during the period: | | | | | | | | | | | | | | | | | | | | | | | | | | | | | | | | |
Per share benefit to net investment income (loss) | | $ | 0.31 | | | $ | 0.33 | | | $ | 0.34 | | | $ | 0.32 | | | $ | 0.31 | | | $ | 0.33 | | | $ | 0.34 | | | $ | 0.34 | |
73
AXA ENTERPRISE MULTIMANAGER VALUE FUND
| | | | | | | | | | | | | | | | | | | | | | | | | | | | | | | | | | | | |
| | | Class A
(New Class)
| | | Class B
| | | Class C
| |
| | | December 13,
2004* to
October 31,
2005(c)(e)
| | | Year Ended October 31,
| | | December 31,
2001* to
October 31, 2002(c)
| | | Year Ended October 31,
| | | December 31,
2001* to October 31, 2002(c)
| |
| | | | 2005(c)(e)
| | | 2004
| | | 2003(c)
| | | | 2005(c)(e)
| | | 2004
| | | 2003(c)
| | |
Net asset value, beginning of period | | $ | 11.61 | | | $ | 10.80 | | | $ | 9.46 | | | $ | 7.96 | | | $ | 10.00 | | | $ | 10.81 | | | $ | 9.46 | | | $ | 7.95 | | | $ | 10.00 | |
| | |
|
|
| |
|
|
| |
|
|
| |
|
|
| |
|
|
| |
|
|
| |
|
|
| |
|
|
| |
|
|
|
Income (loss) from investment operations: | | | | | | | | | | | | | | | | | | | | | | | | | | | | | | | | | | | | |
Net investment income (loss) | | | 0.06 | | | | — | # | | | 0.01 | | | | — | # | | | (0.02 | ) | | | — | # | | | 0.01 | | | | — | # | | | (0.02 | ) |
Net realized and unrealized gain (loss) on investments and foreign currency transactions | | | 0.53 | | | | 1.26 | | | | 1.33 | | | | 1.59 | | | | (2.02 | ) | | | 1.26 | | | | 1.34 | | | | 1.60 | | | | (2.03 | ) |
| | |
|
|
| |
|
|
| |
|
|
| |
|
|
| |
|
|
| |
|
|
| |
|
|
| |
|
|
| |
|
|
|
Total from investment operations | | | 0.59 | | | | 1.26 | | | | 1.34 | | | | 1.59 | | | | (2.04 | ) | | | 1.26 | | | | 1.35 | | | | 1.60 | | | | (2.05 | ) |
| | |
|
|
| |
|
|
| |
|
|
| |
|
|
| |
|
|
| |
|
|
| |
|
|
| |
|
|
| |
|
|
|
Less distributions: | | | | | | | | | | | | | | | | | | | | | | | | | | | | | | | | | | | | |
Dividends from net investment income | | | (0.07 | ) | | | (0.01 | ) | | | — | | | | (0.09 | ) | | | — | | | | (0.01 | ) | | | — | | | | (0.09 | ) | | | — | |
Distributions from realized gains | | | (0.17 | ) | | | (0.17 | ) | | | — | | | | — | | | | — | | | | (0.17 | ) | | | — | | | | — | | | | — | |
| | |
|
|
| |
|
|
| |
|
|
| |
|
|
| |
|
|
| |
|
|
| |
|
|
| |
|
|
| |
|
|
|
Total dividends and distributions | | | (0.24 | ) | | | (0.18 | ) | | | — | | | | (0.09 | ) | | | — | | | | (0.18 | ) | | | — | | | | (0.09 | ) | | | — | |
| | |
|
|
| |
|
|
| |
|
|
| |
|
|
| |
|
|
| |
|
|
| |
|
|
| |
|
|
| |
|
|
|
Net asset value, end of period | | $ | 11.96 | | | $ | 11.88 | | | $ | 10.80 | | | $ | 9.46 | | | $ | 7.96 | | | $ | 11.89 | | | $ | 10.81 | | | $ | 9.46 | | | $ | 7.95 | |
| | |
|
|
| |
|
|
| |
|
|
| |
|
|
| |
|
|
| |
|
|
| |
|
|
| |
|
|
| |
|
|
|
Total return (b)† | | | 5.19 | % | | | 11.60 | % | | | 14.27 | % | | | 20.28 | % | | | (20.50 | )% | | | 11.70 | % | | | 14.27 | % | | | 20.28 | % | | | (20.50 | )% |
| | |
|
|
| |
|
|
| |
|
|
| |
|
|
| |
|
|
| |
|
|
| |
|
|
| |
|
|
| |
|
|
|
Ratios/Supplemental Data: | | | | | | | | | | | | | | | | | | | | | | | | | | | | | | | | | | | | |
Net assets, end of period (000’s) | | $ | 356 | | | $ | 332 | | | $ | 2,787 | | | $ | 2,818 | | | $ | 2,217 | | | $ | 494 | | | $ | 375 | | | $ | 386 | | | $ | 315 | |
Ratio of expenses to average net assets: | | | | | | | | | | | | | | | | | | | | | | | | | | | | | | | | | | | | |
After waivers and reimbursements (a) | | | 1.65 | % | | | 2.20 | % | | | 2.20 | % | | | 2.20 | % | | | 2.20 | % | | | 2.20 | % | | | 2.20 | % | | | 2.20 | % | | | 2.20 | % |
After waivers, reimbursements and fees paid
indirectly (a) | | | 1.56 | % | | | 2.11 | % | | | 2.02 | % | | | 2.10 | % | | | 2.10 | % | | | 2.11 | % | | | 2.02 | % | | | 2.10 | % | | | 2.10 | % |
Before waivers, reimbursements and fees paid indirectly (a) | | | 3.38 | % | | | 3.93 | % | | | 5.68 | % | | | 6.55 | % | | | 6.94 | % | | | 3.93 | % | | | 5.68 | % | | | 6.55 | % | | | 6.94 | % |
Ratio of net investment income (loss) to average net assets: | | | | | | | | | | | | | | | | | | | | | | | | | | | | | | | | | | | | |
After waivers and reimbursements (a) | | | 0.47 | % | | | (0.08 | )% | | | (0.12 | )% | | | (0.07 | )% | | | (0.28 | )% | | | (0.08 | )% | | | (0.12 | )% | | | (0.07 | )% | | | (0.28 | )% |
After waivers, reimbursements and fees paid
indirectly (a) | | | 0.56 | % | | | 0.01 | % | | | 0.06 | % | | | 0.03 | % | | | (0.18 | )% | | | 0.01 | % | | | 0.06 | % | | | 0.03 | % | | | (0.18 | )% |
Before waivers, reimbursements and fees paid indirectly (a) | | | (1.26 | )% | | | (1.81 | )% | | | (3.60 | )% | | | (4.42 | )% | | | (5.01 | )% | | | (1.81 | )% | | | (3.60 | )% | | | (4.42 | )% | | | (5.01 | )% |
Portfolio turnover rate (d) | | | 85 | % | | | 85 | % | | | 108 | % | | | 148 | % | | | 123 | % | | | 85 | % | | | 108 | % | | | 148 | % | | | 123 | % |
Effect of contractual expense limitation during the period: | | | | | | | | | | | | | | | | | | | | | | | | | | | | | | | | | | | | |
Per share benefit to net investment income (loss) | | $ | 0.18 | | | $ | 0.20 | | | $ | 0.36 | | | $ | 0.37 | | | $ | 0.35 | | | $ | 0.20 | | | $ | 0.36 | | | $ | 0.37 | | | $ | 0.36 | |
74
AXA ENTERPRISE MULTIMANAGER VALUE FUND (cont’d)
| | | | | | | | | | | | | | | | | | | | | | | | | | | | | | | | |
| | | Class P (formerly Class A)
| | | Class Y (formerly Class Z)
| |
| | | Year Ended October 31,
| | | December 31,
2001* to October 31, 2002(c)
| | | Year Ended October 31,
| | | December 31,
2001* to October 31, 2002(c)
| |
| | | 2005
(c)(e)
| | | 2004
| | | 2003
(c)
| | | | 2005
(c)(e)
| | | 2004
| | | 2003
(c)
| | |
Net asset value, beginning of period | | $ | 10.88 | | | $ | 9.51 | | | $ | 7.99 | | | $ | 10.00 | | | $ | 10.92 | | | $ | 9.54 | | | $ | 8.02 | | | $ | 10.00 | |
| | |
|
|
| |
|
|
| |
|
|
| |
|
|
| |
|
|
| |
|
|
| |
|
|
| |
|
|
|
Income (loss) from investment operations: | | | | | | | | | | | | | | | | | | | | | | | | | | | | | | | | |
Net investment income (loss) | | | 0.09 | | | | 0.08 | | | | 0.07 | | | | 0.04 | | | | 0.12 | | | | 0.11 | | | | 0.09 | | | | 0.06 | |
Net realized and unrealized gain (loss) on investments and foreign currency transactions | | | 1.25 | | | | 1.34 | | | | 1.60 | | | | (2.05 | ) | | | 1.26 | | | | 1.35 | | | | 1.60 | | | | (2.04 | ) |
| | |
|
|
| |
|
|
| |
|
|
| |
|
|
| |
|
|
| |
|
|
| |
|
|
| |
|
|
|
Total from investment operations | | | 1.34 | | | | 1.42 | | | | 1.67 | | | | (2.01 | ) | | | 1.38 | | | | 1.46 | | | | 1.69 | | | | (1.98 | ) |
| | |
|
|
| |
|
|
| |
|
|
| |
|
|
| |
|
|
| |
|
|
| |
|
|
| |
|
|
|
Less distributions: | | | | | | | | | | | | | | | | | | | | | | | | | | | | | | | | |
Dividends from net investment income | | | (0.09 | ) | | | (0.05 | ) | | | (0.15 | ) | | | — | | | | (0.12 | ) | | | (0.08 | ) | | | (0.17 | ) | | | — | |
Distributions from realized gains | | | (0.17 | ) | | | — | | | | — | | | | — | | | | (0.17 | ) | | | — | | | | — | | | | — | |
| | |
|
|
| |
|
|
| |
|
|
| |
|
|
| |
|
|
| |
|
|
| |
|
|
| |
|
|
|
Total dividends and distributions | | | (0.26 | ) | | | (0.05 | ) | | | (0.15 | ) | | | — | | | | (0.29 | ) | | | (0.08 | ) | | | (0.17 | ) | | | — | |
| | |
|
|
| |
|
|
| |
|
|
| |
|
|
| |
|
|
| |
|
|
| |
|
|
| |
|
|
|
Net asset value, end of period | | $ | 11.96 | | | $ | 10.88 | | | $ | 9.51 | | | $ | 7.99 | | | $ | 12.01 | | | $ | 10.92 | | | $ | 9.54 | | | $ | 8.02 | |
| | |
|
|
| |
|
|
| |
|
|
| |
|
|
| |
|
|
| |
|
|
| |
|
|
| |
|
|
|
Total return (b)† | | | 12.48 | % | | | 15.14 | % | | | 21.11 | % | | | (20.10 | )% | | | 12.82 | % | | | 15.37 | % | | | 21.47 | % | | | (19.80 | )% |
| | |
|
|
| |
|
|
| |
|
|
| |
|
|
| |
|
|
| |
|
|
| |
|
|
| |
|
|
|
Ratios/Supplemental Data: | | | | | | | | | | | | | | | | | | | | | | | | | | | | | | | | |
Net assets, end of period (000’s) | | $ | 4,108 | | | $ | 2,231 | | | $ | 1,990 | | | $ | 1,364 | | | $ | 33,061 | | | $ | 6,924 | | | $ | 6,306 | | | $ | 5,318 | |
Ratio of expenses to average net assets: | | | | | | | | | | | | | | | | | | | | | | | | | | | | | | | | |
After waivers and reimbursements (a) | | | 1.45 | % | | | 1.45 | % | | | 1.45 | % | | | 1.45 | % | | | 1.20 | % | | | 1.20 | % | | | 1.20 | % | | | 1.20 | % |
After waivers, reimbursements and fees paid indirectly (a) | | | 1.36 | % | | | 1.27 | % | | | 1.35 | % | | | 1.35 | % | | | 1.11 | % | | | 1.02 | % | | | 1.10 | % | | | 1.10 | % |
Before waivers, reimbursements and fees paid indirectly (a) | | | 3.18 | % | | | 4.93 | % | | | 5.80 | % | | | 6.19 | % | | | 2.93 | % | | | 4.68 | % | | | 5.55 | % | | | 5.94 | % |
Ratio of net investment income (loss) to average net assets: | | | | | | | | | | | | | | | | | | | | | | | | | | | | | | | | |
After waivers and reimbursements (a) | | | 0.67 | % | | | 0.63 | % | | | 0.68 | % | | | 0.47 | % | | | 0.92 | % | | | 0.88 | % | | | 0.93 | % | | | 0.72 | % |
After waivers, reimbursements and fees paid indirectly (a) | | | 0.76 | % | | | 0.81 | % | | | 0.78 | % | | | 0.57 | % | | | 1.01 | % | | | 1.06 | % | | | 1.03 | % | | | 0.82 | % |
Before waivers, reimbursements and fees paid indirectly (a) | | | (1.06 | )% | | | (2.85 | )% | | | (3.67 | )% | | | (4.26 | )% | | | (0.81 | )% | | | (2.60 | )% | | | (3.42 | )% | | | (4.01 | )% |
Portfolio turnover rate (d) | | | 85 | % | | | 108 | % | | | 148 | % | | | 123 | % | | | 85 | % | | | 108 | % | | | 148 | % | | | 123 | % |
Effect of contractual expense limitation during the period: | | | | | | | | | | | | | | | | | | | | | | | | | | | | | | | | |
Per share benefit to net investment income (loss) | | $ | 0.20 | | | $ | 0.36 | | | $ | 0.37 | | | $ | 0.35 | | | $ | 0.21 | | | $ | 0.36 | | | $ | 0.37 | | | $ | 0.36 | |
75
AXA ENTERPRISE MULTIMANAGER MID CAP GROWTH FUND
| | | | | | | | | | | | | | | | | | | | | | | | | | | | | | | | | | | | |
| | | Class A
(New Class)
| | | Class B
| | | Class C
| |
| | | December 13,
2004* to
October 31,
2005(c)(e)
| | | Year Ended October 31,
| | | December 31, 2001* to October 31, 2002(c)
| | | Year Ended October 31,
| | | December 31,
2001* to October 31,
2002(c)
| |
| | | | 2005(c)(e)
| | | 2004(c)
| | | 2003(c)
| | | | 2005(c)(e)
| | | 2004(c)
| | | 2003(c)
| | |
Net asset value, beginning of period | | $ | 9.54 | | | $ | 8.70 | | | $ | 8.36 | | | $ | 6.16 | | | $ | 10.00 | | | $ | 8.67 | | | $ | 8.34 | | | $ | 6.15 | | | $ | 10.00 | |
| | |
|
|
| |
|
|
| |
|
|
| |
|
|
| |
|
|
| |
|
|
| |
|
|
| |
|
|
| |
|
|
|
Income (loss) from investment operations: | | | | | | | | | | | | | | | | | | | | | | | | | | | | | | | | | | | | |
Net investment loss | | | (0.13 | ) | | | (0.19 | ) | | | (0.17 | ) | | | (0.13 | ) | | | (0.13 | ) | | | (0.19 | ) | | | (0.17 | ) | | | (0.13 | ) | | | (0.13 | ) |
Net realized and unrealized gain (loss) on investments | | | 0.50 | | | | 1.13 | | | | 0.51 | | | | 2.33 | | | | (3.71 | ) | | | 1.14 | | | | 0.50 | | | | 2.32 | | | | (3.72 | ) |
| | |
|
|
| |
|
|
| |
|
|
| |
|
|
| |
|
|
| |
|
|
| |
|
|
| |
|
|
| |
|
|
|
Total from investment operations | | | 0.37 | | | | 0.94 | | | | 0.34 | | | | 2.20 | | | | (3.84 | ) | | | 0.95 | | | | 0.33 | | | | 2.19 | | | | (3.85 | ) |
| | |
|
|
| |
|
|
| |
|
|
| |
|
|
| |
|
|
| |
|
|
| |
|
|
| |
|
|
| |
|
|
|
Redemption fees | | | — | # | | | — | | | | — | | | | — | | | | — | | | | — | | | | — | | | | — | | | | — | |
| | |
|
|
| |
|
|
| |
|
|
| |
|
|
| |
|
|
| |
|
|
| |
|
|
| |
|
|
| |
|
|
|
Net asset value, end of period | | $ | 9.91 | | | $ | 9.64 | | | $ | 8.70 | | | $ | 8.36 | | | $ | 6.16 | | | $ | 9.62 | | | $ | 8.67 | | | $ | 8.34 | | | $ | 6.15 | |
| | |
|
|
| |
|
|
| |
|
|
| |
|
|
| |
|
|
| |
|
|
| |
|
|
| |
|
|
| |
|
|
|
Total return (b)† | | | 3.88 | % | | | 10.80 | % | | | 4.07 | % | | | 35.71 | % | | | (38.40 | )% | | | 10.83 | % | | | 4.08 | % | | | 35.61 | % | | | (38.50 | )% |
| | |
|
|
| |
|
|
| |
|
|
| |
|
|
| |
|
|
| |
|
|
| |
|
|
| |
|
|
| |
|
|
|
Ratios/Supplemental Data: | | | | | | | | | | | | | | | | | | | | | | | | | | | | | | | | | | | | |
Net assets, end of period (000’s) | | $ | 886 | | | $ | 195 | | | $ | 3,263 | | | $ | 3,299 | | | $ | 2,094 | | | $ | 331 | | | $ | 352 | | | $ | 376 | | | $ | 485 | |
Ratio of expenses to average net assets: | | | | | | | | | | | | | | | | | | | | | | | | | | | | | | | | | | | | |
After waivers and reimbursements (a) | | | 1.90 | % | | | 2.45 | % | | | 2.45 | % | | | 2.45 | % | | | 2.45 | % | | | 2.45 | % | | | 2.45 | % | | | 2.45 | % | | | 2.45 | % |
After waivers, reimbursements and fees paid indirectly (a) | | | 1.86 | % | | | 2.41 | % | | | 2.20 | % | | | 2.27 | % | | | 2.37 | % | | | 2.41 | % | | | 2.20 | % | | | 2.27 | % | | | 2.37 | % |
Before waivers, reimbursements and fees paid indirectly (a) | | | 4.80 | % | | | 5.35 | % | | | 5.99 | % | | | 7.11 | % | | | 7.97 | % | | | 5.35 | % | | | 5.99 | % | | | 7.11 | % | | | 7.97 | % |
Ratio of net investment loss to average net assets: | | | | | | | | | | | | | | | | | | | | | | | | | | | | | | | | | | | | |
After waivers and reimbursements (a) | | | (1.54 | )% | | | (2.09 | )% | | | (2.20 | )% | | | (2.04 | )% | | | (2.15 | )% | | | (2.09 | )% | | | (2.20 | )% | | | (2.04 | )% | | | (2.15 | )% |
After waivers, reimbursements and fees paid indirectly (a) | | | (1.50 | )% | | | (2.05 | )% | | | (1.95 | )% | | | (1.86 | )% | | | (2.07 | )% | | | (2.05 | )% | | | (1.95 | )% | | | (1.86 | )% | | | (2.07 | )% |
Before waivers, reimbursements and fees paid indirectly (a) | | | (4.44 | )% | | | (4.99 | )% | | | (5.74 | )% | | | (6.70 | )% | | | (7.67 | )% | | | (4.99 | )% | | | (5.74 | )% | | | (6.70 | )% | | | (7.67 | )% |
Portfolio turnover rate (d) | | | 80 | % | | | 80 | % | | | 86 | % | | | 180 | % | | | 192 | % | | | 80 | % | | | 86 | % | | | 180 | % | | | 192 | % |
Effect of contractual expense limitation during the period: | | | | | | | | | | | | | | | | | | | | | | | | | | | | | | | | | | | | |
Per share benefit to net investment loss | | $ | 0.25 | | | $ | 0.27 | | | $ | 0.30 | | | $ | 0.32 | | | $ | 0.33 | | | $ | 0.27 | | | $ | 0.30 | | | $ | 0.32 | | | $ | 0.33 | |
76
AXA ENTERPRISE MULTIMANAGER MID CAP GROWTH FUND (cont’d)
| | | | | | | | | | | | | | | | | | | | | | | | | | | | | | | | |
| | | Class P (formerly Class A)
| | | Class Y (formerly Class Z)
| |
| | | Year Ended October 31,
| | | December 31,
2001* to
October 31, 2002(c)
| | | Year Ended October 31,
| | | December 31,
2001* to October 31,
2002(c)
| |
| | | 2005(c)(e)
| | | 2004(c)
| | | 2003(c)
| | | | 2005(c)(e)
| | | 2004(c)
| | | 2003(c)
| | |
Net asset value, beginning of period | | $ | 8.88 | | | $ | 8.47 | | | $ | 6.20 | | | $ | 10.00 | | | $ | 8.94 | | | $ | 8.51 | | | $ | 6.21 | | | $ | 10.00 | |
| | |
|
|
| |
|
|
| |
|
|
| |
|
|
| |
|
|
| |
|
|
| |
|
|
| |
|
|
|
Income (loss) from investment operations: | | | | | | | | | | | | | | | | | | | | | | | | | | | | | | | | |
Net investment loss | | | (0.12 | ) | | | (0.10 | ) | | | (0.08 | ) | | | (0.09 | ) | | | (0.10 | ) | | | (0.08 | ) | | | (0.06 | ) | | | (0.08 | ) |
Net realized and unrealized gain (loss) on investments | | | 1.16 | | | | 0.51 | | | | 2.35 | | | | (3.71 | ) | | | 1.17 | | | | 0.51 | | | | 2.36 | | | | (3.71 | ) |
| | |
|
|
| |
|
|
| |
|
|
| |
|
|
| |
|
|
| |
|
|
| |
|
|
| |
|
|
|
Total from investment operations | | | 1.04 | | | | 0.41 | | | | 2.27 | | | | (3.80 | ) | | | 1.07 | | | | 0.43 | | | | 2.30 | | | | (3.79 | ) |
| | |
|
|
| |
|
|
| |
|
|
| |
|
|
| |
|
|
| |
|
|
| |
|
|
| |
|
|
|
Redemption fees | | | — | | | | — | | | | — | | | | — | | | | — | | | | — | | | | — | | | | — | |
| | |
|
|
| |
|
|
| |
|
|
| |
|
|
| |
|
|
| |
|
|
| |
|
|
| |
|
|
|
Net asset value, end of period | | $ | 9.92 | | | $ | 8.88 | | | $ | 8.47 | | | $ | 6.20 | | | $ | 10.01 | | | $ | 8.94 | | | $ | 8.51 | | | $ | 6.21 | |
| | |
|
|
| |
|
|
| |
|
|
| |
|
|
| |
|
|
| |
|
|
| |
|
|
| |
|
|
|
Total return (b)† | | | 11.59 | % | | | 4.96 | % | | | 36.61 | % | | | (38.00 | )% | | | 11.97 | % | | | 5.05 | % | | | 37.04 | % | | | (37.90 | )% |
| | |
|
|
| |
|
|
| |
|
|
| |
|
|
| |
|
|
| |
|
|
| |
|
|
| |
|
|
|
Ratios/Supplemental Data: | | | | | | | | | | | | | | | | | | | | | | | | | | | | | | | | |
Net assets, end of period (000’s) | | $ | 5,094 | | | $ | 2,747 | | | $ | 2,440 | | | $ | 1,409 | | | $ | 6,385 | | | $ | 5,884 | | | $ | 5,841 | | | $ | 4,155 | |
Ratio of expenses to average net assets: | | | | | | | | | | | | | | | | | | | | | | | | | | | | | | | | |
After waivers and reimbursements (a) | | | 1.70 | % | | | 1.70 | % | | | 1.70 | % | | | 1.70 | % | | | 1.45 | % | | | 1.45 | % | | | 1.45 | % | | | 1.45 | % |
After waivers, reimbursements and fees paid indirectly (a) | | | 1.66 | % | | | 1.45 | % | | | 1.52 | % | | | 1.62 | % | | | 1.41 | % | | | 1.20 | % | | | 1.27 | % | | | 1.37 | % |
Before waivers, reimbursements and fees paid indirectly (a) | | | 4.60 | % | | | 5.24 | % | | | 6.36 | % | | | 7.22 | % | | | 4.35 | % | | | 4.99 | % | | | 6.11 | % | | | 6.97 | % |
Ratio of net investment loss to average net assets: | | | | | | | | | | | | | | | | | | | | | | | | | | | | | | | | |
After waivers and reimbursements (a) | | | (1.34 | )% | | | (1.45 | )% | | | (1.29 | )% | | | (1.40 | )% | | | (1.09 | )% | | | (1.20 | )% | | | (1.04 | )% | | | (1.15 | )% |
After waivers, reimbursements and fees paid indirectly (a) | | | (1.30 | )% | | | (1.20 | )% | | | (1.11 | )% | | | (1.32 | )% | | | (1.05 | )% | | | (0.95 | )% | | | (0.86 | )% | | | (1.07 | )% |
Before waivers, reimbursements and fees paid indirectly (a) | | | (4.24 | )% | | | (4.99 | )% | | | (5.95 | )% | | | (6.92 | )% | | | (3.99 | )% | | | (4.74 | )% | | | (5.70 | )% | | | (6.67 | )% |
Portfolio turnover rate (d) | | | 80 | % | | | 86 | % | | | 180 | % | | | 192 | % | | | 80 | % | | | 86 | % | | | 180 | % | | | 192 | % |
Effect of contractual expense limitation during the period: | | | | | | | | | | | | | | | | | | | | | | | | | | | | | | | | |
Per share benefit to net investment loss | | $ | 0.28 | | | $ | 0.31 | | | $ | 0.32 | | | $ | 0.34 | | | $ | 0.28 | | | $ | 0.31 | | | $ | 0.32 | | | $ | 0.36 | |
77
AXA ENTERPRISE MULTIMANAGER MID CAP VALUE FUND
| | | | | | | | | | | | | | | | | | | | | | | | | | | | | | | | | | | | |
| | | Class A
(New Class)
| | | Class B
| | | Class C
| |
| | | December 13, 2004* to October 31,
2005(c)(e)
| | | Year Ended October 31,
| | | December 31,
2001* to October 31,
2002(c)
| | | Year Ended October 31,
| | | December 31,
2001* to October 31,
2002(c)
| |
| | | | 2005(c)(e)
| | | 2004(c)
| | | 2003(c)
| | | | 2005(c)(e)
| | | 2004(c)
| | | 2003(c)
| | |
Net asset value, beginning of period | | $ | 11.79 | | | $ | 10.81 | | | $ | 9.71 | | | $ | 7.15 | | | $ | 10.00 | | | $ | 10.80 | | | $ | 9.70 | | | $ | 7.15 | | | $ | 10.00 | |
| | |
|
|
| |
|
|
| |
|
|
| |
|
|
| |
|
|
| |
|
|
| |
|
|
| |
|
|
| |
|
|
|
Income (loss) from investment operations: | | | | | | | | | | | | | | | | | | | | | | | | | | | | | | | | | | | | |
Net investment loss | | | (0.06 | ) | | | (0.13 | ) | | | (0.11 | ) | | | (0.08 | ) | | | (0.09 | ) | | | (0.13 | ) | | | (0.11 | ) | | | (0.08 | ) | �� | | (0.09 | ) |
Net realized and unrealized gain (loss) on investments and foreign currency transactions | | | 0.46 | | | | 1.27 | | | | 1.21 | | | | 2.65 | | | | (2.76 | ) | | | 1.26 | | | | 1.21 | | | | 2.64 | | | | (2.76 | ) |
| | |
|
|
| |
|
|
| |
|
|
| |
|
|
| |
|
|
| |
|
|
| |
|
|
| |
|
|
| |
|
|
|
Total from investment operations | | | 0.40 | | | | 1.14 | | | | 1.10 | | | | 2.57 | | | | (2.85 | ) | | | 1.13 | | | | 1.10 | | | | 2.56 | | | | (2.85 | ) |
| | |
|
|
| |
|
|
| |
|
|
| |
|
|
| |
|
|
| |
|
|
| |
|
|
| |
|
|
| |
|
|
|
Less distributions: | | | | | | | | | | | | | | | | | | | | | | | | | | | | | | | | | | | | |
Dividends from net investment income | | | — | | | | — | | | | — | | | | (0.01 | ) | | | — | | | | — | | | | — | | | | (0.01 | ) | | | — | |
| | |
|
|
| |
|
|
| |
|
|
| |
|
|
| |
|
|
| |
|
|
| |
|
|
| |
|
|
| |
|
|
|
Redemption fees | | | — | | | | — | # | | | — | | | | — | | | | — | | | | — | | | | — | | | | — | | | | — | |
| | |
|
|
| |
|
|
| |
|
|
| |
|
|
| |
|
|
| |
|
|
| |
|
|
| |
|
|
| |
|
|
|
Net asset value, end of period | | $ | 12.19 | | | $ | 11.95 | | | $ | 10.81 | | | $ | 9.71 | | | $ | 7.15 | | | $ | 11.93 | | | $ | 10.80 | | | $ | 9.70 | | | $ | 7.15 | |
| | |
|
|
| |
|
|
| |
|
|
| |
|
|
| |
|
|
| |
|
|
| |
|
|
| |
|
|
| |
|
|
|
Total return (b)† | | | 3.39 | % | | | 10.55 | % | | | 11.33 | % | | | 35.90 | % | | | (28.50 | )% | | | 10.36 | % | | | 11.44 | % | | | 35.76 | % | | | (28.50 | )% |
| | |
|
|
| |
|
|
| |
|
|
| |
|
|
| |
|
|
| |
|
|
| |
|
|
| |
|
|
| |
|
|
|
Ratios/Supplemental Data: | | | | | | | | | | | | | | | | | | | | | | | | | | | | | | | | | | | | |
Net assets, end of period (000’s) | | $ | 1,233 | | | $ | 412 | | | $ | 3,803 | | | $ | 3,661 | | | $ | 2,451 | | | $ | 542 | | | $ | 461 | | | $ | 490 | | | $ | 550 | |
Ratio of expenses to average net assets: | | | | | | | | | | | | | | | | | | | | | | | | | | | | | | | | | | | | |
After waivers and reimbursements (a) | | | 1.90 | % | | | 2.45 | % | | | 2.45 | % | | | 2.45 | % | | | 2.45 | % | | | 2.45 | % | | | 2.45 | % | | | 2.45 | % | | | 2.45 | % |
After waivers, reimbursements and fees paid
indirectly (a) | | | 1.88 | % | | | 2.43 | % | | | 2.37 | % | | | 2.43 | % | | | 2.32 | % | | | 2.43 | % | | | 2.37 | % | | | 2.43 | % | | | 2.32 | % |
Before waivers, reimbursements and fees paid
indirectly (a) | | | 4.35 | % | | | 4.90 | % | | | 5.25 | % | | | 6.18 | % | | | 6.61 | % | | | 4.90 | % | | | 5.25 | % | | | 6.18 | % | | | 6.61 | % |
Ratio of net investment loss to average net assets: | | | | | | | | | | | | | | | | | | | | | | | | | | | | | | | | | | | | |
After waivers and reimbursements (a) | | | (0.56 | )% | | | (1.11 | )% | | | (1.13 | )% | | | (1.00 | )% | | | (1.23 | )% | | | (1.11 | )% | | | (1.13 | )% | | | (1.00 | )% | | | (1.23 | )% |
After waivers, reimbursements and fees paid
indirectly (a) | | | (0.54 | )% | | | (1.09 | )% | | | (1.05 | )% | | | (0.98 | )% | | | (1.10 | )% | | | (1.09 | )% | | | (1.05 | )% | | | (0.98 | )% | | | (1.10 | )% |
Before waivers, reimbursements and fees paid
indirectly (a) | | | (3.01 | )% | | | (3.56 | )% | | | (3.93 | )% | | | (4.73 | )% | | | (5.39 | )% | | | (3.56 | )% | | | (3.93 | )% | | | (4.73 | )% | | | (5.39 | )% |
Portfolio turnover rate (d) | | | 72 | % | | | 72 | % | | | 68 | % | | | 78 | % | | | 112 | % | | | 72 | % | | | 68 | % | | | 78 | % | | | 112 | % |
Effect of contractual expense limitation during the period: | | | | | | | | | | | | | | | | | | | | | | | | | | | | | | | | | | | | |
Per share benefit to net investment loss | | $ | 0.27 | | | $ | 0.29 | | | $ | 0.29 | | | $ | 0.30 | | | $ | 0.29 | | | $ | 0.29 | | | $ | 0.29 | | | $ | 0.30 | | | $ | 0.29 | |
78
AXA ENTERPRISE MULTIMANAGER MID CAP VALUE FUND (cont’d)
| | | | | | | | | | | | | | | | | | | | | | | | | | | | | | | | |
| | | Class P (formerly Class A)
| | | Class Y (formerly Class Z)
| |
| | | Year Ended October 31,
| | | December 31,
2001* to October 31,
2002(c)
| | | Year Ended October 31,
| | | December 31,
2001* to October 31,
2002(c)
| |
| | | 2005(c)(e)
| | | 2004(c)
| | | 2003(c)
| | | | 2005(c)(e)
| | | 2004(c)
| | | 2003(c)
| | |
Net asset value, beginning of period | | $ | 10.98 | | | $ | 9.78 | | | $ | 7.20 | | | $ | 10.00 | | | $ | 11.00 | | | $ | 9.79 | | | $ | 7.21 | | | $ | 10.00 | |
| | |
|
|
| |
|
|
| |
|
|
| |
|
|
| |
|
|
| |
|
|
| |
|
|
| |
|
|
|
Income (loss) from investment operations: | | | | | | | | | | | | | | | | | | | | | | | | | | | | | | | | |
Net investment loss | | | (0.04 | ) | | | (0.03 | ) | | | (0.02 | ) | | | (0.03 | ) | | | (0.01 | ) | | | (0.01 | ) | | | — | # | | | (0.02 | ) |
Net realized and unrealized gain (loss) on investments and foreign currency transactions | | | 1.26 | | | | 1.23 | | | | 2.65 | | | | (2.77 | ) | | | 1.28 | | | | 1.23 | | | | 2.65 | | | | (2.77 | ) |
| | |
|
|
| |
|
|
| |
|
|
| |
|
|
| |
|
|
| |
|
|
| |
|
|
| |
|
|
|
Total from investment operations | | | 1.22 | | | | 1.20 | | | | 2.63 | | | | (2.80 | ) | | | 1.27 | | | | 1.22 | | | | 2.65 | | | | (2.79 | ) |
| | |
|
|
| |
|
|
| |
|
|
| |
|
|
| |
|
|
| |
|
|
| |
|
|
| |
|
|
|
Less distributions: | | | | | | | | | | | | | | | | | | | | | | | | | | | | | | | | |
Dividends from net investment income | | | — | | | | — | | | | (0.05 | ) | | | — | | | | — | | | | (0.01 | ) | | | (0.07 | ) | | | — | |
| | |
|
|
| |
|
|
| |
|
|
| |
|
|
| |
|
|
| |
|
|
| |
|
|
| |
|
|
|
Redemption fees | | | — | | | | — | | | | — | | | | — | | | | — | | | | — | | | | — | | | | — | |
| | |
|
|
| |
|
|
| |
|
|
| |
|
|
| |
|
|
| |
|
|
| |
|
|
| |
|
|
|
Net asset value, end of period | | $ | 12.20 | | | $ | 10.98 | | | $ | 9.78 | | | $ | 7.20 | | | $ | 12.27 | | | $ | 11.00 | | | $ | 9.79 | | | $ | 7.21 | |
| | |
|
|
| |
|
|
| |
|
|
| |
|
|
| |
|
|
| |
|
|
| |
|
|
| |
|
|
|
Total return (b)† | | | 11.11 | % | | | 12.27 | % | | | 36.84 | % | | | (28.00 | )% | | | 11.55 | % | | | 12.51 | % | | | 37.13 | % | | | (27.90 | )% |
| | |
|
|
| |
|
|
| |
|
|
| |
|
|
| |
|
|
| |
|
|
| |
|
|
| |
|
|
|
Ratios/Supplemental Data: | | | | | | | | | | | | | | | | | | | | | | | | | | | | | | | | |
Net assets, end of period (000’s) | | $ | 6,579 | | | $ | 3,921 | | | $ | 3,770 | | | $ | 2,902 | | | $ | 8,233 | | | $ | 7,555 | | | $ | 7,017 | | | $ | 5,167 | |
Ratio of expenses to average net assets: | | | | | | | | | | | | | | | | | | | | | | | | | | | | | | | | |
After waivers and reimbursements (a) | | | 1.70 | % | | | 1.70 | % | | | 1.70 | % | | | 1.70 | % | | | 1.45 | % | | | 1.45 | % | | | 1.45 | % | | | 1.45 | % |
After waivers, reimbursements and fees paid indirectly (a) | | | 1.68 | % | | | 1.62 | % | | | 1.68 | % | | | 1.57 | % | | | 1.43 | % | | | 1.37 | % | | | 1.43 | % | | | 1.32 | % |
Before waivers, reimbursements and fees paid indirectly (a) | | | 4.15 | % | | | 4.50 | % | | | 5.43 | % | | | 5.86 | % | | | 3.90 | % | | | 4.25 | % | | | 5.18 | % | | | 5.61 | % |
Ratio of net investment loss to average net assets: | | | | | | | | | | | | | | | | | | | | | | | | | | | | | | | | |
After waivers and reimbursements (a) | | | (0.36 | )% | | | (0.38 | )% | | | (0.25 | )% | | | (0.48 | )% | | | (0.11 | )% | | | (0.13 | )% | | | 0.00 | %@ | | | (0.23 | )% |
After waivers, reimbursements and fees paid indirectly (a) | | | (0.34 | )% | | | (0.30 | )% | | | (0.23 | )% | | | (0.35 | )% | | | (0.09 | )% | | | (0.05 | )% | | | 0.02 | % | | | (0.10 | )% |
Before waivers, reimbursements and fees paid indirectly (a) | | | (2.81 | )% | | | (3.18 | )% | | | (3.98 | )% | | | (4.64 | )% | | | (2.56 | )% | | | (2.93 | )% | | | (3.73 | )% | | | (4.39 | )% |
Portfolio turnover rate (d) | | | 72 | % | | | 68 | % | | | 78 | % | | | 112 | % | | | 72 | % | | | 68 | % | | | 78 | % | | | 112 | % |
Effect of contractual expense limitation during the period: | | | | | | | | | | | | | | | | | | | | | | | | | | | | | | | | |
Per share benefit to net investment loss | | $ | 0.29 | | | $ | 0.30 | | | $ | 0.30 | | | $ | 0.28 | | | $ | 0.30 | | | $ | 0.30 | | | $ | 0.30 | | | $ | 0.30 | |
79
AXA ENTERPRISE MULTIMANAGER INTERNATIONAL EQUITY FUND
| | | | | | | | | | | | | | | | | | | | | | | | | | | | | | | | | | | | |
| | | Class A
(New Class)
| | | Class B
| | | Class C
| |
| | | December 13,
2004* to
October 31,
2005(c)(e)
| | | Year Ended October 31,
| | | December 31,
2001* to
October 31, 2002(c)
| | | Year Ended October 31,
| | | December 31,
2001* to
October 31, 2002(c)
| |
| | | | 2005(c)(e)
| | | 2004
| | | 2003(c)
| | | | 2005(c)(e)
| | | 2004
| | | 2003(c)
| | |
Net asset value, beginning of period | | $ | 12.19 | | | $ | 11.32 | | | $ | 9.72 | | | $ | 7.86 | | | $ | 10.00 | | | $ | 11.33 | | | $ | 9.72 | | | $ | 7.87 | | | $ | 10.00 | |
| | |
|
|
| |
|
|
| |
|
|
| |
|
|
| |
|
|
| |
|
|
| |
|
|
| |
|
|
| |
|
|
|
Income (loss) from investment operations: | | | | | | | | | | | | | | | | | | | | | | | | | | | | | | | | | | | | |
Net investment income (loss) | | | 0.05 | | | | (0.02 | ) | | | (0.03 | ) | | | (0.02 | ) | | | (0.03 | ) | | | (0.02 | ) | | | (0.03 | ) | | | (0.02 | ) | | | (0.03 | ) |
Net realized and unrealized gain (loss) on investments and foreign currency transactions | | | 1.03 | | | | 1.79 | | | | 1.63 | | | | 1.92 | | | | (2.11 | ) | | | 1.78 | | | | 1.64 | | | | 1.91 | | | | (2.10 | ) |
| | |
|
|
| |
|
|
| |
|
|
| |
|
|
| |
|
|
| |
|
|
| |
|
|
| |
|
|
| |
|
|
|
Total from investment operations | | | 1.08 | | | | 1.77 | | | | 1.60 | | | | 1.90 | | | | (2.14 | ) | | | 1.76 | | | | 1.61 | | | | 1.89 | | | | (2.13 | ) |
| | |
|
|
| |
|
|
| |
|
|
| |
|
|
| |
|
|
| |
|
|
| |
|
|
| |
|
|
| |
|
|
|
Less distributions: | | | | | | | | | | | | | | | | | | | | | | | | | | | | | | | | | | | | |
Dividends from net investment income | | | (0.09 | ) | | | (0.02 | ) | | | — | | | | (0.04 | ) | | | — | | | | (0.02 | ) | | | — | | | | (0.04 | ) | | | — | |
Distributions from realized gains | | | (0.03 | ) | | | (0.03 | ) | | | — | | | | — | | | | — | | | | (0.03 | ) | | | — | | | | — | | | | — | |
| | |
|
|
| |
|
|
| |
|
|
| |
|
|
| |
|
|
| |
|
|
| |
|
|
| |
|
|
| |
|
|
|
Total dividends and distributions | | | (0.12 | ) | | | (0.05 | ) | | | — | | | | (0.04 | ) | | | — | | | | (0.05 | ) | | | — | | | | (0.04 | ) | | | — | |
| | |
|
|
| |
|
|
| |
|
|
| |
|
|
| |
|
|
| |
|
|
| |
|
|
| |
|
|
| |
|
|
|
Redemption fees | | | — | | | | — | | | | — | | | | — | | | | — | | | | — | # | | | — | | | | — | | | | — | |
| | |
|
|
| |
|
|
| |
|
|
| |
|
|
| |
|
|
| |
|
|
| |
|
|
| |
|
|
| |
|
|
|
Net asset value, end of period | | $ | 13.15 | | | $ | 13.04 | | | $ | 11.32 | | | $ | 9.72 | | | $ | 7.86 | | | $ | 13.04 | | | $ | 11.33 | | | $ | 9.72 | | | $ | 7.87 | |
| | |
|
|
| |
|
|
| |
|
|
| |
|
|
| |
|
|
| |
|
|
| |
|
|
| |
|
|
| |
|
|
|
Total return (b)† | | | 8.95 | % | | | 15.70 | % | | | 16.46 | % | | | 24.23 | % | | | (21.40 | )% | | | 15.60 | % | | | 16.56 | % | | | 24.08 | % | | | (21.30 | )% |
| | |
|
|
| |
|
|
| |
|
|
| |
|
|
| |
|
|
| |
|
|
| |
|
|
| |
|
|
| |
|
|
|
Ratios/Supplemental Data: | | | | | | | | | | | | | | | | | | | | | | | | | | | | | | | | | | | | |
Net assets, end of period (000’s) | | $ | 1,729 | | | $ | 744 | | | $ | 2,806 | | | $ | 2,423 | | | $ | 1,814 | | | $ | 682 | | | $ | 349 | | | $ | 305 | | | $ | 213 | |
Ratio of expenses to average net assets: | | | | | | | | | | | | | | | | | | | | | | | | | | | | | | | | | | | | |
After waivers and reimbursements (a) | | | 2.10 | % | | | 2.65 | % | | | 2.65 | % | | | 2.65 | % | | | 2.65 | % | | | 2.65 | % | | | 2.65 | % | | | 2.65 | % | | | 2.65 | % |
After waivers, reimbursements and fees paid indirectly (a) | | | 2.06 | % | | | 2.61 | % | | | 2.38 | % | | | 2.61 | % | | | 2.61 | % | | | 2.61 | % | | | 2.38 | % | | | 2.61 | % | | | 2.61 | % |
Before waivers, reimbursements and fees paid indirectly (a) | | | 3.70 | % | | | 4.25 | % | | | 6.47 | % | | | 7.77 | % | | | 8.40 | % | | | 4.25 | % | | | 6.47 | % | | | 7.77 | % | | | 8.40 | % |
Ratio of net investment loss to average net assets: | | | | | | | | | | | | | | | | | | | | | | | | | | | | | | | | | | | | |
After waivers and reimbursements (a) | | | 0.37 | % | | | (0.18 | )% | | | (0.50 | )% | | | (0.26 | )% | | | (0.36 | )% | | | (0.18 | )% | | | (0.50 | )% | | | (0.26 | )% | | | (0.36 | )% |
After waivers, reimbursements and fees paid indirectly (a) | | | 0.41 | % | | | (0.14 | )% | | | (0.23 | )% | | | (0.22 | )% | | | (0.32 | )% | | | (0.14 | )% | | | (0.23 | )% | | | (0.22 | )% | | | (0.32 | )% |
Before waivers, reimbursements and fees paid indirectly (a) | | | (1.23 | )% | | | (1.78 | )% | | | (4.32 | )% | | | (5.38 | )% | | | (6.12 | )% | | | (1.78 | )% | | | (4.32 | )% | | | (5.38 | )% | | | (6.12 | )% |
Portfolio turnover rate (d) | | | 73 | % | | | 73 | % | | | 67 | % | | | 92 | % | | | 27 | % | | | 73 | % | | | 67 | % | | | 92 | % | | | 27 | % |
Effect of contractual expense limitation during the period: | | | | | | | | | | | | | | | | | | | | | | | | | | | | | | | | | | | | |
Per share benefit to net investment loss | | $ | 0.18 | | | $ | 0.20 | | | $ | 0.41 | | | $ | 0.43 | | | $ | 0.43 | | | $ | 0.20 | | | $ | 0.41 | | | $ | 0.43 | | | $ | 0.44 | |
80
AXA ENTERPRISE MULTIMANAGER INTERNATIONAL EQUITY FUND (cont’d)
| | | | | | | | | | | | | | | | | | | | | | | | | | | | | | | | |
| | | Class P (formerly Class A)
| | | Class Y (formerly Class Z)
| |
| | | Year Ended October 31,
| | | December 31,
2001* to
October 31, 2002(c)
| | | Year Ended October 31,
| | | December 31,
2001* to
October 31, 2002(c)
| |
| | | 2005
(c)(e)
| | | 2004
| | | 2003
(c)
| | | | 2005
(c)(e)
| | | 2004
| | | 2003
(c)
| | |
Net asset value, beginning of period | | $ | 11.41 | | | $ | 9.77 | | | $ | 7.91 | | | $ | 10.00 | | | $ | 11.44 | | | $ | 9.80 | | | $ | 7.93 | | | $ | 10.00 | |
| | |
|
|
| |
|
|
| |
|
|
| |
|
|
| |
|
|
| |
|
|
| |
|
|
| |
|
|
|
Income (loss) from investment operations: | | | | | | | | | | | | | | | | | | | | | | | | | | | | | | | | |
Net investment loss income (loss) | | | 0.08 | | | | 0.06 | | | | 0.04 | | | | 0.03 | | | | 0.11 | | | | 0.08 | | | | 0.07 | | | | 0.05 | |
Net realized and unrealized gain (loss) on investments and foreign currency transactions | | | 1.79 | | | | 1.63 | | | | 1.91 | | | | (2.12 | ) | | | 1.81 | | | | 1.64 | | | | 1.91 | | | | (2.12 | ) |
| | |
|
|
| |
|
|
| |
|
|
| |
|
|
| |
|
|
| |
|
|
| |
|
|
| |
|
|
|
Total from investment operations | | | 1.87 | | | | 1.69 | | | | 1.95 | | | | (2.09 | ) | | | 1.92 | | | | 1.72 | | | | 1.98 | | | | (2.07 | ) |
| | |
|
|
| |
|
|
| |
|
|
| |
|
|
| |
|
|
| |
|
|
| |
|
|
| |
|
|
|
Less distributions: | | | | | | | | | | | | | | | | | | | | | | | | | | | | | | | | |
Dividends from net investment income | | | (0.11 | ) | | | (0.05 | ) | | | (0.09 | ) | | | — | | | | (0.15 | ) | | | (0.08 | ) | | | (0.11 | ) | | | — | |
Distributions from realized gains | | | (0.03 | ) | | | — | | | | — | | | | — | | | | (0.03 | ) | | | — | | | | — | | | | — | |
| | |
|
|
| |
|
|
| |
|
|
| |
|
|
| |
|
|
| |
|
|
| |
|
|
| |
|
|
|
Total dividends and distributions | | | (0.14 | ) | | | (0.05 | ) | | | (0.09 | ) | | | — | | | | (0.18 | ) | | | (0.08 | ) | | | (0.11 | ) | | | — | |
| | |
|
|
| |
|
|
| |
|
|
| |
|
|
| |
|
|
| |
|
|
| |
|
|
| |
|
|
|
Redemption fees | | | — | | | | — | | | | — | | | | — | | | | — | | | | — | | | | — | | | | — | |
| | |
|
|
| |
|
|
| |
|
|
| |
|
|
| |
|
|
| |
|
|
| |
|
|
| |
|
|
|
Net asset value, end of period | | $ | 13.14 | | | $ | 11.41 | | | $ | 9.77 | | | $ | 7.91 | | | $ | 13.18 | | | $ | 11.44 | | | $ | 9.80 | | | $ | 7.93 | |
| | |
|
|
| |
|
|
| |
|
|
| |
|
|
| |
|
|
| |
|
|
| |
|
|
| |
|
|
|
Total return (b)† | | | 16.55 | % | | | 17.39 | % | | | 25.02 | % | | | (20.90 | )% | | | 16.79 | % | | | 17.73 | % | | | 25.40 | % | | | (20.70 | )% |
| | |
|
|
| |
|
|
| |
|
|
| |
|
|
| |
|
|
| |
|
|
| |
|
|
| |
|
|
|
Ratios/Supplemental Data: | | | | | | | | | | | | | | | | | | | | | | | | | | | | | | | | |
Net assets, end of period (000’s) | | $ | 4,208 | | | $ | 1,982 | | | $ | 1,562 | | | $ | 1,059 | | | $ | 33,503 | | | $ | 7,119 | | | $ | 6,164 | | | $ | 5,055 | |
Ratio of expenses to average net assets: | | | | | | | | | | | | | | | | | | | | | | | | | | | | | | | | |
After waivers and reimbursements (a) | | | 1.90 | % | | | 1.90 | % | | | 1.90 | % | | | 1.90 | % | | | 1.65 | % | | | 1.65 | % | | | 1.65 | % | | | 1.65 | % |
After waivers, reimbursements and fees paid indirectly (a) | | | 1.86 | % | | | 1.63 | % | | | 1.86 | % | | | 1.86 | % | | | 1.61 | % | | | 1.38 | % | | | 1.61 | % | | | 1.61 | % |
Before waivers, reimbursements and fees paid indirectly (a) | | | 3.50 | % | | | 5.72 | % | | | 7.02 | % | | | 7.65 | % | | | 3.25 | % | | | 5.47 | % | | | 6.77 | % | | | 7.40 | % |
Ratio of net investment loss to average net assets: | | | | | | | | | | | | | | | | | | | | | | | | | | | | | | | | |
After waivers and reimbursements (a) | | | 0.57 | % | | | 0.25 | % | | | 0.49 | % | | | 0.39 | % | | | 0.82 | % | | | 0.50 | % | | | 0.74 | % | | | 0.64 | % |
After waivers, reimbursements and fees paid indirectly (a) | | | 0.61 | % | | | 0.52 | % | | | 0.53 | % | | | 0.43 | % | | | 0.86 | % | | | 0.77 | % | | | 0.78 | % | | | 0.68 | % |
Before waivers, reimbursements and fees paid indirectly (a) | | | (1.03 | )% | | | (3.57 | )% | | | (4.63 | )% | | | (5.37 | )% | | | (0.78 | )% | | | (3.32 | )% | | | (4.38 | )% | | | (5.12 | )% |
Portfolio turnover rate (d) | | | 73 | % | | | 67 | % | | | 92 | % | | | 27 | % | | | 73 | % | | | 67 | % | | | 92 | % | | | 27 | % |
Effect of contractual expense limitation during the period: | | | | | | | | | | | | | | | | | | | | | | | | | | | | | | | | |
Per share benefit to net investment loss | | $ | 0.20 | | | $ | 0.41 | | | $ | 0.43 | | | $ | 0.43 | | | $ | 0.20 | | | $ | 0.42 | | | $ | 0.43 | | | $ | 0.44 | |
81
AXA ENTERPRISE MULTIMANAGER TECHNOLOGY FUND
| | | | | | | | | | | | | | | | | | | | | | | | | | | | | | | | | | | | |
| | | Class A
(New Class)
| | | Class B
| | | Class C
| |
| | | December 13,
2004* to
October 31,
2005(c)(e)
| | | Year Ended October 31,
| | | December 31, 2001* to October 31, 2002(c)
| | | Year Ended October 31,
| | | December 31, 2001* to October 31, 2002(c)
| |
| | | | 2005
(c)(e)
| | | 2004
(c)
| | | 2003
(c)
| | | | 2005
(c)(e)
| | | 2004
(c)
| | | 2003
(c)
| | |
Net asset value, beginning of period | | $ | 9.53 | | | $ | 8.67 | | | $ | 8.97 | | | $ | 5.74 | | | $ | 10.00 | | | $ | 8.67 | | | $ | 8.97 | | | $ | 5.74 | | | $ | 10.00 | |
| | |
|
|
| |
|
|
| |
|
|
| |
|
|
| |
|
|
| |
|
|
| |
|
|
| |
|
|
| |
|
|
|
Income (loss) from investment operations: | | | | | | | | | | | | | | | | | | | | | | | | | | | | | | | | | | | | |
Net investment loss | | | (0.08 | ) | | | (0.14 | ) | | | (0.20 | ) | | | (0.17 | ) | | | (0.14 | ) | | | (0.14 | ) | | | (0.20 | ) | | | (0.17 | ) | | | (0.14 | ) |
Net realized and unrealized gain (loss) on investments and foreign currency transactions | | | 0.46 | | | | 1.14 | | | | (0.10 | ) | | | 3.41 | | | | (4.12 | ) | | | 1.14 | | | | (0.10 | ) | | | 3.41 | | | | (4.12 | ) |
| | |
|
|
| |
|
|
| |
|
|
| |
|
|
| |
|
|
| |
|
|
| |
|
|
| |
|
|
| |
|
|
|
Total from investment operations | | | 0.38 | | | | 1.00 | | | | (0.30 | ) | | | 3.24 | | | | (4.26 | ) | | | 1.00 | | | | (0.30 | ) | | | 3.24 | | | | (4.26 | ) |
| | |
|
|
| |
|
|
| |
|
|
| |
|
|
| |
|
|
| |
|
|
| |
|
|
| |
|
|
| |
|
|
|
Redemption fees | | | — | # | | | — | | | | — | | | | — | | | | — | | | | — | | | | — | | | | — | | | | — | |
| | |
|
|
| |
|
|
| |
|
|
| |
|
|
| |
|
|
| |
|
|
| |
|
|
| |
|
|
| |
|
|
|
Less distributions: | | | | | | | | | | | | | | | | | | | | | | | | | | | | | | | | | | | | |
Dividends from net investment income | | | — | | | | — | | | | — | | | | (0.01 | ) | | | — | | | | — | | | | — | | | | (0.01 | ) | | | — | |
| | |
|
|
| |
|
|
| |
|
|
| |
|
|
| |
|
|
| |
|
|
| |
|
|
| |
|
|
| |
|
|
|
Redemption fees | | | — | | | | — | # | | | — | | | | — | | | | — | | | | — | # | | | — | | | | — | | | | — | |
| | |
|
|
| |
|
|
| |
|
|
| |
|
|
| |
|
|
| |
|
|
| |
|
|
| |
|
|
| |
|
|
|
Net asset value, end of period | | $ | 9.91 | | | $ | 9.67 | | | $ | 8.67 | | | $ | 8.97 | | | $ | 5.74 | | | $ | 9.67 | | | $ | 8.67 | | | $ | 8.97 | | | $ | 5.74 | |
| | |
|
|
| |
|
|
| |
|
|
| |
|
|
| |
|
|
| |
|
|
| |
|
|
| |
|
|
| |
|
|
|
Total return (b)† | | | 3.99 | % | | | 11.53 | % | | | (3.34 | )% | | | 56.41 | % | | | (42.60 | )% | | | 11.53 | % | | | (3.34 | )% | | | 56.41 | % | | | (42.60 | )% |
| | |
|
|
| |
|
|
| |
|
|
| |
|
|
| |
|
|
| |
|
|
| |
|
|
| |
|
|
| |
|
|
|
Ratios/Supplemental Data: | | | | | | | | | | | | | | | | | | | | | | | | | | | | | | | | | | | | |
Net assets, end of period (000’s) | | $ | 23,301 | | | $ | 30,012 | | | $ | 1,035 | | | $ | 1,056 | | | $ | 429 | | | $ | 7,753 | | | $ | 67 | | | $ | 62 | | | $ | 41 | |
Ratio of expenses to average net assets: | | | | | | | | | | | | | | | | | | | | | | | | | | | | | | | | | | | | |
After waivers and reimbursements (a) | | | 2.15 | % | | | 2.70 | % | | | 2.70 | % | | | 2.70 | % | | | 2.70 | % | | | 2.70 | % | | | 2.70 | % | | | 2.70 | % | | | 2.70 | % |
After waivers, reimbursements and fees paid indirectly (a) | | | 1.40 | % | | | 1.95 | % | | | 2.49 | % | | | 2.67 | % | | | 2.67 | % | | | 1.95 | % | | | 2.49 | % | | | 2.67 | % | | | 2.67 | % |
Before waivers, reimbursements and fees paid indirectly (a) | | | 4.43 | % | | | 4.98 | % | | | 8.09 | % | | | 10.01 | % | | | 10.13 | % | | | 4.98 | % | | | 8.09 | % | | | 10.01 | % | | | 10.13 | % |
Ratio of net investment loss to average net assets: | | | | | | | | | | | | | | | | | | | | | | | | | | | | | | | | | | | | |
After waivers and reimbursements (a) | | | (1.62 | )% | | | (2.17 | )% | | | (2.48 | )% | | | (2.44 | )% | | | (2.44 | )% | | | (2.17 | )% | | | (2.48 | )% | | | (2.44 | )% | | | (2.44 | )% |
After waivers, reimbursements and fees paid indirectly (a) | | | (0.87 | )% | | | (1.42 | )% | | | (2.27 | )% | | | (2.41 | )% | | | (2.41 | )% | | | (1.42 | )% | | | (2.27 | )% | | | (2.41 | )% | | | (2.41 | )% |
Before waivers, reimbursements and fees paid indirectly (a) | | | (3.90 | )% | | | (4.45 | )% | | | (7.87 | )% | | | (9.75 | )% | | | (9.87 | )% | | | (4.45 | )% | | | (7.87 | )% | | | (9.75 | )% | | | (9.87 | )% |
Portfolio turnover rate (d) | | | 252 | % | | | 252 | % | | | 172 | % | | | 125 | % | | | 154 | % | | | 252 | % | | | 172 | % | | | 125 | % | | | 154 | % |
Effect of contractual expense limitation during the period: | | | | | | | | | | | | | | | | | | | | | | | | | | | | | | | | | | | | |
Per share benefit to net investment loss | | $ | 0.20 | | | $ | 0.22 | | | $ | 0.47 | | | $ | 0.51 | | | $ | 0.43 | | | $ | 0.22 | | | $ | 0.47 | | | $ | 0.50 | | | $ | 0.46 | |
82
AXA ENTERPRISE MULTIMANAGER TECHNOLOGY FUND (cont’d)
| | | | | | | | | | | | | | | | | | | | | | | | | | | | | | | | |
| | | Class P (formerly Class A)
| | | Class Y (formerly Class Z)
| |
| | | Year Ended October 31,
| | | December 31, 2001* to October 31, 2002(c)
| | | Year Ended October 31,
| | | December 31, 2001* to October 31, 2002(c)
| |
| | | 2005(c)(e)
| | | 2004(c)
| | | 2003(c)
| | | | 2005(c)(e)
| | | 2004(c)
| | | 2003(c)
| | |
Net asset value, beginning of period | | $ | 8.84 | | | $ | 9.07 | | | $ | 5.77 | | | $ | 10.00 | | | $ | 8.87 | | | $ | 9.09 | | | $ | 5.78 | | | $ | 10.00 | |
| | |
|
|
| |
|
|
| |
|
|
| |
|
|
| |
|
|
| |
|
|
| |
|
|
| |
|
|
|
Income (loss) from investment operations: | | | | | | | | | | | | | | | | | | | | | | | | | | | | | | | | |
Net investment loss | | | (0.06 | ) | | | (0.14 | ) | | | (0.12 | ) | | | (0.10 | ) | | | (0.04 | ) | | | (0.11 | ) | | | (0.10 | ) | | | (0.09 | ) |
Net realized and unrealized gain (loss) on investments and foreign currency transactions | | | 1.15 | | | | (0.09 | ) | | | 3.44 | | | | (4.13 | ) | | | 1.16 | | | | (0.11 | ) | | | 3.44 | | | | (4.13 | ) |
| | |
|
|
| |
|
|
| |
|
|
| |
|
|
| |
|
|
| |
|
|
| |
|
|
| |
|
|
|
Total from investment operations | | | 1.09 | | | | (0.23 | ) | | | 3.32 | | | | (4.23 | ) | | | 1.12 | | | | (0.22 | ) | | | 3.34 | | | | (4.22 | ) |
| | |
|
|
| |
|
|
| |
|
|
| |
|
|
| |
|
|
| |
|
|
| |
|
|
| |
|
|
|
Redemption fees | | | — | | | | — | | | | — | | | | — | | | | — | | | | — | | | | — | | | | — | |
| | |
|
|
| |
|
|
| |
|
|
| |
|
|
| |
|
|
| |
|
|
| |
|
|
| |
|
|
|
Less distributions: | | | | | | | | | | | | | | | | | | | | | | | | | | | | | | | | |
Dividends from net investment income | | | — | | | | — | | | | (0.02 | ) | | | — | | | | — | | | | — | # | | | (0.03 | ) | | | — | |
| | |
|
|
| |
|
|
| |
|
|
| |
|
|
| |
|
|
| |
|
|
| |
|
|
| |
|
|
|
Redemption fees | | | — | | | | — | | | | — | | | | — | | | | — | | | | — | | | | — | | | | — | |
| | |
|
|
| |
|
|
| |
|
|
| |
|
|
| |
|
|
| |
|
|
| |
|
|
| |
|
|
|
Net asset value, end of period | | $ | 9.93 | | | $ | 8.84 | | | $ | 9.07 | | | $ | 5.77 | | | $ | 9.99 | | | $ | 8.87 | | | $ | 9.09 | | | $ | 5.78 | |
| | |
|
|
| |
|
|
| |
|
|
| |
|
|
| |
|
|
| |
|
|
| |
|
|
| |
|
|
|
Total return (b)† | | | 12.33 | % | | | (2.54 | )% | | | 57.67 | % | | | (42.30 | )% | | | 12.63 | % | | | (2.39 | )% | | | 58.14 | % | | | (42.20 | )% |
| | |
|
|
| |
|
|
| |
|
|
| |
|
|
| |
|
|
| |
|
|
| |
|
|
| |
|
|
|
Ratios/Supplemental Data: | | | | | | | | | | | | | | | | | | | | | | | | | | | | | | | | |
Net assets, end of period (000’s) | | $ | 1,297 | | | $ | 477 | | | $ | 480 | | | $ | 219 | | | $ | 6,337 | | | $ | 5,474 | | | $ | 5,954 | | | $ | 3,494 | |
Ratio of expenses to average net assets: | | | | | | | | | | | | | | | | | | | | | | | | | | | | | | | | |
After waivers and reimbursements (a) | | | 1.95 | % | | | 1.95 | % | | | 1.95 | % | | | 1.95 | % | | | 1.70 | % | | | 1.70 | % | | | 1.70 | % | | | 1.70 | % |
After waivers, reimbursements and fees paid indirectly (a) | | | 1.20 | % | | | 1.74 | % | | | 1.92 | % | | | 1.92 | % | | | 0.95 | % | | | 1.49 | % | | | 1.67 | % | | | 1.67 | % |
Before waivers, reimbursements and fees paid indirectly (a) | | | 4.23 | % | | | 7.34 | % | | | 9.26 | % | | | 9.38 | % | | | 3.98 | % | | | 7.09 | % | | | 9.01 | % | | | 9.13 | % |
Ratio of net investment loss to average net assets: | | | | | | | | | | | | | | | | | | | | | | | | | | | | | | | | |
After waivers and reimbursements (a) | | | (1.42 | )% | | | (1.73 | )% | | | (1.69 | )% | | | (1.69 | )% | | | (1.17 | )% | | | (1.48 | )% | | | (1.44 | )% | | | (1.44 | )% |
After waivers, reimbursements and fees paid indirectly (a) | | | (0.67 | )% | | | (1.52 | )% | | | (1.66 | )% | | | (1.66 | )% | | | (0.42 | )% | | | (1.27 | )% | | | (1.41 | )% | | | (1.41 | )% |
Before waivers, reimbursements and fees paid indirectly (a) | | | (3.70 | )% | | | (7.12 | )% | | | (9.00 | )% | | | (9.12 | )% | | | (3.45 | )% | | | (6.87 | )% | | | (8.75 | )% | | | (8.87 | )% |
Portfolio turnover rate (d) | | | 252 | % | | | 172 | % | | | 125 | % | | | 154 | % | | | 252 | % | | | 172 | % | | | 125 | % | | | 154 | % |
Effect of contractual expense limitation during the period: | | | | | | | | | | | | | | | | | | | | | | | | | | | | | | | | |
Per share benefit to net investment loss | | $ | 0.21 | | | $ | 0.48 | | | $ | 0.52 | | | $ | 0.44 | | | $ | 0.21 | | | $ | 0.48 | | | $ | 0.51 | | | $ | 0.47 | |
83
AXA ENTERPRISE MULTIMANAGER HEALTH CARE FUND
| | | | | | | | | | | | | | | | | | | | | | | | | | | | | | | | | | | | |
| | | Class A
(New Class)
| | | Class B
| | | Class C
| |
| | | December 13,
2004* to
October 31,
2005(c)(e)
| | | Year Ended October 31,
| | | December 31, 2001* to October 31, 2002(c)
| | | Year Ended October 31,
| | | December 31, 2001* to October 31, 2002(c)
| |
| | | | 2005(c)(e)
| | | 2004(c)
| | | 2003(c)
| | | | 2005(c)(e)
| | | 2004(c)
| | | 2003(c)
| | |
Net asset value, beginning of period | | $ | 11.07 | | | $ | 10.25 | | | $ | 9.30 | | | $ | 8.02 | | | $ | 10.00 | | | $ | 10.26 | | | $ | 9.30 | | | $ | 8.03 | | | $ | 10.00 | |
| | |
|
|
| |
|
|
| |
|
|
| |
|
|
| |
|
|
| |
|
|
| |
|
|
| |
|
|
| |
|
|
|
Income (loss) from investment operations: | | | | | | | | | | | | | | | | | | | | | | | | | | | | | | | | | | | | |
Net investment loss | | | (0.11 | ) | | | (0.17 | ) | | | (0.17 | ) | | | (0.15 | ) | | | (0.14 | ) | | | (0.17 | ) | | | (0.17 | ) | | | (0.15 | ) | | | (0.14 | ) |
Net realized and unrealized gain (loss) on investments and foreign currency transactions | | | 0.63 | | | | 1.26 | | | | 1.12 | | | | 1.44 | | | | (1.84 | ) | | | 1.25 | | | | 1.13 | | | | 1.43 | | | | (1.83 | ) |
| | |
|
|
| |
|
|
| |
|
|
| |
|
|
| |
|
|
| |
|
|
| |
|
|
| |
|
|
| |
|
|
|
Total from investment operations | | | 0.52 | | | | 1.09 | | | | 0.95 | | | | 1.29 | | | | (1.98 | ) | | | 1.08 | | | | 0.96 | | | | 1.28 | | | | (1.97 | ) |
| | |
|
|
| |
|
|
| |
|
|
| |
|
|
| |
|
|
| |
|
|
| |
|
|
| |
|
|
| |
|
|
|
Redemption fees | | | — | # | | | — | | | | — | | | | — | | | | — | | | | — | | | | — | | | | — | | | | — | |
| | |
|
|
| |
|
|
| |
|
|
| |
|
|
| |
|
|
| |
|
|
| |
|
|
| |
|
|
| |
|
|
|
Less distributions: | | | | | | | | | | | | | | | | | | | | | | | | | | | | | | | | | | | | |
Dividends from net investment income | | | — | | | | — | | | | — | | | | (0.01 | ) | | | — | | | | — | | | | — | | | | (0.01 | ) | | | — | |
Distributions from realized gains | | | (0.61 | ) | | | (0.61 | ) | | | — | | | | — | | | | — | | | | (0.61 | ) | | | — | | | | — | | | | — | |
| | |
|
|
| |
|
|
| |
|
|
| |
|
|
| |
|
|
| |
|
|
| |
|
|
| |
|
|
| |
|
|
|
Total dividends and distributions | | | (0.61 | ) | | | (0.61 | ) | | | — | | | | (0.01 | ) | | | — | | | | (0.61 | ) | | | — | | | | (0.01 | ) | | | — | |
| | |
|
|
| |
|
|
| |
|
|
| |
|
|
| |
|
|
| |
|
|
| |
|
|
| |
|
|
| |
|
|
|
Redemption fees | | | — | | | | — | | | | — | | | | — | | | | — | | | | — | # | | | — | | | | — | | | | — | |
| | |
|
|
| |
|
|
| |
|
|
| |
|
|
| |
|
|
| |
|
|
| |
|
|
| |
|
|
| |
|
|
|
Net asset value, end of period | | $ | 10.98 | | | $ | 10.73 | | | $ | 10.25 | | | $ | 9.30 | | | $ | 8.02 | | | $ | 10.73 | | | $ | 10.26 | | | $ | 9.30 | | | $ | 8.03 | |
| | |
|
|
| |
|
|
| |
|
|
| |
|
|
| |
|
|
| |
|
|
| |
|
|
| |
|
|
| |
|
|
|
Total return (b)† | | | 4.89 | % | | | 10.70 | % | | | 10.32 | % | | | 15.89 | % | | | (19.70 | )% | | | 10.70 | % | | | 10.32 | % | | | 15.89 | % | | | (19.70 | )% |
| | |
|
|
| |
|
|
| |
|
|
| |
|
|
| |
|
|
| |
|
|
| |
|
|
| |
|
|
| |
|
|
|
Ratios/Supplemental Data: | | | | | | | | | | | | | | | | | | | | | | | | | | | | | | | | | | | | |
Net assets, end of period (000’s) | | $ | 408 | | | $ | 234 | | | $ | 1,288 | | | $ | 1,126 | | | $ | 932 | | | $ | 183 | | | $ | 98 | | | $ | 165 | | | $ | 157 | |
Ratio of expenses to average net assets: | | | | | | | | | | | | | | | | | | | | | | | | | | | | | | | | | | | | |
After waivers and reimbursements (a) | | | 2.15 | % | | | 2.70 | % | | | 2.70 | % | | | 2.70 | % | | | 2.70 | % | | | 2.70 | % | | | 2.70 | % | | | 2.70 | % | | | 2.70 | % |
After waivers, reimbursements and fees paid indirectly (a) | | | 2.12 | % | | | 2.67 | % | | | 2.63 | % | | | 2.69 | % | | | 2.68 | % | | | 2.67 | % | | | 2.63 | % | | | 2.69 | % | | | 2.68 | % |
Before waivers, reimbursements and fees paid indirectly (a) | | | 6.07 | % | | | 6.62 | % | | | 7.25 | % | | | 8.15 | % | | | 8.58 | % | | | 6.62 | % | | | 7.25 | % | | | 8.15 | % | | | 8.58 | % |
Ratio of net investment loss to average net assets: | | | | | | | | | | | | | | | | | | | | | | | | | | | | | | | | | | | | |
After waivers and reimbursements (a) | | | (1.14 | )% | | | (1.69 | )% | | | (1.71 | )% | | | (1.72 | )% | | | (1.90 | )% | | | (1.69 | )% | | | (1.71 | )% | | | (1.72 | )% | | | (1.90 | )% |
After waivers, reimbursements and fees paid indirectly (a) | | | (1.11 | )% | | | (1.66 | )% | | | (1.64 | )% | | | (1.71 | )% | | | (1.88 | )% | | | (1.66 | )% | | | (1.64 | )% | | | (1.71 | )% | | | (1.88 | )% |
Before waivers, reimbursements and fees paid indirectly (a) | | | (5.06 | )% | | | (5.61 | )% | | | (6.26 | )% | | | (7.17 | )% | | | (7.78 | )% | | | (5.61 | )% | | | (6.26 | )% | | | (7.17 | )% | | | (7.78 | )% |
Portfolio turnover rate (d) | | | 115 | % | | | 115 | % | | | 127 | % | | | 103 | % | | | 102 | % | | | 115 | % | | | 127 | % | | | 103 | % | | | 102 | % |
Effect of contractual expense limitation during the period: | | | | | | | | | | | | | | | | | | | | | | | | | | | | | | | | | | | | |
Per share benefit to net investment loss | | $ | 0.38 | | | $ | 0.41 | | | $ | 0.46 | | | $ | 0.47 | | | $ | 0.42 | | | $ | 0.41 | | | $ | 0.46 | | | $ | 0.47 | | | $ | 0.43 | |
84
AXA ENTERPRISE MULTIMANAGER HEALTH CARE FUND (cont’d)
| | | | | | | | | | | | | | | | | | | | | | | | | | | | | | | | |
| | | Class P (formerly Class A)
| | | Class Y (formerly Class Z)
| |
| | | Year Ended October 31,
| | | December 31, 2001* to October 31, 2002(c)
| | | Year Ended October 31,
| | | December 31, 2001* to October 31, 2002(c)
| |
| | | 2005(c)(e)
| | | 2004(c)
| | | 2003(c)
| | | | 2005(c)(e)
| | | 2004(c)
| | | 2003(c)
| | |
Net asset value, beginning of period | | $ | 10.42 | | | $ | 9.38 | | | $ | 8.07 | | | $ | 10.00 | | | $ | 10.47 | | | $ | 9.41 | | | $ | 8.09 | | | $ | 10.00 | |
| | |
|
|
| |
|
|
| |
|
|
| |
|
|
| |
|
|
| |
|
|
| |
|
|
| |
|
|
|
Income (loss) from investment operations: | | | | | | | | | | | | | | | | | | | | | | | | | | | | | | | | |
Net investment loss | | | (0.10 | ) | | | (0.09 | ) | | | (0.08 | ) | | | (0.08 | ) | | | (0.07 | ) | | | (0.07 | ) | | | (0.06 | ) | | | (0.07 | ) |
Net realized and unrealized gain (loss) on investments and foreign currency transactions | | | 1.27 | | | | 1.13 | | | | 1.43 | | | | (1.85 | ) | | | 1.28 | | | | 1.13 | | | | 1.44 | | | | (1.84 | ) |
| | |
|
|
| |
|
|
| |
|
|
| |
|
|
| |
|
|
| |
|
|
| |
|
|
| |
|
|
|
Total from investment operations | | | 1.17 | | | | 1.04 | | | | 1.35 | | | | (1.93 | ) | | | 1.21 | | | | 1.06 | | | | 1.38 | | | | (1.91 | ) |
| | |
|
|
| |
|
|
| |
|
|
| |
|
|
| |
|
|
| |
|
|
| |
|
|
| |
|
|
|
Redemption fees | | | — | | | | — | | | | — | | | | — | | | | — | | | | — | | | | — | | | | — | |
| | |
|
|
| |
|
|
| |
|
|
| |
|
|
| |
|
|
| |
|
|
| |
|
|
| |
|
|
|
Less distributions: | | | | | | | | | | | | | | | | | | | | | | | | | | | | | | | | |
Dividends from net investment income | | | — | | | | — | | | | (0.04 | ) | | | — | | | | — | | | | — | # | | | (0.06 | ) | | | — | |
Distributions from realized gains | | | (0.61 | ) | | | — | | | | — | | | | — | | | | (0.61 | ) | | | — | | | | — | | | | — | |
| | |
|
|
| |
|
|
| |
|
|
| |
|
|
| |
|
|
| |
|
|
| |
|
|
| |
|
|
|
Total dividends and distributions | | | (0.61 | ) | | | — | | | | (0.04 | ) | | | — | | | | (0.61 | ) | | | — | # | | | (0.06 | ) | | | — | |
| | |
|
|
| |
|
|
| |
|
|
| |
|
|
| |
|
|
| |
|
|
| |
|
|
| |
|
|
|
Redemption fees | | | — | | | | — | | | | — | | | | — | | | | — | | | | — | | | | — | | | | — | |
| | |
|
|
| |
|
|
| |
|
|
| |
|
|
| |
|
|
| |
|
|
| |
|
|
| |
|
|
|
Net asset value, end of period | | $ | 10.98 | | | $ | 10.42 | | | $ | 9.38 | | | $ | 8.07 | | | $ | 11.07 | | | $ | 10.47 | | | $ | 9.41 | | | $ | 8.09 | |
| | |
|
|
| |
|
|
| |
|
|
| |
|
|
| |
|
|
| |
|
|
| |
|
|
| |
|
|
|
Total return (b)† | | | 11.43 | % | | | 11.09 | % | | | 16.78 | % | | | (19.30 | )% | | | 11.77 | % | | | 11.32 | % | | | 17.16 | % | | | (19.10 | )% |
| | |
|
|
| |
|
|
| |
|
|
| |
|
|
| |
|
|
| |
|
|
| |
|
|
| |
|
|
|
Ratios/Supplemental Data: | | | | | | | | | | | | | | | | | | | | | | | | | | | | | | | | |
Net assets, end of period (000’s) | | $ | 1,796 | | | $ | 848 | | | $ | 801 | | | $ | 561 | | | $ | 6,566 | | | $ | 6,277 | | | $ | 5,670 | | | $ | 4,884 | |
Ratio of expenses to average net assets: | | | | | | | | | | | | | | | | | | | | | | | | | | | | | | | | |
After waivers and reimbursements (a) | | | 1.95 | % | | | 1.95 | % | | | 1.95 | % | | | 1.95 | % | | | 1.70 | % | | | 1.70 | % | | | 1.70 | % | | | 1.70 | % |
After waivers, reimbursements and fees paid indirectly (a) | | | 1.92 | % | | | 1.88 | % | | | 1.94 | % | | | 1.93 | % | | | 1.67 | % | | | 1.63 | % | | | 1.69 | % | | | 1.68 | % |
Before waivers, reimbursements and fees paid indirectly (a) | | | 5.87 | % | | | 6.50 | % | | | 7.40 | % | | | 7.83 | % | | | 5.62 | % | | | 6.25 | % | | | 7.15 | % | | | 7.58 | % |
Ratio of net investment loss to average net assets: | | | | | | | | | | | | | | | | | | | | | | | | | | | | | | | | |
After waivers and reimbursements (a) | | | (0.94 | )% | | | (0.96 | )% | | | (0.97 | )% | | | (1.15 | )% | | | (0.69 | )% | | | (0.71 | )% | | | (0.72 | )% | | | (0.90 | )% |
After waivers, reimbursements and fees paid indirectly (a) | | | (0.91 | )% | | | (0.89 | )% | | | (0.96 | )% | | | (1.13 | )% | | | (0.66 | )% | | | (0.64 | )% | | | (0.71 | )% | | | (0.88 | )% |
Before waivers, reimbursements and fees paid indirectly (a) | | | (4.86 | )% | | | (5.51 | )% | | | (6.42 | )% | | | (7.03 | )% | | | (4.61 | )% | | | (5.26 | )% | | | (6.17 | )% | | | (6.78 | )% |
Portfolio turnover rate (d) | | | 115 | % | | | 127 | % | | | 103 | % | | | 102 | % | | | 115 | % | | | 127 | % | | | 103 | % | | | 102 | % |
Effect of contractual expense limitation during the period: | | | | | | | | | | | | | | | | | | | | | | | | | | | | | | | | |
Per share benefit to net investment loss | | $ | 0.42 | | | $ | 0.47 | | | $ | 0.47 | | | $ | 0.42 | | | $ | 0.42 | | | $ | 0.47 | | | $ | 0.47 | | | $ | 0.44 | |
85
AXA ENTERPRISE MULTIMANAGER CORE BOND FUND
| | | | | | | | | | | | | | | | | | | | | | | | | | | | | | | | | | | | |
| | | Class A
(New Class)
| | | Class B
| | | Class C
| |
| | | December 13,
2004* to
October 31,
2005(c)(e)
| | | Year Ended October 31,
| | | December 31, 2001* to October 31, 2002(c)
| | | Year Ended October 31,
| | | December 31, 2001* to October 31, 2002(c)
| |
| | | | 2005
(c)(e)
| | | 2004
(c)
| | | 2003
(c)
| | | | 2005
(c)(e)
| | | 2004
(c)
| | | 2003
(c)
| | |
Net asset value, beginning of period | | $ | 10.22 | | | $ | 10.21 | | | $ | 10.23 | | | $ | 10.20 | | | $ | 10.00 | | | $ | 10.20 | | | $ | 10.22 | | | $ | 10.19 | | | $ | 10.00 | |
| | |
|
|
| |
|
|
| |
|
|
| |
|
|
| |
|
|
| |
|
|
| |
|
|
| |
|
|
| |
|
|
|
Income (loss) from investment operations: | | | | | | | | | | | | | | | | | | | | | | | | | | | | | | | | | | | | |
Net investment income | | | 0.28 | | | | 0.26 | | | | 0.17 | | | | 0.19 | | | | 0.26 | | | | 0.26 | | | | 0.17 | | | | 0.19 | | | | 0.25 | |
Net realized and unrealized gain (loss) on investments and foreign currency transactions | | | (0.24 | ) | | | (0.26 | ) | | | 0.24 | | | | 0.32 | | | | 0.18 | | | | (0.26 | ) | | | 0.24 | | | | 0.32 | | | | 0.18 | |
| | |
|
|
| |
|
|
| |
|
|
| |
|
|
| |
|
|
| |
|
|
| |
|
|
| |
|
|
| |
|
|
|
Total from investment operations | | | 0.04 | | | | 0.00 | | | | 0.41 | | | | 0.51 | | | | 0.44 | | | | 0.00 | | | | 0.41 | | | | 0.51 | | | | 0.43 | |
| | |
|
|
| |
|
|
| |
|
|
| |
|
|
| |
|
|
| |
|
|
| |
|
|
| |
|
|
| |
|
|
|
Redemption fees | | | — | # | | | — | | | | — | | | | — | | | | — | | | | — | | | | — | | | | — | | | | — | |
| | |
|
|
| |
|
|
| |
|
|
| |
|
|
| |
|
|
| |
|
|
| |
|
|
| |
|
|
| |
|
|
|
Less distributions: | | | | | | | | | | | | | | | | | | | | | | | | | | | | | | | | | | | | |
Dividends from net investment income | | | (0.29 | ) | | | (0.26 | ) | | | (0.24 | ) | | | (0.27 | ) | | | (0.24 | ) | | | (0.26 | ) | | | (0.24 | ) | | | (0.27 | ) | | | (0.24 | ) |
Distributions from realized gains | | | (0.14 | ) | | | (0.14 | ) | | | (0.19 | ) | | | (0.21 | ) | | | — | | | | (0.14 | ) | | | (0.19 | ) | | | (0.21 | ) | | | — | |
| | |
|
|
| |
|
|
| |
|
|
| |
|
|
| |
|
|
| |
|
|
| |
|
|
| |
|
|
| |
|
|
|
Total dividends and distributions | | | (0.43 | ) | | | (0.40 | ) | | | (0.43 | ) | | | (0.48 | ) | | | (0.24 | ) | | | (0.40 | ) | | | (0.43 | ) | | | (0.48 | ) | | | (0.24 | ) |
| | |
|
|
| |
|
|
| |
|
|
| |
|
|
| |
|
|
| |
|
|
| |
|
|
| |
|
|
| |
|
|
|
Redemption fees | | | — | | | | — | | | | — | | | | — | | | | — | | | | — | # | | | — | | | | — | | | | — | |
| | |
|
|
| |
|
|
| |
|
|
| |
|
|
| |
|
|
| |
|
|
| |
|
|
| |
|
|
| |
|
|
|
Net asset value, end of period | | $ | 9.83 | | | $ | 9.81 | | | $ | 10.21 | | | $ | 10.23 | | | $ | 10.20 | | | $ | 9.80 | | | $ | 10.20 | | | $ | 10.22 | | | $ | 10.19 | |
| | |
|
|
| |
|
|
| |
|
|
| |
|
|
| |
|
|
| |
|
|
| |
|
|
| |
|
|
| |
|
|
|
Total return (b)† | | | 0.44 | % | | | 0.07 | % | | | 4.02 | % | | | 5.14 | % | | | 4.42 | % | | | (0.03 | )% | | | 4.12 | % | | | 5.14 | % | | | 4.38 | % |
| | |
|
|
| |
|
|
| |
|
|
| |
|
|
| |
|
|
| |
|
|
| |
|
|
| |
|
|
| |
|
|
|
Ratios/Supplemental Data: | | | | | | | | | | | | | | | | | | | | | | | | | | | | | | | | | | | | |
Net assets, end of period (000’s) | | $ | 39,508 | | | $ | 24,373 | | | $ | 7,380 | | | $ | 9,647 | | | $ | 8,989 | | | $ | 18,819 | | | $ | 1,000 | | | $ | 1,538 | | | $ | 1,960 | |
Ratio of expenses to average net assets: | | | | | | | | | | | | | | | | | | | | | | | | | | | | | | | | | | | | |
After waivers and reimbursements (a) | | | 1.25 | % | | | 1.80 | % | | | 1.80 | % | | | 1.80 | % | | | 1.80 | % | | | 1.80 | % | | | 1.80 | % | | | 1.80 | % | | | 1.80 | % |
Before waivers and reimbursements (a) | | | 2.37 | % | | | 2.92 | % | | | 3.19 | % | | | 3.00 | % | | | 3.33 | % | | | 2.92 | % | | | 3.19 | % | | | 3.00 | % | | | 3.33 | % |
Ratio of net investment income to average net assets: | | | | | | | | | | | | | | | | | | | | | | | | | | | | | | | | | | | | |
After waivers and reimbursements (a) | | | 3.11 | % | | | 2.56 | % | | | 1.68 | % | | | 1.84 | % | | | 2.94 | % | | | 2.56 | % | | | 1.68 | % | | | 1.84 | % | | | 2.94 | % |
Before waivers and reimbursements (a) | | | 1.99 | % | | | 1.44 | % | | | 0.29 | % | | | 0.64 | % | | | 1.41 | % | | | 1.44 | % | | | 0.29 | % | | | 0.64 | % | | | 1.41 | % |
Portfolio turnover rate (d) | | | 736 | % | | | 736 | % | | | 564 | % | | | 566 | % | | | 422 | % | | | 736 | % | | | 564 | % | | | 566 | % | | | 422 | % |
Effect of contractual expense limitation during the period: | | | | | | | | | | | | | | | | | | | | | | | | | | | | | | | | | | | | |
Per share benefit to net investment income | | $ | 0.10 | | | $ | 0.11 | | | $ | 0.14 | | | $ | 0.12 | | | $ | 0.13 | | | $ | 0.11 | | | $ | 0.14 | | | $ | 0.12 | | | $ | 0.13 | |
86
AXA ENTERPRISE MULTIMANAGER CORE BOND FUND (cont’d)
| | | | | | | | | | | | | | | | | | | | | | | | | | | | | | | | |
| | | Class P (formerly Class A)
| | | Class Y (formerly Class Z)
| |
| | | Year Ended October 31,
| | | December 31, 2001* to October 31, 2002(c)
| | | Year Ended October 31,
| | | December 31, 2001* to October 31, 2002(c)
| |
| | | 2005
(c)(e)
| | | 2004
(c)
| | | 2003
(c)
| | | | 2005
(c)(e)
| | | 2004
(c)
| | | 2003
(c)
| | |
Net asset value, beginning of period | | $ | 10.23 | | | $ | 10.25 | | | $ | 10.22 | | | $ | 10.00 | | | $ | 10.23 | | | $ | 10.25 | | | $ | 10.22 | | | $ | 10.00 | |
| | |
|
|
| |
|
|
| |
|
|
| |
|
|
| |
|
|
| |
|
|
| |
|
|
| |
|
|
|
Income (loss) from investment operations: | | | | | | | | | | | | | | | | | | | | | | | | | | | | | | | | |
Net investment income | | | 0.33 | | | | 0.25 | | | | 0.27 | | | | 0.31 | | | | 0.36 | | | | 0.27 | | | | 0.29 | | | | 0.33 | |
Net realized and unrealized gain (loss) on investments and foreign currency transactions | | | (0.27 | ) | | | 0.24 | | | | 0.32 | | | | 0.19 | | | | (0.26 | ) | | | 0.24 | | | | 0.33 | | | | 0.19 | |
| | |
|
|
| |
|
|
| |
|
|
| |
|
|
| |
|
|
| |
|
|
| |
|
|
| |
|
|
|
Total from investment operations | | | 0.06 | | | | 0.49 | | | | 0.59 | | | | 0.50 | | | | 0.10 | | | | 0.51 | | | | 0.62 | | | | 0.52 | |
| | |
|
|
| |
|
|
| |
|
|
| |
|
|
| |
|
|
| |
|
|
| |
|
|
| |
|
|
|
Redemption fees | | | — | | | | — | | | | — | | | | — | | | | — | | | | — | | | | — | | | | — | |
| | |
|
|
| |
|
|
| |
|
|
| |
|
|
| |
|
|
| |
|
|
| |
|
|
| |
|
|
|
Less distributions: | | | | | | | | | | | | | | | | | | | | | | | | | | | | | | | | |
Dividends from net investment income | | | (0.33 | ) | | | (0.32 | ) | | | (0.35 | ) | | | (0.28 | ) | | | (0.36 | ) | | | (0.34 | ) | | | (0.38 | ) | | | (0.30 | ) |
Distributions from realized gains | | | (0.14 | ) | | | (0.19 | ) | | | (0.21 | ) | | | — | | | | (0.14 | ) | | | (0.19 | ) | | | (0.21 | ) | | | — | |
| | |
|
|
| |
|
|
| |
|
|
| |
|
|
| |
|
|
| |
|
|
| |
|
|
| |
|
|
|
Total dividends and distributions | | | (0.47 | ) | | | (0.51 | ) | | | (0.56 | ) | | | (0.28 | ) | | | (0.50 | ) | | | (0.53 | ) | | | (0.59 | ) | | | (0.30 | ) |
| | |
|
|
| |
|
|
| |
|
|
| |
|
|
| |
|
|
| |
|
|
| |
|
|
| |
|
|
|
Redemption fees | | | — | | | | — | | | | — | | | | — | | | | — | | | | — | | | | — | | | | — | |
| | |
|
|
| |
|
|
| |
|
|
| |
|
|
| |
|
|
| |
|
|
| |
|
|
| |
|
|
|
Net asset value, end of period | | $ | 9.82 | | | $ | 10.23 | | | $ | 10.25 | | | $ | 10.22 | | | $ | 9.83 | | | $ | 10.23 | | | $ | 10.25 | | | $ | 10.22 | |
| | |
|
|
| |
|
|
| |
|
|
| |
|
|
| |
|
|
| |
|
|
| |
|
|
| |
|
|
|
Total return (b)† | | | 0.63 | % | | | 4.91 | % | | | 5.93 | % | | | 5.08 | % | | | 0.98 | % | | | 5.17 | % | | | 6.19 | % | | | 5.23 | % |
| | |
|
|
| |
|
|
| |
|
|
| |
|
|
| |
|
|
| |
|
|
| |
|
|
| |
|
|
|
Ratios/Supplemental Data: | | | | | | | | | | | | | | | | | | | | | | | | | | | | | | | | |
Net assets, end of period (000’s) | | $ | 7,977 | | | $ | 4,287 | | | $ | 4,514 | | | $ | 4,837 | | | $ | 39,747 | | | $ | 26,206 | | | $ | 26,589 | | | $ | 28,552 | |
Ratio of expenses to average net assets: | | | | | | | | �� | | | | | | | | | | | | | | | | | | | | | | | | |
After waivers and reimbursements (a) | | | 1.05 | % | | | 1.05 | % | | | 1.05 | % | | | 1.05 | % | | | 0.80 | % | | | 0.80 | % | | | 0.80 | % | | | 0.80 | % |
Before waivers and reimbursements (a) | | | 2.17 | % | | | 2.44 | % | | | 2.25 | % | | | 2.58 | % | | | 1.92 | % | | | 2.19 | % | | | 2.00 | % | | | 2.33 | % |
Ratio of net investment income to average net assets: | | | | | | | | | | | | | | | | | | | | | | | | | | | | | | | | |
After waivers and reimbursements (a) | | | 3.31 | % | | | 2.43 | % | | | 2.59 | % | | | 3.69 | % | | | 3.56 | % | | | 2.68 | % | | | 2.84 | % | | | 3.94 | % |
Before waivers and reimbursements (a) | | | 2.19 | % | | | 1.04 | % | | | 1.39 | % | | | 2.16 | % | | | 2.44 | % | | | 1.29 | % | | | 1.64 | % | | | 2.41 | % |
Portfolio turnover rate (d) | | | 736 | % | | | 564 | % | | | 566 | % | | | 422 | % | | | 736 | % | | | 564 | % | | | 566 | % | | | 422 | % |
Effect of contractual expense limitation during the period: | | | | | | | | | | | | | | | | | | | | | | | | | | | | | | | | |
Per share benefit to net investment income | | $ | 0.11 | | | $ | 0.14 | | | $ | 0.12 | | | $ | 0.13 | | | $ | 0.11 | | | $ | 0.14 | | | $ | 0.12 | | | $ | 0.13 | |
| * | Commencement of operations. |
| # | Per share amount is less than $0.005. |
| @ | Ratio amount is less than 0.005%. |
| † | The total returns for Class A, Class B, Class C and Class P do not include sales charges. |
| (a) | Ratios for periods of less than one year are annualized. |
| (b) | Total return for periods less than one year are not annualized. |
| (c) | Net investment income and capital changes are based on daily average shares outstanding. |
| (d) | Portfolio turnover rate for periods less than one year are not annualized. |
| (e) | Reflects overall fund ratios adjusted for class specific expenses. |
87
If you would like more information about the funds, the following documents are available free upon request and on the funds’ website at www.axaenterprise.com.
Annual and Semi-Annual Reports — Includes more information about the funds’ performance. The reports usually include performance information, a discussion of market conditions and the investment strategies that affected the funds’ performance during the last fiscal year.
Statement of Additional Information (SAI) — Provides more detailed information about the funds, has been filed with the Securities and Exchange Commission and is incorporated into this Prospectus by reference.
Portfolio Holdings Disclosure — A description of the funds’ policies and procedures with respect to the disclosure of their portfolio securities holdings is available (i) in the funds’ SAI and (ii) on the funds’ website at www.axaenterprise.com.
To order a free copy of a fund’s SAI and/or Annual and Semi-Annual Report,
contact your financial professional, or the Distributor at:
Enterprise Fund Distributors, Inc.
Atlanta Financial Center
3343 Peachtree Road, N.E., Suite 450
Atlanta, GA 30326
Telephone: 1-800-432-4320
Internet: www.axaenterprise.com
Your financial professional or AXA Enterprise Multimanager Funds will also be happy to answer your questions or to provide any additional information that you may require.
Information about the funds (including the SAI) can be reviewed and copied at the
SEC’s Public Reference Room in Washington, D.C. Information on the operation of the
Public Reference Room may be obtained by calling the SEC at 1-202-942-8090. Reports and
other information about the funds are available on the EDGAR database on the SEC’s
Internet site at:
http://www.sec.gov.
Investors may also obtain this information, after paying a duplicating
fee, by electronic request at the following E-mail address:
publicinfo@sec.gov or by writing the
SEC’s Public Reference Section,
Washington, D.C. 20549-0102.
AXA Enterprise Multimanager Funds
| | |
| AXA Enterprise Multimanager Growth Fund | | AXA Enterprise Multimanager International Equity Fund |
| AXA Enterprise Multimanager Core Equity Fund | | AXA Enterprise Multimanager Technology Fund |
| AXA Enterprise Multimanager Value Fund | | AXA Enterprise Multimanager Healthcare Fund |
| AXA Enterprise Multimanager Mid Cap Growth Fund | | AXA Enterprise Multimanager Core Bond Fund |
| AXA Enterprise Multimanager Mid Cap Value Fund | | |
(Investment Company Act File No. 811-10507)