UNITED STATES
SECURITIES AND EXCHANGE COMMISSION
Washington, D.C. 20549
FORM N-CSR
CERTIFIED SHAREHOLDER REPORT OF REGISTERED MANAGEMENT INVESTMENT
COMPANIES
Investment Company Act file number 811-5349
Goldman Sachs Trust
(Exact name of registrant as specified in charter)71 South Wacker Drive, Suite 500, Chicago, Illinois 60606
(Address of principal executive offices) (Zip code)| | | |
| Peter V. Bonanno, Esq. | | Copies to: |
| Goldman, Sachs & Co. | | Jack Murphy, Esq. |
| One New York Plaza | | Dechert |
| New York, New York 10004 | | 1775 I Street, NW |
| | | Washington, DC 20006 |
|
(Name and address of agents for service)
|
Registrant’s telephone number, including area code: (312) 655-4400
Date of fiscal year end: October 31
Date of reporting period: April 30, 2007
| | | |
| ITEM 1. | | REPORTS TO STOCKHOLDERS. |
| | | |
| | | The Semiannual Report to Stockholders is filed herewith. |
Goldman Sachs Funds
| |
| SINGLE/ MULTI-SECTOR TAXABLE FIXED INCOME FUNDS | Semiannual Report April 30, 2007 |
| | | |
| | Current income potential from portfolios that invest in a variety of fixed income securities. |
Goldman Sachs Single/ Multi-Sector
Taxable Fixed Income Funds
| | |
| n | GOLDMAN SACHS GOVERNMENT INCOME FUND | |
| |
| n | GOLDMAN SACHS U.S. MORTGAGES FUND | |
| |
| n | GOLDMAN SACHS CORE FIXED INCOME FUND | |
| |
| n | GOLDMAN SACHS INVESTMENT GRADE CREDIT FUND | |
| |
| n | GOLDMAN SACHS CORE PLUS FIXED INCOME FUND | |
| |
| The Goldman Sachs Government Income Fund’s net asset value and yield are not guaranteed by the U.S. government or by its agencies, instrumentalities or sponsored enterprises. Investments in fixed income securities are subject to the risks associated with debt securities including credit and interest rate risk. The guarantee on certain U.S. government securities applies only to the underlying securities of the Fund if held to maturity and not to the value of the Fund’s shares. The Fund’s investments in mortgage-backed securities are subject to prepayment risks. These risks may result in greater share price volatility. The Fund may make investments in derivative instruments, including options, financial futures, Eurodollar futures contracts, swaps, options on swaps and structured securities. Derivative instruments may involve a high degree of financial risk. These risks include the risk that a small movement in the price of the underlying security or benchmark may result in a disproportionately large movement, unfavorable or favorable, in the price of the derivative instrument; risks of default by a counterparty; and the risks that transactions may not be liquid. | |
The Goldman Sachs U.S. Mortgages Fund’s investment in mortgage-backed securities (MBS) is subject to prepayment risk, the risk that in a declining interest rate environment the Fund’s underlying mortgages may be prepaid, causing the Fund to have to reinvest at lower interest rates. This risk may result in greater share price volatility than a fixed income fund not invested in MBS. The guarantee on U.S. government securities applies only to the underlying securities of the Fund if held to maturity and not to the value of the Fund’s shares. The Fund may make substantial investments in derivative instruments, including options, financial futures, Eurodollar futures contracts, swaps, options on swaps and structured securities. Derivative instruments may involve a high degree of financial risk. These risks include the risk that a small movement in the price of the underlying security or benchmark may result in a disproportionately large movement, unfavorable or favorable, in the price of the derivative instrument; risks of default by a counterparty; and the risks that transactions may not be liquid. Investments in fixed income securities are subject to the risks associated with debt securities including credit and interest rate risk.
The Goldman Sachs Core Fixed Income Fund’s investments in fixed income securities are subject to the risks associated with debt securities including credit and interest rate risk. The guarantee on certain U.S. government securities applies only to the underlying securities of the Fund if held to maturity and not to the value of the Fund’s shares. The Fund’s investments in mortgage-backed securities are subject to prepayment risks. These risks may result in greater share price volatility. The Fund may make substantial investments in derivative instruments, including options, financial futures, Eurodollar futures contracts, swaps, options on swaps and structured securities. Derivative instruments may involve a high degree of financial risk. These risks include the risk that a small movement in the price of the underlying security or benchmark may result in a disproportionately large movement, unfavorable or favorable, in the price of the derivative instrument; risks of default by a counterparty; and the risks that transactions may not be liquid. The Fund may also engage in forward foreign currency transactions for both speculative and hedging purposes.
| | | | | |
| |
NOT FDIC-INSURED | | May Lose Value | | No Bank Guarantee |
| |
GOLDMAN SACHS SINGLE/ MULTI-SECTOR TAXABLE FIXED INCOME FUNDS
| |
| The Goldman Sachs Investment Grade Credit Fund’s investments in fixed income securities are subject to the risks associated with debt securities including credit and interest rate risk. The guarantee on certain U.S. government securities applies only to the underlying securities of the Fund if held to maturity and not to the value of the Fund’s shares. The Fund’s investments in mortgage-backed securities are subject to prepayment risks. These risks may result in greater share price volatility. The Fund may make substantial investments in derivative instruments, including options, financial futures, Eurodollar futures contracts, swaps, options on swaps and structured securities. Derivative instruments may involve a high degree of financial risk. These risks include the risk that a small movement in the price of the underlying security or benchmark may result in a disproportionately large movement, unfavorable or favorable, in the price of the derivative instrument; risks of default by a counterparty; and the risks that transactions may not be liquid. | |
The Goldman Sachs Core Plus Fixed Income Fund’s investments in fixed income securities are subject to the risks associated with debt securities including credit and interest rate risk. The guarantee on certain U.S. government securities applies only to the underlying securities of the Fund if held to maturity and not to the value of the Fund’s shares. The Fund’s investments in mortgage-backed securities are subject to prepayment risks. These risks may result in greater share price volatility. The Fund may make substantial investments in derivative instruments, including options, financial futures, Eurodollar futures contracts, swaps, options on swaps and structured securities. Derivative instruments may involve a high degree of financial risk. These risks include the risk that a small movement in the price of the underlying security or benchmark may result in a disproportionately large movement, unfavorable or favorable, in the price of the derivative instrument; risks of default by a counterparty; and the risks that transactions may not be liquid.
1
GOLDMAN SACHS SINGLE/ MULTI-SECTOR TAXABLE FIXED INCOME FUNDS
What Distinguishes Goldman Sachs Asset
Management’s Fixed Income Investment Process?
At Goldman Sachs Asset Management (“GSAM”), the goal of our fixed income investment process is to provide consistent, strong performance by actively managing our portfolios within a research-intensive, risk-managed framework.
| | | |
| |
| | | A key element of our fixed income investment philosophy is to evaluate the broadest global opportunity set to capture relative value across sectors and instruments. Our globally integrated investment process involves managing dynamically along the risk/return spectrum, as we continue to develop value-added strategies through:

n Assess relative value among sectors (such as mortgages and corporates) and sub-sectors
n Leverage the vast resources of GSAM in selecting securities for each portfolio

n Team approach to decision making
n Manage risk by avoiding significant sector and interest rate bets
n Careful management of yield curve strategies — while closely managing portfolio duration
 |
| | | | | | | |
| | | Fixed Income portfolios that: | | |
| | | | | |
| | | | |
n Include domestic and global investment options, income opportunities,
and access to areas of specialization | | |
| | | | |
n Capitalize on GSAM’s industry-renowned credit research capabilities | | |
| | | | |
n Use a risk-managed framework to seek total return, recognizing the
importance of investors’ capital accumulation goals as well as their
need for income | | |
2
PORTFOLIO RESULTS
Government Income Fund
Dear Shareholder:
This report provides an overview on the performance of the Goldman Sachs Government Income Fund during the six-month reporting period that ended April 30, 2007.
Performance Review
| |
| Over the six-month period that ended April 30, 2007, the Fund’s Class A, B, C, Institutional and Service Shares generated cumulative total returns, without sales charges, of 2.29%, 1.98%, 1.99%, 2.48% and 2.30%, respectively. These returns compare to the 2.61% cumulative total return of the Fund’s benchmark, the Lehman Brothers Government/ Mortgage Index, over the same time period. |
| |
| A combination of top-down and bottom-up investment strategies impacted the Fund’s performance relative to its benchmark over the period. Fundamental yield curve strategies contributed to performance as the yield curve steepened over the period. Based on negative fundamentals in the mortgage market, we continued to underweight the Fund’s mortgage exposure relative to the benchmark. This strategy detracted from performance as the mortgage sector outperformed over the period. However, individual mortgage securities helped enhance results. In particular, our selection of high quality floating rate adjustable rate mortgages (“ARMs”) and mortgage derivatives contributed positively to relative performance. On the other hand, the Fund’s holdings of Treasury Inflation Protected Securities (“TIPS”) and select asset-backed auto securities modestly detracted. |
Market Review
| |
| The six-month reporting period was characterized by a number of ongoing themes. The yield curve, for example, remained flat. Although short- to intermediate-term yields fell and longer yields rose modestly, the difference between two- and 10-year yields increased by only 12 basis points. |
| |
| Economic data continued to be mixed. Despite the downturn in the housing sector, strong employment data and robust corporate earnings raised the level of uncertainty in the bond market. Meanwhile, a growing number of delinquencies in the sub-prime sector of the mortgage market exacerbated concerns about the housing market and whether its weakness would spill over into the broader economy. A widespread sell-off in the global equity markets—sparked by a sharp decline in Chinese equities—contributed to a spike in volatility during late February. |
| |
| Through three consecutive meetings, the Federal Reserve (the “Fed”) held short-term interest rates steady at 5.25%. In their post-meeting statements, Fed governors stressed the upside risks to inflation, but acknowledged the downside risks to the U.S. economy, specifically the housing slowdown and decreased business spending. Given the benign inflation data during the period, the Fed appears to have successfully restrained inflation. Nonetheless, a tightening labor market and higher crude oil and gasoline prices suggest that inflation could remain a focus in the coming months. |
3
PORTFOLIO RESULTS
| |
| During the six-month reporting period, the 10-year Treasury yield rose two basis points, closing the period at 4.62%. In general, investment-grade sectors outperformed Treasuries. |
| |
| The Fund seeks a high level of current income, consistent with safety of principal. |
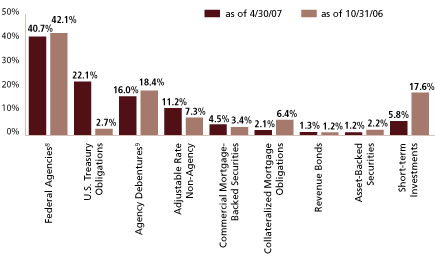
Portfolio Composition
| |
| Over the period, the Fund continued to focus on sectors and securities that we believed would generate a competitive total rate of return relative to the benchmark. We tactically adjusted the Fund’s exposures to take advantage of changing relative valuations within the market and to add value in security-specific trades. We continued to find value in AAA rated adjustable-rate mortgages ARMs and commercial mortgage-backed securities (“CMBS”). At the end of the reporting period, the Fund’s largest sector weight was in mortgage-backed securities. We maintained a defensive short-duration position relative to the benchmark for much of the period based on our belief that interest rates would move higher. |
| |
| We thank you for your investment and look forward to your continued confidence. |
| |
| |
| Goldman Sachs U.S. Fixed Income Investment Management Team |
| |
| May 18, 2007 |
4
FUND BASICS
Government Income Fund
as of April 30, 2007
| | | | | | | | | | | | | | | |
| November 1, 2006– | | Fund Total Return | | Lehman Govt./ | | 30-Day | | |
| April 30, 2007 | | (based on NAV)1 | | Mortgage Index2 | | Standardized Yield3 | | |
| |
| Class A | | | 2.29 | % | | | 2.61 | % | | | 4.04 | % | | |
| Class B | | | 1.98 | | | | 2.61 | | | | 3.48 | | | |
| Class C | | | 1.99 | | | | 2.61 | | | | 3.47 | | | |
| Institutional | | | 2.48 | | | | 2.61 | | | | 4.60 | | | |
| Service | | | 2.30 | | | | 2.61 | | | | 4.09 | | | |
| |
| |
| 1 | The net asset value (NAV) represents the net assets of the class of the Fund (ex-dividend) divided by the total number of shares of the class outstanding. The Fund’s performance assumes the reinvestment of dividends and other distributions. The Fund’s performance does not reflect the deduction of any applicable sales charges. |
| |
| 2 | The Lehman Brothers Government/ Mortgage Index, an unmanaged index, does not reflect any deduction for fees, expenses or taxes. It is not possible to invest directly in an unmanaged index. |
| |
| 3 | The 30-Day Standardized Yield of the Fund is calculated by dividing the net investment income per share (as defined by securities industry regulations) earned by the Fund over a 30-day period (ending on the stated month-end date) by the maximum public offering price per share of the Fund on the last day of the period. This number is then annualized. This yield does not necessarily reflect income actually earned and distributed by the Fund and, therefore, may not be correlated with the dividends or other distributions paid to shareholders. |
| STANDARDIZED AVERAGE ANNUAL TOTAL RETURNS 4 |
| | | | | | | | | | | | | | | | | | | | | |
| For the period ended 3/31/07 | | One Year | | Five Years | | Ten Years | | Since Inception | | Inception Date | | |
| |
| Class A | | | 0.94 | % | | | 3.62 | % | | | 5.30 | % | | | 5.59 | % | | 2/10/93 | | |
| |
| Class B | | | -0.26 | | | | 3.38 | | | | 5.06 | | | | 5.08 | | | 5/1/96 | | |
| |
| Class C | | | 3.80 | | | | 3.80 | | | | N/A | | | | 4.72 | | | 8/15/97 | | |
| |
| Institutional | | | 6.02 | | | | 4.98 | | | | N/A | | | | 5.91 | | | 8/15/97 | | |
| |
| Service | | | 5.49 | | | | 4.46 | | | | 5.725 | | | | 5.845 | | | 2/10/93 | | |
| |
| | |
| | 4 | The Standardized Total Returns are average annual total returns as of the most recent calendar quarter-end. They assume reinvestment of all distributions at NAV. These returns reflect a maximum initial sales charge of 4.5% for Class A Shares, the assumed contingent deferred sales charge for Class B Shares (5% maximum declining to 0% after six years), and the assumed contingent deferred sales charge for Class C Shares (1% if redeemed within 12 months of purchase). Because Institutional and Service Shares do not involve a sales charge, such a charge is not applied to their Standardized Total Returns. |
| |
| | 5 | Performance data for Service Shares prior to 8/15/97 (commencement of operations) is that of Class A Shares (excluding the impact of front-end sales charges applicable to Class A Shares since Service Shares are not subject to any sales charges). Performance of Class A Shares in the Fund reflects the expenses applicable to the Fund’s Class A Shares. The fees applicable to Service Shares are different from those applicable to Class A Shares which impact performance ratings and rankings for a class of shares. |
| |
| | | The returns represent past performance. Past performance does not guarantee future results. The Fund’s investment return and principal value will fluctuate so that an investor’s shares, when redeemed, may be worth more or less than their original cost. Current performance may be lower or higher than the performance quoted above. Please visit our Web site at: www.goldmansachsfunds.com to obtain the most recent month-end returns. Performance reflects expense limitations in effect. In their absence, performance would be reduced. Returns do not reflect the deduction of taxes that a shareholder would pay on Fund distributions or the redemption of Fund shares. |
5
FUND BASICS
| | | | | | | | | | | |
| | | Current Expense Ratio (Net) | | Expense Ratio Before Waivers (Gross) | | |
| |
| Class A | | | 0.95 | % | | | 1.04 | % | | |
| Class B | | | 1.70 | | | | 1.79 | | | |
| Class C | | | 1.70 | | | | 1.79 | | | |
| Institutional | | | 0.58 | | | | 0.67 | | | |
| Service | | | 1.08 | | | | 1.17 | | | |
| |
| |
| 6 | The expense ratios of the Fund, both current (net of any fee waivers or expense limitations) and before waivers (gross of any fee waivers or expense limitations), are as set forth above according to the most recent publicly available Prospectus for the Fund and may differ from the expense ratios disclosed in the Financial Highlights in this report. The waivers and expense limitations are voluntary and may be modified or terminated at any time at the option of the Investment Adviser. If this occurs, the expense ratios may change without shareholder approval. |
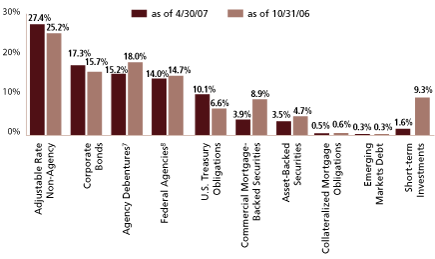
Percentage of Net Assets
| |
| 7 | The percentage shown for each investment category reflects the value of investments in that category as a percentage of net assets. Short-term investments represent repurchase agreements. Figures in the above graph may not sum to 100% due to the exclusion of other assets and liabilities. |
| 8 | Federal Agencies are mortgage backed securities guaranteed by the Government National Mortgage Association (“GNMA”), Federal National Mortgage Association (“FNMA”) and Federal Home Loan Mortgage Corp. (“FHLMC”). GNMA instruments are backed by the full faith and credit of the U.S. Government. 2.1% of the Federal Agencies are guaranteed by GNMA. |
| 9 | “Agency Debentures” include agency securities offered by companies such as FNMA and FHLMC, which operate under a government charter. While they are required to report to a government regulator, their assets are not explicitly guaranteed by the government and they otherwise operate similar to any other publicly traded company. |
6
PORTFOLIO RESULTS
U.S. Mortgages Fund
Dear Shareholder,
This report provides an overview on the performance of the Goldman Sachs U.S. Mortgages Fund during the six-month reporting period that ended April 30, 2007.
Performance Review
| |
| Over the six-month period that ended April 30, 2007, the Fund’s Class A, Institutional and Separate Account Institutional Shares generated cumulative total returns, without sales charges, of 2.49%, 2.77% and 2.69%, respectively. These returns compare to the 2.87% cumulative total return of the Fund’s benchmark, the Lehman Brothers Securitized Index, over the same time period. |
| |
| Throughout the reporting period, we continued to target an underweight position to mortgage pass-throughs. We held this view because mortgage-backed security fundamentals were unattractive and implied volatility remained near cyclical lows. However, mortgages outperformed the market during the reporting period and our underweight detracted from performance. Security selection helped offset this underperformance. In particular, our selection of collateralized mortgage obligations (“CMOs”) and adjustable rate mortgages (“ARMs”) added value. |
| |
| To the extent we find them effective instruments to manage the duration of the portfolio, the Fund may employ the use of derivatives, including futures, swaps and Eurodollar futures contracts. We believe that using derivatives, including both futures and swaps, in the portfolio has been an effective portfolio management tool. Futures have been efficiently employed to hedge duration (interest rate sensitivity) drift that may occur due to the passage of time, changing interest rates or changing mortgage durations. In addition, we believe that futures allowed us to optimize security selection by giving us the flexibility to select the most attractive securities for the portfolio, regardless of the securities’ maturity/duration. Finally, futures and swaps were important tools in implementing certain interest rate and spread views. |
Market Review
| |
| Over the six-month reporting period, the yield curve steepened as short- to intermediate-term yields fell and longer yields rose modestly. Although the difference between two- and 10-year yields increased by only 12 basis points, the yield curve remained flat. |
| |
| The housing sector experienced a downturn, but strong employment data and robust corporate earnings raised the level of uncertainty in the bond market. Meanwhile, a growing number of delinquencies in the sub-prime sector of the mortgage market exacerbated concerns about the housing sector and whether its weakness would spill over into the broader economy. |
| |
| Through three consecutive meetings, the Federal Reserve (the “Fed”) held short-term interest rates steady at 5.25%. In their post-meeting statements, Fed governors stressed the upside risks to inflation, but acknowledged the downside risks to the U.S. economy, specifically the housing slowdown and decreased business spending. |
7
PORTFOLIO RESULTS
| |
| During the six-month reporting period, the 10-year Treasury yield rose two basis points, closing the period at 4.62%. Mortgages outperformed Treasuries. Although spreads widened on fixed-rate mortgages, a decline in implied volatility contributed to the outperformance of mortgage pass-throughs. As the period ended, mortgage spreads remained tight relative to long-term averages and implied volatility remained below historical levels. |
INVESTMENT OBJECTIVE
The Fund seeks a high level of total return consisting of income and capital appreciation.
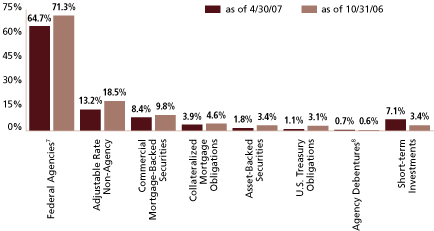
Portfolio Composition
| |
| The Fund maintained a short duration position relative to its benchmark over most of the reporting period. Given its underweight position in mortgage pass-throughs, the Fund invested in other collateralized sectors. We took advantage of opportunities to add value in security-specific trades; we favor bonds with less exposure to implied volatility and housing turnover such as seasoned 15-year mortgage-backed securities, super-senior AAA adjustable-rate mortgage floaters, and super-senior AAA commercial mortgage-backed securities. We continue to believe that fundamentals remain unattractive and that implied volatility continues to remain near cyclical lows. |
| |
| We thank you for your investment and look forward to your continued confidence. |
| |
| |
| Goldman Sachs Fixed Income Investment Management Team |
| |
| May 21, 2007 |
8
FUND BASICS
U.S. Mortgages Fund
as of April 30, 2007
| | | | | | | | | | | | | | | |
| November 1, 2006– | | Fund Total Return | | Lehman Brothers | | 30-Day | | |
| April 30, 2007 | | (based on NAV)1 | | Securitized Index2 | | Standardized Yield3 | | |
| |
| Class A | | | 2.49 | % | | | 2.87 | % | | | 4.29 | % | | |
| |
| Institutional | | | 2.77 | | | | 2.87 | | | | 4.89 | | | |
| |
| Separate Account Institutional | | | 2.69 | | | | 2.87 | | | | 4.94 | | | |
| |
| |
| |
| 1 | The net asset value (NAV) represents the net assets of the class of the Fund (ex-dividend) divided by the total number of shares of the class outstanding. The Fund’s performance assumes the reinvestment of dividends and other distributions. The Fund’s performance does not reflect the deduction of any applicable sales charges. |
| |
| 2 | The Lehman Brothers Securitized Index is an unmanaged composite of asset-backed securities, collateralized mortgage-backed securities (ERISA-eligible) and fixed rate mortgage-backed securities. The Index figures do not reflect any deduction for fees, expenses or taxes. It is not possible to invest directly in an unmanaged index. |
| |
| 3 | The 30-Day Standardized Yield of the Fund is calculated by dividing the net investment income per share (as defined by securities industry regulations) earned by the Fund over a 30-day period (ending on the stated month-end date) by the maximum public offering price per share of the Fund on the last day of the period. This number is then annualized. This yield does not necessarily reflect income actually earned and distributed by the Fund and, therefore, may not be correlated with the dividends or other distributions paid to shareholders. |
| STANDARDIZED AVERAGE ANNUAL TOTAL RETURNS 4 |
| | | | | | | | | | | | | |
| For the period ended 3/31/07 | | One Year | | Since Inception | | Inception Date | | |
| |
| Class A | | | 1.39 | % | | | 2.67 | % | | 11/3/03 | | |
| |
| Institutional | | | 6.51 | | | | 4.50 | | | 11/3/03 | | |
| |
| Separate Account Institutional | | | 6.57 | | | | 4.52 | | | 11/3/03 | | |
| |
| |
| |
| 4 | The Standardized Total Returns are average annual total returns as of the most recent calendar quarter-end. They assume reinvestment of all distributions at NAV. These returns reflect a maximum initial sales charge of 4.5% for Class A Shares. Because Institutional and Separate Account Institutional Shares do not involve a sales charge, such a charge is not applied to their Standardized Total Returns. |
| |
| | The returns represent past performance. Past performance does not guarantee future results. The Fund’s investment return and principal value will fluctuate so that an investor’s shares, when redeemed, may be worth more or less than their original cost. Current performance may be lower or higher than the performance quoted above. Please visit our Web site at: www.goldmansachsfunds.com to obtain the most recent month-end returns. Performance reflects expense limitations in effect. In their absence, performance would be reduced. Returns do not reflect the deduction of taxes that a shareholder would pay on Fund distributions or the redemption of Fund shares. |
| | | | | | | | | | | |
| | | Current Expense Ratio (Net) | | Expense Ratio Before Waivers (Gross) | | |
| |
| Class A | | | 0.79 | % | | | 0.98 | % | | |
| |
| Institutional | | | 0.40 | | | | 0.61 | | | |
| |
| Separate Account Institutional | | | 0.35 | | | | 0.56 | | | |
| |
| |
| |
| 5 | The expense ratios of the Fund, both current (net of any fee waivers or expense limitations) and before waivers (gross of any fee waivers or expense limitations), are as set forth above according to the most recent publicly available Prospectus for the Fund and may differ from the expense ratios disclosed in the Financial Highlights in this report. The waivers and expense limitations are voluntary and may be modified or terminated at any time at the option of the Investment Adviser. If this occurs, the expense ratios may change without shareholder approval. |
9
FUND BASICS
Percentage of Net Assets
| |
| 6 | The percentage shown for each investment category reflects the value of investments in that category as a percentage of net assets. Short-term investments represent repurchase agreements. Figures in the above graph may not sum to 100% due to the exclusion of other assets and liabilities. |
| 7 | Federal Agencies are mortgage backed securities guaranteed by the Government National Mortgage Association (“GNMA”), Federal National Mortgage Association (“FNMA”) and Federal Home Loan Mortgage Corp. (“FHLMC”). GNMA instruments are backed by the full faith and credit of the U.S. Government. 1.6% of the Federal Agencies are guaranteed by GNMA. |
| 8 | “Agency Debentures” include agency securities offered by companies such as FNMA and FHLMC, which operate under a government charter. While they are required to report to a government regulator, their assets are not explicitly guaranteed by the government and they otherwise operate similar to any other publicly traded company. |
10
PORTFOLIO RESULTS
Core Fixed Income Fund
Dear Shareholder,
This report provides an overview on the performance of the Goldman Sachs Core Fixed Income Fund during the six-month reporting period that ended April 30, 2007.
Performance Review
| |
| Over the six-month period that ended April 30, 2007, the Fund’s Class A, B, C, Institutional and Service Shares generated cumulative total returns, without sales charges, of 2.34%, 1.95%, 1.95%, 2.51% and 2.26%, respectively. These returns compare to the 2.64% cumulative total return of the Fund’s benchmark, the Lehman Brothers Aggregate Bond Index, over the same time period. |
| |
| The most meaningful detractor to the Fund’s performance was our long Australian dollar/short U.S. dollar trade, as market expectations of additional interest-rate increases in Australia caused its bonds—and our position—to underperform. Within the currency strategy, our long Japanese yen (“JPY”) and short New Zealand dollar (“NZD”) trades detracted from performance as the JPY depreciated and the NZD appreciated over the reporting period. |
| |
| Our duration position contributed positively to performance. The Fund benefited from our yield-curve steepening position at the five- and 15-year parts of the curve. Results were also enhanced by our fundamental term structure positioning. |
| |
| At the security level, our underweight to mortgage-backed securities detracted as the mortgage sector outperformed Treasuries. Within investment-grade corporate bonds, our selection of industrial- and financial-sector credits contributed positively to performance. Our Treasury Inflation Protection Securities position benefited returns as higher-than-expected inflation data was reported early in the period. However, our selection of Treasuries detracted from performance. |
| |
| In addition, to the extent we find them effective instruments to manage the overall duration of the portfolio, the Fund may employ the use of derivatives, including futures, swaps and Eurodollar futures contracts. We believe that using derivatives, including both futures and swaps, in the portfolio has been an effective portfolio management tool. Futures have been efficiently employed to hedge duration (interest rate sensitivity) drift that may occur due to the passage of time, changing interest rates or changing mortgage durations. In addition, we believe that futures allowed us to optimize security selection by giving us the flexibility to select the most attractive securities for the portfolio, regardless of the securities’ maturity/duration. Finally, futures and swaps were important tools in implementing certain interest rate and spread views. |
Market Review
| |
| The six-month reporting period was characterized by a number of ongoing themes. The yield curve, for example, remained flat. Although short- to intermediate-term yields fell and longer yields rose modestly, the difference between two- and 10-year yields increased by only 12 basis points. |
| |
| Economic data continued to be mixed. Despite the downturn in the housing sector, strong employment data and robust corporate earnings raised the level of uncertainty in the bond market. Meanwhile, a growing number of delinquencies in the sub-prime sector of the |
11
PORTFOLIO RESULTS
| |
| mortgage market exacerbated concerns about the housing market and whether its weakness would spill over into the broader economy. A widespread sell-off in the global equity markets—sparked by a sharp decline in Chinese equities—contributed to a spike in volatility during late February. |
| |
| Through three consecutive meetings, the Federal Reserve Board (the “Fed”) held short-term interest rates steady at 5.25%. In their post-meeting statements, Fed governors stressed the upside risks to inflation, but acknowledged the downside risks to the U.S. economy, specifically the housing slowdown and decreased business spending. Given the benign inflation data during the period, the Fed appears to have successfully restrained inflation. |
| |
| Nonetheless, a tightening labor market and higher crude oil and gasoline prices suggest that inflation could remain a focus in the coming months. |
| |
| During the six-month reporting period, the 10-year Treasury yield rose two basis points, closing the period at 4.62%. In general, investment-grade sectors outperformed Treasuries. |
INVESTMENT OBJECTIVE
The Goldman Sachs Core Fixed Income Fund seeks a total return consisting of capital appreciation and income that exceeds the total return of the Lehman Brothers Aggregate Bond Index.
Portfolio Composition
| |
| During the period, the Fund continued to hold a short-duration position relative to the benchmark, driven primarily by our quantitative model. We maintained an underweight exposure in the mortgage sector because of historically tight spreads and low implied volatility. However, we continued to find value in bonds with less exposure to implied volatility and to turnover in the housing sector. These bonds included 15-year mortgage-backed securities from established lenders with good reputations, super-senior AAA adjustable-rate mortgage floaters, and super-senior AAA collateralized mortgage-backed securities. We slightly reduced the Fund’s underweight to the corporate sector because we believe spreads are tighter than warranted for the overall level of credit quality. Our exposure to government securities increased modestly, but we maintained our underweight in favor of other high quality spread sectors at the shorter end of the yield curve, such as agencies. |
| |
| We thank you for your investment and look forward to your continued confidence. |
| |
| |
| Goldman Sachs U.S. Fixed Income Investment Management Team |
| |
| May 17, 2007 |
12
FUND BASICS
Core Fixed Income Fund
as of April 30, 2007
| | | | | | | | | | | | | | | |
| November 1, 2006– | | Fund Total Return | | Lehman Aggregate | | 30-Day | | |
| April 30, 2007 | | (based on NAV)1 | | Bond Index2 | | Standardized Yield3 | | |
| |
| Class A | | | 2.34 | % | | | 2.64 | % | | | 4.57 | % | | |
| Class B | | | 1.95 | | | | 2.64 | | | | 4.03 | | | |
| Class C | | | 1.95 | | | | 2.64 | | | | 4.04 | | | |
| Institutional | | | 2.51 | | | | 2.64 | | | | 5.15 | | | |
| Service | | | 2.26 | | | | 2.64 | | | | 4.65 | | | |
| |
| |
| 1 | The net asset value (NAV) represents the net assets of the class of the Fund (ex-dividend) divided by the total number of shares of the class outstanding. The Fund’s performance assumes the reinvestment of dividends and other distributions. The Fund’s performance does not reflect the deduction of any applicable sales charges. |
| |
| 2 | The Lehman Brothers Aggregate Bond Index represents an unmanaged diversified portfolio of fixed income securities, including U.S. Treasuries, investment-grade corporate bonds, and mortgage-backed and asset-backed securities. The Index figures do not reflect any deduction for fees, expenses or taxes. It is not possible to invest directly in an unmanaged index. |
| |
| 3 | The 30-Day Standardized Yield of the Fund is calculated by dividing the net investment income per share (as defined by securities industry regulations) earned by the Fund over a 30-day period (ending on the stated month-end date) by the maximum public offering price per share of the Fund on the last day of the period. This number is then annualized. This yield does not necessarily reflect income actually earned and distributed by the Fund and, therefore, may not be correlated with the dividends or other distributions paid to shareholders. |
| STANDARDIZED AVERAGE ANNUAL TOTAL RETURNS 4 |
| | | | | | | | | | | | | | | | | | | | | |
| For the period ended 3/31/07 | | One Year | | Five Years | | Ten Years | | Since Inception | | Inception Date | | |
| |
| Class A | | | 0.61 | % | | | 4.16 | % | | | N/A | | | | 5.46 | % | | 5/1/97 | | |
| Class B | | | -0.49 | | | | 3.91 | | | | N/A | | | | 5.18 | | | 5/1/97 | | |
| Class C | | | 3.64 | | | | 4.33 | | | | N/A | | | | 4.93 | | | 8/15/97 | | |
| Institutional | | | 5.74 | | | | 5.52 | | | | 6.46 | % | | | 6.26 | | | 1/5/94 | | |
| Service | | | 5.32 | | | | 5.02 | | | | 5.94 | | | | 5.83 | | | 3/13/96 | | |
| |
| |
| 4 | The Standardized Total Returns are average annual total returns as of the most recent calendar quarter-end. They assume reinvestment of all distributions at NAV. These returns reflect a maximum initial sales charge of 4.5% for Class A Shares, the assumed contingent deferred sales charge for Class B Shares (5% maximum declining to 0% after six years) and the assumed contingent deferred sales charge for Class C Shares (1% if redeemed within 12 months of purchase). Because Institutional and Service Shares do not involve a sales charge, such a charge is not applied to their Standardized Total Returns. |
| |
| | The returns represent past performance. Past performance does not guarantee future results. The Fund’s investment return and principal value will fluctuate so that an investor’s shares, when redeemed, may be worth more or less than their original cost. Current performance may be lower or higher than the performance quoted above. Please visit our Web site at: www.goldmansachsfunds.com to obtain the most recent month-end returns. Performance reflects expense limitations in effect. In their absence, performance would be reduced. Returns do not reflect the deduction of taxes that a shareholder would pay on Fund distributions or the redemption of Fund shares. |
| | | | | | | | | | | |
| | | Current Expense Ratio (Net) | | Expense Ratio Before Waivers (Gross) | | |
| |
| Class A | | | 0.83 | % | | | 0.84 | % | | |
| Class B | | | 1.58 | | | | 1.59 | | | |
| Class C | | | 1.58 | | | | 1.59 | | | |
| Institutional | | | 0.46 | | | | 0.47 | | | |
| Service | | | 0.96 | | | | 0.97 | | | |
| |
| |
| 5 | The expense ratios of the Fund, both current (net of any fee waivers or expense limitations) and before waivers (gross of any fee waivers or expense limitations), are as set forth above according to the most recent publicly available Prospectus for the Fund and may differ from the expense ratios disclosed in the Financial Highlights in this report. The waivers and expense limitations are voluntary and may be modified or terminated at any time at the option of the Investment Adviser. If this occurs, the expense ratios may change without shareholder approval. |
13
FUND BASICS
Percentage of Net Assets
| |
| 6 | The percentage shown for each investment category reflects the value of investments in that category as a percentage of net assets. Short-term investments represent repurchase agreements. Figures in the above graph may not sum to 100% due to the exclusion of other assets and liabilities. |
| 7 | “Agency Debentures” include agency securities offered by companies such as Federal National Mortgage Association (“FNMA”) and Federal Home Loan Mortgage Corp. (“FHLMC”), which operate under a government charter. While they are required to report to a government regulator, their assets are not explicitly guaranteed by the government and they otherwise operate similar to any other publicly traded company. |
| 8 | Federal Agencies are mortgage backed securities guaranteed by the Government National Mortgage Association (“GNMA”), FNMA and FHLMC. GNMA instruments are backed by the full faith and credit of the U.S. Government. |
14
PORTFOLIO RESULTS
Investment Grade Credit Fund
Dear Shareholder:
This report provides an overview on the performance of the Goldman Sachs Investment Grade Credit Fund during the six-month reporting period that ended April 30, 2007.
Performance Review
| |
| Over the six-month period that ended April 30, 2007, the Fund’s Class A, Institutional and Separate Account Institutional Shares generated cumulative total returns, without sales charges, of 3.14%, 3.34% and 3.36%, respectively. These returns compare to the 2.79% cumulative total return of the Fund’s benchmark, the Lehman Brothers U.S. Credit Index, over the same time period. |
| |
| The largest contributor to the Fund’s performance was within our allocation to corporate securities. We overweighted the life insurance, property and casualty, and auto sectors, which added positively to results. Our overweight to high quality financial issues boosted performance in March, when many financial names, primarily those of lower quality, suffered in response to investor fears about sub-prime lending practices. |
| |
| Also adding to returns was our underweight to higher quality corporates and our overweight to lower quality corporates. We continue to overweight lower quality issues because we believe they are less susceptible to shareholder-friendly actions such as stock repurchases and onetime dividend payouts, which adversely impact bond prices. Our strategy was rewarded when lower quality issues outperformed higher quality issues during the period. |
| |
| Detracting slightly from performance was our underweight to emerging market debt. Spreads tightened over the period in response to sovereign macroeconomic stabilization programs, improved debt management efforts, and strong investor demand. The Fund’s short duration bias positively impacted performance, mostly due to rising yields in December. (Yields move inversely to bond prices.) However, as yields fell during the first four months of 2007, our position detracted from performance. Nonetheless, for the reporting period, our strategy was modestly positive. |
| |
| To the extent we find them effective instruments to manage the overall duration of the portfolio, the Fund may employ the use of derivatives, including futures, swaps and Eurodollar futures contracts. The Fund also makes use of currency forwards for the purpose of hedging all non-U.S. dollar exposure back to the base U.S. dollar currency. We believe that using derivatives, including both futures and swaps, in the portfolio has been an effective portfolio management tool. Futures have been efficiently employed to hedge duration (interest rate sensitivity) drift that may occur due to the passage of time, or changing interest rates. In addition, we believe that futures allowed us to optimize security selection by giving us the flexibility to select the most attractive securities for the portfolio, regardless of the securities’ maturity/duration. Finally, futures and swaps were important tools in implementing certain interest rate and spread views. |
Market Review
| |
| The six-month reporting period was characterized by a number of ongoing themes. The yield curve, for example, remained flat. Although short- to intermediate-term yields fell |
15
| |
| and longer yields rose modestly, the difference between two- and 10-year yields increased by only 12 basis points. |
| |
| Economic data continued to be mixed. Despite the downturn in the housing sector, strong employment data and robust corporate earnings raised the level of uncertainty in the bond market. Meanwhile, a growing number of delinquencies in the sub-prime sector of the mortgage market exacerbated concerns about the housing market and whether its weakness would spill over into the broader economy. A widespread sell-off in the global equity markets—sparked by a sharp decline in Chinese equities—contributed to a spike in volatility during late February. |
| |
| Through three consecutive meetings, the Federal Reserve Board (the “Fed”) held short-term interest rates steady at 5.25%. In their post-meeting statements, Fed governors stressed the upside risks to inflation, but acknowledged the downside risks to the U.S. economy, specifically the housing slowdown and decreased business spending. Given the benign inflation data during the period, the Fed appears to have successfully restrained inflation. Nonetheless, a tightening labor market and higher crude oil and gasoline prices suggest that inflation could remain a focus in the coming months. |
INVESTMENT OBJECTIVE
The Fund seeks a high level total return consisting of capital appreciation and income that exceeds the total return of the Lehman Brothers U.S. Credit Index
Portfolio Composition
| |
| From a credit quality perspective, the Fund held a down-in-quality bias, reflected through its overweight to BBB rated bonds versus the benchmark. The Fund continued to hold this position on the belief that lower quality credits still have the potential to benefit from balance sheet deleveraging and, in turn, remain less susceptible to equity shareholder-friendly activities. However, we have recently trimmed this position, as valuations are beginning to appear rich. In terms of sector positioning, the Fund had overweights in the insurance and media-cable securities, while holding underweights in consumer products, brokerage, banks, retail, and technology. |
| |
| We thank you for your investment and look forward to your continued confidence. |
| |
| Goldman Sachs Fixed Income Investment Management Team |
| |
| May 17, 2007 |
16
FUND BASICS
Investment Grade Credit Fund
as of April 30, 2007
| | | | | | | | | | | | | | | |
| November 1, 2006– | | Fund Total Return | | Lehman Brothers | | 30-Day | | |
| April 30, 2007 | | (based on NAV)1 | | U.S. Credit Index2 | | Standardized Yield3 | | |
| |
| Class A | | | 3.14 | % | | | 2.79 | % | | | 5.02 | % | | |
| |
| Institutional | | | 3.34 | | | | 2.79 | | | | 5.65 | | | |
| |
| Separate Account Institutional | | | 3.36 | | | | 2.79 | | | | 5.70 | | | |
| |
| |
| |
| 1 | The net asset value (NAV) represents the net assets of the class of the Fund (ex-dividend) divided by the total number of shares of the class outstanding. The Fund’s performance assumes the reinvestment of dividends and other distributions. The Fund’s performance does not reflect the deduction of any applicable sales charges. |
| |
| 2 | The Lehman Brothers U.S. Credit Index is an unmanaged index which is unbundled into pure corporates (industrial, utility, and finance, including both U.S. and Non-U.S. corporations) and non-corporates (sovereign, supranational, foreign agencies, and foreign local governments). The Index figures do not reflect any deduction for fees, expenses or taxes. It is not possible to invest directly in an unmanaged index. |
| |
| 3 | The 30-Day Standardized Yield of the Fund is calculated by dividing the net investment income per share (as defined by securities industry regulations) earned by the Fund over a 30-day period (ending on the stated month-end date) by the maximum public offering price per share of the Fund on the last day of the period. This number is then annualized. This yield does not necessarily reflect income actually earned and distributed by the Fund and, therefore, may not be correlated with the dividends or other distributions paid to shareholders. |
| STANDARDIZED AVERAGE ANNUAL TOTAL RETURNS 4 |
| | | | | | | | | | | | | |
| For the period ended 3/31/07 | | One Year | | Since Inception | | Inception Date | | |
| |
| Class A | | | 1.97 | % | | | 2.88 | % | | 11/3/03 | | |
| |
| Institutional | | | 7.17 | | | | 4.76 | | | 11/3/03 | | |
| |
| Separate Account Institutional | | | 7.23 | | | | 4.79 | | | 11/3/03 | | |
| |
| |
| |
| 4 | The Standardized Total Returns are average annual total returns as of the most recent calendar quarter-end. They assume reinvestment of all distributions at NAV. These returns reflect a maximum initial sales charge of 4.5% for Class A Shares. Because Institutional and Separate Account Institutional Shares do not involve a sales charge, such a charge is not applied to their Standardized Total Returns. |
| |
| | The returns represent past performance. Past performance does not guarantee future results. The Fund’s investment return and principal value will fluctuate so that an investor’s shares, when redeemed, may be worth more or less than their original cost. Current performance may be lower or higher than the performance quoted above. Please visit our Web site at: www.goldmansachsfunds.com to obtain the most recent month-end returns. Performance reflects expense limitations in effect. In their absence, performance would be reduced. Returns do not reflect the deduction of taxes that a shareholder would pay on Fund distributions or the redemption of Fund shares. |
| | | | | | | | | | | |
| | | Current Expense Ratio (Net) | | Expense Ratio Before Waivers (Gross) | | |
| |
| Class A | | | 0.79 | % | | | 1.02 | % | | |
| |
| Institutional | | | 0.40 | | | | 0.65 | | | |
| |
| Separate Account Institutional | | | 0.35 | | | | 0.60 | | | |
| |
| |
| |
| 5 | The expense ratios of the Fund, both current (net of any fee waivers or expense limitations) and before waivers (gross of any fee waivers or expense limitations), are as set forth above according to the most recent publicly available Prospectus for the Fund and may differ from the expense ratios disclosed in the Financial Highlights in this report. The waivers and expense limitations are voluntary and may be modified or terminated at any time at the option of the Investment Adviser. If this occurs, the expense ratios may change without shareholder approval. |
17
FUND BASICS
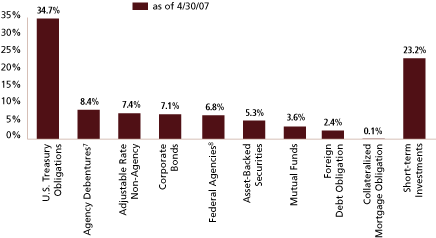
Percentage of Net Assets
| |
| 6 | The percentage shown for each investment category reflects the value of investments in that category as a percentage of net assets. Short-term investments represent repurchase agreements. Figures in the above graph may not sum to 100% due to the exclusion of other assets and liabilities. |
| 7 | Please refer to the table below for Top Ten Industry Allocations in the Corporate Bond Sector. |
| TOP TEN INDUSTRY ALLOCATIONS |
| | | | | | | | | | | |
| Percentage of Net Assets | | as of 4/30/07 | | as of 10/31/06 | | |
| |
| Banks | | | 17.7 | % | | | 21.0 | % | | |
| Insurance | | | 17.5 | | | | 14.0 | | | |
| Financial | | | 10.4 | | | | 8.6 | | | |
| REIT | | | 13.0 | | | | 13.1 | | | |
| Electric | | | 6.8 | | | | 8.5 | | | |
| Natural Gas | | | 6.7 | | | | 3.3 | | | |
| Energy | | | 6.1 | | | | 2.5 | | | |
| Communications | | | 5.8 | | | | 6.7 | | | |
| Media | | | 4.9 | | | | 4.2 | | | |
| Transportation | | | 3.2 | | | | 0.0 | | | |
| |
18
PORTFOLIO RESULTS
Core Plus Fixed Income Fund
Dear Shareholder:
This report provides an overview on the performance of the Goldman Sachs Core Plus Fixed Income Fund for the period from its inception on November 30, 2006 to April 30, 2007.
Performance Review
| |
| Over the period from the Fund’s inception on November 30, 2006 to April 30, 2007, the Fund’s Class A, C, and Institutional Shares generated cumulative total returns, without sales charges, of 1.31%, 1.01% and 1.47%, respectively. These returns compare to the 1.46% cumulative total return of the Fund’s benchmark, the Lehman Brothers Aggregate Bond Index, over the same time period. |
| |
| The most meaningful detractor to the Fund’s performance was our long Australian dollar/short U.S. dollar trade, as market expectations of additional interest-rate increases caused Australian bonds to underperform. Our overall currency trades in Japanese yen, Swedish kroner and Canadian dollars had an adverse impact on returns. However, these trades were partly offset by our long exposure to Norwegian kroner, which appreciated on supportive economic data. |
| |
| Our fundamental duration strategy contributed positively to performance. The Fund was well-positioned for the modest steepening of the yield curve during the period. At the sector level, our underweight to mortgage-backed securities detracted as the mortgage sector outperformed Treasuries. Within investment-grade corporates, our selection of industrial- and financial-sector credits added positively to performance. Our preference for lower quality credits also contributed positively as these securities outperformed higher quality credits. |
| |
| In addition, to the extent we find them effective instruments to manage the overall duration of the portfolio, the Fund may employ the use of derivatives, including futures, swaps and Eurodollar futures contract. We believe that using derivatives, including both futures and swaps, in the portfolio has been an effective portfolio management tool. Futures have been efficiently employed to hedge duration (interest rate sensitivity) drift that may occur due to the passage of time, changing interest rates or changing mortgage durations. In addition, we believe that futures allowed us to optimize security selection by giving us the flexibility to select the most attractive securities for the portfolio, regardless of the securities’ maturity/duration. Finally, futures, forwards and swaps are important tools in implementing certain interest rate, spread, and currency views. |
Market Review
| |
| The six-month reporting period was characterized by a number of ongoing themes. The yield curve, for example, remained flat. Although short- to intermediate-term yields fell and longer yields rose modestly, the difference between two- and 10-year yields increased by only 12 basis points. |
| |
| Economic data continued to be mixed. Despite the downturn in the housing sector, strong employment data and robust corporate earnings raised the level of uncertainty in the bond market. Meanwhile, a growing number of delinquencies in the sub-prime sector of the mortgage market exacerbated concerns about the housing market and whether its weakness |
19
PORTFOLIO RESULTS
| |
| would spill over into the broader economy. A widespread sell-off in the global equity markets—sparked by a sharp decline in Chinese equities—contributed to a spike in volatility during late February. |
| |
| Through three consecutive meetings, the Federal Reserve Board (the “Fed”) held short-term interest rates steady at 5.25%. In their post-meeting statements, Fed governors stressed the upside risks to inflation, but acknowledged the downside risks to the U.S. economy, specifically the housing slowdown and decreased business spending. Given the benign inflation data during the period, the Fed appears to have successfully restrained inflation. Nonetheless, a tightening labor market and higher crude oil and gasoline prices suggest that inflation could remain a focus in the coming months. |
| |
| During the six-month reporting period, the 10-year Treasury yield rose two basis points, closing the period at 4.62%. In general, investment-grade sectors outperformed Treasuries. Emerging market debt also outperformed Treasuries. |
INVESTMENT OBJECTIVE
The Goldman Sachs Core Plus Fixed Income Fund seeks a total return consisting of capital appreciation and income that exceeds the total return of the Lehman Brothers Aggregate Bond Index.
Portfolio Composition
| |
| During the period, the Fund continued to hold a short-duration position relative to the benchmark. We initiated an underweight exposure in the mortgage sector because of historically tight spreads and low implied volatility. However, we continued to find value in bonds with less exposure to implied volatility and to turnover in the housing sector. These bonds included 15-year mortgage-backed securities from established lenders, super-senior AAA adjustable-rate mortgage floaters, and super-senior AAA collateralized mortgage-backed securities. We also increased the Fund’s underweight to the corporate sector because we believe credit quality in the sector will be pressured by robust capital expenditures, dividend increases, leveraged buy-outs, and other shareholder-friendly activity. Our exposure to emerging market debt remained unchanged over the period. We continue to see a favorable external environment for the asset class due to supportive cyclical factors, sovereign macroeconomic stabilization programs, and improved debt management efforts. |
| |
| We thank you for your investment and look forward to your continued confidence. |
| |
| |
| Goldman Sachs U.S. Fixed Income Investment Management Team |
| |
| May 17, 2007 |
20
FUND BASICS
Core Plus Fixed Income Fund
as of April 30, 2007
| | | | | | | | | | | | | | | |
| November 30, 2006– | | Fund Total Return | | Lehman Aggregate | | 30-Day | | |
| April 30, 2007 | | (based on NAV)1 | | Bond Index2 | | Standardized Yield3 | | |
| |
| Class A | | | 1.31 | % | | | 1.46 | % | | | 3.58 | % | | |
| Class C | | | 1.01 | | | | 1.46 | | | | 3.00 | | | |
| Institutional | | | 1.47 | | | | 1.46 | | | | 4.12 | | | |
| |
| |
| 1 | The net asset value (NAV) represents the net assets of the class of the Fund (ex-dividend) divided by the total number of shares of the class outstanding. The Fund’s performance assumes the reinvestment of dividends and other distributions. The Fund’s performance does not reflect the deduction of any applicable sales charges. |
| |
| 2 | The Lehman Brothers Aggregate Bond Index represents an unmanaged diversified portfolio of fixed income securities, including U.S. Treasuries, investment-grade corporate bonds, and mortgage-backed and asset-backed securities. The Index figures do not reflect any deduction for fees, expenses or taxes. It is not possible to invest directly in an unmanaged index. |
| |
| 3 | The 30-Day Standardized Yield of the Fund is calculated by dividing the net investment income per share (as defined by securities industry regulations) earned by the Fund over a 30-day period (ending on the stated month-end date) by the maximum public offering price per share of the Fund on the last day of the period. This number is then annualized. This yield does not necessarily reflect income actually earned and distributed by the Fund and, therefore, may not be correlated with the dividends or other distributions paid to shareholders. |
| STANDARDIZED AVERAGE ANNUAL TOTAL RETURNS 4 |
| | | | | | | | | |
| For the period ended 3/31/07 | | Since Inception | | Inception Date | | |
| |
| Class A | | | -3.84 | % | | 11/30/06 | | |
| Class C | | | -0.56 | | | 11/30/06 | | |
| Institutional | | | 0.81 | | | 11/30/06 | | |
| |
| |
| 4 | The Standardized Total Returns are average annual total returns or cumulative total returns (only if the performance period is one year or less) as of the most recent calendar quarter-end. They assume reinvestment of all distributions at NAV. These returns reflect a maximum initial sales charge of 4.5% for Class A Shares and the assumed contingent deferred sales charge for Class C Shares (1% if redeemed within 12 months of purchase). Because Institutional Shares do not involve a sales charge, such a charge is not applied to their Standardized Total Returns. The Fund will charge a 2% redemption fee on the redemption of shares (including by exchange) held for 30 calendar days or less. The performance figures do not reflect the deduction of the redemption fee. If reflected, the redemption fee would reduce the performance quoted. |
| |
| | The returns represent past performance. Past performance does not guarantee future results. The Fund’s investment return and principal value will fluctuate so that an investor’s shares, when redeemed, may be worth more or less than their original cost. Current performance may be lower or higher than the performance quoted above. Please visit our Web site at: www.goldmansachsfunds.com to obtain the most recent month-end returns. Performance reflects expense limitations in effect. In their absence, performance would be reduced. Returns do not reflect the deduction of taxes that a shareholder would pay on Fund distributions or the redemption of Fund shares. |
| | | | | | | | | | | |
| | | Current Expense Ratio (Net) | | Expense Ratio Before Waivers (Gross) | | |
| |
| Class A | | | 0.86 | % | | | 2.15 | % | | |
| Class C | | | 1.61 | | | | 2.90 | | | |
| Institutional | | | 0.49 | | | | 1.78 | | | |
| |
| |
| 5 | The expense ratios of the Fund, both current (net of any fee waivers or expense limitations) and before waivers (gross of any fee waivers or expense limitations), are set forth above according to the most recent publicly available Prospectus for the Fund and may differ from the expense ratios disclosed in the Financial Highlights in this report. The waivers and expense limitations are voluntary and may be modified or terminated at any time at the option of the Investment Adviser. If this occurs, the expense ratios may change without shareholder approval. |
21
FUND BASICS
Percentage of Net Assets
| |
| 6 | The percentage shown for each investment category reflects the value of investments in that category as a percentage of net assets. Short-term investments represent repurchase agreements. Figures in the above graph may not sum to 100% due to the exclusion of other assets and liabilities. |
| 7 | “Agency Debentures” include agency securities offered by companies such as Federal National Mortgage Association (“FNMA”) and Federal Home Loan Mortgage Corp. (“FHLMC”), which operate under a government charter. While they are required to report to a government regulator, their assets are not explicitly guaranteed by the government and they otherwise operate similar to any other publicly traded company. |
| 8 | Federal Agencies are mortgage backed securities guaranteed by the Government National Mortgage Association (“GNMA”), FNMA and FHLMC. GNMA instruments are backed by the full faith and credit of the U.S. Government. |
22
GOLDMAN SACHS GOVERNMENT INCOME FUND
Schedule of Investments
April 30, 2007 (Unaudited)
| | | | | | | | | | | | | | | | | |
| | | Principal | | Interest | | Maturity | | |
| | | Amount | | Rate | | Date | | Value |
| | |
Mortgage-Backed Obligations – 58.5% |
| |
| | | Adjustable Rate FHLMC(a) – 2.2% |
| | | $ | 7,472,421 | | | | 3.489 | % | | | 09/01/33 | | | $ | 7,404,278 | |
| | | | 5,280,647 | | | | 4.582 | | | | 08/01/35 | | | | 5,245,692 | |
| | | | | | | | | | | | | | | | | |
| | | | | | | | | | | | | | | | 12,649,970 | |
| | | |
| | | Adjustable Rate FNMA(a) – 3.9% |
| | | | 12,450,545 | | | | 5.028 | | | | 11/25/28 | | | | 12,483,616 | |
| | | | 206,922 | | | | 4.485 | | | | 03/01/33 | | | | 210,002 | |
| | | | 3,885,555 | | | | 3.850 | | | | 10/01/33 | | | | 3,843,667 | |
| | | | 6,140,738 | | | | 4.332 | | | | 01/01/35 | | | | 6,087,294 | |
| | | | | | | | | | | | | | | | | |
| | | | | | | | | | | | | | | | 22,624,579 | |
| | | |
| | | Adjustable Rate GNMA(a) – 2.1% |
| | | | 232,019 | | | | 5.375 | | | | 06/20/23 | | | | 234,493 | |
| | | | 108,172 | | | | 5.750 | | | | 07/20/23 | | | | 109,531 | |
| | | | 112,312 | | | | 5.750 | | | | 08/20/23 | | | | 113,390 | |
| | | | 292,805 | | | | 5.750 | | | | 09/20/23 | | | | 295,614 | |
| | | | 82,140 | | | | 5.375 | | | | 03/20/24 | | | | 83,057 | |
| | | | 778,860 | | | | 5.375 | | | | 04/20/24 | | | | 786,746 | |
| | | | 102,016 | | | | 5.375 | | | | 05/20/24 | | | | 103,099 | |
| | | | 751,543 | | | | 5.375 | | | | 06/20/24 | | | | 760,226 | |
| | | | 413,391 | | | | 5.750 | | | | 07/20/24 | | | | 418,165 | |
| | | | 587,569 | | | | 5.750 | | | | 08/20/24 | | | | 594,475 | |
| | | | 192,680 | | | | 5.750 | | | | 09/20/24 | | | | 194,833 | |
| | | | 212,972 | | | | 6.125 | | | | 11/20/24 | | | | 215,973 | |
| | | | 187,750 | | | | 6.125 | | | | 12/20/24 | | | | 190,333 | |
| | | | 157,512 | | | | 5.375 | | | | 01/20/25 | | | | 159,646 | |
| | | | 80,144 | | | | 5.375 | | | | 02/20/25 | | | | 81,234 | |
| | | | 262,927 | | | | 5.375 | | | | 05/20/25 | | | | 266,372 | |
| | | | 180,485 | | | | 5.750 | | | | 07/20/25 | | | | 182,844 | |
| | | | 124,277 | | | | 5.375 | | | | 02/20/26 | | | | 125,743 | |
| | | | 5,147 | | | | 5.750 | | | | 07/20/26 | | | | 5,207 | |
| | | | 308,568 | | | | 5.375 | | | | 01/20/27 | | | | 312,733 | |
| | | | 108,614 | | | | 5.375 | | | | 02/20/27 | | | | 109,919 | |
| | | | 886,905 | | | | 5.375 | | | | 04/20/27 | | | | 897,304 | |
| | | | 101,322 | | | | 5.375 | | | | 05/20/27 | | | | 102,418 | |
| | | | 103,914 | | | | 5.375 | | | | 06/20/27 | | | | 105,030 | |
| | | | 31,200 | | | | 6.125 | | | | 11/20/27 | | | | 31,561 | |
| | | | 127,244 | | | | 6.125 | | | | 12/20/27 | | | | 128,709 | |
| | | | 273,319 | | | | 5.375 | | | | 01/20/28 | | | | 276,747 | |
| | | | 102,771 | | | | 5.250 | | | | 02/20/28 | | | | 103,846 | |
| | | | 96,903 | | | | 5.375 | | | | 03/20/28 | | | | 98,086 | |
| | | | 684,997 | | | | 5.500 | | | | 07/20/29 | | | | 692,932 | |
| | | | 251,471 | | | | 5.500 | | | | 08/20/29 | | | | 254,386 | |
| | | | 103,990 | | | | 5.500 | | | | 09/20/29 | | | | 105,237 | |
| | | | 304,683 | | | | 6.125 | | | | 10/20/29 | | | | 308,604 | |
| | | | 370,619 | | | | 6.125 | | | | 11/20/29 | | | | 375,441 | |
| | | | 102,879 | | | | 6.125 | | | | 12/20/29 | | | | 104,207 | |
| | | | 152,466 | | | | 5.250 | | | | 01/20/30 | | | | 154,280 | |
| | | | 69,275 | | | | 5.250 | | | | 02/20/30 | | | | 70,100 | |
| | | | 274,083 | | | | 5.250 | | | | 03/20/30 | | | | 277,343 | |
| | | | 464,569 | | | | 5.375 | | | | 04/20/30 | | | | 470,501 | |
| | | | 1,195,209 | | | | 5.375 | | | | 05/20/30 | | | | 1,211,249 | |
| | | | 116,067 | | | | 5.375 | | | | 06/20/30 | | | | 117,473 | |
| | | | 836,335 | | | | 5.500 | | | | 07/20/30 | | | | 848,859 | |
| | | | 123,383 | | | | 5.500 | | | | 09/20/30 | | | | 125,228 | |
| | | | 282,860 | | | | 5.875 | | | | 10/20/30 | | | | 286,794 | |
| | | | | | | | | | | | | | | | | |
| | | | | | | | | | | | | | | | 12,489,968 | |
| | | |
| | | Adjustable Rate Non-Agency(a) – 11.2% |
| | | Banc of America Commercial Mortgage, Inc. Series 2005-6, Class A4 |
| | | | 10,000,000 | | | | 5.353 | | | | 09/10/47 | | | | 9,942,461 | |
| | | Bear Stearns Adjustable Rate Mortgage Trust Series 2003-5, Class 1A1 |
| | | | 80,760 | | | | 5.960 | | | | 08/25/33 | | | | 81,993 | |
| | | Citigroup/Deutsche Bank Commercial Mortgage Trust Series 2005-CD1, Class A4 |
| | | | 10,000,000 | | | | 5.400 | | | | 07/15/44 | | | | 9,989,083 | |
| | | Countrywide Alternative Loan Trust Series 2005-59, Class 1A1 |
| | | | 3,776,891 | | | | 5.650 | | | | 11/20/35 | | | | 3,789,672 | |
| | | Countrywide Home Loans Series 2003-37, Class 1A1 |
| | | | 114,206 | | | | 5.807 | | | | 08/25/33 | | | | 114,467 | |
| | | CS First Boston Mortgage Securities Corp. Series 2003-AR9, Class 2A2 |
| | | | 418,015 | | | | 5.100 | | | | 03/25/33 | | | | 416,875 | |
| | | Harborview Mortgage Loan Trust Series 2005-10, Class 2A1A |
| | | | 1,168,344 | | | | 5.630 | | | | 11/19/35 | | | | 1,172,064 | |
| | | Harborview Mortgage Loan Trust Series 2005-16, Class 2A1A |
| | | | 1,305,595 | | | | 5.560 | | | | 01/19/36 | | | | 1,308,180 | |
| | | Impac CMB Trust Series 2004-8, Class 1A |
| | | | 790,833 | | | | 5.680 | | | | 10/25/34 | | | | 790,960 | |
| | | JPMorgan Mortgage Trust Series 2007-A1, Class 1A1 |
| | | | 1,962,523 | | | | 4.204 | | | | 07/25/35 | | | | 1,929,217 | |
| | | JPMorgan Mortgage Trust Series 2007-A1, Class 2A2 |
| | | | 1,949,147 | | | | 4.766 | | | | 07/25/35 | | | | 1,932,215 | |
| | | JPMorgan Mortgage Trust Series 2007-A1, Class 4A2 |
| | | | 982,696 | | | | 4.071 | | | | 07/25/35 | | | | 964,637 | |
| | | JPMorgan Mortgage Trust Series 2007-A1, Class 5A2 |
| | | | 1,935,419 | | | | 4.771 | | | | 07/25/35 | | | | 1,918,788 | |
| | | Lehman XS Trust Series 2007-4N, Class 3A2A |
| | | | 3,977,413 | | | | 5.733 | | | | 03/25/47 | | | | 3,978,656 | |
| | | Master Adjustable Rate Mortgages Trust Series 2004-9, Class 2A1 |
| | | | 293,949 | | | | 5.700 | | | | 11/25/34 | | | | 294,893 | |
| | | MLCC Mortgage Investors, Inc. Series 2004-E, Class A2B |
| | | | 2,224,540 | | | | 5.674 | | | | 11/25/29 | | | | 2,228,866 | |
| | | Sequoia Mortgage Trust Series 2004-09, Class A2 |
| | | | 1,466,307 | | | | 5.681 | | | | 10/20/34 | | | | 1,471,014 | |
| | | Structured Adjustable Rate Mortgage Loan Series 2004-1, Class 3A3 |
| | | | 84,729 | | | | 7.380 | | | | 02/25/34 | | | | 86,084 | |
| | | Structured Adjustable Rate Mortgage Loan Series 2004-5, Class 1A |
| | | | 1,139,994 | | | | 5.400 | | | | 05/25/34 | | | | 1,148,357 | |
| | | Structured Asset Securities Corp. Series 2003-24A, Class 1A3 |
| | | | 1,061,725 | | | | 5.000 | | | | 07/25/33 | | | | 1,075,065 | |
| | | Structured Asset Securities Corp. Series 2003-34A, Class 3A3 |
| | | | 1,640,011 | | | | 4.700 | | | | 11/25/33 | | | | 1,649,547 | |
The accompanying notes are an integral part of these financial statements.
23
GOLDMAN SACHS GOVERNMENT INCOME FUND
Schedule of Investments (continued)
April 30, 2007 (Unaudited)
| | | | | | | | | | | | | | | | | |
| | | Principal | | Interest | | Maturity | | |
| | | Amount | | Rate | | Date | | Value |
| | |
Mortgage-Backed Obligations – (continued) |
| |
| | | Adjustable Rate Non-Agency(a) – (continued) |
| | | Washington Mutual Mortgage Pass-Through Certificates Series 2005-AR11, Class A1A |
| | | $ | 3,076,830 | | | | 5.640 | % | | | 08/25/45 | | | $ | 3,084,586 | |
| | | Washington Mutual Mortgage Pass-Through Certificates Series 2006-AR13, Class 1A |
| | | | 4,013,955 | | | | 5.894 | | | | 10/25/46 | | | | 4,016,463 | |
| | | Washington Mutual Mortgage Pass-Through Certificates Series 2006-AR19, Class 1A |
| | | | 920,118 | | | | 5.754 | | | | 01/25/47 | | | | 918,968 | |
| | | Washington Mutual Mortgage Pass-Through Certificates Series 2007-0A2, Class 2A |
| | | | 2,780,006 | | | | 5.714 | | | | 01/25/47 | | | | 2,776,965 | |
| | | Wells Fargo Mortgage Backed Securities Trust Series 2005-AR16, Class 1A1 |
| | | | 5,239,813 | | | | 4.975 | | | | 10/25/35 | | | | 5,245,426 | |
| | | Wells Fargo Mortgage Backed Securities Trust Series 2006-AR10, Class 5A3 |
| | | | 3,251,599 | | | | 5.600 | | | | 07/25/36 | | | | 3,244,927 | |
| | | | | | | | | | | | | | | | | |
| | | | | | | | | | | | | | | | 65,570,429 | |
| | | |
| | | Commercial Mortgage Backed Securities – 4.5% |
| | | Interest Only(a)(b)(c) – 0.4% |
| | | Bear Stearns Commercial Mortgage Securities, Inc. Series 2003-T10, Class X2 |
| | | | 17,723,003 | | | | 1.422 | | | | 03/13/40 | | | | 678,892 | |
| | | CS First Boston Mortgage Securities Corp. Series 2003-C3, Class ASP |
| | | | 12,736,999 | | | | 1.944 | | | | 05/15/38 | | | | 465,469 | |
| | | JPMorgan Chase Commercial Mortgage Securities Corp. Series 2004-C1, Class X2 |
| | | | 20,316,291 | | | | 1.157 | | | | 01/15/38 | | | | 591,104 | |
| | | Prudential Commercial Mortgage Trust Series 2003-PWR1, Class X2 |
| | | | 20,626,018 | | | | 1.625 | | | | 02/11/36 | | | | 917,406 | |
| | | | | | | | | | | | | | | | | |
| | | | | | | | | | | | | | | | 2,652,871 | |
| | | |
| | | Sequential Fixed Rate – 4.1% |
| | | CS First Boston Mortgage Securities Corp. Series 1997-C2, Class A3 |
| | | | 358,139 | | | | 6.550 | | | | 01/17/35 | | | | 359,011 | |
| | | First Union National Bank Commercial Mortgage Trust Series 2000-C2, Class A2 |
| | | | 9,500,000 | | | | 7.202 | | | | 10/15/32 | | | | 10,021,616 | |
| | | GMAC Commercial Mortgage Securities, Inc. Series 2002-C1, Class A2 |
| | | | 8,000,000 | | | | 6.278 | | | | 11/15/39 | | | | 8,310,733 | |
| | | Morgan Stanley Capital I Series 2007-T25, Class A3 |
| | | | 5,000,000 | | | | 5.514 | | | | 11/12/49 | | | | 5,048,711 | |
| | | | | | | | | | | | | | | | | |
| | | | | | | | | | | | | | | | 23,740,071 | |
| | | |
| | | TOTAL COMMERCIAL MORTGAGE BACKED SECURITIES | | $ | 26,392,942 | |
| | | |
| | | Collateralized Mortgage Obligations – 2.1% |
| | | Interest Only(b) – 0.1% |
| | | Countrywide Home Loan Trust Series 2003-42, Class 2X1(a) |
| | | | 888,178 | | | | 0.362 | | | | 10/25/33 | | | | 3,533 | |
| | | CS First Boston Mortgage Securities Corp. Series 2003-11, Class 1A2 |
| | | | 122,901 | | | | 5.500 | | | | 06/25/33 | | | | 6,087 | |
| | | CS First Boston Mortgage Securities Corp. Series 2003-AR18, Class 2X(a) |
| | | | 258,785 | | | | 0.782 | | | | 07/25/33 | | | | 1,125 | |
| | | CS First Boston Mortgage Securities Corp. Series 2003-AR20, Class 2X(a) |
| | | | 311,914 | | | | 0.605 | | | | 08/25/33 | | | | 1,500 | |
| | | FNMA Series 151, Class 2 |
| | | | 26,403 | | | | 9.500 | | | | 07/25/22 | | | | 6,689 | |
| | | FNMA Series 2004-47, Class EI(a)(d) |
| | | | 3,507,918 | | | | 0.000 | | | | 06/25/34 | | | | 148,024 | |
| | | FNMA Series 2004-62, Class DI(a)(d) |
| | | | 1,562,008 | | | | 0.000 | | | | 07/25/33 | | | | 66,655 | |
| | | FNMA Series 2004-71, Class DI(a)(d) |
| | | | 2,663,794 | | | | 0.000 | | | | 04/25/34 | | | | 65,332 | |
| | | Master Adjustable Rate Mortgages Trust Series 2003-2, Class 3AX(a) |
| | | | 94,173 | | | | 0.679 | | | | 08/25/33 | | | | 700 | |
| | | Master Adjustable Rate Mortgages Trust Series 2003-2, Class 4AX(a) |
| | | | 32,801 | | | | 1.158 | | | | 07/25/33 | | | | 484 | |
| | | Washington Mutual Mortgage Pass-Through Certificates Series 2003-AR04, Class X1(a) |
| | | | 2,177,827 | | | | 1.181 | | | | 01/25/08 | | | | 17,835 | |
| | | Washington Mutual Mortgage Pass-Through Certificates Series 2003-AR12, Class X(a) |
| | | | 5,447,578 | | | | 0.485 | | | | 02/25/34 | | | | 31,091 | |
| | | Washington Mutual Series 2003-AR07, Class X(a) |
| | | | 1,254,352 | | | | 0.941 | | | | 06/25/08 | | | | 9,406 | |
| | | | | | | | | | | | | | | | | |
| | | | | | | | | | | | | | | | 358,461 | |
| | | |
| | | Inverse Floaters(a) – 0.1% |
| | | GNMA Series 2001-48, Class SA |
| | | | 90,265 | | | | 9.198 | | | | 10/16/31 | | | | 99,895 | |
| | | GNMA Series 2001-51, Class SA |
| | | | 71,751 | | | | 9.447 | | | | 10/16/31 | | | | 81,186 | |
| | | GNMA Series 2001-51, Class SB |
| | | | 90,040 | | | | 9.198 | | | | 10/16/31 | | | | 100,424 | |
| | | GNMA Series 2001-59, Class SA |
| | | | 78,553 | | | | 9.035 | | | | 11/16/24 | | | | 86,220 | |
| | | GNMA Series 2002-13, Class SB |
| | | | 307,145 | | | | 12.740 | | | | 02/16/32 | | | | 378,770 | |
| | | | | | | | | | | | | | | | | |
| | | | | | | | | | | | | | | | 746,495 | |
| | | |
| | | Principal Only(e) – 0.0% |
| | | FNMA REMIC Trust Series G-35, Class N |
| | | | 23,202 | | | | 0.000 | | | | 10/25/21 | | | | 18,884 | |
| | | |
| | | Regular Floater(a) – 0.0% |
| | | FHLMC Series 1760, Class ZB |
| | | | 261,659 | | | | 3.980 | | | | 05/15/24 | | | | 256,866 | |
| | | |
The accompanying notes are an integral part of these financial statements.
24
GOLDMAN SACHS GOVERNMENT INCOME FUND
| | | | | | | | | | | | | | | | | |
| | | Principal | | Interest | | Maturity | | |
| | | Amount | | Rate | | Date | | Value |
| | |
Mortgage-Backed Obligations – (continued) |
| |
| | | Regular Floater(a) – (continued) |
| | | Sequential Fixed Rate – 1.9% |
| | | FHLMC Series 2329, Class ZA |
| | | $ | 5,069,056 | | | | 6.500 | % | | | 06/15/31 | | | $ | 5,241,469 | |
| | | FHLMC Series 2590, Class NV |
| | | | 2,000,000 | | | | 5.000 | | | | 03/15/18 | | | | 1,980,298 | |
| | | FNMA REMIC Series 1993-78, Class H |
| | | | 21,162 | | | | 6.500 | | | | 06/25/08 | | | | 21,201 | |
| | | FNMA REMIC Trust Series 1994-42, Class ZQ |
| | | | 2,945,175 | | | | 7.000 | | | | 04/25/24 | | | | 3,075,928 | |
| | | FNMA Series 2001-53, Class GH |
| | | | 704,088 | | | | 8.000 | | | | 09/25/16 | | | | 742,169 | |
| | | | | | | | | | | | | | | | | |
| | | | | | | | | | | | | | | | 11,061,065 | |
| | | |
| | | TOTAL COLLATERALIZED MORTGAGE | | | | |
| | | | OBLIGATIONS | | | | | | | | | | | $ | 12,441,771 | |
| | | |
| | | FHLMC – 12.0% |
| | | | 1,727,842 | | | | 5.500 | | | | 12/01/08 | | | | 1,731,477 | |
| | | | 109,965 | | | | 7.000 | | | | 06/01/09 | | | | 111,508 | |
| | | | 1,157,128 | | | | 6.500 | | | | 12/01/13 | | | | 1,182,594 | |
| | | | 45,157 | | | | 4.000 | | | | 02/01/14 | | | | 42,766 | |
| | | | 31,904 | | | | 6.500 | | | | 02/01/14 | | | | 32,606 | |
| | | | 713,055 | | | | 4.000 | | | | 03/01/14 | | | | 675,308 | |
| | | | 138,494 | | | | 4.000 | | | | 04/01/14 | | | | 131,163 | |
| | | | 4,411,388 | | | | 7.500 | | | | 11/01/14 | | | | 4,591,483 | |
| | | | 20,797 | | | | 7.000 | | | | 02/01/15 | | | | 21,475 | |
| | | | 2,062,874 | | | | 5.500 | | | | 07/01/15 | | | | 2,072,035 | |
| | | | 206,340 | | | | 8.000 | | | | 07/01/15 | | | | 216,949 | |
| | | | 33,607 | | | | 7.000 | | | | 01/01/16 | | | | 34,752 | |
| | | | 84,889 | | | | 7.000 | | | | 02/01/16 | | | | 87,783 | |
| | | | 636,980 | | | | 4.500 | | | | 05/01/18 | | | | 619,002 | |
| | | | 484,416 | | | | 5.500 | | | | 05/01/18 | | | | 486,288 | |
| | | | 150,562 | | | | 4.500 | | | | 06/01/18 | | | | 146,313 | |
| | | | 2,761,506 | | | | 5.500 | | | | 06/01/18 | | | | 2,772,182 | |
| | | | 601,659 | | | | 4.500 | | | | 09/01/18 | | | | 584,678 | |
| | | | 441,399 | | | | 4.500 | | | | 10/01/18 | | | | 428,942 | |
| | | | 455,146 | | | | 4.500 | | | | 11/01/18 | | | | 442,300 | |
| | | | 11,277,487 | | | | 4.500 | | | | 12/01/18 | | | | 10,959,200 | |
| | | | 2,276,308 | | | | 5.000 | | | | 12/01/18 | | | | 2,250,744 | |
| | | | 165,313 | | | | 4.500 | | | | 01/01/19 | | | | 160,647 | |
| | | | 330,179 | | | | 4.500 | | | | 03/01/19 | | | | 320,657 | |
| | | | 13,489,343 | | | | 4.000 | | | | 06/01/19 | | | | 12,775,238 | |
| | | | 8,148,986 | | | | 4.500 | | | | 06/01/19 | | | | 7,918,995 | |
| | | | 650,340 | | | | 5.000 | | | | 06/01/19 | | | | 642,077 | |
| | | | 6,646,076 | | | | 5.000 | | | | 11/01/19 | | | | 6,564,228 | |
| | | | 899,876 | | | | 4.500 | | | | 02/01/20 | | | | 873,363 | |
| | | | 27,978 | | | | 6.500 | | | | 08/01/22 | | | | 28,627 | |
| | | | 1,729,079 | | | | 4.500 | | | | 10/01/23 | | | | 1,640,901 | |
| | | | 22,733 | | | | 7.500 | | | | 03/01/27 | | | | 23,694 | |
| | | | 962,330 | | | | 6.500 | | | | 07/01/28 | | | | 981,721 | |
| | | | 5,841,804 | | | | 6.500 | | | | 12/01/29 | | | | 6,036,171 | |
| | | | 19,154 | | | | 8.000 | | | | 07/01/30 | | | | 19,868 | |
| | | | 58,129 | | | | 7.500 | | | | 12/01/30 | | | | 60,558 | |
| | | | 6,119 | | | | 7.500 | | | | 01/01/31 | | | | 6,375 | |
| | | | 422,812 | | | | 7.000 | | | | 04/01/31 | | | | 440,372 | |
| | | | 273,295 | | | | 6.500 | | | | 07/01/31 | | | | 282,388 | |
| | | | 1,799,959 | | | | 6.000 | | | | 05/01/33 | | | | 1,823,996 | |
| | | | | | | | | | | | | | | | | |
| | | | | | | | | | | | | | | | 70,221,424 | |
| | | |
| | | FNMA – 20.5% |
| | | | 3,647,677 | | | | 6.277 | | | | 12/01/08 | | | | 3,637,813 | |
| | | | 669,466 | | | | 5.500 | | | | 05/01/09 | | | | 671,768 | |
| | | | 513,521 | | | | 4.500 | | | | 03/01/13 | | | | 505,197 | |
| | | | 233,009 | | | | 4.500 | | | | 05/01/13 | | | | 229,183 | |
| | | | 306,511 | | | | 4.000 | | | | 06/01/13 | | | | 297,867 | |
| | | | 490,244 | | | | 4.500 | | | | 06/01/13 | | | | 482,138 | |
| | | | 408,630 | | | �� | 4.000 | | | | 07/01/13 | | | | 397,107 | |
| | | | 510,354 | | | | 4.500 | | | | 07/01/13 | | | | 501,863 | |
| | | | 569,664 | | | | 4.000 | | | | 08/01/13 | | | | 553,482 | |
| | | | 240,965 | | | | 4.500 | | | | 08/01/13 | | | | 236,930 | |
| | | | 842,406 | | | | 4.000 | | | | 09/01/13 | | | | 818,288 | |
| | | | 1,010,582 | | | | 4.500 | | | | 09/01/13 | | | | 993,554 | |
| | | | 1,700,334 | | | | 4.000 | | | | 10/01/13 | | | | 1,651,245 | |
| | | | 833,538 | | | | 4.000 | | | | 04/01/14 | | | | 808,153 | |
| | | | 3,899,488 | | | | 5.500 | | | | 09/01/14 | | | | 3,919,370 | |
| | | | 135,833 | | | | 7.000 | | | | 03/01/15 | | | | 140,149 | |
| | | | 40,448 | | | | 8.000 | | | | 01/01/16 | | | | 42,357 | |
| | | | 687,869 | | | | 5.000 | | | | 11/01/17 | | | | 680,277 | |
| | | | 23,126,909 | | | | 5.000 | | | | 12/01/17 | | | | 22,870,296 | |
| | | | 4,240,578 | | | | 5.000 | | | | 01/01/18 | | | | 4,193,826 | |
| | | | 5,304,200 | | | | 5.000 | | | | 02/01/18 | | | | 5,242,449 | |
| | | | 4,688,345 | | | | 5.000 | | | | 03/01/18 | | | | 4,633,627 | |
| | | | 643,970 | | | | 4.500 | | | | 04/01/18 | | | | 625,284 | |
| | | | 1,720,805 | | | | 5.000 | | | | 04/01/18 | | | | 1,700,776 | |
| | | | 2,922,858 | | | | 4.500 | | | | 05/01/18 | | | | 2,838,495 | |
| | | | 627,230 | | | | 5.000 | | | | 05/01/18 | | | | 619,925 | |
| | | | 5,363,005 | | | | 4.500 | | | | 06/01/18 | | | | 5,207,755 | |
| | | | 2,877,229 | | | | 5.000 | | | | 06/01/18 | | | | 2,843,739 | |
| | | | 422,597 | | | | 4.500 | | | | 07/01/18 | | | | 410,398 | |
| | | | 141,630 | | | | 5.000 | | | | 07/01/18 | | | | 139,977 | |
| | | | 11,357,377 | | | | 4.000 | | | | 08/01/18 | | | | 10,784,062 | |
| | | | 491,849 | | | | 4.500 | | | | 08/01/18 | | | | 477,653 | |
| | | | 114,078 | | | | 5.000 | | | | 08/01/18 | | | | 112,746 | |
| | | | 824,001 | | | | 4.500 | | | | 09/01/18 | | | | 800,218 | |
| | | | 1,642,232 | | | | 5.000 | | | | 09/01/18 | | | | 1,623,118 | |
| | | | 6,715,319 | | | | 4.500 | | | | 10/01/18 | | | | 6,521,492 | |
| | | | 8,340,470 | | | | 5.000 | | | | 10/01/18 | | | | 8,243,396 | |
| | | | 605,169 | | | | 4.500 | | | | 11/01/18 | | | | 587,703 | |
| | | | 3,942,189 | | | | 5.000 | | | | 11/01/18 | | | | 3,896,303 | |
| | | | 783,126 | | | | 4.500 | | | | 12/01/18 | | | | 760,522 | |
| | | | 1,608,976 | | | | 5.500 | | | | 12/01/18 | | | | 1,615,270 | |
| | | | 157,656 | | | | 4.500 | | | | 01/01/19 | | | | 153,105 | |
| | | | 220,281 | | | | 4.500 | | | | 03/01/19 | | | | 213,923 | |
| | | | 3,167,936 | | | | 5.000 | | | | 04/01/19 | | | | 3,131,065 | |
| | | | 140,636 | | | | 4.500 | | | | 06/01/19 | | | | 136,445 | |
| | | | 3,382,330 | | | | 5.000 | | | | 06/01/19 | | | | 3,342,964 | |
| | | | 1,836,505 | | | | 4.500 | | | | 09/01/19 | | | | 1,783,497 | |
| | | | 525,068 | | | | 4.500 | | | | 03/01/20 | | | | 509,913 | |
| | | | 1,369,939 | | | | 4.500 | | | | 04/01/20 | | | | 1,330,398 | |
| | | | 13,863 | | | | 7.500 | | | | 03/01/24 | | | | 14,532 | |
| | | | 49,610 | | | | 6.500 | | | | 10/01/28 | | | | 51,183 | |
| | | |
The accompanying notes are an integral part of these financial statements.
25
GOLDMAN SACHS GOVERNMENT INCOME FUND
Schedule of Investments (continued)
April 30, 2007 (Unaudited)
| | | | | | | | | | | | | | | | | |
| | | Principal | | Interest | | Maturity | | |
| | | Amount | | Rate | | Date | | Value |
| | |
Mortgage-Backed Obligations – (continued) |
| |
| | | FNMA – (continued) |
| | | $ | 59,187 | | | | 6.500 | % | | | 11/01/28 | | | $ | 61,073 | |
| | | | 22,680 | | | | 7.500 | | | | 07/01/29 | | | | 23,672 | |
| | | | 1,842 | | | | 7.500 | | | | 08/01/29 | | | | 1,922 | |
| | | | 9,853 | | | | 7.500 | | | | 10/01/29 | | | | 10,355 | |
| | | | 3,751 | | | | 7.500 | | | | 02/01/30 | | | | 3,915 | |
| | | | 5,169 | | | | 7.500 | | | | 03/01/30 | | | | 5,419 | |
| | | | 685,014 | | | | 7.000 | | | | 07/01/31 | | | | 706,037 | |
| | | | 13,470 | | | | 6.500 | | | | 01/01/34 | | | | 13,881 | |
| | | | 964,270 | | | | 7.500 | | | | 08/01/35 | | | | 1,000,052 | |
| | | | 2,240,974 | | | | 7.500 | | | | 10/01/35 | | | | 2,324,132 | |
| | | | 186,515 | | | | 7.500 | | | | 04/01/36 | | | | 193,436 | |
| | | | 776,820 | | | | 7.500 | | | | 05/01/36 | | | | 805,442 | |
| | | | 678,511 | | | | 7.500 | | | | 09/01/36 | | | | 703,512 | |
| | | | | | | | | | | | | | | | | |
| | | | | | | | | | | | | | | | 119,835,644 | |
| | | |
| | | TOTAL MORTGAGE-BACKED OBLIGATIONS |
| | | (Cost $343,199,660) | | $ | 342,226,727 | |
| | | |
| |
| | |
Agency Debentures – 16.0% |
| |
| | | FFCB |
| | | $ | 6,838,000 | | | | 4.100 | % | | | 07/21/08 | | | $ | 6,763,726 | |
| | | | 10,000,000 | | | | 4.200 | | | | 02/23/09 | | | | 9,882,500 | |
| | | | 11,000,000 | | | | 4.450 | | | | 06/11/09 | | | | 10,913,716 | |
| | | | 7,000,000 | | | | 7.375 | | | | 02/09/10 | | | | 7,471,541 | |
| | | | 9,000,000 | | | | 4.750 | | | | 11/06/12 | | | | 8,956,647 | |
| | | | 3,900,000 | | | | 3.500 | | | | 02/13/09 | | | | 3,806,018 | |
| | | | 1,500,000 | | | | 7.625 | | | | 05/14/10 | | | | 1,617,684 | |
| | | | 8,400,000 | | | | 4.500 | | | | 09/14/12 | | | | 8,247,528 | |
| | | FHLMC |
| | | | 10,390,000 | | | | 4.250 | | | | 06/23/08 | | | | 10,298,682 | |
| | | | 11,000,000 | | | | 4.480 | | | | 09/19/08 | | | | 10,923,174 | |
| | | FNMA |
| | | | 5,000,000 | | | | 6.625 | | | | 09/15/09 | | | | 5,199,369 | |
| | | New Valley Generation II |
| | | | 3,416,362 | | | | 5.572 | | | | 05/01/20 | | | | 3,448,814 | |
| | | Small Business Administration |
| | | | 508,841 | | | | 6.700 | | | | 12/01/16 | | | | 524,105 | |
| | | | 389,870 | | | | 7.150 | | | | 03/01/17 | | | | 404,813 | |
| | | | 283,884 | | | | 7.500 | | | | 04/01/17 | | | | 296,454 | |
| | | | 179,196 | | | | 7.300 | | | | 05/01/17 | | | | 186,286 | |
| | | | 125,317 | | | | 6.800 | | | | 08/01/17 | | | | 129,515 | |
| | | | 324,539 | | | | 6.300 | | | | 05/01/18 | | | | 333,094 | |
| | | | 294,884 | | | | 6.300 | | | | 06/01/18 | | | | 302,742 | |
| | | Tennessee Valley Authority |
| | | | 4,000,000 | | | | 5.375 | | | | 04/01/56 | | | | 4,048,440 | |
| | | |
| | | TOTAL AGENCY DEBENTURES |
| | | (Cost $94,436,415) | | $ | 93,754,848 | |
| | | |
| |
| | |
Asset-Backed Securities – 1.2% |
| |
| | | Home Equity(a) – 1.1% |
| | | Citigroup Mortgage Loan Trust, Inc. Series 2004-OPT1, Class A2 |
| | | $ | 889,086 | | | | 5.680 | % | | | 10/25/34 | | | $ | 891,078 | |
| | | Countrywide Home Equity Loan Trust Series 2004-I, Class A |
| | | | 1,178,100 | | | | 5.610 | | | | 02/15/34 | | | | 1,177,917 | |
| | | Countrywide Home Equity Loan Trust Series 2004-Q, Class 2A |
| | | | 1,198,120 | | | | 5.620 | | | | 12/15/33 | | | | 1,200,145 | |
| | | Countrywide Home Equity Loan Trust Series 2005-B, Class 2A |
| | | | 1,272,053 | | | | 5.500 | | | | 05/15/35 | | | | 1,270,463 | |
| | | Master Asset Backed Securities Trust Series 2005-WMC1, Class A4 |
| | | | 1,136,765 | | | | 5.510 | | | | 03/25/35 | | | | 1,136,925 | |
| | | Popular Asset Backed Securities Mortgage Pass-Through Trust Series 2004-5, Class AV2 |
| | | | 648,844 | | | | 5.660 | | | | 12/25/34 | | | | 649,960 | |
| | | Securitized Asset Backed Receivables LLC Trust Series 2004-OP2, Class A2 |
| | | | 170,785 | | | | 5.670 | | | | 08/25/34 | | | | 170,983 | |
| | | | | | | | | | | | | | | | | |
| | | | | | | | | | | | | | | | 6,497,471 | |
| | | |
| | | Manufactured Housing – 0.1% |
| | | Mid-State Trust Series 4, Class A |
| | | | 265,266 | | | | 8.330 | | | | 04/01/30 | | | | 283,004 | |
| | | |
| | | TOTAL ASSET-BACKED SECURITIES |
| | | (Cost $6,772,726) | | $ | 6,780,475 | |
| | | |
| |
| | |
U.S. Treasury Obligations – 22.1% |
| |
| | | United States Treasury Bonds |
| | | $ | 1,600,000 | | | | 4.500 | % | | | 02/15/36 | | | $ | 1,515,374 | |
| | | United States Treasury Inflation Protected Securities |
| | | | 1,727,040 | | | | 2.000 | | | | 07/15/14 | | | | 1,713,569 | |
| | | | 705,236 | | | | 2.500 | | | | 07/15/16 | | | | 724,630 | |
| | | | 647,640 | | | | 2.375 | | | | 01/15/25 | | | | 651,055 | |
| | | | 1,311,596 | | | | 2.375 | | | | 01/15/27 | | | | 1,321,280 | |
| | | United States Treasury Notes |
| | | | 5,000,000 | | | | 4.500 | | | | 03/31/09 | | | | 4,988,670 | |
| | | | 3,900,000 | | | | 4.875 | | | | 08/15/09 | | | | 3,925,350 | |
| | | | 89,000,000 | | | | 4.500 | | | | 09/30/11 | | | | 88,916,563 | |
| | | | 19,700,000 | | | | 4.875 | | | | 08/15/16 | | | | 20,068,784 | |
| | | | 5,100,000 | | | | 4.625 | | | | 02/15/17 | | | | 5,099,184 | |
| | | |
| | | TOTAL U.S. TREASURY OBLIGATIONS |
| | | (Cost $128,922,338) | | $ | 128,924,459 | |
| | | |
| | |
Insured Revenue Bonds – 1.3% |
| |
| | | New Jersey Economic Development Authority Series A (MBIA) |
| | | $ | 2,000,000 | | | | 7.425 | % | | | 02/15/29 | | | $ | 2,472,180 | |
| | | |
The accompanying notes are an integral part of these financial statements.
26
GOLDMAN SACHS GOVERNMENT INCOME FUND
| | | | | | | | | | | | | | | | | |
| | | Principal | | Interest | | Maturity | | |
| | | Amount | | Rate | | Date | | Value |
| | |
Insured Revenue Bonds – (continued) |
| |
| | | Sales Tax Asset Receivable Taxable Series B (FSA) |
| | | $ | 5,500,000 | | | | 3.600 | % | | | 10/15/08 | | | $ | 5,402,485 | |
| | | |
| | | TOTAL INSURED REVENUE BONDS |
| | | (Cost $7,500,000) | | $ | 7,874,665 | |
| | | |
| | | TOTAL INVESTMENTS BEFORE REPURCHASE AGREEMENT – 99.1% |
| | | (Cost $580,831,139) | | $ | 579,561,174 | |
| | | |
| |
| | |
Repurchase Agreement(f) – 5.8% |
| |
| | | Joint Repurchase Agreement Account II |
| | | $ | 33,800,000 | | | | 5.242 | % | | | 05/01/07 | | | $ | 33,800,000 | |
| | | Maturity Value: $33,804,922 |
| | | (Cost $33,800,000) | | | | |
| | | |
| | | TOTAL INVESTMENTS – 104.9% |
| | | (Cost $614,631,139) | | $ | 613,361,174 | |
| | | |
| | | LIABILITIES IN EXCESS OF OTHER ASSETS – (4.9)% | | | (28,898,864 | ) |
| | | |
| | | NET ASSETS – 100.0% | | $ | 584,462,310 | |
| | | |
| |
| | The percentage shown for each investment category reflects the value of investments in that category as a percentage of net assets. |
| |
| (a) | Variable rate security. Interest rate disclosed is that which is in effect at April 30, 2007. |
| |
| (b) | Represents security with notional principal amount. The actual effective yield of this security is different than the stated interest rate. |
| |
| (c) | Securities are exempt from registration under Rule 144A of the Securities Act of 1933. Under procedures approved by the Board of Trustees, such securities have been determined to be liquid by the Investment Adviser and may be resold, normally to qualified institutional buyers in transactions exempt from registration. Total market value of Rule 144A securities amounts to $2,652,871, which represents approximately 0.4% of net assets as of April 30, 2007. |
| |
| (d) | Security is issued with zero coupon and interest rate is contingent upon LIBOR reaching a predetermined level. |
| |
| (e) | Security issued with a zero coupon. Income is recognized through the accretion of discount. |
| |
| (f) | Joint repurchase agreement was entered into on April 30, 2007. Additional information appears on page 63. |
| | | | | | | |
| | | |
| | | Investment Abbreviations: |
| | | FFCB | | — | | Federal Farm Credit Bank |
| | | FHLB | | — | | Federal Home Loan Bank |
| | | FHLMC | | — | | Federal Home Loan Mortgage Corp. |
| | | FNMA | | — | | Federal National Mortgage Association |
| | | FSA | | — | | Insured by Financial Security Assurance Co. |
| | | GNMA | | — | | Government National Mortgage Association |
| | | LIBOR | | — | | London Interbank Offered Rate |
| | | MBIA | | — | | Insured by Municipal Bond Investors Assurance |
| | | REMIC | | — | | Real Estate Mortgage Investment Conduit |
| | | |
The accompanying notes are an integral part of these financial statements.
27
GOLDMAN SACHS GOVERNMENT INCOME FUND
Schedule of Investments (continued)
April 30, 2007 (Unaudited)
| ADDITIONAL INVESTMENT INFORMATION |
FUTURES CONTRACTS — At April 30, 2007, the following futures contacts were open:
| | | | | | | | | | | | | | | |
| | | Number of | | | | | | |
| | | Contracts | | Settlement | | Market | | Unrealized |
| Type | | Long (Short) | | Month | | Value | | Gain (Loss) |
| |
| Eurodollars | | | 76 | | | June 2007 | | $ | 17,988,250 | | | $ | (13,558 | ) |
| Eurodollars | | | (20 | ) | | September 2007 | | | (4,740,000 | ) | | | 13,682 | |
| Eurodollars | | | (90 | ) | | December 2007 | | | (21,372,750 | ) | | | 35,919 | |
| U.S. Treasury Bonds | | | 713 | | | June 2007 | | | 79,677,750 | | | | 614,591 | |
| 2 Year U.S. Treasury Notes | | | (76 | ) | | June 2007 | | | (15,558,625 | ) | | | (39,216 | ) |
| 10 Year U.S. Treasury Notes | | | (1,022 | ) | | June 2007 | | | (110,711,344 | ) | | | (60,585 | ) |
| |
TOTAL | | | | | | | | $ | (54,716,719 | ) | | $ | 550,833 | |
| |
INTEREST RATE SWAP CONTRACTS — At April 30, 2007, the Fund had outstanding swap contracts with the following terms:
| | | | | | | | | | | | | | | | | | | | | |
| | | | | | | Rates Exchanged | | | | |
| | | | | | | | | | | |
| | | Notional | | | | Payments | | Payments | | Upfront | | |
| Swap | | Amount | | Termination | | received by | | made by | | Payments made | | Unrealized |
| Counterparty | | (000s) | | Date | | the Fund | | the Fund | | by the Fund | | Gain (Loss) |
| |
| Banc of America Securities LLC | | $ | 30,000 | | | | 04/07/08 | | | 4.339% | | 3 month LIBOR | | $ | — | | | $ | (294,579 | ) |
| Banc of America Securities LLC | | | 35,000 | | | | 09/02/10 | | | 4.309 | | 3 month LIBOR | | | — | | | | (831,964 | ) |
| Banc of America Securities LLC | | | 25,000 | | | | 10/06/10 | | | 4.703 | | 3 month LIBOR | | | — | | | | (264,901 | ) |
| Banc of America Securities LLC (a) | | | 98,400 | | | | 06/20/12 | | | 5.000 | | 3 month LIBOR | | | 297,331 | | | | (188,062 | ) |
| Deutsche Bank Securities, Inc. (a) | | | 88,300 | | | | 06/20/12 | | | 5.000 | | 3 month LIBOR | | | 393,023 | | | | (294,969 | ) |
| Deutsche Bank Securities, Inc. (a) | | | 125,700 | | | | 06/20/12 | | | 3 month LIBOR | | 5.000% | | | 380,440 | | | | (520,025 | ) |
| JPMorgan Securities, Inc.(a) | | | 13,800 | | | | 06/20/12 | | | 3 month LIBOR | | 5.000 | | | 98,376 | | | | (113,700 | ) |
| Banc of America Securities LLC (a) | | | 155,100 | | | | 06/20/12 | | | 3 month LIBOR | | 5.000 | | | 791,975 | | | | (964,616 | ) |
| Bear Stearns & Co., Inc.(a) | | | 29,000 | | | | 06/20/12 | | | 3 month LIBOR | | 5.000 | | | 195,919 | | | | (228,122 | ) |
| Banc of America Securities LLC (a) | | | 98,200 | | | | 06/20/14 | | | 5.100 | | 3 month LIBOR | | | 763,928 | | | | (514,323 | ) |
| JPMorgan Securities, Inc.(a) | | | 28,000 | | | | 06/20/14 | | | 5.100 | | 3 month LIBOR | | | 308,350 | | | | (237,179 | ) |
| Deutsche Bank Securities, Inc. (a) | | | 164,100 | | | | 06/20/14 | | | 5.100 | | 3 month LIBOR | | | 1,294,941 | | | | (861,288 | ) |
| JPMorgan Securities, Inc.(a) | | | 45,000 | | | | 06/20/14 | | | 3 month LIBOR | | 5.100 | | | 287,375 | | | | (401,756 | ) |
| Banc of America Securities LLC (a) | | | 72,600 | | | | 06/20/14 | | | 3 month LIBOR | | 5.100 | | | 215,604 | | | | (400,139 | ) |
| Deutsche Bank Securities, Inc. (a) | | | 24,400 | | | | 06/20/14 | | | 3 month LIBOR | | 5.100 | | | 176,579 | | | | (238,599 | ) |
| Banc of America Securities LLC | | | 30,000 | | | | 12/09/14 | | | 4.641 | | 3 month LIBOR | | | — | | | | (518,115 | ) |
| Banc of America Securities LLC | | | 9,000 | | | | 05/25/15 | | | 4.533 | | 3 month LIBOR | | | — | | | | (244,978 | ) |
| JPMorgan Securities, Inc. | | | 30,000 | | | | 03/07/16 | | | 3 month LIBOR | | 5.183 | | | — | | | | (112,968 | ) |
| JPMorgan Securities, Inc.(a) | | | 22,000 | | | | 06/20/17 | | | 5.100 | | 3 month LIBOR | | | 334,040 | | | | (442,760 | ) |
| Banc of America Securities LLC | | | 43,000 | | | | 11/02/19 | | | 3 month LIBOR | | 4.865 | | | — | | | | 1,010,783 | |
| Banc of America Securities LLC | | | 20,000 | | | | 11/12/19 | | | 3 month LIBOR | | 5.069 | | | — | | | | 74,576 | |
| Banc of America Securities LLC | | | 13,200 | | | | 04/09/35 | | | 5.266 | | 3 month LIBOR | | | — | | | | (224,911 | ) |
| |
TOTAL | | | | | | | | | | | | | | $ | 5,537,881 | | | $ | (6,812,595 | ) |
| |
| |
| (a) | Represents forward starting interest rate swaps whose effective dates of commencement of accruals and cash flows occur subsequent to April 30, 2007. |
LIBOR—London Interbank Offered Rate
The accompanying notes are an integral part of these financial statements.
28
GOLDMAN SACHS U.S. MORTGAGES FUND
Schedule of Investments
April 30, 2007 (Unaudited)
| | | | | | | | | | | | | | | | | |
| | | Principal | | Interest | | Maturity | | |
| | | Amount | | Rate | | Date | | Value |
| | |
Mortgage-Backed Obligations – 90.2% |
| |
| | | Adjustable Rate FHLMC(a) – 0.2% |
| | | $ | 891,595 | | | | 4.261 | % | | | 04/01/33 | | | $ | 890,976 | |
| | | |
| | | Adjustable Rate FNMA(a) – 3.9% |
| | | | 35,698 | | | | 5.608 | | | | 07/01/22 | | | | 36,143 | |
| | | | 45,725 | | | | 5.642 | | | | 07/01/27 | | | | 46,259 | |
| | | | 103,625 | | | | 5.642 | | | | 11/01/27 | | | | 104,835 | |
| | | | 13,622 | | | | 5.642 | | | | 01/01/31 | | | | 13,783 | |
| | | | 22,809 | | | | 5.642 | | | | 06/01/32 | | | | 23,080 | |
| | | | 41,956 | | | | 5.608 | | | | 08/01/32 | | | | 42,455 | |
| | | | 3,505,241 | | | | 4.418 | | | | 05/01/33 | | | | 3,504,158 | |
| | | | 105,353 | | | | 5.608 | | | | 05/01/33 | | | | 106,613 | |
| | | | 771,592 | | | | 4.842 | | | | 06/01/33 | | | | 787,119 | |
| | | | 2,331,333 | | | | 3.850 | | | | 10/01/33 | | | | 2,306,201 | |
| | | | 847,933 | | | | 4.396 | | | | 12/01/33 | | | | 844,354 | |
| | | | 1,412,487 | | | | 4.654 | | | | 08/01/34 | | | | 1,406,884 | |
| | | | 5,393,195 | | | | 4.569 | | | | 02/01/35 | | | | 5,336,698 | |
| | | | 43,492 | | | | 5.642 | | | | 11/01/35 | | | | 44,021 | |
| | | | 222,796 | | | | 5.642 | | | | 12/01/37 | | | | 225,533 | |
| | | | 98,995 | | | | 5.642 | | | | 01/01/38 | | | | 100,216 | |
| | | | 72,696 | | | | 5.642 | | | | 11/01/40 | | | | 73,601 | |
| | | | | | | | | | | | | | | | | |
| | | | | | | | | | | | | | | | 15,001,953 | |
| | | |
| | | Adjustable Rate GNMA(a) – 1.6% |
| | | | 100,190 | | | | 5.375 | | | | 06/20/23 | | | | 101,258 | |
| | | | 48,076 | | | | 5.750 | | | | 07/20/23 | | | | 48,680 | |
| | | | 49,917 | | | | 5.750 | | | | 08/20/23 | | | | 50,395 | |
| | | | 130,135 | | | | 5.750 | | | | 09/20/23 | | | | 131,384 | |
| | | | 35,469 | | | | 5.375 | | | | 03/20/24 | | | | 35,866 | |
| | | | 336,325 | | | | 5.375 | | | | 04/20/24 | | | | 339,732 | |
| | | | 44,052 | | | | 5.375 | | | | 05/20/24 | | | | 44,520 | |
| | | | 324,530 | | | | 5.375 | | | | 06/20/24 | | | | 328,279 | |
| | | | 183,729 | | | | 5.750 | | | | 07/20/24 | | | | 185,852 | |
| | | | 261,141 | | | | 5.750 | | | | 08/20/24 | | | | 264,211 | |
| | | | 85,636 | | | | 5.750 | | | | 09/20/24 | | | | 86,592 | |
| | | | 91,965 | | | | 6.125 | | | | 11/20/24 | | | | 93,261 | |
| | | | 81,074 | | | | 6.125 | | | | 12/20/24 | | | | 82,189 | |
| | | | 68,016 | | | | 5.375 | | | | 01/20/25 | | | | 68,938 | |
| | | | 34,608 | | | | 5.375 | | | | 02/20/25 | | | | 35,078 | |
| | | | 113,537 | | | | 5.375 | | | | 05/20/25 | | | | 115,024 | |
| | | | 80,216 | | | | 5.750 | | | | 07/20/25 | | | | 81,264 | |
| | | | 53,665 | | | | 5.375 | | | | 02/20/26 | | | | 54,298 | |
| | | | 2,288 | | | | 5.750 | | | | 07/20/26 | | | | 2,314 | |
| | | | 133,245 | | | | 5.375 | | | | 01/20/27 | | | | 135,044 | |
| | | | 46,901 | | | | 5.375 | | | | 02/20/27 | | | | 47,465 | |
| | | | 382,982 | | | | 5.375 | | | | 04/20/27 | | | | 387,472 | |
| | | | 43,753 | | | | 5.375 | | | | 05/20/27 | | | | 44,226 | |
| | | | 44,872 | | | | 5.375 | | | | 06/20/27 | | | | 45,354 | |
| | | | 13,180 | | | | 6.125 | | | | 11/20/27 | | | | 13,332 | |
| | | | 54,946 | | | | 6.125 | | | | 12/20/27 | | | | 55,579 | |
| | | | 118,024 | | | | 5.375 | | | | 01/20/28 | | | | 119,504 | |
| | | | 45,676 | | | | 5.250 | | | | 02/20/28 | | | | 46,154 | |
| | | | 41,845 | | | | 5.375 | | | | 03/20/28 | | | | 42,356 | |
| | | | 304,443 | | | | 5.500 | | | | 07/20/29 | | | | 307,970 | |
| | | | 111,765 | | | | 5.500 | | | | 08/20/29 | | | | 113,060 | |
| | | | 46,218 | | | | 5.500 | | | | 09/20/29 | | | | 46,772 | |
| | | | 131,567 | | | | 6.125 | | | | 10/20/29 | | | | 133,261 | |
| | | | 160,040 | | | | 6.125 | | | | 11/20/29 | | | | 162,122 | |
| | | | 44,425 | | | | 6.125 | | | | 12/20/29 | | | | 44,999 | |
| | | | 67,763 | | | | 5.250 | | | | 01/20/30 | | | | 68,569 | |
| | | | 30,789 | | | | 5.250 | | | | 02/20/30 | | | | 31,156 | |
| | | | 121,815 | | | | 5.250 | | | | 03/20/30 | | | | 123,263 | |
| | | | 200,609 | | | | 5.375 | | | | 04/20/30 | | | | 203,170 | |
| | | | 516,114 | | | | 5.375 | | | | 05/20/30 | | | | 523,039 | |
| | | | 50,120 | | | | 5.375 | | | | 06/20/30 | | | | 50,727 | |
| | | | 371,704 | | | | 5.500 | | | | 07/20/30 | | | | 377,271 | |
| | | | 54,837 | | | | 5.500 | | | | 09/20/30 | | | | 55,657 | |
| | | | 122,144 | | | | 5.875 | | | | 10/20/30 | | | | 123,843 | |
| | | | 585,285 | | | | 4.500 | | | | 12/20/34 | | | | 584,171 | |
| | | | | | | | | | | | | | | | | |
| | | | | | | | | | | | | | | | 6,034,671 | |
| | | |
| | | Adjustable Rate Non-Agency(a) – 13.2% |
| | | American Home Mortgage Assets Series 2007-1, Class A1 |
| | | | 4,924,191 | | | | 5.714 | | | | 02/25/47 | | | | 4,889,721 | |
| | | American Home Mortgage Investment Trust Series 2004-3, Class 1A |
| | | | 69,686 | | | | 5.690 | | | | 10/25/34 | | | | 69,788 | |
| | | Bear Stearns Alt-A Trust Series 2004-3, Class A1 |
| | | | 181,763 | | | | 5.640 | | | | 04/25/34 | | | | 181,969 | |
| | | Countrywide Alternative Loan Trust Series 2005-59, Class 1A1 |
| | | | 1,716,768 | | | | 5.650 | | | | 11/20/35 | | | | 1,722,578 | |
| | | Harborview Mortgage Loan Trust Series 2005-15, Class 2A11 |
| | | | 1,451,759 | | | | 5.590 | | | | 10/20/45 | | | | 1,455,797 | |
| | | Harborview Mortgage Loan Trust Series 2005-16, Class 2A1A |
| | | | 870,396 | | | | 5.560 | | | | 01/19/36 | | | | 872,120 | |
| | | Harborview Mortgage Loan Trust Series 2005-16, Class 3A1A |
| | | | 2,974,077 | | | | 5.570 | | | | 01/19/36 | | | | 2,976,865 | |
| | | Impac CMB Trust Series 2004-8, Class 1A |
| | | | 296,562 | | | | 5.680 | | | | 10/25/34 | | | | 296,610 | |
| | | Impac CMB Trust Series 2005-6, Class 1A1 |
| | | | 3,137,192 | | | | 5.570 | | | | 10/25/35 | | | | 3,140,095 | |
| | | Impac Secured Assets Corp. Series 2005-2, Class A1W |
| | | | 3,333,093 | | | | 5.570 | | | | 03/25/36 | | | | 3,342,210 | |
| | | JPMorgan Mortgage Trust Series 2007-A1, Class 1A1 |
| | | | 981,261 | | | | 4.204 | | | | 07/25/35 | | | | 964,609 | |
| | | JPMorgan Mortgage Trust Series 2007-A1, Class 2A2 |
| | | | 974,574 | | | | 4.766 | | | | 07/25/35 | | | | 966,107 | |
| | | JPMorgan Mortgage Trust Series 2007-A1, Class 4A2 |
| | | | 982,696 | | | | 4.071 | | | | 07/25/35 | | | | 964,637 | |
| | | JPMorgan Mortgage Trust Series 2007-A1, Class 5A2 |
| | | | 967,710 | | | | 4.771 | | | | 07/25/35 | | | | 959,394 | |
| | | Lehman XS Trust Series 2005-5N, Class 3A1A |
| | | | 2,137,607 | | | | 5.620 | | | | 11/25/35 | | | | 2,138,869 | |
| | | Lehman XS Trust Series 2006-2N, Class 1A1 |
| | | | 2,721,928 | | | | 5.580 | | | | 02/25/46 | | | | 2,728,614 | |
| | | Lehman XS Trust Series 2007-4N, Class 3A2A |
| | | | 2,983,060 | | | | 5.764 | | | | 03/25/47 | | | | 2,983,992 | |
| | | Master Adjustable Rate Mortgages Trust Series 2006-OA2, Class 4A1A |
| | | | 2,852,245 | | | | 5.833 | | | | 12/25/46 | | | | 2,852,245 | |
| | | Mortgage IT Trust Series 2005-5, Class A1 |
| | | | 1,575,046 | | | | 5.580 | | | | 12/25/35 | | | | 1,577,450 | |
The accompanying notes are an integral part of these financial statements.
29
GOLDMAN SACHS U.S. MORTGAGES FUND
Schedule of Investments (continued)
April 30, 2007 (Unaudited)
| | | | | | | | | | | | | | | | | |
| | | Principal | | Interest | | Maturity | | |
| | | Amount | | Rate | | Date | | Value |
| | |
Mortgage-Backed Obligations – (continued) |
| |
| | | Adjustable Rate Non-Agency(a) – (continued) |
| | | Sequoia Mortgage Trust Series 2004-09, Class A2 |
| | | $ | 902,343 | | | | 5.681 | % | | | 10/20/34 | | | $ | 905,239 | |
| | | Structured Adjustable Rate Mortgage Loan Series 2004-19, Class 2A2 |
| | | | 254,391 | | | | 7.189 | | | | 01/25/35 | | | | 257,730 | |
| | | Structured Adjustable Rate Mortgage Loan Series 2004-6, Class 3A2 |
| | | | 1,367,405 | | | | 4.713 | | | | 06/25/34 | | | | 1,369,345 | |
| | | Structured Asset Securities Corp. Series 2003-34A, Class 3A3 |
| | | | 82,001 | | | | 4.700 | | | | 11/25/33 | | | | 82,478 | |
| | | Structured Asset Securities Corp. Series 2003-37A, Class 3A7 |
| | | | 305,724 | | | | 4.520 | | | | 12/25/33 | | | | 306,410 | |
| | | WAMU Mortgage Pass-Through Certificates Series 2006-AR7, Class A1A |
| | | | 2,467,331 | | | | 5.934 | | | | 09/25/46 | | | | 2,470,030 | |
| | | WAMU Mortgage Pass-Through Certificates Series 2006-AR19, Class 1A |
| | | | 920,118 | | | | 5.754 | | | | 01/25/47 | | | | 918,968 | |
| | | Wells Fargo Mortgage Backed Securities Trust Series 2005-AR16, Class 1A1 |
| | | | 2,619,907 | | | | 4.975 | | | | 10/25/35 | | | | 2,622,713 | |
| | | WMALT Mortgage Pass-Through Certificates Series 2006-AR13, Class 1A |
| | | | 2,682,527 | | | | 5.894 | | | | 10/25/46 | | | | 2,684,204 | |
| | | WMALT Mortgage Pass-Through Certificates Series 2006-AR9, Class 2A |
| | | | 3,838,340 | | | | 5.854 | | | | 11/25/46 | | | | 3,837,740 | |
| | | | | | | | | | | | | | | | | |
| | | | | | | | | | | | | | | | 50,538,527 | |
| | | |
| | | Commercial Mortgage Backed Securities – 8.4% |
| | | Interest Only(a)(b)(c) – 0.1% |
| | | Bear Stearns Commercial Mortgage Securities, Inc. Series 2003-T10, Class X2 |
| | | | 5,008,675 | | | | 1.422 | | | | 03/13/40 | | | | 191,861 | |
| | | JPMorgan Chase Commercial Mortgage Securities Corp. Series 2004-C1, Class X2 |
| | | | 5,335,592 | | | | 1.157 | | | | 01/15/38 | | | | 155,239 | |
| | | Prudential Commercial Mortgage Trust Series 2003-PWR1, Class X2 |
| | | | 5,448,382 | | | | 1.625 | | | | 02/11/36 | | | | 242,334 | |
| | | | | | | | | | | | | | | | | |
| | | | | | | | | | | | | | | | 589,434 | |
| | | |
| | | Sequential Fixed Rate – 8.3% |
| | | Banc of America Commercial Mortgage, Inc. Series 2005-5, Class A4(a) |
| | | | 4,000,000 | | | | 5.115 | | | | 10/10/45 | | | | 3,939,607 | |
| | | Banc of America Commercial Mortgage, Inc. Series 2005-6, Class A4(a) |
| | | | 5,000,000 | | | | 5.353 | | | | 09/10/47 | | | | 4,971,231 | |
| | | Banc of America Commercial Mortgage, Inc. Series 2006-4, Class A4, |
| | | | 1,000,000 | | | | 5.634 | | | | 07/10/46 | | | | 1,018,558 | |
| | | Bear Stearns Commercial Mortgage Securities, Inc. Series 2005-PW10, Class A4(a) |
| | | | 5,000,000 | | | | 5.405 | | | | 12/11/40 | | | | 5,024,252 | |
| | | CS First Boston Mortgage Securities Corp. Series 1997-C2, Class A3 |
| | | | 199,961 | | | | 6.550 | | | | 01/17/35 | | | | 200,448 | |
| | | GE Capital Commercial Mortgage Corp. Series 2005-C4, Class A4(a) |
| | | | 5,000,000 | | | | 5.512 | | | | 11/10/45 | | | | 5,023,121 | |
| | | LB-UBS Commercial Mortgage Trust Series 2002-C1, Class A2 |
| | | | 131,350 | | | | 5.969 | | | | 03/15/26 | | | | 131,776 | |
| | | LB-UBS Commercial Mortgage Trust Series 2005-C5, Class A4 |
| | | | 2,000,000 | | | | 4.954 | | | | 09/15/30 | | | | 1,953,691 | |
| | | LB-UBS Commercial Mortgage Trust Series 2005-C7, Class A4(a) |
| | | | 2,000,000 | | | | 5.197 | | | | 11/15/30 | | | | 1,983,193 | |
| | | LB-UBS Commercial Mortgage Trust Series 2006-C1, Class A4 |
| | | | 3,500,000 | | | | 5.156 | | | | 02/15/31 | | | | 3,457,058 | |
| | | Wachovia Bank Commercial Mortgage Trust Series 2005-C21, Class A4(a) |
| | | | 4,000,000 | | | | 5.371 | | | | 10/15/44 | | | | 3,981,081 | |
| | | | | | | | | | | | | | | | | |
| | | | | | | | | | | | | | | | 31,684,016 | |
| | | |
| | | TOTAL COMMERCIAL MORTGAGE BACKED |
| | | SECURITIES | | | 32,273,450 | |
| | | |
| | | Collateralized Mortgage Obligations – 3.9% |
| | | Interest Only(b) – 0.1% |
| | | ABN AMRO Mortgage Corp. Series 2003-5, Class A2 |
| | | | 59,156 | | | | 5.500 | | | | 04/25/33 | | | | 5,222 | |
| | | ABN AMRO Mortgage Corp. Series 2003-8, Class A2 |
| | | | 383,938 | | | | 5.500 | | | | 06/25/33 | | | | 39,012 | |
| | | Countrywide Home Loan Trust Series 2003-42, Class 2X1(a) |
| | | | 579,247 | | | | 0.362 | | | | 10/25/33 | | | | 2,304 | |
| | | CS First Boston Mortgage Securities Corp. Series 2002-AR31, Class 5X(a) |
| | | | 176,810 | | | | 0.000 | | | | 11/25/32 | | | | 106 | |
| | | CS First Boston Mortgage Securities Corp. Series 2003-08, Class 3A2 |
| | | | 5,794 | | | | 5.500 | | | | 04/25/33 | | | | 227 | |
| | | CS First Boston Mortgage Securities Corp. Series 2003-10, Class 3A13 |
| | | | 5,063 | | | | 5.750 | | | | 05/25/33 | | | | 146 | |
| | | CS First Boston Mortgage Securities Corp. Series 2003-11, Class 1A2 |
| | | | 24,580 | | | | 5.500 | | | | 06/25/33 | | | | 1,217 | |
| | | CS First Boston Mortgage Securities Corp. Series 2003-19, Class 1A2 |
| | | | 462,843 | | | | 5.250 | | | | 07/25/33 | | | | 58,196 | |
| | | FHLMC Series 2575, Class IB |
| | | | 240,880 | | | | 5.500 | | | | 08/15/30 | | | | 20,704 | |
| | | FNMA Series 2004-47, Class EI(a)(e) |
| | | | 1,576,021 | | | | 0.000 | | | | 06/25/34 | | | | 66,504 | |
| | | FNMA Series 2004-62, Class DI(a)(e) |
| | | | 694,226 | | | | 0.000 | | | | 07/25/33 | | | | 29,625 | |
The accompanying notes are an integral part of these financial statements.
30
GOLDMAN SACHS U.S. MORTGAGES FUND
| | | | | | | | | | | | | | | | | |
| | | Principal | | Interest | | Maturity | | |
| | | Amount | | Rate | | Date | | Value |
| | |
Mortgage-Backed Obligations – (continued) |
| |
| | | Interest Only(b) – (continued) |
| | | FNMA Series E, Class E2 |
| | | $ | 1,037 | | | | 5.060 | % | | | 09/01/10 | | | $ | 7,109 | |
| | | Master Adjustable Rate Mortgages Trust Series 2003-2, Class 3AX(a) |
| | | | 62,782 | | | | 0.679 | | | | 08/25/33 | | | | 467 | |
| | | Master Adjustable Rate Mortgages Trust Series 2003-2, Class 4AX(a) |
| | | | 16,400 | | | | 1.158 | | | | 07/25/33 | | | | 242 | |
| | | WAMU Mortgage Pass-Through Certificates Series 2003-AR04, Class X1(a) |
| | | | 362,971 | | | | 1.181 | | | | 01/25/08 | | | | 2,973 | |
| | | WAMU Mortgage Pass-Through Certificates Series 2003-AR12, Class X(a) |
| | | | 920,199 | | | | 0.485 | | | | 02/25/34 | | | | 5,252 | |
| | | WAMU Mortgage Pass-Through Certificates Series 2003-S3, Class 1A41 |
| | | | 302,915 | | | | 5.500 | | | | 06/25/33 | | | | 25,704 | |
| | | | | | | | | | | | | | | | | |
| | | | | | | | | | | | | | | | 265,010 | |
| | | |
| | | Inverse Floaters(a) – 0.0% |
| | | FHLMC Series 1544, Class M |
| | | | 6,800 | | | | 11.674 | | | | 07/15/08 | | | | 6,866 | |
| | | FNMA Series 1993-072, Class SA |
| | | | 1,531 | | | | 8.792 | | | | 05/25/08 | | | | 1,549 | |
| | | FNMA Series 1993-093, Class SA |
| | | | 2,972 | | | | 11.713 | | | | 05/25/08 | | | | 3,040 | |
| | | FNMA Series 1993-095, Class SE |
| | | | 4,874 | | | | 11.976 | | | | 06/25/08 | | | | 4,976 | |
| | | FNMA Series 1993-135, Class S |
| | | | 14,036 | | | | 6.500 | | | | 07/25/08 | | | | 14,302 | |
| | | GNMA Series 2001-48, Class SA |
| | | | 30,088 | | | | 9.198 | | | | 10/16/31 | | | | 33,298 | |
| | | GNMA Series 2001-51, Class SB |
| | | | 30,013 | | | | 9.198 | | | | 10/16/31 | | | | 33,475 | |
| | | GNMA Series 2001-59, Class SA |
| | | | 45,095 | | | | 9.035 | | | | 11/16/24 | | | | 49,497 | |
| | | | | | | | | | | | | | | | | |
| | | | | | | | | | | | | | | | 147,003 | |
| | | |
| | | Planned Amortization Class – 1.3% |
| | | FNMA REMIC Series 1993-63, Class PK |
| | | | 15,632 | | | | 6.500 | | | | 05/25/08 | | | | 15,650 | |
| | | FNMA Series 2003-88, Class TH |
| | | | 5,000,000 | | | | 4.500 | | | | 09/25/18 | | | | 4,783,771 | |
| | | | | | | | | | | | | | | | | |
| | | | | | | | | | | | | | | | 4,799,421 | |
| | | |
| | | Sequential Fixed Rate – 2.5% |
| | | CS First Boston Mortgage Securities Corp. Series 2002-5, Class PPA1 |
| | | | 158,281 | | | | 6.500 | | | | 03/25/32 | | | | 157,009 | |
| | | FHLMC Series 1703, Class GC |
| | | | 2,049,244 | | | | 6.500 | | | | 04/15/09 | | | | 2,052,312 | |
| | | FHLMC Series 1823, Class A |
| | | | 947,520 | | | | 6.500 | | | | 08/15/23 | | | | 951,455 | |
| | | FHLMC Series 2042, Class N |
| | | | 861,023 | | | | 6.500 | | | | 03/15/28 | | | | 879,350 | |
| | | FHLMC Series 2458, Class OD |
| | | | 87,430 | | | | 6.000 | | | | 04/15/16 | | | | 87,457 | |
| | | FHLMC Series 2590, Class NV |
| | | | 1,000,000 | | | | 5.000 | | | | 03/15/18 | | | | 990,149 | |
| | | FNMA REMIC Trust Series 1993-101, Class PJ |
| | | | 179,744 | | | | 7.000 | | | | 06/25/08 | | | | 180,263 | |
| | | FNMA REMIC Trust Series 2002-24, Class AE |
| | | | 235,178 | | | | 6.000 | | | | 04/25/16 | | | | 234,536 | |
| | | FNMA Series 1993-76, Class PJ |
| | | | 46,046 | | | | 6.000 | | | | 06/25/08 | | | | 46,028 | |
| | | FNMA Series 1994-42, Class K |
| | | | 2,851,320 | | | | 6.500 | | | | 04/25/24 | | | | 2,928,790 | |
| | | FNMA Series 2000-16, Class ZG |
| | | | 1,159,789 | | | | 8.500 | | | | 06/25/30 | | | | 1,237,718 | |
| | | | | | | | | | | | | | | | | |
| | | | | | | | | | | | | | | | 9,745,067 | |
| | | |
| | | TOTAL COLLATERALIZED MORTGAGE |
| | | OBLIGATIONS | | | 14,956,501 | |
| | | |
| | | FHLMC – 19.5% |
| | | | 268,937 | | | | 5.000 | | | | 12/01/12 | | | | 266,083 | |
| | | | 45,157 | | | | 4.000 | | | | 02/01/14 | | | | 42,766 | |
| | | | 713,055 | | | | 4.000 | | | | 03/01/14 | | | | 675,307 | |
| | | | 138,494 | | | | 4.000 | | | | 04/01/14 | | | | 131,163 | |
| | | | 154,178 | | | | 4.000 | | | | 05/01/14 | | | | 149,644 | |
| | | | 27,143 | | | | 7.000 | | | | 04/01/15 | | | | 27,739 | |
| | | | 24,877 | | | | 7.000 | | | | 02/01/16 | | | | 25,726 | |
| | | | 109,364 | | | | 6.000 | | | | 03/01/16 | | | | 110,812 | |
| | | | 424,653 | | | | 4.500 | | | | 05/01/18 | | | | 412,669 | |
| | | | 3,061,491 | | | | 5.000 | | | | 05/01/18 | | | | 3,025,832 | |
| | | | 100,375 | | | | 4.500 | | | | 06/01/18 | | | | 97,542 | |
| | | | 820,511 | | | | 4.000 | | | | 08/01/18 | | | | 779,439 | |
| | | | 17,199 | | | | 4.500 | | | | 08/01/18 | | | | 16,702 | |
| | | | 401,106 | | | | 4.500 | | | | 09/01/18 | | | | 389,785 | |
| | | | 294,266 | | | | 4.500 | | | | 10/01/18 | | | | 285,960 | |
| | | | 749,396 | | | | 4.500 | | | | 11/01/18 | | | | 728,245 | |
| | | | 16,573,259 | | | | 4.500 | | | | 12/01/18 | | | | 16,105,264 | |
| | | | 7,551,601 | | | | 5.000 | | | | 12/01/18 | | | | 7,466,796 | |
| | | | 486,181 | | | | 4.500 | | | | 01/01/19 | | | | 472,201 | |
| | | | 755,964 | | | | 5.000 | | | | 01/01/19 | | | | 747,159 | |
| | | | 1,984,599 | | | | 4.500 | | | | 02/01/19 | | | | 1,927,081 | |
| | | | 904,939 | | | | 5.000 | | | | 02/01/19 | | | | 893,726 | |
| | | | 2,103,485 | | | | 4.500 | | | | 03/01/19 | | | | 2,041,103 | |
| | | | 735,158 | | | | 4.000 | | | | 04/01/19 | | | | 695,798 | |
| | | | 41,526 | | | | 4.500 | | | | 04/01/19 | | | | 40,286 | |
| | | | 104,973 | | | �� | 5.000 | | | | 04/01/19 | | | | 103,639 | |
| | | | 4,512,082 | | | | 4.500 | | | | 06/01/19 | | | | 4,384,737 | |
| | | | 650,340 | | | | 5.000 | | | | 06/01/19 | | | | 642,077 | |
| | | | 39,567 | | | | 4.500 | | | | 11/01/19 | | | | 38,386 | |
| | | | 1,859,760 | | | | 4.500 | | | | 02/01/20 | | | | 1,804,965 | |
| | | | 5,913,548 | | | | 4.500 | | | | 08/01/20 | | | | 5,742,600 | |
| | | | 954,371 | | | | 4.500 | | | | 10/01/20 | | | | 926,782 | |
| | | | 5,361,463 | | | | 5.500 | | | | 05/01/21 | | | | 5,368,907 | |
| | | | 3,475,592 | | | | 4.500 | | | | 08/01/23 | | | | 3,311,429 | |
| | | | 61,791 | | | | 7.500 | | | | 03/01/27 | | | | 64,404 | |
| | | | 2,780,501 | | | | 6.500 | | | | 01/01/29 | | | | 2,871,410 | |
The accompanying notes are an integral part of these financial statements.
31
GOLDMAN SACHS U.S. MORTGAGES FUND
Schedule of Investments (continued)
April 30, 2007 (Unaudited)
| | | | | | | | | | | | | | | | | |
| | | Principal | | Interest | | Maturity | | |
| | | Amount | | Rate | | Date | | Value |
| | |
Mortgage-Backed Obligations – (continued) |
| |
| | | FHLMC – (continued) |
| | | $ | 994,576 | | | | 6.500 | % | | | 04/01/29 | | | $ | 1,027,066 | |
| | | | 495,068 | | | | 6.500 | | | | 12/01/29 | | | | 511,540 | |
| | | | 422,812 | | | | 7.000 | | | | 04/01/31 | | | | 440,372 | |
| | | | 3,347,621 | | | | 7.000 | | | | 09/01/31 | | | | 3,486,646 | |
| | | | 1,629,925 | | | | 7.000 | | | | 04/01/32 | | | | 1,692,321 | |
| | | | 2,939,306 | | | | 7.000 | | | | 05/01/32 | | | | 3,051,827 | |
| | | | 1,067,485 | | | | 6.000 | | | | 05/01/33 | | | | 1,081,741 | |
| | | | 456,235 | | | | 6.500 | | | | 08/01/33 | | | | 470,319 | |
| | | | | | | | | | | | | | | | | |
| | | | | | | | | | | | | | | | 74,575,996 | |
| | | |
| | | FNMA – 39.5% |
| | | | 102,170 | | | | 4.000 | | | | 06/01/13 | | | | 99,289 | |
| | | | 136,210 | | | | 4.000 | | | | 07/01/13 | | | | 132,369 | |
| | | | 189,888 | | | | 4.000 | | | | 08/01/13 | | | | 184,494 | |
| | | | 360,116 | | | | 4.000 | | | | 09/01/13 | | | | 349,806 | |
| | | | 744,024 | | | | 4.000 | | | | 10/01/13 | | | | 722,543 | |
| | | | 555,692 | | | | 4.000 | | | | 04/01/14 | | | | 538,769 | |
| | | | 8,632 | | | | 5.500 | | | | 04/01/16 | | | | 8,673 | |
| | | | 8,988 | | | | 5.500 | | | | 08/01/16 | | | | 9,030 | |
| | | | 110,689 | | | | 5.500 | | | | 11/01/16 | | | | 111,206 | |
| | | | 91,981 | | | | 5.500 | | | | 12/01/16 | | | | 92,409 | |
| | | | 131,939 | | | | 5.500 | | | | 01/01/17 | | | | 132,555 | |
| | | | 15,445,079 | | | | 5.000 | | | | 10/01/17 | | | | 15,272,630 | |
| | | | 3,858,040 | | | | 5.000 | | | | 11/01/17 | | | | 3,815,002 | |
| | | | 12,515,658 | | | | 5.000 | | | | 12/01/17 | | | | 12,376,088 | |
| | | | 264,756 | | | | 4.500 | | | | 01/01/18 | | | | 257,184 | |
| | | | 5,509,650 | | | | 5.000 | | | | 01/01/18 | | | | 5,448,334 | |
| | | | 3,811,787 | | | | 5.000 | | | | 02/01/18 | | | | 3,767,389 | |
| | | | 6,967 | | | | 6.000 | | | | 02/01/18 | | | | 7,046 | |
| | | | 513,425 | | | | 4.500 | | | | 03/01/18 | | | | 498,436 | |
| | | | 9,738,338 | | | | 5.000 | | | | 03/01/18 | | | | 9,624,776 | |
| | | | 726,762 | | | | 4.500 | | | | 04/01/18 | | | | 705,630 | |
| | | | 5,641,192 | | | | 5.000 | | | | 04/01/18 | | | | 5,575,517 | |
| | | | 2,696,421 | | | | 4.500 | | | | 05/01/18 | | | | 2,618,536 | |
| | | | 5,182,463 | | | | 5.000 | | | | 05/01/18 | | | | 5,122,130 | |
| | | | 80,029 | | | | 6.000 | | | | 05/01/18 | | | | 80,931 | |
| | | | 9,737,155 | | | | 4.500 | | | | 06/01/18 | | | | 9,453,846 | |
| | | | 7,161,511 | | | | 5.000 | | | | 06/01/18 | | | | 7,078,015 | |
| | | | 2,157,172 | | | | 4.500 | | | | 07/01/18 | | | | 2,094,909 | |
| | | | 1,804,211 | | | | 5.000 | | | | 07/01/18 | | | | 1,783,178 | |
| | | | 4,380,761 | | | | 4.000 | | | | 08/01/18 | | | | 4,159,622 | |
| | | | 1,318,645 | | | | 4.500 | | | | 08/01/18 | | | | 1,280,474 | |
| | | | 485,731 | | | | 5.000 | | | | 08/01/18 | | | | 480,062 | |
| | | | 658,099 | | | | 5.000 | | | | 09/01/18 | | | | 650,419 | |
| | | | 1,544,237 | | | | 5.000 | | | | 10/01/18 | | | | 1,526,215 | |
| | | | 9,167,779 | | | | 5.000 | | | | 11/01/18 | | | | 9,061,318 | |
| | | | 444,551 | | | | 6.000 | | | | 11/01/18 | | | | 449,557 | |
| | | | 729,999 | | | | 7.000 | | | | 11/01/18 | | | | 753,197 | |
| | | | 655,618 | | | | 4.000 | | | | 12/01/18 | | | | 622,523 | |
| | | | 58,900 | | | | 4.500 | | | | 12/01/18 | | | | 57,200 | |
| | | | 5,474,979 | | | | 5.000 | | | | 12/01/18 | | | | 5,411,081 | |
| | | | 1,608,976 | | | | 5.500 | | | | 12/01/18 | | | | 1,615,270 | |
| | | | 822,046 | | | | 6.000 | | | | 12/01/18 | | | | 831,301 | |
| | | | 261,453 | | | | 5.000 | | | | 01/01/19 | | | | 258,401 | |
| | | | 657,656 | | | | 6.000 | | | | 01/01/19 | | | | 665,061 | |
| | | | 377,046 | | | | 5.000 | | | | 02/01/19 | | | | 372,465 | |
| | | | 5,209,695 | | | | 5.000 | | | | 04/01/19 | | | | 5,149,060 | |
| | | | 238,746 | | | | 6.000 | | | | 04/01/19 | | | | 242,197 | |
| | | | 307,198 | | | | 4.000 | | | | 05/01/19 | | | | 290,754 | |
| | | | 48,238 | | | | 6.000 | | | | 05/01/19 | | | | 49,159 | |
| | | | 1,040,492 | | | | 5.000 | | | | 06/01/19 | | | | 1,028,348 | |
| | | | 99,151 | | | | 5.500 | | | | 07/01/19 | | | | 99,420 | |
| | | | 8,743,340 | | | | 5.000 | | | | 08/01/19 | | | | 8,632,236 | |
| | | | 265,330 | | | | 5.500 | | | | 08/01/19 | | | | 266,049 | |
| | | | 132,895 | | | | 5.000 | | | | 09/01/19 | | | | 131,344 | |
| | | | 121,106 | | | | 5.500 | | | | 09/01/19 | | | | 121,434 | |
| | | | 1,521,101 | | | | 4.000 | | | | 10/01/19 | | | | 1,439,677 | |
| | | | 259,308 | | | | 5.500 | | | | 10/01/19 | | | | 260,011 | |
| | | | 3,220,467 | | | | 4.500 | | | | 11/01/19 | | | | 3,123,246 | |
| | | | 79,880 | | | | 5.500 | | | | 11/01/19 | | | | 80,097 | |
| | | | 55,260 | | | | 5.500 | | | | 12/01/19 | | | | 55,410 | |
| | | | 167,732 | | | | 7.000 | | | | 09/01/21 | | | | 175,999 | |
| | | | 481,323 | | | | 7.000 | | | | 06/01/22 | | | | 504,873 | |
| | | | 232,800 | | | | 7.000 | | | | 07/01/22 | | | | 244,190 | |
| | | | 73,747 | | | | 6.500 | | | | 01/01/29 | | | | 76,140 | |
| | | | 137,053 | | | | 6.500 | | | | 04/01/29 | | | | 141,418 | |
| | | | 106,524 | | | | 6.500 | | | | 05/01/29 | | | | 109,916 | |
| | | | 1,002,534 | | | | 6.500 | | | | 06/01/29 | | | | 1,034,462 | |
| | | | 549,387 | | | | 6.500 | | | | 07/01/29 | | | | 566,881 | |
| | | | 67,588 | | | | 6.500 | | | | 09/01/29 | | | | 69,740 | |
| | | | 131,528 | | | | 7.000 | | | | 08/01/31 | | | | 135,591 | |
| | | | 8,173 | | | | 6.500 | | | | 08/01/32 | | | | 8,417 | |
| | | | 338,622 | | | | 6.500 | | | | 11/01/32 | | | | 348,758 | |
| | | | 251,916 | | | | 6.000 | | | | 01/01/33 | | | | 255,290 | |
| | | | 5,429 | | | | 6.000 | | | | 02/01/33 | | | | 5,501 | |
| | | | 151,505 | | | | 6.000 | | | | 06/01/33 | | | | 153,393 | |
| | | | 51,494 | | | | 6.000 | | | | 07/01/33 | | | | 52,135 | |
| | | | 123,631 | | | | 6.000 | | | | 09/01/33 | | | | 125,172 | |
| | | | 34,539 | | | | 6.000 | | | | 10/01/33 | | | | 34,969 | |
| | | | 265,185 | | | | 5.500 | | | | 07/01/34 | | | | 262,778 | |
| | | | 73,035 | | | | 6.000 | | | | 11/01/34 | | | | 73,809 | |
| | | | 2,134,320 | | | | 6.000 | | | | 12/01/34 | | | | 2,156,942 | |
| | | | 3,374,217 | | | | 7.500 | | | | 05/01/36 | | | | 3,498,543 | |
| | | | 894,178 | | | | 7.500 | | | | 08/01/36 | | | | 927,125 | |
| | | | 2,448,733 | | | | 7.500 | | | | 09/01/36 | | | | 2,538,960 | |
| | | | 515,335 | | | | 7.500 | | | | 12/01/36 | | | | 534,323 | |
| | | | | | | | | | | | | | | | | |
| | | | | | | | | | | | | | | | 151,158,653 | |
| | | |
| | | GNMA – 0.0% |
| | | | 1,071 | | | | 6.000 | | | | 12/15/23 | | | | 1,086 | |
| | | | 33,524 | | | | 6.000 | | | | 03/15/26 | | | | 34,119 | |
| | | | 41,323 | | | | 6.000 | | | | 04/15/26 | | | | 42,056 | |
| | | | | | | | | | | | | | | | | |
| | | | | | | | | | | | | | | | 77,261 | |
| | | |
| | | TOTAL MORTGAGE-BACKED OBLIGATIONS |
| | | (Cost $346,370,632) | | $ | 345,507,988 | |
| | | |
The accompanying notes are an integral part of these financial statements.
32
GOLDMAN SACHS U.S. MORTGAGES FUND
| | | | | | | | | | | | | | | | | |
| | | Principal | | Interest | | Maturity | | |
| | | Amount | | Rate | | Date | | Value |
| | |
Agency Debenture – 0.7% |
| |
| | | Tennessee Valley Authority |
| | | $ | 2,800,000 | | | | 5.375 | % | | | 04/01/56 | | | $ | 2,833,908 | |
| | | (Cost $2,791,657) | | | | |
| | | |
| | |
Asset-Backed Securities(a) – 1.8% |
| |
| | | Home Equity – 1.8% |
| | | ContiMortgage Home Equity Loan Trust Series 1999-1, Class A7 |
| | | | 20,378 | | | | 6.970 | | | | 12/25/13 | | | | 20,302 | |
| | | Countrywide Home Equity Loan Trust Series 2002-E, Class A |
| | | | 88,813 | | | | 5.580 | | | | 10/15/28 | | | | 88,813 | |
| | | Countrywide Home Equity Loan Trust Series 2003-A, Class A |
| | | | 1,190,822 | | | | 5.670 | | | | 03/15/29 | | | | 1,192,716 | |
| | | Countrywide Home Equity Loan Trust Series 2003-D, Class A |
| | | | 362,025 | | | | 5.580 | | | | 06/15/29 | | | | 362,385 | |
| | | Countrywide Home Equity Loan Trust Series 2004-G, Class 2A |
| | | | 181,985 | | | | 5.540 | | | | 12/15/29 | | | | 182,213 | |
| | | Countrywide Home Equity Loan Trust Series 2004-I, Class A |
| | | | 1,178,098 | | | | 5.610 | | | | 02/15/34 | | | | 1,177,916 | |
| | | Countrywide Home Equity Loan Trust Series 2004-J, Class 2A |
| | | | 118,817 | | | | 5.610 | | | | 12/15/33 | | | | 118,780 | |
| | | Countrywide Home Equity Loan Trust Series 2004-O, Class 1A |
| | | | 458,068 | | | | 5.600 | | | | 02/15/34 | | | | 458,715 | |
| | | Countrywide Home Equity Loan Trust Series 2004-Q, Class 2A |
| | | | 399,373 | | | | 5.620 | | | | 12/15/33 | | | | 400,048 | |
| | | Countrywide Home Equity Loan Trust Series 2004-S, Class 1A |
| | | | 193,203 | | | | 5.560 | | | | 02/15/30 | | | | 193,356 | |
| | | Countrywide Home Equity Loan Trust Series 2005-A, Class 2A |
| | | | 741,302 | | | | 5.560 | | | | 04/15/35 | | | | 740,955 | |
| | | Master Asset Backed Securities Trust Series 2005-WMC1, Class A4 |
| | | | 568,382 | | | | 5.510 | | | | 03/25/35 | | | | 568,462 | |
| | | Morgan Stanley ABS Capital I Series 2004-HE1, Class A4 |
| | | | 548,071 | | | | 5.690 | | | | 01/25/34 | | | | 549,052 | |
| | | Popular Asset Backed Securities Mortgage Pass-Through Trust Series 2004-5, Class AV2 |
| | | | 170,748 | | | | 5.660 | | | | 12/25/34 | | | | 171,042 | |
| | | Residential Asset Mortgage Products, Inc. Series 2004-RZ1, Class AII |
| | | | 278,120 | | | | 5.560 | | | | 03/25/34 | | | | 278,447 | |
| | | Residential Funding Mortgage Securities, Inc. Series 2004-HS2, Class AII |
| | | | 352,527 | | | | 5.550 | | | �� | 06/25/29 | | | | 352,712 | |
| | | | | | | | | | | | | | | | | |
| | | | | | | | | | | | | | | | 6,855,914 | |
| | | |
| | | TOTAL ASSET-BACKED SECURITIES |
| | | (Cost $6,853,127) | | $ | 6,855,914 | |
| | | |
| | |
U.S. Treasury Obligations – 1.1% |
| |
| | | United States Treasury Inflation Protected Securities |
| | | $ | 1,187,340 | | | | 2.000 | % | | | 07/15/14 | | | $ | 1,178,079 | |
| | | | 431,760 | | | | 2.375 | | | | 01/15/25 | | | | 434,036 | |
| | | | 807,136 | | | | 2.375 | | | | 01/15/27 | | | | 813,095 | |
| | | United States Treasury Principal-Only STRIPS(d) |
| | | | 4,000,000 | | | | 0.000 | | | | 11/15/21 | | | | 1,962,400 | |
| | | |
| | | TOTAL U.S. TREASURY OBLIGATIONS |
| | | (Cost $4,349,368) | | | 4,387,610 | |
| | | |
| | | TOTAL INVESTMENTS BEFORE REPURCHASE AGREEMENT – 93.8% |
| | | (Cost $360,364,784) | | $ | 359,585,420 | |
| | | |
| | |
Repurchase Agreement(f) – 7.1% |
| |
| | | Joint Repurchase Agreement Account II |
| | | $ | 27,100,000 | | | | 5.242 | % | | | 05/01/07 | | | $ | 27,100,000 | |
| | | Maturity Value: $27,103,946 |
| | | (Cost $27,100,000) | | | | |
| | | |
| | | TOTAL INVESTMENTS – 100.9% |
| | | (Cost $387,464,784) | | $ | 386,685,420 | |
| | | |
| | | LIABILITIES IN EXCESS OF OTHER ASSETS – (0.9)% | | | (3,633,588 | ) |
| | | |
| | | NET ASSETS – 100.0% | | $ | 383,051,832 | |
| | | |
| |
| | The percentage shown for each investment category reflects the value of investments in that category as a percentage of net assets. |
| |
| (a) | Variable rate security. Interest rate disclosed is that which is in effect at April 30, 2007. |
| |
| (b) | Represents security with notional principal amount. The actual effective yield of this security is different than the stated interest rate. |
| |
| (c) | Securities are exempt from registration under rule 144A of the Securities Act of 1933. Under procedures approved by the Board of Trustees, such securities have been determined to be liquid by the Investment Adviser and may be resold, normally to qualified institutional buyers in transactions exempt from registration. Total market value of Rule 144A securities amounted to $589,434, which represents approximately 0.2% of net assets as of April 30, 2007. |
| |
| (d) | Security issued with a zero coupon. Income is recognized through the accretion of discount. |
| |
| (e) | Security is issued with zero coupon and interest rate is contingent upon LIBOR reaching a predetermined level. |
| |
| (f) | Joint repurchase agreement was entered into on April 30, 2007. Additional information appears on page 63. |
| | | | | | | |
| | | |
| | | Investment Abbreviations: |
| | | FHLMC | | — | | Federal Home Loan Mortgage Corp. |
| | | FNMA | | — | | Federal National Mortgage Association |
| | | GNMA | | — | | Government National Mortgage Association |
| | | LIBOR | | — | | London Interbank Offered Rate |
| | | REMIC | | — | | Real Estate Mortgage Investment Conduit |
| | | STRIPS | | — | | Separate Trading of Registered Interest and Principal of Securities |
| | | |
The accompanying notes are an integral part of these financial statements.
33
GOLDMAN SACHS U.S. MORTGAGES FUND
Schedule of Investments (continued)
April 30, 2007 (Unaudited)
| ADDITIONAL INVESTMENT INFORMATION |
FUTURES CONTRACTS — At April 30, 2007, the following futures contracts were open:
| | | | | | | | | | | | | | | |
| | | Number of | | | | | | |
| | | Contracts | | Settlement | | Market | | Unrealized |
| Type | | Long (Short) | | Month | | Value | | Gain (Loss) |
| |
| Eurodollars | | | 138 | | | June 2007 | | $ | 32,662,875 | | | $ | (38,692 | ) |
| Eurodollars | | | 35 | | | September 2007 | | | 8,295,000 | | | | (16,956 | ) |
| Eurodollars | | | 36 | | | March 2008 | | | 8,566,650 | | | | 9,778 | |
| Eurodollars | | | 22 | | | June 2008 | | | 5,242,600 | | | | 13,950 | |
| U.S. Treasury Bonds | | | 90 | | | June 2007 | | | 10,057,500 | | | | 41,557 | |
| 2 Year U.S. Treasury Notes | | | (29 | ) | | June 2007 | | | (5,936,844 | ) | | | 4,932 | |
| 5 Year U.S. Treasury Notes | | | (60 | ) | | June 2007 | | | (6,349,687 | ) | | | (20,030 | ) |
| 10 Year U.S. Treasury Notes | | | (328 | ) | | June 2007 | | | (35,531,625 | ) | | | 34,847 | |
| |
TOTAL | | | | | | | | $ | 17,006,469 | | | $ | 29,386 | |
| |
SWAP CONTRACTS — At April 30, 2007, the Fund had outstanding swap contracts with the following terms:
INTEREST RATE SWAP CONTRACTS
| | | | | | | | | | | | | | | | | | | |
| | | | | | | Rates Exchanged | | | | |
| | | | | | | | | | | |
| | | Notional | | | | Payments | | Payments | | Upfront Payments | | |
| | | Amount | | Termination | | received by | | made by | | made (received) | | Unrealized |
| Swap Counterparty | | (000s) | | Date | | the Fund | | the Fund | | by the Fund | | Loss |
| |
Banc of America Securities LLC | | $ | 12,000 | | | 09/02/10 | | 4.309% | | 3 month LIBOR | | $ | — | | | $ | (285,245 | ) |
| Banc of America Securities LLC | | | 15,000 | | | 10/06/10 | | 4.703 | | 3 month LIBOR | | | — | | | | (158,941 | ) |
| Banc of America Securities LLC | | | 11,000 | | | 05/23/12 | | 4.374 | | 3 month LIBOR | | | — | | | | (198,216 | ) |
| Banc of America Securities LLC (a) | | | 36,700 | | | 06/20/12 | | 5.000 | | 3 month LIBOR | | | 129,083 | | | | (88,328 | ) |
| Banc of America Securities LLC (a) | | | 28,600 | | | 06/20/12 | | 3 month LIBOR | | 5.000% | | | 151,078 | | | | (182,836 | ) |
| Bear Stearns & Co., Inc.(a) | | | 5,900 | | | 06/20/12 | | 3 month LIBOR | | 5.000 | | | 39,859 | | | | (46,411 | ) |
| Deutsche Bank Securities, Inc. (a) | | | 14,100 | | | 06/20/12 | | 3 month LIBOR | | 5.000 | | | 28,316 | | | | (43,974 | ) |
| Deutsche Bank Securities, Inc. (a) | | | 63,700 | | | 06/20/14 | | 5.100 | | 3 month LIBOR | | | 592,482 | | | | (421,001 | ) |
| Banc of America Securities LLC (a) | | | 16,000 | | | 06/20/14 | | 5.100 | | 3 month LIBOR | | | 41,652 | | | | (984 | ) |
| Banc of America Securities LLC (a) | | | 35,900 | | | 06/20/14 | | 3 month LIBOR | | 5.100 | | | (74,778 | ) | | | (16,472 | ) |
| JPMorgan Securities, Inc. | | | 10,000 | | | 03/07/16 | | 3 month LIBOR | | 5.183 | | | — | | | | (37,333 | ) |
| Banc of America Securities LLC (a) | | | 9,100 | | | 06/20/22 | | 5.250 | | 3 month LIBOR | | | (21,940 | ) | | | (24,234 | ) |
| |
TOTAL | | | | | | | | | | | | $ | 885,752 | | | $ | (1,503,975 | ) |
| |
| |
| (a) | Represents forward starting interest rate swaps whose effective dates of commencement of accruals and cash flows occur subsequent to April 30, 2007. |
LIBOR—London Interbank Offered Rate
The accompanying notes are an integral part of these financial statements.
34
GOLDMAN SACHS U.S. MORTGAGES FUND
| ADDITIONAL INVESTMENT INFORMATION (continued) |
TOTAL RETURN INDEX SWAP CONTRACTS
| | | | | | | | | | | | | | | |
| | | Notional | | | | | | | | Unrealized |
| | | Amount | | Termination | | Reference | | Payments | | Gain |
| Swap Counterparty | | (000s) | | Date | | Security | | to be Exchanged (a) | | (Loss) |
| |
| Banc of America Securities LLC | | $ | 7,000 | | | 05/02/07 | | Banc of America Securities LLC CMBS AAA 10Yr Index | | Monthly duration adjusted return | | $ | (3,207 | ) |
| JPMorgan Securities, Inc. | | | 11,000 | | | 05/31/07 | | Banc of America Securities LLC CMBS AAA 10Yr Index | | Monthly duration adjusted return | | | 670 | |
| Banc of America Securities LLC | | | 4,500 | | | 06/18/07 | | Banc of America Securities LLC CMBS AAA 10Yr Index | | Monthly duration adjusted return | | | (2,059 | ) |
| Banc of America Securities LLC | | | 4,000 | | | 07/02/07 | | Banc of America Securities LLC CMBS AAA 10Yr Index | | Monthly duration adjusted return | | | (1,660 | ) |
| Banc of America Securities LLC | | | 6,000 | | | 07/18/07 | | Banc of America Securities LLC CMBS AAA 10Yr Index | | Monthly duration adjusted return | | | (2,474 | ) |
| Banc of America Securities LLC | | | 18,000 | | | 08/01/07 | | Banc of America Securities LLC CMBS AAA 10Yr Index | | Monthly duration adjusted return | | | (8,130 | ) |
| JPMorgan Securities, Inc. | | | 1,500 | | | 08/31/07 | | Banc of America Securities LLC CMBS AAA 10Yr Index | | Monthly duration adjusted return | | | 700 | |
| Banc of America Securities LLC | | | 1,500 | | | 08/31/07 | | Banc of America Securities LLC CMBS AAA 10Yr Index | | Monthly duration adjusted return | | | 420 | |
| Deutsche Bank Securities,Inc. | | | 2,000 | | | 08/31/07 | | Banc of America Securities LLC CMBS AAA 10Yr Index | | Monthly duration adjusted return | | | 934 | |
| |
TOTAL | | | | | | | | | | | | $ | (14,806 | ) |
| |
| |
| (a) | Fund receives payments based on any positive monthly duration adjusted return of the underlying index. Fund makes payments on any such negative returns. |
The accompanying notes are an integral part of these financial statements.
35
GOLDMAN SACHS CORE FIXED INCOME FUND
Schedule of Investments
April 30, 2007 (Unaudited)
| | | | | | | | | | | | | | | | | |
| | | Principal | | Interest | | Maturity | | |
| | | Amount* | | Rate | | Date | | Value |
| | |
Corporate Bonds – 17.3% |
| |
| | | Aerospace/Defense – 0.1% |
| | | Boeing Capital Corp. |
| | | $ | 500,000 | | | | 5.800 | % | | | 01/15/13 | | | $ | 517,689 | |
| | | General Dynamics Corp. |
| | | | 750,000 | | | | 4.500 | | | | 08/15/10 | | | | 738,429 | |
| | | | | | | | | | | | | | | | | |
| | | | | | | | | | | | | | | | 1,256,118 | |
| | | |
| | | Automotive – 0.1% |
| | | General Motors Acceptance Corp. |
| | | | 2,900,000 | | | | 6.875 | | | | 09/15/11 | | | | 2,915,289 | |
| | | |
| | | Banks – 3.1% |
| | | ANZ Capital Trust I(a) |
| | | | 3,500,000 | | | | 5.360 | | | | 12/29/49 | | | | 3,444,374 | |
| | | Associates Corp. NA |
| | | | 500,000 | | | | 6.875 | | | | 11/15/08 | | | | 512,625 | |
| | | | 2,000,000 | | | | 8.550 | | | | 07/15/09 | | | | 2,144,690 | |
| | | Astoria Financial Corp. |
| | | | 4,600,000 | | | | 5.750 | | | | 10/15/12 | | | | 4,644,291 | |
| | | Bank of America Corp. |
| | | | 500,000 | | | | 5.375 | | | | 06/15/14 | | | | 502,574 | |
| | | Citigroup, Inc. |
| | | | 2,000,000 | | | | 7.250 | | | | 10/15/11 | | | | 2,161,848 | |
| | | Credit Suisse USA, Inc. |
| | | | 500,000 | | | | 4.625 | | | | 01/15/08 | | | | 497,422 | |
| | | Fleet Boston Financial Corp. |
| | | | 450,000 | | | | 7.375 | | | | 12/01/09 | | | | 474,670 | |
| | | Greater Bay Bancorp Series D |
| | | | 2,900,000 | | | | 5.125 | | | | 04/15/10 | | | | 2,886,999 | |
| | | GreenPoint Financial Corp. |
| | | | 2,400,000 | | | | 3.200 | | | | 06/06/08 | | | | 2,346,928 | |
| | | HBOS Capital Funding LP(a)(b) |
| | | | 4,325,000 | | | | 6.071 | | | | 06/27/49 | | | | 4,425,500 | |
| | | JPMorgan & Co., Inc. |
| | | | 20,000 | | | | 5.750 | | | | 10/15/08 | | | | 20,173 | |
| | | | 155,000 | | | | 6.000 | | | | 01/15/09 | | | | 156,997 | |
| | | JPMorgan Chase & Co. |
| | | | 4,065,000 | | | | 5.250 | | | | 05/30/07 | | | | 4,064,333 | |
| | | | 500,000 | | | | 5.750 | | | | 01/02/13 | | | | 511,928 | |
| | | | 500,000 | | | | 5.250 | | | | 05/01/15 | | | | 495,300 | |
| | | JPMorgan Chase Bank NA |
| | | | 395,000 | | | | 6.125 | | | | 11/01/08 | | | | 398,941 | |
| | | KeyBank NA |
| | | | 5,500,000 | | | | 5.000 | | | | 07/17/07 | | | | 5,492,635 | |
| | | Mizuho JGB Investment LLC(a)(b) |
| | | | 1,600,000 | | | | 9.870 | | | | 06/30/49 | | | | 1,679,064 | |
| | | MUFG Capital Finance 1 Ltd.(b) |
| | | | 5,250,000 | | | | 6.346 | | | | 07/25/49 | | | | 5,366,950 | |
| | | National Australia Bank Ltd. |
| | | | 2,000,000 | | | | 8.600 | | | | 05/19/10 | | | | 2,196,456 | |
| | | National City Bank |
| | | | 500,000 | | | | 4.500 | | | | 03/15/10 | | | | 492,300 | |
| | | Popular North America, Inc. |
| | | | 4,125,000 | | | | 5.200 | | | | 12/12/07 | | | | 4,118,841 | |
| | | Regions Financial Corp. |
| | | | 4,500,000 | | | | 7.000 | | | | 03/01/11 | | | | 4,777,425 | |
| | | Resona Bank Ltd.(a)(b) |
| | | | 3,500,000 | | | | 5.850 | | | | 04/15/49 | | | | 3,483,060 | |
| | | | EUR 2,675,000 | | | | 4.125 | | | | 09/27/49 | | | | 3,525,939 | |
| | | Sovereign Bank |
| | | $ | 1,000,000 | | | | 4.000 | | | | 02/01/08 | | | | 989,768 | |
| | | | 375,000 | | | | 5.125 | | | | 03/15/13 | | | | 368,069 | |
| | | | 2,550,000 | | | | 4.375 | (b) | | | 08/01/13 | | | | 2,514,881 | |
| | | U.S. Bancorp |
| | | | 750,000 | | | | 3.950 | | | | 08/23/07 | | | | 746,683 | |
| | | Union Planters Corp. |
| | | | 150,000 | | | | 7.750 | | | | 03/01/11 | | | | 162,894 | |
| | | Wachovia Bank NA |
| | | | 105,000 | | | | 5.800 | | | | 12/01/08 | | | | 105,916 | |
| | | | 5,000,000 | | | | 7.875 | | | | 02/15/10 | | | | 5,361,118 | |
| | | Washington Mutual Bank |
| | | | 1,000,000 | | | | 5.500 | | | | 01/15/13 | | | | 994,781 | |
| | | | 1,000,000 | | | | 5.650 | | | | 08/15/14 | | | | 994,237 | |
| | | Wells Fargo & Co. |
| | | | 500,000 | | | | 3.500 | | | | 04/04/08 | | | | 492,691 | |
| | | Wells Fargo Bank NA |
| | | | 1,000,000 | | | | 6.450 | | | | 02/01/11 | | | | 1,045,369 | |
| | | | | | | | | | | | | | | | | |
| | | | | | | | | | | | | | | | 74,598,670 | |
| | | |
| | | Brokerage – 0.4% |
| | | Bear Stearns Cos., Inc. |
| | | | 500,000 | | | | 4.500 | | | | 10/28/10 | | | | 489,850 | |
| | | FMR Corp.(a) |
| | | | 500,000 | | | | 4.750 | | | | 03/01/13 | | | | 489,915 | |
| | | Lehman Brothers Holdings, Inc. |
| | | | 4,500,000 | | | | 5.250 | | | | 02/06/12 | | | | 4,500,554 | |
| | | Morgan Stanley |
| | | | 500,000 | | | | 3.625 | | | | 04/01/08 | | | | 492,868 | |
| | | | 400,000 | | | | 4.250 | | | | 05/15/10 | | | | 390,521 | |
| | | | 3,000,000 | | | | 5.300 | | | | 03/01/13 | | | | 3,009,618 | |
| | | | | | | | | | | | | | | | | |
| | | | | | | | | | | | | | | | 9,373,326 | |
| | | |
| | | Captive Financial – 0.1% |
| | | HSBC Finance Corp. |
| | | | 500,000 | | | | 4.750 | | | | 07/15/13 | | | | 483,881 | |
| | | Nelnet, Inc. |
| | | | 2,580,000 | | | | 5.125 | | | | 06/01/10 | | | | 2,523,364 | |
| | | | | | | | | | | | | | | | | |
| | | | | | | | | | | | | | | | 3,007,245 | |
| | | |
| | | Diversified Manufacturing – 0.2% |
| | | General Electric Co. |
| | | | 1,300,000 | | | | 5.000 | | | | 02/01/13 | | | | 1,291,176 | |
| | | Tyco International Group Participation Certificate(a) |
| | | | 3,525,000 | | | | 4.436 | | | | 06/15/07 | | | | 3,520,312 | |
| | | | | | | | | | | | | | | | | |
| | | | | | | | | | | | | | | | 4,811,488 | |
| | | |
| | | Electric – 1.6% |
| | | Arizona Public Service Co. |
| | | | 2,590,000 | | | | 5.800 | | | | 06/30/14 | | | | 2,615,424 | |
| | | | 4,425,000 | | | | 6.250 | | | | 08/01/16 | | | | 4,571,848 | |
| | | CenterPoint Energy, Inc. Series B |
| | | | 550,000 | | | | 7.250 | | | | 09/01/10 | | | | 581,688 | |
The accompanying notes are an integral part of these financial statements.
36
GOLDMAN SACHS CORE FIXED INCOME FUND
| | | | | | | | | | | | | | | | | |
| | | Principal | | Interest | | Maturity | | |
| | | Amount* | | Rate | | Date | | Value |
| | |
Corporate Bonds – (continued) |
| |
| | | Electric – (continued) |
| | | FirstEnergy Corp. Series C |
| | | $ | 4,050,000 | | | | 7.375 | % | | | 11/15/31 | | | $ | 4,644,649 | |
| | | MidAmerican Energy Holdings Co. |
| | | | 1,500,000 | | | | 7.630 | | | | 10/15/07 | | | | 1,513,358 | |
| | | | 2,210,000 | | | | 7.520 | | | | 09/15/08 | | | | 2,273,757 | |
| | | | 6,125,000 | | | | 6.125 | | | | 04/01/36 | | | | 6,227,360 | |
| | | National Rural Utilities Cooperative Finance Corp. |
| | | | 950,000 | | | | 3.250 | | | | 10/01/07 | | | | 942,109 | |
| | | NiSource Finance Corp.(b) |
| | | | 5,000,000 | | | | 5.930 | | | | 11/23/09 | | | | 5,006,025 | |
| | | Progress Energy, Inc. |
| | | | 50,000 | | | | 5.625 | | | | 01/15/16 | | | | 50,505 | |
| | | | 3,000,000 | | | | 7.750 | | | | 03/01/31 | | | | 3,603,516 | |
| | | TXU Corp. Series O |
| | | | 5,250,000 | | | | 4.800 | | | | 11/15/09 | | | | 5,171,250 | |
| | | Union Electric Co. |
| | | | 500,000 | | | | 6.750 | | | | 05/01/08 | | | | 504,289 | |
| | | | | | | | | | | | | | | | | |
| | | | | | | | | | | | | | | | 37,705,778 | |
| | | |
| | | Energy – 0.5% |
| | | Canadian Natural Resources Ltd. |
| | | | 1,800,000 | | | | 5.700 | | | | 05/15/17 | | | | 1,805,409 | |
| | | | 450,000 | | | | 5.850 | | | | 02/01/35 | | | | 426,251 | |
| | | | 3,100,000 | | | | 6.500 | | | | 02/15/37 | | | | 3,194,371 | |
| | | | 1,025,000 | | | | 6.250 | | | | 03/15/38 | | | | 1,017,416 | |
| | | Kerr-McGee Corp. |
| | | | 4,575,000 | | | | 6.950 | | | | 07/01/24 | | | | 4,892,655 | |
| | | | | | | | | | | | | | | | | |
| | | | | | | | | | | | | | | | 11,336,102 | |
| | | |
| | | Entertainment – 0.1% |
| | | Time Warner Entertainment Co. |
| | | | 2,175,000 | | | | 8.375 | | | | 03/15/23 | | | | 2,600,904 | |
| | | |
| | | Environmental – 0.1% |
| | | Waste Management, Inc. |
| | | | 2,000,000 | | | | 7.375 | | | | 08/01/10 | | | | 2,121,419 | |
| | | |
| | | Food & Beverage – 0.0% |
| | | Anheuser-Busch Cos., Inc. |
| | | | 500,000 | | | | 4.700 | | | | 04/15/12 | | | | 489,351 | |
| | | Kraft Foods, Inc. |
| | | | 300,000 | | | | 4.000 | | | | 10/01/08 | | | | 294,992 | |
| | | McDonald’s Corp. |
| | | | 280,000 | | | | 6.000 | | | | 04/15/11 | | | | 287,170 | |
| | | | | | | | | | | | | | | | | |
| | | | | | | | | | | | | | | | 1,071,513 | |
| | | |
| | | Gaming – 0.2% |
| | | Caesars Entertainment, Inc. |
| | | | 1,745,000 | | | | 7.500 | | | | 09/01/09 | | | | 1,816,981 | |
| | | Harrah’s Operating Co., Inc. |
| | | | 2,475,000 | | | | 5.500 | | | | 07/01/10 | | | | 2,434,781 | |
| | | MGM Mirage, Inc. |
| | | | 850,000 | | | | 8.500 | | | | 09/15/10 | | | | 910,563 | |
| | | | | | | | | | | | | | | | | |
| | | | | | | | | | | | | | | | 5,162,325 | |
| | | |
| | | Life Insurance – 0.5% |
| | | American International Group, Inc. |
| | | | 1,850,000 | | | | 6.250 | | | | 03/15/37 | | | | 1,841,394 | |
| | | Americo Life, Inc.(a) |
| | | | 1,600,000 | | | | 7.875 | | | | 05/01/13 | | | | 1,646,667 | |
| | | Lincoln National Corp. |
| | | | 513,000 | | | | 6.500 | | | | 03/15/08 | | | | 515,860 | |
| | | Phoenix Life Insurance Co.(a) |
| | | | 3,200,000 | | | | 7.150 | | | | 12/15/34 | | | | 3,409,213 | |
| | | Principal Financial Group Australia(a) |
| | | | 2,750,000 | | | | 8.200 | | | | 08/15/09 | | | | 2,933,744 | |
| | | Prudential Financial, Inc. |
| | | | 1,000,000 | | | | 4.500 | | | | 07/15/13 | | | | 959,302 | |
| | | Reinsurance Group of America, Inc. |
| | | | 550,000 | | | | 6.750 | | | | 12/15/11 | | | | 579,238 | |
| | | | | | | | | | | | | | | | | |
| | | | | | | | | | | | | | | | 11,885,418 | |
| | | |
| | | Media-Cable – 1.7% |
| | | Comcast Cable Communications Holdings, Inc. |
| | | | 7,395,000 | | | | 8.375 | | | | 03/15/13 | | | | 8,479,042 | |
| | | | 2,050,000 | | | | 9.455 | | | | 11/15/22 | | | | 2,706,431 | |
| | | Cox Communications, Inc. |
| | | | 7,211,000 | | | | 4.625 | | | | 01/15/10 | | | | 7,110,469 | |
| | | | 5,050,000 | | | | 5.875 | (a) | | | 12/01/16 | | | | 5,092,021 | |
| | | Cox Enterprises, Inc.(a) |
| | | | 2,825,000 | | | | 4.375 | | | | 05/01/08 | | | | 2,793,436 | |
| | | Rogers Cable, Inc. |
| | | | 1,575,000 | | | | 5.500 | | | | 03/15/14 | | | | 1,559,250 | |
| | | Time Warner Cable, Inc.(a) |
| | | | 8,050,000 | | | | 5.400 | | | | 07/02/12 | | | | 8,072,355 | |
| | | | 1,525,000 | | | | 6.550 | | | | 05/01/37 | | | | 1,552,059 | |
| | | Viacom, Inc. |
| | | | 1,975,000 | | | | 5.750 | | | | 04/30/11 | | | | 2,002,213 | |
| | | | | | | | | | | | | | | | | |
| | | | | | | | | | | | | | | | 39,367,276 | |
| | | |
| | | Media-Non Cable – 0.4% |
| | | AMFM, Inc. |
| | | | 5,325,000 | | | | 8.000 | | | | 11/01/08 | | | | 5,505,872 | |
| | | News America, Inc. |
| | | | 2,750,000 | | | | 6.400 | | | | 12/15/35 | | | | 2,771,417 | |
| | | | | | | | | | | | | | | | | |
| | | | | | | | | | | | | | | | 8,277,289 | |
| | | |
| | | Metals & Mining – 0.2% |
| | | Inco Ltd. |
| | | | 5,550,000 | | | | 5.700 | | | | 10/15/15 | | | | 5,558,584 | |
| | | |
| | | Noncaptive-Financial – 1.6% |
| | | American General Finance Corp. |
| | | | 500,000 | | | | 4.000 | | | | 03/15/11 | | | | 479,135 | |
| | | Countrywide Home Loans MTN |
| | | | 750,000 | | | | 4.250 | | | | 12/19/07 | | | | 743,964 | |
| | | FIA Credit Services NA |
| | | | 300,000 | | | | 5.375 | | | | 01/15/08 | | | | 299,842 | |
| | | GATX Financial Corp. |
| | | | 5,775,000 | | | | 5.125 | | | | 04/15/10 | | | | 5,752,599 | |
The accompanying notes are an integral part of these financial statements.
37
GOLDMAN SACHS CORE FIXED INCOME FUND
Schedule of Investments (continued)
April 30, 2007 (Unaudited)
| | | | | | | | | | | | | | | | | |
| | | Principal | | Interest | | Maturity | | |
| | | Amount* | | Rate | | Date | | Value |
| | |
Corporate Bonds – (continued) |
| |
| | | Noncaptive-Financial – (continued) |
| | | General Electric Capital Corp. |
| | | $ | 3,000,000 | | | | 7.375 | % | | | 01/19/10 | | | $ | 3,176,935 | |
| | | | 345,000 | | | | 6.125 | | | | 02/22/11 | | | | 357,523 | |
| | | HSBC Finance Corp. |
| | | | 250,000 | | | | 8.000 | | | | 07/15/10 | | | | 270,683 | |
| | | | 8,375,000 | | | | 5.700 | | | | 06/01/11 | | | | 8,512,099 | |
| | | | 1,000,000 | | | | 6.375 | | | | 10/15/11 | | | | 1,043,649 | |
| | | MBNA Corp. |
| | | | 500,000 | | | | 6.125 | | | | 03/01/13 | | | | 519,503 | |
| | | PHH Corp. |
| | | | 7,950,000 | | | | 6.000 | | | | 03/01/08 | | | | 7,967,053 | |
| | | | 1,900,000 | | | | 7.125 | | | | 03/01/13 | | | | 2,058,639 | |
| | | Residential Capital LLC |
| | | | 7,000,000 | | | | 6.375 | | | | 06/30/10 | | | | 7,023,813 | |
| | | SLM Corp. |
| | | | 500,000 | | | | 5.375 | | | | 01/15/13 | | | | 465,008 | |
| | | | 500,000 | | | | 5.375 | | | | 05/15/14 | | | | 454,748 | |
| | | | | | | | | | | | | | | | | |
| | | | | | | | | | | | | | | | 39,125,193 | |
| | | |
| | | Pipelines – 1.2% |
| | | Boardwalk Pipelines LP |
| | | | 4,400,000 | | | | 5.875 | | | | 11/15/16 | | | | 4,431,410 | |
| | | CenterPoint Energy Resources Corp. Series B |
| | | | 4,075,000 | | | | 5.950 | | | | 01/15/14 | | | | 4,128,411 | |
| | | Energy Transfer Partners LP |
| | | | 2,175,000 | | | | 5.650 | | | | 08/01/12 | | | | 2,203,094 | |
| | | | 6,450,000 | | | | 5.950 | | | | 02/01/15 | | | | 6,542,675 | |
| | | Enterprise Products Operating LP |
| | | | 3,525,000 | | | | 5.600 | | | | 10/15/14 | | | | 3,519,322 | |
| | | | 2,450,000 | | | | 5.000 | | | | 03/01/15 | | | | 2,338,752 | |
| | | ONEOK Partners LP |
| | | | 2,625,000 | | | | 6.650 | | | | 10/01/36 | | | | 2,721,209 | |
| | | Panhandle Eastern PipeLine |
| | | | 1,350,000 | | | | 4.800 | | | | 08/15/08 | | | | 1,337,047 | |
| | | Southern Natural Gas Co.(a) |
| | | | 1,650,000 | | | | 5.900 | | | | 04/01/17 | | | | 1,654,506 | |
| | | | | | | | | | | | | | | | | |
| | | | | | | | | | | | | | | | 28,876,426 | |
| | | |
| | | Property/Casualty Insurance – 1.6% |
| | | AON Capital Trust A |
| | | | 1,852,000 | | | | 8.205 | | | | 01/01/27 | | | | 2,070,639 | |
| | | Arch Capital Group Ltd. |
| | | | 3,200,000 | | | | 7.350 | | | | 05/01/34 | | | | 3,508,363 | |
| | | Aspen Insurance Holdings Ltd. |
| | | | 1,525,000 | | | | 6.000 | | | | 08/15/14 | | | | 1,521,915 | |
| | | CNA Financial Corp. |
| | | | 98,000 | | | | 6.600 | | | | 12/15/08 | | | | 99,823 | |
| | | | 500,000 | | | | 5.850 | | | | 12/15/14 | | | | 503,128 | |
| | | Endurance Specialty Holdings Ltd. |
| | | | 2,950,000 | | | | 6.150 | | | | 10/15/15 | | | | 2,950,339 | |
| | | Everest Reinsurance Holdings, Inc. |
| | | | 1,000,000 | | | | 5.400 | | | | 10/15/14 | | | | 992,342 | |
| | | Hartford Financial Services Group, Inc. |
| | | | 2,000,000 | | | | 7.900 | | | | 06/15/10 | | | | 2,163,031 | |
| | | QBE Insurance Group Ltd.(a)(b) |
| | | | 3,150,000 | | | | 5.647 | | | | 07/01/23 | | | | 3,096,311 | |
| | | SAFECO Corp. |
| | | | 5,000,000 | | | | 6.875 | | | | 07/15/07 | | | | 5,015,470 | |
| | | Swiss Re Capital I LP(a)(b) |
| | | | 5,400,000 | | | | 6.854 | | | | 05/25/49 | | | | 5,637,886 | |
| | | The Chubb Corp.(b) |
| | | | 4,225,000 | | | | 6.375 | | | | 03/29/67 | | | | 4,275,945 | |
| | | White Mountains Reinsurance Group Ltd.(a) |
| | | | 4,900,000 | | | | 6.375 | | | | 03/20/17 | | | | 4,844,880 | |
| | | Zurich Capital Trust I(a) |
| | | | 2,500,000 | | | | 8.376 | | | | 06/01/37 | | | | 2,610,397 | |
| | | | | | | | | | | | | | | | | |
| | | | | | | | | | | | | | | | 39,290,469 | |
| | | |
| | | REIT – 1.0% |
| | | Brandywine Operating Partnership LP |
| | | | 3,740,000 | | | | 4.500 | | | | 11/01/09 | | | | 3,673,277 | |
| | | Highwoods Properties, Inc.(a) |
| | | | 3,525,000 | | | | 5.850 | | | | 03/15/17 | | | | 3,505,570 | |
| | | iStar Financial, Inc. |
| | | | 2,200,000 | | | | 5.650 | | | | 09/15/11 | | | | 2,205,539 | |
| | | iStar Financial, Inc. Series B |
| | | | 3,275,000 | | | | 5.700 | | | | 03/01/14 | | | | 3,263,403 | |
| | | Liberty Property LP |
| | | | 1,100,000 | | | | 7.250 | | | | 03/15/11 | | | | 1,175,600 | |
| | | Simon Property Group LP |
| | | | 1,625,000 | | | | 7.000 | | | | 06/15/08 | | | | 1,655,295 | |
| | | Westfield Capital Corp.(a) |
| | | | 3,725,000 | | | | 5.125 | | | | 11/15/14 | | | | 3,653,186 | |
| | | Westfield Group(a) |
| | | | 4,411,000 | | | | 5.400 | | | | 10/01/12 | | | | 4,440,355 | |
| | | | | | | | | | | | | | | | | |
| | | | | | | | | | | | | | | | 23,572,225 | |
| | | |
| | | Restaurants – 0.0% |
| | | Darden Restaurants, Inc. |
| | | | 800,000 | | | | 4.875 | | | | 08/15/10 | | | | 787,786 | |
| | | |
| | | Retailers – 0.0% |
| | | Target Corp. |
| | | | 750,000 | | | | 5.875 | | | | 03/01/12 | | | | 773,190 | |
| | | |
| | | Tobacco – 0.1% |
| | | Altria Group, Inc. |
| | | | 475,000 | | | | 7.000 | | | | 11/04/13 | | | | 516,885 | |
| | | | 1,020,000 | | | | 7.750 | | | | 01/15/27 | | | | 1,226,948 | |
| | | | | | | | | | | | | | | | | |
| | | | | | | | | | | | | | | | 1,743,833 | |
| | | |
| | | Wireless Telecommunications – 0.8% |
| | | America Movil SA de CV |
| | | | 1,800,000 | | | | 5.500 | | | | 03/01/14 | | | | 1,796,292 | |
| | | AT&T Wireless Services, Inc. |
| | | | 5,775,000 | | | | 7.875 | | | | 03/01/11 | | | | 6,321,313 | |
| | | Intelsat |
| | | | 3,850,000 | | | | 5.250 | | | | 11/01/08 | | | | 3,744,125 | |
| | | Sprint Capital Corp. |
| | | | 3,100,000 | | | | 7.625 | | | | 01/30/11 | | | | 3,324,027 | |
| | | | 235,000 | | | | 6.875 | | | | 11/15/28 | | | | 233,501 | |
The accompanying notes are an integral part of these financial statements.
38
GOLDMAN SACHS CORE FIXED INCOME FUND
| | | | | | | | | | | | | | | | | |
| | | Principal | | Interest | | Maturity | | |
| | | Amount* | | Rate | | Date | | Value |
| | |
Corporate Bonds – (continued) |
| |
| | | Wireless Telecommunications – (continued) |
| | | Telecom Italia Capital SA |
| | | $ | 2,475,000 | | | | 4.875 | % | | | 10/01/10 | | | $ | 2,442,228 | |
| | | | | | | | | | | | | | | | | |
| | | | | | | | | | | | | | | | 17,861,486 | |
| | | |
| | | Wirelines Telecommunications – 1.7% |
| | | Ameritech Capital Funding |
| | | | 775,000 | | | | 6.250 | | | | 05/18/09 | | | | 785,089 | |
| | | AT&T, Inc. |
| | | | 2,725,000 | | | | 4.125 | | | | 09/15/09 | | | | 2,664,955 | |
| | | BellSouth Corp. |
| | | | 7,000,000 | | | | 6.000 | | | | 10/15/11 | | | | 7,229,229 | |
| | | Deutsche Telekom International Finance BV |
| | | | 2,800,000 | | | | 5.375 | | | | 03/23/11 | | | | 2,820,602 | |
| | | | 4,075,000 | | | | 8.250 | | | | 06/15/30 | | | | 5,115,903 | |
| | | Embarq Corp. |
| | | | 1,500,000 | | | | 7.995 | | | | 06/01/36 | | | | 1,586,828 | |
| | | France Telecom SA |
| | | | 5,750,000 | | | | 7.750 | | | | 03/01/11 | | | | 6,260,890 | |
| | | Qwest Capital Funding, Inc. |
| | | | 500,000 | | | | 7.900 | | | | 08/15/10 | | | | 522,500 | |
| | | Telecom Italia Capital |
| | | | 3,050,000 | | | | 4.000 | | | | 01/15/10 | | | | 2,959,209 | |
| | | | 2,625,000 | | | | 4.950 | | | | 09/30/14 | | | | 2,498,601 | |
| | | Telecomunicaciones de Puerto Rico, Inc. |
| | | | 2,650,000 | | | | 6.800 | | | | 05/15/09 | | | | 2,703,989 | |
| | | Telefonica Europe BV |
| | | | 2,575,000 | | | | 7.750 | | | | 09/15/10 | | | | 2,774,459 | |
| | | TPSA Finance BV(a) |
| | | | 2,200,000 | | | | 7.750 | | | | 12/10/08 | | | | 2,273,458 | |
| | | | | | | | | | | | | | | | | |
| | | | | | | | | | | | | | | | 40,195,712 | |
| | | |
| | | TOTAL CORPORATE BONDS |
| | | (Cost $409,531,458) | | | 413,275,064 | |
| | | |
| | |
Mortgage-Backed Obligations – 45.8% |
| |
| | | Adjustable Rate FNMA(b) – 0.4% |
| | | $ | 68,974 | | | | 4.485 | % | | | 03/01/33 | | | $ | 70,000 | |
| | | | 9,325,333 | | | | 3.850 | | | | 10/01/33 | | | | 9,224,802 | |
| | | | | | | | | | | | | | | | | |
| | | | | | | | | | | | | | | | 9,294,802 | |
| | | |
| | | Adjustable Rate Non-Agency(b) – 27.4% |
| | | American Home Mortgage Assets Series 2007-1, Class A1 |
| | | | 21,666,438 | | | | 5.714 | | | | 02/25/47 | | | | 21,514,773 | |
| | | Banc of America Commercial Mortgage, Inc. Series 2005-6, Class A4 |
| | | | 20,000,000 | | | | 5.353 | | | | 09/10/47 | | | | 19,884,922 | |
| | | Bear Stearns Adjustable Rate Mortgage Trust Series 2003-5, Class 1A1 |
| | | | 161,520 | | | | 5.960 | | | | 08/25/33 | | | | 163,986 | |
| | | Bear Stearns Alternative-A Trust Series 2005-8, Class 11A1 |
| | | | 3,254,070 | | | | 5.590 | | | | 10/25/35 | | | | 3,264,515 | |
| | | Bear Stearns Mortgage Funding Trust Series 2006-AR2, Class 1A1 |
| | | | 22,307,478 | | | | 5.520 | | | | 09/25/36 | | | | 22,223,580 | |
| | | Chase Mortgage Finance Corp. Series 2007-A1, Class 1A3 |
| | | | 16,473,742 | | | | 4.365 | | | | 02/25/37 | | | | 16,312,299 | |
| | | Chase Mortgage Finance Corp. Series 2007-A1, Class 4A1 |
| | | | 7,718,615 | | | | 4.497 | | | | 02/25/37 | | | | 7,644,748 | |
| | | Citigroup Commercial Mortgage Trust Series 2006-C4, Class A3 |
| | | | 13,000,000 | | | | 5.915 | | | | 03/15/49 | | | | 13,404,046 | |
| | | Commercial Mortgage Pass Through Certificates Series 2006-C7,
Class A4 |
| | | | 24,000,000 | | | | 5.962 | | | | 06/10/46 | | | | 24,815,781 | |
| | | Countrywide Alternative Loan Trust Series 2005-51, Class 1A1 |
| | | | 6,687,306 | | | | 5.640 | | | | 11/20/35 | | | | 6,702,553 | |
| | | Countrywide Alternative Loan Trust Series 2005-51, Class 2A1 |
| | | | 8,465,500 | | | | 5.620 | | | | 11/20/35 | | | | 8,482,150 | |
| | | Countrywide Alternative Loan Trust Series 2005-51, Class 4A1 |
| | | | 8,540,274 | | | | 5.640 | | | | 11/20/35 | | | | 8,570,173 | |
| | | Countrywide Alternative Loan Trust Series 2005-59, Class 1A1 |
| | | | 8,240,488 | | | | 5.650 | | | | 11/20/35 | | | | 8,268,374 | |
| | | Countrywide Alternative Loan Trust Series 2005-59, Class 1A2A |
| | | | 6,867,074 | | | | 5.700 | | | | 11/20/35 | | | | 6,896,029 | |
| | | Countrywide Alternative Loan Trust Series 2005-62, Class 1A1 |
| | | | 13,077,757 | | | | 5.620 | | | | 12/25/35 | | | | 13,174,396 | |
| | | Countrywide Alternative Loan Trust Series 2006-OA19, Class A1 |
| | | | 21,901,423 | | | | 5.500 | | | | 02/20/47 | | | | 21,859,462 | |
| | | Countrywide Home Loan Mortgage Pass Through Trust Series 2006-3, Class 1A1 |
| | | | 6,113,745 | | | | 5.560 | | | | 03/25/36 | | | | 6,124,926 | |
| | | Countrywide Home Loans Series 2003-37, Class 1A1 |
| | | | 114,206 | | | | 5.807 | | | | 08/25/33 | | | | 114,467 | |
| | | CS First Boston Mortgage Securities Corp. Series 2003-AR9, Class��2A2 |
| | | | 157,917 | | | | 5.100 | | | | 03/25/33 | | | | 157,486 | |
| | | Downey Savings & Loan Association Mortgage Loan Trust Series 2005-AR6, Class 2A1A |
| | | | 9,847,217 | | | | 5.610 | | | | 10/19/45 | | | | 9,890,596 | |
| | | Harborview Mortgage Loan Trust Series 2005-10, Class 2A1A |
| | | | 12,267,613 | | | | 5.630 | | | | 11/19/35 | | | | 12,306,669 | |
| | | Harborview Mortgage Loan Trust Series 2005-16, Class 2A1A |
| | | | 2,611,189 | | | | 5.560 | | | | 01/19/36 | | | | 2,616,360 | |
| | | Harborview Mortgage Loan Trust Series 2005-16, Class 3A1A |
| | | | 13,085,937 | | | | 5.570 | | | | 01/19/36 | | | | 13,110,951 | |
| | | Harborview Mortgage Loan Trust Series 2006-12, Class 2A2A |
| | | | 17,654,959 | | | | 5.510 | | | | 01/19/38 | | | | 17,669,503 | |
| | | Impac CMB Trust Series 2005-6, Class 1A1 |
| | | | 11,921,331 | | | | 5.570 | | | | 10/25/35 | | | | 11,932,359 | |
| | | Impac Secured Assets Corp. Series 2005-2, Class A1W |
| | | | 10,665,899 | | | | 5.570 | | | | 03/25/36 | | | | 10,695,072 | |
| | | Indymac Index Mortgage Loan Trust Series 2006-AR2, Class 1A1A |
| | | | 9,558,102 | | | | 5.540 | | | | 04/25/46 | | | | 9,569,932 | |
| | | Indymac Index Mortgage Loan Trust Series 2006-AR4, Class A1A |
| | | | 11,503,688 | | | | 5.530 | | | | 05/25/46 | | | | 11,518,510 | |
The accompanying notes are an integral part of these financial statements.
39
GOLDMAN SACHS CORE FIXED INCOME FUND
Schedule of Investments (continued)
April 30, 2007 (Unaudited)
| | | | | | | | | | | | | | | | | |
| | | Principal | | Interest | | Maturity | | |
| | | Amount* | | Rate | | Date | | Value |
| | |
Mortgage-Backed Obligations – (continued) |
| |
| | | Adjustable Rate Non-Agency(b) – (continued) |
| | | JPMorgan Mortgage Trust Series 2007-A1, Class 1A1 |
| | | $ | 6,868,829 | | | | 4.204 | % | | | 07/25/35 | | | $ | 6,752,260 | |
| | | JPMorgan Mortgage Trust Series 2007-A1, Class 2A2 |
| | | | 2,923,721 | | | | 4.766 | | | | 07/25/35 | | | | 2,898,322 | |
| | | JPMorgan Mortgage Trust Series 2007-A1, Class 4A2 |
| | | | 1,965,393 | | | | 4.071 | | | | 07/25/35 | | | | 1,929,274 | |
| | | JPMorgan Mortgage Trust Series 2007-A1, Class 5A2 |
| | | | 7,741,678 | | | | 4.771 | | | | 07/25/35 | | | | 7,675,153 | |
| | | Lehman XS Trust Series 2005-5N, Class 3A1A |
| | | | 10,993,405 | | | | 5.620 | | | | 11/25/35 | | | | 10,999,900 | |
| | | Lehman XS Trust Series 2005-9N, Class 1A1 |
| | | | 11,787,361 | | | | 5.590 | | | | 02/25/36 | | | | 11,791,045 | |
| | | Luminent Mortgage Trust Series 2006-2, Class A1A |
| | | | 11,135,281 | | | | 5.520 | | | | 02/25/46 | | | | 11,126,425 | |
| | | Master Adjustable Rate Mortgages Trust Series 2004-9, Class 2A1 |
| | | | 489,915 | | | | 5.700 | | | | 11/25/34 | | | | 491,489 | |
| | | Master Adjustable Rate Mortgages Trust Series 2006-OA2, Class 4A1A |
| | | | 15,211,972 | | | | 5.833 | | | | 12/25/46 | | | | 15,211,972 | |
| | | MLCC Mortgage Investors, Inc. Series 2004-E, Class A2B |
| | | | 4,671,534 | | | | 5.674 | | | | 11/25/29 | | | | 4,680,618 | |
| | | Morgan Stanley Capital I Series 2006-T21, Class A4 |
| | | | 19,000,000 | | | | 5.162 | | | | 10/12/52 | | | | 18,769,995 | |
| | | Mortgage IT Trust Series 2005-AR1, Class 1A1 |
| | | | 10,093,757 | | | | 5.570 | | | | 11/25/35 | | | | 10,116,840 | |
| | | Sequoia Mortgage Trust Series 2003-4, Class 1A2 |
| | | | 3,179,484 | | | | 5.721 | | | | 07/20/33 | | | | 3,182,003 | |
| | | Structured Asset Mortgage Investments, Inc. Series 2006-AR1, Class 3A1 |
| | | | 16,771,839 | | | | 5.550 | | | | 02/25/36 | | | | 16,798,088 | |
| | | Structured Asset Mortgage Investments, Inc. Series 2006-AR2, Class A1 |
| | | | 10,198,499 | | | | 5.550 | | | | 02/25/36 | | | | 10,215,265 | |
| | | Structured Asset Securities Corp. Series 2003-37A, Class 3A7 |
| | | | 4,585,858 | | | | 4.520 | | | | 12/25/33 | | | | 4,596,149 | |
| | | Thornburg Mortgage Securities Trust Series 2006-5, Class A1 |
| | | | 25,840,417 | | | | 5.440 | | | | 08/25/36 | | | | 25,800,181 | |
| | | Washington Mutual Mortgage Pass-Through Certificates Series 2005-AR8, Class 2A1A |
| | | | 12,486,116 | | | | 5.610 | | | | 07/25/45 | | | | 12,503,077 | |
| | | Washington Mutual Mortgage Pass-Through Certificates Series 2005-AR11, Class A1A |
| | | | 7,032,754 | | | | 5.640 | | | | 08/25/45 | | | | 7,050,481 | |
| | | Washington Mutual Mortgage Pass-Through Certificates Series 2005-AR13, Class A1A1 |
| | | | 13,097,180 | | | | 5.610 | | | | 10/25/45 | | | | 13,113,133 | |
| | | Washington Mutual Mortgage Pass-Through Certificates Series 2006-AR11, Class 3A1A |
| | | | 4,687,988 | | | | 5.934 | | | | 09/25/46 | | | | 4,693,116 | |
| | | Washington Mutual Mortgage Pass-Through Certificates Series 2006-AR13, Class 1A |
| | | | 16,095,162 | | | | 5.894 | | | | 10/25/46 | | | | 16,105,221 | |
| | | Washington Mutual Mortgage Pass-Through Certificates Series 2006-AR17, Class 1A |
| | | | 7,776,946 | | | | 5.834 | | | | 12/25/46 | | | | 7,801,506 | |
| | | Washington Mutual Mortgage Pass-Through Certificates Series 2006-AR7, Class A1A |
| | | | 10,691,769 | | | | 5.934 | | | | 09/25/46 | | | | 10,703,463 | |
| | | Washington Mutual Mortgage Pass-Through Certificates Series 2006-AR9, Class 2A |
| | | | 23,030,040 | | | | 5.854 | | | | 11/25/46 | | | | 23,026,441 | |
| | | Washington Mutual Mortgage Pass-Through Certificates Series 2006-AR19, Class 1A |
| | | | 3,680,473 | | | | 5.754 | | | | 01/25/47 | | | | 3,675,872 | |
| | | Washington Mutual Mortgage Pass-Through Certificates Series 2007-0A2, Class 1A(c) |
| | | | 7,532,386 | | | | 5.714 | | | | 03/25/47 | | | | 7,522,970 | |
| | | Washington Mutual Mortgage Pass-Through Certificates Series 2007-0A2, Class 2A(c) |
| | | | 12,046,691 | | | | 5.714 | | | | 01/25/47 | | | | 12,033,515 | |
| | | Washington Mutual Series 2002-AR19, Class A7 |
| | | | 836,736 | | | | 4.679 | | | | 02/25/33 | | | | 829,058 | |
| | | Washington Mutual Series 2005-AR15, Class A1A1 |
| | | | 13,969,960 | | | | 5.580 | | | | 11/25/45 | | | | 14,013,798 | |
| | | Washington Mutual Series 2005-AR17, Series A1A1 |
| | | | 10,752,520 | | | | 5.590 | | | | 12/25/45 | | | | 10,748,434 | |
| | | Wells Fargo Mortgage Backed Securities Trust Series 2005-AR16, Class 1A1 |
| | | | 13,099,533 | | | | 4.975 | | | | 10/25/35 | | | | 13,113,565 | |
| | | Wells Fargo Mortgage Backed Securities Trust Series 2006-AR2, Class 2A3 |
| | | | 26,133,617 | | | | 5.090 | | | | 03/25/36 | | | | 26,096,335 | |
| | | | | | | | | | | | | | | | | |
| | | | | | | | | | | | | | | | 654,953,582 | |
| | | |
| | | Commercial Mortgage Backed Securities – 3.9% |
| | | Agency – 0.3% |
| | | FNMA |
| | | | 1,257,696 | | | | 7.040 | | | | 08/01/15 | | | | 1,390,007 | |
| | | | 2,772,840 | | | | 6.460 | | | | 12/01/28 | | | | 2,817,686 | |
| | | FNMA Series 2001-M2, Class C |
| | | | 3,473,738 | | | | 6.300 | | | | 09/25/15 | | | | 3,556,958 | |
| | | | | | | | | | | | | | | | | |
| | | | | | | | | | | | | | | | 7,764,651 | |
| | | |
| | | Interest Only(a)(b)(c) – 0.1% |
| | | Bear Stearns Commercial Mortgage Securities, Inc. Series 2001-TOP2, Class X2 |
| | | | 38,000,000 | | | | 1.285 | | | | 02/15/35 | | | | 431,844 | |
| | | CS First Boston Mortgage Securities Corp. Series 2002-CKS4, Class ASP |
| | | | 23,309,953 | | | | 1.793 | | | | 11/15/36 | | | | 840,643 | |
| | | | | | | | | | | | | | | | | |
| | | | | | | | | | | | | | | | 1,272,487 | |
| | | |
| | | Sequential Fixed Rate – 3.5% |
| | | Banc of America Commercial Mortgage, Inc. Series 2006-4 Class A4 |
| | | | 6,000,000 | | | | 5.634 | | | | 07/10/46 | | | | 6,111,348 | |
The accompanying notes are an integral part of these financial statements.
40
GOLDMAN SACHS CORE FIXED INCOME FUND
| | | | | | | | | | | | | | | | | |
| | | Principal | | Interest | | Maturity | | |
| | | Amount* | | Rate | | Date | | Value |
| | |
Mortgage-Backed Obligations – (continued) |
| |
| | | Sequential Fixed Rate – (continued) |
| | | Commercial Mortgage Acceptance Corp. Series 1997-ML1, Class A3 |
| | | $ | 2,331,765 | | | | 6.570 | % | | | 12/15/30 | | | $ | 2,329,139 | |
| | | CS First Boston Mortgage Securities Corp. Series 1997-C2, Class A3 |
| | | | 5,968,988 | | | | 6.550 | | | | 01/17/35 | | | | 5,983,514 | |
| | | First Union National Bank Commercial Mortgage Trust Series 2000-C2, Class A2 |
| | | | 17,000,000 | | | | 7.202 | | | | 10/15/32 | | | | 17,933,418 | |
| | | GMAC Commercial Mortgage Securities, Inc. Series 2002-C1, Class A2 |
| | | | 15,000,000 | | | | 6.278 | | | | 11/15/39 | | | | 15,582,625 | |
| | | LB-UBS Commercial Mortgage Trust Series 2005-C5, Class A4 |
| | | | 9,000,000 | | | | 4.954 | | | | 09/15/30 | | | | 8,791,610 | |
| | | LB-UBS Commercial Mortgage Trust Series 2005-C7, Class A4(b) |
| | | | 10,175,000 | | | | 5.197 | | | | 11/15/30 | | | | 10,089,495 | |
| | | LB-UBS Commercial Mortgage Trust Series 2006-C1, Class A4 |
| | | | 12,000,000 | | | | 5.156 | | | | 02/15/31 | | | | 11,852,769 | |
| | | Merrill Lynch Mortgage Investors, Inc. Series 1998-C2, Class A2 |
| | | | 748,688 | | | | 6.390 | | | | 02/15/30 | | | | 749,296 | |
| | | Merrill Lynch Mortgage Investors, Inc. Series 1999-C1, Class A2 |
| | | | 3,944,800 | | | | 7.560 | | | | 11/15/31 | | | | 4,108,347 | |
| | | | | | | | | | | | | | | | | |
| | | | | | | | | | | | | | | | 83,531,561 | |
| | | |
| | | TOTAL COMMERCIAL MORTGAGE BACKED |
| | | SECURITIES | | $ | 92,568,699 | |
| | | |
| | | Collateralized Mortgage Obligations – 0.5% |
| | | Interest Only(c) – 0.1% |
| | | ABN AMRO Mortgage Corp. Series 2003-5, Class A2 |
| | | | 2,218,349 | | | | 5.500 | | | | 04/25/33 | | | | 195,838 | |
| | | Countrywide Home Loan Trust Series 2003-42, Class 2X1(b) |
| | | | 2,896,234 | | | | 0.362 | | | | 10/25/33 | | | | 11,520 | |
| | | CS First Boston Mortgage Securities Corp. Series 2002-AR31, Class 5X(b) |
| | | | 796,614 | | | | 0.000 | | | | 11/25/32 | | | | 478 | |
| | | CS First Boston Mortgage Securities Corp. Series 2003-08, Class 3A2 |
| | | | 301,263 | | | | 5.500 | | | | 04/25/33 | | | | 11,797 | |
| | | CS First Boston Mortgage Securities Corp. Series 2003-10, Class 3A13 |
| | | | 237,938 | | | | 5.750 | | | | 05/25/33 | | | | 6,850 | |
| | | CS First Boston Mortgage Securities Corp. Series 2003-11, Class 1A2 |
| | | | 253,996 | | | | 5.500 | | | | 06/25/33 | | | | 12,581 | |
| | | CS First Boston Mortgage Securities Corp. Series 2003-AR18, Class 2X(b) |
| | | | 2,976,030 | | | | 0.782 | | | | 07/25/33 | | | | 12,936 | |
| | | CS First Boston Mortgage Securities Corp. Series 2003-AR20, Class 2X(b) |
| | | | 3,587,016 | | | | 0.605 | | | | 08/25/33 | | | | 17,248 | |
| | | FNMA Series 2004-47, Class EI(b)(f) |
| | | | 6,456,603 | | | | 0.000 | | | | 06/25/34 | | | | 272,450 | |
| | | FNMA Series 2004-62, Class DI(b)(f) |
| | | | 2,892,608 | | | | 0.000 | | | | 07/25/33 | | | | 123,435 | |
| | | FNMA Series 2004-71, Class DI(b)(f) |
| | | | 5,993,536 | | | | 0.000 | | | | 04/25/34 | | | | 146,997 | |
| | | Washington Mutual Mortgage Pass-Through Certificates Series 2003-AR04, Class X1(b) |
| | | | 4,718,626 | | | | 1.181 | | | | 01/25/08 | | | | 38,642 | |
| | | Washington Mutual Mortgage Pass-Through Certificates Series 2003-AR12, Class X(b) |
| | | | 11,447,276 | | | | 0.485 | | | | 02/25/34 | | | | 65,333 | |
| | | Washington Mutual Series 2003-AR05, Class X1(b) |
| | | | 13,881,696 | | | | 0.756 | | | | 02/25/08 | | | | 78,222 | |
| | | Washington Mutual Series 2003-AR06, Class X2 |
| | | | 10,773,404 | | | | 0.371 | | | | 05/25/08 | | | | 33,016 | |
| | | Washington Mutual Series 2003-AR07, Class X(b) |
| | | | 17,090,544 | | | | 0.941 | | | | 06/25/08 | | | | 128,155 | |
| | | Wells Fargo Mortgage Backed Securities Trust Series 2003-G, ClassAI0(b) |
| | | | 12,272,251 | | | | 0.762 | | | | 06/25/33 | | | | 229,896 | |
| | | | | | | | | | | | | | | | | |
| | | | | | | | | | | | | | | | 1,385,394 | |
| | | |
| | | Inverse Floaters(b) – 0.1% |
| | | FHLMC Series 1544, Class M |
| | | | 27,199 | | | | 11.674 | | | | 07/15/08 | | | | 27,466 | |
| | | FNMA Series 1993-072, Class SA |
| | | | 10,719 | | | | 8.792 | | | | 05/25/08 | | | | 10,840 | |
| | | FNMA Series 1993-093, Class SA |
| | | | 13,867 | | | | 11.713 | | | | 05/25/08 | | | | 14,185 | |
| | | FNMA Series 1993-095, Class SE |
| | | | 21,931 | | | | 11.976 | | | | 06/25/08 | | | | 22,393 | |
| | | FNMA Series 1993-135, Class S |
| | | | 56,146 | | | | 6.500 | | | | 07/25/08 | | | | 57,209 | |
| | | FNMA Series 1993-175, Class SA |
| | | | 137,642 | | | | 12.177 | | | | 09/25/08 | | | | 142,960 | |
| | | GNMA Series 2001-48, Class SA |
| | | | 210,618 | | | | 9.198 | | | | 10/16/31 | | | | 233,088 | |
| | | GNMA Series 2001-51, Class SA |
| | | | 406,587 | | | | 9.447 | | | | 10/16/31 | | | | 460,054 | |
| | | GNMA Series 2001-51, Class SB |
| | | | 420,187 | | | | 9.198 | | | | 10/16/31 | | | | 468,648 | |
| | | GNMA Series 2001-59, Class SA |
| | | | 75,379 | | | | 9.035 | | | | 11/16/24 | | | | 82,737 | |
| | | GNMA Series 2002-11, Class SA |
| | | | 212,121 | | | | 12.740 | | | | 02/16/32 | | | | 260,973 | |
| | | GNMA Series 2002-13, Class SB |
| | | | 493,556 | | | | 12.740 | | | | 02/16/32 | | | | 608,651 | |
| | | | | | | | | | | | | | | | | |
| | | | | | | | | | | | | | | | 2,389,204 | |
| | | |
| | | Planned Amortization Class – 0.2% |
| | | FHLMC Series 2639, Class UL |
| | | | 325,523 | | | | 4.750 | | | | 03/15/22 | | | | 321,375 | |
| | | FHLMC Series 2681, Class PC |
| | | | 1,500,000 | | | | 5.000 | | | | 01/15/19 | | | | 1,494,132 | |
The accompanying notes are an integral part of these financial statements.
41
GOLDMAN SACHS CORE FIXED INCOME FUND
Schedule of Investments (continued)
April 30, 2007 (Unaudited)
| | | | | | | | | | | | | | | | | |
| | | Principal | | Interest | | Maturity | | |
| | | Amount* | | Rate | | Date | | Value |
| | |
Mortgage-Backed Obligations – (continued) |
| |
| | | Planned Amortization Class – (continued) |
| | | FHLMC Series 2775, Class MC |
| | | $ | 1,458,800 | | | | 5.000 | % | | | 08/15/27 | | | $ | 1,451,019 | |
| | | FHLMC Series 2949, Class WV |
| | | | 2,000,000 | | | | 5.000 | | | | 12/15/20 | | | | 1,971,373 | |
| | | FNMA Series 1999-51, Class LG |
| | | | 108,033 | | | | 6.500 | | | | 12/25/28 | | | | 107,666 | |
| | | FNMA Series 2003-134, Class ME |
| | | | 411,098 | | | | 4.500 | | | | 06/25/33 | | | | 397,780 | |
| | | FNMA Series 2004-64, Class BA |
| | | | 278,930 | | | | 5.000 | | | | 03/25/34 | | | | 275,778 | |
| | | | | | | | | | | | | | | | | |
| | | | | | | | | | | | | | | | 6,019,123 | |
| | | |
| | | Regular Floater(b) – 0.0% |
| | | FHLMC Series 3138, Class X(f) |
| | | | 90,079 | | | | 0.000 | | | | 04/15/36 | | | | 90,273 | |
| | | FNMA REMIC Trust Series 1993-175, Class FA |
| | | | 297,307 | | | | 3.930 | | | | 09/25/08 | | | | 293,675 | |
| | | FNMA Series 2006-48, Class VF |
| | | | 759,645 | | | | 5.670 | | | | 02/25/20 | | | | 753,993 | |
| | | | | | | | | | | | | | | | | |
| | | | | | | | | | | | | | | | 1,137,941 | |
| | | |
| | | Sequential Fixed Rate – 0.1% |
| | | FHLMC Series 2367, Class BC |
| | | | 521,686 | | | | 6.000 | | | | 04/15/16 | | | | 521,258 | |
| | | FHLMC Series 2664, Class MA |
| | | | 493,393 | | | | 5.000 | | | | 04/15/30 | | | | 490,679 | |
| | | FHLMC Series 2796, Class AB |
| | | | 239,435 | | | | 5.500 | | | | 10/15/31 | | | | 240,620 | |
| | | FNMA REMIC Series 1993-78, Class H |
| | | | 268,055 | | | | 6.500 | | | | 06/25/08 | | | | 268,544 | |
| | | FNMA Series 2005-103, Class DA |
| | | | 446,368 | | | | 5.000 | | | | 06/25/16 | | | | 441,171 | |
| | | | | | | | | | | | | | | | | |
| | | | | | | | | | | | | | | | 1,962,272 | |
| | | |
| | | TOTAL COLLATERALIZED MORTGAGE
OBLIGATIONS | | $ | 12,893,934 | |
| | | |
| | | FHLMC – 4.1% |
| | | | 268,937 | | | | 5.000 | | | | 12/01/12 | | | | 266,083 | |
| | | | 23,285 | | | | 5.500 | | | | 07/01/13 | | | | 23,381 | |
| | | | 175,284 | | | | 5.500 | | | | 12/01/13 | | | | 176,007 | |
| | | | 2,279,543 | | | | 6.500 | | | | 12/01/13 | | | | 2,329,711 | |
| | | | 135,470 | | | | 4.000 | | | | 02/01/14 | | | | 128,299 | |
| | | | 67,314 | | | | 5.500 | | | | 02/01/14 | | | | 67,592 | |
| | | | 2,139,174 | | | | 4.000 | | | | 03/01/14 | | | | 2,025,929 | |
| | | | 415,485 | | | | 4.000 | | | | 04/01/14 | | | | 393,490 | |
| | | | 26,547 | | | | 5.500 | | | | 06/01/14 | | | | 26,665 | |
| | | | 64,735 | | | | 5.500 | | | | 09/01/14 | | | | 65,023 | |
| | | | 3,799 | | | | 7.000 | | | | 10/01/14 | | | | 3,882 | |
| | | | 1,134,286 | | | | 6.000 | | | | 12/01/14 | | | | 1,137,960 | |
| | | | 32,995 | | | | 7.000 | | | | 05/01/15 | | | | 33,720 | |
| | | | 103,170 | | | | 8.000 | | | | 07/01/15 | | | | 108,474 | |
| | | | 14,446 | | | | 7.000 | | | | 02/01/16 | | | | 14,935 | |
| | | | 34,920 | | | | 7.000 | | | | 03/01/16 | | | | 36,110 | |
| | | | 742,193 | | | | 7.500 | | | | 05/01/16 | | | | 771,257 | |
| | | | 3,206 | | | | 7.000 | | | | 10/01/17 | | | | 3,351 | |
| | | | 2,547,925 | | | | 4.500 | | | | 05/01/18 | | | | 2,476,014 | |
| | | | 602,249 | | | | 4.500 | | | | 06/01/18 | | | | 585,252 | |
| | | | 2,406,643 | | | | 4.500 | | | | 09/01/18 | | | | 2,338,719 | |
| | | | 1,765,598 | | | | 4.500 | | | | 10/01/18 | | | | 1,715,768 | |
| | | | 1,615,852 | | | | 5.000 | | | | 10/01/18 | | | | 1,597,706 | |
| | | | 2,266,551 | | | | 4.500 | | | | 11/01/18 | | | | 2,202,581 | |
| | | | 1,875,978 | | | | 4.500 | | | | 12/01/18 | | | | 1,823,031 | |
| | | | 5,314,695 | | | | 5.000 | | | | 12/01/18 | | | | 5,255,010 | |
| | | | 661,252 | | | | 4.500 | | | | 01/01/19 | | | | 642,590 | |
| | | | 1,773,475 | | | | 4.500 | | | | 03/01/19 | | | | 1,722,047 | |
| | | | 42,266,617 | | | | 4.000 | | | | 06/01/19 | | | | 40,029,088 | |
| | | | 8,148,986 | | | | 4.500 | | | | 06/01/19 | | | | 7,918,995 | |
| | | | 650,340 | | | | 5.000 | | | | 06/01/19 | | | | 642,077 | |
| | | | 3,599,501 | | | | 4.500 | | | | 02/01/20 | | | | 3,493,448 | |
| | | | 3,738,967 | | | | 5.000 | | | | 06/01/20 | | | | 3,691,464 | |
| | | | 5,298,271 | | | | 5.000 | | | | 07/01/20 | | | | 5,226,081 | |
| | | | 3,458,158 | | | | 4.500 | | | | 10/01/23 | | | | 3,281,802 | |
| | | | 560,705 | | | | 5.500 | | | | 10/01/25 | | | | 558,129 | |
| | | | 783,204 | | | | 5.500 | | | | 11/01/25 | | | | 779,605 | |
| | | | 74,964 | | | | 7.000 | | | | 06/01/26 | | | | 78,119 | |
| | | | 62,600 | | | | 7.500 | | | | 03/01/27 | | | | 65,247 | |
| | | | 17,984 | | | | 6.500 | | | | 06/01/29 | | | | 18,572 | |
| | | | 2,326,820 | | | | 6.500 | | | | 12/01/29 | | | | 2,404,238 | |
| | | | 67,994 | | | | 7.500 | | | | 12/01/30 | | | | 70,834 | |
| | | | 43,165 | | | | 7.500 | | | | 01/01/31 | | | | 44,968 | |
| | | | 81,161 | | | | 6.500 | | | | 03/01/32 | | | | 83,667 | |
| | | | 19,312 | | | | 6.500 | | | | 04/01/32 | | | | 19,908 | |
| | | | 202,394 | | | | 6.500 | | | | 07/01/32 | | | | 208,642 | |
| | | | 1,421,032 | | | | 6.500 | | | | 08/01/33 | | | | 1,464,900 | |
| | | | 500,814 | | | | 6.500 | | | | 10/01/33 | | | | 515,955 | |
| | | | | | | | | | | | | | | | | |
| | | | | | | | | | | | | | | | 98,566,326 | |
| | | |
| | | FNMA – 9.5% |
| | | | 1,016 | | | | 9.000 | | | | 09/15/08 | | | | 1,034 | |
| | | | 359,495 | | | | 8.500 | | | | 10/01/15 | | | | 383,951 | |
| | | | 14,829 | | | | 7.000 | | | | 01/01/16 | | | | 15,297 | |
| | | | 670,439 | | | | 6.000 | | | | 12/01/16 | | | | 681,978 | |
| | | | 8,465,621 | | | | 5.000 | | | | 10/01/17 | | | | 8,371,100 | |
| | | | 56,179,620 | | | | 5.000 | | | | 12/01/17 | | | | 55,552,380 | |
| | | | 1,613,179 | | | | 5.000 | | | | 01/01/18 | | | | 1,595,271 | |
| | | | 5,556,491 | | | | 5.000 | | | | 02/01/18 | | | | 5,491,670 | |
| | | | 1,159,234 | | | | 4.500 | | | | 04/01/18 | | | | 1,125,775 | |
| | | | 1,648,670 | | | | 5.000 | | | | 04/01/18 | | | | 1,629,481 | |
| | | | 9,864,653 | | | | 4.500 | | | | 05/01/18 | | | | 9,579,923 | |
| | | | 1,160,751 | | | | 5.000 | | | | 05/01/18 | | | | 1,147,240 | |
| | | | 19,787,375 | | | | 4.500 | | | | 06/01/18 | | | | 19,215,654 | |
| | | | 869,159 | | | | 5.000 | | | | 06/01/18 | | | | 859,043 | |
| | | | 6,381,760 | | | | 4.000 | | | | 07/01/18 | | | | 6,059,611 | |
| | | | 3,121,208 | | | | 4.500 | | | | 07/01/18 | | | | 3,030,611 | |
| | | | 3,106,688 | | | | 4.000 | | | | 08/01/18 | | | | 2,949,864 | |
| | | | 15,927,322 | | | | 4.500 | | | | 08/01/18 | | | | 15,462,830 | |
| | | | 79,576 | | | | 6.000 | | | | 08/01/18 | | | | 80,472 | |
| | | | 26,983,647 | | | | 4.000 | | | | 09/01/18 | | | | 25,620,777 | |
| | | | 8,712,354 | | | | 4.500 | | | | 09/01/18 | | | | 8,458,007 | |
The accompanying notes are an integral part of these financial statements.
42
GOLDMAN SACHS CORE FIXED INCOME FUND
| | | | | | | | | | | | | | | | | |
| | | Principal | | Interest | | Maturity | | |
| | | Amount* | | Rate | | Date | | Value |
| | |
Mortgage-Backed Obligations – (continued) |
| |
| | | FNMA – (continued) |
| | | $ | 3,427,738 | | | | 4.500 | % | | | 10/01/18 | | | $ | 3,328,801 | |
| | | | 2,420,682 | | | | 4.500 | | | | 11/01/18 | | | | 2,350,812 | |
| | | | 2,760,005 | | | | 5.000 | | | | 11/01/18 | | | | 2,727,882 | |
| | | | 3,103,063 | | | | 4.500 | | | | 12/01/18 | | | | 3,013,498 | |
| | | | 2,413,464 | | | | 5.500 | | | | 12/01/18 | | | | 2,422,905 | |
| | | | 630,625 | | | | 4.500 | | | | 01/01/19 | | | | 612,423 | |
| | | | 881,125 | | | | 4.500 | | | | 03/01/19 | | | | 855,693 | |
| | | | 2,957,341 | | | | 5.000 | | | | 04/01/19 | | | | 2,922,921 | |
| | | | 203,279 | | | | 5.000 | | | | 05/01/19 | | | | 200,725 | |
| | | | 421,875 | | | | 4.500 | | | | 06/01/19 | | | | 409,304 | |
| | | | 339,723 | | | | 5.000 | | | | 06/01/19 | | | | 335,769 | |
| | | | 271,910 | | | | 4.500 | | | | 07/01/19 | | | | 263,702 | |
| | | | 245,565 | | | | 4.500 | | | | 08/01/19 | | | | 238,151 | |
| | | | 7,346,023 | | | | 4.500 | | | | 09/01/19 | | | | 7,133,991 | |
| | | | 435,112 | | | | 5.000 | | | | 11/01/19 | | | | 429,645 | |
| | | | 817,394 | | | | 5.000 | | | | 12/01/19 | | | | 807,854 | |
| | | | 2,100,273 | | | | 4.500 | | | | 03/01/20 | | | | 2,039,652 | |
| | | | 5,479,757 | | | | 4.500 | | | | 04/01/20 | | | | 5,321,592 | |
| | | | 11,948 | | | | 7.500 | | | | 03/01/29 | | | | 12,470 | |
| | | | 8,939 | | | | 7.500 | | | | 08/01/29 | | | | 9,330 | |
| | | | 4,184 | | | | 7.500 | | | | 11/01/29 | | | | 4,367 | |
| | | | 55,028 | | | | 6.500 | | | | 12/01/30 | | | | 56,675 | |
| | | | 58,134 | | | | 7.500 | | | | 12/01/30 | | | | 59,973 | |
| | | | 128,263 | | | | 8.000 | | | | 01/01/31 | | | | 134,511 | |
| | | | 65,414 | | | | 8.000 | | | | 02/01/31 | | | | 68,967 | |
| | | | 680,314 | | | | 7.000 | | | | 03/01/31 | | | | 707,548 | |
| | | | 15,208 | | | | 6.500 | | | | 09/01/33 | | | | 15,643 | |
| | | | 2,946,130 | | | | 7.500 | | | | 09/01/34 | | | | 3,069,528 | |
| | | | 3,040,624 | | | | 7.500 | | | | 09/01/35 | | | | 3,153,456 | |
| | | | 2,240,974 | | | | 7.500 | | | | 10/01/35 | | | | 2,324,132 | |
| | | | 2,291,466 | | | | 7.500 | | | | 02/01/36 | | | | 2,375,898 | |
| | | | 649,504 | | | | 7.500 | | | | 05/01/36 | | | | 673,436 | |
| | | | 2,384,361 | | | | 7.500 | | | | 07/01/36 | | | | 2,472,215 | |
| | | | 746,970 | | | | 7.500 | | | | 08/01/36 | | | | 774,493 | |
| | | | 2,338,671 | | | | 7.500 | | | | 09/01/36 | | | | 2,424,841 | |
| | | | 1,137,677 | | | | 7.500 | | | | 10/01/36 | | | | 1,179,596 | |
| | | | 1,453,210 | | | | 7.500 | | | | 11/01/36 | | | | 1,506,755 | |
| | | | 788,919 | | | | 8.000 | | | | 11/01/36 | | | | 832,490 | |
| | | | 1,866,615 | | | | 7.500 | | | | 12/01/36 | | | | 1,935,392 | |
| | | | | | | | | | | | | | | | | |
| | | | | | | | | | | | | | | | 226,519,005 | |
| | | |
| | | TOTAL MORTGAGE-BACKED OBLIGATIONS |
| | | (Cost $1,093,527,240) | | $ | 1,094,796,348 | |
| | | |
| | |
Agency Debentures – 15.2% |
| |
| | | FFCB |
| | | $ | 2,500,000 | | | | 3.250 | % | | | 06/15/07 | | | $ | 2,494,007 | |
| | | | 2,000,000 | | | | 3.625 | | | | 01/04/08 | | | | 1,978,944 | |
| | | | 3,000,000 | | | | 3.150 | | | | 07/21/08 | | | | 2,934,111 | |
| | | | 750,000 | | | | 5.200 | | | | 02/24/10 | | | | 747,801 | |
| | | | 420,000 | | | | 5.810 | | | | 01/10/11 | | | | 434,163 | |
| | | | 750,000 | | | | 4.650 | | | | 11/29/11 | | | | 738,256 | |
| | | | 250,000 | | | | 5.220 | | | | 10/20/14 | | | | 246,817 | |
| | | | 9,000,000 | | | | 4.830 | | | | 12/22/14 | | | | 8,948,727 | |
| | | | 2,000,000 | | | | 5.200 | | | | 03/21/16 | | | | 2,034,522 | |
| | | | 500,000 | | | | 5.625 | | | | 10/19/20 | | | | 493,410 | |
| | | | 2,000,000 | | | | 5.300 | | | | 08/25/26 | | | | 2,015,956 | |
| | | FHLB |
| | | | 100,000,000 | | | | 4.800 | | | | 05/02/08 | | | | 99,750,600 | |
| | | | 800,000 | | | | 4.500 | | | | 06/06/08 | | | | 795,242 | |
| | | | 500,000 | | | | 4.050 | | | | 08/13/08 | | | | 494,231 | |
| | | | 2,565,000 | | | | 5.800 | | | | 09/02/08 | | | | 2,590,670 | |
| | | | 325,000 | | | | 5.250 | | | | 11/14/08 | | | | 326,357 | |
| | | | 875,000 | | | | 5.490 | | | | 12/22/08 | | | | 882,903 | |
| | | | 5,000,000 | | | | 5.375 | (e) | | | 05/15/09 | | | | 5,046,392 | |
| | | | 10,000,000 | | | | 6.715 | | | | 06/29/09 | | | | 10,380,180 | |
| | | | 10,000,000 | | | | 6.500 | | | | 08/14/09 | | | | 10,346,593 | |
| | | | 400,000 | | | | 4.280 | | | | 10/30/09 | | | | 394,081 | |
| | | | 1,250,000 | | | | 4.750 | | | | 03/30/10 | | | | 1,239,595 | |
| | | | 200,000 | | | | 5.000 | | | | 03/30/10 | | | | 199,380 | |
| | | | 550,000 | | | | 4.000 | | | | 04/22/10 | | | | 538,209 | |
| | | | 1,500,000 | | | | 5.000 | (b) | | | 08/09/10 | | | | 1,482,795 | |
| | | | 750,000 | | | | 5.200 | | | | 10/28/10 | | | | 747,571 | |
| | | | 500,000 | | | | 5.000 | (b) | | | 02/24/11 | | | | 499,704 | |
| | | | 100,000 | | | | 6.000 | | | | 05/13/11 | | | | 104,240 | |
| | | | 1,000,000 | | | | 5.000 | | | | 08/03/11 | | | | 992,019 | |
| | | | 9,595,000 | | | | 4.250 | | | | 11/15/11 | | | | 9,373,893 | |
| | | | 1,000,000 | | | | 4.750 | | | | 02/16/12 | | | | 984,026 | |
| | | | 500,000 | | | | 5.000 | | | | 02/21/12 | | | | 495,465 | |
| | | | 1,200,000 | | | | 5.250 | | | | 05/03/12 | | | | 1,192,619 | |
| | | | 2,500,000 | | | | 4.750 | | | | 03/26/13 | | | | 2,450,080 | |
| | | | 200,000 | | | | 4.750 | (b) | | | 10/29/13 | | | | 198,561 | |
| | | | 500,000 | | | | 5.500 | (b) | | | 01/30/15 | | | | 499,108 | |
| | | | 1,000,000 | | | | 5.740 | | | | 04/20/15 | | | | 996,183 | |
| | | | 2,000,000 | | | | 5.200 | | | | 04/23/18 | | | | 1,950,572 | |
| | | | 500,000 | | | | 4.000 | (b) | | | 06/26/18 | | | | 490,704 | |
| | | | 500,000 | | | | 5.650 | | | | 03/22/19 | | | | 493,475 | |
| | | | 500,000 | | | | 5.300 | | | | 11/04/19 | | | | 487,775 | |
| | | | 500,000 | | | | 5.850 | | | | 12/27/19 | | | | 495,277 | |
| | | | 2,000,000 | | | | 5.400 | | | | 12/30/19 | | | | 2,055,940 | |
| | | FHLMC |
| | | | 1,950,000 | | | | 3.500 | | | | 09/15/07 | | | | 1,938,440 | |
| | | | 10,540,000 | | | | 3.650 | | | | 01/23/08 | | | | 10,423,006 | |
| | | | 200,000 | | | | 3.250 | | | | 03/14/08 | | | | 196,766 | |
| | | | 50,000 | | | | 5.750 | | | | 04/15/08 | | | | 50,271 | |
| | | | 40,000,000 | | | | 4.480 | | | | 09/19/08 | | | | 39,720,632 | |
| | | | 750,000 | | | | 4.850 | | | | 12/01/09 | | | | 745,105 | |
| | | | 1,810,000 | | | | 5.125 | | | | 07/15/12 | | | | 1,835,148 | |
| | | | 750,000 | | | | 5.250 | | | | 11/05/12 | | | | 747,022 | |
| | | | 1,500,000 | | | | 4.800 | | | | 07/30/13 | | | | 1,468,071 | |
| | | | 500,000 | | | | 5.125 | | | | 08/06/13 | | | | 493,524 | |
| | | | 10,500,000 | | | | 5.000 | | | | 01/30/14 | | | | 10,551,534 | |
| | | | 895,000 | | | | 5.000 | (b) | | | 08/26/14 | | | | 889,386 | |
| | | | 1,500,000 | | | | 4.000 | (b) | | | 10/14/14 | | | | 1,490,592 | |
| | | | 500,000 | | | | 5.000 | | | | 10/27/14 | | | | 502,796 | |
| | | | 750,000 | | | | 5.000 | | | | 11/13/14 | | | | 753,485 | |
The accompanying notes are an integral part of these financial statements.
43
GOLDMAN SACHS CORE FIXED INCOME FUND
Schedule of Investments (continued)
April 30, 2007 (Unaudited)
| | | | | | | | | | | | | | | | | |
| | | Principal | | Interest | | Maturity | | |
| | | Amount* | | Rate | | Date | | Value |
| | |
Agency Debentures – (continued) |
| |
| | | FHLMC – (continued) |
| | | $ | 1,000,000 | | | | 5.400 | % | | | 09/22/15 | | | $ | 988,481 | |
| | | | 1,500,000 | | | | 5.000 | | | | 10/20/16 | | | | 1,454,362 | |
| | | | 800,000 | | | | 5.250 | | | | 03/17/17 | | | | 780,316 | |
| | | | 2,000,000 | | | | 5.000 | (b) | | | 02/13/18 | | | | 1,986,484 | |
| | | | 500,000 | | | | 4.500 | (b) | | | 07/15/18 | | | | 483,084 | |
| | | | 496,000 | | | | 5.000 | | | | 07/30/18 | | | | 476,518 | |
| | | | 1,000,000 | | | | 5.125 | (b) | | | 08/01/18 | | | | 988,148 | |
| | | | 1,135,000 | | | | 5.000 | | | | 06/11/21 | | | | 1,070,785 | |
| | | FNMA |
| | | | 2,850,000 | | | | 5.750 | | | | 02/15/08 | | | | 2,862,198 | |
| | | | 50,000,000 | | | | 4.200 | | | | 03/24/08 | | | | 49,553,900 | |
| | | | 1,000,000 | | | | 4.000 | | | | 09/02/08 | | | | 986,477 | |
| | | | 1,250,000 | | | | 5.250 | | | | 01/15/09 | | | | 1,257,485 | |
| | | | 500,000 | | | | 4.000 | | | | 11/30/09 | | | | 490,201 | |
| | | | 200,000 | | | | 4.250 | | | | 07/28/10 | | | | 196,247 | |
| | | | 5,150,000 | | | | 6.250 | | | | 02/01/11 | | | | 5,381,408 | |
| | | | 19,560,000 | | | | 5.300 | | | | 02/22/11 | | | | 19,512,948 | |
| | | | 1,000,000 | | | | 4.550 | | | | 03/09/11 | | | | 984,264 | |
| | | | 750,000 | | | | 5.375 | | | | 11/15/11 | | | | 767,698 | |
| | | | 11,000,000 | | | | 5.625 | | | | 02/28/12 | | | | 10,975,959 | |
| | | | 4,600,000 | | | | 5.250 | | | | 08/01/12 | | | | 4,657,489 | |
| | | | 1,000,000 | | | | 4.250 | (b) | | | 10/19/12 | | | | 994,820 | |
| | | | 300,000 | | | | 5.000 | | | | 04/15/13 | | | | 296,222 | |
| | | | 500,000 | | | | 4.625 | | | | 10/15/14 | | | | 491,416 | |
| | | | 500,000 | | | | 5.310 | | | | 11/03/14 | | | | 494,743 | |
| | | | 800,000 | | | | 5.000 | | | | 04/26/17 | | | | 778,093 | |
| | | | 669,000 | | | | 5.250 | | | | 03/11/22 | | | | 640,750 | |
| | | | 306,000 | | | | 5.000 | | | | 06/16/28 | | | | 282,165 | |
| | | Small Business Administration |
| | | | 737,209 | | | | 6.300 | | | | 06/01/18 | | | | 756,855 | |
| | | Tennessee Valley Authority |
| | | | 200,000 | | | | 5.625 | | | | 01/18/11 | | | | 205,722 | |
| | | |
| | | TOTAL AGENCY DEBENTURES |
| | | (Cost $365,166,215) | | $ | 364,642,170 | |
| | | |
| | |
Asset-Backed Securities – 3.5% |
| |
| | | Credit Card – 0.1% |
| | | MBNA Master Credit Card Trust II Series 1999-J, Class A |
| | | $ | 3,000,000 | | | | 7.000 | % | | | 02/15/12 | | | $ | 3,138,240 | |
| | | |
| | | Home Equity(b) – 3.0% |
| | | Amortizing Residential Collateral Trust Series 2002-BC1M, Class A |
| | | | 1,034,917 | | | | 5.600 | | | | 01/01/32 | | | | 1,035,888 | |
| | | ContiMortgage Home Equity Loan Trust Series 1999-1, Class A7 |
| | | | 6,114 | | | | 6.970 | | | | 12/25/13 | | | | 6,090 | |
| | | Countrywide Home Equity Loan Trust Series 2002-E, Class A |
| | | | 2,220,324 | | | | 5.580 | | | | 10/15/28 | | | | 2,220,322 | |
| | | Countrywide Home Equity Loan Trust Series 2003-A, Class A |
| | | | 7,144,933 | | | | 5.670 | | | | 03/15/29 | | | | 7,156,295 | |
| | | Countrywide Home Equity Loan Trust Series 2004-G, Class 2A |
| | | | 1,364,887 | | | | 5.540 | | | | 12/15/29 | | | | 1,366,596 | |
| | | Countrywide Home Equity Loan Trust Series 2004-S, Class 1A |
| | | | 4,443,826 | | | | 5.560 | | | | 02/15/30 | | | | 4,447,348 | |
| | | Countrywide Home Equity Loan Trust Series 2005-I, Class 2A |
| | | | 9,488,104 | | | | 5.550 | | | | 02/15/36 | | | | 9,446,594 | |
| | | Countrywide Home Equity Loan Trust Series 2006-H, Class 2A1B |
| | | | 33,434,944 | | | | 5.470 | | | | 11/15/36 | | | | 33,372,254 | |
| | | First Franklin Mortgage Loan Asset Backed Certificates Series 2004-FF11, Class 2A2 |
| | | | 914,874 | | | | 5.600 | | | | 01/25/35 | | | | 914,874 | |
| | | Impac CMB Trust Series 2004-10, Class 2A |
| | | | 4,537,359 | | | | 5.640 | | | | 03/25/35 | | | | 4,550,348 | |
| | | Impac CMB Trust Series 2004-8, Class 1A |
| | | | 1,680,520 | | | | 5.680 | | | | 10/25/34 | | | | 1,680,789 | |
| | | Morgan Stanley ABS Capital I Series 2004-HE1, Class A4 |
| | | | 4,071,384 | | | | 5.690 | | | | 01/25/34 | | | | 4,078,673 | |
| | | Popular Asset Backed Securities Mortgage Pass-Through Trust Series 2004-5, Class AV2 |
| | | | 1,297,688 | | | | 5.660 | | | | 12/25/34 | | | | 1,299,919 | |
| | | | | | | | | | | | | | | | | |
| | | | | | | | | | | | | | | | 71,575,990 | |
| | | |
| | | Manufactured Housing – 0.1% |
| | | Mid-State Trust Series 4, Class A |
| | | | 1,781,213 | | | | 8.330 | | | | 04/01/30 | | | | 1,900,323 | |
| | | |
| | | Utilities – 0.3% |
| | | Massachusetts RRB Special Purpose Trust Series 1999-1, Class A5 |
| | | | 6,150,000 | | | | 7.030 | | | | 03/15/12 | | | | 6,360,084 | |
| | | |
| | | TOTAL ASSET-BACKED SECURITIES |
| | | (Cost $83,285,373) | | $ | 82,974,637 | |
| | | |
| | |
U.S. Treasury Obligations – 10.1% |
| |
| | | United States Treasury Bond |
| | | $ | 55,330,000 | | | | 4.500 | % | | | 02/15/36 | | | $ | 52,485,485 | |
| | | United States Treasury Inflation Protected Securities |
| | | | 6,584,340 | | | | 2.000 | | | | 07/15/14 | | | | 6,532,982 | |
| | | | 265,633 | | | | 1.625 | | | | 01/15/15 | | | | 255,589 | |
| | | | 3,451,899 | | | | 1.875 | | | | 07/15/15 | | | | 3,380,686 | |
| | | | 7,858,344 | | | | 2.500 | | | | 07/15/16 | | | | 8,074,448 | |
| | | | 2,914,380 | | | | 2.375 | | | | 01/15/25 | | | | 2,929,748 | |
| | | | 5,145,492 | | | | 2.375 | | | | 01/15/27 | | | | 5,183,481 | |
| | | United States Treasury Notes |
| | | | 3,000,000 | | | | 3.625 | | | | 01/15/10 | | | | 2,930,700 | |
| | | | 150,000 | | | | 3.500 | | | | 02/15/10 | | | | 145,958 | |
| | | | 1,000,000 | | | | 6.500 | | | | 02/15/10 | | | | 1,050,770 | |
| | | | 500,000 | | | | 4.000 | | | | 03/15/10 | | | | 493,030 | |
| | | | 500,000 | | | | 4.500 | | | | 02/28/11 | | | | 500,000 | |
| | | | 1,750,000 | | | | 4.000 | | | | 11/15/12 | | | | 1,707,930 | |
| | | | 200,000 | | | | 4.750 | | | | 05/15/14 | | | | 202,196 | |
| | | | 750,000 | | | | 4.250 | | | | 11/15/14 | | | | 734,355 | |
| | | | 74,600,000 | | | | 4.875 | | | | 08/15/16 | | | | 75,996,514 | |
The accompanying notes are an integral part of these financial statements.
44
GOLDMAN SACHS CORE FIXED INCOME FUND
| | | | | | | | | | | | | | | | | |
| | | Principal | | Interest | | Maturity | | |
| | | Amount* | | Rate | | Date | | Value |
| | |
U.S. Treasury Obligations – (continued) |
| |
| | | United States Treasury Principal-Only STRIPS(d) |
| | | $ | 560,000 | | | | 0.000 | % | | | 05/15/18 | | | $ | 332,315 | |
| | | | 10,200,000 | | | | 0.000 | | | | 05/15/20 | | | | 5,421,300 | |
| | | | 1,800,000 | | | | 0.000 | | | | 08/15/20 | | | | 943,794 | |
| | | | 128,500,000 | | | | 0.000 | | | | 11/15/21 | | | | 63,042,100 | |
| | | | 6,250,000 | | | | 0.000 | | | | 11/15/22 | | | | 2,919,375 | |
| | | | 400,000 | | | | 0.000 | | | | 02/15/25 | | | | 166,632 | |
| | | | 8,500,000 | | | | 0.000 | | | | 08/15/26 | | | | 3,296,470 | |
| | | | 7,300,000 | | | | 0.000 | | | | 11/15/26 | | | | 2,798,966 | |
| | | |
| | | TOTAL U.S. TREASURY OBLIGATIONS |
| | | (Cost $242,098,707) | | $ | 241,524,824 | |
| | | |
| | |
Emerging Market Debt(a)(b) – 0.3% |
| |
| | | Regional Banks – 0.3% |
| | | VTB Capital (Vneshtorgbank) |
| | | $ | 7,980,000 | | | | 5.960 | % | | | 08/01/08 | | | $ | 7,987,980 | |
| | | (Cost $7,980,000) | | | | |
| | | |
| | | TOTAL INVESTMENTS BEFORE REPURCHASE AGREEMENT – 92.2% |
| | | (Cost $2,201,588,993) | | $ | 2,205,201,023 | |
| | | |
| | |
Repurchase Agreement(g) – 1.6% |
| |
| | | Joint Repurchase Agreement Account II |
| | | $ | 39,400,000 | | | | 5.242 | % | | | 05/01/07 | | | $ | 39,400,000 | |
| | | Maturity Value: $39,405,737 |
| | | (Cost $39,400,000) | | | | |
| | | |
| | | TOTAL INVESTMENTS – 93.8% |
| | | (Cost $2,240,988,993) | | $ | 2,244,601,023 | |
| | | |
| | | OTHER ASSETS IN EXCESS OF LIABILITIES – 6.2% | | | 147,919,018 | |
| | | |
| | | NET ASSETS – 100.0% | | $ | 2,392,520,041 | |
| | | |
| |
| | The percentage shown for each investment category reflects the value of investments in that category as a percentage of net assets. |
| | |
| | * | The principal amount of each security is stated in the currency in which the bond is denominated. All amounts shown are in U.S. dollars unless otherwise noted. See below. |
| | | | | |
| Currency Description |
| |
| EUR = Euro Currency |
| |
| (a) | Securities are exempt from registration under Rule 144A of the Securities Act of 1933. Under procedures approved by the Board of Trustees, such securities have been determined to be liquid by the Investment Adviser and may be resold, normally to qualified institutional buyers in transactions exempt from registration. Total market value of Rule 144A securities amounts to $87,044,675, which represents approximately 3.6% of net assets as of April 30, 2007. |
| |
| (b) | Variable rate security. Interest rate disclosed is that which is in effect at April 30, 2007. |
| |
| (c) | Represents security with nominal principal amount. The actual effective yield of this security is different than the stated interest rate. |
| |
| (d) | Security issued with a zero coupon. Income is recognized through the accretion of discount. |
| |
| (e) | A portion of this security is segregated as collateral for initial margin requirement on futures transactions. |
| |
| (f) | Security is issued with zero coupon and interest rate is contingent upon LIBOR reaching a predetermined level. |
| |
| (g) | Joint repurchase agreement was entered into on April 30, 2007. Additional information appears on page 63. |
| | | | | | | |
| | | |
| | | Investment Abbreviations: |
| | | FFCB | | — | | Federal Farm Credit Bank |
| | | FHLB | | — | | Federal Home Loan Bank |
| | | FHLMC | | — | | Federal Home Loan Mortgage Corp. |
| | | FNMA | | — | | Federal National Mortgage Association |
| | | GNMA | | — | | Government National Mortgage Association |
| | | LIBOR | | — | | London Interbank Offered Rate |
| | | MTN | | — | | Medium-Term Note |
| | | REIT | | — | | Real Estate Investment Trust |
| | | REMIC | | — | | Real Estate Mortgage Investment Conduit |
| | | STRIPS | | — | | Separate Trading of Registered Interest and Principal of Securities |
| | | |
The accompanying notes are an integral part of these financial statements.
45
GOLDMAN SACHS CORE FIXED INCOME FUND
Schedule of Investments (continued)
April 30, 2007 (Unaudited)
| ADDITIONAL INVESTMENT INFORMATION |
FORWARD FOREIGN CURRENCY CONTRACTS — At April 30, 2007, the Fund had outstanding forward foreign currency exchange contracts, both to purchase and sell foreign currencies:
| | | | | | | | | | | | | | | | | | | | | |
| Open Forward Foreign Currency | | Purchase/ | | Expiration | | Value on | | Current | | Unrealized |
| Contracts with Unrealized Gain | | Sale Contract | | Date | | Settlement Date | | Value | | Gain |
| |
| Australian Dollar | | | Purchase | | | | 06/20/07 | | | $ | 27,980,747 | | | $ | 28,955,198 | | | $ | 974,451 | |
| British Pound | | | Purchase | | | | 06/20/07 | | | | 66,536,092 | | | | 68,798,478 | | | | 2,262,386 | |
| Canadian Dollar | | | Purchase | | | | 06/20/07 | | | | 28,296,000 | | | | 29,354,039 | | | | 1,058,039 | |
| Euro | | | Purchase | | | | 06/20/07 | | | | 42,244,348 | | | | 43,173,872 | | | | 929,524 | |
| Euro | | | Sale | | | | 06/20/07 | | | | 28,766,000 | | | | 28,757,930 | | | | 8,070 | |
| Japanese Yen | | | Sale | | | | 06/20/07 | | | | 65,352,333 | | | | 64,097,332 | | | | 1,255,001 | |
| New Zealand Dollar | | | Purchase | | | | 06/20/07 | | | | 20,911,000 | | | | 21,795,003 | | | | 884,003 | |
| Norwegian Krone | | | Purchase | | | | 06/20/07 | | | | 58,723,275 | | | | 60,427,043 | | | | 1,703,768 | |
| Swedish Krona | | | Purchase | | | | 06/20/07 | | | | 16,811,179 | | | | 17,388,993 | | | | 577,814 | |
| Swiss Franc | | | Purchase | | | | 06/20/07 | | | | 35,305,000 | | | | 35,445,429 | | | | 140,429 | |
| Swiss Franc | | | Sale | | | | 06/20/07 | | | | 27,191,875 | | | | 27,094,402 | | | | 97,473 | |
| |
| TOTAL OPEN FORWARD FOREIGN CURRENCY CONTRACTS WITH UNREALIZED GAIN | | | | | | | | | | $ | 9,890,958 | |
| |
| | | | | | | | | | | | | | | | | | | | | |
| Open Forward Foreign Currency | | Purchase/ | | Expiration | | Value on | | Current | | Unrealized |
| Contracts with Unrealized Loss | | Sale Contract | | Date | | Settlement Date | | Value | | Loss |
| |
| British Pound | | | Sale | | | | 05/16/07 | | | $ | 2,795,756 | | | $ | 2,850,405 | | | $ | (54,649 | ) |
| British Pound | | | Purchase | | | | 06/20/07 | | | | 14,350,000 | | | | 14,336,212 | | | | (13,788 | ) |
| British Pound | | | Sale | | | | 06/20/07 | | | | 49,232,980 | | | | 50,190,800 | | | | (957,820 | ) |
| Canadian Dollar | | | Sale | | | | 06/20/07 | | | | 35,279,547 | | | | 37,287,266 | | | | (2,007,719 | ) |
| Euro | | | Sale | | | | 05/30/07 | | | | 4,447,973 | | | | 4,456,280 | | | | (8,307 | ) |
| Euro | | | Sale | | | | 06/20/07 | | | | 35,060,072 | | | | 35,733,735 | | | | (673,663 | ) |
| Japanese Yen | | | Purchase | | | | 06/20/07 | | | | 42,231,000 | | | | 41,376,112 | | | | (854,888 | ) |
| New Zealand Dollar | | | Sale | | | | 06/20/07 | | | | 19,144,738 | | | | 20,399,894 | | | | (1,255,156 | ) |
| Norwegian Krone | | | Sale | | | | 06/20/07 | | | | 28,168,000 | | | | 28,872,361 | | | | (704,361 | ) |
| Swedish Krona | | | Sale | | | | 06/20/07 | | | | 7,117,000 | | | | 7,438,350 | | | | (321,350 | ) |
| Swiss Franc | | | Purchase | | | | 06/20/07 | | | | 35,730,000 | | | | 35,584,288 | | | | (145,712 | ) |
| Swiss Franc | | | Sale | | | | 06/20/07 | | | | 40,681,462 | | | | 41,085,278 | | | | (403,816 | ) |
| |
| TOTAL OPEN FORWARD FOREIGN CURRENCY CONTRACTS WITH UNREALIZED LOSS | | | | | | | | | | $ | (7,401,229 | ) |
| |
The accompanying notes are an integral part of these financial statements.
46
GOLDMAN SACHS CORE FIXED INCOME FUND
| ADDITIONAL INVESTMENT INFORMATION (continued) |
FUTURES CONTRACTS — At April 30, 2007, the following futures contracts were open:
| | | | | | | | | | | | | | | | | |
| | | Number of | | | | | | |
| | | Contracts | | Settlement | | Market | | Unrealized |
| Type | | Long (Short) | | Month | | Value | | Gain (Loss) |
| |
| Eurodollars | | | 432 | | | | June 2007 | | | $ | 102,249,000 | | | $ | (74,560 | ) |
| Eurodollars | | | 64 | | | | September 2007 | | | | 15,168,000 | | | | (30,618 | ) |
| Eurodollars | | | (257 | ) | | | December 2007 | | | | (61,031,075 | ) | | | 88,148 | |
| Eurodollars | | | 158 | | | | March 2008 | | | | 37,598,075 | | | | 42,913 | |
| Eurodollars | | | 92 | | | | June 2008 | | | | 21,923,600 | | | | 58,337 | |
| U.S. Treasury Bonds | | | (169 | ) | | | June 2007 | | | | (18,885,750 | ) | | | (80,281 | ) |
| 2 Year U.S. Treasury Notes | | | (64 | ) | | | June 2007 | | | | (13,102,000 | ) | | | (33,024 | ) |
| 5 Year U.S. Treasury Notes | | | 1,969 | | | | June 2007 | | | | 208,375,578 | | | | 557,079 | |
| 10 Year U.S. Treasury Notes | | | (2,064 | ) | | | June 2007 | | | | (223,589,250 | ) | | | (155,465 | ) |
| |
TOTAL | | | | | | | | | | $ | 68,706,178 | | | $ | 372,529 | |
| |
SWAP CONTRACTS — At April 30, 2007, the Fund had outstanding swap contracts with the following terms:
INTEREST RATE SWAP CONTRACTS
| | | | | | | | | | | | | | | | | | | | | | | | | |
| | | | | | | Rates Exchanged | | | | |
| | | | | | | | | | | |
| | | Notional | | | | Payments | | Payments | | Upfront Payments | | |
| | | Amount | | Termination | | received by | | made by | | made (received) | | Unrealized |
| Swap Counterparty | | (000s) | | Date | | the Fund | | the Fund | | by the Fund | | Gain (Loss) |
| |
| Banc of America Securities LLC | | $ | 100,000 | | | | 10/14/08 | | | | 3.514% | | | 3 month LIBOR | | $ | — | | | $ | (2,449,900 | ) |
Banc of America Securities LLC(a) | | | 127,100 | | | | 06/21/10 | | | | 5.000 | | | 3 month LIBOR | | | 703,835 | | | | (708,017 | ) |
| Banc of America Securities LLC | | | 80,000 | | | | 09/02/10 | | | | 4.309 | | | 3 month LIBOR | | | — | | | | (1,901,633 | ) |
| Banc of America Securities LLC | | | 65,000 | | | | 10/06/10 | | | | 4.702 | | | 3 month LIBOR | | | — | | | | (688,743 | ) |
| Banc of America Securities LLC | | | 65,000 | | | | 04/19/12 | | | | 4.547 | | | 3 month LIBOR | | | — | | | | (1,276,996 | ) |
Deutsche Bank Securities, Inc.(a) | | | AUD 170,600 | | | | 06/20/12 | | | | 6.250 | | | 6 month BBSW | | | (715,020 | ) | | | (772,171 | ) |
Deutsche Bank Securities, Inc.(a) | | | AUD 170,600 | | | | 06/20/12 | | | 6 month BBSW | | | 6.250% | | | | 2,290,136 | | | | (802,945 | ) |
Banc of America Securities LLC(a) | | $ | 364,100 | | | | 06/20/12 | | | | 5.000 | | | 3 month LIBOR | | | 1,045,280 | | | | (639,704 | ) |
Deutsche Bank Securities, Inc.(a) | | | 556,300 | | | | 06/20/12 | | | | 5.000 | | | 3 month LIBOR | | | 1,416,445 | | | | (798,695 | ) |
Deutsche Bank Securities, Inc.(a) | | | 585,350 | | | | 06/20/12 | | | 3 month LIBOR | | | 5.000 | | | | 1,953,436 | | | | (2,575,543 | ) |
JPMorgan Securities, Inc.(a) | | | 90,400 | | | | 06/20/12 | | | 3 month LIBOR | | | 5.000 | | | | 644,432 | | | | (744,817 | ) |
Banc of America Securities LLC(a) | | | 474,900 | | | | 06/20/12 | | | 3 month LIBOR | | | 5.000 | | | | 2,041,018 | | | | (2,569,191 | ) |
Bear Stearns & Co., Inc.(a) | | | 74,000 | | | | 06/20/12 | | | 3 month LIBOR | | | 5.000 | | | | 499,931 | | | | (582,105 | ) |
Banc of America Securities LLC(a) | | | 93,000 | | | | 06/20/14 | | | | 5.100 | | | 3 month LIBOR | | | 1,569,924 | | | | (1,333,537 | ) |
JPMorgan Securities, Inc.(a) | | | 100,000 | | | | 06/20/14 | | | | 5.100 | | | 3 month LIBOR | | | 1,101,249 | | | | (847,069 | ) |
Deutsche Bank Securities, Inc.(a) | | | 552,300 | | | | 06/20/14 | | | | 5.100 | | | 3 month LIBOR | | | 3,241,004 | | | | (1,809,840 | ) |
JPMorgan Securities, Inc.(a) | | | 168,700 | | | | 06/20/14 | | | 3 month LIBOR | | | 5.100 | | | | 1,046,763 | | | | (1,475,564 | ) |
Banc of America Securities LLC(a) | | | 254,900 | | | | 06/20/14 | | | 3 month LIBOR | | | 5.100 | | | | 250,202 | | | | (898,108 | ) |
Deutsche Bank Securities, Inc.(a) | | | 18,700 | | | | 06/20/14 | | | 3 month LIBOR | | | 5.100 | | | | 135,329 | | | | (182,861 | ) |
| Banc of America Securities LLC | | | 11,000 | | | | 05/26/15 | | | | 4.532 | | | 3 month LIBOR | | | — | | | | (299,418 | ) |
| Banc of America Securities LLC | | | 25,000 | | | | 10/19/15 | | | | 4.965 | | | 3 month LIBOR | | | — | | | | (259,775 | ) |
| Bear Stearns & Co., Inc. | | | 85,000 | | | | 06/19/16 | | | | 5.666 | | | 3 month LIBOR | | | — | | | | 4,492,864 | |
JPMorgan Securities, Inc.(a) | | | 69,700 | | | | 06/20/17 | | | | 5.100 | | | 3 month LIBOR | | | 1,058,298 | | | | (1,402,743 | ) |
| Banc of America Securities LLC | | | 80,000 | | | | 03/23/20 | | | 3 month LIBOR | | | 5.108 | | | | — | | | | 1,105,797 | |
Banc of America Securities LLC(a) | | | 65,400 | | | | 06/20/22 | | | | 5.250 | | | 3 month LIBOR | | | (157,681 | ) | | | (174,166 | ) |
| Banc of America Securities LLC | | | 9,000 | | | | 03/30/35 | | | | 5.320 | | | 3 month LIBOR | | | — | | | | (81,940 | ) |
| Banc of America Securities LLC | | | 10,000 | | | | 04/09/35 | | | | 5.265 | | | 3 month LIBOR | | | — | | | | (170,387 | ) |
| |
TOTAL | | | | | | | | | | | | | | | | | | $ | 18,124,581 | | | $ | (19,847,207 | ) |
| |
| |
| (a) | Represents forward starting interest rate swap whose effective dates of commencement of accruals and cash flows occur subsequent to April 30, 2007. |
AUD —Australian Dollar
BBSW —Australian Bank Bill Swap Rate
LIBOR—London Interbank Offered Rate
The accompanying notes are an integral part of these financial statements.
47
GOLDMAN SACHS CORE FIXED INCOME FUND
Schedule of Investments (continued)
April 30, 2007 (Unaudited)
| ADDITIONAL INVESTMENT INFORMATION (continued) |
CREDIT DEFAULT SWAP CONTRACTS
| | | | | | | | | | | | | | | | | | | | | | | |
| | | | | Notional | | Rate | | | | Upfront Payments | | Unrealized |
| | | | | Amount | | Paid by | | Termination | | made (received) | | Gain |
| Referenced Obligation | | Swap Counterparty | | (000s) | | Fund | | Date | | by the Fund | | (Loss) |
| |
Protection Purchased: | | | | | | | | | | | | | | | | | | | | | | |
| Core Investment Grade Bond Trust | | JPMorgan Securities, Inc. | | $ | 280,500 | | | | 0.400% | | | | 12/20/11 | | | $ | (548,865 | ) | | $ | (131,143 | ) |
| Core Investment Grade Bond Trust | | Banc of America Securities LLC | | | 126,000 | | | | 0.350 | | | | 06/20/12 | | | | 200,491 | | | | (193,730 | ) |
PHH Corp.
7.125% 03/01/13 | | Bear Stearns & Co., Inc. | | | 2,600 | | | | 1.150 | | | | 06/20/13 | | | | — | | | | (99,339 | ) |
| Core Investment Grade Bond Trust | | JPMorgan Securities, Inc. | | | 65,000 | | | | 0.650 | | | | 12/20/16 | | | | (314,106 | ) | | | 265,074 | |
| Core Investment Grade Bond Trust | | Banc of America Securities LLC | | | 17,000 | | | | 0.650 | | | | 12/20/16 | | | | 9,343 | | | | (22,166 | ) |
| |
TOTAL | | | | | | | | | | | | | | | | $ | (653,137 | ) | | $ | (181,304 | ) |
| |
TOTAL RETURN INDEX SWAP CONTRACTS
| | | | | | | | | | | | | | | | | |
| | | Notional | | | | | | | | |
| | | Amount | | Termination | | Reference | | Payments | | Unrealized |
| Swap Counterparty | | (000s) | | Date | | Security | | to be Exchanged(a) | | Gain (Loss) |
| |
| JPMorgan Securities, Inc. | | $ | 51,000 | | | | 05/31/07 | | | Banc of America Securities LLC
CMBS AAA 10Yr Index | | Monthly duration adjusted return | | $ | 590 | |
| Banc of America Securities LLC | | | 28,000 | | | | 06/05/07 | | | Banc of America Securities LLC
CMBS AAA 10Yr Index | | Monthly duration adjusted return | | | (11,619 | ) |
| Banc of America Securities LLC | | | 20,000 | | | | 06/18/07 | | | Banc of America Securities LLC
CMBS AAA 10Yr Index | | Monthly duration adjusted return | | | (16,927 | ) |
| Banc of America Securities LLC | | | 21,000 | | | | 07/02/07 | | | Banc of America Securities LLC CMBS AAA 10Yr Index | | Monthly duration adjusted return | | | (8,714 | ) |
| Banc of America Securities LLC | | | 28,000 | | | | 07/18/07 | | | Banc of America Securities LLC
CMBS AAA 10Yr Index | | Monthly duration adjusted return | | | (20,100 | ) |
| Banc of America Securities LLC | | | 28,000 | | | | 08/01/07 | | | Banc of America Securities LLC
CMBS AAA 10Yr Index | | Monthly duration adjusted return | | | (12,168 | ) |
| JPMorgan Securities, Inc. | | | 22,000 | | | | 08/31/07 | | | Banc of America Securities LLC
CMBS AAA 10Yr Index | | Monthly duration adjusted return | | | 10,270 | |
| Banc of America Securities LLC | | | 22,000 | | | | 08/31/07 | | | Banc of America Securities LLC
CMBS AAA 10Yr Index | | Monthly duration adjusted return | | | 6,154 | |
| DMG & Partners | | | 27,000 | | | | 08/31/07 | | | Banc of America Securities LLC
CMBS AAA 10Yr Index | | Monthly duration adjusted return | | | 12,605 | |
| Banc of America Securities LLC | | | 25,000 | | | | 10/02/07 | | | Banc of America Securities LLC
CMBS AAA 10Yr Index | | Monthly duration adjusted return | | | (10,759 | ) |
| Banc of America Securities LLC | | | 25,000 | | | | 10/31/07 | | | Banc of America Securities LLC
CMBS AAA 10Yr Index | | Monthly duration adjusted return | | | (18,400 | ) |
| |
TOTAL | | | | | | | | | | | | | | $ | (69,068 | ) |
| |
| |
| (a) | Fund receives payments based on any positive monthly duration adjusted return of the underlying index. Fund makes payments on any such negative returns. |
The accompanying notes are an integral part of these financial statements.
48
GOLDMAN SACHS INVESTMENT GRADE CREDIT FUND
Schedule of Investments
April 30, 2007 (Unaudited)
| | | | | | | | | | | | | | | | | |
| | | Principal | | Interest | | Maturity | | |
| | | Amount* | | Rate | | Date | | Value |
| | |
Corporate Bonds – 100.3% |
| |
| | | Automotive – 3.2% |
| | | Chrysler Corp. |
| | | $ | 3,325,000 | | | | 7.450 | % | | | 03/01/27 | | | $ | 3,811,780 | |
| | | DaimlerChrysler NA |
| | | | 400,000 | | | | 8.500 | | | | 01/18/31 | | | | 504,492 | |
| | | Ford Motor Credit Co. |
| | | | 1,700,000 | | | | 5.700 | | | | 01/15/10 | | | | 1,640,760 | |
| | | General Motors Acceptance Corp. |
| | | | 1,275,000 | | | | 6.875 | | | | 09/15/11 | | | | 1,281,722 | |
| | | | | | | | | | | | | | | | | |
| | | | | | | | | | | | | | | | 7,238,754 | |
| | | |
| | | Banks – 17.7% |
| | | ANZ Capital Trust I(a) |
| | | | 325,000 | | | | 4.484 | | | | 01/15/49 | | | | 318,117 | |
| | | | 800,000 | | | | 5.360 | | | | 12/29/49 | | | | 787,286 | |
| | | Astoria Financial Corp. |
| | | | 225,000 | | | | 5.750 | | | | 10/15/12 | | | | 227,166 | |
| | | Banca Popolare di Bergamo Capital Trust(b) |
| | | | EUR 475,000 | | | | 8.364 | | | | 02/15/49 | | | | 725,527 | |
| | | Credit Suisse First Boston London(a)(b) |
| | | $ | 1,625,000 | | | | 7.900 | | | | 05/29/49 | | | | 1,628,455 | |
| | | Danske Bank A/S(a)(b) |
| | | | 300,000 | | | | 7.400 | | | | 06/15/10 | | | | 300,769 | |
| | | Greater Bay Bancorp Series D |
| | | | 2,700,000 | | | | 5.125 | | | | 04/15/10 | | | | 2,687,896 | |
| | | GreenPoint Financial Corp. |
| | | | 600,000 | | | | 3.200 | | | | 06/06/08 | | | | 586,732 | |
| | | HBOS PLC(a)(b) |
| | | | 1,750,000 | | | | 5.375 | | | | 12/29/49 | | | | 1,737,209 | |
| | | HSBC Capital Funding LP(a)(b) |
| | | | 1,050,000 | | | | 4.610 | | | | 06/27/49 | | | | 1,002,779 | |
| | | HSBC USA, Inc. |
| | | | 250,000 | | | | 6.625 | | | | 03/01/09 | | | | 256,696 | |
| | | Huntington National Bank |
| | | | 1,000,000 | | | | 8.000 | | | | 04/01/10 | | | | 1,071,663 | |
| | | JPMorgan Chase Capital Co. Series T |
| | | | 1,650,000 | | | | 6.550 | | | | 09/29/36 | | | | 1,685,988 | |
| | | Key Bank N.A.(c) |
| | | | 1,000,000 | | | | 6.500 | | | | 10/15/27 | | | | 1,016,723 | |
| | | Lehman Brothers Holdings E-Capital Trust I(b) |
| | | | 675,000 | | | | 6.140 | | | | 08/19/65 | | | | 682,858 | |
| | | Manufacturers & Traders Trust Co.(b) |
| | | | 1,495,000 | | | | 5.585 | | | | 12/28/20 | | | | 1,485,645 | |
| | | Mizuho JGB Investment LLC(a)(b) |
| | | | 1,275,000 | | | | 9.870 | | | | 06/30/49 | | | | 1,338,004 | |
| | | MUFG Capital Finance 1 Ltd.(b) |
| | | | 4,325,000 | | | | 6.346 | | | | 07/25/49 | | | | 4,421,344 | |
| | | Nordea Bank Sweden AB(a)(b) |
| | | | 2,380,000 | | | | 8.950 | | | | 11/12/49 | | | | 2,573,044 | |
| | | North Fork Bancorp.(b) |
| | | | 1,350,000 | | | | 5.000 | | | | 08/15/12 | | | | 1,348,657 | |
| | | PNC Funding Corp. |
| | | | 600,000 | | | | 7.500 | | | | 11/01/09 | | | | 632,956 | |
| | | Popular North America, Inc. |
| | | | 1,795,000 | | | | 4.250 | | | | 04/01/08 | | | | 1,765,289 | |
| | | RBS Capital Trust II(b) |
| | | | 1,000,000 | | | | 5.512 | | | | 09/30/49 | | | | 988,930 | |
| | | Resona Bank Ltd.(a)(b) |
| | | | EUR 1,475,000 | | | | 5.850 | | | | 04/15/49 | | | | 1,467,861 | |
| | | $ | 925,000 | | | | 4.125 | | | | 09/27/49 | | | | 1,219,250 | |
| | | Resona Preferred Global Securities Ltd.(a)(b) |
| | | | 2,175,000 | | | | 7.191 | | | | 07/30/49 | | | | 2,299,151 | |
| | | Royal Bank of Scotland Group PLC |
| | | | 400,000 | | | | 9.118 | | | | 03/31/49 | | | | 441,582 | |
| | | Sovereign Bank |
| | | | 1,000,000 | | | | 4.000 | | | | 02/01/08 | | | | 989,768 | |
| | | | 300,000 | | | | 5.125 | | | | 03/15/13 | | | | 294,455 | |
| | | | 455,000 | | | | 4.375 | (b) | | | 08/01/13 | | | | 448,734 | |
| | | Tokai Preferred Capital Co. LLC(a)(b) |
| | | | 650,000 | | | | 9.980 | | | | 12/29/49 | | | | 682,537 | |
| | | Unicredito Italiano Capital Trust(a)(b) |
| | | | 500,000 | | | | 9.200 | | | | 10/05/49 | | | | 561,496 | |
| | | Wachovia Capital Trust III(b) |
| | | | 1,775,000 | | | | 5.800 | | | | 03/15/42 | | | | 1,801,447 | |
| | | Washington Mutual Bank |
| | | | 500,000 | | | | 5.950 | | | | 05/20/13 | | | | 509,553 | |
| | | | | | | | | | | | | | | | | |
| | | | | | | | | | | | | | | | 39,985,567 | |
| | | |
| | | Captive Financial – 0.8% |
| | | Nelnet, Inc. |
| | | | 1,760,000 | | | | 5.125 | | | | 06/01/10 | | | | 1,721,365 | |
| | | |
| | | Consumer Cyclical Services – 0.5% |
| | | Sabre Holdings Corp. |
| | | | 1,300,000 | | | | 8.350 | | | | 03/15/16 | | | | 1,226,554 | |
| | | |
| | | Diversified Manufacturing – 1.0% |
| | | Tyco International Group SA |
| | | | 2,000,000 | | | | 6.875 | | | | 01/15/29 | | | | 2,371,312 | |
| | | |
| | | Electric – 6.8% |
| | | Arizona Public Service Co. |
| | | | 500,000 | | | | 6.250 | | | | 08/01/16 | | | | 516,593 | |
| | | | 2,000,000 | | | | 6.875 | | | | 08/01/36 | | | | 2,137,398 | |
| | | Centerpoint Energy, Inc. |
| | | | 2,100,000 | | | | 5.875 | | | | 06/01/08 | | | | 2,108,045 | |
| | | CenterPoint Energy, Inc. Series B |
| | | | 350,000 | | | | 7.250 | | | | 09/01/10 | | | | 370,165 | |
| | | Commonwealth Edison Co. |
| | | | 425,000 | | | | 5.900 | | | | 03/15/36 | | | | 404,972 | |
| | | MidAmerican Energy Holdings Co. |
| | | | 280,000 | | | | 7.520 | | | | 09/15/08 | | | | 288,078 | |
| | | | 2,100,000 | | | | 6.125 | | | | 04/01/36 | | | | 2,135,095 | |
| | | NiSource Finance Corp.(b) |
| | | | 500,000 | | | | 5.930 | | | | 11/23/09 | | | | 500,602 | |
| | | Ohio Edison Co. |
| | | | 1,500,000 | | | | 6.875 | | | | 07/15/36 | | | | 1,643,442 | |
| | | Progress Energy, Inc. |
| | | | 2,175,000 | | | | 5.625 | | | | 01/15/16 | | | | 2,196,970 | |
| | | | 1,000,000 | | | | 7.000 | | | | 10/30/31 | | | | 1,109,302 | |
| | | Southwestern Public Service Cos. |
| | | | 375,000 | | | | 6.000 | | | | 10/01/36 | | | | 372,719 | |
| | | Tampa Electric Co. |
| | | | 275,000 | | | | 6.550 | | | | 05/15/36 | | | | 294,322 | |
The accompanying notes are an integral part of these financial statements.
49
GOLDMAN SACHS INVESTMENT GRADE CREDIT FUND
Schedule of Investments (continued)
April 30, 2007 (Unaudited)
| | | | | | | | | | | | | | | | | |
| | | Principal | | Interest | | Maturity | | |
| | | Amount* | | Rate | | Date | | Value |
| | |
Corporate Bonds – (continued) |
| |
| | | Electric – (continued) |
| | | TXU Corp. Series O |
| | | $ | 1,225,000 | | | | 4.800 | % | | | 11/15/09 | | | $ | 1,206,625 | |
| | | | | | | | | | | | | | | | | |
| | | | | | | | | | | | | | | | 15,284,328 | |
| | | |
| | | Energy – 6.1% |
| | | Anadarko Petroleum Corp. |
| | | | 6,025,000 | | | | 6.450 | | | | 09/15/36 | | | | 6,040,219 | |
| | | Canadian Natural Resources Ltd. |
| | | | 1,375,000 | | | | 5.850 | | | | 02/01/35 | | | | 1,302,435 | |
| | | | 4,275,000 | | | | 6.500 | | | | 02/15/37 | | | | 4,405,140 | |
| | | Kerr-McGee Corp. |
| | | | 800,000 | | | | 6.950 | | | | 07/01/24 | | | | 855,546 | |
| | | XTO Energy, Inc. |
| | | | 1,200,000 | | | | 6.250 | | | | 04/15/13 | | | | 1,248,185 | |
| | | | | | | | | | | | | | | | | |
| | | | | | | | | | | | | | | | 13,851,525 | |
| | | |
| | | Entertainment – 0.8% |
| | | Time Warner Entertainment Co. |
| | | | 325,000 | | | | 7.250 | | | | 09/01/08 | | | | 332,831 | |
| | | | 1,290,000 | | | | 8.375 | | | | 03/15/23 | | | | 1,542,605 | |
| | | | | | | | | | | | | | | | | |
| | | | | | | | | | | | | | | | 1,875,436 | |
| | | |
| | | Gaming – 1.1% |
| | | Harrah’s Operating Co., Inc. |
| | | | 2,425,000 | | | | 5.500 | | | | 07/01/10 | | | | 2,385,594 | |
| | | |
| | | Healthcare Products – 0.4% |
| | | Hospira, Inc. |
| | | | 1,000,000 | | | | 6.050 | | | | 03/30/17 | | | | 1,010,293 | |
| | | |
| | | Life Insurance – 6.9% |
| | | American International Group, Inc. |
| | | | 1,150,000 | | | | 6.250 | | | | 03/15/37 | | | | 1,144,650 | |
| | | Americo Life, Inc.(a) |
| | | | 550,000 | | | | 7.875 | | | | 05/01/13 | | | | 566,042 | |
| | | AXA Financial, Inc. |
| | | | 805,000 | | | | 7.750 | | | | 08/01/10 | | | | 867,495 | |
| | | AXA SA(a)(b) |
| | | | 825,000 | | | | 6.379 | | | | 12/14/49 | | | | 807,002 | |
| | | | 825,000 | | | | 6.463 | | | | 12/31/49 | | | | 815,197 | |
| | | Lincoln National Corp.(b) |
| | | | 1,600,000 | | | | 7.000 | | | | 05/17/66 | | | | 1,690,231 | |
| | | Phoenix Life Insurance Co.(a) |
| | | | 2,600,000 | | | | 7.150 | | | | 12/15/34 | | | | 2,769,985 | |
| | | Reinsurance Group of America, Inc. |
| | | | 625,000 | | | | 6.750 | | | | 12/15/11 | | | | 658,224 | |
| | | | 2,250,000 | | | | 6.750 | (b) | | | 12/15/65 | | | | 2,260,518 | |
| | | SL Finance PLC(b) |
| | | | EUR650,000 | | | | 6.375 | | | | 07/12/22 | | | | 953,017 | |
| | | Stingray Pass-Through Trust(a) |
| | | $ | 400,000 | | | | 5.902 | | | | 01/12/15 | | | | 370,992 | |
| | | Symetra Financial Corp.(a) |
| | | | 1,600,000 | | | | 6.125 | | | | 04/01/16 | | | | 1,625,678 | |
| | | The MONY Group, Inc. |
| | | | 1,000,000 | | | | 8.350 | | | | 03/15/10 | | | | 1,084,859 | |
| | | | | | | | | | | | | | | | | |
| | | | | | | | | | | | | | | | 15,613,890 | |
| | | |
| | | Media-Cable – 4.1% |
| | | Comcast Cable Communications Holdings, Inc. |
| | | | 1,350,000 | | | | 9.455 | | | | 11/15/22 | | | | 1,782,284 | |
| | | Cox Communications, Inc. |
| | | | 850,000 | | | | 4.625 | | | | 01/15/10 | | | | 838,150 | |
| | | Cox Enterprises, Inc.(a) |
| | | | 3,275,000 | | | | 4.375 | | | | 05/01/08 | | | | 3,238,409 | |
| | | Time Warner Cable, Inc.(a) |
| | | | 3,225,000 | | | | 6.550 | | | | 05/01/37 | | | | 3,282,223 | |
| | | | | | | | | | | | | | | | | |
| | | | | | | | | | | | | | | | 9,141,066 | |
| | | |
| | | Media-Non Cable – 0.8% |
| | | AMFM, Inc. |
| | | | 1,700,000 | | | | 8.000 | | | | 11/01/08 | | | | 1,757,743 | |
| | | |
| | | Metals & Mining – 1.2% |
| | | Falconbridge Ltd. |
| | | | 500,000 | | | | 7.250 | | | | 07/15/12 | | | | 547,063 | |
| | | Inco Ltd. |
| | | | 2,050,000 | | | | 5.700 | | | | 10/15/15 | | | | 2,053,171 | |
| | | | | | | | | | | | | | | | | |
| | | | | | | | | | | | | | | | 2,600,234 | |
| | | |
| | | Noncaptive-Financial – 9.6% |
| | | American General Finance Corp.(c) |
| | | | 1,825,000 | | | | 8.450 | | | | 10/15/09 | | | | 1,965,193 | |
| | | Capital One Bank |
| | | | 325,000 | | | | 5.000 | | | | 06/15/09 | | | | 324,006 | |
| | | Capital One Financial Corp. |
| | | | 1,775,000 | | | | 5.700 | | | | 09/15/11 | | | | 1,789,708 | |
| | | GATX Financial Corp. |
| | | | 3,400,000 | | | | 5.125 | | | | 04/15/10 | | | | 3,386,811 | |
| | | MGIC Investment Corp. |
| | | | 1,300,000 | | | | 5.625 | | | | 09/15/11 | | | | 1,307,760 | |
| | | Nelnet, Inc.(b) |
| | | | 625,000 | | | | 7.400 | | | | 09/29/36 | | | | 633,788 | |
| | | PHH Corp. |
| | | | 3,088,000 | | | | 6.000 | | | | 03/01/08 | | | | 3,094,624 | |
| | | | 750,000 | | | | 7.125 | | | | 03/01/13 | | | | 812,621 | |
| | | Residential Capital LLC |
| | | | 2,575,000 | | | | 6.375 | | | | 06/30/10 | | | | 2,583,759 | |
| | | | 900,000 | | | | 6.500 | | | | 04/17/13 | | | | 899,524 | |
| | | SLM Corp. |
| | | | 5,000,000 | | | | 5.400 | | | | 10/25/11 | | | | 4,796,835 | |
| | | | | | | | | | | | | | | | | |
| | | | | | | | | | | | | | | | 21,594,629 | |
| | | |
| | | Paper – 1.4% |
| | | Weyerhaeuser Co. |
| | | | 3,025,000 | | | | 7.375 | | | | 03/15/32 | | | | 3,198,520 | |
| | | |
| | | Pipelines – 6.7% |
| | | Boardwalk Pipelines LP |
| | | | 1,775,000 | | | | 5.875 | | | | 11/15/16 | | | | 1,787,671 | |
| | | Energy Transfer Partners LP |
| | | | 4,350,000 | | | | 5.950 | | | | 02/01/15 | | | | 4,412,502 | |
| | | Enterprise Products Operating LP |
| | | | 1,805,000 | | | | 4.950 | | | | 06/01/10 | | | | 1,791,589 | |
| | | | 2,350,000 | | | | 5.600 | | | | 10/15/14 | | | | 2,346,215 | |
| | | | 275,000 | | | | 5.000 | | | | 03/01/15 | | | | 262,513 | |
The accompanying notes are an integral part of these financial statements.
50
GOLDMAN SACHS INVESTMENT GRADE CREDIT FUND
| | | | | | | | | | | | | | | | | |
| | | Principal | | Interest | | Maturity | | |
| | | Amount* | | Rate | | Date | | Value |
| | |
Corporate Bonds – (continued) |
| |
| | | Pipelines – (continued) |
| | | ONEOK Partners LP |
| | | $ | 1,375,000 | | | | 5.900 | % | | | 04/01/12 | | | $ | 1,413,416 | |
| | | | 775,000 | | | | 6.650 | | | | 10/01/36 | | | | 803,405 | |
| | | Panhandle Eastern PipeLine |
| | | | 150,000 | | | | 4.800 | | | | 08/15/08 | | | | 148,561 | |
| | | Southern Natural Gas Co.(a) |
| | | | 700,000 | | | | 5.900 | | | | 04/01/17 | | | | 701,911 | |
| | | TransCanada PipeLines Ltd.(b) |
| | | | 1,500,000 | | | | 6.350 | | | | 05/15/67 | | | | 1,497,315 | |
| | | | | | | | | | | | | | | | | |
| | | | | | | | | | | | | | | | 15,165,098 | |
| | | |
| | | Property/Casualty Insurance – 10.6% |
| | | Ace Capital Trust II |
| | | | 250,000 | | | | 9.700 | | | | 04/01/30 | | | | 334,205 | |
| | | AON Capital Trust A |
| | | | 1,000,000 | | | | 8.205 | | | | 01/01/27 | | | | 1,118,056 | |
| | | Arch Capital Group Ltd. |
| | | | 1,245,000 | | | | 7.350 | | | | 05/01/34 | | | | 1,364,973 | |
| | | Aspen Insurance Holdings Ltd. |
| | | | 1,025,000 | | | | 6.000 | | | | 08/15/14 | | | | 1,022,926 | |
| | | Catlin Insurance Co. Ltd.(a)(b) |
| | | | 1,050,000 | | | | 7.249 | | | | 01/19/49 | | | | 1,058,540 | |
| | | CNA Financial Corp. |
| | | | 350,000 | | | | 6.600 | | | | 12/15/08 | | | | 356,509 | |
| | | | 1,000,000 | | | | 5.850 | | | | 12/15/14 | | | | 1,006,256 | |
| | | Endurance Specialty Holdings Ltd. |
| | | | 1,100,000 | | | | 6.150 | | | | 10/15/15 | | | | 1,100,127 | |
| | | Everest Reinsurance Holdings, Inc.(b) |
| | | | 1,500,000 | | | | 6.600 | | | | 05/15/37 | | | | 1,505,403 | |
| | | Marsh & McLennan Cos., Inc. |
| | | | 1,000,000 | | | �� | 5.150 | | | | 09/15/10 | | | | 990,431 | |
| | | PartnerRe Finance(b) |
| | | | 175,000 | | | | 6.440 | | | | 12/01/66 | | | | 175,402 | |
| | | QBE Capital Funding II LP(a)(b) |
| | | | 1,500,000 | | | | 6.797 | | | | 06/01/49 | | | | 1,512,959 | |
| | | QBE Insurance Group Ltd.(a)(b) |
| | | | 855,000 | | | | 5.647 | | | | 07/01/23 | | | | 840,427 | |
| | | Swiss Re Capital I LP(a)(b) |
| | | | 4,375,000 | | | | 6.854 | | | | 05/29/49 | | | | 4,567,732 | |
| | | The Chubb Corp.(b) |
| | | | 1,625,000 | | | | 6.375 | | | | 03/29/67 | | | | 1,644,594 | |
| | | The Travelers Cos., Inc.(b) |
| | | | 1,300,000 | | | | 6.250 | | | | 03/15/37 | | | | 1,301,773 | |
| | | White Mountains Reinsurance Group Ltd.(a) |
| | | | 1,725,000 | | | | 6.375 | | | | 03/20/17 | | | | 1,705,595 | |
| | | ZFS Finance USA Trust II(a)(b) |
| | | | 2,100,000 | | | | 6.450 | | | | 12/15/65 | | | | 2,124,307 | |
| | | Zurich Capital Trust I(a) |
| | | | 125,000 | | | | 8.376 | | | | 06/01/37 | | | | 130,520 | |
| | | | | | | | | | | | | | | | | |
| | | | | | | | | | | | | | | | 23,860,735 | |
| | | |
| | | REIT – 13.0% |
| | | Arden Realty LP |
| | | | 1,160,000 | | | | 5.200 | | | | 09/01/11 | | | | 1,165,533 | |
| | | BRE Properties, Inc. |
| | | | 3,525,000 | | | | 7.450 | | | | 01/15/11 | | | | 3,788,511 | |
| | | Camden Property Trust |
| | | | 1,650,000 | | | | 4.375 | | | | 01/15/10 | | | | 1,618,097 | |
| | | Colonial Realty LP |
| | | | 1,750,000 | | | | 6.050 | | | | 09/01/16 | | | | 1,790,171 | |
| | | Health Care Property Investors, Inc. |
| | | | 1,825,000 | | | | 5.950 | | | | 09/15/11 | | | | 1,858,117 | |
| | | Heritage Property Investment Trust |
| | | | 885,000 | | | | 4.500 | | | | 10/15/09 | | | | 868,984 | |
| | | Highwoods Properties, Inc.(a) |
| | | | 2,925,000 | | | | 5.850 | | | | 03/15/17 | | | | 2,908,878 | |
| | | iStar Financial, Inc. Series B |
| | | | 3,200,000 | | | | 5.700 | | | | 03/01/14 | | | | 3,188,669 | |
| | | Liberty Property LP |
| | | | 225,000 | | | | 7.750 | | | | 04/15/09 | | | | 235,337 | |
| | | Pan Pacific Retail Properties, Inc. |
| | | | 1,350,000 | | | | 5.950 | | | | 06/01/14 | | | | 1,388,333 | |
| | | Post Apartment Homes LP |
| | | | 1,500,000 | | | | 7.700 | | | | 12/20/10 | | | | 1,614,069 | |
| | | | 3,000,000 | | | | 6.300 | | | | 06/01/13 | | | | 3,110,535 | |
| | | ProLogis |
| | | | 2,250,000 | | | | 5.500 | | | | 04/01/12 | | | | 2,275,157 | |
| | | Shurgard Storage Centers, Inc. |
| | | | 2,050,000 | | | | 7.750 | | | | 02/22/11 | | | | 2,204,980 | |
| | | Simon Property Group LP |
| | | | 200,000 | | | | 7.000 | (c) | | | 06/15/08 | | | | 203,729 | |
| | | | 1,000,000 | | | | 5.600 | | | | 09/01/11 | | | | 1,016,017 | |
| | | | | | | | | | | | | | | | | |
| | | | | | | | | | | | | | | | 29,235,117 | |
| | | |
| | | Retailers – 0.9% |
| | | Federated Retail Holdings, Inc. |
| | | | 2,050,000 | | | | 5.350 | | | | 03/15/12 | | | | 2,048,973 | |
| | | |
| | | Tobacco – 0.9% |
| | | Altria Group, Inc. |
| | | | 275,000 | | | | 7.000 | | | | 11/04/13 | | | | 299,249 | |
| | | | 393,000 | | | | 7.750 | | | | 01/15/27 | | | | 472,736 | |
| | | Imperial Tobacco Overseas BV |
| | | | 1,200,000 | | | | 7.125 | | | | 04/01/09 | | | | 1,238,343 | |
| | | | | | | | | | | | | | | | | |
| | | | | | | | | | | | | | | | 2,010,328 | |
| | | |
| | | Wireless Telecommunications – 2.1% |
| | | America Movil SA de CV |
| | | | 800,000 | | | | 5.500 | | | | 03/01/14 | | | | 798,352 | |
| | | AT&T Wireless Services, Inc. |
| | | | 900,000 | | | | 8.750 | | | | 03/01/31 | | | | 1,176,542 | |
| | | Intelsat |
| | | | 350,000 | | | | 5.250 | | | | 11/01/08 | | | | 340,375 | |
| | | Sprint Capital Corp. |
| | | | 1,500,000 | | | | 7.625 | | | | 01/30/11 | | | | 1,608,400 | |
| | | | 850,000 | | | | 6.875 | | | | 11/15/28 | | | | 844,577 | |
| | | | | | | | | | | | | | | | | |
| | | | | | | | | | | | | | | | 4,768,246 | |
| | | |
| | | Wirelines Telecommunications – 3.7% |
| | | Ameritech Capital Funding |
| | | | 575,000 | | | | 6.250 | | | | 05/18/09 | | | | 582,485 | |
The accompanying notes are an integral part of these financial statements.
51
GOLDMAN SACHS INVESTMENT GRADE CREDIT FUND
Schedule of Investments (continued)
April 30, 2007 (Unaudited)
| | | | | | | | | | | | | | | | | |
| | | Principal | | Interest | | Maturity | | |
| | | Amount* | | Rate | | Date | | Value |
| | |
Corporate Bonds – (continued) |
| |
| | | Wirelines Telecommunications – (continued) |
| | | Bellsouth Telecommunications, Inc. |
| | | $ | 426,000 | | | | 6.125 | % | | | 09/23/08 | | | $ | 429,440 | |
| | | Deutsche Telekom International Finance BV |
| | | | 550,000 | | | | 5.375 | | | | 03/23/11 | | | | 554,047 | |
| | | | 1,650,000 | | | | 8.250 | | | | 06/15/30 | | | | 2,071,470 | |
| | | Embarq Corp. |
| | | | 500,000 | | | | 7.995 | | | | 06/01/36 | | | | 528,943 | |
| | | France Telecom SA |
| | | | EUR175,000 | | | | 8.125 | | | | 01/28/33 | | | | 322,002 | |
| | | Telecom Italia Capital |
| | | $ | 700,000 | | | | 4.000 | | | | 01/15/10 | | | | 679,163 | |
| | | | 1,700,000 | | | | 4.950 | | | | 09/30/14 | | | | 1,618,141 | |
| | | TPSA Finance BV(a) |
| | | | 350,000 | | | | 7.750 | | | | 12/10/08 | | | | 361,686 | |
| | | Verizon Communications, Inc. |
| | | | 1,260,000 | | | | 7.510 | | | | 04/01/09 | | | | 1,309,681 | |
| | | | | | | | | | | | | | | | | |
| | | | | | | | | | | | | | | | 8,457,058 | |
| | | |
| | | TOTAL CORPORATE BONDS |
| | | (Cost $225,986,072) | | $ | 226,402,365 | |
| | | |
| | |
Emerging Markets Debt – 0.4% |
| |
| | | Korea Development Bank |
| | | $ | 150,000 | | | | 5.750 | % | | | 09/10/13 | | | $ | 153,482 | |
| | | VTB Capital (Vneshtorgbank)(a)(b) |
| | | | 700,000 | | | | 5.955 | | | | 08/01/08 | | | | 700,700 | |
| | | |
| | | TOTAL EMERGING MARKETS DEBT |
| | | (Cost $852,350) | | | 854,182 | |
| | | |
| | | TOTAL INVESTMENTS BEFORE REPURCHASE AGREEMENT – 100.7% |
| | | (Cost $226,838,422) | | $ | 227,256,547 | |
| | | |
| | |
Repurchase Agreement(d) – 0.8% |
| |
| | | Joint Repurchase Agreement Account II |
| | | | 1,800,000 | | | | 5.242 | % | | | 05/01/07 | | | | 1,800,000 | |
| | | Maturity Value: $1,800,262 |
| | | (Cost $1,800,000) | | | | |
| | | |
| | | TOTAL INVESTMENTS – 101.5% |
| | | (Cost $228,638,422) | | $ | 229,056,547 | |
| | | |
| | | LIABILITIES IN EXCESS OF OTHER ASSETS – (1.5)% | | | (3,412,877 | ) |
| | | |
| | | NET ASSETS – 100.0% | | $ | 225,643,670 | |
| | | |
| |
| | The percentage shown for each investment category reflects the value of investments in that category as a percentage of net assets. |
| |
| * | The principal amount of each security is stated in the currency in which the bond is denominated. All amounts shown are in U.S. dollars unless otherwise noted. See below. |
| | | | | | | | | | | |
| Currency Description |
| |
| EUR | | = | | Euro Currency | | | | | | |
| |
| (a) | Securities are exempt from registration under Rule 144A of the Securities Act of 1933. Under procedures approved by the Board of Trustees, such securities have been determined to be liquid by the Investment Adviser and may be resold, normally to qualified institutional buyers in transactions exempt from registration. Total market value of Rule 144A securities amounts to $46,004,741, which represents approximately 20.4% of net assets as of April 30, 2007. |
| |
| (b) | Variable rate security. Interest rate disclosed is that which is in effect at April 30, 2007. |
| |
| (c) | Securities with “Put” features with resetting interest rates. Maturity dates disclosed are the final maturity dates. |
| |
| (d) | Joint repurchase agreement was entered into on April 30, 2007. Additional information appears on page 63. |
| | | | | | | |
| | | |
| | | Investment Abbreviation: |
| | | REIT | | — | | Real Estate Investment Trust |
| | | |
The accompanying notes are an integral part of these financial statements.
52
GOLDMAN SACHS INVESTMENT GRADE CREDIT FUND
| ADDITIONAL INVESTMENT INFORMATION |
FORWARD FOREIGN CURRENCY CONTRACTS — At April 30, 2007, the Fund had outstanding forward foreign currency exchange contracts, to sell foreign currencies:
| | | | | | | | | | | | | | | | | | | | | |
| Open Forward Foreign Currency | | Purchase/ | | Expiration | | Value on | | Current | | Unrealized |
| Contracts | | Sale Contract | | Date | | Settlement Date | | Value | | Loss |
| |
| British Pound | | | Sale | | | | 05/16/07 | | | $ | 514,865 | | | $ | 524,930 | | | $ | (10,065 | ) |
| Euro | | | Sale | | | | 05/30/07 | | | | 2,987,482 | | | | 2,993,061 | | | | (5,579 | ) |
| |
| TOTAL OPEN FORWARD FOREIGN CURRENCY CONTRACTS WITH UNREALIZED LOSS | | $ | 3,502,347 | | | $ | 3,517,991 | | | $ | (15,644 | ) |
| |
FUTURES CONTRACTS — At April 30, 2007, the following futures contracts were open:
| | | | | | | | | | | | | | | |
| | | Number of | | | | | | |
| | | Contracts | | Settlement | | Market | | Unrealized |
| Type | | Long (Short) | | Month | | Value | | Gain (Loss) |
| |
| Eurodollars | | | (5 | ) | | June 2007 | | $ | (1,183,437 | ) | | $ | 2,358 | |
| Eurodollars | | | 6 | | | September 2007 | | | 1,422,000 | | | | (2,908 | ) |
| Eurodollars | | | 7 | | | March 2008 | | | 1,665,737 | | | | 1,914 | |
| Eurodollars | | | 4 | | | June 2008 | | | 953,200 | | | | 2,536 | |
| U.S. Treasury Bonds | | | (69 | ) | | June 2007 | | | (7,710,750 | ) | | | 55,313 | |
| 2 Year U.S. Treasury Notes | | | (76 | ) | | June 2007 | | | (15,558,625 | ) | | | (4,442 | ) |
| 5 Year U.S. Treasury Notes | | | 122 | | | June 2007 | | | 12,911,031 | | | | 37,169 | |
| 10 Year U.S. Treasury Notes | | | 2 | | | June 2007 | | | 216,656 | | | | 1,028 | |
| |
TOTAL | | | | | | | | $ | (7,284,188 | ) | | $ | 92,968 | |
| |
SWAP CONTRACTS — At April 30, 2007, the Fund had outstanding swap contracts with the following terms:
INTEREST RATE SWAP CONTRACTS
| | | | | | | | | | | | | | | | | | | | | |
| | | | | | | Rates Exchanged | | | | |
| | | | | | | | | | | |
| | | Notional | | | | Payments | | Payments | | Upfront Payments | | |
| | | Amount | | Termination | | received by | | made by | | made by | | Unrealized |
| Swap Counterparty | | (000s) | | Date | | the Fund | | the Fund | | the Fund | | Gain (Loss) |
| |
| Banc of America Securities LLC | | $ | 8,000 | | | | 09/02/10 | | | 4.309% | | 3 month LIBOR | | $ | — | | | $ | (190,163 | ) |
| Banc of America Securities LLC | | | 5,000 | | | | 05/23/12 | | | 4.374 | | 3 month LIBOR | | | — | | | | (67,417 | ) |
Banc of America Securities LLC (a) | | | 13,100 | | | | 06/20/12 | | | 5.000 | | 3 month LIBOR | | | 24,442 | | | | (9,894 | ) |
Deutsche Bank Securities, Inc. (a) | | | 13,500 | | | | 06/20/12 | | | 3 month LIBOR | | 5.000% | | | 19,621 | | | | (34,612 | ) |
Banc of America Securities LLC (a) | | | 9,600 | | | | 06/20/12 | | | 3 month LIBOR | | 5.000 | | | 31,433 | | | | (42,094 | ) |
Deutsche Bank Securities, Inc. (a) | | | 22,000 | | | | 06/20/14 | | | 5.100 | | 3 month LIBOR | | | 263,944 | | | | (203,627 | ) |
Deutsche Bank Securities, Inc. (a) | | | 14,000 | | | | 06/20/14 | | | 3 month LIBOR | | 5.100 | | | 101,316 | | | | (136,901 | ) |
Banc of America Securities LLC (a) | | | 14,000 | | | | 06/20/14 | | | 3 month LIBOR | | 5.100 | | | 99,609 | | | | (135,194 | ) |
Banc of America Securities LLC (a) | | | 8,700 | | | | 06/20/14 | | | 5.100 | | 3 month LIBOR | | | 146,864 | | | | (124,750 | ) |
JPMorgan Securities, Inc.(a) | | | 2,700 | | | | 06/20/14 | | | 3 month LIBOR | | 5.100 | | | 21,016 | | | | (27,879 | ) |
| Banc of America Securities LLC | | | 7,000 | | | | 10/19/15 | | | 4.965 | | 3 month LIBOR | | | — | | | | (72,737 | ) |
Deutsche Bank Securities, Inc. (a) | | | 15,900 | | | | 06/20/22 | | | 3 month LIBOR | | 5.250 | | | 60,729 | | | | 25,868 | |
| Banc of America Securities LLC | | | 4,000 | | | | 03/19/35 | | | 5.288 | | 3 month LIBOR | | | — | | | | (55,743 | ) |
| Banc of America Securities LLC | | | 2,800 | | | | 04/09/35 | | | 5.266 | | 3 month LIBOR | | | — | | | | (47,708 | ) |
Banc of America Securities LLC (a) | | | 2,800 | | | | 06/22/37 | | | 5.250 | | 3 month LIBOR | | | 94,591 | | | | (149,068 | ) |
| |
TOTAL | | | | | | | | | | | | | | $ | 863,565 | | | $ | (1,271,919 | ) |
| |
| |
| (a) | Represents forward starting interest rate swap whose effective dates of commencement of accruals and cash flows occur subsequent to April 30, 2007. |
LIBOR—London Interbank Offered Rate
The accompanying notes are an integral part of these financial statements.
53
GOLDMAN SACHS INVESTMENT GRADE CREDIT FUND
Schedule of Investments (continued)
April 30, 2007 (Unaudited)
| ADDITIONAL INVESTMENT INFORMATION (continued) |
CREDIT DEFAULT SWAP CONTRACTS
| | | | | | | | | | | | | | | | | | | | | | | |
| | | | | Notional | | Rate Paid | | | | Upfront Payments | | |
| | | | | Amount | | (Received) | | Termination | | made (received) | | Unrealized |
| Referenced Obligation | | Swap Counterparty | | (000s) | | by Fund | | Date | | by the Fund | | Gain (Loss) |
| |
Protection Purchased: | | | | | | | | | | | | | | | | | | | | | | |
| Core Investment Grade Bond Trust | | JPMorgan Securities, Inc. | | $ | 39,700 | | | | 0.400 | % | | | 12/20/11 | | | $ | (77,683 | ) | | $ | (18,561 | ) |
| Core Investment Grade Bond Trust | | Banc of America Securities LLC | | | 68,900 | | | | 0.350 | | | | 06/20/12 | | | | 130,091 | | | | (125,132 | ) |
Lowe’s Cos., Inc.
8.250% 6/1/2010 | | Banc of America Securities LLC | | | 5,000 | | | | 0.180 | | | | 06/20/13 | | | | — | | | | 9,784 | |
Centex Corp.
5.250% 6/15/2015 | | Bear Stearns & Co., Inc. | | | 2,000 | | | | 0.845 | | | | 06/20/13 | | | | — | | | | 63,474 | |
| Core Investment Grade Bond Trust | | Deutsche Bank Securities, Inc. | | | 48,300 | | | | 0.650 | | | | 12/20/16 | | | | (321,920 | ) | | | 285,486 | |
| Core Investment Grade Bond Trust | | JPMorgan Securities, Inc. | | | 18,000 | | | | 0.650 | | | | 12/20/16 | | | | (114,101 | ) | | | 100,523 | |
| Core Investment Grade Bond Trust | | Banc of America Securities LLC | | | 2,000 | | | | 0.650 | | | | 12/20/16 | | | | 1,099 | | | | (2,608 | ) |
| |
Protection Sold: | | | | | | | | | | | | | | | | | | | | | | |
Countrywide Home Loans, Inc.
4.00%, 3/22/2011 | | JPMorgan Securities, Inc | | | 2,500 | | | | (0.450 | ) | | | 03/20/12 | | | | — | | | | (20,296 | ) |
Countrywide Home Loans, Inc.
4.00%, 3/22/2011 | | JPMorgan Securities, Inc. | | | 1,500 | | | | (0.720 | ) | | | 03/20/12 | | | | — | | | | (2,340 | ) |
Countrywide Home Loans, Inc.
4.00%, 3/22/2011 | | Deutsche Bank Securities, Inc | | | 1,000 | | | | (0.610 | ) | | | 03/20/12 | | | | — | | | | 3,250 | |
| |
TOTAL | | | | | | | | | | | | | | | | $ | (382,514 | ) | | $ | 293,580 | |
| |
The accompanying notes are an integral part of these financial statements.
54
GOLDMAN SACHS CORE PLUS FIXED INCOME FUND
Schedule of Investments
April 30, 2007 (Unaudited)
| | | | | | | | | | | | | | | | | |
| | | Principal | | Interest | | Maturity | | |
| | | Amount* | | Rate | | Date | | Value |
| | |
Corporate Bonds – 7.1% |
| |
| | | Banks – 1.2% |
| | | JPMorgan Chase Capital XXII Series V |
| | | $ | 250,000 | | | | 6.450 | % | | | 02/02/37 | | | $ | 252,931 | |
| | | MUFG Capital Finance 1 Ltd.(a) |
| | | | 100,000 | | | | 6.346 | | | | 07/29/49 | | | | 102,134 | |
| | | Resona Preferred Global Securities Ltd.(a)(b) |
| | | | 175,000 | | | | 7.191 | | | | 12/29/49 | | | | 184,989 | |
| | | Washington Mutual, Inc. |
| | | | 350,000 | | | | 8.250 | | | | 04/01/10 | | | | 377,835 | |
| | | | | | | | | | | | | | | | | |
| | | | | | | | | | | | | | | | 917,889 | |
| | | |
| | | Electric – 0.9% |
| | | Arizona Public Service Co. |
| | | | 150,000 | | | | 6.250 | | | | 08/01/16 | | | | 154,978 | |
| | | Commonwealth Edison Co. |
| | | | 75,000 | | | | 5.900 | | | | 03/15/36 | | | | 71,466 | |
| | | MidAmerican Energy Holdings Co. |
| | | | 325,000 | | | | 6.125 | | | | 04/01/36 | | | | 330,431 | |
| | | Progress Energy, Inc. |
| | | | 100,000 | | | | 5.625 | | | | 01/15/16 | | | | 101,010 | |
| | | | | | | | | | | | | | | | | |
| | | | | | | | | | | | | | | | 657,885 | |
| | | |
| | | Energy – 0.5% |
| | | Canadian Natural Resources Ltd. |
| | | | 25,000 | | | | 5.700 | | | | 05/15/17 | | | | 25,075 | |
| | | | 100,000 | | | | 6.500 | | | | 02/15/37 | | | | 103,044 | |
| | | | 25,000 | | | | 6.250 | | | | 03/15/38 | | | | 24,815 | |
| | | Kerr-McGee Corp. |
| | | | 75,000 | | | | 6.950 | | | | 07/01/24 | | | | 80,208 | |
| | | XTO Energy, Inc. |
| | | | 150,000 | | | | 5.000 | | | | 01/31/15 | | | | 144,529 | |
| | | | | | | | | | | | | | | | | |
| | | | | | | | | | | | | | | | 377,671 | |
| | | |
| | | Life Insurance – 0.5% |
| | | American International Group, Inc. |
| | | | 100,000 | | | | 6.250 | | | | 03/15/37 | | | | 99,535 | |
| | | Americo Life, Inc.(b) |
| | | | 50,000 | | | | 7.875 | | | | 05/01/13 | | | | 51,458 | |
| | | Phoenix Life Insurance Co.(b) |
| | | | 100,000 | | | | 7.150 | | | | 12/15/34 | | | | 106,538 | |
| | | Symetra Financial Corp.(b) |
| | | | 100,000 | | | | 6.125 | | | | 04/01/16 | | | | 101,605 | |
| | | | | | | | | | | | | | | | | |
| | | | | | | | | | | | | | | | 359,136 | |
| | | |
| | | Media-Cable – 1.1% |
| | | Comcast Cable Communications Holdings, Inc. |
| | | | 175,000 | | | | 9.455 | | | | 11/15/22 | | | | 230,776 | |
| | | Cox Communications, Inc.(b) |
| | | | 150,000 | | | | 5.875 | | | | 12/01/16 | | | | 151,248 | |
| | | Time Warner Cable, Inc.(b) |
| | | | 250,000 | | | | 5.400 | | | | 07/02/12 | | | | 250,694 | |
| | | | 150,000 | | | | 6.550 | | | | 05/01/37 | | | | 152,662 | |
| | | | | | | | | | | | | | | | | |
| | | | | | | | | | | | | | | | 785,380 | |
| | | |
| | | Media-Non Cable – 0.1% |
| | | AMFM, Inc. |
| | | | 50,000 | | | | 8.000 | | | | 11/01/08 | | | | 51,698 | |
| | | |
| | | Noncaptive-Financial – 0.5% |
| | | GATX Financial Corp. |
| | | | 150,000 | | | | 8.875 | | | | 06/01/09 | | | | 160,144 | |
| | | Residential Capital LLC |
| | | | 175,000 | | | | 6.375 | | | | 06/30/10 | | | | 175,595 | |
| | | | | | | | | | | | | | | | | |
| | | | | | | | | | | | | | | | 335,739 | |
| | | |
| | | Pipelines – 1.0% |
| | | Boardwalk Pipelines LP |
| | | | 200,000 | | | | 5.875 | | | | 11/15/16 | | | | 201,428 | |
| | | Energy Transfer Partners LP |
| | | | 100,000 | | | | 5.950 | | | | 02/01/15 | | | | 101,437 | |
| | | Enterprise Products Operating LP |
| | | | 125,000 | | | | 5.600 | | | | 10/15/14 | | | | 124,799 | |
| | | | 75,000 | | | | 5.000 | | | | 03/01/15 | | | | 72,127 | |
| | | ONEOK Partners LP |
| | | | 75,000 | | | | 6.150 | | | | 10/01/16 | | | | 77,207 | |
| | | | 125,000 | | | | 6.650 | | | | 10/01/36 | | | | 129,581 | |
| | | Southern Natural Gas Co.(b) |
| | | | 50,000 | | | | 5.900 | | | | 04/01/17 | | | | 50,137 | |
| | | | | | | | | | | | | | | | | |
| | | | | | | | | | | | | | | | 756,716 | |
| | | |
| | | Property/Casualty Insurance – 0.4% |
| | | Endurance Specialty Holdings Ltd. |
| | | | 75,000 | | | | 6.150 | | | | 10/15/15 | | | | 75,009 | |
| | | Swiss Re Capital I LP(a)(b) |
| | | | 100,000 | | | | 6.854 | | | | 05/29/49 | | | | 104,405 | |
| | | The Chubb Corp.(a) |
| | | | 125,000 | | | | 6.375 | | | | 03/29/67 | | | | 126,507 | |
| | | | | | | | | | | | | | | | | |
| | | | | | | | | | | | | | | | 305,921 | |
| | | |
| | | REIT – 0.3% |
| | | iStar Financial, Inc. Series B |
| | | | 100,000 | | | | 5.700 | | | | 03/01/14 | | | | 99,646 | |
| | | Westfield Capital Corp.(b) |
| | | | 150,000 | | | | 5.125 | | | | 11/15/14 | | | | 147,108 | |
| | | | | | | | | | | | | | | | | |
| | | | | | | | | | | | | | | | 246,754 | |
| | | |
| | | Wireless Telecommunications – 0.1% |
| | | Sprint Capital Corp. |
| | | | 50,000 | | | | 6.875 | | | | 11/15/28 | | | | 49,681 | |
| | | |
| | | Wirelines Telecommunications – 0.5% |
| | | Deutsche Telekom International Finance BV |
| | | | 200,000 | | | | 8.250 | | | | 06/15/30 | | | | 251,027 | |
| | | Telecom Italia Capital |
| | | | 150,000 | | | | 4.950 | | | | 09/30/14 | | | | 142,777 | |
| | | | | | | | | | | | | | | | | |
| | | | | | | | | | | | | | | | 393,804 | |
| | | |
| | | TOTAL CORPORATE BONDS |
| | | (Cost $5,236,190) | | $ | 5,238,274 | |
| | | |
| | |
Mortgage-Backed Obligations – 14.3% |
| |
| | | Adjustable Rate Non-Agency(a) – 7.4% |
| | | Countrywide Alternative Loan Trust Series 2005-38, Class A3 |
| | | $ | 471,440 | | | | 5.670 | % | | | 09/25/35 | | | $ | 473,321 | |
The accompanying notes are an integral part of these financial statements.
55
GOLDMAN SACHS CORE PLUS FIXED INCOME FUND
Schedule of Investments (continued)
April 30, 2007 (Unaudited)
| | | | | | | | | | | | | | | | | |
| | | Principal | | Interest | | Maturity | | |
| | | Amount* | | Rate | | Date | | Value |
| | |
Mortgage-Backed Obligations – (continued) |
| |
| | | Adjustable Rate Non-Agency(a) – (continued) |
| | | Harborview Mortgage Loan Trust Series 2006-10, Class 2A1A |
| | | $ | 953,964 | | | | 5.500 | % | | | 11/19/36 | | | $ | 949,939 | |
| | | Harborview Mortgage Loan Trust Series 2006-12, Class 2A2A |
| | | | 1,858,417 | | | | 5.510 | | | | 01/19/38 | | | | 1,859,948 | |
| | | Lehman XS Trust Series 2006-2N, Class 1A1 |
| | | | 2,041,446 | | | | 5.580 | | | | 02/25/46 | | | | 2,046,460 | |
| | | Master Adjustable Rate Mortgages Trust Series 2004-9, Class 2A1 |
| | | | 97,983 | | | | 5.700 | | | | 11/25/34 | | | | 98,298 | |
| | | | | | | | | | | | | | | | | |
| | | | | | | | | | | | | | | | 5,427,966 | |
| | | |
| | | FHLMC – 0.6% |
| | | | 437,356 | | | | 5.000 | | | | 05/01/18 | | | | 432,262 | |
| | | |
| | | FNMA – 6.2% |
| | | | 72,721 | | | | 4.500 | | | | 04/01/18 | | | | 70,598 | |
| | | | 3,662,589 | | | | 4.500 | | | | 06/01/18 | | | | 3,556,874 | |
| | | | 999,127 | | | | 4.500 | | | | 01/01/19 | | | | 969,971 | |
| | | | | | | | | | | | | | | | | |
| | | | | | | | | | | | | | | | 4,597,443 | |
| | | |
| | | Collateralized Mortgage Obligation – 0.1% |
| | | Regular Floater(a)(d) – 0.1% |
| | | FHLMC Series 3167 Class X(d) |
| | | $ | 90,683 | | | | 0.000 | % | | | 06/15/36 | | | $ | 84,975 | |
| | | |
| | | TOTAL MORTGAGE-BACKED OBLIGATIONS |
| | | (Cost $10,535,450) | | $ | 10,542,646 | |
| | | |
| | |
Agency Debentures – 8.4% |
| |
| | | FHLB |
| | | $ | 1,600,000 | | | | 5.000 | % | | | 12/11/09 | | | $ | 1,607,568 | |
| | | | 1,800,000 | | | | 4.750 | | | | 10/06/10 | | | | 1,799,231 | |
| | | FNMA |
| | | | 2,800,000 | | | | 5.125 | | | | 09/02/08 | | | | 2,804,965 | |
| | | |
| | | TOTAL AGENCY DEBENTURES |
| | | (Cost $6,208,430) | | $ | 6,211,764 | |
| | | |
| | |
Asset-Backed Securities(a) – 5.3% |
| |
| | | Home Equity – 5.3% |
| | | Countrywide Home Equity Loan Trust Series 2007-B Class A |
| | | $ | 1,000,000 | | | | 5.470 | % | | | 09/25/32 | | | $ | 1,001,977 | |
| | | Countrywide Home Equity Loan Trust Series 2007-C Class A |
| | | | 1,000,000 | | | | 5.470 | | | | 05/15/37 | | | | 999,989 | |
| | | Wells Fargo Home Equity Trust Series 2005-3, Class AI1A |
| | | | 1,920,683 | | | | 5.590 | | | | 11/25/35 | | | | 1,922,225 | |
| | | | | | | | | | | | | | | | | |
| | | | | | | | | | | | | | | | 3,924,191 | |
| | | |
| | | TOTAL ASSET-BACKED SECURITIES |
| | | (Cost $3,924,884) | | $ | 3,924,191 | |
| | | |
| | |
U.S. Treasury Obligations – 34.7% |
| |
| | | United States Treasury Bonds |
| | | $ | 1,100,000 | | | | 4.500 | | | | 02/15/36 | | | $ | 1,043,109 | |
| | | United States Treasury Inflation Protected Securities |
| | | | 906,732 | | | | 2.500 | | | | 07/15/16 | | | | 931,030 | |
| | | | 107,940 | | | | 2.375 | | | | 01/15/25 | | | | 108,509 | |
| | | | 100,892 | | | | 2.375 | | | | 01/15/27 | | | | 101,637 | |
| | | United States Treasury Notes |
| | | | 9,200,000 | | | | 4.875 | | | | 10/31/08 | | | | 9,214,370 | |
| | | | 3,900,000 | | | | 4.875 | | | | 08/15/09 | | | | 3,925,350 | |
| | | | 7,800,000 | | | | 4.625 | | | | 11/15/09 | | | | 7,812,496 | |
| | | | 1,600,000 | | | | 4.875 | | | | 08/15/16 | | | | 1,629,952 | |
| | | United States Treasury Principal-Only STRIPS(c) |
| | | | 850,000 | | | | 0.000 | | | | 11/15/21 | | | | 417,010 | |
| | | | 1,100,000 | | | | 0.000 | | | | 11/15/26 | | | | 421,762 | |
| | | |
| | | TOTAL U.S. TREASURY OBLIGATIONS |
| | | (Cost $25,607,995) | | $ | 25,605,225 | |
| | | |
| | |
Foreign Debt Obligation – 2.4% |
| |
| | | Government of Japan |
| | | | JPY215,000,000 | | | | 1.700 | % | | | 12/20/16 | | | $ | 1,820,516 | |
| | | (Cost $1,779,880) | | | | |
| | | |
| | | | | | | | | | | |
| | | Shares | | Description | | Value |
| | |
Mutual Funds (Institutional Shares) – 3.6% |
| |
| | | Fixed Income – 3.6% |
| | | | 85,647 | | | Goldman Sachs Emerging Markets Debt Fund | | $ | 1,055,409 | |
| | | | 190,365 | | | Goldman Sachs High Yield Fund | | | 1,583,856 | |
| | | | | | | | | | | |
| | | | | | | | | | 2,639,265 | |
| | | |
| | | TOTAL MUTUAL FUNDS (INSTITUTIONAL SHARES) |
| | | (Cost $2,593,407) | | $ | 2,639,265 | |
| | | |
| | | TOTAL INVESTMENTS BEFORE REPURCHASE AGREEMENT – 75.8% |
| | | (Cost $55,886,236) | | $ | 55,981,881 | |
| | | |
The accompanying notes are an integral part of these financial statements.
56
GOLDMAN SACHS CORE PLUS FIXED INCOME FUND
| | | | | | | | | | | | | | | | | |
| | | Principal | | Interest | | Maturity | | |
| | | Amount | | Rate | | Date | | Value |
| | |
Repurchase Agreement(e) – 23.2% |
| |
| | | Joint Repurchase Agreement Account II |
| | | $ | 17,100,000 | | | | 5.242 | % | | | 05/01/07 | | | $ | 17,100,000 | |
| | | Maturity Value: $17,102,490 |
| | | (Cost $17,100,000) | | | | |
| | | |
| | | TOTAL INVESTMENTS – 99.0% |
| | | (Cost $72,986,236) | | $ | 73,081,881 | |
| | | |
| | | OTHER ASSETS IN EXCESS OF LIABILITIES – 1.0% | | | 745,449 | |
| | | |
| | | NET ASSETS – 100.0% | | $ | 73,827,330 | |
| | | |
| |
| | The percentage shown for each investment category reflects the value of investments in that category as a percentage of net assets. |
| | |
| | * | The principal amount of each security is stated in the currency in which the bond is denominated. All amounts shown are in U.S. dollars unless otherwise noted. See below. |
| | | | | |
| Currency Description |
| |
| JPY | | = | | Japanese Yen |
| |
| (a) | Variable rate security. Interest rate disclosed is that which is in effect at April 30, 2007. |
| |
| (b) | Securities are exempt from registration under Rule 144A of the Securities Act of 1933. Under procedures approved by the Board of Trustees, such securities have been determined to be liquid by the Investment Adviser and may be resold, normally to qualified institutional buyers in transactions exempt from registration. Total market value of Rule 144A securities amounts to $1,300,844, which represents approximately 1.8% of net assets as of April 30, 2007. |
| |
| (c) | Security issued with a zero coupon. Income is recognized through the accretion of discount. |
| |
| (d) | Security is issued with zero coupon and interest rate is contingent upon LIBOR reaching a predetermined level. |
| |
| (e) | Joint repurchase agreement was entered into on April 30, 2007. Additional information appears on page 63. |
| | | | | | | |
| | | |
| | | Investment Abbreviations: |
| | | FHLB | | — | | Federal Home Loan Bank |
| | | FHLMC | | — | | Federal Home Loan Mortgage Corp. |
| | | FNMA | | — | | Federal National Mortgage Association |
| | | LIBOR | | — | | London Interbank Offered Rate |
| | | REIT | | — | | Real Estate Investment Trust |
| | | STRIPS | | — | | Separate Trading of Registered Interest and Principal of Securities |
| | | |
The accompanying notes are an integral part of these financial statements.
57
GOLDMAN SACHS CORE PLUS FIXED INCOME FUND
Schedule of Investments (continued)
April 30, 2007 (Unaudited)
| ADDITIONAL INVESTMENT INFORMATION |
FORWARD FOREIGN CURRENCY CONTRACTS — At April 30, 2007, the Fund had outstanding forward foreign currency exchange contracts, both to purchase and sell foreign currencies:
| | | | | | | | | | | | | | | | | | | | | |
| Open Forward Foreign Currency | | Purchase/ | | Expiration | | Value on | | Current | | Unrealized |
| Contracts with Unrealized Gain | | Sale Contract | | Date | | Settlement Date | | Value | | Gain |
| |
| Australian Dollar | | | Purchase | | | | 06/20/07 | | | $ | 985,575 | | | $ | 1,013,789 | | | $ | 28,214 | |
| British Pound | | | Purchase | | | | 06/20/07 | | | | 2,094,689 | | | | 2,161,418 | | | | 66,729 | |
| Canadian Dollar | | | Purchase | | | | 06/20/07 | | | | 1,090,000 | | | | 1,123,440 | | | | 33,440 | |
| Euro | | | Purchase | | | | 05/30/07 | | | | 66,504 | | | | 66,698 | | | | 194 | |
| Euro | | | Purchase | | | | 06/20/07 | | | | 1,040,988 | | | | 1,063,505 | | | | 22,517 | |
| Euro | | | Sale | | | | 06/20/07 | | | | 229,000 | | | | 228,936 | | | | 64 | |
| Japanese Yen | | | Sale | | | | 05/31/07 | | | | 1,841,970 | | | | 1,828,405 | | | | 13,565 | |
| Japanese Yen | | | Sale | | | | 06/20/07 | | | | 1,391,076 | | | | 1,367,577 | | | | 23,499 | |
| New Zealand Dollar | | | Purchase | | | | 06/20/07 | | | | 615,000 | | | | 640,524 | | | | 25,524 | |
| Norwegian Krone | | | Purchase | | | | 06/20/07 | | | | 1,938,037 | | | | 1,989,593 | | | | 51,556 | |
| Swedish Krona | | | Purchase | | | | 06/20/07 | | | | 335,706 | | | | 343,960 | | | | 8,254 | |
| Swiss Franc | | | Purchase | | | | 06/20/07 | | | | 1,042,000 | | | | 1,046,360 | | | | 4,360 | |
| | | | Sale | | | | 06/20/07 | | | | 1,660,517 | | | | 1,654,564 | | | | 5,953 | |
| |
TOTAL OPEN FORWARD FOREIGN CURRENCY CONTRACTS WITH UNREALIZED GAIN | | | | | | | | | | | | | | | | | | $ | 283,869 | |
| |
| | | | | | | | | | | | | | | | | | | | | |
| Open Forward Foreign Currency | | Purchase/ | | Expiration | | Value on | | Current | | Unrealized |
| Contracts with Unrealized Loss | | Sale Contract | | Date | | Settlement Date | | Value | | Loss |
| |
| Australian Dollar | | | Sale | | | | 07/18/07 | | | $ | 10,570 | | | $ | 10,606 | | | $ | (36 | ) |
| British Pound | | | Sale | | | | 05/16/07 | | | | 88,549 | | | | 89,239 | | | | (690 | ) |
| British Pound | | | Purchase | | | | 06/20/07 | | | | 457,000 | | | | 456,828 | | | | (172 | ) |
| British Pound | | | Sale | | | | 06/20/07 | | | | 1,412,999 | | | | 1,439,816 | | | | (26,817 | ) |
| Canadian Dollar | | | Sale | | | | 06/20/07 | | | | 965,541 | | | | 1,018,716 | | | | (53,175 | ) |
| Euro | | | Sale | | | | 05/30/07 | | | | 40,872 | | | | 40,948 | | | | (76 | ) |
| Euro | | | Sale | | | | 06/20/07 | | | | 871,000 | | | | 885,659 | | | | (14,659 | ) |
| Japanese Yen | | | Purchase | | | | 06/20/07 | | | | 1,015,000 | | | | 995,197 | | | | (19,803 | ) |
| New Zealand Dollar | | | Sale | | | | 06/20/07 | | | | 571,140 | | | | 608,984 | | | | (37,844 | ) |
| Norwegian Krone | | | Sale | | | | 06/20/07 | | | | 1,005,000 | | | | 1,030,305 | | | | (25,305 | ) |
| Swedish Krona | | | Sale | | | | 06/21/07 | | | | 66,153 | | | | 68,261 | | | | (2,108 | ) |
| Swiss Franc | | | Purchase | | | | 06/20/07 | | | | 829,000 | | | | 826,680 | | | | (2,320 | ) |
| | | | Sale | | | | 06/20/07 | | | | 643,000 | | | | 645,023 | | | | (2,023 | ) |
| |
TOTAL OPEN FORWARD FOREIGN CURRENCY CONTRACTS WITH UNREALIZED LOSS | | | | | | | | | | | | | | | | | | $ | (185,028 | ) |
| |
The accompanying notes are an integral part of these financial statements.
58
GOLDMAN SACHS CORE PLUS FIXED INCOME FUND
| ADDITIONAL INVESTMENT INFORMATION (continued) |
FUTURES CONTRACTS — At April 30, 2007, the following futures contracts were open:
| | | | | | | | | | | | | | | |
| | | Number of | | | | | | |
| | | Contracts | | Settlement | | Market | | Unrealized |
| Type | | Long (Short) | | Month | | Value | | Gain (Loss) |
| |
| Eurodollars | | | 26 | | | June 2007 | | $ | 6,153,875 | | | $ | (4,487 | ) |
| Eurodollars | | | 4 | | | December 2007 | | | 949,900 | | | | 794 | |
| 2 Year Euro-Schatz | | | 9 | | | June 2007 | | | 1,266,749 | | | | 835 | |
| 5 Year Euro-Bobl | | | (31 | ) | | June 2007 | | | (4,559,116 | ) | | | 35,396 | |
| 10 Year Euro-Bund | | | 3 | | | June 2007 | | | 467,324 | | | | (8,769 | ) |
| 30 Year Euro-Buxl | | | 2 | | | June 2007 | | | 258,738 | | | | (10,158 | ) |
| 10 Year Japanese Yen Bond | | | (1 | ) | | June 2007 | | | (1,124,911 | ) | | | 3,255 | |
| U.K. Life Long Gilt | | | (2 | ) | | June 2007 | | | (426,514 | ) | | | (7 | ) |
| U.S. Treasury Bonds | | | 49 | | | June 2007 | | | 5,475,750 | | | | 48,110 | |
| 2 Year U.S. Treasury Notes | | | (14 | ) | | June 2007 | | | (2,866,063 | ) | | | (6,643 | ) |
| 5 Year U.S. Treasury Notes | | | 86 | | | June 2007 | | | 9,101,219 | | | | 32,204 | |
| 10 Year U.S. Treasury Notes | | | (118 | ) | | June 2007 | | | (12,782,719 | ) | | | (7,587 | ) |
| |
TOTAL | | | | | | | | $ | 13,282,286 | | | $ | 82,943 | |
| |
The accompanying notes are an integral part of these financial statements.
59
GOLDMAN SACHS CORE PLUS FIXED INCOME FUND
Schedule of Investments (continued)
April 30, 2007 (Unaudited)
| ADDITIONAL INVESTMENT INFORMATION (continued) |
SWAP CONTRACTS — At April 30, 2007, the Fund had outstanding swap contracts with the following terms:
INTEREST RATE SWAP CONTRACTS
| | | | | | | | | | | | | | | | | | | |
| | | | | | | Rates Exchanged | | Upfront | | |
| | | | | | | | | Payments | | |
| | | Notional | | | | Payments | | Payments | | made | | |
| | | Amount | | Termination | | received by | | made by | | (received) by | | Unrealized |
| Swap Counterparty | | (000s) | | Date | | the Fund | | the Fund | | the Fund | | Gain (Loss) |
| |
CSFB International London(a) | | | EUR 3,580 | | | 06/22/09 | | 4.250% | | 6 month EURO | | $ | 8,039 | | | $ | (18,911 | ) |
BNP Paribas SA(a) | | | EUR 2,550 | | | 06/22/09 | | 4.250 | | 6 month EURO | | | 4,822 | | | | 21,533 | |
Merrill Lynch Capital Markets(a) | | | EUR 2,420 | | | 06/22/09 | | 4.250 | | 6 month EURO | | | 4,693 | | | | (12,074 | ) |
| Deutsche Bank AG | | | EUR 7,140 | | | 10/16/09 | | 4.360 | | 6 month EURO | | | — | | | | (2,153 | ) |
| Deutsche Bank AG | | | EUR 2,860 | | | 10/16/09 | | 4.401 | | 6 month EURO | | | — | | | | 2,082 | |
| Deutsche Bank AG | | | EUR 2,850 | | | 10/16/09 | | 4.395 | | 6 month EURO | | | — | | | | 1,645 | |
| Deutsche Bank AG | | | EUR 1,430 | | | 10/16/09 | | 4.363 | | 6 month EURO | | | — | | | | (323 | ) |
| Deutsche Bank AG | | | CAD 110 | | | 04/04/12 | | 4.318 | | 3 month CDOR | | | — | | | | (261 | ) |
| Deutsche Bank AG | | | CAD 110 | | | 04/05/12 | | 4.328 | | 3 month CDOR | | | — | | | | (473 | ) |
| Deutsche Bank AG | | | NZD 180 | | | 04/10/12 | | 3 month ZDOR | | 7.598% | | | — | | | | (140 | ) |
| Deutsche Bank AG | | | NZD 180 | | | 04/11/12 | | 3 month ZDOR | | 7.598 | | | — | | | | (114 | ) |
| JPMorgan Securities, Inc. | | | MXN 10,580 | | | 04/17/12 | | 7.670 | | Mexican Interbank Equilibrium Rate | | | — | | | | (7,445 | ) |
Bank of America Securities LLC(a) | | | USD 11,200 | | | 06/20/12 | | 5.000 | | 3 month LIBOR | | | 22,222 | | | | (9,774 | ) |
Bank of America Securities LLC(a) | | | USD 14,900 | | | 06/20/12 | | 3 month LIBOR | | 5.000 | | | 65,125 | | | | (81,710 | ) |
Bear Stearns & Co., Inc.(a) | | | USD 2,000 | | | 06/20/12 | | 3 month LIBOR | | 5.000 | | | 13,512 | | | | (15,733 | ) |
Citibank NA(a) | | | JPY 85,000 | | | 06/20/12 | | 6 month JYOR | | 1.500 | | | (3,090 | ) | | | (654 | ) |
Citibank NA(a) | | | EUR 910 | | | 06/20/12 | | 4.250 | | 6 month EURO | | | 6,298 | | | | (11,627 | ) |
Deutsche Bank Securities, Inc. (a) | | | USD 24,900 | | | 06/20/12 | | 5.000 | | 3 month LIBOR | | | 200,468 | | | | (172,817 | ) |
Deutsche Bank Securities, Inc. (a) | | | USD 13,700 | | | 06/20/12 | | 3 month LIBOR | | 5.000 | | | 36,102 | | | | (51,315 | ) |
Deutsche Bank AG (a) | | | AUD 2,360 | | | 06/20/12 | | 6.250 | | 6 month BBSW | | | (5,118 | ) | | | (15,455 | ) |
Deutsche Bank AG (a) | | | USD 970 | | | 06/20/12 | | 5.000 | | 3 month LIBOR | | | (1,766 | ) | | | 2,844 | |
Deutsche Bank AG (a) | | | AUD 1,600 | | | 06/20/12 | | 6 month BBSW | | 6.250 | | | 19,784 | | | | (5,836 | ) |
Deutsche Bank AG (a) | | | USD 680 | | | 06/20/12 | | 3 month LIBOR | | 5.000 | | | (2,669 | ) | | | 1,914 | |
Deutsche Bank AG (a) | | | AUD 600 | | | 06/20/12 | | 6.250 | | 6 month BBSW | | | (5,008 | ) | | | (223 | ) |
JPMorgan Securities, Inc. (a) | | | USD 2,100 | | | 06/20/12 | | 3 month LIBOR | | 5.000 | | | 14,970 | | | | (17,302 | ) |
Merrill Lynch Capital Markets(a) | | | JPY 300,000 | | | 06/20/12 | | 6 month JYOR | | 1.500 | | | (15,074 | ) | | | 1,857 | |
The accompanying notes are an integral part of these financial statements.
60
GOLDMAN SACHS CORE PLUS FIXED INCOME FUND
| ADDITIONAL INVESTMENT INFORMATION (continued) |
INTEREST RATE SWAP CONTRACTS — (continued)
| | | | | | | | | | | | | | | | | | | |
| | | | | | | Rates Exchanged | | Upfront | | |
| | | | | | | | | Payments | | |
| | | Notional | | | | Payments | | Payments | | made | | |
| | | Amount | | Termination | | received by | | made by | | (received) by | | Unrealized |
| Swap Counterparty | | (000s) | | Date | | the Fund | | the Fund | | the Fund | | Gain (Loss) |
| |
Bank of America NA (a) | | | JPY 50,000 | | | 06/20/14 | | 6 month JYOR | | 1.500% | | $ | 1,944 | | | $ | 99 | |
Banc of America Securities LLC(a) | | | USD 6,500 | | | 06/20/14 | | 3 month LIBOR | | 5.100 | | | 21,231 | | | | (37,753 | ) |
Citibank NA(a) | | | JPY 319,000 | | | 06/20/14 | | 6 month JYOR | | 1.500 | | | 21,940 | | | | (6,589 | ) |
Citibank NA(a) | | | JPY 121,000 | | | 06/20/14 | | 1.500% | | 6 month JYOR | | | (1,850 | ) | | | (3,282 | ) |
Deutsche Bank AG (a) | | | JPY 141,000 | | | 06/20/14 | | 6 month JYOR | | 1.500 | | | 4,388 | | | | (10,368 | ) |
Deutsche Bank AG (a) | | | JPY 121,000 | | | 06/20/14 | | 1.500 | | 6 month JYOR | | | (344 | ) | | | (4,788 | ) |
Deutsche Bank Securities, Inc. (a) | | | USD 33,000 | | | 06/20/14 | | 5.100 | | 3 month LIBOR | | | 286,988 | | | | (203,145 | ) |
Deutsche Bank Securities, Inc. (a) | | | USD 1,200 | | | 06/20/14 | | 3 month LIBOR | | 5.100 | | | 8,684 | | | | (11,734 | ) |
JPMorgan Securities, Inc. (a) | | | USD 5,000 | | | 06/20/14 | | 3 month LIBOR | | 5.100 | | | 28,951 | | | | (41,660 | ) |
| Deutsche Bank AG | | | EUR 4,810 | | | 10/16/14 | | 6 month EURO | | 4.378 | | | — | | | | (2,117 | ) |
| Deutsche Bank AG | | | EUR 1,920 | | | 10/16/14 | | 6 month EURO | | 4.435 | | | — | | | | (10,619 | ) |
| Deutsche Bank AG | | | EUR 1,920 | | | 10/16/14 | | 6 month EURO | | 4.442 | | | — | | | | (8,929 | ) |
| Deutsche Bank AG | | | EUR 960 | | | 10/16/14 | | 6 month EURO | | 4.380 | | | — | | | | (613 | ) |
| Citibank NA | | | JPY 213,000 | | | 12/20/16 | | 6 month JYOR | | 1.872 | | | — | | | | (22,764 | ) |
Bank of America NA (a) | | | JPY 106,000 | | | 06/20/17 | | 1.750 | | 6 month JYOR | | | (11,272 | ) | | | 6,292 | |
Barclays Bank PLC (a) | | | SEK 5,000 | | | 06/20/17 | | 3 month SKOF | | 4.250 | | | 7,888 | | | | 10,211 | |
CSFB International London(a) | | | EUR 600 | | | 06/20/17 | | 6 month EURO | | 4.250 | | | 14,046 | | | | (3,786 | ) |
CSFB International London(a) | | | EUR 450 | | | 06/20/17 | | 4.250 | | 6 month EURO | | | (2,187 | ) | | | (5,996 | ) |
| Deutsche Bank AG | | | SEK 18,000 | | | 06/20/17 | | 3 month SKOF | | 4.250 | | | — | | | | 65,158 | |
Deutsche Bank AG (a) | | | EUR 1,770 | | | 06/20/17 | | 4.250 | | 6 month EURO | | | 11,523 | | | | (43,709 | ) |
CSFB International London(a) | | | GBP 100 | | | 06/20/37 | | 6 month BP | | 4.500 | | | 3,413 | | | | 7,584 | |
Deutsche Bank AG (a) | | | USD 700 | | | 06/20/37 | | 5.250 | | 3 month LIBOR | | | 19,140 | | | | (32,766 | ) |
Barclays Bank PLC (a) | | | GBP 150 | | | 06/22/37 | | 6 month BP | | 4.500 | | | 10,297 | | | | 6,212 | |
Citibank NA(a) | | | EUR 310 | | | 06/22/37 | | 6 month EURO | | 4.250 | | | 5,181 | | | | 13,497 | |
Citibank NA(a) | | | GBP 240 | | | 06/22/37 | | 6 month BP | | 4.500 | | | 4,578 | | | | 21,815 | |
Merrill Lynch Capital Markets(a) | | | GBP 160 | | | 06/22/37 | | 6 month BP | | 4.500 | | | 3,162 | | | | 14,433 | |
| Deutsche Bank AG | | | EUR 1,070 | | | 10/16/37 | | 4.568 | | 6 month EURO | | | — | | | | 7,571 | |
| Deutsche Bank AG | | | EUR 430 | | | 10/16/37 | | 4.631 | | 6 month EURO | | | — | | | | 8,932 | |
| Deutsche Bank AG | | | EUR 420 | | | 10/16/37 | | 4.641 | | 6 month EURO | | | — | | | | 9,637 | |
| Deutsche Bank AG | | | EUR 210 | | | 10/16/37 | | 4.573 | | 6 month EURO | | | — | | | | 1,691 | |
| |
TOTAL | | | | | | | | | | | | $ | 801,011 | | | $ | (669,951 | ) |
| |
| |
| (a) | Represents forward starting interest rate swap whose effective dates of commencement of accruals and cash flows occur subsequent to April 30, 2007. |
| | | | | | | | | | | |
AUD | | — | | Australian Dollar | | JYOR | | — | | Japanese Yen Offered Rate |
BBSW | | — | | Australian Bank Bill Swap Reference Rate | | LIBOR | | — | | London Interbank Offered Rate |
BP | | — | | British Pound Offered Rate | | MXN | | — | | Mexican Peso |
CAD | | — | | Canadian Dollar | | NZD | | — | | New Zealand Dollar |
CDOR | | — | | Canadian Dollar Offered Rate | | SEK | | — | | Swedish Krona |
EUR | | — | | Euro Currency | | SKOF | | — | | Swedish Krona Offered Rate |
EURO | | — | | Euro Offered Rate | | USD | | — | | U.S. Dollar |
GBP | | — | | British Pounds | | ZDOR | | — | | New Zealand Offered Rate |
JPY | | — | | Japanese Yen | | | | | | |
The accompanying notes are an integral part of these financial statements.
61
GOLDMAN SACHS CORE PLUS FIXED INCOME FUND
Schedule of Investments (continued)
April 30, 2007 (Unaudited)
| ADDITIONAL INVESTMENT INFORMATION (continued) |
CREDIT DEFAULT SWAP CONTRACTS
| | | | | | | | | | | | | | | | | | | | | |
| | | | | | | | | | | Upfront | | |
| | | | | Notional | | Rate | | | | Payments | | |
| | | | | Amount | | Paid by | | Termination | | (received) made | | Unrealized |
| Referenced Obligation | | Swap Counterparty | | (000s) | | Fund | | Date | | by the Fund | | Gain (Loss) |
| |
Protection Purchased: | | | | | | | | | | | | | | | | | | | | |
| Core Investment Grade Bond Trust | | JPMorgan Securities, Inc. | | $ | 7,000 | | | | 0.400 | % | | 12/20/11 | | $ | (13,697 | ) | | $ | (3,273 | ) |
| Core Investment Grade Bond Trust | | Banc of America Securities LLC | | | 3,200 | | | | 0.350 | | | 06/20/12 | | | 5,092 | | | | (4,920 | ) |
| Core Investment Grade Bond Trust | | JPMorgan Securities, Inc. | | | 5,000 | | | | 0.650 | | | 12/20/16 | | | (30,353 | ) | | | 26,582 | |
| Core Investment Grade Bond Trust | | Banc of America Securities LLC | | | 1,000 | | | | 0.650 | | | 12/20/16 | | | 549 | | | | (1,304 | ) |
| |
TOTAL | | | | | | | | | | | | | | $ | (38,409 | ) | | $ | 17,085 | |
| |
TOTAL RETURN INDEX SWAP CONTRACTS
| | | | | | | | | | | | | | | | | |
| | | Notional | | | | | | | | |
| | | Amount | | Termination | | Reference | | Value | | Unrealized |
| Swap Counterparty | | (000s) | | Date | | Security | | to be Exchanged(a) | | Gain(Loss) |
| |
| JPMorgan Securities, Inc. | | $ | 500 | | | | 05/31/07 | | | Banc of America Securities LLC CMBS AAA 10 Yr Index | | Monthly duration adjusted return | | $ | (213 | ) |
| JPMorgan Securities, Inc. | | | 500 | | | | 05/31/07 | | | Banc of America Securities LLC CMBS AAA 10 Yr Index | | Monthly duration adjusted return | | | 233 | |
| Banc of America Securities LLC | | | 5,500 | | | | 06/02/07 | | | Banc of America Securities LLC CMBS AAA 10 Yr Index | | Monthly duration adjusted return | | | (2,918 | ) |
| Banc of America Securities LLC | | | 500 | | | | 07/03/07 | | | Banc of America Securities LLC CMBS AAA 10 Yr Index | | Monthly duration adjusted return | | | (208 | ) |
| Banc of America Securities LLC | | | 1,000 | | | | 07/18/07 | | | Banc of America Securities LLC CMBS AAA 10 Yr Index | | Monthly duration adjusted return | | | (412 | ) |
| Banc of America Securities LLC | | | 1,000 | | | | 08/02/07 | | | Banc of America Securities LLC CMBS AAA 10 Yr Index | | Monthly duration adjusted return | | | (435 | ) |
| JPMorgan Securities, Inc. | | | 750 | | | | 08/31/07 | | | Banc of America Securities LLC CMBS AAA 10 Yr Index | | Monthly duration adjusted return | | | 350 | |
| JPMorgan Securities, Inc. | | | 1,000 | | | | 09/04/07 | | | Banc of America Securities LLC CMBS AAA 10 Yr Index | | Monthly duration adjusted return | | | 467 | |
| Banc of America Securities LLC | | | 750 | | | | 09/04/07 | | | Banc of America Securities LLC CMBS AAA 10 Yr Index | | Monthly duration adjusted return | | | 210 | |
| |
TOTAL | | | | | | | | | | | | | | $ | (2,926 | ) |
| |
| |
| (a) | Fund receives payments based on any positive monthly duration adjusted return of the underlying index. Fund makes payments on any such negative returns. |
The accompanying notes are an integral part of these financial statements.
62
| |
| GOLDMAN SACHS SINGLE/MULTI-SECTOR TAXABLE FIXED INCOME FUNDS |
| ADDITIONAL INVESTMENT INFORMATION (continued) |
JOINT REPURCHASE AGREEMENT ACCOUNT II — At April 30, 2007, the Funds had undivided interests in the Joint Repurchase Agreement Account II, as follows:
| | | | | |
| Fund | | Principal Amount |
| |
| Government Income | | $ | 33,800,000 | |
| |
| U.S. Mortgages | | | 27,100,000 | |
| |
| Core Fixed Income | | | 39,400,000 | |
| |
| Investment Grade Credit | | | 1,800,000 | |
| |
| Core Plus Fixed Income | | | 17,100,000 | |
| |
REPURCHASE AGREEMENTS
| | | | | | | | | | | | | | | |
| | | Principal | | Interest | | Maturity | | Maturity |
| Counterparty | | Amount | | Rate | | Date | | Value |
| |
| Banc of America Securities LLC | | $ | 1,500,000,000 | | | | 5.24 | % | | 05/01/07 | | $ | 1,500,218,333 | |
| |
| Barclays Capital PLC | | | 1,250,000,000 | | | | 5.24 | | | 05/01/07 | | | 1,250,181,944 | |
| |
| Bear Stearns | | | 750,000,000 | | | | 5.25 | | | 05/01/07 | | | 750,109,375 | |
| |
| Citigroup Global Markets, Inc. | | | 1,050,000,000 | | | | 5.24 | | | 05/01/07 | | | 1,050,152,833 | |
| |
| Credit Suisse First Boston LLC | | | 500,000,000 | | | | 5.25 | | | 05/01/07 | | | 500,072,917 | |
| |
| Deutsche Bank Securities, Inc. | | | 950,000,000 | | | | 5.24 | | | 05/01/07 | | | 950,138,278 | |
| |
| Greenwich Capital Markets | | | 550,000,000 | | | | 5.25 | | | 05/01/07 | | | 550,080,208 | |
| |
| UBS Securities LLC | | | 1,850,000,000 | | | | 5.24 | | | 05/01/07 | | | 1,850,269,279 | |
| |
| Wachovia Bank | | | 250,000,000 | | | | 5.24 | | | 05/01/07 | | | 250,036,389 | |
| |
TOTAL | | $ | 8,650,000,000 | | | | | | | | | $ | 8,651,259,556 | |
| |
At April 30, 2007, the Joint Repurchase Agreement Account II was fully collateralized by Federal Home Loan Mortgage Association, 2.700% to 10.500%, due 05/01/07 to 04/01/47; Federal National Mortgage Association, 3.375% to 9.000%, due 05/15/07 to 05/01/47; Government National Mortgage Association, 4.500% to 9.000%, due 07/15/09 to 04/20/37. The aggregate market value of the collateral, including accrued interest, was $8,849,763,665.
The accompanying notes are an integral part of these financial statements.
63
GOLDMAN SACHS SINGLE/MULTI-SECTOR TAXABLE FIXED INCOME FUNDS
Statements of Assets and Liabilities
April 30, 2007 (Unaudited)
| | | | | | | | | | |
| | | | | Government | | |
| | | | | Income Fund | | |
| |
| | | Assets: |
| |
| | | Investments in securities, at value (identified cost $580,831,139, $360,364,784, $2,201,588,993, $226,838,422 and $55,886,236, respectively) | | $ | 579,561,174 | | | |
| | | Repurchase agreement, at value which equals cost | | | 33,800,000 | | | |
| | | Cash(a) | | | 2,602,687 | | | |
| | | Receivables: | | | | | | |
| | | | Investment securities sold | | | 55,787,445 | | | |
| | | | Interest, at value | | | 3,485,752 | | | |
| | | | Fund shares sold | | | 1,539,643 | | | |
| | | | Reimbursement from investment adviser | | | 63,471 | | | |
| | | | Due from broker-variation margin(b) | | | 1,893,340 | | | |
| | | | Forward foreign currency exchange contracts, at value | | | — | | | |
| | | | Swap contracts, at value (includes upfront payments made of $3,057,573, $763,217, $10,864,529, $626,069 and $567,507, respectively) | | | 2,047,110 | | | |
| | | | Deferred offering cost | | | — | | | |
| | | Other assets, at value | | | 4,366 | | | |
| | | |
| | | Total assets | | | 680,784,988 | | | |
| | | |
| | | Liabilities: |
| |
| | | Due to Custodian — U.S. Dollar | | | 153,677 | | | |
| | | Due to Custodian — Foreign currency (identified cost $31,677) | | | — | | | |
| | | Payables: | | | | | | |
| | | | Investment securities purchased | | | 90,786,076 | | | |
| | | | Swap contracts, at value (includes upfront payments made (received) of $2,480,308, $122,535, $6,606,915, ($145,018)
and ($195,095), respectively) | | | 3,321,824 | | | |
| | | | Fund shares repurchased | | | 1,065,554 | | | |
| | | | Forward foreign currency exchange contracts, at value | | | — | | | |
| | | | Income distribution | | | 375,890 | | | |
| | | | Amounts owed to affiliates | | | 404,801 | | | |
| | | | Due to broker-variation margin | | | — | | | |
| | | Accrued expenses and other liabilities | | | 214,856 | | | |
| | | |
| | | Total liabilities | | | 96,322,678 | | | |
| | | |
| | | Net Assets: |
| |
| | | Paid-in capital | | | 595,419,288 | | | |
| | | Accumulated undistributed net investment income | | | 2,431,406 | | | |
| | | Accumulated net realized gain (loss) on investments, futures, swaps and foreign currency related transactions | | | (5,856,657 | ) | | |
| | | Net unrealized depreciation on investments, futures, swaps and translation of assets and liabilities denominated in foreign currencies | | | (7,531,727 | ) | | |
| | | |
| | | NET ASSETS | | $ | 584,462,310 | | | |
| |
| | | Net Assets: | | | | | | |
| | | | Class A | | $ | 317,262,594 | | | |
| | | | Class B | | | 16,773,369 | | | |
| | | | Class C | | | 12,283,608 | | | |
| | | | Institutional | | | 206,372,301 | | | |
| | | | Service | | | 31,770,438 | | | |
| | | | Separate Account Institutional Shares | | | — | | | |
| |
| | | Shares Outstanding: | | | | | | |
| | | | Class A | | | 21,604,685 | | | |
| | | | Class B | | | 1,142,082 | | | |
| | | | Class C | | | 836,865 | | | |
| | | | Institutional | | | 14,069,120 | | | |
| | | | Service | | | 2,167,555 | | | |
| | | | Separate Account Institutional Shares | | | — | | | |
| |
| | | Total shares outstanding, $0.001 par value (unlimited number of shares authorized) | | | 39,820,307 | | | |
| |
| | | Net asset value, offering and redemption price per share:(c) | | | | | | |
| | | | Class A | | | $14.68 | | | |
| | | | Class B | | | 14.69 | | | |
| | | | Class C | | | 14.68 | | | |
| | | | Institutional | | | 14.67 | | | |
| | | | Service | | | 14.66 | | | |
| | | | Separate Account Institutional Shares | | | — | | | |
| |
| |
| (a) | Includes restricted cash of $2,602,687, $922,945, $23,482,866 and $606,508 relating to swap contracts for Government Income, U.S. Mortgages, Core Fixed Income and Investment Grade Credit Funds, respectively. |
| (b) | Includes restricted cash of $1,427,625, $709,057, $268,180, $1,398,000 and $312,532, relating to initial margin requirements and collateral on futures transactions for Government Income, U.S. Mortgages, Investment Grade Credit, Core Fixed Income and Core Plus Fixed Income Funds, respectively. |
| (c) | Maximum public offering price per share for Class A shares of Government Income, U.S. Mortgages, Core Fixed Income, Investment Grade Credit and Core Plus Fixed Income Funds (NAV per share multiplied by 1.0471) is $15.37, $10.38, $10.31, $10.49 and $10.43, respectively. At redemption, Class B and Class C shares may be subject to a contingent deferred sales charge, assessed on the amount equal to the lesser of the current net asset value or the original purchase price of the shares. |
The accompanying notes are an integral part of these financial statements.
64
GOLDMAN SACHS SINGLE/MULTI-SECTOR TAXABLE FIXED INCOME FUNDS
| | | | | | | | | | | | | | | | | | | |
| | | U.S. Mortgages | | Core Fixed | | Investment Grade | | Core Plus Fixed | | |
| | | Fund | | Income Fund | | Credit Fund | | Income Fund | | |
| |
| | | |
| |
| | | $ | 359,585,420 | | | $ | 2,205,201,023 | | | $ | 227,256,547 | | | $ | 55,981,881 | | | |
| | | | 27,100,000 | | | | 39,400,000 | | | | 1,800,000 | | | | 17,100,000 | | | |
| | | | 997,878 | | | | 24,396,789 | | | | 753,218 | | | | 339 | | | |
| | | | 1,189,574 | | | | 123,271,023 | | | | — | | | | 78,377 | | | |
| | | | 1,493,032 | | | | 16,919,703 | | | | 3,380,844 | | | | 453,932 | | | |
| | | | 74,786 | | | | 5,657,270 | | | | 1,793 | | | | 181,791 | | | |
| | | | 66,073 | | | | — | | | | 35,858 | | | | 81,600 | | | |
| | | | 709,057 | | | | 1,398,000 | | | | 305,227 | | | | 362,563 | | | |
| | | | — | | | | 9,890,958 | | | | — | | | | 283,869 | | | |
| | | | 255,628 | | | | 10,066,699 | | | | 265,042 | | | | 399,397 | | | |
| | | | — | | | | — | | | | — | | | | 69,770 | | | |
| | | | 9,752 | | | | 57,725 | | | | 10,331 | | | | 4,909 | | | |
| | | |
| | | | 391,481,200 | | | | 2,436,259,190 | | | | 233,808,860 | | | | 74,998,428 | | | |
| | | |
| | | |
| |
| | | | — | | | | — | | | | — | | | | — | | | |
| | | | 1,628 | | | | — | | | | — | | | | 30,731 | | | |
| |
| | | | 4,176,636 | | | | 15,398,565 | | | | 4,495,950 | | | | 396,633 | | | |
| | | | 888,657 | | | | 12,692,834 | | | | 762,330 | | | | 292,587 | | | |
| | | | 2,700,060 | | | | 3,651,758 | | | | 2,520,613 | | | | 328 | | | |
| | | | — | | | | 7,401,229 | | | | 15,644 | | | | 185,028 | | | |
| | | | 297,739 | | | | 2,656,673 | | | | 202,251 | | | | 32,804 | | | |
| | | | 112,923 | | | | 1,041,383 | | | | 66,990 | | | | 33,862 | | | |
| | | | 91,381 | | | | 452,643 | | | | — | | | | — | | | |
| | | | 160,344 | | | | 444,064 | | | | 101,412 | | | | 199,125 | | | |
| | | |
| | | | 8,429,368 | | | | 43,739,149 | | | | 8,165,190 | | | | 1,171,098 | | | |
| | | |
| | | |
| |
| | | | 385,092,978 | | | | 2,406,223,062 | | | | 229,329,833 | | | | 74,016,900 | | | |
| | | | 197,377 | | | | 1,902,540 | | | | 310,930 | | | | 35,025 | | | |
| | | | 30,236 | | | | (1,986,062 | ) | | | (3,518,123 | ) | | | 153,491 | | | |
| | | | (2,268,759 | ) | | | (13,619,499 | ) | | | (478,970 | ) | | | (378,086 | ) | | |
| | | |
| | | $ | 383,051,832 | | | $ | 2,392,520,041 | | | $ | 225,643,670 | | | $ | 73,827,330 | | | |
| |
| |
| | | $ | 6,694,280 | | | $ | 743,815,543 | | | $ | 6,937,728 | | | $ | 12,564,687 | | | |
| | | | — | | | | 21,389,450 | | | | — | | | | — | | | |
| | | | — | | | | 24,487,393 | | | | — | | | | 360,253 | | | |
| | | | 138,602,374 | | | | 1,557,319,876 | | | | 3,576,745 | | | | 60,902,390 | | | |
| | | | — | | | | 45,507,779 | | | | — | | | | — | | | |
| | | | 237,755,178 | | | | — | | | | 215,129,197 | | | | — | | | |
| |
| |
| | | | 675,468 | | | | 75,528,084 | | | | 692,310 | | | | 1,261,211 | | | |
| | | | — | | | | 2,162,855 | | | | — | | | | — | | | |
| | | | — | | | | 2,474,610 | | | | — | | | | 36,173 | | | |
| | | | 13,963,860 | | | | 157,534,619 | | | | 356,260 | | | | 6,113,494 | | | |
| | | | — | | | | 4,601,172 | | | | — | | | | — | | | |
| | | | 23,967,316 | | | | — | | | | 21,442,538 | | | | — | | | |
| |
| | | | 38,606,644 | | | | 242,301,340 | | | | 22,491,108 | | | | 7,410,878 | | | |
| |
| |
| | | | $9.91 | | | $ | 9.85 | | | $ | 10.02 | | | $ | 9.96 | | | |
| | | | — | | | | 9.89 | | | | — | | | | — | | | |
| | | | — | | | | 9.90 | | | | — | | | | 9.96 | | | |
| | | | 9.93 | | | | 9.89 | | | | 10.04 | | | | 9.96 | | | |
| | | | — | | | | 9.89 | | | | — | | | | — | | | |
| | | | 9.92 | | | | — | | | | 10.03 | | | | — | | | |
| |
The accompanying notes are an integral part of these financial statements.
65
GOLDMAN SACHS SINGLE/MULTI-SECTOR TAXABLE FIXED INCOME FUNDS
Statements of Operations
For the Six Months Ended April 30, 2007 (Unaudited)
| | | | | | | | |
| | | | | Government |
| | | | | Income Fund |
| |
| | | Investment income: |
| |
| | | Interest | | $ | 15,592,998 | |
| | | Dividends from Underlying Funds | | | — | |
| | | |
| | | Total income | | | 15,592,998 | |
| | | |
| | | Expenses: |
| |
| | | Management fees | | | 1,689,321 | |
| | | Distribution and Service fees(b) | | | 626,033 | |
| | | Transfer Agent fees(b) | | | 365,320 | |
| | | Custody and accounting fees | | | 115,487 | |
| | | Professional fees | | | 37,239 | |
| | | Amortization of offering costs | | | — | |
| | | Service share fees(b) | | | 74,893 | |
| | | Registration fees | | | 42,071 | |
| | | Printing fees | | | 17,107 | |
| | | Trustee fees | | | 9,217 | |
| | | Other | | | 41,385 | |
| | | |
| | | Total expenses | | | 3,018,073 | |
| | | |
| | | Less — expense reductions | | | (274,402 | ) |
| | | |
| | | Net expenses | | | 2,743,671 | |
| | | |
| | | NET INVESTMENT INCOME | | | 12,849,327 | |
| | | |
| | | Realized and unrealized gain (loss) on investments, futures, swaps and foreign currency related transactions: |
| |
| | | Net realized gain (loss) from: | | | | |
| | | | Investment transactions | | | 121,857 | |
| | | | Capital gain distributions from Underlying Funds | | | — | |
| | | | Futures transactions | | | 3,286,301 | |
| | | | Swap contracts | | | 3,209,281 | |
| | | | Foreign currency related transactions | | | — | |
| | | Net change in unrealized gain (loss) on: | | | | |
| | | | Investments | | | 1,509,707 | |
| | | | Futures | | | 67,580 | |
| | | | Swap contracts | | | (6,786,242 | ) |
| | | | Translation of assets and liabilities denominated in foreign currencies | | | — | |
| | | |
| | | Net realized and unrealized gain (loss) on investments, futures, swaps and foreign currency related transactions | | | 1,408,484 | |
| | | |
| | | NET INCREASE IN NET ASSETS RESULTING FROM OPERATIONS | | $ | 14,257,811 | |
| | | |
| |
| (a) | Commenced operations on November 30, 2006. |
| (b) | Class specific Distribution and Service, Transfer Agent, and Service Share fees were as follows: |
| | | | | | | | | | | | | | | | | | | | | | | | | | | | | | | | | | | | | | | | | | | | | |
| | | Distribution and Service Fees | | Transfer Agent Fees | | Service Share Fees |
| | | | | | | | | | |
| | | | | | | Separate | | | |
| | | | | | | Account | | | |
| Fund | | Class A | | | Class B | | | Class C | | | Class A | | | Class B | | | Class C | | | Institutional | | | Service | | | Institutional | | | Class A | | | Institutional | |
| | | | | | | | | | | | | | | | | | | | | | | | | | | | | | | | | | |
| Government Income | | $ | 458,505 | | | $ | 86,683 | | | $ | 80,845 | | | $ | 293,443 | | | $ | 13,869 | | | $ | 12,935 | | | $ | 39,082 | | | $ | 5,991 | | | $ | — | | | $ | — | | | $ | — | |
| U.S. Mortgages | | | 8,317 | | | | — | | | | — | | | | 5,323 | | | | — | | | | — | | | | 24,940 | | | | — | | | | 60,178 | | | | 1,663 | | | | 31,175 | |
| Core Fixed Income | | | 894,336 | | | | 110,298 | | | | 103,383 | | | | 572,375 | | | | 17,648 | | | | 16,541 | | | | 289,484 | | | | 9,149 | | | | — | | | | — | | | | — | |
| Investment Grade Credit | | | 7,559 | | | | — | | | | — | | | | 4,838 | | | | — | | | | — | | | | 670 | | | | — | | | | 42,276 | | | | 1,512 | | | | 838 | |
| Core Plus Fixed Income | | | 4,738 | | | | — | | | | 1,036 | | | | 3,032 | | | | — | | | | 166 | | | | 8,763 | | | | — | | | | — | | | | — | | | | — | |
The accompanying notes are an integral part of these financial statements.
66
| | | | | | | | | | | | | | | | | |
| | | U.S. Mortgages | | Core Fixed | | Investment Grade | | Core Plus Fixed |
| | | Fund | | Income Fund | | Credit Fund | | Income Fund(a) |
| |
| | | |
| |
| | | $ | 11,190,165 | | | $ | 59,635,425 | | | $ | 6,252,245 | | | $ | 1,139,887 | |
| | | | — | | | | — | | | | — | | | | 74,162 | |
| | | |
| | | | 11,190,165 | | | | 59,635,425 | | | | 6,252,245 | | | | 1,214,049 | |
| | | |
| | | |
| |
| | | | 864,492 | | | | 4,224,039 | | | | 441,559 | | | | 102,848 | |
| | | | 8,317 | | | | 1,108,017 | | | | 7,559 | | | | 5,774 | |
| | | | 90,441 | | | | 905,197 | | | | 47,784 | | | | 11,961 | |
| | | | 102,958 | | | | 129,355 | | | | 36,921 | | | | 55,855 | |
| | | | 35,079 | | | | 54,750 | | | | 27,299 | | | | 55,220 | |
| | | | — | | | | — | | | | — | | | | 49,230 | |
| | | | 32,838 | | | | 114,367 | | | | 2,350 | | | | — | |
| | | | 18,388 | | | | 50,992 | | | | 18,079 | | | | 24,894 | |
| | | | 13,575 | | | | 46,201 | | | | 17,869 | | | | 17,914 | |
| | | | 9,217 | | | | 9,217 | | | | 9,217 | | | | 9,217 | |
| | | | 4,024 | | | | 50,028 | | | | 500 | | | | 12,100 | |
| | | |
| | | | 1,179,329 | | | | 6,692,163 | | | | 609,137 | | | | 345,013 | |
| | | |
| | | | (383,748 | ) | | | (56,337 | ) | | | (206,547 | ) | | | (223,921 | ) |
| | | |
| | | | 795,581 | | | | 6,635,826 | | | | 402,590 | | | | 121,092 | |
| | | |
| | | | 10,394,584 | | | | 52,999,599 | | | | 5,849,655 | | | | 1,092,957 | |
| | | |
| | | |
| |
| |
| | | | 812,378 | | | | 3,164,439 | | | | 18,201 | | | | (116,100 | ) |
| | | | — | | | | — | | | | — | | | | 17,610 | |
| | | | 293,275 | | | | 11,646,797 | | | | 420,874 | | | | 400,757 | |
| | | | 540,074 | | | | 8,781,514 | | | | 360,228 | | | | (19,538 | ) |
| | | | — | | | | (3,742,927 | ) | | | (171,905 | ) | | | (129,238 | ) |
| |
| | | | 440,664 | | | | (1,265,898 | ) | | | 1,169,538 | | | | 95,645 | |
| | | | 370,316 | | | | 1,158,388 | | | | 118,859 | | | | 82,943 | |
| | | | (1,185,024 | ) | | | (21,665,080 | ) | | | (377,186 | ) | | | (655,792 | ) |
| | | | — | | | | 3,429,141 | | | | 13,012 | | | | 99,118 | |
| | | |
| |
| | | | 1,271,683 | | | | 1,506,374 | | | | 1,551,621 | | | | (224,595 | ) |
| | | |
| | | $ | 11,666,267 | | | $ | 54,505,973 | | | $ | 7,401,276 | | | $ | 868,362 | |
| | | |
The accompanying notes are an integral part of these financial statements.
67
GOLDMAN SACHS SINGLE/ MULTI-SECTOR TAXABLE FIXED INCOME FUNDS
Statements of Changes in Net Assets
| | | | | | | | | | | | | | | | | | | | |
| | | | | Government Income Fund | | U.S. Mortgages Fund |
| | | | | | | |
| | | | | For the | | | | For the | | |
| | | | | Six Months | | | | Six Months | | |
| | | | | Ended | | For the | | Ended | | For the |
| | | | | April 30, 2007 | | Year Ended | | April 30, 2007 | | Year Ended |
| | | | | (Unaudited) | | October 31, 2006 | | (Unaudited) | | October 31, 2006 |
| |
| | | From operations: |
| |
| | | Net investment income | | $ | 12,849,327 | | | $ | 31,518,636 | | | $ | 10,394,584 | | | $ | 22,135,388 | |
| | | Net realized gain (loss) on investment, futures, swaps and foreign currency related transactions | | | 6,617,439 | | | | (14,124,908 | ) | | | 1,645,727 | | | | (342,237 | ) |
| | | Net change in unrealized gain (loss) on investments, futures, swaps and translation of assets and liabilities denominated in foreign currencies | | | (5,208,955 | ) | | | 11,340,934 | | | | (374,044 | ) | | | 5,107,390 | |
| | | |
| | | Net increase in net assets resulting from operations | | | 14,257,811 | | | | 28,734,662 | | | | 11,666,267 | | | | 26,900,541 | |
| | | |
| |
| | | Distributions to shareholders: |
| |
| | | From net investment income | | | | | | | | | | | | | | | | |
| | | | Class A Shares | | | (7,420,703 | ) | | | (24,629,669 | ) | | | (158,864 | ) | | | (327,343 | ) |
| | | | Class B Shares | | | (284,801 | ) | | | (650,709 | ) | | | — | | | | — | |
| | | | Class C Shares | | | (264,956 | ) | | | (542,468 | ) | | | — | | | | — | |
| | | | Institutional Shares | | | (4,300,788 | ) | | | (4,808,529 | ) | | | (3,177,111 | ) | | | (4,165,860 | ) |
| | | | Service Shares | | | (585,273 | ) | | | (711,718 | ) | | | — | | | | — | |
| | | | Separate Account Institutional Shares | | | — | | | | — | | | | (7,751,078 | ) | | | (17,156,726 | ) |
| | | From net realized gains | | | | | | | | | | | | | | | | |
| | | | Class A Shares | | | — | | | | (160,181 | ) | | | — | | | | — | |
| | | | Class B Shares | | | — | | | | (5,062 | ) | | | — | | | | — | |
| | | | Class C Shares | | | — | | | | (3,803 | ) | | | — | | | | — | |
| | | | Institutional Shares | | | — | | | | (12,822 | ) | | | — | | | | — | |
| | | | Service Shares | | | — | | | | (3,776 | ) | | | — | | | | — | |
| | | From capital | | | | | | | | | | | | | | | | |
| | | | Class A Shares | | | — | | | | — | | | | — | | | | — | |
| | | | Class B Shares | | | — | | | | — | | | | — | | | | — | |
| | | | Class C Shares | | | — | | | | — | | | | — | | | | — | |
| | | | Institutional Shares | | | — | | | | — | | | | — | | | | — | |
| | | | Service Shares | | | — | | | | — | | | | — | | | | — | |
| | | |
| | | Total distributions to shareholders | | | (12,856,521 | ) | | | (31,528,737 | ) | | | (11,087,053 | ) | | | (21,649,929 | ) |
| | | |
| |
| | | From share transactions: |
| |
| | | Net proceeds from sales of shares | | | 249,266,519 | | | | 490,086,040 | | | | 46,818,137 | | | | 293,021,211 | |
| | | Proceeds received in connection with merger | | | — | | | | — | | | | — | | | | — | |
| | | Reinvestment of dividends and distributions | | | 10,379,697 | | | | 28,194,885 | | | | 8,956,554 | | | | 18,063,365 | |
| | | Cost of shares repurchased | | | (315,236,050 | ) | | | (727,312,932 | ) | | | (105,707,311 | ) | | | (353,767,406 | ) |
| | | |
| | | Net increase (decrease) in net assets resulting from share transactions | | | (55,589,834 | ) | | | (209,032,007 | ) | | | (49,932,620 | ) | | | (42,682,830 | ) |
| | | |
| | | TOTAL INCREASE (DECREASE) | | | (54,188,544 | ) | | | (211,826,082 | ) | | | (49,353,406 | ) | | | (37,432,218 | ) |
| | | |
| |
| | | Net assets: |
| |
| | | Beginning of period | | | 638,650,854 | | | | 850,476,936 | | | | 432,405,238 | | | | 469,837,456 | |
| | | |
| | | End of period | | $ | 584,462,310 | | | $ | 638,650,854 | | | $ | 383,051,832 | | | $ | 432,405,238 | |
| | | |
| | | Accumulated undistributed (distributions in excess of) net investment income | | $ | 2,431,406 | | | $ | 2,438,600 | | | $ | 197,377 | | | $ | 889,846 | |
| | | |
| |
| (a) | Commenced operations on November 30, 2006. |
The accompanying notes are an integral part of these financial statements.
68
GOLDMAN SACHS SINGLE/MULTI-SECTOR TAXABLE FIXED INCOME FUNDS
| | | | | | | | | | | | | | | | | | | | | |
| | | Core Fixed Income Fund | | Investment Grade Credit Fund | | Core Plus Fixed Income Fund(a) |
| | | | | | | |
| | | For the | | | | For the | | | | |
| | | Six Months | | | | Six Months | | | | For the |
| | | Ended | | For the | | Ended | | For the | | Period Ended |
| | | April 30, 2007 | | Year Ended | | April 30, 2007 | | Year Ended | | April 30, 2007 |
| | | (Unaudited) | | October 31, 2006 | | (Unaudited) | | October 31, 2006 | | (Unaudited) |
| |
| | | |
| |
| | | $ | 52,999,599 | | | $ | 97,632,224 | | | $ | 5,849,655 | | | $ | 11,221,247 | | | $ | 1,092,957 | |
| |
| | | | 19,849,823 | | | | (30,351,124 | ) | | | 627,398 | | | | (3,970,304 | ) | | | 153,491 | |
| |
| |
| | | | (18,343,449 | ) | | | 37,147,203 | | | | 924,223 | | | | 3,469,449 | | | | (378,086 | ) |
| | | |
| | | | 54,505,973 | | | | 104,428,303 | | | | 7,401,276 | | | | 10,720,392 | | | | 868,362 | |
| | | |
| |
| | | |
| |
| |
| | | | (14,493,041 | ) | | | (27,592,559 | ) | | | (145,917 | ) | | | (173,533 | ) | | | (73,338 | ) |
| | | | (362,223 | ) | | | (809,299 | ) | | | — | | | | — | | | | — | |
| | | | (339,353 | ) | | | (683,475 | ) | | | — | | | | — | | | | (3,521 | ) |
| | | | (31,885,122 | ) | | | (59,364,208 | ) | | | (87,661 | ) | | | (173,199 | ) | | | (981,073 | ) |
| | | | (891,834 | ) | | | (1,497,789 | ) | | | — | | | | — | | | | — | |
| | | | — | | | | — | | | | (5,583,112 | ) | | | (10,283,179 | ) | | | — | |
| |
| | | | — | | | | (4,057,820 | ) | | | — | | | | — | | | | — | |
| | | | — | | | | (173,446 | ) | | | — | | | | — | | | | — | |
| | | | — | | | | (143,326 | ) | | | — | | | | — | | | | — | |
| | | | — | | | | (6,915,957 | ) | | | — | | | | — | | | | — | |
| | | | — | | | | (198,051 | ) | | | — | | | | — | | | | — | |
| |
| | | | — | | | | (666,129 | ) | | | — | | | | — | | | | — | |
| | | | — | | | | (19,538 | ) | | | — | | | | — | | | | — | |
| | | | — | | | | (16,500 | ) | | | — | | | | — | | | | — | |
| | | | — | | | | (1,433,147 | ) | | | — | | | | — | | | | — | |
| | | | — | | | | (36,159 | ) | | | — | | | | — | | | | — | |
| | | |
| | | | (47,971,573 | ) | | | (103,607,403 | ) | | | (5,816,690 | ) | | | (10,629,911 | ) | | | (1,057,932 | ) |
| | | |
| |
| | | |
| |
| | | | 430,144,982 | | | | 1,051,438,670 | | | | 30,473,681 | | | | 68,516,397 | | | | 75,028,827 | |
| | | | 93,427,679 | | | | 230,276,588 | | | | — | | | | — | | | | — | |
| | | | 31,923,612 | | | | 70,943,055 | | | | 4,525,677 | | | | 8,219,129 | | | | 1,012,248 | |
| | | | (533,866,152 | ) | | | (829,727,761 | ) | | | (23,798,846 | ) | | | (63,423,525 | ) | | | (2,024,175 | ) |
| | | |
| | | | 21,630,121 | | | | 522,930,552 | | | | 11,200,512 | | | | 13,312,001 | | | | 74,016,900 | |
| | | |
| | | | 28,164,521 | | | | 523,751,452 | | | | 12,785,098 | | | | 13,402,482 | | | | 73,827,330 | |
| | | |
| |
| | | |
| |
| | | | 2,364,355,520 | | | | 1,840,604,068 | | | | 212,858,572 | | | | 199,456,090 | | | | — | |
| | | |
| | | $ | 2,392,520,041 | | | $ | 2,364,355,520 | | | $ | 225,643,670 | | | $ | 212,858,572 | | | $ | 73,827,330 | |
| | | |
| |
| | | $ | 1,902,540 | | | $ | (3,125,486 | ) | | $ | 310,930 | | | $ | 277,965 | | | $ | 35,025 | |
| | | |
The accompanying notes are an integral part of these financial statements.
69
GOLDMAN SACHS SINGLE/MULTI-SECTOR TAXABLE FIXED INCOME FUNDS
Notes to Financial Statements
April 30, 2007 (Unaudited)
Goldman Sachs Trust (the “Trust”) is a Delaware statutory trust registered under the Investment Company Act of 1940, as amended (“the Act”), as an open-end management investment company. The Trust includes Goldman Sachs Government Income Fund (“Government Income”), Goldman Sachs U.S. Mortgages Fund (“U.S. Mortgages”), Goldman Sachs Core Fixed Income Fund (“Core Fixed Income”) Goldman Sachs Investment Grade Credit Fund (“Investment Grade Credit”) and Goldman Sachs Core Plus Fixed Income Fund (“Core Plus Fixed Income”) (collectively, the “Funds” or individually a “Fund”). Each Fund is a diversified portfolio of the Trust. U.S. Mortgages and Investment Grade Credit offer three classes of shares — Class A, Institutional and Separate Account Institutional and Core Plus Fixed Income currently offers three classes of Shares — Class A, Class C and Institutional. Government Income and Core Fixed Income offer five classes of shares — Class A, Class B, Class C, Institutional and Service. Class A shares of the funds charge a maximum initial sales charge of 4.50%. The contingent deferred sales charge for Class B shares is 5.00% maximum declining to zero after six years for the Government Income and Core Fixed Income. The Class C shares of Government Income, Core Fixed Income and Core Plus Fixed Income have a contingent deferred sales charge of 1.00% during the first 12 months. Institutional, Service and Separate Account Institutional shares are not subject to a sales charge. Goldman, Sachs & Co. (“Goldman Sachs”) as distributor of the Funds receives such sales loads of which a certain portion may be retained.
| 2. SIGNIFICANT ACCOUNTING POLICIES |
The following is a summary of the significant accounting policies consistently followed by the Funds. The preparation of financial statements in conformity with U.S. generally accepted accounting principles requires management to make estimates and assumptions that may affect the reported amounts. Actual results could differ from those estimates.
A. Investment Valuation — Portfolio securities for which market quotations are readily available are valued at market value on the basis of quotations furnished by a pricing service or provided by dealers in such securities. Investments in the investment companies that are not traded on a securities exchange (the “Underlying Funds”) are valued at the net asset value per share of each Underlying Fund on the day of valuation. Certain instruments may be valued by the investment adviser in good faith through the use of valuation models (matrix pricing) that take into account spread and yield changes on government instruments in the appropriate market. Short-term debt obligations maturing in sixty days or less are valued at amortized cost, which approximates market value. Portfolio securities for which market quotations are not readily available or are deemed not to reflect market value by the investment adviser are valued based on yield equivalents, pricing matrices or other sources, under valuation procedures established by the Trust’s Board of Trustees.
B. Security Transactions and Investment Income — Security transactions are reflected as of the trade date. Realized gains and losses on sales of portfolio securities are calculated using the identified cost basis. Interest income is recorded on the basis of interest accrued, premium amortized and discount accreted. Market discounts, original issue discount (OID) and market premiums on debt securities are accreted/amortized to interest income over the life of the security with a corresponding adjustment in the cost basis of that security. Net investment income (other than class specific expenses) and unrealized and realized gains or losses are allocated daily to each class of shares of the respective Funds based upon the relative proportion of net assets of each class.
Certain mortgage security paydown gains and losses are recorded as interest income (loss) and included in interest income in the accompanying Statements of Operations.
70
GOLDMAN SACHS SINGLE/MULTI-SECTOR TAXABLE FIXED INCOME FUNDS
| 2. SIGNIFICANT ACCOUNTING POLICIES (continued) |
Pursuant to applicable law and procedures adopted by the Trust’s Board of Trustees, securities transactions in portfolio securities (including futures transactions) may be effected from time to time through Goldman Sachs or an affiliate. In order for Goldman Sachs or an affiliate, acting as agent, to effect securities or futures transactions for a Fund, the commissions, fees or other remuneration received by Goldman Sachs or an affiliate must be reasonable and fair compared to the commissions, fees or other remuneration received by other brokers in connection with comparable transactions involving similar securities or futures contracts.
C. Expenses — Expenses incurred by the Trust that do not specifically relate to an individual Fund of the Trust are allocated to the Funds on a straight-line and/or “pro-rata” basis depending upon the nature of the expense. Expenses included in the accompanying financial statements reflect the expenses of each Fund and do not include any expenses associated with the Underlying Funds.
Class A, Class B and Class C shareholders of the Funds bear all expenses and fees relating to their respective Distribution and Service Plans. Service Shares bear all expenses and fees relating to their Service and Shareholder Administration Plans. Each class of shares of the Funds separately bear its respective class-specific Transfer Agency fees. Class A and Institutional shareholders of U.S. Mortgages and Investment Grade Credit bear their respective class specific Account Services fees.
D. Federal Taxes and Distribution to Shareholders — It is each Fund’s policy to comply with the requirements of the Internal Revenue Code of 1986, as amended (the “Code”), applicable to regulated investment companies and to distribute each year substantially all of its investment company taxable and tax-exempt income and capital gains to its shareholders. Accordingly, no federal tax provisions are required. Dividends and distributions to shareholders are recorded on the ex-dividend date. Income distributions are declared daily and paid monthly. Capital gain distributions, if any, are declared and paid annually. Net capital losses are carried forward to future years and may be used to the extent allowed by the Code to offset any future capital gains. Utilization of capital loss carryforwards will reduce the requirement of future capital gain distributions.
The characterization of distributions to shareholders for financial reporting purposes is determined in accordance with Federal income tax rules, which may differ from U.S. generally accepted accounting principles. Therefore, the source of each Fund’s distributions may be shown in the accompanying financial statements as either from net investment income, net realized gains, or as a tax return of capital.
E. Foreign Currency Translations — The books and records of the Funds are maintained in U.S. dollars. Amounts denominated in foreign currencies are translated into U.S. dollars on the following basis: (i) investment valuations, foreign currency and other assets and liabilities initially expressed in foreign currencies are converted each business day into U.S. dollars based upon current exchange rates; and (ii) purchases and sales of foreign investments, income and expenses are converted into U.S. dollars based upon currency exchange rates prevailing on the respective dates of such transactions.
Net realized and unrealized gain (loss) on foreign currency transactions will represent: (i) foreign exchange gains and losses from the sale and holdings of foreign currencies; (ii) gains and losses from the sale of investments (applicable to fixed income securities); (iii) currency gains and losses between trade date and settlement date on investment securities transactions and forward exchange contracts; and (iv) gains and losses from the difference between amounts of interest, dividends and foreign withholding taxes recorded and the amounts actually received. The effect of changes in foreign currency exchange rates on securities and derivative instruments are not segregated in the Statement of Operations from the effects of changes in market prices of those securities and derivative instruments, and are included with the net realized and unrealized gain (loss)
71
GOLDMAN SACHS SINGLE/MULTI-SECTOR TAXABLE FIXED INCOME FUNDS
Notes to Financial Statements (continued)
April 30, 2007 (Unaudited)
| 2. SIGNIFICANT ACCOUNTING POLICIES (continued) |
on securities and derivative instruments transactions. Net unrealized foreign exchange gains and losses arising from changes in the value of other assets and liabilities as a result of changes in foreign exchange rates are included as increases and decreases in unrealized gain (loss) on foreign currency related transactions.
F. Forward Foreign Currency Exchange Contracts — Core Fixed Income, Investment Grade Credit and Core Plus Fixed Income may enter into forward foreign currency exchange contracts for the purchase or sale of a specific foreign currency at a fixed price on a future date as a hedge or cross-hedge against either specific transactions or portfolio positions. Core Fixed Income, Investment Grade Credit and Core Plus Fixed Income may also purchase and sell forward contracts to seek to increase total return. All commitments are “marked-to-market” daily at the applicable translation rates and any resulting unrealized gains or losses are recorded in the Funds’ financial statements. Core Fixed Income, Investment Grade Credit and Core Plus Fixed Income record realized gains or losses at the time a forward contract is offset by entry into a closing transaction or extinguished by delivery of the currency. Risks may arise upon entering into these contracts from the potential inability of counterparties to meet the terms of their contracts and from unanticipated movements in the value of a foreign currency relative to the U.S. dollar.
The contractual amounts of forward foreign currency contracts do not necessarily represent the amounts potentially subject to risk. The measurement of the risks associated with these instruments is meaningful only when all related and offsetting transactions are considered. At April 30, 2007, Core Fixed Income, Investment Grade Credit and Core Plus Fixed Income had segregated sufficient cash and/or securities to cover any commitments under these contracts.
G. Forward Sales Contracts — The Funds may enter into forward security sales of mortgage-backed securities in which the Funds sell securities in the current month for delivery of securities defined by pool-stipulated characteristics on a specified future date. The value of the contract is recorded as an asset and a liability on the Funds’ records with the difference between its market value and expected cash proceeds recorded as an unrealized gain or loss. Gains or losses are realized upon delivery of the security sold.
H. Futures Contracts — The Funds may enter into futures transactions to hedge against changes in interest rates, securities prices, currency exchange rates or to seek to increase total return. Futures contracts are valued at the last settlement price, or in the absence of a sale, the last bid price, at the end of each day on the board of trade or exchange upon which they are traded. Upon entering into a futures contract, the Funds are required to segregate cash or securities equal to the minimum “initial margin” requirement of the associated futures exchange. Subsequent payments for futures contracts (“variation margin”) are paid or received by the Funds, dependent on the fluctuations in the value of the contracts, and are recorded for financial reporting purposes as unrealized gains or losses. When contracts are closed, the Funds realize a gain or loss which is reported in the Statement of Operations.
The use of futures contracts involves, to varying degrees, elements of market and counterparty risk which may exceed the amounts recognized in the Statement of Assets and Liabilities. Changes in the value of a futures contract may not directly correlate with changes in the value of the underlying securities. These risks may decrease the effectiveness of the Funds’ strategies and potentially result in a loss.
I. Mortgage Dollar Rolls — The Funds may enter into mortgage “dollar rolls” in which the Funds sell securities in the current month for delivery and simultaneously contract with the same counterparty to repurchase similar (same type, coupon and maturity) but not identical securities on a specified future date. For financial and tax reporting purposes, the Funds treat
72
GOLDMAN SACHS SINGLE/MULTI-SECTOR TAXABLE FIXED INCOME FUNDS
| 2. SIGNIFICANT ACCOUNTING POLICIES (continued) |
mortgage dollar rolls as two separate transactions; one involving the purchase of a security and a separate transaction involving a sale.
During the settlement period between sale and repurchase, the Funds will not be entitled to accrued interest and/or receive principal payments on the securities sold. Dollar roll transactions involve the risk that the market value of the securities sold by the Funds may decline below the repurchase price of those securities. In the event the buyer of the securities under a dollar roll transaction files for bankruptcy or becomes insolvent, the Funds’ use of proceeds of the transaction may be restricted pending a determination by, or with respect to, the other party.
J. Repurchase Agreements — Repurchase agreements involve the purchase of securities subject to the seller’s agreement to repurchase the securities at a mutually agreed upon date and price. During the term of a repurchase agreement, the value of the underlying securities held as collateral on behalf of the Funds, including accrued interest, is required to exceed the value of the repurchase agreement, including accrued interest. If the seller defaults or becomes insolvent, realization of the collateral by the Funds may be delayed or limited and there may be a decline in the value of the collateral during the period while the Funds seek to assert their rights. The underlying securities for all repurchase agreements are held in safekeeping at the Funds’ custodian or designated subcustodians under triparty repurchase agreements.
Pursuant to exemptive relief granted by the Securities and Exchange Commission (“SEC”) and terms and conditions contained therein, the Funds, together with other registered investment companies having management or investment advisory agreements with Goldman Sachs Asset Management, L.P. (“GSAM”), or its affiliates, may transfer uninvested cash into joint accounts, the daily aggregate balance of which is invested in one or more repurchase agreements.
K. Securities purchased on a when-issued or delayed-delivery basis — The Funds may purchase securities on a when-issued or delayed-delivery basis. Securities purchased or sold on a when-issued or delayed-delivery basis may be settled a month or more after trade date; interest income is not accrued until settlement date. At the time a Fund enters into such transactions, it is required to have segregated assets with a current value at least equal to the amount of its when-issued or delayed-delivery purchase commitments. Credit risks exist on these commitments to the extent of any unrealized gains on the underlying securities purchased and any unrealized losses on the underlying securities sold. Market risk exists on these commitments to the same extent as if the securities were owned on a settled basis and gains and losses are recorded and reported in the same manner. In addition to the normal credit and market risks, transactions with delayed settlement dates may expose the Funds to greater risk that such transactions may not be consummated.
L. Segregation Transactions — The Funds may enter into certain derivative transactions to seek to increase total return. Forward foreign currency exchange contracts, futures contracts, swap contracts, written options, mortgage dollar rolls, when-issued securities and forward commitments represent examples of such transactions. As a result of entering into these transactions, the Funds are required to segregate liquid assets with a current value equal to or greater than the market value of the corresponding transactions.
M. Swap Contracts — The Funds may enter into swap transactions for hedging purposes or to seek to increase total return. Risks may arise as a result of the failure of the counterparty to the swap contract to comply with the terms of the swap contract. The loss incurred by the failure of a counterparty is generally limited to the net payment to be received by the Funds and/or the termination value at the end of the contract. Therefore, the Funds consider the creditworthiness of each counterparty to a contract in evaluating potential credit risk. Additionally, risks may arise from unanticipated movements in interest rates or in the value of the underlying reference asset or index. Entering into these agreements involves, to varying
73
GOLDMAN SACHS SINGLE/MULTI-SECTOR TAXABLE FIXED INCOME FUNDS
Notes to Financial Statements (continued)
April 30, 2007 (Unaudited)
| 2. SIGNIFICANT ACCOUNTING POLICIES (continued) |
degrees, market, liquidity, elements of credit, legal and documentation risk in excess of amounts recognized in the Statement of Assets and Liabilities. The Funds may invest in the following types of swaps:
An interest rate swap is an agreement that obligates two parties to exchange a series of cash flows at specified intervals based upon or calculated by reference to changes in specified prices, rates or indices for a specified amount of an underlying asset or notional principal amount. The payment flows are usually netted against each other, with the difference being paid by one party to the other.
A total return swap is an agreement that gives a Fund the right to receive the appreciation in the value of a specified security, index or other instrument in return for a fee paid to the counterparty, which will typically be an agreed upon interest rate. If the underlying asset declines in value over the term of the swap, the Fund may also be required to pay the dollar value of that decline to the counterparty.
Credit default swap agreements involve one party making a stream of payments to another party in exchange for the right to receive a specified return in the event of a default by a third party, typically a corporate issuer on its obligation. A Fund may use credit default swaps to provide a measure of protection against defaults of a corporate issuer or to take an active long or short position with respect to the likelihood of a particular issuer’s default. As a seller of protection, a Fund generally receives an upfront payment or a fixed rate of income throughout the term of the swap provided that there is no credit event. Credit default swaps may involve greater risks than if a Fund had invested in the referenced obligation directly. If the Fund enters into a buy contract and no credit event occurs, its exposure is limited to the periodic payments previously made to the counterparty. In addition, if the Fund enters into a sale contract and a credit event occurs, the value of the referenced obligation received by the Fund reduced by the periodic payments previously received may be less than the maximum payout amount it pays to the counterparty, resulting in a loss to the Fund.
Swaps are marked to market daily using either pricing vendor quotations, counterparty prices or model prices and the change in value, if any, is recorded as an unrealized gain or loss in the Statement of Operations. Upfront payments made and/or received by the Funds, are recorded as an asset and/ or liability on the Statement of Assets and Liabilities and are recorded as a realized gain or loss ratably over the contract’s term/event with the exception of forward starting interest rate swaps, which are recorded as a realized gain or loss on termination date. Periodic payments received or made on swap contracts are recorded as realized gain or loss on the Statement of Operations. Gains or losses are also realized upon early termination of the swap agreements and recorded as realized gains on swaps on the Statement of Operations.
N. Treasury Inflation-Protected Securities — The Funds may invest in Treasury Inflation-Protected Securities (“TIPS”), specially structured bonds in which the principal amount is adjusted daily to keep pace with inflation, as measured by the U.S. Consumer Pricing Index (“CPI”). The adjustments for interest income due to inflation are reflected in interest income on the Statement of Operations. The repayment of the original bond principal upon maturity and adjustments for interest income are guaranteed by the full faith and credit of the U.S. Government.
GSAM, an affiliate of Goldman Sachs, serves as investment adviser pursuant to an Investment Management Agreement (the “Agreement”) with the Trust on behalf of the Funds. Under the Agreement, GSAM manages the Funds, subject to the general supervision of the Trust’s Board of Trustees.
As compensation for the services rendered pursuant to the Agreement, the assumption of the expenses related thereto and administering the Funds’ business affairs, including providing facilities, GSAM is entitled to a fee (“Management fee”), computed daily and payable monthly, equal to an annual percentage rate of each Fund’s average daily net assets.
74
GOLDMAN SACHS SINGLE/MULTI-SECTOR TAXABLE FIXED INCOME FUNDS
| 3. AGREEMENTS (continued) |
For the six months ended April 30, 2007, GSAM received a Management fee on a contractual basis at the following rates:
| | | | | | | | | | | | | | | | | | | | | |
| | | Contractual Management Fee | | |
| | | | | Effective |
| | | Up to | | Next | | Over | | Effective | | Net Management |
| Fund | | $1 billion | | $1 billion | | $2 billion | | Fee | | Fee (After Waivers) |
| |
| Government Income | | | 0.54% | | | | 0.49 | % | | | 0.47 | % | | | 0.54 | % | | | 0.54 | % |
| |
| U.S. Mortgages | | | 0.40 | | | | 0.36 | | | | 0.34 | | | | 0.40 | | | | 0.33 | * |
| |
| Core Fixed Income | | | 0.40 | | | | 0.36 | | | | 0.34 | | | | 0.38 | | | | 0.38 | |
| |
| Investment Grade Credit | | | 0.40 | | | | 0.36 | | | | 0.34 | | | | 0.40 | | | | 0.33 | * |
| |
| Core Plus Fixed Income | | | 0.45 | | | | 0.41 | | | | 0.39 | | | | 0.45 | | | | 0.45 | |
| |
| |
| * | GSAM voluntarily agreed to waive a portion of its management fee in order to achieve an effective fee of 0.33% and 0.33%, as an annual percentage rate of average daily net assets of U.S. Mortgages and Investment Grade Credit, respectively. |
GSAM has also voluntarily agreed to limit certain “Other Expenses” (excluding Management fees, Distribution and Service fees, Transfer Agency fees and expenses, Service Share fees, Account Service fees, taxes, interest, brokerage fees and litigation, indemnification, shareholder meeting and other extraordinary expenses exclusive of any custody and transfer agent fee credit reductions) to the extent that such expenses exceed, on an annual basis, a percentage rate of the average daily net assets of each Fund. Such expense reimbursements, if any, are computed daily and paid monthly. In addition, the Funds are not obligated to reimburse GSAM for prior fiscal year expense reimbursements, if any. For the six months ended April 30, 2007, the Other Expense limitations for Government Income, U.S. Mortgages, Core Fixed Income, Investment Grade Credit and Core Plus Fixed Income as an annual percentage rate of average daily net assets were 0.004%, 0.004%, 0.104%, 0.004% and 0.004%, respectively.
The Trust, on behalf of each Fund, has adopted Distribution and Service Plans. Under the Plans, Goldman Sachs and/or authorized dealers are entitled to a monthly fee for distribution services equal to, on an annual basis, 0.25% of the average daily net assets of U.S. Mortgages and Investment Grade Credit attributable to Class A shares and 0.25%, 0.75% and 0.75% of the average daily net assets of Government Income, Core Fixed Income and Core Plus Fixed Income attributable to Class A, Class B and Class C shares, respectively. Additionally, Goldman Sachs and/or authorized dealers are entitled to receive, under the Plans, a separate fee for personal and account maintenance services equal to, on an annual basis, 0.25% of the average daily net assets of Government Income, Core Fixed Income and Core Plus Fixed Income attributable to Class B or Class C Shares, as appropriate.
75
GOLDMAN SACHS SINGLE/MULTI-SECTOR TAXABLE FIXED INCOME FUNDS
Notes to Financial Statements (continued)
April 30, 2007 (Unaudited)
| 3. AGREEMENTS (continued) |
Goldman Sachs serves as Distributor of the shares of the Funds pursuant to a Distribution Agreement. Goldman Sachs may retain a portion of the Class A sales load and Class B and Class C contingent deferred sales charges. During for the six months ended April 30, 2007, Goldman Sachs advised the Funds that it retained the following approximate amounts:
| | | | | | | | | | | | | |
| | | Sales | | Contingent Deferred |
| | | Load | | Sales Charge |
| | | | | |
| Fund | | Class A | | Class B | | Class C |
| |
| Government Income | | | $15,200 | | | | $100 | | | $ | 600 | |
| |
| U.S. Mortgages | | | 400 | | | | — | | | | — | |
| |
| Core Fixed Income | | | 61,500 | | | | — | | | | 1,000 | |
| |
| Investment Grade Credit | | | 700 | | | | — | | | | — | |
| |
| Core Plus Fixed Income | | | 3,700 | | | | — | | | | — | |
| |
Goldman Sachs also serves as Transfer Agent of the Funds for a fee. The fees charged for such transfer agency services are calculated daily and payable monthly at an annual rate as follows: 0.16% of the average daily net assets for Class A, Class B and Class C Shares and 0.04% of the average daily net assets for Separate Account Institutional (U.S. Mortgages and Investment Grade Credit only), Institutional for the Funds and Service shares (Government Income and Core Fixed Income only). For the six months ended April 30, 2007, Goldman Sachs has voluntarily agreed to waive a portion of the Transfer Agent fees equal to 0.02% of the average daily net assets attributable to Institutional and Separate Account Institutional shares of U.S. Mortgages and Investment Grade Credit. Goldman Sachs may discontinue or modify this waiver in the future at its discretion.
The Trust, on behalf of Government Income and Core Fixed Income, has adopted a Service Plan and a Shareholder Administration Plan for Service Shares. These plans allow for Service Shares to compensate service organizations for providing varying levels of personal and account administration and shareholder administration services to their customers who are beneficial owners of such shares. The Service Plan, and Shareholder Administration Plan provide for compensation to the service organizations in an amount equal to, on an annualized basis, 0.25% and 0.25% respectively, of the average daily net assets of each share class. The Trust, on behalf of Class A and Institutional Class Shares of U.S. Mortgages and Investment Grade Credit Funds, has adopted Account Service Plans. Under these Plans, Goldman Sachs and authorized dealers are entitled to receive a fee for account service and account maintenance equal to, on an annual basis, 0.05% of the average daily net assets of U.S. Mortgages and Investment Grade Credit Funds attributable to Class A and Institutional Class shares.
For the six months ended April 30, 2007, GSAM and the distributor have voluntarily agreed to waive certain fees and reimburse other expenses. In addition, the Funds have entered into certain offset arrangements with the custodian and transfer
76
GOLDMAN SACHS SINGLE/MULTI-SECTOR TAXABLE FIXED INCOME FUNDS
| 3. AGREEMENTS (continued) |
agent resulting in a reduction of the Funds’ expenses. For the six months ended April 30, 2007, expense reductions were as follows (in thousands):
| | | | | | | | | | | | | | | | | | | | | | | | | |
| | | Fee Waivers | | | | Fee Credits | | |
| | | | | Other | | | | Total |
| | | Management | | Transfer | | Expense | | Custody | | Transfer | | Expense |
| Fund | | Fees | | Agent Fees | | Reimbursement | | Fee | | Agent Fee | | Reductions |
| |
| Government Income | | $ | — | | | $ | — | | | $ | 250 | | | $ | 14 | | | $ | 10 | | | $ | 274 | |
| |
| U.S. Mortgages | | | 151 | | | | 43 | | | | 175 | | | | 15 | | | | — | | | | 384 | |
| |
| Core Fixed Income | | | — | | | | — | | | | — | | | | 39 | | | | 17 | | | | 56 | |
| |
| Investment Grade Credit | | | 77 | | | | 22 | | | | 106 | | | | 2 | | | | — | | | | 207 | |
| |
| Core Plus Fixed Income | | | — | | | | — | | | | 224 | | | | — | | | | — | | | | 224 | |
| |
At April 30, 2007, the amounts owed to affiliates of the Trust were as follows (in thousands):
| | | | | | | | | | | | | | | | | |
| | | Management | | Distribution and | | Transfer | | |
| Fund | | Fees | | Service Fees | | Agent Fees | | Total |
| |
| Government Income | | $ | 262 | | | $ | 89 | | | $ | 54 | | | $ | 405 | |
| |
| U.S. Mortgages | | | 105 | | | | 1 | | | | 7 | | | | 113 | |
| |
| Core Fixed Income | | | 702 | | | | 188 | | | | 151 | | | | 1,041 | |
| |
| Investment Grade Credit | | | 61 | | | | 1 | | | | 5 | | | | 67 | |
| |
| Core Plus Fixed Income | | | 28 | | | | 3 | | | | 3 | | | | 34 | |
| |
| 4. PORTFOLIO SECURITIES TRANSACTIONS |
The cost of purchases and proceeds from sales and maturities of long-term securities for the six months ended April 30, 2007, were as follows:
| | | | | | | | | | | | | | | | | |
| | | | | | | Sales and | | Sales and Maturities |
| | | Purchases of | | Purchases | | Maturities of | | (Excluding |
| | | U.S. Government | | (Excluding | | U.S. Government | | U.S. Government |
| | | and Agency | | U.S. Government and | | and Agency | | and Agency |
| Fund | | Obligations | | Agency Obligations | | Obligations) | | Obligations) |
| |
| Government Income | | $ | 473,267,918 | | | $ | 29,926,629 | | | $ | 396,872,792 | | | $ | 16,652,393 | |
| |
| U.S. Mortgages | | | 988,185,828 | | | | 16,037,044 | | | | 1,040,336,210 | | | | 46,013,603 | |
| |
| Core Fixed Income | | | 1,236,617,323 | | | | 211,349,685 | | | | 583,491,819 | | | | 605,695,602 | |
| |
| Investment Grade Credit | | | 25,680,166 | | | | 93,605,565 | | | | 35,224,090 | | | | 55,873,534 | |
| |
| Core Plus Fixed Income | | | 92,574,251 | | | | 20,892,108 | | | | 55,335,720 | | | | 947,456 | |
| |
77
GOLDMAN SACHS SINGLE/MULTI-SECTOR TAXABLE FIXED INCOME FUNDS
Notes to Financial Statements (continued)
April 30, 2007 (Unaudited)
| 4. PORTFOLIO SECURITIES TRANSACTIONS (continued) |
For the year ended April 30, 2007, Government Income, U.S. Mortgages, Core Fixed Income, Investment Grade Credit and Core Plus Fixed Income paid commissions of approximately $57,600, $12,500, $170,100, $7,600 and $7,200, respectively, in connection with futures contracts entered into with Goldman Sachs.
| 5. LINE OF CREDIT FACILITY |
The Funds participate in a $400,000,000 committed, unsecured revolving line of credit facility together with other registered investment companies having management or investment advisory agreements with GSAM or affiliates. Such amount was increased to $450,000,000 effective May 23, 2007.
Under the most restrictive arrangement, the Funds must own securities having a market value in excess of 300% of each Fund’s total bank borrowings. This facility is to be used solely for temporary or emergency purposes. The interest rate on borrowings is based on the federal funds rate. The committed facility also requires a fee to be paid by the Funds based on the amount of the commitment that has not been utilized. For the six months ended April 30, 2007, the Funds did not have any borrowings under this facility.
As of the most recent fiscal year ended October 31, 2006, the Funds’ capital loss carryforwards and certain timing differences on a tax basis were as follows.
| | | | | | | | | | | | | | | | | | |
| | | Government | | | | Core Fixed | | Investment Grade |
| | | Income | | U.S. Mortgages | | Income | | Credit |
| |
Capital loss carryforward:1 | | | | | | | | | | | | | | | | |
| | Expiring 2013 | | $ | — | | | $ | (936,118 | ) | | $ | — | | | $ | (419,693 | ) |
| | Expiring 2014 | | | (11,925,097 | ) | | | (978,868 | ) | | | (22,304,650 | ) | | | (3,690,267 | ) |
| |
| Total capital loss carryforward | | $ | (11,925,097 | ) | | $ | (1,914,986 | ) | | $ | (22,304,650 | ) | | $ | (4,109,960 | ) |
| |
| Timing differences (income distribution payables, straddles and swap receivables) | | | (326,685 | ) | | | (311,786 | ) | | | (2,837,105 | ) | | | (251,423 | ) |
| |
| |
| 1 | Expiration occurs on October 31 of the year indicated. |
As of April 30, 2007, the Funds’ aggregate security unrealized gains and losses based on cost for U.S. federal income tax purposes was as follows:
| | | | | | | | | | | | | | | | | | | | | |
| | | Government | | | | Core Fixed | | Investment | | Core Plus Fixed |
| | | Income | | U.S. Mortgages | | Income | | Grade Credit | | Income |
| |
| Tax Cost | | $ | 614,363,347 | | | $ | 388,381,615 | | | $ | 2,258,753,361 | | | $ | 229,133,525 | | | $ | 73,748,838 | |
| |
| Gross unrealized gain | | | 3,224,509 | | | | 1,519,517 | | | | 13,107,446 | | | | 2,188,975 | | | | 169,976 | |
| Gross unrealized loss | | | (4,226,682 | ) | | | (3,215,712 | ) | | | (27,259,784 | ) | | | (2,265,953 | ) | | | (836,933 | ) |
| |
| Net unrealized security loss | | $ | (1,002,173 | ) | | $ | (1,696,195 | ) | | $ | (14,152,338 | ) | | $ | (76,978 | ) | | $ | (666,957 | ) |
| |
78
GOLDMAN SACHS SINGLE/MULTI-SECTOR TAXABLE FIXED INCOME FUNDS
| 6. TAX INFORMATION (continued) |
The difference between book-basis and tax-basis unrealized gains (losses) is attributable to wash sales, differences related to the tax treatment of non-periodic swap payments, amortization of swaps, market discount accretion and premium amortization and mark-to-market gain (losses) on 1256 futures contracts.
As of April 30, 2007, Goldman Sachs Group, Inc. (“GSG”) was the beneficial owner of approximately 68% of the outstanding Institutional Shares of the Core Plus Fixed Income Fund.
Mergers and Reorganizations — At a meeting held on December 14, 2005, the Board of Trustees of the Trust approved an Agreement and Plan of Reorganization (“the First Funds Agreement”) providing for the tax-free acquisition of the First Funds Intermediate Bond Portfolio by the Core Fixed Income Fund. On April 7, 2006, the Board of Trustees approved certain amendments to the First Funds Agreement. The acquisition was completed on June 5, 2006, as of the close of business June 2, 2006.
Pursuant to the First Funds Agreement, the assets and liabilities of the First Funds Intermediate Bond Portfolio (“Acquired Fund”) Institutional Class, Class A, Class B and Class C were transferred into the Core Fixed Income (“Survivor Fund”) Institutional Class and Class A, Class B and Class C, respectively, in a tax free exchange as follows:
| | | | | | | | | | | | | |
| | | | | | | Acquired Fund’s Shares |
| | | Exchanged Shares of | | Value of Exchanged | | Outstanding as of |
| Survivor Share Class/Acquired Fund Share Class | | Survivor Issued | | Shares | | June 2, 2006 |
| |
| Core Fixed Income Institutional Class/First Funds Intermediate Bond Portfolio Institutional Class | | | 23,256,054 | | | $ | 225,816,117 | | | | 22,869,788 | |
| |
| Core Fixed Income Class A/First Fund Intermediate Bond Portfolio Class A | | | 249,590 | | | | 2,413,528 | | | | 244,781 | |
| |
| Core Fixed Income Class A/First Funds Intermediate Bond Portfolio Class B | | | 32,136 | | | | 310,758 | | | | 31,472 | |
| |
| Core Fixed Income Class A/First Funds Intermediate Bond Portfolio Class C | | | 179,544 | | | | 1,736,185 | | | | 175,687 | |
| |
The following chart shows the Survivor Fund’s and Acquired Fund’s aggregate net assets (immediately before and after the completion of the acquisition) and the Acquired Fund’s unrealized depreciation.
| | | | | | | | | | | | | | | | | |
| | | | | | | Survivor Fund’s | | |
| | | Survivor Fund’s | | Acquired Fund’s | | Aggregate Net | | |
| | | Aggregate Net | | Aggregate Net | | Assets | | Acquired Fund’s |
| | | Assets Before | | Assets Before | | Immediately | | Unrealized |
| Survivor/Acquired Fund | | Acquisition | | Acquisition | | After Acquisition | | (Depreciation) |
| |
| Core Fixed Income/First Funds Intermediate Bond Portfolio | | $ | 2,168,716,107 | | | $ | 230,276,588 | | | $ | 2,398,992,695 | | | $ | (5,005,096 | ) |
| |
79
GOLDMAN SACHS SINGLE/MULTI-SECTOR TAXABLE FIXED INCOME FUNDS
Notes to Financial Statements (continued)
April 30, 2007 (Unaudited)
| 7. OTHER MATTERS (continued) |
At a meeting held on December 14, 2006, the Board of Trustees of the Trust approved an Agreement and Plan of Reorganization (“the Agreement”) providing for the tax-free acquisition of the Signal Income Fund into the Goldman Sachs Core Fixed Income Fund. The acquisition was completed on April 30, 2007, as of the close of business on April 27, 2007.
Pursuant to the Agreement, the assets and liabilities of the Signal Income Fund (“Acquired Fund”) Class A and Institutional Class were transferred into the Goldman Sachs Core Fixed Income Fund (“Survivor Fund”) Class A and Institutional Class, respectively, in a tax-free exchange as follows:
| | | | | | | | | | | | | |
| | | Exchanged Shares | | | | Acquired Fund’s |
| | | of Survivor | | Value of | | Shares Outstanding |
| Survivor/Acquired Fund | | Issued | | Exchanged Shares | | as of April 27, 2007 |
| |
| Core Fixed Income Class A/Signal Income Class A | | | 23,514 | | | $ | 230,909 | | | | 23,842 | |
| |
| Core Fixed Income Institutional Class/Signal Income Institutional Class | | | 9,461,521 | | | | 93,196,770 | | | | 9,622,019 | |
| |
The following chart shows the Survivor Fund’s and Acquired Fund’s aggregate net assets (immediately before and after the completion of the acquisition) and the Acquired Fund’s unrealized appreciation and capital loss carryforwards. Utilization of the Acquired Fund’s capital loss carryforward may be limited under the Internal Revenue Code.
| | | | | | | | | | | | | | | | | | | | | |
| | | | | | | Survivor Fund’s | | | | |
| | | Survivor Fund’s | | Acquired Fund’s | | Aggregate | | | | |
| | | Aggregate | | Aggregate | | Net Assets | | Acquired | | Acquired |
| | | Net Assets | | Net Assets | | immediately | | Fund’s | | Fund’s |
| | | before | | before | | after | | Unrealized | | Capital Loss |
| Survivor/Acquired Fund | | acquisition | | acquisition | | acquisition | | Appreciation | | Carryforward |
| |
| Core Fixed Income/Signal Income | | $ | 2,284,620,154 | | | $ | 93,427,679 | | | $ | 2,378,047,833 | | | $ | (847,168 | ) | | $ | (531,026 | ) |
| |
New Accounting Pronouncements — On July 13, 2006, the Financial Accounting Standards Board (“FASB”) released FASB Interpretation No. 48 “Accounting for Uncertainty in Income Taxes” (“FIN 48”). FIN 48 provides guidance for how uncertain tax positions should be recognized, measured, presented and disclosed in the financial statements. FIN 48 requires the evaluation of tax positions taken or expected to be taken in the course of preparing the Fund’s tax returns to determine whether the tax positions are “more-likely-than-not” of being sustained by the applicable tax authority. Tax positions not deemed to meet the more-likely-than-not threshold would be recorded as a tax benefit or expense in the current year. Adoption of FIN 48 is required for fiscal years beginning after December 15, 2006 and is to be applied to all open tax years as of the effective date. Recent SEC guidance allows implementing FIN 48 in Fund net asset value calculations as late as the Fund’s last net asset value calculation in the first required financial statement reporting period. As a result, the Funds will incorporate FIN 48 in their April 30, 2008 semiannual reports. At this time, the advisor is evaluating the implications of FIN 48 and its impact in the financial statements has not yet been determined.
On September 15, 2006, the FASB released Statement Financial Accounting Standard No. 157 “Fair Value Measurement” (“FAS 157”) which provides enhanced guidance for using fair value to measure assets and liabilities. The standard requires companies to provide expanded information about the assets and liabilities measured at fair value and the potential effect of these fair valuations on an entity’s financial performance. The standard does not expand the use of fair value in any new circumstances, but provides clarification on acceptable fair valuation methods and applications. FAS 157 is effective for financial statements issued for fiscal years beginning after November 15, 2007. The investment adviser does not believe the adoption of FAS 157 will impact the amounts reported in the financial statements, however, additional disclosures will be required.
80
GOLDMAN SACHS SINGLE/MULTI-SECTOR TAXABLE FIXED INCOME FUNDS
| 8. CHANGE IN INDEPENDENT REGISTERED PUBLIC ACCOUNTING FIRM |
On December 14, 2006, the Board of Trustees of the Trust, upon the recommendation of the Board’s audit committee, determined not to retain Ernst & Young LLP and approved a change of the Portfolio’s independent registered public accounting firm to PricewaterhouseCoopers LLP. For the years ended October 31, 2006 and October 31, 2005, Ernst & Young LLP’s audit reports contained no adverse opinion or disclaimer of opinion; nor were their reports qualified or modified as to uncertainty, audit scope, or accounting principles. Further, there were no disagreements between the Portfolios and Ernst & Young LLP on accounting principles or practices, financial statement disclosure or audit scope or procedures, which if not resolved to the satisfaction of Ernst & Young LLP would have caused them to make reference to the disagreement in their reports.
At a meeting held on November 8, 2006, the Board of Trustees of the Trust approved an Agreement and Plan of Reorganization (the “Agreement”) providing for the tax-free acquisition of the AXA Enterprise Government Securities Fund and AXA Enterprise Multi-Manager Core Bond Fund by the Government Income and Core Plus Fixed Income Funds, respectively. Government Income acquired all of the net assets of approximately $191.6 million of the AXA Enterprise Government Securities Fund and Core Plus Fixed Income acquired all of the net assets of approximately $108.0 million of the AXA Enterprise Multi-Manager Core Bond Fund. The acquisition was completed on June 25, 2007, as of the close of business June 22, 2007.
81
GOLDMAN SACHS SINGLE/MULTI-SECTOR TAXABLE FIXED INCOME FUNDS
Notes to Financial Statements (continued)
April 30, 2007 (Unaudited)
| 9. SUMMARY OF SHARE TRANSACTIONS |
Share activity is as follows:
| | | | | | | | | | | | | | | | | |
| | | Government Income Fund |
| | | |
| | | For the Six Months Ended | | |
| | | April 30, 2007 | | For the Year Ended |
| | | (Unaudited) | | October 31, 2006 |
| | | |
| | | Shares | | | Dollars | | | Shares | | | Dollars | |
| | | |
Class A Shares | | | | | | | | | | | | | | | | |
| Shares sold | | | 4,971,067 | | | $ | 72,903,733 | | | | 19,006,196 | | | $ | 276,486,239 | |
Shares converted from Class B(a) | | | 34,585 | | | | 507,786 | | | | 71,331 | | | | 1,040,729 | |
| Shares issued in connection with merger | | | — | | | | — | | | | — | | | | — | |
| Reinvestment of dividends and distributions | | | 442,264 | | | | 6,487,090 | | | | 1,574,240 | | | | 22,857,034 | |
| Shares repurchased | | | (13,399,120 | ) | | | (195,842,916 | ) | | | (41,202,955 | ) | | | (593,696,503 | ) |
| | | |
| | | | (7,951,204 | ) | | | (115,944,307 | ) | | | (20,551,188 | ) | | | (293,312,501 | ) |
| |
Class B Shares | | | | | | | | | | | | | | | | |
| Shares sold | | | 74,468 | | | | 1,095,427 | | | | 131,172 | | | | 1,901,404 | |
| Reinvestment of dividends and distributions | | | 14,741 | | | | 216,218 | | | | 33,925 | | | | 492,693 | |
Shares converted to Class A(a) | | | (34,585 | ) | | | (507,786 | ) | | | (71,326 | ) | | | (1,040,729 | ) |
| Shares repurchased | | | (190,481 | ) | | | (2,794,174 | ) | | | (523,718 | ) | | | (7,594,308 | ) |
| | | |
| | | | (135,857 | ) | | | (1,990,315 | ) | | | (429,947 | ) | | | (6,240,940 | ) |
| |
Class C Shares | | | | | | | | | | | | | | | | |
| Shares sold | | | 234,829 | | | | 3,444,588 | | | | 273,958 | | | | 3,976,041 | |
| Reinvestment of dividends and distributions | | | 13,082 | | | | 191,737 | | | | 28,527 | | | | 414,100 | |
| Shares repurchased | | | (568,039 | ) | | | (8,324,195 | ) | | | (429,252 | ) | | | (6,230,332 | ) |
| | | |
| | | | (320,128 | ) | | | (4,687,870 | ) | | | (126,767 | ) | | | (1,840,191 | ) |
| |
Institutional Shares | | | | | | | | | | | | | | | | |
| Shares sold | | | 10,580,771 | | | | 154,807,144 | | | | 13,235,776 | | | | 192,106,435 | |
| Shares issued in connection with merger | | | — | | | | — | | | | — | | | | — | |
| Reinvestment of dividends and distributions | | | 220,585 | | | | 3,231,454 | | | | 285,861 | | | | 4,144,669 | |
| Shares repurchased | | | (6,768,057 | ) | | | (99,227,446 | ) | | | (7,659,473 | ) | | | (111,004,132 | ) |
| | | |
| | | | 4,033,299 | | | | 58,811,152 | | | | 5,862,164 | | | | 85,246,972 | |
| |
Service Shares | | | | | | | | | | | | | | | | |
| Shares sold | | | 1,162,896 | | | | 17,015,627 | | | | 1,077,215 | | | | 15,615,921 | |
| Reinvestment of dividends and distributions | | | 17,304 | | | | 253,198 | | | | 19,752 | | | | 286,389 | |
| Shares repurchased | | | (618,048 | ) | | | (9,047,319 | ) | | | (605,504 | ) | | | (8,787,657 | ) |
| | | |
| | | | 562,152 | | | | 8,221,506 | | | | 491,463 | | | | 7,114,653 | |
| |
Separate Account Institutional Shares | | | | | | | | | | | | | | | | |
| Shares sold | | | — | | | | — | | | | — | | | | — | |
| Reinvestment of dividends and distributions | | | — | | | | — | | | | — | | | | — | |
| Shares repurchased | | | — | | | | — | | | | — | | | | — | |
| | | |
| | | | — | | | | — | | | | — | | | | — | |
| |
NET INCREASE (DECREASE) | | | (3,811,738 | ) | | $ | (55,589,834 | ) | | | (14,754,275 | ) | | $ | (209,032,007 | ) |
| |
| |
| (a) | Commenced operations on November 30, 2006. |
82
GOLDMAN SACHS SINGLE/MULTI-SECTOR TAXABLE FIXED INCOME FUNDS
| 9. SUMMARY OF SHARE TRANSACTIONS (continued) |
| | | | | | | | | | | | | | | | | | | | | | | | | | | | | | | | | |
| | | U.S. Mortgages Fund | | Core Fixed Income Fund |
| |
| | | For the Six Months Ended | | | | For the Six Months Ended | | For the Year Ended |
| | | April 30, 2007 | | For the Year Ended | | April 30, 2007 | | October 31, 2006 |
| | | (Unaudited) | | October 31, 2006 | | (Unaudited) | | Shares |
| |
| | | Shares | | | Dollars | | | Shares | | | Dollars | | | Shares | | | Dollars | | | Shares | | | Dollars | |
| |
| |
| | | | 46,964 | | | $ | 465,076 | | | | 74,629 | | | $ | 736,840 | | | | 13,961,899 | | | $ | 137,327,976 | | | | 33,915,411 | | | $ | 330,454,717 | |
| | | | — | | | | — | | | | — | | | | — | | | | 88,899 | | | | 876,542 | | | | 94,032 | | | | 918,118 | |
| | | | — | | | | — | | | | — | | | | — | | | | 23,514 | | | | 230,909 | | | | 461,270 | | | | 4,460,471 | |
| | | | 14,453 | | | | 143,142 | | | | 32,146 | | | | 315,209 | | | | 1,258,458 | | | | 12,387,032 | | | | 2,859,107 | | | | 27,907,378 | |
| | | | (90,242 | ) | | | (896,955 | ) | | | (208,971 | ) | | | (2,050,018 | ) | | | (12,585,271 | ) | | | (123,729,006 | ) | | | (31,237,706 | ) | | | (304,040,411 | ) |
| |
| | | | (28,825 | ) | | | (288,737 | ) | | | (102,196 | ) | | | (997,969 | ) | | | 2,747,499 | | | | 27,093,453 | | | | 6,092,114 | | | | 59,700,273 | |
| |
| |
| | | | — | | | | — | | | | — | | | | — | | | | 214,376 | | | | 2,118,227 | | | | 413,768 | | | | 4,040,182 | |
| | | | — | | | | — | | | | — | | | | — | | | | 29,491 | | | | 291,521 | | | | 80,189 | | | | 786,518 | |
| | | | — | | | | — | | | | — | | | | — | | | | (88,540 | ) | | | (876,542 | ) | | | (93,649 | ) | | | (918,118 | ) |
| | | | — | | | | — | | | | — | | | | — | | | | (321,498 | ) | | | (3,174,991 | ) | | | (1,008,157 | ) | | | (9,859,452 | ) |
| |
| | | | — | | | | — | | | | — | | | | — | | | | (166,171 | ) | | | (1,641,785 | ) | | | (607,849 | ) | | | (5,950,870 | ) |
| |
| |
| | | | — | | | | — | | | | — | | | | — | | | | 900,432 | | | | 8,899,029 | | | | 861,312 | | | | 8,439,976 | |
| | | | — | | | | — | | | | — | | | | — | | | | 29,338 | | | | 290,168 | | | | 75,872 | | | | 744,534 | |
| | | | — | | | | — | | | | — | | | | — | | | | (576,946 | ) | | | (5,703,010 | ) | | | (1,179,491 | ) | | | (11,563,276 | ) |
| |
| | | | — | | | | — | | | | — | | | | — | | | | 352,824 | | | | 3,486,187 | | | | (242,307 | ) | | | (2,378,766 | ) |
| |
| |
| | | | 1,854,208 | | | | 18,355,727 | | | | 4,996,084 | | | | 49,157,500 | | | | 27,971,768 | | | | 276,166,512 | | | | 70,215,331 | | | | 684,433,513 | |
| | | | — | | | | — | | | | — | | | | — | | | | 9,461,521 | | | | 93,196,770 | | | | 23,256,054 | | | | 225,816,117 | |
| | | | 275,365 | | | | 2,731,573 | | | | 365,157 | | | | 3,584,728 | | | | 1,880,985 | | | | 18,585,320 | | | | 4,149,150 | | | | 40,632,934 | |
| | | | (18,627 | ) | | | (184,786 | ) | | | (1,103,686 | ) | | | (10,910,941 | ) | | | (39,904,337 | ) | | | (394,051,210 | ) | | | (50,393,455 | ) | | | (494,390,692 | ) |
| |
| | | | 2,110,946 | | | | 20,902,514 | | | | 4,257,555 | | | | 41,831,287 | | | | (590,063 | ) | | | (6,102,608 | ) | | | 47,227,080 | | | | 456,491,872 | |
| |
| |
| | | | — | | | | — | | | | — | | | | — | | | | 569,870 | | | | 5,633,238 | | | | 2,448,389 | | | | 24,070,282 | |
| | | | — | | | | — | | | | — | | | | — | | | | 37,389 | | | | 369,571 | | | | 88,895 | | | | 871,691 | |
| | | | — | | | | — | | | | — | | | | — | | | | (730,438 | ) | | | (7,207,935 | ) | | | (1,010,620 | ) | | | (9,873,930 | ) |
| |
| | | | — | | | | — | | | | — | | | | — | | | | (123,179 | ) | | | (1,205,126 | ) | | | 1,526,664 | | | | 15,068,043 | |
| |
| |
| | | | 2,823,921 | | | | 27,997,334 | | | | 24,833,736 | | | | 243,126,871 | | | | — | | | | — | | | | — | | | | — | |
| | | | 613,770 | | | | 6,081,839 | | | | 1,443,931 | | | | 14,163,428 | | | | — | | | | — | | | | — | | | | — | |
| | | | (10,556,030 | ) | | | (104,625,570 | ) | | | (34,651,048 | ) | | | (340,806,447 | ) | | | — | | | | — | | | | — | | | | — | |
| |
| | | | (7,118,339 | ) | | | (70,546,397 | ) | | | (8,373,381 | ) | | | (83,516,148 | ) | | | — | | | | — | | | | — | | | | — | |
| |
| | | | (5,036,218 | ) | | $ | (49,932,620 | ) | | | (4,218,022 | ) | | $ | (42,682,830 | ) | | | 2,220,910 | | | $ | 21,630,121 | | | | 53,995,702 | | | $ | 522,930,552 | |
| |
83
GOLDMAN SACHS SINGLE/MULTI-SECTOR TAXABLE FIXED INCOME FUNDS
Notes to Financial Statements (continued)
April 30, 2007 (Unaudited)
| 9. SUMMARY OF SHARE TRANSACTIONS (continued) |
| | | | | | | | | | | | | | | | | |
| | | Investment Grade Credit Fund |
| | | |
| | | For the Six Months Ended | | |
| | | April 30, 2007 | | For the Year Ended |
| | | (Unaudited) | | October 31, 2006 |
| | | |
| | | Shares | | | Dollars | | | Shares | | | Dollars | |
| | | |
Class A Shares | | | | | | | | | | | | | | | | |
| |
| Shares sold | | | 383,110 | | | $ | 3,821,555 | | | | 122,758 | | | $ | 1,221,812 | |
| Reinvestment of dividends and distributions | | | 12,781 | | | | 127,654 | | | | 13,743 | | | | 135,325 | |
| Shares repurchased | | | (47,300 | ) | | | (470,821 | ) | | | (157,724 | ) | | | (1,542,363 | ) |
| | | |
| | | | 348,591 | | | | 3,478,388 | | | | (21,223 | ) | | | (185,226 | ) |
| |
Class C Shares | | | | | | | | | | | | | | | | |
| |
| Shares sold | | | — | | | | — | | | | — | | | | — | |
| Reinvestment of dividends and distributions | | | — | | | | — | | | | — | | | | — | |
| Shares repurchased | | | — | | | | — | | | | — | | | | — | |
| | | |
| | | | — | | | | — | | | | — | | | | — | |
| |
Institutional Shares | | | | | | | | | | | | | | | | |
| |
| Shares sold | | | 55,735 | | | | 557,154 | | | | 22,238 | | | | 219,000 | |
| Reinvestment of dividends and distributions | | | 8,210 | | | | 82,178 | | | | 16,932 | | | | 166,973 | |
| Shares repurchased | | | (40,409 | ) | | | (403,402 | ) | | | (72,211 | ) | | | (705,458 | ) |
| | | |
| | | | 23,536 | | | | 235,930 | | | | (33,041 | ) | | | (319,485 | ) |
| |
Separate Account Institutional Shares | | | | | | | | | | | | | | | | |
| |
| Shares sold | | | 2,611,504 | | | | 26,094,972 | | | | 6,781,618 | | | | 67,075,585 | |
| Reinvestment of dividends and distributions | | | 431,524 | | | | 4,315,845 | | | | 803,525 | | | | 7,916,831 | |
| Shares repurchased | | | (2,292,108 | ) | | | (22,924,623 | ) | | | (6,233,643 | ) | | | (61,175,704 | ) |
| | | |
| | | | 750,920 | | | | 7,486,194 | | | | 1,351,500 | | | | 13,816,712 | |
| |
NET INCREASE | | | 1,123,047 | | | $ | 11,200,512 | | | | 1,297,236 | | | $ | 13,312,001 | |
| |
| |
| (a) | Commenced operations on November 30, 2006. |
84
GOLDMAN SACHS SINGLE/MULTI-SECTOR TAXABLE FIXED INCOME FUNDS
| 9. SUMMARY OF SHARE TRANSACTIONS (continued) |
| | | | | | | | | |
| | | Core Plus Fixed Income(a) |
| |
| | | For the Period |
| | | Ended |
| | | April 30, 2007 |
| |
| (Unaudited) |
| | | Shares | | | Dollars | |
| |
| |
| | | | 1,456,406 | | | $ | 14,499,601 | |
| | | | 6,601 | | | | 65,643 | |
| | | | (201,796 | ) | | | (2,007,861 | ) |
| |
| | | | 1,261,211 | | | | 12,557,383 | |
| |
| |
| | | | 36,870 | | | | 366,316 | |
| | | | 326 | | | | 3,237 | |
| | | | (1,023 | ) | | | (10,154 | ) |
| |
| | | | 36,173 | | | | 359,399 | |
| |
| |
| | | | 6,019,078 | | | | 60,162,910 | |
| | | | 95,036 | | | | 943,368 | |
| | | | (620 | ) | | | (6,160 | ) |
| |
| | | | 6,113,494 | | | | 61,100,118 | |
| |
| |
| | | | — | | | | — | |
| | | | — | | | | — | |
| | | | — | | | | — | |
| |
| | | | — | | | | — | |
| |
| | | | 7,410,878 | | | $ | 74,016,900 | |
| |
85
GOLDMAN SACHS GOVERNMENT INCOME FUND
Financial Highlights
Selected Data for a Share Outstanding Throughout Each Period
| | | | | | | | | | | | | | | | | | | | | | | | | | | | | | | | | |
| | | | | | | Income (loss) from | | | | |
| | | | | | | investment operations | | Distributions to shareholders | | |
| | | | | | | | | | | |
| | | | | Net asset | | | | | | |
| | | | | value, | | Net | | Net realized | | Total from | | From net | | From net | | | | |
| | | | | beginning | | investment | | and unrealized | | investment | | investment | | realized | | Total | | |
| | | Year - Share Class | | of period | | income(a) | | gain (loss) | | operations | | income | | gains | | distributions | | |
| |
| | | FOR THE SIX MONTHS ENDED APRIL 30, (UNAUDITED) |
| |
| | | 2007 - A | | $ | 14.64 | | | $ | 0.30 | | | $ | 0.03 | | | $ | 0.33 | | | $ | (0.29 | ) | | $ | — | | | $ | (0.29 | ) | | |
| | | 2007 - B | | | 14.64 | | | | 0.24 | | | | 0.05 | | | | 0.29 | | | | (0.24 | ) | | | — | | | | (0.24 | ) | | |
| | | 2007 - C | | | 14.63 | | | | 0.24 | | | | 0.05 | | | | 0.29 | | | | (0.24 | ) | | | — | | | | (0.24 | ) | | |
| | | 2007 - Institutional | | | 14.63 | | | | 0.32 | | | | 0.04 | | | | 0.36 | | | | (0.32 | ) | | | — | | | | (0.32 | ) | | |
| | | 2007 - Service | | | 14.61 | | | | 0.28 | | | | 0.05 | | | | 0.33 | | | | (0.28 | ) | | | — | | | | (0.28 | ) | | |
| | | FOR THE YEARS ENDED OCTOBER 31, |
| |
| | | 2006 - A | | | 14.57 | | | | 0.55 | | | | 0.08 | | | | 0.63 | | | | (0.56 | ) | | | — | (e) | | | (0.56 | ) | | |
| | | 2006 - B | | | 14.57 | | | | 0.44 | | | | 0.08 | | | | 0.52 | | | | (0.45 | ) | | | — | (e) | | | (0.45 | ) | | |
| | | 2006 - C | | | 14.56 | | | | 0.44 | | | | 0.08 | | | | 0.52 | | | | (0.45 | ) | | | — | (e) | | | (0.45 | ) | | |
| | | 2006 - Institutional | | | 14.55 | | | | 0.60 | | | | 0.09 | | | | 0.69 | | | | (0.61 | ) | | | — | (e) | | | (0.61 | ) | | |
| | | 2006 - Service | | | 14.54 | | | | 0.53 | | | | 0.08 | | | | 0.61 | | | | (0.54 | ) | | | — | (e) | | | (0.54 | ) | | |
| | | |
| | | 2005 - A | | | 15.00 | | | | 0.43 | | | | (0.30 | ) | | | 0.13 | | | | (0.39 | ) | | | (0.17 | ) | | | (0.56 | ) | | |
| | | 2005 - B | | | 15.00 | | | | 0.30 | | | | (0.28 | ) | | | 0.02 | | | | (0.28 | ) | | | (0.17 | ) | | | (0.45 | ) | | |
| | | 2005 - C | | | 14.99 | | | | 0.31 | | | | (0.29 | ) | | | 0.02 | | | | (0.28 | ) | | | (0.17 | ) | | | (0.45 | ) | | |
| | | 2005 - Institutional | | | 14.98 | | | | 0.46 | | | | (0.27 | ) | | | 0.19 | | | | (0.45 | ) | | | (0.17 | ) | | | (0.62 | ) | | |
| | | 2005 - Service | | | 14.98 | | | | 0.41 | | | | (0.31 | ) | | | 0.10 | | | | (0.37 | ) | | | (0.17 | ) | | | (0.54 | ) | | |
| | | |
| | | 2004 - A | | | 14.88 | | | | 0.39 | | | | 0.33 | | | | 0.72 | | | | (0.47 | ) | | | (0.13 | ) | | | (0.60 | ) | | |
| | | 2004 - B | | | 14.88 | | | | 0.28 | | | | 0.32 | | | | 0.60 | | | | (0.35 | ) | | | (0.13 | ) | | | (0.48 | ) | | |
| | | 2004 - C | | | 14.87 | | | | 0.28 | | | | 0.32 | | | | 0.60 | | | | (0.35 | ) | | | (0.13 | ) | | | (0.48 | ) | | |
| | | 2004 - Institutional | | | 14.85 | | | | 0.46 | | | | 0.33 | | | | 0.79 | | | | (0.53 | ) | | | (0.13 | ) | | | (0.66 | ) | | |
| | | 2004 - Service | | | 14.85 | | | | 0.37 | | | | 0.34 | | | | 0.71 | | | | (0.45 | ) | | | (0.13 | ) | | | (0.58 | ) | | |
| | | |
| | | 2003 - A | | | 14.95 | | | | 0.41 | | | | 0.05 | | | | 0.46 | | | | (0.51 | ) | | | (0.02 | ) | | | (0.53 | ) | | |
| | | 2003 - B | | | 14.95 | | | | 0.31 | | | | 0.04 | | | | 0.35 | | | | (0.40 | ) | | | (0.02 | ) | | | (0.42 | ) | | |
| | | 2003 - C | | | 14.94 | | | | 0.31 | | | | 0.04 | | | | 0.35 | | | | (0.40 | ) | | | (0.02 | ) | | | (0.42 | ) | | |
| | | 2003 - Institutional | | | 14.93 | | | | 0.47 | | | | 0.04 | | | | 0.51 | | | | (0.57 | ) | | | (0.02 | ) | | | (0.59 | ) | | |
| | | 2003 - Service | | | 14.92 | | | | 0.41 | | | | 0.04 | | | | 0.45 | | | | (0.50 | ) | | | (0.02 | ) | | | (0.52 | ) | | |
| | | |
| | | 2002 - A | | | 14.96 | | | | 0.63 | | | | 0.19 | | | | 0.82 | | | | (0.67 | ) | | | (0.16 | ) | | | (0.83 | ) | | |
| | | 2002 - B | | | 14.96 | | | | 0.52 | | | | 0.19 | | | | 0.71 | | | | (0.56 | ) | | | (0.16 | ) | | | (0.72 | ) | | |
| | | 2002 - C | | | 14.95 | | | | 0.51 | | | | 0.20 | | | | 0.71 | | | | (0.56 | ) | | | (0.16 | ) | | | (0.72 | ) | | |
| | | 2002 - Institutional | | | 14.94 | | | | 0.69 | | | | 0.19 | | | | 0.88 | | | | (0.73 | ) | | | (0.16 | ) | | | (0.89 | ) | | |
| | | 2002 - Service | | | 14.93 | | | | 0.62 | | | | 0.19 | | | | 0.81 | | | | (0.66 | ) | | | (0.16 | ) | | | (0.82 | ) | | |
| | | |
| |
| (a) | Calculated based on the average shares outstanding methodology. |
| (b) | Assumes investment at the net asset value at the beginning of the period, reinvestment of all dividends and distributions, a complete redemption of the investment at the net asset value at the end of the period and no sales or redemption charges. Total return would be reduced if a sales or redemption charge were taken into account. Total returns are not annualized for periods less than one full year. Returns do not reflect the deduction of taxes that a shareholder would pay on Fund distributions or the redemption of Fund shares. |
| (c) | The portfolio turnover rate excluding the effect of mortgage dollar rolls is 73% for the six months ended April 30, 2007 and 690% for the year ended October 31, 2006. Prior years include the effect of mortgage dollar roll transactions. |
| (d) | Annualized. |
| (e) | Amount is less than $0.005 per share. |
The accompanying notes are an integral part of these financial statements.
86
GOLDMAN SACHS GOVERNMENT INCOME FUND
| | | | | | | | | | | | | | | | | | | | | | | | | | | | | | | | | | | |
| | | | | | | | | | | | | Ratios assuming no | | | | |
| | | | | | | | | | | | | expense reductions | | | | |
| | | | | | | | | | | | | | | | | |
| | | | | | | | | | | Ratio of | | Ratio of | | Ratio of | | | | |
| | | | | | | Net assets | | Ratio of | | net investment | | total | | net investment | | | | |
| | | Net asset | | | | at end of | | net expenses | | income to | | expenses | | income to | | Portfolio | | |
| | | value, end | | Total | | period | | to average | | average net | | to average | | average net | | turnover | | |
| | | of period | | return(b) | | (in 000s) | | net assets | | assets | | net assets | | assets | | rate(c) | | |
| |
| | | |
| |
| | | $ | 14.68 | | | | 2.29 | % | | $ | 317,263 | | | | 0.95 | %(d) | | | 4.04 | %(d) | | | 1.03 | %(d) | | | 3.96 | %(d) | | | 75 | % | | |
| | | | 14.69 | | | | 1.98 | | | | 16,773 | | | | 1.70(d) | | | | 3.28(d) | | | | 1.78(d) | | | | 3.20(d) | | | | 75 | | | |
| | | | 14.68 | | | | 1.99 | | | | 12,284 | | | | 1.70(d) | | | | 3.27(d) | | | | 1.78(d) | | | | 3.19(d) | | | | 75 | | | |
| | | | 14.67 | | | | 2.48 | | | | 206,372 | | | | 0.58(d) | | | | 4.41(d) | | | | 0.66(d) | | | | 4.33(d) | | | | 75 | | | |
| | | | 14.66 | | | | 2.30 | | | | 31,770 | | | | 1.08(d) | | | | 3.91(d) | | | | 1.16(d) | | | | 3.83(d) | | | | 75 | | | |
| | | |
| |
| | | | 14.64 | | | | 4.40 | | | | 432,762 | | | | 0.95 | | | | 3.77 | | | | 1.04 | | | | 3.68 | | | | 766 | | | |
| | | | 14.64 | | | | 3.62 | | | | 18,713 | | | | 1.70 | | | | 3.03 | | | | 1.79 | | | | 2.94 | | | | 766 | | | |
| | | | 14.63 | | | | 3.63 | | | | 16,931 | | | | 1.70 | | | | 3.04 | | | | 1.79 | | | | 2.95 | | | | 766 | | | |
| | | | 14.63 | | | | 4.86 | | | | 146,784 | | | | 0.58 | | | | 4.18 | | | | 0.67 | | | | 4.09 | | | | 766 | | | |
| | | | 14.61 | | | | 4.27 | | | | 23,461 | | | | 1.08 | | | | 3.67 | | | | 1.17 | | | | 3.58 | | | | 766 | | | |
| |
| | | | 14.57 | | | | 0.80 | | | | 729,958 | | | | 0.97 | | | | 2.83 | | | | 1.07 | | | | 2.73 | | | | 256 | | | |
| | | | 14.57 | | | | 0.04 | | | | 24,882 | | | | 1.72 | | | | 2.08 | | | | 1.83 | | | | 1.97 | | | | 256 | | | |
| | | | 14.56 | | | | 0.11 | | | | 18,692 | | | | 1.72 | | | | 2.08 | | | | 1.83 | | | | 1.97 | | | | 256 | | | |
| | | | 14.55 | | | | 1.26 | | | | 60,747 | | | | 0.58 | | | | 3.20 | | | | 0.69 | | | | 3.08 | | | | 256 | | | |
| | | | 14.54 | | | | 0.69 | | | | 16,198 | | | | 1.08 | | | | 2.74 | | | | 1.18 | | | | 2.64 | | | | 256 | | | |
| |
| | | | 15.00 | | | | 4.99 | | | | 494,883 | | | | 0.98 | | | | 2.60 | | | | 1.17 | | | | 2.41 | | | | 609 | | | |
| | | | 15.00 | | | | 4.21 | | | | 32,782 | | | | 1.73 | | | | 1.93 | | | | 1.92 | | | | 1.74 | | | | 609 | | | |
| | | | 14.99 | | | | 4.14 | | | | 20,778 | | | | 1.73 | | | | 1.91 | | | | 1.92 | | | | 1.72 | | | | 609 | | | |
| | | | 14.98 | | | | 5.35 | | | | 69,770 | | | | 0.58 | | | | 3.12 | | | | 0.77 | | | | 2.93 | | | | 609 | | | |
| | | | 14.98 | | | | 4.90 | | | | 9,467 | | | | 1.08 | | | | 2.55 | | | | 1.27 | | | | 2.36 | | | | 609 | | | |
| |
| | | | 14.88 | | | | 3.11 | | | | 358,058 | | | | 0.99 | | | | 2.78 | | | | 1.18 | | | | 2.59 | | | | 520 | | | |
| | | | 14.88 | | | | 2.34 | | | | 44,120 | | | | 1.74 | | | | 2.06 | | | | 1.93 | | | | 1.87 | | | | 520 | | | |
| | | | 14.87 | | | | 2.34 | | | | 23,720 | | | | 1.74 | | | | 2.05 | | | | 1.93 | | | | 1.86 | | | | 520 | | | |
| | | | 14.85 | | | | 3.60 | | | | 151,111 | | | | 0.59 | | | | 3.16 | | | | 0.78 | | | | 2.97 | | | | 520 | | | |
| | | | 14.85 | | | | 3.01 | | | | 10,491 | | | | 1.09 | | | | 2.72 | | | | 1.28 | | | | 2.53 | | | | 520 | | | |
| |
| | | | 14.95 | | | | 5.77 | | | | 248,719 | | | | 0.98 | | | | 4.26 | | | | 1.24 | | | | 4.00 | | | | 226 | | | |
| | | | 14.95 | | | | 4.99 | | | | 51,124 | | | | 1.73 | | | | 3.54 | | | | 1.99 | | | | 3.28 | | | | 226 | | | |
| | | | 14.94 | | | | 4.99 | | | | 24,095 | | | | 1.73 | | | | 3.49 | | | | 1.99 | | | | 3.23 | | | | 226 | | | |
| | | | 14.93 | | | | 6.13 | | | | 82,523 | | | | 0.58 | | | | 4.74 | | | | 0.84 | | | | 4.48 | | | | 226 | | | |
| | | | 14.92 | | | | 5.68 | | | | 10,762 | | | | 1.08 | | | | 4.25 | | | | 1.34 | | | | 3.99 | | | | 226 | | | |
| |
87
GOLDMAN SACHS U.S. MORTGAGES FUND
Financial Highlights
Selected Data for a Share Outstanding Throughout Each Period
| | | | | | | | | | | | | | | | | | | | | | | | | | | | | | | | | |
| | | | | | | Income from | | Distributions | | |
| | | | | | | investment operations | | to shareholders | | |
| | | | | Net asset | | | | | | |
| | | | | value, | | Net | | Net realized | | Total from | | From net | | From net | | | | |
| | | | | beginning | | investment | | and unrealized | | investment | | investment | | realized | | Total | | |
| | | Year - Share Class | | of period | | income(a) | | gain (loss) | | operations | | income | | gains | | distributions | | |
| |
| | | FOR THE SIX MONTHS ENDED APRIL 30, (UNAUDITED) |
| |
| | | 2007 — A | | $ | 9.90 | | | $ | 0.22 | | | $ | 0.02 | | | $ | 0.24 | | | $ | (0.23 | ) | | $ | — | | | $ | (0.23 | ) | | |
| | | 2007 — Institutional | | | 9.91 | | | | 0.24 | | | | 0.03 | | | | 0.27 | | | | (0.25 | ) | | | — | | | | (0.25 | ) | | |
| | | 2007 — Separate Account Institutional | | | 9.91 | | | | 0.24 | | | | 0.02 | | | | 0.26 | | | | (0.25 | ) | | | — | | | | (0.25 | ) | | |
| | | FOR THE YEARS ENDED OCTOBER 31, |
| |
| | | 2006 — A | | | 9.82 | | | | 0.41 | | | | 0.08 | | | | 0.49 | | | | (0.41 | ) | | | — | | | | (0.41 | ) | | |
| | | 2006 — Institutional | | | 9.82 | | | | 0.45 | | | | 0.08 | | | | 0.53 | | | | (0.44 | ) | | | — | | | | (0.44 | ) | | |
| | | 2006 — Separate Account Institutional | | | 9.82 | | | | 0.45 | | | | 0.09 | | | | 0.54 | | | | (0.45 | ) | | | — | | | | (0.45 | ) | | |
| | | |
| | | 2005 — A | | | 10.22 | | | | 0.28 | | | | (0.17 | ) | | | 0.11 | | | | (0.33 | ) | | | (0.18 | ) | | | (0.51 | ) | | |
| | | 2005 — Institutional | | | 10.22 | | | | 0.33 | | | | (0.18 | ) | | | 0.15 | | | | (0.37 | ) | | | (0.18 | ) | | | (0.55 | ) | | |
| | | 2005 — Separate Account Institutional | | | 10.21 | | | | 0.36 | | | | (0.20 | ) | | | 0.16 | | | | (0.37 | ) | | | (0.18 | ) | | | (0.55 | ) | | |
| | | FOR THE PERIOD ENDED OCTOBER 31, |
| |
| | | 2004 — A (commenced November 3, 2003) | | | 10.00 | | | | 0.22 | | | | 0.33 | | | | 0.55 | | | | (0.33 | ) | | | — | | | | (0.33 | ) | | |
| | | 2004 — Institutional (commenced November 3, 2003) | | | 10.00 | | | | 0.29 | | | | 0.31 | | | | 0.60 | | | | (0.38 | ) | | | — | | | | (0.38 | ) | | |
| | | 2004 — Separate Account Institutional (commenced November 3, 2003) | | | 10.00 | | | | 0.31 | | | | 0.28 | | | | 0.59 | | | | (0.38 | ) | | | — | | | | (0.38 | ) | | |
| | | |
| |
| (a) | Calculated based on the average shares outstanding methodology. |
| (b) | Assumes investment at the net asset value at the beginning of the period, reinvestment of all dividends and distributions, a complete redemption of the investment at the net asset value at the end of the period and no sales or redemption charges. Total return would be reduced if a sales or redemption charge were taken into account. Total returns for the periods less than one full year are not annualized. Returns do not reflect the deduction of taxes that a shareholder would pay on Fund distributions or the redemption of Fund shares. |
| (c) | The portfolio turnover rate excluding the effect of mortgage dollar rolls is 57% for the period ended April 30, 2007 and 1442% for the year ended October 31, 2006. Prior years include the effect of mortgage dollar roll transactions. |
| (d) | Annualized. |
The accompanying notes are an integral part of these financial statements.
88
| | | | | | | | | | | | | | | | | | | | | | | | | | | | | | | | | | | |
| | | | | | | | | | | | | Ratios assuming no | | | | |
| | | | | | | | | | | | | expense reductions | | | | |
| | | | | | | | | | | | | | | | | |
| | | | | | | | | | | Ratio of | | Ratio of | | Ratio of | | | | |
| | | | | | | Net assets | | Ratio of | | net investment | | total | | net investment | | | | |
| | | Net asset | | | | at end of | | net expenses | | income to | | expenses | | income to | | Portfolio | | |
| | | value, end | | Total | | of period | | to average | | average net | | to average | | average net | | turnover | | |
| | | of period | | return(b) | | (in 000s) | | net assets | | assets | | net assets | | assets | | rate(c) | | |
| |
| | | |
| |
| | | $ | 9.91 | | | | 2.49 | % | | $ | 6,694 | | | | 0.79 | %(d) | | | 4.40 | %(d) | | | 0.95 | %(d) | | | 4.24 | %(d) | | | 231 | % | | |
| | | | 9.93 | | | | 2.77 | | | | 138,603 | | | | 0.40 | (d) | | | 4.80 | (d) | | | 0.58 | (d) | | | 4.62 | (d) | | | 231 | | | |
| | | | 9.92 | | | | 2.69 | | | | 237,755 | | | | 0.35 | (d) | | | 4.82 | (d) | | | 0.53 | (d) | | | 4.64 | (d) | | | 231 | | | |
| | | |
| |
| | | | 9.90 | | | | 5.21 | | | | 6,973 | | | | 0.79 | | | | 4.24 | | | | 0.98 | | | | 4.05 | | | | 1665 | | | |
| | | | 9.91 | | | | 5.56 | | | | 117,497 | | | | 0.40 | | | | 4.64 | | | | 0.61 | | | | 4.43 | | | | 1665 | | | |
| | | | 9.91 | | | | 5.73 | | | | 307,935 | | | | 0.35 | | | | 4.62 | | | | 0.56 | | | | 4.41 | | | | 1665 | | | |
| |
| | | | 9.82 | | | | 1.00 | | | | 7,916 | | | | 0.81 | | | | 2.88 | | | | 0.98 | | | | 2.71 | | | | 2006 | | | |
| | | | 9.82 | | | | 1.49 | | | | 74,616 | | | | 0.40 | | | | 3.43 | | | | 0.58 | | | | 3.24 | | | | 2006 | | | |
| | | | 9.82 | | | | 1.54 | | | | 387,306 | | | | 0.35 | | | | 3.42 | | | | 0.53 | | | | 3.24 | | | | 2006 | | | |
| | | |
| |
| | | | 10.22 | | | | 5.60 | | | | 628 | | | | 0.82 | (d) | | | 1.95 | (d) | | | 1.08 | (d) | | | 1.69 | (d) | | | 1953 | | | |
| | | | 10.22 | | | | 6.07 | | | | 120,628 | | | | 0.40 | (d) | | | 2.86 | (d) | | | 0.68 | (d) | | | 2.58 | (d) | | | 1953 | | | |
| | | |
10.21 | | | | 6.03 | | | | 101,429 | | | | 0.35 | (d) | | | 2.98 | (d) | | | 0.63 | (d) | | | 2.70 | (d) | | | 1953 | | | |
| |
89
GOLDMAN SACHS CORE FIXED INCOME FUND
Financial Highlights
Selected Data for a Share Outstanding Throughout Each Period
| | | | | | | | | | | | | | | | | | | | | | | | | | | | | | | | | | | | | |
| | | | | | | Income (loss) from | | | | |
| | | | | | | investment operations | | Distributions to shareholders | | |
| | | | | Net asset | | | | | | |
| | | | | value, | | Net | | Net realized | | Total from | | From net | | From net | | | | |
| | | | | beginning | | investment | | and unrealized | | investment | | investment | | realized | | From | | Total | | |
| | | Year - Share Class | | of period | | income(a) | | gain (loss) | | operations | | income | | gains | | capital | | distributions | | |
| | | FOR THE SIX MONTHS ENDED APRIL 30, (UNAUDITED) |
| |
| | | 2007 - A | | $ | 9.82 | | | $ | 0.22 | | | $ | 0.01 | | | $ | 0.23 | | | $ | (0.20 | ) | | $ | — | | | $ | — | | | $ | (0.20 | ) | | |
| | | 2007 - B | | | 9.86 | | | | 0.18 | | | | 0.01 | | | | 0.19 | | | | (0.16 | ) | | | — | | | | — | | | | (0.16 | ) | | |
| | | 2007 - C | | | 9.87 | | | | 0.18 | | | | 0.01 | | | | 0.19 | | | | (0.16 | ) | | | — | | | | — | | | | (0.16 | ) | | |
| | | 2007 - Institutional | | | 9.86 | | | | 0.24 | | | | 0.01 | | | | 0.25 | | | | (0.22 | ) | | | — | | | | — | | | | (0.22 | ) | | |
| | | 2007 - Service | | | 9.86 | | | | 0.21 | | | | 0.01 | | | | 0.22 | | | | (0.19 | ) | | | — | | | | — | | | | (0.19 | ) | | |
| | | FOR THE YEARS ENDED OCTOBER 31, |
| |
| | | 2006 - A | | | 9.87 | | | | 0.41 | | | | (0.01 | ) | | | 0.40 | | | | (0.38 | ) | | | (0.06 | ) | | | (0.01 | ) | | | (0.45 | ) | | |
| | | 2006 - B | | | 9.91 | | | | 0.34 | | | | (0.01 | ) | | | 0.33 | | | | (0.31 | ) | | | (0.06 | ) | | | (0.01 | ) | | | (0.38 | ) | | |
| | | 2006 - C | | | 9.91 | | | | 0.34 | | | | — | | | | 0.34 | | | | (0.31 | ) | | | (0.06 | ) | | | (0.01 | ) | | | (0.38 | ) | | |
| | | 2006 - Institutional | | | 9.90 | | | | 0.45 | | | | — | | | | 0.45 | | | | (0.42 | ) | | | (0.06 | ) | | | (0.01 | ) | | | (0.49 | ) | | |
| | | 2006 - Service | | | 9.91 | | | | 0.40 | | | | (0.01 | ) | | | 0.39 | | | | (0.37 | ) | | | (0.06 | ) | | | (0.01 | ) | | | (0.44 | ) | | |
| | | |
| | | 2005 - A | | | 10.25 | | | | 0.32 | | | | (0.20 | ) | | | 0.12 | | | | (0.37 | ) | | | (0.13 | ) | | | — | | | | (0.50 | ) | | |
| | | 2005 - B | | | 10.29 | | | | 0.24 | | | | (0.20 | ) | | | 0.04 | | | | (0.29 | ) | | | (0.13 | ) | | | — | | | | (0.42 | ) | | |
| | | 2005 - C | | | 10.29 | | | | 0.24 | | | | (0.20 | ) | | | 0.04 | | | | (0.29 | ) | | | (0.13 | ) | | | — | | | | (0.42 | ) | | |
| | | 2005 - Institutional | | | 10.28 | | | | 0.36 | | | | (0.21 | ) | | | 0.15 | | | | (0.40 | ) | | | (0.13 | ) | | | — | | | | (0.53 | ) | | |
| | | 2005 - Service | | | 10.29 | | | | 0.31 | | | | (0.21 | ) | | | 0.10 | | | | (0.35 | ) | | | (0.13 | ) | | | — | | | | (0.48 | ) | | |
| | | |
| | | 2004 - A | | | 10.31 | | | | 0.30 | | | | 0.32 | | | | 0.62 | | | | (0.33 | ) | | | (0.35 | ) | | | — | | | | (0.68 | ) | | |
| | | 2004 - B | | | 10.35 | | | | 0.23 | | | | 0.31 | | | | 0.54 | | | | (0.25 | ) | | | (0.35 | ) | | | — | | | | (0.60 | ) | | |
| | | 2004 - C | | | 10.35 | | | | 0.23 | | | | 0.31 | | | | 0.54 | | | | (0.25 | ) | | | (0.35 | ) | | | — | | | | (0.60 | ) | | |
| | | 2004 - Institutional | | | 10.35 | | | | 0.34 | | | | 0.31 | | | | 0.65 | | | | (0.37 | ) | | | (0.35 | ) | | | — | | | | (0.72 | ) | | |
| | | 2004 - Service | | | 10.35 | | | | 0.29 | | | | 0.32 | | | | 0.61 | | | | (0.32 | ) | | | (0.35 | ) | | | — | | | | (0.67 | ) | | |
| | | |
| | | 2003 - A | | | 10.07 | | | | 0.40 | | | | 0.28 | | | | 0.68 | | | | (0.40 | ) | | | (0.04 | ) | | | — | | | | (0.44 | ) | | |
| | | 2003 - B | | | 10.10 | | | | 0.33 | | | | 0.28 | | | | 0.61 | | | | (0.32 | ) | | | (0.04 | ) | | | — | | | | (0.36 | ) | | |
| | | 2003 - C | | | 10.10 | | | | 0.33 | | | | 0.28 | | | | 0.61 | | | | (0.32 | ) | | | (0.04 | ) | | | — | | | | (0.36 | ) | | |
| | | 2003 - Institutional | | | 10.09 | | | | 0.45 | | | | 0.29 | | | | 0.74 | | | | (0.44 | ) | | | (0.04 | ) | | | — | | | | (0.48 | ) | | |
| | | 2003 - Service | | | 10.09 | | | | 0.40 | | | | 0.29 | | | | 0.69 | | | | (0.39 | ) | | | (0.04 | ) | | | — | | | | (0.43 | ) | | |
| | | |
| | | 2002 - A | | | 10.25 | | | | 0.50 | | | | (0.13 | ) | | | 0.37 | | | | (0.52 | ) | | | (0.03 | ) | | | — | | | | (0.55 | ) | | |
| | | 2002 - B | | | 10.29 | | | | 0.43 | | | | (0.15 | ) | | | 0.28 | | | | (0.44 | ) | | | (0.03 | ) | | | — | | | | (0.47 | ) | | |
| | | 2002 - C | | | 10.29 | | | | 0.43 | | | | (0.15 | ) | | | 0.28 | | | | (0.44 | ) | | | (0.03 | ) | | | — | | | | (0.47 | ) | | |
| | | 2002 - Institutional | | | 10.28 | | | | 0.55 | | | | (0.15 | ) | | | 0.40 | | | | (0.56 | ) | | | (0.03 | ) | | | — | | | | (0.59 | ) | | |
| | | 2002 - Service | | | 10.28 | | | | 0.51 | | | | (0.16 | ) | | | 0.35 | | | | (0.51 | ) | | | (0.03 | ) | | | — | | | | (0.54 | ) | | |
| | | |
| |
| (a) | Calculated based on the average shares outstanding methodology. |
| (b) | Assumes investment at the net asset value at the beginning of the period, reinvestment of all dividends and distributions, a complete redemption of the investment at the net asset value at the end of the period and no sales or redemption charges. Total return would be reduced if a sales or redemption charge were taken into account. Total returns less than one full year are not annualized. Returns do not reflect the deduction of taxes that a shareholder would pay on Fund distributions or the redemption of Fund shares. |
| (c) | The portfolio turnover rate excluding the affect of mortgage dollar rolls is 54% for the period ended April 30, 2007 and 516% for the year ended October 31, 2006. Prior years include the effect of mortgage dollar roll transactions. |
| (d) | Annualized. |
The accompanying notes are an integral part of these financial statements.
90
| | | | | | | | | | | | | | | | | | | | | | | | | | | | | | | | | | | |
| | | | | | | | | | | | | Ratios assuming no | | | | |
| | | | | | | | | | | | | expense reductions | | | | |
| | | | | | | | | | | | | | | | | |
| | | | | | | | | | | Ratio of | | Ratio of | | Ratio of | | | | |
| | | | | | | Net assets | | Ratio of | | net investment | | total | | net investment | | | | |
| | | Net asset | | | | at end of | | net expenses | | income to | | expenses | | income to | | Portfolio | | |
| | | value, end | | Total | | period | | to average | | average net | | to average | | average net | | turnover | | |
| | | of period | | return(b) | | (in 000s) | | net assets | | assets | | net assets | | assets | | rate(c) | | |
| |
| | | |
| |
| | | $ | 9.85 | | | | 2.34 | % | | $ | 743,816 | | | | 0.81 | %(d) | | | 4.50 | %(d) | | | 0.82 | %(d) | | | 4.49 | %(d) | | | 55 | % | | |
| | | | 9.89 | | | | 1.95 | | | | 21,389 | | | | 1.56 | (d) | | | 3.74 | (d) | | | 1.57 | (d) | | | 3.73 | (d) | | | 55 | | | |
| | | | 9.90 | | | | 1.95 | | | | 24,487 | | | | 1.56 | (d) | | | 3.74 | (d) | | | 1.57 | (d) | | | 3.73 | (d) | | | 55 | | | |
| | | | 9.89 | | | | 2.51 | | | | 1,557,320 | | | | 0.44 | (d) | | | 4.86 | (d) | | | 0.45 | (d) | | | 4.85 | (d) | | | 55 | | | |
| | | | 9.89 | | | | 2.26 | | | | 45,508 | | | | 0.94 | (d) | | | 4.36 | (d) | | | 0.95 | (d) | | | 4.35 | (d) | | | 55 | | | |
| | | |
| |
| | | | 9.82 | | | | 4.21 | | | | 714,877 | | | | 0.83 | | | | 4.25 | | | | 0.84 | | | | 4.24 | | | | 562 | | | |
| | | | 9.86 | | | | 3.42 | | | | 22,971 | | | | 1.58 | | | | 3.49 | | | | 1.59 | | | | 3.48 | | | | 562 | | | |
| | | | 9.87 | | | | 3.52 | | | | 20,937 | | | | 1.58 | | | | 3.49 | | | | 1.59 | | | | 3.48 | | | | 562 | | | |
| | | | 9.86 | | | | 4.69 | | | | 1,558,971 | | | | 0.46 | | | | 4.65 | | | | 0.47 | | | | 4.64 | | | | 562 | | | |
| | | | 9.86 | | | | 4.06 | | | | 46,600 | | | | 0.96 | | | | 4.13 | | | | 0.97 | | | | 4.12 | | | | 562 | | | |
| |
| | | | 9.87 | | | | 1.14 | | | | 658,114 | | | | 0.86 | | | | 3.14 | | | | 0.87 | | | | 3.13 | | | | 283 | | | |
| | | | 9.91 | | | | 0.38 | | | | 29,096 | | | | 1.61 | | | | 2.40 | | | | 1.62 | | | | 2.39 | | | | 283 | | | |
| | | | 9.91 | | | | 0.38 | | | | 23,432 | | | | 1.61 | | | | 2.40 | | | | 1.62 | | | | 2.39 | | | | 283 | | | |
| | | | 9.90 | | | | 1.53 | | | | 1,098,280 | | | | 0.47 | | | | 3.54 | | | | 0.48 | | | | 3.53 | | | | 283 | | | |
| | | | 9.91 | | | | 1.02 | | | | 31,682 | | | | 0.97 | | | | 3.03 | | | | 0.98 | | | | 3.02 | | | | 283 | | | |
| |
| | | | 10.25 | | | | 6.24 | | | | 523,045 | | | | 0.90 | | | | 2.96 | | | | 0.90 | | | | 2.96 | | | | 549 | | | |
| | | | 10.29 | | | | 5.43 | | | | 32,040 | | | | 1.65 | | | | 2.21 | | | | 1.65 | | | | 2.21 | | | | 549 | | | |
| | | | 10.29 | | | | 5.42 | | | | 24,323 | | | | 1.65 | | | | 2.21 | | | | 1.65 | | | | 2.21 | | | | 549 | | | |
| | | | 10.28 | | | | 6.55 | | | | 860,021 | | | | 0.50 | | | | 3.36 | | | | 0.50 | | | | 3.36 | | | | 549 | | | |
| | | | 10.29 | | | | 6.22 | | | | 20,221 | | | | 1.00 | | | | 2.86 | | | | 1.00 | | | | 2.86 | | | | 549 | | | |
| |
| | | | 10.31 | | | | 7.03 | | | | 445,178 | | | | 0.89 | | | | 3.91 | | | | 0.89 | | | | 3.91 | | | | 489 | | | |
| | | | 10.35 | | | | 6.31 | | | | 37,120 | | | | 1.64 | | | | 3.21 | | | | 1.64 | | | | 3.21 | | | | 489 | | | |
| | | | 10.35 | | | | 6.21 | | | | 25,409 | | | | 1.64 | | | | 3.16 | | | | 1.64 | | | | 3.16 | | | | 489 | | | |
| | | | 10.35 | | | | 7.54 | | | | 695,181 | | | | 0.49 | | | | 4.39 | | | | 0.49 | | | | 4.39 | | | | 489 | | | |
| | | | 10.35 | | | | 6.90 | | | | 21,827 | | | | 0.99 | | | | 3.89 | | | | 0.99 | | | | 3.89 | | | | 489 | | | |
| |
| | | | 10.07 | | | | 3.59 | | | | 315,441 | | | | 0.90 | | | | 5.03 | | | | 0.90 | | | | 5.03 | | | | 437 | | | |
| | | | 10.10 | | | | 2.70 | | | | 36,131 | | | | 1.65 | | | | 4.33 | | | | 1.65 | | | | 4.33 | | | | 437 | | | |
| | | | 10.10 | | | | 2.80 | | | | 20,176 | | | | 1.65 | | | | 4.32 | | | | 1.65 | | | | 4.32 | | | | 437 | | | |
| | | | 10.09 | | | | 3.99 | | | | 733,996 | | | | 0.50 | | | | 5.51 | | | | 0.50 | | | | 5.51 | | | | 437 | | | |
| | | | 10.09 | | | | 3.47 | | | | 29,761 | | | | 1.00 | | | | 5.05 | | | | 1.00 | | | | 5.05 | | | | 437 | | | |
| |
91
GOLDMAN SACHS INVESTMENT GRADE CREDIT FUND
Financial Highlights
Selected Data for a Share Outstanding Throughout Each Period
| | | | | | | | | | | | | | | | | | | | | | | | | | | | | | | | | |
| | | | | | | Income from | | Distributions | | |
| | | | | | | investment operations | | to shareholders | | |
| | | | | Net asset | | | | | | |
| | | | | value, | | Net | | Net realized | | Total from | | From net | | From net | | | | |
| | | | | beginning | | investment | | and unrealized | | investment | | investment | | realized | | Total | | |
| | | Year - Share Class | | of period | | income (a) | | gain (loss) | | operations | | income | | gains | | distributions | | |
| | | FOR THE SIX MONTHS ENDED APRIL 30, (UNAUDITED) |
| |
| | | 2007 — A | | $ | 9.95 | | | $ | 0.24 | | | $ | 0.07 | | | $ | 0.31 | | | $ | (0.24 | ) | | $ | — | | | $ | (0.24 | ) | | |
| | | 2007 — Institutional | | | 9.97 | | | | 0.26 | | | | 0.07 | | | | 0.33 | | | | (0.26 | ) | | | — | | | | (0.26 | ) | | |
| | | 2007 — Separate Account Institutional | | | 9.96 | | | | 0.26 | | | | 0.07 | | | | 0.33 | | | | (0.26 | ) | | | — | | | | (0.26 | ) | | |
| | | FOR THE YEARS ENDED OCTOBER 31, |
| |
| | | 2006 — A | | | 9.93 | | | | 0.47 | | | | — | | | | 0.47 | | | | (0.45 | ) | | | — | | | | (0.45 | ) | | |
| | | 2006 — Institutional | | | 9.95 | | | | 0.51 | | | | — | | | | 0.51 | | | | (0.49 | ) | | | — | | | | (0.49 | ) | | |
| | | 2006 — Separate Account Institutional | | | 9.94 | | | | 0.52 | | | | (0.01 | ) | | | 0.51 | | | | (0.49 | ) | | | — | | | | (0.49 | ) | | |
| | | |
| | | 2005 — A | | | 10.31 | | | | 0.40 | | | | (0.35 | ) | | | 0.05 | | | | (0.39 | ) | | | (0.04 | ) | | | (0.43 | ) | | |
| | | 2005 — Institutional | | | 10.32 | | | | 0.52 | | | | (0.42 | ) | | | 0.10 | | | | (0.43 | ) | | | (0.04 | ) | | | (0.47 | ) | | |
| | | 2005 — Separate Account Institutional | | | 10.31 | | | | 0.46 | | | | (0.35 | ) | | | 0.11 | | | | (0.44 | ) | | | (0.04 | ) | | | (0.48 | ) | | |
| | | FOR THE PERIOD ENDED OCTOBER 31, |
| |
| | | 2004 — A (commenced November 3, 2003) | | | 10.00 | | | | 0.38 | | | | 0.31 | | | | 0.69 | | | | (0.38 | ) | | | — | | | | (0.38 | ) | | |
| | | 2004 — Institutional (commenced November 3, 2003) | | | 10.00 | | | | 0.44 | | | | 0.30 | | | | 0.74 | | | | (0.42 | ) | | | — | | | | (0.42 | ) | | |
| | | 2004 — Separate Account Institutional (commenced November 3, 2003) | | | 10.00 | | | | 0.43 | | | | 0.31 | | | | 0.74 | | | | (0.43 | ) | | | — | | | | (0.43 | ) | | |
| | | |
| |
| (a) | Calculated based on the average shares outstanding methodology. |
| (b) | Assumes investment at the net asset value at the beginning of the period, reinvestment of all dividends and distributions, a complete redemption of the investment at the net asset value at the end of the period and no sales or redemption charges. Total return would be reduced if a sales or redemption charge were taken into account. Total returns for periods less than one full year are not annualized. Returns do not reflect the deduction of taxes that a shareholder would pay on Fund distributions or the redemption of Fund shares. |
| (c) | Annualized. |
The accompanying notes are an integral part of these financial statements.
92
| | | | | | | | | | | | | | | | | | | | | | | | | | | | | | | | | | | |
| | | | | | | | | | | | | Ratios assuming no | | | | |
| | | | | | | | | | | | | expense reductions | | | | |
| | | | | | | | | | | | | | | | | |
| | | | | | | | | | | Ratio of | | Ratio of | | Ratio of | | | | |
| | | | | | | Net assets | | Ratio of | | net investment | | total | | net investment | | | | |
| | | Net asset | | | | at end of | | net expenses | | income to | | expenses | | income to | | Portfolio | | |
| | | value, end | | Total | | of period | | to average | | average net | | to average | | average net | | turnover | | |
| | | of period | | return(b) | | (in 000s) | | net assets | | assets | | net assets | | assets | | rate | | |
| | | |
| |
| | | $ | 10.02 | | | | 3.14 | % | | $ | 6,938 | | | | 0.79 | %(c) | | | 4.85 | %(c) | | | 0.96 | %(c) | | | 4.68 | %(c) | | | 43 | % | | |
| | | | 10.04 | | | | 3.34 | | | | 3,577 | | | | 0.40 | (c) | | | 5.26 | (c) | | | 0.59 | (c) | | | 5.07 | (c) | | | 43 | | | |
| | | | 10.03 | | | | 3.36 | | | | 215,129 | | | | 0.35 | (c) | | | 5.31 | (c) | | | 0.54 | (c) | | | 5.12 | (c) | | | 43 | | | |
| | | |
| |
| | | | 9.95 | | | | 4.84 | | | | 3,420 | | | | 0.79 | | | | 4.82 | | | | 1.04 | | | | 4.57 | | | | 74 | | | |
| | | | 9.97 | | | | 5.35 | | | | 3,317 | | | | 0.40 | | | | 5.21 | | | | 0.65 | | | | 4.96 | | | | 74 | | | |
| | | | 9.96 | | | | 5.30 | | | | 206,122 | | | | 0.35 | | | | 5.26 | | | | 0.60 | | | | 5.01 | | | | 74 | | | |
| |
| | | | 9.93 | | | | 0.50 | | | | 3,622 | | | | 0.81 | | | | 3.88 | | | | 1.07 | | | | 3.62 | | | | 88 | | | |
| | | | 9.95 | | | | 0.89 | | | | 3,638 | | | | 0.40 | | | | 4.40 | | | | 0.66 | | | | 4.14 | | | | 88 | | | |
| | | | 9.94 | | | | 1.04 | | | | 192,196 | | | | 0.35 | | | | 4.34 | | | | 0.62 | | | | 4.07 | | | | 88 | | | |
| | | |
| |
| | | | 10.31 | | | | 7.00 | | | | 2,179 | | | | 0.82 | (c) | | | 3.66 | (c) | | | 1.85 | (c) | | | 2.63 | (c) | | | 78 | | | |
| | | | 10.32 | | | | 7.57 | | | | 76 | | | | 0.40 | (c) | | | 4.28 | (c) | | | 1.45 | (c) | | | 3.23 | (c) | | | 78 | | | |
| | | |
10.31 | | | | 7.52 | | | | 70,269 | | | | 0.35 | (c) | | | 4.26 | (c) | | | 1.40 | (c) | | | 3.21 | (c) | | | 78 | | | |
| |
93
GOLDMAN SACHS CORE PLUS FIXED INCOME FUND
Financial Highlights
Selected Data for a Share Outstanding Throughout the Period
| | | | | | | | | | | | | | | | | | | | | | | | | |
| | | | | | | Income from | | | | |
| | | | | | | investment operations | | | | |
| | | | | | | | | Distributions | | |
| | | | | Net asset | | | | to shareholders | | |
| | | | | value, | | Net | | Net realized | | Total from | | from net | | |
| | | | | beginning | | investment | | and unrealized | | investment | | investment | | |
| | | Year - Share Class | | of period | | income(a) | | (loss) | | operations | | income | | |
| |
| | | FOR THE PERIOD ENDED APRIL 30, (UNAUDITED) |
| |
| | | 2007 - A (commenced November 30, 2006) | | $ | 10.00 | | | $ | 0.16 | | | $ | (0.03 | ) | | $ | 0.13 | | | $ | (0.17 | ) | | |
| | | 2007 - C (commenced November 30, 2006) | | | 10.00 | | | | 0.14 | | | | (0.03 | ) | | | 0.11 | | | | (0.15 | ) | | |
| | | 2007 - Institutional (commenced November 30, 2006) | | | 10.00 | | | | 0.19 | | | | (0.04 | ) | | | 0.15 | | | | (0.19 | ) | | |
| | | |
| |
| (a) | Calculated based on the average shares outstanding methodology. |
| (b) | Assumes investment at the net asset value at the beginning of the period, reinvestment of all dividends and distributions, a complete redemption of the investment at the net asset value at the end of the period and no sales or redemption charges. Total return would be reduced if a sales or redemption charge were taken into account. Total returns for periods less than one full year are not annualized. Returns do not reflect the deduction of taxes that a shareholder would pay on Fund distributions or the redemption of Fund shares. |
| (c) | Annualized. |
| (d) | Expense ratios exclude expenses of the Underlying funds. |
The accompanying notes are an integral part of these financial statements.
94
GOLDMAN SACHS CORE PLUS FIXED INCOME FUND
| | | | | | | | | | | | | | | | | | | | | | | | | | | | | | | | | | | |
| | | | | | | | | | | | | Ratios assuming no | | | | |
| | | | | | | | | | | | | expense reductions | | | | |
| | | | | | | | | | | | | | | | | |
| | | | | | | | | Ratio of | | Ratio of | | Ratio of | | Ratio of | | | | |
| | | | | | | Net assets | | net expenses | | net investment | | total | | net investment | | | | |
| | | Net asset | | | | at end of | | to average | | income to | | expenses | | income to | | Portfolio | | |
| | | value, end | | Total | | of period | | net | | average net | | to average | | average net | | turnover | | |
| | | of period | | return(b) | | (in 000s) | | assets(c)(d) | | assets(c) | | net assets(c)(d) | | assets(c) | | rate | | |
| |
| | | |
| |
| | | $ | 9.96 | | | | 1.31 | % | | $ | 12,565 | | | | 0.86 | % | | | 4.05 | % | | | 1.89 | % | | | 3.02 | % | | | 129 | % | | |
| | | | 9.96 | | | | 1.01 | | | | 360 | | | | 1.61 | | | | 3.48 | | | | 2.64 | | | | 2.45 | | | | 129 | | | |
| | | | 9.96 | | | | 1.47 | | | | 60,902 | | | | 0.49 | | | | 4.62 | | | | 1.52 | | | | 3.59 | | | | 129 | | | |
| |
95
GOLDMAN SACHS SINGLE MULTI-SECTOR FUNDS
Fund Expenses (Unaudited) — Six Month Period Ended April 30, 2007
As a shareholder of Class A, Class B, Class C, Institutional, Service or Separate Account Institutional Shares of the Funds you incur two types of costs: (1) transaction costs, including sales charges (loads) on purchase payments (with respect to Class A Shares), contingent deferred sales charges (loads) on redemptions (with respect to Class B and C shares), and redemption fees (if any); and (2) ongoing costs, including management fees; distribution and service (12b-1) fees (with respect to Class A, Class B and Class C Shares); and other Fund expenses. This example is intended to help you understand your ongoing costs (in dollars) of investing in Class A, Class B, Class C, Institutional, Service and Separate Account Institutional Shares of the Funds and to compare these costs with the ongoing costs of investing in other mutual funds.
The example is based on an investment of $1,000 invested at the beginning of the period and held for the entire period from November 1, 2006 through April 30, 2007.
Actual Expenses — The first line under each share class in the table below provides information about actual account values and actual expenses. You may use the information in this line, together with the amount you invested, to estimate the expenses that you paid over the period. Simply divide your account value by $1,000 (for example, an $8,600 account value divided by $1,000 = 8.6), then multiply the result by the number in the first line under the heading entitled “Expenses Paid” to estimate the expenses you paid on your account for this period.
Hypothetical Example for Comparison Purposes — The second line under each share class in the table below provides information about hypothetical account values and hypothetical expenses based on the Funds’ actual expense ratios and an assumed rate of return of 5% per year before expenses, which is not the Funds’ actual return. The hypothetical account values and expenses may not be used to estimate the actual ending account balance or expenses you paid for the period. You may use this information to compare the ongoing costs of investing in the Funds and other funds. To do so, compare this 5% hypothetical example with the 5% hypothetical examples that appear in the shareholder reports of the other funds.
Please note that the expenses shown in the table are meant to highlight your ongoing costs only and do not reflect any transactional costs, such as sales charges (loads), redemption fees, or exchange fees. Therefore, the second line of the table is useful in comparing ongoing costs only, and will not help you determine the relative total costs of owning different funds. In addition, if these transactional costs were included, your costs would have been higher.
| | | | | | | | | | | | | | | | | | | | | | | | | | | | | | | | | | | | | | | | | | | | | | | | | | | | | | | | | | | | | |
| | | |
| | | Government Income Fund | | U.S. Mortgages Fund | | Core Fixed Income Fund | | Investment Grade Credit Fund | | Core Plus Fixed Income Fund |
| |
| | | | | | | Expenses | | | | Expenses | | | | Expenses | | | | Expenses |
| | | Beginning | | Ending | | Paid for the | | Beginning | | Ending | | Expenses | | Beginning | | Ending | | Paid for the | | Beginning | | Ending | | Paid for the | | Beginning | | Ending | | Paid for the |
| | | Account Value | | Account Value | | 6 months ended | | Account Value | | Account Value | | Paid for the | | Account Value | | Account Value | | 6 months ended | | Account Value | | Account Value | | 6 months ended | | Account Value | | Account Value | | 6 months ended |
| Share Class | | 11/01/06 | | 4/30/07 | | 4/30/07* | | 11/01/06 | | 4/30/07 | | 6 months ended 4/30/07 | | 11/01/06 | | 4/30/07 | | 4/30/07 | | 11/01/06 | | 4/30/07 | | 4/30/07 | | 11/01/06 | | 4/30/07 | | 4/30/07 |
| |
Class A | | | | | | | | | | | | | | | | | | | | | | | | | | | | | | | | | | | | | | | | | | | | | | | | | | | | | | | | | | | | |
| Actual | | $ | 1,000.00 | | | $ | 1,022.90 | | | $ | 4.75 | | | $ | 1,000.00 | | | $ | 1,024.90 | | | $ | 3.96 | | | $ | 1,000.00 | | | $ | 1,023.40 | | | $ | 4.06 | | | $ | 1,000.00 | | | $ | 1,031.40 | | | $ | 3.98 | | | $ | 1,000.00 | | | $ | 1,013.10 | | | $ | 4.14 | |
| Hypothetical 5% return | | | 1,000.00 | | | | 1,020.10 | + | | | 4.74 | | | | 1,000.00 | | | | 1,020.89 | + | | | 3.95 | | | | 1,000.00 | | | | 1,020.78 | + | | | 4.06 | | | | 1,000.00 | | | | 1,020.87 | + | | | 3.96 | | | | 1,000.00 | | | | 1,020.68 | + | | | 4.16 | |
| |
Class B | | | | | | | | | | | | | | | | | | | | | | | | | | | | | | | | | | | | | | | | | | | | | | | | | | | | | | | | | | | | |
| Actual | | | 1,000.00 | | | | 1,019.80 | | | | 8.49 | | | | N/A | | | | N/A | | | | N/A | | | | 1,000.00 | | | | 1,019.50 | | | | 7.81 | | | | N/A | | | | N/A | | | | N/A | | | | N/A | | | | N/A | | | | N/A | |
| Hypothetical 5% return | | | 1,000.00 | | | | 1,016.39 | + | | | 8.48 | | | | N/A | | | | N/A | | | | N/A | | | | 1,000.00 | | | | 1,017.06 | + | | | 7.80 | | | | N/A | | | | N/A | | | | N/A | | | | N/A | | | | N/A | | | | N/A | |
| |
Class C | | | | | | | | | | | | | | | | | | | | | | | | | | | | | | | | | | | | | | | | | | | | | | | | | | | | | | | | | | | | |
| Actual | | | 1,000.00 | | | | 1,019.90 | | | | 8.49 | | | | N/A | | | | N/A | | | | N/A | | | | 1,000.00 | | | | 1,019.50 | | | | 7.82 | | | | N/A | | | | N/A | | | | N/A | | | | 1,000.00 | | | | 1,010.10 | | | | 7.93 | |
| Hypothetical 5% return | | | 1,000.00 | | | | 1,016.39 | + | | | 8.47 | | | | N/A | | | | N/A | | | | N/A | | | | 1,000.00 | | | | 1,017.05 | + | | | 7.81 | | | | N/A | | | | N/A | | | | N/A | | | | 1,000.00 | | | | 1,016.90 | + | | | 7.96 | |
| |
Institutional | | | | | | | | | | | | | | | | | | | | | | | | | | | | | | | | | | | | | | | | | | | | | | | | | | | | | | | | | | | | |
| Actual | | | 1,000.00 | | | | 1,024.80 | | | | 2.88 | | | | 1,000.00 | | | | 1,027.70 | | | | 2.00 | | | | 1,000.00 | | | | 1,025.10 | | | | 2.21 | | | | 1,000.00 | | | | 1,033.40 | | | | 2.03 | | | | 1,000.00 | | | | 1,014.70 | | | | 2.36 | |
| Hypothetical 5% return | | | 1,000.00 | | | | 1,021.95 | + | | | 2.88 | | | | 1,000.00 | | | | 1,022.82 | + | | | 1.99 | | | | 1,000.00 | | | | 1,022.61 | + | | | 2.21 | | | | 1,000.00 | | | | 1,022.80 | + | | | 2.02 | | | | 1,000.00 | | | | 1,022.45 | + | | | 2.37 | |
| |
Separate Account Institutional | | | | | | | | | | | | | | | | | | | | | | | | | | | | | | | | | | | | | | | | | | | | | | | | | | | | | | | | | | | | |
| Actual | | | N/A | | | | N/A | | | | N/A | | | | 1,000.00 | | | | 1,026.90 | | | | 1.74 | | | | N/A | | | | N/A | | | | N/A | | | | 1,000.00 | | | | 1,033.60 | | | | 1.77 | | | | N/A | | | | N/A | | | | N/A | |
| Hypothetical 5% return | | | N/A | | | | N/A | | | | N/A | | | | 1,000.00 | | | | 1,023.08 | + | | | 1.74 | | | | N/A | | | | N/A | | | | N/A | | | | 1,000.00 | | | | 1,023.05 | + | | | 1.77 | | | | N/A | | | | N/A | | | | N/A | |
| |
Service | | | | | | | | | | | | | | | | | | | | | | | | | | | | | | | | | | | | | | | | | | | | | | | | | | | | | | | | | | | | |
| Actual | | | 1,000.00 | | | | 1,023.00 | | | | 5.39 | | | | N/A | | | | N/A | | | | N/A | | | | 1,000.00 | | | | 1,022.60 | | | | 4.71 | | | | N/A | | | | N/A | | | | N/A | | | | N/A | | | | N/A | | | | N/A | |
| Hypothetical 5% return | | | 1,000.00 | | | | 1,019.46 | + | | | 5.38 | | | | N/A | | | | N/A | | | | N/A | | | | 1,000.00 | | | | 1,020.13 | + | | | 4.71 | | | | N/A | | | | N/A | | | | N/A | | | | N/A | | | | N/A | | | | N/A | |
| |
| |
| * | Expenses for each share class are calculated using each Fund’s net annualized expense ratio for each class, which represents the ongoing expenses as a percentage of net assets for the six months ended 4/30/07. Expenses are calculated by multiplying the annualized net expense ratio by the average account value for the period; then multiplying the result by the number of days in the most recent fiscal half year; and then dividing that result by the number of days in the fiscal year. The annualized expense ratios for the period were as follows: |
| | | | | | | | | | | | | | | | | | | | | | | | | |
| | | | | | | | | | | | | Separate Account |
| Fund | | Class A | | Class B | | Class C | | Institutional | | Service | | Institutional |
| | | | | | | | | | | | | |
| Government Income | | | 0.95 | % | | | 1.70 | % | | | 1.70 | % | | | 0.58 | % | | | 1.08 | % | | | N/A | |
| U.S. Mortgages | | | 0.79 | | | | N/A | | | | N/A | | | | 0.40 | | | | N/A | | | | 0.35 | % |
| Core Fixed Income | | | 0.81 | | | | 1.56 | | | | 1.56 | | | | 0.44 | | | | 0.94 | | | | N/A | |
| Investment Grade Credit | | | 0.79 | | | | N/A | | | | N/A | | | | 0.40 | | | | N/A | | | | 0.35 | |
| Core Plus Fixed Income | | | 0.86 | | | | N/A | | | | 1.61 | | | | 0.49 | | | | N/A | | | | N/A | |
| |
| |
| + | Hypothetical expenses are based on the Fund’s actual expense ratios and an assumed rate of return of 5% per year before expenses. |
96
FUNDS PROFILE
Goldman Sachs Funds
Goldman Sachs is a premier financial services firm, known since 1869 for creating thoughtful and customized investment solutions in complex global markets.
Today, the Investment Management Division of Goldman Sachs serves a diverse set of clients worldwide, including private institutions, public entities and individuals. With portfolio management teams located around the world — and $699.0 billion in assets under management as of March 31, 2007 — our investment professionals bring firsthand knowledge of local markets to every investment decision, making us one of the few truly global asset managers.
In building a globally diversified portfolio, you can select from more than 50 Goldman Sachs Funds and gain access to investment opportunities across borders, investment styles, asset classes and security capitalizations.

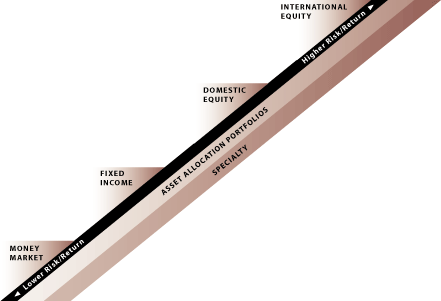
| | | | | |
Money Market Funds1
Fixed Income Funds
▪ Enhanced Income Fund
▪ Ultra-Short Duration
Government Fund
▪ Short Duration Government Fund
▪ Short Duration Tax-Free Fund
▪ California AMT-Free Municipal Fund2
▪ New York AMT-Free Municipal Fund2
▪ Tennessee Municipal Fund | | ▪ Municipal Income Fund
▪ U.S. Mortgages Fund
▪ Government Income Fund
▪ Core Fixed Income Fund
▪ Core Plus Fixed Income Fund
▪ Investment Grade Credit Fund
▪ Global Income Fund
▪ High Yield Municipal Fund
▪ High Yield Fund
▪ Emerging Markets Debt Fund
Domestic Equity Funds
▪ Balanced Fund
▪ Growth and Income Fund
▪ Structured Large Cap Value Fund
▪ Large Cap Value Fund
▪ Structured U.S. Equity Fund
▪ Structured U.S. Equity Flex Fund
▪ Structured Large Cap Growth Fund
▪ Capital Growth Fund | | ▪ Strategic Growth Fund
▪ Concentrated Growth Fund
▪ Mid Cap Value Fund
▪ Growth Opportunities Fund
▪ Small/ Mid Cap Growth Fund
▪ Structured Small Cap Equity Fund
▪ Small Cap Value Fund
International Equity Funds
▪ Structured International Equity Fund
▪ Structured International Equity Flex Fund
▪ Concentrated International Equity Fund 2
▪ Japanese Equity Fund
▪ International Small Cap Fund
▪ Asia Equity Fund
▪ Emerging Markets Equity Fund
▪ BRIC Fund (Brazil, Russia, India, China)
Asset Allocation Funds3
Specialty Funds3
▪ U.S. Equity Dividend and Premium Fund
▪ Structured Tax-Managed Equity Fund
▪ Real Estate Securities Fund
▪ International Real Estate Securities Fund
▪ Tollkeeper FundSM
▪ Commodity Strategy Fund |
| |
| 1 | An investment in a money market fund is neither insured nor guaranteed by the Federal Deposit Insurance Corporation or any other government agency. Although the Funds seek to preserve the value of your investment at $1.00 per share, it is possible to lose money by investing in the Funds. |
| |
| 2 | Effective December 26, 2006, the International Equity Fund was renamed the Concentrated International Equity Fund. Effective June 1, 2007, the California Intermediate AMT-Free Municipal Fund was renamed the California AMT-Free Municipal Fund and the New York Intermediate AMT- Free Municipal Fund was renamed the New York AMT-Free Municipal Fund. |
| |
| 3 | Individual Funds within the Asset Allocation and Specialty categories will have various placement on the risk/return spectrum and may have greater or lesser risk than that indicated by the placement of the general Asset Allocation or Specialty category. |
| |
| | The Goldman Sachs Tollkeeper FundSM is a registered service mark of Goldman, Sachs & Co. |
GOLDMAN SACHS ASSET MANAGEMENT, L.P. 32 OLD SLIP, 32ND FLOOR, NEW YORK, NEW YORK 10005
| | | |
TRUSTEES
Ashok N. Bakhru, Chairman
John P. Coblentz, Jr.
Patrick T. Harker
Mary Patterson McPherson
Alan A. Shuch
Richard P. Strubel | | OFFICERS
Kaysie P. Uniacke, President
James A. McNamara, Senior Vice President
John M. Perlowski, Senior Vice President and Treasurer
Peter V. Bonanno, Secretary |
| |
GOLDMAN, SACHS & CO.
Distributor and Transfer Agent | | GOLDMAN SACHS ASSET MANAGEMENT, L.P.
Investment Adviser |
Visit our Web site at www.goldmansachsfunds.com to obtain the most recent month-end returns.
The reports concerning the Funds included in this shareholder report may contain certain forward-looking statements about the factors that may affect the performance of the Funds in the future. These statements are based on Fund management’s predictions and expectations concerning certain future events and their expected impact on the Funds, such as performance of the economy as a whole and of specific industry sectors, changes in the levels of interest rates, the impact of developing world events, and other factors that may influence the future performance of the Funds. Management believes these forward-looking statements to be reasonable, although they are inherently uncertain and difficult to predict. Actual events may cause adjustments in portfolio management strategies from those currently expected to be employed.
A description of the policies and procedures that the Funds use to determine how to vote proxies relating to portfolio securities and information regarding how a Fund voted proxies relating to portfolio securities during the most recent 12-month period ended June 30 is available (I) without charge, upon request by calling 1-800-526-7384 (for Retail Shareholders) or 1-800-621-2550 (for Institutional Shareholders); and (II) on the Securities and Exchange Commission Web site at http://www.sec.gov.
The Funds file their complete schedule of portfolio holdings with the Securities and Exchange Commission (“SEC”) for the first and third quarters of each fiscal year on Form N-Q. The Funds’ Forms N-Q will become available on the SEC’s website at http://www.sec.gov within 60 days after the Funds’ first and third fiscal quarters. When available, the Funds’ Forms N-Q may be reviewed and copied at the SEC’s Public Reference Room in Washington, D.C. and information on the operation of the Public Reference Room may also be obtained by calling 1-800-SEC-0330. When available, Form N-Q may be obtained upon request and without charge by calling 1-800-526-7384 (for Retail Shareholders) or 1-800-621-2550 (for Institutional Shareholders).
Foreign and emerging markets investments may be more volatile and less liquid than investment in U.S. securities and will be subject to the risks of currency fluctuations and sudden economic or political developments. At times, the Core Fixed Income, Investment Grade Credit, and Core Plus Fixed Income Funds may be unable to sell certain of their portfolio securities without a substantial drop in price, if at all. The Core Fixed Income, Investment Grade Credit and Core Plus Fixed Income Funds may also engage in foreign currency transactions for hedging purposes including cross hedging or for speculative purposes. Forward foreign currency exchange contracts are subject to the risk that the counterparty to the contract will default on its obligations.
Holdings and allocations shown may not be representative of current or future investments. Holdings and allocations may not include the Funds’ entire investment portfolio, which may change at any time. Fund holdings should not be relied on in making investment decisions and should not be construed as research or investment advice regarding particular securities.
This material is not authorized for distribution to prospective investors unless preceded or accompanied by a current Prospectus. Please consider a Fund’s objectives, risks, and charges and expenses, and read the Prospectus carefully before investing. The Prospectus contains this and other information about the Funds.
| |
Copyright 2007 Goldman, Sachs & Co. All rights reserved. 07-1210
| SMSTFISAR / 36.2K / 06-07 |
| | | | | |
| | | (a) | | As of the end of the period covered by this report, the registrant has adopted a code of ethics that applies to the registrant’s principal executive officer, principal financial officer, principal accounting officer or controller, or persons performing similar functions, regardless of whether these individuals are employed by the registrant or a third party (the “Code of Ethics”). |
| | | |
| | | (b) | | During the period covered by this report, no amendments were made to the provisions of the Code of Ethics. |
| | | |
| | | (c) | | During the period covered by this report, the registrant did not grant any waivers, including an implicit waiver, from any provision of the Code of Ethics. |
| | | |
| | | (d) | | A copy of the Code of Ethics is available as provided in Item 12(a)(1) of this report. |
| | | |
| ITEM 3. | | AUDIT COMMITTEE FINANCIAL EXPERT. |
| | | |
| | | The registrant’s board of trustees has determined that the registrant has at least one “audit committee financial expert” (as defined in Item 3 of Form N-CSR) serving on its audit committee. John P. Coblentz, Jr. is the “audit committee financial expert” and is “independent” (as each term is defined in Item 3 of Form N-CSR). |
| | | |
| ITEM 4. | | PRINCIPAL ACCOUNTANT FEES AND SERVICES. |
| | | |
| | | N/A |
| | | |
| ITEM 5. | | AUDIT COMMITTEE OF LISTED REGISTRANTS. |
| | | |
| | | Not applicable. |
| | | |
| ITEM 6. | | SCHEDULE OF INVESTMENTS. |
| | | |
| | | Schedule of Investments is included as part of the Report to Stockholders filed under Item 1. |
| | | |
| ITEM 7. | | DISCLOSURE OF PROXY VOTING POLICIES AND PROCEDURES FOR CLOSED-END MANAGEMENT INVESTMENT COMPANIES. |
| | | |
| | | Not applicable. |
| | | |
| ITEM 8. | | PORTFOLIO MANAGERS OF CLOSED-END MANAGEMENT INVESTMENT COMPANIES. |
| | | |
| | | Not applicable. |
| | | |
| ITEM 9. | | PURCHASES OF EQUITY SECURITIES BY CLOSED-END MANAGEMENT INVESTMENT COMPANY AND AFFILIATED PURCHASERS. |
| | | |
| | | Not applicable. |
| | | |
| ITEM 10. | | SUBMISSION OF MATTERS TO A VOTE OF SECURITY HOLDERS.
There have been no material changes to the procedures by which shareholders may recommend nominees to the registrant’s board of trustees. |
| | | |
| | | |
| ITEM 11. | | CONTROLS AND PROCEDURES. |
| | | |
| | (a) | | The registrant’s principal executive and principal financial officers, or persons performing similar functions have concluded that the registrant’s disclosure controls and procedures (as defined in Rule 30a-3(c) under the Investment Company Act of 1940, as amended (the “1940 Act”)) are effective as of a date within 90 days of the filing of this report that includes the disclosure required by this paragraph, based on the evaluation of these controls and procedures required by Rule 30a-3(b) under the 1940 Act and 15d-15(b) under the Securities Exchange Act of 1934, as amended. |
| | | |
| | (b) | | There were no changes in the registrant’s internal control over financial reporting (as defined in Rule 30a-3(d) under the 1940 Act) that occurred during the registrant’s second fiscal quarter of the period covered by this report that have materially affected, or are reasonably likely to materially affect, the registrant’s internal control over financial reporting. |
| | | |
| | (a)(1) | | Goldman Sachs Trust’s Code of Ethics for Principal Executive and Senior Financial Officers is incorporated by reference to Exhibit 11(a)(1) of the registrant’s Form N-CSR filed on March 8, 2004 for its Real Estate Securities Fund (Accession Number 0000950123-04-0002984). |
| |
| | (a)(2) | | Exhibit 99.CERT | Certifications pursuant to Section 302 of the Sarbanes-Oxley Act of 2002 filed herewith. |
| | | |
| | (b) | | Exhibit 99.906CERT | Certifications pursuant to Section 906 of the Sarbanes-Oxley Act of 2002 filed herewith. |
SIGNATURES
| | | | Pursuant to the requirements of the Securities Exchange Act of 1934 and the Investment Company Act of 1940, the registrant has duly caused this report to be signed on its behalf by the undersigned, thereunto duly authorized. |
| | | | | | | |
| | | | | Goldman Sachs Trust | | |
| | | | | | | |
| By: | | | | /s/ Kaysie P. Uniacke | | |
| | | | |
| | |
| | | | | Kaysie P. Uniacke | | |
| | | | | President/Principal Executive Officer | | |
| | | | | Goldman Sachs Trust | | |
| | | | | | | |
| Date: | | | | June 29, 2007 | | |
| | | | Pursuant to the requirements of the Securities Exchange Act of 1934 and the Investment Company Act of 1940, this report has been signed below by the following persons on behalf of the registrant and in the capacities and on the dates indicated. |
| | | | | | | |
| By: | | | | /s/ Kaysie P. Uniacke | | |
| | | | |
| | |
| | | | | Kaysie P. Uniacke | | |
| | | | | President/Principal Executive Officer | | |
| | | | | Goldman Sachs Trust | | |
| | | | | | | |
| Date: | | | | June 29, 2007 | | |
| | | | | | | |
| By: | | | | /s/ John M. Perlowski | | |
| | | | |
| | |
| | | | | John M. Perlowski | | |
| | | | | Treasurer/Principal Financial Officer | | |
| | | | | Goldman Sachs Trust | | |
| | | | | | | |
| Date: | | | | June 29, 2007 | | |