UNITED STATES
SECURITIES AND EXCHANGE COMMISSION
Washington, D.C. 20549
FORM N-CSR
CERTIFIED SHAREHOLDER REPORT OF REGISTERED MANAGEMENT INVESTMENT
COMPANIES
Investment Company Act file number 811-05349
Goldman Sachs Trust
(Exact name of registrant as specified in charter)71 South Wacker Drive, Chicago, Illinois 60606
(Address of principal executive offices) (Zip code)| | | |
| Peter V. Bonanno, Esq. | | Copies to: |
| Goldman, Sachs & Co. | | Jack W. Murphy, Esq. |
| One New York Plaza | | Dechert LLP |
| New York, New York 10004 | | 1775 I Street, NW |
| | | Washington, D.C. 20006 |
|
(Name and address of agents for service)
|
Registrant’s telephone number, including area code: (312) 655-4400
Date of fiscal year end: October 31
Date of reporting period: April 30, 2008
| | | |
| ITEM 1. | | REPORTS TO STOCKHOLDERS. |
| | | |
| | | The Semi-Annual Report to Stockholders is filed herewith. |
| | | |
Semi-Annual Report | | April 30, 2008 |
| | | Structured Equity Flex Funds |
| | | Structured International Equity Flex
Structured U.S. Equity Flex |
Goldman Sachs Structured Equity Flex Funds
| | |
| n | STRUCTURED INTERNATIONAL EQUITY FLEX | |
| |
| n | STRUCTURED U.S. EQUITY FLEX | |
TABLE OF CONTENTS
| | | |
| Principal Investment Strategies and Risks | | 1 |
| Investment Process | | 2 |
| Letters to Shareholders and Performance Summaries | | 3 |
| Schedules of Investments | | 13 |
| Financial Statements | | 33 |
| Notes to the Financial Statements | | 37 |
| Financial Highlights | | 48 |
| Other Information | | 52 |
| | | | | |
| |
NOT FDIC-INSURED | | May Lose Value | | No Bank Guarantee |
| |
GOLDMAN SACHS STRUCTURED EQUITY FLEX FUNDS
Principal Investment Strategies and Risks
| |
| This is not a complete list of risks that may affect the Funds. For additional information concerning the risks applicable to the Funds, please see the Funds’ Prospectuses. | |
| |
| The Structured International Equity Flex Fund invests in a broadly diversified portfolio of equity investments in companies that are organized outside the United States or whose securities are principally traded outside the United States. Foreign and emerging market securities may be more volatile than U.S. securities and are be subject to the risks of currency fluctuations and sudden economic or political developments. At times, the Fund may be unable to sell certain of its portfolio securities without a substantial drop in price, if at all. The Fund engages in derivative transactions, including short sales of securities. Derivative instruments involve sophisticated investment techniques and involve risks different from, and possibly greater than, the risks associated with investing directly in securities. Derivative instruments often involve leverage of the Fund’s assets, which magnifies the effect of changes in market values. A short sale transaction involves the sale of a borrowed security to a third party, with the understanding that the security must later be returned to the lender. Short sales involve the risk of an unlimited increase in the market value of the security sold short, which could result in a theoretically unlimited loss. Other risks associated with the Fund’s investments in derivative instruments include risks of default by a counterparty and the risks that transactions may not be liquid. | |
| |
| The Structured U.S. Equity Flex Fund invests in a broadly diversified portfolio of large-capitalization U.S. equity investments, including foreign companies that are traded in the U.S. The Fund engages in derivative transactions, including short sales of securities. Derivative instruments involve sophisticated investment techniques and involve risks different from, and possibly greater than, the risks associated with investing directly in securities. Derivative instruments often involve leverage of the Fund’s assets, which magnifies the effect of changes in market values. A short sale transaction involves the sale of a borrowed security to a third party, with the understanding that the security must later be returned to the lender. Short sales involve the risk of an unlimited increase in the market value of the security sold short, which could result in a theoretically unlimited loss. Other risks associated with the Fund’s investments in derivative instruments include risks of default by a counterparty and the risks that transactions may not be liquid. | |
1
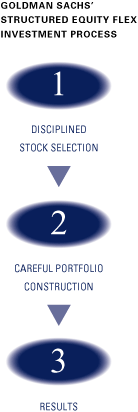
GOLDMAN SACHS STRUCTURED EQUITY FLEX FUNDS
Goldman Sachs’ Structured Equity
Flex Investment Process
| | | |
| |
| | 
n Comprehensive – We calculate expected excess returns for more than 10,000 stocks on a daily basis.
n Rigorous – We evaluate stocks based on fundamental investment criteria that have outperformed historically.
n Objective – We believe our stock selection process is free from the emotion that may lead to biased investment decisions.

n Our computer optimization process allocates risk to our best investment ideas and constructs funds that strive to neutralize systematic risks and deliver better returns.
n We take a limited number of short positions by targeting a portfolio weighting of up to 135% long and 35% short.
n We use a unique, proprietary risk model that is designed to be more precise, more focused and faster to respond because it seeks to identify, track and manage risk specific to our process, using daily data.

Fully invested, well-diversified portfolio that seeks to:
n Maintain style, sector, risk and capitalization characteristics similar to the benchmark.
n Offer broad access to a clearly defined equity universe.
n Generate excess returns that are positive, consistent and repeatable.
n Give the Funds greater exposure to the investment criteria due to their small number of short positions. This leads to potentially higher expected returns. |
2
PORTFOLIO RESULTS
Structured International Equity Flex Fund
Dear Shareholder:
This report provides an overview of the performance of the Goldman Sachs Structured International Equity Flex Fund
(the “Fund”) during the six-month reporting period that ended April 30, 2008.
Performance Review
| |
| Over the six-month period that ended April 30, 2008, the Fund’s Class A, C, and Institutional Shares generated cumulative total returns, without sales charges, of -12.50%, -12.80%, and -12.30%, respectively. These returns compare to a cumulative total return of -9.21% on the Fund’s benchmark, the Morgan Stanley Capital International (“MSCI”) Europe, Australasia, Far East (“EAFE”) Index (unhedged and net of dividend withholding taxes), over the same time period. In the period since their inception through April 30, 2008, the Fund’s Class IR and R Shares generated cumulative total returns of -7.02% and -7.19%, respectively, versus -6.12% for the Index over the same time period. |
| |
| The Fund uses a model that is based on six investment themes — Valuation, Profitability, Earnings Quality, Management Impact, Momentum and Analyst Sentiment. The Valuation theme attempts to capture potential mispricings of securities, typically by comparing a measure of the company’s intrinsic value to its market value. Profitability assesses whether the company is earning more than its cost of capital. Earnings Quality evaluates whether the company’s earnings are coming from more persistent, cash-based sources, as opposed to accruals. Management Impact assesses the company’s management strategy and behavior. Momentum predicts drift in stock prices caused by under-reaction to company-specific information. Finally, the Analyst Sentiment theme looks at how Wall Street analysts’ views about a company’s earnings and prospects are changing over time. |
Portfolio Positioning and Highlights
| |
| The Fund’s performance was disappointing over the last six months, a period in which the market environment was challenging for quantitative strategies generally. We believe that we are still experiencing the continued effects of the “crowding” that characterized the previous 12 to 18 months. (Crowding is a phenomenon in which quantitative managers look for similar stock traits using similar investment themes.) Crowding came to a head in August 2007 as a result of the quant liquidity crunch in which many portfolio managers utilizing quantitative strategies tried to reduce their exposure to equities — the same stocks — simultaneously. The ensuing sell-off, which continued — albeit muted — into September and through the fourth quarter (particularly during November 2007) adversely affected our investment themes, resulting in underperformance by the Fund through the end of the year. Any news that increased market volatility seemed to have a disproportionately negative impact on the Fund and our quantitative factors during the reporting period. The impact of crowding abated somewhat among this universe of stocks as the year turned, and the Fund’s returns were higher than those of the benchmark earlier in the reporting period. |
| |
| Our Valuation investment theme detracted the most from the Fund’s relative performance, followed by Analyst Sentiment. Stock selection was weakest in the Industrials sector and strongest in the Materials and Utilities sectors during the period. With respect to country selection, stock selection was weakest in Japan and strongest in Germany. |
3
PORTFOLIO RESULTS
| |
| Although the Fund has underperformed in the last six months, we maintain a strong belief in an economically based, statistically proven, quantitatively driven process. To help us attempt to improve long-term returns, we have introduced a series of enhancements to our model, including the addition of new factors, modifications to existing factors, and the development of sector-specific factors. We regard many of the factors that we have implemented as more proprietary in nature and therefore less likely to become “crowded.” This should help us reduce our reliance on factors that have become more commonplace and allow us to migrate our models over time to unique return opportunities. In addition, we recently enhanced our trading methodology to allow for frequent rebalancing, which should help us incorporate relevant financial data into our models while continuing to keep transaction costs as low as possible. We believe that by rebalancing our portfolios on a more frequent basis, we may be able to achieve timely exposure to our investment themes and to better exploit shorter-lived information sources, thereby seeking to improve long-term results. |
| |
| Quantitative investing has become extremely popular in recent times. To be successful in the future, we believe quantitative managers should be acutely aware of other managers, be nimble in terms of trading, and employ proprietary models. At Goldman Sachs, we believe that we have the resources, experience and expertise that are necessary to succeed in these challenging times. Our team and Goldman Sachs are committed to doing everything we can to seek better performance in the future. We thank you for your investment and will work to earn your continued confidence. |
| |
| |
| Goldman Sachs Quantitative Investment Strategies Team |
| |
| New York, May 22, 2008 |
4
FUND BASICS
Structured International Equity Flex Fund
as of April 30, 2008
| | | | | | | | | | | |
| November 1, 2007–April 30, 2008 | | Fund Total Return (based on NAV)1 | | MSCI EAFE Index (net)2 | | |
| |
| Class A | | | -12.50 | % | | | -9.21 | % | | |
| Class C | | | -12.80 | | | | -9.21 | | | |
| Institutional | | | -12.30 | | | | -9.21 | | | |
| |
| | | | | | | | | | | |
| November 30, 2007–April 30, 2008 |
| |
| Class IR | | | -7.02 | % | | | -6.12 | % | | |
| Class R | | | -7.19 | | | | -6.12 | | | |
| |
| |
| 1 | The net asset value (“NAV”) represents the net assets of the class of the Fund (ex-dividend) divided by the total number of shares of the class outstanding. The Fund’s performance reflects the reinvestment of dividends and other distributions. The Fund’s performance does not reflect the deduction of any applicable sales charges. |
| |
| 2 | The unmanaged MSCI EAFE Index (unhedged and net of dividend withholding taxes) is a market capitalization-weighted composite of securities in 21 developed markets. The Index is unmanaged and the figures for the Index do not include any deduction for fees, expenses or taxes. It is not possible to invest directly in an unmanaged index. |
| STANDARDIZED AVERAGE ANNUAL TOTAL RETURNS3 |
| | | | | | | | | | | | | |
| For the period ended 3/31/08 | | One Year | | Since Inception | | Inception Date | | |
| |
| Class A | | | -12.78 | % | | | 3.07 | % | | 7/31/06 | | |
| Class C | | | -10.22 | | | | 5.27 | | | 7/31/06 | | |
| Institutional | | | -8.32 | | | | 6.39 | | | 7/31/06 | | |
| Class IR | | | N/A | | | | -10.75 | | | 11/30/07 | | |
| Class R | | | N/A | | | | -10.84 | | | 11/30/07 | | |
| |
| |
| 3 | The Standardized Total Returns are average annual total returns as of the most recent calendar quarter-end except for Class IR and R Shares, which are cumulative total returns. They assume reinvestment of all distributions at NAV. These returns reflect a maximum initial sales charge of 5.5% for Class A Shares and the assumed contingent deferred sales charge for Class C Shares (1% if redeemed within 12 months of purchase). Because Institutional, Class IR and R Shares do not involve a sales charge, such a charge is not applied to their Standardized Average Annual Total Returns. The Fund will charge a 2% redemption fee on the redemption of shares (including by exchange) held for 30 calendar days or less. The performance figures do not reflect the deduction of the redemption fee. If reflected, the redemption fee would reduce the performance quoted. |
The returns represent past performance. Past performance does not guarantee future results. The Fund’s investment return and principal value will fluctuate so that an investor’s shares, when redeemed, may be worth more or less than their original cost. Current performance may be lower or higher than the performance quoted above. Please visit our Web site at: www.goldmansachsfunds.com to obtain the most recent month-end returns. Performance reflects expense limitations in effect. In their absence, performance would be reduced. Returns do not reflect the deduction of taxes that a shareholder would pay on Fund distributions or the redemption of Fund shares.
5
FUND BASICS
| | | | | | | | | | | |
| | | Net Expense Ratio (Current) | | Gross Expense Ratio (Before Waivers) | | |
| |
| Class A | | | 1.60 | % | | | 1.90 | % | | |
| Class C | | | 2.35 | | | | 2.65 | | | |
| Institutional | | | 1.20 | | | | 1.50 | | | |
| Class IR | | | 1.25 | | | | 1.65 | | | |
| Class R | | | 1.75 | | | | 2.15 | | | |
| |
| |
| 4 | The expense ratios of the Fund, both current (net of applicable fee waivers and/or expense limitations) and before waivers (gross of applicable fee waivers and/or expense limitations), are as set forth above according to the most recent publicly available Prospectuses for the Fund and may differ from the expense ratios disclosed in the Financial Highlights in this report. Applicable waivers and expense limitations are voluntary and may be modified or terminated at any time at the option of the Investment Adviser. If this occurs, the expense ratios may change without shareholder approval. |
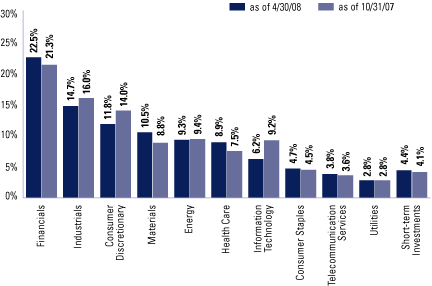
Percentage of Net Assets
| |
| 5 | The percentage shown for each investment category reflects the value of investments in that category as a percentage of net assets. Short-term investments represent repurchase agreements and securities lending collateral, if any. Figures in the above graph may not sum to 100% due to the exclusion of other assets and liabilities. |
6
FUND BASICS
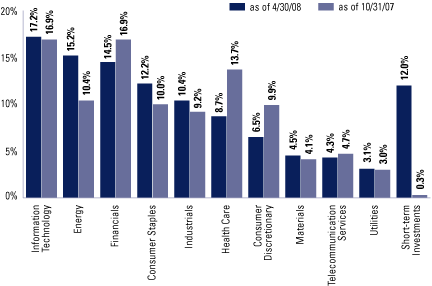
| TOP 10 OVERWEIGHTS AS OF 4/30/086 |
| | | | | | | |
| | | Portfolio Weighting | | |
| Company | | Relative to Benchmark | | Line of Business |
| |
| Repsol YPF SA | | | +2.5 | % | | Energy |
| BASF AG | | | +2.3 | | | Materials |
| Sanofi-Aventis | | | +2.2 | | | Health Care |
| Zurich Financial Services AG | | | +2.0 | | | Financials |
| Muenchener Rueckversicherungs AG | | | +2.0 | | | Financials |
| Vivendi SA | | | +1.8 | | | Consumer Discretionary |
| Cie de Saint-Gobain | | | +1.8 | | | Industrials |
| Svenska Handelsbanken | | | +1.8 | | | Financials |
| Deutsche Bank AG | | | +1.7 | | | Financials |
| Deutsche Lufthansa AG | | | +1.5 | | | Industrials |
| |
| |
| 6 | If a stock holding comprises a larger proportion of the Fund’s portfolio when compared to its proportionate position in the benchmark, it is considered an overweight. Conversely, when a stock holding comprises a smaller proportion of the Fund’s portfolio compared to its proportionate position in the benchmark, the stock is considered an underweight. The top 10 overweights may not be representative of the Fund’s future investments. |
| TOP 10 UNDERWEIGHTS AS OF 4/30/087 |
| | | | | | | |
| | | Portfolio Weighting | | |
| Company | | Relative to Benchmark | | Line of Business |
| |
| GlaxoSmithKline PLC | | | -0.9 | % | | Health Care |
| Roche Holding AG | | | -0.8 | | | Health Care |
| Telefonica SA | | | -0.8 | | | Telecommunication Services |
| Toyota Motor Corp | | | -0.7 | | | Consumer Discretionary |
| Nestle SA | | | -0.5 | | | Consumer Staples |
| HSBC Holdings PLC | | | -0.5 | | | Financials |
| Commonwealth Bank of Australia | | | -0.4 | | | Financials |
| UniCredito Italiano SpA | | | -0.4 | | | Financials |
| Nintendo Co., Ltd. | | | -0.3 | | | Information Technology |
| Volkswagen AG | | | -0.2 | | | Consumer Discretionary |
| |
| |
| 7 | If a stock holding comprises a larger proportion of the Fund’s portfolio when compared to its proportionate position in the benchmark, it is considered an overweight. Conversely, when a stock holding comprises a smaller proportion of the Fund’s portfolio compared to its proportionate position in the benchmark, the stock is considered an underweight. The top 10 underweights may not be representative of the Fund’s future investments. |
7
PORTFOLIO RESULTS
Structured U.S. Equity Flex Fund
Dear Shareholder,
This report provides an overview of the performance of the Goldman Sachs Structured U.S. Equity Flex Fund (the “Fund”) during the six-month reporting period that ended April 30, 2008.
Performance Review
| |
| Over the six-month period that ended April 30, 2008, the Fund’s Class A, C, and Institutional Shares generated cumulative total returns, without sales charges, of -11.42%, -11.71%, and -11.20%, respectively. These returns compare to a cumulative total return of -9.64% on the Fund’s benchmark, the S&P 500 Index (with dividends reinvested), over the same time period. In the period since their inception through April 30, 2008, the Fund’s Class IR and R Shares generated cumulative total returns of -5.76% and -5.97%, respectively, versus -5.69% for the Fund’s Index over the same time period. |
| |
| The Fund uses a model that is based on six investment themes — Valuation, Profitability, Earnings Quality, Management Impact, Momentum and Analyst Sentiment. The Valuation theme attempts to capture potential mispricings of securities, typically by comparing a measure of the company’s intrinsic value to its market value. Profitability assesses whether the company is earning more than its cost of capital. Earnings Quality evaluates whether the company’s earnings are coming from more persistent, cash-based sources, as opposed to accruals. Management Impact assesses the company’s management strategy and behavior. Momentum predicts drift in stock prices caused by under-reaction to company-specific information. Finally, the Analyst Sentiment theme looks at how Wall Street analysts’ views about a company’s earnings and prospects are changing over time. |
Portfolio Positioning and Highlights
| |
| The Fund’s performance was disappointing over the last six months, a period in which the market environment was challenging for quantitative strategies generally. We believe that we are still experiencing the continued effects of the “crowding” that characterized the previous 12 to 18 months. (Crowding is a phenomenon in which quantitative managers look for similar stock traits using similar investment themes.) Crowding came to a head in August 2007 as a result of the quant liquidity crunch in which many portfolio managers utilizing quantitative strategies tried to reduce their exposure to equities — the same stocks — simultaneously. The ensuing sell-off, which continued — albeit muted — into September and through the fourth quarter (particularly during November 2007) adversely affected our investment themes, resulting in underperformance by the Fund through the end of the year. Any news that increased market volatility seemed to have a disproportionately negative impact on the Fund and our quantitative factors during the reporting period. The impact of crowding abated somewhat among this universe of stocks as the year turned, and the Fund’s returns were higher than those of the benchmark earlier in the reporting period. |
| |
| Our Profitability investment themes detracted the most from the Fund’s relative performance, followed by Management Impact. Stock selection was weakest in the Health Care and Consumer Discretionary sectors and strongest in the Materials sector during the period. |
8
PORTFOLIO RESULTS
| |
| Although the Fund has underperformed in the last six months, we maintain a strong belief in an economically based, statistically proven, quantitatively driven process. To help us attempt to improve long-term returns, we have introduced a series of enhancements to our model, including the addition of new factors, modifications to existing factors, and the development of sector-specific factors. We regard many of the factors that we have implemented as more proprietary in nature and therefore less likely to become “crowded.” This should help us reduce our reliance on factors that have become more commonplace and allow us to migrate our models over time to unique return opportunities. In addition, we recently enhanced our trading methodology to allow for frequent rebalancing, which should help us incorporate relevant financial data into our models while continuing to keep transaction costs as low as possible. We believe that by rebalancing our portfolios on a more frequent basis, we may be able to achieve timely exposure to our investment themes and to better exploit shorter-lived information sources, thereby seeking to improve long-term results. |
| |
| Quantitative investing has become extremely popular in recent times. To be successful in the future, we believe quantitative managers should be acutely aware of other managers, be nimble in terms of trading, and employ proprietary models. At Goldman Sachs, we believe that we have the resources, experience and expertise that are necessary to succeed in these challenging times. Our team and Goldman Sachs are committed to doing everything we can to seek better performance in the future. We thank you for your investment and will work to earn your continued confidence. |
| |
| |
| Goldman Sachs Quantitative Investment Strategies Team |
| |
| New York, May 22, 2008 |
9
FUND BASICS
Structured U.S. Equity Flex Fund
as of April 30, 2008
| | | | | | | | | | | |
| November 1, 2007–April 30, 2008 | | Fund Total Return (based on NAV)1 | | S&P 500 Index2 | | |
| |
| Class A | | | -11.42 | % | | | -9.64 | % | | |
| Class C | | | -11.71 | | | | -9.64 | | | |
| Institutional | | | -11.20 | | | | -9.64 | | | |
| |
| | | | | | | | | | | |
| November 30, 2007–April 30, 2008 |
| |
| Class IR | | | -5.76 | % | | | -5.69 | % | | |
| Class R | | | -5.97 | | | | -5.69 | | | |
| |
| |
| 1 | The net asset value (“NAV”) represents the net assets of the class of the Fund (ex-dividend) divided by the total number of shares of the class outstanding. The Fund’s performance reflects the reinvestment of dividends and other distributions. The Fund’s performance does not reflect the deduction of any applicable sales charges. |
| |
| 2 | The S&P 500 Index is the Standard & Poor’s 500 Composite Index of 500 stocks, an unmanaged index of common stock prices. The Index is unmanaged and the figures for the Index do not include any deduction for fees, expenses or taxes. It is not possible to invest directly in an unmanaged index. |
| STANDARDIZED AVERAGE ANNUAL TOTAL RETURNS3 |
| | | | | | | | | | | | | |
| For the period ended 3/31/08 | | One Year | | Since Inception | | Inception Date | | |
| |
| Class A | | | -18.54 | % | | | -11.61 | % | | 9/29/06 | | |
| Class C | | | -15.31 | | | | -8.94 | | | 9/29/06 | | |
| Institutional | | | -13.52 | | | | -7.92 | | | 9/29/06 | | |
| Class IR | | | N/A | | | | -9.77 | | | 11/30/07 | | |
| Class R | | | N/A | | | | -9.98 | | | 11/30/07 | | |
| |
| |
| 3 | The Standardized Total Returns are average annual total returns as of the most recent calendar quarter-end except for Class IR and R Shares, which are cumulative total returns. They assume reinvestment of all distributions at NAV. These returns reflect a maximum initial sales charge of 5.5% for Class A Shares and the assumed contingent deferred sales charge for Class C Shares (1% if redeemed within 12 months of purchase). Because Institutional, Class IR and R Shares do not involve a sales charge, such a charge is not applied to their Standardized Average Annual Total Returns. The Fund will charge a 2% redemption fee on the redemption of shares (including by exchange) held for 30 calendar days or less. The performance figures do not reflect the deduction of the redemption fee. If reflected, the redemption fee would reduce the performance quoted. |
The returns represent past performance. Past performance does not guarantee future results. The Fund’s investment return and principal value will fluctuate so that an investor’s shares, when redeemed, may be worth more or less than their original cost. Current performance may be lower or higher than the performance quoted above. Please visit our Web site at: www.goldmansachsfunds.com to obtain the most recent month-end returns. Performance reflects expense limitations in effect. In their absence, performance would be reduced. Returns do not reflect the deduction of taxes that a shareholder would pay on Fund distributions or the redemption of Fund shares.
10
FUND BASICS
| | | | | | | | | | | |
| | | Net Expense Ratio (Current) | | Gross Expense Ratio (Before Waivers) | | |
| |
| Class A | | | 1.88 | % | | | 2.61 | % | | |
| Class C | | | 2.63 | | | | 3.36 | | | |
| Institutional | | | 1.48 | | | | 2.21 | | | |
| Class IR | | | 1.63 | | | | 2.36 | | | |
| Class R | | | 2.13 | | | | 2.86 | | | |
| |
| |
| 4 | The expense ratios of the Fund, both current (net of applicable fee waivers and/or expense limitations) and before waivers (gross of applicable fee waivers and/or expense limitations), are as set forth above according to the most recent publicly available Prospectuses for the Fund and may differ from the expense ratios disclosed in the Financial Highlights in this report. Applicable waivers and expense limitations are voluntary and may be modified or terminated at any time at the option of the Investment Adviser. If this occurs, the expense ratios may change without shareholder approval. |
Percentage of Net Assets
| |
| 5 | The percentage shown for each investment category reflects the value of investments in that category as a percentage of net assets. Short-term investments represent repurchase agreements and securities lending collateral, if any. Figures in the above graph may not sum to 100% due to the exclusion of other assets and liabilities. |
11
FUND BASICS
| TOP 10 OVERWEIGHTS AS OF 4/30/086 |
| | | | | | | |
| | | Portfolio Weighting | | |
| Company | | Relative to Benchmark | | Line of Business |
| |
| Exxon Mobil Corp. | | | +8.3 | % | | Energy |
| Pfizer, Inc. | | | +5.7 | | | Health Care |
| Microsoft Corp. | | | +5.4 | | | Information Technology |
| Texas Instruments, Inc. | | | +4.9 | | | Information Technology |
| Northrop Grumman Corp. | | | +4.5 | | | Industrials |
| Embarq Corp. | | | +4.1 | | | Telecommunication Services |
| Bank of America Corp. | | | +3.5 | | | Financials |
| Anadarko Petroleum Corp. | | | +3.1 | | | Energy |
| Amgen, Inc. | | | +3.0 | | | Health Care |
| GameStop Corp. | | | +3.0 | | | Consumer Discretionary |
| |
| |
| 6 | If a stock holding comprises a larger proportion of the Fund’s portfolio when compared to its proportionate position in the benchmark, it is considered an overweight. Conversely, when a stock holding comprises a smaller proportion of the Fund’s portfolio compared to its proportionate position in the benchmark, the stock is considered an underweight. The top 10 overweights may not be representative of the Fund’s future investments. |
| TOP 10 UNDERWEIGHTS AS OF 4/30/087 |
| | | | | | | | | |
| | | Portfolio Weighting | | | | |
| Company | | Relative to Benchmark | | Line of Business | | |
| |
| Kohl’s Corp. | | | -4.5 | % | | Consumer Discretionary | | |
| AMAG Pharmaceuticals, Inc. | | | -2.4 | | | Health Care | | |
| Limited Brands, Inc. | | | -1.9 | | | Consumer Discretionary | | |
| SLM Corp. | | | -1.6 | | | Financials | | |
| Tenet Healthcare Corp. | | | -1.5 | | | Health Care | | |
| Aircastle Ltd | | | -1.4 | | | Industrials | | |
| Akamai Technologies, Inc. | | | -1.2 | | | Information Technology | | |
| MedCath Corp. | | | -1.1 | | | Health Care | | |
| inVentiv Health Inc. | | | -1.1 | | | Health Care | | |
| General Motors Corp. | | | -1.1 | | | Consumer Discretionary | | |
| |
| |
| 7 | If a stock holding comprises a larger proportion of the Fund’s portfolio when compared to its proportionate position in the benchmark, it is considered an overweight. Conversely, when a stock holding comprises a smaller proportion of the Fund’s portfolio compared to its proportionate position in the benchmark, the stock is considered an underweight. The top 10 underweights may not be representative of the Fund’s future investments. |
12
GOLDMAN SACHS STRUCTURED INTERNATIONAL EQUITY FLEX FUND
Schedule of Investments
April 30, 2008 (Unaudited)
| | | | | | | | | | | |
| | | Shares | | Description | | Value |
| | |
Common Stocks – 93.9% |
| |
| | | Australia – 8.4% |
| | | | 8,113 | | | AGL Energy Ltd. (Multi-Utilities) | | $ | 95,427 | |
| | | | 15,939 | | | Amcor Ltd. (Containers & Packaging) | | | 101,338 | |
| | | | 92,869 | | | Ansell Ltd. (Health Care Equipment & Supplies) | | | 1,005,076 | |
| | | | 34,445 | | | ASX Ltd. (Diversified Financial Services) | | | 1,167,101 | |
| | | | 62,346 | | | BHP Billiton Ltd.(a) (Metals & Mining) | | | 2,513,270 | |
| | | | 241,112 | | | BlueScope Steel Ltd. (Metals & Mining) | | | 2,515,144 | |
| | | | 354,670 | | | Centennial Coal Co. Ltd.(b) (Oil, Gas & Consumable Fuels) | | | 1,520,249 | |
| | | | 21,085 | | | Commonwealth Bank of Australia (Commercial Banks) | | | 888,818 | |
| | | | 715,820 | | | Commonwealth Property Office Fund (REIT) | | | 946,169 | |
| | | | 29,456 | | | Computershare Ltd. (IT Services) | | | 247,424 | |
| | | | 201,879 | | | Harvey Norman Holdings Ltd. (Multiline Retail) | | | 684,365 | |
| | | | 7,055 | | | Incitec Pivot Ltd.(a) (Chemicals) | | | 1,073,185 | |
| | | | 3,912 | | | Leighton Holdings Ltd. (Construction & Engineering) | | | 173,026 | |
| | | | 3,640 | | | Macquarie Infrastructure Group (Transportation Infrastructure) | | | 9,707 | |
| | | | 471,096 | | | Macquarie Office Trust (REIT) | | | 454,520 | |
| | | | 28,312 | | | National Australia Bank Ltd. (Commercial Banks) | | | 801,599 | |
| | | | 625,431 | | | Qantas Airways Ltd. (Airlines) | | | 1,998,773 | |
| | | | 85,652 | | | QBE Insurance Group Ltd.(a) (Insurance) | | | 2,051,775 | |
| | | | 36,217 | | | Seven Network Ltd. (Media) | | | 316,731 | |
| | | | 23,030 | | | Stockland (REIT) | | | 156,860 | |
| | | | 7,760 | | | Tabcorp Holdings Ltd. (Hotels, Restaurants & Leisure) | | | 83,281 | |
| | | | 13,646 | | | Westpac Banking Corp. (Commercial Banks) | | | 314,288 | |
| | | | 6,756 | | | Woodside Petroleum Ltd. (Oil, Gas & Consumable Fuels) | | | 355,806 | |
| | | | 62,713 | | | Woolworths Ltd.(a) (Food & Staples Retailing) | | | 1,693,335 | |
| | | | | | | | | | | |
| | | | | | | | | | 21,167,267 | |
| | | |
| | | Austria – 0.7% |
| | | | 7,756 | | | EVN AG (Electric Utilities) | | | 254,461 | |
| | | | 21,487 | | | OMV AG(a) (Oil, Gas & Consumable Fuels) | | | 1,613,892 | |
| | | | | | | | | | | |
| | | | | | | | | | 1,868,353 | |
| | | |
| | | Belgium – 1.6% |
| | | | 1 | | | Banque Nationale de Belgique (Diversified Financial Services) | | | 4,658 | |
| | | | 8,204 | | | Bekaert NV (Electrical Equipment) | | | 1,233,461 | |
| | | | 5 | | | Cofinimmo (REIT) | | | 1,072 | |
| | | | 9,230 | | | KBC GROEP NV (Commercial Banks) | | | 1,242,402 | |
| | | | 33,584 | | | Tessenderlo Chemie NV(a) (Chemicals) | | | 1,575,166 | |
| | | | | | | | | | | |
| | | | | | | | | | 4,056,759 | |
| | | |
| | | Denmark – 1.7% |
| | | | 2,250 | | | Danisco A/S (Food Products) | | | 151,230 | |
| | | | 17,225 | | | East Asiatic Co. Ltd. A/S (A/S Det Ostasiatiske Kompagni)(a) (Food Products) | | | 1,522,444 | |
| | | | 50,500 | | | H. Lundbeck A/S(b) (Pharmaceuticals) | | | 1,244,536 | |
| | | | 12,150 | | | Vestas Wind Systems A/S* (Electrical Equipment) | | | 1,317,340 | |
| | | | | | | | | | | |
| | | | | | | | | | 4,235,550 | |
| | | |
| | | Finland – 1.9% |
| | | | 338 | | | Amer Sports Oyj (Leisure Equipment & Products) | | | 5,882 | |
| | | | 90,908 | | | Nokia Oyj(c) (Communications Equipment) | | | 2,733,079 | |
| | | | 26,728 | | | Outokumpu Oyj (Metals & Mining) | | | 1,263,741 | |
| | | | 6,637 | | | Outotec Oyj (Construction & Engineering) | | | 413,437 | |
| | | | 16,226 | | | TietoEnator Oyj(a) (IT Services) | | | 422,938 | |
| | | | | | | | | | | |
| | | | | | | | | | 4,839,077 | |
| | | |
| | | France – 12.2% |
| | | | 34,937 | | | Arkema* (Chemicals) | | | 2,007,441 | |
| | | | 22,474 | | | BNP Paribas(a) (Commercial Banks) | | | 2,395,835 | |
| | | | 6,957 | | | Bongrain SA (Food Products) | | | 681,465 | |
| | | | 10,762 | | | Christian Dior SA (Textiles, Apparel & Luxury Goods) | | | 1,229,440 | |
| | | | 2,316 | | | EDF Energies Nouvelles SA(b) (Independent Power Producers & Energy Traders) | | | 155,525 | |
| | | | 19 | | | Faiveley SA (Electronic Equipment & Instruments) | | | 1,318 | |
| | | | 80,594 | | | France Telecom SA (Diversified Telecommunication Services) | | | 2,521,860 | |
| | | | 23,852 | | | Gaz de France (Gas Utilities) | | | 1,564,339 | |
| | | | 431 | | | Lafarge SA (Construction Materials) | | | 77,282 | |
| | | | 1,820 | | | Laurent-Perrier (Beverages) | | | 263,485 | |
| | | | 916 | | | Pierre & Vacances (Hotels, Restaurants & Leisure) | | | 100,538 | |
| | | | 78 | | | Rubis (Gas Utilities) | | | 6,942 | |
| | | | 72,879 | | | Sanofi-Aventis(a) (Pharmaceuticals) | | | 5,617,594 | |
| | | | 93,645 | | | Total SA(a) (Oil, Gas & Consumable Fuels) | | | 7,844,273 | |
| | | | 81 | | | Unibail-Rodamco (REIT) | | | 20,803 | |
| | | | 160,838 | | | Vivendi SA(a) (Media) | | | 6,484,579 | |
| | | | | | | | | | | |
| | | | | | | | | | 30,972,719 | |
| | | |
The accompanying notes are an integral part of these financial statements.
13
GOLDMAN SACHS STRUCTURED INTERNATIONAL EQUITY FLEX FUND
Schedule of Investments (continued)
April 30, 2008 (Unaudited)
| | | | | | | | | | | |
| | | Shares | | Description | | Value |
| | |
Common Stocks – (continued) |
| |
| | | Germany – 9.0% |
| | | | 31,035 | | | BASF AG(a) (Chemicals) | | $ | 4,412,186 | |
| | | | 31,539 | | | Bechtle AG(a) (IT Services) | | | 1,028,719 | |
| | | | 46,984 | | | Daimler AG (Automobiles) | | | 3,653,314 | |
| | | | 11,072 | | | Deutsche Beteiligungs AG(a) (Capital Markets) | | | 275,007 | |
| | | | 32,140 | | | Deutsche Boerse AG (Diversified Financial Services) | | | 4,674,028 | |
| | | | 28,815 | | | Deutsche Lufthansa AG(a) (Airlines) | | | 754,937 | |
| | | | 3,303 | | | Gildemeister AG (Machinery) | | | 96,475 | |
| | | | 1,643 | | | KWS Saat AG (Food Products) | | | 354,438 | |
| | | | 3,390 | | | Linde AG (Chemicals) | | | 494,140 | |
| | | | 32,904 | | | Muenchener Rueckversicherungs-Gesellschaft AG(a) (Insurance) | | | 6,339,238 | |
| | | | 1,526 | | | Solarworld AG (Electrical Equipment) | | | 81,049 | |
| | | | 1,881 | | | Volkswagen AG (Automobiles) | | | 553,855 | |
| | | | | | | | | | | |
| | | | | | | | | | 22,717,386 | |
| | | |
| | | Greece – 0.8% |
| | | | 35 | | | Babis Vovos International Construction SA* (Real Estate Management & Development) | | | 1,064 | |
| | | | 6,985 | | | EYDAP Athens Water Supply and Sewage Company SA (Water Utilities) | | | 116,946 | |
| | | | 12,837 | | | Gr. Sarantis SA (Personal Products) | | | 219,176 | |
| | | | 36,591 | | | Hellenic Petroleum SA (Oil, Gas & Consumable Fuels) | | | 552,919 | |
| | | | 8,686 | | | Iaso SA (Health Care Providers & Services) | | | 128,185 | |
| | | | 1,743 | | | National Bank of Greece SA (Commercial Banks) | | | 95,873 | |
| | | | 19,365 | | | Public Power Corp. SA (Electric Utilities) | | | 815,057 | |
| | | | | | | | | | | |
| | | | | | | | | | 1,929,220 | |
| | | |
| | | Hong Kong – 1.8% |
| | | | 170,000 | | | BOC Hong Kong (Holdings) Ltd. (Commercial Banks) | | | 440,893 | |
| | | | 109,000 | | | Chinese Estates Holdings Ltd. (Real Estate Management & Development) | | | 171,470 | |
| | | | 37,800 | | | Esprit Holdings Ltd. (Specialty Retail) | | | 465,974 | |
| | | | 63,000 | | | Hang Lung Group Ltd. (Real Estate Management & Development) | | | 339,042 | |
| | | | 7,000 | | | Hang Lung Properties Ltd. (Real Estate Management & Development) | | | 28,463 | |
| | | | 12,800 | | | Hang Seng Bank Ltd. (Commercial Banks) | | | 255,722 | |
| | | | 41,000 | | | Hong Kong & China Gas Co. Ltd. (Gas Utilities) | | | 119,828 | |
| | | | 57,500 | | | Hong Kong Electric Holdings Ltd. (Electric Utilities) | | | 361,544 | |
| | | | 11,500 | | | Hong Kong Exchanges & Clearing Ltd. (Diversified Financial Services) | | | 235,297 | |
| | | | 43,000 | | | Hutchison Whampoa Ltd. (Industrial Conglomerates) | | | 420,211 | |
| | | | 3,000 | | | Hysan Development Co. Ltd. (Real Estate Management & Development) | | | 8,703 | |
| | | | 50,500 | | | Kingboard Chemical Holdings Ltd. (Electronic Equipment & Instruments) | | | 237,981 | |
| | | | 44,000 | | | New World Development Co. Ltd. (Real Estate Management & Development) | | | 113,709 | |
| | | | 44,500 | | | Orient Overseas International Ltd. (Marine) | | | 247,519 | |
| | | | 93,000 | | | Pacific Basin Shipping Ltd. (Marine) | | | 170,206 | |
| | | | 4,000 | | | Parkson Retail Group Ltd. (Multiline Retail) | | | 37,801 | |
| | | | 6,000 | | | Shangri-La Asia Ltd. (Hotels, Restaurants & Leisure) | | | 16,568 | |
| | | | 5,000 | | | Sun Hung Kai Properties Ltd. (Real Estate Management & Development) | | | 87,383 | |
| | | | 1,500 | | | Swire Pacific Ltd. (Real Estate Management & Development) | | | 17,545 | |
| | | | 3,600 | | | Tencent Holdings Ltd. (Internet Software & Services) | | | 23,809 | |
| | | | 40,992 | | | The Link (REIT) | | | 99,187 | |
| | | | 73,000 | | | The Wharf (Holdings) Ltd. (Real Estate Management & Development) | | | 368,708 | |
| | | | 110,000 | | | Tingyi (Cayman Islands) Holding Corp. (Food Products) | | | 146,283 | |
| | | | 30,000 | | | Wheelock & Co. Ltd. (Real Estate Management & Development) | | | 93,822 | |
| | | | | | | | | | | |
| | | | | | | | | | 4,507,668 | |
| | | |
| | | Ireland – 0.7% |
| | | | 66 | | | Anglo Irish Bank Corp. PLC (Commercial Banks) | | | 897 | |
| | | | 52,937 | | | Paddy Power PLC(a) (Hotels, Restaurants & Leisure) | | | 1,858,151 | |
| | | | | | | | | | | |
| | | | | | | | | | 1,859,048 | |
| | | |
| | | Italy – 2.3% |
| | | | 1,958 | | | Banco di Desio e della Brianza SpA (Commercial Banks) | | | 20,602 | |
| | | | 47,927 | | | Cremonini SpA (Food Products) | | | 222,571 | |
| | | | 27,463 | | | Finmeccanica SpA(a)
(Aerospace & Defense) | | | 952,578 | |
| | | | 1,254 | | | Fondiaria-Sai SpA (Insurance) | | | 50,234 | |
| | | |
The accompanying notes are an integral part of these financial statements.
14
GOLDMAN SACHS STRUCTURED INTERNATIONAL EQUITY FLEX FUND
| | | | | | | | | | | |
| | | Shares | | Description | | Value |
| | |
Common Stocks – (continued) |
| |
| | | Italy – (continued) |
| | | | 4,184 | | | I.M.A. Industria Macchine Automatiche SpA (Machinery) | | $ | 88,201 | |
| | | | 178,165 | | | Intesa Sanpaolo (Commercial Banks) | | | 1,324,458 | |
| | | | 43,918 | | | Marr SpA (Food & Staples Retailing) | | | 462,692 | |
| | | | 463,118 | | | Parmalat SpA (Food Products) | | | 1,576,537 | |
| | | | 496,889 | | | Pirelli & C. SpA* (Industrial Conglomerates) | | | 404,594 | |
| | | | 45,793 | | | Snam Rete Gas SpA (Gas Utilities) | | | 289,420 | |
| | | | 194,963 | | | Telecom Italia SpA (Diversified Telecommunication Services) | | | 407,735 | |
| | | | | | | | | | | |
| | | | | | | | | | 5,799,622 | |
| | | |
| | | Japan – 26.6% |
| | | | 44,700 | | | Aloka Co. Ltd. (Health Care Equipment & Supplies) | | | 565,739 | |
| | | | 123,000 | | | AMADA Co. Ltd. (Machinery) | | | 1,030,235 | |
| | | | 73,100 | | | Aoyama Trading Co. Ltd. (Specialty Retail) | | | 1,659,333 | |
| | | | 10,000 | | | Arcs Co. Ltd. (Food & Staples Retailing) | | | 140,934 | |
| | | | 372,000 | | | Asahi Kasei Corp. (Chemicals) | | | 2,114,400 | |
| | | | 10,900 | | | Asatsu-DK, Inc. (Media) | | | 330,368 | |
| | | | 70,100 | | | Astellas Pharma, Inc. (Pharmaceuticals) | | | 2,885,625 | |
| | | | 2,200 | | | Autobacs Seven Co. Ltd. (Specialty Retail) | | | 57,488 | |
| | | | 3,400 | | | BML, Inc. (Health Care Providers & Services) | | | 58,269 | |
| | | | 28,100 | | | Brother Industries Ltd. (Office Electronics) | | | 366,476 | |
| | | | 16,200 | | | CAC Corp. (IT Services) | | | 170,915 | |
| | | | 15,800 | | | Canon Finetech, Inc. (Office Electronics) | | | 225,632 | |
| | | | 20,000 | | | Canon Marketing Japan, Inc. (Distributors) | | | 388,513 | |
| | | | 78 | | | Central Japan Railway Co.
(Road & Rail) | | | 765,683 | |
| | | | 57,100 | | | Coca-Cola West Holdings Co. Ltd. (Beverages) | | | 1,292,695 | |
| | | | 28,000 | | | Dai Nippon Printing Co. Ltd. (Commercial Services & Supplies) | | | 430,971 | |
| | | | 19,200 | | | Daiichi Sankyo Co. Ltd. (Pharmaceuticals) | | | 529,040 | |
| | | | 1,000 | | | Dainippon Sumitomo Pharma Co. Ltd. (Pharmaceuticals) | | | 7,672 | |
| | | | 38,900 | | | Daiwasystem Co. Ltd.(a) (Real Estate Management & Development) | | | 460,056 | |
| | | | 30,400 | | | Duskin Co. Ltd. (Specialty Retail) | | | 516,873 | |
| | | | 80,500 | | | Fuyo General Lease Co. Ltd.(a) (Diversified Financial Services) | | | 2,491,435 | |
| | | | 32,800 | | | Glory Ltd. (Machinery) | | | 738,784 | |
| | | | 27,300 | | | Hitachi Transport System Ltd. (Road & Rail) | | | 326,814 | |
| | | | 104,300 | | | Honda Motor Co. Ltd.(a) (Automobiles) | | | 3,328,880 | |
| | | | 71 | | | IT Holdings Corp.* (IT Services) | | | 1,468 | |
| | | | 13,700 | | | Itochu-Shokuhin Co. Ltd.
(Food & Staples Retailing) | | | 404,400 | |
| | | | 23 | | | Japan Real Estate Investment Corp. (REIT) | | | 272,644 | |
| | | | 25,000 | | | JFE Shoji Holdings, Inc. (Trading Companies & Distributors) | | | 194,247 | |
| | | | 1,409 | | | K.K. DaVinci Advisors* (Real Estate Management & Development) | | | 1,351,984 | |
| | | | 6,600 | | | Kanematsu Electronics Ltd. (Electronic Equipment & Instruments) | | | 50,341 | |
| | | | 4,500 | | | Kato Sangyo Co. Ltd. (Distributors) | | | 48,720 | |
| | | | 66,000 | | | Komori Corp.(a) (Machinery) | | | 1,306,195 | |
| | | | 2,000 | | | Konica Minolta Holdings, Inc. (Office Electronics) | | | 30,139 | |
| | | | 3,100 | | | Kyushu Electric Power Co., Inc. (Electric Utilities) | | | 70,562 | |
| | | | 68,800 | | | Leopalace21 Corp.(a) (Real Estate Management & Development) | | | 1,217,098 | |
| | | | 42,000 | | | Marubeni Corp. (Trading Companies & Distributors) | | | 334,282 | |
| | | | 92,000 | | | Matsushita Electric Industrial Co. Ltd. (Household Durables) | | | 2,147,343 | |
| | | | 24,400 | | | Mikuni Coca-Cola Bottling Co. Ltd.(b) (Beverages) | | | 254,246 | |
| | | | 39,000 | | | Millea Holdings, Inc. (Insurance) | | | 1,652,950 | |
| | | | 95,000 | | | Mitsui O.S.K. Lines Ltd. (Marine) | | | 1,311,658 | |
| | | | 3,900 | | | NEC Electronics Corp.* (Semiconductors & Semiconductor Equipment) | | | 79,445 | |
| | | | 9,500 | | | NEC Fielding Ltd. (IT Services) | | | 114,349 | |
| | | | 5,400 | | | Nintendo Co. Ltd. (Software) | | | 2,984,972 | |
| | | | 293,000 | | | Nippon Express Co. Ltd. (Road & Rail) | | | 1,622,886 | |
| | | | 337,000 | | | Nippon Oil Corp. (Oil, Gas & Consumable Fuels) | | | 2,322,478 | |
| | | | 491,000 | | | Nippon Sheet Glass Co. Ltd. (Building Products) | | | 2,261,996 | |
| | | | 510 | | | Nippon Telephone & Telegraph Corp. (Diversified Telecommunication Services) | | | 2,196,434 | |
| | | | 109,000 | | | Nippon Yusen Kabushiki Kaisha (Marine) | | | 1,062,550 | |
| | | | 226,800 | | | Nissan Motor Co. Ltd. (Automobiles) | | | 2,022,488 | |
| | | | 55,000 | | | Nissan Shatai Co. Ltd. (Auto Components) | | | 409,521 | |
The accompanying notes are an integral part of these financial statements.
15
GOLDMAN SACHS STRUCTURED INTERNATIONAL EQUITY FLEX FUND
Schedule of Investments (continued)
April 30, 2008 (Unaudited)
| | | | | | | | | | | |
| | | Shares | | Description | | Value |
| | |
Common Stocks – (continued) |
| |
| | | Japan – (continued) |
| | | | 596,000 | | | Nisshin Steel Co. Ltd. (Metals & Mining) | | $ | 2,210,564 | |
| | | | 30,100 | | | Nomura Real Estate Holdings, Inc. (Real Estate Management & Development) | | | 612,535 | |
| | | | 104 | | | NTT DoCoMo, Inc. (Wireless Telecommunication Services) | | | 152,756 | |
| | | | 453,000 | | | Osaka Gas Co. Ltd. (Gas Utilities) | | | 1,616,585 | |
| | | | 14,300 | | | Q.P. Corp. (Food Products) | | | 143,823 | |
| | | | 158,000 | | | Ricoh Co. Ltd. (Office Electronics) | | | 2,735,116 | |
| | | | 3,200 | | | Rohm Co. Ltd. (Semiconductors & Semiconductor Equipment) | | | 224,616 | |
| | | | 4,100 | | | Ryosan Co. Ltd. (Electronic Equipment & Instruments) | | | 91,639 | |
| | | | 6,900 | | | Sanshin Electronics Co. Ltd. (Electronic Equipment & Instruments) | | | 70,427 | |
| | | | 2,200 | | | Shikoku Electric Power Co., Inc. (Electric Utilities) | | | 62,554 | |
| | | | 5,000 | | | Shiseido Co. Ltd. (Personal Products) | | | 120,403 | |
| | | | 608,900 | | | Sojitz Corp.(a) (Trading Companies & Distributors) | | | 2,345,465 | |
| | | | 17,000 | | | Sompo Japan Insurance, Inc. (Insurance) | | | 189,412 | |
| | | | 21,600 | | | Sony Corp.(a) (Household Durables) | | | 995,858 | |
| | | | 3,900 | | | Sumitomo Corp. (Trading Companies & Distributors) | | | 52,507 | |
| | | | 33,600 | | | Sumitomo Electric Industries Ltd.(a) (Electrical Equipment) | | | 433,632 | |
| | | | 281 | | | Sumitomo Mitsui Financial Group, Inc. (Commercial Banks) | | | 2,418,118 | |
| | | | 41,800 | | | Takeda Pharmaceutical Co. Ltd.(a) (Pharmaceuticals) | | | 2,210,008 | |
| | | | 73,000 | | | Takihyo Co. Ltd. (Distributors) | | | 231,660 | |
| | | | 13,000 | | | TDK Corp. (Electronic Equipment & Instruments) | | | 888,320 | |
| | | | 96,000 | | | The Bank of Yokohama Ltd. (Commercial Banks) | | | 704,947 | |
| | | | 1,400 | | | The Kansai Electric Power Co., Inc. (Electric Utilities) | | | 33,439 | |
| | | | 3,700 | | | The Okinawa Electric Power Co., Inc. (Electric Utilities) | | | 161,591 | |
| | | | 8,800 | | | TKC Corp. (IT Services) | | | 175,550 | |
| | | | 6,600 | | | Tokyu Community Corp. (Real Estate Management & Development) | | | 144,240 | |
| | | | 1,000 | | | Toppan Printing Co. Ltd. (Commercial Services & Supplies) | | | 11,165 | |
| | | | 21,100 | | | Toyota Motor Corp.(a) (Automobiles) | | | 1,075,294 | |
| | | | 3,900 | | | Toyota Tsusho Corp. (Trading Companies & Distributors) | | | 83,814 | |
| | | | 73,700 | | | Urban Corp. (Real Estate Management & Development) | | | 406,540 | |
| | | | 4,400 | | | Warabeya Nichiyo Co. Ltd. (Food Products) | | | 59,293 | |
| | | | 4,700 | | | Zuken, Inc. (IT Services) | | | 43,907 | |
| | | | | | | | | | | |
| | | | | | | | | | 67,314,004 | |
| | | |
| | | Netherlands – 3.7% |
| | | | 3,023 | | | Corio NV (REIT) | | | 280,981 | |
| | | | 16,089 | | | Heineken Holding NV (Beverages) | | | 822,466 | |
| | | | 148,133 | | | Koninklijke (Royal) Philips Electronics NV(a) (Industrial Conglomerates) | | | 5,568,045 | |
| | | | 5,595 | | | Nieuwe Steen Investments NV (REIT) | | | 161,889 | |
| | | | 173,907 | | | Oce NV(a)(b) (Office Electronics) | | | 2,609,090 | |
| | | | | | | | | | | |
| | | | | | | | | | 9,442,471 | |
| | | |
| | | New Zealand – 0.1% |
| | | | 46,437 | | | Contact Energy Ltd. (Electric Utilities) | | | 352,007 | |
| | | |
| | | Norway – 5.0% |
| | | | 4,800 | | | Blom ASA* (IT Services) | | | 49,212 | |
| | | | 529,000 | | | Deep Sea Supply PLC*(b) (Energy Equipment & Services) | | | 2,285,285 | |
| | | | 210,400 | | | Den Norske Bank(c) (Commercial Banks) | | | 3,123,441 | |
| | | | 7,100 | | | Frontline Ltd. (Oil, Gas & Consumable Fuels) | | | 390,023 | |
| | | | 88,600 | | | Golden Ocean Group Ltd.(b) (Marine) | | | 553,033 | |
| | | | 2,400 | | | Hafslund ASA* (Electric Utilities) | | | 53,714 | |
| | | | 20,500 | | | Hafslund ASA Class B*(b) (Electric Utilities) | | | 449,741 | |
| | | | 352,860 | | | Norsk Hydro ASA(a)(b) (Metals & Mining) | | | 5,188,185 | |
| | | | 38,700 | | | TGS Nopec Geophysical Co. ASA* (Energy Equipment & Services) | | | 620,372 | |
| | | | | | | | | | | |
| | | | | | | | | | 12,713,006 | |
| | | |
| | | Portugal – 0.2% |
| | | | 3,729 | | | Banco Espirito Santo SA(a) (Commercial Banks) | | | 70,816 | |
| | | | 83,596 | | | Redes Energeticas Nacionais SA* (Multi-Utilities) | | | 445,760 | |
| | | | | | | | | | | |
| | | | | | | | | | 516,576 | |
| | | |
The accompanying notes are an integral part of these financial statements.
16
GOLDMAN SACHS STRUCTURED INTERNATIONAL EQUITY FLEX FUND
| | | | | | | | | | | |
| | | Shares | | Description | | Value |
| | |
Common Stocks – (continued) |
| |
| | | Singapore – 1.1% |
| | | | 66,000 | | | Ascendas Real Estate Investment Trust (REIT) | | $ | 125,994 | |
| | | | 8,000 | | | Capitaland Ltd. (Real Estate Management & Development) | | | 40,320 | |
| | | | 32,000 | | | DBS Group Holdings Ltd. (Commercial Banks) | | | 468,190 | |
| | | | 15,279 | | | Jardine Cycle & Carriage Ltd. (Distributors) | | | 187,542 | |
| | | | 37,000 | | | Keppel Corp. Ltd. (Industrial Conglomerates) | | | 283,240 | |
| | | | 50,000 | | | Neptune Orient Lines Ltd. (Marine) | | | 118,549 | |
| | | | 73,000 | | | Oversea-Chinese Banking Corp. Ltd. (Commercial Banks) | | | 477,505 | |
| | | | 6,000 | | | Parkway Holdings Ltd. (Health Care Providers & Services) | | | 15,584 | |
| | | | 19,340 | | | Singapore Airlines Ltd. (Airlines) | | | 227,807 | |
| | | | 3,000 | | | Singapore Exchange Ltd. (Diversified Financial Services) | | | 19,037 | |
| | | | 11,000 | | | Singapore Petroleum Co. Ltd. (Oil, Gas & Consumable Fuels) | | | 58,729 | |
| | | | 158,000 | | | Singapore Telecommunications Ltd. (Diversified Telecommunication Services) | | | 451,213 | |
| | | | 2,000 | | | Wilmar International Ltd. (Food Products) | | | 6,815 | |
| | | | 205,000 | | | Wing Tai Holdings Ltd. (Real Estate Management & Development) | | | 302,668 | |
| | | | | | | | | | | |
| | | | | | | | | | 2,783,193 | |
| | | |
| | | Spain – 4.2% |
| | | | 72,727 | | | Banco Santander SA (Commercial Banks) | | | 1,572,801 | |
| | | | 29 | | | Construcciones y Auxiliar de Ferrocarriles SA (Machinery) | | | 12,675 | |
| | | | 37,291 | | | Gamesa Corp. Tecnologica SA (Electrical Equipment) | | | 1,800,632 | |
| | | | 579,397 | | | Iberia Lineas Aereas de Espana SA (Airlines) | | | 2,275,323 | |
| | | | 88,486 | | | Mapfre SA (Insurance) | | | 448,841 | |
| | | | 103,578 | | | Repsol YPF S.A.(a) (Oil, Gas & Consumable Fuels) | | | 4,184,660 | |
| | | | 15,301 | | | Viscofan SA (Food Products) | | | 367,031 | |
| | | | | | | | | | | |
| | | | | | | | | | 10,661,963 | |
| | | |
| | | Sweden – 4.3% |
| | | | 97,700 | | | Boliden AB (Metals & Mining) | | | 1,057,183 | |
| | | | 30,000 | | | Castellum AB (Real Estate Management & Development) | | | 334,971 | |
| | | | 1,500 | | | Fabege AB (Real Estate Management & Development) | | | 13,971 | |
| | | | 5,900 | | | Hufvudstaden AB (Real Estate Management & Development) | | | 58,031 | |
| | | | 13,100 | | | Kungsleden AB(b) (Real Estate Management & Development) | | | 130,261 | |
| | | | 10,600 | | | Lennart Wallenstam Byggnads AB(b) (Real Estate Management & Development) | | | 205,719 | |
| | | | 4,200 | | | Lundin Petroleum AB* (Oil, Gas & Consumable Fuels) | | | 58,366 | |
| | | | 37,250 | | | Millicom International Cellular SA*(a) (Wireless Telecommunication Services) | | | 3,939,985 | |
| | | | 21,300 | | | NCC AB Class B (Construction & Engineering) | | | 406,588 | |
| | | | 9,500 | | | Oriflame Cosmetics SA (Personal Products) | | | 723,690 | |
| | | | 30,600 | | | Scania AB Class B (Machinery) | | | 625,218 | |
| | | | 41,800 | | | Skanska AB Class B(b) (Construction & Engineering) | | | 687,232 | |
| | | | 50,400 | | | Svenska Handelsbanken AB(a) (Commercial Banks) | | | 1,387,103 | |
| | | | 11,400 | | | Swedish Match AB(b) (Tobacco) | | | 248,394 | |
| | | | 24,050 | | | Volvo AB (Machinery) | | | 358,768 | |
| | | | 26,800 | | | Wihlborgs Fastigheter AB(b) (Real Estate Management & Development) | | | 585,811 | |
| | | | | | | | | | | |
| | | | | | | | | | 10,821,291 | |
| | | |
| | | Switzerland – 7.0% |
| | | | 71,016 | | | Actelion Ltd.*(b) (Biotechnology) | | | 3,565,324 | |
| | | | 5,392 | | | Bachem Holding AG (Life Sciences Tools & Services) | | | 492,427 | |
| | | | 4,920 | | | Bobst Group AG (Machinery) | | | 406,589 | |
| | | | 1,598 | | | Burckhardt Compression Holding AG (Machinery) | | | 512,493 | |
| | | | 7,518 | | | Compagnie Financiere Richemont SA (Textiles, Apparel & Luxury Goods) | | | 451,958 | |
| | | | 21,217 | | | Credit Suisse Group(a) (Capital Markets) | | | 1,181,509 | |
| | | | 1,665 | | | Daetwyler Holding AG* (Industrial Conglomerates) | | | 119,544 | |
| | | | 1,210 | | | Dufry Group (Specialty Retail) | | | 131,843 | |
| | | | 6,200 | | | Huber & Suhner AG (Electrical Equipment) | | | 299,486 | |
| | | | 32,552 | | | Novartis AG (Pharmaceuticals) | | | 1,640,790 | |
| | | | 289 | | | Phoenix Mecano AG (Electronic Equipment & Instruments) | | | 149,346 | |
| | | | 36,375 | | | PSP Swiss Property AG*(a) (Real Estate Management & Development) | | | 2,252,094 | |
| | | | 20,983 | | | Zurich Financial Services AG(a) (Insurance) | | | 6,359,604 | |
| | | | | | | | | | | |
| | | | | | | | | | 17,563,007 | |
| | | |
| | | United Kingdom – 0.6% |
| | | | 131,185 | | | BP PLC(c) (Oil, Gas & Consumable Fuels) | | | 1,589,657 | |
| | | |
The accompanying notes are an integral part of these financial statements.
17
GOLDMAN SACHS STRUCTURED INTERNATIONAL EQUITY FLEX FUND
Schedule of Investments (continued)
April 30, 2008 (Unaudited)
| | | | | | | | | | | |
| | | Shares | | Description | | Value |
| | |
Common Stocks – (continued) |
| |
| | | United Kingdom – (continued) |
| | | | 540 | | | Greencore Group PLC (Food Products) | | $ | 3,168 | |
| | | | | | | | | | | |
| | | | | | | | | | 1,592,825 | |
| | | |
| | | TOTAL COMMON STOCKS |
| | | (Cost $240,899,408) | | $ | 237,713,012 | |
| | | |
| | |
Preferred Stocks – 1.3% |
| |
| | | Germany – 1.3% |
| | | | 14,546 | | | Draegerwerk AG(a) (Health Care Equipment & Supplies) | | $ | 980,050 | |
| | | | 18,409 | | | Fresenius SE (Health Care Equipment & Supplies) | | | 1,520,336 | |
| | | | 5,190 | | | Jungheinrich AG (Machinery) | | | 175,993 | |
| | | | 3,053 | | | Volkswagen AG (Automobiles) | | | 501,853 | |
| | | | | | | | | | | |
| | | | | | | | | | 3,178,232 | |
| | | |
| | | TOTAL PREFERRED STOCKS |
| | | (Cost $3,494,029) | | $ | 3,178,232 | |
| | | |
| | | TOTAL INVESTMENTS BEFORE SECURITIES LENDING COLLATERAL |
| | | (Cost $244,393,437) | | $ | 240,891,244 | |
| | | |
| | | | | | | | | | | |
| | | | | Interest | | |
| | | Shares | | Rate | | Value |
| | |
Securities Lending Collateral(d) – 4.4% |
| |
| | | Boston Global Investment Trust – Enhanced Portfolio |
| | | | 11,075,320 | | | 2.642% | | $ | 11,075,320 | |
| | | (Cost $11,075,320) | | | | |
| | | |
| | | TOTAL INVESTMENTS - 99.6% |
| | | (Cost $255,468,757) | | $ | 251,966,564 | |
| | | |
| | | OTHER ASSETS IN EXCESS
OF LIABILITIES – 0.4% | | | 1,103,087 | |
| | | |
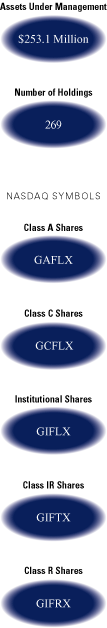
| | | NET ASSETS – 100.0% | | $ | 253,069,651 | |
| | | |
| |
| | The percentage shown for each investment category reflects the value of investments in that category as a percentage of net assets. |
| |
| * | Non-income producing security. |
| |
| (a) | All or a portion of this security is pledged as collateral for short positions within the total return swap. |
| |
| (b) | All or a portion of security is on loan. |
| |
| (c) | All or a portion of security is segregated for initial margin requirement on futures transaction. |
| |
| (d) | Variable rate security. Interest rate disclosed is that which is in effect at April 30, 2008. |
| | | | | | | |
| | | |
| | | Investment Abbreviation: |
| | | REIT | | — | | Real Estate Investment Trust |
| | | |
The accompanying notes are an integral part of these financial statements.
18
GOLDMAN SACHS STRUCTURED INTERNATIONAL EQUITY FLEX FUND
| | | | | | | | | | | |
| | | | | As a % of |
| | | | | Net Assets |
| | | | | |
| | | | | As of | | As of |
| | | | | 4/30/08 | | 10/31/07 |
| | |
Investments Industry Classifications† |
| |
| | | Aerospace & Defense | | | 0.4 | % | | | 0.7 | % |
| | | Airlines | | | 2.1 | | | | 3.4 | |
| | | Auto Components | | | 0.2 | | | | 0.6 | |
| | | Automobiles | | | 4.4 | | | | 3.6 | |
| | | Banks | | | 7.1 | | | | 6.2 | |
| | | Beverages | | | 1.0 | | | | 0.5 | |
| | | Biotechnology | | | 1.4 | | | | 1.0 | |
| | | Building Products | | | 0.9 | | | | 2.1 | |
| | | Capital Markets | | | 0.6 | | | | 3.8 | |
| | | Chemicals | | | 4.6 | | | | 4.3 | |
| | | Commercial Services & Supplies | | | 0.2 | | | | 2.0 | |
| | | Communications Equipment | | | 1.1 | | | | 2.1 | |
| | | Computers & Peripherals | | | 0.0 | | | | 0.2 | |
| | | Construction & Engineering | | | 0.7 | | | | 0.4 | |
| | | Construction Materials | | | 0.0 | | | | 0.1 | |
| | | Distributors | | | 0.3 | | | | 0.5 | |
| | | Diversified Financials | | | 3.4 | | | | 1.9 | |
| | | Diversified Telecommunications Services | | | 2.2 | | | | 3.7 | |
| | | Electric Utilities | | | 1.0 | | | | 2.0 | |
| | | Electrical Equipment | | | 2.0 | | | | 2.0 | |
| | | Electronic Equipment & Instruments | | | 0.6 | | | | 1.7 | |
| | | Energy Equipment & Services | | | 1.1 | | | | 0.5 | |
| | | Food & Staples Retailing | | | 1.1 | | | | 0.8 | |
| | | Food Products | | | 2.1 | | | | 3.0 | |
| | | Gas Utilities | | | 1.4 | | | | 1.1 | |
| | | Healthcare Equipment & Supplies | | | 1.6 | | | | 1.0 | |
| | | Healthcare Providers & Services | | | 0.1 | | | | 0.1 | |
| | | Healthcare Technology | | | 0.0 | | | | 0.1 | |
| | | Hotels, Restaurants & Leisure | | | 0.8 | | | | 1.1 | |
| | | Household Durables | | | 1.2 | | | | 3.6 | |
| | | Independent Power Producers & Energy Traders | | | 0.1 | | | | 0.0 | |
| | | Industrial Conglomerates | | | 2.7 | | | | 0.8 | |
| | | Insurance | | | 6.8 | | | | 5.7 | |
| | | IT Consulting Services | | | 0.9 | | | | 1.3 | |
| | | Leisure Equipment & Products | | | 0.0 | | | | 1.1 | |
| | | Life Sciences Tools & Services | | | 0.2 | | | | 0.1 | |
| | | Machinery | | | 2.1 | | | | 3.1 | |
| | | Marine | | | 1.4 | | | | 0.6 | |
| | | Media | | | 2.8 | | | | 3.4 | |
| | | Metals & Mining | | | 5.8 | | | | 4.9 | |
| | | Multiline Retail | | | 0.3 | | | | 0.6 | |
| | | Multi-Utilities | | | 0.2 | | | | 0.0 | |
| | | Office Electronics | | | 2.4 | | | | 1.2 | |
| | | Oil, Gas & Consumable Fuels | | | 8.1 | | | | 8.2 | |
| | | Personal Products | | | 0.4 | | | | 0.0 | |
| | | Pharmaceuticals | | | 5.6 | | | | 5.2 | |
| | | Real Estate Management & Development | | | 3.7 | | | | 2.9 | |
| | | REIT | | | 1.0 | | | | 0.8 | |
| | | Road & Rail | | | 1.1 | | | | 0.5 | |
| | | Semiconductors Equipment & Products | | | 0.1 | | | | 1.1 | |
| | | Short-term Investments# | | | 4.4 | | | | 4.1 | |
| | | Software | | | 1.2 | | | | 0.3 | |
| | | Specialty Retail | | | 1.1 | | | | 0.3 | |
| | | Textiles & Apparel | | | 0.7 | | | | 0.3 | |
| | | Tobacco | | | 0.1 | | | | 0.2 | |
| | | Trading Companies and Distributors | | | 1.2 | | | | 0.3 | |
| | | Transportation Infrastructure | | | 0.0 | | | | 0.1 | |
| | | Wireless Telecommunication Services | | | 1.6 | | | | 0.0 | |
| | | |
| | | TOTAL INVESTMENTS | | | 99.6 | % | | | 101.2 | % |
| | | |
| |
| | The percentage shown for each industry category does not reflect the value of the total return swap contract. |
| |
| † | Industry concentrations greater than one-tenth of one percent are disclosed. |
| |
| # | Short-term investments include securities lending collateral. |
The accompanying notes are an integral part of these financial statements.
19
GOLDMAN SACHS STRUCTURED INTERNATIONAL EQUITY FLEX FUND
Schedule of Investments
April 30, 2008 (Unaudited)
| | | | | | | | | | | | | | | |
| | | | | Notional | | Current | | Unrealized |
| | | | | Value | | Value | | Gain (Loss) |
| |
| | |
Total Return Swap Long Positions |
| |
| | | Bermuda – 3.1% |
| | | Aquarius Platinum Ltd. (Metals & Mining) | | $ | 718,987 | | | $ | 714,037 | | | $ | (4,950 | ) |
| | | Hiscox Ltd. (Insurance) | | | 1,754,485 | | | | 1,745,872 | | | | (8,613 | ) |
| | | | | | | | | | | | | | | |
| | | | | | | | | | 2,459,909 | | | | (13,563 | ) |
| | | |
| | | France – 0.9% |
| | | Total SA (Oil, Gas & Consumable Fuels) | | | 735,186 | | | | 733,037 | | | | (2,149 | ) |
| | | |
| | | Germany – 6.3% |
| | | E.ON AG (Electric Utilities) | | | 5,080,971 | | | | 5,062,618 | | | | (18,353 | ) |
| | | |
| | | Hong Kong – 1.1% |
| | | Swire Pacific Ltd. (Real Estate Management & Development) | | | 888,772 | | | | 888,953 | | | | 181 | |
| | | |
| | | Italy – 5.1% |
| | | Intesa Sanpaolo (Commercial Banks) | | | 4,085,701 | | | | 4,060,565 | | | | (25,136 | ) |
| | | |
| | | Netherlands – 0.5% |
| | | Koninklijke DSM NV (Chemicals) | | | 364,015 | | | | 362,238 | | | | (1,777 | ) |
| | | |
| | | Sweden – 0.3% |
| | | Securitas Direct AB (Diversified Consumer Services) | | | 241,294 | | | | 242,685 | | | | 1,391 | |
| | | |
| | | United Kingdom – 82.7% |
| | | Amlin PLC (Insurance) | | | 515,686 | | | | 512,924 | | | | (2,762 | ) |
| | | BAE Systems PLC (Aerospace & Defense) | | | 3,245,916 | | | | 3,230,392 | | | | (15,524 | ) |
| | | BG Group PLC (Oil, Gas & Consumable Fuels) | | | 3,995,886 | | | | 3,991,845 | | | | (4,041 | ) |
| | | BP PLC (Oil, Gas & Consumable Fuels) | | | 3,779,925 | | | | 3,777,454 | | | | (2,471 | ) |
| | | Brit Insurance Holdings PLC (Insurance) | | | 436,418 | | | | 433,024 | | | | (3,394 | ) |
| | | British Energy Group PLC (Electric Utilities) | | | 2,952,132 | | | | 2,921,331 | | | | (30,801 | ) |
| | | Carnival PLC (Hotels, Restaurants & Leisure) | | | 1,102,497 | | | | 1,094,894 | | | | (7,603 | ) |
| | | Compass Group PLC (Hotels, Restaurants & Leisure) | | | 1,609,981 | | | | 1,603,771 | | | | (6,210 | ) |
| | | Computacenter PLC (IT Services) | | | 392,394 | | | | 390,609 | | | | (1,785 | ) |
| | | Dairy Crest Group PLC (Food Products) | | | 787,145 | | | | 784,294 | | | | (2,851 | ) |
| | | De La Rue PLC (Commercials, Services & Supplies) | | | 2,591,520 | | | | 2,578,488 | | | | (13,032 | ) |
| | | Home Retail Group PLC (Internet & Catalog Retail) | | | 2,735,135 | | | | 2,720,210 | | | | (14,925 | ) |
| | | HSBC Holdings PLC (Commercial Banks) | | | 6,598,470 | | | | 6,564,334 | | | | (34,136 | ) |
| | | Kazakhmys PLC (Metals & Mining) | | | 2,578,175 | | | | 2,560,019 | | | | (18,156 | ) |
| | | Laird Group PLC (Electronic Equipment & Instruments) | | | 260,350 | | | | 259,024 | | | | (1,326 | ) |
| | | Legal & General Group PLC (Insurance) | | | 2,277,366 | | | | 2,267,484 | | | | (9,882 | ) |
| | | Lloyds TSB Group PLC (Commercial Banks) | | | 1,779,212 | | | | 1,767,771 | | | | (11,441 | ) |
| | | Mondi PLC (Paper & Forest Products) | | | 2,396,009 | | | | 2,383,132 | | | | (12,877 | ) |
| | | Old Mutual PLC (Insurance) | | | 2,919,090 | | | | 2,896,437 | | | | (22,653 | ) |
| | | Petrofac Ltd. (Energy Equipment & Services) | | | 1,327,532 | | | | 1,321,087 | | | | (6,445 | ) |
| | | Robert Wiseman Dairies PLC (Food Products) | | | 138,260 | | | | 138,382 | | | | 122 | |
| | | Royal Bank of Scotland Group PLC (Commercial Banks) | | | 1,051,831 | | | | 1,039,792 | | | | (12,039 | ) |
| | | Royal Dutch Shell PLC (Oil, Gas & Consumable Fuels) | | | 1,270,146 | | | | 1,268,440 | | | | (1,706 | ) |
| | | |
The accompanying notes are an integral part of these financial statements.
20
GOLDMAN SACHS STRUCTURED INTERNATIONAL EQUITY FLEX FUND
| | | | | | | | | | | | | | | |
| | | | | Notional | | Current | | Unrealized |
| | | | | Value | | Value | | Gain (Loss) |
| | |
Total Return Swap Long Positions – (continued) |
| |
| | | United Kingdom – (continued) |
| | | Royal Dutch Shell PLC Series B (Oil, Gas & Consumable Fuels) | | $ | 634,061 | | | $ | 631,800 | | | $ | (2,261 | ) |
| | | Schroders PLC (Capital Markets) | | | 42,902 | | | | 42,678 | | | | (224 | ) |
| | | Shire PLC (Pharmaceuticals) | | | 1,446,457 | | | | 1,429,736 | | | | (16,721 | ) |
| | | SSL International PLC (Health Care Equipment & Supplies) | | | 1,172,621 | | | | 1,169,596 | | | | (3,025 | ) |
| | | Stagecoach Group PLC (Road & Rail) | | | 49,557 | | | | 49,250 | | | | (307 | ) |
| | | Tesco PLC (Food & Staples Retailing) | | | 2,127,684 | | | | 2,116,643 | | | | (11,041 | ) |
| | | Thomas Cook Group PLC (Hotels, Restaurants & Leisure) | | | 2,318,935 | | | | 2,309,987 | | | | (8,948 | ) |
| | | Thomson Reuters PLC (Media) | | | 711,479 | | | | 711,307 | | | | (172 | ) |
| | | Vedanta Resources PLC (Metals & Mining) | | | 2,060,937 | | | | 2,039,526 | | | | (21,411 | ) |
| | | Vodafone Group PLC (Wireless Telecommunication Services) | | | 5,191,502 | | | | 5,164,496 | | | | (27,006 | ) |
| | | William Morrison Supermarkets PLC (Food & Staples Retailing) | | | 2,667,918 | | | | 2,655,624 | | | | (12,294 | ) |
| | | WPP Group PLC (Media) | | | 94,807 | | | | 94,141 | | | | (666 | ) |
| | | WS Atkins PLC (Commercial Services & Supplies) | | | 891,431 | | | | 886,202 | | | | (5,229 | ) |
| | | | | | | | | | | | | | | |
| | | | | | | | | | 65,806,124 | | | | (345,243 | ) |
| | | |
| | | TOTAL LONG | | | | | | | | | | | | |
| | | POSITIONS OF | | | | | | | | | | | | |
| | | TOTAL RETURN | | | | | | | | | | | | |
| | | SWAP | | $ | 80,020,778 | | | $ | 79,616,129 | | | $ | (404,649 | ) |
| | | |
| | |
Total Return Swap Short Positions |
| |
| | | Australia – 5.5% |
| | | Aristrocat Leisure Ltd. (Hotels, Restaurants & Leisure) | | $ | (378,272 | ) | | $ | (381,057 | ) | | $ | (2,785 | ) |
| | | Billabong International Ltd. (Textiles, Apparel & Luxury Goods) | | | (83,771 | ) | | | (84,174 | ) | | | (403 | ) |
| | | Centro Retail Group (REIT) | | | (337,565 | ) | | | (342,944 | ) | | | (5,379 | ) |
| | | Challenger Financial Services Group Ltd. (Diversified Financial Services) | | | (352,418 | ) | | | (356,636 | ) | | | (4,218 | ) |
| | | Cochlear Ltd. (Health Care Equipment & Supplies) | | | (176,331 | ) | | | (178,248 | ) | | | (1,917 | ) |
| | | JB Hi-Fi Ltd. (Specialty Retail) | | | (322,722 | ) | | | (324,803 | ) | | | (2,081 | ) |
| | | Lihir Gold Ltd. (Metals & Mining) | | | (351,249 | ) | | | (362,935 | ) | | | (11,686 | ) |
| | | Paladin Resources Ltd. (Oil, Gas & Consumable Fuels) | | | (536,138 | ) | | | (541,900 | ) | | | (5,762 | ) |
| | | Transurban Group (Transportation Infrastructure) | | | (1,176,104 | ) | | | (1,183,097 | ) | | | (6,993 | ) |
| | | United Group Ltd. (Construction & Engineering) | | | (612,680 | ) | | | (619,570 | ) | | | (6,890 | ) |
| | | West Australian Newspapers Holdings Ltd. (Media) | | | (57,645 | ) | | | (58,021 | ) | | | (376 | ) |
| | | | | | | | | | | | | | | |
| | | | | | | | | | (4,433,385 | ) | | | (48,490 | ) |
| | | |
| | | Austria – 1.7% |
| | | C.A.T. oil AG (Energy Equipment & Services) | | | (743,157 | ) | | | (741,696 | ) | | | 1,461 | |
| | | RHI AG (Construction Materials) | | | (624,278 | ) | | | (623,733 | ) | | | 545 | |
| | | | | | | | | | | | | | | |
| | | | | | | | | | (1,365,429 | ) | | | 2,006 | |
| | | |
| | | Belgium – 0.5% |
| | | Agfa Gevaert NV (Health Care Technology) | | | (249,889 | ) | | | (248,166 | ) | | | 1,723 | |
| | | Exmar NV (Oil, Gas & Consumable Fuels) | | | (78,186 | ) | | | (78,083 | ) | | | 103 | |
| | | |
The accompanying notes are an integral part of these financial statements.
21
GOLDMAN SACHS STRUCTURED INTERNATIONAL EQUITY FLEX FUND
Schedule of Investments (continued)
April 30, 2008 (Unaudited)
| | | | | | | | | | | | | | | |
| | | | | Notional | | Current | | Unrealized |
| | | | | Value | | Value | | Gain (Loss) |
| | |
Total Return Swap Short Positions – (continued) |
| |
| | | Belgium – (continued) |
| | | Groupe Bruxelles Lambert SA (Diversified Financial Services) | | $ | (46,146 | ) | | $ | (45,934 | ) | | $ | 212 | |
| | | Icos Vision Systems NV (Semiconductors & Semiconductor Equipment) | | | (59,307 | ) | | | (59,310 | ) | | | (3 | ) |
| | | | | | | | | | | | | | | |
| | | | | | | | | | (431,493 | ) | | | 2,035 | |
| | | |
| | | Bermuda – 3.4% |
| | | Benfield Group Ltd. (Insurance) | | | (2,724,798 | ) | | | (2,709,924 | ) | | | 14,874 | |
| | | |
| | | Denmark – 1.9% |
| | | Alk-Abello A/S (Pharmaceuticals) | | | (643,993 | ) | | | (642,120 | ) | | | 1,873 | |
| | | NKT Holding A/S (Machinery) | | | (846,375 | ) | | | (840,768 | ) | | | 5,607 | |
| | | Solar Holdings A/S Class B (Trading Companies & Distributors) | | | (64,527 | ) | | | (64,391 | ) | | | 136 | |
| | | Thrane & Thrane A/S (Communications Equipment) | | | (1,383 | ) | | | (1,377 | ) | | | 6 | |
| | | | | | | | | | | | | | | |
| | | | | | | | | | (1,548,656 | ) | | | 7,622 | |
| | | |
| | | Finland – 1.1% |
| | | Stockmann Oyj Abp (Multiline Retail) | | | (550,875 | ) | | | (550,705 | ) | | | 170 | |
| | | Uponor Oyj (Building Projects) | | | (358,363 | ) | | | (357,771 | ) | | | 592 | |
| | | | | | | | | | | | | | | |
| | | | | | | | | | (908,476 | ) | | | 762 | |
| | | |
| | | France – 6.8% |
| | | Alcatel-Lucent (Communications Equipment) | | | (586,816 | ) | | | (582,394 | ) | | | 4,422 | |
| | | April Group (Insurance) | | | (470,388 | ) | | | (468,240 | ) | | | 2,148 | |
| | | Euler Hermes SA (Insurance) | | | (202,336 | ) | | | (201,672 | ) | | | 664 | |
| | | Geodis SA (Air Freight & Logistics) | | | (206,825 | ) | | | (207,167 | ) | | | (342 | ) |
| | | Klepierre (REIT) | | | (731 | ) | | | (726 | ) | | | 5 | |
| | | Remy Cointreau SA (Beverages) | | | (305,739 | ) | | | (302,926 | ) | | | 2,813 | |
| | | Rhodia SA (Chemicals) | | | (1,256,637 | ) | | | (1,241,239 | ) | | | 15,398 | |
| | | SA des Ciments Vicat (Construction Materials) | | | (612,463 | ) | | | (611,946 | ) | | | 517 | |
| | | Seche Environnement (Commercial Services & Supplies) | | | (253,311 | ) | | | (253,204 | ) | | | 107 | |
| | | Wendel (Industrial Conglomerates) | | | (286,159 | ) | | | (284,807 | ) | | | 1,352 | |
| | | Zodiac SA (Aerospace & Defense) | | | (1,288,016 | ) | | | (1,282,388 | ) | | | 5,628 | |
| | | | | | | | | | | | | | | |
| | | | | | | | | | (5,436,709 | ) | | | 32,712 | |
| | | |
| | | Germany – 11.5% |
| | | Continental AG (Auto Components) | | | (1,464,005 | ) | | | (1,455,351 | ) | | | 8,654 | |
| | | Demag Cranes AG (Machinery) | | | (4,708 | ) | | | (4,664 | ) | | | 44 | |
| | | Deutsche Wohnen AG (Real Estate Management & Development | | | (432,445 | ) | | | (433,174 | ) | | | (729 | ) |
| | | DIC Asset AG (Real Estate Management & Development) | | | (2,013,114 | ) | | | (2,013,872 | ) | | | (758 | ) |
| | | Grenkeleasing AG (Diversified Financial Services) | | | (382,031 | ) | | | (382,368 | ) | | | (337 | ) |
| | | Hypo Real Estate Holding AG (Commercial Banks) | | | (61,803 | ) | | | (60,968 | ) | | | 835 | |
| | | Merck KGaA (Pharmaceuticals) | | | (3,889,024 | ) | | | (3,876,700 | ) | | | 12,324 | |
| | | MPC Muenchmeyer Petersen Capital AG (Capital Markets) | | | (498,007 | ) | | | (496,302 | ) | | | 1,705 | |
| | | Premiere AG (Media) | | | (458,436 | ) | | | (453,787 | ) | | | 4,649 | |
| | | | | | | | | | | | | | | |
| | | | | | | | | | (9,177,186 | ) | | | 26,387 | |
| | | |
The accompanying notes are an integral part of these financial statements.
22
GOLDMAN SACHS STRUCTURED INTERNATIONAL EQUITY FLEX FUND
| | | | | | | | | | | | | | | |
| | | | | Notional | | Current | | Unrealized |
| | | | | Value | | Value | | Gain (Loss) |
| | |
Total Return Swap Short Positions – (continued) |
| |
| | | Italy – 1.3% |
| | | Amplifon SpA (Health Care Providers & Services) | | $ | (7,970 | ) | | $ | (7,910 | ) | | $ | 60 | |
| | | Digital Multimedia Technologies SpA (Communications Equipment) | | | (807,608 | ) | | | (802,796 | ) | | | 4,812 | |
| | | Tod’s SpA (Textile, Apparel & Luxury Goods) | | | (218,821 | ) | | | (217,515 | ) | | | 1,306 | |
| | | | | | | | | | | | | | | |
| | | | | | | | | | (1,028,221 | ) | | | 6,178 | |
| | | |
| | | Japan – 21.9% |
| | | A&D Co. Ltd. (Electronic Equipment & Instruments) | | | (342,085 | ) | | | (340,968 | ) | | | 1,117 | |
| | | Advantest Corp. (Semiconductors & Semiconductor Equipment) | | | (499,241 | ) | | | (501,527 | ) | | | (2,286 | ) |
| | | Aeon Mall Co. Ltd. (Real Estate Management & Development) | | | (90,555 | ) | | | (91,039 | ) | | | (484 | ) |
| | | Air Water, Inc. (Chemicals) | | | (90,709 | ) | | | (90,922 | ) | | | (213 | ) |
| | | Chiyoda Corp. (Construction & Engineering) | | | (278,000 | ) | | | (278,958 | ) | | | (958 | ) |
| | | Chugai Pharmaceutical Co. Ltd. (Pharmaceuticals) | | | (750,233 | ) | | | (756,362 | ) | | | (6,129 | ) |
| | | Dowa Mining (Metals & Mining) | | | — | | | | (8,726 | ) | | | (8,726 | ) |
| | | Fuji Seal International, Inc. (Containers & Packaging) | | | (144,148 | ) | | | (144,962 | ) | | | (814 | ) |
| | | Hamamatsu Photonics KK (Electronic Equipment & Instruments) | | | (73,098 | ) | | | (73,640 | ) | | | (542 | ) |
| | | Haseko Corp. (Household Durables) | | | (2,321,053 | ) | | | (2,338,131 | ) | | | (17,078 | ) |
| | | Hirose Electric Co. Ltd. (Electronic Equipment & Instruments) | | | (236,741 | ) | | | (237,478 | ) | | | (737 | ) |
| | | Hoya Corp. (Electronic Equipment & Instruments) | | | (855,034 | ) | | | (862,413 | ) | | | (7,379 | ) |
| | | Isuzu Motors Ltd. (Automobiles) | | | (315,380 | ) | | | (314,883 | ) | | | 497 | |
| | | Jafco Co. Ltd. (Capital Markets) | | | (596,657 | ) | | | (599,113 | ) | | | (2,456 | ) |
| | | Japan Securities Finance Co. Ltd. (Diversified Financial Services) | | | (52,298 | ) | | | (52,162 | ) | | | 136 | |
| | | Keihanshin Real Estate Co. Ltd. (Real Estate Management & Development) | | | (81,784 | ) | | | (81,741 | ) | | | 43 | |
| | | Meitec Corp. (Commercial Services & Supplies) | | | (940,407 | ) | | | (943,157 | ) | | | (2,750 | ) |
| | | MISUMI Group, Inc. (Trading Companies & Distributors) | | | (2,433,776 | ) | | | (2,439,796 | ) | | | (6,020 | ) |
| | | Modec, Inc. (Energy Equipment & Services) | | | (748,424 | ) | | | (751,550 | ) | | | (3,126 | ) |
| | | Nihon M&A Center, Inc. (Commercial Services & Supplies) | | | (143,495 | ) | | | (143,284 | ) | | | 211 | |
| | | Nihon Parkerizing Co. Ltd. (Chemicals) | | | (318,216 | ) | | | (318,228 | ) | | | (12 | ) |
| | | Nippon Light Metal Co. Ltd. (Metals & Mining) | | | (110,821 | ) | | | (111,086 | ) | | | (265 | ) |
| | | Nishimatsuya Chain Co. Ltd. (Specialty Retail) | | | (225,518 | ) | | | (225,914 | ) | | | (396 | ) |
| | | NTT Urban Development Corp. (Real Estate Management & Development) | | | (844,600 | ) | | | (847,124 | ) | | | (2,524 | ) |
| | | Point, Inc. (Specialty Retail) | | | (91,090 | ) | | | (91,445 | ) | | | (355 | ) |
| | | Rakuten, Inc. (Internet & Catalog Retail) | | | (1,105,400 | ) | | | (1,105,666 | ) | | | (266 | ) |
| | | Shionogi & Co. Ltd. (Pharmaceuticals) | | | (805,459 | ) | | | (811,163 | ) | | | (5,704 | ) |
| | | |
The accompanying notes are an integral part of these financial statements.
23
GOLDMAN SACHS STRUCTURED INTERNATIONAL EQUITY FLEX FUND
Schedule of Investments (continued)
April 30, 2008 (Unaudited)
| | | | | | | | | | | | | | | |
| | | | | Notional | | Current | | Unrealized |
| | | | | Value | | Value | | Gain (Loss) |
| | |
Total Return Swap Short Positions – (continued) |
| |
| | | Japan – (continued) |
| | | Sugi Pharmacy Co. Ltd. (Food & Staples Retailing) | | $ | (76,484 | ) | | $ | (76,732 | ) | | $ | (248 | ) |
| | | Sysmex Corp. (Health Care Equipment & Supplies) | | | (2,300,326 | ) | | | (2,311,753 | ) | | | (11,427 | ) |
| | | Tokuyama Corp. (Chemicals) | | | (99,346 | ) | | | (99,862 | ) | | | (516 | ) |
| | | TonenGeneral
Sekiyu KK (Oil, Gas & Consumable Fuels) | | | (34,474 | ) | | | (34,559 | ) | | | (85 | ) |
| | | Towa Pharmaceutical Co. Ltd. (Pharmaceuticals) | | | (430,861 | ) | | | (430,671 | ) | | | 190 | |
| | | | | | | | | | | | | | | |
| | | | | | | | | | (17,515,015 | ) | | | (79,302 | ) |
| | | |
| | | Netherlands – 5.7% |
| | | James Hardie Industries NV (Construction Materials) | | | (1,088,757 | ) | | | (1,092,666 | ) | | | (3,909 | ) |
| | | Reed Elsevier NV (Media) | | | (2,753,583 | ) | | | (2,724,525 | ) | | | 29,058 | |
| | | SBM Offshore NV (Energy Equipment & Services) | | | (747,716 | ) | | | (745,048 | ) | | | 2,668 | |
| | | | | | | | | | | | | | | |
| | | | | | | | | | (4,562,239 | ) | | | 27,817 | |
| | | |
| | | Norway – 12.2% |
| | | Aker Yards AS (Machinery) | | | (762,497 | ) | | | (759,788 | ) | | | 2,709 | |
| | | Awilco Offshore ASA (Energy Equipment & Services) | | | (454,073 | ) | | | (452,935 | ) | | | 1,138 | |
| | | DNO International ASA (Oil, Gas & Consumable Fuels) | | | (1,827,870 | ) | | | (1,811,309 | ) | | | 16,561 | |
| | | Electromagnetic GeoServices AS (Energy Equipment & Services) | | | (101,925 | ) | | | (101,889 | ) | | | 36 | |
| | | Norske Skogindustrier ASA (Paper & Forest Products) | | | (1,115,596 | ) | | | (1,104,869 | ) | | | 10,727 | |
| | | Ocan Rig ASA (Energy Equipment & Services) | | | (1,758,956 | ) | | | (1,753,551 | ) | | | 5,405 | |
| | | Prosafe ASA (Energy Equipment & Services) | | | (2,303,241 | ) | | | (2,290,997 | ) | | | 12,244 | |
| | | Storebrand ASA (Insurance) | | | (1,478,989 | ) | | | (1,468,478 | ) | | | 10,511 | |
| | | | | | | | | | | | | | | |
| | | | | | | | | | (9,743,816 | ) | | | 59,331 | |
| | | |
| | | Sweden – 6.5% |
| | | Billerud (Paper & Forest Products) | | | (487,231 | ) | | | (486,038 | ) | | | 1,193 | |
| | | D. Carnegie & Co. AB (Capital Markets) | | | (1,081,576 | ) | | | (1,074,377 | ) | | | 7,199 | |
| | | Hemtex AB (Specialty Retail) | | | (665,891 | ) | | | (661,898 | ) | | | 3,993 | |
| | | Lindab International AB (Building Products) | | | (273,185 | ) | | | (272,224 | ) | | | 961 | |
| | | Munters AB (Machinery) | | | (615,906 | ) | | | (612,106 | ) | | | 3,800 | |
| | | NeoNet AB (Capital Markets) | | | (97,207 | ) | | | (96,915 | ) | | | 292 | |
| | | NIBE Industrier AB (Building Products) | | | (1,237,620 | ) | | | (1,230,961 | ) | | | 6,659 | |
| | | Securitas Systems AB Class B (Commercial Services & Supplies) | | | (551,036 | ) | | | (548,306 | ) | | | 2,730 | |
| | | SkiStar AB (Hotels Restaurants & Leisure) | | | (185,012 | ) | | | (184,845 | ) | | | 167 | |
| | | | | | | | | | | | | | | |
| | | | | | | | | | (5,167,670 | ) | | | 26,994 | |
| | | |
| | | Switzerland – 1.7% |
| | | Jelmoli Holding AG (Multiline Retail) | | | (303,417 | ) | | | (303,470 | ) | | | (53 | ) |
| | | Kaba Holding AG (Building Products) | | | (692,772 | ) | | | (694,267 | ) | | | (1,495 | ) |
| | | Schmolz + Bickenbach AG (Metals & Mining) | | | (367,413 | ) | | | (366,434 | ) | | | 979 | |
| | | | | | | | | | | | | | | |
| | | | | | | | | | (1,364,171 | ) | | | (569 | ) |
| | | |
| | | United Kingdom – 18.3% |
| | | Aberdeen Asset Management PLC (Capital Markets) | | | (694,335 | ) | | | (690,069 | ) | | | 4,266 | |
| | | Aegis Group PLC (Media) | | | (1,164,295 | ) | | | (1,157,427 | ) | | | 6,868 | |
| | | |
The accompanying notes are an integral part of these financial statements.
24
GOLDMAN SACHS STRUCTURED INTERNATIONAL EQUITY FLEX FUND
| | | | | | | | | | | | | | | |
| | | | | Notional | | Current | | Unrealized |
| | | | | Value | | Value | | Gain (Loss) |
| | |
Total Return Swap Short Positions – (continued) |
| |
| | | United Kingdom – (continued) |
| | | ARM Holdings PLC (Semiconductors & Semiconductor Equipment) | | $ | (349,954 | ) | | $ | (346,589 | ) | | $ | 3,365 | |
| | | Bovis Homes Group PLC (Household Durables) | | | (262,063 | ) | | | (260,486 | ) | | | 1,577 | |
| | | Burberry Group PLC (Textiles, Apparel & Luxury Goods) | | | (291,340 | ) | | | (289,630 | ) | | | 1,710 | |
| | | easyJet PLC (Airlines) | | | (6,961 | ) | | | (6,947 | ) | | | 14 | |
| | | Eurasian Natural Resources Corp. (Metals & Mining) | | | (76,969 | ) | | | (77,114 | ) | | | (145 | ) |
| | | Experian Group Ltd. (Commercial Services & Supplies) | | | (2,434,046 | ) | | | (2,421,302 | ) | | | 12,744 | |
| | | Forth Ports PLC (Transportation & Infrastructure) | | | (468,803 | ) | | | (468,037 | ) | | | 766 | |
| | | Imperial Energy Corp. PLC (Oil, Gas & Consumable Fuels) | | | (701,803 | ) | | | (699,898 | ) | | | 1,905 | |
| | | Inchcape PLC (Distributors) | | | (130,789 | ) | | | (130,043 | ) | | | 746 | |
| | | Inmarsat PLC (Diversified Telecommunication Services) | | | (1,432,360 | ) | | | (1,425,338 | ) | | | 7,022 | |
| | | Intercontinental Hotels Group PLC (Hotels, Restaurants & Leisure) | | | (396,751 | ) | | | (395,101 | ) | | | 1,650 | |
| | | Invensys PLC (Machinery) | | | (961,430 | ) | | | (955,635 | ) | | | 5,795 | |
| | | Ladbrokes PLC (Hotels, Restaurants & Leisure) | | | (567,931 | ) | | | (564,462 | ) | | | 3,469 | |
| | | MFI Furniture Group PLC (Specialty Retail) | | | (1,403,518 | ) | | | (1,399,196 | ) | | | 4,322 | |
| | | Misys PLC (Software) | | | (353,449 | ) | | | (351,433 | ) | | | 2,016 | |
| | | Mitchells & Butlers PLC (Hotels, Restaurants & Leisure) | | | (36,133 | ) | | | (36,051 | ) | | | 82 | |
| | | Rank Group PLC (Hotels, Restaurants & Leisure) | | | (1,278,372 | ) | | | (1,272,624 | ) | | | 5,748 | |
| | | Rentokil Initial PLC (Commercial Services & Supplies) | | | (509,618 | ) | | | (508,424 | ) | | | 1,194 | |
| | | Smiths Group PLC (Industrial Conglomerates) | | | (122,665 | ) | | | (122,256 | ) | | | 409 | |
| | | St. James’s Place PLC (Insurance) | | | (156,207 | ) | | | (154,962 | ) | | | 1,245 | |
| | | Standard Life PLC (Insurance) | | | (545,207 | ) | | | (541,710 | ) | | | 3,497 | |
| | | Yell Group PLC (Media) | | | (365,046 | ) | | | (363,113 | ) | | | 1,933 | |
| | | | | | | | | | | | | | | |
| | | | | | | | | | (14,637,847 | ) | | | 72,198 | |
| | | |
| | | TOTAL SHORT POSITIONS OF TOTAL RETURN SWAP | | $ | (80,180,792 | ) | | $ | (80,030,237 | ) | | $ | 150,555 | |
| | | |
| | | NET LONG AND SHORT POSITIONS OF TOTAL RETURN SWAP | $ | (254,094 | ) |
| | | |
| | | NET FINANCING COST | | | (660,732 | ) |
| | | CORPORATE ACTIONS | | | 655,562 | |
| | | |
| | | NET SWAP CONTRACT | | $ | (259,264 | ) |
| | | |
| |
| | The percentage shown for each investment category reflects the value of investments in that category as a percentage of the current swap value. |
| |
| | Morgan Stanley & Co. acts as the counterparty for the Fund’s swap contract. Termination date for this contract is August 6, 2009. |
| | | | | | | |
| | | |
| | | Investment Abbreviation: |
| | | REIT | | — | | Real Estate Investment Trust |
| | | |
The accompanying notes are an integral part of these financial statements.
25
GOLDMAN SACHS STRUCTURED INTERNATIONAL EQUITY FLEX FUND
Schedule of Investments (continued)
April 30, 2008 (Unaudited)
| | | | | | | |
| | |
Investments Industry Classifications†
Total Return Swap Long Positions |
| |
| | | Aerospace & Defense | | | 4.0 | % |
| | | Capital Markets | | | 0.1 | |
| | | Chemicals | | | 0.4 | |
| | | Commercial Banks | | | 16.9 | |
| | | Commercial Services & Supplies | | | 4.3 | |
| | | Diversified Consumer Services | | | 0.3 | |
| | | Electric Utilities | | | 10.0 | |
| | | Electronic Equipment & Instruments | | | 0.3 | |
| | | Energy Equipment & Services | | | 1.6 | |
| | | Food & Staples Retailing | | | 6.0 | |
| | | Food Products | | | 1.2 | |
| | | Health Care Equipment & Supplies | | | 1.5 | |
| | | Hotels, Restaurants & Leisure | | | 6.3 | |
| | | Insurance | | | 9.9 | |
| | | Internet & Catalog Retail | | | 3.4 | |
| | | IT Services | | | 0.5 | |
| | | Media | | | 1.0 | |
| | | Metals & Mining | | | 6.7 | |
| | | Oil, Gas & Consumable Fuels | | | 13.1 | |
| | | Paper & Forest Products | | | 3.0 | |
| | | Pharmaceuticals | | | 1.8 | |
| | | Real Estate Management & Development | | | 1.1 | |
| | | Road & Rail | | | 0.1 | |
| | | Wireless Telecommunication Services | | | 6.5 | |
| | | |
| | | TOTAL INVESTMENTS | | | 100.0 | % |
| | | |
| |
| | The percentage shown for each industry category reflects the current value of investments in that industry as a percentage of the total current swap value. |
| |
| † | Industry classifications greater than one-tenth of one percent are disclosed. |
| | | | | | | |
| | |
Investments Industry Classifications†
Total Return Swap Short Positions |
| |
| | | Aerospace & Defense | | | 1.6 | % |
| | | Air Freight & Logistics | | | 0.3 | |
| | | Auto Components | | | 1.8 | |
| | | Automobiles | | | 0.4 | |
| | | Beverages | | | 0.4 | |
| | | Building Products | | | 3.2 | |
| | | Capital Markets | | | 3.7 | |
| | | Chemicals | | | 2.2 | |
| | | Commercial Banks | | | 0.1 | |
| | | Commercial Services & Supplies | | | 6.0 | |
| | | Communications Equipment | | | 1.7 | |
| | | Construction & Engineering | | | 1.1 | |
| | | Construction Materials | | | 2.9 | |
| | | Containers & Packaging | | | 0.2 | |
| | | Distributors | | | 0.2 | |
| | | Diversified Financial Services | | | 1.1 | |
| | | Diversified Telecommunication Services | | | 1.8 | |
| | | Electronic Equipment & Instruments | | | 1.9 | |
| | | Energy Equipment & Services | | | 8.5 | |
| | | Food & Staples Retailing | | | 0.1 | |
| | | Health Care Equipment & Supplies | | | 3.1 | |
| | | Health Care Technology | | | 0.3 | |
| | | Hotels, Restaurants & Leisure | | | 3.5 | |
| | | Household Durables | | | 3.3 | |
| | | Industrial Conglomerates | | | 0.5 | |
| | | Insurance | | | 6.9 | |
| | | Internet & Catalog Retail | | | 1.4 | |
| | | Machinery | | | 4.0 | |
| | | Media | | | 5.9 | |
| | | Metals & Mining | | | 1.2 | |
| | | Multiline Retail | | | 1.1 | |
| | | Oil, Gas & Consumable Fuels | | | 4.0 | |
| | | Paper & Forest Products | | | 2.0 | |
| | | Pharmaceuticals | | | 8.1 | |
| | | REIT | | | 0.4 | |
| | | Real Estate Management & Development | | | 4.3 | |
| | | Semiconductors & Semiconductor Equipment | | | 1.1 | |
| | | Software | | | 0.4 | |
| | | Speciality Retail | | | 3.4 | |
| | | Textiles, Apparel & Luxury Goods | | | 0.7 | |
| | | Trading Companies & Distributors | | | 3.1 | |
| | | Transportation Infrastructure | | | 2.1 | |
| | | |
| | | TOTAL INVESTMENTS | | | 100.0 | % |
| | | |
| |
| | The percentage shown for each industry category reflects the current value of investments in that industry as a percentage of the total current swap value. |
| |
| † | Industry classifications greater than one-tenth of one percent are disclosed. |
The accompanying notes are an integral part of these financial statements.
26
GOLDMAN SACHS STRUCTURED INTERNATIONAL EQUITY FLEX FUND
| ADDITIONAL INVESTMENT INFORMATION |
FUTURES CONTRACTS — At April 30, 2008, the following futures contracts were open:
| | | | | | | | | | | | | | | |
| | | Number of | | | | | | |
| | | Contracts | | Settlement | | Notional | | Unrealized |
| Type | | Long | | Month | | Value | | Gain |
| |
| DJ Euro Stoxx 50 Index | | | 87 | | | June 2008 | | $ | 5,109,177 | | | $ | 113,667 | |
| FTSE 100 Index | | | 32 | | | June 2008 | | | 3,879,254 | | | | 28,915 | |
| Share Price 200 Index | | | 9 | | | June 2008 | | | 1,189,023 | | | | 3,643 | |
| Topix Index | | | 28 | | | June 2008 | | | 3,643,218 | | | | 102,331 | |
| |
TOTAL | | | | | | | | | | | | $ | 248,556 | |
| |
The accompanying notes are an integral part of these financial statements.
27
GOLDMAN SACHS STRUCTURED U.S. EQUITY FLEX FUND
Schedule of Investments
April 30, 2008 (Unaudited)
| | | | | | | | | | | |
| | | Shares | | Description | | Value |
| | |
Common Stocks-Long – 130.2% |
| |
| | | Aerospace & Defense – 5.5% |
| | | | 2,200 | | | Lockheed Martin Corp. | | $ | 233,288 | |
| | | | 14,700 | | | Northrop Grumman Corp.(a) | | | 1,081,479 | |
| | | | | | | | | | | |
| | | | | | | | | | 1,314,767 | |
| | | |
| | | Biotechnology – 5.8% |
| | | | 17,200 | | | Amgen, Inc.*(a) | | | 720,164 | |
| | | | 10,800 | | | Biogen Idec, Inc.* | | | 655,452 | |
| | | | | | | | | | | |
| | | | | | | | | | 1,375,616 | |
| | | |
| | | Capital Markets – 3.3% |
| | | | 6,000 | | | Ameriprise Financial, Inc.(a) | | | 284,940 | |
| | | | 4,226 | | | Federated Investors, Inc. Class B | | | 141,487 | |
| | | | 4,000 | | | Greenhill & Co., Inc.(b) | | | 260,200 | |
| | | | 3,700 | | | Janus Capital Group, Inc.(a) | | | 103,822 | |
| | | | | | | | | | | |
| | | | | | | | | | 790,449 | |
| | | |
| | | Chemicals – 4.6% |
| | | | 3,471 | | | CF Industries Holdings, Inc. | | | 464,073 | |
| | | | 8,000 | | | International Flavors & Fragrances, Inc. | | | 364,880 | |
| | | | 5,183 | | | Koppers Holdings, Inc. | | | 251,064 | |
| | | | 200 | | | Monsanto Co. | | | 22,804 | |
| | | | 100 | | | Terra Industries, Inc.* | | | 3,786 | |
| | | | | | | | | | | |
| | | | | | | | | | 1,106,607 | |
| | | |
| | | Commercial Banks – 1.1% |
| | | | 2,200 | | | BB&T Corp. | | | 75,438 | |
| | | | 8,300 | | | Regions Financial Corp. | | | 181,936 | |
| | | | | | | | | | | |
| | | | | | | | | | 257,374 | |
| | | |
| | | Communications Equipment – 2.5% |
| | | | 21,211 | | | Juniper Networks, Inc.*(a) | | | 585,848 | |
| | | | 1,200 | | | Tellabs, Inc.* | | | 6,192 | |
| | | | | | | | | | | |
| | | | | | | | | | 592,040 | |
| | | |
| | | Computers & Peripherals – 2.6% |
| | | | 2,000 | | | Apple, Inc.* | | | 347,900 | |
| | | | 7,400 | | | Dell, Inc.* | | | 137,862 | |
| | | | 3,300 | | | QLogic Corp.* | | | 52,668 | |
| | | | 3,800 | | | Teradata Corp.* | | | 80,902 | |
| | | | | | | | | | | |
| | | | | | | | | | 619,332 | |
| | | |
| | | Consumer Finance – 1.7% |
| | | | 8,411 | | | American Express Co. | | | 403,896 | |
| | | |
| | | Diversified Consumer Services – 2.3% |
| | | | 10,807 | | | Apollo Group, Inc.*(a) | | | 550,076 | |
| | | |
| | | Diversified Financial Services – 5.8% |
| | | | 22,116 | | | Bank of America Corp. | | | 830,235 | |
| | | | 11,600 | | | JPMorgan Chase & Co.(a) | | | 552,740 | |
| | | | | | | | | | | |
| | | | | | | | | | 1,382,975 | |
| | | |
| | | Diversified Telecommunication Services – 6.0% |
| | | | 6,524 | | | AT&T, Inc. | | | 252,544 | |
| | | | 23,600 | | | Embarq Corp.(a) | | | 981,052 | |
| | | | 16,318 | | | Windstream Corp. | | | 191,573 | |
| | | | | | | | | | | |
| | | | | | | | | | 1,425,169 | |
| | | |
| | | Electric Utilities – 0.6% |
| | | | 5,000 | | | Duke Energy Corp. | | | 91,550 | |
| | | | 900 | | | PPL Corp. | | | 43,218 | |
| | | | 100 | | | Progress Energy, Inc. | | | 4,199 | |
| | | | | | | | | | | |
| | | | | | | | | | 138,967 | |
| | | |
| | | Electrical Equipment – 1.0% |
| | | | 476 | | | A.O. Smith Corp. | | | 14,727 | |
| | | | 3,465 | | | EnerSys* | | | 81,081 | |
| | | | 2,500 | | | GrafTech International Ltd.* | | | 49,125 | |
| | | | 1,600 | | | Rockwell Automation, Inc. | | | 86,768 | |
| | | | | | | | | | | |
| | | | | | | | | | 231,701 | |
| | | |
| | | Electronic Equipment & Instruments – 1.2% |
| | | | 9,732 | | | Agilent Technologies, Inc.* | | | 294,004 | |
| | | |
| | | Energy Equipment & Services – 1.0% |
| | | | 147 | | | Halliburton Co. | | | 6,749 | |
| | | | 3,300 | | | National-Oilwell Varco, Inc.* | | | 225,885 | |
| | | | | | | | | | | |
| | | | | | | | | | 232,634 | |
| | | |
| | | Food & Staples Retailing – 5.4% |
| | | | 11,600 | | | Nash Finch Co. | | | 424,328 | |
| | | | 8,200 | | | SUPERVALU, Inc. | | | 271,420 | |
| | | | 19,087 | | | The Kroger Co.(a) | | | 520,121 | |
| | | | 4,500 | | | Winn-Dixie Stores, Inc.*(b) | | | 79,785 | |
| | | | | | | | | | | |
| | | | | | | | | | 1,295,654 | |
| | | |
| | | Food Products – 3.5% |
| | | | 12,300 | | | Chiquita Brands International, Inc.*(b) | | | 279,825 | |
| | | | 31,800 | | | Tyson Foods, Inc.(a) | | | 566,040 | |
| | | | | | | | | | | |
| | | | | | | | | | 845,865 | |
| | | |
| | | Gas Utilities – 1.6% |
| | | | 10,576 | | | Nicor, Inc. | | | 371,429 | |
| | | |
| | | Health Care Providers & Services – 5.1% |
| | | | 2,100 | | | AmerisourceBergen Corp.(a) | | | 85,155 | |
| | | | 6,700 | | | Express Scripts, Inc.* | | | 469,134 | |
| | | | 13,642 | | | Medco Health Solutions, Inc.*(a) | | | 675,825 | |
| | | | | | | | | | | |
| | | | | | | | | | 1,230,114 | |
| | | |
| | | Hotels, Restaurants & Leisure – 0.2% |
| | | | 300 | | | Carnival Corp. | | | 12,051 | |
| | | | 600 | | | McDonald’s Corp. | | | 35,748 | |
| | | | | | | | | | | |
| | | | | | | | | | 47,799 | |
| | | |
| | | Industrial Conglomerates – 2.1% |
| | | | 10,700 | | | Tyco International Ltd.(a)(c) | | | 500,653 | |
| | | |
| | | Insurance – 1.5% |
| | | | 6,509 | | | AmTrust Financial Services, Inc. | | | 101,215 | |
| | | | 4,320 | | | MetLife, Inc. | | | 262,872 | |
| | | | | | | | | | | |
| | | | | | | | | | 364,087 | |
| | | |
| | | Internet & Catalog Retail – 1.5% |
| | | | 4,629 | | | Amazon.com, Inc.*(b) | | | 363,978 | |
| | | |
The accompanying notes are an integral part of these financial statements.
28
GOLDMAN SACHS STRUCTURED U.S. EQUITY FLEX FUND
| | | | | | | | | | | |
| | | Shares | | Description | | Value |
| | |
Common Stocks-Long – (continued) |
| |
| | | Internet Software & Services – 2.2% |
| | | | 133 | | | Google, Inc.* | | $ | 76,381 | |
| | | | 12,600 | | | VeriSign, Inc.* | | | 454,230 | |
| | | | | | | | | | | |
| | | | | | | | | | 530,611 | |
| | | |
| | | IT Services – 0.3% |
| | | | 2,831 | | | Western Union Co. | | | 65,113 | |
| | | |
| | | Life Sciences Tools & Services – 0.3% |
| | | | 1,100 | | | Waters Corp.* | | | 67,606 | |
| | | |
| | | Machinery – 2.8% |
| | | | 15,246 | | | Ingersoll-Rand Co. Ltd. | | | 676,617 | |
| | | |
| | | Media – 3.6% |
| | | | 15,300 | | | CBS Corp. Class B(a)(c) | | | 352,971 | |
| | | | 33,900 | | | Time Warner, Inc.(a) | | | 503,415 | |
| | | | | | | | | | | |
| | | | | | | | | | 856,386 | |
| | | |
| | | Metals & Mining – 0.3% |
| | | | 400 | | | Compass Minerals International, Inc. | | | 25,200 | |
| | | | 866 | | | Newmont Mining Corp. | | | 38,286 | |
| | | | | | | | | | | |
| | | | | | | | | | 63,486 | |
| | | |
| | | Multi-Utilities – 1.0% |
| | | | 5,900 | | | DTE Energy Co. | | | 237,829 | |
| | | |
| | | Multiline Retail – 2.0% |
| | | | 4,925 | | | Sears Holdings Corp.* | | | 485,654 | |
| | | |
| | | Oil, Gas & Consumable Fuels – 14.2% |
| | | | 400 | | | Alpha Natural Resources, Inc.* | | | 19,460 | |
| | | | 11,019 | | | Anadarko Petroleum Corp. | | | 733,425 | |
| | | | 200 | | | Apache Corp. | | | 26,936 | |
| | | | 21,200 | | | Exxon Mobil Corp.(a) | | | 1,973,084 | |
| | | | 400 | | | Noble Energy, Inc. | | | 34,800 | |
| | | | 9,986 | | | Stone Energy Corp.* | | | 608,547 | |
| | | | | | | | | | | |
| | | | | | | | | | 3,396,252 | |
| | | |
| | | Personal Products – 0.1% |
| | | | 400 | | | Herbalife Ltd. | | | 17,512 | |
| | | |
| | | Pharmaceuticals – 5.7% |
| | | | 67,600 | | | Pfizer, Inc.(a) | | | 1,359,436 | |
| | | |
| | | Real Estate Investment Trusts – 4.6% |
| | | | 476 | | | Equity Lifestyle Properties, Inc. | | | 23,533 | |
| | | | 1,300 | | | Equity Residential | | | 53,976 | |
| | | | 8,800 | | | Post Properties, Inc. | | | 322,960 | |
| | | | 11,300 | | | ProLogis | | | 707,493 | |
| | | | | | | | | | | |
| | | | | | | | | | 1,107,962 | |
| | | |
| | | Road & Rail – 0.8% |
| | | | 100 | | | J.B. Hunt Transportation Services, Inc. | | | 3,397 | |
| | | | 2,800 | | | Ryder System, Inc.(a) | | | 191,716 | |
| | | | | | | | | | | |
| | | | | | | | | | 195,113 | |
| | | |
| | | Semiconductors & Semiconductor Equipment – 8.8% |
| | | | 40,988 | | | LSI Corp.* | | | 254,126 | |
| | | | 500 | | | MEMC Electronic Materials, Inc.* | | | 31,485 | |
| | | | 20,400 | | | National Semiconductor Corp.(a) | | | 415,956 | |
| | | | 12,150 | | | NVIDIA Corp.* | | | 249,682 | |
| | | | 39,836 | | | Texas Instruments, Inc.(a) | | | 1,161,618 | |
| | | | | | | | | | | |
| | | | | | | | | | 2,112,867 | |
| | | |
| | | Software – 7.1% |
| | | | 45,300 | | | Microsoft Corp.(a) | | | 1,291,956 | |
| | | | 23,300 | | | Symantec Corp.*(a) | | | 401,226 | |
| | | | | | | | | | | |
| | | | | | | | | | 1,693,182 | |
| | | |
| | | Specialty Retail – 8.6% |
| | | | 16,700 | | | AutoNation, Inc.*(a) | | | 267,367 | |
| | | | 14,000 | | | Best Buy Co., Inc.(b) | | | 602,280 | |
| | | | 12,858 | | | GameStop Corp.* | | | 707,704 | |
| | | | 10,362 | | | PriceSmart, Inc. | | | 295,835 | |
| | | | 843 | | | The Buckle, Inc. | | | 40,953 | |
| | | | 4,200 | | | The TJX Cos., Inc. | | | 135,324 | |
| | | | | | | | | | | |
| | | | | | | | | | 2,049,463 | |
| | | |
| | | Tobacco – 1.9% |
| | | | 3,865 | | | Altria Group, Inc. | | | 77,300 | |
| | | | 7,600 | | | Philip Morris International, Inc.* | | | 387,828 | |
| | | | | | | | | | | |
| | | | | | | | | | 465,128 | |
| | | |
| | | TOTAL COMMON STOCKS-LONG |
| | | (Cost $31,795,383) | | $ | 31,115,403 | |
| | | |
| | | | | | | | | | | | | | | | | |
| | | Principal | | Interest | | Maturity | | |
| | | Amount | | Rate | | Date | | Value |
| | |
Repurchase Agreement(d) – 5.9% |
| |
| | | Joint Repurchase Agreement Account II |
| | | $ | 1,400,000 | | | | 1.989 | % | | | 05/01/08 | | | $ | 1,400,000 | |
| | | Maturity Value: $1,400,077 |
| | | (Cost $1,400,000) | | | | |
| | | |
| | | TOTAL INVESTMENTS BEFORE SECURITIES LENDING COLLATERAL |
| | | (Cost $33,195,383) | | $ | 32,515,403 | |
| | | |
The accompanying notes are an integral part of these financial statements.
29
GOLDMAN SACHS STRUCTURED U.S. EQUITY FLEX FUND
Schedule of Investments (continued)
April 30, 2008 (Unaudited)
| | | | | | | | | | | | | |
| | | | | Interest | | |
| | | Shares | | Rate | | Value |
| | |
Securities Lending Collateral(e) – 6.1% |
| |
| | | Boston Global Investment Trust-Enhanced Portfolio |
| | | | 1,468,500 | | | | 2.642 | % | | $ | 1,468,500 | |
| | | (Cost $1,468,500) | | | | |
| | | |
| | | TOTAL INVESTMENTS – 142.2% |
| | | (Cost $34,663,883) | | $ | 33,983,903 | |
| | | |
| | | SECURITIES SOLD SHORT – (33.6%) |
| | | Proceeds received $(8,699,628) | | $ | (8,026,783 | ) |
| | | |
| | | LIABILITIES IN EXCESS OF
OTHER ASSETS – (8.6)% | | | (2,047,785 | ) |
| | | |
| | | NET ASSETS – 100.0% | | $ | 23,909,335 | |
| | | |
| | | | | | | | | | | |
| | | Shares | | Description | | Value |
| | |
Common Stocks-Short – 33.6% |
| |
| | | Automobiles – 1.1% |
| | | | 11,500 | | | General Motors Corp. | | $ | 266,800 | |
| | | |
| | | Biotechnology – 0.7% |
| | | | 5,067 | | | Acorda Therapeutics, Inc. | | | 106,660 | |
| | | | 2,517 | | | Vertex Pharmaceuticals, Inc. | | | 64,234 | |
| | | | | | | | | | | |
| | | | | | | | | | 170,894 | |
| | | |
| | | Capital Markets – 0.1% |
| | | | 200 | | | Legg Mason, Inc. | | | 12,056 | |
| | | |
| | | Commercial Banks – 0.2% |
| | | | 4,500 | | | Huntington Bancshares, Inc. | | | 42,255 | |
| | | |
| | | Commercial Services & Supplies – 0.4% |
| | | | 2,951 | | | American Reprographics Co. | | | 46,832 | |
| | | | 1,700 | | | Monster Worldwide, Inc. | | | 41,361 | |
| | | | | | | | | | | |
| | | | | | | | | | 88,193 | |
| | | |
| | | Communications Equipment – 2.4% |
| | | | 16,735 | | | Comtech Group Inc. | | | 217,890 | |
| | | | 6,465 | | | Infinera Corp. | | | 81,847 | |
| | | | 16,775 | | | JDS Uniphase Corp. | | | 240,050 | |
| | | | 1,943 | | | Starent Networks Corp. | | | 30,738 | |
| | | | | | | | | | | |
| | | | | | | | | | 570,525 | |
| | | |
| | | Computers & Peripherals – 0.4% |
| | | | 3,200 | | | SanDisk Corp. | | | 86,688 | |
| | | |
| | | Consumer Finance – 1.6% |
| | | | 20,322 | | | SLM Corp. | | | 376,567 | |
| | | |
| | | Diversified Consumer Services – 0.4% |
| | | | 2,317 | | | H&R Block, Inc. | | | 50,673 | |
| | | | 2,229 | | | Jackson Hewitt Tax Service, Inc. | | | 33,234 | |
| | | | | | | | | | | |
| | | | | | | | | | 83,907 | |
| | | |
| | | Health Care Providers & Services – 5.0% |
| | | | 15,100 | | | Healthspring, Inc. | | | 254,284 | |
| | | | 9,000 | | | inVentiv Health Inc. | | | 267,570 | |
| | | | 14,554 | | | MedCath Corp. | | | 270,122 | |
| | | | 500 | | | MWI Veterinary Supply, Inc. | | | 17,235 | |
| | | | 700 | | | Quest Diagnostics, Inc. | | | 35,126 | |
| | | | 56,614 | | | Tenet Healthcare Corp. | | | 362,330 | |
| | | | | | | | | | | |
| | | | | | | | | | 1,206,667 | |
| | | |
| | | Hotels, Restaurants & Leisure – 0.2% |
| | | | 1,683 | | | Gaylord Entertainment Co. | | | 49,850 | |
| | | |
| | | Household Durables – 1.2% |
| | | | 5,800 | | | Centex Corp. | | | 120,756 | |
| | | | 2,700 | | | Harman International Industries, Inc. | | | 110,349 | |
| | | | 933 | | | Snap-on, Inc. | | | 55,336 | |
| | | | | | | | | | | |
| | | | | | | | | | 286,441 | |
| | | |
| | | Insurance – 0.5% |
| | | | 3,420 | | | XL Capital Ltd. | | | 119,324 | |
| | | |
| | | Internet Software & Services – 2.2% |
| | | | 8,100 | | | Akamai Technologies, Inc. | | | 289,737 | |
| | | | 16,709 | | | SAVVIS, Inc. | | | 244,787 | |
| | | | | | | | | | | |
| | | | | | | | | | 534,524 | |
| | | |
| | | Life Sciences Tools & Services – 2.4% |
| | | | 14,122 | | | AMAG Pharmaceuticals, Inc. | | | 579,426 | |
| | | |
| | | Media – 0.6% |
| | | | 4,800 | | | National CineMedia, Inc. | | | 91,968 | |
| | | | 1,400 | | | The E.W. Scripps Co. | | | 62,874 | |
| | | | | | | | | | | |
| | | | | | | | | | 154,842 | |
| | | |
| | | Metals & Mining – 0.4% |
| | | | 5,900 | | | Titanium Metals Corp. | | | 89,916 | |
| | | |
| | | Multiline Retail – 5.1% |
| | | | 3,400 | | | J.C. Penney Co., Inc. | | | 144,500 | |
| | | | 21,781 | | | Kohl’s Corp. | | | 1,064,002 | |
| | | | | | | | | | | |
| | | | | | | | | | 1,208,502 | |
| | | |
| | | Real Estate Investment Trusts – 0.8% |
| | | | 8,300 | | | Duke Realty Corp. | | | 202,686 | |
| | | |
| | | Semiconductors & Semiconductor Equipment – 2.5% |
| | | | 2,488 | | | Advanced Energy Industries, Inc. | | | 34,832 | |
| | | | 26,622 | | | Advanced Micro Devices, Inc. | | | 158,667 | |
| | | | 5,600 | | | Marvell Technology Group Ltd. | | | 72,520 | |
| | | | 16,561 | | | Micron Technology, Inc. | | | 127,851 | |
| | | | 8,775 | | | Novellus Systems, Inc. | | | 191,822 | |
| | | | 987 | | | Rubicon Technology Inc | | | 21,773 | |
| | | | | | | | | | | |
| | | | | | | | | | 607,465 | |
| | | |
| | | Specialty Retail – 1.9% |
| | | | 25,100 | | | Limited Brands, Inc. | | | 464,852 | |
| | | |
| | | Thrifts & Mortgage Finance – 0.4% |
| | | | 3,200 | | | Fannie Mae | | | 90,560 | |
| | | |
| | | Trading Companies & Distributors – 1.4% |
| | | | 23,320 | | | Aircastle Ltd. | | | 326,014 | |
| | | |
| | | Wireless Telecommunication Services – 1.7% |
| | | | 3,786 | | | Leap Wireless International, Inc. | | | 202,437 | |
| | | | 5,800 | | | MetroPCS Communications, Inc. | | | 113,912 | |
The accompanying notes are an integral part of these financial statements.
30
GOLDMAN SACHS STRUCTURED U.S. EQUITY FLEX FUND
| | | | | | | | | | | |
| | | Shares | | Description | | Value |
| | |
Common Stocks-Short – (continued) |
| |
| | | Wireless Telecommunication Services – (continued) |
| | | | 2,000 | | | NII Holdings, Inc. | | $ | 91,480 | |
| | | | | | | | | | | |
| | | | | | | | | | 407,829 | |
| | | |
| | | TOTAL COMMON STOCKS-SHORT |
| | | Proceeds received $(8,699,628) | | $ | (8,026,783 | ) |
| | | |
| |
| | The percentage shown for each investment category reflects the value of investments in that category as a percentage of net assets. |
| |
| * | Non-income producing security. |
| |
| (a) | All or a portion of security is pledged as collateral for short sales. |
| |
| (b) | All or portion of security is on loan. |
| |
| (c) | A portion of this security is segregated for initial margin requirements on futures transactions. |
| |
| (d) | Joint repurchase agreement was entered into on April 30, 2008. Additional information appears on page 32. |
| |
| (e) | Variable rate security. Interest rate disclosed is that which is in effect at April 30, 2008. |
The accompanying notes are an integral part of these financial statements.
31
GOLDMAN SACHS STRUCTURED U.S. EQUITY FLEX FUND
Schedule of Investments (continued)
April 30, 2008 (Unaudited)
| ADDITIONAL INVESTMENT INFORMATION |
FUTURES CONTRACTS — At April 30, 2008, the following futures contracts were open:
| | | | | | | | | | | | | | | |
| | | Number of | | Settlement | | Notional | | Unrealized |
| Type | | Contracts Long | | Month | | Value | | Gain |
| |
| S&P Mini 500 Index | | | 13 | | | June 2008 | | $ | 900,900 | | | $ | 13,144 | |
| |
JOINT REPURCHASE AGREEMENT ACCOUNT II — At April 30, 2008, the Structured U.S. Equity Flex Fund had an undivided interest in the Joint Repurchase Agreement Account II which equaled $1,400,000, in principal amount.
REPURCHASE AGREEMENTS
| | | | | | | | | | | | | | | | | |
| |
| | | Principal | | Interest | | Maturity | | Maturity |
| Counterparty | | Amount | | Rate | | Date | | Value |
| |
| ABN Amro, Inc. | | $ | 2,000,000,000 | | | | 2.00 | % | | | 05/01/08 | | | $ | 2,000,111,111 | |
| |
| Banc of America Securities LLC | | | 4,500,000,000 | | | | 1.98 | | | | 05/01/08 | | | | 4,500,247,500 | |
| |
| Barclays Capital, Inc. | | | 4,500,000,000 | | | | 1.98 | | | | 05/01/08 | | | | 4,500,247,500 | |
| |
| Citigroup Global Markets, Inc. | | | 2,000,000,000 | | | | 2.00 | | | | 05/01/08 | | | | 2,000,111,111 | |
| |
| Credit Suisse Securities (USA) LLC | | | 1,025,000,000 | | | | 1.99 | | | | 05/01/08 | | | | 1,025,056,660 | |
| |
| Deutsche Bank Securities, Inc. | | | 7,200,000,000 | | | | 2.00 | | | | 05/01/08 | | | | 7,200,400,000 | |
| |
| Greenwich Capital Markets | | | 500,000,000 | | | | 1.99 | | | | 05/01/08 | | | | 500,027,639 | |
| |
| JPMorgan Securities | | | 1,200,000,000 | | | | 1.96 | | | | 05/01/08 | | | | 1,200,065,333 | |
| |
| Merrill Lynch | | | 500,000,000 | | | | 2.00 | | | | 05/01/08 | | | | 500,027,778 | |
| |
| UBS Securities LLC | | | 2,125,000,000 | | | | 1.98 | | | | 05/01/08 | | | | 2,125,116,875 | |
| |
TOTAL | | | | | | | | | | | | | | $ | 25,551,411,507 | |
| |
At April 30, 2008, the Joint Repurchase Agreement Account II was fully collateralized by Federal Farm Credit Bank, 3.500% to 6.900%, due 10/06/08 to 03/29/18; Federal Home Loan Bank, 5.000% to 5.500%, due 07/16/08 to 06/25/10; Federal Home Loan Mortgage Corp, 3.100% to 7.000%, due 05/05/08 to 09/01/47; Federal National Mortgage Association, 3.500% to 15.500%, due 06/01/08 to 04/01/48 and Government National Mortgage Association, 6.000%, due 10/20/37. The aggregate market value of the collateral, including accrued interest, was $26,121,839,953.
The accompanying notes are an integral part of these financial statements.
32
GOLDMAN SACHS STRUCTURED EQUITY FLEX FUNDS
Statements of Assets and Liabilities
April 30, 2008 (Unaudited)
| | | | | | | | | | | | | | |
| | | | | Structured | | | | |
| | | | | International | | Structured U.S. | | |
| | | | | Equity Flex Fund | | Equity Flex Fund | | |
| |
| | | Assets: |
| |
| | | Investments in securities, at value (identified cost $244,393,437 and $33,195,383, respectively)(a) | | $ | 240,891,244 | | | $ | 32,515,403 | | | |
| | | Securities lending collateral, at value which equals cost | | | 11,075,320 | | | | 1,468,500 | | | |
| | | Cash | | | 4,671,563 | | | | — | | | |
| | | Foreign currencies, at value (identified cost $6,484,252 and $0, respectively) | | | 6,488,932 | | | | — | | | |
| | | Receivables: | | | | | | | | | | |
| | | | Due from broker-variation margin, at value | | | 2,374,844 | | | | 110,289 | | | |
| | | | Fund shares sold | | | 1,737,530 | | | | 2,000 | | | |
| | | | Dividend and interest receivable, at value | | | 1,495,488 | | | | 9,616 | | | |
| | | | Foreign tax reclaims, at value | | | 163,841 | | | | — | | | |
| | | | Reimbursement from adviser | | | 70,373 | | | | 38,952 | | | |
| | | | Investment securities sold | | | — | | | | 6,925,811 | | | |
| | | | Securities lending income | | | 40,957 | | | | 816 | | | |
| | | Other assets | | | 5,798 | | | | 958 | | | |
| | | |
| | | Total assets | | | 269,015,890 | | | | 41,072,345 | | | |
| | | |
| | | Liabilities: |
| |
| | | Due to Custodian | | | — | | | | 760 | | | |
| | | Payables: | | | | | | | | | | |
| | | | Payable upon return of securities loaned | | | 11,075,320 | | | | 1,468,500 | | | |
| | | | Fund shares repurchased | | | 2,705,067 | | | | 245,030 | | | |
| | | | Due to broker-variation margin, at value | | | 1,413,246 | | | | 112,928 | | | |
| | | | Amounts owed to affiliates | | | 303,137 | | | | 25,480 | | | |
| | | | Investments sold short, at value (proceeds received $8,699,628) | | | — | | | | 8,026,783 | | | |
| | | | Investment securities purchased, at value | | | — | | | | 7,142,887 | | | |
| | | | Dividends for securities sold short | | | — | | | | 10,179 | | | |
| | | Swap contract, at value | | | 259,264 | | | | — | | | |
| | | Accrued expenses | | | 190,205 | | | | 130,463 | | | |
| | | |
| | | Total liabilities | | | 15,946,239 | | | | 17,163,010 | | | |
| | | |
| | | Net Assets: |
| |
| | | Paid-in capital | | | 289,705,793 | | | | 30,508,352 | | | |
| | | Accumulated undistributed net investment income | | | 1,148,586 | | | | 14,776 | | | |
| | | Accumulated net realized loss from investment, futures, securities sold short, swap and foreign currency related transactions | | | (34,242,048 | ) | | | (6,619,802 | ) | | |
| | | Net unrealized gain (loss) on investments, futures, securities sold short, swap contract and translation of assets and liabilities denominated in foreign currencies | | | (3,542,680 | ) | | | 6,009 | | | |
| | | |
| | | NET ASSETS | | $ | 253,069,651 | | | $ | 23,909,335 | | | |
| |
| | | Net Assets: | | | | | | | | | | |
| | | | Class A | | $ | 184,769,310 | | | $ | 13,672,463 | | | |
| | | | Class C | | | 4,540,570 | | | | 666,585 | | | |
| | | | Institutional | | | 63,741,191 | | | | 9,551,454 | | | |
| | | | Class IR | | | 9,299 | | | | 9,426 | | | |
| | | | Class R | | | 9,281 | | | | 9,407 | | | |
| |
| | | Total Net Assets | | $ | 253,069,651 | | | $ | 23,909,335 | | | |
| |
| | | Shares Outstanding: | | | | | | | | | | |
| | | | Class A | | | 16,452,327 | | | | 1,493,701 | | | |
| | | | Class C | | | 408,130 | | | | 73,629 | | | |
| | | | Institutional | | | 5,648,410 | | | | 1,037,802 | | | |
| | | | Class IR | | | 829 | | | | 1,029 | | | |
| | | | Class R | | | 829 | | | | 1,029 | | | |
| |
| | | Net asset value, offering and redemption price per share:(b) | | | | | | | | | | |
| | | | Class A | | | $11.23 | | | | $9.15 | | | |
| | | | Class C | | | 11.13 | | | | 9.05 | | | |
| | | | Institutional | | | 11.28 | | | | 9.20 | | | |
| | | | Class IR | | | 11.21 | | | | 9.16 | | | |
| | | | Class R | | | 11.19 | | | | 9.14 | | | |
| |
| |
| (a) | Includes loaned securities having a market value of $10,505,077 and $1,395,959 for the Structured International Equity Flex and Structured U.S. Equity Flex Funds, respectively. |
| (b) | Maximum public offering price per share (NAV per share multiplied by 1.0582) for Class A Shares of the Structured International Equity Flex and Structured U.S. Equity Flex Funds is $11.88 and $9.68, respectively. At redemption, Class C Shares may be subject to a contingent deferred sales charge, assessed on the amount equal to the lesser of the current NAV or the original purchase price of the shares. |
The accompanying notes are an integral part of these financial statements.
33
GOLDMAN SACHS STRUCTURED EQUITY FLEX FUNDS
Statement of Operations
For the Six Months Ended April 30, 2008 (Unaudited)
| | | | | | | | | | | | |
| | | | | Structured | | Structured |
| | | | | International | | U.S. Equity |
| | | | | Equity Flex Fund | | Flex Fund |
| |
| | | Investment income: |
| |
| | | Dividends(a) | | $ | 4,156,979 | | | $ | 325,134 | |
| | | Interest (including securities lending income of $114,064 and $2,483, respectively) | | | 134,879 | | | | 3,141 | |
| | | |
| | | Total investment income | | | 4,291,858 | | | | 328,275 | |
| | | |
| | | Expenses: |
| |
| | | Management fees | | | 1,893,907 | | | | 178,608 | |
| | | Distribution and Service fees(c) | | | 320,973 | | | | 31,182 | |
| | | Transfer Agent fees(c) | | | 250,853 | | | | 24,331 | |
| | | Custody and accounting fees | | | 187,670 | | | | 37,324 | |
| | | Professional fees | | | 73,768 | | | | 70,927 | |
| | | Printing fees | | | 59,795 | | | | 41,861 | |
| | | Registration fees | | | 38,278 | | | | 28,649 | |
| | | Trustee fees | | | 6,882 | | | | 6,882 | |
| | | Dividend expense on short positions | | | — | | | | 69,656 | |
| | | Other | | | 21,297 | | | | 8,356 | |
| | | |
| | | Total expenses | | | 2,853,423 | | | | 497,776 | |
| | | |
| | | Less — expense reductions | | | (288,344 | ) | | | (183,698 | ) |
| | | |
| | | Net expenses | | | 2,565,079 | | | | 314,078 | |
| | | |
| | | NET INVESTMENT INCOME | | | 1,726,779 | | | | 14,197 | |
| | | |
| | | Realized and unrealized gain (loss) from investment, futures, securities sold short, swap and foreign currency related transactions: |
| |
| | | Net realized loss from: | | | | | | | | |
| | | | Investment transactions | | | (27,087,938 | ) | | | (2,321,558 | ) |
| | | | Futures transactions | | | (285,775 | ) | | | (153,149 | ) |
| | | | Securities sold short | | | — | | | | 882,099 | |
| | | | Swap contract | | | (6,155,202 | ) | | | — | |
| | | | Foreign currency related transactions | | | (67,475 | ) | | | — | |
| | | Net change in unrealized gain (loss) on: | | | | | | | | |
| | | | Investments | | | (30,080,432 | ) | | | (5,085,920 | ) |
| | | | Futures | | | 123,149 | | | | 8,362 | |
| | | | Securities sold short | | | — | | | | 811,319 | |
| | | | Swap contract | | | (82,426 | ) | | | — | |
| | | | Translation of assets and liabilities denominated in foreign currencies | | | (108,032 | ) | | | — | |
| | | |
| | | Net realized and unrealized loss on investment, futures, securities sold short, swap and foreign currency related transactions | | | (63,744,131 | ) | | | (5,858,847 | ) |
| | | |
| | | NET DECREASE IN NET ASSETS RESULTING FROM OPERATIONS | | $ | (62,017,352 | ) | | $ | (5,844,650 | ) |
| | | |
| |
| (a) | Foreign taxes withheld on dividends were $493,796 for the Structured International Equity Flex Fund. |
| (b) | Commenced operations on November 30, 2007. |
| (c) | Class specific Distribution and Service and Transfer Agent fees were as follows: |
| | | | | | | | | | | | | | | | | | | | | | | | | | | | | | | | | |
| | | Distribution and Service Fees | | Transfer Agent Fees |
| | | | | |
| Fund | | Class A | | | Class C | | | Class R(c) | | | Class A | | | Class C | | | Institutional | | | Class IR(c) | | | Class R(c) | |
| | | | | | | | | | | | | | | | | |
| Structured International Equity Flex | | $ | 297,397 | | | $ | 23,557 | | | $ | 19 | | | $ | 226,022 | | | $ | 4,476 | | | $ | 20,341 | | | $ | 7 | | | $ | 7 | |
| Structured U.S. Equity Flex | | | 27,790 | | | | 3,372 | | | | 20 | | | | 21,120 | | | | 640 | | | | 2,555 | | | | 8 | | | | 8 | |
The accompanying notes are an integral part of these financial statements.
34
GOLDMAN SACHS STRUCTURED EQUITY FLEX FUNDS
Statements of Changes in Net Assets
| | | | | | | | | | | | | | | | | | | | | | |
| | | | | Structured International Equity | | Structured U.S. Equity | | |
| | | | | Flex Fund | | Flex Fund | | |
| | | | | | | | | |
| | | | | For the | | | | For the | | | | |
| | | | | Six Months | | | | Six Months | | | | |
| | | | | Ended | | For the | | Ended | | For the | | |
| | | | | April 30, 2008 | | Year Ended | | April 30, 2008 | | Year Ended | | |
| | | | | (Unaudited) | | October 31, 2007 | | (Unaudited) | | October 31, 2007 | | |
| |
| | | From operations: |
| |
| | | Net investment income (loss) | | $ | 1,726,779 | | | $ | 6,480,868 | | | $ | 14,197 | | | $ | (93,224 | ) | | |
| | | Net realized gain (loss) from investment, futures, securities sold short, swap and foreign currency related transactions | | | (33,596,390 | ) | | | 792,575 | | | | (1,592,608 | ) | | | (5,035,068 | ) | | |
| | | Net change in unrealized gain (loss) on investments, futures, securities sold short, swaps and translation of assets and liabilities denominated in foreign currencies | | | (30,147,741 | ) | | | 24,874,351 | | | | (4,266,239 | ) | | | 4,106,465 | | | |
| | | |
| | | Net increase (decrease) in net assets from operations | | | (62,017,352 | ) | | | 32,147,794 | | | | (5,844,650 | ) | | | (1,021,827 | ) | | |
| | | |
| | | Distributions to shareholders: |
| |
| | | From net investment income | | | | | | | | | | | | | | | | | | |
| | | | Class A Shares | | | (4,887,530 | ) | | | — | | | | — | | | | (49,982 | ) | | |
| | | | Class C Shares | | | (76,478 | ) | | | — | | | | — | | | | (10 | ) | | |
| | | | Institutional Shares | | | (2,583,241 | ) | | | — | | | | — | | | | (46,340 | ) | | |
| | | | Class IR Shares(c) | | | (196 | ) | | | — | | | | — | | | | — | | | |
| | | | Class R Shares(c) | | | (196 | ) | | | — | | | | — | | | | — | | | |
| | | From net realized gains | | | | | | | | | | | | | | | | | | |
| | | | Class A Shares | | | (610,354 | ) | | | (126,934 | ) | | | — | | | | (27,477 | ) | | |
| | | | Class C Shares | | | (11,053 | ) | | | (337 | ) | | | — | | | | (21 | ) | | |
| | | | Institutional Shares | | | (281,022 | ) | | | (71,279 | ) | | | — | | | | (18,806 | ) | | |
| | | | Class IR Shares(c) | | | (21 | ) | | | — | | | | — | | | | — | | | |
| | | | Class R Shares(c) | | | (21 | ) | | | — | | | | — | | | | — | | | |
| | | |
| | | Total distributions to shareholders | | | (8,450,112 | ) | | | (198,550 | ) | | | — | | | | (142,636 | ) | | |
| | | |
| | | From share transactions: |
| |
| | | Net proceeds from sales of shares | | | 48,263,907 | | | | 521,038,534 | | | | 2,916,556 | | | | 84,164,756 | | | |
| | | Reinvestment of dividends and distributions | | | 7,690,976 | | | | 179,113 | | | | — | | | | 115,797 | | | |
| | | Cost of shares repurchased | | | (195,422,623 | ) (a) | | | (144,495,795 | ) (b) | | | (27,174,930 | ) | | | (67,715,463 | ) | | |
| | | |
| | | Net increase (decrease) in net assets resulting from share transactions | | | (139,467,740 | ) | | | 376,721,852 | | | | (24,258,374 | ) | | | 16,565,090 | | | |
| | | |
| | | TOTAL INCREASE (DECREASE) | | | (209,935,204 | ) | | | 408,671,096 | | | | (30,103,024 | ) | | | 15,400,627 | | | |
| | | |
| | | Net assets: |
| |
| | | Beginning of period | | | 463,004,855 | | | | 54,333,759 | | | | 54,012,359 | | | | 38,611,732 | | | |
| | | |
| | | End of period | | $ | 253,069,651 | | | $ | 463,004,855 | | | $ | 23,909,335 | | | $ | 54,012,359 | | | |
| | | |
| | | Accumulated undistributed net investment income | | $ | 1,148,586 | | | $ | 6,969,448 | | | $ | 14,776 | | | $ | 579 | | | |
| | | |
| |
| (a) | Net of $5,745 in redemption fees remitted to the Structured International Equity Flex Fund. |
| (b) | Net of $83,958 in redemption fees remitted to the Structured International Equity Flex Fund. |
| (c) | Commenced operations on November 30, 2007. |
The accompanying notes are an integral part of these financial statements.
35
GOLDMAN SACHS STRUCTURED U.S. EQUITY FLEX FUND
Statement of Cash Flows
For the Six Months Ended April 30, 2008 (Unaudited)
| | | | | | | | | |
| |
| | | Cash flows provided by operating activities: |
| |
| | | Dividends and interest received | | $ | 368,923 | | | |
| | | Payment of dividends on securities sold short | | | (73,582 | ) | | |
| | | Operating expenses paid | | | (277,662 | ) | | |
| | | Net payment for margin on futures contracts | | | (132,681 | ) | | |
| | | Purchases of long-term investments | | | (26,685,014 | ) | | |
| | | Proceeds from disposition of long-term investments | | | 59,506,131 | | | |
| | | Purchases of short-term investments, net | | | (1,321,500 | ) | | |
| | | Increase in collateral for securities loaned | | | 1,321,500 | | | |
| | | Purchases to cover securities sold short | | | (20,411,820 | ) | | |
| | | Proceeds for securities sold short | | | 10,931,340 | | | |
| | | |
| | | Net cash provided by operating activities | | | 23,225,635 | | | |
| | | |
| | | Cash flows used for financing activities: |
| |
| | | Net proceeds from sale of shares | | | 2,914,556 | | | |
| | | Net proceeds from repurchased shares | | | (26,973,566 | ) | | |
| | | |
| | | Net cash flows used for financing activities | | | (24,059,010 | ) | | |
| | | |
| | | Net decrease in cash | | | (833,375 | ) | | |
| | | Cash, beginning of period | | | 832,615 | | | |
| | | |
| | | Due to custodian, end of period | | $ | (760 | ) | | |
| | | |
| | | Reconciliation of decrease in net assets from operations to net cash flows provided by operating activities: |
| |
| | | Decrease in net assets from operations | | $ | (5,844,650 | ) | | |
| | | |
| | | Net decrease in cost of investments | | | 34,959,534 | | | |
| | | Net decrease in unrealized appreciation/depreciation on investments | | | 5,084,190 | | | |
| | | Net decrease in cost of investments sold short | | | (10,362,579 | ) | | |
| | | Net increase in payable for open investments | | | 217,076 | | | |
| | | Net decrease in unrealized appreciation/depreciation on investments sold short | | | (811,319 | ) | | |
| | | Decrease in dividends and interest receivable | | | 8,443 | | | |
| | | Decrease in dividends sold short | | | (3,926 | ) | | |
| | | Net increase in due from broker — variation margin | | | 12,106 | | | |
| | | Increase in other assets | | | (277 | ) | | |
| | | Decrease in net accrued expenses | | | (32,963 | ) | | |
| | | |
| | | Total adjustments | | | 29,070,285 | | | |
| | | |
| | | NET CASH FLOWS PROVIDED BY OPERATING ACTIVITIES | | $ | 23,225,635 | | | |
| | | |
A statement of cash flows is required for the Structured U.S. Equity Flex Fund due to the Fund’s use of leverage.
The accompanying notes are an integral part of these financial statements.
36
GOLDMAN SACHS STRUCTURED EQUITY FLEX FUNDS
Notes to Financial Statements
April 30, 2008 (Unaudited)
Goldman Sachs Trust (the “Trust”) is a Delaware statutory trust registered under the Investment Company Act of 1940, as amended (the “Act”), as an open-end management investment company. The Trust includes the Structured International Equity Flex Fund (“Structured International Equity Flex”) and the Structured U.S. Equity Flex Fund (“Structured U.S. Equity Flex”) (collectively, the “Funds” or individually a “Fund”). Each Fund is a diversified portfolio offering five classes of Shares — Class A, Class C, Institutional, Class IR and Class R Shares. Class A Shares of the Funds are sold with a front-end sales charge of up to 5.50%. Class C Shares of the Funds are sold with a contingent deferred sales charge of 1.00% during the first 12 months. Institutional, Class IR and Class R Shares of the Funds are not subject to a sales charge. Goldman, Sachs & Co. (“Goldman Sachs”) serves as distributor of the Funds and receives such sales charges of which a certain portion may be retained. For the Structured International Equity Flex Fund a 2.00% redemption fee will be imposed on the redemption of shares (including by exchange) held for 30 calendar days or less. Class IR and Class R Shares of the Funds commenced operations on November 30, 2007.
Goldman Sachs Asset Management, L.P., (“GSAM”), an affiliate of Goldman Sachs, serves as Investment Adviser pursuant to a Management Agreement (the “Agreement”) with the Trust on behalf of the Funds.
| 2. SIGNIFICANT ACCOUNTING POLICIES |
The following is a summary of the significant accounting policies consistently followed by the Funds. The preparation of financial statements in conformity with U.S. generally accepted accounting principles (“GAAP”) requires management to make estimates and assumptions that may affect the reported amounts. Actual results could differ from those estimates.
A. Investment Valuation — The investment valuation policy of the Funds is to value investments at market value. Investments in securities traded on a foreign equity securities exchange are valued daily at fair value determined by an independent service (if available) under valuation procedures approved by the Trust’s Board of Trustees consistent with applicable regulatory guidance. The independent service takes into account multiple factors including, but not limited to, movements in the U.S. securities markets, certain depositary receipts, futures contracts and foreign currency exchange rates that have occurred subsequent to the close of the foreign securities exchanges. While the independent service may not take into account market or security specific information, under the valuation procedures, these securities might also be fair valued by the adviser by taking into consideration market or security specific information, as discussed below.
Investments in equity securities including equity securities sold short, and investment companies traded on a U.S. securities exchange or the NASDAQ system or for investments in securities traded on a foreign securities exchange for which an independent fair value service is not available are valued daily at their last sale price or official closing price on the principal exchange or system on which they are traded. If no sale occurs, such securities and investment companies are valued at the last bid price. Debt securities are valued at prices supplied by independent pricing services or broker/dealer-supplied valuations. The pricing services may use valuation models or matrix pricing, which considers yield or price with respect to comparable bonds, quotations from bond dealers or by reference to other securities that are considered comparable in such characteristics as rating, interest rate and maturity date, to determine current value. Unlisted equity securities for which market quotations are available are valued at the last sale price on the valuation date, or if no sale occurs, at the last bid price. Investments in investment companies (other than those that are exchange traded) are valued at the net asset value per share on the valuation date. Short-term debt obligations maturing in sixty days or less are valued at amortized cost, which approximates market value. Securities for which market quotations are not readily available or are deemed not to reflect market value by GSAM are valued at fair value using methods approved by the Trust’s Board of Trustees.
In addition, GSAM, consistent with its procedures and applicable regulatory guidance, may determine to make an adjustment to the previous closing prices of either domestic or foreign securities in light of significant events, to reflect what it believes to be the fair value of the securities at the time of determining the Fund’s NAV. Significant events that could affect a large number of securities in a particular market may include, but are not limited to: situations relating to one or more single issuers in a market sector; significant fluctuations in U.S. or foreign markets; market disruptions or market closings; government actions or other developments; as well as the same or similar events which may affect specific issuers or the
37
GOLDMAN SACHS STRUCTURED EQUITY FLEX FUNDS
Notes to Financial Statements (continued)
April 30, 2008 (Unaudited)
| 2. SIGNIFICANT ACCOUNTING POLICIES (continued) |
securities markets even though not tied directly to the securities markets. Other significant events that could relate to a single issuer may include, but are not limited to: corporate actions such as reorganizations, mergers and buy-outs; corporate announcements on earnings; significant litigation and regulatory news such as governmental approvals.
Investing in foreign markets may involve special risks and considerations not typically associated with investing in the United States. These risks include revaluation of currencies, high rates of inflation, repatriation restrictions on income and capital, and adverse political and economic developments. Moreover, securities issued in these markets may be less liquid, subject to government ownership controls and have delayed settlements, and their prices may be more volatile than those of comparable securities in the U.S.
B. Security Transactions and Investment Income — Security transactions are reflected for financial reporting purposes as of the trade date. Realized gains and losses on sales of portfolio securities are calculated using the identified cost basis. Dividend income is recorded on the ex-dividend date, net of foreign withholding taxes, if any, which are reduced by any amounts reclaimable by the Funds, where applicable. Interest income is recorded on the basis of interest accrued, premium amortized and discount accreted. In addition, it is each Fund’s policy to accrue for estimated capital gains taxes on foreign securities held by the Funds, which are subject to taxes. Net investment income (other than class-specific expenses) and unrealized and realized gains or losses are allocated daily to each class of shares of the respective Fund based upon the relative proportion of net assets of each class.
Securities sold within a total return swap are reflected as of trade date. Realized gains and losses are calculated using the financing amount which approximates identified cost and are realized on reset date.
C. Expenses — Expenses incurred by the Trust that do not specifically relate to an individual Fund of the Trust are allocated to the Funds on a straight-line and/or “pro-rata” basis depending upon the nature of the expense.
Class A, Class C and Class R shareholders of the Funds bear all expenses and fees relating to their respective Distribution and Service Plans. Each class of shares of the Funds separately bears its respective class-specific Transfer Agency fees.
D. Federal Taxes and Distributions to Shareholders — It is each Fund’s policy to comply with the requirements of the Internal Revenue Code of 1986, as amended (the “Code”), applicable to regulated investment companies and to distribute each year substantially all of its investment company taxable income and capital gains to its shareholders. Accordingly, no federal tax provisions are required. Dividends and distributions to shareholders are recorded on the ex-dividend date. Income and capital gains distributions, if any, are declared and paid annually. Net capital losses, if any, are carried forward to future years and may be used to the extent allowed by the Code to offset any future capital gains. Utilization of capital loss carryforwards will reduce the requirement of future capital gain distributions.
The characterization of distributions to shareholders for financial reporting purposes is determined in accordance with Federal income tax rules, which may differ from U.S. generally accepted accounting principles. Therefore, the source of the Fund’s distributions may be shown in the accompanying financial statements as either from net investment income, net realized gain, or as a tax return of capital.
In addition, distributions paid by a Fund’s investments in real estate investment trusts (“REITS”) often include a “return of capital” which is recorded by the Fund as a reduction of the cost basis of the securities held. The Code requires a REIT to distribute at least 95% of its taxable income to investors. In many cases, however, because of “non-cash” expenses such as property depreciation, a REIT’s cash flow will exceed its taxable income. The REIT may distribute this excess cash to offer a more competitive yield. This portion of a Fund’s distributions is deemed a return of capital and is generally not taxable to shareholders.
The Funds adopted Financial Accounting Standards Board (“FASB”) Interpretation No. 48, “Accounting of Uncertainty in Income Taxes” (“FIN 48”), on April 30, 2008. FIN 48 establishes financial accounting and disclosure requirements for recognition and measurements of tax positions taken or expected to be taken on an income tax return. GSAM has reviewed the tax positions for the open tax years (tax years ended October 31, 2006 and 2007) and has determined that the implementation of FIN 48 did not have a material impact on the Funds’ financial statements.
38
GOLDMAN SACHS STRUCTURED EQUITY FLEX FUNDS
| 2. SIGNIFICANT ACCOUNTING POLICIES (continued) |
E. Foreign Currency Translations — The books and records of the Funds are maintained in U.S. dollars. Amounts denominated in foreign currencies are translated into U.S. dollars on the following basis: (i) investment valuations, foreign currency and other assets and liabilities initially expressed in foreign currencies are converted each business day into U.S. dollars based upon current exchange rates; and (ii) purchases and sales of foreign investments, income and expenses are converted into U.S. dollars based upon currency exchange rates prevailing on the respective dates of such transactions.
Net realized and unrealized gain (loss) on foreign currency transactions will represent: (i) foreign exchange gains and losses from the sale and holdings of foreign currencies; (ii) currency gains and losses between trade date and settlement date on investment securities transactions and forward exchange contracts; and (iii) gains and losses from the difference between amounts of dividends, interest and foreign withholding taxes recorded and the amounts actually received. The effect of changes in foreign currency exchange rates on securities and derivative instruments are not segregated in the Statements of Operations from the effects of changes in market prices of those securities and derivative instruments, but are included with the net realized and unrealized gain (loss) on securities and derivative instruments. Net unrealized foreign exchange gains and losses arising from changes in the value of other assets and liabilities as a result of changes in foreign exchange rates are included as increases and decreases in unrealized gain (loss) on foreign currency related transactions.
F. Forward Foreign Currency Exchange Contracts — The Funds may enter into forward foreign currency exchange contracts for the purchase or sale of a specific foreign currency at a fixed price on a future date as a hedge or cross-hedge against either specific transactions or portfolio positions. The Funds may also purchase and sell forward contracts to seek to increase total return. All commitments are “marked-to-market” daily at the applicable translation rates and any resulting unrealized gains or losses are recorded in the Funds’ financial statements. The Funds record realized gains or losses at the time a forward contract is offset by entry into a closing transaction or extinguished by delivery of the currency. Risks may arise upon entering into these contracts from the potential inability of counterparties to meet the terms of their contracts and from unanticipated movements in the value of a foreign currency relative to the U.S. dollar.
The contractual amounts of forward foreign currency contracts do not necessarily represent the amounts potentially subject to risk. The measurement of the risks associated with these instruments is meaningful only when all related and offsetting transactions are considered. At April 30, 2008, the Funds had segregated sufficient cash and/or securities to cover any commitments under these contracts.
G. Futures Contracts — The Funds may enter into futures transactions to hedge against changes in interest rates, securities prices, currency exchange rates or to seek to increase total return. Futures contracts are valued at the last settlement price, or in the absence of a sale, the last bid price, at the end of each day on the board of trade or exchange upon which they are traded. Upon entering into a futures contract, the Funds are required to segregate cash or securities equal to the minimum “initial margin” requirement of the associated futures exchange. Subsequent payments for futures contracts (“variation margin”) are paid or received by the Funds, dependent on the fluctuations in the value of the contracts, and are recorded for financial reporting purposes as unrealized gains or losses. When contracts are closed, the Funds realize a gain or loss which is reported in the Statement of Operations.
The use of futures contracts involves, to varying degrees, elements of market and counterparty risk which may exceed the amounts recognized in the Statement of Assets and Liabilities. Changes in the value of a futures contract may not directly correlate with changes in the value of the underlying securities. These risks may decrease the effectiveness of the Funds’ strategies and potentially result in a loss.
H. Redemption Fees — Redemption fees are reimbursed to the Structured International Equity Flex Fund and reflected as a reduction in share redemptions on the Statement of Changes in Net Assets. Redemption fees are credited to Paid-in capital and are allocated to each share class on a pro-rata basis at the time of payment. The Fund uses a first-in first-out method so that shares held longest will be treated as being redeemed first and shares held shortest will be treated as being redeemed last.
39
GOLDMAN SACHS STRUCTURED EQUITY FLEX FUNDS
Notes to Financial Statements (continued)
April 30, 2008 (Unaudited)
| 2. SIGNIFICANT ACCOUNTING POLICIES (continued) |
I. Repurchase Agreements — Repurchase agreements involve the purchase of securities subject to the seller’s agreement to repurchase the securities at a mutually agreed upon date and price. During the term of a repurchase agreement, the value of the underlying securities held as collateral on behalf of the Funds, including accrued interest is required to exceed the value of the repurchase agreement, including accrued interest. If the seller defaults or becomes insolvent, realization of the collateral by the Funds may be delayed or limited and there may be a decline in the value of the collateral during the period while the Funds seek to assert their rights. The underlying securities for all repurchase agreements are held in safekeeping at the Funds’ custodian or designated subcustodians under triparty repurchase agreements.
Pursuant to exemptive relief granted by the Securities and Exchange Commission (“SEC”) and terms and conditions contained therein, the Funds, together with other registered investment companies having management agreements with GSAM, or its affiliates, may transfer uninvested cash into joint accounts, the daily aggregate balance of which is invested in one or more repurchase agreements. In addition, the Funds’ credit exposure is allocated to the underlying repurchase counterparties on a pro-rata basis. With the exception of certain transaction fees, the Funds are not subject to any expenses in relation to these investments.
J. Segregation Transactions — The Funds may enter into certain derivative or other transactions to seek to increase total return. Forward foreign currency exchange contracts, futures contracts, short sales, total return swaps, written options, when-issued securities and forward commitments represent examples of such transactions. As a result of entering into these transactions, the Funds are required to segregate liquid assets with a current value equal to or greater than the market value of the corresponding transactions.
As investment companies registered with the SEC, the Funds must segregate liquid assets to “cover” open positions with respect to certain kinds of derivatives instruments. In the case of swaps that do not settle for cash, for example, the Funds must set aside liquid assets equal to the full notional value of the swaps while the positions are open. With respect to swaps that do settle for cash, however, the Funds are permitted to set aside liquid assets in an amount equal to the Funds’ daily marked-to-market net obligations (i.e., the Funds’ daily net liability) under the swaps, if any, rather than their full notional value.
K. Short Sales — Short selling involves leverage of a Fund’s assets and presents various risks. In order to establish a short position in a security, a Fund must first borrow the security from a lender, such as a Prime Broker or other counterparty. The Funds may not always be able to borrow the security at a particular time or at an acceptable cost. Thus, there is risk that the Funds may be unable to implement their investment strategy due to the lack of available securities or for other reasons.
After selling the borrowed security, a Fund is then obligated to “cover” the short sale by purchasing and returning the security to the lender on a later date. A Fund cannot guarantee that the security necessary to cover a short position will be available for purchase at the time the Fund wishes to close a short position or, if available, that the security will be available at an acceptable price. If the borrowed security has appreciated in value since it was sold, a Fund will be required to pay more for the replacement security than the amount it received from selling the security short. Moreover, purchasing a security to cover a short position can itself cause the price of the security to rise further. The potential loss on a short sale is unlimited because the loss increases as the price of the security sold short increases and the price may rise indefinitely. If the price of a borrowed security declines before the short position is covered, the Fund may realize a gain. A Fund’s gain on a short sale, before transactions and other costs, is generally limited to the difference between the price at which it sold the borrowed security and the price it paid to purchase the security to return to the lender.
Short sales also involve other costs. A Fund must normally repay to the lender an amount equal to any dividend and financing cost that accrues while the loan is outstanding. In addition, to borrow the security, a Fund may be required to pay a premium. A Fund will also incur transaction costs in effecting short sales. The amount of any ultimate gain for a Fund resulting from a short sale will be decreased, and the amount of any ultimate loss will be increased, by the amount of premiums, dividends, interest or expenses a Fund may be required to pay in connection with the short sale.
Until a Fund replaces a borrowed security, a Fund will be required to maintain assets in a segregated account at the custodian as collateral. Thus, short sales involve credit exposure to the broker that executes the short sales. In addition, a
40
GOLDMAN SACHS STRUCTURED EQUITY FLEX FUNDS
| 2. SIGNIFICANT ACCOUNTING POLICIES (continued) |
Fund is required to designate, on the books of its custodian, liquid assets (less any additional collateral already held by the custodian) to cover the short sale obligation, marked-to-market daily. The requirement to segregate assets limits a Fund’s leveraging of its investments and the related risk of losses from leveraging. However, such segregation may also limit a Fund’s investment flexibility, as well as its ability to meet redemption requests or other current obligations.
L. Total Return Swap Transactions — The use of total return swaps is a highly specialized activity which involves investment techniques, risk analyses and tax planning different from those associated with ordinary portfolio securities transactions. The Structured International Equity Flex Fund’s transactions in total return swaps may be significant. These transactions can result in substantial realized and unrealized capital gains and losses relative to the gains and losses from the Fund’s direct investments in equity securities.
Transactions in total return swaps can involve greater risks than if the Fund had invested in securities directly since, in addition to general market risks, swaps are leveraged and are also subject to illiquidity risk, counterparty risk, credit risk and pricing risk. Because they have terms of greater than seven days, swap transactions may be considered to be illiquid. Moreover, the Fund will bear the risk of loss of the amount expected to be received under a total return swap in the event of the default, by, or bankruptcy of a swap counterparty. Total return swaps may also be subject to pricing or “basis” risk, which exists when a particular swap becomes extraordinarily expensive relative to historical prices or the price of corresponding cash market instruments. Under certain market conditions it may not be economically feasible to initiate a transaction or liquidate a position in time to avoid a loss or take advantage of an opportunity. If a swap transaction is particularly large or if the relevant market is illiquid, it may not be possible to initiate a transaction or liquidate a position at an advantageous time or price, which may result in significant losses.
The prices of total return swaps can be volatile, and a variance in the degree of volatility or in the direction of securities prices from the Investment Adviser’s expectations may produce significant losses in the Fund’s investments in swaps. In addition, a perfect correlation between a total return swap and a security’s position may be impossible to achieve. As a result, the Investment Adviser’s use of total return swaps may not be effective in fulfilling the Investment Adviser’s investment strategies and may contribute to losses that would not have been incurred otherwise.
Total return swaps are valued based on the market value of the underlying long and short positions in the swap, valued daily at the last sale price or official closing price on the principal exchange or system on which they are traded. The total market value of the underlying securities plus financing fees, the value of corporate actions, and dividend accruals comprises the total market value of the total return swap position. Total return swaps are reset monthly with change in market value reflected as realized gain or loss.
A. Management Agreement — Under the Agreement, GSAM manages the Funds, subject to the general supervision of the Trust’s Board of Trustees.
As compensation for the services rendered pursuant to the Agreement, the assumption of the expenses related thereto and administering the Funds’ business affairs, including providing facilities, GSAM is entitled to a fee (“Management fee”) computed daily and payable monthly, equal to an annual percentage rate of each Fund’s average daily net assets.
For the six months ended April 30, 2008, GSAM’s contractual Management fees are listed below along with the effective rate for the period:
| | | | | | | | | | | | | |
| | | Contractual Management Rate | | |
| | | | | |
| | | Up to | | Over | | Effective |
| Fund | | $2 billion | | $2 billion | | Rate |
| |
| Structured International Equity Flex | | | 1.10 | % | | | 0.99 | % | | | 1.10 | % |
| |
| Structured U.S. Equity Flex | | | 1.00 | | | | 0.90 | | | | 1.00 | |
| |
41
GOLDMAN SACHS STRUCTURED EQUITY FLEX FUNDS
Notes to Financial Statements (continued)
April 30, 2008 (Unaudited)
| 3. AGREEMENTS (continued) |
B. Distribution Agreement and Service Plan — The Trust, on behalf of each Fund, has adopted Distribution and Service Plans (the “Plans”). Under the Plans, Goldman Sachs and/or authorized dealers are entitled to a monthly fee for distribution services equal to, on an annual basis, 0.25%, 0.75% and 0.50% of each Fund’s average daily net assets attributable to Class A, Class C and Class R Shares, respectively. Additionally, Goldman Sachs and/or authorized dealers are entitled to receive, under the Plans, a separate fee for personal and account maintenance services equal to, on an annual basis, 0.25% of each Fund’s average daily net assets attributable to Class C Shares. With respect to Class A and Class R Shares, the distributor at its discretion may use compensation for distribution services paid under the Plans to compensate service organizations for personal and account maintenance services and expenses so long as such total compensation under the Plans does not exceed the maximum cap on “service fees” imposed by the Financial Industry Regulatory Authority.
Goldman Sachs serves as Distributor of the shares of the Funds pursuant to a Distribution Agreement. Goldman Sachs may retain a portion of the Class A sales load and Class C contingent deferred sales charge. During the six months ended April 30, 2008, Goldman Sachs advised the Funds that it retained the following approximate amounts:
| | | | | | | | | |
| | | | | Contingent Deferred |
| | | Sales Load | | Sales Charge |
| Fund | | Class A | | Class C |
| |
| Structured International Equity Flex | | $ | 1,900 | | | $ | — | |
| |
| Structured U.S. Equity Flex | | | 700 | | | | — | |
| |
C. Transfer Agency Agreement — Goldman Sachs also serves as the Transfer Agent of the Funds for a fee. The fees charged for such transfer agency services are calculated daily and payable monthly at an annual rate as follows: 0.19% of the average daily net assets for Class A, Class C, Class IR and Class R Shares and 0.04% of the average daily net assets for Institutional Shares.
D. Other Agreements — GSAM has voluntarily agreed to limit certain “Other Expenses” of the Funds (excluding Management fees, Distribution and Service fees, Transfer agency fees and expenses, dividend expenses on short sales, taxes, interest, brokerage fees and litigation, indemnification, shareholder meetings and other extraordinary expenses, exclusive of any custody and transfer agent fee credit reductions) to the extent such expenses exceed, on an annual basis, 0.064% of the average daily net assets of each Fund. Such expense reimbursements, if any, are computed daily and paid monthly. In addition, the Funds are not obligated to reimburse GSAM for prior fiscal year expense reimbursements, if any.
For the six months ended April 30, 2008, GSAM has voluntarily agreed to waive certain fees and reimburse other expenses. In addition, the Funds have entered into certain offset arrangements with the custodian and the transfer agent resulting in a reduction in the Funds’ expenses. These expense reductions were as follows (in thousands):
| | | | | | | | | | | | | | | | | |
| | | | | Expense Credits | | |
| | | | | | | |
| | | Other | | | | Transfer | | Total |
| | | Expense | | Custody | | Agent | | Expense |
| Fund | | Reimbursement | | Fee | | Fee | | Reductions |
| |
| Structured International Equity Flex | | $ | 277 | | | $ | 8 | | | $ | 3 | | | $ | 288 | |
| |
| Structured U.S. Equity Flex | | | 183 | | | | 1 | | | | — | | | | 184 | |
| |
42
GOLDMAN SACHS STRUCTURED EQUITY FLEX FUNDS
| 3. AGREEMENTS (continued) |
At April 30, 2008, the amounts owed to affiliates were as follows (in thousands):
| | | | | | | | | | | | | | | | | |
| | | | | Distribution | | Transfer | | |
| | | Management | | and Service | | Agent | | |
| Fund | | Fees | | Fees | | Fees | | Total |
| |
| Structured International Equity Flex | | $ | 229 | | | $ | 42 | | | $ | 32 | | | $ | 303 | |
| |
| Structured U.S. Equity Flex | | | 20 | | | | 3 | | | | 2 | | | | 25 | |
| |
| 4. PORTFOLIO SECURITIES TRANSACTIONS |
The cost of purchases and proceeds from sales and maturities of long-term securities for the six months ended April 30, 2008, were as follows:
| | | | | | | | | | | | | | | | | |
| | | | | | | Purchases to | | |
| | | | | Sales and | | Cover Securities | | Securities |
| Fund | | Purchases | | Maturities | | Sold Short | | Sold Short |
| |
| Structured International Equity Flex | | $ | 208,922,209 | | | $ | 360,294,103 | | | $ | — | | | $ | — | |
| |
| Structured U.S. Equity Flex | | | 27,027,901 | | | | 61,031,942 | | | | 20,411,820 | | | | 10,931,340 | |
| |
For the six months ended April 30, 2008, Structured International Equity Flex and Structured U.S. Equity Flex paid commissions of approximately $17,000 and $1,700, respectively, in connection with futures contracts entered into with Goldman Sachs as the Futures Commission Merchant.
Pursuant to exemptive relief granted by the SEC and the terms and conditions contained therein, the Funds may lend their securities through a securities lending agent, Goldman Sachs Agency Lending (“GSAL”), formerly Boston Global Advisors, a wholly owned subsidiary of Goldman Sachs, to certain qualified borrowers including Goldman Sachs and affiliates. In accordance with the Funds’ security lending procedures, the loans are collateralized at all times with cash and/or securities with a market value at least equal to the securities on loan. The market value of the loaned securities is determined at the close of business of the Funds at their last sale price or official closing price on the principal exchange or system on which they are traded and any additional required collateral is delivered to the Funds on the next business day. As with other extensions of credit, the Funds bear the risk of delay on recovery or loss of rights in the collateral should the borrower of the securities fail financially.
The Funds invest the cash collateral received in connection with securities lending transactions in the Enhanced Portfolio of Boston Global Investment Trust (“Enhanced Portfolio”), a Delaware statutory trust. The Enhanced Portfolio is exempt from registration under Section 3(c)(7) of the Act and is managed by GSAM, for which GSAM receives an investment advisory fee of up to 0.10% of the average daily net assets of the Enhanced Portfolio. The Enhanced Portfolio invests in money market instruments, but is not a “money market fund” subject to requirements of Rule 2a-7 of the Act. The Funds bear the risk of incurring a loss from the investment of cash collateral due to either credit or market factors.
Both the Funds and GSAL receive compensation relating to the lending of the Funds’ securities. The amounts earned by the Funds for the six months ended April 30, 2008, are reported parenthetically under Investment Income on the Statements of Operations.
43
GOLDMAN SACHS STRUCTURED EQUITY FLEX FUNDS
Notes to Financial Statements (continued)
April 30, 2008 (Unaudited)
| 5. SECURITIES LENDING (continued) |
The table below details securities lending activity as of, and for the six months ended April 30, 2008:
| | | | | | | | | | | | | |
| | | | | Earnings Received | | |
| | | Earnings of GSAL | | by the Funds | | |
| | | Relating to | | from Lending to | | Amount Payable to |
| | | Securities Loaned | | Goldman Sachs | | Goldman Sachs |
| | | for the | | for the | | Upon Return of |
| | | Six Months Ended | | Six Months Ended | | Securities Loaned |
| Fund | | April 30, 2008 | | April 30, 2008 | | as of April 30, 2008 |
| |
| Structured International Equity Flex | | $ | 12,714 | | | $ | 29,349 | | | $ | 1,590,850 | |
| |
| Structured U.S. Equity Flex | | | 277 | | | | 96 | | | | — | |
| |
| 6. LINE OF CREDIT FACILITY |
The Funds participate in a $450,000,000 committed, unsecured revolving line of credit facility (the “facility”) together with other funds of the Trust and registered investment companies having management agreements with GSAM or affiliates. This facility is to be used solely for temporary or emergency purposes. The interest rate on borrowings is based on the federal funds rate. The committed facility also requires a fee to be paid by the Funds based on the amount of the commitment that has not been utilized. For the six months ended April 30, 2008, the Funds did not have any borrowings under the facility. Effective May 13, 2008, the facility was increased to $700,000,000.
As of the Funds’ most recent fiscal year end, October 31, 2007, the Funds’ capital loss carryforwards and certain timing differences on a tax basis were as follows:
| | | | | | | | | |
| | | Structured International | | Structured U.S. |
| | | Equity Flex | | Equity Flex |
| |
Capital loss carryforward1
Expiring 2015 | | $ | — | | | $ | (4,645,817 | ) |
| |
| Timing differences (unrealized swap gains) | | | (119,862 | ) | | | — | |
| |
| |
| 1 | Expiration occurs on October 31 of the year indicated. |
At April 30, 2008, the Funds’ aggregate security unrealized gains and losses based on cost for U.S. federal income tax purposes was as follows:
| | | | | | | | | |
| | | Structured International | | Structured U.S. |
| | | Equity Flex | | Equity Flex |
| |
| Tax Cost | | $ | 256,560,322 | | | $ | 35,033,221 | |
| |
| Gross unrealized gain | | | 11,646,658 | | | | 1,814,529 | |
| Gross unrealized loss | | | (16,240,416 | ) | | | (2,863,847 | ) |
| |
| Net unrealized security gain (loss) | | $ | (4,593,758 | ) | | $ | (1,049,318 | ) |
| |
The difference between book-basis and tax-basis unrealized gains (losses) is attributable primarily to wash sales, differences related to the Passive Foreign Investment Company investments, net mark to market gains (losses) on Section 1256 futures and foreign currency contracts recognized for tax purposes as of the most recent fiscal year end.
44
GOLDMAN SACHS STRUCTURED EQUITY FLEX FUNDS
Indemnifications — Under the Trust’s organizational documents, its Trustees, officers, employees and agents are indemnified, to the extent permitted by the Act, against certain liabilities that may arise out of performance of their duties to the Funds. Additionally, in the course of business, the Funds enter into contracts that contain a variety of indemnification clauses. The Funds’ maximum exposure under these arrangements is unknown, as this would involve future claims that may be made against the Funds that have not yet occurred. However, the Funds believe the risk of loss under these arrangements to be minimal.
New Accounting Pronouncements — On September 15, 2006, the FASB released Statement of Financial Accounting Standards No. 157, “Fair Value Measurements” (“FAS 157”), which provides enhanced guidance for using fair value to measure assets and liabilities. FAS 157 requires companies to provide expanded information about the assets and liabilities measured at fair value and the potential effect of these fair valuations on an entity’s financial performance. FAS 157 does not expand the use of fair value in any new circumstances, but provides clarification on acceptable fair valuation methods and applications. FAS 157 is effective for financial statements issued for fiscal years beginning after November 15, 2007. GSAM does not believe the adoption of FAS 157 will impact the amounts reported in the financial statements; however, additional disclosures will be required.
In March 2008, the FASB issued Statement of Financial Accounting Standards No. 161, “Disclosures about Derivative Instruments and Hedging Activities” (“FAS 161”). FAS 161 is effective for fiscal years and interim periods beginning after November 15, 2008. FAS 161 requires enhanced disclosures about the Funds’ derivative and hedging activities. Management is currently evaluating the impact the adoption of FAS 161 will have on the Funds’ financial statement disclosures.
45
GOLDMAN SACHS STRUCTURED EQUITY FLEX FUNDS
Notes to Financial Statements (continued)
April 30, 2008 (Unaudited)
| 8. OTHER MATTERS (continued) |
| | | | | | | | | | | | | | | | | |
| | | Structured International Equity Flex Fund |
| | | |
| | | For the Six Months Ended | | |
| | | April 30, 2008 | | For the Year Ended |
| | | (Unaudited) | | October 31, 2007 |
| | | |
| | | Shares | | | Dollars | | | Shares | | | Dollars | |
| | | |
Class A Shares | | | | | | | | | | | | | | | | |
| Shares sold | | | 3,078,128 | | | $ | 35,058,076 | | | | 28,520,841 | | | $ | 350,359,828 | |
| Reinvestment of dividends and distributions | | | 398,004 | | | | 4,883,515 | | | | 9,818 | | | | 107,014 | |
| Shares redeemed | | | (11,024,612 | ) | | | (122,039,899 | ) | | | (7,434,724 | ) | | | (90,053,895 | ) |
| |
| | | | (7,548,480 | ) | | | (82,098,308 | ) | | | 21,095,935 | | | | 260,412,947 | |
| |
Class C Shares | | | | | | | | | | | | | | | | |
| Shares sold | | | 72,590 | | | | 846,226 | | | | 402,897 | | | | 4,983,826 | |
| Reinvestment of dividends and distributions | | | 5,041 | | | | 61,437 | | | | 31 | | | | 337 | |
| Shares redeemed | | | (71,340 | ) | | | (784,267 | ) | | | (11,709 | ) | | | (140,610 | ) |
| |
| | | | 6,291 | | | | 123,396 | | | | 391,219 | | | | 4,843,553 | |
| |
Institutional Shares | | | | | | | | | | | | | | | | |
| Shares sold | | | 1,087,899 | | | | 12,339,605 | | | | 13,432,212 | | | | 165,694,880 | |
| Reinvestment of dividends and distributions | | | 223,038 | | | | 2,745,590 | | | | 6,566 | | | | 71,762 | |
| Shares redeemed | | | (6,603,650 | ) | | | (72,598,457 | ) | | | (4,668,777 | ) | | | (54,301,290 | ) |
| |
| | | | (5,292,713 | ) | | | (57,513,262 | ) | | | 8,770,001 | | | | 111,465,352 | |
| |
Class IR Shares(a) | | | | | | | | | | | | | | | | |
| Shares sold | | | 811 | | | | 10,000 | | | | — | | | | — | |
| Reinvestment of dividends and distributions | | | 18 | | | | 217 | | | | — | | | | — | |
| |
| | | | 829 | | | | 10,217 | | | | — | | | | — | |
| |
Class R Shares(a) | | | | | | | | | | | | | | | | |
| Shares sold | | | 811 | | | | 10,000 | | | | — | | | | — | |
| Reinvestment of dividends and distributions | | | 18 | | | | 217 | | | | — | | | | — | |
| |
| | | | 829 | | | | 10,217 | | | | — | | | | — | |
| |
NET INCREASE (DECREASE) | | | (12,833,244 | ) | | $ | (139,467,740 | ) | | | 30,257,155 | | | $ | 376,721,852 | |
| |
| |
| (a) | Commenced operations on November 30, 2007. |
46
GOLDMAN SACHS STRUCTURED EQUITY FLEX FUNDS
| 9. SUMMARY OF SHARE TRANSACTIONS |
Share activity is as follows:
| | | | | | | | | | | | | | | | | |
| | | Structured U.S. Equity Flex Fund |
| | | |
| | | For the Six Months Ended | | |
| | | April 30, 2008 | | For the Year Ended |
| | | (Unaudited) | | October 31, 2007 |
| | | |
| | | Shares | | | Dollars | | | Shares | | | Dollars | |
| | | |
Class A Shares | | | | | | | | | | | | | | | | |
| Shares sold | | | 263,612 | | | $ | 2,469,788 | | | | 4,731,595 | | | $ | 49,348,368 | |
| Reinvestment of dividends and distributions | | | — | | | | — | | | | 5,148 | | | | 52,821 | |
| Shares redeemed | | | (2,232,491 | ) | | | (20,728,782 | ) | | | (2,938,967 | ) | | | (29,577,078 | ) |
| |
| | | | (1,968,879 | ) | | | (18,258,994 | ) | | | 1,797,776 | | | | 19,824,111 | |
| |
Class C Shares | | | | | | | | | | | | | | | | |
| Shares sold | | | 26,632 | | | | 249,682 | | | | 61,310 | | | | 644,905 | |
| Reinvestment of dividends and distributions | | | — | | | | — | | | | 2 | | | | 24 | |
| Shares redeemed | | | (12,806 | ) | | | (120,974 | ) | | | (2,514 | ) | | | (24,787 | ) |
| |
| | | | 13,826 | | | | 128,708 | | | | 58,798 | | | | 620,142 | |
| |
Institutional Shares | | | | | | | | | | | | | | | | |
| Shares sold | | | 18,836 | | | | 177,086 | | | | 3,270,179 | | | | 34,171,483 | |
| Reinvestment of dividends and distributions | | | — | | | | — | | | | 6,136 | | | | 62,952 | |
| Shares redeemed | | | (683,580 | ) | | | (6,325,174 | ) | | | (3,698,125 | ) | | | (38,113,598 | ) |
| |
| | | | (664,744 | ) | | | (6,148,088 | ) | | | (421,810 | ) | | | (3,879,163 | ) |
| |
Class IR Shares(a) | | | | | | | | | | | | | | | | |
| Shares sold | | | 1,029 | | | | 10,000 | | | | — | | | | — | |
| |
Class R Shares(a) | | | | | | | | | | | | | | | | |
| Shares sold | | | 1,029 | | | | 10,000 | | | | — | | | | — | |
| |
NET INCREASE (DECREASE) | | | (2,617,739 | ) | | $ | (24,258,374 | ) | | | 1,434,764 | | | $ | 16,565,090 | |
| |
| |
| (a) | Commenced operations on November 30, 2007. |
47
GOLDMAN SACHS STRUCTURED INTERNATIONAL EQUITY FLEX FUND
Financial Highlights
Selected Data for a Share Outstanding Throughout Each Period
| | | | | | | | | | | | | | | | | | | | | | | | | | | | | | | | | |
| | | | | | | Income (loss) from | | Distributions | | |
| | | | | | | investment operations | | to shareholders | | |
| | | | | | | | | | | |
| | | | | Net asset | | | | | | |
| | | | | value, | | Net | | Net realized | | Total from | | From net | | From net | | | | |
| | | | | beginning | | investment | | and unrealized | | investment | | investment | | realized | | Total | | |
| | | Year - Share Class | | of period | | income (loss)(a) | | gain (loss) | | operations | | income | | gains | | distributions | | |
| |
| | | FOR THE SIX MONTHS ENDED APRIL 30, (UNAUDITED) |
| |
| | | 2008 - A | | $ | 13.08 | | | $ | 0.06 | | | $ | (1.67 | ) | | $ | (1.61 | ) | | $ | (0.21 | ) | | $ | (0.03 | ) | | $ | (0.24 | ) | | |
| | | 2008 - C | | | 12.98 | | | | 0.03 | | | | (1.67 | ) | | | (1.64 | ) | | | (0.18 | ) | | | (0.03 | ) | | | (0.21 | ) | | |
| | | 2008 - Institutional | | | 13.15 | | | | 0.06 | | | | (1.66 | ) | | | (1.60 | ) | | | (0.24 | ) | | | (0.03 | ) | | | (0.27 | ) | | |
| | | 2008 - IR (commenced November 30, 2007) | | | 12.32 | | | | 0.10 | | | | (0.94 | ) | | | (0.84 | ) | | | (0.24 | ) | | | (0.03 | ) | | | (0.27 | ) | | |
| | | 2008 - R (commenced November 30, 2007) | | | 12.32 | | | | 0.08 | | | | (0.94 | ) | | | (0.86 | ) | | | (0.24 | ) | | | (0.03 | ) | | | (0.27 | ) | | |
| | | FOR THE YEAR ENDED OCTOBER 31, |
| |
| | | 2007 - A | | | 10.67 | | | | 0.30 | | | | 2.14 | | | | 2.44 | | | | — | | | | (0.03 | ) | | | (0.03 | ) | | |
| | | 2007 - C | | | 10.66 | | | | 0.26 | | | | 2.09 | | | | 2.35 | | | | — | | | | (0.03 | ) | | | (0.03 | ) | | |
| | | 2007 - Institutional | | | 10.69 | | | | 0.38 | | | | 2.11 | | | | 2.49 | | | | — | | | | (0.03 | ) | | | (0.03 | ) | | |
| | | FOR THE PERIOD ENDED OCTOBER 31, |
| |
| | | 2006 - A (commenced July 31, 2006) | | | 10.00 | | | | — | (d) | | | 0.67 | | | | 0.67 | | | | — | | | | — | | | | — | | | |
| | | 2006 - C (commenced July 31, 2006) | | | 10.00 | | | | (0.02 | ) | | | 0.68 | | | | 0.68 | | | | — | | | | — | | | | — | | | |
| | | 2006 - Institutional (commenced July 31, 2006) | | | 10.00 | | | | 0.02 | | | | 0.67 | | | | 0.69 | | | | — | | | | — | | | | — | | | |
| | | |
| |
| (a) | Calculated based on the average shares outstanding methodology. |
| (b) | Assumes investment at the net asset value at the beginning of the period, reinvestment of all dividends and distributions, a complete redemption of the investment at the net asset value at the end of the period and no sales or redemption charges. Total return would be reduced if a sales or redemption charge were taken into account. Total returns for periods less than one full year are not annualized. Returns do not reflect the deduction of taxes that a shareholder would pay on Fund distributions or the redemption of Fund shares. |
| (c) | Annualized. |
| (d) | Amount is less than $0.005 per share. |
The accompanying notes are an integral part of these financial statements.
48
GOLDMAN SACHS STRUCTURED INTERNATIONAL EQUITY FLEX FUND
| | | | | | | | | | | | | | | | | | | | | | | | | | | | | | | | | | | |
| | | | | | | | | | | | | Ratios assuming no | | | | |
| | | | | | | | | | | | | expense reductions | | | | |
| | | | | | | | | | | | | | | | | |
| | | | | | | | | | | Ratio of | | | | Ratio of | | | | |
| | | | | | | Net assets, | | Ratio of | | net investment | | Ratio of | | net investment | | | | |
| | | Net asset | | | | end of | | net expenses | | income (loss) | | total expenses | | income (loss) | | Portfolio | | |
| | | value, end | | Total | | period | | to average | | to average | | to average | | to average | | turnover | | |
| | | of period | | return(b) | | (in 000s) | | net assets | | net assets | | net assets | | net assets | | rate | | |
| |
| | | |
| |
| | | $ | 11.23 | | | | (12.50 | )% | | $ | 184,770 | | | | 1.59 | %(c) | | | 1.00 | %(c) | | | 1.76 | %(c) | | | 0.83 | %(c) | | | 61 | % | | |
| | | | 11.13 | | | | (12.80 | ) | | | 4,541 | | | | 2.34 | (c) | | | 0.61 | (c) | | | 2.51 | (c) | | | 0.44 | (c) | | | 61 | | | |
| | | | 11.28 | | | | (12.30 | ) | | | 63,741 | | | | 1.19 | (c) | | | 1.03 | (c) | | | 1.36 | (c) | | | 0.86 | (c) | | | 61 | | | |
| | | | 11.21 | | | | (7.02 | ) | | | 9 | | | | 1.34 | (c) | | | 2.12 | (c) | | | 1.55 | (c) | | | 1.91 | (c) | | | 61 | | | |
| | | | 11.19 | | | | (7.19 | ) | | | 9 | | | | 1.84 | (c) | | | 1.65 | (c) | | | 2.05 | (c) | | | 1.44 | (c) | | | 61 | | | |
| | | |
| |
| | | | 13.08 | | | | 22.88 | | | | 313,922 | | | | 1.60 | | | | 2.49 | | | | 1.90 | | | | 2.19 | | | | 75 | | | |
| | | | 12.98 | | | | 22.06 | | | | 5,215 | | | | 2.35 | | | | 2.20 | | | | 2.65 | | | | 1.90 | | | | 75 | | | |
| | | | 13.15 | | | | 23.31 | | | | 143,867 | | | | 1.20 | | | | 3.15 | | | | 1.50 | | | | 2.85 | | | | 75 | | | |
| | | |
| |
| | | | 10.67 | | | | 6.70 | | | | 31,009 | | | | 1.60 | (d) | | | 0.10 | (d) | | | 4.53 | (d) | | | (2.83 | )(d) | | | 11 | | | |
| | | | 10.66 | | | | 6.60 | | | | 113 | | | | 2.35 | (d) | | | (0.62 | )(d) | | | 5.58 | (d) | | | (3.85 | )(d) | | | 11 | | | |
| | | | 10.69 | | | | 6.90 | | | | 23,212 | | | | 1.20 | (d) | | | 0.82 | (d) | | | 4.48 | (d) | | | (2.46 | )(d) | | | 11 | | | |
| |
The accompanying notes are an integral part of these financial statements.
49
GOLDMAN SACHS STRUCTURED U.S. EQUITY FLEX FUND
Financial Highlights
Selected Data for a Share Outstanding Throughout Each Period
| | | | | | | | | | | | | | | | | | | | | | | | | | | | | | | | | |
| | | | | | | Income (loss) from | | Distributions | | |
| | | | | | | investment operations | | to shareholders | | |
| | | | | | | | | | | |
| | | | | Net asset | | | | | | |
| | | | | value, | | Net | | Net realized | | Total from | | From net | | From net | | | | |
| | | | | beginning | | investment | | and unrealized | | investment | | investment | | realized | | Total | | |
| | | Year - Share Class | | of period | | income (loss)(a) | | gain (loss) | | operations | | income | | gains | | distributions | | |
| |
| | | FOR THE SIX MONTHS ENDED APRIL 30, (UNAUDITED) |
| |
| | | 2008 - A | | $ | 10.33 | | | $ | 0.01 | | | $ | (1.19 | ) | | $ | (1.18 | ) | | $ | — | | | $ | — | | | $ | — | | | |
| | | 2008 - C | | | 10.25 | | | | (0.03 | ) | | | (1.17 | ) | | | (1.20 | ) | | | — | | | | — | | | | — | | | |
| | | 2008 - Institutional | | | 10.36 | | | | 0.02 | | | | (1.18 | ) | | | (1.16 | ) | | | — | | | | — | | | | — | | | |
| | | 2008 - IR (commenced November 30, 2007) | | | 9.72 | | | | — | (c) | | | (0.56 | ) | | | (0.56 | ) | | | — | | | | — | | | | — | | | |
| | | 2008 - R (commenced November 30, 2007) | | | 9.72 | | | | — | (c) | | | (0.58 | ) | | | (0.58 | ) | | | — | | | | — | | | | — | | | |
| | | FOR THE YEAR ENDED OCTOBER 31, |
| |
| | | 2007 - A | | | 10.19 | | | | (0.03 | ) | | | 0.20 | | | | 0.17 | | | | (0.02 | ) | | | (0.01 | ) | | | (0.03 | ) | | |
| | | 2007 - C | | | 10.18 | | | | (0.12 | ) | | | 0.21 | | | | 0.09 | | | | (0.01 | ) | | | (0.01 | ) | | | (0.02 | ) | | |
| | | 2007 - Institutional | | | 10.19 | | | | 0.02 | | | | 0.19 | | | | 0.21 | | | | (0.03 | ) | | | (0.01 | ) | | | (0.04 | ) | | |
| | | FOR THE PERIOD ENDED OCTOBER 31, |
| |
| | | 2006 - A (commenced September 29, 2006) | | | 10.00 | | | | — | (c) | | | 0.19 | | | | 0.19 | | | | — | | | | — | | | | — | | | |
| | | 2006 - C (commenced September 29, 2006) | | | 10.00 | | | | — | (c) | | | 0.18 | | | | 0.18 | | | | — | | | | — | | | | — | | | |
| | | 2006 - Institutional (commenced September 29, 2006) | | | 10.00 | | | | 0.01 | | | | 0.18 | | | | 0.19 | | | | — | | | | — | | | | — | | | |
| | | |
| |
| (a) | Calculated based on the average shares outstanding methodology. |
| (b) | Assumes investment at the net asset value at the beginning of the period, reinvestment of all dividends and distributions, a complete redemption of the investment at the net asset value at the end of the period and no sales or redemption charges. Total return would be reduced if a sales or redemption charge were taken into account. Total returns for periods less than one full year are not annualized. Returns do not reflect the deduction of taxes that a shareholder would pay on Fund distributions or the redemption of Fund shares. |
| (c) | Amount is less than $0.005 per share. |
| (d) | Annualized. |
| (e) | Includes non-recurring expense for a special shareholder meeting which amounted to approximately 0.02% of average net assets. |
The accompanying notes are an integral part of these financial statements.
50
GOLDMAN SACHS STRUCTURED U.S. EQUITY FLEX FUND
| | | | | | | | | | | | | | | | | | | | | | | | | | | | | | | | | | | | | | | | | | | |
| | | | | | | | | | | | | | | Ratios assuming no expense reductions | | | | |
| | | | | | | | | Ratio of | | Ratio of | | | | | | | | |
| | | | | | | | | net expenses | | net expenses | | | | Ratio of | | Ratio of | | | | | | |
| | | | | | | | | to average | | to average | | Ratio of | | total expenses | | total expenses | | Ratio of | | | | |
| | | | | | | Net assets, | | net assets | | net assets | | net investment | | (including dividend | | (excluding dividend | | net investment | | | | |
| | | Net asset | | | | end of | | (including dividend | | (excluding dividend | | income (loss) | | expenses for | | expenses for | | income (loss) | | Portfolio | | |
| | | value, end | | Total | | period | | expenses for | | expenses for | | to average | | securities sold | | securities sold | | to average | | turnover | | |
| | | of period | | return(b) | | (in 000s) | | securities sold short) | | securities sold short) | | net assets | | short) | | short) | | net assets | | rate | | |
| |
| | | |
| |
| | | $ | 9.15 | | | | (11.42 | )% | | $ | 13,672 | | | | 1.88 | %(d) | | | 1.49 | %(d) | | | (0.02 | )% (d) | | | 2.91 | %(d) | | | 2.52 | %(d) | | | (1.05 | )%(d) | | | 97 | % | | |
| | | | 9.05 | | | | (11.71 | ) | | | 667 | | | | 2.63 | (d) | | | 2.24 | (d) | | | (0.88 | )(d) | | | 3.66 | (d) | | | 3.27 | (d) | | | (1.91 | )(d) | | | 97 | | | |
| | | | 9.20 | | | | (11.20 | ) | | | 9,552 | | | | 1.48 | (d) | | | 1.09 | (d) | | | 0.31 | (d) | | | 2.51 | (d) | | | 2.12 | (d) | | | (0.72 | )(d) | | | 97 | | | |
| | | | 9.16 | | | | (5.76 | ) | | | 9 | | | | 1.63 | (d) | | | 1.25 | (d) | | | (0.05 | )(d) | | | 2.92 | (d) | | | 2.54 | (d) | | | (1.34 | )(d) | | | 97 | | | |
| | | | 9.14 | | | | (5.97 | ) | | | 9 | | | | 2.13(d) | | | | 1.74 | (d) | | | (0.57 | )(d) | | | 3.42 | (d) | | | 3.03 | (d) | | | (1.86 | )(d) | | | 97 | | | |
| | | |
| |
| | | | 10.33 | | | | 1.67 | | | | 35,761 | | | | 1.90 | (e) | | | 1.52 | (e) | | | (0.30 | )(e) | | | 2.63 | (e) | | | 2.25 | (e) | | | (1.03 | )(e) | | | 247 | | | |
| | | | 10.25 | | | | 0.84 | | | | 613 | | | | 2.65 | (e) | | | 2.27 | (e) | | | (1.17 | )(e) | | | 3.38 | (e) | | | 3.00 | (e) | | | (1.90 | )(e) | | | 247 | | | |
| | | | 10.36 | | | | 2.03 | | | | 17,638 | | | | 1.50 | (e) | | | 1.12 | (e) | | | 0.18 | (e) | | | 2.23 | (e) | | | 1.85 | (e) | | | (0.55 | )(e) | | | 247 | | | |
| | | |
| |
| | | | 10.19 | | | | 1.90 | | | | 16,962 | | | | 1.66(d) | | | | 1.50 | (d) | | | (0.18 | )(d) | | | 6.40 | (d) | | | 6.24 | (d) | | | (4.92 | )(d) | | | 28 | | | |
| | | | 10.18 | | | | 1.80 | | | | 10 | | | | 2.28 | (d) | | | 2.25 | (d) | | | 0.40 | (d) | | | 7.97 | (d) | | | 7.94 | (d) | | | (5.29 | )(d) | | | 28 | | | |
| | | | 10.19 | | | | 1.90 | | | | 21,640 | | | | 1.24(d) | | | | 1.10 | (d) | | | 1.41 | (d) | | | 5.84 | (d) | | | 5.70 | (d) | | | (3.19 | )(d) | | | 28 | | | |
| |
The accompanying notes are an integral part of these financial statements.
51
GOLDMAN SACHS STRUCTURED EQUITY FLEX FUND
Fund Expenses (Unaudited) — Six Months Ended April 30, 2008
| |
| | As a shareholder of Class A, Class C, Institutional, Class IR or Class R Shares of the Funds you incur two types of costs: (1) transaction costs, including sales charges (loads) on purchase payments (with respect to Class A Shares), or contingent deferred sales charges (loads) on redemptions (with respect to Class C shares) and redemption fees (with respect to Class A, Class C, Institutional, Class IR or Class R Shares, if any (for Structured International Flex Fund only) and (2) ongoing costs, including management fees; distribution and service (12b-1) fees (with respect to Class A, Class C and Class R Shares); and other Fund expenses. This Example is intended to help you understand your ongoing costs (in dollars) of investing in Class A, Class C, Institutional, Class IR and Class R Shares of the Funds and to compare these costs with the ongoing costs of investing in other mutual funds. |
| |
| | The Example is based on an investment of $1,000 invested at the beginning of the period and held for the entire period from November 1, 2007 through April 30, 2008. |
| |
| | Actual Expenses — The first line under each share class in the table below provides information about actual account values and actual expenses. You may use the information in this line, together with the amount you invested, to estimate the expenses that you paid over the period. Simply divide your account value by $1,000 (for example, an $8,600 account value divided by $1,000=8.6), then multiply the result by the number in the first line under the heading entitled “Expenses Paid” to estimate the expenses you paid on your account during this period. |
| |
| | Hypothetical Example for Comparison Purposes — The second line under each share class in the table below provides information about hypothetical account values and hypothetical expenses based on the Funds’ actual net expense ratio and an assumed rate of return of 5% per year before expenses, which is not the Funds’ actual return. The hypothetical account values and expenses may not be used to estimate the actual ending account balance or expenses you paid for the period. You may use this information to compare the ongoing costs of investing in the Funds and other funds. To do so, compare this 5% hypothetical example with the 5% hypothetical examples that appear in the shareholder reports of the other funds. |
| |
| | Please note that the expenses shown in the table are meant to highlight your ongoing costs only and do not reflect any transactional costs, such as sales charges (loads), redemption fees, or exchange fees. Therefore, the second line of the table is useful in comparing ongoing costs only, and will not help you determine the relative total costs of owning different funds. In addition, if these transactional costs were included, your costs would have been higher. |
| | | | | | | | | | | | | | | | | | | | | | | | | |
| |
| | | Structured International Equity Flex Fund | | Structured U.S. Equity Flex Fund |
| |
| | | Expenses | | | | Expenses |
| | | Beginning | | Ending | | Paid for the | | Beginning | | Ending | | Paid for the |
| | | Account | | Account | | 6 months | | Account | | Account | | 6 months |
| | | Value | | Value | | ended | | Value | | Value | | ended |
| Share Class | | 11/1/07 | | 04/30/08 | | 04/30/08* | | 11/1/07 | | 04/30/08 | | 04/30/08* |
| |
Class A | | | | | | | | | | | | | | | | | | | | | | | | |
| Actual | | $ | 1,000.00 | | | $ | 875.00 | | | $ | 7.41 | | | $ | 1,000.00 | | | $ | 885.80 | | | $ | 8.83 | |
| Hypothetical 5% return | | | 1,000.00 | | | | 1,016.96 | + | | | 7.97 | | | | 1,000.00 | | | | 1,015.49 | + | | | 9.44 | |
| |
Class C | | | | | | | | | | | | | | | | | | | | | | | | |
| Actual | | | 1,000.00 | | | | 872.00 | | | | 10.91 | | | | 1,000.00 | | | | 882.90 | | | | 12.30 | |
| Hypothetical 5% return | | | 1,000.00 | | | | 1,013.21 | + | | | 11.73 | | | | 1,000.00 | | | | 1,011.80 | + | | | 13.14 | |
| |
Institutional | | | | | | | | | | | | | | | | | | | | | | | | |
| Actual | | | 1,000.00 | | | | 877.00 | | | | 5.53 | | | | 1,000.00 | | | | 888.00 | | | | 6.95 | |
| Hypothetical 5% return | | | 1,000.00 | | | | 1,018.97 | + | | | 5.95 | | | | 1,000.00 | | | | 1,017.50 | + | | | 7.42 | |
| |
Class IR# | | | | | | | | | | | | | | | | | | | | | | | | |
| Actual | | | 1,000.00 | | | | 929.80 | | | | 5.30 | | | | 1,000.00 | | | | 942.40 | | | | 6.49 | |
| Hypothetical 5% return | | | 1,000.00 | | | | 1,020.49 | + | | | 5.55 | | | | 1,000.00 | | | | 1,020.49 | + | | | 6.75 | |
| |
Class R# | | | | | | | | | | | | | | | | | | | | | | | | |
| Actual | | | 1,000.00 | | | | 928.10 | | | | 7.27 | | | | 1,000.00 | | | | 940.30 | | | | 8.46 | |
| Hypothetical 5% return | | | 1,000.00 | | | | 1,012.95 | + | | | 7.59 | | | | 1,000.00 | | | | 1,011.77 | + | | | 8.78 | |
| |
| | |
| | * | Expenses for each share class are calculated using the Fund’s annualized net expense ratio for each class, which represents the ongoing expenses as a percentage of net assets for the period ended April 30, 2008. Expenses are calculated by multiplying the annualized net expense ratio by the average account value for the period; then multiplying the result by the number of days in the most recent fiscal half year; and then dividing that result by the number of days in the fiscal year. The annualized net expense ratios for the period were as follows: |
| | | | | | | | | | | | | | | | | | | | | |
| Fund | | Class A | | | Class C | | | Institutional | | | Class IR | | | Class R | |
| |
| Structured International Equity Flex | | | 1.59% | | | | 2.34% | | | | 1.19% | | | | 1.34% | | | | 1.84% | |
| Structured U.S. Equity Flex | | | 1.88 | | | | 2.63 | | | | 1.48 | | | | 1.63 | | | | 2.13 | |
| |
| | |
| | + | Hypothetical expenses are based on each Fund’s actual annualized expense ratios and an assumed rate of return of 5% per year before expenses. |
| |
| | # | Class IR and Class R commenced operations on November 30, 2007. |
52
Goldman Sachs Funds
Goldman Sachs is a premier financial services firm, known since 1869 for creating thoughtful and customized investment solutions in complex global markets.
Today, The Investment Management Division of Goldman Sachs serves a diverse set of clients worldwide, including private institutions, public entities and individuals. With portfolio management teams located around the world — and $828 billion in assets under management as of March 31, 2008 — our investment professionals bring firsthand knowledge of local markets to every investment decision, making us one of the few truly global asset managers.
In building a globally diversified portfolio, you can select from more than 80 Goldman Sachs Funds and gain access to investment opportunities across borders, investment styles, asset classes and security capitalizations.
| | | | | |
Money Market1
Fixed Income
▪ Enhanced Income Fund
▪ Ultra-Short Duration
Government Fund
▪ Short Duration Government Fund
▪ Short Duration Tax-Free Fund
▪ California AMT-Free
Municipal Fund 2
▪ New York AMT-Free
Municipal Fund 2
▪ Municipal Income Fund
▪ Government Income Fund
▪ Inflation Protected
Securities Fund
▪ U.S. Mortgages Fund
▪ Core Fixed Income Fund
▪ Core Plus Fixed Income Fund
▪ Investment Grade Credit Fund
▪ Global Income Fund
▪ High Yield Municipal Fund
▪ High Yield Fund
▪ Emerging Markets Debt Fund
▪ Local Emerging Markets Debt Fund | | Domestic Equity
▪ Balanced Fund
▪ Growth and Income Fund
▪ Structured Large Cap Value Fund
▪ Large Cap Value Fund
▪ Structured U.S. Equity Fund
▪ Structured U.S. Equity Flex Fund
▪ Structured Large Cap
Growth Fund
▪ Capital Growth Fund
▪ Strategic Growth Fund
▪ All Cap Growth Fund
▪ Concentrated Growth Fund
▪ Mid Cap Value Fund
▪ Growth Opportunities Fund
▪ Small/Mid Cap Growth Fund
▪ Structured Small Cap Equity Fund
▪ Structured Small Cap Value Fund
▪ Structured Small Cap Growth Fund
▪ Small Cap Value Fund
Fund of Funds3
▪ Asset Allocation Portfolios
▪ Income Strategies Portfolio
▪ Satellite Strategies Portfolio
Retirement Strategies3 | | International Equity
▪ Structured International Equity Fund
▪ Structured International Equity
Flex Fund
▪ Strategic International Equity Fund
▪ Concentrated International Equity Fund
▪ Japanese Equity Fund
▪ Structured International Small Cap Fund
▪ International Small Cap Fund
▪ Asia Equity Fund
▪ Structured Emerging Markets
Equity Fund
▪ Emerging Markets Equity Fund
▪ Concentrated Emerging Markets
Equity Fund
▪ BRIC Fund (Brazil, Russia, India, China)
Specialty3
▪ U.S. Equity Dividend and Premium Fund
▪ International Equity Dividend and Premium Fund
▪ Structured Tax-Managed Equity Fund
▪ Structured International Tax-Managed Equity Fund
▪ Real Estate Securities Fund
▪ International Real Estate
Securities Fund
▪ Tollkeeper FundSM
▪ Commodity Strategy Fund
▪ Absolute Return Tracker Fund |
| |
| 1 | An investment in a money market fund is neither insured nor guaranteed by the Federal Deposit Insurance Corporation or any other government agency. Although the Funds seek to preserve the value of your investment at $1.00 per share, it is possible to lose money by investing in the Funds. |
| |
| 2 | Effective June 1, 2007, the California Intermediate AMT-Free Municipal Fund was renamed the California AMT-Free Municipal Fund and the New York Intermediate AMT-Free Municipal Fund was renamed the New York AMT-Free Municipal Fund. |
| |
| 3 | Individual Funds within the Fund of Funds, Retirement Strategies and Specialty categories will have various placement on the risk/return spectrum and may have greater or lesser risk than that indicated by the placement of the general Fund of Funds, Retirement Strategies or Specialty category. |
The Goldman Sachs Tollkeeper FundSM is a registered service mark of Goldman, Sachs & Co.
| | | |
TRUSTEES
Ashok N. Bakhru, Chairman
John P. Coblentz, Jr.
Diana M. Daniels
Patrick T. Harker
James A. McNamara
Jessica Palmer
Alan A. Shuch
Richard P. Strubel | | OFFICERS
James A. McNamara, President
John M. Perlowski, Senior Vice President and Treasurer
Peter V. Bonanno, Secretary |
| |
GOLDMAN, SACHS & CO.
Distributor and Transfer Agent | | GOLDMAN SACHS ASSET MANAGEMENT, L.P.
Investment Adviser |
Visit our Web site at www.goldmansachsfunds.com to obtain the most recent month-end returns.
Goldman Sachs Asset Management, L.P. 32 Old Slip, 32nd Floor, New York, New York 10005
The reports concerning the Funds included in this shareholder report may contain certain forward-looking statements about the factors that may affect the performance of the Funds in the future. These statements are based on Fund management’s predictions and expectations concerning certain future events and their expected impact on the Funds, such as performance of the economy as a whole and of specific industry sectors, changes in the levels of interest rates, the impact of developing world events, and other factors that may influence the future performance of the Funds. Management believes these forward-looking statements to be reasonable, although they are inherently uncertain and difficult to predict. Actual events may cause adjustments in portfolio management strategies from those currently expected to be employed.
A description of the policies and procedures that the Funds use to determine how to vote proxies relating to portfolio securities and information regarding how a Fund voted proxies relating to portfolio securities during the most recent 12-month period ended June 30 is available (I) without charge, upon request by calling 1-800-526-7384 (for Retail Shareholders) or 1-800-621-2550 (for Institutional Shareholders); and (II) on the Securities and Exchange Commission Web site at http://www.sec.gov.
The Funds file their complete schedule of portfolio holdings with the SEC for the first and third quarters of each fiscal year on Form N-Q. The Funds’ Forms N-Q are available on the SEC’s website at http://www.sec.gov within 60 days after the Funds’ first and third fiscal quarters. The Funds’ Forms N-Q may be reviewed and copied at the SEC’s Public Reference Room in Washington, D.C., and information on the operation of the Public Reference Room may also be obtained by calling 1-800-SEC-0330. Forms N-Q may be obtained upon request and without charge by calling 1-800-526-7384 (for Retail Shareholders) or 1-800-621-2550 (for Institutional Shareholders).
Holdings and allocations shown are unaudited, and may not be representative of current or future investments. Holdings and allocations may not include the Funds’ entire investment portfolio, which may change at any time. Fund holdings should not be relied on in making investment decisions and should not be construed as research or investment advice regarding particular securities.
The Global Industry Classification Standard (GICS) was developed by and is the exclusive property and a service mark of Morgan Stanley Capital International Inc. (MSCI) and Standard & Poor’s, a division of The McGraw-Hill Companies, Inc. (S&P) and is licensed for use by Goldman Sachs. Neither MSCI, S&P nor any other party involved in making or compiling the GICS or any GICS classifications makes any express or implied warranties or representations with respect to such standard or classification (or the results to be obtained by the use thereof), and all such parties hereby expressly disclaim all warranties of originality, accuracy, completeness, merchantability or fitness for a particular purpose with respect to any of such standard or classification. Without limiting any of the foregoing, in no event shall MSCI, S&P, any of their affiliates or any third party involved in making or compiling the GICS or any GICS classifications have any liability for any direct, indirect, special, punitive, consequential or any other damages (including lost profits) even if notified of the possibility of such damages.
The economic and market forecasts presented herein have been generated by GSAM for informational purposes as of the date of this presentation. They are based on proprietary models and there can be no assurance that the forecasts will be achieved.
This material is not authorized for distribution to prospective investors unless preceded or accompanied by a current Prospectus. Please consider a Fund’s objectives, risks, and charges and expenses, and read the Prospectus carefully before investing. The Prospectus contains this and other information about the Funds.
Copyright 2008 Goldman, Sachs & Co. All rights reserved. 08-9664 STEQFLEXSAR / 6.5K/06-08
| | (a) | | As of the end of the period covered by this report, the registrant has adopted a code of ethics that applies to the registrant’s principal executive officer, principal financial officer, principal accounting officer or controller, or persons performing similar functions, regardless of whether these individuals are employed by the registrant or a third party (the “Code of Ethics”). |
| | | |
| | (b) | | During the period covered by this report, no amendments were made to the provisions of the Code of Ethics. |
| | | |
| | (c) | | During the period covered by this report, the registrant did not grant any waivers, including an implicit waiver, from any provision of the Code of Ethics. |
| | | |
| | (d) | | A copy of the Code of Ethics is available as provided in Item 12(a)(1) of this report. |
| | | |
| | | |
| ITEM 3. | | AUDIT COMMITTEE FINANCIAL EXPERT. |
The information required by this Item is only required in an annual report on this Form N-CSR.
| | | |
| ITEM 4. | | PRINCIPAL ACCOUNTANT FEES AND SERVICES. |
The information required by this Item is only required in an annual report on this Form N-CSR.
| | | |
| ITEM 5. | | AUDIT COMMITTEE OF LISTED REGISTRANTS. |
| | | |
| | | The information required by this Item is only required in an annual report on this Form N-CSR. |
| | | |
| ITEM 6. | | SCHEDULE OF INVESTMENTS. |
| | | |
| | | The Schedule of Investments is included as part of the Semi-Annual Report to Stockholders filed under Item 1 of this Form N-CSR. |
| | | |
| ITEM 7. | | DISCLOSURE OF PROXY VOTING POLICIES AND PROCEDURES FOR CLOSED-END MANAGEMENT INVESTMENT COMPANIES. |
| | | |
| | | The information required by this Item is only required in an annual report on this Form N-CSR. |
| | | |
| ITEM 8. | | PORTFOLIO MANAGERS OF CLOSED-END MANAGEMENT INVESTMENT COMPANIES. |
| | | |
| | | Not applicable. |
| | | |
| ITEM 9. | | PURCHASES OF EQUITY SECURITIES BY CLOSED-END MANAGEMENT INVESTMENT COMPANY AND AFFILIATED PURCHASERS. |
| | | |
| | | Not applicable. |
| | | |
| ITEM 10. | | SUBMISSION OF MATTERS TO A VOTE OF SECURITY HOLDERS.
There have been no material changes to the procedures by which shareholders may recommend nominees to the registrant’s board of trustees. |
| | | |
| | | |
| ITEM 11. | | CONTROLS AND PROCEDURES. |
| | | |
| | (a) | | The registrant’s principal executive and principal financial officers, or persons performing similar functions have concluded that the registrant’s disclosure controls and procedures (as defined in Rule 30a-3(c) under the Investment Company Act of 1940, as amended (the “1940 Act”)) are effective as of a date within 90 days of the filing of this report that includes the disclosure required by this paragraph, based on the evaluation of these controls and procedures required by Rule 30a-3(b) under the 1940 Act and 15d-15(b) under the Securities Exchange Act of 1934, as amended. |
| | | |
| | (b) | | There were no changes in the registrant’s internal control over financial reporting (as defined in Rule 30a-3(d) under the 1940 Act) that occurred during the registrant’s second fiscal quarter of the period covered by this report that have materially affected, or are reasonably likely to materially affect, the registrant’s internal control over financial reporting. |
| | | |
| | (a)(1) | | | Goldman Sachs Trust's Code of Ethics for Principal Executive and Senior Financial Officers is incorporated by reference to Exhibit 11(a)(1) of the registrant's Form N-CSR filed on March 8, 2004 for its Real Estate Securities Fund (Accession Number 0000950123-04-0002984). |
| | | |
| | (a)(2) | | Exhibit 99.CERT | Certifications pursuant to Section 302 of the Sarbanes-Oxley Act of 2002 filed herewith. |
| | | |
| | (b) | | Exhibit 99.906CERT | Certifications pursuant to Section 906 of the Sarbanes-Oxley Act of 2002 filed herewith. |
SIGNATURES
| | | | Pursuant to the requirements of the Securities Exchange Act of 1934, as amended, and the Investment Company Act of 1940, as amended, the Registrant has duly caused this report to be signed on its behalf by the undersigned, thereunto duly authorized. |
| | | | | | | |
| | | | | Goldman Sachs Trust | | |
| | | | | | | |
| By: | | | | /s/ James A. McNamara | | |
| | | | |
| | |
| | | | | James A. McNamara | | |
| | | | | President/Principal Executive Officer | | |
| | | | | Goldman Sachs Trust | | |
| | | | | | | |
| Date: | | | | July 7, 2008 | | |
| | | | Pursuant to the requirements of the Securities Exchange Act of 1934, as amended, and the Investment Company Act of 1940, as amended, this report has been signed below by the following persons on behalf of the Registrant and in the capacities and on the dates indicated. |
| | | | | | | |
| By: | | | | /s/ James A. McNamara | | |
| | | | |
| | |
| | | | | James A. McNamara | | |
| | | | | President/Principal Executive Officer | | |
| | | | | Goldman Sachs Trust | | |
| | | | | | | |
| Date: | | | | July 7, 2008 | | |
| | | | | | | |
| By: | | | | /s/ John M. Perlowski | | |
| | | | |
| | |
| | | | | John M. Perlowski | | |
| | | | | Treasurer/Principal Financial Officer | | |
| | | | | Goldman Sachs Trust | | |
| | | | | | | |
| Date: | | | | July 7, 2008 | | |