UNITED STATES
SECURITIES AND EXCHANGE COMMISSION
Washington, D.C. 20549
FORM N-CSR
CERTIFIED SHAREHOLDER REPORT OF REGISTERED
MANAGEMENT INVESTMENT COMPANIES
Investment Company Act file number 811-05349
Goldman Sachs Trust
(Exact name of registrant as specified in charter)71 South Wacker Drive, Chicago, Illinois 60606
(Address of principal executive offices) (Zip code)| | | |
| Peter V. Bonanno, Esq. | | Copies to: |
| Goldman, Sachs & Co. | | Jack W. Murphy, Esq. |
| One New York Plaza | | Dechert LLP |
| New York, New York 10004 | | 1775 I Street, NW |
| | | Washington, D.C. 20006 |
|
(Name and address of agents for service)
|
Registrant’s telephone number, including area code: (312) 655-4400
Date of fiscal year end: March 31
Date of reporting period: September 30, 2008
| | | |
| ITEM 1. | | REPORTS TO STOCKHOLDERS. |
| | | |
| | | The Semi-Annual Report to Stockholders is filed herewith. |
Goldman Sachs Funds
| | | | |
| | | | |
Semi-Annual Report | | | September 30, 2008 |
| | | | |
| | | | |
| | | | |
| | | | Single Sector Fixed Income |
| | | | Emerging Markets Debt |
| | | | High Yield |
| | | | Investment Grade Credit |
| | | | Local Emerging Markets Debt |
| | | | U.S. Mortgages |
| | | | |
Goldman Sachs Single Sector Fixed Income Funds
| | |
| n | GOLDMAN SACHS EMERGING MARKETS DEBT FUND | |
| |
| n | GOLDMAN SACHS HIGH YIELD FUND | |
| |
| n | GOLDMAN SACHS INVESTMENT GRADE CREDIT FUND | |
| |
| n | GOLDMAN SACHS LOCAL EMERGING MARKETS DEBT FUND | |
| |
| n | GOLDMAN SACHS U.S. MORTGAGES FUND | |
TABLE OF CONTENTS
| | | |
| Principal Investment Strategies and Risks | | 1 |
| Investment Process | | 3 |
| Letters to Shareholders and Performance Summaries | | 4 |
| Schedules of Investments | | 26 |
| Financial Statements | | 64 |
| Notes to the Financial Statements | | 72 |
| Financial Highlights | | 90 |
| Other Information | | 100 |
| | | | | | | |
NOT FDIC-INSURED | | | May Lose Value | | | No Bank Guarantee |
| | | | | | | |
GOLDMAN SACHS SINGLE SECTOR FIXED INCOME FUNDS
Principal Investment Strategies and Risks
The Emerging Markets Debt Fund invests primarily in fixed income securities of issuers located in emerging countries. The Fund’s investments in fixed income securities are subject to the risks associated with debt securities generally, including credit, liquidity and interest rate risk. The majority of the countries in which the Fund invests have sovereign ratings that are below investment grade or are unrated. High yield, lower rated securities involve greater price volatility and present greater risks than higher rated fixed income securities. Fixed income securities of emerging countries are less liquid and are subject to greater price volatility and will be subject to the risks of currency fluctuations and sudden economic or political developments. At times, the Fund may be unable to sell certain of its portfolio securities without a substantial drop in price, if at all. The securities markets of emerging countries have less government regulation and are subject to less extensive accounting and financial reporting requirements than the markets of more developed countries. The Fund is also subject to the risk that the issuers of sovereign debt or the government authorities that control the payment of debt may be unable or unwilling to repay principal or interest when due. The Fund may also engage in foreign currency transactions for hedging purposes (including cross hedging) or for speculative purposes. Forward foreign currency exchange contracts are subject to the risk that the counterparty to the contract will default on its obligations. The Fund may make substantial investments in derivative instruments, including options, financial futures, Eurodollar futures contracts, swaps, option on swaps, structured securities and other derivative investments. Derivative instruments may involve a high degree of financial risk. These risks include the risk that a small movement in the price of the underlying security or benchmark may result in a disproportionately large movement, unfavorable or favorable, in the price of the derivative instrument; risks of default by a counterparty; and the risks that transactions may not be liquid. The Fund may concentrate its investments in particular countries or regions and may be subject to greater losses than if it were less concentrated in a particular country or region. The Fund is non-diversified and may invest more of its assets in fewer issuers than diversified funds and may be more susceptible to adverse developments affecting any single issuer held in its portfolio and may be susceptible to greater losses because of these developments.
The High Yield Fund invests primarily in high-yield, fixed income securities that, at the time of purchase, are non-investment grade securities. The Fund’s investments in fixed income securities are subject to the risks associated with debt securities including credit, liquidity and interest rate risk. The Fund invests in high yield, fixed income securities that, at the time of purchase, are non-investment grade. High yield, lower rated securities involve greater price volatility and present greater risks than higher rated fixed income securities. The Fund may also invest in foreign issuers who are denominated in currencies other than the U.S. dollar and in securities of issuers located in emerging countries denominated in any currency. The Fund’s foreign and emerging market investments may be more volatile and less liquid than its investment in U.S. securities and will be subject to the risks of currency fluctuations and sudden economic or political developments. At times, the Fund may be unable to sell certain of its portfolio securities without a substantial drop in price, if at all. The Fund may also engage in foreign currency transactions for hedging purposes (including cross hedging) or for speculative purposes. The Fund may make substantial investments in derivative instruments, including options, financial futures, Eurodollar futures contracts, swaps, options on swaps, structured securities and other derivative investments. Derivative instruments may involve a high degree of financial risk. These risks include the risk that a small movement in the price of the underlying security or benchmark may result in a disproportionately large movement, unfavorable or favorable, in the price of the derivative instrument; risks of default by a counterparty; and the risks that transactions may not be liquid.
The Investment Grade Credit Fund invests primarily in investment grade fixed income securities. The Fund’s investments in fixed income securities are subject to the risks associated with debt securities generally, including credit, liquidity and interest rate risk. The guarantee on U.S. government securities applies only to the underlying securities of the Fund if held to maturity and not to the value of the Fund’s shares. The Fund’s investments in mortgage-backed securities are subject to prepayment risks. These risks may result in greater share price volatility. The Fund may invest in foreign and emerging markets securities, which may be more volatile and less liquid than its investment in U.S. securities and will be subject to the risks of currency fluctuations and political developments. At times, the Fund may be unable to sell certain of its portfolio securities without a substantial drop in price, if at all. The Fund may also engage in foreign currency transactions for hedging purposes (including cross hedging) or for speculative purposes. Forward foreign currency exchange contracts are subject to the risk that the counterparty to the contract will default on its obligations. The Fund may make substantial investments in derivative instruments, including options, financial futures, Eurodollar futures contracts, swaps, option on swaps, structured securities and other derivative investments. Derivative instruments may involve a high degree of financial risk. These risks include the risk that a small movement in the price of the underlying security or benchmark may result in a disproportionately large movement, unfavorable or favorable, in the price of the derivative instrument; risks of default by a counterparty; and the risks that transactions may not be liquid.
The Local Emerging Markets Debt Fund invests primarily in sovereign and corporate debt of issuers located in emerging countries where such debt securities are denominated in the local currency of such emerging countries. The Fund’s investments in fixed income securities are subject to the risks associated with debt securities generally, including credit, liquidity and interest rate risk. The majority of the countries in which the Fund invests have sovereign ratings that are below investment grade or are unrated. High yield, lower rated securities involve greater price volatility and present greater risks than higher rated fixed income securities. Fixed income securities of emerging countries are less liquid and are subject to greater price volatility and will be subject to the risks of currency fluctuations and sudden economic or political developments. Since the Fund may invest in non-investment
GOLDMAN SACHS SINGLE SECTOR FIXED INCOME FUNDS
grade fixed income securities and emerging country issuers, it especially will be subject to the risk that the liquidity of particular portfolio securities will shrink or disappear suddenly and without warning as a result of adverse economic, market or political events, or adverse investor perceptions, whether or not accurate. At times, the Fund may be unable to sell certain of its portfolio securities without a substantial drop in price, if at all. The securities markets of emerging countries have less government regulation and are subject to less extensive accounting and financial reporting requirements than the markets of more developed countries. The Fund is also subject to the risk that the issuers of sovereign debt or the government authorities that control the payment of debt may be unable or unwilling to repay principal or interest when due. The Fund may also engage in foreign currency transactions for hedging purposes (including cross hedging) or for speculative purposes. Forward foreign currency exchange contracts are subject to the risk that the counterparty to the contract will default on its obligations. The Fund may make substantial investments in derivative instruments, including options, financial futures, Eurodollar futures contracts, swaps, option on swaps, structured securities and other derivative investments. Derivative instruments may involve a high degree of financial risk. These risks include the risk that a small movement in the price of the underlying security or benchmark may result in a disproportionately large movement, unfavorable or favorable, in the price of the derivative instrument; risks of default by a counterparty; and the risks that transactions may not be liquid. The Fund is non-diversified and may invest more of its assets in fewer issuers than diversified funds and may be more susceptible to adverse developments affecting any single issuer held in its portfolio and may be susceptible to greater losses because of these developments.
The U.S. Mortgages Fund invests primarily in securities representing direct or indirect interests in or that are collateralized by mortgage-backed securities. The Fund’s investments in fixed income securities are subject to the risks associated with debt securities generally, including credit, liquidity and interest rate risk. The Fund’s investment in mortgage-backed securities (MBS) is subject to prepayment risk, the risk that in a declining interest rate environment the Fund’s underlying mortgages may be prepaid, causing the Fund to have to reinvest at lower interest rates. This risk may result in greater share price volatility than a fixed income fund not invested in MBS. The guarantee on U.S. government securities applies only to the underlying securities of the Fund if held to maturity and not to the value of the Fund’s shares. The Fund may make substantial investments in derivative instruments, including options, financial futures, Eurodollar futures contracts, swaps, option on swaps, structured securities and other derivative investments. Derivative instruments may involve a high degree of financial risk. These risks include the risk that a small movement in the price of the underlying security or benchmark may result in a disproportionately large movement, unfavorable or favorable, in the price of the derivative instrument; risks of default by a counterparty; and the risks that transactions may not be liquid.
GOLDMAN SACHS SINGLE SECTOR FIXED INCOME FUNDS
What Differentiates the Goldman Sachs Asset Management Fixed Income Investment Process?
At Goldman Sachs Asset Management, L.P. (“GSAM”), the goal of our fixed income investment process is to provide consistent, strong performance by actively managing our portfolios within a research-intensive, risk-managed framework.
A key element of our fixed income investment philosophy is to evaluate the broadest global opportunity set to capture relative value across sectors and instruments. Our globally integrated investment process involves managing dynamically along the risk/return spectrum, as we continue to develop value-added strategies through:
| | | |
| | | 
n Assess relative value among securities and sectors
n Leverage the vast resources of GSAM in selecting securities for each portfolio

n Team approach to decision making
n Manage risk by avoiding significant sector and interest rate bets
n Careful management of yield curve strategies — while closely managing portfolio duration

Fixed Income portfolios that:
n Include domestic and global investment options, income opportunities,
and access to areas of specialization such as high yield
n Capitalize on GSAM’s industry-renowned credit research capabilities
n Use a risk-managed framework to seek total return, recognizing the
importance of investors’ capital accumulation goals as well as their
need for income
|
Emerging Markets Debt Fund
Dear Shareholder:
This report provides an overview on the performance of the Goldman Sachs Emerging Markets Debt Fund (the “Fund”) during the six-month reporting period that ended September 30, 2008.
Performance Review
Over the six-month period that ended September 30, 2008, the Fund’s Class A, Class C and Institutional Shares generated cumulative total returns, without sales charges, of –7.55%, –7.92% and –7.47%, respectively. These returns compare to the –5.88% cumulative total return of the Fund’s benchmark, the J.P. Morgan EMBI Global Diversified Index (with dividends reinvested), over the same time period.
The Fund posted a negative return during the reporting period and underperformed its benchmark. This was largely due to the selection of certain external and local market debt securities. Slightly offsetting this was the Fund’s underweight country exposure to select countries.
Market Review
The JP Morgan EMBI Global Diversified Index returned –5.88% over the six month period ended September 30, 2008. Emerging market spreads widened 116 basis points versus U.S. Treasuries to close the period at 449 basis points. Emerging markets debt came under a lot of pressure during the six months reporting period as deleveraging continued in the midst of the escalating global credit crisis. A series of unprecedented and industry-changing events occurred toward the end of the period that spread fear and shock throughout global financial markets, causing an extreme flight to quality. To list just a few events: Fannie Mae and Freddie Mac entered conservatorship, Lehman Brothers filed for bankruptcy, AIG was rescued by the Federal Reserve Board (the “Fed”), Merrill Lynch agreed to merge with Bank of America, Morgan Stanley and Goldman Sachs were converted into bank holding companies, Washington Mutual filed for bankruptcy and was later acquired by JP Morgan, Wachovia’s banking operations were acquired by Well Fargo and several major European banks were rescued by large monetary injections from both the public and private sectors. In light of these events, investors became extremely risk averse, leading to a broad and indiscriminate sell-off of riskier assets, including emerging markets debt.
INVESTMENT OBJECTIVE
The Fund seeks a high level of total return consisting of income and capital appreciation.
PORTFOLIO RESULTS
Factors Affecting Performance
In terms of county exposure relative to the benchmark, the Fund’s underweight to Venezuela contributed positively to performance as it underperformed the benchmark. This was offset by the Fund’s overweight to Argentina, which detracted from performance. Security selection of Argentine local debt was the primary detractor from excess returns for the period while Hungarian local debt modestly contributed to performance. In the hard currency (U.S. dollar denominated) debt space, the main contributor to performance was security selection of Venezuelan bonds while the primary detractor was security selection of Indonesian and Russian bonds. The Fund’s active currency strategy had a negative impact on performance, especially its exposure to currencies in Latin America and its underweight exposure to the U.S. dollar as the value of the U.S. dollar appreciated 10.6% over the reporting period. However, this was slightly offset by the momentum factor in our active currency strategy. Momentum is one of the ways we seek to manage risk within our active currency strategy; it is meant to capitalize on medium-term persistence that currencies have historically exhibited. By persistence, we’re referring to the trend that past currency return patterns may potentially indicate their future movements. During the reporting period, the Fund’s portfolio benefited from being positioned to take advantage of this persistence. In short, we generally overweighted currencies that had been doing well and underweighted those currencies that have been doing poorly.
Outlook
Fundamentally, we continue to see a favorable policy environment for emerging market debt, due to supportive governmental macroeconomic stabilization programs and improved debt management efforts. We believe these should help buffer the challenges associated with significant global growth deceleration and a decline in capital flows. We believe that the long term technical picture also shines favorably on the asset class. For example, strategic inflows remain strong as investor demand is high and broadening, while net supply remains favorable as emerging market countries are paying down more debt than they are issuing. We continue to have confidence in the asset class despite recent spread widening. Fundamentally, countries continue to benefit from strong balance sheets and the asset class remains structurally sound. Increased volatility in emerging market debt is not uncommon in times of global risk aversion, where all spread sectors are affected. We believe that certain securities have become attractively valued in the near term but we continue to be cognizant of market events and will prudently add or decrease exposure to the emerging market debt asset class based on fundamental valuations and/or market technicals.
Since the conclusion of the reporting period ended September 30, 2008, we have continued to experience periods of extreme volatility in the financial markets. In particular, continued deleveraging, a lack of liquidity and uncertainty regarding the economy have led to increased investor risk aversion. Despite these challenges, we continue to follow our investment approach that includes actively managing the Fund’s portfolios within a research-intensive, risk-managed framework. We thank you for your investment and look forward to your continued confidence.
Goldman Sachs Global Fixed Income Investment Management Team
October 20, 2008
Emerging Markets Debt Fund
as of September 30, 2008
PERFORMANCE REVIEW
| | | | | | | | | | | | | | | |
April 1, 2008–
| | Fund Total Return
| | | J.P. Morgan EMBI Global
| | | 30-Day
| | | |
| September 30, 2008 | | (based on NAV1) | | | Diversified Index2 | | | Standardized Yield3 | | | |
|
| |
| Class A | | | -7.55 | % | | | -5.88 | % | | | 7.31 | % | | |
| Class C | | | -7.92 | | | | -5.88 | | | | 6.87 | | | |
| Institutional | | | -7.47 | | | | -5.88 | | | | 8.04 | | | |
|
| |
| 1 | The net asset value (NAV) represents the net assets of the class of the Fund (ex-dividend) divided by the total number of shares of the class outstanding. The Fund’s performance assumes the reinvestment of dividends and other distributions. The Fund’s performance does not reflect the deduction of any applicable sales charges. |
| 2 | The J.P. Morgan EMBI Global Diversified Index is an unmanaged index of debt instruments of 31 emerging countries. The Index figures do not reflect any deduction for fees, expenses or taxes. It is not possible to invest directly in an unmanaged index. |
| 3 | The 30-Day Standardized Yield of the Fund is calculated by dividing the net investment income per share (as defined by securities industry regulations) earned by the Fund over a 30-day period (ending on the stated month-end date) by the maximum public offering price per share of the Fund on the last day of the period. This number is then annualized. This yield does not necessarily reflect income actually earned and distributed by the Fund and, therefore, may not be correlated with the dividends or other distributions paid to shareholders. |
STANDARDIZED AVERAGE ANNUAL TOTAL RETURNS4
| | | | | | | | | | | | | | | | | |
| For the period ended 9/30/08 | | One Year | | | Five Years | | | Since Inception | | | Inception Date | | |
|
| |
| Class A | | | -10.13 | % | | | 7.70 | % | | | 8.11 | % | | 8/29/03 | | |
| Class C | | | -7.66 | | | | N/A | | | | 0.20 | | | 9/29/06 | | |
| Institutional | | | -5.69 | | | | 9.09 | | | | 9.49 | | | 8/29/03 | | |
|
| |
| 4 | The Standardized Total Returns are average annual total returns as of the most recent calendar quarter-end. They assume reinvestment of all distributions at NAV. These returns reflect a maximum initial sales charge of 4.5% for Class A Shares and the assumed contingent deferred sales charge for Class C Shares (1% if redeemed within 12 months of purchase). Because Institutional Shares do not involve a sales charge, such a charge is not applied to their Standardized Total Returns. The Fund will charge a 2% redemption fee on the redemption of shares (including by exchange) held for 30 calendar days or less. The performance figures do not reflect the deduction of the redemption fee. If reflected, the redemption fee would reduce the performance quoted. |
The returns represent past performance. Past performance does not guarantee future results. The Fund’s investment return and principal value will fluctuate so that an investor’s shares, when redeemed, may be worth more or less than their original cost. Current performance may be lower or higher than the performance quoted above. Please visit our Web site at: www.goldmansachsfunds.com to obtain the most recent month-end returns. Performance reflects expense limitations in effect. In their absence, performance would be reduced. Returns do not reflect the deduction of taxes that a shareholder would pay on Fund distributions or the redemption of Fund shares.
EXPENSE RATIOS5
| | | | | | | | | | | |
| | | Net Expense Ratio (Current) | | Gross Expense Ratio (Before Waivers) | | |
|
| |
| Class A | | | 1.22 | % | | | 1.36 | % | | |
| Class C | | | 1.97 | | | | 2.11 | | | |
| Institutional | | | 0.88 | | | | 1.02 | | | |
|
| |
| 5 | The expense ratios of the Fund, both current (net of applicable fee waivers and/or expense limitations) and before waivers (gross of applicable fee waivers and/or expense limitations), are as set forth above according to the most recent publicly available Prospectuses for the Fund and may differ from the expense ratios disclosed in the Financial Highlights in this report. Applicable waivers and expense limitations are voluntary and may be modified or terminated at any time at the option of the investment adviser. If this occurs, the expense ratios may change without shareholder approval. |
TOP 10 COUNTRY ALLOCATION6
| | | | | | | | | | | |
| | | Percentage of Net Assets
|
| | |
|
| | | as of 9/30/08 | | | as of 3/31/08 | | | |
|
| |
| Russia | | | 10.1 | % | | | 7.4 | % | | |
| Turkey | | | 8.4 | | | | 7.1 | | | |
| Argentina | | | 7.5 | | | | 8.3 | | | |
| Brazil | | | 7.5 | | | | 4.8 | | | |
| Mexico | | | 5.8 | | | | 6.0 | | | |
| Philippines | | | 5.8 | | | | 5.0 | | | |
| Indonesia | | | 5.7 | | | | 4.7 | | | |
| Venezuela | | | 4.7 | | | | 4.6 | | | |
| Colombia | | | 4.4 | | | | — | | | |
| Uruguay | | | 4.0 | | | | 4.8 | | | |
|
| |
| 6 | The percentage shown for each investment category reflects the value of investments in that category as a percentage of net assets. |
High Yield Fund
Dear Shareholder:
This report provides an overview on the performance of the Goldman Sachs High Yield Fund (the “Fund”) during the six-month reporting period that ended September 30, 2008.
Performance Review
Over the six-month period that ended September 30, 2008, the Fund’s Class A, B, C, Institutional, Service, IR and R Shares generated cumulative total returns, without sales charges, of −6.52%, −6.88%, −6.88%, −6.50%, −6.61%, −6.55% and −6.64%, respectively. These returns compared to the −6.77% cumulative total return of the Fund’s benchmark, the Lehman Brothers U.S. Corporate High Yield Bond Index −2% Issuer Capped (with dividends reinvested), over the same time period.
The high yield market has been very challenging since the collapse of Lehman Brothers in September. The Fund performed largely in line with its benchmark given the contributions from its underweights to Finance and Automotives, which offset its overweight to Europe which underperformed.
Market Review
Volatile equity markets and continued negative news from financials weighed on the sentiment in high yield over the six month period that ended September 30, 2008. Specifically, Lehman Brothers’ bankruptcy on September 15 triggered the demise of several financial institutions in the U.S. and Europe, resulting in severe turmoil in the financial markets.
Risky assets such as high yield bonds and equities plunged in the last two weeks of September with the higher-risk CCC-rated bonds hardest hit, returning −8.5% over the last six months. The Automotives sector fell over 23%, led by the drop of GMAC bonds. Its bonds weakened significantly due to liquidity concerns surrounding the finance company’s ability to fund itself in the asset-backed market. The recession in Gaming persisted as that sector came under additional pressure due to weak Las Vegas attendance numbers and company results.
As is typical in times of distress, single-B rated bond spreads widened meaningfully and ended the reporting period more than 1,000 basis points over Treasuries. They have since widened further to almost 1450 basis points in October. Investors’ fear that annual defaults could surge over the next several years, with recently issued aggressively structured leveraged buyouts particularly vulnerable to restructuring.
INVESTMENT OBJECTIVE
The Fund seeks a high level of current income and may also consider the potential for capital appreciation.
PORTFOLIO RESULTS
Investment Strategies
In seeking to meet the Fund’s investment objective, we invest, under normal circumstances, at least 80% of the Fund’s net assets plus any borrowings for investment purposes in high yield, fixed income securities that, at the time of purchase, are non-investment grade. The Fund may invest in obligations of domestic and foreign issuers, which are denominated in currencies other than the U.S. dollar. The Fund typically uses currency forwards for the purpose of hedging currency exposure.
Factors Affecting Performance
As discussed, the Fund’s European exposure negatively impacted its performance, as Europe failed to perform as well as the broader U.S. high yield market. The Fund’s underweight to higher quality BB bonds also detracted from performance as investors’ flight-to-quality put pressure on riskier companies. Performance benefited, however, from the Fund’s continued underweight to Automotive and Financials.
Outlook
Since the collapse of Lehman Brothers, there has been a severe repricing of credit risk. Today, the high yield market yields over 18% and nearly half of the bonds are trading at distressed levels. The market is pricing defaults spiking to 15% annually in the next several years. Historically, these types of market conditions provide investors, who can withstand the volatility, with attractive medium-term return opportunities.
Since the conclusion of the reporting period ended September 30, 2008, we have continued to experience periods of extreme volatility in the financial markets. In particular, continued deleveraging, a lack of liquidity and uncertainty regarding the economy have led to increased investor risk aversion. Despite these challenges, we continue to follow our investment approach that includes actively managing the Fund’s portfolios within a research-intensive, risk-managed framework. We thank you for your investment and look forward to your continued confidence.
Goldman Sachs High Yield Investment Management Team
October 27, 2008
High Yield Fund
as of September 30, 2008
PERFORMANCE REVIEW
| | | | | | | | | | | | | | | |
| | | | | | Lehman Brothers
| | | | | | |
| | | | | | U.S. Corporate
| | | | | | |
| | | Fund Total Return
| | | High Yield Bond Index
| | | 30-Day
| | | |
| April 1, 2008–September 30, 2008 | | (based on NAV)1 | | | 2% Issuer Capped2 | | | Standardized Yield3 | | | |
|
| |
| Class A | | | -6.52 | % | | | -6.77 | % | | | 9.78 | % | | |
| Class B | | | -6.88 | | | | -6.77 | | | | 9.43 | | | |
| Class C | | | -6.88 | | | | -6.77 | | | | 9.43 | | | |
| Institutional | | | -6.50 | | | | -6.77 | | | | 10.64 | | | |
| Service | | | -6.61 | | | | -6.77 | | | | 10.08 | | | |
| Class IR | | | -6.55 | | | | -6.77 | | | | 10.52 | | | |
| Class R | | | -6.64 | | | | -6.77 | | | | 10.01 | | | |
|
| |
| 1 | The net asset value (NAV) represents the net assets of the class of the Fund (ex-dividend) divided by the total number of shares of the class outstanding. The Fund’s performance assumes the reinvestment of dividends and other distributions. The Fund’s performance does not reflect the deduction of any applicable sales charges. |
| 2 | The Lehman Brothers U.S. Corporate High Yield Bond Index−2% Issuer Capped, an unmanaged index, covers the universe of U.S. dollar denominated, non-convertible, fixed rate, non-investment grade debt. Index holdings must have at least one year to final maturity, at least $150 million par amount outstanding, and be publicly issued with a rating of Ba1 or lower. The Index figures do not reflect any deduction for fees, expenses or taxes. It is not possible to invest directly in an unmanaged index. |
| 3 | The 30-Day Standardized Yield of the Fund is calculated by dividing the net investment income per share (as defined by securities industry regulations) earned by the Fund over a 30-day period (ending on the stated month-end date) by the maximum public offering price per share of the Fund on the last day of the period. This number is then annualized. This yield does not necessarily reflect income actually earned and distributed by the Fund and, therefore, may not be correlated with the dividends or other distributions paid to shareholders. |
STANDARDIZED AVERAGE ANNUAL TOTAL RETURNS4
| | | | | | | | | | | | | | | | | | | | | |
| For the period ended 9/30/08 | | One Year | | | Five Years | | | Ten Years | | | Since Inception | | | Inception Date | | |
|
| |
| Class A | | | -16.24 | % | | | 3.52 | % | | | 4.72 | % | | | 4.42 | % | | 8/1/97 | | |
| Class B | | | -17.34 | | | | 3.26 | | | | 4.41 | | | | 4.06 | | | 8/1/97 | | |
| Class C | | | -13.86 | | | | 3.69 | | | | 4.43 | | | | 4.10 | | | 8/15/97 | | |
| Institutional | | | -12.15 | | | | 4.82 | | | | 5.59 | | | | 5.23 | | | 8/1/97 | | |
| Service | | | -12.49 | | | | 4.31 | | | | 5.05 | | | | 4.70 | | | 8/1/97 | | |
| Class IR | | | N/A | | | | N/A | | | | N/A | | | | -10.62 | | | 11/30/07 | | |
| Class R | | | N/A | | | | N/A | | | | N/A | | | | -10.86 | | | 11/30/07 | | |
|
| |
| 4 | The Standardized Total Returns are average annual total returns or cumulative total returns (only if the performance period is one year or less) as of the most recent calendar quarter-end. They assume reinvestment of all distributions at NAV. These returns reflect a maximum initial sales charge of 4.5% for Class A Shares, the assumed contingent deferred sales charge for Class B Shares (5% maximum declining to 0% after six years) and the assumed contingent deferred sales charge for Class C Shares (1% if redeemed within 12 months of purchase). Because Institutional, Service, Class IR and R Shares do not involve a sales charge, such a charge is not applied to their Standardized Total Returns. The Fund will charge a 2% redemption fee on the redemption of shares (including by exchange) held for 60 calendar days or less. The performance figures do not reflect the deduction of the redemption fee. If reflected, the redemption fee would reduce the performance quoted. |
The returns represent past performance. Past performance does not guarantee future results. The Fund’s investment return and principal value will fluctuate so that an investor’s shares, when redeemed, may be worth more or less than their original cost. Current performance may be lower or higher than the performance quoted above. Please visit our Web site at: www.goldmansachsfunds.com to obtain the most recent month-end returns. Performance reflects expense limitations in effect. In their absence, performance would be reduced. Returns do not reflect the deduction of taxes that a shareholder would pay on Fund distributions or the redemption of Fund shares.
EXPENSE RATIOS5
| | | | | | | | | | | |
| | | Net Expense Ratio (Current) | | Gross Expense Ratio (Before Waivers) | | |
|
| |
| Class A | | | 1.08 | % | | | 1.09 | % | | |
| Class B | | | 1.83 | | | | 1.84 | | | |
| Class C | | | 1.83 | | | | 1.84 | | | |
| Institutional | | | 0.74 | | | | 0.75 | | | |
| Service | | | 1.24 | | | | 1.25 | | | |
| Class IR | | | 0.83 | | | | 0.84 | | | |
| Class R | | | 1.33 | | | | 1.34 | | | |
|
| |
| 5 | The expense ratios of the Fund, both current (net of applicable fee waivers and/or expense limitations) and before waivers (gross of applicable fee waivers and/or expense limitations), are as set forth above according to the most recent publicly available Prospectuses for the Fund and may differ from the expense ratios disclosed in the Financial Highlights in this report. Applicable waivers and expense limitations are voluntary and may be modified or terminated at any time at the option of the investment adviser. If this occurs, the expense ratios may change without shareholder approval. |
TOP 10 ISSUERS AS OF 9/30/086
| | | | | | | | | |
| Company | | % of Net Assets | | Line of Business | | |
|
| |
| HCA | | | 1.8 | % | | Health Care–Services | | |
| Ford | | | 1.7 | | | Automotive | | |
| MGM Mirage | | | 1.3 | | | Gaming | | |
| Chesapeake Energy | | | 1.1 | | | Energy–Exploration & Production | | |
| Rexnord | | | 1.1 | | | Capital Goods | | |
| Sungard Data | | | 1.1 | | | Technology–Software/Services | | |
| Cablevision | | | 1.0 | | | Media–Cable | | |
| Sprint Nextel | | | 0.9 | | | Telecommunications–Cellular | | |
| Nielsen | | | 0.9 | | | Publishing | | |
| NRG Energy | | | 0.9 | | | Utilities–Electric | | |
|
| |
| 6 | The top 10 issuers may not be representative of the Fund’s future investments. |
TOP 10 INDUSTRY ALLOCATION7
| | | | | | | | | | | |
| | | Percentage of Net Assets | | |
| | | as of 9/30/08 | | as of 3/31/08 | | |
|
| |
| Gaming | | | 4.9 | % | | | 6.5 | % | | |
| Health Care–Services | | | 4.2 | | | | 4.1 | | | |
| Chemicals | | | 3.9 | | | | 4.6 | | | |
| Utilities–Electric | | | 3.9 | | | | 3.9 | | | |
| Packaging | | | 3.6 | | | | 4.2 | | | |
| Telecommunications–Cellular | | | 3.5 | | | | 3.3 | | | |
| Energy–Exploration & Production | | | 3.1 | | | | 2.8 | | | |
| Media–Cable | | | 3.0 | | | | 3.0 | | | |
| Building Materials | | | 2.7 | | | | 3.1 | | | |
| Publishing | | | 2.5 | | | | 3.7 | | | |
|
| |
| 7 | The percentage shown for each investment category reflects the value of investments in that category as a percentage of net assets. |
Investment Grade Credit Fund
Dear Shareholder:
This report provides an overview on the performance of the Goldman Sachs Investment Grade Credit Fund (the “Fund”) during the six-month reporting period that ended September 30, 2008.
Performance Review
Over the six-month period that ended September 30, 2008, the Fund’s Class A, Institutional and Separate Account Institutional Shares generated cumulative total returns, without sales charges, of – 8.47%, – 8.39% and – 8.27%, respectively. These returns compare to the – 7.23% cumulative total return of the Fund’s benchmark, the Lehman Brothers U.S. Credit Index (with dividends reinvested), over the same time period.
The Fund underperformed its benchmark during the reporting period. This was, in part, due to our corporate security selection strategy during the third quarter, led by underperformance of our financial holdings. A lack of liquidity in the credit market and solvency issues led to back-to-back events of the Lehman Brothers bankruptcy, AIG bailout and Washington Mutual failure, resulting in a further decline in financials. Positioning to be overweight insurance and banks within the corporate sector relative to the benchmark also negatively affected returns. Additionally, the Fund’s mortgage selection strategy underperformed. This was mainly driven by continued turmoil in the U.S. housing market, as well as the sustained deleveraging from the financial sector. Losses were partially offset by gains in our duration strategy which outperformed early in the period, driven by our U.S. curve steepener position.
Market Review
Over the six-month reporting period, corporate credit experienced one of the worst periods in the history of the asset class as the credit crunch turned into a full-blown financial crisis, reshaping the banking landscape and leaving investors concerned of a global recession.
The macro-economic picture for developed economies continued to deteriorate as U.S. consumer demand and exports to the U.S. slowed and countries started to deleverage their local economies. The Federal Reserve Board (the “Fed”) held short-term interest rates steady at 2% through September 2008 to ease inflationary pressures. Elsewhere, the U.S. Treasury placed Fannie Mae and Freddie Mac under conservatorship and developed a $700 billion plan to rescue banks with exposure to illiquid assets. Additionally, the Treasury yield curve steepened over the period. The slower global growth outlook and easing of inflationary pressures towards the end of the period saw the market price in monetary policy easing by the Fed. In early October, after the reporting period ended, the Fed lowered short-term rates from 2.0% to 1.5%. Treasuries at the short end of the curve rallied sharply towards through September as concerns about financial failures and a slowdown in global growth overshadowed actions taken by the Fed and Treasury to restore market confidence.
After falling from earlier record wide levels, credit spreads initially moved wider during the reporting period, primarily driven by volatility in oil prices and uncertainty about the outlook within the financial sector. As the period progressed, credit continued to underperform, driven by poor technicals, negative company specific headlines and
PORTFOLIO RESULTS
generally light summer volumes. A lack of liquidity continued to be a pressing theme. September saw the virtual collapse of the existing financial system and unprecedented government intervention from countries across the world, led by the U.S. During the month of September we experienced these major events: (1) the failure and default of several large organizations, (2) the support of several large systemically important institutions, (3) the initial failure of the U.S. rescue package, (4) a large amount of capital raising by major U.S. financial companies, (5) amendments to certain U.S. tax rules, (6) guarantees of deposits and/or debt by sovereigns in Europe and (7) a wave of consolidation among financial companies in the U.S. and elsewhere.
Headlines primarily drove price action in the credit markets, but concerns remain about how much capital is still needed to offset losses, as well as how financials will be able to access non-government funding in the longer term. Meanwhile, the U.S. government was focused on quickly passing legislation to stop a full-scale meltdown of the financial system. As mentioned, the $700 billion bailout package initially failed in the House of Representatives on Sept 29th, sending the markets reeling and leaving the credit markets in limbo at the end of the reporting period. A revised bailout package was subsequently approved by Congress in early October.
INVESTMENT OBJECTIVE
The Fund seeks a high level total return consisting of capital appreciation and income that exceeds the total return of the Lehman Brothers U.S. Credit Index
Factors Affecting Performance
In terms of sector positioning, the Fund had overweights in financials, media-cable and pipelines, while holding underweights in consumer products, retail and pharmaceuticals. The Fund maintained a down-in-quality bias, reflected in its overweight to BBB-rated bonds. We generally avoided bond issuers with exposure to a cyclical economic slowdown, particularly retailers, as we believed they faced narrowing margin pressures as a result of a global growth slowdown and the recent rapid contraction in lending. Within financials, we added exposure based on attractive valuation, focusing primarily large, blue chip, well-diversified institutions. We felt there was a backstop from the government which could help debt holders should one of these institutions fail.
Outlook
After the dramatic events of September, we are cautious on investment grade corporate credit due to systemic issues including the uncertainty surrounding funding and the ultimate effectiveness of the Troubled Asset Relief Program (TARP). We are currently targeting a neutral sector risk position. As roughly half of the investment grade credit market is comprised of financials, the distress of many of those institutions and the lack of clarity regarding their exposure to the more toxic securities could weigh heavily on market returns. We think governments across the globe will continue to intervene to stabilize the markets but we do not think this will be a panacea. We would, therefore, expect additional financial failures to take place because there are number of firms that are legitimately insolvent. In terms of credit default rates, we expect them to increase markedly as we go into the first half of 2009. Assets are currently priced for extreme tail risk (i.e. for Lehman
PORTFOLIO RESULTS
Brothers or Washington Mutual type events of default). The financials are now in a slow process of balance sheet repair and delevering, which we expect to continue for the next two years. In the non-financial investment grade universe, we also anticipate defaults to start to increase through 2009, as weaker companies are unable to raise new debt and face the impact of economic slowdown on their balance sheets. Companies that are reliant on consumer spending are likely to be the first and potentially hardest hit. Therefore, in general, we would avoid all but the highest quality of those companies.
We expect the massive policy response to succeed in restoring liquidity to the credit markets, but we also believe the deepening of the credit crisis that occurred in September and thus far in October will have a profoundly negative effect on consumer and business confidence. We feel there will be large dispersion between performance of winners and losers within the investment grade credit market and remain focused on bottom-up selection as the cornerstone of added value over the medium-to long-term.
Since the conclusion of the reporting period ended September 30, 2008, we have continued to experience periods of extreme volatility in the financial markets. In particular, continued deleveraging, a lack of liquidity and uncertainty regarding the economy have led to increased investor risk aversion. Despite these challenges, we continue to follow our investment approach that includes actively managing the Fund’s portfolios within a research-intensive, risk-managed framework. We thank you for your investment and look forward to your continued confidence.
Goldman Sachs U.S. Fixed Income Investment Management Team
October 23, 2008
Investment Grade Credit Fund
as of September 30, 2008
PERFORMANCE REVIEW
| | | | | | | | | | | | | | | |
April 1, 2008–
| | Fund Total Return
| | | Lehman Brothers
| | | 30-Day
| | | |
| September 30, 2008 | | (based on NAV)1 | | | U.S. Credit Index2 | | | Standardized Yield3 | | | |
|
| |
| Class A | | | -8.47 | % | | | -7.23 | % | | | 6.18 | % | | |
| Institutional | | | -8.39 | | | | -7.23 | | | | 6.88 | | | |
| Separate Account Institutional | | | -8.27 | | | | -7.23 | | | | 6.93 | | | |
| | | | | | | | | | | | | | | |
|
| |
| 1 | The net asset value (NAV) represents the net assets of the class of the Fund (ex-dividend) divided by the total number of shares of the class outstanding. The Fund’s performance assumes the reinvestment of dividends and other distributions. The Fund’s performance does not reflect the deduction of any applicable sales charges. |
| 2 | The Lehman Brothers U.S. Credit Index is an unmanaged index which is unbundled into pure corporates (industrial, utility, and finance, including both U.S. and Non-U.S. corporations) and non-corporates (sovereign, supranational, foreign agencies, and foreign local governments). The Index figures do not reflect any deduction for fees, expenses or taxes. It is not possible to invest directly in an unmanaged index. |
| 3 | The 30-Day Standardized Yield of the Fund is calculated by dividing the net investment income per share (as defined by securities industry regulations) earned by the Fund over a 30-day period (ending on the stated month-end date) by the maximum public offering price per share of the Fund on the last day of the period. This number is then annualized. This yield does not necessarily reflect income actually earned and distributed by the Fund and, therefore, may not be correlated with the dividends or other distributions paid to shareholders. |
STANDARDIZED AVERAGE ANNUAL TOTAL RETURNS4
| | | | | | | | | | | | | |
| For the period ended 9/30/08 | | One Year | | | Since Inception | | | Inception Date | | |
|
| |
| Class A | | | -12.42 | % | | | 0.48 | % | | 11/3/03 | | |
| Institutional | | | -8.00 | | | | 1.84 | | | 11/3/03 | | |
| Separate Account Institutional | | | -7.87 | | | | 1.89 | | | 11/3/03 | | |
|
| |
| 4 | The Standardized Total Returns are average annual total returns as of the most recent calendar quarter-end. They assume reinvestment of all distributions at NAV. These returns reflect a maximum initial sales charge of 4.5% for Class A Shares. Because Institutional and Separate Account Institutional Shares do not involve a sales charge, such a charge is not applied to their Standardized Total Returns. |
| | The returns represent past performance. Past performance does not guarantee future results. The Fund’s investment return and principal value will fluctuate so that an investor’s shares, when redeemed, may be worth more or less than their original cost. Current performance may be lower or higher than the performance quoted above. Please visit our Web site at: www.goldmansachsfunds.com to obtain the most recent month-end returns. Performance reflects expense limitations in effect. In their absence, performance would be reduced. Returns do not reflect the deduction of taxes that a shareholder would pay on Fund distributions or the redemption of Fund shares. |
EXPENSE RATIOS5
| | | | | | | | | | | |
| | | Net Expense Ratio (Current) | | Gross Expense Ratio (Before Waivers) | | |
|
| |
| Class A | | | 0.76 | % | | | 0.95 | % | | |
| Institutional | | | 0.40 | | | | 0.61 | | | |
| Separate Account Institutional | | | 0.35 | | | | 0.56 | | | |
|
| |
| 5 | The expense ratios of the Fund, both current (net of applicable fee waivers and/or expense limitations) and before waivers (gross of applicable fee waivers and/or expense limitations), are as set forth above according to the most recent publicly available Prospectuses for the Fund and may differ from the expense ratios disclosed in the Financial Highlights in this report. Applicable waivers and expense limitations are voluntary and may be modified or terminated at any time at the option of the investment adviser. If this occurs, the expense ratios may change without shareholder approval. |
| |
| 6 | The percentage shown for each investment category reflects the value of investments in that category as a percentage of net assets (excluding securities lending collateral, if any). Figures in the above graph may not sum to 100% due to the exclusion of other assets and liabilities. |
| |
| 7 | Please refer to the table below for Top Ten Industry Allocations in the Corporate Bond sector. |
TOP TEN INDUSTRY ALLOCATION
| | | | | | | | | | | |
| Percentage of Net Assets | | as of 9/30/08 | | | as of 3/31/08 | | | |
|
| |
| Insurance | | | 14.4 | % | | | 15.5 | % | | |
| Banks | | | 14.0 | | | | 19.7 | | | |
| Real Estate Investment Trusts | | | 11.7 | | | | 11.4 | | | |
| Natural Gas | | | 6.2 | | | | 6.1 | | | |
| Financial | | | 5.4 | | | | 6.0 | | | |
| Media | | | 5.2 | | | | 3.3 | | | |
| Brokerage | | | 4.7 | | | | 8.1 | | | |
| Energy | | | 4.6 | | | | 3.6 | | | |
| Communications | | | 3.9 | | | | 4.2 | | | |
| Electric | | | 3.3 | | | | 3.7 | | | |
|
Local Emerging Markets Debt Fund
Dear Shareholder:
This report provides an overview on the performance of the Goldman Sachs Local Emerging Markets Debt Fund (the “Fund”) during the six-month reporting period that ended September 30, 2008.
Performance Review
Over the six-month period that ended September 30, 2008, the Fund’s Class A, Class C and Institutional Shares generated cumulative total returns, without sales charges, of –7.38%, –7.73% and –7.22%, respectively. These returns compare to the –2.36% cumulative total return of the Fund’s reference benchmark, the JPMorgan Government Bond Index — Emerging Markets Global Diversified Index (with dividends reinvested), over the same time period.
The Fund posted a negative return during the reporting period and underperformed its benchmark. The major detractors to performance included the Fund’s positioning of the U.S. dollar, while the contributors to performance included factors in the active currency strategy.
Market Review
JPMorgan Government Bond Index — Emerging Markets Global Diversified Index returned –2.36% over the six month period ended September 30, 2008. Like many other asset classes, emerging markets local debt did not escape unharmed from the volatility triggered by the ongoing global financial crisis. In general, emerging markets local debt has came under a lot of pressure as deleveraging continued in the midst of the escalating global credit crisis. A series of unprecedented and industry-changing events occurred toward the end of the reporting period that spread fear and shock throughout global financial markets, causing an extreme flight to quality. To list just a few events: Fannie Mae and Freddie Mac entered conservatorship, Lehman Brothers filed for bankruptcy, AIG was rescued by the Federal Reserve Board (the “Fed”), Merrill Lynch agreed to merge with Bank of America, Morgan Stanley and Goldman Sachs were converted into bank holding companies, Washington Mutual filed for bankruptcy and was later acquired by JP Morgan, Wachovia’s banking operations were acquired by Wells Fargo, and several major European banks were rescued by large monetary injections from both the public and private sectors. In light of these events, the emerging markets local debt performed poorly as there was an indiscriminate and broad sell-off of risky assets and investors were extremely risk averse during this financial crisis.
INVESTMENT OBJECTIVE
The Fund seeks a high level of total return consisting of income and capital appreciation.
Factors Affecting Performance
On a total return basis, contributors to performance included the Fund’s momentum factor in the active currency strategy, active currency exposure to currencies in emerging Europe and security selection of Colombian local market debt.
PORTFOLIO RESULTS
The momentum factor is one of the ways we seek to manage risk within our active currency strategy; it is meant to capitalize on medium-term persistence that currencies have historically exhibited. By persistence, we’re referring to the trend that past currency return patterns may potentially indicate their future movements. During the reporting period, the Fund’s portfolio benefited from being positioned to take advantage of this persistence. In short, we generally overweighted currencies that had been doing well and underweighted those currencies that have been doing poorly.
Detractors from performance included the Fund’s underweight exposure to the U.S. dollar, as the value of the U.S. dollar appreciated over the reporting period. In addition, the Fund’s overweight exposure to currencies with high interest rates and security selection of local market debt in Brazil and Indonesia was detrimental to performance.
Outlook
Despite the recent poor performance, we continue to have a positive outlook on the emerging local debt market asset class. Local markets have dramatically transformed in the last few years. This market has deepened and become more liquid, the investor base has grown and is more diversified and emerging market economies have undergone structural changes that promote macroeconomic stability and active debt management. Inflows to this assets class are consistent and stem from strategic investors. We think that these trends are enduring and should or can persist in the future.
There are two sources of potential positive performance that come from investing in emerging local market debt. The first source is expected foreign currency appreciation. We think that emerging market currencies are supported by current account surpluses and strong growth rates, which are not easily undermined and anchor valuations over the medium term. The second source is interest rate convergence. We believe that interest rates of emerging economies will decline due to falling inflation rates and less sovereign risks. Emerging market external spreads have already tightened dramatically over the last ten years and we expect local emerging market yields to follow this trend.
Since the conclusion of the reporting period ended September 30, 2008, we have continued to experience periods of extreme volatility in the financial markets. In particular, continued deleveraging, a lack of liquidity and uncertainty regarding the economy have led to increased investor risk aversion. Despite these challenges, we continue to follow our investment approach that includes actively managing the Fund’s portfolios within a research-intensive, risk-managed framework. We thank you for your investment and look forward to your continued confidence.
Goldman Sachs Global Fixed Income Investment Management Team
October 20, 2008
Local Emerging Markets Debt Fund
as of September 30, 2008
PERFORMANCE REVIEW
| | | | | | | | | | | | | | | |
April 1, 2008–
| | Fund Total Return
| | | J.P. Morgan GBI EM 30-Day
| | | 30-Day
| | | |
| September 30, 2008 | | (based on NAV1) | | | Global Diversified Index2 | | | Standardized Yield3 | | | |
|
| |
| Class A | | | -7.38 | % | | | -2.36 | % | | | 7.63 | % | | |
| Class C | | | -7.73 | | | | -2.36 | | | | 7.24 | | | |
| Institutional | | | -7.22 | | | | -2.36 | | | | 8.47 | | | |
|
| |
| 1 | The net asset value (NAV) represents the net assets of the class of the Fund (ex-dividend) divided by the total number of shares of the class outstanding. The Fund’s performance assumes the reinvestment of dividends and other distributions. The Fund’s performance does not reflect the deduction of any applicable sales charges. |
| 2 | The J.P. Morgan GBI EM Global Diversified Index is an unmanaged index of debt instruments of 14 Emerging Countries. The Index figures do not reflect any deduction for fees, expenses or taxes. It is not possible to invest directly in an unmanaged index. |
| 3 | The 30-Day Standardized Yield of the Fund is calculated by dividing the net investment income per share (as defined by securities industry regulations) earned by the Fund over a 30-day period (ending on the stated month-end date) by the maximum public offering price per share of the Fund on the last day of the period. This number is then annualized. This yield does not necessarily reflect income actually earned and distributed by the Fund and, therefore, may not be correlated with the dividends or other distributions paid to shareholders. |
STANDARDIZED AVERAGE ANNUAL TOTAL RETURNS4
| | | | | | | | | | | | | |
| For the period ending 9/30/08 | | One Year | | | Since Inception | | | Inception Date | | |
|
| |
| Class A | | | N/A | | | | -12.36 | % | | 2/15/08 | | |
| Class C | | | N/A | | | | -8.65 | | | 2/15/08 | | |
| Institutional | | | N/A | | | | -8.04 | | | 2/15/08 | | |
|
| |
| 4 | The Standardized Total Returns are average annual total returns or cumulative total returns (only if the performance period is one year or less) as of the most recent calendar quarter-end. They assume reinvestment of all distributions at NAV. These returns reflect a maximum initial sales charge of 4.5% for Class A Shares and the assumed contingent deferred sales charge for Class C Shares (1% if redeemed within 12 months of purchase). Because Institutional Shares do not involve a sales charge, such a charge is not applied to their Standardized Total Returns. The Fund will charge a 2% redemption fee on the redemption of shares (including by exchange) held for 30 calendar days or less. The performance figures do not reflect the deduction of the redemption fee. If reflected, the redemption fee would reduce the performance quoted. |
| |
| |
| | The returns represent past performance. Past performance does not guarantee future results. The Fund’s investment return and principal value will fluctuate so that an investor’s shares, when redeemed, may be worth more or less than their original cost. Current performance may be lower or higher than the performance quoted above. Please visit our Web site at: www.goldmansachsfunds.com to obtain the most recent month-end returns. Performance reflects expense limitations in effect. In their absence, performance would be reduced. Returns do not reflect the deduction of taxes that a shareholder would pay on Fund distributions or the redemption of Fund shares. |
EXPENSE RATIOS5
| | | | | | | | | | | | |
| | | Net Expense Ratio (Current) | | | | Gross Expense Ratio (Before Waivers) | | |
|
| |
| Class A | | | 1.35 | | % | | | 2.98 | % | | |
| Class C | | | 2.10 | | | | | 3.73 | | | |
| Institutional | | | 1.01 | | | | | 2.64 | | | |
|
| |
| 5 | The expense ratios of the Fund, both current (net of applicable fee waivers and/or expense limitations) and before waivers (gross of applicable fee waivers and/or expense limitations), are as set forth above according to the most recent publicly available Prospectuses for the Fund and may differ from the expense ratios disclosed in the Financial Highlights in this report. Applicable waivers and expense limitations are voluntary and may be modified or terminated at any time at the option of the investment adviser. If this occurs, the expense ratios may change without shareholder approval. |
FUND BASICS
TOP 10 COUNTRY ALLOCATION6
| | | | | | | | | | | | |
| | | Percentage of Net Assets | | | |
| | | | | | |
| | |
as of 9/30/08 | | | | as of 3/31/08 | | | |
|
| |
United States7 | | | 28.9 | | % | | | 36.9 | % | | |
| Turkey | | | 8.3 | | | | | 4.8 | | | |
| Nigeria | | | 8.1 | | | | | 0.0 | | | |
| Hungary | | | 7.4 | | | | | 6.3 | | | |
| Indonesia | | | 6.7 | | | | | 2.9 | | | |
| Peru | | | 6.6 | | | | | 3.7 | | | |
| Russia | | | 6.5 | | | | | 4.3 | | | |
| Mexico | | | 6.4 | | | | | 5.1 | | | |
| Poland | | | 4.8 | | | | | 4.2 | | | |
| Egypt | | | 4.2 | | | | | 1.8 | | | |
|
| |
| 6 | The percentage shown for each investment category reflects the value of investments in that category as a percentage of net assets. |
| |
| 7 | Includes 28.9%, as of 9/30/08, and 36.9%, as of 3/31/08, of short-term investments. Short-term investments include repurchase agreements. |
U.S. Mortgages Fund
Dear Shareholder,
This report provides an overview on the performance of the Goldman Sachs U.S. Mortgages Fund (the “Fund”) during the six-month reporting period that ended September 30, 2008.
Performance Review
Over the six-month period that ended September 30, 2008, the Fund’s Class A, Institutional and Separate Account Institutional Shares generated cumulative total returns, without sales charges, of –1.43%, –1.25% and –1.23%, respectively. These returns compare to the 0.50% cumulative total return of the Fund’s benchmark, the Lehman Brothers Securitized Index (with dividends reinvested), over the same time period.
Our security selection of non-agency-backed adjustable-rate mortgages (ARMs) was the largest detractor from the Fund’s performance versus the benchmark during the reporting period. Despite their seniority in the capital structure and substantial amount of credit enhancement, these securities sold off significantly due to the slowdown in the housing market, illiquidity and forced selling of high quality assets by leveraged investors. Another detractor was our security selection of mortgage-related asset-backed securities. Overall, the Fund’s term structure positioning (i.e. its positioning relative to our interest rate expectations) had a modestly positive impact on performance over the last six months.
Market Review
During the reporting period, the global financial crisis reached historic proportions, rapidly spreading to the overall economy, prompting a historic response from policymakers. The month of September proved to be a turning point for the global financial markets. During September, the U.S. government seized mortgage giants Fannie Mae and Freddie Mac, helped to keep American International Group (AIG) solvent, provided insurance for money market funds, passed the $700 billion Troubled Asset Recovery Program (TARP) and created a program through which the Federal Reserve Board (the “Fed”) will purchase commercial paper outright, among many other measures. Arguably the most pivotal event, the Lehman Brothers bankruptcy filing, led to historically wide spreads in the corporate sector, with the financial sub-sector leading the way. Yields on U.S. Treasuries rose during the six-month period, as rising food and energy prices triggered inflation fears. With the exception of the mortgage sector, spread sectors experienced a dramatic widening as the financial system was shaken to its core.
Looking back, after improving in April, market sentiment took a turn for the worse in May and June, putting renewed pressure on all risky assets. A number of factors weighed on the mortgage market in the latter part of the second quarter, including renewed macroeconomic concerns, continued declines in home prices, weakening in the broader financial system and quarter-end balance sheet pressures. Non-agency mortgage spreads finished the second quarter tighter, as the sector rallied in April and May in response to improved financing and liquidity conditions. After reaching historic wide levels in August, agency mortgage spreads tightened significantly in response to the government’s takeover of the government-sponsored enterprises (GSEs) on September 7. Agency mortgage passthrough spreads rallied close to 50 basis points the day following the announcement. However, spreads then reversed course, moving wider toward the end of the third quarter, as extreme stress in money markets and heightened liquidity concerns weighed on the market.
PORTFOLIO RESULTS
As the third quarter came to a close, fundamentals in the housing market continued to deteriorate, with the S&P/Case-Shiller housing indices reaching record annual declines, but with some signs of a slowdown in the quarterly rates of decline. In addition, within the non-agency mortgage market, credit performance continued to deteriorate across sectors. Risk premiums in the non-agency mortgage market remained elevated and the outlook for the sector remained volatile due to a number of factors, including concerns around housing and economic conditions, ratings uncertainty and delinquency and performance trends.
We expect that US economic growth will be negative in the coming quarters. Inflation is in retreat with oil prices down more than 25% from the highs seen in July and inflation expectations likely to give way to deflation concerns as global growth slows. However, we do not see deflation as a significant threat, due largely to policymakers’ extraordinary response to the financial crisis.
INVESTMENT OBJECTIVE
The Fund seeks a high level of total return consisting of income and capital appreciation.
Factors Affecting Performance
A combination of top-down and bottom-up investment strategies impacted the Fund’s performance relative to its benchmark. At the security level, the primary detractor from performance, particularly over the latter half of the period, was the Fund’s holdings of high quality non-agency ARMs. While we are disappointed with Fund’s recent performance, we are confident in our positions, our process and our risk management. We believe that the Fund should continue to hold the non-agency ARM positions as these securities can offer a significant yield advantage and we feel they have the ability to recover in value during the intermediate- to long-term.
The Fund’s term structure positioning had a modestly positive impact on performance. Within our cross-sector strategies, we held an underweight commercial mortgage-backed security (CMBS) exposure due to negative market fundamentals. This benefited the Fund’s relative performance as the sector performed poorly versus Treasuries.
Outlook
Considering the severity of the financial crisis and the downturn in housing, U.S. economic growth has held up better than might have been expected thus far in 2008. Growth has been supported primarily by the strength of net exports and the surprising resilience of retail sales. However, we expect both of those sources of support to weaken in the coming months.
PORTFOLIO RESULTS
The government’s recent actions reinforce the credit of senior GSE debt. We believe this is a positive development for agency debentures and agency-guaranteed mortgage-backed securities (MBS). Despite an expected increase in supply, we believe the demand picture for agency MBS has improved due to increased GSE portfolio flexibility and an expected revival in overseas demand for agency MBS due to increased clarity in the relationship between GSEs and the U.S. Treasury. Additionally, the U.S. Treasury is available as the backstop (rather than the primary) buyer of agency MBS. We continue to believe there are attractive security selection opportunities within the sector. It is likely for principal prepayments to increase given our expectations for lower mortgage rates and increased refinancing options. The $700 billion TARP, in combination with the bailout of the GSEs in September, may shorten the time it will take for the U.S. housing market to stabilize. This could also reduce the probability of extreme negative housing scenarios through the reduction of mortgage rates and increased refinancing options for borrowers. However, much uncertainty remains surrounding the timing and implementation of the Treasury’s measures. Therefore, we expect to see ongoing volatility, particularly within the non-agency market, given heightened headline and liquidity concerns and overall shaken investor confidence. Nevertheless, we see attractive security selection opportunities in senior non-agency ARMs. We remain cautious on CMBS due to deteriorating fundamentals.
Since the conclusion of the reporting period ended September 30, 2008, we have continued to experience periods of extreme volatility in the financial markets. In particular, continued deleveraging, a lack of liquidity and uncertainty regarding the economy have led to increased investor risk aversion. Despite these challenges, we continue to follow our investment approach that includes actively managing the Fund’s portfolios within a research-intensive, risk-managed framework. We thank you for your investment and look forward to your continued confidence.
Goldman Sachs U.S. Fixed Income Investment Management Team
October 23, 2008
U.S. Mortgages Fund
as of September 30, 2008
PERFORMANCE REVIEW
| | | | | | | | | | | | | |
April 1, 2008–
| | Fund Total Return
| | | Lehman Brothers
| | | 30-Day
| |
| September 30, 2008 | | (based on NAV)1 | | | Securitized Index2 | | | Standardized Yield3 | |
| |
| |
| Class A | | | -1.43 | % | | | 0.50 | % | | | 4.73 | % |
| Institutional | | | -1.25 | | | | 0.50 | | | | 5.33 | |
| Separate Account Institutional | | | -1.23 | | | | 0.50 | | | | 5.38 | |
|
| |
| 1 | The net asset value (NAV) represents the net assets of the class of the Fund (ex-dividend) divided by the total number of shares of the class outstanding. The Fund’s performance assumes the reinvestment of dividends and other distributions. The Fund’s performance does not reflect the deduction of any applicable sales charges. |
| 2 | The Lehman Brothers Securitized Index is an unmanaged composite of asset-backed securities, collateralized mortgage-backed securities and fixed rate mortgage-backed securities. The Index figures do not reflect any deduction for fees, expenses or taxes. It is not possible to invest directly in an unmanaged index. |
| 3 | The 30-Day Standardized Yield of the Fund is calculated by dividing the net investment income per share (as defined by securities industry regulations) earned by the Fund over a 30-day period (ending on the stated month-end date) by the maximum public offering price per share of the Fund on the last day of the period. This number is then annualized. This yield does not necessarily reflect income actually earned and distributed by the Fund and, therefore, may not be correlated with the dividends or other distributions paid to shareholders. |
STANDARDIZED AVERAGE ANNUAL TOTAL RETURNS4
| | | | | | | | | | | | | |
| For the period ended 9/30/08 | | One Year | | | Since Inception | | | Inception Date | |
| |
| |
| Class A | | | -6.00 | % | | | 1.96 | % | | | 11/3/03 | |
| Institutional | | | -1.28 | | | | 3.32 | | | | 11/3/03 | |
| Separate Account Institutional | | | -1.13 | | | | 3.38 | | | | 11/3/03 | |
|
| |
| 4 | The Standardized Total Returns are average annual total returns as of the most recent calendar quarter-end. They assume reinvestment of all distributions at NAV. These returns reflect a maximum initial sales charge of 4.5% for Class A Shares. Because Institutional and Separate Account Institutional Shares do not involve a sales charge, such a charge is not applied to their Standardized Total Returns. |
The returns represent past performance. Past performance does not guarantee future results. The Fund’s investment return and principal value will fluctuate so that an investor’s shares, when redeemed, may be worth more or less than their original cost. Current performance may be lower or higher than the performance quoted above. Please visit our Web site at: www.goldmansachsfunds.com to obtain the most recent month-end returns. Performance reflects expense limitations in effect. In their absence, performance would be reduced. Returns do not reflect the deduction of taxes that a shareholder would pay on Fund distributions or the redemption of Fund shares.
EXPENSE RATIOS5
| | | | | | | | | |
| | | Net Expense Ratio (Current) | | Gross Expense Ratio (Before Waivers) |
|
| |
| Class A | | | 0.76 | % | | | 0.91 | % |
| Institutional | | | 0.40 | | | | 0.57 | |
| Separate Account Institutional | | | 0.35 | | | | 0.52 | |
|
| |
| 5 | The expense ratios of the Fund, both current (net of applicable fee waivers and/or expense limitations) and before waivers (gross of applicable fee waivers and/or expense limitations), are as set forth above according to the most recent publicly available Prospectuses for the Fund and may differ from the expense ratios disclosed in the Financial Highlights in this report. Applicable waivers and expense limitations are voluntary and may be modified or terminated at any time at the option of the investment adviser. If this occurs, the expense ratios may change without shareholder approval. |
FUND BASICS
SECTOR ALLOCATIONS6
Percentage of Net Assets
| |
| 6 | The percentage shown for each investment category reflects the value of investments in that category as a percentage of net assets (excluding securities lending collateral, if any). Figures in the above graph may not sum to 100% due to the exclusion of other assets and liabilities. |
| |
| 7 | Federal Agencies are mortgage-backed securities that consist of Government National Mortgage Association (“GNMA”), Federal National Mortgage Association (“FNMA”) and Federal Home Loan Mortgage Corp. (“FHLMC”). GNMA instruments are backed by the full faith and credit of the U.S. Government. |
| |
| 8 | “Agency Debentures” include agency securities offered by companies such as FNMA and FHLMC, which operate under a government charter. While they are required to report to a government regulator, their assets are not explicitly guaranteed by the government and they otherwise operate similar to any other publicly traded company. |
GOLDMAN SACHS EMERGING MARKETS DEBT FUND
Schedule of Investments
September 30, 2008 (Unaudited)
| | | | | | | | | | | | | | | | | | | |
| | | Principal
| | Interest
| | Maturity
| | |
| | | Amount | | Rate | | Date | | Value |
| |
Sovereign Debt Obligations – 77.4% |
| | | | | | | | | | | | | | | | | | | |
| | | | | | | | | | | | | | | | | | | |
| | | | | Argentina – 7.5% |
| | | | | Republic of Argentina (B-)(a) |
| | | | | | ARS 2,594,832 | | | | 2.000 | % | | | 01/03/10 | | | $ | 785,666 | |
| | | | | Republic of Argentina (B) |
| | | | | $ | 3,330,000 | | | | 7.000 | | | | 03/28/11 | | | | 2,490,932 | |
| | | | | | 9,960,000 | | | | 7.000 | | | | 10/03/15 | | | | 5,717,040 | |
| | | | | | ARS 3,673,355 | | | | 2.000 | (a) | | | 01/03/16 | | | | 814,555 | |
| | | | | | EUR 645,640 | | | | 1.200 | (b) | | | 12/31/38 | | | | 199,965 | |
| | | | | $ | 1,530,000 | | | | 1.330 | (b) | | | 12/31/38 | | | | 377,145 | |
| | | | | Republic of Argentina (B/B3)(a) |
| | | | | | 6,462,500 | | | | 3.127 | | | | 08/03/12 | | | | 4,658,647 | |
| | | | | | | | | | | | | | | | | | | |
| | | | | | | | | | | | | | | | | | 15,043,950 | |
| | | | | |
| | | | | |
| | | | | Brazil – 4.5% |
| | | | | Federal Republic of Brazil (BBB-/Ba1) |
| | | | | | 2,970,000 | | | | 6.000 | | | | 01/17/17 | | | | 2,866,050 | |
| | | | | | 4,640,000 | | | | 8.250 | | | | 01/20/34 | | | | 5,254,800 | |
| | | | | | 1,000,000 | | | | 7.125 | | | | 01/20/37 | | | | 1,030,000 | |
| | | | | | | | | | | | | | | | | | | |
| | | | | | | | | | | | | | | | | | 9,150,850 | |
| | | | | |
| | | | | |
| | | | | Bulgaria – 0.6% |
| | | | | Republic of Bulgaria (BBB+/Baa3) |
| | | | | | 1,180,000 | | | | 8.250 | | | | 01/15/15 | | | | 1,292,100 | |
| | | | | |
| | | | | |
| | | | | Colombia – 3.7% |
| | | | | Republic of Colombia (BBB-/Ba1) |
| | | | | | 1,170,000 | | | | 6.364 | (a) | | | 03/17/13 | | | | 1,199,250 | |
| | | | | | 3,500,000 | | | | 7.375 | | | | 01/27/17 | | | | 3,640,000 | |
| | | | | | 830,000 | | | | 8.375 | | | | 02/15/27 | | | | 921,300 | |
| | | | | | 1,690,000 | | | | 7.375 | | | | 09/18/37 | | | | 1,690,000 | |
| | | | | | | | | | | | | | | | | | | |
| | | | | | | | | | | | | | | | | | 7,450,550 | |
| | | | | |
| | | | | |
| | | | | Dominican Republic – 1.7% |
| | | | | Dominican Republic (B+/B2) |
| | | | | | 3,653,824 | | | | 9.040 | | | | 01/23/18 | | | | 3,443,729 | |
| | | | | |
| | | | | |
| | | | | Ecuador(b) – 1.2% |
| | | | | Republic of Ecuador (B-/B3) |
| | | | | | 3,475,000 | | | | 10.000 | | | | 08/15/30 | | | | 2,502,000 | |
| | | | | |
| | | | | |
| | | | | El Salvador – 1.1% |
| | | | | Republic of El Salvador (BB+/Baa3) |
| | | | | | 2,170,000 | | | | 8.250 | | | | 04/10/32 | | | | 2,148,300 | |
| | | | | |
| | | | | |
| | | | | Gabon(c) – 0.8% |
| | | | | Republic of Gabonese (BB-) |
| | | | | | 1,680,000 | | | | 8.200 | | | | 12/12/17 | | | | 1,528,800 | |
| | | | | |
| | | | | |
| | | | | Georgia – 0.3% |
| | | | | Republic of Georgia (B) |
| | | | | | 570,000 | | | | 7.500 | | | | 04/15/13 | | | | 501,600 | |
| | | | | |
| | | | | |
| | | | | Ghana – 0.3% |
| | | | | Republic of Ghana (B+) |
| | | | | | 780,000 | | | | 8.500 | | | | 10/04/17 | | | | 686,400 | |
| | | | | |
| | | | | |
| | | | | Hungary – 1.8% |
| | | | | Hungary Government Bond (BBB+/A2) |
| | | | | | HUF 720,260,000 | | | | 6.500 | | | | 06/24/19 | | | | 3,683,110 | |
| | | | | |
| | | | | |
| | | | | Indonesia – 3.6% |
| | | | | Republic of Indonesia (BB-/Ba3) |
| | | | | | 1,080,000 | | | | 7.500 | | | | 01/15/16 | | | | 1,031,400 | |
| | | | | | 600,000 | | | | 6.625 | (c) | | | 02/17/37 | | | | 462,000 | |
| | | | | | 680,000 | | | | 7.750 | | | | 01/17/38 | | | | 595,000 | |
| | | | | | 5,890,000 | | | | 7.750 | (c) | | | 01/17/38 | | | | 5,153,750 | |
| | | | | | | | | | | | | | | | | | | |
| | | | | | | | | | | | | | | | | | 7,242,150 | |
| | | | | |
| | | | | |
| | | | | Iraq – 1.1% |
| | | | | Republic of Iraq |
| | | | | | 3,290,000 | | | | 5.800 | | | | 01/15/28 | | | | 2,154,950 | |
| | | | | |
| | | | | |
| | | | | Israel – 0.2% |
| | | | | State of Israel (A/A1) |
| | | | | | 400,000 | | | | 5.125 | | | | 03/01/14 | | | | 404,982 | |
| | | | | |
| | | | | |
| | | | | Jamaica – 0.2% |
| | | | | Government of Jamaica (B) |
| | | | | | 440,000 | | | | 8.000 | | | | 06/24/19 | | | | 402,600 | |
| | | | | |
| | | | | |
| | | | | Korea – 0.6% |
| | | | | Republic of Korea (A/A2) |
| | | | | | 1,280,000 | | | | 5.625 | | | | 11/03/25 | | | | 1,172,066 | |
| | | | | |
| | | | | |
| | | | | Lebanon – 2.5% |
| | | | | Republic of Lebanon MTN (B-/B3) |
| | | | | | 190,000 | | | | 10.250 | | | | 10/06/09 | | | | 195,700 | |
| | | | | Republic of Lebanon MTN (B-) |
| | | | | | 2,690,000 | | | | 6.109 | (a) | | | 11/30/09 | | | | 2,629,475 | |
| | | | | | 2,831,000 | | | | 4.000 | | | | 12/31/17 | | | | 2,208,180 | |
| | | | | | | | | | | | | | | | | | | |
| | | | | | | | | | | | | | | | | | 5,033,355 | |
| | | | | |
| | | | | |
| | | | | Malaysia – 1.9% |
| | | | | Malaysia (A-/A3) |
| | | | | | 3,520,000 | | | | 7.500 | | | | 07/15/11 | | | | 3,859,843 | |
| | | | | |
| | | | | |
| | | | | Mexico – 5.8% |
| | | | | Mexican Fixed Rate Bonds (A+/Baa1) |
| | | | | | MXN 34,350,000 | | | | 10.000 | | | | 12/05/24 | | | | 3,552,862 | |
| | | | | Mexican Udibonos (A+/Baa1) |
| | | | | | 23,674,875 | | | | 3.500 | | | | 12/14/17 | | | | 2,085,902 | |
| | | | | United Mexican States (BBB+/Baa1) |
| | | | | $ | 290,000 | | | | 5.625 | | | | 01/15/17 | | | | 283,040 | |
| | | | | | 2,590,000 | | | | 8.300 | | | | 08/15/31 | | | | 3,062,675 | |
| | | | | | 2,530,000 | | | | 7.500 | | | | 04/08/33 | | | | 2,764,025 | |
| | | | | | | | | | | | | | | | | | | |
| | | | | | | | | | | | | | | | | | 11,748,504 | |
| | | | | |
| | | | | |
| | | | | Pakistan – 0.4% |
| | | | | Islamic Republic of Pakistan (CCC+/B2) |
| | | | | | 1,350,000 | | | | 6.875 | (c) | | | 06/01/17 | | | | 607,500 | |
| | | | | | 400,000 | | | | 6.875 | | | | 06/01/17 | | | | 180,000 | |
| | | | | | | | | | | | | | | | | | | |
| | | | | | | | | | | | | | | | | | 787,500 | |
| | | | | |
| | | | | |
| | | | | Panama – 1.7% |
| | | | | Republic of Panama (BB+/Ba1) |
| | | | | | 200,000 | | | | 9.375 | (d) | | | 04/01/29 | | | | 248,000 | |
| | | | | | 3,372,000 | | | | 6.700 | | | | 01/26/36 | | | | 3,152,820 | |
| | | | | | | | | | | | | | | | | | | |
| | | | | | | | | | | | | | | | | | 3,400,820 | |
| | | | | |
| | | | | |
The accompanying notes are an integral part of these financial statements.
GOLDMAN SACHS EMERGING MARKETS DEBT FUND
| | | | | | | | | | | | | | | | | | | |
| | | Principal
| | Interest
| | Maturity
| | |
| | | Amount | | Rate | | Date | | Value |
| |
Sovereign Debt Obligations – (continued) |
| | | | | Panama – (continued) |
| | | | | | | | | | | | | | | | | | | |
| | | | | Peru – 2.5% |
| | | | | Republic of Peru (BBB-/Ba1) |
| | | | | $ | 3,095,000 | | | | 8.375 | % | | | 05/03/16 | | | $ | 3,419,975 | |
| | | | | | 1,840,000 | | | | 6.550 | | | | 03/14/37 | | | | 1,692,800 | |
| | | | | | | | | | | | | | | | | | | |
| | | | | | | | | | | | | | | | | | 5,112,775 | |
| | | | | |
| | | | | |
| | | | | Philippines – 5.8% |
| | | | | Republic of Philippines (B1) |
| | | | | | 3,025,000 | | | | 7.500 | | | | 09/25/24 | | | | 3,146,000 | |
| | | | | Republic of Philippines (BB-/B1) |
| | | | | | 620,000 | | | | 9.500 | (d) | | | 10/21/24 | | | | 747,100 | |
| | | | | | 5,980,000 | | | | 10.625 | | | | 03/16/25 | | | | 7,893,600 | |
| | | | | | | | | | | | | | | | | | | |
| | | | | | | | | | | | | | | | | | 11,786,700 | |
| | | | | |
| | | | | |
| | | | | Russia(b) – 5.5% |
| | | | | Russian Federation (BBB+/Baa1) |
| | | | | | 11,059,300 | | | | 7.500 | | | | 03/31/30 | | | | 11,114,597 | |
| | | | | |
| | | | | |
| | | | | Serbia(b) – 0.7% |
| | | | | Republic of Serbia (BB-) |
| | | | | | 1,710,000 | | | | 3.750 | | | | 11/01/24 | | | | 1,410,750 | |
| | | | | |
| | | | | |
| | | | | South Africa – 1.0% |
| | | | | Republic of South Africa (BBB+/Baa1) |
| | | | | | 180,000 | | | | 6.500 | | | | 06/02/14 | | | | 176,400 | |
| | | | | | 2,210,000 | | | | 5.875 | | | | 05/30/22 | | | | 1,889,550 | |
| | | | | | | | | | | | | | | | | | | |
| | | | | | | | | | | | | | | | | | 2,065,950 | |
| | | | | |
| | | | | |
| | | | | Trinidad and Tobago – 1.4% |
| | | | | Trinidad & Tobago (A-/Baa1) |
| | | | | | 2,540,000 | | | | 5.875 | (c) | | | 05/17/27 | | | | 2,501,900 | |
| | | | | | 290,000 | | | | 5.875 | | | | 05/17/27 | | | | 281,063 | |
| | | | | | | | | | | | | | | | | | | |
| | | | | | | | | | | | | | | | | | 2,782,963 | |
| | | | | |
| | | | | |
| | | | | Turkey – 8.4% |
| | | | | Republic of Turkey (BB-/Ba3) |
| | | | | | 1,040,000 | | | | 9.500 | | | | 01/15/14 | | | | 1,145,300 | |
| | | | | | 6,810,000 | | | | 6.750 | | | | 04/03/18 | | | | 6,367,350 | |
| | | | | | 3,080,000 | | | | 7.000 | | | | 03/11/19 | | | | 2,910,600 | |
| | | | | | 3,320,000 | | | | 7.375 | | | | 02/05/25 | | | | 3,129,100 | |
| | | | | | 1,580,000 | | | | 6.875 | | | | 03/17/36 | | | | 1,350,900 | |
| | | | | | 2,440,000 | | | | 7.250 | | | | 03/05/38 | | | | 2,122,800 | |
| | | | | | | | | | | | | | | | | | | |
| | | | | | | | | | | | | | | | | | 17,026,050 | |
| | | | | |
| | | | | |
| | | | | Ukraine – 3.5% |
| | | | | Ukraine Government (B+/B1) |
| | | | | | 1,520,000 | | | | 6.875 | | | | 03/04/11 | | | | 1,352,800 | |
| | | | | | 1,000,000 | | | | 6.385 | (c) | | | 06/26/12 | | | | 847,890 | |
| | | | | | 980,000 | | | | 6.385 | | | | 06/26/12 | | | | 813,400 | |
| | | | | | 3,800,000 | | | | 7.650 | | | | 06/11/13 | | | | 3,268,000 | |
| | | | | | 1,160,000 | | | | 6.580 | | | | 11/21/16 | | | | 864,200 | |
| | | | | | | | | | | | | | | | | | | |
| | | | | | | | | | | | | | | | | | 7,146,290 | |
| | | | | |
| | | | | |
| | | | | Uruguay – 4.0% |
| | | | | Republic of Uruguay (BB/B1) |
| | | | | | 6,109,587 | | | | 8.000 | | | | 11/18/22 | | | | 6,048,491 | |
| | | | | | 2,230,000 | | | | 7.625 | | | | 03/21/36 | | | | 2,107,350 | |
| | | | | | | | | | | | | | | | | | | |
| | | | | | | | | | | | | | | | | | 8,155,841 | |
| | | | | |
| | | | | |
| | | | | Venezuela – 3.1% |
| | | | | Republic of Venezuela (BB-/B2) |
| | | | | | 7,470,000 | | | | 6.000 | | | | 12/09/20 | | | | 4,108,500 | |
| | | | | | 1,140,000 | | | | 9.000 | | | | 05/07/23 | | | | 769,500 | |
| | | | | | 1,420,000 | | | | 9.250 | | | | 05/07/28 | | | | 958,500 | |
| | | | | | 600,000 | | | | 9.375 | | | | 01/13/34 | | | | 408,000 | |
| | | | | | | | | | | | | | | | | | | |
| | | | | | | | | | | | | | | | | | 6,244,500 | |
| | | | | |
| | | | | |
| | | | | TOTAL SOVEREIGN DEBT OBLIGATIONS |
| | | | | (Cost $171,563,905) | | $ | 156,484,575 | |
| | | | | |
| | | | | |
| | | | | | | | | | | | | | | | | | | |
| | | | | | | | | | | | | | | | | | | |
Corporate Obligations – 17.2% |
| | | | | | | | | | | | | | | | | | | |
| | | | | | | | | | | | | | | | | | | |
| | | | | Bermuda – 0.6% |
| | | | | Digicel Group Ltd. (Caa2) |
| | | | | $ | 1,490,000 | | | | 8.875 | % | | | 01/15/15 | | | $ | 1,192,000 | |
| | | | | |
| | | | | |
| | | | | Brazil – 1.1% |
| | | | | Companhia Energetica de Sao Paulo (Ba2) |
| | | | | | BRL 1,025,939 | | | | 9.750 | | | | 01/15/15 | | | | 511,567 | |
| | | | | Independencia International Ltd. (B/B2)(c) |
| | | | | $ | 1,570,000 | | | | 9.875 | | | | 05/15/15 | | | | 1,333,012 | |
| | | | | RBS – Zero Hora Editora Jornalistica SA (BB)(c) |
| | | | | | BRL 800,000 | | | | 11.250 | | | | 06/15/17 | | | | 290,084 | |
| | | | | | | | | | | | | | | | | | | |
| | | | | | | | | | | | | | | | | | 2,134,663 | |
| | | | | |
| | | | | |
| | | | | Colombia(c) – 0.7% |
| | | | | EEB International Ltd. (BB) |
| | | | | $ | 690,000 | | | | 8.750 | | | | 10/31/14 | | | | 690,000 | |
| | | | | TGI International Ltd. (BB) |
| | | | | | 760,000 | | | | 9.500 | | | | 10/03/17 | | | | 767,883 | |
| | | | | | | | | | | | | | | | | | | |
| | | | | | | | | | | | | | | | | | 1,457,883 | |
| | | | | |
| | | | | |
| | | | | Indonesia – 2.1% |
| | | | | Majapahit Holding BV (BB-/Ba3) |
| | | | | | 3,490,000 | | | | 7.750 | | | | 10/17/16 | | | | 3,071,200 | |
| | | | | | 1,310,000 | | | | 7.875 | (c) | | | 06/29/37 | | | | 956,300 | |
| | | | | | 360,000 | | | | 7.875 | | | | 06/29/37 | | | | 262,800 | |
| | | | | | | | | | | | | | | | | | | |
| | | | | | | | | | | | | | | | | | 4,290,300 | |
| | | | | |
| | | | | |
| | | | | Ireland(c) – 0.9% |
| | | | | TransCapital Invest Ltd. for OJSC AK Transneft (BBB+/A2) |
| | | | | | 1,270,000 | | | | 8.700 | | | | 08/07/18 | | | | 1,055,827 | |
| | | | | VIP Finance Ireland Ltd. for OJSC Vimpel Communications (BB+/Ba2) |
| | | | | | 1,180,000 | | | | 9.125 | | | | 04/30/18 | | | | 837,800 | |
| | | | | | | | | | | | | | | | | | | |
| | | | | | | | | | | | | | | | | | 1,893,627 | |
| | | | | |
| | | | | |
| | | | | Israel(c) – 0.8% |
| | | | | Israel Electric Corp. Ltd. (BBB+/Baa2) |
| | | | | | 1,660,000 | | | | 7.250 | | | | 01/15/19 | | | | 1,638,839 | |
| | | | | |
| | | | | |
| | | | | Kazakhstan – 2.2% |
| | | | | CenterCredit International BV (Ba1) |
| | | | | KZT | 232,000,000 | | | | 8.250 | | | | 09/30/11 | | | | 1,431,920 | |
| | | | | Kazkommerts International BV (BB/Ba1) |
| | | | | $ | 600,000 | | | | 7.875 | | | | 04/07/14 | | | | 354,000 | |
| | | | | KazMunaiGaz Finance Sub BV (BBB-/Baa1)(c) |
| | | | | | 1,850,000 | | | | 8.375 | | | | 07/02/13 | | | | 1,554,000 | |
| | | | | |
| | | | | |
The accompanying notes are an integral part of these financial statements.
GOLDMAN SACHS EMERGING MARKETS DEBT FUND
Schedule of Investments (continued)
September 30, 2008 (Unaudited)
| | | | | | | | | | | | | | | | | | | |
| | | Principal
| | Interest
| | Maturity
| | |
| | | Amount | | Rate | | Date | | Value |
| |
Corporate Obligations – (continued) |
| | | | | Kazakhstan – (continued) |
| | | | | | | | | | | | | | | | | | | |
| | | | | TuranAlem Finance BV (BB/Ba1) |
| | | | | $ | 450,000 | | | | 4.166 | (a)% | | | 01/22/09 | | | $ | 405,000 | |
| | | | | | 1,260,000 | | | | 8.000 | | | | 03/24/14 | | | | 680,400 | |
| | | | | | | | | | | | | | | | | | | |
| | | | | | | | | | | | | | | | | | 4,425,320 | |
| | | | | |
| | | | | |
| | | | | Russia – 4.6% |
| | | | | Evraz Group SA (BB-/Ba3)(c) |
| | | | | | 550,000 | | | | 9.500 | | | | 04/24/18 | | | | 379,500 | |
| | | | | Gazprom OAO (BBB/A3) |
| | | | | | 990,000 | | | | 9.625 | | | | 03/01/13 | | | | 978,862 | |
| | | | | Gaz Capital SA (BBB/A3)(c) |
| | | | | | 1,970,000 | | | | 8.146 | | | | 04/11/18 | | | | 1,723,750 | |
| | | | | RSHB Capital SA for OJSC Russian Agricultural Bank (A3)(c) |
| | | | | | 800,000 | | | | 7.750 | | | | 05/29/18 | | | | 607,360 | |
| | | | | VTB Capital SA (BBB+/A2)(d) |
| | | | | | 5,040,000 | | | | 6.875 | | | | 05/29/18 | | | | 3,754,800 | |
| | | | | | 2,470,000 | | | | 6.875 | (c) | | | 05/29/18 | | | | 1,840,150 | |
| | | | | | | | | | | | | | | | | | | |
| | | | | | | | | | | | | | | | | | 9,284,422 | |
| | | | | |
| | | | | |
| | | | | South Africa – 0.9% |
| | | | | Peermont Proprietary Global Ltd. (B/B3) |
| | | | | EUR | 1,910,000 | | | | 7.750 | | | | 04/30/14 | | | | 1,720,895 | |
| | | | | |
| | | | | |
| | | | | Trinidad and Tobago – 1.0% |
| | | | | Petroleum Co. of Trinidad & Tobago Ltd. (BBB+/Baa2) |
| | | | | $ | 1,030,000 | | | | 6.000 | | | | 05/08/22 | | | | 963,956 | |
| | | | | National Gas Co. of Trinidad & Tobago Ltd. (BBB+/A3)(c) |
| | | | | | 1,230,000 | | | | 6.050 | | | | 01/15/36 | | | | 1,123,913 | |
| | | | | | | | | | | | | | | | | | | |
| | | | | | | | | | | | | | | | | | 2,087,869 | |
| | | | | |
| | | | | |
| | | | | Ukraine – 0.1% |
| | | | | Nak Naftogaz Ukrainy (B1) |
| | | | | | 200,000 | | | | 8.125 | | | | 09/30/09 | | | | 166,000 | |
| | | | | |
| | | | | |
| | | | | United Arab Emirates(a) – 0.6% |
| | | | | Jafz Sukuk Ltd. (A+/A1) |
| | | | | AED | 5,400,000 | | | | 3.291 | | | | 11/27/12 | | | | 1,250,344 | |
| | | | | |
| | | | | |
| | | | | Venezuela – 1.6% |
| | | | | Petroleos de Venezuela SA (BB-) |
| | | | | $ | 4,090,000 | | | | 5.250 | | | | 04/12/17 | | | | 2,188,150 | |
| | | | | | 2,100,000 | | | | 5.375 | | | | 04/12/27 | | | | 945,000 | |
| | | | | | | | | | | | | | | | | | | |
| | | | | | | | | | | | | | | | | | 3,133,150 | |
| | | | | |
| | | | | |
| | | | | TOTAL CORPORATE OBLIGATIONS |
| | | | | (Cost $40,957,938) | | $ | 34,675,312 | |
| | | | | |
| | | | | |
| | | | | | | | | | | | | | | | | | | |
| | | | | | | | | | | | | | | | | | | |
Credit Linked Notes(c)(e) – 1.9% |
| | | | | | | | | | | | | | | | | | | |
| | | | | | | | | | | | | | | | | | | |
| | | | | Brazil – 1.9% |
| | | | | Federal Republic of Brazil |
| | | | | BRL | 2,700,000 | | | | 6.000 | % | | | 05/19/15 | | | $ | 2,166,215 | |
| | | | | $ | 443,768 | | | | 6.000 | | | | 05/16/17 | | | | 424,908 | |
| | | | | |
| | | | | |
| | | | | BRL | 1,000,000 | | | | 6.000 | % | | | 05/17/45 | | | $ | 1,208,200 | |
| | | | | | | | | | | | | | | | | | | |
| | | | | | | | | | | | | | | | | | 3,799,323 | |
| | | | | |
| | | | | |
| | | | | TOTAL CREDIT LINKED NOTES |
| | | | | (Cost $3,405,459) | | | | | | $ | 3,799,323 | |
| | | | | |
| | | | | |
| | | | | | | | | | | | | | | | | | | |
| | | | | | | | | | | | | | | | | | | |
Structured Note(c)(f)(g) – 1.1% |
| | | | | | | | | | | | | | | | | | | |
| | | | | | | | | | | | | | | | | | | |
| | | | | Republic of Turkey |
| | | | | TRY | 3,730,000 | | | | 0.000 | % | | | 04/14/10 | | | $ | 2,238,176 | |
| | | | | | | | | | | | | | | | | | | |
| | | | | (Cost $2,363,156) |
| | | | | |
| | | | | TOTAL INVESTMENTS – 97.6% |
| | | | | (Cost $218,290,458) | | $ | 197,197,386 | |
| | | | | |
| | | | | |
| | | | | OTHER ASSETS IN EXCESS OF LIABILITIES – 2.4% | | | 4,820,012 | |
| | | | | |
| | | | | |
| | | | | NET ASSETS – 100.0% | | | | | | $ | 202,017,398 | |
| | | | | |
| | | | | |
The percentage shown for each investment category reflects the value of investments in that category as a percentage of net assets.
| | |
| (a) | | Variable rate security. Interest rate disclosed is that which is in effect at September 30, 2008. |
| |
| (b) | | Coupon increases periodically based upon a predetermined schedule. Interest rate disclosed is that which is in effect at September 30, 2008. |
| |
| (c) | | Securities are exempt from registration under Rule 144A of the Securities Act of 1933. Under procedures approved by the Board of Trustees, such securities have been determined to be liquid by the Investment adviser and may be resold, normally to qualified institutional buyers in transactions exempt form registration. Total market value of Rule 144A securities amounts to $ 29,699,581, which represents approximately 14.7% of net assets as of September 30, 2008. |
| |
| (d) | | Securities with “Put” features with resetting interest rates. Maturity dates disclosed are the final maturity dates. |
| |
| (e) | | The underlying security is issued by Barclays Bank PLC. |
| |
| (f) | | The underlying security is issued by Deutsche Bank Securities, Inc. |
| |
| (g) | | Security issued with zero coupon. Income is recognized through the accretion of discount. |
Security ratings disclosed, if any, are issued by Standard & Poor’s/Moody’s Investors Service. A brief description of the ratings is available in the Fund’s Statement of Additional Information.
| | | | | | | |
| | | |
| | | |
| | | Investment Abbreviations: |
| | | CETIP | | — | | Central of Custody and Settlement of Private Bonds |
| | | LIBOR | | — | | London Interbank Offered Rate |
| | | MTN | | — | | Medium-Term Note |
| | | |
| | | |
The accompanying notes are an integral part of these financial statements.
GOLDMAN SACHS EMERGING MARKETS DEBT FUND
ADDITIONAL INVESTMENT INFORMATION
FORWARD FOREIGN CURRENCY CONTRACTS — At September 30, 2008, the Fund had outstanding forward foreign currency exchange contracts, both to purchase and sell foreign currencies:
| | | | | | | | | | | | | | | | | |
Open Forward Foreign
| | | | | | | | | | | | | |
Currency Contracts
| | Contract
| | Expiration
| | Value on
| | | Current
| | | Unrealized
| |
| with Unrealized Gain | | Type | | Date | | Settlement Date | | | Value | | | Gain | |
| | |
| Brazilian Real | | Sale | | 11/04/08 | | $ | 3,274,872 | | | $ | 2,769,763 | | | $ | 505,109 | |
| Euro | | Sale | | 10/31/08 | | | 2,167,534 | | | | 2,089,961 | | | | 77,573 | |
| Hungarian Forint | | Sale | | 10/16/08 | | | 4,002,490 | | | | 3,817,255 | | | | 185,235 | |
| Malaysian Ringgit | | Sale | | 11/04/08 | | | 2,220,720 | | | | 2,193,755 | | | | 26,965 | |
| Mexican Peso | | Sale | | 10/17/08 | | | 9,022,314 | | | | 8,531,024 | | | | 491,290 | |
| Taiwan Dollar | | Sale | | 11/04/08 | | | 2,281,712 | | | | 2,196,323 | | | | 85,389 | |
| |
| |
TOTAL | | | | | | | | | | | | | | $ | 1,371,561 | |
| |
| |
| | | | | | | | | | | | | | | | | |
Open Forward Foreign
| | | | | | | | | | | | | |
Currency Contracts
| | Contract
| | Expiration
| | Value on
| | | Current
| | | Unrealized
| |
| with Unrealized Loss | | Type | | Date | | Settlement Date | | | Value | | | Loss | |
| | |
| Brazilian Real | | Purchase | | 11/04/08 | | $ | 2,309,600 | | | $ | 2,189,390 | | | $ | (120,210 | ) |
| Malaysian Ringgit | | Purchase | | 11/04/08 | | | 2,319,896 | | | | 2,193,755 | | | | (126,141 | ) |
| Mexican Peso | | Purchase | | 10/17/08 | | | 3,111,206 | | | | 3,018,515 | | | | (92,691 | ) |
| Taiwan Dollar | | Purchase | | 11/04/08 | | | 2,337,088 | | | | 2,196,323 | | | | (140,765 | ) |
| Turkish Lira | | Purchase | | 12/17/08 | | | 3,240,428 | | | | 3,176,315 | | | | (64,113 | ) |
| Turkish Lira | | Sale | | 12/17/08 | | | 3,096,700 | | | | 3,176,315 | | | | (79,615 | ) |
| Yuan Renminbi | | Purchase | | 11/04/08 | | | 2,529,788 | | | | 2,476,065 | | | | (53,723 | ) |
| |
| |
TOTAL | | | | | | | | | | | | | | $ | (677,258 | ) |
| |
| |
FUTURES CONTRACT — At September 30, 2008, the following futures contract was open:
| | | | | | | | | | | | | | | |
| | | Number of
| | | Settlement
| | Notional
| | | Unrealized
| |
| Type | | Contracts Long | | | Month | | Value | | | Gain | |
| | |
| 5 Year U.S. Treasury Notes | | | 125 | | | December 2008 | | $ | 14,029,297 | | | $ | 46,805 | |
| |
| |
SWAP CONTRACTS — At September 30, 2008, the Fund had outstanding swap contracts with the following terms:
INTEREST RATE SWAP CONTRACTS
| | | | | | | | | | | | | | | | | | | |
| | | | | | | | | Rates Exchanged | | | |
| | | Notional
| | | | | | Payments
| | | Payments
| | | |
| | | Amount
| | | Termination
| | | received by
| | | made by
| | Unrealized
| |
| Swap Counterparty | | (000s) | | | Date | | | the Fund | | | the Fund | | Gain (Loss) | |
| | |
| JPMorgan Securities, Inc. | | BRL | 18,000 | | | | 01/04/10 | | | | 13.120 | % | | Brazilian Interbank
Deposit Average | | $ | (108,781 | ) |
| | | | 42,000 | | | | 01/04/10 | | | | 14.010 | | | Brazilian Interbank
Deposit Average | | | (39,729 | ) |
| | | | 49,000 | | | | 01/03/11 | | | | 14.940 | | | Brazil CETIP
Interbank Deposit Rate | | | 167,376 | |
| |
| |
TOTAL | | | | | | | | | | | | | | | | $ | 18,866 | |
| |
| |
The accompanying notes are an integral part of these financial statements.
GOLDMAN SACHS EMERGING MARKETS DEBT FUND
Schedule of Investments (continued)
September 30, 2008 (Unaudited)
| |
| ADDITIONAL INVESTMENT INFORMATION (continued) | |
TOTAL RETURN SWAP CONTRACTS
| | | | | | | | | | | | | | | | | |
| | | Notional
| | | | | | | | | | | |
| | | Amount
| | | Reference
| | Termination
| | | Financing
| | Unrealized
| |
| Swap Counterparty | | (000s) | | | Security | | Date | | | Fee | | Loss | |
| | |
| Deutsche Bank Securities, Inc. | | | TRY 4,800 | | | Turkish Government Bond
16.000% 03/07/12 | | | 03/12/09 | | | TRY Central
Deposit Bank
+0.300%# | | $ | (86,545 | ) |
| JPMorgan Securities, Inc. | | | 1,700 | | | Turkish Government Bond
0.000% 04/14/10 | | | 04/14/10 | | | 3 month LIBOR
+0.400% | | | (56,442 | ) |
| |
| |
TOTAL | | | | | | | | | | | | | | $ | (142,987 | ) |
| |
| |
| | |
| # | | The Fund receives semi-annual coupon payments in accordance with the swap contracts. On the termination date of the swap contracts, the Fund will either receive from or pay to the counterparty an amount equal to the net of the accrued financing fees and the value of the reference security subtracted from the original notional cost (notional multiplied by the price change of the reference security, converted to U.S. Dollars). |
The accompanying notes are an integral part of these financial statements.
GOLDMAN SACHS HIGH YIELD FUND
Schedule of Investments
September 30, 2008 (Unaudited)
| | | | | | | | | | | | | | | | | |
| | | Principal
| | Interest
| | Maturity
| | |
| | | Amount | | Rate | | Date | | Value |
| |
Corporate Bonds – 83.1% |
| | | | | | | | | | | | | | | | | |
| | | | | | | | | | | | | | | | | |
| | | Aerospace – 0.7% |
| | | Esterline Technologies Corp. (B+/B1) |
| | | $ | 2,020,000 | | | | 7.750 | % | | | 06/15/13 | | | $ | 2,009,900 | |
| | | Mecachrome International, Inc. (B/Caa2) |
| | | | EUR 3,500,000 | | | | 9.000 | | | | 05/15/14 | | | | 1,724,555 | |
| | | Moog, Inc. (BB-/Ba3) |
| | | $ | 210,000 | | | | 6.250 | | | | 01/15/15 | | | | 198,975 | |
| | | Sequa Corp. (B-/Caa2)(a) |
| | | | 10,000,000 | | | | 11.750 | | | | 12/01/15 | | | | 8,650,000 | |
| | | | 4,651,875 | | | | 13.500 | (b) | | | 12/01/15 | | | | 4,035,502 | |
| | | TransDigm, Inc. (B-/B3) |
| | | | 7,250,000 | | | | 7.750 | | | | 07/15/14 | | | | 6,815,000 | |
| | | Vought Aircraft Industries, Inc. (CCC/Caa1) |
| | | | 2,750,000 | | | | 8.000 | | | | 07/15/11 | | | | 2,440,625 | |
| | | | | | | | | | | | | | | | | |
| | | | | | | | | | | | | | | | 25,874,557 | |
| | | |
| | | |
| | | Agriculture – 0.6% |
| | | Land O’ Lakes, Inc. (BB/Ba2) |
| | | | 320,000 | | | | 8.750 | | | | 11/15/11 | | | | 317,200 | |
| | | Land O’ Lakes, Inc. (BBB-/Baa3) |
| | | | 3,150,000 | | | | 9.000 | | | | 12/15/10 | | | | 3,213,000 | |
| | | National Beef Packing Co. LLC/NB Finance Corp. (B-/Caa1) |
| | | | 2,750,000 | | | | 10.500 | | | | 08/01/11 | | | | 2,722,500 | |
| | | Pilgrim’s Pride Corp. (CCC/Caa1) |
| | | | 6,000,000 | | | | 7.625 | | | | 05/01/15 | | | | 3,780,000 | |
| | | Pilgrim’s Pride Corp. (CCC-/Caa1) |
| | | | 3,250,000 | | | | 8.375 | | | | 05/01/17 | | | | 1,462,500 | |
| | | Smithfield Foods, Inc. (BB-/Ba3) |
| | | | 2,000,000 | | | | 7.000 | | | | 08/01/11 | | | | 1,740,000 | |
| | | | 2,875,000 | | | | 7.750 | | | | 05/15/13 | | | | 2,386,250 | |
| | | | 5,000,000 | | | | 7.750 | | | | 07/01/17 | | | | 3,900,000 | |
| | | Tereos Europe (BB/B1) |
| | | | EUR 4,000,000 | | | | 6.375 | | | | 04/15/14 | | | | 3,463,189 | |
| | | | | | | | | | | | | | | | | |
| | | | | | | | | | | | | | | | 22,984,639 | |
| | | |
| | | |
| | | Automotive – 2.0% |
| | | FCE Bank PLC (B/B1) |
| | | | 2,000,000 | | | | 6.142 | (c) | | | 09/30/09 | | | | 2,336,949 | |
| | | | 11,250,000 | | | | 7.125 | | | | 01/16/12 | | | | 10,611,295 | |
| | | | 12,000,000 | | | | 7.125 | | | | 01/15/13 | | | | 11,825,523 | |
| | | Ford Motor Co. (CCC/Caa1) |
| | | $ | 9,000,000 | | | | 7.450 | | | | 07/16/31 | | | | 3,780,000 | |
| | | | 1,250,000 | | | | 8.900 | | | | 01/15/32 | | | | 600,000 | |
| | | Ford Motor Credit Co. LLC (B-/B1) |
| | | | 4,735,000 | | | | 7.875 | | | | 06/15/10 | | | | 3,515,737 | |
| | | | 2,500,000 | | | | 9.750 | | | | 09/15/10 | | | | 1,876,168 | |
| | | | 1,250,000 | | | | 7.375 | | | | 02/01/11 | | | | 827,111 | |
| | | | 11,250,000 | | | | 9.875 | | | | 08/10/11 | | | | 7,513,742 | |
| | | | 14,375,000 | | | | 7.250 | | | | 10/25/11 | | | | 9,120,795 | |
| | | | 7,000,000 | | | | 7.000 | | | | 10/01/13 | | | | 4,343,192 | |
| | | | 9,250,000 | | | | 8.000 | | | | 12/15/16 | | | | 5,907,027 | |
| | | General Motors Corp. (B-/Caa2) |
| | | | EUR 2,250,000 | | | | 7.250 | | | | 07/03/13 | | | | 1,425,398 | |
| | | $ | 2,000,000 | | | | 7.125 | | | | 07/15/13 | | | | 960,000 | |
| | | | 2,000,000 | | | | 7.700 | | | | 04/15/16 | | | | 860,000 | |
| | | | 1,750,000 | | | | 8.800 | (d) | | | 03/01/21 | | | | 717,500 | |
| | | | 2,750,000 | | | | 8.250 | | | | 07/15/23 | | | | 1,086,250 | |
| | | |
| | | |
| | | | EUR 2,000,000 | | | | 8.375 | | | | 07/05/33 | | | | 1,069,928 | |
| | | | 14,290,000 | | | | 8.375 | | | | 07/15/33 | | | | 5,787,450 | |
| | | | | | | | | | | | | | | | | |
| | | | | | | | | | | | | | | | 74,164,065 | |
| | | |
| | | |
| | | Automotive – Distributor – 0.1% |
| | | Keystone Automotive Operations, Inc. (CCC/Caa2) |
| | | | 4,000,000 | | | | 9.750 | | | | 11/01/13 | | | | 2,120,000 | |
| | | |
| | | |
| | | Automotive Parts – 1.2% |
| | | Accuride Corp. (CCC/Caa1) |
| | | | 3,000,000 | | | | 8.500 | | | | 02/01/15 | | | | 1,770,000 | |
| | | Allison Transmission, Inc. (B-/Caa1)(a) |
| | | | 4,500,000 | | | | 11.000 | | | | 11/01/15 | | | | 3,825,000 | |
| | | | 3,250,000 | | | | 11.250 | (b) | | | 11/01/15 | | | | 2,632,500 | |
| | | Lear Corp. Series B (B/B3) |
| | | | 5,750,000 | | | | 8.500 | | | | 12/01/13 | | | | 4,211,875 | |
| | | Tenneco, Inc. (B/B3) |
| | | | 3,250,000 | | | | 8.625 | | | | 11/15/14 | | | | 2,600,000 | |
| | | Tenneco, Inc. (BB-/B2) |
| | | | 2,000,000 | | | | 8.125 | | | | 11/15/15 | | | | 1,700,000 | |
| | | The Goodyear Tire & Rubber Co. (BB-/B2) |
| | | | 5,000,000 | | | | 7.857 | | | | 08/15/11 | | | | 4,912,500 | |
| | | The Goodyear Tire & Rubber Co. (BB-/Ba3) |
| | | | 1,950,000 | | | | 9.000 | | | | 07/01/15 | | | | 1,950,000 | |
| | | TRW Automotive, Inc. (BB/Ba3) |
| | | | EUR 7,000,000 | | | | 6.375 | | | | 03/15/14 | | | | 7,588,044 | |
| | | $ | 6,000,000 | | | | 7.000 | (a) | | | 03/15/14 | | | | 4,920,000 | |
| | | United Components, Inc. (CCC+/Caa1) |
| | | | 5,500,000 | | | | 9.375 | | | | 06/15/13 | | | | 4,565,000 | |
| | | Visteon Corp. (B-/Caa1)(a)(d) |
| | | | 2,069,000 | | | | 12.250 | | | | 12/31/16 | | | | 1,241,400 | |
| | | Visteon Corp. (B-/Caa2) |
| | | | 802,000 | | | | 8.250 | | | | 08/01/10 | | | | 665,660 | |
| | | | 2,000,000 | | | | 7.000 | | | | 03/10/14 | | | | 810,000 | |
| | | | | | | | | | | | | | | | | |
| | | | | | | | | | | | | | | | 43,391,979 | |
| | | |
| | | |
| | | Building Materials – 2.7% |
| | | ACIH, Inc. (D/Ca)(a)(e)(f) |
| | | | 6,000,000 | | | | 11.500 | | | | 12/15/12 | | | | 720,000 | |
| | | Associated Materials, Inc. (CCC/Caa2)(e) |
| | | | 13,500,000 | | | | 11.250 | | | | 03/01/14 | | | | 8,775,000 | |
| | | Associated Materials, Inc. (CCC+/B3) |
| | | | 1,250,000 | | | | 9.750 | | | | 04/15/12 | | | | 1,250,000 | |
| | | Calcipar SA (BB+/Ba2)(c) |
| | | | EUR 7,021,000 | | | | 6.147 | | | | 07/01/14 | | | | 6,918,916 | |
| | | CPG International, Inc. (B/B3) |
| | | $ | 3,500,000 | | | | 10.500 | | | | 07/01/13 | | | | 2,380,000 | |
| | | Grohe Holding GMBH (B/B2)(c) |
| | | | EUR 5,000,000 | | | | 7.838 | | | | 01/15/14 | | | | 5,631,201 | |
| | | Grohe Holding GMBH (CCC+/B3) |
| | | | 24,000,000 | | | | 8.625 | | | | 10/01/14 | | | | 24,664,662 | |
| | | Heating Finance PLC (CCC/Caa3) |
| | | | GBP 2,000,000 | | | | 7.875 | | | | 03/31/14 | | | | 995,596 | |
| | | Interface, Inc. (B-/B3) |
| | | $ | 2,000,000 | | | | 9.500 | | | | 02/01/14 | | | | 2,040,000 | |
| | | Legrand S.A. (BBB/Baa3) |
| | | | 5,050,000 | | | | 8.500 | | | | 02/15/25 | | | | 5,067,746 | |
| | | |
| | | |
The accompanying notes are an integral part of these financial statements.
GOLDMAN SACHS HIGH YIELD FUND
Schedule of Investments (continued)
September 30, 2008 (Unaudited)
| | | | | | | | | | | | | | | | | |
| | | Principal
| | Interest
| | Maturity
| | |
| | | Amount | | Rate | | Date | | Value |
| |
Corporate Bonds – (continued) |
| | | Building Materials – (continued) |
| | | | | | | | | | | | | | | | | |
| | | Masonite Corp. |
| | | $ | 7,000,000 | | | | 11.000 | % | | | 04/06/15 | | | $ | 1,960,000 | |
| | | Nortek, Inc. (B/B1)(a) |
| | | | 2,500,000 | | | | 10.000 | | | | 12/01/13 | | | | 2,225,000 | |
| | | Nortek, Inc. (CCC/Caa1) |
| | | | 24,500,000 | | | | 8.500 | | | | 09/01/14 | | | | 13,965,000 | |
| | | NTK Holdings, Inc. (CCC/Caa2)(e) |
| | | | 11,000,000 | | | | 10.750 | | | | 03/01/14 | | | | 4,785,000 | |
| | | Owens Corning, Inc. (BBB-/Ba1) |
| | | | 4,250,000 | | | | 6.500 | | | | 12/01/16 | | | | 3,655,942 | |
| | | | 1,750,000 | | | | 7.000 | | | | 12/01/36 | | | | 1,390,695 | |
| | | Panolam Industries International, Inc. (CCC+/Caa1) |
| | | | 6,500,000 | | | | 10.750 | | | | 10/01/13 | | | | 3,900,000 | |
| | | PLY Gem Industries, Inc. (CCC+/Caa2) |
| | | | 7,000,000 | | | | 9.000 | | | | 02/15/12 | | | | 3,850,000 | |
| | | Texas Industries, Inc. (BB-/Ba3) |
| | | | 4,125,000 | | | | 7.250 | | | | 07/15/13 | | | | 3,588,750 | |
| | | Texas Industries, Inc. (BB-/Ba3)(a) |
| | | | 2,500,000 | | | | 7.250 | | | | 07/15/13 | | | | 2,175,000 | |
| | | Werner Holdings Co., Inc. (D/WR)(f) |
| | | | 3,000,000 | | | | 10.000 | | | | 11/15/07 | | | | 300 | |
| | | | | | | | | | | | | | | | | |
| | | | | | | | | | | | | | | | 99,938,808 | |
| | | |
| | | |
| | | Capital Goods – 2.4% |
| | | Altra Industrial Motion, Inc. (B+/B1) |
| | | | 4,000,000 | | | | 9.000 | | | | 12/01/11 | | | | 4,120,000 | |
| | | Baldor Electric Co. (B/B3) |
| | | | 13,250,000 | | | | 8.625 | | | | 02/15/17 | | | | 12,587,500 | |
| | | Briggs & Stratton Corp. (BB-/Ba2) |
| | | | 2,500,000 | | | | 8.875 | | | | 03/15/11 | | | | 2,450,000 | |
| | | General Cable Corp. (B+/B1) |
| | | | 50,000 | | | | 7.125 | | | | 04/01/17 | | | | 44,750 | |
| | | Mueller Water Products, Inc. (B/B3) |
| | | | 6,500,000 | | | | 7.375 | | | | 06/01/17 | | | | 5,135,000 | |
| | | Nexans SA (BB+) |
| | | | EUR 8,000,000 | | | | 5.750 | | | | 05/02/17 | | | | 9,291,482 | |
| | | RBS Global & Rexnord Corp. (B-/B3) |
| | | $ | 20,150,000 | | | | 9.500 | | | | 08/01/14 | | | | 18,941,000 | |
| | | | 7,000,000 | | | | 8.875 | | | | 09/01/16 | | | | 6,562,500 | |
| | | RBS Global & Rexnord Corp. (CCC+/Caa1) |
| | | | 15,000,000 | | | | 11.750 | | | | 08/01/16 | | | | 14,250,000 | |
| | | Sensata Technologies (B-/Caa1) |
| | | | 9,750,000 | | | | 8.000 | | | | 05/01/14 | | | | 8,336,250 | |
| | | SPX Corp. (BB/Ba2)(a) |
| | | | 1,000,000 | | | | 7.625 | | | | 12/15/14 | | | | 992,500 | |
| | | Terex Corp. (B+/Ba3) |
| | | | 4,150,000 | | | | 8.000 | | | | 11/15/17 | | | | 3,797,250 | |
| | | VAC Finanzierung GMBH (B/B3) |
| | | | EUR 4,000,000 | | | | 9.250 | | | | 04/15/16 | | | | 3,829,217 | |
| | | | | | | | | | | | | | | | | |
| | | | | | | | | | | | | | | | 90,337,449 | |
| | | |
| | | |
| | | Chemicals – 3.9% |
| | | Basell AF SCA (CCC+/B3) |
| | | $ | 19,250,000 | | | | 8.375 | %(a) | | | 08/15/15 | | | | 9,625,000 | |
| | | | EUR 5,000,000 | | | | 8.375 | | | | 08/15/15 | | | | 3,167,551 | |
| | | Cognis GMBH (B/B1)(c) |
| | | | 12,500,000 | | | | 6.958 | | | | 09/15/13 | | | | 14,429,953 | |
| | | |
| | | |
| | | Cognis GMBH (CCC+/Caa1) |
| | | | EUR 8,000,000 | | | | 9.500 | | | | 05/15/14 | | | | 9,178,858 | |
| | | Compass Minerals International, Inc. (B+)(e) |
| | | | 4,661,000 | | | | 12.000 | | | | 06/01/13 | | | | 4,905,702 | |
| | | Equistar Chemicals LP (B/B3) |
| | | | 2,000,000 | | | | 7.550 | | | | 02/15/26 | | | | 1,220,000 | |
| | | Hexion U.S. Finance Corp./Hexion Nova Scotia Finance ULC (B/B3) |
| | | | 11,250,000 | | | | 9.750 | | | | 11/15/14 | | | | 8,662,500 | |
| | | Huntsman International LLC (B/B2) |
| | | | 3,000,000 | | | | 7.875 | | | | 11/15/14 | | | | 2,580,000 | |
| | | Ineos Group Holdings PLC (B-/B3) |
| | | | EUR 14,250,000 | | | | 7.875 | | | | 02/15/16 | | | | 10,582,259 | |
| | | $ | 11,000,000 | | | | 8.500 | (a) | | | 02/15/16 | | | | 5,885,000 | |
| | | Invista (BB/Ba3)(a) |
| | | | 6,325,000 | | | | 9.250 | | | | 05/01/12 | | | | 6,072,000 | |
| | | KRATON Polymers LLC/Capital Corp. (CCC-/Caa1) |
| | | | 7,975,000 | | | | 8.125 | | | | 01/15/14 | | | | 4,625,500 | |
| | | MacDermid, Inc. (CCC+/Caa1)(a) |
| | | | 7,750,000 | | | | 9.500 | | | | 04/15/17 | | | | 6,587,500 | |
| | | Momentive Performance Materials, Inc. (B/B3) |
| | | | EUR 3,750,000 | | | | 9.000 | | | | 12/01/14 | | | | 3,484,306 | |
| | | $ | 7,250,000 | | | | 9.750 | | | | 12/01/14 | | | | 5,763,750 | |
| | | | 4,000,000 | | | | 10.125 | (b) | | | 12/01/14 | | | | 3,240,000 | |
| | | Momentive Performance Materials, Inc. (CCC+/Caa2) |
| | | | 7,500,000 | | | | 11.500 | | | | 12/01/16 | | | | 5,175,000 | |
| | | Nalco Co. (B3) |
| | | | EUR 3,625,000 | | | | 9.000 | | | | 11/15/13 | | | | 4,822,596 | |
| | | Rhodia S.A. (BB/B1)(c) |
| | | | 7,250,000 | | | | 7.713 | | | | 10/15/13 | | | | 8,420,406 | |
| | | Rockwood Specialties Group, Inc. (BB-/B3) |
| | | | 14,750,000 | | | | 7.625 | | | | 11/15/14 | | | | 18,688,550 | |
| | | SPCM SA (BB-/B3) |
| | | | 2,875,000 | | | | 8.250 | | | | 06/15/13 | | | | 3,237,941 | |
| | | The Mosaic Co. (BBB-/Baa3)(a) |
| | | $ | 1,125,000 | | | | 7.375 | | | | 12/01/14 | | | | 1,167,188 | |
| | | | 3,385,000 | | | | 7.625 | | | | 12/01/16 | | | | 3,554,250 | |
| | | | | | | | | | | | | | | | | |
| | | | | | | | | | | | | | | | 145,075,810 | |
| | | |
| | | |
| | | Conglomerates – 1.2% |
| | | Blount, Inc. (B/B2) |
| | | | 6,750,000 | | | | 8.875 | | | | 08/01/12 | | | | 6,682,500 | |
| | | Bombardier, Inc. (BB+/Ba2)(a) |
| | | | 6,750,000 | | | | 6.750 | | | | 05/01/12 | | | | 6,581,250 | |
| | | | 3,000,000 | | | | 8.000 | | | | 11/15/14 | | | | 3,045,000 | |
| | | | EUR 2,000,000 | | | | 7.250 | | | | 11/15/16 | | | | 2,534,041 | |
| | | Park-Ohio Industries, Inc. (B-/B3) |
| | | $ | 5,000,000 | | | | 8.375 | | | | 11/15/14 | | | | 3,975,000 | |
| | | Polypore, Inc. (B-/B3) |
| | | | EUR 10,000,000 | | | | 8.750 | | | | 05/15/12 | | | | 12,670,203 | |
| | | | 4,250,000 | | | | 8.750 | | | | 05/15/12 | | | | 3,995,000 | |
| | | Trimas Corp. (B-/B3) |
| | | $ | 5,401,000 | | | | 9.875 | | | | 06/15/12 | | | | 4,671,865 | |
| | | | | | | | | | | | | | | | | |
| | | | | | | | | | | | | | | | 44,154,859 | |
| | | |
| | | |
The accompanying notes are an integral part of these financial statements.
GOLDMAN SACHS HIGH YIELD FUND
| | | | | | | | | | | | | | | | | |
| | | Principal
| | Interest
| | Maturity
| | |
| | | Amount | | Rate | | Date | | Value |
| |
Corporate Bonds – (continued) |
| | | Conglomerates – (continued) |
| | | | | | | | | | | | | | | | | |
| | | Consumer Products – Household & Leisure – 2.4% |
| | | Affinion Group, Inc. (B-/B2) |
| | | $ | 6,000,000 | | | | 10.125 | % | | | 10/15/13 | | | $ | 5,640,000 | |
| | | Affinion Group, Inc. (B-/B3) |
| | | | 4,125,000 | | | | 11.500 | | | | 10/15/15 | | | | 3,836,250 | |
| | | Ames True Temper (CCC-/Caa3) |
| | | | 3,750,000 | | | | 10.000 | | | | 07/15/12 | | | | 1,837,500 | |
| | | Easton-Bell Sports, Inc. (CCC+/Caa1) |
| | | | 4,750,000 | | | | 8.375 | | | | 10/01/12 | | | | 3,942,500 | |
| | | Elizabeth Arden, Inc. (B+/B1) |
| | | | 1,750,000 | | | | 7.750 | | | | 01/15/14 | | | | 1,579,375 | |
| | | Harry & David Holdings, Inc. (CCC+/B3) |
| | | | 3,110,000 | | | | 9.000 | | | | 03/01/13 | | | | 1,586,100 | |
| | | Jarden Corp. (B/B3) |
| | | | 9,000,000 | | | | 7.500 | | | | 05/01/17 | | | | 7,515,000 | |
| | | Safilo Capital International S.A. (B+/B2) |
| | | | EUR 7,150,000 | | | | 9.625 | | | | 05/15/13 | | | | 7,146,698 | |
| | | Sealy Mattress Co. (BB-/B2) |
| | | $ | 7,000,000 | | | | 8.250 | | | | 06/15/14 | | | | 5,530,000 | |
| | | Simmons Bedding Co. (B/B2) |
| | | | 3,500,000 | | | | 7.875 | | | | 01/15/14 | | | | 2,695,000 | |
| | | Simmons Bedding Co. (CCC+/B3)(e) |
| | | | 4,500,000 | | | | 10.000 | | | | 12/15/14 | | | | 2,525,625 | |
| | | Solo Cup Co. (CCC/Caa2) |
| | | | 7,000,000 | | | | 8.500 | | | | 02/15/14 | | | | 5,600,000 | |
| | | Spectrum Brands, Inc. (CCC-/Caa3) |
| | | | 5,000,000 | | | | 12.000 | (b) | | | 10/02/13 | | | | 3,250,000 | |
| | | | 12,250,000 | | | | 7.375 | | | | 02/01/15 | | | | 5,818,750 | |
| | | Visant Corp. (B+/B1) |
| | | | 7,375,000 | | | | 7.625 | | | | 10/01/12 | | | | 6,932,500 | |
| | | Visant Holding Corp. (B-/B3) |
| | | | 15,750,000 | | | | 8.750 | | | | 12/01/13 | | | | 14,490,000 | |
| | | | 10,000,000 | | | | 10.250 | (e) | | | 12/01/13 | | | | 9,000,000 | |
| | | | | | | | | | | | | | | | | |
| | | | | | | | | | | | | | | | 88,925,298 | |
| | | |
| | | |
| | | Consumer Products – Industrial – 0.6% |
| | | Johnsondiversey Holdings, Inc. (CCC+/Caa1)(e) |
| | | | 7,000,000 | | | | 10.670 | | | | 05/15/13 | | | | 6,930,000 | |
| | | Johnsondiversey, Inc. (B/B2) |
| | | | EUR 10,598,000 | | | | 9.625 | | | | 05/15/12 | | | | 14,323,073 | |
| | | $ | 2,895,000 | | | | 9.625 | | | | 05/15/12 | | | | 2,909,475 | |
| | | | | | | | | | | | | | | | | |
| | | | | | | | | | | | | | | | 24,162,548 | |
| | | |
| | | |
| | | Consumer Products – Non Durable – 1.5% |
| | | Belvedere SA (D/Caa2)(f) |
| | | | EUR 4,500,000 | | | | 0.000 | | | | 05/15/13 | | | | 2,850,796 | |
| | | Chattem, Inc. (B/B2) |
| | | $ | 2,655,000 | | | | 7.000 | | | | 03/01/14 | | | | 2,548,800 | |
| | | Church & Dwight Co., Inc. (BB/Ba2) |
| | | | 2,250,000 | | | | 6.000 | | | | 12/15/12 | | | | 2,143,125 | |
| | | Constellation Brands, Inc. (B/B2) |
| | | | 1,522,000 | | | | 8.125 | | | | 01/15/12 | | | | 1,499,170 | |
| | | Constellation Brands, Inc. (BB-/Ba3) |
| | | | 4,000,000 | | | | 7.250 | | | | 09/01/16 | | | | 3,700,000 | |
| | | | 9,000,000 | | | | 7.250 | | | | 05/15/17 | | | | 8,415,000 | |
| | | Prestige Brands, Inc. (B-/B3) |
| | | | 2,100,000 | | | | 9.250 | | | | 04/15/12 | | | | 2,089,500 | |
| | | |
| | | |
| | | Reddy Ice Holdings, Inc. (B-/Caa1)(e) |
| | | | 3,865,000 | | | | 10.500 | | | | 11/01/12 | | | | 3,053,350 | |
| | | Sally Holdings LLC (B-/B3) |
| | | | 12,750,000 | | | | 9.250 | | | | 11/15/14 | | | | 11,857,500 | |
| | | Sally Holdings LLC (CCC+/Caa1) |
| | | | 16,750,000 | | | | 10.500 | | | | 11/15/16 | | | | 15,954,375 | |
| | | Yankee Acquisition Corp. (B-/B3) |
| | | | 3,000,000 | | | | 8.500 | | | | 02/15/15 | | | | 2,160,000 | |
| | | Yankee Acquisition Corp. (CCC+/Caa1) |
| | | | 2,250,000 | | | | 9.750 | | | | 02/15/17 | | | | 1,282,500 | |
| | | | | | | | | | | | | | | | | |
| | | | | | | | | | | | | | | | 57,554,116 | |
| | | |
| | | |
| | | Defense – 1.1% |
| | | Alliant Techsystems, Inc. (BB-/B1) |
| | | | 6,250,000 | | | | 6.750 | | | | 04/01/16 | | | | 5,843,750 | |
| | | Communications & Power Industries, Inc. (B-/B3) |
| | | | 2,000,000 | | | | 8.000 | | | | 02/01/12 | | | | 1,915,000 | |
| | | DRS Technologies, Inc. (B/B3) |
| | | | 3,500,000 | | | | 6.875 | | | | 11/01/13 | | | | 3,465,000 | |
| | | | 3,750,000 | | | | 7.625 | | | | 02/01/18 | | | | 3,881,250 | |
| | | DRS Technologies, Inc. (BB-/B1) |
| | | | 2,000,000 | | | | 6.625 | | | | 02/01/16 | | | | 1,990,000 | |
| | | L-3 Communications Corp. (BB+/Ba3) |
| | | | 2,500,000 | | | | 6.125 | | | | 07/15/13 | | | | 2,318,750 | |
| | | | 5,500,000 | | | | 6.125 | | | | 01/15/14 | | | | 5,101,250 | |
| | | | 7,750,000 | | | | 5.875 | | | | 01/15/15 | | | | 7,013,750 | |
| | | | 10,000,000 | | | | 6.375 | | | | 10/15/15 | | | | 9,200,000 | |
| | | | | | | | | | | | | | | | | |
| | | | | | | | | | | | | | | | 40,728,750 | |
| | | |
| | | |
| | | Energy – Coal – 0.9% |
| | | Arch Western Finance LLC (BB/B1) |
| | | | 4,670,000 | | | | 6.750 | | | | 07/01/13 | | | | 4,389,800 | |
| | | Foundation PA Coal Co. (B/Ba3) |
| | | | 650,000 | | | | 7.250 | | | | 08/01/14 | | | | 624,000 | |
| | | Massey Energy Co. (BB-/B2) |
| | | | 6,750,000 | | | | 6.875 | | | | 12/15/13 | | | | 6,058,125 | |
| | | Massey Energy Co. (BB-) |
| | | | 2,000,000 | | | | 3.250 | | | | 08/01/15 | | | | 1,382,500 | |
| | | New World Resources BV (B/B3) |
| | | | EUR 5,000,000 | | | | 7.375 | | | | 05/15/15 | | | | 5,631,201 | |
| | | Peabody Energy Corp. (BB+/Ba1) |
| | | $ | 4,000,000 | | | | 6.875 | | | | 03/15/13 | | | | 3,860,000 | |
| | | | 1,000,000 | | | | 5.875 | | | | 04/15/16 | | | | 925,000 | |
| | | | 10,000,000 | | | | 7.375 | | | | 11/01/16 | | | | 9,600,000 | |
| | | | | | | | | | | | | | | | | |
| | | | | | | | | | | | | | | | 32,470,626 | |
| | | |
| | | |
| | | Energy – Exploration & Production – 3.1% |
| | | Chesapeake Energy Corp. (BB/Ba3) |
| | | | 8,500,000 | | | | 6.375 | | | | 06/15/15 | | | | 7,565,000 | |
| | | | 6,530,000 | | | | 6.625 | | | | 01/15/16 | | | | 5,925,975 | |
| | | | 11,875,000 | | | | 6.875 | | | | 01/15/16 | | | | 10,657,812 | |
| | | | EUR 3,250,000 | | | | 6.250 | | | | 01/15/17 | | | | 3,889,048 | |
| | | $ | 11,500,000 | | | | 6.500 | | | | 08/15/17 | | | | 10,120,000 | |
| | | | 2,500,000 | | | | 7.250 | | | | 12/15/18 | | | | 2,306,250 | |
| | | Cimarex Energy Co. (BB/Ba3) |
| | | | 5,000,000 | | | | 7.125 | | | | 05/01/17 | | | | 4,700,000 | |
| | | |
| | | |
The accompanying notes are an integral part of these financial statements.
GOLDMAN SACHS HIGH YIELD FUND
Schedule of Investments (continued)
September 30, 2008 (Unaudited)
| | | | | | | | | | | | | | | | | |
| | | Principal
| | Interest
| | Maturity
| | |
| | | Amount | | Rate | | Date | | Value |
| |
Corporate Bonds – (continued) |
| | | Energy – Exploration & Production – (continued) |
| | | | | | | | | | | | | | | | | |
| | | Encore Acquisition Co. (B/B1) |
| | | $ | 9,000,000 | | | | 6.000 | % | | | 07/15/15 | | | $ | 7,245,000 | |
| | | | 3,000,000 | | | | 7.250 | | | | 12/01/17 | | | | 2,535,000 | |
| | | EXCO Resources, Inc. (B-/Caa1) |
| | | | 3,000,000 | | | | 7.250 | | | | 01/15/11 | | | | 2,850,000 | |
| | | KCS Energy, Inc. (B/B3) |
| | | | 2,375,000 | | | | 7.125 | | | | 04/01/12 | | | | 2,113,750 | |
| | | Newfield Exploration Co. (BB-/Ba3) |
| | | | 3,000,000 | | | | 6.625 | | | | 09/01/14 | | | | 2,730,000 | |
| | | | 8,625,000 | | | | 6.625 | | | | 04/15/16 | | | | 7,740,938 | |
| | | | 3,500,000 | | | | 7.125 | | | | 05/15/18 | | | | 3,010,000 | |
| | | OPTI Canada, Inc. (BB+/B1) |
| | | | 8,000,000 | | | | 7.875 | | | | 12/15/14 | | | | 7,260,000 | |
| | | Plains Exploration & Production Co. (BB/B1) |
| | | | 7,000,000 | | | | 7.750 | | | | 06/15/15 | | | | 6,440,000 | |
| | | | 4,000,000 | | | | 7.000 | | | | 03/15/17 | | | | 3,480,000 | |
| | | | 2,500,000 | | | | 7.625 | | | | 06/01/18 | | | | 2,212,500 | |
| | | Quicksilver Resources, Inc. (B/B1) |
| | | | 1,750,000 | | | | 8.250 | | | | 08/01/15 | | | | 1,627,500 | |
| | | Quicksilver Resources, Inc. (B/B2) |
| | | | 7,000,000 | | | | 7.125 | | | | 04/01/16 | | | | 5,845,000 | |
| | | Range Resources Corp. (BB/Ba3) |
| | | | 3,750,000 | | | | 6.375 | | | | 03/15/15 | | | | 3,431,250 | |
| | | SandRidge Energy Inc. (B-/B3)(a) |
| | | | 2,500,000 | | | | 8.000 | | | | 06/01/18 | | | | 2,162,500 | |
| | | Southwestern Energy Co. (BB+/Ba2)(a) |
| | | | 3,000,000 | | | | 7.500 | | | | 02/01/18 | | | | 2,940,000 | |
| | | Whiting Petroleum Corp. (BB-/B1) |
| | | | 4,000,000 | | | | 7.250 | | | | 05/01/13 | | | | 3,680,000 | |
| | | | 2,500,000 | | | | 7.000 | | | | 02/01/14 | | | | 2,175,000 | |
| | | | | | | | | | | | | | | | | |
| | | | | | | | | | | | | | | | 114,642,523 | |
| | | |
| | | |
| | | Energy – Refining(a) – 0.2% |
| | | Petroplus Finance Ltd. (BB-/B1) |
| | | | 2,500,000 | | | | 6.750 | | | | 05/01/14 | | | | 2,200,000 | |
| | | | 6,500,000 | | | | 7.000 | | | | 05/01/17 | | | | 5,362,500 | |
| | | | | | | | | | | | | | | | | |
| | | | | | | | | | | | | | | | 7,562,500 | |
| | | |
| | | |
| | | Energy – Services – 0.4% |
| | | Compagnie Generale de Geophysique-Veritas (BB/Ba3) |
| | | | 3,500,000 | | | | 7.500 | | | | 05/15/15 | | | | 3,425,625 | |
| | | Helix Energy Solutions Group, Inc. (BB-/B3)(a) |
| | | �� | 4,500,000 | | | | 9.500 | | | | 01/15/16 | | | | 4,275,000 | |
| | | Key Energy Services, Inc. (BB-/B1)(a) |
| | | | 5,000,000 | | | | 8.375 | | | | 12/01/14 | | | | 4,825,000 | |
| | | Seitel, Inc. (B-/B3) |
| | | | 2,500,000 | | | | 9.750 | | | | 02/15/14 | | | | 2,037,500 | |
| | | | | | | | | | | | | | | | | |
| | | | | | | | | | | | | | | | 14,563,125 | |
| | | |
| | | |
| | | Entertainment & Leisure – 0.6% |
| | | AMC Entertainment, Inc. (B-/Ba3) |
| | | | 1,000,000 | | | | 8.625 | | | | 08/15/12 | | | | 990,000 | |
| | | AMC Entertainment, Inc. (CCC+/B2) |
| | | | 3,250,000 | | | | 11.000 | | | | 02/01/16 | | | | 3,217,500 | |
| | | HRP Myrtle Beach Operations LLC (WR)(a)(f) |
| | | | 1,750,000 | | | | 0.000 | | | | 04/01/12 | | | | 1,365,000 | |
| | | |
| | | |
| | | Universal City Development Partners (B+/B1) |
| | | | 7,750,000 | | | | 11.750 | | | | 04/01/10 | | | | 7,808,125 | |
| | | Universal City Florida Holding Co. (B-/B3) |
| | | | 1,125,000 | | | | 8.375 | | | | 05/01/10 | | | | 1,125,000 | |
| | | WMG Acquisition Corp. (B/B3) |
| | | | 5,750,000 | | | | 7.375 | | | | 04/15/14 | | | | 4,269,375 | |
| | | WMG Holdings Corp. (B/B3)(e) |
| | | | 4,550,000 | | | | 9.500 | | | | 12/15/14 | | | | 2,502,500 | |
| | | | | | | | | | | | | | | | | |
| | | | | | | | | | | | | | | | 21,277,500 | |
| | | |
| | | |
| | | Environmental – 1.1% |
| | | Allied Waste North America, Inc. (BB/B1) |
| | | | 3,875,000 | | | | 6.375 | | | | 04/15/11 | | | | 3,758,750 | |
| | | | 5,285,000 | | | | 7.875 | | | | 04/15/13 | | | | 5,285,000 | |
| | | | 3,750,000 | | | | 6.125 | | | | 02/15/14 | | | | 3,431,250 | |
| | | | 9,000,000 | | | | 7.250 | | | | 03/15/15 | | | | 8,595,000 | |
| | | Allied Waste North America, Inc. Series B (BB/B1) |
| | | | 5,055,000 | | | | 7.125 | | | | 05/15/16 | | | | 4,739,062 | |
| | | | 4,500,000 | | | | 6.875 | | | | 06/01/17 | | | | 4,331,250 | |
| | | Waste Services (B-/Caa1) |
| | | | 7,250,000 | | | | 9.500 | | | | 04/15/14 | | | | 7,068,750 | |
| | | WCA Waste Corp. (B-/B3) |
| | | | 2,500,000 | | | | 9.250 | | | | 06/15/14 | | | | 2,400,000 | |
| | | | | | | | | | | | | | | | | |
| | | | | | | | | | | | | | | | 39,609,062 | |
| | | |
| | | |
| | | Finance – 1.2% |
| | | ETrade Financial Corp. (B/Ba3) |
| | | | 6,250,000 | | | | 7.375 | | | | 09/15/13 | | | | 4,875,000 | |
| | | General Motors Acceptance Corp. (B-/B3) |
| | | | EUR 2,750,000 | | | | 4.750 | | | | 09/14/09 | | | | 2,477,728 | |
| | | $ | 3,000,000 | | | | 7.250 | | | | 03/02/11 | | | | 1,485,869 | |
| | | | 15,750,000 | | | | 6.875 | | | | 09/15/11 | | | | 7,087,500 | |
| | | | 6,000,000 | | | | 6.750 | | | | 12/01/14 | | | | 2,369,843 | |
| | | | 13,785,000 | | | | 8.000 | | | | 11/01/31 | | | | 5,376,150 | |
| | | GMAC Canada Ltd. (B-/B3) |
| | | | CAD 1,000,000 | | | | 4.721 | (c) | | | 05/22/09 | | | | 834,278 | |
| | | | GBP 500,000 | | | | 6.625 | | | | 12/17/10 | | | | 515,577 | |
| | | | EUR 4,000,000 | | | | 6.000 | | | | 05/23/12 | | | | 2,984,537 | |
| | | GMAC International Finance BV (B-/B3) |
| | | | 1,750,000 | | | | 6.164 | (c) | | | 05/22/09 | | | | 1,823,101 | |
| | | | 2,750,000 | | | | 5.750 | | | | 05/21/10 | | | | 2,516,443 | |
| | | GMAC LLC (B-/B3) |
| | | | 4,000,000 | | | | 5.750 | | | | 09/27/10 | | | | 2,534,041 | |
| | | | 2,500,000 | | | | 5.375 | | | | 06/06/11 | | | | 1,478,190 | |
| | | NCO Group, Inc. (B-/Caa1) |
| | | $ | 7,250,000 | | | | 11.875 | | | | 11/15/14 | | | | 5,963,125 | |
| | | Nuveen Investments, Inc. (B-/B3)(a) |
| | | | 2,500,000 | | | | 10.500 | | | | 11/15/15 | | | | 1,925,000 | |
| | | | | | | | | | | | | | | | | |
| | | | | | | | | | | | | | | | 44,246,382 | |
| | | |
| | | |
| | | Finance Insurance(a) – 0.1% |
| | | HUB International Holdings, Inc. (CCC+/B3) |
| | | | 6,500,000 | | | | 9.000 | | | | 12/15/14 | | | | 5,720,000 | |
| | | |
| | | |
The accompanying notes are an integral part of these financial statements.
GOLDMAN SACHS HIGH YIELD FUND
| | | | | | | | | | | | | | | | | |
| | | Principal
| | Interest
| | Maturity
| | |
| | | Amount | | Rate | | Date | | Value |
| |
Corporate Bonds – (continued) |
| | | Finance Insurance(a) – (continued) |
| | | | | | | | | | | | | | | | | |
| | | Food – 1.4% |
| | | Dean Foods Co. (B/B3) |
| | | $ | 9,000,000 | | | | 7.000 | % | | | 06/01/16 | | | $ | 7,920,000 | |
| | | Dole Food Co. (B-/Caa1) |
| | | | 5,013,000 | | | | 8.625 | | | | 05/01/09 | | | | 4,781,149 | |
| | | | 4,000,000 | | | | 7.250 | | | | 06/15/10 | | | | 3,570,000 | |
| | | | 3,250,000 | | | | 8.875 | | | | 03/15/11 | | | | 2,746,250 | |
| | | Foodcorp Ltd. (B/B2) |
| | | | EUR 7,500,000 | | | | 8.875 | | | | 06/15/12 | | | | 6,651,856 | |
| | | Michael Foods, Inc. (B-/B3) |
| | | $ | 4,750,000 | | | | 8.000 | | | | 11/15/13 | | | | 4,583,750 | |
| | | Pinnacle Foods Finance LLC (CCC/Caa2) |
| | | | 17,750,000 | | | | 9.250 | | | | 04/01/15 | | | | 14,732,500 | |
| | | | 11,500,000 | | | | 10.625 | | | | 04/01/17 | | | | 8,855,000 | |
| | | | | | | | | | | | | | | | | |
| | | | | | | | | | | | | | | | 53,840,505 | |
| | | |
| | | |
| | | Gaming – 4.9% |
| | | Boyd Gaming Corp. (BB/B1) |
| | | | 3,000,000 | | | | 6.750 | | | | 04/15/14 | | | | 2,182,500 | |
| | | | 1,000,000 | | | | 7.125 | | | | 02/01/16 | | | | 695,000 | |
| | | Buffalo Thunder Development Authority (B/B2)(a) |
| | | | 2,500,000 | | | | 9.375 | | | | 12/15/14 | | | | 1,050,000 | |
| | | CCM Merger, Inc. (B-/Caa1)(a) |
| | | | 4,500,000 | | | | 8.000 | | | | 08/01/13 | | | | 3,465,000 | |
| | | Chukchansi Economic Development Authority (B+/B2)(a) |
| | | | 4,000,000 | | | | 8.000 | | | | 11/15/13 | | | | 3,080,000 | |
| | | Circus & Eldorado (B/B2) |
| | | | 3,500,000 | | | | 10.125 | | | | 03/01/12 | | | | 3,150,000 | |
| | | Cirsa Capital Luxembourg SA (B+/B3) |
| | | | EUR 1,750,000 | | | | 7.875 | | | | 07/15/12 | | | | 1,675,283 | |
| | | Cirsa Finance Luxembourg SA (B+/B2) |
| | | | 5,750,000 | | | | 8.750 | | | | 05/15/14 | | | | 5,018,808 | |
| | | Codere Finance Luxembourg SA (BB-/B2) |
| | | | 17,250,000 | | | | 8.250 | | | | 06/15/15 | | | | 17,970,571 | |
| | | Galaxy Entertainment Finance Co. Ltd. (B+/B1)(a) |
| | | $ | 1,500,000 | | | | 9.875 | | | | 12/15/12 | | | | 1,012,500 | |
| | | Harrah’s Operating Co., Inc. (B+/Caa1)(a) |
| | | | 10,000,000 | | | | 10.750 | | | | 02/01/16 | | | | 5,200,000 | |
| | | Harrah’s Operating Co., Inc. (B-/Caa2) |
| | | | 8,375,000 | | | | 5.625 | | | | 06/01/15 | | | | 2,345,000 | |
| | | | 8,000,000 | | | | 6.500 | | | | 06/01/16 | | | | 2,100,000 | |
| | | Herbst Gaming, Inc. (D/C)(f) |
| | | | 2,000,000 | | | | 8.125 | | | | 06/01/12 | | | | 80,000 | |
| | | Isle of Capri Casinos, Inc. (B-/B3) |
| | | | 3,250,000 | | | | 7.000 | | | | 03/01/14 | | | | 2,201,875 | |
| | | Mandalay Resort Group (B+/B1) |
| | | | 2,000,000 | | | | 9.375 | | | | 02/15/10 | | | | 1,800,000 | |
| | | Mashantucket Pequot Tribe (BB+/Ba2)(a) |
| | | | 4,000,000 | | | | 8.500 | | | | 11/15/15 | | | | 2,680,000 | |
| | | MGM Mirage, Inc. (B+/B1) |
| | | | 5,125,000 | | | | 8.375 | | | | 02/01/11 | | | | 4,176,875 | |
| | | |
| | | |
| | | MGM Mirage, Inc. (BB/Ba2) |
| | | | 2,000,000 | | | | 8.500 | | | | 09/15/10 | | | | 1,880,000 | |
| | | | 1,500,000 | | | | 6.750 | | | | 09/01/12 | | | | 1,200,000 | |
| | | | 9,875,000 | | | | 6.750 | | | | 04/01/13 | | | | 7,801,250 | |
| | | | 3,500,000 | | | | 5.875 | | | | 02/27/14 | | | | 2,485,000 | |
| | | | 21,000,000 | | | | 6.625 | | | | 07/15/15 | | | | 14,700,000 | |
| | | | 12,000,000 | | | | 7.500 | | | | 06/01/16 | | | | 8,520,000 | |
| | | | 3,000,000 | | | | 7.625 | | | | 01/15/17 | | | | 2,160,000 | |
| | | Mirage Resorts, Inc. (BB/Ba2) |
| | | | 3,125,000 | | | | 7.250 | | | | 08/01/17 | | | | 2,187,500 | |
| | | Mohegan Tribal Gaming Authority (B/Ba3) |
| | | | 3,000,000 | | | | 8.000 | | | | 04/01/12 | | | | 2,550,000 | |
| | | | 1,555,000 | | | | 7.125 | | | | 08/15/14 | | | | 1,104,050 | |
| | | Mohegan Tribal Gaming Authority (B+/Ba1) |
| | | | 250,000 | | | | 6.125 | | | | 02/15/13 | | | | 207,500 | |
| | | MTR Gaming Group, Inc. (B/B2) |
| | | | 3,000,000 | | | | 9.750 | | | | 04/01/10 | | | | 2,820,000 | |
| | | Park Place Entertainment Corp. (B-/Caa2) |
| | | | 5,000,000 | | | | 7.875 | | | | 03/15/10 | | | | 3,900,000 | |
| | | | 2,500,000 | | | | 8.125 | | | | 05/15/11 | | | | 1,500,000 | |
| | | Peermont Proprietary Global Ltd. (B/B3) |
| | | | EUR 14,500,000 | | | | 7.750 | | | | 04/30/14 | | | | 13,064,387 | |
| | | Penn National Gaming, Inc. (BB-/B1) |
| | | $ | 4,000,000 | | | | 6.750 | | | | 03/01/15 | | | | 3,520,000 | |
| | | Pinnacle Entertainment, Inc. (B+/B3) |
| | | | 4,750,000 | | | | 8.250 | | | | 03/15/12 | | | | 4,560,000 | |
| | | | 1,500,000 | | | | 8.750 | | | | 10/01/13 | | | | 1,440,000 | |
| | | | 6,430,000 | | | | 7.500 | | | | 06/15/15 | | | | 4,758,200 | |
| | | Pokagon Gaming Authority (B+/B2)(a) |
| | | | 1,865,000 | | | | 10.375 | | | | 06/15/14 | | | | 1,930,275 | |
| | | River Rock Entertainment (B+/B2) |
| | | | 2,000,000 | | | | 9.750 | | | | 11/01/11 | | | | 1,840,000 | |
| | | San Pasqual Casino (BB-/B2)(a) |
| | | | 2,375,000 | | | | 8.000 | | | | 09/15/13 | | | | 2,066,250 | |
| | | Seneca Gaming Corp. (BB/Ba2) |
| | | | 2,300,000 | | | | 7.250 | | | | 05/01/12 | | | | 1,942,500 | |
| | | Shingle Springs Tribal Gaming Authority (B/B3)(a) |
| | | | 8,250,000 | | | | 9.375 | | | | 06/15/15 | | | | 5,940,000 | |
| | | Snoqualmie Entertainment Authority (B/B3)(a) |
| | | | 5,000,000 | | | | 9.125 | | | | 02/01/15 | | | | 3,550,000 | |
| | | Station Casinos, Inc. (B-/B3) |
| | | | 2,500,000 | | | | 6.000 | | | | 04/01/12 | | | | 1,443,750 | |
| | | | 2,000,000 | | | | 7.750 | | | | 08/15/16 | | | | 1,110,000 | |
| | | Station Casinos, Inc. (CCC/Caa2) |
| | | | 11,625,000 | | | | 6.500 | | | | 02/01/14 | | | | 3,429,375 | |
| | | | 16,000,000 | | | | 6.875 | | | | 03/01/16 | | | | 4,560,000 | |
| | | Tropicana Entertainment LLC (WR)(f) |
| | | | 4,000,000 | | | | 9.625 | | | | 12/15/14 | | | | 640,000 | |
| | | Turning Stone Casino Resort Enterprise (B+/B1)(a) |
| | | | 2,950,000 | | | | 9.125 | | | | 09/15/14 | | | | 2,655,000 | |
| | | Wynn Las Vegas LLC (BBB-/Ba2) |
| | | | 16,000,000 | | | | 6.625 | | | | 12/01/14 | | | | 13,640,000 | |
| | | | | | | | | | | | | | | | | |
| | | | | | | | | | | | | | | | 184,988,449 | |
| | | |
| | | |
The accompanying notes are an integral part of these financial statements.
GOLDMAN SACHS HIGH YIELD FUND
Schedule of Investments (continued)
September 30, 2008 (Unaudited)
| | | | | | | | | | | | | | | | | |
| | | Principal
| | Interest
| | Maturity
| | |
| | | Amount | | Rate | | Date | | Value |
| |
Corporate Bonds – (continued) |
| | | Gaming – (continued) |
| | | | | | | | | | | | | | | | | |
| | | Health Care – Medical Products – 2.4% |
| | | Accellent, Inc. (CCC+/Caa3) |
| | | $ | 8,000,000 | | | | 10.500 | % | | | 12/01/13 | | | $ | 7,040,000 | |
| | | Advanced Medical Optics, Inc. (B-/B2) |
| | | | 7,280,000 | | | | 7.500 | | | | 05/01/17 | | | | 6,333,600 | |
| | | Bausch & Lomb, Inc. (B/Caa1)(a) |
| | | | 15,250,000 | | | | 9.875 | | | | 11/01/15 | | | | 14,640,000 | |
| | | DJO Finance LLC/DJO Finance Corp. (B-/Caa1) |
| | | | 11,000,000 | | | | 10.875 | | | | 11/15/14 | | | | 10,587,500 | |
| | | Fisher Scientific International, Inc. (BBB/Baa3) |
| | | | 2,250,000 | | | | 6.125 | | | | 07/01/15 | | | | 2,165,446 | |
| | | Fresenius (BB+/Ba2) |
| | | | 6,625,000 | | | | 6.875 | | | | 07/15/17 | | | | 6,325,420 | |
| | | PTS Acquisition Corp. (B/Caa1) |
| | | | 21,500,000 | | | | 9.500 | | | | 04/15/15 | | | | 16,877,500 | |
| | | PTS Acquisition Corp. (B-/Caa1) |
| | | | EUR 10,000,000 | | | | 9.750 | | | | 04/15/17 | | | | 7,883,682 | |
| | | The Cooper Companies, Inc. (BB-/Ba3) |
| | | $ | 2,000,000 | | | | 7.125 | | | | 02/15/15 | | | | 1,955,000 | |
| | | VWR Funding, Inc. (B-/Caa1)(b) |
| | | | 19,500,000 | | | | 10.250 | | | | 07/15/15 | | | | 17,647,500 | |
| | | | | | | | | | | | | | | | | |
| | | | | | | | | | | | | | | | 91,455,648 | |
| | | |
| | | |
| | | Health Care – Pharmaceutical – 0.4% |
| | | Angiotech Pharmaceuticals, Inc. (C/C) |
| | | | 4,375,000 | | | | 7.750 | | | | 04/01/14 | | | | 2,646,875 | |
| | | Elan Finance PLC/Elan Finance Corp. (B/B3) |
| | | | 5,000,000 | | | | 7.750 | | | | 11/15/11 | | | | 4,618,750 | |
| | | | 1,500,000 | | | | 8.875 | | | | 12/01/13 | | | | 1,290,000 | |
| | | Warner Chilcott Corp. (B-/B3) |
| | | | 5,731,000 | | | | 8.750 | | | | 02/01/15 | | | | 5,702,345 | |
| | | | | | | | | | | | | | | | | |
| | | | | | | | | | | | | | | | 14,257,970 | |
| | | |
| | | |
| | | Health Care – Services – 4.2% |
| | | Alliance Imaging, Inc. (B-/B3) |
| | | | 4,000,000 | | | | 7.250 | | | | 12/15/12 | | | | 3,680,000 | |
| | | Community Health Systems, Inc. (B/B3) |
| | | | 17,125,000 | | | | 8.875 | | | | 07/15/15 | | | | 16,354,375 | |
| | | CRC Health Corp. (CCC+/Caa1) |
| | | | 3,250,000 | | | | 10.750 | | | | 02/01/16 | | | | 2,470,000 | |
| | | DaVita, Inc. (B/B2) |
| | | | 5,500,000 | | | | 7.250 | | | | 03/15/15 | | | | 5,238,750 | |
| | | DaVita, Inc. (B+/B1) |
| | | | 2,250,000 | | | | 6.625 | | | | 03/15/13 | | | | 2,120,625 | |
| | | HCA, Inc. (B-/Caa1) |
| | | | GBP 1,502,000 | | | | 8.750 | | | | 11/01/10 | | | | 2,616,925 | |
| | | $ | 3,250,000 | | | | 6.300 | | | | 10/01/12 | | | | 2,827,500 | |
| | | | 14,000,000 | | | | 6.250 | | | | 02/15/13 | | | | 11,620,000 | |
| | | | 5,920,000 | | | | 6.750 | | | | 07/15/13 | | | | 4,972,800 | |
| | | | 8,750,000 | | | | 6.375 | | | | 01/15/15 | | | | 6,956,250 | |
| | | | 4,000,000 | | | | 6.500 | | | | 02/15/16 | | | | 3,180,000 | |
| | | HCA, Inc. (BB-/B2) |
| | | | 10,000,000 | | | | 9.125 | | | | 11/15/14 | | | | 9,787,500 | |
| | | | 13,750,000 | | | | 9.250 | | | | 11/15/16 | | | | 13,406,250 | |
| | | | 13,750,000 | | | | 9.625 | (b) | | | 11/15/16 | | | | 13,028,125 | |
| | | Psychiatric Solutions, Inc. (B-/B3) |
| | | | 2,220,000 | | | | 7.750 | | | | 07/15/15 | | | | 2,086,800 | |
| | | |
| | | |
| | | Select Medical Corp. (CCC+/B3) |
| | | | 7,000,000 | | | | 7.625 | | | | 02/01/15 | | | | 5,661,250 | |
| | | Senior Housing Properties Trust (BBB-/Ba1) |
| | | | 1,950,000 | | | | 7.875 | | | | 04/15/15 | | | | 1,945,125 | |
| | | Tenet Healthcare Corp. (B/Caa1) |
| | | | 3,000,000 | | | | 6.375 | | | | 12/01/11 | | | | 2,767,500 | |
| | | | 4,000,000 | | | | 6.500 | | | | 06/01/12 | | | | 3,660,000 | |
| | | | 12,000,000 | | | | 7.375 | | | | 02/01/13 | | | | 10,920,000 | |
| | | | 4,000,000 | | | | 9.875 | | | | 07/01/14 | | | | 3,900,000 | |
| | | | 2,000,000 | | | | 9.250 | | | | 02/01/15 | | | | 1,890,000 | |
| | | U.S. Oncology, Inc. (B-/B2) |
| | | | 5,000,000 | | | | 9.000 | | | | 08/15/12 | | | | 4,975,000 | |
| | | U.S. Oncology, Inc. (CCC+/B3) |
| | | | 1,875,000 | | | | 10.750 | | | | 08/15/14 | | | | 1,884,375 | |
| | | United Surgical Partners International, Inc. (CCC+/Caa1) |
| | | | 5,000,000 | | | | 8.875 | | | | 05/01/17 | | | | 4,200,000 | |
| | | Vanguard Health Holding Co. I (CCC+/Caa1)(e) |
| | | | 3,500,000 | | | | 11.250 | | | | 10/01/15 | | | | 3,045,000 | |
| | | Vanguard Health Holding Co. II (CCC+/Caa1) |
| | | | 8,625,000 | | | | 9.000 | | | | 10/01/14 | | | | 8,323,125 | |
| | | Ventas Realty LP (BBB-/Ba1) |
| | | | 2,000,000 | | | | 9.000 | | | | 05/01/12 | | | | 2,085,000 | |
| | | | | | | | | | | | | | | | | |
| | | | | | | | | | | | | | | | 155,602,275 | |
| | | |
| | | |
| | | Home Construction – 0.4% |
| | | D. R. Horton, Inc. (BB/Ba2) |
| | | | 2,000,000 | | | | 5.375 | | | | 06/15/12 | | | | 1,620,000 | |
| | | | 2,000,000 | | | | 5.250 | | | | 02/15/15 | | | | 1,520,000 | |
| | | K. Hovnanian Enterprises, Inc. (B+/Ba3)(a) |
| | | | 1,750,000 | | | | 11.500 | | | | 05/01/13 | | | | 1,706,250 | |
| | | K. Hovnanian Enterprises, Inc. (CCC+/Caa1) |
| | | | 1,000,000 | | | | 6.250 | | | | 01/15/15 | | | | 582,500 | |
| | | | 3,450,000 | | | | 7.500 | | | | 05/15/16 | | | | 1,983,750 | |
| | | | 4,000,000 | | | | 8.625 | | | | 01/15/17 | | | | 2,340,000 | |
| | | Kimball Hill, Inc. (WR)(f) |
| | | | 2,250,000 | | | | 10.500 | | | | 12/15/12 | | | | 45,000 | |
| | | Meritage Homes Corp. (BB-/B1) |
| | | | 5,250,000 | | | | 6.250 | | | | 03/15/15 | | | | 3,911,250 | |
| | | | | | | | | | | | | | | | | |
| | | | | | | | | | | | | | | | 13,708,750 | |
| | | |
| | | |
| | | Lodging – 0.6% |
| | | Gaylord Entertainment Co. (B+/Caa1) |
| | | | 4,825,000 | | | | 8.000 | | | | 11/15/13 | | | | 4,197,750 | |
| | | Host Hotels & Resorts LP (BB/Ba1) |
| | | | 4,000,000 | | | | 6.750 | | | | 06/01/16 | | | | 3,300,000 | |
| | | Host Hotels & Resorts LP (BB) |
| | | | 4,000,000 | | | | 6.875 | | | | 06/01/16 | | | | 3,440,000 | |
| | | Host Marriott LP (BB/Ba1) |
| | | | 8,250,000 | | | | 7.125 | | | | 11/01/13 | | | | 7,301,250 | |
| | | | 5,500,000 | | | | 6.375 | | | | 03/15/15 | | | | 4,482,500 | |
| | | | | | | | | | | | | | | | | |
| | | | | | | | | | | | | | | | 22,721,500 | |
| | | |
| | | |
| | | Machinery – 0.3% |
| | | Case New Holland, Inc. (BBB-/Ba3) |
| | | | 3,000,000 | | | | 7.125 | | | | 03/01/14 | | | | 2,812,500 | |
| | | | 953,000 | | | | 7.250 | | | | 01/15/16 | | | | 883,908 | |
| | | |
| | | |
The accompanying notes are an integral part of these financial statements.
GOLDMAN SACHS HIGH YIELD FUND
| | | | | | | | | | | | | | | | | |
| | | Principal
| | Interest
| | Maturity
| | |
| | | Amount | | Rate | | Date | | Value |
| |
Corporate Bonds – (continued) |
| | | Machinery – (continued) |
| | | | | | | | | | | | | | | | | |
| | | Douglas Dynamics LLC (B-/B3)(a) |
| | | $ | 1,750,000 | | | | 7.750 | % | | | 01/15/12 | | | $ | 1,435,000 | |
| | | Dresser-Rand Group, Inc. (BB-/B1) |
| | | | 6,098,000 | | | | 7.375 | | | | 11/01/14 | | | | 5,732,120 | |
| | | | | | | | | | | | | | | | | |
| | | | | | | | | | | | | | | | 10,863,528 | |
| | | |
| | | |
| | | Media – 1.7% |
| | | DIRECTV Holdings LLC (BB/Ba3) |
| | | | 4,500,000 | | | | 8.375 | | | | 03/15/13 | | | | 4,455,000 | |
| | | | 3,500,000 | | | | 6.375 | | | | 06/15/15 | | | | 3,071,250 | |
| | | | 22,750,000 | | | | 7.625 | (a) | | | 05/15/16 | | | | 21,043,750 | |
| | | EchoStar DBS Corp. (BB-/Ba3) |
| | | | 5,500,000 | | | | 6.375 | | | | 10/01/11 | | | | 5,060,000 | |
| | | | 8,000,000 | | | | 7.000 | | | | 10/01/13 | | | | 6,880,000 | |
| | | | 4,000,000 | | | | 6.625 | | | | 10/01/14 | | | | 3,200,000 | |
| | | | 6,250,000 | | | | 7.750 | | | | 05/31/15 | | | | 5,281,250 | |
| | | | 6,525,000 | | | | 7.125 | | | | 02/01/16 | | | | 5,236,312 | |
| | | Lamar Media Corp. (BB-/Ba3) |
| | | | 5,000,000 | | | | 7.250 | | | | 01/01/13 | | | | 4,500,000 | |
| | | | 5,250,000 | | | | 6.625 | | | | 08/15/15 | | | | 4,357,500 | |
| | | | | | | | | | | | | | | | | |
| | | | | | | | | | | | | | | | 63,085,062 | |
| | | |
| | | |
| | | Media – Broadcasting & Radio – 1.3% |
| | | Bonten Media Acquisition Co. (CCC+/Caa2)(a)(b) |
| | | | 3,500,000 | | | | 9.000 | | | | 06/01/15 | | | | 2,135,000 | |
| | | Clear Channel Communications, Inc. (CCC+/Caa1) |
| | | | 4,750,000 | | | | 6.250 | | | | 03/15/11 | | | | 3,040,000 | |
| | | | 6,000,000 | | | | 5.750 | | | | 01/15/13 | | | | 2,820,000 | |
| | | | 10,000,000 | | | | 5.500 | | | | 09/15/14 | | | | 3,050,000 | |
| | | | 5,750,000 | | | | 5.500 | | | | 12/15/16 | | | | 2,242,500 | |
| | | CMP Susquehanna Corp. (CCC/Caa1) |
| | | | 6,750,000 | | | | 9.875 | | | | 05/15/14 | | | | 3,780,000 | |
| | | Fox Acquisition Sub LLC (CCC+/Caa1)(a) |
| | | | 1,250,000 | | | | 13.375 | | | | 07/15/16 | | | | 1,187,500 | |
| | | Liberty Media LLC (BB+/Ba2) |
| | | | 3,500,000 | | | | 5.700 | | | | 05/15/13 | | | | 2,920,471 | |
| | | | 2,120,000 | | | | 8.250 | | | | 02/01/30 | | | | 1,496,505 | |
| | | LIN Television Corp. (B+/B1) |
| | | | 8,750,000 | | | | 6.500 | | | | 05/15/13 | | | | 6,825,000 | |
| | | Local TV Finance LLC (CCC+/Caa1)(a)(b) |
| | | | 5,000,000 | | | | 9.250 | | | | 06/15/15 | | | | 3,200,000 | |
| | | Radio One, Inc. (CCC+/Caa1) |
| | | | 2,250,000 | | | | 6.375 | | | | 02/15/13 | | | | 1,541,250 | |
| | | Univision Communications, Inc. (CCC/Caa1)(a)(b) |
| | | | 28,750,000 | | | | 9.750 | | | | 03/15/15 | | | | 13,225,000 | |
| | | | | | | | | | | | | | | | | |
| | | | | | | | | | | | | | | | 47,463,226 | |
| | | |
| | | |
| | | Media – Cable – 3.0% |
| | | Adelphia Communications Corp.(f) |
| | | | 2,000,000 | | | | 10.250 | | | | 06/15/49 | | | | 80,000 | |
| | | Atlantic Broadband Finance LLC (CCC+/Caa1) |
| | | | 3,250,000 | | | | 9.375 | | | | 01/15/14 | | | | 2,876,250 | |
| | | Cablevision Systems Corp. (B+/B2) |
| | | | 10,750,000 | | | | 8.000 | | | | 04/15/12 | | | | 10,105,000 | |
| | | CCH I Holdings LLC (CCC/Caa3) |
| | | | 13,585,000 | | | | 11.000 | | | | 10/01/15 | | | | 8,932,137 | |
| | | |
| | | |
| | | CCO Holdings LLC/CCO Holdings Capital Corp (CCC/Caa1) |
| | | | 10,250,000 | | | | 8.750 | | | | 11/15/13 | | | | 8,891,875 | |
| | | Charter Communications Holdings II (CCC/Caa2) |
| | | | 11,000,000 | | | | 10.250 | | | | 09/15/10 | | | | 9,900,000 | |
| | | CSC Holdings, Inc. (BB/B1) |
| | | | 7,250,000 | | | | 8.125 | | | | 07/15/09 | | | | 7,177,500 | |
| | | | 1,250,000 | | | | 8.125 | | | | 08/15/09 | | | | 1,237,500 | |
| | | | 5,550,000 | | | | 6.750 | | | | 04/15/12 | | | | 5,085,187 | |
| | | | 8,000,000 | | | | 8.500 | (a) | | | 06/15/15 | | | | 7,430,000 | |
| | | CSC Holdings, Inc. Series B (BB/B1) |
| | | | 5,000,000 | | | | 7.625 | | | | 04/01/11 | | | | 4,787,500 | |
| | | Frontier Vision(f) |
| | | | 2,000,000 | | | | 11.000 | | | | 10/15/49 | | | | — | |
| | | Kabel Deutschland GmbH (B-/B2) |
| | | | 5,750,000 | | | | 10.625 | | | | 07/01/14 | | | | 5,721,250 | |
| | | Ono Finance II (CCC+/B3) |
| | | | EUR 12,000,000 | | | | 8.000 | | | | 05/16/14 | | | | 7,771,058 | |
| | | Ono Finance PLC (CCC+/B3) |
| | | | 4,250,000 | | | | 10.500 | | | | 05/15/14 | | | | 2,991,576 | |
| | | Rainbow National Services LLC (BB/B1)(a) |
| | | $ | 200,000 | | | | 8.750 | | | | 09/01/12 | | | | 200,000 | |
| | | Rainbow National Services LLC (BB/B2)(a) |
| | | | 1,909,000 | | | | 10.375 | | | | 09/01/14 | | | | 1,947,180 | |
| | | UPC Holding BV (B-/B3) |
| | | | EUR 7,500,000 | | | | 7.750 | | | | 01/15/14 | | | | 8,552,387 | |
| | | | 10,125,000 | | | | 8.625 | | | | 01/15/14 | | | | 11,830,802 | |
| | | | 6,000,000 | | | | 8.000 | | | | 11/01/16 | | | | 6,504,038 | |
| | | | | | | | | | | | | | | | | |
| | | | | | | | | | | | | | | | 112,021,240 | |
| | | |
| | | |
| | | Media – Diversified – 0.6% |
| | | CanWest MediaWorks, Inc. (CCC+/B3) |
| | | $ | 9,000,000 | | | | 8.000 | | | | 09/15/12 | | | | 7,470,000 | |
| | | Quebecor Media, Inc. (B/B2) |
| | | | 7,410,000 | | | | 7.750 | | | | 03/15/16 | | | | 6,530,063 | |
| | | Rogers Wireless Communications, Inc. (BB+/Ba1) |
| | | | 5,370,000 | | | | 8.000 | | | | 12/15/12 | | | | 5,356,575 | |
| | | Rogers Wireless Communications, Inc. (BBB-/Baa3) |
| | | | 2,000,000 | | | | 7.500 | | | | 03/15/15 | | | | 2,060,000 | |
| | | Videotron Ltee (BB-/Ba2) |
| | | | 625,000 | | | | 6.875 | | | | 01/15/14 | | | | 571,875 | |
| | | | 1,000,000 | | | | 6.375 | | | | 12/15/15 | | | | 885,000 | |
| | | | | | | | | | | | | | | | | |
| | | | | | | | | | | | | | | | 22,873,513 | |
| | | |
| | | |
| | | Metals – 1.8% |
| | | AK Steel Corp. (BB-/Ba3) |
| | | | 7,000,000 | | | | 7.750 | | | | 06/15/12 | | | | 6,650,000 | |
| | | Aleris International, Inc. (B-/B3)(b) |
| | | | 8,500,000 | | | | 9.000 | | | | 12/15/14 | | | | 5,270,000 | |
| | | Aleris International, Inc. (B-/Caa1) |
| | | | 16,000,000 | | | | 10.000 | | | | 12/15/16 | | | | 9,920,000 | |
| | | FMG Finance Pty Ltd (B+/B1)(a) |
| | | | 5,000,000 | | | | 10.625 | | | | 09/01/16 | | | | 4,850,000 | |
| | | Freeport-McMoRan Copper & Gold, Inc. (BBB-/Ba2) |
| | | | 750,000 | | | | 5.883 | (c) | | | 04/01/15 | | | | 713,433 | |
| | | | 2,250,000 | | | | 8.250 | | | | 04/01/15 | | | | 2,199,375 | |
| | | | 5,000,000 | | | | 8.375 | | | | 04/01/17 | | | | 4,900,000 | |
| | | |
| | | |
The accompanying notes are an integral part of these financial statements.
GOLDMAN SACHS HIGH YIELD FUND
Schedule of Investments (continued)
September 30, 2008 (Unaudited)
| | | | | | | | | | | | | | | | | |
| | | Principal
| | Interest
| | Maturity
| | |
| | | Amount | | Rate | | Date | | Value |
| |
Corporate Bonds – (continued) |
| | | Metals – (continued) |
| | | | | | | | | | | | | | | | | |
| | | GrafTech Finance, Inc. (BB/Ba3) |
| | | $ | 367,000 | | | | 10.250 | % | | | 02/15/12 | | | $ | 378,927 | |
| | | Noranda Aluminium Acquisition Corp. (B-/B3)(c) |
| | | | 7,375,000 | | | | 6.828 | | | | 05/15/15 | | | | 5,715,625 | |
| | | Noranda Aluminium Holding Corp. (CCC+/Caa1)(c) |
| | | | 3,250,000 | | | | 8.578 | | | | 11/15/14 | | | | 2,177,500 | |
| | | Novelis, Inc. (B/B3) |
| | | | 13,500,000 | | | | 7.250 | | | | 02/15/15 | | | | 11,677,500 | |
| | | Steel Dynamics, Inc. (BB+/Ba2) |
| | | | 6,000,000 | | | | 7.375 | | | | 11/01/12 | | | | 5,640,000 | |
| | | | 3,000,000 | | | | 7.750 | (a) | | | 04/15/16 | | | | 2,700,000 | |
| | | Tube City IMS Corp. (B-/B3) |
| | | | 3,500,000 | | | | 9.750 | | | | 02/01/15 | | | | 3,220,000 | |
| | | | | | | | | | | | | | | | | |
| | | | | | | | | | | | | | | | 66,012,360 | |
| | | |
| | | |
| | | Packaging – 3.6% |
| | | Ball Corp. (BB+/Ba1) |
| | | | 50,000 | | | | 6.875 | | | | 12/15/12 | | | | 49,938 | |
| | | Berry Plastics Holding Corp. (CCC/Caa2) |
| | | | 8,000,000 | | | | 10.250 | | | | 03/01/16 | | | | 4,960,000 | |
| | | Berry Plastics Holding Corp. (CCC+/Caa1) |
| | | | 2,500,000 | | | | 6.694 | (c) | | | 09/15/14 | | | | 1,625,000 | |
| | | | 11,000,000 | | | | 8.875 | | | | 09/15/14 | | | | 8,030,000 | |
| | | Beverage Packaging Holdings II SA/Luxembourg (B+/B2) |
| | | | EUR 9,000,000 | | | | 8.000 | | | | 12/15/16 | | | | 9,882,758 | |
| | | Beverage Packaging Holdings II SA/Luxembourg (B-/B3) |
| | | | 17,000,000 | | | | 9.500 | | | | 06/15/17 | | | | 16,154,509 | |
| | | Clondalkin Acquisition (B+/Ba3)(c) |
| | | | 1,000,000 | | | | 6.958 | | | | 12/15/13 | | | | 1,126,240 | |
| | | Clondalkin Industries BV (B-/Ba3) |
| | | | 2,250,000 | | | | 8.000 | | | | 03/15/14 | | | | 2,153,935 | |
| | | Consol Specialty Glass Ltd. (BB-/B1) |
| | | | 7,000,000 | | | | 7.625 | | | | 04/15/14 | | | | 6,701,130 | |
| | | Crown Americas LLC (B/B1) |
| | | $ | 10,000,000 | | | | 7.750 | | | | 11/15/15 | | | | 9,850,000 | |
| | | Crown European Holdings SA (BB/Baa3) |
| | | | EUR 1,500,000 | | | | 6.250 | | | | 09/01/11 | | | | 1,911,089 | |
| | | Gerresheimer Holdings GMBH (BB+/B1) |
| | | | 4,800,000 | | | | 7.875 | | | | 03/01/15 | | | | 6,622,293 | |
| | | Graham Packaging Co., Inc. (CCC+/Caa1) |
| | | $ | 21,643,000 | | | | 9.875 | | | | 10/15/14 | | | | 18,071,905 | |
| | | Graphic Packaging International, Inc. (B-/B3) |
| | | | 15,000,000 | | | | 9.500 | | | | 08/15/13 | | | | 13,200,000 | |
| | | Impress Holdings BV (B-/B3) |
| | | | EUR 14,000,000 | | | | 9.250 | | | | 09/15/14 | | | | 16,161,548 | |
| | | Impress Holdings BV (BB-/Ba3)(c) |
| | | $ | 1,000,000 | | | | 5.916 | (a) | | | 09/15/13 | | | | 878,226 | |
| | | | EUR 2,750,000 | | | | 8.088 | | | | 09/15/13 | | | | 3,368,162 | |
| | | OI European Group BV (BB/Ba3) |
| | | | 250,000 | | | | 6.875 | | | | 03/31/17 | | | | 300,917 | |
| | | Owens Brockway Glass Container (BB/Ba3) |
| | | $ | 2,500,000 | | | | 8.250 | | | | 05/15/13 | | | | 2,493,750 | |
| | | | EUR 1,125,000 | | | | 6.750 | | | | 12/01/14 | | | | 1,377,885 | |
| | | $ | 1,000,000 | | | | 6.750 | | | | 12/01/14 | | | | 955,000 | |
| | | Plastipak Holdings, Inc. (B/B3)(a) |
| | | | 1,165,000 | | | | 8.500 | | | | 12/15/15 | | | | 981,512 | |
| | | |
| | | |
| | | Pregis Corp. (CCC+/Caa2) |
| | | | 7,000,000 | | | | 12.375 | | | | 10/15/13 | | | | 4,550,000 | |
| | | Stichting Participatie Impress Cooperatieve UA(b) |
| | | | EUR 967,555 | | | | 17.000 | | | | 09/29/49 | | | | 1,232,722 | |
| | | Tekni-Plex, Inc. (Caa1) |
| | | $ | 2,500,000 | | | | 10.875 | | | | 08/15/12 | | | | 2,500,000 | |
| | | | | | | | | | | | | | | | | |
| | | | | | | | | | | | | | | | 135,138,519 | |
| | | |
| | | |
| | | Paper – 2.0% |
| | | Boise Cascade LLC (BB-/B2) |
| | | | 3,732,000 | | | | 7.125 | | | | 10/15/14 | | | | 2,463,120 | |
| | | Catalyst Paper Corp. (B-/B2) |
| | | | 3,500,000 | | | | 8.625 | | | | 06/15/11 | | | | 2,738,750 | |
| | | | 1,500,000 | | | | 7.375 | | | | 03/01/14 | | | | 1,020,000 | |
| | | Georgia-Pacific Corp. (B+/B2) |
| | | | 8,500,000 | | | | 8.125 | | | | 05/15/11 | | | | 8,393,750 | |
| | | | 1,000,000 | | | | 9.500 | | | | 12/01/11 | | | | 990,000 | |
| | | | 1,500,000 | | | | 7.700 | | | | 06/15/15 | | | | 1,380,000 | |
| | | | 1,250,000 | | | | 8.000 | | | | 01/15/24 | | | | 1,112,500 | |
| | | | 2,750,000 | | | | 7.750 | | | | 11/15/29 | | | | 2,296,250 | |
| | | Georgia-Pacific Corp. (BB-/Ba3)(a) |
| | | | 10,000,000 | | | | 7.000 | | | | 01/15/15 | | | | 8,975,000 | |
| | | | 8,125,000 | | | | 7.125 | | | | 01/15/17 | | | | 7,251,562 | |
| | | Jefferson Smurfit Corp. (B-/B3) |
| | | | 6,000,000 | | | | 8.250 | | | | 10/01/12 | | | | 5,040,000 | |
| | | | 1,750,000 | | | | 7.500 | | | | 06/01/13 | | | | 1,435,000 | |
| | | JSG Funding PLC (B+/B2) |
| | | | 3,250,000 | | | | 7.750 | | | | 04/01/15 | | | | 2,697,500 | |
| | | NewPage Corp. (B-/B2) |
| | | | 8,000,000 | | | | 10.000 | | | | 05/01/12 | | | | 7,200,000 | |
| | | Smurfit Kappa Funding PLC (B+/B2) |
| | | | EUR 6,000,000 | | | | 7.750 | | | | 04/01/15 | | | | 6,799,676 | |
| | | Smurfit-Stone Container Enterprises, Inc. (B-/B3) |
| | | $ | 8,500,000 | | | | 8.000 | | | | 03/15/17 | | | | 6,630,000 | |
| | | Stone Container Finance (B-/B3) |
| | | | 2,250,000 | | | | 7.375 | | | | 07/15/14 | | | | 1,732,500 | |
| | | Verso Paper Holdings LLC, Inc. (B+/B2) |
| | | | 5,000,000 | | | | 9.125 | | | | 08/01/14 | | | | 4,200,000 | |
| | | Verso Paper Holdings LLC, Inc. (CCC+/B3) |
| | | | 5,000,000 | | | | 11.375 | | | | 08/01/16 | | | | 3,925,000 | |
| | | | | | | | | | | | | | | | | |
| | | | | | | | | | | | | | | | 76,280,608 | |
| | | |
| | | |
| | | Printing – 0.2% |
| | | SGS International, Inc. (B-/B3) |
| | | | 4,750,000 | | | | 12.000 | | | | 12/15/13 | | | | 3,823,750 | |
| | | Valassis Communications, Inc. (B-/B3) |
| | | | 5,000,000 | | | | 8.250 | | | | 03/01/15 | | | | 3,450,000 | |
| | | | | | | | | | | | | | | | | |
| | | | | | | | | | | | | | | | 7,273,750 | |
| | | |
| | | |
| | | Publishing – 2.5% |
| | | Dex Media West Finance Co. (BB-/B1) |
| | | | 300,000 | | | | 8.500 | | | | 08/15/10 | | | | 261,750 | |
| | | Dex Media West LLC (B+/B1) |
| | | | 6,744,000 | | | | 9.875 | | | | 08/15/13 | | | | 4,181,280 | |
| | | Dex Media, Inc. (B-/B2) |
| | | | 1,250,000 | | | | 8.000 | | | | 11/15/13 | | | | 575,000 | |
| | | | 12,750,000 | | | | 9.000 | (e) | | | 11/15/13 | | | | 5,992,500 | |
| | | |
| | | |
The accompanying notes are an integral part of these financial statements.
GOLDMAN SACHS HIGH YIELD FUND
| | | | | | | | | | | | | | | | | |
| | | Principal
| | Interest
| | Maturity
| | |
| | | Amount | | Rate | | Date | | Value |
| |
Corporate Bonds – (continued) |
| | | Publishing – (continued) |
| | | | | | | | | | | | | | | | | |
| | | Idearc, Inc. (B-/B3) |
| | | $ | 12,500,000 | | | | 8.000 | % | | | 11/15/16 | | | $ | 3,531,250 | |
| | | Lighthouse International Co. SA (BB-/B2) |
| | | | EUR 10,000,000 | | | | 8.000 | | | | 04/30/14 | | | | 8,517,192 | |
| | | Morris Publishing Group LLC (CCC/Caa1) |
| | | $ | 4,500,000 | | | | 7.000 | | | | 08/01/13 | | | | 1,080,000 | |
| | | Nielsen Finance LLC Co. (B-/Caa1) |
| | | | 15,000,000 | | | | 10.000 | | | | 08/01/14 | | | | 14,343,750 | |
| | | Nielsen Finance LLC Co. (CCC+/Caa1)(e) |
| | | | 20,000,000 | | | | 12.500 | | | | 08/01/16 | | | | 13,150,000 | |
| | | RH Donnelley Corp. (B+/B1)(a) |
| | | | 2,820,000 | | | | 11.750 | | | | 05/15/15 | | | | 1,734,300 | |
| | | RH Donnelley Corp. (B-/B3) |
| | | | 7,000,000 | | | | 6.875 | | | | 01/15/13 | | | | 2,730,000 | |
| | | | 7,000,000 | | | | 8.875 | | | | 01/15/16 | | | | 2,310,000 | |
| | | The Nielsen Co. (CCC+/Caa1)(e) |
| | | | EUR 10,000,000 | | | | 11.125 | | | | 08/01/16 | | | | 6,757,442 | |
| | | TL Acquisitions, Inc. (CCC+/Caa1)(a) |
| | | $ | 18,500,000 | | | | 10.500 | | | | 01/15/15 | | | | 14,892,500 | |
| | | Truvo Subsidiary Corp. (CCC+/Caa1) |
| | | | EUR 19,750,000 | | | | 8.500 | | | | 12/01/14 | | | | 14,458,109 | |
| | | | | | | | | | | | | | | | | |
| | | | | | | | | | | | | | | | 94,515,073 | |
| | | |
| | | |
| | | Real Estate – 0.3% |
| | | Castle HoldCo Ltd. (B/Caa1)(c) |
| | | | GBP 2,000,000 | | | | 8.643 | | | | 05/15/14 | | | | 1,422,280 | |
| | | Castle HoldCo Ltd. (CCC+/Caa3) |
| | | | 2,500,000 | | | | 9.875 | | | | 05/15/15 | | | | 1,355,611 | |
| | | Fontainebleau Las Vegas Holdings Corp. LLC (CCC/Caa1)(a) |
| | | $ | 5,000,000 | | | | 10.250 | | | | 06/15/15 | | | | 1,700,000 | |
| | | Realogy Corp. (B-/Caa2) |
| | | | 7,000,000 | | | | 10.500 | | | | 04/15/14 | | | | 3,185,000 | |
| | | | 2,750,000 | | | | 11.000 | (b) | | | 04/15/14 | | | | 1,086,250 | |
| | | Realogy Corp. (CCC/Caa3) |
| | | | 5,000,000 | | | | 12.375 | | | | 04/15/15 | | | | 1,875,000 | |
| | | | | | | | | | | | | | | | | |
| | | | | | | | | | | | | | | | 10,624,141 | |
| | | |
| | | |
| | | Restaurants – 0.5% |
| | | Landry’s Restaurants, Inc. (CCC+/B3)(d) |
| | | | 9,050,000 | | | | 9.500 | | | | 12/15/14 | | | | 8,190,250 | |
| | | NPC International, Inc. (CCC+/Caa1) |
| | | | 2,500,000 | | | | 9.500 | | | | 05/01/14 | | | | 2,062,500 | |
| | | OSI Restaurant Partners, Inc. (CCC/Caa1) |
| | | | 10,000,000 | | | | 10.000 | | | | 06/15/15 | | | | 4,450,000 | |
| | | Seminole Hard Rock Entertainment, Inc. (BB/B1)(a)(c) |
| | | | 5,250,000 | | | | 5.319 | | | | 03/15/14 | | | | 3,963,750 | |
| | | | | | | | | | | | | | | | | |
| | | | | | | | | | | | | | | | 18,666,500 | |
| | | |
| | | |
| | | Retailers – 1.3% |
| | | AutoNation, Inc. (BB+/Ba2) |
| | | | 745,000 | | | | 7.000 | % | | | 04/15/14 | | | | 644,425 | |
| | | Burlington Coat Factory Warehouse Corp. (CCC/B3) |
| | | | 2,250,000 | | | | 11.125 | | | | 04/15/14 | | | | 1,282,500 | |
| | | Claire’s Stores, Inc. (CCC/Caa3) |
| | | | 2,625,000 | | | | 10.500 | | | | 06/01/17 | | | | 918,750 | |
| | | Claire’s Stores, Inc. (CCC+/Caa2) |
| | | | 3,000,000 | | | | 9.625 | | | | 06/01/15 | | | | 810,000 | |
| | | |
| | | |
| | | Edcon Proprietary Ltd. (BB-/B2)(c) |
| | | | EUR 12,750,000 | | | | 8.208 | | | | 06/15/14 | | | | 10,679,925 | |
| | | General Nutrition Centers, Inc. (CCC/Caa1)(b)(c) |
| | | $ | 7,000,000 | | | | 7.584 | | | | 03/15/14 | | | | 5,845,000 | |
| | | Michaels Stores, Inc. (CCC/Caa1) |
| | | | 9,500,000 | | | | 10.000 | | | | 11/01/14 | | | | 5,842,500 | |
| | | Michaels Stores, Inc. (CCC/Caa2) |
| | | | 11,000,000 | | | | 11.375 | | | | 11/01/16 | | | | 5,170,000 | |
| | | Neiman-Marcus Group, Inc. (B/B3) |
| | | | 14,500,000 | | | | 10.375 | | | | 10/15/15 | | | | 12,071,250 | |
| | | Neiman-Marcus Group, Inc. (B+/B2)(b) |
| | | | 7,000,000 | | | | 9.000 | | | | 10/15/15 | | | | 5,836,250 | |
| | | | | | | | | | | | | | | | | |
| | | | | | | | | | | | | | | | 49,100,600 | |
| | | |
| | | |
| | | Retailers – Food & Drug – 0.6% |
| | | Ahold Lease USA, Inc. (BBB-/Baa3)(e) |
| | | | 856,392 | | | | 7.820 | | | | 01/02/20 | | | | 923,833 | |
| | | | 2,000,000 | | | | 8.620 | | | | 01/02/25 | | | | 2,235,000 | |
| | | Ingles Markets, Inc. (B+/B2) |
| | | | 4,615,000 | | | | 8.875 | | | | 12/01/11 | | | | 4,649,613 | |
| | | Rite Aid Corp. (B+/Caa1) |
| | | | 5,000,000 | | | | 7.500 | | | | 03/01/17 | | | | 3,850,000 | |
| | | Rite Aid Corp. (CCC+/Caa2) |
| | | | 3,625,000 | | | | 9.375 | | | | 12/15/15 | | | | 1,957,500 | |
| | | | 7,000,000 | | | | 9.500 | | | | 06/15/17 | | | | 3,657,500 | |
| | | Supervalu, Inc. (B+/B1) |
| | | | 5,000,000 | | | | 7.500 | | | | 11/15/14 | | | | 4,850,000 | |
| | | | | | | | | | | | | | | | | |
| | | | | | | | | | | | | | | | 22,123,446 | |
| | | |
| | | |
| | | Services Cyclical – Business Services – 1.6% |
| | | ACCO Brands Corp. (B+/B2) |
| | | | 7,500,000 | | | | 7.625 | | | | 08/15/15 | | | | 5,850,000 | |
| | | Carlson Wagonlit BV (B-/B2)(c) |
| | | | EUR 9,000,000 | | | | 10.713 | | | | 05/01/15 | | | | 7,982,228 | |
| | | Cornell Co., Inc. (B/B2) |
| | | $ | 1,500,000 | | | | 10.750 | | | | 07/01/12 | | | | 1,492,500 | |
| | | Corrections Corp. of America (BB/Ba2) |
| | | | 2,000,000 | | | | 7.500 | | | | 05/01/11 | | | | 1,975,000 | |
| | | | 625,000 | | | | 6.750 | | | | 01/31/14 | | | | 584,375 | |
| | | Great Lakes Dredge & Dock Co. (B-/Caa1) |
| | | | 3,500,000 | | | | 7.750 | | | | 12/15/13 | | | | 3,220,000 | |
| | | Iron Mountain, Inc. (B+/B2) |
| | | | 3,000,000 | | | | 8.625 | | | | 04/01/13 | | | | 2,970,000 | |
| | | | 1,500,000 | | | | 6.625 | | | | 01/01/16 | | | | 1,425,000 | |
| | | | 4,250,000 | | | | 8.000 | | | | 06/15/20 | | | | 4,133,125 | |
| | | ISS Holdings A/S (B/Caa1) |
| | | | EUR 9,000,000 | | | | 8.875 | | | | 05/15/16 | | | | 11,149,779 | |
| | | Savcio Holdings Ltd. (B+/B2) |
| | | | 2,000,000 | | | | 8.000 | | | | 02/15/13 | | | | 2,336,948 | |
| | | West Corp. (B-/Caa1) |
| | | $ | 10,000,000 | | | | 9.500 | | | | 10/15/14 | | | | 7,700,000 | |
| | | | 14,250,000 | | | | 11.000 | | | | 10/15/16 | | | | 10,545,000 | |
| | | | | | | | | | | | | | | | | |
| | | | | | | | | | | | | | | | 61,363,955 | |
| | | |
| | | |
The accompanying notes are an integral part of these financial statements.
GOLDMAN SACHS HIGH YIELD FUND
Schedule of Investments (continued)
September 30, 2008 (Unaudited)
| | | | | | | | | | | | | | | | | |
| | | Principal
| | Interest
| | Maturity
| | |
| | | Amount | | Rate | | Date | | Value |
| |
Corporate Bonds – (continued) |
| | | Services Cyclical – Business Services – (continued) |
| | | | | | | | | | | | | | | | | |
| | | Services Cyclical – Consumer Services – 0.1% |
| | | Service Corp. International (BB-/B1) |
| | | $ | 1,750,000 | | | | 6.750 | % | | | 04/01/16 | | | $ | 1,513,750 | |
| | | | 2,125,000 | | | | 7.000 | | | | 06/15/17 | | | | 1,838,125 | |
| | | | | | | | | | | | | | | | | |
| | | | | | | | | | | | | | | | 3,351,875 | |
| | | |
| | | |
| | | Services Cyclical – Rental Equipment – 1.5% |
| | | Ahern Rentals, Inc. (B+/B3) |
| | | | 3,000,000 | | | | 9.250 | | | | 08/15/13 | | | | 1,500,000 | |
| | | Ashtead Capital, Inc. (B/B1)(a) |
| | | | 3,000,000 | | | | 9.000 | | | | 08/15/16 | | | | 2,610,000 | |
| | | Ashtead Holdings PLC (B/B1)(a) |
| | | | 2,000,000 | | | | 8.625 | | | | 08/01/15 | | | | 1,720,000 | |
| | | Avis Budget Car Rental (B+/Ba3) |
| | | | 955,000 | | | | 7.625 | | | | 05/15/14 | | | | 620,750 | |
| | | Europcar Groupe SA (B+/B3) |
| | | | EUR 3,250,000 | | | | 8.125 | | | | 05/15/14 | | | | 2,287,676 | |
| | | Europcar Groupe SA (BB-/B2)(c) |
| | | | 4,000,000 | | | | 8.465 | | | | 05/15/13 | | | | 3,266,097 | |
| | | Hertz Corp. (B/B2) |
| | | $ | 10,000,000 | | | | 10.500 | | | | 01/01/16 | | | | 8,450,000 | |
| | | Hertz Corp. (BB-/B1) |
| | | | EUR 1,500,000 | | | | 7.875 | | | | 01/01/14 | | | | 1,562,658 | |
| | | $ | 10,725,000 | | | | 8.875 | | | | 01/01/14 | | | | 9,277,125 | |
| | | Neff Corp. (CCC+/Caa2) |
| | | | 3,000,000 | | | | 10.000 | | | | 06/01/15 | | | | 900,000 | |
| | | RSC Equipment Rental, Inc. (B-/Caa1) |
| | | | 15,500,000 | | | | 9.500 | | | | 12/01/14 | | | | 11,780,000 | |
| | | United Rentals North America, Inc. (B/B2) |
| | | | 7,000,000 | | | | 7.750 | | | | 11/15/13 | | | | 5,285,000 | |
| | | | 5,750,000 | | | | 7.000 | | | | 02/15/14 | | | | 4,197,500 | |
| | | United Rentals North America, Inc. (BB-/B1) |
| | | | 5,000,000 | | | | 6.500 | | | | 02/15/12 | | | | 4,175,000 | |
| | | | | | | | | | | | | | | | | |
| | | | | | | | | | | | | | | | 57,631,806 | |
| | | |
| | | |
| | | Technology – Hardware – 2.0% |
| | | Avago Technologies (B/B3) |
| | | | 6,250,000 | | | | 11.875 | | | | 12/01/15 | | | | 6,531,250 | |
| | | Avago Technologies Finance Corp. (BB-/B1) |
| | | | 11,500,000 | | | | 10.125 | | | | 12/01/13 | | | | 11,873,750 | |
| | | Freescale Semiconductor, Inc. (B-/B2) |
| | | | 4,750,000 | | | | 8.875 | | | | 12/15/14 | | | | 3,325,000 | |
| | | | 12,825,000 | | | | 9.125 | (b) | | | 12/15/14 | | | | 8,143,875 | |
| | | Freescale Semiconductor, Inc. (B-/B3) |
| | | | 10,000,000 | | | | 10.125 | | | | 12/15/16 | | | | 6,450,000 | |
| | | Lucent Technologies, Inc. (BB-/Ba3) |
| | | | 1,250,000 | | | | 5.500 | | | | 11/15/08 | | | | 1,234,375 | |
| | | | 10,750,000 | | | | 6.450 | | | | 03/15/29 | | | | 6,718,750 | |
| | | Nortel Networks Ltd. (B-/B3) |
| | | | 1,000,000 | | | | 7.041 | %(c) | | | 07/15/11 | | | | 665,000 | |
| | | | 4,750,000 | | | | 10.125 | | | | 07/15/13 | | | | 3,016,250 | |
| | | | 3,000,000 | | | | 10.750 | | | | 07/15/16 | | | | 1,755,000 | |
| | | NXP BV/NXP Funding LLC (B-/B3) |
| | | | 750,000 | | | | 5.541 | (c) | | | 10/15/13 | | | | 498,750 | |
| | | | EUR 1,500,000 | | | | 7.713 | (c) | | | 10/15/13 | | | | 1,288,137 | |
| | | $ | 4,625,000 | | | | 7.875 | | | | 10/15/14 | | | | 3,133,438 | |
| | | |
| | | |
| | | NXP BV/NXP Funding LLC (CCC+/Caa2) |
| | | | EUR 5,500,000 | | | | 8.625 | | | | 10/15/15 | | | | 3,716,593 | |
| | | $ | 10,005,000 | | | | 9.500 | | | | 10/15/15 | | | | 5,227,612 | |
| | | Spansion, Inc. (B/Caa2)(a) |
| | | | 6,000,000 | | | | 11.250 | | | | 01/15/16 | | | | 3,480,000 | |
| | | Xerox Corp. (BBB/Baa2) |
| | | | EUR 2,000,000 | | | | 9.750 | | | | 01/15/09 | | | | 2,826,159 | |
| | | $ | 2,250,000 | | | | 9.750 | | | | 01/15/09 | | | | 2,287,402 | |
| | | | 2,000,000 | | | | 7.625 | | | | 06/15/13 | | | | 2,026,555 | |
| | | | | | | | | | | | | | | | | |
| | | | | | | | | | | | | | | | 74,197,896 | |
| | | |
| | | |
| | | Technology – Software/Services – 2.3% |
| | | First Data Corp. (B/B3)(a) |
| | | | 19,500,000 | | | | 9.875 | | | | 09/24/15 | | | | 15,307,500 | |
| | | Sabre Holdings Corp. (B-/Caa1) |
| | | | 10,000,000 | | | | 8.350 | | | | 03/15/16 | | | | 6,400,000 | |
| | | Serena Software, Inc. (CCC+/Caa1) |
| | | | 5,000,000 | | | | 10.375 | | | | 03/15/16 | | | | 4,400,000 | |
| | | Sungard Data Systems, Inc. (B/Caa1) |
| | | | 12,000,000 | | | | 9.125 | | | | 08/15/13 | | | | 10,800,000 | |
| | | | 6,000,000 | | | | 10.625 | (a) | | | 05/15/15 | | | | 5,655,000 | |
| | | Sungard Data Systems, Inc. (B-/Caa1) |
| | | | 26,125,000 | | | | 10.250 | | | | 08/15/15 | | | | 22,794,063 | |
| | | Travelport, Inc. (B/B3) |
| | | | EUR 2,000,000 | | | | 9.588 | (c)(d) | | | 09/01/14 | | | | 1,984,998 | |
| | | $ | 15,500,000 | | | | 9.875 | | | | 09/01/14 | | | | 12,400,000 | |
| | | Travelport, Inc. (CCC+/Caa1) |
| | | | 11,000,000 | | | | 11.875 | | | | 09/01/16 | | | | 7,892,500 | |
| | | Travelport, Inc. (Caa1) |
| | | | EUR 375,000 | | | | 10.875 | | | | 09/01/16 | | | | 345,791 | |
| | | | | | | | | | | | | | | | | |
| | | | | | | | | | | | | | | | 87,979,852 | |
| | | |
| | | |
| | | Telecommunications – 2.3% |
| | | BCM Ireland Finance Ltd. (B-/B3)(c) |
| | | | 3,000,000 | | | | 9.965 | | | | 08/15/16 | | | | 3,209,785 | |
| | | Citizens Communications Co. (BB/Ba2) |
| | | $ | 7,625,000 | | | | 9.250 | | | | 05/15/11 | | | | 7,663,125 | |
| | | | 2,500,000 | | | | 6.250 | | | | 01/15/13 | | | | 2,350,000 | |
| | | Frontier Communications Corp. (BB/Ba2) |
| | | | 8,750,000 | | | | 6.625 | | | | 03/15/15 | | | | 7,393,750 | |
| | | Level 3 Financing, Inc. (CCC+/Caa1) |
| | | | 10,000,000 | | | | 9.250 | | | | 11/01/14 | | | | 7,575,000 | |
| | | Nordic Telephone Co. Holdings (B+/B2) |
| | | | EUR 14,250,000 | | | | 8.250 | | | | 05/01/16 | | | | 16,650,759 | |
| | | $ | 9,000,000 | | | | 8.875 | (a) | | | 05/01/16 | | | | 8,370,000 | |
| | | Qwest Capital Funding, Inc. (B+/B1) |
| | | | 750,000 | | | | 7.000 | | | | 08/03/09 | | | | 738,750 | |
| | | | 5,500,000 | | | | 7.900 | | | | 08/15/10 | | | | 5,280,000 | |
| | | Qwest Communications International, Inc. (B+/Ba3) |
| | | | 3,000,000 | | | | 7.500 | | | | 02/15/14 | | | | 2,625,000 | |
| | | Qwest Communications International, Inc. Series B (B+/Ba3) |
| | | | 1,500,000 | | | | 7.500 | | | | 02/15/14 | | | | 1,312,500 | |
| | | Qwest Corp. (BBB-/Ba1) |
| | | | 7,750,000 | | | | 8.875 | | | | 03/15/12 | | | | 7,527,187 | |
| | | | 1,450,000 | | | | 7.500 | | | | 10/01/14 | | | | 1,276,000 | |
| | | |
| | | |
The accompanying notes are an integral part of these financial statements.
GOLDMAN SACHS HIGH YIELD FUND
| | | | | | | | | | | | | | | | | |
| | | Principal
| | Interest
| | Maturity
| | |
| | | Amount | | Rate | | Date | | Value |
| |
Corporate Bonds – (continued) |
| | | Telecommunications – (continued) |
| | | | | | | | | | | | | | | | | |
| | | Windstream Corp. (BB/Ba3) |
| | | $ | 4,000,000 | | | | 8.125 | % | | | 08/01/13 | | | $ | 3,830,000 | |
| | | | 7,250,000 | | | | 8.625 | | | | 08/01/16 | | | | 6,724,375 | |
| | | | 2,200,000 | | | | 7.000 | | | | 03/15/19 | | | | 1,782,000 | |
| | | | | | | | | | | | | | | | | |
| | | | | | | | | | | | | | | | 84,308,231 | |
| | | |
| | | |
| | | Telecommunications – Cellular – 3.5% |
| | | American Tower Corp. (BB+/Ba1) |
| | | | 5,000,000 | | | | 7.125 | | | | 10/15/12 | | | | 4,937,500 | |
| | | | 3,000,000 | | | | 7.000 | (a) | | | 10/15/17 | | | | 2,895,000 | |
| | | Centennial Cellular Communications (B/B2) |
| | | | 1,500,000 | | | | 10.125 | | | | 06/15/13 | | | | 1,485,000 | |
| | | Digicel Group Ltd. (Caa1)(a) |
| | | | 15,000,000 | | | | 8.875 | | | | 01/15/15 | | | | 12,750,000 | |
| | | | 7,573,000 | | | | 9.125 | (b) | | | 01/15/15 | | | | 6,437,050 | |
| | | Digicel Group Ltd. (B2)(a) |
| | | | 4,000,000 | | | | 9.250 | | | | 09/01/12 | | | | 3,960,000 | |
| | | Hellas Telecommunications III (CCC+/B3) |
| | | | EUR 7,250,000 | | | | 8.500 | | | | 10/15/13 | | | | 7,348,718 | |
| | | Hellas Telecommunications Luxembourg II (CCC+/Caa1)(c) |
| | | | 10,000,000 | | | | 10.963 | | | | 01/15/15 | | | | 7,954,072 | |
| | | Hellas Telecommunications Luxembourg V (B/B1)(c) |
| | | | 1,500,000 | | | | 8.463 | | | | 10/15/12 | | | | 1,615,451 | |
| | | Nextel Communications, Inc. (BB/Baa3) |
| | | $ | 3,000,000 | | | | 5.950 | | | | 03/15/14 | | | | 2,126,256 | |
| | | | 14,000,000 | | | | 7.375 | | | | 08/01/15 | | | | 9,426,929 | |
| | | Orascom Telecom Finance SCA (B-/B2)(a) |
| | | | 17,250,000 | | | | 7.875 | | | | 02/08/14 | | | | 14,835,000 | |
| | | Sprint Capital Corp. (BB/Baa3) |
| | | | 16,000,000 | | | | 6.900 | | | | 05/01/19 | | | | 12,561,846 | |
| | | | 4,500,000 | | | | 8.750 | | | | 03/15/32 | | | | 3,452,757 | |
| | | Sprint Nextel Corp. (BB/Baa3) |
| | | | 10,000,000 | | | | 6.000 | | | | 12/01/16 | | | | 7,650,438 | |
| | | VIP Finance Ireland Ltd. for OJSC Vimpel Communications (BB+/Ba2)(a) |
| | | | 5,000,000 | | | | 9.125 | | | | 04/30/18 | | | | 3,550,000 | |
| | | Wind Acquisition Finance SA (B/B2) |
| | | | EUR 8,500,000 | | | | 9.750 | | | | 12/01/15 | | | | 10,829,504 | |
| | | $ | 16,750,000 | | | | 10.750 | (a) | | | 12/01/15 | | | | 16,415,000 | |
| | | | | | | | | | | | | | | | | |
| | | | | | | | | | | | | | | | 130,230,521 | |
| | | |
| | | |
| | | Telecommunications – Satellites – 0.9% |
| | | Inmarsat Finance II PLC (BB-/B1)(e) |
| | | | 6,000,000 | | | | 10.375 | | | | 11/15/12 | | | | 5,947,500 | |
| | | Inmarsat Finance PLC (BB/Ba3) |
| | | | 1,395,000 | | | | 7.625 | | | | 06/30/12 | | | | 1,367,100 | |
| | | Intelsat Bermuda Ltd. (CCC+/Caa2) |
| | | | 5,000,000 | | | | 11.250 | | | | 06/15/16 | | | | 4,887,500 | |
| | | | 2,000,000 | | | | 11.250 | (a)(e) | | | 02/04/17 | | | | 1,560,000 | |
| | | Intelsat Bermuda Ltd. (CCC+/Caa3) |
| | | | 1,500,000 | | | | 6.500 | | | | 11/01/13 | | | | 960,000 | |
| | | Intelsat Intermediate Holding Co. Ltd. (B-/Caa1)(a)(e) |
| | | | 4,500,000 | | | | 9.500 | | | | 02/01/15 | | | | 3,611,250 | |
| | | Intelsat Ltd. (CCC+/Caa3) |
| | | | 9,000,000 | | | | 7.625 | | | | 04/15/12 | | | | 6,840,000 | |
| | | |
| | | |
| | | Intelsat Subsidiary Holding Co. Ltd. (BB-/B3)(a) |
| | | | 4,500,000 | | | | 8.500 | | | | 01/15/13 | | | | 4,230,000 | |
| | | | 3,250,000 | | | | 8.875 | | | | 01/15/15 | | | | 3,022,500 | |
| | | | | | | | | | | | | | | | | |
| | | | | | | | | | | | | | | | 32,425,850 | |
| | | |
| | | |
| | | Textiles & Apparel – 0.3% |
| | | Oxford Industries, Inc. (B+/B2) |
| | | | 3,500,000 | | | | 8.875 | | | | 06/01/11 | | | | 3,163,125 | |
| | | Perry Ellis International, Inc. (B-/B3) |
| | | | 1,225,000 | | | | 8.875 | | | | 09/15/13 | | | | 1,090,250 | |
| | | Propex Fabrics, Inc. (WR)(f) |
| | | | 2,500,000 | | | | 10.000 | | | | 12/01/12 | | | | 25,000 | |
| | | Quiksilver, Inc. (B/B1) |
| | | | 8,750,000 | | | | 6.875 | | | | 04/15/15 | | | | 6,037,500 | |
| | | Warnaco, Inc. (BB+/Ba3) |
| | | | 2,000,000 | | | | 8.875 | | | | 06/15/13 | | | | 2,010,000 | |
| | | | | | | | | | | | | | | | | |
| | | | | | | | | | | | | | | | 12,325,875 | |
| | | |
| | | |
| | | Tobacco – 0.1% |
| | | Alliance One International, Inc. (B+/B2) |
| | | | 1,000,000 | | | | 8.500 | | | | 05/15/12 | | | | 932,500 | |
| | | | 4,500,000 | | | | 11.000 | | | | 05/15/12 | | | | 4,443,750 | |
| | | | | | | | | | | | | | | | | |
| | | | | | | | | | | | | | | | 5,376,250 | |
| | | |
| | | |
| | | Transportation – 0.1% |
| | | Stena AB (BB+/Ba2) |
| | | | EUR 3,250,000 | | | | 6.125 | | | | 02/01/17 | | | | 3,317,130 | |
| | | | | | | | | | | | | | | | | |
| | | | | | | | | | | | | | | | 3,317,130 | |
| | | |
| | | |
| | | Utilities – Distribution – 0.5% |
| | | AmeriGas Partners LP (Ba3) |
| | | $ | 3,000,000 | | | | 7.250 | | | | 05/20/15 | | | | 2,775,000 | |
| | | AmeriGas Partners LP/AmeriGas Eagle Finance Corp. (Ba3) |
| | | | 6,750,000 | | | | 7.125 | | | | 05/20/16 | | | | 6,142,500 | |
| | | Ferrellgas Finance LP (B+/Ba3) |
| | | | 438,000 | | | | 6.750 | | | | 05/01/14 | | | | 363,540 | |
| | | Inergy LP/Inergy Finance Corp. (B+/B1) |
| | | | 3,550,000 | | | | 6.875 | | | | 12/15/14 | | | | 3,106,250 | |
| | | | 3,000,000 | | | | 8.250 | | | | 03/01/16 | | | | 2,760,000 | |
| | | Suburban Propane Partners LP (B+/B1) |
| | | | 5,000,000 | | | | 6.875 | | | | 12/15/13 | | | | 4,450,000 | |
| | | | | | | | | | | | | | | | | |
| | | | | | | | | | | | | | | | 19,597,290 | |
| | | |
| | | |
| | | Utilities – Electric – 3.9% |
| | | Allegheny Energy Supply Co. LLC (BBB-/Ba1)(a) |
| | | | 5,000,000 | | | | 8.250 | | | | 04/15/12 | | | | 5,075,000 | |
| | | Dynegy Holdings, Inc. (B/B2) |
| | | | 3,000,000 | | | | 8.750 | | | | 02/15/12 | | | | 2,865,000 | |
| | | | 4,000,000 | | | | 7.500 | | | | 06/01/15 | | | | 3,440,000 | |
| | | | 4,000,000 | | | | 8.375 | | | | 05/01/16 | | | | 3,500,000 | |
| | | | 1,500,000 | | | | 7.125 | | | | 05/15/18 | | | | 1,140,000 | |
| | | | 7,000,000 | | | | 7.750 | | | | 06/01/19 | | | | 5,827,500 | |
| | | Edison Mission Energy (BB-/B1) |
| | | | 2,000,000 | | | | 7.500 | | | | 06/15/13 | | | | 1,920,000 | |
| | | | 5,000,000 | | | | 7.750 | | | | 06/15/16 | | | | 4,725,000 | |
| | | | 10,000,000 | | | | 7.000 | | | | 05/15/17 | | | | 9,050,000 | |
| | | | 6,000,000 | | | | 7.200 | | | | 05/15/19 | | | | 5,310,000 | |
| | | |
| | | |
The accompanying notes are an integral part of these financial statements.
GOLDMAN SACHS HIGH YIELD FUND
Schedule of Investments (continued)
September 30, 2008 (Unaudited)
| | | | | | | | | | | | | | | | | |
| | | Principal
| | Interest
| | Maturity
| | |
| | | Amount | | Rate | | Date | | Value |
| |
Corporate Bonds – (continued) |
| | | Utilities – Electric – (continued) |
| | | | | | | | | | | | | | | | | |
| | | Elwood Energy LLC (BB/Ba1) |
| | | $ | 2,174,430 | | | | 8.159 | % | | | 07/05/26 | | | $ | 2,022,220 | |
| | | Intergen NV (BB-/Ba3)(a) |
| | | | 4,500,000 | | | | 9.000 | | | | 06/30/17 | | | | 4,511,250 | |
| | | Ipalco Enterprises, Inc. (BB/Ba1) |
| | | | 1,500,000 | | | | 8.625 | | | | 11/14/11 | | | | 1,515,000 | |
| | | Midwest Generation LLC (BB+/Baa3) |
| | | | 357,811 | | | | 8.300 | | | | 07/02/09 | | | | 359,600 | |
| | | | 4,174,001 | | | | 8.560 | | | | 01/02/16 | | | | 4,174,001 | |
| | | Mirant Americas Generation LLC (B-/B3) |
| | | | 8,500,000 | | | | 8.300 | | | | 05/01/11 | | | | 8,181,250 | |
| | | Mirant Mid-Atlantic LLC (BB/Ba1) |
| | | | 2,236,320 | | | | 9.125 | | | | 06/30/17 | | | | 2,404,044 | |
| | | Mirant North America LLC (B-/B1) |
| | | | 7,500,000 | | | | 7.375 | | | | 12/31/13 | | | | 6,975,000 | |
| | | NRG Energy, Inc. (B/B1) |
| | | | 13,250,000 | | | | 7.250 | | | | 02/01/14 | | | | 12,190,000 | |
| | | | 17,250,000 | | | | 7.375 | | | | 02/01/16 | | | | 15,870,000 | |
| | | | 6,000,000 | | | | 7.375 | | | | 01/15/17 | | | | 5,460,000 | |
| | | Orion Power Holdings, Inc. (BB/Ba3) |
| | | | 3,500,000 | | | | 12.000 | | | | 05/01/10 | | | | 3,526,250 | |
| | | Reliant Energy, Inc. (B+/B1) |
| | | | 4,000,000 | | | | 7.625 | | | | 06/15/14 | | | | 2,970,000 | |
| | | | 8,500,000 | | | | 7.875 | | | | 06/15/17 | | | | 6,290,000 | |
| | | The AES Corp. (BB-/B1) |
| | | | 5,500,000 | | | | 9.500 | | | | 06/01/09 | | | | 5,541,250 | |
| | | | 5,250,000 | | | | 9.375 | | | | 09/15/10 | | | | 5,315,625 | |
| | | | 6,250,000 | | | | 7.750 | | | | 10/15/15 | | | | 5,703,125 | |
| | | | 6,500,000 | | | | 8.000 | | | | 10/15/17 | | | | 5,980,000 | |
| | | | 6,250,000 | | | | 8.000 | (a) | | | 06/01/20 | | | | 5,468,750 | |
| | | | | | | | | | | | | | | | | |
| | | | | | | | | | | | | | | | 147,309,865 | |
| | | |
| | | |
| | | Utilities – Pipelines – 2.0% |
| | | El Paso Corp. (BB-/Ba3) |
| | | | 11,000,000 | | | | 7.000 | | | | 06/15/17 | | | | 10,037,500 | |
| | | El Paso Natural Gas Co. (BB/Baa3) |
| | | | 3,125,000 | | | | 8.625 | | | | 01/15/22 | | | | 3,121,128 | |
| | | | 2,375,000 | | | | 7.500 | | | | 11/15/26 | | | | 2,198,539 | |
| | | | 4,250,000 | | | | 8.375 | | | | 06/15/32 | | | | 4,282,623 | |
| | | Mark West Energy Partners LP/Mark West Energy Finance Corp. Series B (B+/B2) |
| | | | 6,750,000 | | | | 8.500 | | | | 07/15/16 | | | | 6,412,500 | |
| | | Regency Energy Partners (B/B1) |
| | | | 3,998,000 | | | | 8.375 | | | | 12/15/13 | | | | 3,598,200 | |
| | | Southern Natural Gas Co. (BB/Baa3) |
| | | | 3,000,000 | | | | 7.350 | | | | 02/15/31 | | | | 2,684,514 | |
| | | | 3,000,000 | | | | 8.000 | | | | 03/01/32 | | | | 2,878,050 | |
| | | Southern Star Central Corp. (BB+/Ba2) |
| | | | 1,000,000 | | | | 6.750 | | | | 03/01/16 | | | | 922,500 | |
| | | Targa Resources Partners LP (B/B2)(a) |
| | | | 2,000,000 | | | | 8.250 | | | | 07/01/16 | | | | 1,720,000 | |
| | | Targa Resources, Inc. (CCC+/B3) |
| | | | 9,055,000 | | | | 8.500 | | | | 11/01/13 | | | | 7,877,850 | |
| | | |
| | | |
| | | Tennessee Gas Pipeline Co. (BB/Baa3) |
| | | | 250,000 | | | | 7.500 | | | | 04/01/17 | | | | 241,875 | |
| | | | 3,000,000 | | | | 7.000 | | | | 10/15/28 | | | | 2,649,014 | |
| | | | 3,750,000 | | | | 8.375 | | | | 06/15/32 | | | | 3,937,980 | |
| | | | 1,500,000 | | | | 7.625 | | | | 04/01/37 | | | | 1,405,697 | |
| | | The Williams Cos., Inc. (BB+/Baa3) |
| | | | 4,750,000 | | | | 8.125 | | | | 03/15/12 | | | | 4,868,750 | |
| | | | 3,000,000 | | | | 7.625 | | | | 07/15/19 | | | | 2,985,000 | |
| | | | 11,000,000 | | | | 7.875 | | | | 09/01/21 | | | | 11,000,000 | |
| | | | 1,000,000 | | | | 7.500 | | | | 01/15/31 | | | | 920,000 | |
| | | | | | | | | | | | | | | | | |
| | | | | | | | | | | | | | | | 73,741,720 | |
| | | |
| | | |
| | | TOTAL CORPORATE BONDS |
| | | (Cost $3,862,357,166) | | $ | 3,105,279,375 | |
| | | |
| | | |
| | | | | Dividend
| | Maturity
| | |
| | | Shares | | Rate | | Date | | Value |
| |
Preferred Stocks – 0.0% |
| | | | | | | | | | | | | | | | | |
| | | | | | | | | | | | | | | | | |
| | | Lucent Technologies Capital Trust I |
| | | | 1,000 | | | | 7.750 | % | | | 03/15/17 | | | $ | 390,000 | |
| | | Pliant Corp.(b) |
| | | | 2,796 | | | | 13.000 | | | | 09/01/09 | | | | 167,760 | |
| | | Spanish Broadcasting Systems, Inc.(b)(d) |
| | | | 2,994 | | | | 10.750 | | | | 10/15/13 | | | | 1,047,900 | |
| | | |
| | | |
| | | TOTAL PREFERRED STOCKS |
| | | (Cost $6,866,180) | | $ | 1,605,660 | |
| | | |
| | | |
| | | | | | | | | | | |
| | | Shares | | | Description | | Value | |
| |
Common Stocks – 0.2% |
| | | | | | | | | | | |
| | | | | | | | | | | |
| | | | 1,996,917 | | | Adelphia Recovery Trust Series ACC-1* | | $ | 39,938 | |
| | | | 24,334 | | | Axiohm Transaction Solutions, Inc.* | | | 243 | |
| | | | 195,700 | | | Huntsman Corp. | | | 2,465,820 | |
| | | | 8,366 | | | iPCS, Inc.* | | | 186,311 | |
| | | | 1,656 | | | Nycomed* | | | 23 | |
| | | | 567,500 | | | Parmalat SpA(a) | | | 1,323,240 | |
| | | | 351 | | | Pliant Corp.* | | | 4 | |
| | | | 33,975 | | | Polymer Group, Inc.* | | | 373,725 | |
| | | | 2,500 | | | Port Townsend Holdings Co., Inc.* | | | 912,500 | |
| | | | 20,372 | | | Smurfit Kappa Funding PLC* | | | 87,760 | |
| | | | 410 | | | Time Warner Cable, Inc. | | | 9,922 | |
| | | | 103,389 | | | Viasystems Group, Inc.* | | | 1,033,890 | |
| | | | 1,051 | | | Zemex Minerals Group, Inc.* | | | — | |
| | | |
| | | |
| | | TOTAL COMMON STOCKS |
| | | (Cost $13,661,058) | | $ | 6,433,376 | |
| | | |
| | | |
The accompanying notes are an integral part of these financial statements.
GOLDMAN SACHS HIGH YIELD FUND
| | | | | | | | | | | | | |
| | | | | Expiration
| | |
| | | Units | | Date | | Value |
| |
Warrants(f)* – 0.0% |
| | | | | | | | | | | | | |
| | | | | | | | | | | | | |
| | | APP China Group Ltd. |
| | | | 2,731 | | | | 03/15/10 | | | $ | — | |
| | | Avecia Group PLC (Ordinary)(a) |
| | | | 40,000 | | | | 07/01/10 | | | | 400 | |
| | | Avecia Group PLC (Preferred)(a) |
| | | | 40,000 | | | | 01/01/10 | | | | 400 | |
| | | Merrill Corp. Class A(a) |
| | | | 1,500 | | | | 05/01/09 | | | | 15 | |
| | | Parmalat SpA(a) |
| | | | 650 | | | | 12/31/15 | | | | 1,519 | |
| | | |
| | | |
| | | TOTAL WARRANTS |
| | | (Cost $1,028,072) | | $ | 2,334 | |
| | | |
| | | |
| | | | | | | | | | | | | |
| | | Shares | | Description | | Value |
| |
Special Purpose Entity* – 0.0% |
| | | | | | | | | | | | | |
| | | | | | | | | | | | | |
| | | | 526,991 | | | | Adelphia Recovery Trust | | | | | |
| | | (Cost $63,727) | | $ | 73,779 | |
| | | |
| | | |
| | | TOTAL INVESTMENTS BEFORE REPURCHASE AGREEMENT – 83.3% |
| | | (Cost $3,883,976,203) | | $ | 3,113,394,524 | |
| | | |
| | | |
| | | | | | | | | | | | | | | | | |
| | | Principal
| | Interest
| | Maturity
| | |
| | | Amount | | Rate | | Date | | Value |
| |
Repurchase Agreement(g) – 10.6% |
| | | | | | | | | | | | | | | | | |
| | | | | | | | | | | | | | | | | |
| | | Joint Repurchase Agreement Account II |
| | | $ | 396,100,000 | | | | 1.944 | % | | | 10/01/08 | | | $ | 396,100,000 | |
| | | Maturity Value: $396,121,389 |
| | | (Cost $396,100,000) | | | | |
| | | |
| | | |
| | | TOTAL INVESTMENTS – 93.9% |
| | | (Cost $4,280,076,203) | | $ | 3,509,494,524 | |
| | | |
| | | |
| | | OTHER ASSETS IN EXCESS OF LIABILITIES – 6.1% | | | 227,945,124 | |
| | | |
| | | |
| | | NET ASSETS – 100.0% | | $ | 3,737,439,648 | |
| | | |
| | | |
The percentage shown for each investment category reflects the value of investments in that category as a percentage of net assets.
| | |
| * | | Non-income producing security. |
| |
| (a) | | Securities are exempt from registration under Rule 144A of the Securities Act of 1933. Under procedures approved by the Board of Trustees, such securities have been determined to be liquid by the Investment Adviser and may be resold, normally to qualified institutional buyers in transactions exempt from registration. Total market value of Rule 144A securities amounts to $384,457,560, which represents approximately 10.3% of net assets as of September 30, 2008. |
| |
| (b) | | Pay-in-kind securities. |
| |
| (c) | | Variable rate security. Interest rate disclosed is that which is in effect at September 30, 2008. |
| |
| (d) | | Securities with “Put” features with resetting interest rates. Maturity dates disclosed are the final maturity dates. |
| |
| (e) | | These securities are issued with a zero coupon or interest rate which increases to the stated rate at a set date in the future. |
| |
| (f) | | Security is currently in default/non-income producing. |
| |
| (g) | | Joint repurchase agreement was entered into on September 30, 2008. Additional information appears on page 63. |
Security ratings disclosed, if any, are issued by Standard & Poor’s/Moody’s Investors Service. A brief description of the ratings is available in the Fund’s Statement of Additional Information.
The accompanying notes are an integral part of these financial statements.
GOLDMAN SACHS HIGH YIELD FUND
Schedule of Investments (continued)
September 30, 2008 (Unaudited)
| | | | | | | |
| | | | | As a % of
| |
| | | | | Net Assets | |
| |
Investments Industry Classifications† |
| | | | | | | |
| | | | | | | |
| | | Aerospace | | | 0.7 | % |
| | | Agriculture | | | 0.6 | |
| | | Automotive | | | 3.2 | |
| | | Building Materials | | | 2.7 | |
| | | Capital Goods | | | 2.4 | |
| | | Chemicals | | | 3.9 | |
| | | Conglomerates | | | 1.2 | |
| | | Consumer Products | | | 4.6 | |
| | | Defense | | | 1.1 | |
| | | Energy | | | 4.5 | |
| | | Entertainment & Leisure | | | 0.6 | |
| | | Environmental | | | 1.1 | |
| | | Finance | | | 1.3 | |
| | | Food | | | 1.5 | |
| | | Gaming | | | 4.9 | |
| | | Health Care | | | 7.0 | |
| | | Home Construction | | | 0.4 | |
| | | Lodging | | | 0.6 | |
| | | Machinery | | | 0.3 | |
| | | Media | | | 6.6 | |
| | | Metals | | | 1.8 | |
| | | Packaging | | | 3.6 | |
| | | Paper | | | 2.1 | |
| | | Printing | | | 0.2 | |
| | | Publishing | | | 2.5 | |
| | | Real Estate | | | 0.3 | |
| | | Restaurants | | | 0.5 | |
| | | Retailers | | | 1.9 | |
| | | Services Cyclical | | | 3.3 | |
| | | Short-term Investments# | | | 16.7 | |
| | | Technology | | | 4.4 | |
| | | Telecommunications | | | 6.6 | |
| | | Textiles & Apparel | | | 0.3 | |
| | | Tobacco | | | 0.1 | |
| | | Transportation | | | 0.1 | |
| | | Utilities | | | 6.4 | |
| | | |
| | | |
| | | TOTAL INVESTMENTS | | | 100.0 | % |
| | | |
| | | |
| | |
| † | | Industry concentrations greater than one-tenth of one percent are disclosed. |
| |
| # | | Short-term investments include repurchase agreements and other assets/liabilities. |
The accompanying notes are an integral part of these financial statements.
GOLDMAN SACHS HIGH YIELD FUND
ADDITIONAL INVESTMENT INFORMATION
FORWARD FOREIGN CURRENCY CONTRACTS — At September 30, 2008, the Fund had outstanding forward foreign currency exchange contracts, both to purchase and sell foreign currencies:
| | | | | | | | | | | | | | | | | |
Open Forward Foreign Currency
| | Contract
| | Expiration
| | Value on
| | | Current
| | | Unrealized
| |
| Contracts with Unrealized Gain | | Type | | Date | | Settlement Date | | | Value | | | Gain | |
| | |
| British Pound | | Sale | | 11/14/08 | | $ | 16,421,945 | | | $ | 15,511,261 | | | $ | 910,684 | |
| Euro | | Sale | | 11/14/08 | | | 636,319,243 | | | | 606,941,520 | | | | 29,377,723 | |
| |
| |
TOTAL | | | | | | | | | | | | | | $ | 30,288,407 | |
| |
| |
| | | | | | | | | | | | | |
Open Forward Foreign Currency
| | Contract
| | Expiration
| | Value on
| | | Current
| | Unrealized
|
| Contracts with Unrealized Loss | | Type | | Date | | Settlement Date | | | Value | | Loss |
| |
| Euro | | Purchase | | 11/14/08 | | $ | 42,538,166 | | | $41,714,861 | | $(823,305) |
| |
| |
The accompanying notes are an integral part of these financial statements.
GOLDMAN SACHS INVESTMENT GRADE CREDIT FUND
Schedule of Investments
September 30, 2008 (Unaudited)
| | | | | | | | | | | | | | | | | |
| | | Principal
| | Interest
| | Maturity
| | |
| | | Amount | | Rate | | Date | | Value |
| |
Corporate Bonds – 81.9% |
| | | | | | | | | | | | | | | | | |
| | | | | | | | | | | | | | | | | |
| | | Automotive – 0.6% |
| | | Ford Motor Credit Co. LLC |
| | | $ | 1,700,000 | | | | 5.700 | % | | | 01/15/10 | | | $ | 1,305,183 | |
| | | |
| | | |
| | | Banks – 14.0% |
| | | ANZ Capital Trust I(a)(b) |
| | | | 1,725,000 | | | | 4.484 | | | | 12/15/49 | | | | 1,680,633 | |
| | | ANZ Capital Trust II(a)(b) |
| | | | 800,000 | | | | 5.360 | | | | 12/29/49 | | | | 714,416 | |
| | | Astoria Financial Corp.(b) |
| | | | 225,000 | | | | 5.750 | | | | 10/15/12 | | | | 193,957 | |
| | | Banca Popolare di Bergamo Capital Trust(b)(c) |
| | | | EUR 475,000 | | | | 8.364 | | | | 02/15/49 | | | | 638,948 | |
| | | Bank of America Corp. |
| | | $ | 5,000,000 | | | | 5.420 | | | | 03/15/17 | | | | 3,980,010 | |
| | | Citigroup, Inc. |
| | | | 1,750,000 | | | | 5.500 | | | | 04/11/13 | | | | 1,527,507 | |
| | | | 2,525,000 | | | | 6.875 | | | | 03/05/38 | | | | 2,071,341 | |
| | | HBOS PLC(a)(b)(c) |
| | | | 1,750,000 | | | | 5.375 | | | | 11/01/49 | | | | 1,082,672 | |
| | | HSBC Capital Funding LP(a)(b)(c) |
| | | | 1,050,000 | | | | 4.610 | | | | 06/27/49 | | | | 826,126 | |
| | | ING Capital Funding Trust III(b)(c) |
| | | | 1,075,000 | | | | 8.439 | | | | 12/31/49 | | | | 991,268 | |
| | | JPMorgan Chase & Co.(b)(c) |
| | | | 1,225,000 | | | | 7.900 | | | | 04/30/49 | | | | 1,031,303 | |
| | | JPMorgan Chase Capital Co. Series T(b) |
| | | | 1,650,000 | | | | 6.550 | | | | 09/29/36 | | | | 1,213,217 | |
| | | Manufacturers & Traders Trust Co.(b)(c) |
| | | | 1,495,000 | | | | 5.585 | | | | 12/28/20 | | | | 1,146,655 | |
| | | MUFG Capital Finance 1 Ltd.(b)(c) |
| | | | 3,025,000 | | | | 6.346 | | | | 07/25/49 | | | | 2,132,332 | |
| | | Nordea Bank Sweden AB(a)(b)(c) |
| | | | 2,380,000 | | | | 8.950 | | | | 11/29/49 | | | | 2,146,213 | |
| | | Northern Trust Co. |
| | | | 1,625,000 | | | | 6.500 | | | | 08/15/18 | | | | 1,656,809 | |
| | | PNC Bank NA |
| | | | 1,000,000 | | | | 4.875 | | | | 09/21/17 | | | | 835,451 | |
| | | | 850,000 | | | | 6.000 | | | | 12/07/17 | | | | 770,477 | |
| | | RBS Capital Trust II(b)(c) |
| | | | 1,000,000 | | | | 5.512 | | | | 09/30/49 | | | | 690,334 | |
| | | Resona Bank Ltd.(a)(b)(c) |
| | | | 1,475,000 | | | | 5.850 | | | | 04/15/49 | | | | 1,084,839 | |
| | | Resona Preferred Global Securities Ltd.(a)(b)(c) |
| | | | 3,475,000 | | | | 7.191 | | | | 07/30/49 | | | | 2,579,809 | |
| | | Royal Bank of Scotland Group PLC(b)(c) |
| | | | 2,425,000 | | | | 9.118 | | | | 03/31/49 | | | | 2,351,474 | |
| | | Santander Issuances SA Unipersonal(a)(b)(c) |
| | | | 700,000 | | | | 5.805 | | | | 06/20/16 | | | | 671,650 | |
| | | Sovereign Bank(b)(c) |
| | | | 455,000 | | | | 4.511 | | | | 08/01/13 | | | | 333,069 | |
| | | Sumitomo Mitsui Banking Corp.(a)(b)(c) |
| | | | 450,000 | | | | 5.625 | | | | 10/15/49 | | | | 359,495 | |
| | | Unicredito Italiano Capital Trust II(a)(b)(c) |
| | | | 500,000 | | | | 9.200 | | | | 10/05/49 | | | | 479,190 | |
| | | | | | | | | | | | | | | | | |
| | | | | | | | | | | | | | | | 33,189,195 | |
| | | |
| | | |
| | | Brokerage – 4.7% |
| | | Bear Stearns Cos., Inc. |
| | | | 5,600,000 | | | | 6.400 | | | | 10/02/17 | | | | 5,139,885 | |
| | | | 925,000 | | | | 7.250 | | | | 02/01/18 | | | | 889,738 | |
| | | Merrill Lynch & Co., Inc. |
| | | | 1,200,000 | | | | 6.400 | | | | 08/28/17 | | | | 1,022,519 | |
| | | Morgan Stanley(b) |
| | | | 1,225,000 | | | | 6.625 | | | | 04/01/18 | | | | 820,750 | |
| | | Morgan Stanley & Co.(b) |
| | | | 5,100,000 | | | | 6.250 | | | | 08/28/17 | | | | 3,162,209 | |
| | | | | | | | | | | | | | | | | |
| | | | | | | | | | | | | | | | 11,035,101 | |
| | | |
| | | |
| | | Captive Auto – 0.2% |
| | | General Motors Acceptance Corp. |
| | | | 1,275,000 | | | | 6.875 | | | | 09/15/11 | | | | 573,750 | |
| | | |
| | | |
| | | Captive Financial(b) – 0.7% |
| | | Nelnet, Inc. |
| | | | 1,760,000 | | | | 5.125 | | | | 06/01/10 | | | | 1,631,178 | |
| | | |
| | | |
| | | Distributor(a)(b) – 0.4% |
| | | Southern Star Central Gas Pipeline, Inc. |
| | | | 1,100,000 | | | | 6.000 | | | | 06/01/16 | | | | 997,447 | |
| | | |
| | | |
| | | Diversified Manufacturing(a)(b) – 0.8% |
| | | Tyco International Group SA |
| | | | 2,000,000 | | | | 6.875 | | | | 01/15/21 | | | | 1,908,500 | |
| | | |
| | | |
| | | Electric(b) – 3.3% |
| | | Arizona Public Service Co. |
| | | | 500,000 | | | | 6.250 | | | | 08/01/16 | | | | 471,114 | |
| | | Commonwealth Edison Co. |
| | | | 1,475,000 | | | | 6.150 | | | | 09/15/17 | | | | 1,394,922 | |
| | | | 1,025,000 | | | | 5.900 | | | | 03/15/36 | | | | 824,877 | |
| | | MidAmerican Energy Holdings Co. |
| | | | 2,475,000 | | | | 5.750 | | | | 04/01/18 | | | | 2,283,163 | |
| | | NiSource Finance Corp.(c) |
| | | | 500,000 | | | | 3.381 | | | | 11/23/09 | | | | 487,234 | |
| | | Progress Energy, Inc. |
| | | | 1,000,000 | | | | 7.000 | | | | 10/30/31 | | | | 955,558 | |
| | | Public Service Co. of Oklahoma Series G |
| | | | 1,650,000 | | | | 6.625 | | | | 11/15/37 | | | | 1,453,927 | |
| | | | | | | | | | | | | | | | | |
| | | | | | | | | | | | | | | | 7,870,795 | |
| | | |
| | | |
| | | Energy(b) – 4.6% |
| | | EnCana Corp. |
| | | | 2,325,000 | | | | 6.500 | | | | 02/01/38 | | | | 1,875,819 | |
| | | Kerr-McGee Corp. |
| | | | 3,000,000 | | | | 6.950 | | | | 07/01/24 | | | | 2,835,885 | |
| | | Petro-Canada |
| | | | 725,000 | | | | 6.050 | | | | 05/15/18 | | | | 632,860 | |
| | | Transocean, Inc. |
| | | | 1,175,000 | | | | 6.000 | | | | 03/15/18 | | | | 1,096,623 | |
| | | Valero Energy Corp. |
| | | | 2,600,000 | | | | 6.125 | | | | 06/15/17 | | | | 2,433,629 | |
| | | XTO Energy, Inc. |
| | | | 2,350,000 | | | | 6.750 | | | | 08/01/37 | | | | 2,085,195 | |
| | | | | | | | | | | | | | | | | |
| | | | | | | | | | | | | | | | 10,960,011 | |
| | | |
| | | |
The accompanying notes are an integral part of these financial statements.
GOLDMAN SACHS INVESTMENT GRADE CREDIT FUND
| | | | | | | | | | | | | | | | | |
| | | Principal
| | Interest
| | Maturity
| | |
| | | Amount | | Rate | | Date | | Value |
| |
Corporate Bonds – (continued) |
| | | Energy(b) – (continued) |
| | | | | | | | | | | | | | | | | |
| | | Entertainment – 0.5% |
| | | Time Warner Entertainment Co. |
| | | $ | 1,290,000 | | | | 8.375 | % | | | 03/15/23 | | | $ | 1,255,396 | |
| | | |
| | | |
| | | Food & Beverage – 0.8% |
| | | Cargill, Inc.(a)(b) |
| | | | 1,250,000 | | | | 6.000 | | | | 11/27/17 | | | | 1,176,083 | |
| | | Kraft Foods, Inc. |
| | | | 750,000 | | | | 6.500 | | | | 08/11/17 | | | | 721,652 | |
| | | | | | | | | | | | | | | | | |
| | | | | | | | | | | | | | | | 1,897,735 | |
| | | |
| | | |
| | | Gaming(b) – 0.2% |
| | | Harrah’s Operating Co., Inc. |
| | | | 500,000 | | | | 5.500 | | | | 07/01/10 | | | | 385,000 | |
| | | |
| | | |
| | | Life Insurance – 6.1% |
| | | Americo Life, Inc.(a)(b) |
| | | | 550,000 | | | | 7.875 | | | | 05/01/13 | | | | 544,814 | |
| | | AXA Financial, Inc.(b) |
| | | | 805,000 | | | | 7.750 | | | | 08/01/10 | | | | 843,358 | |
| | | AXA SA(a)(b)(c) |
| | | | 550,000 | | | | 6.463 | | | | 12/31/49 | | | | 314,118 | |
| | | Lincoln National Corp.(b)(c) |
| | | | 1,600,000 | | | | 7.000 | | | | 05/17/66 | | | | 1,341,680 | |
| | | MetLife Capital Trust X(a)(b)(c) |
| | | | 600,000 | | | | 9.250 | | | | 04/08/38 | | | | 569,519 | |
| | | Nationwide Life Global Funding I(a) |
| | | | 2,450,000 | | | | 5.450 | | | | 10/02/12 | | | | 2,453,442 | |
| | | Phoenix Life Insurance Co.(a)(b) |
| | | | 2,600,000 | | | | 7.150 | | | | 12/15/34 | | | | 2,481,598 | |
| | | Reinsurance Group of America, Inc. |
| | | | 625,000 | | | | 6.750 | | | | 12/15/11 | | | | 601,829 | |
| | | | 2,250,000 | | | | 6.750 | (b)(c) | | | 12/15/65 | | | | 1,565,415 | |
| | | SL Finance PLC(b)(c) |
| | | | EUR 650,000 | | | | 6.375 | | | | 07/12/22 | | | | 823,106 | |
| | | Symetra Financial Corp.(a)(b) |
| | | $ | 1,600,000 | | | | 6.125 | | | | 04/01/16 | | | | 1,289,192 | |
| | | | 725,000 | | | | 8.300 | (c) | | | 10/15/37 | | | | 501,705 | |
| | | The MONY Group, Inc.(b) |
| | | | 1,000,000 | | | | 8.350 | | | | 03/15/10 | | | | 1,050,136 | |
| | | | | | | | | | | | | | | | | |
| | | | | | | | | | | | | | | | 14,379,912 | |
| | | |
| | | |
| | | Media – Cable – 3.9% |
| | | British Sky Broadcasting Group PLC(a)(b) |
| | | | 1,975,000 | | | | 6.100 | | | | 02/15/18 | | | | 1,892,682 | |
| | | Comcast Cable Communications Holdings, Inc. |
| | | | 2,200,000 | | | | 8.375 | | | | 03/15/13 | | | | 2,307,338 | |
| | | | 1,350,000 | | | | 9.455 | | | | 11/15/22 | | | | 1,495,510 | |
| | | Rogers Communications, Inc.(b) |
| | | | 2,500,000 | | | | 6.800 | | | | 08/15/18 | | | | 2,365,075 | |
| | | Time Warner Cable, Inc.(b) |
| | | | 1,300,000 | | | | 5.400 | | | | 07/02/12 | | | | 1,236,581 | |
| | | | | | | | | | | | | | | | | |
| | | | | | | | | | | | | | | | 9,297,186 | |
| | | |
| | | |
| | | Media – Non Cable(b) – 1.3% |
| | | News America, Inc. |
| | | | 2,450,000 | | | | 6.650 | | | | 11/15/37 | | | | 2,101,714 | |
| | | Thomson Reuters Corp. |
| | | | 1,025,000 | | | | 6.500 | | | | 07/15/18 | | | | 980,272 | |
| | | | | | | | | | | | | | | | | |
| | | | | | | | | | | | | | | | 3,081,986 | |
| | | |
| | | |
| | | Metals & Mining(b) – 1.7% |
| | | ArcelorMittal(a) |
| | | | 1,925,000 | | | | 6.125 | | | | 06/01/18 | | | | 1,705,764 | |
| | | Inco Ltd. |
| | | | 2,050,000 | | | | 5.700 | | | | 10/15/15 | | | | 1,852,915 | |
| | | Xstrata Canada Corp. |
| | | | 500,000 | | | | 7.250 | | | | 07/15/12 | | | | 511,796 | |
| | | | | | | | | | | | | | | | | |
| | | | | | | | | | | | | | | | 4,070,475 | |
| | | |
| | | |
| | | Noncaptive – Financial – 4.7% |
| | | American General Finance Corp.(d) |
| | | | 1,225,000 | | | | 8.450 | | | | 10/15/09 | | | | 857,133 | |
| | | Countrywide Home Loans, Inc. |
| | | | 3,025,000 | | | | 5.625 | | | | 07/15/09 | | | | 2,860,830 | |
| | | | 954,000 | | | | 4.125 | | | | 09/15/09 | | | | 891,990 | |
| | | GATX Financial Corp.(b) |
| | | | 3,400,000 | | | | 5.125 | | | | 04/15/10 | | | | 3,426,574 | |
| | | Nelnet, Inc.(b)(c) |
| | | | 625,000 | | | | 7.400 | | | | 09/29/36 | | | | 426,299 | |
| | | PHH Corp.(b) |
| | | | 750,000 | | | | 7.125 | | | | 03/01/13 | | | | 683,760 | |
| | | SLM Corp. |
| | | | 2,750,000 | | | | 5.400 | | | | 10/25/11 | | | | 1,925,000 | |
| �� | | | | | | | | | | | | | | | | |
| | | | | | | | | | | | | | | | 11,071,586 | |
| | | |
| | | |
| | | Pipelines(b) – 6.2% |
| | | Energy Transfer Partners LP |
| | | | 6,652,000 | | | | 5.950 | | | | 02/01/15 | | | | 6,155,838 | |
| | | Enterprise Products Operating LP |
| | | | 2,350,000 | | | | 5.600 | | | | 10/15/14 | | | | 2,186,740 | |
| | | | 275,000 | | | | 5.000 | | | | 03/01/15 | | | | 245,225 | |
| | | Gulf South Pipeline Co. LP(a) |
| | | | 1,900,000 | | | | 6.300 | | | | 08/15/17 | | | | 1,821,484 | |
| | | ONEOK Partners LP |
| | | | 1,400,000 | | | | 6.150 | | | | 10/01/16 | | | | 1,321,943 | |
| | | Southern Natural Gas Co.(a) |
| | | | 700,000 | | | | 5.900 | | | | 04/01/17 | | | | 617,423 | |
| | | Tennessee Gas Pipeline Co. |
| | | | 1,150,000 | | | | 8.375 | | | | 06/15/32 | | | | 1,207,647 | |
| | | TransCanada PipeLines Ltd.(c) |
| | | | 1,500,000 | | | | 6.350 | | | | 05/15/67 | | | | 1,186,623 | |
| | | | | | | | | | | | | | | | | |
| | | | | | | | | | | | | | | | 14,742,923 | |
| | | |
| | | |
| | | Property/Casualty Insurance – 8.3% |
| | | Ace Capital Trust II(b) |
| | | | 250,000 | | | | 9.700 | | | | 04/01/30 | | | | 253,311 | |
| | | Ace INA Holdings, Inc.(b) |
| | | | 1,500,000 | | | | 6.700 | | | | 05/15/36 | | | | 1,333,863 | |
| | | AON Capital Trust A |
| | | | 900,000 | | | | 8.205 | | | | 01/01/27 | | | | 778,595 | |
| | | |
| | | |
The accompanying notes are an integral part of these financial statements.
GOLDMAN SACHS INVESTMENT GRADE CREDIT FUND
Schedule of Investments (continued)
September 30, 2008 (Unaudited)
| | | | | | | | | | | | | | | | | |
| | | Principal
| | Interest
| | Maturity
| | |
| | | Amount | | Rate | | Date | | Value |
| |
Corporate Bonds – (continued) |
| | | Property/Casualty Insurance – (continued) |
| | | | | | | | | | | | | | | | | |
| | | Arch Capital Group Ltd.(b) |
| | | $ | 1,245,000 | | | | 7.350 | % | | | 05/01/34 | | | $ | 1,251,502 | |
| | | Aspen Insurance Holdings Ltd.(b) |
| | | | 1,025,000 | | | | 6.000 | | | | 08/15/14 | | | | 935,753 | |
| | | Catlin Insurance Co. Ltd.(a)(b)(c) |
| | | | 1,050,000 | | | | 7.249 | | | | 01/19/49 | | | | 468,730 | |
| | | CNA Financial Corp.(b) |
| | | | 1,000,000 | | | | 5.850 | | | | 12/15/14 | | | | 950,931 | |
| | | Endurance Specialty Holdings Ltd.(b) |
| | | | 1,100,000 | | | | 6.150 | | | | 10/15/15 | | | | 921,284 | |
| | | | 1,350,000 | | | | 7.000 | | | | 07/15/34 | | | | 1,202,835 | |
| | | Everest Reinsurance Holdings, Inc.(b)(c) |
| | | | 1,500,000 | | | | 6.600 | | | | 05/15/37 | | | | 876,699 | |
| | | Marsh & McLennan Cos., Inc.(b) |
| | | | 1,000,000 | | | | 5.150 | | | | 09/15/10 | | | | 998,288 | |
| | | PartnerRe Finance(b)(c) |
| | | | 175,000 | | | | 6.440 | | | | 12/01/66 | | | | 122,824 | |
| | | QBE Capital Funding II LP(a)(b)(c) |
| | | | 925,000 | | | | 6.797 | | | | 06/01/49 | | | | 738,490 | |
| | | QBE Insurance Group Ltd.(a)(b)(c) |
| | | | 855,000 | | | | 5.647 | | | | 07/01/23 | | | | 852,144 | |
| | | Swiss Re Capital I LP(a)(b)(c) |
| | | | 2,475,000 | | | | 6.854 | | | | 05/29/49 | | | | 2,103,468 | |
| | | The Chubb Corp.(b)(c) |
| | | | 1,625,000 | | | | 6.375 | | | | 03/29/67 | | | | 1,285,470 | |
| | | The Travelers Cos., Inc.(b)(c) |
| | | | 1,300,000 | | | | 6.250 | | | | 03/15/37 | | | | 999,874 | |
| | | White Mountains Reinsurance Group Ltd.(a)(b) |
| | | | 1,725,000 | | | | 6.375 | | | | 03/20/17 | | | | 1,547,385 | |
| | | ZFS Finance USA Trust I(a)(b)(c) |
| | | | 1,375,000 | | | | 6.150 | | | | 12/15/65 | | | | 998,553 | |
| | | ZFS Finance USA Trust II(a)(b)(c) |
| | | | 1,275,000 | | | | 6.450 | | | | 12/15/65 | | | | 918,009 | |
| | | | | | | | | | | | | | | | | |
| | | | | | | | | | | | | | | | 19,538,008 | |
| | | |
| | | |
| | | Real Estate Investment Trusts – 11.7% |
| | | Arden Realty LP(b)(e) |
| | | | 1,160,000 | | | | 5.200 | | | | 09/01/11 | | | | 1,114,161 | |
| | | BRE Properties, Inc.(b) |
| | | | 3,525,000 | | | | 7.450 | | | | 01/15/11 | | | | 3,552,541 | |
| | | Camden Property Trust(b) |
| | | | 1,650,000 | | | | 4.375 | | | | 01/15/10 | | | | 1,599,432 | |
| | | Colonial Realty LP(b) |
| | | | 1,750,000 | | | | 6.050 | | | | 09/01/16 | | | | 1,467,989 | |
| | | Health Care Property Investors, Inc.(b) |
| | | | 1,825,000 | | | | 5.950 | | | | 09/15/11 | | | | 1,722,296 | |
| | | Highwoods Properties, Inc.(b) |
| | | | 2,925,000 | | | | 5.850 | | | | 03/15/17 | | | | 2,346,298 | |
| | | Hospitality Properties Trust(b) |
| | | | 775,000 | | | | 6.700 | | | | 01/15/18 | | | | 609,007 | |
| | | iStar Financial, Inc. Series B(b) |
| | | | 2,950,000 | | | | 5.700 | | | | 03/01/14 | | | | 1,445,500 | |
| | | Liberty Property LP(b) |
| | | | 225,000 | | | | 7.750 | | | | 04/15/09 | | | | 224,760 | |
| | | Pan Pacific Retail Properties, Inc.(b) |
| | | | 1,350,000 | | | | 5.950 | | | | 06/01/14 | | | | 1,301,971 | |
| | | |
| | | |
| | | Post Apartment Homes LP |
| | | | 1,500,000 | | | | 7.700 | | | | 12/20/10 | | | | 1,550,540 | |
| | | | 3,000,000 | | | | 6.300 | (b) | | | 06/01/13 | | | | 2,918,865 | |
| | | ProLogis(b) |
| | | | 2,250,000 | | | | 5.500 | | | | 04/01/12 | | | | 2,157,523 | |
| | | Shurgard Storage Centers, Inc.(b) |
| | | | 2,050,000 | | | | 7.750 | | | | 02/22/11 | | | | 2,142,549 | |
| | | Simon Property Group LP(b) |
| | | | 1,000,000 | | | | 5.600 | | | | 09/01/11 | | | | 987,283 | |
| | | | 1,350,000 | | | | 6.125 | | | | 05/30/18 | | | | 1,195,831 | |
| | | WEA Finance LLC(a)(b) |
| | | | 1,625,000 | | | | 7.125 | | | | 04/15/18 | | | | 1,460,882 | |
| | | | | | | | | | | | | | | | | |
| | | | | | | | | | | | | | | | 27,797,428 | |
| | | |
| | | |
| | | Restaurants(b) – 0.5% |
| | | Darden Restaurants, Inc. |
| | | | 1,225,000 | | | | 5.625 | | | | 10/15/12 | | | | 1,154,375 | |
| | | |
| | | |
| | | Retailers(b) – 0.3% |
| | | CVS Caremark Corp. |
| | | | 800,000 | | | | 6.250 | | | | 06/01/27 | | | | 720,278 | |
| | | |
| | | |
| | | Software(b) – 0.4% |
| | | Sabre Holdings Corp. |
| | | | 1,300,000 | | | | 6.350 | | | | 03/15/16 | | | | 832,000 | |
| | | |
| | | |
| | | Technology(b) – 0.9% |
| | | Computer Sciences Corp.(a) |
| | | | 475,000 | | | | 6.500 | | | | 03/15/18 | | | | 456,226 | |
| | | Fiserv, Inc. |
| | | | 1,775,000 | | | | 6.125 | | | | 11/20/12 | | | | 1,745,821 | |
| | | | | | | | | | | | | | | | | |
| | | | | | | | | | | | | | | | 2,202,047 | |
| | | |
| | | |
| | | Tobacco – 1.2% |
| | | Imperial Tobacco Overseas BV |
| | | | 1,200,000 | | | | 7.125 | | | | 04/01/09 | | | | 1,199,669 | |
| | | Philip Morris International, Inc. |
| | | | 1,800,000 | | | | 5.650 | | | | 05/16/18 | | | | 1,663,801 | |
| | | | | | | | | | | | | | | | | |
| | | | | | | | | | | | | | | | 2,863,470 | |
| | | |
| | | |
| | | Wireless Telecommunications(b) – 1.4% |
| | | AT&T Wireless Services, Inc. |
| | | | 900,000 | | | | 8.750 | | | | 03/01/31 | | | | 959,564 | |
| | | AT&T, Inc. |
| | | | 1,175,000 | | | | 6.400 | | | | 05/15/38 | | | | 986,083 | |
| | | Sprint Capital Corp. |
| | | | 1,500,000 | | | | 7.625 | | | | 01/30/11 | | | | 1,429,387 | |
| | | | | | | | | | | | | | | | | |
| | | | | | | | | | | | | | | | 3,375,034 | |
| | | |
| | | |
| | | Wirelines Telecommunications – 2.5% |
| | | Deutsche Telekom International Finance BV |
| | | | 1,650,000 | | | | 8.750 | | | | 06/15/30 | | | | 1,673,162 | |
| | | Telecom Italia Capital(b) |
| | | | 1,700,000 | | | | 4.950 | | | | 09/30/14 | | | | 1,440,274 | |
| | | |
| | | |
The accompanying notes are an integral part of these financial statements.
GOLDMAN SACHS INVESTMENT GRADE CREDIT FUND
| | | | | | | | | | | | | | | | | |
| | | Principal
| | Interest
| | Maturity
| | |
| | | Amount | | Rate | | Date | | Value |
| |
Corporate Bonds – (continued) |
| | | Wirelines Telecommunications – (continued) |
| | | | | | | | | | | | | | | | | |
| | | Verizon Communications, Inc.(b) |
| | | $ | 3,125,000 | | | | 6.100 | % | | | 04/15/18 | | | $ | 2,904,630 | |
| | | | | | | | | | | | | | | | | |
| | | | | | | | | | | | | | | | 6,018,066 | |
| | | |
| | | |
| | | TOTAL CORPORATE BONDS |
| | | (Cost $224,793,000) | | $ | 194,154,065 | |
| | | |
| | | |
| | | | | | | | | | | | | | | | | |
| | | | | | | | | | | | | | | | | |
Mortgage-Backed Obligations – 12.8% |
| | | | | | | | | | | | | | | | | |
| | | | | | | | | | | | | | | | | |
| | | Collateralized Mortgage Obligations – 3.6% |
| | | Countrywide Alternative Loan Trust Series 2007-06, Class A4 |
| | | $ | 1,200,000 | | | | 5.750 | % | | | 04/25/47 | | | $ | 735,598 | |
| | | Countrywide Alternative Loan Trust Series 2007-15CB, Class A5 |
| | | | 2,667,171 | | | | 5.750 | | | | 07/25/37 | | | | 1,614,108 | |
| | | Countrywide Alternative Loan Trust Series 2007-16CB, Class 4A7 |
| | | | 2,122,047 | | | | 6.000 | | | | 08/25/37 | | | | 1,367,807 | |
| | | Residential Asset Securitization Trust Series 2007-06, Class 1A3 |
| | | | 1,813,203 | | | | 6.000 | | | | 04/25/37 | | | | 910,030 | |
| | | Structured Adjustable Rate Mortgage Loan Trust Series 2005-21, Class 7A1(c) |
| | | | 2,387,731 | | | | 6.011 | | | | 11/25/35 | | | | 1,654,285 | |
| | | Washington Mutual Pass-Through Certificates Series 2005-AR15, Class A1A1(c) |
| | | | 1,728,319 | | | | 3.467 | | | | 11/25/45 | | | | 1,106,700 | |
| | | Wells Fargo Alternative Loan Trust Series 2007-PA2, Class 1A1 |
| | | | 1,761,497 | | | | 6.000 | | | | 06/25/37 | | | | 1,202,016 | |
| | | | | | | | | | | | | | | | | |
| | | | | | | | | | | | | | | | 8,590,544 | |
| | | |
| | | |
| | | Federal Agencies – 9.2% |
| | | FNMA – 9.2% |
| | | | 470,454 | | | | 4.500 | | | | 10/01/18 | | | | 463,536 | |
| | | | 103,308 | | | | 4.500 | | | | 11/01/18 | | | | 101,789 | |
| | | | 173,564 | | | | 4.500 | | | | 12/01/18 | | | | 171,011 | |
| | | | 678,603 | | | | 4.500 | | | | 05/01/19 | | | | 666,502 | |
| | | | 338,612 | | | | 4.500 | | | | 06/01/19 | | | | 332,575 | |
| | | | 235,457 | | | | 4.500 | | | | 08/01/19 | | | | 231,258 | |
| | | | 2,375,701 | | | | 6.000 | | | | 02/01/36 | | | | 2,409,030 | |
| | | | 1,624,300 | | | | 6.000 | | | | 10/01/36 | | | | 1,647,088 | |
| | | | 3,847,878 | | | | 6.000 | | | | 05/01/38 | | | | 3,901,645 | |
| | | | 6,000,000 | | | | 5.500 | | | | TBA-15yr | (f) | | | 5,983,128 | |
| | | | 6,000,000 | | | | 4.500 | | | | TBA-15yr | (f) | | | 5,839,998 | |
| | | | | | | | | | | | | | | | | |
| | | | | | | | | | | | | | | | 21,747,560 | |
| | | |
| | | |
| | | TOTAL MORTGAGE-BACKED OBLIGATIONS |
| | | (Cost $32,191,727) | | $ | 30,338,104 | |
| | | |
| | | |
| | | TOTAL INVESTMENTS BEFORE REPURCHASE AGREEMENT – 94.7% |
| | | (Cost $256,984,727) | | $ | 224,492,169 | |
| | | |
| | | |
| | | | | | | | | | | | | | | | | |
| | | | | | | | | | | | | | | | | |
Repurchase Agreement(g) – 8.3% |
| | | | | | | | | | | | | | | | | |
| | | | | | | | | | | | | | | | | |
| | | Joint Repurchase Agreement Account II |
| | | $ | 19,600,000 | | | | 1.944 | % | | | 10/01/08 | | | $ | 19,600,000 | |
| | | Maturity Value: $19,601,058 |
| | | (Cost $19,600,000) | | | | |
| | | |
| | | |
| | | TOTAL INVESTMENTS – 103.0% |
| | | (Cost $276,584,727) | | $ | 244,092,169 | |
| | | |
| | | |
| | | LIABILITIES IN EXCESS OF OTHER ASSETS – (3.0)% | | | (7,083,708 | ) |
| | | |
| | | |
| | | NET ASSETS – 100.0% | | $ | 237,008,461 | |
| | | |
| | | |
The percentage shown for each investment category reflects the value of investments in that category as a percentage of net assets.
| | |
| (a) | | Securities are exempt from registration under Rule 144A of the Securities Act of 1933. Under procedures approved by the Board of Trustees, such securities have been determined to be liquid by the investment adviser and may be resold, normally to qualified institutional buyers in transactions exempt from registration. Total market value of Rule 144A securities amounts to $39,442,701, which represents approximately 16.6% of net assets as of September 30, 2008. |
| |
| (b) | | Securities with “Call” features with resetting interest rates. Maturity dates disclosed are the final maturity dates. |
| |
| (c) | | Variable rate security. Interest rate disclosed is that which is in effect at September 30, 2008. |
| |
| (d) | | Securities with “Put” features with resetting interest rates. Maturity dates disclosed are the final maturity dates. |
| |
| (e) | | A portion of this security is segregated as collateral for initial margin requirement on futures transactions. |
| |
| (f) | | TBA (To Be Announced) Securities are purchased on a forward commitment basis with an approximate principal amount and no defined maturity date. The actual principal and maturity date will be determined upon settlement when the specific mortgage pools are assigned. Total market value of TBA securities (excluding forward sales contracts, if any) amounts to $11,823,126 which represents approximately 5.0% of net assets as of September 30, 2008. |
| |
| (g) | | Joint repurchase agreement was entered into on September 30, 2008. Additional information appears on page 63. |
| | | | | | | |
| | | |
| | | |
| | | Investment Abbreviations: |
| | | FNMA | | — | | Federal National Mortgage Association |
| | | LIBOR | | — | | London Interbank Offered Rate |
| | | |
| | | |
The accompanying notes are an integral part of these financial statements.
GOLDMAN SACHS INVESTMENT GRADE CREDIT FUND
Schedule of Investments (continued)
September 30, 2008 (Unaudited)
ADDITIONAL INVESTMENT INFORMATION
FORWARD FOREIGN CURRENCY CONTRACTS — At September 30, 2008, the Fund had outstanding forward foreign currency exchange contracts to sell foreign currencies:
| | | | | | | | | | | | | | | |
Open Forward Foreign Currency
| | Contract
| | | Expiration
| | Value on
| | | Current
| | Unrealized
|
| Contracts with Unrealized Gain | | Type | | | Date | | Settlement Date | | | Value | | Gain |
| |
| British Pound | | | Sale | | | 11/21/08 | | $ | 485,003 | | | $468,598 | | $16,405 |
| Euro | | | Sale | | | 10/31/08 | | | 2,276,369 | | | 2,194,874 | | 81,495 |
| |
| |
TOTAL | | | | | | | | | | | | | | $97,900 |
| |
| |
FORWARD SALES CONTRACT — At September 30, 2008, the Fund had the following forward sales contract:
| | | | | | | | | | | | | | | | | |
| | | Interest
| | | Maturity
| | | Settlement
| | | Principal
| | |
| Description | | Rate | | | Date | | | Date | | | Amount | | Value |
| |
| FNMA (Proceeds Receivable: $2,028,125) | | | 6.000% | | | | TBA-15yr | (d) | | | 10/14/08 | | | $2,000,000 | | $2,028,125 |
| |
| |
FUTURES CONTRACTS — At September 30, 2008, the following futures contracts were open:
| | | | | | | | | | | | | | | |
| | | Number of
| | | | | | | | | |
| | | Contracts
| | | Settlement
| | Notional
| | | Unrealized
| |
| Type | | Long (Short) | | | Month | | Value | | | Gain (Loss) | |
| | |
| Eurodollars | | | (8 | ) | | December 2008 | | $ | (1,930,900 | ) | | $ | 17,470 | |
| Eurodollars | | | (8 | ) | | March 2009 | | | (1,940,700 | ) | | | 4,346 | |
| Eurodollars | | | (8 | ) | | June 2009 | | | (1,939,200 | ) | | | 1,047 | |
| Eurodollars | | | (13 | ) | | September 2009 | | | (3,148,438 | ) | | | (3,620 | ) |
| Eurodollars | | | (13 | ) | | December 2009 | | | (3,138,200 | ) | | | (1,020 | ) |
| 5 Year Euro-Bond | | | (14 | ) | | December 2008 | | | (2,162,395 | ) | | | (5,952 | ) |
| U.S. Treasury Bonds | | | 82 | | | December 2008 | | | 9,608,094 | | | | (63,100 | ) |
| 2 Year U.S. Treasury Notes | | | 44 | | | December 2008 | | | 9,391,250 | | | | 17,202 | |
| 5 Year U.S. Treasury Notes | | | 127 | | | December 2008 | | | 14,253,766 | | | | (227,631 | ) |
| 10 Year U.S. Treasury Notes | | | (211 | ) | | December 2008 | | | (24,185,875 | ) | | | 353,631 | |
| |
| |
TOTAL | | | | | | | | | | | | $ | 92,373 | |
| |
| |
The accompanying notes are an integral part of these financial statements.
GOLDMAN SACHS INVESTMENT GRADE CREDIT FUND
| |
| ADDITIONAL INVESTMENT INFORMATION (continued) | |
SWAP CONTRACTS — At September 30, 2008, the Fund had outstanding swap contracts with the following terms:
INTEREST RATE SWAP CONTRACTS
| | | | | | | | | | | | | | | | | | | | | |
| | | | | | | | | Rates Exchanged | | | | | | |
| | | Notional
| | | | | | Payments
| | Payments
| | Upfront Payments
| | | | |
| | | Amount
| | | Termination
| | | received by
| | made by
| | made (received)
| | | Unrealized
| |
| Swap Counterparty | | (000s) | | | Date | | | the Fund | | the Fund | | by the Fund | | | Gain (Loss) | |
| | |
| Banc of America Securities LLC | | $ | 8,000 | | | | 09/02/10 | | | 4.309% | | 3 month LIBOR | | $ | — | | | $ | 151,299 | |
| | | | 7,000 | | | | 10/19/15 | | | 4.965 | | 3 month LIBOR | | | — | | | | 397,455 | |
| | | | 500(a) | | | | 12/17/18 | | | 4.750 | | 3 month LIBOR | | | 16,645 | | | | (7,515 | ) |
| | | | 500(a) | | | | 12/17/28 | | | 3 month LIBOR | | 5.000% | | | (26,307 | ) | | | 7,306 | |
| | | | 900(a) | | | | 12/17/28 | | | 5.000 | | 3 month LIBOR | | | (15,199 | ) | | | 49,400 | |
| | | | 4,000 | | | | 03/19/35 | | | 5.288 | | 3 month LIBOR | | | — | | | | 364,305 | |
| | | | 2,800 | | | | 04/09/35 | | | 5.266 | | 3 month LIBOR | | | — | | | | 294,186 | |
| Credit Suisse First Boston Corp. | | | 5,800(a) | | | | 12/17/13 | | | 4.250 | | 3 month LIBOR | | | 35,689 | | | | (9,676 | ) |
| | | | 1,200(a) | | | | 12/17/18 | | | 4.750 | | 3 month LIBOR | | | 23,948 | | | | (2,034 | ) |
| | | | 600(a) | | | | 12/17/23 | | | 3 month LIBOR | | 4.750 | | | 7,370 | | | | (13,123 | ) |
| | | | 1,100(a) | | | | 12/17/28 | | | 3 month LIBOR | | 5.000 | | | (36,303 | ) | | | (5,499 | ) |
| | | | 1,000(a) | | | | 12/17/38 | | | 5.000 | | 3 month LIBOR | | | (9,021 | ) | | | 55,265 | |
| Deutsche Bank Securities, Inc. | | | 2,700(a) | | | | 12/17/13 | | | 3 month LIBOR | | 4.250 | | | (35,593 | ) | | | 16,349 | |
| | | | 9,100(a) | | | | 12/17/13 | | | 4.250 | | 3 month LIBOR | | | 63,419 | | | | (22,605 | ) |
| | | | 800(a) | | | | 12/17/18 | | | 4.750 | | 3 month LIBOR | | | 14,000 | | | | 609 | |
| | | | 800(a) | | | | 12/17/28 | | | 3 month LIBOR | | 5.000 | | | (20,842 | ) | | | (9,559 | ) |
| JPMorgan Securities, Inc. | | | 2,100(a) | | | | 12/17/13 | | | 3 month LIBOR | | 4.250 | | | (30,310 | ) | | | 15,342 | |
| | | | 9,100(a) | | | | 12/17/13 | | | 4.250 | | 3 month LIBOR | | | 99,632 | | | | (58,818 | ) |
| | | | 2,300(a) | | | | 12/17/15 | | | 3 month LIBOR | | 4.500 | | | 10,310 | | | | (31,818 | ) |
| | | | 2,300(a) | | | | 12/17/18 | | | 4.750 | | 3 month LIBOR | | | 23,167 | | | | 18,833 | |
| | | | 11,700(a) | | | | 12/17/23 | | | 3 month LIBOR | | 4.750 | | | 124,275 | | | | (236,470 | ) |
| | | | 500(a) | | | | 12/17/28 | | | 3 month LIBOR | | 5.000 | | | (26,071 | ) | | | 7,070 | |
| | | | 1,900(a) | | | | 12/17/38 | | | 5.000 | | 3 month LIBOR | | | (17,870 | ) | | | 105,733 | |
| |
| |
TOTAL | | | | | | | | | | | | | | $ | 200,939 | | | $ | 1,086,035 | |
| |
| |
| |
| (a) | Represents forward starting interest rate swaps whose effective dates of commencement of accruals and cash flows occur subsequent to September 30, 2008. |
CREDIT DEFAULT SWAP CONTRACTS
| | | | | | | | | | | | | | | | | | | | | | | |
| | | | | Notional
| | | Rates
| | | | | | | | | | |
| | | | | Amount
| | | paid by
| | | Termination
| | | Upfront Payments
| | | Unrealized
| |
| Swap Counterparty | | Referenced Obligation | | (000s) | | | Fund | | | Date | | | received by the Fund | | | Gain (Loss) | |
| | |
Protection Purchased: | | | | | | | | | | | | | | | | | | | | | | |
| Credit Suisse First Boston Corp. | | Computer Sciences Corp. 5.000%, 02/15/13 | | $ | 475 | | | | (1.180 | )% | | | 03/20/18 | | | $ | — | | | $ | (18,539 | ) |
| JPMorgan Securities, Inc. | | CDX North America Investment Grade Index | | | 5,000 | | | | (1.550 | ) | | | 06/20/13 | | | | (16,695 | ) | | | 44,859 | |
| |
| |
TOTAL | | | | | | | | | | | | | | | | $ | (16,695 | ) | | $ | 26,320 | |
| |
| |
The accompanying notes are an integral part of these financial statements.
GOLDMAN SACHS LOCAL EMERGING MARKETS DEBT FUND
Schedule of Investments
September 30, 2008 (Unaudited)
| | | | | | | | | | | | | | | | | |
| | | Principal
| | Interest
| | Maturity
| | |
| | | Amount | | Rate | | Date | | Value |
| |
Sovereign Debt Obligations – 42.9% |
| | | | | | | | | | | | | | | | | |
| | | | | | | | | | | | | | | | | |
| | | Argentina(a) – 3.7% |
| | | Republic of Argentina (B) |
| | | ARS | 25,868,695 | | | | 2.000 | % | | | 01/03/16 | | | $ | 5,736,304 | |
| | | |
| | | |
| | | Colombia – 2.4% |
| | | Republic of Colombia (BB+/Ba1) |
| | | COP | 9,000,000,000 | | | | 9.850 | | | | 06/28/27 | | | | 3,753,231 | |
| | | |
| | | |
| | | Egypt – 0.6% |
| | | Arab Republic of Egypt (BB+/Ba1) |
| | | EGP | 5,900,000 | | | | 8.750 | | | | 07/18/12 | | | | 918,078 | |
| | | |
| | | |
| | | Hungary – 7.4% |
| | | Hungary Government Bond (BBB+/A2) |
| | | HUF | 2,087,600,000 | | | | 7.250 | | | | 06/12/12 | | | | 11,316,021 | |
| | | |
| | | |
| | | Mexico – 6.4% |
| | | Mexican Fixed Rate Bonds (A+/Baa1) |
| | | MXN | 16,000,000 | | | | 10.000 | | | | 12/05/24 | | | | 1,654,899 | |
| | | Mexican Udibonos (A+/Baa1) |
| | | | 93,679,031 | | | | 3.500 | | | | 12/14/17 | | | | 8,253,698 | |
| | | | | | | | | | | | | | | | | |
| | | | | | | | | | | | | | | | 9,908,597 | |
| | | |
| | | |
| | | Peru – 6.6% |
| | | Peru Government Bond (BBB+/Baa3) |
| | | PEN | 27,378,000 | | | | 12.250 | | | | 08/10/11 | | | | 10,108,058 | |
| | | |
| | | |
| | | Poland – 4.8% |
| | | Poland Government Bond (A/A2) |
| | | PLN | 17,699,360 | | | | 3.000 | | | | 08/24/16 | | | | 7,394,975 | |
| | | |
| | | |
| | | Turkey – 8.3% |
| | | Turkey Government Bond (BB) |
| | | TRY | 9,248,136 | | | | 10.000 | | | | 02/15/12 | | | | 6,829,561 | |
| | | Turkey Government Bond (Ba3) |
| | | | 5,330,000 | | | | 14.000 | | | | 01/19/11 | | | | 3,820,638 | |
| | | Turkey Government Bond |
| | | | 3,000,000 | | | | 16.000 | | | | 08/28/13 | | | | 2,157,542 | |
| | | | | | | | | | | | | | | | | |
| | | | | | | | | | | | | | | | 12,807,741 | |
| | | |
| | | |
| | | Uruguay – 2.7% |
| | | Republic of Uruguay (BB-/B1+) |
| | | UYU | 93,904,027 | | | | 5.000 | | | | 09/14/18 | | | | 4,188,302 | |
| | | |
| | | |
| | | TOTAL SOVEREIGN DEBT OBLIGATIONS |
| | | (Cost $73,082,000) | | $ | 66,131,307 | |
| | | | | | | | | | | | | | | | | |
| | | |
| | | |
| | | | | | | | | | | | | | | | | |
| | | | | | | | | | | | | | | | | |
Corporate Obligations – 12.8% |
| | | | | | | | | | | | | | | | | |
| | | | | | | | | | | | | | | | | |
| | | Brazil – 2.1% |
| | | Morgan Stanley (A+/A1)(b) |
| | | BRL | 9,000,000 | | | | 10.090 | % | | | 05/03/17 | | | $ | 2,601,292 | |
| | | RBS-Zero Hora Editora Jornalistica SA (BB) |
| | | | 2,000,000 | | | | 11.250 | | | | 06/15/17 | | | | 725,209 | |
| | | | | | | | | | | | | | | | | |
| | | | | | | | | | | | | | | | 3,326,501 | |
| | | |
| | | |
| | | Germany – 1.3% |
| | | Kreditanstalt fuer Wiederaufbau (AAA/Aaa) |
| | | NGN | 255,000,000 | | | | 8.500 | | | | 01/18/11 | | | | 1,953,450 | |
| | | |
| | | |
| | | Russia – 6.5% |
| | | Gazprombank (BBB-/A3) |
| | | RUB | 70,000,000 | | | | 7.250 | | | | 02/22/10 | | | | 2,615,732 | |
| | | Red Arrow International Leasing Plc (BBB+/Baa2) |
| | | | 209,463,878 | | | | 8.375 | | | | 06/30/12 | | | | 7,428,391 | |
| | | | | | | | | | | | | | | | | |
| | | | | | | | | | | | | | | | 10,044,123 | |
| | | |
| | | |
| | | United Arab Emirates(a) – 2.9% |
| | | Jafz Sukuk Ltd. (A+/A1) |
| | | AED | 19,100,000 | | | | 3.291 | | | | 11/27/12 | | | | 4,422,512 | |
| | | |
| | | |
| | | TOTAL CORPORATE OBLIGATIONS |
| | | (Cost $24,229,787) | | $ | 19,746,586 | |
| | | |
| | | |
| | | | | | | | | | | | | | | | | |
| | | | | | | | | | | | | | | | | |
Credit Linked Notes – 18.4% |
| | | | | | | | | | | | | | | | | |
| | | | | | | | | | | | | | | | | |
| | | Egypt(c)(d) – 3.6% |
| | | Arab Republic of Egypt |
| | | $ | 1,022,000 | | | | 0.000 | % | | | 04/16/09 | | | $ | 1,025,434 | |
| | | EGP | 28,155,912 | | | | 0.000 | | | | 08/06/09 | | | | 4,608,240 | |
| | | | | | | | | | | | | | | | | |
| | | | | | | | | | | | | | | | 5,633,674 | |
| | | |
| | | |
| | | Indonesia – 6.7% |
| | | Republic of Indonesia |
| | | | | | | | | | | | | | | | | |
| | | IDR | 46,000,000,000 | | | | 10.000 | (e) | | | 07/15/17 | | | | 4,093,097 | |
| | | $ | 7,670,484 | | | | 10.000 | (b)(f) | | | 07/18/17 | | | | 6,173,436 | |
| | | | | | | | | | | | | | | | | |
| | | | | | | | | | | | | | | | 10,266,533 | |
| | | |
| | | |
| | | Nigeria(c)(g) – 8.1% |
| | | Federal Republic of Nigeria |
| | | NGN | 1,571,288,113 | | | | 0.000 | | | | 05/11/09 | | | | 12,552,671 | |
| | | |
| | | |
| | | TOTAL CREDIT LINKED NOTES |
| | | (Cost $30,340,870) | | $ | 28,452,878 | |
| | | |
| | | |
| | | | | | | | | | | | | | | | | |
| | | | | | | | | | | | | | | | | |
Foreign Debt Obligation – 0.8% |
| | | | | | | | | | | | | | | | | |
| | | | | | | | | | | | | | | | | |
| | | Supranational – 0.8% |
| | | International Bank Reconstruction & Development |
| | | | | | | | | | | | | | | | | |
| | | UYU | 28,902,640 | | | | 3.400 | % | | | 04/15/17 | | | $ | 1,248,636 | |
| | | (Cost $1,483,452) | | | | |
| | | |
| | | |
| | | TOTAL INVESTMENTS BEFORE REPURCHASE AGREEMENT – 74.9% |
| | | (Cost $129,136,109) | | $ | 115,579,407 | |
| | | |
| | | |
| | | | | | | | | | | | | | | | | |
| | | | | | | | | | | | | | | | | |
The accompanying notes are an integral part of these financial statements.
GOLDMAN SACHS LOCAL EMERGING MARKETS DEBT FUND
| | | | | | | | | | | | | | | | | |
| | | Principal
| | Interest
| | Maturity
| | |
| | | Amount | | Rate | | Date | | Value |
| |
Repurchase Agreement(h) – 28.9% |
| | | | | | | | | | | | | | | | | |
| | | | | | | | | | | | | | | | | |
| | | Joint Repurchase Agreement Account II |
| | | $ | 44,600,000 | | | | 1.944 | % | | | 10/01/08 | | | $ | 44,600,000 | |
| | | Maturity Value: $44,602,408 |
| | | | | | | | | | | | | | | | | |
| | | (Cost $44,600,000) | | | | |
| | | |
| | | |
| | | TOTAL INVESTMENTS – 103.8% |
| | | (Cost $173,736,109) | | $ | 160,179,407 | |
| | | |
| | | |
| | | LIABILITIES IN EXCESS OF OTHER ASSETS – (3.8)% | | | (5,921,619 | ) |
| | | |
| | | |
| | | NET ASSETS – 100.0% | | $ | 154,257,788 | |
| | | |
| | | |
The percentage shown for each investment category reflects the value of investments in that category as a percentage of net assets.
| | |
| (a) | | Variable rate security. Interest rate disclosed is that which is in effect at September 30, 2008. |
| |
| (b) | | Securities are exempt from registration under Rule 144A of the Securities Act of 1933. Under procedures approved by the Board of Trustees, such securities have been determined to be liquid by the investment adviser and may be resold, normally to qualified institutional buyers in transactions exempt from registration. Total market value of Rule 144A securities amounts to $8,774,728, which represents approximately 5.7% of net assets as of September 30, 2008. |
| |
| (c) | | Security issued with a zero coupon. Income is recognized through the accretion of discount. |
| |
| (d) | | The underlying security is issued by Citigroup Inc. |
| |
| (e) | | The underlying security is issued by HSBC Corp. |
| |
| (f) | | The underlying security is issued by J.P. Morgan Chase. |
| |
| (g) | | The underlying security is issued by Standard Bank Plc. |
| |
| (h) | | Joint repurchase agreement was entered into on September 30, 2008. Additional information appears on page 63. |
Security ratings disclosed, if any, are issued by Standard & Poor’s/Moody’s Investors Service. A brief description of the ratings is available in the Fund’s Statement of Additional Information.
ADDITIONAL INVESTMENT INFORMATION
FORWARD FOREIGN CURRENCY CONTRACTS — At September 30, 2008, the Fund had outstanding forward foreign currency exchange contracts, both to purchase and sell foreign currencies:
| | | | | | | | | | | | | | | | | |
Open Forward Foreign Currency
| | Contract
| | Expiration
| | Value on
| | | Notional
| | | Unrealized
| |
| Contracts with Unrealized Gain | | Type | | Date | | Settlement Date | | | Value | | | Gain | |
| | |
| Malaysian Ringgit | | Sale | | 11/04/08 | | $ | 1,000,000 | | | $ | 994,098 | | | $ | 5,902 | |
| |
| |
| | | | | | | | | | | | | | | | | |
| | | | | | | | | | | | | | | | | |
Open Forward Foreign Currency
| | Contract
| | Expiration
| | Value on
| | | Notional
| | | Unrealized
| |
| Contracts with Unrealized Loss | | Type | | Date | | Settlement Date | | | Value | | | Loss | |
| | |
| Brazilian Real | | Purchase | | 11/04/08 | | $ | 9,512,979 | | | $ | 8,070,671 | | | $ | (1,442,308 | ) |
| Chilean Peso | | Purchase | | 11/04/08 | | | 6,642,476 | | | | 6,032,245 | | | | (610,231 | ) |
| Indian Rupee | | Purchase | | 11/04/08 | | | 8,282,159 | | | | 7,593,394 | | | | (688,765 | ) |
| Malaysian Ringgit | | Purchase | | 11/04/08 | | | 8,497,624 | | | | 8,055,022 | | | | (442,602 | ) |
| New Taiwan Dollar | | Purchase | | 11/04/08 | | | 6,606,455 | | | | 6,208,543 | | | | (397,912 | ) |
| Philippine Peso | | Purchase | | 11/04/08 | | | 4,285,633 | | | | 4,065,063 | | | | (220,570 | ) |
| Singapore Dollar | | Purchase | | 12/17/08 | | | 7,797,286 | | | | 7,787,470 | | | | (9,816 | ) |
| South African Rand | | Purchase | | 12/17/08 | | | 7,592,056 | | | | 7,402,949 | | | | (189,107 | ) |
| South Korean Won | | Purchase | | 11/04/08 | | | 4,334,322 | | | | 3,687,539 | | | | (646,783 | ) |
| Yuan Renminbi | | Purchase | | 11/04/08 | | | 8,423,198 | | | | 8,275,774 | | | | (147,424 | ) |
| |
| |
TOTAL | | | | | | | | | | | | | | $ | (4,795,518 | ) |
| |
| |
The accompanying notes are an integral part of these financial statements.
GOLDMAN SACHS LOCAL EMERGING MARKETS DEBT FUND
Schedule of Investments (continued)
September 30, 2008 (Unaudited)
| |
| ADDITIONAL INVESTMENT INFORMATION (continued) | |
SWAP CONTRACTS — At September 30, 2008, the Fund had outstanding swap contracts with the following terms:
INTEREST RATE SWAP CONTRACTS
| | | | | | | | | | | | | | | | | | | | | |
| | | | | | | | | Rates Exchanged | | | | |
| | | Notional
| | | | | | Payments
| | | Payments
| | | | |
| | | Amount
| | | Termination
| | | received by
| | | made by
| | | Unrealized
| |
| Swap Counterparty | | (000s) | | | Date | | | the Fund | | | the Fund | | | Loss | |
| | |
| JPMorgan Securities, Inc. | | | BRL 12,000 | | | | 01/02/12 | | | | 12.660 | % | | | Brazilian Interbank
Deposit Average | | | $ | (206,212 | ) |
| | | | 6,000 | | | | 01/02/12 | | | | 13.360 | | | | Brazilian Interbank
Deposit Average | | | | (57,701 | ) |
| |
| |
TOTAL | | | | | | | | | | | | | | | | | | $ | (263,913 | ) |
| |
| |
The accompanying notes are an integral part of these financial statements.
GOLDMAN SACHS U.S. MORTGAGES FUND
Schedule of Investments
September 30, 2008 (Unaudited)
| | | | | | | | | | | | | | | | | |
| | | Principal
| | Interest
| | Maturity
| | |
| | | Amount | | Rate | | Date | | Value |
Mortgage-Backed Obligations – 105.4% |
| | | | | | | | | | | | | | | | | |
| | | | | | | | | | | | | | | | | |
| | | Collateralized Mortgage Obligations – 12.8% |
| | | Adjustable Rate Non-Agency(a) – 11.5% |
| | | Adjustable Rate Mortgage Trust Series 2004-5, Class 2A1 |
| | | $ | 430,026 | | | | 4.997 | % | | | 04/25/35 | | | $ | 331,430 | |
| | | American Home Mortgage Assets Series 2006-3, Class 1A1 |
| | | | 6,173,080 | | | | 3.825 | | | | 10/25/46 | | | | 3,647,144 | |
| | | American Home Mortgage Assets Series 2006-3, Class 2A11 |
| | | | 13,534,024 | | | | 3.795 | | | | 10/25/46 | | | | 8,011,258 | |
| | | American Home Mortgage Assets Series 2007-1, Class A1 |
| | | | 5,980,678 | | �� | | 3.555 | | | | 02/25/47 | | | | 3,008,145 | |
| | | American Home Mortgage Investment Trust Series 2004-3, Class 1A |
| | | | 27,931 | | | | 3.577 | | | | 10/25/34 | | | | 22,097 | |
| | | Bear Stearns Adjustable Rate Mortgage Trust Series 2004-1, Class 21A1 |
| | | | 602,774 | | | | 4.470 | | | | 04/25/34 | | | | 477,622 | |
| | | Bear Stearns Adjustable Rate Mortgage Trust Series 2005-03, Class 2A1 |
| | | | 1,624,213 | | | | 5.077 | | | | 06/25/35 | | | | 1,255,271 | |
| | | Bear Stearns Alt-A Trust II Series 2007-1, Class 1A1 |
| | | | 3,514,171 | | | | 6.231 | | | | 09/25/47 | | | | 2,291,744 | |
| | | Bear Stearns Alt-A Trust Series 2004-3, Class A1 |
| | | | 139,465 | | | | 3.847 | | | | 04/25/34 | | | | 90,155 | |
| | | Bear Stearns Alt-A Trust Series 2005-5, Class 21A1 |
| | | | 1,558,416 | | | | 5.235 | | | | 07/25/35 | | | | 1,124,103 | |
| | | Countrywide Alternative Loan Trust Series 2005-16, Class A1 |
| | | | 1,200,133 | | | | 4.500 | | | | 06/25/35 | | | | 690,385 | |
| | | Countrywide Alternative Loan Trust Series 2005-38, Class A1 |
| | | | 342,589 | | | | 4.355 | | | | 09/25/35 | | | | 217,847 | |
| | | Countrywide Alternative Loan Trust Series 2005-59, Class 1A1 |
| | | | 1,384,287 | | | | 3.537 | | | | 11/20/35 | | | | 856,763 | |
| | | Countrywide Alternative Loan Trust Series 2007-0A11, Class A1A |
| | | | 6,723,978 | | | | 4.235 | | | | 11/25/47 | | | | 3,546,864 | |
| | | Countrywide Home Loan Trust Series 2003-52, Class A1 |
| | | | 624,276 | | | | 4.673 | | | | 02/19/34 | | | | 442,735 | |
| | | Countrywide Home Loan Trust Series 2004-HYB6, Class A2 |
| | | | 552,977 | | | | 4.543 | | | | 11/20/34 | | | | 389,869 | |
| | | Countrywide Home Loan Trust Series 2005-HYB4, Class 2A1 |
| | | | 2,335,222 | | | | 4.902 | | | | 08/20/35 | | | | 1,563,642 | |
| | | First Horizon Mortgage Pass-Through Trust Series 2004-AR6, Class 2A1 |
| | | | 205,813 | | | | 4.750 | | | | 12/25/34 | | | | 185,947 | |
| | | Harborview Mortgage Loan Trust Series 2005-14, Class 5A1A |
| | | | 1,413,950 | | | | 5.738 | | | | 12/19/35 | | | | 867,412 | |
| | | Harborview Mortgage Loan Trust Series 2005-15, Class 2A11 |
| | | | 980,879 | | | | 3.458 | | | | 10/20/45 | | | | 614,705 | |
| | | Harborview Mortgage Loan Trust Series 2005-16, Class 2A1A |
| | | | 525,373 | | | | 3.270 | | | | 01/19/36 | | | | 334,927 | |
| | | Harborview Mortgage Loan Trust Series 2005-16, Class 3A1A |
| | | | 1,997,123 | | | | 3.280 | | | | 01/19/36 | | | | 1,251,670 | |
| | | Impac CMB Trust Series 2004-08, Class 1A |
| | | | 157,798 | | | | 3.927 | | | | 10/25/34 | | | | 42,857 | |
| | | Impac CMB Trust Series 2005-06, Class 1A1 |
| | | | 1,861,247 | | | | 3.457 | | | | 10/25/35 | | | | 987,892 | |
| | | |
| | | |
| | | Impac Secured Assets Corp. Series 2005-2, Class A1W |
| | | | 2,286,667 | | | | 3.457 | | | | 03/25/36 | | | | 1,201,271 | |
| | | Indymac Index Mortgage Loan Trust Series 2005-AR13, Class 4A1 |
| | | | 953,148 | | | | 5.358 | | | | 08/25/35 | | | | 636,926 | |
| | | Indymac Index Mortgage Loan Trust Series 2005-AR15, Class A1 |
| | | | 642,588 | | | | 5.425 | | | | 09/25/35 | | | | 423,437 | |
| | | JPMorgan Mortgage Trust Series 2005-A4, Class 2A1 |
| | | | 1,834,783 | | | | 5.061 | | | | 07/25/35 | | | | 1,690,792 | |
| | | JPMorgan Mortgage Trust Series 2007-A1, Class 1A1 |
| | | | 851,301 | | | | 4.200 | | | | 07/25/35 | | | | 793,224 | |
| | | JPMorgan Mortgage Trust Series 2007-A1, Class 2A2 |
| | | | 753,447 | | | | 4.746 | | | | 07/25/35 | | | | 680,307 | |
| | | JPMorgan Mortgage Trust Series 2007-A1, Class 4A2 |
| | | | 810,635 | | | | 4.069 | | | | 07/25/35 | | | | 751,492 | |
| | | JPMorgan Mortgage Trust Series 2007-A1, Class 5A2 |
| | | | 770,769 | | | | 4.766 | | | | 07/25/35 | | | | 684,990 | |
| | | Lehman XS Trust Series 2005-5N, Class 3A1A |
| | | | 1,600,210 | | | | 3.507 | | | | 11/25/35 | | | | 1,024,803 | |
| | | Lehman XS Trust Series 2006-2N, Class 1A1 |
| | | | 2,160,719 | | | | 3.467 | | | | 02/25/46 | | | | 1,297,884 | |
| | | Lehman XS Trust Series 2007-04N, Class 3A2A |
| | | | 2,662,666 | | | | 3.605 | | | | 03/25/47 | | | | 1,549,021 | |
| | | Lehman XS Trust Series 2007-16N, Class 2A2 |
| | | | 2,872,797 | | | | 4.057 | | | | 09/25/47 | | | | 1,647,795 | |
| | | Luminent Mortgage Trust Series 2006-5, Class A1A |
| | | | 655,333 | | | | 3.397 | | | | 07/25/36 | | | | 396,229 | |
| | | Master Adjustable Rate Mortgages Trust Series 2006-OA2, Class 4A1A |
| | | | 1,573,105 | | | | 3.705 | | | | 12/25/46 | | | | 799,116 | |
| | | Master Adjustable Rate Mortgages Trust Series 2007-1, Class I2A3 |
| | | | 1,703,316 | | | | 4.055 | | | | 01/25/47 | | | | 874,401 | |
| | | Merrill Lynch Alternative Note Asset Series 2007-AF1, Class AV1 |
| | | | 2,651,017 | | | | 5.648 | | | | 06/25/37 | | | | 1,681,616 | |
| | | Morgan Stanley Mortgage Loan Trust Series 2004-8AR, Class 4A1 |
| | | | 1,709,005 | | | | 5.363 | | | | 10/25/34 | | | | 1,159,808 | |
| | | Mortgage IT Trust Series 2005-5, Class A1 |
| | | | 1,333,737 | | | | 3.467 | | | | 12/25/35 | | | | 1,021,210 | |
| | | Residential Accredit Loans, Inc. Series 2005-Q05, Class A1 |
| | | | 1,676,248 | | | | 3.855 | | | | 01/25/46 | | | | 1,010,495 | |
| | | Residential Funding Mortgage Securities I Series 2005-SA4, Class 2A1 |
| | | | 1,334,887 | | | | 5.202 | | | | 09/25/35 | | | | 1,035,985 | |
| | | Residential Funding Mortgage Securities I Series 2005-SA4, Class 2A2 |
| | | | 1,479,625 | | | | 5.180 | | | | 09/25/35 | | | | 1,260,229 | |
| | | Sequoia Mortgage Trust Series 2004-09, Class A2 |
| | | | 517,702 | | | | 3.745 | | | | 10/20/34 | | | | 451,898 | |
| | | Structured Adjustable Rate Mortgage Loan Series 2004-06, Class 3A2 |
| | | | 1,089,438 | | | | 4.700 | | | | 06/25/34 | | | | 960,604 | |
| | | |
| | | |
The accompanying notes are an integral part of these financial statements.
GOLDMAN SACHS U.S. MORTGAGES FUND
Schedule of Investments (continued)
September 30, 2008 (Unaudited)
| | | | | | | | | | | | | | | | | |
| | | Principal
| | Interest
| | Maturity
| | |
| | | Amount | | Rate | | Date | | Value |
| |
Mortgage-Backed Obligations – (continued) |
| | | Adjustable Rate Non-Agency(a) – (continued) |
| | | | | | | | | | | | | | | | | |
| | | Structured Adjustable Rate Mortgage Loan Series 2004-19, Class 2A2 |
| | | $ | 167,182 | | | | 5.339 | % | | | 01/25/35 | | | $ | 123,897 | |
| | | Structured Adjustable Rate Mortgage Loan Trust Series 2004-05, Class 3A1 |
| | | | 711,097 | | | | 4.380 | | | | 05/25/34 | | | | 500,376 | |
| | | Structured Adjustable Rate Mortgage Loan Trust Series 2004-12, Class 3A2 |
| | | | 315,362 | | | | 5.250 | | | | 09/25/34 | | | | 224,778 | |
| | | Structured Adjustable Rate Mortgage Loan Trust Series 2004-16, Class 3A1 |
| | | | 1,360,410 | | | | 5.450 | | | | 11/25/34 | | | | 1,023,664 | |
| | | Structured Adjustable Rate Mortgage Loan Trust Series 2007-09, Class 1A1 |
| | | | 8,722,864 | | | | 6.000 | | | | 10/25/37 | | | | 5,574,529 | |
| | | Structured Adjustable Rate Mortgage Loan Trust Series 2007-10, Class 1A1 |
| | | | 6,035,707 | | | | 6.000 | | | | 11/25/37 | | | | 3,859,638 | |
| | | Structured Asset Mortgage Investments, Inc. Series 2007-AR3, Class 2A1 |
| | | | 6,425,252 | | | | 3.397 | | | | 09/25/47 | | | | 3,626,156 | |
| | | Structured Asset Mortgage Investments, Inc. Series 2007-AR6, Class A1 |
| | | | 3,876,169 | | | | 4.355 | | | | 08/25/47 | | | | 2,183,174 | |
| | | Structured Asset Securities Corp. Series 2003-26A, Class 3A5 |
| | | | 1,000,000 | | | | 4.956 | | | | 09/25/33 | | | | 812,109 | |
| | | Structured Asset Securities Corp. Series 2003-34A, Class 3A3 |
| | | | 55,322 | | | | 4.958 | | | | 11/25/33 | | | | 48,899 | |
| | | Structured Asset Securities Corp. Series 2003-37A, Class 3A7 |
| | | | 209,334 | | | | 4.520 | | | | 12/25/33 | | | | 183,346 | |
| | | Washington Mutual Mortgage Pass-Through Certificates Series 2004-AR3, Class A2 |
| | | | 964,869 | | | | 4.243 | | | | 06/25/34 | | | | 871,270 | |
| | | Washington Mutual Mortgage Pass-Through Certificates Series 2006-AR02, Class 1A1 |
| | | | 3,361,770 | | | | 5.297 | | | | 03/25/37 | | | | 2,838,822 | |
| | | Washington Mutual Mortgage Pass-Through Certificates Series 2006-AR07, Class 2A |
| | | | 3,351,948 | | | | 3.835 | | | | 07/25/46 | | | | 1,824,191 | |
| | | Washington Mutual Mortgage Pass-Through Certificates Series 2006-AR09, Class 2A |
| | | | 3,392,431 | | | | 3.695 | | | | 11/25/46 | | | | 1,797,484 | |
| | | Washington Mutual Mortgage Pass-Through Certificates Series 2007-0A1, Class 2A |
| | | | 9,570,586 | | | | 3.575 | | | | 12/25/46 | | | | 5,081,844 | |
| | | Wells Fargo Alternative Loan Trust Series 2007-PA6, Class A1 |
| | | | 11,982,072 | | | | 6.602 | | | | 12/28/37 | | | | 7,875,001 | |
| | | Wells Fargo Mortgage Backed Securities Trust Series 2005-AR16, Class 1A1 |
| | | | 1,157,784 | | | | 5.332 | | | | 10/25/35 | | | | 1,003,151 | |
| | | | | | | | | | | | | | | | | |
| | | | | | | | | | | | | | | | 94,738,346 | |
| | | |
| | | |
| | | Interest Only(b) – 0.0% |
| | | ABN AMRO Mortgage Corp. Series 2003-5, Class A2 |
| | | | 41,907 | | | | 5.500 | | | | 04/25/33 | | | | 3,532 | |
| | | ABN AMRO Mortgage Corp. Series 2003-8, Class A2 |
| | | | 279,312 | | | | 5.500 | | | | 06/25/33 | | | | 26,491 | |
| | | CS First Boston Mortgage Securities Corp. Series 2002-AR31, Class 5X(a) |
| | | | 64,462 | | | | 0.000 | | | | 11/25/32 | | | | — | |
| | | CS First Boston Mortgage Securities Corp. Series 2003-08, Class 3A2 |
| | | | 1,874 | | | | 5.500 | | | | 04/25/33 | | | | 27 | |
| | | CS First Boston Mortgage Securities Corp. Series 2003-10, Class 3A13 |
| | | | 793 | | | | 5.750 | | | | 05/25/33 | | | | 4 | |
| | | CS First Boston Mortgage Securities Corp. Series 2003-11, Class 1A2 |
| | | | 11,302 | | | | 5.500 | | | | 06/25/33 | | | | 271 | |
| | | CS First Boston Mortgage Securities Corp. Series 2003-19, Class 1A2 |
| | | | 392,476 | | | | 5.250 | | | | 07/25/33 | | | | 40,953 | |
| | | FHLMC REMIC Series 2575, Class IB |
| | | | 162,430 | | | | 5.500 | | | | 08/15/30 | | | | 12,337 | |
| | | FNMA REMIC Series 2004-47, Class EI(a)(c) |
| | | | 1,287,861 | | | | 0.000 | | | | 06/25/34 | | | | 37,440 | |
| | | FNMA REMIC Series 2004-62, Class DI(a)(c) |
| | | | 578,799 | | | | 0.000 | | | | 07/25/33 | | | | 17,548 | |
| | | FNMA Series E, Class E2 |
| | | | 450 | | | | 506.000 | | | | 09/01/10 | | | | 1,777 | |
| | | Master Adjustable Rate Mortgages Trust Series 2003-2, Class 3AX(a) |
| | | | 35,790 | | | | 0.120 | | | | 08/25/33 | | | | 178 | |
| | | Master Adjustable Rate Mortgages Trust Series 2003-2, Class 4AX(a) |
| | | | 11,312 | | | | 0.320 | | | | 07/25/33 | | | | 104 | |
| | | Washington Mutual Mortgage Pass-Through Certificates Series 2003-AR12, Class X(a) |
| | | | 650,147 | | | | 0.481 | | | | 02/25/34 | | | | 260 | |
| | | Washington Mutual Mortgage Pass-Through Certificates Series 2003-S3, Class 1A41 |
| | | | 205,949 | | | | 5.500 | | | | 06/25/33 | | | | 16,479 | |
| | | | | | | | | | | | | | | | | |
| | | | | | | | | | | | | | | | 157,401 | |
| | | |
| | | |
| | | Inverse Floaters(a) – 0.0% |
| | | GNMA Series 2001-48, Class SA |
| | | | 23,672 | | | | 18.401 | | | | 10/16/31 | | | | 25,769 | |
| | | GNMA Series 2001-51, Class SB |
| | | | 23,310 | | | | 18.401 | | | | 10/16/31 | | | | 25,497 | |
| | | GNMA Series 2001-59, Class SA |
| | | | 35,689 | | | | 18.239 | | | | 11/16/24 | | | | 38,139 | |
| | | | | | | | | | | | | | | | | |
| | | | | | | | | | | | | | | | 89,405 | |
| | | |
| | | |
| | | Planned Amortization Class – 0.6% |
| | | FNMA REMIC Series 2003-88, Class TH |
| | | | 5,000,000 | | | | 4.500 | | | | 09/25/18 | | | | 4,837,393 | |
| | | |
| | | |
The accompanying notes are an integral part of these financial statements.
GOLDMAN SACHS U.S. MORTGAGES FUND
| | | | | | | | | | | | | | | | | |
| | | Principal
| | Interest
| | Maturity
| | |
| | | Amount | | Rate | | Date | | Value |
| |
Mortgage-Backed Obligations – (continued) |
| | | Planned Amortization Class – (continued) |
| | | | | | | | | | | | | | | | | |
| | | Regular Floater(a)(c) – 0.2% |
| | | FHLMC REMIC Series 3038, Class XA |
| | | $ | 70,549 | | | | 0.000 | % | | | 09/15/35 | | | $ | 61,971 | |
| | | FHLMC REMIC Series 3313, Class AU |
| | | | 70,422 | | | | 0.000 | | | | 04/15/37 | | | | 72,609 | |
| | | FHLMC REMIC Series 3325, Class SX |
| | | | 1,068,422 | | | | 0.000 | | | | 06/15/37 | | | | 1,077,480 | |
| | | FHLMC Series 3013, Class XH |
| | | | 167,896 | | | | 0.000 | | | | 08/15/35 | | | | 164,504 | |
| | | FNMA Series 2006-81, Class LF |
| | | | 75,642 | | | | 0.000 | | | | 09/25/36 | | | | 67,756 | |
| | | | | | | | | | | | | | | | | |
| | | | | | | | | | | | | | | | 1,444,320 | |
| | | |
| | | |
| | | Sequential Fixed Rate – 0.5% |
| | | Countrywide Alternative Loan Trust Series 2005-J11, Class 2A1 |
| | | | 680,781 | | | | 6.000 | | | | 10/25/35 | | | | 511,862 | |
| | | Countrywide Alternative Loan Trust Series 2006-5T2, Class A3 |
| | | | 762,596 | | | | 6.000 | | | | 04/25/36 | | | | 594,310 | |
| | | FHLMC REMIC Series 1703, Class GC |
| | | | 348,125 | | | | 6.500 | | | | 04/15/09 | | | | 347,793 | |
| | | FHLMC REMIC Series 1823, Class A |
| | | | 178,541 | | | | 6.500 | | | | 08/15/23 | | | | 178,952 | |
| | | FHLMC REMIC Series 2042, Class N |
| | | | 654,411 | | | | 6.500 | | | | 03/15/28 | | | | 674,820 | |
| | | FHLMC REMIC Series 2590, Class NV |
| | | | 1,000,000 | | | | 5.000 | | | | 03/15/18 | | | | 989,865 | |
| | | FNMA REMIC Series 2000-16, Class ZG |
| | | | 910,032 | | | | 8.500 | | | | 06/25/30 | | | | 973,457 | |
| | | | | | | | | | | | | | | | | |
| | | | | | | | | | | | | | | | 4,271,059 | |
| | | |
| | | |
| | | TOTAL COLLATERALIZED MORTGAGE OBLIGATIONS | | $ | 105,537,924 | |
| | | |
| | | |
| | | Commercial Mortgage-Backed Securities – 6.6% |
| | | Interest Only(a)(b)(d) – 0.0% |
| | | Bear Stearns Commercial Mortgage Securities, Inc. Series 2003-T10, Class X2 |
| | | | 4,606,352 | | | | 1.320 | | | | 03/13/40 | | | | 115,125 | |
| | | JPMorgan Chase Commercial Mortgage Securities Corp. Series 2004-C1, Class X2 |
| | | | 4,750,326 | | | | 1.145 | | | | 01/15/38 | | | | 86,800 | |
| | | Prudential Commercial Mortgage Trust Series 2003-PWR1, Class X2 |
| | | | 5,025,344 | | | | 1.615 | | | | 02/11/36 | | | | 139,739 | |
| | | | | | | | | | | | | | | | | |
| | | | | | | | | | | | | | | | 341,664 | |
| | | |
| | | |
| | | Sequential Fixed Rate – 6.6% |
| | | Banc of America Commercial Mortgage, Inc. Series 2005-5, Class A4 |
| | | | 4,000,000 | | | | 5.115 | | | | 10/10/45 | | | | 3,606,049 | |
| | | Banc of America Commercial Mortgage, Inc. Series 2005-6, Class A4 |
| | | | 5,000,000 | | | | 5.352 | | | | 09/10/47 | | | | 4,456,388 | |
| | | Bear Stearns Commercial Mortgage Securities Series 2006-PW13, Class A4 |
| | | | 10,295,000 | | | | 5.540 | | | | 09/11/41 | | | | 9,171,124 | |
| | | |
| | | |
| | | Bear Stearns Commercial Mortgage Securities Trust Series 2006-PW14, Class A4 |
| | | | 4,000,000 | | | | 5.201 | | | | 12/11/38 | | | | 3,462,530 | |
| | | Bear Stearns Commercial Mortgage Securities, Inc. Series 2005-PW10, Class A4 |
| | | | 5,000,000 | | | | 5.405 | | | | 12/11/40 | | | | 4,610,231 | |
| | | GE Capital Commercial Mortgage Corp. Series 2005-C4, Class A4 |
| | | | 5,000,000 | | | | 5.334 | | | | 11/10/45 | | | | 4,449,614 | |
| | | LB-UBS Commercial Mortgage Trust Series 2002-C1, Class A2 |
| | | | 59,806 | | | | 5.969 | | | | 03/15/26 | | | | 59,759 | |
| | | LB-UBS Commercial Mortgage Trust Series 2005-C5, Class A4 |
| | | | 2,000,000 | | | | 4.954 | | | | 09/15/30 | | | | 1,750,849 | |
| | | LB-UBS Commercial Mortgage Trust Series 2005-C7, Class A4 |
| | | | 2,000,000 | | | | 5.197 | | | | 11/15/30 | | | | 1,772,157 | |
| | | LB-UBS Commercial Mortgage Trust Series 2006-C1, Class A4 |
| | | | 13,500,000 | | | | 5.156 | | | | 02/15/31 | | | | 11,786,385 | |
| | | Morgan Stanley Capital I Series 2007-T25, Class A3 |
| | | | 7,000,000 | | | | 5.514 | | | | 11/12/49 | | | | 5,923,598 | |
| | | Wachovia Bank Commercial Mortgage Trust Series 2005-C21, Class A4 |
| | | | 4,000,000 | | | | 5.210 | | | | 10/15/44 | | | | 3,537,747 | |
| | | | | | | | | | | | | | | | | |
| | | | | | | | | | | | | | | | 54,586,431 | |
| | | |
| | | |
| | | TOTAL COMMERCIAL MORTGAGE-BACKED SECURITIES | | $ | 54,928,095 | |
| | | |
| | | |
| | | Federal Agencies – 86.0% |
| | | Adjustable Rate FHLMC(a) – 0.7% |
| | | | 397,941 | | | | 4.771 | | | | 04/01/33 | | | | 400,664 | |
| | | | 5,113,342 | | | | 4.571 | | | | 08/01/35 | | | | 5,101,477 | |
| | | | | | | | | | | | | | | | | |
| | | | | | | | | | | | | | | | 5,502,141 | |
| | | |
| | | |
| | | Adjustable Rate FNMA(a) – 1.0% |
| | | | 27,425 | | | | 4.361 | | | | 07/01/22 | | | | 27,507 | |
| | | | 27,851 | | | | 4.079 | | | | 07/01/27 | | | | 27,750 | |
| | | | 75,175 | | | | 4.079 | | | | 11/01/27 | | | | 74,903 | |
| | | | 9,148 | | | | 4.079 | | | | 01/01/31 | | | | 9,134 | |
| | | | 10,313 | | | | 4.079 | | | | 06/01/32 | | | | 10,306 | |
| | | | 38,992 | | | | 4.361 | | | | 08/01/32 | | | | 38,975 | |
| | | | 90,642 | | | | 4.361 | | | | 05/01/33 | | | | 90,659 | |
| | | | 1,916,396 | | | | 4.364 | | | | 05/01/33 | | | | 1,929,088 | |
| | | | 542,471 | | | | 3.911 | | | | 06/01/33 | | | | 545,821 | |
| | | | 479,220 | | | | 4.337 | | | | 12/01/33 | | | | 484,539 | |
| | | | 693,307 | | | | 4.583 | | | | 08/01/34 | | | | 703,599 | |
| | | | 4,036,181 | | | | 4.567 | | | | 02/01/35 | | | | 4,037,833 | |
| | | | 33,770 | | | | 4.079 | | | | 11/01/35 | | | | 33,790 | |
| | | | 157,969 | | | | 4.079 | | | | 12/01/37 | | | | 158,087 | |
| | | | 73,256 | | | | 4.079 | | | | 01/01/38 | | | | 73,312 | |
| | | | 52,837 | | | | 4.079 | | | | 11/01/40 | | | | 52,879 | |
| | | | | | | | | | | | | | | | | |
| | | | | | | | | | | | | | | | 8,298,182 | |
| | | |
| | | |
The accompanying notes are an integral part of these financial statements.
GOLDMAN SACHS U.S. MORTGAGES FUND
Schedule of Investments (continued)
September 30, 2008 (Unaudited)
| | | | | | | | | | | | | | | | | |
| | | Principal
| | Interest
| | Maturity
| | |
| | | Amount | | Rate | | Date | | Value |
| |
Mortgage-Backed Obligations – (continued) |
| | | Adjustable Rate FNMA(a) – (continued) |
| | | | | | | | | | | | | | | | | |
| | | Adjustable Rate GNMA(a) – 0.5% |
| | | $ | 80,263 | | | | 5.375 | % | | | 06/20/23 | | | $ | 81,371 | |
| | | | 36,624 | | | | 5.625 | | | | 07/20/23 | | | | 37,029 | |
| | | | 37,374 | | | | 5.625 | | | | 08/20/23 | | | | 37,786 | |
| | | | 100,563 | | | | 5.625 | | | | 09/20/23 | | | | 101,672 | |
| | | | 27,585 | | | | 5.375 | | | | 03/20/24 | | | | 27,805 | |
| | | | 252,836 | | | | 5.375 | | | | 04/20/24 | | | | 255,668 | |
| | | | 29,777 | | | | 5.375 | | | | 05/20/24 | | | | 30,174 | |
| | | | 249,028 | | | | 5.375 | | | | 06/20/24 | | | | 252,559 | |
| | | | 139,002 | | | | 5.625 | | | | 07/20/24 | | | | 140,769 | |
| | | | 198,010 | | | | 5.625 | | | | 08/20/24 | | | | 200,553 | |
| | | | 62,796 | | | | 5.625 | | | | 09/20/24 | | | | 63,564 | |
| | | | 71,507 | | | | 5.125 | | | | 11/20/24 | | | | 71,380 | |
| | | | 61,084 | | | | 5.125 | | | | 12/20/24 | | | | 61,379 | |
| | | | 51,656 | | | | 5.375 | | | | 01/20/25 | | | | 52,167 | |
| | | | 24,487 | | | | 5.375 | | | | 02/20/25 | | | | 24,646 | |
| | | | 87,433 | | | | 5.375 | | | | 05/20/25 | | | | 88,342 | |
| | | | 63,504 | | | | 5.625 | | | | 07/20/25 | | | | 63,652 | |
| | | | 32,726 | | | | 5.375 | | | | 02/20/26 | | | | 32,926 | |
| | | | 1,750 | | | | 5.625 | | | | 07/20/26 | | | | 1,753 | |
| | | | 95,196 | | | | 5.375 | | | | 01/20/27 | | | | 95,793 | |
| | | | 30,854 | | | | 5.375 | | | | 02/20/27 | | | | 31,040 | |
| | | | 262,236 | | | | 5.375 | | | | 04/20/27 | | | | 264,867 | |
| | | | 30,074 | | | | 5.375 | | | | 05/20/27 | | | | 30,440 | |
| | | | 30,422 | | | | 5.375 | | | | 06/20/27 | | | | 30,728 | |
| | | | 9,641 | | | | 5.125 | | | | 11/20/27 | | | | 9,614 | |
| | | | 37,201 | | | | 5.125 | | | | 12/20/27 | | | | 37,087 | |
| | | | 80,474 | | | | 5.375 | | | | 01/20/28 | | | | 80,946 | |
| | | | 28,419 | | | | 5.250 | | | | 02/20/28 | | | | 28,512 | |
| | | | 30,945 | | | | 5.375 | | | | 03/20/28 | | | | 31,130 | |
| | | | 178,881 | | | | 5.625 | | | | 07/20/29 | | | | 178,825 | |
| | | | 66,856 | | | | 5.625 | | | | 08/20/29 | | | | 66,867 | |
| | | | 24,107 | | | | 5.625 | | | | 09/20/29 | | | | 24,125 | |
| | | | 80,644 | | | | 5.125 | | | | 10/20/29 | | | | 80,321 | |
| | | | 108,713 | | | | 5.125 | | | | 11/20/29 | | | | 108,245 | |
| | | | 25,979 | | | | 5.125 | | | | 12/20/29 | | | | 25,876 | |
| | | | 35,993 | | | | 5.250 | | | | 01/20/30 | | | | 36,063 | |
| | | | 17,822 | | | | 5.250 | | | | 02/20/30 | | | | 17,857 | |
| | | | 69,477 | | | | 5.250 | | | | 03/20/30 | | | | 69,585 | |
| | | | 110,258 | | | | 5.375 | | | | 04/20/30 | | | | 111,201 | |
| | | | 279,604 | | | | 5.375 | | | | 05/20/30 | | | | 281,988 | |
| | | | 27,746 | | | | 5.375 | | | | 06/20/30 | | | | 27,977 | |
| | | | 242,277 | | | | 5.625 | | | | 07/20/30 | | | | 242,345 | |
| | | | 36,027 | | | | 5.625 | | | | 09/20/30 | | | | 36,034 | |
| | | | 70,264 | | | | 4.875 | | | | 10/20/30 | | | | 69,728 | |
| | | | 385,699 | | | | 4.750 | | | | 12/20/34 | | | | 381,531 | |
| | | | | | | | | | | | | | | | | |
| | | | | | | | | | | | | | | | 4,023,920 | |
| | | |
| | | |
| | | FHLMC – 18.4% |
| | | | 168,414 | | | | 5.000 | | | | 12/01/12 | | | | 169,311 | |
| | | | 29,609 | | | | 4.000 | | | | 02/01/14 | | | | 28,486 | |
| | | | 488,793 | | | | 4.000 | | | | 03/01/14 | | | | 470,256 | |
| | | | 97,408 | | | | 4.000 | | | | 04/01/14 | | | | 93,714 | |
| | | | 108,653 | | | | 4.000 | | | | 05/01/14 | | | | 107,203 | |
| | | | 8,682 | | | | 7.000 | | | | 04/01/15 | | | | 9,143 | |
| | | | 21,819 | | | | 7.000 | | | | 02/01/16 | | | | 23,043 | |
| | | | 65,143 | | | | 6.000 | | | | 03/01/16 | | | | 66,310 | |
| | | |
| | | |
| | | | 337,193 | | | | 4.500 | | | | 05/01/18 | | | | 332,115 | |
| | | | 600,198 | | | | 4.000 | | | | 04/01/19 | | | | 574,303 | |
| | | | 785,735 | | | | 5.500 | | | | 04/01/20 | | | | 795,195 | |
| | | | 4,280,743 | | | | 5.500 | | | | 05/01/21 | | | | 4,314,894 | |
| | | | 2,949,857 | | | | 4.500 | | | | 08/01/23 | | | | 2,841,283 | |
| | | | 32,057 | | | | 7.500 | | | | 03/01/27 | | | | 34,832 | |
| | | | 2,184,016 | | | | 6.500 | | | | 01/01/29 | | | | 2,262,380 | |
| | | | 758,707 | | | | 6.500 | | | | 04/01/29 | | | | 785,456 | |
| | | | 386,179 | | | | 6.500 | | | | 12/01/29 | | | | 400,005 | |
| | | | 277,359 | | | | 7.000 | | | | 04/01/31 | | | | 293,045 | |
| | | | 2,420,048 | | | | 7.000 | | | | 09/01/31 | | | | 2,556,911 | |
| | | | 1,064,921 | | | | 7.000 | | | | 04/01/32 | | | | 1,118,069 | |
| | | | 2,411,003 | | | | 7.000 | | | | 05/01/32 | | | | 2,531,332 | |
| | | | 848,683 | | | | 6.000 | | | | 05/01/33 | | | | 861,669 | |
| | | | 351,402 | | | | 6.500 | | | | 08/01/33 | | | | 362,477 | |
| | | | 1,203,066 | | | | 5.000 | | | | 11/01/35 | | | | 1,173,787 | |
| | | | 3,842,227 | | | | 5.000 | | | | 12/01/35 | | | | 3,748,718 | |
| | | | 12,507,660 | | | | 5.000 | | | | 03/01/36 | | | | 12,203,260 | |
| | | | 10,656,404 | | | | 5.000 | | | | 04/01/36 | | | | 10,397,058 | |
| | | | 17,347,146 | | | | 5.000 | | | | 06/01/36 | | | | 16,928,505 | |
| | | | 5,719,711 | | | | 5.500 | | | | 12/01/37 | | | | 5,693,874 | |
| | | | 4,690,563 | | | | 5.500 | | | | 01/01/38 | | | | 4,669,375 | |
| | | | 54,308,917 | | | | 5.500 | | | | 02/01/38 | | | | 54,071,453 | |
| | | | 410,769 | | | | 5.500 | | | | 04/01/38 | | | | 408,914 | |
| | | | 5,551,082 | | | | 5.500 | | | | 05/01/38 | | | | 5,526,008 | |
| | | | 11,999,991 | | | | 5.500 | | | | 06/01/38 | | | | 11,945,786 | |
| | | | 4,000,000 | | | | 5.500 | | | | 07/01/38 | | | | 3,981,931 | |
| | | | 1,029,473 | | | | 5.500 | | | | 08/01/38 | | | | 1,024,824 | |
| | | | | | | | | | | | | | | | | |
| | | | | | | | | | | | | | | | 152,804,925 | |
| | | |
| | | |
| | | FNMA – 65.4% |
| | | | 66,498 | | | | 4.000 | | | | 06/01/13 | | | | 65,766 | |
| | | | 90,555 | | | | 4.000 | | | | 07/01/13 | | | | 89,893 | |
| | | | 126,115 | | | | 4.000 | | | | 08/01/13 | | | | 124,690 | |
| | | | 241,040 | | | | 4.000 | | | | 09/01/13 | | | | 238,242 | |
| | | | 5,539 | | | | 5.500 | | | | 09/01/13 | | | | 5,642 | |
| | | | 504,949 | | | | 4.000 | | | | 10/01/13 | | | | 498,921 | |
| | | | 12,973 | | | | 5.500 | | | | 02/01/14 | | | | 13,214 | |
| | | | 383,888 | | | | 4.000 | | | | 04/01/14 | | | | 378,388 | |
| | | | 2,731 | | | | 5.500 | | | | 04/01/14 | | | | 2,782 | |
| | | | 6,188 | | | | 5.500 | | | | 04/01/16 | | | | 6,273 | |
| | | | 6,719 | | | | 5.500 | | | | 08/01/16 | | | | 6,810 | |
| | | | 81,402 | | | | 5.500 | | | | 11/01/16 | | | | 82,513 | |
| | | | 146,295 | | | | 5.000 | | | | 12/01/16 | | | | 146,311 | |
| | | | 65,977 | | | | 5.500 | | | | 12/01/16 | | | | 66,879 | |
| | | | 93,956 | | | | 5.500 | | | | 01/01/17 | | | | 95,239 | |
| | | | 27,019 | | | | 5.000 | | | | 02/01/17 | | | | 27,023 | |
| | | | 209,173 | | | | 5.000 | | | | 04/01/17 | | | | 209,197 | |
| | | | 59,329 | | | | 5.000 | | | | 05/01/17 | | | | 59,336 | |
| | | | 6,991 | | | | 5.500 | | | | 05/01/17 | | | | 7,117 | |
| | | | 299,155 | | | | 5.000 | | | | 06/01/17 | | | | 299,189 | |
| | | | 33,144 | | | | 5.500 | | | | 07/01/17 | | | | 33,740 | |
| | | | 4,745 | | | | 5.500 | | | | 09/01/17 | | | | 4,830 | |
| | | | 2,885,240 | | | | 5.000 | | | | 11/01/17 | | | | 2,897,598 | |
| | | | 2,123,172 | | | | 5.000 | | | | 12/01/17 | | | | 2,129,398 | |
| | | | 4,049,338 | | | | 5.000 | | | | 01/01/18 | | | | 4,063,650 | |
| | | |
| | | |
The accompanying notes are an integral part of these financial statements.
GOLDMAN SACHS U.S. MORTGAGES FUND
| | | | | | | | | | | | | | | | | |
| | | Principal
| | Interest
| | Maturity
| | |
| | | Amount | | Rate | | Date | | Value |
| |
Mortgage-Backed Obligations – (continued) |
| | | FNMA – (continued) |
| | | | | | | | | | | | | | | | | |
| | | $ | 55,595 | | | | 5.500 | % | | | 01/01/18 | | | $ | 56,699 | |
| | | | 1,268,595 | | | | 5.000 | | | | 02/01/18 | | | | 1,271,795 | |
| | | | 43,637 | | | | 5.500 | | | | 02/01/18 | | | | 44,509 | |
| | | | 5,941 | | | | 6.000 | | | | 02/01/18 | | | | 6,087 | |
| | | | 7,324,841 | | | | 5.000 | | | | 03/01/18 | | | | 7,339,225 | |
| | | | 4,267,808 | | | | 5.000 | | | | 04/01/18 | | | | 4,264,865 | |
| | | | 79,688 | | | | 5.500 | | | | 04/01/18 | | | | 81,223 | |
| | | | 2,651,171 | | | | 5.000 | | | | 05/01/18 | | | | 2,649,522 | |
| | | | 15,316 | | | | 5.500 | | | | 05/01/18 | | | | 15,594 | |
| | | | 57,546 | | | | 6.000 | | | | 05/01/18 | | | | 58,952 | |
| | | | 12,702,378 | | | | 4.500 | | | | 06/01/18 | | | | 12,516,629 | |
| | | | 3,483,777 | | | | 5.000 | | | | 06/01/18 | | | | 3,487,377 | |
| | | | 174,518 | | | | 5.000 | | | | 07/01/18 | | | | 175,119 | |
| | | | 3,518,867 | | | | 4.000 | | | | 08/01/18 | | | | 3,415,435 | |
| | | | 76,883 | | | | 5.000 | | | | 09/01/18 | | | | 77,136 | |
| | | | 71,440 | | | | 5.000 | | | | 10/01/18 | | | | 71,675 | |
| | | | 520,483 | | | | 5.000 | | | | 11/01/18 | | | | 522,846 | |
| | | | 331,209 | | | | 6.000 | | | | 11/01/18 | | | | 339,308 | |
| | | | 475,545 | | | | 7.000 | | | | 11/01/18 | | | | 501,644 | |
| | | | 533,135 | | | | 4.000 | | | | 12/01/18 | | | | 517,464 | |
| | | | 2,744,117 | | | | 4.500 | | | | 12/01/18 | | | | 2,703,763 | |
| | | | 622,695 | | | | 6.000 | | | | 12/01/18 | | | | 637,919 | |
| | | | 492,997 | | | | 6.000 | | | | 01/01/19 | | | | 505,051 | |
| | | | 11,376 | | | | 5.500 | | | | 02/01/19 | | | | 11,559 | |
| | | | 57,313 | | | | 5.500 | | | | 04/01/19 | | | | 58,093 | |
| | | | 174,034 | | | | 6.000 | | | | 04/01/19 | | | | 179,043 | |
| | | | 256,050 | | | | 4.000 | | | | 05/01/19 | | | | 245,003 | |
| | | | 14,241 | | | | 5.500 | | | | 05/01/19 | | | | 14,497 | |
| | | | 36,378 | | | | 6.000 | | | | 05/01/19 | | | | 37,230 | |
| | | | 75,586 | | | | 5.500 | | | | 07/01/19 | | | | 76,614 | |
| | | | 185,112 | | | | 5.500 | | | | 08/01/19 | | | | 187,631 | |
| | | | 90,965 | | | | 5.500 | | | | 09/01/19 | | | | 92,202 | |
| | | | 1,227,174 | | | | 6.000 | | | | 09/01/19 | | | | 1,256,139 | |
| | | | 1,257,128 | | | | 4.000 | | | | 10/01/19 | | | | 1,202,891 | |
| | | | 198,824 | | | | 5.500 | | | | 10/01/19 | | | | 201,529 | |
| | | | 60,167 | | | | 5.500 | | | | 11/01/19 | | | | 60,985 | |
| | | | 44,180 | | | | 5.500 | | | | 12/01/19 | | | | 44,782 | |
| | | | 349,212 | | | | 5.500 | | | | 02/01/20 | | | | 354,836 | |
| | | | 1,544,724 | | | | 6.000 | | | | 12/01/20 | | | | 1,581,184 | |
| | | | 79,143 | | | | 5.500 | | | | 01/01/21 | | | | 80,219 | |
| | | | 128,441 | | | | 7.000 | | | | 09/01/21 | | | | 135,089 | |
| | | | 360,785 | | | | 7.000 | | | | 06/01/22 | | | | 379,359 | |
| | | | 172,476 | | | | 7.000 | | | | 07/01/22 | | | | 181,355 | |
| | | | 933,134 | | | | 5.000 | | | | 07/01/23 | | | | 927,456 | |
| | | | 46,296 | | | | 6.500 | | | | 01/01/29 | | | | 48,017 | |
| | | | 3,664 | | | | 7.000 | | | | 01/01/29 | | | | 3,855 | |
| | | | 124,201 | | | | 6.500 | | | | 04/01/29 | | | | 128,664 | |
| | | | 83,425 | | | | 6.500 | | | | 05/01/29 | | | | 86,422 | |
| | | | 837,116 | | | | 6.500 | | | | 06/01/29 | | | | 867,197 | |
| | | | 420,312 | | | | 6.500 | | | | 07/01/29 | | | | 435,414 | |
| | | | 40,411 | | | | 6.500 | | | | 09/01/29 | | | | 41,863 | |
| | | | 3,606 | | | | 7.000 | | | | 09/01/29 | | | | 3,792 | |
| | | | 7,183 | | | | 7.000 | | | | 02/01/30 | | | | 7,551 | |
| | | | 81,456 | | | | 7.000 | | | | 08/01/31 | | | | 85,238 | |
| | | | 3,808 | | | | 7.000 | | | | 03/01/32 | | | | 4,002 | |
| | | | 2,803 | | | | 7.000 | | | | 04/01/32 | | | | 2,946 | |
| | | |
| | | |
| | | | 10,806 | | | | 7.000 | | | | 05/01/32 | | | | 11,356 | |
| | | | 27,651 | | | | 7.000 | | | | 06/01/32 | | | | 29,057 | |
| | | | 3,676 | | | | 7.000 | | | | 07/01/32 | | | | 3,863 | |
| | | | 6,631 | | | | 6.500 | | | | 08/01/32 | | | | 6,849 | |
| | | | 252,406 | | | | 6.500 | | | | 11/01/32 | | | | 260,706 | |
| | | | 204,214 | | | | 6.000 | | | | 01/01/33 | | | | 207,744 | |
| | | | 5,310 | | | | 6.000 | | | | 02/01/33 | | | | 5,402 | |
| | | | 1,606,872 | | | | 5.500 | | | | 04/01/33 | | | | 1,607,146 | |
| | | | 762,242 | | | | 5.500 | | | | 06/01/33 | | | | 762,372 | |
| | | | 123,787 | | | | 6.000 | | | | 06/01/33 | | | | 125,776 | |
| | | | 3,558,860 | | | | 5.500 | | | | 07/01/33 | | | | 3,559,467 | |
| | | | 41,068 | | | | 6.000 | | | | 07/01/33 | | | | 41,728 | |
| | | | 646,577 | | | | 5.500 | | | | 09/01/33 | | | | 646,687 | |
| | | | 101,777 | | | | 6.000 | | | | 09/01/33 | | | | 103,412 | |
| | | | 639,832 | | | | 5.500 | | | | 10/01/33 | | | | 639,941 | |
| | | | 25,476 | | | | 6.000 | | | | 10/01/33 | | | | 25,886 | |
| | | | 1,377,170 | | | | 5.500 | | | | 12/01/33 | | | | 1,378,265 | |
| | | | 14,309,897 | | | | 5.500 | | | | 01/01/34 | | | | 14,312,336 | |
| | | | 222,577 | | | | 5.500 | | | | 07/01/34 | | | | 222,361 | |
| | | | 7,588,609 | | | | 5.500 | | | | 11/01/34 | | | | 7,582,787 | |
| | | | 66,252 | | | | 6.000 | | | | 11/01/34 | | | | 67,234 | |
| | | | 1,751,537 | | | | 6.000 | | | | 12/01/34 | | | | 1,777,503 | |
| | | | 645,535 | | | | 7.500 | | | | 05/01/35 | | | | 690,104 | |
| | | | 6,302,072 | | | | 5.000 | | | | 01/01/36 | | | | 6,150,667 | |
| | | | 418,514 | | | | 5.000 | | | | 06/01/36 | | | | 408,721 | |
| | | | 354,168 | | | | 7.500 | | | | 08/01/36 | | | | 374,926 | |
| | | | 7,279,494 | | | | 6.500 | | | | 09/01/36 | | | | 7,472,614 | |
| | | | 24,842 | | | | 5.500 | | | | 10/01/36 | | | | 24,796 | |
| | | | 24,119 | | | | 5.000 | | | | 11/01/36 | | | | 23,524 | |
| | | | 737,846 | | | | 6.000 | | | | 11/01/36 | | | | 748,197 | |
| | | | 12,711,668 | | | | 6.500 | | | | 11/01/36 | | | | 13,048,901 | |
| | | | 1,416,782 | | | | 5.000 | | | | 12/01/36 | | | | 1,381,859 | |
| | | | 1,448,158 | | | | 6.500 | | | | 12/01/36 | | | | 1,486,577 | |
| | | | 174,024 | | | | 7.500 | | | | 12/01/36 | | | | 184,224 | |
| | | | 4,387,866 | | | | 7.000 | | | | 01/01/37 | | | | 4,582,988 | |
| | | | 854,673 | | | | 5.000 | | | | 02/01/37 | | | | 833,423 | |
| | | | 3,545,784 | | | | 5.000 | | | | 03/01/37 | | | | 3,457,626 | |
| | | | 5,008,837 | | | | 6.500 | | | | 03/01/37 | | | | 5,141,718 | |
| | | | 4,817,184 | | | | 5.000 | | | | 04/01/37 | | | | 4,697,418 | |
| | | | 23,434,147 | | | | 7.000 | | | | 04/01/37 | | | | 24,481,406 | |
| | | | 3,247,674 | | | | 5.000 | | | | 05/01/37 | | | | 3,166,928 | |
| | | | 3,575,406 | | | | 5.500 | | | | 05/01/37 | | | | 3,568,552 | |
| | | | 1,786,037 | | | | 7.500 | | | | 05/01/37 | | | | 1,889,388 | |
| | | | 10,037,762 | | | | 5.000 | | | | 06/01/37 | | | | 9,788,203 | |
| | | | 872,146 | | | | 5.500 | | | | 06/01/37 | | | | 870,474 | |
| | | | 3,756,345 | | | | 5.000 | | | | 07/01/37 | | | | 3,662,955 | |
| | | | 9,030,630 | | | | 5.500 | | | | 07/01/37 | | | | 9,013,318 | |
| | | | 1,391,241 | | | | 6.500 | | | | 07/01/37 | | | | 1,428,072 | |
| | | | 204,889 | | | | 7.000 | | | | 07/01/37 | | | | 212,780 | |
| | | | 1,756,394 | | | | 7.500 | | | | 07/01/37 | | | | 1,858,743 | |
| | | | 2,289,336 | | | | 5.000 | | | | 08/01/37 | | | | 2,232,419 | |
| | | | 3,098,994 | | | | 5.500 | | | | 08/01/37 | | | | 3,093,053 | |
| | | | 3,985,677 | | | | 6.500 | | | | 08/01/37 | | | | 4,091,191 | |
| | | | 74,144 | | | | 7.000 | | | | 08/01/37 | | | | 77,000 | |
| | | | 58,492 | | | | 7.500 | | | | 08/01/37 | | | | 61,441 | |
| | | | 961,377 | | | | 5.000 | | | | 09/01/37 | | | | 937,482 | |
| | | |
| | | |
The accompanying notes are an integral part of these financial statements.
GOLDMAN SACHS U.S. MORTGAGES FUND
Schedule of Investments (continued)
September 30, 2008 (Unaudited)
| | | | | | | | | | | | | | | | | |
| | | Principal
| | Interest
| | Maturity
| | |
| | | Amount | | Rate | | Date | | Value |
| |
Mortgage-Backed Obligations – (continued) |
| | | FNMA – (continued) |
| | | | | | | | | | | | | | | | | |
| | | $ | 8,178,560 | | | | 5.500 | % | | | 09/01/37 | | | $ | 8,162,882 | |
| | | | 3,709,025 | | | | 6.500 | | | | 09/01/37 | | | | 3,807,221 | |
| | | | 22,768,933 | | | | 7.000 | | | | 09/01/37 | | | | 23,816,172 | |
| | | | 4,901,795 | | | | 7.500 | | | | 09/01/37 | | | | 5,179,306 | |
| | | | 651,469 | | | | 5.000 | | | | 10/01/37 | | | | 635,273 | |
| | | | 712,815 | | | | 5.500 | | | | 10/01/37 | | | | 711,449 | |
| | | | 1,308,578 | | | | 6.500 | | | | 10/01/37 | | | | 1,343,238 | |
| | | | 507,473 | | | | 7.000 | | | | 10/01/37 | | | | 527,017 | |
| | | | 2,943,176 | | | | 7.500 | | | | 10/01/37 | | | | 3,110,120 | |
| | | | 4,592,986 | | | | 5.000 | | | | 11/01/37 | | | | 4,478,795 | |
| | | | 421,291 | | | | 5.500 | | | | 11/01/37 | | | | 420,483 | |
| | | | 128,694 | | | | 6.500 | | | | 11/01/37 | | | | 132,088 | |
| | | | 9,329,195 | | | | 7.500 | | | | 11/01/37 | | | | 9,862,370 | |
| | | | 5,525,023 | | | | 8.000 | | | | 11/01/37 | | | | 5,902,030 | |
| | | | 1,438,334 | | | | 5.000 | | | | 12/01/37 | | | | 1,402,575 | |
| | | | 541,562 | | | | 5.500 | | | | 12/01/37 | | | | 540,524 | |
| | | | 931,822 | | | | 6.500 | | | | 12/01/37 | | | | 956,491 | |
| | | | 85,284 | | | | 7.500 | | | | 12/01/37 | | | | 90,254 | |
| | | | 3,462,161 | | | | 8.000 | | | | 12/01/37 | | | | 3,667,845 | |
| | | | 29,111 | | | | 5.000 | | | | 01/01/38 | | | | 28,387 | |
| | | | 1,511,683 | | | | 5.500 | | | | 01/01/38 | | | | 1,508,785 | |
| | | | 126,012 | | | | 8.000 | | | | 01/01/38 | | | | 133,265 | |
| | | | 31,126 | | | | 5.000 | | | | 02/01/38 | | | | 30,352 | |
| | | | 1,049,185 | | | | 5.500 | | | | 02/01/38 | | | | 1,047,108 | |
| | | | 721,447 | | | | 5.000 | | | | 03/01/38 | | | | 703,438 | |
| | | | 10,274,670 | | | | 5.500 | | | | 03/01/38 | | | | 10,253,945 | |
| | | | 822,366 | | | | 5.500 | | | | 03/01/38 | | | | 820,708 | |
| | | | 16,331,356 | | | | 5.000 | | | | 04/01/38 | | | | 15,923,690 | |
| | | | 1,371,247 | | | | 5.500 | | | | 04/01/38 | | | | 1,368,481 | |
| | | | 8,474,860 | | | | 5.000 | | | | 05/01/38 | | | | 8,263,310 | |
| | | | 7,700,879 | | | | 5.500 | | | | 05/01/38 | | | | 7,685,347 | |
| | | | 39,353,968 | | | | 5.500 | | | | 06/01/38 | | | | 39,274,587 | |
| | | | 96,516 | | | | 6.500 | | | | 06/01/38 | | | | 99,071 | |
| | | | 1,995,434 | | | | 5.000 | | | | 07/01/38 | | | | 1,945,624 | |
| | | | 5,304,142 | | | | 5.500 | | | | 07/01/38 | | | | 5,293,444 | |
| | | | 262,055 | | | | 6.000 | | | | 07/01/38 | | | | 265,717 | |
| | | | 2,982,207 | | | | 5.000 | | | | 08/01/38 | | | | 2,909,667 | |
| | | | 2,642,536 | | | | 6.000 | | | | 08/01/38 | | | | 2,679,196 | |
| | | | 45,357,460 | | | | 6.000 | | | | 09/01/38 | | | | 46,045,000 | |
| | | | 71,000,000 | | | | 5.500 | | | | TBA-15yr | (e) | | | 70,800,348 | |
| | | | 21,000,000 | | | | 6.000 | | | | TBA-15yr | (e) | | | 21,269,052 | |
| | | | 12,000,000 | | | | 6.500 | | | | TBA-15yr | (e) | | | 12,303,744 | |
| | | | | | | | | | | | | | | | | |
| | | | | | | | | | | | | | | | 541,753,100 | |
| | | |
| | | |
| | | GNMA – 0.0% |
| | | | 1,018 | | | | 6.000 | | | | 12/15/23 | | | | 1,053 | |
| | | | 30,890 | | | | 6.000 | | | | 03/15/26 | | | | 31,509 | |
| | | | 25,904 | | | | 6.000 | | | | 04/15/26 | | | | 26,423 | |
| | | | | | | | | | | | | | | | | |
| | | | | | | | | | | | | | | | 58,985 | |
| | | |
| | | |
| | | TOTAL FEDERAL AGENCIES | | $ | 712,441,253 | |
| | | |
| | | |
| | | TOTAL MORTGAGE-BACKED OBLIGATIONS |
| | | (Cost $933,280,229) | | $ | 872,907,272 | |
| | | |
| | | |
| | | | | | | | | | | | | | | | | |
| | | | | | | | | | | | | | | | | |
Agency Debenture(f) – 0.4% |
| | | | | | | | | | | | | | | | | |
| | | | | | | | | | | | | | | | | |
| | | Tennessee Valley Authority |
| | | $ | 2,800,000 | | | | 5.375 | % | | | 04/01/56 | | | $ | 2,965,478 | |
| | | (Cost $2,791,709) | | | | |
| | | |
| | | |
| | | | | | | | | | | | | | | | | |
| | | | | | | | | | | | | | | | | |
Asset-Backed Securities – 0.9% |
| | | | | | | | | | | | | | | | | |
| | | | | | | | | | | | | | | | | |
| | | Home Equity – 0.9% |
| | | CIT Mortgage Loan Trust Series 2007-1, Class 2A1(a)(d) |
| | | $ | 1,978,890 | | | | 4.207 | % | | | 10/25/37 | | | $ | 1,682,057 | |
| | | CIT Mortgage Loan Trust Series 2007-1, Class 2A2(a)(d) |
| | | | 570,000 | | | | 4.457 | | | | 10/25/37 | | | | 285,000 | |
| | | CIT Mortgage Loan Trust Series 2007-1, Class 2A3(a)(d) |
| | | | 1,100,000 | | | | 4.657 | | | | 10/25/37 | | | | 412,500 | |
| | | ContiMortgage Home Equity Loan Trust Series 1999-1, Class A7(a) |
| | | | 254 | | | | 6.970 | | | | 12/25/13 | | | | 250 | |
| | | Countrywide Home Equity Loan Trust Series 2002-E, Class A(a) |
| | | | 48,350 | | | | 2.748 | | | | 10/15/28 | | | | 33,562 | |
| | | Countrywide Home Equity Loan Trust Series 2003-D, Class A(a) |
| | | | 219,211 | | | | 2.748 | | | | 06/15/29 | | | | 123,461 | |
| | | Countrywide Home Equity Loan Trust Series 2004-G, Class 2A(a) |
| | | | 78,484 | | | | 2.708 | | | | 12/15/29 | | | | 52,576 | |
| | | Countrywide Home Equity Loan Trust Series 2004-I, Class A(a) |
| | | | 754,900 | | | | 2.778 | | | | 02/15/34 | | | | 436,115 | |
| | | Countrywide Home Equity Loan Trust Series 2004-J, Class 2A(a) |
| | | | 74,842 | | | | 2.778 | | | | 12/15/33 | | | | 44,625 | |
| | | Countrywide Home Equity Loan Trust Series 2004-O, Class 1A(a) |
| | | | 282,010 | | | | 2.768 | | | | 02/15/34 | | | | 188,218 | |
| | | Countrywide Home Equity Loan Trust Series 2005-A, Class 2A(a) |
| | | | 512,233 | | | | 2.728 | | | | 04/15/35 | | | | 317,005 | |
| | | GMAC Mortgage Corp. Loan Trust Series 2007-HE3, Class 1A1 |
| | | | 691,038 | | | | 7.000 | | | | 09/25/37 | | | | 384,822 | |
| | | GMAC Mortgage Corp. Loan Trust Series 2007-HE3, Class 2A1 |
| | | | 702,832 | | | | 7.000 | | | | 09/25/37 | | | | 340,891 | |
| | | Household Home Equity Loan Trust Series 2007-3, Class APT(a) |
| | | | 3,005,583 | | | | 4.388 | | | | 11/20/36 | | | | 2,284,712 | |
| | | |
| | | |
The accompanying notes are an integral part of these financial statements.
GOLDMAN SACHS U.S. MORTGAGES FUND
| | | | | | | | | | | | | | | | | |
| | | Principal
| | Interest
| | Maturity
| | |
| | | Amount | | Rate | | Date | | Value |
| |
Asset-Backed Securities – (continued) |
| | | Home Equity – (continued) |
| | | | | | | | | | | | | | | | | |
| | | Morgan Stanley Capital, Inc. Series 2004-HE1, Class A4(a) |
| | | $ | 548,071 | | | | 3.577 | % | | | 01/25/34 | | | $ | 493,264 | |
| | | Residential Asset Mortgage Products, Inc. Series 2004-RZ1, Class AII(a) |
| | | | 257,558 | | | | 3.687 | | | | 03/25/34 | | | | 171,075 | |
| | | |
| | | |
| | | TOTAL ASSET-BACKED SECURITIES |
| | | (Cost $10,827,638) | | $ | 7,250,133 | |
| | | |
| | | |
| | | TOTAL INVESTMENTS BEFORE REPURCHASE AGREEMENT – 106.7% |
| | | (Cost $946,899,576) | | $ | 883,122,883 | |
| | | |
| | | |
| | | | | | | | | | | | | | | | | |
| | | | | | | | | | | | | | | | | |
Repurchase Agreement(g) – 5.5% |
| | | | | | | | | | | | | | | | | |
| | | | | | | | | | | | | | | | | |
| | | Joint Repurchase Agreement Account II |
| | | $ | 45,700,000 | | | | 1.944 | % | | | 10/01/08 | | | $ | 45,700,000 | |
| | | Maturity Value: $45,702,468 |
| | | (Cost $45,700,000) | | | | |
| | | |
| | | |
| | | TOTAL INVESTMENTS – 112.2% |
| | | (Cost $992,599,576) | | $ | 928,822,883 | |
| | | |
| | | |
| | | LIABILITIES IN EXCESS OF OTHER ASSETS – (12.2)% | | | (100,676,417 | ) |
| | | |
| | | |
| | | NET ASSETS – 100.0% | | $ | 828,146,466 | |
| | | |
| | | |
The percentage shown for each investment category reflects the value of investments in that category as a percentage of net assets.
| | |
| (a) | | Variable rate security. Interest rate disclosed is that which is in effect at September 30, 2008. |
| |
| (b) | | Represents security with notional or nominal principal amount. The actual effective yield of this security is different than the stated interest rate. |
| |
| (c) | | Security is issued with zero coupon and interest rate is contingent upon LIBOR reaching a predetermined level. |
| |
| (d) | | Securities are exempt from registration under rule 144A of the securities Act of 1933. Under procedures approved by the Board of Trustees, such securities have been determined to be liquid by the investment adviser and may be resold, normally to qualified institutional buyers in transactions exempt from registration. Total market value of Rule 144A securities amounted to $2,721,221, which represents approximately 0.3% of net assets as of September 30, 2008. |
| |
| (e) | | TBA (To Be Announced) Securities are purchased on a forward commitment basis with an approximate principal amount and no defined maturity date. The actual principal and maturity date will be determined upon settlement when the specific mortgage pools are assigned. Total market value of TBA securities amounts to $104,373,144 which represents approximately 12.6% (excluding forward sales contracts, if any) of net assets as of September 30, 2008. |
| |
| (f) | | A portion of this security is segregated as collateral for initial margin requirement on futures transactions. |
| |
| (g) | | Joint repurchase agreement was entered into on September 30, 2008. Additional information appears on page 63. |
| | | | | | | |
| | | |
| | | |
| | | Investment Abbreviations: |
| | | FHLMC | | — | | Federal Home Loan Mortgage Corp. |
| | | FNMA | | — | | Federal National Mortgage Association |
| | | GNMA | | — | | Government National Mortgage Association |
| | | LIBOR | | — | | London Interbank Offered Rate |
| | | REMIC | | — | | Real Estate Mortgage Investment Conduit |
| | | |
| | | |
The accompanying notes are an integral part of these financial statements.
GOLDMAN SACHS U.S. MORTGAGES FUND
Schedule of Investments (continued)
September 30, 2008 (Unaudited)
ADDITIONAL INVESTMENT INFORMATION
FORWARD SALES CONTRACT — At September 30, 2008, the Fund had the following forward sales contract:
| | | | | | | | | | | | | | | | | | | |
| | | Interest
| | | Maturity
| | Settlement
| | | Principal
| | | | |
| Description | | Rate | | | Date | | Date | | | Amount | | | Value | |
| | |
| FNMA (Proceeds Receivable: $50,205,313) | | | 7.000% | | | TBA-15yr(e) | | | 10/14/08 | | | $ | 48,000,000 | | | $ | 50,145,022 | |
| |
| |
FUTURES CONTRACTS — At September 30, 2008, the following futures contracts were open:
| | | | | | | | | | | | | | | |
| | | Number of
| | | | | | | | | |
| | | Contracts
| | | Settlement
| | Notional
| | | Unrealized
| |
| Type | | Long (Short) | | | Month | | Value | | | Gain (Loss) | |
| | |
| Eurodollars | | | (15 | ) | | December 2008 | | $ | (3,620,438 | ) | | $ | 13,690 | |
| Eurodollars | | | (15 | ) | | March 2009 | | | (3,638,813 | ) | | | (3,989 | ) |
| Eurodollars | | | (15 | ) | | June 2009 | | | (3,636,000 | ) | | | (3,801 | ) |
| Eurodollars | | | (24 | ) | | September 2009 | | | (5,812,500 | ) | | | (7,459 | ) |
| Eurodollars | | | (24 | ) | | December 2009 | | | (5,793,600 | ) | | | 3,641 | |
| U.S. Treasury Bonds | | | 54 | | | December 2008 | | | 6,327,281 | | | | (22,878 | ) |
| 2 Year U.S. Treasury Notes | | | 124 | | | December 2008 | | | 26,466,250 | | | | 91,407 | |
| 5 Year U.S. Treasury Notes | | | (191 | ) | | December 2008 | | | (21,436,766 | ) | | | (18,705 | ) |
| 10 Year U.S. Treasury Notes | | | 186 | | | December 2008 | | | 21,320,250 | | | | (130,874 | ) |
| |
| |
TOTAL | | | | | | | | | | | | $ | (78,968 | ) |
| |
| |
INTEREST RATE SWAP CONTRACTS — At September 30, 2008, the Fund had outstanding swap contracts with the following terms:
| | | | | | | | | | | | | | | | | | | | | |
| | | | | | | | | Rates Exchanged | | | | | | |
| | | Notional
| | | | | | Payments
| | Payments
| | Upfront Payments
| | | | |
| | | Amount
| | | Termination
| | | received by
| | made by
| | made (received)
| | | Unrealized
| |
| Swap Counterparty | | (000s) | | | Date | | | the Fund | | the Fund | | by the Fund | | | Gain (Loss) | |
| | |
| Banc of America Securities LLC | | $ | 12,000 | | | | 09/02/10 | | | 4.309% | | 3 month LIBOR | | $ | — | | | $ | 226,948 | |
| | | | 15,000 | | | | 10/06/10 | | | 4.703 | | 3 month LIBOR | | | — | | | | 600,773 | |
| | | | 13,000 | (a) | | | 12/17/13 | | | 4.250 | | 3 month LIBOR | | | (53,232 | ) | | | 111,539 | |
| | | | 1,800 | (a) | | | 12/17/18 | | | 4.750 | | 3 month LIBOR | | | 59,925 | | | | (27,054 | ) |
| | | | 6,300 | (a) | | | 12/17/23 | | | 3 month LIBOR | | 4.750% | | | 21,197 | | | | (81,609 | ) |
| | | | 1,600 | (a) | | | 12/17/28 | | | 3 month LIBOR | | 5.000 | | | (84,182 | ) | | | 23,380 | |
| | | | 3,000 | (a) | | | 12/17/28 | | | 5.000 | | 3 month LIBOR | | | (50,663 | ) | | | 164,668 | |
| Credit Suisse First Boston Corp. | | | 12,300 | (a) | | | 12/17/13 | | | 4.250 | | 3 month LIBOR | | | 75,685 | | | | (20,519 | ) |
| | | | 4,500 | (a) | | | 12/17/18 | | | 4.750 | | 3 month LIBOR | | | 89,803 | | | | (7,629 | ) |
| | | | 8,500 | (a) | | | 12/17/23 | | | 3 month LIBOR | | 4.750 | | | 104,403 | | | | (185,913 | ) |
| | | | 4,300 | (a) | | | 12/17/28 | | | 3 month LIBOR | | 5.000 | | | (141,149 | ) | | | (22,259 | ) |
| | | | 1,900 | (a) | | | 12/17/38 | | | 5.000 | | 3 month LIBOR | | | (17,140 | ) | | | 105,003 | |
| Deutsche Bank Securities, Inc. | | | 35,300 | (a) | | | 12/17/13 | | | 4.250 | | 3 month LIBOR | | | 246,009 | | | | (87,686 | ) |
| | | | 3,400 | (a) | | | 12/17/18 | | | 4.750 | | 3 month LIBOR | | | 59,500 | | | | 2,587 | |
| | | | 3,200 | (a) | | | 12/17/28 | | | 3 month LIBOR | | 5.000 | | | (83,367 | ) | | | (38,238 | ) |
| JPMorgan Securities, Inc. | | | 16,700 | (a) | | | 12/17/13 | | | 3 month LIBOR | | 4.250 | | | (241,039 | ) | | | 122,009 | |
| | | | 3,600 | (a) | | | 12/17/13 | | | 4.250 | | 3 month LIBOR | | | 23,391 | | | | (7,245 | ) |
| | | | 19,700 | (a) | | | 12/17/15 | | | 4.500 | | 3 month LIBOR | | | 78,328 | | | | 105,891 | |
| | | | 16,700 | (a) | | | 12/17/18 | | | 4.750 | | 3 month LIBOR | | | 116,728 | | | | 188,232 | |
| | | | 45,800 | (a) | | | 12/17/23 | | | 3 month LIBOR | | 4.750 | | | 656,901 | | | | (1,096,093 | ) |
| | | | 1,900 | (a) | | | 12/17/28 | | | 3 month LIBOR | | 5.000 | | | (99,071 | ) | | | 26,868 | |
| | | | 3,600 | (a) | | | 12/17/38 | | | 5.000 | | 3 month LIBOR | | | (33,859 | ) | | | 200,337 | |
| |
| |
TOTAL | | | | | | | | | | | | | | $ | 728,168 | | | $ | 303,990 | |
| |
| |
| | |
| (a) | | Represents forward starting interest rate swaps whose effective dates of commencement of accruals and cash flows occur subsequent to September 30, 2008. |
The accompanying notes are an integral part of these financial statements.
GOLDMAN SACHS SINGLE SECTOR FIXED INCOME FUNDS
| |
| ADDITIONAL INVESTMENT INFORMATION (continued) | |
JOINT REPURCHASE AGREEMENT ACCOUNT II — At September 30, 2008, certain Funds had undivided interests in the Joint Repurchase Agreement Account II, as follows:
| | | | | |
| Fund | | Principal Amount | |
| | |
| High Yield | | $ | 396,100,000 | |
| |
| |
| Investment Grade Credit | | | 19,600,000 | |
| |
| |
| Local Emerging Market Debt | | | 44,600,000 | |
| |
| |
| U.S. Mortgages | | | 45,700,000 | |
| |
| |
REPURCHASE AGREEMENTS
| | | | | | | | | | | | | | | | | |
| | |
| | | Principal
| | | Interest
| | | Maturity
| | | Maturity
| |
| Counterparty | | Amount | | | Rate | | | Date | | | Value | |
| | |
| ABN Amro, Inc. | | $ | 1,000,000,000 | | | | 2.25 | % | | | 10/01/08 | | | $ | 1,000,062,500 | |
| |
| |
| Banc of America Securities LLC | | | 1,500,000,000 | | | | 2.25 | | | | 10/01/08 | | | | 1,500,093,750 | |
| |
| |
| Barclays Capital, Inc. | | | 100,000,000 | | | | 0.25 | | | | 10/01/08 | | | | 100,000,694 | |
| |
| |
| Barclays Capital, Inc. | | | 497,800,000 | | | | 1.00 | | | | 10/01/08 | | | | 497,813,828 | |
| |
| |
| Barclays Capital, Inc. | | | 5,850,000,000 | | | | 2.25 | | | | 10/01/08 | | | | 5,850,365,625 | |
| |
| |
| Credit Suisse Securities (USA) LLC | | | 150,000,000 | | | | 1.80 | | | | 10/01/08 | | | | 150,007,500 | |
| |
| |
| Deutsche Bank Securities, Inc. | | | 300,000,000 | | | | 2.75 | | | | 10/01/08 | | | | 300,022,917 | |
| |
| |
| Greenwich Capital Markets | | | 750,000,000 | | | | 2.50 | | | | 10/01/08 | | | | 750,052,083 | |
| |
| |
| JPMorgan Securities | | | 1,600,000,000 | | | | 2.00 | | | | 10/01/08 | | | | 1,600,088,889 | |
| |
| |
| Merrill Lynch & Co., Inc. | | | 2,000,000,000 | | | | 1.50 | | | | 10/01/08 | | | | 2,000,083,333 | |
| |
| |
| Morgan Stanley & Co. | | | 800,000,000 | | | | 0.40 | | | | 10/01/08 | | | | 800,008,889 | |
| |
| |
| Morgan Stanley & Co. | | | 500,000,000 | | | | 1.75 | | | | 10/01/08 | | | | 500,024,306 | |
| |
| |
| UBS Securities LLC | | | 950,000,000 | | | | 1.50 | | | | 10/01/08 | | | | 950,039,583 | |
| |
| |
TOTAL | | | | | | | | | | | | | | $ | 15,998,663,897 | |
| |
| |
At September 30, 2008, the Joint Repurchase Agreement Account II was fully collateralized by Federal Farm Credit Bank 0.000%, due 01/08/09; Federal Home Loan Bank, 0.000% to 5.250%, due 10/27/08 to 06/05/17; Federal Home Loan Mortgage Corp., 3.250% to 7.500%, due 03/05/09 to 12/01/47; Federal National Mortgage Association, 3.000% to 15.500%, due 12/01/08 to 10/01/48 and U.S. Treasury Note, 7.500%, due 11/15/16. The aggregate market value of the collateral, including accrued interest, was $16,356,152,736.
The accompanying notes are an integral part of these financial statements.
GOLDMAN SACHS SINGLE SECTOR FIXED INCOME FUNDS
Statements of Assets and Liabilities
September 30, 2008 (Unaudited)
| | | | | | | | | |
| | | | | Emerging Markets
| | | |
| | | | | Debt Fund | | | |
|
| | | Assets: |
| | | | | | | | | |
| | | Investments in securities, at value (identified cost $218,290,458, $3,883,976,203, $276,584,727, $129,136,109 and $946,899,576, respectively) | | $ | 197,197,386 | | | |
| | | Repurchase agreement, at value which equals cost | | | — | | | |
| | | Cash | | | 2,501,079 | | | |
| | | Foreign currencies, at value (identified cost $5,605, $833,103, $0, $224,253 and $0, respectively) | | | 5,603 | | | |
| | | Receivables: | | | | | | |
| | | Investment securities sold, at value | | | 5,267,904 | | | |
| | | Interest and dividends, at value | | | 4,268,895 | | | |
| | | Due from broker — swap collateral(a) | | | 1,250,000 | | | |
| | | Fund shares sold | | | 413,188 | | | |
| | | Due from broker — variation margin, at value(b) | | | 156,250 | | | |
| | | Reimbursement from investment adviser | | | 118,255 | | | |
| | | Due from custodian | | | — | | | |
| | | Due from broker | | | — | | | |
| | | Deferred offering costs | | | — | | | |
| | | Forward foreign currency exchange contracts, at value | | | 1,371,561 | | | |
| | | Swap contracts, at value (includes upfront payments made of $0, $0, $217,715, $0 and $594,475, respectively) | | | 167,376 | | | |
| | | Other assets, at value | | | 570 | | | |
| | | |
| | | |
| | | Total assets | | | 212,718,067 | | | |
| | | |
| | | |
| | | | | | | | | |
|
| | | Liabilities: |
| | | | | | | | | |
| | | Due to Custodian | | | — | | | |
| | | Payables: | | | | | | |
| | | Investment securities purchased, at value | | | 4,907,708 | | | |
| | | Fund shares redeemed | | | 4,327,647 | | | |
| | | Amounts owed to affiliates | | | 176,257 | | | |
| | | Due to broker — variation margin, at value | | | 159,179 | | | |
| | | Income distribution | | | 45,191 | | | |
| | | Forward sales contract, at value (proceeds received $0, $0, $2,028,125, $0, and $50,205,313) | | | — | | | |
| | | Forward foreign currency exchange contracts, at value | | | 677,258 | | | |
| | | Swap contracts, at value (includes upfront payments received of $0, $0, $33,471, $0 and $133,693, respectively) | | | 291,497 | | | |
| | | Accrued expenses and other liabilities | | | 115,932 | | | |
| | | |
| | | |
| | | Total liabilities | | | 10,700,669 | | | |
| | | |
| | | |
| | | | | | | | | |
|
| | | Net Assets: |
| | | | | | | | | |
| | | Paid-in capital | | | 228,373,196 | | | |
| | | Accumulated undistributed (distribution in excess of) net investment income | | | 224,336 | | | |
| | | Accumulated net realized gain (loss) from investment, futures, swap and foreign currency related transactions | | | (6,078,440 | ) | | |
| | | Net unrealized loss on investments, futures, swaps and translation of assets and liabilities denominated in foreign currencies | | | (20,501,694 | ) | | |
| | | |
| | | |
| | | NET ASSETS | | $ | 202,017,398 | | | |
| |
| |
| | | | | | | | | |
| | | Net Assets: | | | | | | |
| | | Class A | | $ | 65,903,987 | | | |
| | | Class B | | | — | | | |
| | | Class C | | | 1,978,432 | | | |
| | | Institutional | | | 134,134,979 | | | |
| | | Service | | | — | | | |
| | | Separate Account Institutional Shares | | | — | | | |
| | | Class IR | | | — | | | |
| | | Class R | | | — | | | |
| |
| |
| | | | | | | | | |
| | | Total Net Assets | | $ | 202,017,398 | | | |
| |
| |
| | | Shares Outstanding $0.001 par value (unlimited shares authorized): | | | | | | |
| | | Class A | | | 6,309,214 | | | |
| | | Class B | | | — | | | |
| | | Class C | | | 189,871 | | | |
| | | Institutional | | | 12,831,832 | | | |
| | | Service | | | — | | | |
| | | Separate Account Institutional Shares | | | — | | | |
| | | Class IR | | | — | | | |
| | | Class R | | | — | | | |
| |
| |
| | | Net asset value, offering and redemption price per share:(c) | | | | | | |
| | | Class A | | | $10.45 | | | |
| | | Class B | | | — | | | |
| | | Class C | | | 10.42 | | | |
| | | Institutional | | | 10.45 | | | |
| | | Service | | | — | | | |
| | | Separate Account Institutional Shares | | | — | | | |
| | | Class IR | | | — | | | |
| | | Class R | | | — | | | |
| |
| |
| |
| (a) | Represents restricted cash on deposit with the counterparties as collateral for swaps for Emerging Markets Debt, Investment Grade Credit and U.S. Mortgages, respectively. |
| (b) | Includes cash on deposit with counterparty of $156,250 for Emerging Markets Debt Fund, relating to initial margin requirements on futures transactions. |
| (c) | Maximum public offering price per share for Class A shares of Emerging Markets Debt, High Yield, Investment Grade Credit, Local Emerging Markets Debt and U.S. Mortgages Funds (NAV per share multiplied by 1.0471) is $10.94, $6.69, $8.97, $9.27 and $9.72, respectively. At redemption, Class B and Class C shares may be subject to a contingent deferred sales charge, assessed on the amount equal to the lesser of the current net asset value or the original purchase price of the shares. |
The accompanying notes are an integral part of these financial statements.
64
GOLDMAN SACHS SINGLE SECTOR FIXED INCOME FUNDS
| | | | | | | | | | | | | | | | | | | |
| | | High Yield
| | | Investment Grade
| | | Local Emerging
| | | U.S. Mortgages
| | | |
| | | Fund | | | Credit Fund | | | Markets Debt Fund | | | Fund | | | |
| | | | | | | | | | | | | | | | | | | |
| |
|
| | | |
| | | | | | | | | | | | | | | | | | | |
| | | $ | 3,113,394,524 | | | $ | 224,492,169 | | | $ | 115,579,407 | | | $ | 883,122,883 | | | |
| | | | 396,100,000 | | | | 19,600,000 | | | | 44,600,000 | | | | 45,700,000 | | | |
| | | | 12,777,430 | | | | 149,820 | | | | 40,275 | | | | — | | | |
| | | | 827,800 | | | | — | | | | 209,208 | | | | — | | | |
| | | | | | | | | | | | | | | | | | | |
| | | | 3,880,529 | | | | 7,932,500 | | | | 640,880 | | | | 135,644,990 | | | |
| | | | 93,962,164 | | | | 3,820,432 | | | | 1,854,941 | | | | 3,823,418 | | | |
| | | | — | | | | 5,513 | | | | — | | | | 1,000,099 | | | |
| | | | 167,718,211 | | | | 386,000 | | | | 713,154 | | | | — | | | |
| | | | — | | | | 472,842 | | | | — | | | | 410,783 | | | |
| | | | 96,507 | | | | 29,812 | | | | — | | | | 124,566 | | | |
| | | | 37,500 | | | | — | | | | — | | | | — | | | |
| | | | — | | | | — | | | | 17,880 | | | | — | | | |
| | | | — | | | | — | | | | 57,786 | | | | — | | | |
| | | | 30,288,407 | | | | 97,900 | | | | 5,902 | | | | — | | | |
| | | | — | | | | 1,599,011 | | | | — | | | | 2,150,320 | | | |
| | | | 18,677 | | | | 474 | | | | 3,617 | | | | 1,413 | | | |
| | | |
| | | |
| | | | 3,819,101,749 | | | | 258,586,473 | | | | 163,723,050 | | | | 1,071,978,472 | | | |
| | | |
| | | |
| | | | | | | | | | | | | | | | | | | |
| | | | | | | | | | | | | | | | | | | |
|
| | | |
| | | | | | | | | | | | | | | | | | | |
| | | | 8,428 | | | | — | | | | — | | | | 94,593 | | | |
| | | | | | | | | | | | | | | | | | | |
| | | | 58,199,985 | | | | 17,879,766 | | | | — | | | | 190,027,321 | | | |
| | | | 13,840,261 | | | | 490,224 | | | | 3,957,194 | | | | 717,994 | | | |
| | | | 2,761,107 | | | | 75,904 | | | | 268,397 | | | | 242,140 | | | |
| | | | — | | | | 416,075 | | | | — | | | | 621,796 | | | |
| | | | 5,692,856 | | | | 256,583 | | | | 25,261 | | | | 665,223 | | | |
| | | | — | | | | 2,028,125 | | | | — | | | | 50,145,022 | | | |
| | | | 823,305 | | | | — | | | | 4,795,518 | | | | — | | | |
| | | | — | | | | 302,412 | | | | 263,913 | | | | 1,118,162 | | | |
| | | | 336,159 | | | | 128,923 | | | | 154,979 | | | | 199,755 | | | |
| | | |
| | | |
| | | | 81,662,101 | | | | 21,578,012 | | | | 9,465,262 | | | | 243,832,006 | | | |
| | | |
| | | |
| | | | | | | | | | | | | | | | | | | |
| | | | | | | | | | | | | | | | | | | |
|
| | | |
| | | | | | | | | | | | | | | | | | | |
| | | | 4,526,264,085 | | | | 278,387,195 | | | | 173,262,688 | | | | 880,829,155 | | | |
| | | | 6,739,787 | | | | (586,935 | ) | | | 133,199 | | | | (1,111,799 | ) | | |
| | | | (52,973,567 | ) | | | (9,597,979 | ) | | | (383,090 | ) | | | 11,920,490 | | | |
| | | | (742,590,657 | ) | | | (31,193,820 | ) | | | (18,755,009 | ) | | | (63,491,380 | ) | | |
| | | |
| | | |
| | | $ | 3,737,439,648 | | | $ | 237,008,461 | | | $ | 154,257,788 | | | $ | 828,146,466 | | | |
| |
| |
| | | | | | | | | | | | | | | | | | | |
| | | | | | | | | | | | | | | | | | | |
| | | $ | 1,754,282,330 | | | $ | 12,221,282 | | | $ | 26,483,080 | | | $ | 7,677,872 | | | |
| | | | 74,992,913 | | | | — | | | | — | | | | — | | | |
| | | | 87,750,400 | | | | — | | | | 28,338 | | | | — | | | |
| | | | 1,807,388,937 | | | | 11,068,198 | | | | 127,746,370 | | | | 303,474,797 | | | |
| | | | 13,007,177 | | | | — | | | | — | | | | — | | | |
| | | | — | | | | 213,718,981 | | | | — | | | | 516,993,797 | | | |
| | | | 8,943 | | | | — | | | | — | | | | — | | | |
| | | | 8,948 | | | | — | | | | — | | | | — | | | |
| |
| |
| | | | | | | | | | | | | | | | | | | |
| | | $ | 3,737,439,648 | | | $ | 237,008,461 | | | $ | 154,257,788 | | | $ | 828,146,466 | | | |
| |
| |
| | | | | | | | | | | | | | | | | | | |
| | | | 274,331,920 | | | | 1,426,450 | | | | 2,991,349 | | | | 827,577 | | | |
| | | | 11,714,495 | | | | — | | | | — | | | | — | | | |
| | | | 13,722,307 | | | | — | | | | 3,200 | | | | — | | | |
| | | | 282,287,265 | | | | 1,289,322 | | | | 14,427,859 | | | | 32,659,601 | | | |
| | | | 2,036,807 | | | | — | | | | — | | | | — | | | |
| | | | — | | | | 24,918,818 | | | | | | | | 55,639,199 | | | |
| | | | 1,399 | | | | — | | | | — | | | | — | | | |
| | | | 1,399 | | | | — | | | | — | | | | — | | | |
| |
| |
| | | | | | | | | | | | | | | | | | | |
| | | | $6.39 | | | | $8.57 | | | | $8.85 | | | | $9.28 | | | |
| | | | 6.40 | | | | — | | | | — | | | | — | | | |
| | | | 6.39 | | | | — | | | | 8.86 | | | | — | | | |
| | | | 6.40 | | | | 8.58 | | | | 8.85 | | | | 9.29 | | | |
| | | | 6.39 | | | | — | | | | — | | | | — | | | |
| | | | — | | | | 8.58 | | | | — | | | | 9.29 | | | |
| | | | 6.39 | | | | — | | | | — | | | | — | | | |
| | | | 6.39 | | | | — | | | | — | | | | — | | | |
| |
| |
The accompanying notes are an integral part of these financial statements.
65
GOLDMAN SACHS SINGLE SECTOR FIXED INCOME FUNDS
Statements of Operations
For the Six Months Ended September 30, 2008 (Unaudited)
| | | | | | | |
| | | | | Emerging Markets
| |
| | | | | Debt Fund | |
| |
|
| | | Investment income: |
| | | | | | | |
| | | Interest — net of allowances (including securities lending income of $900, $0, $0, $0 and $0, respectively) | | $ | 8,567,975 | |
| | | Dividends | | | — | |
| | | |
| | | |
| | | Total investment income | | | 8,567,975 | |
| | | |
| | | |
| | | | | | | |
| | | | | | | |
|
| | | Expenses: |
| | | | | | | |
| | | Management fees | | | 952,722 | |
| | | Distribution and Service fees(b) | | | 114,708 | |
| | | Transfer Agent fees(b) | | | 86,146 | |
| | | Custody and accounting fees | | | 75,580 | |
| | | Professional fees | | | 65,673 | |
| | | Registration fees | | | 34,496 | |
| | | Printing fees | | | 27,606 | |
| | | Trustee fees | | | 7,018 | |
| | | Account Service Fee(b) | | | — | |
| | | Service share fees — Service Plan | | | — | |
| | | Service share fees — Shareholder Administration Plan | | | — | |
| | | Amortization of offering costs | | | — | |
| | | Other | | | 37,260 | |
| | | |
| | | |
| | | Total expenses | | | 1,401,209 | |
| | | |
| | | |
| | | Less — expense reductions | | | (203,470 | ) |
| | | |
| | | |
| | | Net expenses | | | 1,197,739 | |
| | | |
| | | |
| | | NET INVESTMENT INCOME | | | 7,370,236 | |
| | | |
| | | |
| | | | | | | |
| | | | | | | |
|
| | | Realized and unrealized gain (loss) from investment, futures, swap and foreign currency related transactions: |
| | | | | | | |
| | | Net realized gain (loss) from: | | | | |
| | | Investment transactions | | | (5,616,379 | ) |
| | | Futures transactions | | | 96,829 | |
| | | Swap contracts | | | (867,648 | ) |
| | | Foreign currency related transactions | | | 147,705 | |
| | | Net change in unrealized gain (loss) on: | | | | |
| | | Investments | | | (19,499,103 | ) |
| | | Futures | | | 46,805 | |
| | | Swap contracts | | | (82,730 | ) |
| | | Translation of assets and liabilities denominated in foreign currencies | | | 1,006,227 | |
| | | |
| | | |
| | | Net realized and unrealized loss from investment, futures, swap and foreign currency related transactions | | | (24,768,294 | ) |
| | | |
| | | |
| | | NET DECREASE IN NET ASSETS RESULTING FROM OPERATIONS | | $ | (17,398,058 | ) |
| | | |
| | | |
| |
| (a) | Net of $42,864 in foreign withholding tax for High Yield Fund. |
| (b) | Class specific Distribution and Service, Transfer Agent and Account Service fees were as follows: |
| | | | | | | | | | | | | | | | | | | | | | | | | | | | | | | | | | | | | | | | | | | | | | | | | | | | | | | | | |
| | | Distribution and Service Fees | | | Transfer Agent Fees | | | Account Service Fee | | | | |
Fund | | Class A | | | Class B | | | Class C | | | Class R | | | Class A | | | Class B | | | Class C | | | Institutional | | | Service | | | Class IR | | | Class R | | | Class A | | | Institutional | | | | |
| Emerging Markets Debt | | $ | 104,394 | | | | N/A | | | $ | 10,314 | | | | N/A | | | $ | 54,285 | | | | N/A | | | $ | 1,341 | | | $ | 30,520 | | | | N/A | | | | N/A | | | | N/A | | | | N/A | | | | N/A | | | | | |
| High Yield | | | 2,149,685 | | | $ | 449,952 | | | | 502,643 | | | $ | 24 | | | | 1,117,836 | | | $ | 58,494 | | | | 65,343 | | | | 343,279 | | | $ | 2,619 | | | $ | 6 | | | $ | 6 | | | | N/A | | | | N/A | | | | | |
| Investment Grade Credit | | | 13,105 | | | | — | | | | — | | | | — | | | | 6,814 | | | | — | | | | — | | | | 2,108 | | | | — | | | | — | | | | 45,372 | | | $ | 2,621 | | | $ | 2,634 | | | | | |
| Local Emerging Markets Debt | | | 27,625 | | | | — | | | | 589 | | | | — | | | | 14,365 | | | | — | | | | 77 | | | | 21,178 | | | | N/A | | | | N/A | | | | N/A | | | | N/A | | | | N/A | | | | | |
| U.S. Mortgages | | | 10,781 | | | | N/A | | | | N/A | | | | N/A | | | | 5,606 | | | | N/A | | | | N/A | | | | 57,110 | | | | N/A | | | | N/A | | | | 103,198 | | | | 2,156 | | | | 71,387 | | | | | |
The accompanying notes are an integral part of these financial statements.
GOLDMAN SACHS SINGLE SECTOR FIXED INCOME FUNDS
| | | | | | | | | | | | | | | | | |
| | | High Yield
| | | Investment Grade
| | | Local Emerging
| | | U.S. Mortgages
| |
| | | Fund | | | Credit Fund | | | Markets Debt Fund | | | Fund | |
| |
| | | | | | | | | | | | | | | | | |
| | | | | | | | | | | | | | | | | |
|
| | | |
| | | | | | | | | | | | | | | | | |
| | | $ | 167,824,233 | (a) | | $ | 8,032,594 | | | $ | 4,873,965 | | | $ | 21,040,695 | |
| | | | 430,042 | | | | 17,530 | | | | — | | | | — | |
| | | |
| | | |
| | | | 168,254,275 | | | | 8,050,124 | | | | 4,873,965 | | | | 21,040,695 | |
| | | |
| | | |
| | | | | | | | | | | | | | | | | |
| | | | | | | | | | | | | | | | | |
|
| | | |
| | | | | | | | | | | | | | | | | |
| | | | 12,167,209 | | | | 495,759 | | | | 576,487 | | | | 1,620,327 | |
| | | | 3,102,304 | | | | 13,105 | | | | 28,214 | | | | 10,781 | |
| | | | 1,587,583 | | | | 54,294 | | | | 35,620 | | | | 165,914 | |
| | | | 139,199 | | | | 22,592 | | | | 76,348 | | | | 115,494 | |
| | | | 64,693 | | | | 59,378 | | | | 22,866 | | | | 90,614 | |
| | | | 102,916 | | | | 33,723 | | | | 500 | | | | 50,066 | |
| | | | 99,354 | | | | 35,676 | | | | 24,631 | | | | 43,002 | |
| | | | 7,018 | | | | 7,018 | | | | 7,018 | | | | 7,018 | |
| | | | — | | | | 5,255 | | | | — | | | | 73,543 | |
| | | | 16,367 | | | | — | | | | — | | | | — | |
| | | | 16,367 | | | | — | | | | — | | | | — | |
| | | | — | | | | — | | | | 75,001 | | | | — | |
| | | | 25,716 | | | | 6,052 | | | | 24,682 | | | | 8,671 | |
| | | |
| | | |
| | | | 17,328,726 | | | | 732,852 | | | | 871,367 | | | | 2,185,430 | |
| | | |
| | | |
| | | | (110,409 | ) | | | (272,066 | ) | | | (213,531 | ) | | | (677,206 | ) |
| | | |
| | | |
| | | | 17,218,317 | | | | 460,786 | | | | 657,836 | | | | 1,508,224 | |
| | | |
| | | |
| | | | 151,035,958 | | | | 7,589,338 | | | | 4,216,129 | | | | 19,532,471 | |
| | | |
| | | |
| | | | | | | | | | | | | | | | | |
| | | | | | | | | | | | | | | | | |
|
| | | |
| | | | | | | | | | | | | | | | | |
| | | | | | | | | | | | | | | | | |
| | | | (14,808,412 | ) | | | (11,411,326 | ) | | | (1,149,982 | ) | | | 2,220,592 | |
| | | | — | | | | 434,587 | | | | — | | | | 1,266,394 | |
| | | | — | | | | 1,990,739 | | | | 35,861 | | | | 3,675,272 | |
| | | | (8,112,623 | ) | | | 1,205,371 | | | | 757,066 | | | | — | |
| | | | | | | | | | | | | | | | | |
| | | | (448,301,789 | ) | | | (18,916,159 | ) | | | (13,221,094 | ) | | | (32,170,149 | ) |
| | | | — | | | | 1,288,835 | | | | — | | | | 628,834 | |
| | | | — | | | | (3,693,483 | ) | | | (135,565 | ) | | | (5,311,188 | ) |
| | | | 69,905,606 | | | | 81,695 | | | | (4,803,622 | ) | | | — | |
| | | |
| | | |
| | | | (401,317,218 | ) | | | (29,019,741 | ) | | | (18,517,336 | ) | | | (29,690,245 | ) |
| | | |
| | | |
| | | $ | (250,281,260 | ) | | $ | (21,430,403 | ) | | $ | (14,301,207 | ) | | $ | (10,157,774 | ) |
| | | |
| | | |
The accompanying notes are an integral part of these financial statements.
GOLDMAN SACHS SINGLE SECTOR FIXED INCOME FUNDS
Statements of Changes in Net Assets
| | | | | | | | | | | | | | | |
| | | | | Emerging Markets Debt Fund | |
| | | | | For the
| | | | | | | |
| | | | | Six Months Ended
| | | For the Period
| | | For the
| |
| | | | | September 30, 2008
| | | November 1, 2007
| | | Year Ended
| |
| | | | | (Unaudited) | | | to March 31, 2008* | | | October 31, 2007 | |
| |
|
| | | From operations: |
| | | | | | | | | | | | | | | |
| | | Net investment income | | $ | 7,370,236 | | | $ | 7,114,082 | | | $ | 11,638,757 | |
| | | Net realized gain (loss) from investment, futures, swap and foreign currency related transactions | | | (6,239,493 | ) | | | 766,990 | | | | 3,567,242 | |
| | | Net change in unrealized gain (loss) on investments, futures, swaps and translation of assets and liabilities denominated in foreign currencies | | | (18,528,801 | ) | | | (9,194,684 | ) | | | 3,003,579 | |
| | | |
| | | |
| | | Net increase (decrease) in net assets resulting from operations | | | (17,398,058 | ) | | | (1,313,612 | ) | | | 18,209,578 | |
| | | |
| | | |
| | | | | | | | | | | | | | | |
| | | | | | | | | | | | | | | |
|
| | | Distributions to shareholders: |
| | | | | | | | | | | | | | | |
| | | From net investment income | | | | | | | | | | | | |
| | | Class A Shares | | | (2,352,438 | ) | | | (2,259,201 | ) | | | (3,991,437 | ) |
| | | Class B Shares | | | — | | | | — | | | | — | |
| | | Class C Shares | | | (50,307 | ) | | | (31,858 | ) | | | (14,850 | ) |
| | | Institutional Shares | | | (4,561,741 | ) | | | (5,110,620 | ) | | | (7,522,819 | ) |
| | | Service Shares | | | — | | | | — | | | | — | |
| | | Separate Account Institutional Shares | | | — | | | | — | | | | — | |
| | | Class IR Shares(a) | | | — | | | | — | | | | — | |
| | | Class R Shares(a) | | | — | | | | — | | | | — | |
| | | From net realized gains | | | | | | | | | | | | |
| | | Class A Shares | | | — | | | | (1,107,574 | ) | | | (1,270,842 | ) |
| | | Class B Shares | | | — | | | | — | | | | — | |
| | | Class C Shares | | | — | | | | (14,463 | ) | | | (379 | ) |
| | | Institutional Shares | | | — | | | | (2,422,864 | ) | | | (1,659,868 | ) |
| | | From capital | | | | | | | | | | | | |
| | | Class A Shares | | | — | | | | — | | | | — | |
| | | Institutional Shares | | | — | | | | — | | | | — | |
| | | Separate Account Institutional Shares | | | — | | | | — | | | | — | |
| | | |
| | | |
| | | | | | | | | | | | | | | |
| | | Total distributions to shareholders | | | (6,964,486 | ) | | | (10,946,580 | ) | | | (14,460,195 | ) |
| | | |
| | | |
| | | | | | | | | | | | | | | |
| | | | | | | | | | | | | | | |
|
| | | From share transactions: |
| | | | | | | | | | | | | | | |
| | | Net proceeds from sales of shares | | | 70,608,222 | | | | 53,759,140 | | | | 167,975,848 | |
| | | Proceeds received in connection with merger | | | — | | | | — | | | | — | |
| | | Reinvestment of distributions | | | 6,646,188 | | | | 10,474,807 | | | | 13,303,327 | |
| | | Cost of shares redeemed | | | (85,649,727 | )(b) | | | (91,165,062 | )(b) | | | (65,437,875 | )(b) |
| | | |
| | | |
| | | Net increase (decrease) in net assets resulting from share transactions | | | (8,395,317 | ) | | | (26,931,115 | ) | | | 115,841,300 | |
| | | |
| | | |
| | | TOTAL INCREASE (DECREASE) | | | (32,757,861 | ) | | | (39,191,307 | ) | | | 119,590,683 | |
| | | |
| | | |
| | | | | | | | | | | | | | | |
| | | | | | | | | | | | | | | |
|
| | | Net assets: |
| | | | | | | | | | | | | | | |
| | | Beginning of period | | | 234,775,259 | | | | 273,966,566 | | | | 154,375,883 | |
| | | |
| | | |
| | | End of period | | $ | 202,017,398 | | | $ | 234,775,259 | | | $ | 273,966,566 | |
| | | |
| | | |
| | | Accumulated undistributed (distribution in excess of) net investment income | | $ | 224,336 | | | $ | (181,414 | ) | | $ | 296,193 | |
| | | |
| | | |
| |
| * | The Fund changed its fiscal year end from October 31 to March 31. |
| |
| (a) | Commenced operations on November 30, 2007. |
| |
| (b) | Net of $31,107, $1,392 and $5,494 and $107,327, $113,159 and $310,735 redemption fees for Emerging Markets Debt Fund and High Yield Fund, respectively, for the six months ended September 30, 2008, period ended March 31, 2008 and year ended October 31, 2007, respectively. |
The accompanying notes are an integral part of these financial statements.
GOLDMAN SACHS SINGLE SECTOR FIXED INCOME FUNDS
| | | | | | | | | | | | | | | | | | | | | | | | | |
| | | High Yield Fund | | | Investment Grade Credit Fund | |
| | | For the
| | | | | | | | | For the
| | | | | | | |
| | | Six Months Ended
| | | For the Period
| | | For the
| | | Six Months Ended
| | | For the Period
| | | For the
| |
| | | September 30, 2008
| | | November 1, 2007
| | | Year Ended
| | | September 30, 2008
| | | November 1, 2007
| | | Year Ended
| |
| | | (Unaudited) | | | to March 31, 2008* | | | October 31, 2007 | | | (Unaudited) | | | to March 31, 2008* | | | October 31, 2007 | |
| |
|
| | | |
| | | | | | | | | | | | | | | | | | | | | | | | | |
| | | $ | 151,035,958 | | | $ | 118,336,853 | | | $ | 243,697,927 | | | $ | 7,589,338 | | | $ | 6,142,235 | | | $ | 12,908,029 | |
| | | | | | | | | | | | | | | | | | | | | | | | | |
| | | | (22,921,035 | ) | | | (32,905,610 | ) | | | 35,445,816 | | | | (7,780,629 | ) | | | (1,093,653 | ) | | | 689,530 | |
| | | | | | | | | | | | | | | | | | | | | | | | | |
| | | | (378,396,183 | ) | | | (343,468,751 | ) | | | (89,891,894 | ) | | | (21,239,112 | ) | | | (5,975,351 | ) | | | (2,576,164 | ) |
| | | |
| | | |
| | | | (250,281,260 | ) | | | (258,037,508 | ) | | | 189,251,849 | | | | (21,430,403 | ) | | | (926,769 | ) | | | 11,021,395 | |
| | | |
| | | |
| | | | | | | | | | | | | | | | | | | | | | | | | |
| | | | | | | | | | | | | | | | | | | | | | | | | |
|
| | | |
| | | | | | | | | | | | | | | | | | | | | | | | | |
| | | | | | | | | | | | | | | | | | | | | | | | | |
| | | | (68,656,824 | ) | | | (59,885,688 | ) | | | (121,637,861 | ) | | | (301,319 | ) | | | (162,801 | ) | | | (343,303 | ) |
| | | | (3,247,995 | ) | | | (3,355,548 | ) | | | (7,218,281 | ) | | | — | | | | — | | | | — | |
| | | | (3,636,098 | ) | | | (3,536,092 | ) | | | (7,427,455 | ) | | | — | | | | — | | | | — | |
| | | | (71,343,216 | ) | | | (61,831,495 | ) | | | (110,683,239 | ) | | | (323,520 | ) | | | (195,322 | ) | | | (267,488 | ) |
| | | | (515,407 | ) | | | (320,088 | ) | | | (379,636 | ) | | | — | | | | — | | | | — | |
| | | | — | | | | — | | | | — | | | | (6,986,091 | ) | | | (4,625,270 | ) | | | (11,567,094 | ) |
| | | | (402 | ) | | | (289 | ) | | | — | | | | — | | | | — | | | | — | |
| | | | (377 | ) | | | (273 | ) | | | — | | | | — | | | | — | | | | — | |
| | | | | | | | | | | | | | | | | | | | | | | | | |
| | | | — | | | | — | | | | — | | | | — | | | | — | | | | — | |
| | | | — | | | | — | | | | — | | | | — | | | | — | | | | — | |
| | | | — | | | | — | | | | — | | | | — | | | | — | | | | — | |
| | | | — | | | | — | | | | — | | | | — | | | | — | | | | — | |
| | | | | | | | | | | | | | | | | | | | | | | | | |
| | | | — | | | | — | | | | — | | | | — | | | | (31,121 | ) | | | — | |
| | | | — | | | | — | | | | — | | | | — | | | | (37,338 | ) | | | — | |
| | | | — | | | | — | | | | — | | | | — | | | | (884,170 | ) | | | — | |
| | | |
| | | |
| | | | (147,400,319 | ) | | | (128,929,473 | ) | | | (247,346,472 | ) | | | (7,610,930 | ) | | | (5,936,022 | ) | | | (12,177,885 | ) |
| | | |
| | | |
| | | | | | | | | | | | | | | | | | | | | | | | | |
| | | | | | | | | | | | | | | | | | | | | | | | | |
|
| | | |
| | | | | | | | | | | | | | | | | | | | | | | | | |
| | | | 1,213,238,645 | | | | 664,724,345 | | | | 1,746,992,051 | | | | 53,727,072 | | | | 37,545,092 | | | | 82,437,849 | |
| | | | — | | | | — | | | | 131,649,843 | | | | — | | | | — | | | | — | |
| | | | 115,389,754 | | | | 102,424,969 | | | | 195,239,156 | | | | 6,008,016 | | | | 4,642,385 | | | | 9,674,188 | |
| | | | (676,885,087 | )(b) | | | (563,381,634 | )(b) | | | (1,231,153,803 | )(b) | | | (39,851,665 | ) | | | (48,024,294 | ) | | | (44,948,140 | ) |
| | | |
| | | |
| | | | 651,743,312 | | | | 203,767,680 | | | | 842,727,247 | | | | 19,883,423 | | | | (5,836,817 | ) | | | 47,163,897 | |
| | | |
| | | |
| | | | 254,061,733 | | | | (183,199,301 | ) | | | 784,632,624 | | | | (9,157,910 | ) | | | (12,699,608 | ) | | | 46,007,407 | |
| | | |
| | | |
| | | | | | | | | | | | | | | | | | | | | | | | | |
| | | | | | | | | | | | | | | | | | | | | | | | | |
|
| | | |
| | | | | | | | | | | | | | | | | | | | | | | | | |
| | | | | | | | | | | | | | | | | | | | | | | | | |
| | | | 3,483,377,915 | | | | 3,666,577,216 | | | | 2,881,944,592 | | | | 246,166,371 | | | | 258,865,979 | | | | 212,858,572 | |
| | | |
| | | |
| | | $ | 3,737,439,648 | | | $ | 3,483,377,915 | | | $ | 3,666,577,216 | | | $ | 237,008,461 | | | $ | 246,166,371 | | | $ | 258,865,979 | |
| | | |
| | | |
| | | $ | 6,739,787 | | | $ | 3,104,148 | | | $ | 13,282,715 | | | $ | (586,935 | ) | | $ | (565,343 | ) | | $ | 52,088 | |
| | | |
| | | |
The accompanying notes are an integral part of these financial statements.
GOLDMAN SACHS SINGLE SECTOR FIXED INCOME FUNDS
Statements of Changes in Net Assets
| | | | | | | | | | | |
| | | | | Local Emerging Markets Debt | |
| | | | | For the
| | | | |
| | | | | Six Months Ended
| | | For the
| |
| | | | | September 30, 2008
| | | Period Ended
| |
| | | | | (Unaudited) | | | March 31, 2008(a) | |
| |
|
| | | From operations: |
| | | | | | | | | | | |
| | | Net investment income | | $ | 4,216,129 | | | $ | 304,110 | |
| | | Net realized gain (loss) from investment, futures, swap and foreign currency related transactions | | | (357,055 | ) | | | (188,558 | ) |
| | | Net change in unrealized gain (loss) on investments, futures, swaps and translation of assets and liabilities denominated in foreign currencies | | | (18,160,281 | ) | | | (594,728 | ) |
| | | |
| | | |
| | | Net increase (decrease) in net assets resulting from operations | | | (14,301,207 | ) | | | (479,176 | ) |
| | | |
| | | |
| | | | | | | | | | | |
| | | | | | | | | | | |
|
| | | Distributions to shareholders: |
| | | | | | | | | | | |
| | | From net investment income | | | | | | | | |
| | | Class A Shares | | | (689,753 | ) | | | (1,667 | ) |
| | | Class C Shares | | | (3,081 | ) | | | (66 | ) |
| | | Institutional Shares | | | (3,430,512 | ) | | | (100,523 | ) |
| | | Separate Account Institutional Shares | | | — | | | | — | |
| | | From capital | | | | | | | | |
| | | Class A Shares | | | — | | | | (3,181 | ) |
| | | Class C Shares | | | — | | | | (127 | ) |
| | | Institutional Shares | | | — | | | | (191,803 | ) |
| | | |
| | | |
| | | Total distributions to shareholders | | | (4,123,346 | ) | | | (297,367 | ) |
| | | |
| | | |
| | | | | | | | | | | |
| | | | | | | | | | | |
|
| | | From share transactions: |
| | | | | | | | | | | |
| | | Net proceeds from sales of shares | | | 149,755,027 | | | | 62,655,249 | |
| | | Reinvestment of dividends and distributions | | | 3,995,438 | | | | 296,418 | |
| | | Cost of shares redeemed | | | (43,108,869 | )(b) | | | (134,379 | ) |
| | | |
| | | |
| | | Net increase in net assets resulting from share transactions | | | 110,641,596 | | | | 62,817,288 | |
| | | |
| | | |
| | | TOTAL INCREASE (DECREASE) | | | 92,217,043 | | | | 62,040,745 | |
| | | |
| | | |
| | | | | | | | | | | |
| | | | | | | | | | | |
|
| | | Net assets: |
| | | | | | | | | | | |
| | | Beginning of period | | | 62,040,745 | | | | — | |
| | | |
| | | |
| | | End of period | | $ | 154,257,788 | | | $ | 62,040,745 | |
| | | |
| | | |
| | | Accumulated undistributed (distribution in excess of) net investment income | | $ | 133,199 | | | $ | 40,416 | |
| | | |
| | | |
| | |
| * | | The Fund changed its fiscal year end from October 31 to March 31. |
| (a) | | Commenced operations on February 15, 2008. |
| (b) | | Net of $20 redemption fees for Local Emerging Markets Debt Fund. |
The accompanying notes are an integral part of these financial statements.
GOLDMAN SACHS SINGLE SECTOR FIXED INCOME FUNDS
| | | | | | | | | | | | | |
| | | U.S. Mortgages Fund |
| | | For the
| | | | |
| | | Six Months Ended
| | For the Period
| | For the
|
| | | September 30, 2008
| | November 1, 2007
| | Year Ended
|
| | | (Unaudited) | | to March 31, 2008* | | October 31, 2007 |
| |
|
| | | |
| | | | | | | | | | | | | |
| | | $ | 19,532,471 | | | $ | 14,577,983 | | | $ | 21,311,799 | |
| | | | 7,162,258 | | | | 7,874,502 | | | | (682,434 | ) |
| | | | | | | | | | | | | |
| | | | (36,852,503 | ) | | | (28,234,984 | ) | | | 3,490,822 | |
| | | |
| | | |
| | | | (10,157,774 | ) | | | (5,782,499 | ) | | | 24,120,187 | |
| | | |
| | | |
| | | | | | | | | | | | | |
| | | | | | | | | | | | | |
|
| | | |
| | | | | | | | | | | | | |
| | | | | | | | | | | | | |
| | | | (202,881 | ) | | | (140,480 | ) | | | (325,116 | ) |
| | | | — | | | | — | | | | — | |
| | | | (7,251,918 | ) | | | (3,399,507 | ) | | | (7,058,792 | ) |
| | | | (13,197,368 | ) | | | (11,502,439 | ) | | | (15,163,742 | ) |
| | | | | | | | | | | | | |
| | | | | | | | — | | | | | |
| | | | | | | | — | | | | — | |
| | | | — | | | | — | | | | — | |
| | | |
| | | |
| | | | (20,652,167 | ) | | | (15,042,426 | ) | | | (22,547,650 | ) |
| | | |
| | | |
| | | | | | | | | | | | | |
| | | | | | | | | | | | | |
|
| | | |
| | | | | | | | | | | | | |
| | | | 252,501,228 | | | | 96,889,098 | | | | 379,310,165 | |
| | | | 16,343,513 | | | | 11,951,182 | | | | 18,414,913 | |
| | | | (88,339,158 | ) | | | (103,222,843 | ) | | | (138,044,541 | ) |
| | | |
| | | |
| | | | 180,505,583 | | | | 5,617,437 | | | | 259,680,537 | |
| | | |
| | | |
| | | | 149,695,642 | | | | (15,207,488 | ) | | | 261,253,074 | |
| | | |
| | | |
| | | | | | | | | | | | | |
| | | | | | | | | | | | | |
|
| | | |
| | | | | | | | | | | | | |
| | | | 678,450,824 | | | | 693,658,312 | | | | 432,405,238 | |
| | | |
| | | |
| | | $ | 828,146,466 | | | $ | 678,450,824 | | | $ | 693,658,312 | |
| | | |
| | | |
| | | $ | (1,111,799 | ) | | $ | 7,897 | | | $ | (96,144 | ) |
| | | |
| | | |
The accompanying notes are an integral part of these financial statements.
GOLDMAN SACHS SINGLE SECTOR FIXED INCOME FUNDS
Notes to Financial Statements
September 30, 2008 (Unaudited)
1. ORGANIZATION
Goldman Sachs Trust (the “Trust”) is a Delaware statutory trust registered under the Investment Company Act of 1940, as amended (the “Act”), as an open-end management investment company. The following are Goldman Sachs Funds included in this report (collectively, the “Funds” or individually a “Fund”), the share classes offered by each Fund and their diversification status under the Act:
| | | | | |
| Fund | | Share Classes Offered | | Diversified/Non-diversified |
| |
Emerging Markets Debt, Local Emerging
Markets Debt | | A, C and Institutional | | Non-diversified |
| |
| |
| High Yield | | A, B, C, Institutional, Service, IR and R | | Diversified |
| |
| |
| Investment Grade Credit, U.S. Mortgages | | A, Institutional and Separate Account Institutional | | Diversified |
| |
| |
Class A Shares of the Funds charge a maximum initial sales charge of 4.50%. The contingent deferred sales charge for Class B Shares is 5.00% maximum declining to zero after six years for High Yield. Class C Shares have a contingent deferred sales charge of 1.00% during the first 12 months. Institutional, Service, Separate Account Institutional, Class IR and Class R Shares of the Funds are not subject to a sales charge. Goldman, Sachs & Co. (“Goldman Sachs”) serves as Distributor of the shares of the Funds pursuant to a Distribution Agreement, receives such sales charges and may retain a portion of such sales charges.
Goldman Sachs Asset Management, L.P., (“GSAM”), an affiliate of Goldman Sachs, serves as investment adviser pursuant to a Management Agreement (the “Agreement”) with the Trust on behalf of the Funds.
High Yield, Emerging Markets Debt and Local Emerging Markets Debt will charge a 2% redemption fee on the redemption of shares (including by exchange) held for 30 calendar days or less (60 calendar days or less for High Yield). For this purpose, the Funds use a first-in first-out (“FIFO”) method so that shares held longest will be treated as being redeemed first and shares held shortest will be treated as being redeemed last.
The Emerging Markets Debt, High Yield, Investment Grade Credit and U.S. Mortgages Funds changed their fiscal year end from October 31 to March 31. GSAM has agreed to reimburse these Funds for any cost associated with changing these Funds’ fiscal year ends.
2. SIGNIFICANT ACCOUNTING POLICIES
The following is a summary of the significant accounting policies consistently followed by the Funds. The preparation of financial statements in conformity with Generally Accepted Accounting Principles in the United States of America (“GAAP”) requires management to make estimates and assumptions that may affect amounts. Actual results could differ from those estimates.
A. Investment Valuation — The investment valuation policy of the Funds is to value investments at market value. The Funds’ investments for which market quotations are readily available are valued on the basis of quotations furnished by an independent pricing service or provided by securities dealers. The pricing services may use valuation models or matrix pricing, which considers yield or price with respect to comparable bonds, quotations from bond dealers or by reference to other securities that are considered comparable in such characteristics as rating, interest rate and maturity date, to determine current value. If accurate quotations are not readily available, or if GSAM believes that such quotations do not accurately reflect fair value, the fair value of the Funds’ investments may be determined based on yield equivalents, a pricing matrix or other sources, under valuation procedures established by the Board of Trustees. Short-term debt obligations maturing in sixty days or less are valued at amortized cost, which approximates market value.
GOLDMAN SACHS SINGLE SECTOR FIXED INCOME FUNDS
| |
| 2. SIGNIFICANT ACCOUNTING POLICIES (continued) | |
GSAM, consistent with its procedures and applicable regulatory guidance, may determine to make an adjustment to the previous closing prices of either domestic or foreign securities in light of significant events, to reflect what it believes to be the fair value of the securities at the time of determining the Funds’ NAV. Significant events that could affect a large number of securities in a particular market may include, but are not limited to: situations relating to one or more single issuers in a market sector; significant fluctuations in U.S. or foreign markets; market dislocations; market disruptions or market closings; equipment failures; natural or man-made disasters or acts of God; armed conflicts; government actions or other developments; as well as the same or similar events which may affect specific issuers or the securities markets even though not tied directly to the securities markets. Other significant events that could relate to a single issuer may include, but are not limited to: corporate actions such as reorganizations, mergers and buy-outs; corporate announcements, including those relating to earnings, products and regulatory news; significant litigation; low trading volume; and trading limits or suspensions.
B. Security Transactions and Investment Income — Security transactions are reflected for financial reporting purposes as of the trade date. Realized gains and losses on sales of portfolio securities are calculated using the identified cost basis. Dividend income is recognized on the ex-dividend date, net of foreign withholding taxes, if any, which are reduced by any amounts reclaimable by the Funds, where applicable. Interest income is recorded on the basis of interest accrued, premium amortized and discount accreted. Certain mortgage security paydown gains and losses are recorded as interest income (loss) and are included in interest income in the accompanying Statements of Operations. Market discounts, original issue discount (“OID”) and market premiums on debt securities are accreted/amortized to interest income over the life of the security with a corresponding adjustment in the cost basis of that security. In addition, it is the Funds’ policy to accrue for estimated capital gains taxes, if any, on foreign securities held by the Funds, which are subject to such taxes.
Net investment income (other than class specific expenses) and unrealized and realized gains or losses are allocated daily to each class of shares of the respective Fund based upon the relative proportion of net assets of each class.
C. Expenses — Expenses incurred by the Trust that do not specifically relate to an individual Fund of the Trust are allocated to the Funds on a straight-line and/or “pro-rata” basis depending upon the nature of the expense.
D. Federal Taxes and Distributions to Shareholders — It is each Fund’s policy to comply with the requirements of the Internal Revenue Code of 1986, as amended (the “Code”), applicable to regulated investment companies and to distribute each year substantially all of its investment company taxable and tax-exempt income and capital gains to its shareholders. Accordingly, no federal tax provisions are required. Distributions to shareholders are recorded on the ex-dividend date. Income and capital gains distributions, if any, are declared and paid according to the following schedule:
| | | | | | | | | |
| | | Income Distributions
| | | Capital Gains Distributions
| |
| Fund | | Declared and Paid | | | Declared and Paid | |
| | |
| Emerging Markets Debt, High Yield, Investment Grade Credit, Local Emerging Markets Debt and U.S. Mortgages | | | Daily/Monthly | | | | Annually | |
| |
| |
Net capital losses are carried forward to future years and may be used to the extent allowed by the Code to offset any future capital gains. Utilization of capital loss carryforwards will reduce the requirement of future capital gain distributions.
The characterization of distributions to shareholders for financial reporting purposes is determined in accordance with Federal income tax rules, which may differ from GAAP. The source of each Fund’s distributions may be shown in the accompanying financial statements as either from net investment income, net realized gain or capital.
GSAM has reviewed the tax positions for the Funds under Financial Accounting Standards Board (“FASB”) Interpretation No. 48, “Accounting for Uncertainty in Income Taxes” (“FIN 48”) for the open tax years (tax years ended October 31, 2005-2007 and March 31, 2008) and determined that the application of FIN 48 did not have a material impact on the Funds’ financial statements. FIN 48 establishes financial accounting and disclosure requirements for recognition and measurement of tax positions taken or expected to be taken on a U.S. income tax return.
GOLDMAN SACHS SINGLE SECTOR FIXED INCOME FUNDS
Notes to Financial Statements (continued)
September 30, 2008 (Unaudited)
| |
| 2. SIGNIFICANT ACCOUNTING POLICIES (continued) | |
E. Foreign Currency Translations — The books and records of the Funds are accounted for in U.S. dollars. Amounts denominated in foreign currencies are translated into U.S. dollars (using 4:00 p.m. Eastern Time exchange rates) on the following basis: (i) investment valuations, foreign currency and other assets and liabilities initially expressed in foreign currencies are converted into U.S. dollars based upon current exchange rates; and (ii) purchases and sales of foreign investments, income and expenses are converted into U.S. dollars based upon currency exchange rates prevailing on the respective dates of such transactions.
Net realized and unrealized gain (loss) on foreign currency transactions represents: (i) foreign exchange gains and losses from the sale and holdings of foreign currencies; (ii) currency gains and losses between trade date and settlement date on investment security transactions and forward exchange contracts; and (iii) gains and losses from the difference between amounts of dividends, interest and foreign withholding taxes recorded and the amounts actually received. The effect of changes in foreign currency exchange rates on securities and derivative instruments are segregated in the Statements of Operations from the effects of changes in market prices of those investments, and are included with the net realized and unrealized gain (loss) on foreign currency related transactions. Net unrealized foreign exchange gains and losses arising from changes in the value of other assets and liabilities as a result of changes in foreign exchange rates are included as increases and decreases in unrealized gain (loss) on foreign currency related transactions.
Non U.S. currency symbols utilized throughout the report are defined as follows:
| | | |
| AED = Arab Emirate Dollar | | IDR = Indonesian Rupiah |
| ARS = Argentine Peso | | KZT = Kazakhstan Tenge |
| BRL = Brazilian Real | | MXN = Mexican Peso |
| CAD = Canadian Dollar | | NGN = Nigerian Naira |
| COP = Colombian Peso | | PEN = Peruvian Nuevo Sol |
| EGP = Egyptian Pound | | PLN = Polish Zloty |
| EUR = Euro | | RUB = Russian Ruble |
| GBP = British Pound | | TRY = Turkish Lira |
| HUF = Hungarian Forint | | UYU = Uruguayan Peso |
F. Forward Foreign Currency Exchange Contracts — The Funds (except the U.S. Mortgages Fund) may enter into forward foreign currency exchange contracts for the purchase or sale of a specific foreign currency at a fixed price on a future date as a hedge or cross-hedge against either specific transactions or portfolio positions. The Funds may also purchase and sell forward foreign currency exchange contracts to seek to increase total return. All commitments are “marked-to-market” daily at the applicable translation rates and any resulting unrealized gains or losses are recorded by the Funds. The Funds record realized gains or losses on the settlement date of a contract.
Risks may arise upon entering into these contracts from the potential inability of counterparties to meet the terms of their contracts and from unanticipated movements in the value of a foreign currency relative to the U.S. dollar. The contractual amounts of forward foreign currency contracts do not necessarily represent the amounts potentially subject to risk. The measurement of the risks associated with these instruments is meaningful only when all related and offsetting transactions are considered. For forward foreign currency exchange contracts, the Funds segregate sufficient cash and/or securities to cover any commitments under these contracts.
G. Futures Contracts — The Funds may purchase or sell futures contracts to hedge against changes in interest rates, securities prices, currency exchange rates, or to seek to increase total return. Futures contracts are valued at the last settlement price, or in the absence of a sale, the last bid price, at the end of each day on the board of trade or exchange upon which they are traded. Upon entering into a futures contract, the Funds deposit cash or securities in an account on behalf of the broker in an amount sufficient to meet the initial margin requirement. Subsequent payments are made or received by the Funds equal to the daily change in the contract value and are recorded as variation margin receivable or payable and offset in unrealized gains or losses. The Funds recognize a realized gain or loss when a contract is closed or expires.
GOLDMAN SACHS SINGLE SECTOR FIXED INCOME FUNDS
| |
| 2. SIGNIFICANT ACCOUNTING POLICIES (continued) | |
The use of futures contracts involves, to varying degrees, elements of market and counterparty risk which may exceed the amounts recognized in the Statements of Assets and Liabilities. Futures contracts may be illiquid, and exchanges may limit fluctuations in futures contract prices during a single day. Changes in the value of a futures contract may not directly correlate with changes in the value of the underlying securities. These risks may decrease the effectiveness of the Funds’ strategies and potentially result in a loss. For futures contracts, the Funds segregate sufficient cash and/or securities to cover any commitments under these contracts.
H. Mortgage and Asset-Backed Securities — Certain Funds may invest in mortgage and/or asset-backed securities. Mortgage-backed securities represent direct or indirect participations in, or are collateralized by and payable from, mortgage loans secured by real property. These securities may include mortgage pass-through securities, collateralized mortgage obligations, Real Estate Mortgage Investment Conduit pass-through or participation certificates, and stripped mortgage-backed securities. Asset-backed securities include securities whose principal and interest payments are collateralized by pools of assets such as auto loans, credit card receivables, leases, installment contracts and personal property. Asset-backed securities also include home equity line of credit loans and other second-lien mortgages.
The value of some mortgage- and asset-backed securities may be particularly sensitive to changes in prevailing interest rates. The value of these securities may also fluctuate in response to the market’s perception of the creditworthiness of the issuers. Early repayment of principal on mortgage- or asset-backed securities may expose a Fund to the risk of earning a lower rate of return upon reinvestment of principal. Asset-backed securities may present credit risks that are not presented by mortgage-backed securities because they generally do not have the benefit of a security interest in collateral that is comparable to mortgage assets. Some asset-backed securities may only have a subordinated claim on collateral. In addition, while mortgage- and asset-backed securities may be supported by some form of government or private guarantee and/or insurance, there is no assurance that private guarantors or insurers, if any, will meet their obligations.
Stripped mortgage-backed securities are usually structured with two different classes: one that receives substantially all of the interest payments (the interest-only, or “IO” and/or the high coupon rate with relatively low principal amount, or “IOette”), and the other that receives substantially all of the principal payments (the principal-only, or “PO”) from a pool of mortgage loans. Little to no principal will be received at the maturity of an IO; as a result, adjustments are made to the cost of the security on a daily basis until maturity. These adjustments are included in interest income. Payments received for PO’s, typically monthly, are treated as a proportionate reduction to the reduction in par of the cost basis of the securities and excess amounts are recorded as gains. All gains and losses resulting from principal payments are classified as interest income in the accompanying Statement of Operations.
I. Mortgage Dollar Rolls — The U.S. Mortgages and Investment Grade Credit Funds may enter into mortgage “dollar rolls” in which the Funds sell securities in the current month for delivery and simultaneously contracts with the same counterparty to repurchase similar (same type, coupon and maturity) but not identical securities on a specified future date. The Funds treat mortgage dollar rolls as two separate transactions; one involving the purchase of a security and a separate transaction involving a sale.
During the settlement period between sale and repurchase, the Funds will not be entitled to accrued interest and principal payments on the securities sold. Dollar roll transactions involve the risk that the market value of the securities sold by the Funds may decline below the repurchase price of those securities. In the event the buyer of the securities under a dollar roll transaction files for bankruptcy or becomes insolvent, the Funds’ use of proceeds of the transaction may be restricted pending a determination by, or with respect to, the other party.
J. Offering Costs — Offering costs paid in connection with the offering of shares of Local Emerging Markets Debt are amortized on a straight-line basis over 12 months from the date of commencement of operations.
K. Redemption Fees — A 2% redemption fee will be imposed on the redemption of shares (including by exchange) held for 60 calendar days or less with respect to the High Yield Fund and 30 days or less with respect to the Emerging Markets Debt and Local Emerging Markets Debt Funds. For this purpose, the Funds use a first-in first-out method so that shares held longest will be treated as being redeemed first and shares held shortest will be treated as being redeemed last.
GOLDMAN SACHS SINGLE SECTOR FIXED INCOME FUNDS
Notes to Financial Statements (continued)
September 30, 2008 (Unaudited)
| |
| 2. SIGNIFICANT ACCOUNTING POLICIES (continued) | |
Redemption fees are reimbursed to a Fund and are reflected as a reduction in share redemptions. Redemption fees are credited to Paid-in Capital and are allocated to each share class of a Fund on a pro-rata basis at the time of payment.
L. Repurchase Agreements — The Funds may enter in repurchase agreements. Repurchase agreements involve the purchase of securities subject to the seller’s agreement to repurchase the securities at a mutually agreed upon date and price. During the term of a repurchase agreement, the value of the underlying securities held as collateral on behalf of the Funds, including accrued interest is required to exceed the value of the repurchase agreement, including accrued interest. If the seller defaults or becomes insolvent, realization of the collateral by the Funds may be delayed or limited and there may be a decline in the value of the collateral during the period while the Funds seek to assert their rights. The underlying securities for all repurchase agreements are held in safekeeping at the Funds’ custodian or designated subcustodians under triparty repurchase agreements.
Pursuant to exemptive relief granted by the Securities and Exchange Commission (“SEC”) and terms and conditions contained therein, the Funds, together with other registered investment companies having management agreements with GSAM, or its affiliates, may transfer uninvested cash into joint accounts, the daily aggregate balance of which is invested in one or more repurchase agreements. In addition, the Funds’ credit exposure is allocated to the underlying repurchase counterparties on a pro-rata basis. With the exception of certain transaction fees, the Funds are not subject to any expenses in relation to these investments.
M. Swap Contracts — The Funds may enter into swap transactions for hedging purposes or to seek to increase total return. Swap transactions are privately negotiated agreements between a Fund and a counterparty to exchange or swap investment cash flows, assets, foreign currencies or market-linked returns at specified, future intervals. The Funds may be required to post collateral under the terms of a swap contract. Risks may arise as a result of the failure of the counterparty to the swap contract to comply with the terms of the swap contract. The loss incurred by the failure of a counterparty is generally limited to the net payment to be received by the Funds, and/or the termination value at the end of the contract. Therefore, the Funds consider the creditworthiness of each counterparty to a contract in evaluating potential credit risk. Additionally, risks may arise from unanticipated movements in interest rates or in the value of the underlying reference asset or index. Entering into these agreements involves, to varying degrees, market, liquidity, elements of credit, legal and documentation risk in excess of amounts recognized in the Statements of Assets and Liabilities. When entering into swap contracts, a Fund must set aside liquid assets or engage in other appropriate measures to cover its obligations under the swap contract. The Funds may invest in the following types of swaps:
A credit default swap agreement involves one party making a stream of payments to another party in exchange for the right to receive a specified return in the event of a default by a third party, typically a corporate issuer or an issuer within an index on its obligation. A Fund may use credit default swaps to provide a measure of protection against defaults of a corporate issuer or to take an active long or short position with respect to the likelihood of a particular issuer’s default. If the Fund enters into a buy contract and no credit event occurs, its exposure is limited to the periodic payments previously made to the counterparty. If a credit event occurs, the seller of protection may be required to pay the Fund the notional value of the credit default swap on the specified reference obligation. As a seller of protection, a Fund generally receives an upfront payment or a fixed rate of income throughout the term of the swap provided that there is no credit event. If the Fund enters into a sale contract and a credit event occurs, in addition to the credit exposure the Fund has on the other assets held in its portfolio, the value of the reference obligation received by the Fund reduced by the periodic payments previously received may be less than the maximum payout amount the Fund pays to the counterparty, resulting in a loss to the Fund. Credit default swaps may involve greater risks than if a Fund had invested in the referenced obligation directly.
An interest rate swap is an agreement that obligates two parties to exchange a series of cash flows at specified intervals based upon or calculated by reference to changes in specified prices, rates or indices for a specified amount of an underlying asset or notional principal amount. The payment flows are usually netted against each other, with the difference being paid by one party to the other.
A total return swap is an agreement that gives the Funds the right to receive the appreciation in the value of a specified security, index or other instrument in return for a fee paid to the counterparty, which will typically be an agreed upon
GOLDMAN SACHS SINGLE SECTOR FIXED INCOME FUNDS
| |
| 2. SIGNIFICANT ACCOUNTING POLICIES (continued) | |
interest rate. If the underlying asset declines in value over the term of the swap, the Funds may also be required to pay the dollar value of that decline to the counterparty.
Swaps are marked-to-market daily using either pricing vendor quotations, counterparty prices or model prices and the change in value, if any, is recorded as unrealized gain or loss. Upfront payments made and/or received by the Funds are recorded as an asset and/or liability on the Statements of Assets and Liabilities and are recorded as a realized gain or loss ratably over the contract’s term/event with the exception of forward starting interest rate swaps, which are recorded as a realized gain or loss ratably beginning on the effective start date. Periodic payments received or made on swap contracts are recorded as a realized gain or loss on the Statements of Operations. Gains or losses are also realized upon early termination of the swap agreements or, with respect to credit default swaps, when a credit event occurs and recorded as realized gains from swaps on the Statements of Operations.
N. When-Issued Securities and Forward Commitments — The Funds may purchase when-issued securities, including TBA (To Be Announced) securities and enter into contracts to purchase or sell securities for a fixed price at a future date beyond the customary settlement period. When-issued securities are securities that have been authorized, but not yet issued in the market. When-issued securities are purchased in order to secure what is considered to be an advantageous price and yield to the Funds at the time of entering into the transaction. A forward commitment involves the entering into a contract to purchase or sell securities for a fixed price at a future date beyond the customary settlement period. The purchase of securities on a when-issued or forward commitment basis involves a risk of loss if the value of the security to be purchased declines before the settlement date. Conversely, the sale of securities on a forward commitment basis involves the risk that the value of the securities sold may increase before the settlement date. Although the Funds will generally purchase securities on a when-issued or forward commitment basis with the intention of acquiring the securities for their portfolios, the Funds may dispose of when-issued securities or forward commitments prior to settlement if GSAM deems it appropriate. When purchasing a security on a when-issued basis or entering into a forward commitment, the Funds must set aside liquid assets, or engage in other appropriate measures to cover their obligations.
3. AGREEMENTS
A. Management Agreement — Under the Agreement, GSAM manages the Funds, subject to the general supervision of the Board of Trustees.
As compensation for the services rendered pursuant to the Agreement, the assumption of the expenses related thereto and administering the Funds’ business affairs, including providing facilities, GSAM is entitled to a fee (“Management fee”) computed daily and payable monthly, equal to an annual percentage rate of each Fund’s average daily net assets.
For the six months ended September 30, 2008, GSAM received a Management fee on a contractual basis at the following rates:
| | | | | | | | | | | | | | | | | | | | | | | | | | | | | |
| | | | | | | | | | | | | | | | | | | | | Effective Net
| |
| | | Contractual Management Rate | | | Management
| |
| | | Up to
| | | Next
| | | Next
| | | Next
| | | Over
| | | Effective
| | | Rate
| |
| Fund | | $1 billion | | | $1 billion | | | $3 billion | | | $3 billion | | | $8 billion | | | Rate | | | (after waiver) | |
| | |
| Emerging Markets Debt | | | 0.80 | % | | | 0.80 | % | | | 0.72 | % | | | 0.68 | % | | | 0.67 | % | | | 0.80 | % | | | 0.80 | % |
| |
| |
| High Yield | | | 0.70 | | | | 0.70 | | | | 0.63 | | | | 0.60 | | | | 0.59 | | | | 0.67 | | | | 0.67 | |
| |
| |
| Investment Grade Credit | | | 0.40 | | | | 0.36 | | | | 0.34 | | | | 0.33 | | | | 0.32 | | | | 0.40 | | | | 0.33 | * |
| |
| |
| Local Emerging Markets Debt | | | 0.90 | | | | 0.90 | | | | 0.81 | | | | 0.77 | | | | 0.75 | | | | 0.90 | | | | 0.90 | |
| |
| |
| U.S. Mortgages | | | 0.40 | | | | 0.36 | | | | 0.34 | | | | 0.33 | | | | 0.32 | | | | 0.40 | | | | 0.33 | * |
| |
| |
| | |
| | Effective July 1, 2008, GSAM implemented these additional asset level breakpoints to its contractual Management rate. |
| |
| * | | GSAM voluntarily agreed to waive a portion of its Management fee in order to achieve an effective rate of 0.33% as an annual percentage rate of average daily net assets each of Investment Grade Credit and U.S. Mortgages for the six months ended September 30, 2008. |
GOLDMAN SACHS SINGLE SECTOR FIXED INCOME FUNDS
Notes to Financial Statements (continued)
September 30, 2008 (Unaudited)
| |
| 3. AGREEMENTS (continued) | |
B. Distribution Agreement and Service Plans — The Trust, on behalf of each Fund, has adopted Distribution and Service Plans (the “Plans”). Under the Plans, Goldman Sachs and/or authorized dealers are entitled to a monthly fee for distribution services equal to, on an annual basis, 0.25%, 0.75%, 0.75% and 0.50% of each Fund’s average daily net assets attributable to Class A, Class B, Class C and Class R Shares, respectively. Additionally, Goldman Sachs and/or authorized dealers are entitled to receive, under the Plans, a separate fee for personal and account maintenance services equal to, on an annual basis, 0.25% of each Fund’s average daily net assets attributable to Class B and Class C Shares. With respect to Class A and Class R Shares, the Distributor at its discretion may use compensation for distribution services paid under the Plans to compensate service organizations for personal and account maintenance services and expenses so long as such total compensation under the Plans do not exceed the maximum cap on “service fees” imposed by the Financial Industry Regulatory Authority.
Goldman Sachs may retain a portion of the Class A sales load and Class B and Class C contingent deferred sales charges. During the six months ended September 30, 2008, Goldman Sachs advised the Funds that it retained the following approximate amounts:
| | | | | | | | | | | | | |
| | | Front End
| | | Contingent Deferred
| |
| | | Sales Load | | | Sales Charge | |
| Fund | | Class A | | | Class B | | | Class C | |
| | |
| Emerging Markets Debt | | $ | 3,300 | | | | N/A | | | $ | — | |
| |
| |
| High Yield | | | 63,400 | | | | — | | | | 100 | |
| |
| |
| Investment Grade Credit | | | 200 | | | | N/A | | | | N/A | |
| |
| |
| Local Emerging Markets Debt | | | 300 | | | | N/A | | | | — | |
| |
| |
C. Transfer Agency Agreement — Goldman Sachs also serves as Transfer Agent of the Funds for a fee pursuant to a Transfer Agency Agreement. The fees charged for such transfer agency services are calculated daily and payable monthly at an annual rate as follows: 0.13% of the average daily net assets for Class A, Class B, Class C, Class IR and Class R Shares and 0.04% of the average daily net assets for Institutional, Separate Account Institutional, and Service Shares. Goldman Sachs has voluntarily agreed to waive a portion of the Transfer Agent Fees equal to 0.02% of the average daily net assets attributable to Institutional and Separate Account Institutional Shares of Investment Grade Credit and U.S. Mortgages. Goldman may discontinue or modify the waiver in the future at its discretion.
D. Service Plan and Shareholder Administration Plans — The Trust, on behalf of High Yield, has adopted a Service Plan and Shareholder Administration Plan for Service Shares. These plans allow for Service Shares to compensate service organizations for providing varying levels of personal and account administration and shareholder administration services to their customers who are beneficial owners of such shares. The Service Plan and Shareholder Administration Plan each provide for compensation to the service organizations in an amount equal to, on an annual basis, 0.25% of the average daily net assets of the Service Shares.
E. Account Service Plans — The Trust, on behalf of Class A and Institutional Shares of Investment Grade Credit and U.S. Mortgages Funds, has adopted Account Service Plans. Under these Plans, Goldman Sachs and authorized dealers are entitled to receive a fee for account service and account maintenance equal to, on an annual basis, 0.05% of the average daily net assets of U.S. Mortgages and Investment Grade Credit Funds attributable to Class A and Institutional Shares.
F. Other Agreements — GSAM has voluntarily agreed to limit certain “Other Expenses” of the Funds (excluding Management fees, Distribution and Service fees, Transfer Agent fees and expenses, Service Share fees, Account Service fees, taxes, interest, brokerage fees and litigation, indemnification, shareholder meetings and other extraordinary expenses, exclusive of any custody and transfer agent fee credit reductions) to the extent such expenses exceed, on an annual basis, a percentage rate of the average daily net assets of each Fund. Such expense reimbursements, if any, are computed daily and
GOLDMAN SACHS SINGLE SECTOR FIXED INCOME FUNDS
| |
| 3. AGREEMENTS (continued) | |
paid monthly. In addition, the Funds are not obligated to reimburse GSAM for prior fiscal year expense reimbursements, if any. The Other Expenses limitations for Emerging Markets Debt, High Yield, Investment Grade Credit, Local Emerging Markets Debt and U.S. Mortgages as an annual percentage rate of average daily net assets were 0.044%, 0.024%, 0.004%, 0.074% and 0.004%, respectively.
In addition, the Funds have entered into certain offset arrangements with the custodian and transfer agent resulting in a reduction of the Funds’ expenses. For the six months ended September 30, 2008, these expense reductions, including any waivers and expense reimbursements were as follows (in thousands):
| | | | | | | | | | | | | | | | | | | | | | | | | |
| | | | | | | | | | | | Fee Credits | | | | |
| | | Fee Waivers | | | Other
| | | Custody
| | | | | | Total
| |
| | | Management
| | | Transfer
| | | Expense
| | | Fee
| | | Transfer
| | | Expense
| |
| Fund | | Fees | | | Agent Fees | | | Reimbursement | | | Reductions | | | Agent Fee | | | Reductions | |
| | |
| Emerging Markets Debt | | $ | — | | | $ | — | | | $ | 195 | | | $ | 8 | | | $ | — | | | $ | 203 | |
| |
| |
| High Yield | | | — | | | | — | | | | 58 | | | | 42 | | | | 10 | | | | 110 | |
| |
| |
| Investment Grade Credit | | | 87 | | | | 24 | | | | 159 | | | | 2 | | | | — | | | | 272 | |
| |
| |
| Local Emerging Markets Debt | | | — | | | | — | | | | 184 | | | | 30 | | | | — | | | | 214 | |
| |
| |
| U.S. Mortgages | | | 283 | | | | 80 | | | | 299 | | | | 15 | | | | — | | | | 677 | |
| |
| |
As of September 30, 2008, the amounts owed to affiliates of the Funds were as follows (in thousands):
| | | | | | | | | | | | | | | | | | | | | |
| | | Management
| | | Distribution and
| | | Transfer
| | | Over
| | | | |
| Fund | | Fees | | | Service Fees | | | Agent Fees | | | Reimbursement | | | Total | |
| | |
| Emerging Markets Debt | | $ | 146 | | | $ | 17 | | | $ | 13 | | | $ | — | | | $ | 176 | |
| |
| |
| High Yield | | | 1,996 | | | | 503 | | | | 262 | | | | — | | | | 2,761 | |
| |
| |
| Investment Grade Credit | | | 68 | | | | 3 | | | | 5 | | | | — | | | | 76 | |
| |
| |
| Local Emerging Markets Debt | | | 128 | | | | 7 | | | | 8 | | | | 125 | | | | 268 | |
| |
| |
| U.S. Mortgages | | | 226 | | | | 2 | | | | 14 | | | | — | | | | 242 | |
| |
| |
4. FAIR VALUE OF INVESTMENTS
For the period ended September 30, 2008, the Funds adopted FASB Statement of Financial Accounting Standards No. 157, Fair Value Measurements (“FAS 157”). FAS 157 establishes fair value hierarchy that prioritizes the inputs to valuation techniques used to measure fair value. The hierarchy gives the highest priority to unadjusted quoted prices in active markets for identical assets or liabilities (Level 1 measurements) and the lowest priority to unobservable inputs (Level 3 measurements). The three levels of the fair value hierarchy under FAS 157 are described below:
Level 1 — Unadjusted quoted prices in active markets that are accessible at the measurement date for identical, unrestricted assets or liabilities;
Level 2 — Quoted prices in markets that are not active or financial instruments for which all significant inputs are observable, either directly or indirectly;
Level 3 — Prices or valuations that require inputs that are both significant to the fair value measurement and unobservable.
GOLDMAN SACHS SINGLE SECTOR FIXED INCOME FUNDS
Notes to Financial Statements (continued)
September 30, 2008 (Unaudited)
| |
| 4. FAIR VALUE OF INVESTMENTS (continued) | |
As required by FAS 157, assets and liabilities are classified in their entirety based on the lowest level of input that is significant to the fair value measurement. The following is a summary of the levels within the fair value hierarchy in which the Funds invest:
| | | | | | | | | | | | | | | | | | | | | | | | | | | | | | | | | |
| | | Emerging Markets Debt | | | High Yield | |
| | | Investments in
| | | Investments in
| | | | | | | | | Investments in
| | | Investments in
| | | | | | | |
| | | Securities
| | | Securities
| | | Derivatives-
| | | Derivatives-
| | | Securities
| | | Securities
| | | Derivatives-
| | | Derivatives-
| |
| Level | | Long-Assets | | | Short-Liabilities | | | Assets | | | Liabilities | | | Long-Assets | | | Short-Liabilities | | | Assets | | | Liabilities | |
| | |
| Level 1 | | $ | – | | | $ | – | | | $ | 46,805 | | | $ | – | | | $ | 4,488,235 | | | $ | – | | | $ | – | | | $ | – | |
| Level 2 | | | 195,475,383 | | | | – | | | | 1,538,937 | | | | (968,755 | ) | | | 3,498,979,557 | | | | – | | | | 30,288,407 | | | | (823,305 | ) |
| Level 3 | | | 1,722,003 | | | | – | | | | – | | | | – | | | | 6,026,732 | | | | – | | | | – | | | | – | |
| |
| |
Total | | $ | 197,197,386 | | | $ | – | | | $ | 1,585,742 | | | $ | (968,755 | ) | | $ | 3,509,494,524 | | | $ | – | | | $ | 30,288,407 | | | $ | (823,305 | ) |
| |
| |
| | | | | | | | | | | | | | | | | | | | | | | | | | | | | | | | | |
| | | | | | | | | | | | | | | | | | | | | | | | | | | | | | | | | |
| | | Investment Grade Credit | | | Local Emerging Markets Debt | |
| | | Investments in
| | | Investments in
| | | | | | | | | Investments in
| | | Investments in
| | | | | | | |
| | | Securities
| | | Securities
| | | Derivatives-
| | | Derivatives-
| | | Securities
| | | Securities
| | | Derivatives-
| | | Derivatives-
| |
| Level | | Long-Assets | | | Short-Liabilities | | | Assets | | | Liabilities | | | Long-Assets | | | Short-Liabilities | | | Assets | | | Liabilities | |
| | |
| Level 1 | | $ | – | | | $ | – | | | $ | 393,696 | | | $ | (301,323 | ) | | $ | – | | | $ | – | | | $ | – | | | $ | – | |
| Level 2 | | | 244,092,169 | | | | (2,028,125 | ) | | | 1,696,911 | | | | (302,412 | ) | | | 152,369,081 | | | | – | | | | 5,902 | | | | (5,059,431 | ) |
| Level 3 | | | – | | | | – | | | | – | | | | – | | | | 7,810,326 | | | | – | | | | – | | | | – | |
| |
| |
Total | | $ | 244,092,169 | | | $ | (2,028,125 | ) | | $ | 2,090,607 | | | $ | (603,735 | ) | | $ | 160,179,407 | | | $ | – | | | $ | 5,902 | | | $ | (5,059,431 | ) |
| |
| |
| | | | | | | | | | | | | | | | | | | | | | | | | | | | | | | | | |
| | | | | | | | | | | | | | | | | | | | | | | | | | | | | | | | | |
| | | U.S. Mortgages | | | | | | | | | | | | | |
| | | Investments in
| | | Investments in
| | | | | | | | | | | | | | | | | | | |
| | | Securities
| | | Securities
| | | Derivatives-
| | | Derivatives-
| | | | | | | | | | | | | |
| Level | | Long-Assets | | | Short-Liabilities | | | Assets | | | Liabilities | | | | | | | | | | | | | |
| | | | | | | | | | | | | | |
| Level 1 | | $ | – | | | $ | – | | | $ | 108,738 | | | $ | (187,706 | ) | | | | | | | | | | | | | | | | |
| Level 2 | | | 928,822,883 | | | | (50,145,022 | ) | | | 2,150,320 | | | | (1,118,162 | ) | | | | | | | | | | | | | | | | |
| Level 3 | | | – | | | | – | | | | – | | | | – | | | | | | | | | | | | | | | | | |
| | | | | | | | | | | | | | | | | |
| | | | | | | | | | | | | | | | | |
Total | | $ | 928,822,883 | | | $ | (50,145,022 | ) | | $ | 2,150,320 | | | $ | (1,197,130 | ) | | | | | | | | | | | | | | | | |
| | | | | | | | | | | | | | | | | |
| | | | | | | | | | | | | | | | | |
The following is a reconciliation of Level 3 investments for the six months ended September 30, 2008.
| | | | | | | | | | | | | |
| | | Emerging Markets
| | | | | | Local Emerging
| |
| | | Debt | | | High Yield | | | Markets Debt | |
| | | Investments in
| | | Investments in
| | | Investments in
| |
| | | Securities
| | | Securities
| | | Securities
| |
| Level 3 | | Long-Assets | | | Long-Assets | | | Long-Assets | |
| | |
| Beginning Balance as of March 31, 2008 | | $ | 281,300 | | | $ | 22,451,904 | | | $ | 2,192,165 | |
| Realized gain (loss) | | | – | | | | – | | | | – | |
| Change in unrealized gain (loss) | | | (115,556 | ) | | | (4,436,126 | ) | | | (692,542 | ) |
| Net purchase (sales) | | | – | | | | (2,700,077 | ) | | | 6,310,703 | |
| Net transfers in and/or out of Level 3 | | | 1,556,259 | | | | (9,288,969 | ) | | | – | |
| |
| |
| Ending Balance as of September 30, 2008 | | $ | 1,722,003 | | | $ | 6,026,732 | | | $ | 7,810,326 | |
| |
| |
GOLDMAN SACHS SINGLE SECTOR FIXED INCOME FUNDS
5. PORTFOLIO SECURITIES TRANSACTIONS
The cost of purchases and proceeds from sales and maturities of long-term securities for the six months ended September 30, 2008, were as follows:
| | | | | | | | | | | | | | | | | |
| | | | | | | | | Sales and
| | | Sales and Maturities
| |
| | | Purchases of
| | | Purchases
| | | Maturities of
| | | (Excluding
| |
| | | U.S. Government
| | | (Excluding
| | | U.S. Government
| | | U.S. Government
| |
| | | and Agency
| | | U.S. Government and
| | | and Agency
| | | and Agency
| |
| Fund | | Obligations | | | Agency Obligations) | | | Obligations | | | Obligations) | |
| | |
| Emerging Markets Debt | | $ | 8,863,226 | | | $ | 150,304,571 | | | $ | 6,005,150 | | | $ | 156,392,305 | |
| |
| |
| High Yield | | | — | | | | 596,954,056 | | | | — | | | | 243,418,090 | |
| |
| |
| Investment Grade Credit | | | 31,859,949 | | | | 72,080,586 | | | | 10,001,877 | | | | 69,501,344 | |
| |
| |
| Local Emerging Markets Debt | | | — | | | | 131,249,475 | | | | — | | | | 32,437,395 | |
| |
| |
| U.S. Mortgages | | | 1,456,502,459 | | | | 21,075,882 | | | | 1,196,272,602 | | | | 4,349,829 | |
| |
| |
For the six months ended September 30, 2008, Emerging Markets Debt, Investment Grade Credit and U.S. Mortgages paid commissions of approximately $1,000, $13,900 and $33,500, respectively in connection with futures contracts entered into with Goldman Sachs as the Futures Commission Merchant.
6. SECURITIES LENDING
The Funds may lend their securities through an agreement with their custodian, State Street Bank and Trust Company (“SSB”). In accordance with the Funds’ security lending procedures, the loans are collateralized at all times with cash and/or securities with a market value at least equal to the securities on loan. The market value of the loaned securities is determined at the close of business of the Funds, in accordance with the Funds’ valuation policies or, if applicable, by the valuation procedures established by the Board of Trustees, and any additional required collateral is delivered to the Funds on the next business day. As with other extensions of credit, the Funds bear the risk of delay on recovery or loss of rights in the collateral should the borrower of the securities fail financially.
The Funds invest the cash collateral received in connection with securities lending transactions in the State Street Navigator Securities Lending Prime Portfolio (the “Portfolio”). The Portfolio is a private, registered money market fund and is managed by State Street Global Advisors (“SSgA”). The Portfolio has been established primarily for the investment of cash collateral on behalf of funds participating in SSB’s securities lending program and complies with the requirements of Rule 2a-7 of the 1940 Act. The Funds bear the risk of incurring a loss from the investment of cash collateral due to either credit or market factors. Both the Funds and SSB receive compensation relating to the lending of the Funds’ securities. The amounts earned by the Funds for the six months ended September 30, 2008, are reported parenthetically under Investment Income on the Statements of Operations. Effective October 2, 2008, the Funds suspended this program but may resume lending securities in the future.
7. LINE OF CREDIT FACILITY
The Funds, except for Local Emerging Markets Debt, participated in a $700,000,000 committed, unsecured revolving line of credit facility (the “facility”) together with other funds of the Trust and registered investment companies having a management agreement with GSAM or affiliates. This facility is to be used solely for temporary or emergency purposes. The interest rate on borrowings is based on the federal funds rate. The committed facility also requires a fee to be paid by the Funds based on the amount of the commitment that has not been utilized. For the six months ended September 30, 2008, the Funds did not have any borrowings under the facility. Prior to May 13, 2008, the amount of the facility was $450,000,000.
GOLDMAN SACHS SINGLE SECTOR FIXED INCOME FUNDS
Notes to Financial Statements (continued)
September 30, 2008 (Unaudited)
8. TAX INFORMATION
As of the most recent fiscal year ended, March 31, 2008, the Funds’ capital loss carryforwards and certain timing differences on a tax basis were as follows.
| | | | | | | | | | | | | | | | | | | | | |
| | | Emerging
| | | | | | Investment Grade
| | | Local Emerging
| | | | |
| | | Markets Debt | | | High Yield | | | Credit | | | Markets Debt | | | U.S. Mortgages | |
| | |
Capital loss carryforward:(1) | | | | | | | | | | | | | | | | | | | | |
| Expiring 2009 | | $ | — | | | $ | (11,007,057 | ) | | $ | — | | | $ | — | | | $ | — | |
| Expiring 2010 | | | — | | | | (3,471,539 | ) | | | — | | | | — | | | | — | |
| Expiring 2011 | | | — | | | | (1,172,508 | ) | | | — | | | | — | | | | — | |
| Expiring 2012 | | | — | | | | — | | | | — | | | | — | | | | — | |
| Expiring 2013 | | | | | | | — | | | | — | | | | — | | | | — | |
| Expiring 2014 | | | | | | | (8,291,304 | ) | | | (2,649,569 | ) | | | — | | | | — | |
| Expiring 2015 | | | — | | | | — | | | | — | | | | — | | | | — | |
| Expiring 2016 | | | — | | | | (49,236,893 | ) | | | (487,181 | ) | | | — | | | | — | |
| |
| |
| Total capital loss carryforward | | $ | — | | | $ | (73,179,301 | ) | | $ | (3,136,750 | ) | | $ | — | | | $ | — | |
| |
| |
| Timing differences (income distribution payables, straddles and swap income receivables) | | $ | (533,872 | ) | | $ | (4,816,962 | ) | | $ | (568,985 | ) | | $ | 1,485 | | | $ | (817,792 | ) |
| |
| |
| | |
| (1) | | Expiration occurs on March 31 of the year indicated. |
As of September 30, 2008, the Funds’ aggregate security unrealized gains and losses based on cost for U.S. federal income tax purposes was as follows:
| | | | | | | | | | | | | | | | | | | | | |
| | | Emerging
| | | | | | Investment Grade
| | | Local Emerging
| | | | |
| | | Markets Debt | | | High Yield | | | Credit | | | Markets Debt | | | U.S. Mortgages | |
| | |
| Tax Cost | | $ | 218,940,235 | | | $ | 4,280,165,500 | | | $ | 276,584,727 | | | $ | 173,779,163 | | | $ | 992,606,263 | |
| |
| |
| Gross unrealized gain | | | 611,491 | | | | 12,251,792 | | | | 221,251 | | | | 11,032 | | | | 4,531,909 | |
| Gross unrealized loss | | | (22,354,340 | ) | | | (782,922,768 | ) | | | (32,713,809 | ) | | | (13,610,788 | ) | | | (68,315,289 | ) |
| |
| |
| Net unrealized security loss | | $ | (21,742,849 | ) | | $ | (770,670,976 | ) | | $ | (32,492,558 | ) | | $ | (13,599,756 | ) | | $ | (63,783,380 | ) |
| |
| |
The difference between book-basis and tax-basis unrealized gains (losses) is attributable to net mark-to market gains (losses) on regulated futures and foreign currency contracts and wash sales as of the most recent fiscal year end.
9. OTHER RISKS
Funds’ Shareholder Concentration — Certain Goldman Sachs Fund of Fund Portfolios may invest a significant percentage of its assets in the Funds. In the event the Fund of Funds Portfolios experience significant redemptions and/or reallocations, the Funds may be exposed to liquidity risk. In particular, the Fund may encounter difficulty meeting redemptions if unusual market conditions create an unfavorable environment in which the Fund is forced to liquidate its
GOLDMAN SACHS SINGLE SECTOR FIXED INCOME FUNDS
| |
| 9. OTHER RISKS (continued) | |
securities. The following Portfolios were beneficial owners of certain Funds with amounts of 5% or greater as of September 30, 2008 (as a percentage of outstanding shares):
| | | | | | | | | | | | | |
| | | | | | | | | Goldman Sachs
| |
| | | Goldman Sachs
| | | Goldman Sachs
| | | Growth and Income
| |
| | | Balanced
| | | Growth Strategy
| | | Strategy
| |
| Fund | | Strategy Portfolio | | | Portfolio | | | Portfolio | |
| | |
| Emerging Markets Debt | | | 6 | % | | | 18 | % | | | 22 | % |
| |
| |
| Local Emerging Markets Debt | | | 7 | | | | 24 | | | | 29 | |
| |
| |
As of September 30, 2008, Goldman Sachs Group, Inc. was the beneficial owner of approximately 32% of Shares outstanding of Class C Shares of the Local Emerging Markets Debt Fund and 100% of Shares outstanding of Class IR and Class R Shares of the High Yield Fund.
Indemnifications — Under the Trust’s organizational documents, its Board of Trustees, officers, employees and agents are indemnified, to the extent permitted by the Act, against certain liabilities that may arise out of performance of their duties to the Funds. Additionally, in the course of business, the Funds enter into contracts that contain a variety of indemnification clauses. The Funds’ maximum exposure under these arrangements is unknown; as this would involve future claims that may be against the Funds that have not yet occurred. However, the Funds believe the risk of loss under these arrangements to be remote.
Market and Credit Risks — In the normal course of business the Funds trade financial instruments and enter into financial transactions where risk of potential loss exists due to changes in the market (market risk) or failure of the contracting party to the transaction to perform (credit risk). The Funds may be exposed to additional credit risk that an institution or other entity with which the Funds have unsettled or open transactions will default.
Investing in foreign markets may involve special risks and considerations not typically associated with investing in the U.S. These risks include revaluation of currencies, high rates of inflation, repatriation restrictions on income and capital, and adverse political and economic developments. Moreover, securities issued in these markets may be less liquid, subject to government ownership controls, have delayed settlements and their prices may be more volatile than those of comparable securities in the U.S.
10. OTHER MATTERS
Mergers and Reorganizations — At a meeting held on November 9, 2006, the Board of Trustees of the Trust approved an Agreement and Plan of Reorganization (“the Reorganization Agreement”) providing for the tax-free reorganization of the AXA Enterprise High Yield Bond Fund by the High Yield Fund. The reorganization was completed on June 25, 2007, as of the close of business on June 22, 2007.
GOLDMAN SACHS SINGLE SECTOR FIXED INCOME FUNDS
Notes to Financial Statements (continued)
September 30, 2008 (Unaudited)
| |
| 10. OTHER MATTERS (continued) | |
Pursuant to the Reorganization Agreement, the assets and liabilities of the AXA Enterprise High Yield Bond Fund’s (“Acquired Fund”) Class A, Class B, Class C and Class Y were transferred into the High Yield Fund’s (“Survivor Fund”) Class A, Class B, Class C and Institutional Class, respectively, in a tax-free exchange as follows:
| | | | | | | | | | | | | |
| | | Exchanged Shares
| | | | | | Acquired Fund’s
| |
| | | of Survivor
| | | Value of
| | | Shares Outstanding
| |
| Survivor/Acquired Fund | | Issued | | | Exchanged Shares | | | as of June 22, 2007 | |
| | |
| High Yield Class A/ | | | | | | | | | | | | |
| AXA Enterprise High Yield Bond Class A | | | 8,370,809 | | | $ | 68,222,384 | | | | 7,030,741 | |
| |
| |
| High Yield Class B/ | | | | | | | | | | | | |
| AXA Enterprise High Yield Bond Class B | | | 4,327,921 | | | | 35,359,057 | | | | 3,647,903 | |
| |
| |
| High Yield Class C/ | | | | | | | | | | | | |
| AXA Enterprise High Yield Bond Class C | | | 2,322,931 | | | | 18,955,171 | | | | 1,956,052 | |
| |
| |
| High Yield Institutional Class/ | | | | | | | | | | | | |
| AXA Enterprise High Yield Bond Class Y | | | 1,116,820 | | | | 9,113,231 | | | | 938,668 | |
| |
| |
The following chart shows the Survivor Fund’s and Acquired Fund’s aggregate net assets (immediately before and after the completion of the reorganization) and the Acquired Fund’s unrealized appreciation and capital loss carryforwards. Utilization of the Acquired Fund’s capital loss carryforward may be limited under the Code.
| | | | | | | | | | | | | | | | | | | | | |
| | | Survivor Fund’s
| | | Acquired Fund’s
| | | Survivor Fund’s
| | | | | | | |
| | | Aggregate Net
| | | Aggregate Net
| | | Aggregate Net
| | | Acquired Fund’s
| | | Acquired Fund’s
| |
| | | Assets before
| | | Assets before
| | | Assets Immediately
| | | Unrealized
| | | Capital Loss
| |
| Survivor/Acquired Fund | | reorganization | | | reorganization | | | after reorganization | | | Appreciation | | | Carryforward | |
| | |
| High Yield/AXA Enterprise High Yield Bond | | $ | 3,315,990,233 | | | $ | 131,649,843 | | | $ | 3,447,640,076 | | | $ | 1,226,239 | | | $ | (16,622,835 | ) |
| |
| |
New Accounting Pronouncements — In March 2008, the FASB issued Statement of Financial Accounting Standards No. 161, “Disclosures about Derivative Instruments and Hedging Activities” (“FAS 161”). FAS 161 is effective for fiscal years and interim periods beginning after November 15, 2008. FAS 161 requires enhanced disclosures about the Funds’ derivative and hedging activities. Management is currently evaluating the impact the adoption of FAS 161 will have on the Funds’ financial statement disclosures.
GOLDMAN SACHS SINGLE SECTOR FIXED INCOME FUNDS
11. SUMMARY OF SHARE TRANSACTIONS
Share activity is as follows:
| | | | | | | | | | | | | | | | | | | | | | | | | |
| | | Emerging Markets Debt Fund | |
| | | | |
| | | For the Six Months Ended
| | | | | | | |
| | | September 30, 2008
| | | For the Period November 1, 2007
| | | For the Year Ended
| |
| | | (Unaudited) | | | to March 31, 2008* | | | October 31, 2007 | |
| | | | |
| | | Shares | | | Dollars | | | Shares | | | Dollars | | | Shares | | | Dollars | |
| | | | |
Class A Shares | | | | | | | | | | | | | | | | | | | | | | | | |
| Shares sold | | | 2,226,514 | | | $ | 25,591,615 | | | | 2,342,051 | | | $ | 27,667,088 | | | | 4,353,597 | | | $ | 52,317,508 | |
| Shares issued in connection with merger | | | — | | | | — | | | | — | | | | — | | | | — | | | | — | |
| Reinvestment of distributions | | | 186,605 | | | | 2,117,004 | | | | 248,217 | | | | 2,928,894 | | | | 369,563 | | | | 4,425,421 | |
| Shares redeemed | | | (3,656,773 | ) | | | (41,480,108 | ) | | | (1,996,878 | ) | | | (23,559,570 | ) | | | (3,548,141 | ) | | | (42,424,740 | ) |
| |
| |
| | | | (1,243,654 | ) | | | (13,771,489 | ) | | | 593,390 | | | | 7,036,412 | | | | 1,175,019 | | | | 14,318,189 | |
| |
| |
Class C Shares | | | | | | | | | | | | | | | | | | | | | | | | |
| Shares sold | | | 77,467 | | | | 889,885 | | | | 91,162 | | | | 1,074,508 | | | | 82,909 | | | | 985,311 | |
| Shares issued in connection with merger | | | — | | | | — | | | | — | | | | — | | | | — | | | | — | |
| Reinvestment of distributions | | | 3,656 | | | | 41,205 | | | | 3,007 | | | | 35,366 | | | | 807 | | | | 9,614 | |
| Shares redeemed | | | (54,173 | ) | | | (622,129 | ) | | | (13,203 | ) | | | (155,072 | ) | | | (1,885 | ) | | | (22,264 | ) |
| |
| |
| | | | 26,950 | | | | 308,961 | | | | 80,966 | | | | 954,802 | | | | 81,831 | | | | 972,661 | |
| |
| |
Institutional Shares | | | | | | | | | | | | | | | | | | | | | | | | |
| Shares sold | | | 3,842,735 | | | | 44,126,722 | | | | 2,108,545 | | | | 25,017,544 | | | | 9,558,691 | | | | 114,673,029 | |
| Shares issued in connection with merger | | | — | | | | — | | | | — | | | | — | | | | — | | | | — | |
| Reinvestment of distributions | | | 396,189 | | | | 4,487,979 | | | | 635,605 | | | | 7,510,547 | | | | 740,538 | | | | 8,868,292 | |
| Shares redeemed | | | (3,875,840 | ) | | | (43,547,490 | ) | | | (5,742,828 | ) | | | (67,450,420 | ) | | | (1,924,964 | ) | | | (22,990,871 | ) |
| |
| |
| | | | 363,084 | | | | 5,067,211 | | | | (2,998,678 | ) | | | (34,922,329 | ) | | | 8,374,265 | | | | 100,550,450 | |
| |
| |
NET INCREASE (DECREASE) | | | (853,620 | ) | | $ | (8,395,317 | ) | | | (2,324,322 | ) | | $ | (26,931,115 | ) | | | 9,631,115 | | | $ | 115,841,300 | |
| |
| |
| | |
| * | | The Fund changed its fiscal year end from October 31 to March 31. |
GOLDMAN SACHS SINGLE SECTOR FIXED INCOME FUNDS
Notes to Financial Statements (continued)
September 30, 2008 (Unaudited)
Share activity is as follows:
| | | | | | | | | | | | | | | | | | | | | | | | | |
| | | | | | | | | High Yield Fund | | | | | | | |
| | | | |
| | | For the Six Months Ended
| | | | | | | |
| | | September 30, 2008
| | | For the Period November 1, 2007
| | | For the Year Ended
| |
| | | (Unaudited) | | | to March 31, 2008* | | | October 31, 2007 | |
| | | | |
| | | Shares | | | Dollars | | | Shares | | | Dollars | | | Shares | | | Dollars | |
| | | | |
Class A Shares | | | | | | | | | | | | | | | | | | | | | | | | |
| Shares sold | | | 81,424,744 | | | $ | 568,886,659 | | | | 35,716,778 | | | $ | 264,555,735 | | | | 96,811,653 | | | $ | 784,743,576 | |
| Shares issued in connection with merger | | | — | | | | — | | | | — | | | | — | | | | 8,370,809 | | | | 68,222,384 | |
| Reinvestment of distributions | | | 8,572,864 | | | | 60,112,454 | | | | 7,078,436 | | | | 52,380,371 | | | | 12,888,183 | | | | 103,737,100 | |
Shares converted from Class B(a) | | | 267,862 | | | | 1,919,400 | | | | 291,849 | | | | 2,166,360 | | | | 393,525 | | | | 3,149,357 | |
| Shares redeemed | | | (47,533,196 | ) | | | (336,550,242 | ) | | | (35,578,487 | ) | | | (263,914,880 | ) | | | (67,997,624 | ) | | | (547,222,326 | ) |
| |
| |
| | | | 42,732,274 | | | | 294,368,271 | | | | 7,508,576 | | | | 55,187,586 | | | | 50,466,546 | | | | 412,630,091 | |
| |
| |
Class B Shares | | | | | | | | | | | | | | | | | | | | | | | | |
| Shares sold | | | 400,766 | | | | 2,887,773 | | | | 330,804 | | | | 2,464,142 | | | | 1,658,242 | | | | 13,495,012 | |
| Shares issued in connection with merger | | | — | | | | — | | | | — | | | | — | | | | 4,327,921 | | | | 35,359,057 | |
| Reinvestment of distributions | | | 348,575 | | | | 2,452,661 | | | | 341,133 | | | | 2,529,064 | | | | 653,818 | | | | 5,261,142 | |
Shares converted to Class A(a) | | | (267,713 | ) | | | (1,919,400 | ) | | | (291,455 | ) | | | (2,166,360 | ) | | | (392,852 | ) | | | (3,149,357 | ) |
| Shares redeemed | | | (1,800,357 | ) | | | (12,723,895 | ) | | | (1,936,011 | ) | | | (14,330,803 | ) | | | (3,681,580 | ) | | | (29,577,301 | ) |
| |
| |
| | | | (1,318,729 | ) | | | (9,302,861 | ) | | | (1,555,529 | ) | | | (11,503,957 | ) | | | 2,565,549 | | | | 21,388,553 | |
| |
| |
Class C Shares | | | | | | | | | | | | | | | | | | | | | | | | |
| Shares sold | | | 1,453,396 | | | | 10,446,356 | | | | 1,169,706 | | | | 8,724,064 | | | | 5,101,822 | | | | 41,491,709 | |
| Shares issued in connection with merger | | | — | | | | — | | | | — | | | | — | | | | 2,322,931 | | | | 18,955,171 | |
| Reinvestment of distributions | | | 331,718 | | | | 2,330,806 | | | | 307,774 | | | | 2,279,416 | | | | 594,235 | | | | 4,781,271 | |
| Shares redeemed | | | (2,258,185 | ) | | | (16,034,624 | ) | | | (2,295,475 | ) | | | (17,058,476 | ) | | | (4,268,770 | ) | | | (34,240,044 | ) |
| |
| |
| | | | (473,071 | ) | | | (3,257,462 | ) | | | (817,995 | ) | | | (6,054,996 | ) | | | 3,750,218 | | | | 30,988,107 | |
| |
| |
Institutional Shares | | | | | | | | | | | | | | | | | | | | | | | | |
| Shares sold | | | 90,573,218 | | | | 626,307,490 | | | | 51,355,920 | | | | 385,356,277 | | | | 111,403,467 | | | | 900,996,513 | |
| Shares issued in connection with merger | | | — | | | | — | | | | — | | | | — | | | | 1,116,820 | | | | 9,113,231 | |
| Reinvestment of distributions | | | 7,129,155 | | | | 50,099,202 | | | | 6,073,478 | | | | 44,983,452 | | | | 10,066,461 | | | | 81,175,867 | |
| Shares redeemed | | | (43,728,877 | ) | | | (310,451,503 | ) | | | (36,406,155 | ) | | | (267,340,275 | ) | | | (76,426,912 | ) | | | (619,115,202 | ) |
| |
| |
| | | | 53,973,496 | | | | 365,955,189 | | | | 21,023,243 | | | | 162,999,454 | | | | 46,159,836 | | | | 372,170,409 | |
| |
| |
Service Shares | | | | | | | | | | | | | | | | | | | | | | | | |
| Shares sold | | | 654,415 | | | | 4,710,323 | | | | 492,583 | | | | 3,604,127 | | | | 777,362 | | | | 6,265,241 | |
| Reinvestment of distributions | | | 56,368 | | | | 393,852 | | | | 34,195 | | | | 252,104 | | | | 35,411 | | | | 283,776 | |
| Shares redeemed | | | (159,869 | ) | | | (1,124,823 | ) | | | (101,159 | ) | | | (737,200 | ) | | | (123,655 | ) | | | (998,930 | ) |
| |
| |
| | | | 550,914 | | | | 3,979,352 | | | | 425,619 | | | | 3,119,031 | | | | 689,118 | | | | 5,550,087 | |
| |
| |
Class IR Shares(b) | | | | | | | | | | | | | | | | | | | | | | | | |
| Shares sold | | | — | | | | — | | | | 1,302 | | | | 10,000 | | | | — | | | | — | |
| Reinvestment of distributions | | | 58 | | | | 402 | | | | 39 | | | | 289 | | | | — | | | | — | |
| |
| |
| | | | 58 | | | | 402 | | | | 1,341 | | | | 10,289 | | | | — | | | | — | |
| |
| |
Class R Shares(b) | | | | | | | | | | | | | | | | | | | | | | | | |
| Shares sold | | | 6 | | | | 44 | | | | 1,302 | | | | 10,000 | | | | — | | | | — | |
| Reinvestment of distributions | | | 54 | | | | 377 | | | | 37 | | | | 273 | | | | — | | | | — | |
| |
| |
| | | | 60 | | | | 421 | | | | 1,339 | | | | 10,273 | | | | — | | | | — | |
| |
| |
NET INCREASE (DECREASE) | | | 95,465,002 | | | $ | 651,743,312 | | | | 26,586,594 | | | $ | 203,767,680 | | | | 103,631,267 | | | $ | 842,727,247 | |
| |
| |
| | |
| * | | The Fund changed its fiscal year end from October 31 to March 31. |
| (a) | | Class B Shares automatically convert into Class A Shares on or about the fifteenth day of the last month of the calendar quarter that is eight years after the initial purchase date of either the Fund or another Goldman Sachs Fund. |
| | |
| (b) | | Class IR and R Shares of the High Yield Fund commenced operations on November 30, 2007. |
GOLDMAN SACHS SINGLE SECTOR FIXED INCOME FUNDS
11. SUMMARY OF SHARE TRANSACTIONS (continued)
Share activity is as follows:
| | | | | | | | | | | | | | | | | | | | | | | | | |
| | | Investment Grade Credit Fund | |
| | | | |
| | | For the Six Months Ended
| | | | | | | |
| | | September 30, 2008
| | | For the Period November 1, 2007
| | | For the Year Ended
| |
| | | (Unaudited) | | | to March 31, 2008* | | | October 31, 2007 | |
| | | | |
| | | Shares | | | Dollars | | | Shares | | | Dollars | | | Shares | | | Dollars | |
| | |
Class A Shares | | | | | | | | | | | | | | | | | | | | | | | | |
| Shares sold | | | 568,660 | | | $ | 5,260,209 | | | | 125,628 | | | $ | 1,242,804 | | | | 603,406 | | | $ | 5,994,828 | |
| Reinvestment of distributions | | | 28,809 | | | | 265,944 | | | | 16,689 | | | | 164,540 | | | | 29,335 | | | | 290,799 | |
| Shares redeemed | | | (152,287 | ) | | | (1,415,045 | ) | | | (31,251 | ) | | | (306,945 | ) | | | (106,258 | ) | | | (1,054,310 | ) |
| |
| |
| | | | 445,182 | | | | 4,111,108 | | | | 111,066 | | | | 1,100,399 | | | | 526,483 | | | | 5,231,317 | |
| |
| |
Institutional Shares | | | | | | | | | | | | | | | | | | | | | | | | |
| Shares sold | | | 378,085 | | | | 3,558,363 | | | | 118,021 | | | | 1,151,363 | | | | 838,243 | | | | 8,320,685 | |
| Reinvestment of distributions | | | 24,098 | | | | 223,175 | | | | 17,433 | | | | 172,373 | | | | 23,646 | | | | 234,541 | |
| Shares redeemed | | | (200,583 | ) | | | (1,895,855 | ) | | | (145,867 | ) | | | (1,434,882 | ) | | | (96,478 | ) | | | (953,900 | ) |
| |
| |
| | | | 201,600 | | | | 1,885,683 | | | | (10,413 | ) | | | (111,146 | ) | | | 765,411 | | | | 7,601,326 | |
| |
| |
Separate Account Institutional Shares | | | | | | | | | | | | | | | | | | | | | | | | |
| Shares sold | | | 4,773,555 | | | | 44,908,500 | | | | 3,547,009 | | | | 35,150,925 | | | | 6,860,944 | | | | 68,122,336 | |
| Reinvestment of distributions | | | 594,366 | | | | 5,518,897 | | | | 435,843 | | | | 4,305,472 | | | | 921,386 | | | | 9,148,848 | |
| Shares redeemed | | | (3,897,744 | ) | | | (36,540,765 | ) | | | (4,685,260 | ) | | | (46,282,467 | ) | | | (4,322,899 | ) | | | (42,939,930 | ) |
| |
| |
| | | | 1,470,177 | | | | 13,886,632 | | | | (702,408 | ) | | | (6,826,070 | ) | | | 3,459,431 | | | | 34,331,254 | |
| |
| |
NET INCREASE (DECREASE) | | | 2,116,959 | | | $ | 19,883,423 | | | | (601,755 | ) | | $ | (5,836,817 | ) | | | 4,751,325 | | | $ | 47,163,897 | |
| |
| |
| | |
| * | | The Fund changed its fiscal year end from October 31 to March 31. |
GOLDMAN SACHS SINGLE SECTOR FIXED INCOME FUNDS
Notes to Financial Statements (continued)
September 30, 2008 (Unaudited)
Share activity is as follows:
| | | | | | | | | | | | | | | | | |
| | | Local Emerging Markets Debt Fund | |
| | | | |
| | | For the Six Months Ended
| | | For the Period from
| |
| | | September 30, 2008
| | | February 15, 2008 to
| |
| | | (Unaudited) | | | March 31, 2008(a) | |
| | | | |
| | | Shares | | | Dollars | | | Shares | | | Dollars | |
| | |
Class A Shares | | | | | | | | | | | | | | | | |
| Shares sold | | | 5,533,543 | | | $ | 54,290,225 | | | | 149,915 | | | $ | 1,510,010 | |
| Reinvestment of distributions | | | 62,469 | | | | 598,434 | | | | 491 | | | | 4,841 | |
| Shares redeemed | | | (2,755,068 | ) | | | (25,913,949 | ) | | | (1 | ) | | | (10 | ) |
| |
| |
| | | | 2,840,944 | | | | 28,974,710 | | | | 150,405 | | | | 1,514,841 | |
| |
| |
Class C Shares | | | | | | | | | | | | | | | | |
| Shares sold | | | 2,155 | | | | 21,000 | | | | 12,847 | | | | 128,003 | |
| Reinvestment of distributions | | | 293 | | | | 2,875 | | | | 20 | | | | 193 | |
| Shares redeemed | | | (12,114 | ) | | | (113,734 | ) | | | (1 | ) | | | (10 | ) |
| |
| |
| | | | (9,666 | ) | | | (89,859 | ) | | | 12,866 | | | | 128,186 | |
| |
| |
Institutional Shares | | | | | | | | | | | | | | | | |
| Shares sold | | | 9,758,692 | | | | 95,443,802 | | | | 6,118,709 | | | | 61,017,236 | |
| Reinvestment of distributions | | | 353,163 | | | | 3,394,129 | | | | 29,451 | | | | 291,384 | |
| Shares redeemed | | | (1,818,594 | ) | | | (17,081,186 | ) | | | (13,562 | ) | | | (134,359 | ) |
| |
| |
| | | | 8,293,261 | | | | 81,756,745 | | | | 6,134,598 | | | | 61,174,261 | |
| |
| |
NET INCREASE | | | 11,124,539 | | | $ | 110,641,596 | | | | 6,297,869 | | | $ | 62,817,288 | |
| |
| |
| | |
| * | | The Fund changed its fiscal year end from October 31 to March 31. |
| (a) | | The Local Emerging Markets Debt Fund commenced operations on February 15, 2008. |
GOLDMAN SACHS SINGLE SECTOR FIXED INCOME FUNDS
11. SUMMARY OF SHARE TRANSACTIONS (continued)
Share activity is as follows:
| | | | | | | | | | | | | | | | | | | | | | | | | |
| | | U.S. Mortgages Fund | |
| | | | |
| | | For the Six Months Ended
| | | | | | | |
| | | September 30, 2008
| | | For the Period November 1, 2007
| | | For the Year Ended
| |
| | | (Unaudited) | | | to March 31, 2008* | | | October 31, 2007 | |
| | | | |
| | | Shares | | | Dollars | | | Shares | | | Dollars | | | Shares | | | Dollars | |
| | |
Class A Shares | | | | | | | | | | | | | | | | | | | | | | | | |
| Shares sold | | | 214,054 | | | $ | 2,071,210 | | | | 24,691 | | | $ | 247,785 | | | | 91,219 | | | $ | 901,860 | |
| Reinvestment of distributions | | | 21,218 | | | | 200,325 | | | | 14,110 | | | | 139,832 | | | | 30,971 | | | | 305,402 | |
| Shares redeemed | | | (137,425 | ) | | | (1,280,370 | ) | | | (19,564 | ) | | | (194,290 | ) | | | (115,990 | ) | | | (1,148,045 | ) |
| |
| |
| | | | 97,847 | | | | 991,165 | | | | 19,237 | | | | 193,327 | | | | 6,200 | | | | 59,217 | |
| |
| |
Institutional Shares | | | | | | | | | | | | | | | | | | | | | | | | |
| Shares sold | | | 15,689,676 | | | | 151,489,068 | | | | 1,647,569 | | | | 16,334,283 | | | | 4,044,591 | | | | 39,935,762 | |
| Reinvestment of distributions | | | 600,279 | | | | 5,660,375 | | | | 279,639 | | | | 2,776,186 | | | | 610,156 | | | | 6,026,409 | |
| Shares redeemed | | | (669,585 | ) | | | (6,358,953 | ) | | | (375,783 | ) | | | (3,747,559 | ) | | | (1,019,855 | ) | | | (9,997,982 | ) |
| |
| |
| | | | 15,620,370 | | | | 150,790,490 | | | | 1,551,425 | | | | 15,362,910 | | | | 3,634,892 | | | | 35,964,189 | |
| |
| |
Separate Account Institutional Shares | | | | | | | | | | | | | | | | | | | | | | | | |
| Shares sold | | | 10,412,724 | | | | 98,940,950 | | | | 8,036,696 | | | | 80,307,030 | | | | 34,189,108 | | | | 338,472,543 | |
| Reinvestment of distributions | | | 1,108,776 | | | | 10,482,813 | | | | 909,719 | | | | 9,035,164 | | | | 1,223,142 | | | | 12,083,102 | |
| Shares redeemed | | | (8,518,304 | ) | | | (80,699,835 | ) | | | (9,982,268 | ) | | | (99,280,994 | ) | | | (12,826,049 | ) | | | (126,898,514 | ) |
| |
| |
| | | | 3,003,196 | | | | 28,723,928 | | | | (1,035,853 | ) | | | (9,938,800 | ) | | | 22,586,201 | | | | 223,657,131 | |
| |
| |
NET INCREASE | | | 18,721,413 | | | $ | 180,505,583 | | | | 534,809 | | | $ | 5,617,437 | | | | 26,227,293 | | | $ | 259,680,537 | |
| |
| |
| | |
| * | | The Fund changed its fiscal year end from October 31 to March 31. |
GOLDMAN SACHS EMERGING MARKETS DEBT FUND
Financial Highlights
Selected Data for a Share Outstanding Throughout Each Period
| | | | | | | | | | | | | | | | | | | | | | | | | | | | | | | | | |
| | | | | | | | Income (loss) from
| | | Distributions
| | | |
| | | | | | | | investment operations | | | to shareholders | | | |
| | | | | Net asset
| | | | | | | | | | | | | | | | | | | | | |
| | | | | value,
| | | Net
| | | Net realized
| | | Total from
| | | From net
| | | From net
| | | | | | |
| | | | | beginning
| | | investment
| | | and unrealized
| | | investment
| | | investment
| | | realized
| | | Total
| | | |
| | | Year - Share Class | | of period | | | income(a) | | | gain (loss) | | | operations | | | income | | | gains | | | distributions | | | |
| |
| | | | | | | | | | | | | | | | | | | | | | | | | | | | | | | | | |
| |
| FOR THE SIX MONTHS ENDED SEPTEMBER 30, (UNAUDITED) |
| | | | | | | | | | | | | | | | | | | | | | | | | | | | | | | | | |
| | | | | | | | | | | | | | | | | | | | | | | | | | | | | | | | | |
| | | 2008 - A | | $ | 11.63 | | | $ | 0.34 | | | $ | (1.20 | ) | | $ | (0.86 | ) | | $ | (0.32 | ) | | $ | — | | | $ | (0.32 | ) | | |
| | | 2008 - C | | | 11.60 | | | | 0.30 | | | | (1.20 | ) | | | (0.90 | ) | | | (0.28 | ) | | | — | | | | (0.28 | ) | | |
| | | 2008 - Institutional | | | 11.63 | | | | 0.36 | | | | (1.20 | ) | | | (0.84 | ) | | | (0.34 | ) | | | — | | | | (0.34 | ) | | |
| | | | | | | | | | | | | | | | | | | | | | | | | | | | | | | | | |
| | | | | | | | | | | | | | | | | | | | | | | | | | | | | | | | | |
| FOR THE PERIOD NOVEMBER 1, 2007, TO MARCH 31, 2008* |
| | | | | | | | | | | | | | | | | | | | | | | | | | | | | | | | | |
| | | | | | | | | | | | | | | | | | | | | | | | | | | | | | | | | |
| | | 2008 - A | | | 12.16 | | | | 0.30 | | | | (0.37 | ) | | | (0.07 | ) | | | (0.31 | ) | | | (0.15 | ) | | | (0.46 | ) | | |
| | | 2008 - C | | | 12.14 | | | | 0.25 | | | | (0.36 | ) | | | (0.11 | ) | | | (0.28 | ) | | | (0.15 | ) | | | (0.43 | ) | | |
| | | 2008 - Institutional | | | 12.17 | | | | 0.32 | | | | (0.38 | ) | | | (0.06 | ) | | | (0.33 | ) | | | (0.15 | ) | | | (0.48 | ) | | |
| | | | | | | | | | | | | | | | | | | | | | | | | | | | | | | | | |
| | | | | | | | | | | | | | | | | | | | | | | | | | | | | | | | | |
| FOR THE YEARS ENDED OCTOBER 31, |
| | | | | | | | | | | | | | | | | | | | | | | | | | | | | | | | | |
| | | | | | | | | | | | | | | | | | | | | | | | | | | | | | | | | |
| | | 2007 - A | | | 11.98 | | | | 0.63 | | | | 0.38 | | | | 1.01 | | | | (0.62 | ) | | | (0.21 | ) | | | (0.83 | ) | | |
| | | 2007 - C | | | 11.97 | | | | 0.53 | | | | 0.38 | | | | 0.91 | | | | (0.53 | ) | | | (0.21 | ) | | | (0.74 | ) | | |
| | | 2007 - Institutional | | | 11.99 | | | | 0.67 | | | | 0.39 | | | | 1.06 | | | | (0.67 | ) | | | (0.21 | ) | | | (0.88 | ) | | |
| | | | | | | | | | | | | | | | | | | | | | | | | | | | | | | | | |
| | | | | | | | | | | | | | | | | | | | | | | | | | | | | | | | | |
| | | |
| | | |
| | | 2006 - A | | | 11.75 | | | | 0.60 | | | | 0.69 | | | | 1.29 | | | | (0.65 | ) | | | (0.41 | ) | | | (1.06 | ) | | |
| | | 2006 - C (commenced September 26, 2006) | | | 11.78 | | | | 0.01 | | | | 0.22 | | | | 0.23 | | | | (0.04 | ) | | | — | | | | (0.04 | ) | | |
| | | 2006 - Institutional | | | 11.76 | | | | 0.64 | | | | 0.69 | | | | 1.33 | | | | (0.69 | ) | | | (0.41 | ) | | | (1.10 | ) | | |
| | | | | | | | | | | | | | | | | | | | | | | | | | | | | | | | | |
| | | | | | | | | | | | | | | | | | | | | | | | | | | | | | | | | |
| | | |
| | | |
| | | 2005 - A | | | 11.18 | | | | 0.74 | | | | 1.00 | | | | 1.74 | | | | (0.64 | ) | | | (0.53 | ) | | | (1.17 | ) | | |
| | | 2005 - Institutional | | | 11.19 | | | | 0.77 | | | | 1.02 | | | | 1.79 | | | | (0.69 | ) | | | (0.53 | ) | | | (1.22 | ) | | |
| | | | | | | | | | | | | | | | | | | | | | | | | | | | | | | | | |
| | | | | | | | | | | | | | | | | | | | | | | | | | | | | | | | | |
| | | |
| | | |
| | | 2004 - A | | | 10.22 | | | | 0.59 | | | | 0.97 | | | | 1.56 | | | | (0.57 | ) | | | (0.03 | ) | | | (0.60 | ) | | |
| | | 2004 - Institutional | | | 10.23 | | | | 0.62 | | | | 0.98 | | | | 1.60 | | | | (0.61 | ) | | | (0.03 | ) | | | (0.64 | ) | | |
| | | | | | | | | | | | | | | | | | | | | | | | | | | | | | | | | |
| | | | | | | | | | | | | | | | | | | | | | | | | | | | | | | | | |
| | | |
| | | |
| | | 2003 - A (commenced August 29, 2003) | | | 10.00 | | | | 0.08 | | | | 0.26 | | | | 0.34 | | | | (0.12 | ) | | | — | | | | (0.12 | ) | | |
| | | 2003 - Institutional (commenced August 29, 2003) | | | 10.00 | | | | 0.11 | | | | 0.24 | | | | 0.35 | | | | (0.12 | ) | | | — | | | | (0.12 | ) | | |
| | | | | | | | | | | | | | | | | | | | | | | | | | | | | | | | | |
| | | | | | | | | | | | | | | | | | | | | | | | | | | | | | | | | |
| | | |
| | | |
| |
| * | The Fund changed its fiscal year end from October 31 to March 31. |
| (a) | Calculated based on the average shares outstanding methodology. |
| (b) | Assumes investment at the net asset value at the beginning of the period, reinvestment of all dividends and distributions, a complete redemption of the investment at the net asset value at the end of the period and no sales or redemption charges. Total return would be reduced if a sales or redemption charge were taken into account. Total returns for periods less than one full year are not annualized. Returns do not reflect the deduction of taxes that a shareholder would pay on Fund distributions or the redemption of Fund shares. |
| (c) | Annualized. |
The accompanying notes are an integral part of these financial statements.
GOLDMAN SACHS EMERGING MARKETS DEBT FUND
| | | | | | | | | | | | | | | | | | | | | | | | | | | | | | | | | | | |
| | | | | | | | | | | | | | | | | | Ratios assuming no
| | | | | | |
| | | | | | | | | | | | | | | | | | expense reductions | | | | | | |
| | | | | | | | | | | | | | | Ratio of
| | | | | | Ratio of
| | | | | | |
| | | | | | | | | Net assets,
| | | Ratio of
| | | net investment
| | | Ratio of
| | | net investment
| | | | | | |
| | | Net asset
| | | | | | end of
| | | net expenses
| | | income
| | | total expenses
| | | income
| | | Portfolio
| | | |
| | | value, end
| | | Total
| | | period
| | | to average
| | | to average
| | | to average
| | | to average
| | | turnover
| | | |
| | | of period | | | return(b) | | | (in 000s) | | | net assets | | | net assets | | | net assets | | | net assets | | | rate | | | |
| |
| | | | | | | | | | | | | | | | | | | | | | | | | | | | | | | | | | | |
| |
| |
| | | | | | | | | | | | | | | | | | | | | | | | | | | | | | | | | | | |
| | | | | | | | | | | | | | | | | | | | | | | | | | | | | | | | | | | |
| | | $ | 10.45 | | | | (7.55 | )% | | $ | 65,904 | | | | 1.22 | %(c) | | | 5.96 | %(c) | | | 1.38 | %(c) | | | 5.80 | %(c) | | | 72 | % | | |
| | | | 10.42 | | | | (7.92 | ) | | | 1,978 | | | | 1.97 | (c) | | | 5.20 | (c) | | | 2.13 | (c) | | | 5.04 | (c) | | | 72 | | | |
| | | | 10.45 | | | | (7.47 | ) | | | 134,135 | | | | 0.88 | (c) | | | 6.33 | (c) | | | 1.04 | (c) | | | 6.17 | (c) | | | 72 | | | |
| | | | | | | | | | | | | | | | | | | | | | | | | | | | | | | | | | | |
| | | | | | | | | | | | | | | | | | | | | | | | | | | | | | | | | | | |
| |
| | | | | | | | | | | | | | | | | | | | | | | | | | | | | | | | | | | |
| | | | | | | | | | | | | | | | | | | | | | | | | | | | | | | | | | | |
| | | | 11.63 | | | | (0.51 | ) | | | 87,818 | | | | 1.21 | (c) | | | 6.03 | (c) | | | 1.36 | (c) | | | 5.88 | (c) | | | 41 | | | |
| | | | 11.60 | | | | (0.82 | ) | | | 1,890 | | | | 1.96 | (c) | | | 5.20 | (c) | | | 2.11 | (c) | | | 5.05 | (c) | | | 41 | | | |
| | | | 11.63 | | | | (0.37 | ) | | | 145,067 | | | | 0.87 | (c) | | | 6.51 | (c) | | | 1.02 | (c) | | | 6.36 | (c) | | | 41 | | | |
| | | | | | | | | | | | | | | | | | | | | | | | | | | | | | | | | | | |
| | | | | | | | | | | | | | | | | | | | | | | | | | | | | | | | | | | |
| |
| | | | | | | | | | | | | | | | | | | | | | | | | | | | | | | | | | | |
| | | | | | | | | | | | | | | | | | | | | | | | | | | | | | | | | | | |
| | | | 12.16 | | | | 8.86 | | | | 84,661 | | | | 1.23 | | | | 5.23 | | | | 1.38 | | | | 5.08 | | | | 81 | | | |
| | | | 12.14 | | | | 7.80 | | | | 995 | | | | 1.98 | | | | 4.64 | | | | 2.13 | | | | 4.49 | | | | 81 | | | |
| | | | 12.17 | | | | 9.25 | | | | 188,311 | | | | 0.87 | | | | 5.68 | | | | 1.02 | | | | 5.53 | | | | 81 | | | |
| | | | | | | | | | | | | | | | | | | | | | | | | | | | | | | | | | | |
| | | | | | | | | | | | | | | | | | | | | | | | | | | | | | | | | | | |
| |
| |
| | | | 11.98 | | | | 11.63 | | | | 69,302 | | | | 1.23 | | | | 5.17 | | | | 1.53 | | | | 4.87 | | | | 167 | | | |
| | | | 11.97 | | | | 1.98 | | | | 1 | | | | 1.71 | (c) | | | 1.36 | (c) | | | 1.75 | (c) | | | 1.32 | (c) | | | 167 | | | |
| | | | 11.99 | | | | 11.93 | | | | 85,073 | | | | 0.86 | | | | 5.51 | | | | 1.16 | | | | 5.21 | | | | 167 | | | |
| | | | | | | | | | | | | | | | | | | | | | | | | | | | | | | | | | | |
| | | | | | | | | | | | | | | | | | | | | | | | | | | | | | | | | | | |
| |
| |
| | | | 11.75 | | | | 16.48 | | | | 34,327 | | | | 1.26 | | | | 6.13 | | | | 1.82 | | | | 5.57 | | | | 207 | | | |
| | | | 11.76 | | | | 17.01 | | | | 40,962 | | | | 0.88 | | | | 6.58 | | | | 1.52 | | | | 5.94 | | | | 207 | | | |
| | | | | | | | | | | | | | | | | | | | | | | | | | | | | | | | | | | |
| | | | | | | | | | | | | | | | | | | | | | | | | | | | | | | | | | | |
| |
| |
| | | | 11.18 | | | | 15.78 | | | | 5,411 | | | | 1.28 | | | | 5.43 | | | | 3.09 | | | | 3.62 | | | | 273 | | | |
| | | | 11.19 | | | | 16.22 | | | | 20,387 | | | | 0.88 | | | | 5.90 | | | | 2.57 | | | | 4.21 | | | | 273 | | | |
| | | | | | | | | | | | | | | | | | | | | | | | | | | | | | | | | | | |
| | | | | | | | | | | | | | | | | | | | | | | | | | | | | | | | | | | |
| |
| |
| | | | 10.22 | | | | 3.36 | | | | 1,088 | | | | 1.28 | (c) | | | 5.35 | (c) | | | 5.53 | (c) | | | 1.10 | (c) | | | 49 | | | |
| | | | 10.23 | | | | 3.52 | | | | 11,688 | | | | 0.88 | (c) | | | 5.96 | (c) | | | 4.88 | (c) | | | 1.96 | (c) | | | 49 | | | |
| | | | | | | | | | | | | | | | | | | | | | | | | | | | | | | | | | | |
| | | | | | | | | | | | | | | | | | | | | | | | | | | | | | | | | | | |
| |
| |
The accompanying notes are an integral part of these financial statements.
GOLDMAN SACHS HIGH YIELD FUND
Financial Highlights
Selected Data for a Share Outstanding Throughout Each Period
| | | | | | | | | | | | | | | | | | | | | | | | | |
| | | | | | | | Income (loss) from
| | | Distributions
| | | |
| | | | | Net asset
| | | investment operations | | | to shareholders
| | | |
| | | | | value,
| | | Net
| | | Net realized
| | | Total from
| | | from net
| | | |
| | | | | beginning
| | | investment
| | | and unrealized
| | | investment
| | | investment
| | | |
| | | Year - Share Class | | of period | | | income(a) | | | gain (loss) | | | operations | | | income | | | |
| |
| FOR THE SIX MONTHS ENDED SEPTEMBER 30, (UNAUDITED) |
| | | | | | | | | | | | | | | | | | | | | | | | | |
| | | | | | | | | | | | | | | | | | | | | | | | | |
| | | 2008 - A | | $ | 7.12 | | | $ | 0.29 | | | $ | (0.73 | ) | | $ | (0.44 | ) | | $ | (0.29 | ) | | |
| | | 2008 - B | | | 7.13 | | | | 0.27 | | | | (0.74 | ) | | | (0.47 | ) | | | (0.26 | ) | | |
| | | 2008 - C | | | 7.12 | | | | 0.27 | | | | (0.74 | ) | | | (0.47 | ) | | | (0.26 | ) | | |
| | | 2008 - Institutional | | | 7.13 | | | | 0.31 | | | | (0.74 | ) | | | (0.43 | ) | | | (0.30 | ) | | |
| | | 2008 - Service | | | 7.12 | | | | 0.29 | | | | (0.74 | ) | | | (0.45 | ) | | | (0.28 | ) | | |
| | | 2008 - IR | | | 7.12 | | | | 0.30 | | | | (0.74 | ) | | | (0.44 | ) | | | (0.29 | ) | | |
| | | 2008 - R | | | 7.12 | | | | 0.28 | | | | (0.73 | ) | | | (0.45 | ) | | | (0.28 | ) | | |
| | | | | | | | | | | | | | | | | | | | | | | | | |
| | | | | | | | | | | | | | | | | | | | | | | | | |
| FOR THE PERIOD NOVEMBER 1, 2007 TO MARCH 31, 2008* |
| | | | | | | | | | | | | | | | | | | | | | | | | |
| | | | | | | | | | | | | | | | | | | | | | | | | |
| | | 2008 - A | | | 7.93 | | | | 0.24 | | | | (0.78 | ) | | | (0.54 | ) | | | (0.27 | ) | | |
| | | 2008 - B | | | 7.94 | | | | 0.22 | | | | (0.79 | ) | | | (0.57 | ) | | | (0.24 | ) | | |
| | | 2008 - C | | | 7.93 | | | | 0.22 | | | | (0.79 | ) | | | (0.57 | ) | | | (0.24 | ) | | |
| | | 2008 - Institutional | | | 7.94 | | | | 0.25 | | | | (0.78 | ) | | | (0.53 | ) | | | (0.28 | ) | | |
| | | 2008 - Service | | | 7.92 | | | | 0.24 | | | | (0.78 | ) | | | (0.54 | ) | | | (0.26 | ) | | |
| | | 2008 - IR (commenced November 30, 2007) | | | 7.68 | | | | 0.20 | | | | (0.54 | ) | | | (0.34 | ) | | | (0.22 | ) | | |
| | | 2008 - R (commenced November 30, 2007) | | | 7.68 | | | | 0.19 | | | | (0.54 | ) | | | (0.35 | ) | | | (0.21 | ) | | |
| | | | | | | | | | | | | | | | | | | | | | | | | |
| | | | | | | | | | | | | | | | | | | | | | | | | |
| FOR THE YEARS ENDED OCTOBER 31, |
| | | | | | | | | | | | | | | | | | | | | | | | | |
| | | | | | | | | | | | | | | | | | | | | | | | | |
| | | 2007 - A | | | 8.04 | | | | 0.60 | | | | (0.10 | ) | | | 0.50 | | | | (0.61 | ) | | |
| | | 2007 - B | | | 8.05 | | | | 0.54 | | | | (0.10 | ) | | | 0.44 | | | | (0.55 | ) | | |
| | | 2007 - C | | | 8.04 | | | | 0.54 | | | | (0.10 | ) | | | 0.44 | | | | (0.55 | ) | | |
| | | 2007 - Institutional | | | 8.05 | | | | 0.63 | | | | (0.10 | ) | | | 0.53 | | | | (0.64 | ) | | |
| | | 2007 - Service | | | 8.03 | | | | 0.59 | | | | (0.10 | ) | | | 0.49 | | | | (0.60 | ) | | |
| | | | | | | | | | | | | | | | | | | | | | | | | |
| | | | | | | | | | | | | | | | | | | | | | | | | |
| | | |
| | | |
| | | 2006 - A | | | 7.81 | | | | 0.58 | | | | 0.23 | | | | 0.81 | | | | (0.58 | ) | | |
| | | 2006 - B | | | 7.82 | | | | 0.53 | | | | 0.22 | | | | 0.75 | | | | (0.52 | ) | | |
| | | 2006 - C | | | 7.81 | | | | 0.53 | | | | 0.22 | | | | 0.75 | | | | (0.52 | ) | | |
| | | 2006 - Institutional | | | 7.82 | | | | 0.61 | | | | 0.23 | | | | 0.84 | | | | (0.61 | ) | | |
| | | 2006 - Service | | | 7.80 | | | | 0.57 | | | | 0.23 | | | | 0.80 | | | | (0.57 | ) | | |
| | | | | | | | | | | | | | | | | | | | | | | | | |
| | | | | | | | | | | | | | | | | | | | | | | | | |
| | | |
| | | |
| | | 2005 - A | | | 8.08 | | | | 0.62 | | | | (0.22 | ) | | | 0.40 | | | | (0.67 | ) | | |
| | | 2005 - B | | | 8.09 | | | | 0.56 | | | | (0.22 | ) | | | 0.34 | | | | (0.61 | ) | | |
| | | 2005 - C | | | 8.08 | | | | 0.56 | | | | (0.22 | ) | | | 0.34 | | | | (0.61 | ) | | |
| | | 2005 - Institutional | | | 8.09 | | | | 0.65 | | | | (0.21 | ) | | | 0.44 | | | | (0.71 | ) | | |
| | | 2005 - Service | | | 8.09 | | | | 0.62 | | | | (0.24 | ) | | | 0.38 | | | | (0.67 | ) | | |
| | | | | | | | | | | | | | | | | | | | | | | | | |
| | | | | | | | | | | | | | | | | | | | | | | | | |
| | | |
| | | |
| | | 2004 - A | | | 7.79 | | | | 0.65 | | | | 0.32 | | | | 0.97 | | | | (0.68 | ) | | |
| | | 2004 - B | | | 7.80 | | | | 0.60 | | | | 0.31 | | | | 0.91 | | | | (0.62 | ) | | |
| | | 2004 - C | | | 7.79 | | | | 0.60 | | | | 0.31 | | | | 0.91 | | | | (0.62 | ) | | |
| | | 2004 - Institutional | | | 7.81 | | | | 0.69 | | | | 0.30 | | | | 0.99 | | | | (0.71 | ) | | |
| | | 2004 - Service | | | 7.80 | | | | 0.65 | | | | 0.31 | | | | 0.96 | | | | (0.67 | ) | | |
| | | | | | | | | | | | | | | | | | | | | | | | | |
| | | | | | | | | | | | | | | | | | | | | | | | | |
| | | |
| | | |
| | | 2003 - A | | | 6.38 | | | | 0.65 | | | | 1.40 | | | | 2.05 | | | | (0.64 | ) | | |
| | | 2003 - B | | | 6.39 | | | | 0.60 | | | | 1.39 | | | | 1.99 | | | | (0.58 | ) | | |
| | | 2003 - C | | | 6.38 | | | | 0.59 | | | | 1.40 | | | | 1.99 | | | | (0.58 | ) | | |
| | | 2003 - Institutional | | | 6.39 | | | | 0.68 | | | | 1.41 | | | | 2.09 | | | | (0.67 | ) | | |
| | | 2003 - Service | | | 6.39 | | | | 0.64 | | | | 1.40 | | | | 2.04 | | | | (0.63 | ) | | |
| | | | | | | | | | | | | | | | | | | | | | | | | |
| | | | | | | | | | | | | | | | | | | | | | | | | |
| | | |
| | | |
| | | | | | | | | | | | | | | | | | | | | | | | | |
| | | | | | | | | | | | | | | | | | | | | | | | | |
| |
| * | The Fund changed its fiscal year end from October 31 to March 31. |
| |
| (a) | Calculated based on the average shares outstanding methodology. |
| |
| (b) | Assumes investment at the net asset value at the beginning of the period, reinvestment of all dividends and distributions, a complete redemption of the investment at the net asset value at the end of the period and no sales or redemption charges. Total return would be reduced if a sales or redemption charge were taken into account. Total returns for periods less than one full year are not annualized. Returns do not reflect the deduction of taxes that a shareholder would pay on Fund distributions or the redemption of Fund shares. |
The accompanying notes are an integral part of these financial statements.
GOLDMAN SACHS HIGH YIELD FUND
| | | | | | | | | | | | | | | | | | | | | | | | | | | | | | | | | | | |
| | | | | | | | | | | | | | | | | | Ratios assuming no
| | | | | | |
| | | | | | | | | | | | | | | | | | expense reductions | | | | | | |
| | | | | | | | | | | | | | | Ratio of
| | | | | | Ratio of
| | | | | | |
| | | | | | | | | Net assets,
| | | Ratio of
| | | net investment
| | | Ratio of
| | | net investment
| | | | | | |
| | | Net asset
| | | | | | end of
| | | net expenses
| | | income
| | | total expenses
| | | income
| | | Portfolio
| | | |
| | | value, end
| | | Total
| | | period
| | | to average
| | | to average
| | | to average
| | | to average
| | | turnover
| | | |
| | | of period | | | return(b) | | | (in 000s) | | | net assets | | | net assets | | | net assets | | | net assets | | | rate | | | |
| |
| |
| | | | | | | | | | | | | | | | | | | | | | | | | | | | | | | | | | | |
| | | | | | | | | | | | | | | | | | | | | | | | | | | | | | | | | | | |
| | | $ | 6.39 | | | | (6.52 | )% | | $ | 1,754,283 | | | | 1.07 | %(c) | | | 8.17 | %(c) | | | 1.07 | %(c) | | | 8.17 | %(c) | | | 7 | % | | |
| | | | 6.40 | | | | (6.88 | ) | | | 74,993 | | | | 1.82 | (c) | | | 7.42 | (c) | | | 1.82 | (c) | | | 7.42 | (c) | | | 7 | | | |
| | | | 6.39 | | | | (6.88 | ) | | | 87,750 | | | | 1.82 | (c) | | | 7.43 | (c) | | | 1.82 | (c) | | | 7.43 | (c) | | | 7 | | | |
| | | | 6.40 | | | | (6.50 | ) | | | 1,807,389 | | | | 0.73 | (c) | | | 8.53 | (c) | | | 0.73 | (c) | | | 8.53 | (c) | | | 7 | | | |
| | | | 6.39 | | | | (6.61 | ) | | | 13,007 | | | | 1.23 | (c) | | | 8.07 | (c) | | | 1.23 | (c) | | | 8.07 | (c) | | | 7 | | | |
| | | | 6.39 | | | | (6.55 | ) | | | 9 | | | | 0.82 | (c) | | | 8.33 | (c) | | | 0.82 | (c) | | | 8.33 | (c) | | | 7 | | | |
| | | | 6.39 | | | | (6.64 | ) | | | 9 | | | | 1.32 | (c) | | | 7.83 | (c) | | | 1.32 | (c) | | | 7.83 | (c) | | | 7 | | | |
| | | | | | | | | | | | | | | | | | | | | | | | | | | | | | | | | | | |
| | | | | | | | | | | | | | | | | | | | | | | | | | | | | | | | | | | |
| |
| | | | | | | | | | | | | | | | | | | | | | | | | | | | | | | | | | | |
| | | | | | | | | | | | | | | | | | | | | | | | | | | | | | | | | | | |
| | | | 7.12 | | | | (6.82 | ) | | | 1,650,027 | | | | 1.07 | (c) | | | 7.87 | (c) | | | 1.09 | (c) | | | 7.85 | (c) | | | 11 | | | |
| | | | 7.13 | | | | (7.23 | ) | | | 92,953 | | | | 1.82 | (c) | | | 7.12 | (c) | | | 1.84 | (c) | | | 7.10 | (c) | | | 11 | | | |
| | | | 7.12 | | | | (7.11 | ) | | | 101,138 | | | | 1.82 | (c) | | | 7.12 | (c) | | | 1.84 | (c) | | | 7.10 | (c) | | | 11 | | | |
| | | | 7.13 | | | | (6.68 | ) | | | 1,628,668 | | | | 0.73 | (c) | | | 8.22 | (c) | | | 0.75 | (c) | | | 8.20 | (c) | | | 11 | | | |
| | | | 7.12 | | | | (6.89 | ) | | | 10,573 | | | | 1.23 | (c) | | | 7.72 | (c) | | | 1.25 | (c) | | | 7.70 | (c) | | | 11 | | | |
| | | | 7.12 | | | | (4.35 | ) | | | 10 | | | | 0.82 | (c) | | | 8.20 | (c) | | | 0.84 | (c) | | | 8.18 | (c) | | | 11 | | | |
| | | | 7.12 | | | | (4.51 | ) | | | 9 | | | | 1.32 | (c) | | | 7.73 | (c) | | | 1.34 | (c) | | | 7.71 | (c) | | | 11 | | | |
| | | | | | | | | | | | | | | | | | | | | | | | | | | | | | | | | | | |
| | | | | | | | | | | | | | | | | | | | | | | | | | | | | | | | | | | |
| |
| | | | | | | | | | | | | | | | | | | | | | | | | | | | | | | | | | | |
| | | | | | | | | | | | | | | | | | | | | | | | | | | | | | | | | | | |
| | | | 7.93 | | | | 6.41 | | | | 1,777,150 | | | | 1.09 | | | | 7.46 | | | | 1.11 | | | | 7.44 | | | | 50 | | | |
| | | | 7.94 | | | | 5.61 | | | | 115,817 | | | | 1.84 | | | | 6.72 | | | | 1.86 | | | | 6.70 | | | | 50 | | | |
| | | | 7.93 | | | | 5.61 | | | | 119,073 | | | | 1.84 | | | | 6.71 | | | | 1.86 | | | | 6.69 | | | | 50 | | | |
| | | | 7.94 | | | | 6.79 | | | | 1,646,138 | | | | 0.73 | | | | 7.82 | | | | 0.75 | | | | 7.80 | | | | 50 | | | |
| | | | 7.92 | | | | 6.28 | | | | 8,399 | | | | 1.24 | | | | 7.34 | | | | 1.26 | | | | 7.32 | | | | 50 | | | |
| | | | | | | | | | | | | | | | | | | | | | | | | | | | | | | | | | | |
| | | | | | | | | | | | | | | | | | | | | | | | | | | | | | | | | | | |
| |
| |
| | | | 8.04 | | | | 10.76 | | | | 1,395,265 | | | | 1.12 | | | | 7.38 | | | | 1.14 | | | | 7.36 | | | | 41 | | | |
| | | | 8.05 | | | | 9.93 | | | | 96,743 | | | | 1.87 | | | | 6.64 | | | | 1.89 | | | | 6.62 | | | | 41 | | | |
| | | | 8.04 | | | | 9.94 | | | | 90,528 | | | | 1.87 | | | | 6.64 | | | | 1.89 | | | | 6.62 | | | | 41 | | | |
| | | | 8.05 | | | | 11.16 | | | | 1,296,429 | | | | 0.75 | | | | 7.76 | | | | 0.77 | | | | 7.74 | | | | 41 | | | |
| | | | 8.03 | | | | 10.63 | | | | 2,980 | | | | 1.25 | | | | 7.26 | | | | 1.27 | | | | 7.24 | | | | 41 | | | |
| | | | | | | | | | | | | | | | | | | | | | | | | | | | | | | | | | | |
| | | | | | | | | | | | | | | | | | | | | | | | | | | | | | | | | | | |
| |
| |
| | | | 7.81 | | | | 5.10 | | | | 1,006,734 | | | | 1.15 | | | | 7.74 | | | | 1.17 | | | | 7.72 | | | | 52 | | | |
| | | | 7.82 | | | | 4.31 | | | | 104,637 | | | | 1.90 | | | | 6.98 | | | | 1.92 | | | | 6.96 | | | | 52 | | | |
| | | | 7.81 | | | | 4.32 | | | | 72,590 | | | | 1.90 | | | | 6.95 | | | | 1.92 | | | | 6.93 | | | | 52 | | | |
| | | | 7.82 | | | | 5.50 | | | | 825,508 | | | | 0.76 | | | | 8.11 | | | | 0.79 | | | | 8.08 | | | | 52 | | | |
| | | | 7.80 | | | | 4.72 | | | | 1,597 | | | | 1.26 | | | | 7.62 | | | | 1.29 | | | | 7.59 | | | | 52 | | | |
| | | | | | | | | | | | | | | | | | | | | | | | | | | | | | | | | | | |
| | | | | | | | | | | | | | | | | | | | | | | | | | | | | | | | | | | |
| |
| |
| | | | 8.08 | | | | 12.94 | | | | 1,109,364 | | | | 1.16 | | | | 8.31 | | | | 1.18 | | | | 8.29 | | | | 47 | | | |
| | | | 8.09 | | | | 12.09 | | | | 105,106 | | | | 1.91 | | | | 7.54 | | | | 1.93 | | | | 7.52 | | | | 47 | | | |
| | | | 8.08 | | | | 12.10 | | | | 56,174 | | | | 1.91 | | | | 7.53 | | | | 1.93 | | | | 7.51 | | | | 47 | | | |
| | | | 8.09 | | | | 13.23 | | | | 832,175 | | | | 0.76 | | | | 8.73 | | | | 0.78 | | | | 8.71 | | | | 47 | | | |
| | | | 8.09 | | | | 12.81 | | | | 1,160 | | | | 1.26 | | | | 8.18 | | | | 1.28 | | | | 8.16 | | | | 47 | | | |
| | | | | | | | | | | | | | | | | | | | | | | | | | | | | | | | | | | |
| | | | | | | | | | | | | | | | | | | | | | | | | | | | | | | | | | | |
| |
| |
| | | | 7.79 | | | | 33.34 | | | | 1,821,032 | | | | 1.17 | | | | 8.97 | | | | 1.19 | | | | 8.95 | | | | 54 | | | |
| | | | 7.80 | | | | 32.31 | | | | 97,894 | | | | 1.92 | | | | 8.25 | | | | 1.94 | | | | 8.23 | | | | 54 | | | |
| | | | 7.79 | | | | 32.36 | | | | 46,812 | | | | 1.92 | | | | 8.21 | | | | 1.94 | | | | 8.19 | | | | 54 | | | |
| | | | 7.81 | | | | 33.98 | | | | 1,119,417 | | | | 0.77 | | | | 9.42 | | | | 0.79 | | | | 9.40 | | | | 54 | | | |
| | | | 7.80 | | | | 33.16 | | | | 958 | | | | 1.27 | | | | 8.86 | | | | 1.29 | | | | 8.84 | | | | 54 | | | |
| | | | | | | | | | | | | | | | | | | | | | | | | | | | | | | | | | | |
| | | | | | | | | | | | | | | | | | | | | | | | | | | | | | | | | | | |
| |
| |
The accompanying notes are an integral part of these financial statements.
GOLDMAN SACHS INVESTMENT GRADE CREDIT FUND
Financial Highlights
Selected Data for a Share Outstanding Throughout Each Period
| | | | | | | | | | | | | | | | | | | | | | | | | | | | | | | | | |
| | | | | | | | Income (loss) from
| | | Distributions
| | | |
| | | | | | | | investment operations | | | to shareholders | | | |
| | | | | Net asset
| | | | | | | | | | | | | | | | | | | | | |
| | | | | value,
| | | Net
| | | Net realized
| | | Total from
| | | From net
| | | From net
| | | | | | |
| | | | | beginning
| | | investment
| | | and unrealized
| | | investment
| | | investment
| | | realized
| | | Total
| | | |
| | | Year - Share Class | | of period | | | income(a) | | | gain (loss) | | | operations | | | income | | | gains | | | distributions | | | |
| |
| | | | | | | | | | | | | | | | | | | | | | | | | | | | | | | | | |
| |
| FOR THE SIX MONTHS ENDED SEPTEMBER 30, (UNAUDITED) |
| | | | | | | | | | | | | | | | | | | | | | | | | | | | | | | | | |
| | | | | | | | | | | | | | | | | | | | | | | | | | | | | | | | | |
| | | 2008 - A | | | $9.64 | | | $ | 0.26 | | | $ | (1.06 | ) | | $ | (0.80 | ) | | $ | (0.27 | ) | | $ | — | | | $ | (0.27 | ) | | |
| | | 2008 - Institutional | | | 9.66 | | | | 0.29 | | | | (1.08 | ) | | | (0.79 | ) | | | (0.29 | ) | | | — | | | | (0.29 | ) | | |
| | | 2008 - Separate Account Institutional | | | 9.65 | | | | 0.29 | | | | (1.07 | ) | | | (0.78 | ) | | | (0.29 | ) | | | — | | | | (0.29 | ) | | |
| | | | | | | | | | | | | | | | | | | | | | | | | | | | | | | | | |
| | | | | | | | | | | | | | | | | | | | | | | | | | | | | | | | | |
| FOR THE PERIOD NOVEMBER 1, 2007 TO MARCH 31, 2008* |
| | | | | | | | | | | | | | | | | | | | | | | | | | | | | | | | | |
| | | | | | | | | | | | | | | | | | | | | | | | | | | | | | | | | |
| | | 2008 - A | | | 9.90 | | | | 0.22 | | | | (0.27 | ) | | | (0.05 | ) | | | (0.21 | ) | | | — | | | | (0.21 | ) | | |
| | | 2008 - Institutional | | | 9.92 | | | | 0.23 | | | | (0.27 | ) | | | (0.04 | ) | | | (0.22 | ) | | | — | | | | (0.22 | ) | | |
| | | 2008 - Separate Account Institutional | | | 9.91 | | | | 0.23 | | | | (0.26 | ) | | | (0.03 | ) | | | (0.23 | ) | | | — | | | | (0.23 | ) | | |
| | | | | | | | | | | | | | | | | | | | | | | | | | | | | | | | | |
| | | | | | | | | | | | | | | | | | | | | | | | | | | | | | | | | |
| FOR THE YEARS ENDED OCTOBER 31, |
| | | | | | | | | | | | | | | | | | | | | | | | | | | | | | | | | |
| | | | | | | | | | | | | | | | | | | | | | | | | | | | | | | | | |
| | | 2007 - A | | | 9.95 | | | | 0.51 | | | | (0.08 | ) | | | 0.43 | | | | (0.48 | ) | | | — | | | | (0.48 | ) | | |
| | | 2007 - Institutional | | | 9.97 | | | | 0.55 | | | | (0.08 | ) | | | 0.47 | | | | (0.52 | ) | | | — | | | | (0.52 | ) | | |
| | | 2007 - Separate Account Institutional | | | 9.96 | | | | 0.56 | | | | (0.08 | ) | | | 0.48 | | | | (0.53 | ) | | | — | | | | (0.53 | ) | | |
| | | | | | | | | | | | | | | | | | | | | | | | | | | | | | | | | |
| | | | | | | | | | | | | | | | | | | | | | | | | | | | | | | | | |
| | | |
| | | |
| | | 2006 - A | | | 9.93 | | | | 0.47 | | | | — | | | | 0.47 | | | | (0.45 | ) | | | — | | | | (0.45 | ) | | |
| | | 2006 - Institutional | | | 9.95 | | | | 0.51 | | | | — | | | | 0.51 | | | | (0.49 | ) | | | — | | | | (0.49 | ) | | |
| | | 2006 - Separate Account Institutional | | | 9.94 | | | | 0.52 | | | | (0.01 | ) | | | 0.51 | | | | (0.49 | ) | | | — | | | | (0.49 | ) | | |
| | | | | | | | | | | | | | | | | | | | | | | | | | | | | | | | | |
| | | | | | | | | | | | | | | | | | | | | | | | | | | | | | | | | |
| | | |
| | | |
| | | 2005 - A | | | 10.31 | | | | 0.40 | | | | (0.35 | ) | | | 0.05 | | | | (0.39 | ) | | | (0.04 | ) | | | (0.43 | ) | | |
| | | 2005 - Institutional | | | 10.32 | | | | 0.52 | | | | (0.42 | ) | | | 0.10 | | | | (0.43 | ) | | | (0.04 | ) | | | (0.47 | ) | | |
| | | 2005 - Separate Account Institutional | | | 10.31 | | | | 0.46 | | | | (0.35 | ) | | | 0.11 | | | | (0.44 | ) | | | (0.04 | ) | | | (0.48 | ) | | |
| | | | | | | | | | | | | | | | | | | | | | | | | | | | | | | | | |
| | | | | | | | | | | | | | | | | | | | | | | | | | | | | | | | | |
| FOR THE PERIOD ENDED OCTOBER 31, |
| | | | | | | | | | | | | | | | | | | | | | | | | | | | | | | | | |
| | | | | | | | | | | | | | | | | | | | | | | | | | | | | | | | | |
| | | 2004 - A (commenced November 3, 2003) | | | 10.00 | | | | 0.38 | | | | 0.31 | | | | 0.69 | | | | (0.38 | ) | | | — | | | | (0.38 | ) | | |
| | | 2004 - Institutional (commenced November 3, 2003) | | | 10.00 | | | | 0.44 | | | | 0.30 | | | | 0.74 | | | | (0.42 | ) | | | — | | | | (0.42 | ) | | |
| | | 2004 - Separate Account Institutional (commenced
November 3, 2003) | | | 10.00 | | | | 0.43 | | | | 0.31 | | | | 0.74 | | | | (0.43 | ) | | | — | | | | (0.43 | ) | | |
| | | | | | | | | | | | | | | | | | | | | | | | | | | | | | | | | |
| | | | | | | | | | | | | | | | | | | | | | | | | | | | | | | | | |
| | | |
| | | |
| | | | | | | | | | | | | | | | | | | | | | | | | | | | | | | | | |
| |
| * | The Fund changed its fiscal year end from October 31 to March 31. |
| |
| (a) | Calculated based on the average shares outstanding methodology. |
| |
| (b) | Assumes investment at the net asset value at the beginning of the period, reinvestment of all dividends and distributions, a complete redemption of the investment at the net asset value at the end of the period and no sales or redemption charges. Total return would be reduced if a sales or redemption charge were taken into account. Total returns for periods less than one full year are not annualized. Returns do not reflect the deduction of taxes that a shareholder would pay on Fund distributions or the redemption of Fund shares. |
The accompanying notes are an integral part of these financial statements.
GOLDMAN SACHS INVESTMENT GRADE CREDIT FUND
| | | | | | | | | | | | | | | | | | | | | | | | | | | | | | | | | | | |
| | | | | | | | | | | | | | | | | | Ratios assuming no
| | | | | | |
| | | | | | | | | | | | | | | | | | expense reductions | | | | | | |
| | | | | | | | | | | | | | | Ratio of
| | | | | | Ratio of
| | | | | | |
| | | | | | | | | Net assets,
| | | Ratio of
| | | net investment
| | | Ratio of
| | | net investment
| | | | | | |
| | | Net asset
| | | | | | end of
| | | net expenses
| | | income
| | | total expenses
| | | income
| | | Portfolio
| | | |
| | | value, end
| | | Total
| | | period
| | | to average
| | | to average
| | | to average
| | | to average
| | | turnover
| | | |
| | | of period | | | return(b) | | | (in 000s) | | | net assets | | | net assets | | | net assets | | | net assets | | | rate | | | |
| |
| | | | | | | | | | | | | | | | | | | | | | | | | | | | | | | | | | | |
| |
| |
| | | | | | | | | | | | | | | | | | | | | | | | | | | | | | | | | | | |
| | | | | | | | | | | | | | | | | | | | | | | | | | | | | | | | | | | |
| | | $ | 8.57 | | | | (8.47 | )% | | $ | 12,221 | | | | 0.76 | %(c) | | | 5.63 | %(c) | | | 0.96 | %(c) | | | 5.43 | %(c) | | | 34 | % | | |
| | | | 8.58 | | | | (8.39 | ) | | | 11,068 | | | | 0.40 | (c) | | | 6.07 | (c) | | | 0.62 | (c) | | | 5.85 | (c) | | | 34 | | | |
| | | | 8.58 | | | | (8.27 | ) | | | 213,719 | | | | 0.35 | (c) | | | 6.15 | (c) | | | 0.57 | (c) | | | 5.93 | (c) | | | 34 | | | |
| | | | | | | | | | | | | | | | | | | | | | | | | | | | | | | | | | | |
| | | | | | | | | | | | | | | | | | | | | | | | | | | | | | | | | | | |
| |
| | | | | | | | | | | | | | | | | | | | | | | | | | | | | | | | | | | |
| | | | | | | | | | | | | | | | | | | | | | | | | | | | | | | | | | | |
| | | | 9.64 | | | | (0.54 | ) | | | 9,455 | | | | 0.76 | (c) | | | 5.31 | (c) | | | 0.95 | (c) | | | 5.12 | (c) | | | 15 | | | |
| | | | 9.66 | | | | (0.39 | ) | | | 10,504 | | | | 0.40 | (c) | | | 5.67 | (c) | | | 0.61 | (c) | | | 5.46 | (c) | | | 15 | | | |
| | | | 9.65 | | | | (0.37 | ) | | | 226,207 | | | | 0.35 | (c) | | | 5.72 | (c) | | | 0.56 | (c) | | | 5.51 | (c) | | | 15 | | | |
| | | | | | | | | | | | | | | | | | | | | | | | | | | | | | | | | | | |
| | | | | | | | | | | | | | | | | | | | | | | | | | | | | | | | | | | |
| |
| | | | | | | | | | | | | | | | | | | | | | | | | | | | | | | | | | | |
| | | | | | | | | | | | | | | | | | | | | | | | | | | | | | | | | | | |
| | | | 9.90 | | | | 4.44 | | | | 8,615 | | | | 0.79 | | | | 5.17 | | | | 0.97 | | | | 4.99 | | | | 74 | | | |
| | | | 9.92 | | | | 4.83 | | | | 10,893 | | | | 0.40 | | | | 5.59 | | | | 0.60 | | | | 5.39 | | | | 74 | | | |
| | | | 9.91 | | | | 4.89 | | | | 239,358 | | | | 0.35 | | | | 5.61 | | | | 0.55 | | | | 5.41 | | | | 74 | | | |
| | | | | | | | | | | | | | | | | | | | | | | | | | | | | | | | | | | |
| | | | | | | | | | | | | | | | | | | | | | | | | | | | | | | | | | | |
| |
| |
| | | | 9.95 | | | | 4.84 | | | | 3,420 | | | | 0.79 | | | | 4.82 | | | | 1.04 | | | | 4.57 | | | | 74 | | | |
| | | | 9.97 | | | | 5.35 | | | | 3,317 | | | | 0.40 | | | | 5.21 | | | | 0.65 | | | | 4.96 | | | | 74 | | | |
| | | | 9.96 | | | | 5.30 | | | | 206,122 | | | | 0.35 | | | | 5.26 | | | | 0.60 | | | | 5.01 | | | | 74 | | | |
| | | | | | | | | | | | | | | | | | | | | | | | | | | | | | | | | | | |
| | | | | | | | | | | | | | | | | | | | | | | | | | | | | | | | | | | |
| |
| |
| | | | 9.93 | | | | 0.50 | | | | 3,622 | | | | 0.81 | | | | 3.88 | | | | 1.07 | | | | 3.62 | | | | 88 | | | |
| | | | 9.95 | | | | 0.89 | | | | 3,638 | | | | 0.40 | | | | 4.40 | | | | 0.66 | | | | 4.14 | | | | 88 | | | |
| | | | 9.94 | | | | 1.04 | | | | 192,196 | | | | 0.35 | | | | 4.34 | | | | 0.62 | | | | 4.07 | | | | 88 | | | |
| | | | | | | | | | | | | | | | | | | | | | | | | | | | | | | | | | | |
| | | | | | | | | | | | | | | | | | | | | | | | | | | | | | | | | | | |
| |
| | | | | | | | | | | | | | | | | | | | | | | | | | | | | | | | | | | |
| | | | | | | | | | | | | | | | | | | | | | | | | | | | | | | | | | | |
| | | | 10.31 | | | | 7.00 | | | | 2,179 | | | | 0.82 | (c) | | | 3.66 | (c) | | | 1.85 | (c) | | | 2.63 | (c) | | | 78 | | | |
| | | | 10.32 | | | | 7.57 | | | | 76 | | | | 0.40 | (c) | | | 4.28 | (c) | | | 1.45 | (c) | | | 3.23 | (c) | | | 78 | | | |
| | | | | | | | | | | | | | | | | | | | | | | | | | | | | | | | | | | |
| | | | 10.31 | | | | 7.52 | | | | 70,269 | | | | 0.35 | (c) | | | 4.26 | (c) | | | 1.40 | (c) | | | 3.21 | (c) | | | 78 | | | |
| | | | | | | | | | | | | | | | | | | | | | | | | | | | | | | | | | | |
| | | | | | | | | | | | | | | | | | | | | | | | | | | | | | | | | | | |
| |
| |
The accompanying notes are an integral part of these financial statements.
GOLDMAN SACHS LOCAL EMERGING MARKETS DEBT FUND
Financial Highlights
Selected Data for a Share Outstanding Throughout Each Period
| | | | | | | | | | | | | | | | | | | | | | | | | |
| | | | | | | | Income (loss) from
| | | | | | |
| | | | | | | | investment operations | | | | | | |
| | | | | | | | | | | | | | | | | Distributions to
| | | |
| | | | | Net asset
| | | | | | | | | | | | shareholders from
| | | |
| | | | | value,
| | | Net
| | | Net realized
| | | Total from
| | | net
| | | |
| | | | | beginning
| | | investment
| | | and unrealized
| | | investment
| | | investment
| | | |
| | | Year — Share Class | | of period | | | income(a) | | | loss | | | operations | | | income | | | |
| |
| FOR THE SIX MONTHS ENDED SEPTEMBER 30, (UNAUDITED) |
| | | | | | | | | | | | | | | | | | | | | | | | | |
| | | | | | | | | | | | | | | | | | | | | | | | | |
| | | 2008 - A | | | $9.85 | | | $ | 0.31 | | | $ | (1.02 | ) | | $ | (0.71 | ) | | $ | (0.29 | ) | | |
| | | 2008 - C | | | 9.85 | | | | 0.27 | | | | (1.00 | ) | | | (0.73 | ) | | | (0.26 | ) | | |
| | | 2008 - Institutional | | | 9.85 | | | | 0.32 | | | | (1.01 | ) | | | (0.69 | ) | | | (0.31 | ) | | |
| | | | | | | | | | | | | | | | | | | | | | | | | |
| FOR THE PERIOD ENDED MARCH 31, |
| | | | | | | | | | | | | | | | | | | | | | | | | |
| | | | | | | | | | | | | | | | | | | | | | | | | |
| | | 2008 - A (commenced February 15, 2008) | | | 10.00 | | | | 0.04 | | | | (0.14 | ) | | | (0.10 | ) | | | (0.05 | ) | | |
| | | 2008 - C (commenced February 15, 2008) | | | 10.00 | | | | 0.04 | | | | (0.14 | ) | | | (0.10 | ) | | | (0.05 | ) | | |
| | | 2008 - Institutional (commenced February 15, 2008) | | | 10.00 | | | | 0.06 | | | | (0.15 | ) | | | (0.09 | ) | | | (0.06 | ) | | |
| | | | | | | | | | | | | | | | | | | | | | | | | |
| | | | | | | | | | | | | | | | | | | | | | | | | |
| | | |
| | | |
| | | | | | | | | | | | | | | | | | | | | | | | | |
| |
| (a) | Calculated based on the average shares outstanding methodology. |
| |
| (b) | Assumes investment at the net asset value at the beginning of the period, reinvestment of all dividends and distributions, a complete redemption of the investment at the net asset value at the end of the period and no sales or redemption charges. Total return would be reduced if a sales or redemption charge were taken into account. Total returns for periods less than one full year are not annualized. Returns do not reflect the deduction of taxes that a shareholder would pay on Fund distributions or the redemption of Fund shares. |
The accompanying notes are an integral part of these financial statements.
GOLDMAN SACHS LOCAL EMERGING MARKETS DEBT FUND
| | | | | | | | | | | | | | | | | | | | | | | | | | | | | | | | | | | |
| | | | | | | | | | | | | | | | | | Ratios assuming no
| | | | | | |
| | | | | | | | | | | | | | | | | | expense reductions | | | | | | |
| | | | | | | | | | | | | | | Ratio of
| | | | | | Ratio of
| | | | | | |
| | | | | | | | | Net assets,
| | | Ratio of
| | | net investment
| | | Ratio of
| | | net investment
| | | | | | |
| | | Net asset
| | | | | | end of
| | | net expenses
| | | income
| | | total expenses
| | | income
| | | Portfolio
| | | |
| | | value, end
| | | Total
| | | period
| | | to average
| | | to average
| | | to average
| | | to average
| | | turnover
| | | |
| | | of period | | | return(b) | | | (in 000s) | | | net assets(c) | | | net assets(c) | | | net assets(c) | | | net assets(c) | | | rate | | | |
| |
| |
| | | | | | | | | | | | | | | | | | | | | | | | | | | | | | | | | | | |
| | | | | | | | | | | | | | | | | | | | | | | | | | | | | | | | | | | |
| | | $ | 8.85 | | | | (7.38 | )% | | $ | 26,483 | | | | 1.33 | % | | | 6.39 | % | | | 1.49 | % | | | 6.23 | % | | | 37 | % | | |
| | | | 8.86 | | | | (7.73 | ) | | | 28 | | | | 2.08 | | | | 5.37 | | | | 2.24 | | | | 5.21 | | | | 37 | | | |
| | | | 8.85 | | | | (7.22 | ) | | | 127,747 | | | | 0.99 | | | | 6.62 | | | | 1.15 | | | | 6.46 | | | | 37 | | | |
| | | | | | | | | | | | | | | | | | | | | | | | | | | | | | | | | | | |
| |
| | | | | | | | | | | | | | | | | | | | | | | | | | | | | | | | | | | |
| | | | | | | | | | | | | | | | | | | | | | | | | | | | | | | | | | | |
| | | | 9.85 | | | | (0.93 | ) | | | 1,482 | | | | 1.35 | | | | 4.29 | | | | 2.98 | | | | 2.66 | | | | 3 | | | |
| | | | 9.85 | | | | (1.01 | ) | | | 127 | | | | 2.10 | | | | 4.30 | | | | 3.73 | | | | 2.67 | | | | 3 | | | |
| | | | 9.85 | | | | (0.89 | ) | | | 60,432 | | | | 1.01 | | | | 5.52 | | | | 2.64 | | | | 3.89 | | | | 3 | | | |
| | | | | | | | | | | | | | | | | | | | | | | | | | | | | | | | | | | |
| | | | | | | | | | | | | | | | | | | | | | | | | | | | | | | | | | | |
| |
| |
The accompanying notes are an integral part of these financial statements.
GOLDMAN SACHS U.S. MORTGAGES FUND
Financial Highlights
Selected Data for a Share Outstanding Throughout Each Period
| | | | | | | | | | | | | | | | | | | | | | | | | | | | | | | | | |
| | | | | | | |
| | | | | | | | | | | | | | | |
| | | | | | | | Income (loss) from
| | | | | | | | | Distributions
| | | |
| | | | | | | | investment operations | | | | | | | | | to shareholders | | | |
| | | | | Net asset
| | | | | | | | | | | | | | | | | | | | | |
| | | | | value,
| | | Net
| | | Net realized
| | | Total from
| | | From net
| | | From net
| | | | | | |
| | | | | beginning
| | | investment
| | | and unrealized
| | | investment
| | | investment
| | | realized
| | | Total
| | | |
| | | Year - Share Class | | of period | | | income(a) | | | gain (loss) | | | operations | | | income | | | gains | | | distributions | | | |
| |
| | | | | | | | | | | | | | | | | | | | | | | | | | | | | | | | | |
| |
| FOR THE SIX MONTHS ENDED SEPTEMBER 30, (UNAUDITED) |
| | | | | | | | | | | | | | | | | | | | | | | | | | | | | | | | | |
| | | | | | | | | | | | | | | | | | | | | | | | | | | | | | | | | |
| | | 2008 - A | | | $9.62 | | | $ | 0.21 | | | $ | (0.33 | ) | | $ | (0.12 | ) | | $ | (0.22 | ) | | $ | — | | | $ | (0.22 | ) | | |
| | | 2008 - Institutional | | | 9.64 | | | | 0.23 | | | | (0.34 | ) | | | (0.11 | ) | | | (0.24 | ) | | | — | | | | (0.24 | ) | | |
| | | 2008 - Separate Account Institutional | | | 9.64 | | | | 0.23 | | | | (0.34 | ) | | | (0.11 | ) | | | (0.24 | ) | | | — | | | | (0.24 | ) | | |
| | | | | | | | | | | | | | | | | | | | | | | | | | | | | | | | | |
| | | | | | | | | | | | | | | | | | | | | | | | | | | | | | | | | |
| FOR THE PERIOD NOVEMBER 1, 2007 TO MARCH 31, 2008* |
| | | | | | | | | | | | | | | | | | | | | | | | | | | | | | | | | |
| | | | | | | | | | | | | | | | | | | | | | | | | | | | | | | | | |
| | | 2008 - A | | | 9.91 | | | | 0.19 | | | | (0.29 | ) | | | (0.10 | ) | | | (0.19 | ) | | | — | | | | (0.19 | ) | | |
| | | 2008 - Institutional | | | 9.93 | | | | 0.20 | | | | (0.28 | ) | | | (0.08 | ) | | | (0.21 | ) | | | — | | | | (0.21 | ) | | |
| | | 2008 - Separate Account Institutional | | | 9.93 | | | | 0.21 | | | | (0.29 | ) | | | (0.08 | ) | | | (0.21 | ) | | | — | | | | (0.21 | ) | | |
| | | | | | | | | | | | | | | | | | | | | | | | | | | | | | | | | |
| | | | | | | | | | | | | | | | | | | | | | | | | | | | | | | | | |
| FOR THE YEARS ENDED OCTOBER 31, |
| | | | | | | | | | | | | | | | | | | | | | | | | | | | | | | | | |
| | | | | | | | | | | | | | | | | | | | | | | | | | | | | | | | | |
| | | 2007 - A | | | 9.90 | | | | 0.44 | | | | 0.04 | | | | 0.48 | | | | (0.47 | ) | | | — | | | | (0.47 | ) | | |
| | | 2007 - Institutional | | | 9.91 | | | | 0.47 | | | | 0.05 | | | | 0.52 | | | | (0.50 | ) | | | — | | | | (0.50 | ) | | |
| | | 2007 - Separate Account Institutional | | | 9.91 | | | | 0.48 | | | | 0.05 | | | | 0.53 | | | | (0.51 | ) | | | — | | | | (0.51 | ) | | |
| | | | | | | | | | | | | | | | | | | | | | | | | | | | | | | | | |
| | | | | | | | | | | | | | | | | | | | | | | | | | | | | | | | | |
| | | |
| | | |
| | | 2006 - A | | | 9.82 | | | | 0.41 | | | | 0.08 | | | | 0.49 | | | | (0.41 | ) | | | — | | | | (0.41 | ) | | |
| | | 2006 - Institutional | | | 9.82 | | | | 0.45 | | | | 0.08 | | | | 0.53 | | | | (0.44 | ) | | | — | | | | (0.44 | ) | | |
| | | 2006 - Separate Account Institutional | | | 9.82 | | | | 0.45 | | | | 0.09 | | | | 0.54 | | | | (0.45 | ) | | | — | | | | (0.45 | ) | | |
| | | | | | | | | | | | | | | | | | | | | | | | | | | | | | | | | |
| | | | | | | | | | | | | | | | | | | | | | | | | | | | | | | | | |
| | | |
| | | |
| | | 2005 - A | | | 10.22 | | | | 0.28 | | | | (0.17 | ) | | | 0.11 | | | | (0.33 | ) | | | (0.18 | ) | | | (0.51 | ) | | |
| | | 2005 - Institutional | | | 10.22 | | | | 0.33 | | | | (0.18 | ) | | | 0.15 | | | | (0.37 | ) | | | (0.18 | ) | | | (0.55 | ) | | |
| | | 2005 - Separate Account Institutional | | | 10.21 | | | | 0.36 | | | | (0.20 | ) | | | 0.16 | | | | (0.37 | ) | | | (0.18 | ) | | | (0.55 | ) | | |
| | | | | | | | | | | | | | | | | | | | | | | | | | | | | | | | | |
| | | | | | | | | | | | | | | | | | | | | | | | | | | | | | | | | |
| |
| |
| FOR THE PERIOD ENDED OCTOBER 31, |
| | | | | | | | | | | | | | | | | | | | | | | | | | | | | | | | | |
| | | | | | | | | | | | | | | | | | | | | | | | | | | | | | | | | |
| | | 2004 - A (commenced November 3, 2003) | | | 10.00 | | | | 0.22 | | | | 0.33 | | | | 0.55 | | | | (0.33 | ) | | | — | | | | (0.33 | ) | | |
| | | 2004 - Institutional (commenced November 3, 2003) | | | 10.00 | | | | 0.29 | | | | 0.31 | | | | 0.60 | | | | (0.38 | ) | | | — | | | | (0.38 | ) | | |
| | | 2004 - Separate Account Institutional (commenced
November 3, 2003) | | | 10.00 | | | | 0.31 | | | | 0.28 | | | | 0.59 | | | | (0.38 | ) | | | — | | | | (0.38 | ) | | |
| | | | | | | | | | | | | | | | | | | | | | | | | | | | | | | | | |
| | | | | | | | | | | | | | | | | | | | | | | | | | | | | | | | | |
| | | |
| | | |
| |
| * | The Fund changed its fiscal year end from October 31 to March 31. |
| (a) | Calculated based on the average shares outstanding methodology. |
| (b) | Assumes investment at the net asset value at the beginning of the period, reinvestment of all dividends and distributions, a complete redemption of the investment at the net asset value at the end of the period and no sale or redemption charges. Total return would be reduced if a sales or redemption charge were taken into account. Total returns for periods less than one full year are not annualized. Returns do not reflect the deduction of taxes that a shareholder would pay on Fund distributions or the redemption of Fund Shares. |
| (c) | The portfolio turnover rate excluding the effect of mortgage dollar rolls is 141% for the six months ended September 30, 2008, 295% for the period ended March 31, 2008, 380% for the year ended October 31, 2007 and 1442% for the year ended October 31, 2006. Prior years include the effect of mortgage dollar roll transaction, if any. |
| (d) | Annualized. |
The accompanying notes are an integral part of these financial statements.
| | | | | | | | | | | | | | | | | | | | | | | | | | | | | | | | | | |
| | | | | | | | | | | | | | Ratios assuming no
| | | | | | |
| | | | | | | | | | | | | | expense reductions | | | | | | |
| | | | | | | | | | | | | | Ratio of
| | | | | | Ratio of
| | | | | | |
| | | | | | | | Net assets,
| | | Ratio of
| | | net investment
| | | Ratio of
| | | net investment
| | | | | | |
| | | Net asset
| | | | | end of
| | | net expenses
| | | income
| | | total expenses
| | | income
| | | Portfolio
| | | |
| | | value, end
| | Total
| | | period
| | | to average
| | | to average
| | | to average
| | | to average
| | | turnover
| | | |
| | | of period | | return(b) | | | (in 000s) | | | net assets | | | net assets | | | net assets | | | net assets | | | rate(c) | | | |
| |
| | | | | | | | | | | | | | | | | | | | | | | | | | | | | | | | | | |
| |
| |
| | | | | | | | | | | | | | | | | | | | | | | | | | | | | | | | | | |
| | | | | | | | | | | | | | | | | | | | | | | | | | | | | | | | | | |
| | | $9.28 | | | | (1.43 | )% | | $ | 7,678 | | | | 0.76 | %(d) | | | 4.43 | %(d) | | | 0.91 | %(d) | | | 4.28 | %(d) | | | 147 | % | | |
| | | 9.29 | | | | (1.25 | ) | | | 303,475 | | | | 0.40 | (d) | | | 4.80 | (d) | | | 0.57 | (d) | | | 4.63 | (d) | | | 147 | | | |
| | | 9.29 | | | | (1.23 | ) | | | 516,993 | | | | 0.35 | (d) | | | 4.84 | (d) | | | 0.52 | (d) | | | 4.67 | (d) | | | 147 | | | |
| | | | | | | | | | | | | | | | | | | | | | | | | | | | | | | | | | |
| | | | | | | | | | | | | | | | | | | | | | | | | | | | | | | | | | |
| |
| | | | | | | | | | | | | | | | | | | | | | | | | | | | | | | | | | |
| | | | | | | | | | | | | | | | | | | | | | | | | | | | | | | | | | |
| | | 9.62 | | | | (0.80 | ) | | | 7,021 | | | | 0.76 | (d) | | | 4.58 | (d) | | | 0.91 | (d) | | | 4.43 | (d) | | | 483 | | | |
| | | 9.64 | | | | (0.75 | ) | | | 164,236 | | | | 0.40 | (d) | | | 4.94 | (d) | | | 0.57 | (d) | | | 4.77 | (d) | | | 483 | | | |
| | | 9.64 | | | | (0.73 | ) | | | 507,194 | | | | 0.35 | (d) | | | 4.98 | (d) | | | 0.52 | (d) | | | 4.81 | (d) | | | 483 | | | |
| | | | | | | | | | | | | | | | | | | | | | | | | | | | | | | | | | |
| | | | | | | | | | | | | | | | | | | | | | | | | | | | | | | | | | |
| |
| | | | | | | | | | | | | | | | | | | | | | | | | | | | | | | | | | |
| | | | | | | | | | | | | | | | | | | | | | | | | | | | | | | | | | |
| | | 9.91 | | | | 4.96 | | | | 7,044 | | | | 0.78 | | | | 4.43 | | | | 0.94 | | | | 4.27 | | | | 610 | | | |
| | | 9.93 | | | | 5.43 | | | | 153,795 | | | | 0.40 | | | | 4.81 | | | | 0.58 | | | | 4.63 | | | | 610 | | | |
| | | 9.93 | | | | 5.48 | | | | 532,819 | | | | 0.35 | | | | 4.84 | | | | 0.53 | | | | 4.66 | | | | 610 | | | |
| | | | | | | | | | | | | | | | | | | | | | | | | | | | | | | | | | |
| | | | | | | | | | | | | | | | | | | | | | | | | | | | | | | | | | |
| |
| |
| | | 9.90 | | | | 5.21 | | | | 6,973 | | | | 0.79 | | | | 4.24 | | | | 0.98 | | | | 4.05 | | | | 1,665 | | | |
| | | 9.91 | | | | 5.56 | | | | 117,497 | | | | 0.40 | | | | 4.64 | | | | 0.61 | | | | 4.43 | | | | 1,665 | | | |
| | | 9.91 | | | | 5.73 | | | | 307,935 | | | | 0.35 | | | | 4.62 | | | | 0.56 | | | | 4.41 | | | | 1,665 | | | |
| | | | | | | | | | | | | | | | | | | | | | | | | | | | | | | | | | |
| | | | | | | | | | | | | | | | | | | | | | | | | | | | | | | | | | |
| |
| |
| | | 9.82 | | | | 1.00 | | | | 7,916 | | | | 0.81 | | | | 2.88 | | | | 0.98 | | | | 2.71 | | | | 2,006 | | | |
| | | 9.82 | | | | 1.49 | | | | 74,616 | | | | 0.40 | | | | 3.43 | | | | 0.58 | | | | 3.24 | | | | 2,006 | | | |
| | | 9.82 | | | | 1.54 | | | | 387,306 | | | | 0.35 | | | | 3.42 | | | | 0.53 | | | | 3.24 | | | | 2,006 | | | |
| | | | | | | | | | | | | | | | | | | | | | | | | | | | | | | | | | |
| | | | | | | | | | | | | | | | | | | | | | | | | | | | | | | | | | |
| |
| | | | | | | | | | | | | | | | | | | | | | | | | | | | | | | | | | |
| | | | | | | | | | | | | | | | | | | | | | | | | | | | | | | | | | |
| | | 10.22 | | | | 5.60 | | | | 628 | | | | 0.82 | (d) | | | 1.95 | (d) | | | 1.08 | (d) | | | 1.69 | (d) | | | 1,953 | | | |
| | | 10.22 | | | | 6.07 | | | | 120,628 | | | | 0.40 | (d) | | | 2.86 | (d) | | | 0.68 | (d) | | | 2.58 | (d) | | | 1,953 | | | |
| | | | | | | | | | | | | | | | | | | | | | | | | | | | | | | | | | |
| | | 10.21 | | | | 6.03 | | | | 101,429 | | | | 0.35 | (d) | | | 2.98 | (d) | | | 0.63 | (d) | | | 2.70 | (d) | | | 1,953 | | | |
| | | | | | | | | | | | | | | | | | | | | | | | | | | | | | | | | | |
| | | | | | | | | | | | | | | | | | | | | | | | | | | | | | | | | | |
| |
| |
GOLDMAN SACHS SINGLE SECTOR FIXED INCOME FUNDS
Fund Expenses (Unaudited) — Six Month Period Ended September 30, 2008
As a shareholder of Class A, Class B, Class C, Institutional, Service, Separate Account Institutional, Class IR or Class R Shares of the Funds you incur two types of costs: (1) transaction costs, including sales charges (loads) on purchase payments (with respect to Class A Shares), contingent deferred sales charges (loads) on redemptions (with respect to Class B and Class C Shares), and redemption fees (if any); and (2) ongoing costs, including management fees; distribution and service (12b-1) fees (with respect to Class A, Class B, Class C and Class R Shares); and other Fund expenses. This Example is intended to help you understand your ongoing costs (in dollars) of investing in Class A, Class B, Class C, Institutional, Service, Separate Account Institutional, Class IR and Class R Shares of the Funds and to compare these costs with the ongoing costs of investing in other mutual funds.
The Example is based on an investment of $1,000 invested at the beginning of the period and held for the entire period from April 1, 2008 through September 30, 2008.
Actual Expenses — The first line under each share class in the table below provides information about actual account values and actual expenses. You may use the information in this line, together with the amount you invested, to estimate the expenses that you paid over the period. Simply divide your account value by $1,000 (for example, an $8,600 account value divided by $1,000=8.6), then multiply the result by the number in the first line under the heading entitled “Expenses Paid” to estimate the expenses you paid on your account during this period.
Hypothetical Example for Comparison Purposes — The second line under each share class in the table below provides information about hypothetical account values and hypothetical expenses based on the Funds’ actual net expense ratio and an assumed rate of return of 5% per year before expenses, which is not the Funds’ actual return. The hypothetical account values and expenses may not be used to estimate the actual ending account balance or expenses you paid for the period. You may use this information to compare the ongoing costs of investing in the Funds and other funds. To do so, compare this 5% hypothetical example with the 5% hypothetical examples that appear in the shareholder reports of the other funds.
Please note that the expenses shown in the table are meant to highlight your ongoing costs only and do not reflect any transactional costs, such as sales charges (loads), redemption fees, or exchange fees. Therefore, the second line of the table is useful in comparing ongoing costs only, and will not help you determine the relative total costs of owning different funds. In addition, if these transactional costs were included, your costs would have been higher.
| | | | | | | | | | | | | | | | | | | | | | | | | | | | | | | | | | | | | | | | | | | | | | | | | | | | | | | | | | | | | | | | | | | | | | | | | | | | |
| | | | Emerging Markets Debt Fund | | | | High Yield Fund | | | | Investment Grade Credit Fund | | | | Local Emerging Markets Debt Fund | | | | U.S. Mortgages Fund | |
| | | | | | | | | | | | Expenses Paid
| | | | | | | | | | | | Expenses Paid
| | | | | | | | | | | | Expenses Paid
| | | | | | | | | | | | Expenses Paid
| | | | | | | | | | | | Expenses Paid
| |
| | | | Beginning
| | | | Ending
| | | | for the
| | | | Beginning
| | | | Ending
| | | | for the
| | | | Beginning
| | | | Ending
| | | | for the
| | | | Beginning
| | | | Ending
| | | | for the
| | | | Beginning
| | | | Ending
| | | | for the
| |
| | | | Account
| | | | Account
| | | | 6 months
| | | | Account
| | | | Account
| | | | 6 months
| | | | Account
| | | | Account
| | | | 6 months
| | | | Account
| | | | Account
| | | | 6 months
| | | | Account
| | | | Account
| | | | 6 months
| |
| | | | Value
| | | | Value
| | | | ended
| | | | Value
| | | | Value
| | | | ended
| | | | Value
| | | | Value
| | | | ended
| | | | Value
| | | | Value
| | | | ended
| | | | Value
| | | | Value
| | | | ended
| |
| Share Class | | | 4/1/08 | | | | 9/30/08 | | | | 9/30/08* | | | | 4/1/08 | | | | 9/30/08 | | | | 9/30/08* | | | | 4/1/08 | | | | 9/30/08 | | | | 9/30/08* | | | | 4/1/08 | | | | 9/30/08 | | | | 9/30/08* | | | | 4/1/08 | | | | 9/30/08 | | | | 9/30/08* | |
Class A | | | | | | | | | | | | | | | | | | | | | | | | | | | | | | | | | | | | | | | | | | | | | | | | | | | | | | | | | | | | | | | | | | | | | | | | | | | |
| Actual | | | $ | 1,000 | | | | $ | 924.50 | | | | $ | 5.86 | | | | $ | 1,000 | | | | $ | 934.80 | | | | $ | 5.17 | | | | $ | 1,000 | | | | $ | 915.30 | | | | $ | 3.65 | | | | | 1,000 | | | | | 926.20 | | | | $ | 6.38 | | | | $ | 1,000 | | | | $ | 985.70 | | | | $ | 3.78 | |
| Hypothetical 5% return | | | | 1,000 | | | | | 1,018.97 | + | | | | 6.15 | | | | | 1,000 | | | | | 1,019.72 | + | | | | 5.40 | | | | | 1,000 | | | | | 1,021.25 | + | | | | 3.86 | | | | | 1,000 | | | | | 1,018.44 | + | | | | 6.69 | | | | | 1,000 | | | | | 1,021.26 | + | | | | 3.85 | |
| |
Class B | | | | | | | | | | | | | | | | | | | | | | | | | | | | | | | | | | | | | | | | | | | | | | | | | | | | | | | | | | | | | | | | | | | | | | | | | | | |
| Actual | | | | N/A | | | | | N/A | | | | | N/A | | | | | 1,000 | | | | | 931.20 | | | | | 8.80 | | | | | N/A | | | | | N/A | | | | | N/A | | | | | N/A | | | | | N/A | | | | | N/A | | | | | N/A | | | | | N/A | | | | | N/A | |
| Hypothetical 5% return | | | | N/A | | | | | N/A | | | | | N/A | | | | | 1,000 | | | | | 1,015.96 | + | | | | 9.19 | | | | | N/A | | | | | N/A | | | | | N/A | | | | | N/A | | | | | N/A | | | | | N/A | | | | | N/A | | | | | N/A | | | | | N/A | |
| |
Class C | | | | | | | | | | | | | | | | | | | | | | | | | | | | | | | | | | | | | | | | | | | | | | | | | | | | | | | | | | | | | | | | | | | | | | | | | | | |
| Actual | | | | 1,000 | | | | | 920.80 | | | | | 9.46 | | | | | 1,000 | | | | | 931.20 | | | | | 8.80 | | | | | N/A | | | | | N/A | | | | | N/A | | | | | 1,000 | | | | | 922.70 | | | | | 9.87 | | | | | N/A | | | | | N/A | | | | | N/A | |
| Hypothetical 5% return | | | | 1,000 | | | | | 1,015.22 | + | | | | 9.92 | | | | | 1,000 | | | | | 1,015.96 | + | | | | 9.19 | | | | | N/A | | | | | N/A | | | | | N/A | | | | | 1,000 | | | | | 1,014.80 | + | | | | 10.35 | | | | | N/A | | | | | N/A | | | | | N/A | |
| |
Institutional | | | | | | | | | | | | | | | | | | | | | | | | | | | | | | | | | | | | | | | | | | | | | | | | | | | | | | | | | | | | | | | | | | | | | | | | | | | |
| Actual | | | | 1,000 | | | | | 925.30 | | | | | 4.24 | | | | | 1,000 | | | | | 935.00 | | | | | 3.53 | | | | | 1,000 | | | | | 916.10 | | | | | 1.94 | | | | | 1,000 | | | | | 927.80 | | | | | 4.66 | | | | | 1,000 | | | | | 987.50 | | | | | 2.00 | |
| Hypothetical 5% return | | | | 1,000 | | | | | 1,020.67 | + | | | | 4.45 | | | | | 1,000 | | | | | 1,021.42 | + | | | | 3.68 | | | | | 1,000 | | | | | 1,023.05 | + | | | | 2.05 | | | | | 1,000 | | | | | 1,020.23 | + | | | | 4.88 | | | | | 1,000 | | | | | 1,023.06 | + | | | | 2.03 | |
| |
Service | | | | | | | | | | | | | | | | | | | | | | | | | | | | | | | | | | | | | | | | | | | | | | | | | | | | | | | | | | | | | | | | | | | | | | | | | | | |
| Actual | | | | N/A | | | | | N/A | | | | | N/A | | | | | 1,000 | | | | | 933.90 | | | | | 5.96 | | | | | N/A | | | | | N/A | | | | | N/A | | | | | N/A | | | | | N/A | | | | | N/A | | | | | N/A | | | | | N/A | | | | | N/A | |
| Hypothetical 5% return | | | | N/A | | | | | N/A | | | | | N/A | | | | | 1,000 | | | | | 1,018.91 | + | | | | 6.22 | | | | | N/A | | | | | N/A | | | | | N/A | | | | | N/A | | | | | N/A | | | | | N/A | | | | | N/A | | | | | N/A | | | | | N/A | |
| |
Separate Account Institutional | | | | | | | | | | | | | | | | | | | | | | | | | | | | | | | | | | | | | | | | | | | | | | | | | | | | | | | | | | | | | | | | | | | | | | | | | | | |
| Actual | | | | N/A | | | | | N/A | | | | | N/A | | | | | N/A | | | | | N/A | | | | | N/A | | | | | 1,000 | | | | | 917.30 | | | | | 1.69 | | | | | N/A | | | | | N/A | | | | | N/A | | | | | N/A | | | | | 987.70 | | | | | 1.75 | |
| Hypothetical 5% return | | | | N/A | | | | | N/A | | | | | N/A | | | | | N/A | | | | | N/A | | | | | N/A | | | | | 1,000 | | | | | 1,023.30 | + | | | | 1.79 | | | | | N/A | | | | | N/A | | | | | N/A | | | | | N/A | | | | | 1,023.31 | + | | | | 1.78 | |
| |
Class IR | | | | | | | | | | | | | | | | | | | | | | | | | | | | | | | | | | | | | | | | | | | | | | | | | | | | | | | | | | | | | | | | | | | | | | | | | | | |
| Actual | | | | N/A | | | | | N/A | | | | | N/A | | | | | 1,000 | | | | | 934.50 | | | | | 4.02 | | | | | N/A | | | | | N/A | | | | | N/A | | | | | N/A | | | | | N/A | | | | | N/A | | | | | N/A | | | | | N/A | | | | | N/A | |
| Hypothetical 5% return | | | | N/A | | | | | N/A | | | | | N/A | | | | | 1,000 | | | | | 1,025.07 | + | | | | 4.21 | | | | | N/A | | | | | N/A | | | | | N/A | | | | | N/A | | | | | N/A | | | | | N/A | | | | | N/A | | | | | N/A | | | | | N/A | |
| |
Class R | | | | | | | | | | | | | | | | | | | | | | | | | | | | | | | | | | | | | | | | | | | | | | | | | | | | | | | | | | | | | | | | | | | | | | | | | | | |
| Actual | | | | N/A | | | | | N/A | | | | | N/A | | | | | 1,000 | | | | | 933.60 | | | | | 6.27 | | | | | N/A | | | | | N/A | | | | | N/A | | | | | N/A | | | | | N/A | | | | | N/A | | | | | N/A | | | | | N/A | | | | | N/A | |
| Hypothetical 5% return | | | | N/A | | | | | N/A | | | | | N/A | | | | | 1,000 | | | | | 1,018.58 | + | | | | 6.54 | | | | | N/A | | | | | N/A | | | | | N/A | | | | | N/A | | | | | N/A | | | | | N/A | | | | | N/A | | | | | N/A | | | | | N/A | |
| |
| |
| * | Expenses for each share class are calculated using each Fund’s annualized net expense ratio for each class, which represents the ongoing expenses as a percentage of net assets for the six months ended September 30, 2008. Expenses are calculated by multiplying the annualized net expense ratio by the average account value for the period; then multiplying the result by the number of days in the most recent fiscal half year; and then dividing that result by the number of days in the fiscal year. The annualized net expense ratios for the period were as follows: |
| | | | | | | | | | | | | | | | | | | | | | | | | | | | | | | | | |
| Fund | | Class A | | | Class B | | | Class C | | | Institutional | | | Service | | | Separate Account Institutional | | | Class IR | | | Class R | |
| | |
| Emerging Markets Debt | | | 1.22 | % | | | N/A | | | | 1.97 | % | | | 0.88 | % | | | N/A | | | | N/A | | | | N/A | | | | N/A | |
| High Yield | | | 1.07 | | | | 1.82 | % | | | 1.82 | | | | 0.73 | | | | 1.23 | % | | | N/A | | | | 0.82 | % | | | 1.32 | % |
| Investment Grade Credit | | | 0.76 | | | | N/A | | | | N/A | | | | 0.40 | | | | N/A | | | | 0.35 | % | | | N/A | | | | N/A | |
| Local Emerging Markets Debt | | | 1.33 | | | | N/A | | | | 2.08 | | | | 0.99 | | | | N/A | | | | N/A | | | | N/A | | | | N/A | |
| U.S. Mortgages | | | 0.76 | | | | N/A | | | | N/A | | | | 0.40 | | | | N/A | | | | 0.35 | | | | N/A | | | | N/A | |
| |
| |
| |
| + | Hypothetical expenses are based on each Fund’s actual annualized net expense ratios and an assumed rate of return of 5% per year before expenses. |
100
GOLDMAN SACHS SINGLE SECTOR FIXED INCOME FUNDS
Statement Regarding Basis for Approval of Management Agreement (Unaudited)
Background
The Goldman Sachs U.S. Mortgages, Goldman Sachs Investment Grade Credit, Goldman Sachs High Yield, Goldman Sachs Emerging Markets Debt and Goldman Sachs Local Emerging Markets Debt Funds (the “Funds”) are investment portfolios of Goldman Sachs Trust (the “Trust”). The Board of Trustees oversees the management of the Trust and reviews the investment performance and expenses of the Funds at regularly scheduled meetings held during the year. In addition, the Board of Trustees determines annually whether to approve and continue the Trust’s investment management agreement (the “Management Agreement”) with Goldman Sachs Asset Management, L.P. (the “Investment Adviser”) with respect to the Funds.
The Management Agreement was most recently approved for continuation until June 30, 2009 by the Board of Trustees, including those Trustees who are not parties to the Management Agreement or “interested persons” (as defined in the Investment Company Act of 1940, as amended) of any party thereto (the “Independent Trustees”), at a meeting held on June 18, 2008 (the “Annual Contract Meeting”).
To assist the Trustees in their deliberations at the Annual Contract Meeting, and in addition to the reviews of the Funds’ investment performance, expenses and other matters discussed at regularly scheduled Board meetings, the Trustees have established a Contract Review Committee (the “Committee”) whose members include all of the Independent Trustees. The Committee held meetings on December 12, 2007, February 6, 2008 and May 21, 2008. At those Committee meetings, the Independent Trustees considered matters relating to the Management Agreement including: (a) the nature and quality of the advisory, administrative and other services provided to the Funds by the Investment Adviser and its affiliates; (b) the Funds’ investment performance; (c) the Funds’ management fee arrangements; (d) the Investment Adviser’s undertakings to reimburse certain fees and expenses of the Funds that exceed specified levels and the estimated annualized savings realized by the Funds from those undertakings; (e) potential economies of scale and the levels of breakpoints in the fees payable by the Funds under the Management Agreement; (f) the relative expense levels of the Funds as compared to those of comparable funds; (g) data relating to the Investment Adviser’s profitability with respect to the Trust and each of the Funds (with the exception of the Local Emerging Markets Debt Fund, which commenced operations in 2008); (h) the statutory and regulatory requirements applicable to the approval and continuation of mutual fund investment management agreements; (i) a summary of fee concessions by the Investment Adviser and its affiliates with respect to the Funds; (j) recently proposed changes to the expense cap arrangements, and proposed amendments to the management fee schedules to further reduce the fee rates charged on assets above specified levels; (k) capacity issues relating to the Funds; (l) information on the advisory fees charged to institutional accounts by the Investment Adviser; (m) information on the processes followed by a third party mutual fund data provider engaged as part of the Trustees’ contract review (the “Outside Data Provider”) in producing investment performance and expense comparisons for the Funds; (n) the current pricing and profitability of the Funds’ transfer agent; and (o) the nature and quality of the services provided by the Funds’ unaffiliated service providers and reports on due diligence conducted by the Investment Adviser with respect to those service providers.
At the Annual Contract Meeting, the Trustees reviewed the matters that were considered at the Committee meetings and also considered additional matters including: (a) the quality of the Investment Adviser’s services; (b) the structure, staff and capabilities of the Investment Adviser and its portfolio management team; (c) the groups within the Investment Adviser that support the portfolio management team, including the legal and compliance departments, the credit department, the fund controllers group, the tax group, the product services group, the valuation oversight group, the risk management and analysis group, the business planning team and the technology group; (d) the Investment Adviser’s business continuity and disaster recovery planning; (e) the Investment Adviser’s financial resources and its ability to hire and retain talented personnel; (f) the fees received by the Investment Adviser’s affiliates from the Funds for transfer agency, distribution and other services; (g) the terms of the Management Agreement and agreements with other service providers entered into by the Trust on behalf of the Funds; (h) the administrative services provided under the Management Agreement, including the nature and extent of the Investment Adviser’s oversight of the Funds’ other service providers, including the custodian and fund accounting agent; (i) portfolio trading related issues; and (j) the Investment Adviser’s processes and policies addressing various types of potential conflicts of interest. At the Annual Contract Meeting, the Trustees also considered further the Investment Adviser’s profitability with respect to the Trust and each Fund (with the exception of the Local Emerging Markets Debt Fund), and each Fund’s investment performance, fees and expenses, including each Fund’s expense trends over time and existing and proposed breakpoints in the fee rates payable under the Management Agreement.
In connection with the Committee meetings and the Annual Contract Meeting, the Trustees received written materials and oral presentations on the topics covered, and were advised by their independent legal counsel regarding their responsibilities under applicable law. Also, in conjunction with these meetings, the Trustees attended sessions at which they reviewed information regarding the Funds’ assets, sales and redemptions, and the payment of Rule 12b-1 distribution and
GOLDMAN SACHS SINGLE SECTOR FIXED INCOME FUNDS
Statement Regarding Basis for Approval of Management Agreement (Unaudited) (continued)
service fees by the Funds and the payment of non-Rule 12b-1 shareholder service and administration fees by the High Yield Fund’s Service Shares. Information was also provided to the Trustees relating to revenue sharing payments made by and services provided by the Investment Adviser and its affiliates to intermediaries that promote the sale, distribution and/or servicing of Fund shares; portfolio manager ownership of Fund shares; portfolio manager compensation, the alignment of the interests of the Funds and the portfolio managers and related potential conflicts of interest; the number and types of accounts managed by the portfolio managers; and other matters. During the course of their deliberations, the Independent Trustees met in executive sessions with their independent legal counsel, without representatives of the Investment Adviser or its affiliates present.
The presentations made at the Committee meetings and at the Annual Contract Meeting encompassed the Funds and other mutual fund portfolios for which the Board of Trustees has responsibility. While the management agreements for all of the Funds and the other mutual fund portfolios for which the Trustees have responsibility were considered at the same Annual Contract Meeting, the Trustees separately considered the Management Agreement as it applied to each Fund.
In evaluating the Management Agreement at the Annual Contract Meeting, the Trustees relied upon their knowledge, resulting from their meetings and other interactions throughout the year, of the Investment Adviser, its affiliates, their services and the Funds. At those meetings the Trustees received materials relating to the Investment Adviser’s investment management and other services provided under the Management Agreement, including: (a) information on the investment performance of the Funds in comparison to the performance of similar mutual funds and benchmark performance indices; (b) general investment outlooks in the markets in which the Funds invest; (c) compliance reports; and (d) expenses borne by the Funds. In addition, the Trustees were provided with copies of disclosure materials regarding the Funds and their expenses, as well as information on the Funds’ competitive universe and discussed the broad range of other investment choices that are available to Fund investors.
Nature, Extent and Quality of the Services Provided Under the Management Agreement
As part of their review, the Trustees considered the nature, extent and quality of the services provided by the Investment Adviser. In this regard, the Trustees considered both the investment advisory services, and the other, non-advisory services, that are provided to the Funds by the Investment Adviser and its affiliates. The Trustees concluded that the Investment Adviser was both able to commit substantial financial and other resources to the operations of the Funds and had continued to commit those resources in multiple areas including portfolio management, trading, technology, human resources, tax, treasury, legal, compliance, vendor oversight and risk management. The Independent Trustees also believed that the Investment Adviser had made significant commitments to address regulatory compliance requirements applicable to the Funds and the Investment Adviser, including the implementation and enhancement of compliance systems and education and training initiatives.
Investment Performance
The Independent Trustees also considered the investment performance of the Funds and the Investment Adviser. In this regard, they compared the investment performance of each Fund (with the exception of the Local Emerging Markets Debt Fund, which commenced operations in 2008) to the performance of other similar SEC-registered funds and to rankings and ratings compiled by the Outside Data Provider. The Independent Trustees also reviewed each Fund’s investment performance relative to its performance benchmark. This information on each Fund’s investment performance was provided for the one-, three-, five- and ten-year periods ended December 31, 2007, to the extent that each Fund had been in existence for those periods. In addition, they considered the investment performance trends of the Funds over time, and reviewed the investment performance of each Fund in light of its investment objective and policies, credit and duration parameters, as well as in light of periodic analyses of its quality and risk profile. The Independent Trustees considered whether each Fund had operated within its investment policies, and had complied with its investment limitations. The Trustees noted that the Local Emerging Markets Debt Fund commenced operations in 2008 and had provided a satisfactory level of performance to investors in light of its investment policies and prevailing market conditions. The Trustees believed that each of the other Funds had provided investment performance within a competitive range for long-term investors, and that the Investment Adviser’s continued management would benefit each Fund and its shareholders.
Costs of Services Provided and Competitive Information
The Independent Trustees considered the contractual fee rates payable by each Fund under the Management Agreement. In this regard, the Trustees considered information on the services rendered by the Investment Adviser to the Funds, which
GOLDMAN SACHS SINGLE SECTOR FIXED INCOME FUNDS
Statement Regarding Basis for Approval of Management Agreement (Unaudited) (continued)
included both advisory and administrative services that were directed to the needs and operations of the Funds as registered mutual funds.
In particular, the Trustees reviewed analyses prepared by the Outside Data Provider regarding the expense rankings of the Funds. The analyses provided a comparison of the Funds’ management fees and breakpoints to relevant peer groups and category universes; an expense analysis which compared each Fund’s expenses to a peer group and a category universe; and a five-year history (or, in the case of Funds that commenced investment operations within a shorter period, since the year in which it commenced operations), comparing each Fund’s expenses to the category averages. The analyses also compared each Fund’s transfer agency fees, custody and accounting fees, distribution fees, other expenses and fee waivers/reimbursements to those of other funds in the peer groups and peer group medians. The Independent Trustees believed that the comparisons provided by the Outside Data Provider were useful in evaluating the reasonableness of the management fees and total expenses paid by the Funds.
In addition, the Independent Trustees considered the Investment Adviser’s voluntary undertakings to limit the Funds’ “other expenses” ratios (excluding certain expenses) to certain specified levels and to waive a portion of its management fees payable by the U.S. Mortgages and Investment Grade Credit Funds. They also considered comparative fee information for services provided by the Investment Adviser to institutional accounts and information that indicated that services provided to the Funds differed in various significant respects from the services provided to institutional accounts, which generally required fewer services from the Investment Adviser, were less time-intensive and paid lower fees.
The Independent Trustees noted the competitive nature of the mutual fund marketplace, and that many of the Funds’ shareholders invested in the Funds in part because of the Funds’ relationship with the Investment Adviser and have a general expectation that the relationship will continue. They also noted that shareholders may be able to redeem their Fund shares if they believe that the Fund fees and expenses are too high or if they are dissatisfied with the performance of the Fund.
Profitability
The Independent Trustees reviewed the Investment Adviser’s revenues and pre-tax profit margins with respect to the Trust and each of the Funds (with the exception of the Local Emerging Markets Debt Fund, which commenced operations in 2008). In this regard the Independent Trustees reviewed, among other things, profitability analyses and summaries, revenue and expense schedules by Fund and by function (i.e., investment management, transfer agency and distribution and service), and expense allocation methodologies, as well as the report of an independent registered public accounting firm regarding the mathematical accuracy and conformity to the Investment Adviser’s allocation methodologies of the Investment Adviser’s schedule of revenues and expenses. Profitability data for the Trust and each Fund (with the exception of the Local Emerging Markets Debt Fund) were provided for 2007 and 2006, and the Independent Trustees considered this information in relation to the Investment Adviser’s overall profitability. The Independent Trustees considered the Investment Adviser’s revenues and pre-tax profit margins both in absolute terms and in comparison to information on the reported pre-tax profit margins earned by certain other asset management firms.
Economies of Scale
The Independent Trustees also considered the breakpoints in the fee rate payable under the Management Agreement for each of the Funds at the following annual percentages of the average daily net assets of the Funds:
| | | | | | | | | | | | | | | | | | | | | |
| | | First $1 Billion | | | Next $1 Billion | | | Next $3 Billion | | | Next $3 Billion | | | Over $8 Billion | |
| | |
| Emerging Markets Debt | | | 0.80% | | | | 0.80% | | | | 0.72% | | | | 0.68% | | | | 0.67% | |
| High Yield | | | 0.70% | | | | 0.70% | | | | 0.63% | | | | 0.60% | | | | 0.59% | |
| Investment Grade Credit | | | 0.40% | | | | 0.36% | | | | 0.34% | | | | 0.33% | | | | 0.32% | |
| Local Emerging Markets Debt | | | 0.90% | | | | 0.90% | | | | 0.81% | | | | 0.77% | | | | 0.75% | |
| U.S. Mortgages | | | 0.40% | | | | 0.36% | | | | 0.34% | | | | 0.33% | | | | 0.32% | |
| |
| |
The breakpoints at the $5 and $8 billion asset levels were considered by the Independent Trustees at the May Committee meeting and were approved by the Trustees at the Annual Contract Meeting. These additional breakpoints had been proposed by the Investment Adviser to further share potential economies of scale, if any, with the Funds and their shareholders as assets under management reach those asset levels. In approving these fee breakpoints, the Independent Trustees considered the Investment Adviser’s potential economies of scale in managing each Fund, and whether the Funds and their shareholders were participating in the benefits of those economies. In this regard, the Independent Trustees considered the amounts of assets in the Funds; the information provided by the Investment Adviser relating to the costs of
GOLDMAN SACHS SINGLE SECTOR FIXED INCOME FUNDS
Statement Regarding Basis for Approval of Management Agreement (Unaudited) (continued)
the services provided by the Investment Adviser and its affiliates and the profits realized by them; information comparing fee rates charged by the Investment Adviser with fee rates charged by other, unaffiliated investment managers to other mutual funds; and the Investment Adviser’s voluntary undertakings to limit fees and “other expenses” to certain amounts. Upon reviewing these matters at the Annual Contract Meeting in 2008, the Independent Trustees concluded that the fee breakpoints represented a means of ensuring that benefits of scalability would be passed along to shareholders at the specified asset levels.
Other Benefits to the Investment Adviser and Its Affiliates
The Independent Trustees also considered the other benefits derived by the Investment Adviser and its affiliates from their relationship with the Funds as stated above, including: (a) transfer agency fees received by Goldman, Sachs & Co. (“Goldman Sachs”); (b) futures commissions earned by Goldman Sachs for executing futures transactions on behalf of the Funds; (c) trading efficiencies resulting from aggregation of orders of the Funds with those for other funds or accounts managed by the Investment Adviser; (d) the Investment Adviser’s ability to leverage the infrastructure designed to service the Funds on behalf of its other clients; (e) the Investment Adviser’s ability to cross-market other products and services to Fund shareholders; (f) Goldman Sachs’ retention of certain fees as Fund Distributor; and (g) the Investment Adviser’s ability to negotiate better pricing with custodians on behalf of its other clients, as a result of the relationship with the Funds.
Other Benefits to the Funds and Their Shareholders
The Independent Trustees also noted that the Funds receive certain other benefits as a result of their relationship with the Investment Adviser, including: (a) trading efficiencies resulting from aggregation of orders of the Funds with those of other funds or accounts managed by the Investment Adviser; (b) improved servicing and pricing from vendors because of the volume of business generated by the Investment Adviser and its affiliates; (c) improved servicing and pricing from broker-dealers because of the volume of business generated by the Investment Adviser and its affiliates; (d) the Investment Adviser’s ability to negotiate favorably with derivatives counterparties as a result of the size and reputation of the Goldman Sachs organization; (e) the advantage received from the Investment Adviser’s knowledge and experience gained from managing other accounts and products; and (f) the Investment Adviser’s ability to hire and retain qualified personnel to provide services to the Funds because of the reputation of the Goldman Sachs organization.
Conclusion
In connection with their consideration of the Management Agreement, the Independent Trustees gave weight to each of the factors described above, but did not identify any particular factor as controlling their decision. After deliberation and consideration of all of the information provided, including the factors described above, the Independent Trustees concluded, in the exercise of their business judgment, that the management fees paid by each of the Funds were reasonable in light of the services provided to it by the Investment Adviser, the Investment Adviser’s costs and each Fund’s current and reasonably foreseeable asset levels, and that the Management Agreement should be approved and continued with respect to each Fund until June 30, 2009.
Goldman Sachs Funds
Goldman Sachs is a premier financial services firm, known since 1869 for creating thoughtful and customized investment solutions in complex global markets.
Today, the Investment Management Division of Goldman Sachs serves a diverse set of clients worldwide, including private institutions, public entities and individuals. With portfolio management teams located around the world — and $758 billion in assets under management as of September 30, 2008 — our investment professionals bring firsthand knowledge of local markets to every investment decision, making us one of the few truly global asset managers.
GOLDMAN SACHS FUNDS
In building a globally diversified portfolio, you can select from more than 80 Goldman Sachs Funds and gain access to investment opportunities across borders, investment styles, asset classes and security capitalizations.

| | | | | |
Money Market1
Fixed Income
§n Enhanced Income Fund
§n Ultra-Short Duration
Government Fund
§n Short Duration Government
Fund
§n Short Duration Tax-Free Fund
§n California AMT-Free
Municipal Fund
§n New York AMT-Free
Municipal Fund
§n Municipal Income Fund
§n Government Income Fund
§n Inflation Protected Securities
Fund
§n U.S. Mortgages Fund
§n Core Fixed Income Fund
§n Core Plus Fixed Income Fund
§n Investment Grade Credit Fund
§n Global Income Fund
§n High Yield Municipal Fund
§n High Yield Fund
§n Emerging Markets Debt Fund
§n Local Emerging Markets
Debt Fund | | Domestic Equity
§n Balanced Fund
§n Growth and Income Fund
§n Structured Large Cap Value Fund
§n Large Cap Value Fund
§n Structured U.S. Equity Fund
§n Structured U.S. Equity Flex Fund
§n Structured Large Cap Growth Fund
§n Capital Growth Fund
§n Strategic Growth Fund
§n All Cap Growth Fund
§n Concentrated Growth Fund
§n Tollkeeper FundSM
§n Mid Cap Value Fund
§n Growth Opportunities Fund
§n Small/Mid Cap Growth Fund
§n Structured Small Cap Equity Fund
§n Structured Small Cap Value Fund
§n Structured Small Cap Growth Fund
§n Small Cap Value Fund
Fund of Funds2
§n Asset Allocation Portfolios
§n Income Strategies Portfolio
§n Satellite Strategies Portfolio
§n Enhanced Dividend Global Equity
Portfolio
§n Tax-Advantaged Global Equity
Portfolio | |
Retirement Strategies2
International Equity
§n Structured International Equity Fund
§n Structured International Equity
Flex Fund
§n Strategic International Equity Fund
§n Concentrated International Equity Fund
§n Structured International Small Cap Fund
§n International Small Cap Fund
§n Asia Equity Fund
§n Structured Emerging Markets
Equity Fund
§n Emerging Markets Equity Fund
§n Concentrated Emerging Markets
Equity Fund
§n BRIC Fund (Brazil, Russia, India, China)
Specialty2
§n U.S. Equity Dividend and Premium Fund
§n International Equity Dividend and
Premium Fund
§n Structured Tax-Managed Equity Fund
§n Structured International Tax-Managed
Equity Fund
§n Real Estate Securities Fund
§n International Real Estate Securities Fund
§n Commodity Strategy Fund
§n Absolute Return Tracker Fund |
| |
1 | An investment in a money market fund is neither insured nor guaranteed by the Federal Deposit Insurance Corporation or any other government agency. Although the Funds seek to preserve the value of your investment at $1.00 per share, it is possible to lose money by investing in the Funds. |
| |
| 2 | Individual Funds within the Fund of Funds, Retirement Strategies and Specialty categories will have various placement on the risk/return spectrum and may have greater or lesser risk than that indicated by the placement of the general Fund of Funds, Retirement Strategies or Specialty category. |
The Goldman Sachs Tollkeeper FundSM is a registered service mark of Goldman, Sachs & Co.
| | | |
TRUSTEES
Ashok N. Bakhru, Chairman
John P. Coblentz, Jr.
Diana M. Daniels
Patrick T. Harker
James A. McNamara
Jessica Palmer
Alan A. Shuch
Richard P. Strubel | | OFFICERS
James A. McNamara, President
John M. Perlowski, Senior Vice President and Treasurer
Peter V. Bonanno, Secretary |
| | | |
| | | |
GOLDMAN, SACHS & CO.
Distributor and Transfer Agent | | GOLDMAN SACHS ASSET MANAGEMENT, L.P.
Investment Adviser |
Visit our Web site at www.goldmansachsfunds.com to obtain the most recent month-end returns.
Goldman Sachs Asset Management, L.P. 32 Old Slip, 32nd Floor, New York, New York 10005
The reports concerning the Funds included in this shareholder report may contain certain forward-looking statements about the factors that may affect the performance of the Funds in the future. These statements are based on Fund management’s predictions and expectations concerning certain future events and their expected impact on the Funds, such as performance of the economy as a whole and of specific industry sectors, changes in the levels of interest rates, the impact of developing world events, and other factors that may influence the future performance of the Funds. Management believes these forward-looking statements to be reasonable, although they are inherently uncertain and difficult to predict. Actual events may cause adjustments in portfolio management strategies from those currently expected to be employed.
A description of the policies and procedures that the Funds uses to determine how to vote proxies relating to portfolio securities and information regarding how the Funds voted proxies relating to portfolio securities for the 12-month period ending June 30, 2008 will be available (I) without charge, upon request by calling 1-800-526-7384 (for Retail Shareholders) or 1-800-621-2550 (for Institutional Shareholders); and (II) on the Securities and Exchange Commission (”SEC”) Web site at http://www.sec.gov.
The Funds files its complete schedule of portfolio holdings with the SEC for the first and third quarters of each fiscal year on Form N-Q. The Funds’ Form N-Q will be available on the SEC’s website at http://www.sec.gov within 60 days after the Funds’ first and third fiscal quarters. The Funds’ Form N-Q, when available, may be reviewed and copied at the SEC’s Public Reference Room in Washington, D.C., and information on the operation of the Public Reference Room may also be obtained by calling 1-800-SEC-0330. Forms N-Q may be obtained upon request and without charge by calling 1-800-526-7384 (for Retail Shareholders) or 1-800-621-2550 (for Institutional Shareholders).
Holdings and allocations shown may not be representative of current or future investments. Holdings and allocations may not include the Funds’ entire investment portfolio, which may change at any time. Fund holdings should not be relied on in making investment decisions and should not be construed as research or investment advice regarding particular securities.
This material is not authorized for distribution to prospective investors unless preceded or accompanied by a current Prospectus. Please consider a Fund’s objectives, risks, and charges and expenses, and read the Prospectus carefully before investing. The Prospectus contains this and other information about the Fund.
Copyright 2008 Goldman, Sachs & Co. All rights reserved. 08-8676.MF.TMPL SSTFISAR / 89.7K / 10-08
| | (a) | | The information required by this Item is only required in an annual report on this Form N-CSR. |
| | | |
| | (b) | | During the period covered by this report, no amendments were made to the provisions of the Code of Ethics. |
| | | |
| | (c) | | During the period covered by this report, the registrant did not grant any waivers, including an implicit waiver, from any provision of the Code of Ethics. |
| | | |
| | (d) | | A copy of the Code of Ethics is available as provided in Item 12(a)(1) of this report. |
| | | |
| | | |
| ITEM 3. | | AUDIT COMMITTEE FINANCIAL EXPERT. |
The information required by this Item is only required in an annual report on this Form N-CSR.
| | | |
| ITEM 4. | | PRINCIPAL ACCOUNTANT FEES AND SERVICES. |
The information required by this Item is only required in an annual report on this Form N-CSR.
| | | |
| ITEM 5. | | AUDIT COMMITTEE OF LISTED REGISTRANTS. |
| | | |
| | | The information required by this Item is only required in an annual report on this Form N-CSR. |
| | | |
| ITEM 6. | | SCHEDULE OF INVESTMENTS. |
| | | |
| | | The Schedule of Investments is included as part of the Semi-Annual Report to Stockholders filed under Item 1 of this Form N-CSR. |
| | | |
| ITEM 7. | | DISCLOSURE OF PROXY VOTING POLICIES AND PROCEDURES FOR CLOSED-END MANAGEMENT INVESTMENT COMPANIES. |
| | | |
| | | Not applicable. |
| | | |
| ITEM 8. | | PORTFOLIO MANAGERS OF CLOSED-END MANAGEMENT INVESTMENT COMPANIES. |
| | | |
| | | Not applicable. |
| | | |
| ITEM 9. | | PURCHASES OF EQUITY SECURITIES BY CLOSED-END MANAGEMENT INVESTMENT COMPANY AND AFFILIATED PURCHASERS. |
| | | |
| | | Not applicable. |
| | | |
| ITEM 10. | | SUBMISSION OF MATTERS TO A VOTE OF SECURITY HOLDERS.
There have been no material changes to the procedures by which shareholders may recommend nominees to the registrant’s board of trustees. |
| | | |
| | | |
| ITEM 11. | | CONTROLS AND PROCEDURES. |
| | | |
| | (a) | | The registrant’s principal executive and principal financial officers, or persons performing similar functions have concluded that the registrant’s disclosure controls and procedures (as defined in Rule 30a-3(c) under the Investment Company Act of 1940, as amended (the “1940 Act”)) are effective as of a date within 90 days of the filing of this report that includes the disclosure required by this paragraph, based on the evaluation of these controls and procedures required by Rule 30a-3(b) under the 1940 Act and 15d-15(b) under the Securities Exchange Act of 1934, as amended. |
| | | |
| | (b) | | There were no changes in the registrant’s internal control over financial reporting (as defined in Rule 30a-3(d) under the 1940 Act) that occurred during the registrant’s second fiscal quarter of the period covered by this report that have materially affected, or are reasonably likely to materially affect, the registrant’s internal control over financial reporting. |
| | | |
| | (a)(1) | | | Goldman Sachs Trust's Code of Ethics for Principal Executive and Senior Financial Officers is incorporated by reference to Exhibit 11(a)(1) of the registrant's Form N-CSR filed on March 8, 2004 for its Real Estate Securities Fund (Accession Number 0000950123-04-0002984). |
| | | |
| | (a)(2) | | Exhibit 99.CERT | Certifications pursuant to Section 302 of the Sarbanes-Oxley Act of 2002 filed herewith. |
| | | |
| | (b) | | Exhibit 99.906CERT | Certifications pursuant to Section 906 of the Sarbanes-Oxley Act of 2002 filed herewith. |
SIGNATURES
| | | | Pursuant to the requirements of the Securities Exchange Act of 1934, as amended, and the Investment Company Act of 1940, as amended, the Registrant has duly caused this report to be signed on its behalf by the undersigned, thereunto duly authorized. |
| | | | | | | |
| | | | | Goldman Sachs Trust | | |
| | | | | | | |
| By: | | | | /s/ James A. McNamara | | |
| | | | |
| | |
| | | | | James A. McNamara | | |
| | | | | President/Principal Executive Officer | | |
| | | | | Goldman Sachs Trust | | |
| | | | | | | |
| Date: | | | | December 5, 2008 | | |
| | | | Pursuant to the requirements of the Securities Exchange Act of 1934, as amended, and the Investment Company Act of 1940, as amended, this report has been signed below by the following persons on behalf of the Registrant and in the capacities and on the dates indicated. |
| | | | | | | |
| By: | | | | /s/ James A. McNamara | | |
| | | | |
| | |
| | | | | James A. McNamara | | |
| | | | | President/Principal Executive Officer | | |
| | | | | Goldman Sachs Trust | | |
| | | | | | | |
| Date: | | | | December 5, 2008 | | |
| | | | | | | |
| By: | | | | /s/ John M. Perlowski | | |
| | | | |
| | |
| | | | | John M. Perlowski | | |
| | | | | Treasurer/Principal Financial Officer | | |
| | | | | Goldman Sachs Trust | | |
| | | | | | | |
| Date: | | | | December 5, 2008 | | |


![[GRAPHIC]](https://capedge.com/proxy/N-CSRS/0000950123-08-017070/y72107y7210708.gif)
![[GRAPHIC]](https://capedge.com/proxy/N-CSRS/0000950123-08-017070/y72107y7210707.gif)
![[GRAPHIC]](https://capedge.com/proxy/N-CSRS/0000950123-08-017070/y72107y7210705.gif)
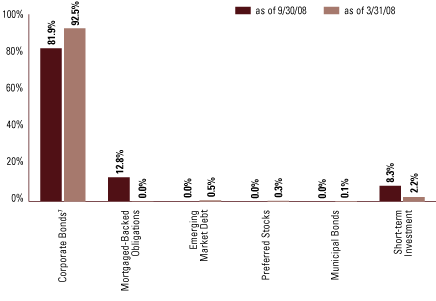
![[GRAPHIC]](https://capedge.com/proxy/N-CSRS/0000950123-08-017070/y72107y7210709.gif)
![[GRAPHIC]](https://capedge.com/proxy/N-CSRS/0000950123-08-017070/y72107y7210703.gif)
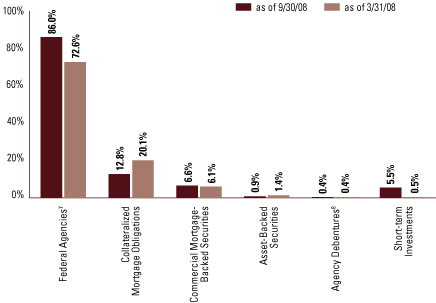
![[GRAPHIC]](https://capedge.com/proxy/N-CSRS/0000950123-08-017070/y72107y7210716.gif)