UNITED STATES
SECURITIES AND EXCHANGE COMMISSION
Washington, D.C. 20549
FORM N-CSR
CERTIFIED SHAREHOLDER REPORT OF REGISTERED
MANAGEMENT INVESTMENT COMPANIES
Investment Company Act file number 811-05349
Goldman Sachs Trust
(Exact name of registrant as specified in charter)
71 South Wacker Drive,
Chicago, Illinois 60606
(Address of principal executive offices) (Zip code)
Copies to: | ||
Caroline Kraus | Geoffrey R.T. Kenyon, Esq. | |
Goldman, Sachs & Co. | Dechert LLP | |
200 West Street | 100 Oliver Street | |
New York, New York 10282 | 40th Floor | |
| Boston, MA 02110-2605 | ||
(Name and address of agents for service)
Registrant’s telephone number, including area code: (312) 655-4400
Date of fiscal year end: December 31
Date of reporting period: June 30, 2013
| ITEM 1. | REPORTS TO STOCKHOLDERS. |
| The Semi-Annual Report to Stockholders is filed herewith. |
Goldman Sachs Funds

| Semi-Annual Report | June 30, 2013 | |||
Structured Tax-Advantaged | ||||
U.S. Equity Dividend and Premium | ||||
International Equity Dividend and Premium | ||||
Structured Tax-Managed Equity | ||||
Structured International Tax-Managed Equity | ||||

Goldman Sachs Structured Tax-Advantaged Equity Funds
| n | U.S. EQUITY DIVIDEND AND PREMIUM |
| n | INTERNATIONAL EQUITY DIVIDEND AND PREMIUM |
| n | STRUCTURED TAX-MANAGED EQUITY |
| n | STRUCTURED INTERNATIONAL TAX-MANAGED EQUITY |
TABLE OF CONTENTS | ||||
Principal Investment Strategies and Risks | 1 | |||
Market Review | 3 | |||
Investment Process — Equity Dividend and Premium Funds | 6 | |||
Portfolio Management Discussions and Performance Summaries — Equity Dividend and Premium Funds | 7 | |||
Investment Process — Global Structured Tax-Managed | 17 | |||
Portfolio Management Discussions and Performance Summaries — Structured Tax-Managed Funds | 18 | |||
Schedules of Investments | 28 | |||
Financial Statements | 48 | |||
Financial Highlights | 52 | |||
Notes to the Financial Statements | 60 | |||
Other Information | 80 | |||
| NOT FDIC-INSURED | May Lose Value | No Bank Guarantee | ||
GOLDMAN SACHS STRUCTURED TAX-ADVANTAGED EQUITY FUNDS
Principal Investment Strategies and Risks
This is not a complete list of risks that may affect the Funds. For additional information concerning the risks applicable to the Funds, please see the Funds’ Prospectuses.
The Goldman Sachs U.S. Equity Dividend and Premium Fund invests primarily in dividend-paying equity investments in large-capitalization U.S. equity issuers. The Fund is subject to market risk, which means that the value of the securities in which it invests may go up or down in response to the prospects of individual companies, particular sectors and/or general economic conditions. The Fund is also subject to the risks associated with writing (selling) call options, which limits the opportunity to profit from an increase in the market value of stocks in exchange for up-front cash at the time of selling the call option. In a rising market, the Fund could significantly underperform the market, and the Fund’s options strategies may not fully protect it against declines in the value of the market. The Investment Adviser’s use of quantitative models to execute the Fund’s investment strategy may fail to produce the intended result. Different investment styles (e.g., “quantitative”) tend to shift in and out of favor, and at times the Fund may underperform other funds that invest in similar asset classes. The Fund is also subject to the risk that the pre-tax performance of the Fund may be lower than the performance of a similar fund that is not tax-managed. No assurance can be offered that the Fund’s tax-managed strategies will reduce the amount of taxable income and capital gains distributed by the Fund to shareholders.
The Goldman Sachs International Equity Dividend and Premium Fund invests primarily in dividend-paying equity investments in companies that are organized outside the United States or whose securities are principally traded outside the United States. The Fund is subject to market risk, which means that the value of the securities in which it invests may go up or down in response to the prospects of individual companies, particular sectors and/or general economic conditions. Foreign and emerging markets investments may be more volatile and less liquid than investments in U.S. securities and are subject to the risks of currency fluctuations and adverse economic or political developments. The Fund is also subject to the risks associated with writing (selling) call options, which limits the opportunity to profit from an increase in the market value of stocks in exchange for up-front cash at the time of selling the call option. In a rising market, the Fund could significantly underperform the market, and the Fund’s options strategies may not fully protect it against declines in the value of the market. The Investment Adviser’s use of quantitative models to execute the Fund’s investment strategy may fail to produce the intended result. Different investment styles (e.g., “quantitative”) tend to shift in and out of favor, and at times the Fund may underperform other funds that invest in similar asset classes. The Fund is also subject to the risk that the pre-tax performance of the Fund may be lower than the performance of a similar fund that is not tax-managed. No assurance can be offered that the Fund’s tax managed strategies will reduce the amount of taxable income and capital gains distributed by the Fund to shareholders.
The Goldman Sachs Structured Tax-Managed Equity Fund invests in equity investments in U.S. issuers, including foreign issuers that are traded in the United States. The Fund is subject to market risk, which means that the value of the securities in which it invests may go up or down in response to the prospects of individual companies, particular sectors and/or general economic conditions. The Investment Adviser’s use of quantitative models to execute the Fund’s investment strategy may fail to produce the intended result. Different investment styles (e.g., “quantitative”) tend to shift in and out of favor, and at times the Fund may underperform other funds that invest in similar asset classes. Foreign and emerging markets investments may be more volatile and less liquid than U.S. securities and are subject to the risks of currency fluctuations and adverse economic or political developments. The Fund is also subject to the risk that the pre-tax performance of the Fund may be lower than the performance of a similar fund that is not tax-managed. No assurance can be offered that the Fund’s tax-managed strategies will reduce the amount of taxable income and capital gains distributed by the Fund to shareholders. The Fund is not suitable for IRAs or other tax-exempt or tax-deferred accounts.
1
GOLDMAN SACHS STRUCTURED TAX-ADVANTAGED EQUITY FUNDS
The Goldman Sachs Structured International Tax-Managed Equity Fund invests primarily in international equity securities. The Fund is subject to market risk, which means that the value of the securities in which it invests may go up or down in response to the prospects of individual companies, particular sectors and/or general economic conditions. Foreign and emerging markets investments may be more volatile than investments in U.S. securities and are subject to the risks of currency fluctuations and adverse economic or political developments. The Investment Adviser’s use of quantitative models to execute the Fund’s investment strategy may fail to produce the intended result. Different investment styles (e.g., “quantitative”) tend to shift in and out of favor, and at times the Fund may underperform other funds that invest in similar asset classes. The Fund is also subject to the risk that the pre-tax performance of the Fund may be lower than the performance of a similar fund that is not tax-managed. No assurance can be offered that the Fund’s tax-managed strategies will reduce the amount of taxable income and capital gains distributed by the Fund to shareholders. The Fund is not suitable for IRAs or other tax-exempt or tax-deferred accounts.
2
MARKET REVIEW
Goldman Sachs Structured Tax-Advantaged Equity Funds
Market Review
The U.S. and international equity markets generated positive returns during the six months ended June 30, 2013 (the “Reporting Period”).
U.S. Equity Markets
U.S. equities, as represented by the S&P® 500 Index, extended their rally from 2012 with a strong first quarter in 2013. Indeed, the S&P® 500 Index finished the first quarter of 2013 with significant gains, making a five-year high during these months. The Dow Jones Industrial Average also hit a new record high during the first calendar quarter.
Despite the overhang of automatic spending cuts, or sequestration, that went into effect in March 2013, U.S. equity markets reflected a variety of improving economic indicators. Strong momentum in the housing market continued, as the Case-Shiller Index of house prices rose 8.1% in January 2013, year-over-year the fastest pace since mid-2006. The employment picture also improved, with the unemployment rate dropping to 7.7%. Strong retail sales suggested consumers may have been feeling the effects of better housing and labor market conditions.
After a strong start to the second quarter of 2013, bullish sentiment began to fade, and the U.S. equity rally halted in mid-May 2013 when Federal Reserve (“Fed”) Chair Bernanke announced the potential “tapering” of the pace of quantitative easing asset purchases. U.S. equity markets reacted negatively again in June to news the slowing of the asset purchase program could begin later this year, with the program ending by the middle of 2014 if the economy grows as expected. U.S. equity markets calmed toward the end of the month as a downward revision of first quarter Gross Domestic Product (“GDP”) from 2.4% to 1.8% supported reassurance from the Fed that it would only begin reducing asset purchases if the economy was clearly on track. Still, the S&P® 500 Index declined modestly in June 2013, ending seven consecutive months of gains and muting returns for the quarter as a whole. Even with that, both the S&P® 500 Index and the Dow Jones Industrial Average made fresh record highs, fueled by the continued strong rebound in house prices during the second calendar quarter, and returns for the Reporting Period overall were still significantly up.
For the Reporting Period as a whole, all ten sectors within the S&P® 500 Index posted gains. Health care did best, followed closely by consumer discretionary and financials. Conversely, materials performed worst, as commodity prices were volatile in part due to a slowing Chinese economy. Information technology, utilities, telecommunication services and energy were also comparatively weak, though still producing positive returns.
All segments of the U.S. equity market advanced during the Reporting Period, with small-cap stocks, as measured by the Russell 2000® Index gaining most, followed by mid-cap stocks and then large-cap stocks, as measured by the Russell Midcap® Index and the Russell 1000® Index, respectively. From a style perspective, value-oriented stocks solidly outpaced growth-oriented stocks in the large-cap and mid-cap segments of the U.S. equity market; however, growth stocks substantially outperformed value stocks in the small-cap segment of the U.S. equity market. (All as measured by the Russell Investments indices.)
3
MARKET REVIEW
International Equity Markets
European equity markets managed gains during the Reporting Period, despite a banking crisis in Cyprus and further economic contraction in the Eurozone. Strong performance by the Japanese equity market dominated returns for the Reporting Period but was partially offset by weaker returns for the Asia ex-Japan region, where such returns were exaggerated by depreciating currencies. The yen weakened to its lowest level against the U.S. dollar since mid-2009 on expectations the new head of the Bank of Japan will aggressively pursue a 2% inflation target. Japanese equities hit a five-year high during May 2013 before taking a sharp turn down with a number of other global equity markets.
In mid-May 2013, Fed Chair Bernanke announced the potential “tapering” of the pace of quantitative easing asset purchases, which led to a virtual halt in the broad global equity market rally. International equity markets reacted negatively again in June 2013 to news the slowing of the asset purchase program could begin later this year, with the program ending by the middle of 2014 if the economy grows as expected.
In China, a sharp spike in interbank lending rates in June 2013 further pressured global equity markets. Concerns that tighter monetary conditions would exacerbate an already slowing Chinese economy weakened commodity prices.
Largely as a result of concerns about slowing demand from China and its impact on commodities, the materials and energy sectors were the only sectors in the MSCI EAFE Index to post negative returns during the Reporting Period as a whole. The consumer discretionary and health care sectors posted the best performance.
Looking Ahead
In the months ahead, we expect less expensive stocks to outpace more expensive stocks. We also believe that stocks with good momentum are likely to outperform those with poor momentum. Our plan is to seek profitable companies with positive fundamentals, sustainable earnings and a track record of using capital to enhance shareholder value. To that end, we anticipate remaining fully invested, with long-term performance likely to be the result of stock selection rather than sector or capitalization allocations.
We stand behind our investment philosophy that sound economic investment principles, coupled with a disciplined quantitative approach, can provide potentially strong, uncorrelated returns over the long term. Our research agenda is robust, and we continue to enhance our existing models, add new proprietary forecasting signals and improve our trading execution as we seek to provide the most value to our shareholders.
4
MARKET REVIEW
| Changes to Quantitative Investment Strategies Team |
| After 33 years of distinguished service, Don Mulvihill, CIO of Customized Beta Strategies within the Quantitative Investment Strategies (“QIS”) team, decided to retire from the firm at the end of June 2013. Gary Chropuvka assumed Mr. Mulvihill’s role as Head of the Customized Beta Strategies business, overseeing the team’s tax-efficient, rules-based and customized beta investment strategies. Mr. Chropuvka brings extensive experience having joined QIS in 1999 with Mr. Mulvihill to manage the team’s tax-efficient investment strategies. All of Mr. Mulvihill’s direct investment responsibilities were performed within a co-lead or team leadership structure and follow processes that provide continuity in day-to-day investment decision-making in each portfolio. |
5
INVESTMENT PROCESS
What Differentiates the Goldman Sachs U.S. Equity Dividend and Premium and Goldman Sachs International Equity Dividend and Premium Funds’ Investment Process?
The Goldman Sachs U.S. Equity Dividend and Premium Fund seeks to maximize income and total return. The Goldman Sachs International Equity Dividend and Premium Fund seeks to maximize total return with an emphasis on income. Their portfolios consist primarily of large-cap, dividend-paying stocks.1 By investing in these securities, and through the use of option call writing, the Funds seek to generate an attractive after-tax cash flow.

A diversified portfolio:
| n | Create a diversified large-cap equity portfolio that participates in all industries and sectors. |
| n | Emphasize higher dividend-paying stocks within each industry and sector. |
Written call options:
| n | The Funds utilize index call writing to seek to enhance their cash flow. |

| n | We use proprietary quantitative techniques, including optimization tools, a risk model and a transactions cost model, in identifying a portfolio of stocks that we believe may enhance expected dividend yield while limiting deviations when compared to the S&P 500 Index or MSCI EAFE Index, as applicable. |

| n | A fully invested, style-consistent portfolio. |
| n | The Funds seek attractive after-tax cash flow from qualified dividends, long-term capital gains and option call writing. |
| n | The Funds seek to enhance after-tax returns by generating distributions primarily from qualified dividends and long-term capital gains. |
| 1Dividends | are not guaranteed and a company’s future ability to pay dividends may be limited. |
6
PORTFOLIO RESULTS
U.S. Equity Dividend and Premium Fund
Portfolio Management Discussion and Analysis
Below, the Goldman Sachs Quantitative Investment Strategies Team discusses the Goldman Sachs U.S. Equity Dividend and Premium Fund’s (the “Fund”) performance and positioning for the six-month period ended June 30, 2013 (the “Reporting Period”).
| Q | How did the Fund perform during the Reporting Period? |
| A | During the Reporting Period, the Fund’s Class A, C, Institutional and IR Shares generated cumulative total returns, without sales charges, of 11.06%, 10.58%, 11.30% and 11.21%, respectively. These returns compare to the 13.82% cumulative total return of the Fund’s benchmark, the Standard & Poor’s® 500 Index (with dividends reinvested) (the “S&P 500 Index”), during the same period. The Barclays U.S. Aggregate Bond Index returned -2.44%. Although the Fund does not invest in fixed income securities, maximizing income is part of the Fund’s investment objective, and therefore we believe that a comparison of the Fund’s performance to that of the Barclays U.S. Aggregate Bond Index is useful to investors. |
| Q | What key factors were most responsible for the Fund’s performance during the Reporting Period? |
| A | The sale of call options on the S&P 500 Index detracted from the Fund’s total return during the Reporting Period. (A call option is an option that gives the holder the right to buy a certain quantity of an underlying security at an agreed-upon price at any time up to an agreed-upon date.) |
| Security selection overall contributed positively to the Fund’s relative performance. The Fund benefited from its stock selection in the information technology, industrials, financials, consumer staples and energy sectors. Stock picks in the health care, telecommunication services, materials, utilities and consumer discretionary sectors dampened relative results. |
| Q | How did the Fund’s call writing affect its performance? |
| A | Consistent with our investment approach, we wrote index call options on a portion of the stock portfolio’s market value. When the Fund sells an index call option, it retains the premium it receives from the sale. However, if the purchaser exercises the option, the Fund is obligated to pay the purchaser the difference between the price of the index and the exercise price of the option. Although the Fund retains the premium it receives from the sale of the option, the premium may not exceed the difference in the value of the index as call options are exercised. This is what happened during the Reporting Period when the S&P 500 Index appreciated, and thus the Fund’s call writing detracted from performance. |
| We seek to generate a 4% annual return through the premiums received through the Fund’s call writing. In our efforts to accomplish this, we write call options covering up to 40% of the total value of the Fund’s stock portfolio. |
| Overall, call option writing tends to reduce volatility. Since its inception, the realized daily volatility of the Fund has been 20.97% compared to the realized volatility of the S&P 500 Index of 22.40%. During the Reporting Period, the realized daily volatility of the Fund was 12.12% compared to the realized volatility of the S&P 500 Index of 12.37%. |
| Q | What was the Fund’s dividend yield during the Reporting Period? |
| A | While maintaining industry and sector weights consistent with the S&P 500 Index, we favor stocks with higher dividend yields. The dividend yield of the Fund during the Reporting Period was 3.03% compared to 2.18% for the S&P 500 Index. The Fund’s dividend yield served to enhance its quarterly net income distributions. |
| Q | Among individual holdings, which stocks contributed most to the Fund’s results? |
| A | Relative to the S&P 500 Index, the Fund benefited from overweighted positions in aerospace company Lockheed Martin, technology firm Hewlett-Packard and financial services company Prudential Financial. |
7
PORTFOLIO RESULTS
| Q | Which individual stock holdings detracted significantly from relative performance during the Reporting Period? |
| A | Relative to the S&P 500 Index, the Fund’s returns were hurt by overweighted positions in mining company Southern Copper, pharmaceutical maker Pfizer and integrated communications company CenturyLink. |
| Q | How did the Fund use derivatives and similar instruments during the Reporting Period? |
| A | During the Reporting Period, we used equity index futures, on an opportunistic basis, to equitize the Fund’s excess cash holdings. In other words, we put the Fund’s excess cash holdings to work by using them as collateral for the purchase of equity index futures. Consistent with our investment approach, we also wrote equity index call options on a portion of the portfolio’s market value in an effort to generate premiums and reduce volatility. |
| Q | What changes or enhancements did you make to your quantitative model during the Reporting Period? |
| A | No material changes or enhancements were made to our quantitative model during the Reporting Period. |
8
FUND BASICS
U.S. Equity Dividend and Premium Fund
as of June 30, 2013

| PERFORMANCE REVIEW | ||||||||||||||
| January 1, 2013– June 30, 2013 | Fund Total Return (based on NAV)1 | S&P 500 Index2 | Barclays U.S. Aggregate Bond Index3 | |||||||||||
| Class A | 11.06 | % | 13.82 | % | -2.44 | % | ||||||||
| Class C | 10.58 | 13.82 | -2.44 | |||||||||||
| Institutional | 11.30 | 13.82 | -2.44 | |||||||||||
| Class IR | 11.21 | 13.82 | -2.44 | |||||||||||
| 1 | The net asset value (“NAV”) represents the net assets of the class of the Fund (ex-dividend) divided by the total number of shares of the class outstanding. The Fund’s performance reflects the reinvestment of dividends and other distributions. The Fund’s performance does not reflect the deduction of any applicable sales charges. |
| 2 | The S&P 500 Index is an unmanaged composite index of 500 common stock prices. The Index figures do not include any deduction for fees, expenses or taxes. It is not possible to invest directly in an index. |
| 3 | The Barclays U.S. Aggregate Bond Index represents an unmanaged diversified portfolio of fixed income securities, including U.S. Treasuries, investment-grade corporate bonds, and mortgage- backed and asset-backed securities. The Index figures do not reflect any deduction for fees, expenses or taxes. It is not possible to invest directly in an index. |
| STANDARDIZED TOTAL RETURNS4 | ||||||||||||||||
| For the period ended 6/30/13 | One Year | Five Years | Since Inception | Inception Date | ||||||||||||
| Class A | 8.60 | % | 5.35 | % | 4.47 | % | 8/31/05 | |||||||||
| Class C | 13.11 | 5.74 | 4.42 | 8/31/05 | ||||||||||||
| Institutional | 15.45 | 6.96 | 5.64 | 8/31/05 | ||||||||||||
| Class IR | 15.27 | N/A | 15.89 | 8/31/10 | ||||||||||||
| 4 | The Standardized Total Returns are average annual total returns as of the most recent calendar quarter-end. They assume reinvestment of all distributions at NAV. These returns reflect a maximum initial sales charge of 5.5% for Class A Shares and the assumed contingent deferred sales charge for Class C Shares (1% if redeemed within 12 months of purchase). Because Institutional and Class IR Shares do not involve a sales charge, such a charge is not applied to their Standardized Total Returns. |
The returns set forth in the tables above represent past performance. Past performance does not guarantee future results. The Fund’s investment return and principal value will fluctuate so that an investor’s shares, when redeemed, may be worth more or less than their original cost. Current performance may be lower or higher than the performance quoted above. Please visit our web site at www.goldmansachsfunds. com to obtain the most recent month-end returns. Performance reflects applicable fee waivers and/or expense limitations in effect during the periods shown. In their absence, performance would be reduced. Returns do not reflect the deduction of taxes that a shareholder would pay on Fund distributions or the redemption of Fund shares.
9
FUND BASICS
| EXPENSE RATIOS5 | ||||||||||
| Net Expense Ratio (Current) | Gross Expense Ratio (Before Waivers) | |||||||||
| Class A | 1.20 | % | 1.22 | % | ||||||
| Class C | 1.95 | 1.97 | ||||||||
| Institutional | 0.80 | 0.82 | ||||||||
| Class IR | 0.95 | 0.97 | ||||||||
| 5 | The expense ratios of the Fund, both current (net of applicable fee waivers and/or expense limitations) and before waivers (gross of applicable fee waivers and/or expense limitations) are as set forth above according to the most recent publicly available Prospectus for the Fund and may differ from the expense ratios disclosed in the Financial Highlights in this report. The Fund’s waivers and/or expense limitations will remain in place through at least April 30, 2014, and prior to such date the Investment Adviser may not terminate the arrangements without the approval of the Fund’s Board of Trustees. If these arrangements are discontinued in the future, the expense ratios may change without shareholder approval. |
| STANDARDIZED AFTER-TAX PERFORMANCE AS OF 6/30/136 | ||||||||||
| Class A Shares | One Year | Five Years | Since Inception (8/31/05) | |||||||
| Returns before taxes* | 8.60 | % | 5.35% | 4.47% | ||||||
| Returns after taxes on distributions** | 6.89 | 4.68 | 3.72 | |||||||
Returns after taxes on distributions*** and sale of Fund shares | 6.37 | 4.23 | 3.65 | |||||||
| 6 | The after-tax returns are calculated using the historically highest individual federal marginal income tax rates at the time of distributions (currently 23.8% for qualifying ordinary income dividends and long-term capital gain distributions and 43.4% for non-qualifying ordinary income dividends) and do not reflect state and local taxes. Actual after-tax returns will be calculated at calendar year-end and depend on an investor’s tax situation and may differ from those shown. In addition, the after-tax returns shown are not relevant to investors who hold Fund shares through tax-deferred arrangements such as 401(k) plans or individual retirement accounts. Under certain circumstances, the addition of the tax benefits from capital losses resulting from redemptions may cause the Returns After Taxes on Distributions and Sale of Fund Shares to be greater than the Returns After Taxes on Distributions or even Returns Before Taxes. Standardized after-tax returns assume reinvestment of all distributions at NAV and reflect a maximum initial sales charge of 5.5% for Class A Shares. |
| * | Returns Before Taxes do not reflect taxes on distributions on the Fund’s Class A Shares nor do they show how performance can be impacted by taxes when shares are redeemed. |
| ** | Returns After Taxes on Distributions assume that taxes are paid on distributions on the Fund’s Class A Shares (i.e., dividends and capital gains) but do not reflect taxes that may be incurred upon redemption of the Class A Shares at the end of the performance period. |
| *** | Returns After Taxes on Distributions and Sale of Fund Shares reflect taxes paid on distributions on the Fund’s Class A Shares and taxes applicable when the shares are redeemed. |
10
FUND BASICS
| TOP TEN HOLDINGS AS OF 6/30/137 | ||||||||
| Holding | % of Net Assets | Line of Business | ||||||
| Apple, Inc. | 3.0 | % | Technology Hardware & Equipment | |||||
| Microsoft Corp. | 3.0 | Software & Services | ||||||
| JPMorgan Chase & Co. | 2.4 | Diversified Financials | ||||||
| Pfizer, Inc. | 2.3 | Pharmaceuticals, Biotechnology & Life Sciences | ||||||
| General Electric Co. | 2.3 | Capital Goods | ||||||
| The Procter & Gamble Co. | 2.2 | Household & Personal Products | ||||||
| Cisco Systems, Inc. | 2.0 | Technology Hardware & Equipment | ||||||
| Merck & Co., Inc. | 2.0 | Pharmaceuticals, Biotechnology & Life Sciences | ||||||
| Exxon Mobil Corp. | 1.8 | Energy | ||||||
| The Home Depot, Inc. | 1.7 | Retailing | ||||||
| 7 | The top 10 holdings may not be representative of the Fund’s future investments. |
| FUND VS. BENCHMARK SECTOR ALLOCATIONS8 |
| As of June 30, 2013 |
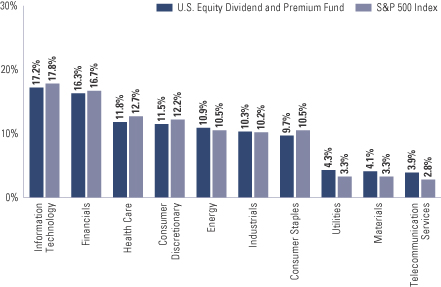
| 8 | The Fund is actively managed and, as such, its composition may differ over time. Consequently, the Fund’s overall sector allocations may differ from percentages contained in the graph above. The graph categorizes investments using Global Industry Classification Standard (“GICS”), however, the sector classifications used by the portfolio management team may differ from GICS. The percentage shown for each investment category reflects the value of investments in that category as a percentage of market value. The graph depicts the Fund’s investments but may not represent the Fund’s market exposure due to the exclusion of certain derivatives, if any, as listed in the Additional Investment Information section of the Schedule of Investments. |
11
PORTFOLIO RESULTS
International Equity Dividend and Premium Fund
Portfolio Management Discussion and Analysis
Below, the Goldman Sachs Quantitative Investment Strategies Team discusses the Goldman Sachs International Equity Dividend and Premium Fund’s (the “Fund”) performance and positioning for the six-month period ended June 30, 2013 (the “Reporting Period”).
| Q | How did the Fund perform during the Reporting Period? |
| A | During the Reporting Period, the Fund’s Class A, C, Institutional and IR Shares generated cumulative total returns, without sales charges, of 0.47%, 0.00%, 0.68% and 0.61%, respectively. These returns compare to the 4.10% cumulative total return of the Fund’s benchmark, the MSCI EAFE Index (net, unhedged, with dividends reinvested). The Barclays Global Aggregate Bond Index returned -4.83%. Although the Fund does not invest in fixed income securities, maximizing income is part of the Fund’s investment objective, and therefore we believe that a comparison of the Fund’s performance to that of the Barclays Global Aggregate Bond Index is useful to investors. |
| Q | What key factors were most responsible for the Fund’s performance during the Reporting Period? |
| A | The sale of call options detracted from the Fund’s total return during the Reporting Period. (A call option is an option that gives the holder the right to buy a certain quantity of an underlying security at an agreed-upon price at any time up to an agreed-upon date.) |
| Security selection also hampered the Fund’s relative performance. Our stock picks in the consumer staples, industrials, utilities, telecommunication services and consumer discretionary sectors dampened returns versus the MSCI EAFE Index. Stock picks in the energy, materials, information technology, financials and health care sectors added to relative results. |
| Q | How did the Fund’s call writing affect its performance? |
| A | Consistent with our investment approach, we wrote index call options on a portion of the stock portfolio’s market value, primarily on the Japanese, United Kingdom and European indices. When the Fund sells an index call option, it retains the premium it receives from the sale. However, if the purchaser exercises the option, the Fund is obligated to pay the purchaser the difference between the price of the index and the exercise price of the option. Although the Fund retains the premium it receives from the sale of the option, the premium may not exceed the difference in the value of the index as call options are exercised. This is what happened during the Reporting Period when the MSCI EAFE Index appreciated, and thus the Fund’s call writing hurt performance. |
| We seek to generate a 4% annual return through the premiums received through the Fund’s call writing. In our efforts to accomplish this, we write call options covering up to 40% of the total value of the Fund’s stock portfolio. |
| Overall, call option writing tends to reduce volatility. Since its inception, the realized daily volatility of the Fund has been 23.11% compared to the realized volatility of the MSCI EAFE Index of 24.20%. During the Reporting Period, realized daily volatility of the Fund was 13.33% compared to the realized volatility of the MSCI EAFE Index of 13.80%. |
| Q | What was the Fund’s dividend yield during the Reporting Period? |
| A | While maintaining industry and sector weights consistent with the MSCI EAFE Index, we favor stocks with higher dividend yields. The dividend yield of the Fund during the Reporting Period was 4.66% compared to 3.48% for the MSCI EAFE Index. The Fund’s dividend yield served to enhance its quarterly net income distributions. |
12
PORTFOLIO RESULTS
| Q | Which individual stock holdings detracted significantly from relative performance during the Reporting Period? |
| A | Fund performance was hampered by overweighted positions relative to the MSCI EAFE Index in Rio Tinto, a British-Australian metals and mining company; RWE, a German electric, gas and water utility; and Banco Santander, a Spanish bank holding company. |
| Q | Among individual holdings, which stocks contributed most to the Fund’s results? |
| A | Relative to the MSCI EAFE Index, the Fund benefited from overweighted positions in National Australia Bank, an international banking group based in Australia; Lonza Group, a Swiss chemicals and biotechnology company; and Mizuho Financial Group, a Japanese bank holding company. |
| Q | How did the Fund use derivatives and similar instruments during the Reporting Period? |
| A | During the Reporting Period, we used equity index futures, on an opportunistic basis, to equitize the Fund’s excess cash holdings. In other words, we put the Fund’s excess cash holdings to work by using them as collateral for the purchase of equity index futures. Consistent with our investment approach, we also wrote equity index call options on a portion of the portfolio’s market value in an effort to generate premiums and reduce volatility. |
| Q | What changes or enhancements did you make to your quantitative model during the Reporting Period? |
| A | No material changes or enhancements were made to our quantitative model during the Reporting Period. |
13
FUND BASICS
International Equity Dividend and Premium Fund
as of June 30, 2013
| PERFORMANCE REVIEW | ||||||||||||||
| January 1, 2013– June 30, 2013 | Fund Total Return (based on Nav)1 | MSCI EAFE (Net) Index (unhedged)2 | Barclays Global Aggregate Bond Index3 | |||||||||||
| Class A | 0.47 | % | 4.10 | % | -4.83 | % | ||||||||
| Class C | 0.00 | 4.10 | -4.83 | |||||||||||
| Institutional | 0.68 | 4.10 | -4.83 | |||||||||||
| Class IR | 0.61 | 4.10 | -4.83 | |||||||||||
| 1 | The net asset value (“NAV”) represents the net assets of the class of the Fund (ex-dividend) divided by the total number of shares of the class outstanding. The Fund’s performance reflects the reinvestment of dividends and other distributions. The Fund’s performance does not reflects the deduction of any applicable sales charges. |
| 2 | The MSCI EAFE Index (unhedged and net of dividend withholding taxes) is an unmanaged market capitalization-weighted composite of securities in 22 developed markets. The Index figures do not include any deduction for fees or expenses. It is not possible to invest directly in an index. |
| 3 | The Barclays Global Aggregate Bond Index represents an unmanaged diversified portfolio of fixed income securities, including U.S. Treasuries, investment-grade corporate bonds, and mortgage- backed and asset-backed securities. The Index figures do not reflect any deduction for fees, expenses or taxes. It is not possible to invest directly in an index. |
| STANDARDIZED TOTAL RETURNS4 | ||||||||||||||
| For the period ended 6/30/13 | One Year | Five Years | Since Inception | Inception Date | ||||||||||
| Class A | 7.61 | % | -2.09% | -3.05 | % | 1/31/08 | ||||||||
| Class C | 12.12 | -1.97 | -2.99 | 1/31/08 | ||||||||||
| Institutional | 14.49 | -0.86 | -1.87 | 1/31/08 | ||||||||||
| Class IR | 14.19 | NA | 5.95 | 8/31/10 | ||||||||||
| 4 | The Standardized Total Returns are average annual total returns as of the most recent calendar quarter-end. They assume reinvestment of all distributions at NAV. These returns reflect a maximum initial sales charge of 5.5% for Class A Shares and the assumed contingent deferred sales charge for Class C Shares (1% if redeemed within 12 months of purchase). Because Institutional and Class IR Shares do not involve a sales charge, such a charge is not applied to their Standardized Total Returns. |
The returns set forth in the tables above represent past performance. Past performance does not guarantee future results. The Fund’s investment return and principal value will fluctuate so that an investor’s shares, when redeemed, may be worth more or less than their original cost. Current performance may be lower or higher than the performance quoted above. Please visit our web site at www.goldmansachsfunds.com to obtain the most recent month-end returns. Performance reflects applicable fee waivers and/or expense limitations in effect during the periods shown. In their absence, performance would be reduced. Returns do not reflect the deduction of taxes that a shareholder would pay on Fund distributions or the redemption of Fund shares.
14
FUND BASICS
| EXPENSE RATIOS5 | ||||||||||
| Net Expense Ratio (Current) | Gross Expense Ratio (Before Waivers) | |||||||||
| Class A | 1.37 | % | 1.37 | % | ||||||
| Class C | 2.11 | 2.11 | ||||||||
| Institutional | 0.95 | 0.95 | ||||||||
| Class IR | 1.10 | 1.10 | ||||||||
| 5 | The expense ratios of the Fund, both current (net of applicable fee waivers and/or expense limitations) and before waivers (gross of applicable fee waivers and/or expense limitations) are as set forth above according to the most recent publicly available Prospectus for the Fund and may differ from the expense ratios disclosed in the Financial Highlights in this report. The Fund’s waivers and/or expense limitations will remain in place through at least April 30, 2014, and prior to such date the Investment Adviser may not terminate the arrangements without the approval of the Fund’s Board of Trustees. If these arrangements are discontinued in the future, the expense ratios may change without shareholder approval. |
| STANDARDIZED AFTER-TAX PERFORMANCE AS OF 6/30/136 | ||||||||||||
| Class A Shares | One Year | Five Years | Since Inception (1/31/08) | |||||||||
| Returns before taxes* | 7.61 | % | -2.09 | % | -3.05% | |||||||
| Returns after taxes on distributions** | 6.78 | -2.54 | -3.50 | |||||||||
Returns after taxes on distributions*** and sale of Fund shares | 4.95 | -1.23 | -1.91 | |||||||||
| 6 | The after-tax returns are calculated using the historically highest individual federal marginal income tax rates at the time of distributions (currently 23.8% for qualifying ordinary income dividends and long-term capital gain distributions and 43.4% for non-qualifying ordinary income dividends) and do not reflect state and local taxes. Actual after-tax returns will be calculated at calendar year-end and depend on an investor’s tax situation and may differ from those shown. In addition, the after-tax returns shown are not relevant to investors who hold Fund shares through tax-deferred arrangements such as 401(k) plans or individual retirement accounts. Under certain circumstances, the addition of the tax benefits from capital losses resulting from redemptions may cause the Returns After Taxes on Distributions and Sale of Fund Shares to be greater than the Returns After Taxes on Distributions or even Returns Before Taxes. Standardized after-tax returns assume reinvestment of all distributions at NAV and reflect a maximum initial sales charge of 5.5% for Class A Shares. |
| * | Returns Before Taxes do not reflect taxes on distributions on the Fund’s Class A Shares nor do they show how performance can be impacted by taxes when shares are redeemed. |
| ** | Returns After Taxes on Distributions assume that taxes are paid on distributions on the Fund’s Class A Shares (i.e., dividends and capital gains) but do not reflect taxes that may be incurred upon redemption of the Class A Shares at the end of the performance period. |
| *** | Returns After Taxes on Distributions and Sale of Fund Shares reflect taxes paid on distributions on the Fund’s Class A Shares and taxes applicable when the shares are redeemed. |
15
FUND BASICS
| TOP TEN HOLDINGS AS OF 6/30/137 | ||||||||
| Company | % of Net Assets | Line of Business | ||||||
| HSBC Holdings PLC | 2.8 | Banks | ||||||
| BP PLC ADR | 2.7 | Energy | ||||||
| Nestle SA (Registered) | 2.5 | Food, Beverage & Tobacco | ||||||
| Total SA | 2.4 | Energy | ||||||
| Roche Holding AG | 2.3 | Pharmaceuticals, Biotechnology & Life Sciences | ||||||
| Banco Santander SA | 2.1 | Banks | ||||||
| AstraZeneca PLC | 1.6 | Pharmaceuticals, Biotechnology & Life Sciences | ||||||
| Commonwealth Bank of | 1.5 | Banks | ||||||
| Australia | ||||||||
| Rio Tinto PLC | 1.4 | Materials | ||||||
| Swedbank AB Class A | 1.3 | Banks | ||||||
| 7 | The top 10 holdings may not be representative of the Fund’s future investments. |
| FUND VS. BENCHMARK SECTOR ALLOCATIONS8 |
| As of June 30, 2013 |
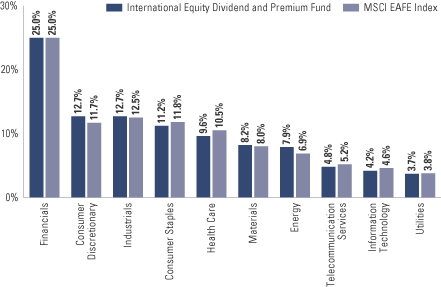
| 8 | The Fund is actively managed and, as such, its composition may differ over time. Consequently, the Fund’s overall sector allocations may differ from percentages contained in the graph above. The graph categorizes investments using Global Industry Classification Standard (“GICS”), however, the sector classifications used by the portfolio management team may differ from GICS. The percentage shown for each investment category reflects the value of investments in that category as a percentage of market value. The graph depicts the Fund’s investments but may not represent the Fund’s market exposure due to the exclusion of certain derivatives, if any, as listed in the Additional Investment Information section of the Schedule of Investments. |
16
INVESTMENT PROCESS
What Differentiates the Goldman Sachs Global Structured Tax-Management Investment Process?
In managing money for many of the world’s wealthiest taxable investors, Goldman Sachs often constructs a diversified investment portfolio around a tax-managed core. With the Goldman Sachs Structured Tax-Managed Equity Fund and Structured International Tax-Managed Equity Fund, investors can access Goldman Sachs’ tax-smart investment expertise while capitalizing on this same strategic approach to portfolio construction.
Goldman Sachs Global Structured Tax-Management Investment Process
The Goldman Sachs Global Structured Tax-Management investment process is a disciplined quantitative approach that has been consistently applied since 1989. With the Goldman Sachs Structured Tax-Managed Equity Fund and the Goldman Sachs Structured International Tax-Managed Equity Fund, the Structured investment process is enhanced with an additional layer that seeks to maximize after-tax returns.

| n | Comprehensive |
| n | Rigorous |
| n | Objective |
| n | Extensive |
| n | Fundamental |
| n | Insightful |
Advantage: Daily analysis of approximately 3,000 U.S. and international equity securities using a proprietary model.

| n | Benchmark driven |
| n | Sector and size neutral |
| n | Tax optimized |
Tax optimization is an additional layer that is built into the existing Structured investment process — a distinct advantage. While other managers may simply seek to minimize taxable distributions through a low turnover strategy, this extension of the Structured investment process seeks to maximize after-tax returns — the true objective of every taxable investor.
Advantage: Value added through stock selection — not market timing, industry rotation or style bias.

| n | A fully invested, style-consistent portfolio |
| n | Broad access to the total U.S. and international equity markets |
| n | A consistent goal of seeking to maximize after-tax risk-adjusted returns |
17
PORTFOLIO RESULTS
Structured Tax-Managed Equity Fund
Portfolio Management Discussion and Analysis
Below, the Goldman Sachs Quantitative Investment Strategies Team discusses the Goldman Sachs Structured Tax-Managed Equity Fund’s (the “Fund”) performance and positioning for the six-month period ended June 30, 2013 (the “Reporting Period”).
| Q | How did the Fund perform during the Reporting Period? |
| A | During the Reporting Period, the Fund’s Class A, B, C, Institutional, Service and IR Shares generated cumulative total returns, without sales charges, of 15.11%, 14.66%, 14.61%, 15.35%, 15.11% and 15.24%, respectively. These returns compare to the 14.06% cumulative total return of the Fund’s benchmark, the Russell 3000® Index (with dividends reinvested) (the “Index”), over the same time period. |
| Q | What key factors were most responsible for the Fund’s performance during the Reporting Period? |
| A | During the Reporting Period, the Fund outperformed the Index, largely because of our quantitative model. Security selection also added to the Fund’s relative returns during the Reporting Period. |
| Q | What impact did the Fund’s investment themes have on performance during the Reporting Period? |
| A | In keeping with our investment approach, we use our quantitative model and its six investment themes to take a long-term view of market patterns and look for inefficiencies, selecting stocks for the Fund and overweighting or underweighting the ones chosen by the model. Over time and by design, the performance of any one of the model’s investment themes tends to have a low correlation with the model’s other themes, demonstrating the diversification benefit of the Fund’s theme-driven quantitative model. The variance in performance supports our research indicating that the diversification provided by the Fund’s different investment themes is a significant investment advantage over the long term, even though the Fund may experience underperformance in the short term. Of course, diversification does not protect an investor from market risk nor does it ensure a profit. |
| During the Reporting Period, three of our six investment themes — Momentum, Valuation and Sentiment — enhanced the Fund’s relative performance. Momentum seeks to predict drifts in stock prices caused by delayed investor reaction to company-specific information and information about related companies. The Valuation theme attempts to capture potential mispricings of securities, typically by comparing a measure of the company’s intrinsic value to its market value. Sentiment reflects selected investment views and decisions of individuals and financial intermediaries. |
| Management, Profitability and Quality detracted from relative results during the Reporting Period. Our Management theme assesses the characteristics, policies and strategic decisions of company management, while Profitability assesses whether a company is earning more than its cost of capital. Quality assesses both firm and management quality. |
| Q | How did the Fund sector and industry allocations affect relative performance? |
| A | In constructing the Fund’s portfolio, we focus on picking stocks rather than on making sector or industry bets. Consequently, the Fund is similar to the Index in terms of its sector and industry allocations and its style. Changes in its sector or industry weights generally do not have a meaningful impact on relative performance. |
| Q | How successful was your stock selection during the Reporting Period? |
| A | The Fund seeks to provide investors with a tax-efficient means for maintaining broadly diversified exposure to the entire U.S. equity market, ranging from large- to small-cap stocks. During the Reporting Period, our security selection added to the Fund’s relative performance. |
| Q | Among individual holdings, which stocks contributed most to the Fund’s results? |
| A | Stock picks in the consumer staples, industrials and health care sectors contributed positively to the Fund’s relative performance during the Reporting Period. The Fund benefited from overweighted positions in chicken producer Pilgrim’s Pride; real estate information marketplace Zillow; |
18
PORTFOLIO RESULTS
and biotechnology company Vertex Pharmaceuticals. We adopted the overweight in Pilgrim’s Pride because of our positive view on Sentiment. The overweights in Zillow and Vertex Pharmaceuticals were the result of our positive views on Momentum and Profitability. |
| Q | Which individual stock holdings detracted significantly from relative performance during the Reporting Period? |
| A | Security selection in the consumer discretionary, financials and telecommunication services sectors detracted from relative performance. The Fund was hurt by overweighted positions in Greenhill & Co., an investment banking services provider; Altisource Portfolio Solutions, a real estate and mortgage portfolio management provider; and American Tower, a real estate investment trust focused on wireless and broadcast communications infrastructure. We chose to overweight Greenhill & Co. and Altisource Portfolio Solutions because of our positive views of Momentum and Profitability. Our positive view on Valuation led us to overweight American Tower. |
| Q | How did the Fund use derivatives and similar instruments during the Reporting Period? |
| A | During the Reporting Period, we did not use derivatives as part of an active management strategy to add value to the Fund’s results. However, we used equity index futures, on an opportunistic basis, to equitize the Fund’s excess cash holdings. In other words, we put the Fund’s excess cash holdings to work by using them as collateral for the purchase of equity index futures. |
| Q | What changes or enhancements did you make to your quantitative model during the Reporting Period? |
| A | We made no enhancements to our quantitative model in the first quarter of 2013. In the second calendar quarter, we implemented enhancements to our Valuation theme through the introduction of more industry-specific models, including a model tailored to the banking industry. We expect these industry-specific models to help us capture industry-specific dynamics and local knowledge while allowing us to maintain our systematic approach. |
| Q | How was the Fund positioned relative to the Index at the end of the Reporting Period? |
| A | In constructing the Fund’s portfolio, we focus on picking stocks rather than on making industry or sector bets. Consequently, the Fund is similar to the Index in terms of its sector allocation and style. That said, at the end of the Reporting Period, the Fund was modestly overweight relative to the Index in the health care, industrials, financials and energy sectors. It was underweight compared to the Index in consumer staples, information technology, utilities, materials, telecommunication services and consumer discretionary at the end of the Reporting Period. |
19
FUND BASICS
Structured Tax-Managed Equity Fund
as of June 30, 2013
| PERFORMANCE REVIEW | ||||||||||
| January 1, 2013–June 30, 2013 | Fund Total Return (based on NAV)1 | Russell 3000 Index2 | ||||||||
| Class A | 15.11 | % | 14.06 | % | ||||||
| Class B | 14.66 | 14.06 | ||||||||
| Class C | 14.61 | 14.06 | ||||||||
| Institutional | 15.35 | 14.06 | ||||||||
| Service | 15.11 | 14.06 | ||||||||
| Class IR | 15.24 | 14.06 | ||||||||
| 1 | The net asset value (“NAV”) represents the net assets of the class of the Fund (ex-dividend) divided by the total number of shares of the class outstanding. The Fund’s performance assumes the reinvestment of dividends and other distributions. The Fund’s performance does not reflect the deduction of any applicable sales charges. |
| 2 | The Russell 3000 Index (with dividends reinvested) is an unmanaged index that measures the performance of the 3,000 largest U.S. companies based on total market capitalization, which represents approximately 98% of the investable U.S. equity market. Index figures do not reflect any deduction for fees, expenses or taxes. It is not possible to invest directly in an index. |
| STANDARDIZED TOTAL RETURNS3 | ||||||||||||||
| For the period ended 6/30/13 | One Year | Five Years | Ten Years | Since Inception | Inception Date | |||||||||
| Class A | 15.46 | % | 5.00% | 6.69% | 2.18% | 4/3/00 | ||||||||
| Class B | 16.27 | 5.04 | 6.62 | 2.14 | 4/3/00 | |||||||||
| Class C | 20.21 | 5.39 | 6.49 | 1.84 | 4/3/00 | |||||||||
| Institutional | 22.57 | 6.62 | 7.73 | 3.03 | 4/3/00 | |||||||||
| Service | 22.10 | 6.09 | 7.19 | 2.52 | 4/3/00 | |||||||||
| Class IR | 22.45 | N/A | N/A | 20.29 | 8/31/10 | |||||||||
| 3 | The Standardized Total Returns are average annual total returns as of the most recent calendar quarter-end. They assume reinvestment of all distributions at NAV. These returns reflect a maximum initial sales charge of 5.5% for Class A Shares, the assumed contingent deferred sales charge for Class B Shares (5% maximum declining to 0% after six years) and the assumed contingent deferred sales charge for Class C Shares (1% if redeemed within 12 months of purchase). Because Institutional, Service and Class IR Shares do not involve a sales charge, such a charge is not applied to their Standardized Total Returns. The Fund’s Class B Shares are no longer available for purchase by new or existing shareholders (although current Class B shareholders may continue to reinvest income and capital gains distributions into Class B Shares, and Class B shareholders may continue to exchange their shares for Class B Shares of certain other Goldman Sachs Funds). |
The returns set forth in the tables above represent past performance. Past performance does not guarantee future results. The Fund’s investment return and principal value will fluctuate so that an investor’s shares, when redeemed, may be worth more or less than their original cost. Current performance may be lower or higher than the performance quoted above. Please visit our web site at www.goldmansachsfunds.com to obtain the most recent month-end returns. Performance reflects applicable fee waivers and/or expense limitations in effect during the periods shown. In their absence, performance would be reduced. Returns do not reflect the deduction of taxes that a shareholder would pay on Fund distributions or the redemption of Fund shares.
20
FUND BASICS
| EXPENSE RATIOS4 | ||||||||||
| Net Expense Ratio (Current) | Gross Expense Ratio (Before Waivers) | |||||||||
| Class A | 1.19 | % | 1.23 | % | ||||||
| Class B | 1.94 | 1.98 | ||||||||
| Class C | 1.93 | 1.97 | ||||||||
| Institutional | 0.78 | 0.82 | ||||||||
| Service | 1.28 | 1.32 | ||||||||
| Class IR | 0.93 | 0.97 | ||||||||
| 4 | The expense ratios of the Fund, both current (net of applicable fee waivers and/or expense limitations) and before waivers (gross of applicable fee waivers and/or expense limitations) are as set forth above according to the most recent publicly available Prospectus for the Fund and may differ from the expense ratios disclosed in the Financial Highlights in this report. The Fund’s waivers and/or expense limitations will remain in place through at least April 30, 2014, and prior to such date the Investment Adviser may not terminate the arrangements without the approval of the Fund’s Board of Trustees. If these arrangements are discontinued in the future, the expense ratios may change without shareholder approval. |
STANDARDIZED AFTER-TAX PERFORMANCE AS OF 6/30/135 | ||||||||||||
| Class A Shares | One Year | Five Years | Ten Years | Since Inception (4/3/00) | ||||||||
| Returns before taxes* | 15.46 | % | 5.00% | 6.69% | 2.18% | |||||||
| Returns after taxes on distributions** | 15.27 | 4.85 | 6.58 | 2.10 | ||||||||
Returns after taxes on distributions*** | 9.04 | 3.95 | 5.44 | 1.72 | ||||||||
| 5 | The after-tax returns are calculated using the historically highest individual federal marginal income tax rates at the time of distributions (currently 23.8% for qualifying ordinary income dividends and long-term capital gain distributions and 43.4% for non-qualifying ordinary income dividends) and do not reflect state and local taxes. Actual after-tax returns will be calculated at calendar year-end and depend on an investor’s tax situation and may differ from those shown. In addition, the after-tax returns shown are not relevant to investors who hold Fund shares through tax-deferred arrangements such as 401(k) plans or individual retirement accounts. Under certain circumstances, the addition of the tax benefits from capital losses resulting from redemptions may cause the Returns After Taxes on Distributions and Sale of Fund Shares to be greater than the Returns After Taxes on Distributions or even Returns Before Taxes. Standardized after-tax returns assume reinvestment of all distributions at NAV and reflect a maximum initial sales charge of 5.5% for Class A Shares. |
| * | Returns Before Taxes do not reflect taxes on distributions on the Fund’s Class A Shares nor do they show how performance can be impacted by taxes when shares are redeemed. |
| ** | Returns After Taxes on Distributions assume that taxes are paid on distributions on the Fund’s Class A Shares (i.e., dividends and capital gains) but do not reflect taxes that may be incurred upon redemption of the Class A Shares at the end of the performance period. |
| *** | Returns After Taxes on Distributions and Sale of Fund Shares reflect taxes paid on distributions on the Fund’s Class A Shares and taxes applicable when the shares are redeemed. |
21
FUND BASICS
| TOP TEN HOLDING S AS OF 6/30/136 | ||||||||
| Holding | % of Net Assets | Line of Business | ||||||
| Exxon Mobil Corp. | 2.9 | % | Energy | |||||
| Johnson & Johnson | 2.2 | Pharmaceuticals, Biotechnology & Life Sciences | ||||||
| AT&T, Inc. | 2.1 | Telecommunication Services | ||||||
| JPMorgan Chase & Co. | 2.0 | Diversified Financials | ||||||
| Pfizer, Inc. | 2.0 | Pharmaceuticals, Biotechnology & Life Sciences | ||||||
| International Business Machines Corp. | 1.9 | Software & Services | ||||||
| Google, Inc. Class A | 1.9 | Software & Services | ||||||
| Apple, Inc. | 1.9 | Technology Hardware & Equipment | ||||||
| Berkshire Hathaway, Inc. Class B | 1.6 | Insurance | ||||||
| Merck & Co., Inc. | 1.5 | Pharmaceuticals, Biotechnology & Life Sciences | ||||||
| 6 | The top 10 holdings may not be representative of the Fund’s future investments. |
| FUND VS. BENCHMARK SECTOR ALLOCATIONS7 |
| As of June 30, 2013 |
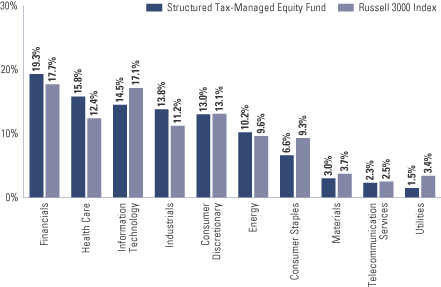
| 7 | The Fund is actively managed and, as such, its composition may differ over time. Consequently, the Fund’s overall sector allocations may differ from percentages contained in the graph above. The graph categorizes investments using Global Industry Classification Standard (“GICS”), however, the sector classifications used by the portfolio management team may differ from GICS. The percentage shown for each investment category reflects the value of investments in that category as a percentage of market value (excluding investments in the securities lending reinvestment vehicle, if any). Investments in the securities lending reinvestment vehicle represented 5.2% of the Fund’s net assets at June 30, 2013. The graph depicts the Fund’s investments but may not represent the Fund’s market exposure due to the exclusion of certain derivatives, if any, as listed in the Additional Investment Information section of the Schedule of Investments. |
22
PORTFOLIO RESULTS
Structured International Tax-Managed Equity Fund
Portfolio Management Discussion and Analysis
Below, the Goldman Sachs Quantitative Investment Strategies Team discusses the Goldman Sachs Structured International Tax-Managed Equity Fund’s (the “Fund”) performance and positioning for the six-month period ended June 30, 2013 (the “Reporting Period”).
| Q | How did the Fund perform during the Reporting Period? |
| A | During the Reporting Period, the Fund’s Class A, C, Institutional and IR Shares generated cumulative total returns, without sales charges, 4.46%, 4.11%, 4.61% and 4.44%, respectively. These returns compare to the 4.10% cumulative total return of the Fund’s benchmark, the MSCI EAFE Index (net, unhedged, with dividends reinvested) (the “Index”), during the same time period. |
| Q | What key factors were most responsible for the Fund’s performance during the Reporting Period? |
| A | During the Reporting Period, the Fund outperformed the Index, largely as a result of our quantitative model. Security selection also added to Fund’s relative returns during the Reporting Period. |
| Q | What impact did the Fund’s investment themes have on performance during the Reporting Period? |
| A | In keeping with our investment approach, we use our quantitative model and its six investment themes to take a long-term view of market patterns and look for inefficiencies, selecting stocks for the Fund and overweighting or underweighting the ones chosen by the model. Over time and by design, the performance of any one of the model’s investment themes tends to have a low correlation with the model’s other themes, demonstrating the diversification benefit of the Fund’s theme-driven quantitative model. The variance in performance supports our research indicating that the diversification provided by the Fund’s different investment themes is a significant investment advantage over the long term, even though the Fund may experience underperformance in the short term. Of course, diversification does not protect an investor from market risk nor does it ensure a profit. |
| During the Reporting Period, four of our six investment themes — Momentum, Sentiment, Valuation and Quality — contributed positively to the Fund’s relative performance. Momentum seeks to predict drifts in stock prices caused by delayed investor reaction to company-specific information and information about related companies. Sentiment reflects selected investment views and decisions of individuals and financial intermediaries, while Valuation attempts to capture potential mispricings of securities, typically by comparing a measure of the company’s intrinsic value to its market value. Our Quality theme assesses both firm and management quality. |
| The Management theme, which assesses the characteristics, policies and strategic decisions of company management, detracted from the Fund’s relative results during the Reporting Period. Profitability had a relatively neutral impact on Fund returns. Profitability assesses whether a company is earning more than its cost of capital. |
| Q | How did the Fund sector and industry allocations affect relative performance? |
| A | In constructing the Fund’s portfolio, we focus on picking stocks rather than on making sector or industry bets. Consequently, the Fund is similar to the Index in terms of its sector and industry allocations and its style. Changes in its sector or industry weights generally do not have a meaningful impact on relative performance. |
| Q | How successful was your stock selection during the Reporting Period? |
| A | The Fund seeks to provide investors with a tax-efficient means for maintaining broadly diversified exposure to the entire EAFE equity market. During the Reporting Period, security selection added to relative returns. |
| Q | Among individual holdings, which stocks contributed most to the Fund’s results? |
| A | Security selection in the financials, industrials and materials sectors contributed most positively to relative results. The Fund benefited from overweighted positions in London- headquartered easyJet Airline Company; Spanish transaction processor for the global travel and tourism industry Amadeus IT Group; and Dutch multinational banking and financial services corporation ING Groep. We chose to overweight easyJet Airline Company because of our positive views |
23
PORTFOLIO RESULTS
on Momentum and Sentiment. The Fund’s overweight in Amadeus IT Group was the result of our positive views on Profitability and Momentum. We adopted the overweight in ING Groep as a result of our positive views on Momentum and Valuation. |
| Q | Which individual stock holdings detracted significantly from relative performance during the Reporting Period? |
| A | Stock picks in the energy and utilities sectors detracted most from relative performance. The Fund was hampered by overweighted positions in Deutsche Bank, a German global banking and financial services firm; Petrofac, a U.K.-based provider of facilities services to the oil, gas and energy production and processing industries; and Enel, an Italian power company. The Fund was overweight Deutsche Bank because of our positive views on Valuation and Momentum, while we assumed the overweight in Petrofac because of our positive views on Momentum and Management. The overweight in Enel was the result of our positive views on Valuation and Management. |
| Q | How did the Fund use derivatives and similar instruments during the Reporting Period? |
| A | During the Reporting Period, we did not use derivatives as part of an active management strategy to add value to the Fund’s results. However, we used equity index futures, on an opportunistic basis, to equitize the Fund’s excess cash holdings. In other words, we put the Fund’s excess cash holdings to work by using them as collateral for the purchase of equity index futures. |
| Q | What changes or enhancements did you make to your quantitative model during the Reporting Period? |
| A | We made no enhancements to our quantitative model in the first quarter of 2013. In the second calendar quarter, we implemented enhancements to our investment themes across multiple regions. We extended our Momentum theme in Canada and the Far East by better accounting for annual cyclicality. In Japan, we improved our measure of Sentiment by identifying investment trends through natural language processing. In Europe, we implemented enhancements to our Quality theme that were previously introduced in other regions, including measures of solvency, earnings quality and capital investment. Across all regions, we expanded the Sentiment theme by incorporating elements of behavioral economics and prospect theory that should help us identify structural misvaluations within equities. |
| Q | How was the Fund positioned relative to the Index at the end of the Reporting Period? |
| A | In constructing the Fund’s portfolio, we focus on picking stocks rather than on country weightings. Consequently, the Fund is similar to the Index in terms of its sector and country allocations. That said, at the end of the Reporting Period, the Fund was overweight the consumer discretionary, health care, financials and information technology sectors. It was underweight utilities, telecommunication services, materials, industrials and energy. The Fund was relatively neutrally weighted compared to the Index in the consumer staples sector at the end of the Reporting Period. |
| At the end of the Reporting Period, the Fund was overweight relative to the Index in France, Norway, Japan, Italy and Spain. Compared to the Index, it was underweight the U.K., Germany, Switzerland, Australia, Sweden, Finland, the Netherlands, Ireland, Austria and Denmark. The Fund was relatively neutrally weighted compared to the Index in Portugal, Hong Kong, New Zealand, Singapore, Israel, Greece and Belgium at the end of the Reporting Period. |
24
FUND BASICS
Structured International Tax-Managed Equity Fund
as of June 30, 2013
| PERFORMANCE REVIEW | ||||||||||
| January 1, 2013–June 30, 2013 | Fund Total Return (based on NAV)1 | MSCI EAFE (Net) Index (unhedged)2 | ||||||||
| Class A | 4.46 | % | 4.10 | % | ||||||
| Class C | 4.11 | 4.10 | ||||||||
| Institutional | 4.61 | 4.10 | ||||||||
| Class IR | 4.44 | 4.10 | ||||||||
| 1 | The net asset value (“NAV”) represents the net assets of the class of the Fund (ex-dividend) divided by the total number of shares of the class outstanding. The Fund’s performance reflects the reinvestment of dividends and other distributions. The Fund’s performance does not reflect the deduction of any applicable sales charges. |
| 2 | The unmanaged MSCI EAFE Index (net, unhedged and net of dividend withholding taxes) is a market capitalization-weighted composite of securities in 22 developed markets. The Index figures do not include any deduction for fees or expenses. It is not possible to invest directly in an index. |
| STANDARDIZED TOTAL RETURNS3 | ||||||||||||
| For the period ended 6/30/13 | One Year | Five Years | Since Inception | Inception Date | ||||||||
| Class A | 12.55 | % | -2.90% | -3.08% | 1/31/08 | |||||||
| Class C | 17.33 | -2.54 | -2.79 | 1/31/08 | ||||||||
| Institutional | 19.60 | -1.42 | -1.68 | 1/31/08 | ||||||||
| Class IR | 19.36 | NA | 8.58 | 8/31/10 | ||||||||
| 3 | The Standardized Total Returns are average annual total returns as of the most recent calendar quarter-end. They assume reinvestment of all distributions at NAV. These returns reflect a maximum initial sales charge of 5.5% for Class A Shares and the assumed contingent deferred sales charge for Class C Shares (1% if redeemed within 12 months of purchase). Because Institutional and Class IR Shares do not involve a sales charge, such a charge is not applied to their Standardized Total Returns. |
The returns set forth in the tables above represent past performance. Past performance does not guarantee future results. The Fund’s investment return and principal value will fluctuate so that an investor’s shares, when redeemed, may be worth more or less than their original cost. Current performance may be lower or higher than the performance quoted above. Please visit our web site at www.goldmansachsfunds.com to obtain the most recent month-end returns. Performance reflects applicable fee waivers and/or expense limitations in effect during the periods shown. In their absence, performance would be reduced. Returns do not reflect the deduction of taxes that a shareholder would pay on Fund distributions or the redemption of Fund shares.
25
FUND BASICS
| EXPENSE RATIOS4 | ||||||||||
| Net Expense Ratio (Current) | Gross Expense Ratio (Before Waivers) | |||||||||
| Class A | 1.40 | % | 1.59 | % | ||||||
| Class C | 2.11 | 2.30 | ||||||||
| Institutional | 0.98 | 1.17 | ||||||||
| Class IR | 1.17 | 1.36 | ||||||||
| 4 | The expense ratios of the Fund, both current (net of applicable fee waivers and/or expense limitations) and before waivers (gross of applicable fee waivers and/or expense limitations) are as set forth above according to the most recent publicly available Prospectus for the Fund and may differ from the expense ratios disclosed in the Financial Highlights in this report. The Fund’s waivers and/or expense limitations will remain in place through at least April 30, 2014, and prior to such date the Investment Adviser may not terminate the arrangements without the approval of the Fund’s Board of Trustees. If these arrangements are discontinued in the future, the expense ratios may change without shareholder approval. |
| STANDARDIZED AFTER-TAX PERFORMANCE AS OF 6/30/135 | ||||||||||
| Class A Shares | One Year | Five Years | Since Inception (1/31/08) | |||||||
| Returns before taxes* | 12.55 | % | -2.90% | -3.08% | ||||||
| Returns after taxes on distributions** | 12.13 | -3.16 | -3.31 | |||||||
Returns after taxes on distributions*** | 7.75 | -2.00 | -2.14 | |||||||
| 5 | The after-tax returns are calculated using the historically highest individual federal marginal income tax rates at the time of distributions (currently 23.8% for qualifying ordinary income dividends and long-term capital gain distributions and 43.4% for non-qualifying ordinary income dividends) and do not reflect state and local taxes. Actual after-tax returns will be calculated at calendar year-end and depend on an investor’s tax situation and may differ from those shown. In addition, the after-tax returns shown are not relevant to investors who hold Fund shares through tax-deferred arrangements such as 401(k) plans or individual retirement accounts. Under certain circumstances, the addition of the tax benefits from capital losses resulting from redemptions may cause the Returns After Taxes on Distributions and Sale of Fund Shares to be greater than the Returns After Taxes on Distributions or even Returns Before Taxes. Standardized after-tax returns assume reinvestment of all distributions at NAV and reflect a maximum initial sales charge of 5.5% for Class A Shares. |
| * | Returns Before Taxes do not reflect taxes on distributions on the Fund’s Class A Shares nor do they show how performance can be impacted by taxes when shares are redeemed. |
| ** | Returns After Taxes on Distributions assume that taxes are paid on distributions on the Fund’s Class A Shares (i.e., dividends and capital gains) but do not reflect taxes that may be incurred upon redemption of the Class A Shares at the end of the performance period. |
| *** | Returns After Taxes on Distributions and Sale of Fund Shares reflect taxes paid on distributions on the Fund’s Class A Shares and taxes applicable when the shares are redeemed. |
26
FUND BASICS
| TOP TEN HOLDINGS AS OF 6/30/136 | ||||||||
| Holding | % of Total Net Assets | Line of Business | ||||||
| Sanofi | 2.0 | % | Pharmaceuticals, Biotechnology & Life Sciences | |||||
| GlaxoSmithKline PLC ADR | 1.8 | Pharmaceuticals, Biotechnology & Life Sciences | ||||||
| Amadeus IT Holding SA Class A | 1.7 | Software & Services | ||||||
| Legrand SA | 1.7 | Capital Goods | ||||||
| British American Tobacco PLC | 1.6 | Food, Beverage & Tobacco | ||||||
| BASF SE | 1.5 | Materials | ||||||
| SES SA FDR | 1.5 | Media | ||||||
| Nordea Bank AB | 1.5 | Banks | ||||||
| Compagnie Generale des | 1.4 | Automobiles & Components | ||||||
| Etablissements Michelin Class B | ||||||||
| HSBC Holdings PLC | 1.4 | Banks | ||||||
| 6 | The top 10 holdings may not be representative of the Fund’s future investments. |
| FUND VS. BENCHMARK SECTOR ALLOCATIONS7 |
| As of June 30, 2013 |
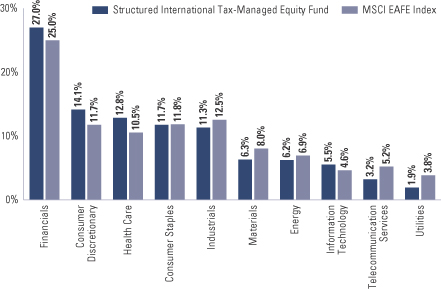
| 7 | The Fund is actively managed and, as such, its composition may differ over time. Consequently, the Fund’s overall sector allocations may differ from percentages contained in the graph above. The graph categorizes investments using Global Industry Classification Standard (“GICS”), however, the sector classifications used by the portfolio management team may differ from GICS. The percentage shown for each investment category reflects the value of investments in that category as a percentage of market value (excluding investments in the securities lending reinvestment vehicle, if any). Investments in the securities lending reinvestment vehicle represented 0.1% of the Fund’s net assets at June 30, 2013. The graph depicts the Fund’s investments but may not represent the Fund’s market exposure due to the exclusion of certain derivatives, if any, as listed in the Additional Investment Information section of the Schedule of Investments. |
27
GOLDMAN SACHS U.S. EQUITY DIVIDEND AND PREMIUM FUND
Schedule of Investments
June 30, 2013 (Unaudited)
| Shares | Description | Value | ||||||
| Common Stocks – 98.2% | ||||||||
| Automobiles & Components – 2.0% | ||||||||
| 1,164,600 | Ford Motor Co. | $ | 18,016,362 | |||||
| 199,800 | Johnson Controls, Inc. | 7,150,842 | ||||||
|
| |||||||
| 25,167,204 | ||||||||
|
| |||||||
| Banks – 3.8% | ||||||||
| 264,301 | First Niagara Financial Group, Inc. | 2,661,512 | ||||||
| 136,200 | Hudson City Bancorp, Inc. | 1,247,592 | ||||||
| 1,053,900 | New York Community Bancorp, Inc. | 14,754,600 | ||||||
| 783,800 | Valley National Bancorp | 7,422,586 | ||||||
| 516,300 | Wells Fargo & Co.(a) | 21,307,701 | ||||||
|
| |||||||
| 47,393,991 | ||||||||
|
| |||||||
| Capital Goods – 7.6% | ||||||||
| 67,300 | 3M Co. | 7,359,255 | ||||||
| 118,300 | Caterpillar, Inc. | 9,758,567 | ||||||
| 37,300 | Deere & Co. | 3,030,625 | ||||||
| 118,100 | Eaton Corp. PLC | 7,772,161 | ||||||
| 231,200 | Emerson Electric Co. | 12,609,648 | ||||||
| 7,700 | GATX Corp. | 365,211 | ||||||
| 1,231,150 | General Electric Co.(b) | 28,550,369 | ||||||
| 34,700 | Honeywell International, Inc. | 2,753,098 | ||||||
| 6,000 | Hubbell, Inc. Class B | 594,000 | ||||||
| 158,500 | Lockheed Martin Corp. | 17,190,910 | ||||||
| 53,000 | The Boeing Co.(a) | 5,429,320 | ||||||
|
| |||||||
| 95,413,164 | ||||||||
|
| |||||||
| Commercial & Professional Services – 1.4% | ||||||||
| 16,000 | Manpowergroup, Inc. | 876,800 | ||||||
| 541,200 | Pitney Bowes, Inc. | 7,944,816 | ||||||
| 663,800 | R.R. Donnelley & Sons Co. | 9,299,838 | ||||||
|
| |||||||
| 18,121,454 | ||||||||
|
| |||||||
| Consumer Durables & Apparel – 0.5% | ||||||||
| 48,400 | Garmin Ltd. | 1,750,144 | ||||||
| 33,600 | NIKE, Inc. Class B | 2,139,648 | ||||||
| 110,300 | PulteGroup, Inc.* | 2,092,391 | ||||||
|
| |||||||
| 5,982,183 | ||||||||
|
| |||||||
| Consumer Services – 3.2% | ||||||||
| 185,100 | Carnival Corp. | 6,347,079 | ||||||
| 166,600 | Las Vegas Sands Corp. | 8,818,138 | ||||||
| 68,300 | McDonald’s Corp. | 6,761,700 | ||||||
| 127,300 | Starwood Hotels & Resorts Worldwide, Inc. | 8,044,087 | ||||||
| 78,000 | Wynn Resorts Ltd. | 9,984,000 | ||||||
|
| |||||||
| 39,955,004 | ||||||||
|
| |||||||
| Diversified Financials – 6.1% | ||||||||
| 89,300 | Ameriprise Financial, Inc. | 7,222,584 | ||||||
| 972,581 | Bank of America Corp. | 12,507,392 | ||||||
| 59,700 | BlackRock, Inc. | 15,333,945 | ||||||
| 40,400 | Capital One Financial Corp. | 2,537,524 | ||||||
| 215,000 | Federated Investors, Inc. Class B | 5,893,150 | ||||||
|
| |||||||
| Common Stocks – (continued) | ||||||||
| Diversified Financials – (continued) | ||||||||
| 570,800 | JPMorgan Chase & Co. | $ | 30,132,532 | |||||
| 116,700 | The Bank of New York Mellon Corp. | 3,273,435 | ||||||
|
| |||||||
| 76,900,562 | ||||||||
|
| |||||||
| Energy – 10.7% | ||||||||
| 171,700 | Chevron Corp.(b) | 20,318,978 | ||||||
| 316,400 | ConocoPhillips | 19,142,200 | ||||||
| 251,500 | Exxon Mobil Corp.(a) | 22,723,025 | ||||||
| 26,900 | Golar LNG Ltd. | 857,841 | ||||||
| 390,600 | Kinder Morgan, Inc. | 14,901,390 | ||||||
| 162,600 | Occidental Petroleum Corp. | 14,508,798 | ||||||
| 175,600 | Schlumberger Ltd. | 12,583,496 | ||||||
| 443,200 | Spectra Energy Corp. | 15,272,672 | ||||||
| 444,300 | The Williams Companies, Inc. | 14,426,421 | ||||||
|
| |||||||
| 134,734,821 | ||||||||
|
| |||||||
| Food & Staples Retailing – 2.1% | ||||||||
| 82,200 | Costco Wholesale Corp.(a) | 9,088,854 | ||||||
| 181,500 | CVS Caremark Corp. | 10,378,170 | ||||||
| 87,700 | Wal-Mart Stores, Inc. | 6,532,773 | ||||||
|
| |||||||
| 25,999,797 | ||||||||
|
| |||||||
| Food, Beverage & Tobacco – 4.9% | ||||||||
| 533,800 | Altria Group, Inc. | 18,677,662 | ||||||
| 27,500 | Hillshire Brands Co. | 909,700 | ||||||
| 179,400 | Kellogg Co. | 11,522,862 | ||||||
| 241,800 | Kraft Foods Group, Inc. | 13,509,366 | ||||||
| 141,400 | PepsiCo, Inc. | 11,565,106 | ||||||
| 35,300 | Philip Morris International, Inc. | 3,057,686 | ||||||
| 53,700 | The Coca-Cola Co.(a) | 2,153,907 | ||||||
|
| |||||||
| 61,396,289 | ||||||||
|
| |||||||
| Health Care Equipment & Services – 3.1% | ||||||||
| 202,500 | Baxter International, Inc. | 14,027,175 | ||||||
| 104,900 | HCA Holdings, Inc. | 3,782,694 | ||||||
| 279,100 | Medtronic, Inc. | 14,365,277 | ||||||
| 7,900 | Omnicare, Inc. | 376,909 | ||||||
| 6,500 | Teleflex, Inc. | 503,685 | ||||||
| 92,300 | UnitedHealth Group, Inc. | 6,043,804 | ||||||
|
| |||||||
| 39,099,544 | ||||||||
|
| |||||||
| Household & Personal Products – 2.6% | ||||||||
| 29,800 | Church & Dwight Co., Inc. | 1,838,958 | ||||||
| 32,600 | Kimberly-Clark Corp. | 3,166,764 | ||||||
| 357,700 | The Procter & Gamble Co.(a) | 27,539,323 | ||||||
|
| |||||||
| 32,545,045 | ||||||||
|
| |||||||
| Insurance – 4.7% | ||||||||
| 118,400 | Aflac, Inc.(a) | 6,881,408 | ||||||
| 168,000 | Mercury General Corp. | 7,385,280 | ||||||
| 304,400 | MetLife, Inc. | 13,929,344 | ||||||
| 971,600 | Old Republic International Corp.(a) | 12,504,492 | ||||||
|
| |||||||
| 28 | The accompanying notes are an integral part of these financial statements. |
GOLDMAN SACHS U.S. EQUITY DIVIDEND AND PREMIUM FUND
| Shares | Description | Value | ||||||
| Common Stocks – (continued) | ||||||||
| Insurance – (continued) | ||||||||
| 202,900 | Prudential Financial, Inc. | $ | 14,817,787 | |||||
| 59,200 | StanCorp Financial Group, Inc. | 2,925,072 | ||||||
|
| |||||||
| 58,443,383 | ||||||||
|
| |||||||
| Materials – 4.0% | ||||||||
| 536,600 | Freeport-McMoRan Copper & Gold, Inc. | 14,815,526 | ||||||
| 80,800 | International Paper Co. | 3,580,248 | ||||||
| 106,400 | LyondellBasell Industries NV Class A | 7,050,064 | ||||||
| 43,800 | Newmont Mining Corp. | 1,311,810 | ||||||
| 12,300 | Packaging Corp. of America | 602,208 | ||||||
| 255,957 | Southern Copper Corp. | 7,069,532 | ||||||
| 496,700 | The Dow Chemical Co. | 15,978,839 | ||||||
|
| |||||||
| 50,408,227 | ||||||||
|
| |||||||
| Media – 2.3% | ||||||||
| 390,200 | Cablevision Systems Corp. Class A | 6,563,164 | ||||||
| 216,700 | Comcast Corp. Class A | 9,075,396 | ||||||
| 32,600 | DISH Network Corp. Class A | 1,386,152 | ||||||
| 215,300 | Thomson Reuters Corp. | 7,012,321 | ||||||
| 95,300 | Time Warner, Inc. | 5,510,246 | ||||||
|
| |||||||
| 29,547,279 | ||||||||
|
| |||||||
| Pharmaceuticals, Biotechnology & Life Sciences – 8.5% | ||||||||
| 218,200 | AbbVie, Inc. | 9,020,388 | ||||||
| 49,500 | Agilent Technologies, Inc. | 2,116,620 | ||||||
| 63,400 | Amgen, Inc. | 6,255,044 | ||||||
| 339,700 | Eli Lilly & Co. | 16,686,064 | ||||||
| 154,200 | Gilead Sciences, Inc.* | 7,896,582 | ||||||
| 114,400 | Johnson & Johnson | 9,822,384 | ||||||
| 538,250 | Merck & Co., Inc. | 25,001,713 | ||||||
| 1,032,500 | Pfizer, Inc.(a) | 28,920,325 | ||||||
| 3,700 | Regeneron Pharmaceuticals, Inc.* | 832,056 | ||||||
|
| |||||||
| 106,551,176 | ||||||||
|
| |||||||
| Real Estate Investment Trust – 1.5% | ||||||||
| 77,701 | Duke Realty Corp. | 1,211,364 | ||||||
| 16,600 | Extra Space Storage, Inc. | 696,038 | ||||||
| 142,101 | Prologis, Inc. | 5,360,029 | ||||||
| 57,101 | Ventas, Inc. | 3,966,227 | ||||||
| 33,100 | Vornado Realty Trust | 2,742,335 | ||||||
| 152,800 | Weyerhaeuser Co. | 4,353,272 | ||||||
|
| |||||||
| 18,329,265 | ||||||||
|
| |||||||
| Retailing – 3.3% | ||||||||
| 56,200 | L Brands, Inc. | 2,767,850 | ||||||
| 144,000 | Lowe’s Companies, Inc. | 5,889,600 | ||||||
| 138,500 | Macy’s, Inc. | 6,648,000 | ||||||
| 27,300 | Target Corp. | 1,879,878 | ||||||
| 55,700 | The Gap, Inc. | 2,324,361 | ||||||
| 275,600 | The Home Depot, Inc. | 21,350,732 | ||||||
|
| |||||||
| 40,860,421 | ||||||||
|
| |||||||
| Common Stocks – (continued) | ||||||||
| Semiconductors & Semiconductor Equipment – 3.4% | ||||||||
| 162,900 | Analog Devices, Inc. | $ | 7,340,274 | |||||
| 484,200 | Applied Materials, Inc. | 7,219,422 | ||||||
| 802,700 | Intel Corp. | 19,441,394 | ||||||
| 111,500 | Maxim Integrated Products, Inc. | 3,097,470 | ||||||
| 134,700 | Microchip Technology, Inc. | 5,017,575 | ||||||
|
| |||||||
| 42,116,135 | ||||||||
|
| |||||||
| Software & Services – 7.0% | ||||||||
| 160,000 | Accenture PLC Class A | 11,513,600 | ||||||
| 149,800 | Automatic Data Processing, Inc. | 10,315,228 | ||||||
| 318,100 | CA, Inc. | 9,107,203 | ||||||
| 80,700 | Compuware Corp. | 835,245 | ||||||
| 84,100 | eBay, Inc.* | 4,349,652 | ||||||
| 7,500 | Google, Inc. Class A* | 6,602,775 | ||||||
| 32,700 | International Business Machines Corp. | 6,249,297 | ||||||
| 26,100 | Lender Processing Services, Inc. | 844,335 | ||||||
| 1,095,150 | Microsoft Corp.(a)(b) | 37,815,529 | ||||||
| 10,100 | NetSuite, Inc.* | 926,574 | ||||||
|
| |||||||
| 88,559,438 | ||||||||
|
| |||||||
| Technology Hardware & Equipment – 6.4% | ||||||||
| 96,500 | Apple, Inc.(a)(b) | 38,221,720 | ||||||
| 1,035,700 | Cisco Systems, Inc. | 25,177,867 | ||||||
| 53,900 | Diebold, Inc. | 1,815,891 | ||||||
| 409,200 | Hewlett-Packard Co. | 10,148,160 | ||||||
| 39,300 | Lexmark International, Inc. Class A | 1,201,401 | ||||||
| 169,700 | Molex, Inc. Class A | 4,218,742 | ||||||
|
| |||||||
| 80,783,781 | ||||||||
|
| |||||||
| Telecommunication Services – 3.9% | ||||||||
| 598,428 | AT&T, Inc.(a)(b) | 21,184,351 | ||||||
| 412,200 | CenturyLink, Inc. | 14,571,270 | ||||||
| 1,530,101 | Frontier Communications Corp. | 6,196,909 | ||||||
| 845,400 | Windstream Corp. | 6,518,034 | ||||||
|
| |||||||
| 48,470,564 | ||||||||
|
| |||||||
| Transportation – 1.0% | ||||||||
| 10,500 | Con-way, Inc. | 409,080 | ||||||
| 167,800 | CSX Corp. | 3,891,282 | ||||||
| 5,300 | J.B. Hunt Transport Services, Inc. | 382,872 | ||||||
| 43,900 | Union Pacific Corp. | 6,772,892 | ||||||
| 20,300 | United Parcel Service, Inc. Class B | 1,755,544 | ||||||
|
| |||||||
| 13,211,670 | ||||||||
|
| |||||||
| Utilities – 4.2% | ||||||||
| 75,600 | Ameren Corp. | 2,603,664 | ||||||
| 50,300 | Dominion Resources, Inc. | 2,858,046 | ||||||
| 224,700 | Duke Energy Corp. | 15,167,250 | ||||||
| 44,100 | Entergy Corp. | 3,072,888 | ||||||
| 198,900 | Exelon Corp. | 6,142,032 | ||||||
| 322,000 | FirstEnergy Corp. | 12,023,480 | ||||||
|
| |||||||
| The accompanying notes are an integral part of these financial statements. | 29 |
GOLDMAN SACHS U.S. EQUITY DIVIDEND AND PREMIUM FUND
Schedule of Investments (continued)
June 30, 2013 (Unaudited)
| Shares | Description | Value | ||||||
| Common Stocks – (continued) | ||||||||
| Utilities – (continued) | ||||||||
| 459,900 | TECO Energy, Inc. | $ | 7,905,681 | |||||
| 79,500 | The Southern Co. | 3,508,335 | ||||||
|
| |||||||
| 53,281,376 | ||||||||
|
| |||||||
| TOTAL INVESTMENTS – 98.2% | ||||||||
| (Cost $1,170,796,645) | $ | 1,233,271,773 | ||||||
|
| |||||||
|
| OTHER ASSETS IN EXCESS OF LIABILITIES – 1.8% | 22,286,471 | ||||||
|
| |||||||
| NET ASSETS – 100.0% | $ | 1,255,558,244 | ||||||
|
| |||||||
| The percentage shown for each investment category reflects the value of investments in that category as a percentage of net assets. | ||
* | Non-income producing security. | |
(a) | All or a portion of this security is held as collateral for call options written. | |
(b) | All or a portion of security is segregated as collateral for initial margin requirements on futures transactions. | |
| ADDITIONAL INVESTMENT INFORMATION |
FUTURES CONTRACTS — At June 30, 2013, the Fund had the following futures contracts:
| Type | Number of Contracts Long (Short) | Expiration Date | Current Value | Unrealized Gain (Loss) | ||||||
S&P 500 E-mini Index | 312 | September 2013 | $24,949,080 | $ | 51,409 | |||||
WRITTEN OPTIONS CONTRACTS — At June 30, 2013, the Fund had the following written options:
| Call Options | Number of Contracts | Exercise Rate | Expiration Month | Value | ||||||||||
S&P 500 Index | 3,156 | $ | 1,610 | September 2013 | $ | (14,517,600 | ) | |||||||
(Premiums Received $11,992,800) | ||||||||||||||
For the six months ended June 30, 2013, the Fund had the following written options activity:
| Number of Contracts | Premiums Received | |||||||
Contracts Outstanding December 31, 2012 | 3,101 | $ | 8,772,729 | |||||
Contracts written | 6,441 | 21,273,930 | ||||||
Contracts bought to close | (6,386 | ) | (18,053,859 | ) | ||||
Contracts Outstanding June 30, 2013 | 3,156 | $11,992,800 | ||||||
| 30 | The accompanying notes are an integral part of these financial statements. |
GOLDMAN SACHS INTERNATIONAL EQUITY DIVIDEND AND PREMIUM FUND
Schedule of Investments
June 30, 2013 (Unaudited)
Shares | Description | Value | ||||||
| Common Stocks – 96.5% | ||||||||
| Australia – 8.0% | ||||||||
| 4,429 | Australia & New Zealand Banking Group Ltd. (Banks) | $ | 114,952 | |||||
| 64,163 | Bendigo and Adelaide Bank Ltd. (Banks) | 588,362 | ||||||
| 130,867 | BHP Billiton Ltd. (Materials) | 3,766,721 | ||||||
| 88,939 | Commonwealth Bank of Australia (Banks) | 5,598,363 | ||||||
| 460,363 | Dexus Property Group (REIT) | 448,946 | ||||||
| 157,650 | Federation Centres Ltd. (REIT) | 341,678 | ||||||
| 328,641 | GPT Group (REIT) | 1,153,964 | ||||||
| 273,837 | Iluka Resources Ltd. (Materials) | 2,467,846 | ||||||
| 1,131,767 | Metcash Ltd. (Food & Staples Retailing) | 3,630,710 | ||||||
| 90,430 | National Australia Bank Ltd. (Banks) | 2,446,128 | ||||||
| 92,559 | Origin Energy Ltd. (Energy) | 1,060,669 | ||||||
| 6,016 | Rio Tinto Ltd. (Materials) | 288,136 | ||||||
| 844,588 | Tatts Group Ltd. (Consumer Services) | 2,439,739 | ||||||
| 184,405 | Telstra Corp. Ltd. (Telecommunication Services) | 804,449 | ||||||
| 297,418 | Toll Holdings Ltd. (Transportation) | 1,439,468 | ||||||
| 142,954 | Westpac Banking Corp. (Banks) | 3,753,241 | ||||||
|
| |||||||
| 30,343,372 | ||||||||
|
| |||||||
| Belgium – 1.7% | ||||||||
| 45,353 | Anheuser-Busch InBev NV (Food, Beverage & Tobacco)(a) | 4,083,276 | ||||||
| 49,812 | Belgacom SA (Telecommunication Services) | 1,115,297 | ||||||
| 7,851 | Delhaize Group SA (Food & Staples Retailing) | 485,368 | ||||||
| 13,433 | Telenet Group Holding NV (Media) | 616,523 | ||||||
| 4,914 | Umicore SA (Materials) | 204,053 | ||||||
|
| |||||||
| 6,504,517 | ||||||||
|
| |||||||
| China – 0.3% | ||||||||
| 33,000 | AAC Technologies Holdings, Inc. (Technology Hardware & Equipment) | 186,358 | ||||||
| 1,635,000 | Yangzijiang Shipbuilding Holdings Ltd. Class H (Capital Goods) | 1,067,138 | ||||||
|
| |||||||
| 1,253,496 | ||||||||
|
| |||||||
| Denmark – 0.5% | ||||||||
| 10,740 | Novo Nordisk A/S Class B (Pharmaceuticals, Biotechnology & Life Sciences) | 1,669,667 | ||||||
|
| |||||||
| Finland – 1.8% | ||||||||
| 29,669 | Elisa Oyj (Telecommunication Services) | 579,666 | ||||||
| 4,556 | Kesko Oyj Class B (Food & Staples Retailing) | 126,562 | ||||||
| 54,361 | Metso Oyj (Capital Goods) | 1,841,365 | ||||||
| 632,069 | Nokia Oyj (Technology Hardware & Equipment)* | 2,356,315 | ||||||
| 67,853 | Orion Oyj Class B (Pharmaceuticals, Biotechnology & Life Sciences) | 1,589,935 | ||||||
|
| |||||||
| Common Stocks – (continued) | ||||||||
| Finland – (continued) | ||||||||
| 4,928 | Pohjola Bank PLC Class A (Diversified Financials) | $ | 72,420 | |||||
|
| |||||||
| 6,566,263 | ||||||||
|
| |||||||
| France – 8.5% | ||||||||
| 4,925 | Casino Guichard Perrachon SA (Food & Staples Retailing) | 461,429 | ||||||
| 38,286 | CNP Assurances (Insurance) | 549,712 | ||||||
| 37,638 | Compagnie de Saint-Gobain (Capital Goods) | 1,525,094 | ||||||
| 5,124 | Essilor International SA (Health Care Equipment & Services) | 545,900 | ||||||
| 217,745 | France Telecom SA (Telecommunication Services)(a) | 2,061,916 | ||||||
| 60,680 | GDF Suez (Utilities) | 1,190,228 | ||||||
| 11,273 | Imerys SA (Materials) | 692,157 | ||||||
| 9,504 | Lafarge SA (Materials) | 584,400 | ||||||
| 13,410 | L’Oreal SA (Household & Personal Products) | 2,204,396 | ||||||
| 11,045 | LVMH Moet Hennessy Louis Vuitton SA (Consumer Durables & Apparel) | 1,793,205 | ||||||
| 12,785 | Pernod-Ricard SA (Food, Beverage & Tobacco) | 1,419,058 | ||||||
| 11,133 | Peugeot SA (Automobiles & Components)* | 91,825 | ||||||
| 30,201 | Rexel SA (Capital Goods) | 680,452 | ||||||
| 13,851 | Safran SA (Capital Goods) | 723,111 | ||||||
| 25,079 | Sanofi (Pharmaceuticals, Biotechnology & Life Sciences) | 2,592,682 | ||||||
| 23,946 | Schneider Electric SA (Capital Goods) | 1,739,120 | ||||||
| 12,440 | Societe Generale SA (Banks) | 428,129 | ||||||
| 185,622 | Total SA (Energy)(a) | 9,066,373 | ||||||
| 6,018 | Unibail-Rodamco SE (REIT) | 1,401,624 | ||||||
| 113,132 | Vivendi SA (Telecommunication Services)(a) | 2,144,035 | ||||||
|
| |||||||
| 31,894,846 | ||||||||
|
| |||||||
| Germany – 7.2% | ||||||||
| 23,821 | BASF SE (Materials) | 2,124,680 | ||||||
| 13,518 | Bayer AG (Registered) (Pharmaceuticals, Biotechnology & Life Sciences) | 1,439,270 | ||||||
| 34,003 | Bayerische Motoren Werke AG (Automobiles & Components) | 2,967,655 | ||||||
| 8,001 | Daimler AG (Registered) (Automobiles & Components)(a) | 483,012 | ||||||
| 100,647 | Deutsche Post AG (Registered) (Transportation) | 2,497,862 | ||||||
| 240,712 | Deutsche Telekom AG (Registered) (Telecommunication Services) | 2,804,429 | ||||||
| 86,179 | E.ON SE (Utilities) | 1,412,359 | ||||||
| 21,131 | Hugo Boss AG (Consumer Durables & Apparel) | 2,323,548 | ||||||
| 50,230 | K+S AG (Registered) (Materials) | 1,856,357 | ||||||
| 122,773 | RWE AG (Utilities)(a) | 3,913,762 | ||||||
| 25,825 | SAP AG (Software & Services) | 1,885,820 | ||||||
|
| |||||||
| The accompanying notes are an integral part of these financial statements. | 31 |
GOLDMAN SACHS INTERNATIONAL EQUITY DIVIDEND AND PREMIUM FUND
Schedule of Investments (continued)
June 30, 2013 (Unaudited)
Shares | Description | Value | ||||||
| Common Stocks – (continued) | ||||||||
| Germany – (continued) | ||||||||
| 33,145 | Siemens AG (Registered) (Capital Goods)(a) | $ | 3,356,381 | |||||
| 8,224 | Suedzucker AG (Food, Beverage & Tobacco) | 254,610 | ||||||
|
| |||||||
| 27,319,745 | ||||||||
|
| |||||||
| Hong Kong – 3.0% | ||||||||
| 70,400 | AIA Group Ltd. (Insurance) | 296,595 | ||||||
| 593,000 | BOC Hong Kong Holdings Ltd. (Banks) | 1,814,039 | ||||||
| 119,000 | Cathay Pacific Airways Ltd. (Transportation) | 207,078 | ||||||
| 30,000 | Cheung Kong Infrastructure Holdings Ltd. (Utilities) | 199,901 | ||||||
| 75,000 | Galaxy Entertainment Group Ltd. (Consumer Services)* | 364,308 | ||||||
| 112,000 | Hang Lung Properties Ltd. (Real Estate) | 387,949 | ||||||
| 64,400 | Hang Seng Bank Ltd. (Banks) | 948,394 | ||||||
| 154,000 | Henderson Land Development Co. Ltd. (Real Estate) | 914,587 | ||||||
| 168,100 | Hong Kong & China Gas Co. Ltd. (Utilities) | 410,174 | ||||||
| 47,200 | Hong Kong Exchanges and Clearing Ltd. (Diversified Financials) | 708,915 | ||||||
| 24,500 | Hopewell Holdings Ltd. (Capital Goods) | 81,314 | ||||||
| 27,000 | Hysan Development Co. Ltd. (Real Estate) | 116,563 | ||||||
| 36,500 | Kerry Properties Ltd. (Real Estate) | 142,293 | ||||||
| 252,000 | Li & Fung Ltd. (Consumer Durables & Apparel) | 343,473 | ||||||
| 58,000 | MGM China Holdings Ltd. (Consumer Services) | 153,912 | ||||||
| 92,000 | MTR Corp. Ltd. (Transportation) | 338,083 | ||||||
| 133,302 | New World Development Co. Ltd. (Real Estate) | 183,101 | ||||||
| 10,620 | Noble Group Ltd. (Capital Goods) | 8,076 | ||||||
| 23,500 | Orient Overseas International Ltd. (Transportation) | 150,531 | ||||||
| 115,500 | Power Assets Holdings Ltd. (Utilities) | 994,224 | ||||||
| 242,400 | Sands China Ltd. (Consumer Services) | 1,132,752 | ||||||
| 155,261 | Sino Land Co. Ltd. (Real Estate) | 217,082 | ||||||
| 58,200 | Swire Properties Ltd. (Real Estate) | 171,344 | ||||||
| 112,000 | Wharf Holdings Ltd. (Real Estate) | 934,799 | ||||||
|
| |||||||
| 11,219,487 | ||||||||
|
| |||||||
| Israel – 0.6% | ||||||||
| 178,535 | Bezeq Israeli Telecommunication Corp. Ltd. (Telecommunication Services) | 237,368 | ||||||
| 46,143 | Israel Chemicals Ltd. (Materials) | 453,144 | ||||||
| 1,851 | Mellanox Technologies Ltd. (Semiconductors & Semiconductor Equipment)* | 92,025 | ||||||
|
| |||||||
| Common Stocks – (continued) | ||||||||
| Israel – (continued) | ||||||||
| 33,102 | Teva Pharmaceutical Industries Ltd. ADR (Pharmaceuticals, Biotechnology & Life Sciences) | $ | 1,297,598 | |||||
|
| |||||||
| 2,080,135 | ||||||||
|
| |||||||
| Italy – 2.6% | ||||||||
| 223,832 | Atlantia SpA (Transportation)(a) | 3,650,758 | ||||||
| 139,829 | Enel SpA (Utilities) | 438,779 | ||||||
| 104,784 | Eni SpA (Energy) | 2,150,584 | ||||||
| 79,711 | Fiat SpA (Automobiles & Components)* | 555,907 | ||||||
| 517,201 | Finmeccanica SpA (Capital Goods)*(a) | 2,587,540 | ||||||
| 5,731 | Saipem SpA (Energy) | 93,172 | ||||||
| 538,083 | Telecom Italia SpA (Telecommunication Services) | 299,986 | ||||||
|
| |||||||
| 9,776,726 | ||||||||
|
| |||||||
| Japan – 21.9% | ||||||||
| 8,600 | AEON Financial Service Co. Ltd. (Diversified Financials) | 243,616 | ||||||
| 2,200 | Aeon Mall Co. Ltd. (Real Estate) | 54,578 | ||||||
| 8,300 | Aisin Seiki Co. Ltd. (Automobiles & Components) | 316,914 | ||||||
| 194,000 | Asahi Glass Co. Ltd. (Capital Goods) | 1,257,469 | ||||||
| 10,700 | Asics Corp. (Consumer Durables & Apparel) | 168,628 | ||||||
| 5,600 | Astellas Pharma, Inc. (Pharmaceuticals, Biotechnology & Life Sciences) | 304,215 | ||||||
| 7,800 | Benesse Holdings, Inc. (Consumer Services) | 281,400 | ||||||
| 49,100 | Bridgestone Corp. (Automobiles & Components) | 1,674,321 | ||||||
| 134,800 | Canon, Inc. (Technology Hardware & Equipment) | 4,417,839 | ||||||
| 19,200 | Casio Computer Co. Ltd. (Consumer Durables & Apparel) | 169,195 | ||||||
| 23,400 | Chubu Electric Power Co., Inc. (Utilities) | 331,461 | ||||||
| 6,600 | Coca-Cola West Co. Ltd. (Food, Beverage & Tobacco) | 117,042 | ||||||
| 7,800 | Credit Saison Co. Ltd. (Diversified Financials) | 195,991 | ||||||
| 90,000 | Dai Nippon Printing Co. Ltd. (Commercial & Professional Services) | 821,230 | ||||||
| 37,000 | Daihatsu Motor Co. Ltd. (Automobiles & Components) | 700,808 | ||||||
| 64,700 | Daiichi Sankyo Co. Ltd. (Pharmaceuticals, Biotechnology & Life Sciences) | 1,078,213 | ||||||
| 1,500 | Daito Trust Construction Co. Ltd. (Real Estate) | 141,330 | ||||||
| 111,000 | Daiwa Securities Group, Inc. (Diversified Financials) | 929,616 | ||||||
| 26,900 | Denso Corp. (Automobiles & Components) | 1,264,655 | ||||||
|
| |||||||
| 32 | The accompanying notes are an integral part of these financial statements. |
GOLDMAN SACHS INTERNATIONAL EQUITY DIVIDEND AND PREMIUM FUND
Shares | Description | Value | ||||||
| Common Stocks – (continued) | ||||||||
| Japan – (continued) | ||||||||
| 2,500 | Dentsu, Inc. (Media) | $ | 86,459 | |||||
| 41,100 | Eisai Co. Ltd. (Pharmaceuticals, Biotechnology & Life Sciences) | 1,674,996 | ||||||
| 8,600 | FANUC Corp. (Capital Goods) | 1,244,651 | ||||||
| 2,900 | Fast Retailing Co. Ltd. (Retailing) | 978,763 | ||||||
| 24,000 | Fuji Heavy Industries Ltd. (Automobiles & Components) | 592,662 | ||||||
| 48,000 | Fujitsu Ltd. (Software & Services) | 198,576 | ||||||
| 61,000 | Fukuoka Financial Group, Inc. (Banks) | 259,443 | ||||||
| 70,000 | Furukawa Electric Co. Ltd. (Capital Goods) | 161,943 | ||||||
| 20,000 | Hino Motors Ltd. (Capital Goods) | 293,478 | ||||||
| 54,000 | Hitachi Ltd. (Technology Hardware & Equipment) | 346,005 | ||||||
| 73,000 | Honda Motor Co. Ltd. (Automobiles & Components) | 2,711,908 | ||||||
| 63,200 | Hoya Corp. (Technology Hardware & Equipment) | 1,299,911 | ||||||
| 32,400 | Hulic Co. Ltd. (Real Estate) | 347,599 | ||||||
| 91,000 | IHI Corp. (Capital Goods) | 344,300 | ||||||
| 37,000 | Isuzu Motors Ltd. (Automobiles & Components) | 252,930 | ||||||
| 73,600 | ITOCHU Corp. (Capital Goods) | 849,687 | ||||||
| 41,000 | J. Front Retailing Co. Ltd. (Retailing) | 326,961 | ||||||
| 12,500 | Japan Airlines Co. Ltd. (Transportation) | 643,508 | ||||||
| 2,700 | Japan Exchange Group, Inc. (Diversified Financials) | 272,719 | ||||||
| 47,700 | Japan Tobacco, Inc. (Food, Beverage & Tobacco) | 1,683,693 | ||||||
| 6,000 | JGC Corp. (Capital Goods) | 215,971 | ||||||
| 156,600 | JX Holdings, Inc. (Energy) | 756,129 | ||||||
| 18,500 | Kao Corp. (Household & Personal Products) | 629,768 | ||||||
| 7,100 | KDDI Corp. (Telecommunication Services) | 369,722 | ||||||
| 64,000 | Kintetsu Corp. (Transportation) | 281,347 | ||||||
| 20,000 | Kirin Holdings Co. Ltd. (Food, Beverage & Tobacco) | 313,286 | ||||||
| 63,600 | Komatsu Ltd. (Capital Goods) | 1,464,831 | ||||||
| 10,000 | Kubota Corp. (Capital Goods) | 145,534 | ||||||
| 43,400 | Kyushu Electric Power Co., Inc. (Utilities)* | 654,088 | ||||||
| 1,700 | Lawson, Inc. (Food & Staples Retailing) | 129,754 | ||||||
| 9,200 | Makita Corp. (Capital Goods) | 494,613 | ||||||
| 20,000 | Marubeni Corp. (Capital Goods) | 133,667 | ||||||
| 22,000 | Marui Group Co. Ltd. (Retailing) | 219,156 | ||||||
| 8,500 | Maruichi Steel Tube Ltd. (Materials) | 217,191 | ||||||
| 2,600 | Miraca Holdings, Inc. (Health Care Equipment & Services) | 119,478 | ||||||
| 28,400 | Mitsubishi Corp. (Capital Goods) | 485,177 | ||||||
| 78,000 | Mitsubishi Electric Corp. (Capital Goods) | 728,840 | ||||||
|
| |||||||
| Common Stocks – (continued) | ||||||||
| Japan – (continued) | ||||||||
| 55,000 | Mitsubishi Estate Co. Ltd. (Real Estate) | $ | 1,464,313 | |||||
| 50,000 | Mitsubishi Heavy Industries Ltd. (Capital Goods) | 277,978 | ||||||
| 24,800 | Mitsubishi UFJ Lease & Finance Co. Ltd. (Diversified Financials) | 117,665 | ||||||
| 128,300 | Mitsui & Co. Ltd. (Capital Goods) | 1,608,909 | ||||||
| 41,000 | Mitsui Fudosan Co. Ltd. (Real Estate) | 1,205,402 | ||||||
| 12,000 | Murata Manufacturing Co. Ltd. (Technology Hardware & Equipment) | 912,779 | ||||||
| 7,600 | Nabtesco Corp. (Capital Goods) | 157,797 | ||||||
| 39,000 | NEC Corp. (Technology Hardware & Equipment) | 85,404 | ||||||
| 14,800 | Nikon Corp. (Consumer Durables & Apparel) | 345,304 | ||||||
| 1,600 | Nintendo Co. Ltd. (Software & Services) | 188,748 | ||||||
| 15 | Nippon Building Fund, Inc. (REIT) | 173,723 | ||||||
| 14,000 | Nippon Electric Glass Co. Ltd. (Technology Hardware & Equipment) | 68,150 | ||||||
| 367,500 | Nippon Steel & Sumitomo Metal Corp. (Materials) | 990,138 | ||||||
| 368,000 | Nippon Yusen Kabushiki Kaisha (Transportation) | 973,681 | ||||||
| 31,700 | Nissan Motor Co. Ltd. (Automobiles & Components) | 321,219 | ||||||
| 9,000 | Nisshin Seifun Group, Inc. (Food, Beverage & Tobacco) | 107,846 | ||||||
| 7,300 | Nitto Denko Corp. (Materials) | 469,591 | ||||||
| 31,000 | NKSJ Holdings, Inc. (Insurance) | 736,704 | ||||||
| 62,600 | Nomura Holdings, Inc. (Diversified Financials) | 460,784 | ||||||
| 2,800 | Nomura Real Estate Holdings, Inc. (Real Estate) | 61,851 | ||||||
| 81 | Nomura Real Estate Office Fund, Inc. (REIT) | 355,210 | ||||||
| 1,772 | NTT DoCoMo, Inc. (Telecommunication Services) | 2,756,710 | ||||||
| 149 | NTT Urban Development Corp. (Real Estate) | 182,883 | ||||||
| 5,500 | Olympus Corp. (Health Care Equipment & Services)* | 167,196 | ||||||
| 24,500 | Oracle Corp. Japan (Software & Services) | 1,014,768 | ||||||
| 19,200 | Rakuten, Inc. (Retailing) | 227,078 | ||||||
| 209,000 | Resona Holdings, Inc. (Banks) | 1,017,871 | ||||||
| 29,000 | Ricoh Co. Ltd. (Technology Hardware & Equipment) | 345,029 | ||||||
| 9,300 | Rohm Co. Ltd. (Semiconductors & Semiconductor Equipment) | 377,685 | ||||||
| 45,200 | Sankyo Co. Ltd. (Consumer Durables & Apparel) | 2,135,856 | ||||||
| 3,800 | Sanrio Co. Ltd. (Retailing) | 176,820 | ||||||
| 13,200 | Sega Sammy Holdings, Inc. (Consumer Durables & Apparel) | 330,767 | ||||||
|
| |||||||
| The accompanying notes are an integral part of these financial statements. | 33 |
GOLDMAN SACHS INTERNATIONAL EQUITY DIVIDEND AND PREMIUM FUND
Schedule of Investments (continued)
June 30, 2013 (Unaudited)
Shares | Description | Value | ||||||
| Common Stocks – (continued) | ||||||||
| Japan – (continued) | ||||||||
| 21,000 | Sekisui Chemical Co. Ltd. (Consumer Durables & Apparel) | $ | 222,989 | |||||
| 104,000 | Sekisui House Ltd. (Consumer Durables & Apparel) | 1,502,643 | ||||||
| 4,100 | Seven & I Holdings Co. Ltd. (Food & Staples Retailing) | 150,156 | ||||||
| 133,900 | Seven Bank Ltd. (Banks) | 485,399 | ||||||
| 7,400 | Shin-Etsu Chemical Co. Ltd. (Materials) | 489,771 | ||||||
| 136,500 | Shiseido Co. Ltd. (Household & Personal Products) | 2,030,960 | ||||||
| 16,700 | Softbank Corp. (Telecommunication Services) | 972,106 | ||||||
| 645,000 | Sumitomo Chemical Co. Ltd. (Materials) | 2,023,028 | ||||||
| 98,700 | Sumitomo Corp. (Capital Goods) | 1,230,157 | ||||||
| 24,000 | Sumitomo Metal Mining Co. Ltd. (Materials) | 267,328 | ||||||
| 74,600 | Sumitomo Mitsui Financial Group, Inc. (Banks) | 3,414,670 | ||||||
| 377,000 | Sumitomo Mitsui Trust Holdings, Inc. (Banks) | 1,759,028 | ||||||
| 35,000 | Sumitomo Realty & Development Co. Ltd. (Real Estate) | 1,394,893 | ||||||
| 9,000 | Sumitomo Rubber Industries Ltd. (Automobiles & Components) | 146,917 | ||||||
| 5,600 | Sysmex Corp. (Health Care Equipment & Services) | 366,445 | ||||||
| 31,000 | Taiheiyo Cement Corp. (Materials) | 98,927 | ||||||
| 7,500 | Terumo Corp. (Health Care Equipment & Services) | 373,185 | ||||||
| 46,000 | The Bank of Yokohama Ltd. (Banks) | 237,298 | ||||||
| 99,500 | The Kansai Electric Power Co., Inc. (Utilities)* | 1,361,987 | ||||||
| 8,000 | The Yokohama Rubber Co. Ltd. (Automobiles & Components) | 80,419 | ||||||
| 55,300 | Tohoku Electric Power Co., Inc. (Utilities)* | 690,471 | ||||||
| 84,000 | Tokyu Corp. (Transportation) | 550,011 | ||||||
| 50,000 | Tokyu Land Corp. (Real Estate) | 457,698 | ||||||
| 18,000 | TonenGeneral Sekiyu KK (Energy) | 174,177 | ||||||
| 51,000 | Toppan Printing Co. Ltd. (Commercial & Professional Services) | 353,793 | ||||||
| 248,000 | Toshiba Corp. (Capital Goods) | 1,188,807 | ||||||
| 2,200 | Toyota Industries Corp. (Automobiles & Components) | 90,058 | ||||||
| 55,600 | Toyota Motor Corp. (Automobiles & Components) | 3,353,672 | ||||||
| 3,600 | Trend Micro, Inc. (Software & Services) | 114,454 | ||||||
| 4,720 | USS Co. Ltd. (Retailing) | 599,161 | ||||||
| 4,300 | West Japan Railway Co. (Transportation) | 182,364 | ||||||
|
| |||||||
| Common Stocks – (continued) | ||||||||
| Japan – (continued) | ||||||||
| 443 | Yahoo Japan Corp. (Software & Services) | $ | 218,140 | |||||
|
| |||||||
| 82,794,236 | ||||||||
|
| |||||||
| Luxembourg – 0.2% | ||||||||
| 78,939 | ArcelorMittal (Materials) | 883,511 | ||||||
|
| |||||||
| Netherlands – 3.0% | ||||||||
| 24,742 | Akzo Nobel NV (Materials) | 1,394,978 | ||||||
| 65,371 | Delta Lloyd NV (Insurance) | 1,310,037 | ||||||
| 14,640 | Heineken NV (Food, Beverage & Tobacco) | 931,860 | ||||||
| 1,645 | Koninklijke DSM NV (Materials) | 107,189 | ||||||
| 60,752 | Koninklijke Philips NV (Capital Goods) | 1,656,167 | ||||||
| 110,354 | Royal Dutch Shell PLC Class A (Energy)(a) | 3,526,197 | ||||||
| 69,498 | Royal Dutch Shell PLC Class B (Energy) | 2,301,701 | ||||||
|
| |||||||
| 11,228,129 | ||||||||
|
| |||||||
| New Zealand – 0.0% | ||||||||
| 44,301 | Telecom Corp. of New Zealand Ltd. (Telecommunication Services) | 77,143 | ||||||
|
| |||||||
| Norway – 1.0% | ||||||||
| 179,192 | Gjensidige Forsikring ASA (Insurance) | 2,639,886 | ||||||
| 66,673 | Orkla ASA (Food, Beverage & Tobacco) | 545,886 | ||||||
| 14,049 | Yara International ASA (Materials) | 560,261 | ||||||
|
| |||||||
| 3,746,033 | ||||||||
|
| |||||||
| Portugal – 0.0% | ||||||||
| 24,156 | Portugal Telecom, SGPS, SA (Registered) (Telecommunication Services) | 93,977 | ||||||
|
| |||||||
| Singapore – 0.6% | ||||||||
| 617,000 | CapitaCommercial Trust (REIT) | 711,774 | ||||||
| 27,000 | City Developments Ltd. (Real Estate) | 227,143 | ||||||
| 402,000 | Genting Singapore PLC (Consumer Services) | 416,851 | ||||||
| 63,000 | Global Logistic Properties Ltd. (Real Estate) | 136,686 | ||||||
| 235,000 | Golden Agri-Resources Ltd. (Food, Beverage & Tobacco) | 103,455 | ||||||
| 16,000 | Singapore Airlines Ltd. (Transportation) | 127,711 | ||||||
| 10,000 | Singapore Exchange Ltd. (Diversified Financials) | 55,464 | ||||||
| 17,000 | United Overseas Bank Ltd. (Banks) | 265,474 | ||||||
| 117,000 | Wilmar International Ltd. (Food, Beverage & Tobacco) | 289,369 | ||||||
|
| |||||||
| 2,333,927 | ||||||||
|
| |||||||
| 34 | The accompanying notes are an integral part of these financial statements. |
GOLDMAN SACHS INTERNATIONAL EQUITY DIVIDEND AND PREMIUM FUND
Shares | Description | Value | ||||||
| Common Stocks – (continued) | ||||||||
| Spain – 3.3% | ||||||||
| 10,081 | ACS Actividades de Construccion y Servicios SA (Capital Goods) | $ | 266,685 | |||||
| 538,987 | Banco Bilbao Vizcaya Argentaria SA (Banks) | 4,529,574 | ||||||
| 1,212,954 | Banco Santander SA (Banks)(a) | 7,761,994 | ||||||
|
| |||||||
| 12,558,253 | ||||||||
|
| |||||||
| Sweden – 4.1% | ||||||||
| 50,617 | Boliden AB (Materials) | 627,413 | ||||||
| 11,515 | Elekta AB Class B (Health Care Equipment & Services) | 175,144 | ||||||
| 108,408 | Hennes & Mauritz AB Class B (Retailing) | 3,566,773 | ||||||
| 348,031 | Ratos AB Class B (Diversified Financials) | 2,699,063 | ||||||
| 27,556 | Sandvik AB (Capital Goods) | 329,110 | ||||||
| 226,362 | Securitas AB Class B (Commercial & Professional Services) | 1,978,912 | ||||||
| 17,964 | SKF AB Class B (Capital Goods) | 420,845 | ||||||
| 207,530 | Swedbank AB Class A (Banks) | 4,753,382 | ||||||
| 65,661 | Telefonaktiebolaget LM Ericsson Class B (Technology Hardware & Equipment) | 744,585 | ||||||
| 21,273 | Volvo AB Class B (Capital Goods) | 283,877 | ||||||
|
| |||||||
| 15,579,104 | ||||||||
|
| |||||||
| Switzerland – 9.4% | ||||||||
| 13,699 | Compagnie Financiere Richemont SA Class A (Consumer Durables & Apparel) | 1,211,743 | ||||||
| 130,045 | Credit Suisse Group AG (Registered) (Diversified Financials)* | 3,442,822 | ||||||
| 659 | EMS-Chemie Holding AG (Registered) (Materials) | 195,186 | ||||||
| 458,460 | Glencore Xstrata PLC (Materials) | 1,897,787 | ||||||
| 61,645 | Lonza Group AG (Registered) (Pharmaceuticals, Biotechnology & Life Sciences)* | 4,631,852 | ||||||
| 141,180 | Nestle SA (Registered) (Food, Beverage & Tobacco)(a) | 9,264,288 | ||||||
| 23,383 | Novartis AG (Registered) (Pharmaceuticals, Biotechnology & Life Sciences)(a) | 1,656,231 | ||||||
| 647 | Partners Group Holding AG (Diversified Financials) | 174,898 | ||||||
| 34,969 | Roche Holding AG (Pharmaceuticals, Biotechnology & Life Sciences) | 8,679,213 | ||||||
| 2,853 | Syngenta AG (Registered) (Materials) | 1,116,372 | ||||||
| 12,566 | Zurich Insurance Group AG (Insurance)* | 3,257,222 | ||||||
|
| |||||||
| 35,527,614 | ||||||||
|
| |||||||
| Common Stocks – (continued) | ||||||||
| United Kingdom – 18.8% | ||||||||
| 26,347 | Anglo American PLC (Materials) | $ | 507,723 | |||||
| 46,156 | ARM Holdings PLC (Semiconductors & Semiconductor Equipment) | 558,353 | ||||||
| 131,312 | AstraZeneca PLC (Pharmaceuticals, Biotechnology & Life Sciences) | 6,208,281 | ||||||
| 654,366 | Aviva PLC (Insurance) | 3,372,699 | ||||||
| 34,415 | BHP Billiton PLC (Materials) | 877,508 | ||||||
| 242,976 | BP PLC ADR (Energy)(a)(b) | 10,141,818 | ||||||
| 17,507 | British American Tobacco PLC (Food, Beverage & Tobacco) | 897,927 | ||||||
| 44,418 | British Land Co. PLC (REIT) | 382,643 | ||||||
| 6,737 | Burberry Group PLC (Consumer Durables & Apparel) | 138,597 | ||||||
| 128,885 | Capita PLC (Commercial & Professional Services) | 1,894,481 | ||||||
| 115,718 | Compass Group PLC (Consumer Services) | 1,478,411 | ||||||
| 47,423 | Diageo PLC (Food, Beverage & Tobacco) | 1,359,917 | ||||||
| 253,718 | G4S PLC (Commercial & Professional Services) | 894,609 | ||||||
| 20,965 | GlaxoSmithKline PLC ADR (Pharmaceuticals, Biotechnology & Life Sciences) | 1,047,621 | ||||||
| 1,027,973 | HSBC Holdings PLC (Banks)(a) | 10,641,730 | ||||||
| 461,621 | ICAP PLC (Diversified Financials) | 2,548,768 | ||||||
| 113,917 | Imperial Tobacco Group PLC (Food, Beverage & Tobacco) | 3,950,029 | ||||||
| 63,146 | Inmarsat PLC (Telecommunication Services) | 646,681 | ||||||
| 60,442 | J Sainsbury PLC (Food & Staples Retailing) | 326,680 | ||||||
| 330,340 | Melrose Industries PLC (Capital Goods) | 1,252,073 | ||||||
| 33,103 | Pearson PLC (Media) | 588,714 | ||||||
| 100,924 | Persimmon PLC (Consumer Durables & Apparel)* | 1,811,676 | ||||||
| 13,444 | Reckitt Benckiser Group PLC (Household & Personal Products) | 950,982 | ||||||
| 5,912 | Reed Elsevier PLC (Media) | 67,169 | ||||||
| 234,189 | Resolution Ltd. (Insurance) | 1,014,430 | ||||||
| 126,892 | Rio Tinto PLC (Materials)(a) | 5,160,566 | ||||||
| 304,988 | RSA Insurance Group PLC (Insurance) | 553,308 | ||||||
| 9,279 | SABMiller PLC (Food, Beverage & Tobacco) | 444,909 | ||||||
| 58,875 | Segro PLC (REIT) | 249,764 | ||||||
| 74,213 | SSE PLC (Utilities) | 1,718,593 | ||||||
| 86,475 | Standard Chartered PLC (Banks) | 1,877,406 | ||||||
| 459,811 | Tesco PLC (Food & Staples Retailing) | 2,315,524 | ||||||
| 51,694 | Unilever PLC (Food, Beverage & Tobacco)(a) | 2,092,686 | ||||||
|
| |||||||
| The accompanying notes are an integral part of these financial statements. | 35 |
GOLDMAN SACHS INTERNATIONAL EQUITY DIVIDEND AND PREMIUM FUND
Schedule of Investments (continued)
June 30, 2013 (Unaudited)
Shares | Description | Value | ||||||
| Common Stocks – (continued) | ||||||||
| United Kingdom – (continued) | ||||||||
| 99,440 | Vodafone Group PLC ADR (Telecommunication Services)(b) | $ | 2,857,906 | |||||
|
| |||||||
| 70,830,182 | ||||||||
|
| |||||||
| TOTAL COMMON STOCKS | ||||||||
| (Cost $403,248,330) | $ | 364,280,363 | ||||||
|
| |||||||
| Preferred Stocks – 1.5% | ||||||||
| Germany – 1.5% | ||||||||
| 39,079 | Bayerische Motoren Werke AG Preference Shares (Automobiles & Components)(a) | 2,668,961 | ||||||
| 62,130 | ProSiebenSat.1 Media AG Preference Shares (Media)* | 2,664,774 | ||||||
| 14,294 | RWE AG Preference Shares (Utilities) | 441,193 | ||||||
|
| |||||||
| TOTAL PREFERRED STOCKS | ||||||||
| (Cost $5,807,138) | $ | 5,774,928 | ||||||
|
| |||||||
| Units | Description | Expiration Month | Value | |||||||||
| Right* – 0.0% | ||||||||||||
| Hong Kong – 0.0% | ||||||||||||
| 1,666 | New World Development Co. Ltd. (Real Estate) | 12/49 | $ | — | ||||||||
| (Cost $0) | ||||||||||||
|
| |||||||||||
| | TOTAL INVESTMENTS – 98.0% (Cost $409,055,468) | | $ | 370,055,291 | ||||||||
|
| |||||||||||
| | OTHER ASSETS IN EXCESS OF LIABILITIES – 2.0% | | 7,595,709 | |||||||||
|
| |||||||||||
| NET ASSETS – 100.0% | $ | 377,651,000 | ||||||||||
|
| |||||||||||
| The percentage shown for each investment category reflects the value of investments in that category as a percentage of net assets. | ||
* | Non-income producing security. | |
(a) | All or a portion of this security is held as collateral for call options written. | |
(b) | All or a portion of security is segregated as collateral for initial margin requirements on futures transactions. | |
| ||||
Investment Abbreviations: | ||||
ADR | — | American Depositary Receipt | ||
REIT | — | Real Estate Investment Trust | ||
| ||||
| ADDITIONAL INVESTMENT INFORMATION |
FUTURES CONTRACTS — At June 30, 2013, the Fund had the following futures contracts:
| Type | Number of Contracts Long (Short) | Expiration Date | Current Value | Unrealized Gain (Loss) | ||||||||||
EURO STOXX 50 Index | 125 | September 2013 | $ | 4,227,108 | $ | (136,716 | ) | |||||||
FTSE 100 Index | 21 | September 2013 | 1,967,980 | (47,707 | ) | |||||||||
TSE TOPIX Index | 17 | September 2013 | 1,938,596 | 110,392 | ||||||||||
| TOTAL | $ | (74,031 | ) | |||||||||||
WRITTEN OPTIONS CONTRACTS — At June 30, 2013, the Fund had the following written options:
| Call Options | Number of Contracts | Exercise Rate | Expiration Month | Value | ||||||||||
EURO STOXX 50 Index | 2,379 | EUR | 2,650 | September 2013 | $ | (2,396,788 | ) | |||||||
FTSE 100 Index | 485 | GBP | 6,250 | September 2013 | (1,117,556 | ) | ||||||||
Nikkei-225 Stock Average | 173 | JPY | 13,000 | September 2013 | (2,040,835 | ) | ||||||||
| TOTAL (Premiums Received $4,548,045) | 3,037 | $ | (5,555,179 | ) | ||||||||||
| 36 | The accompanying notes are an integral part of these financial statements. |
GOLDMAN SACHS INTERNATIONAL EQUITY DIVIDEND AND PREMIUM FUND
| ADDITIONAL INVESTMENT INFORMATION (continued) |
For the six months ended June 30, 2013, the Fund had the following written options activity:
| Number of Contracts | Premiums Received | |||||||
Contracts Outstanding December 31, 2012 | 2,755 | $ | 3,138,291 | |||||
Contracts written | 6,354 | 7,285,586 | ||||||
Contracts expired | (3,104 | ) | (1,912,811 | ) | ||||
Contracts bought to close | (2,968 | ) | (3,963,021 | ) | ||||
Contracts Outstanding June 30, 2013 | 3,037 | $ | 4,548,045 | |||||
| The accompanying notes are an integral part of these financial statements. | 37 |
GOLDMAN SACHS STRUCTURED TAX-MANAGED EQUITY FUND
Schedule of Investments
June 30, 2013 (Unaudited)
| Shares | Description | Value | ||||||
| Common Stocks – 96.0% | ||||||||
| Automobiles & Components – 0.8% | ||||||||
| 29,340 | BorgWarner, Inc.* | $ | 2,527,641 | |||||
| 16,019 | General Motors Co.* | 533,593 | ||||||
| 10,940 | Gentex Corp. | 252,167 | ||||||
|
| |||||||
| 3,313,401 | ||||||||
|
| |||||||
| Banks – 3.8% | ||||||||
| 32,755 | Capitol Federal Financial, Inc. | 397,646 | ||||||
| 7,860 | Hancock Holding Co. | 236,350 | ||||||
| 2,190 | M&T Bank Corp. | 244,733 | ||||||
| 63,147 | Ocwen Financial Corp.* | 2,602,919 | ||||||
| 166,400 | Regions Financial Corp. | 1,585,792 | ||||||
| 64,124 | The PNC Financial Services Group, Inc. | 4,675,922 | ||||||
| 15,761 | U.S. Bancorp | 569,760 | ||||||
| 5,424 | Walker & Dunlop, Inc.* | 94,920 | ||||||
| 116,732 | Wells Fargo & Co. | 4,817,530 | ||||||
|
| |||||||
| 15,225,572 | ||||||||
|
| |||||||
| Capital Goods – 9.0% | ||||||||
| 8,748 | AGCO Corp. | 439,062 | ||||||
| 31,608 | Alliant Techsystems, Inc. | 2,602,287 | ||||||
| 2,060 | Carlisle Companies, Inc. | 128,359 | ||||||
| 2,900 | Danaher Corp. | 183,570 | ||||||
| 12,445 | DigitalGlobe, Inc.* | 385,919 | ||||||
| 20,780 | Donaldson Co., Inc. | 741,015 | ||||||
| 1,900 | EnerSys, Inc. | 93,176 | ||||||
| 168,234 | General Electric Co. | 3,901,346 | ||||||
| 9,481 | Honeywell International, Inc. | 752,223 | ||||||
| 3,718 | Hyster-Yale Materials Handling, Inc. | 233,453 | ||||||
| 62,899 | Illinois Tool Works, Inc. | 4,350,724 | ||||||
| 1,627 | L-3 Communications Holdings, Inc. | 139,434 | ||||||
| 29,272 | Lockheed Martin Corp. | 3,174,841 | ||||||
| 8,660 | Masco Corp. | 168,783 | ||||||
| 66,406 | Raytheon Co. | 4,390,765 | ||||||
| 37,020 | Spirit Aerosystems Holdings, Inc. Class A* | 795,190 | ||||||
| 9,040 | SPX Corp. | 650,699 | ||||||
| 25,430 | TAL International Group, Inc.*(a) | 1,107,985 | ||||||
| 23,061 | Taser International, Inc.* | 196,480 | ||||||
| 55,021 | The Boeing Co. | 5,636,351 | ||||||
| 6,527 | Trex Co., Inc.* | 309,967 | ||||||
| 18,029 | United Technologies Corp. | 1,675,615 | ||||||
| 26,059 | WABCO Holdings, Inc.* | 1,946,347 | ||||||
| 23,184 | Watsco, Inc. | 1,946,529 | ||||||
|
| |||||||
| 35,950,120 | ||||||||
|
| |||||||
| Commercial & Professional Services – 0.5% | ||||||||
| 2,261 | Barrett Business Services, Inc. | 118,047 | ||||||
| 9,909 | Kforce, Inc. | 144,672 | ||||||
| 17,718 | Manpowergroup, Inc. | 970,946 | ||||||
| 65,378 | Steelcase, Inc. Class A | 953,211 | ||||||
|
| |||||||
| 2,186,876 | ||||||||
|
| |||||||
| Consumer Durables & Apparel – 1.2% | ||||||||
| 3,573 | Arctic Cat, Inc. | 160,714 | ||||||
| 24,689 | Blyth, Inc.(a) | 344,658 | ||||||
|
| |||||||
| Common Stocks – (continued) | ||||||||
| Consumer Durables & Apparel – (continued) | ||||||||
| 8,345 | Columbia Sportswear Co.(a) | $ | 522,814 | |||||
| 30,240 | Garmin Ltd.(a) | 1,093,478 | ||||||
| 3,479 | Harman International Industries, Inc. | 188,562 | ||||||
| 37,602 | Hasbro, Inc. | 1,685,698 | ||||||
| 33,728 | Hovnanian Enterprises, Inc. Class A*(a) | 189,214 | ||||||
| 32,101 | PulteGroup, Inc.* | 608,956 | ||||||
| 440 | Ralph Lauren Corp. | 76,446 | ||||||
|
| |||||||
| 4,870,540 | ||||||||
|
| |||||||
| Consumer Services – 2.8% | ||||||||
| 81,740 | Apollo Group, Inc. Class A* | 1,448,433 | ||||||
| 9,538 | Bally Technologies, Inc.* | 538,134 | ||||||
| 38,746 | Boyd Gaming Corp.* | 437,830 | ||||||
| 11,820 | Coinstar, Inc.*(a) | 693,479 | ||||||
| 6,048 | Marriott International, Inc. Class A | 244,158 | ||||||
| 6,393 | Multimedia Games Holding Co., Inc.* | 166,665 | ||||||
| 12,296 | Papa John’s International, Inc.* | 803,790 | ||||||
| 17,760 | Starbucks Corp. | 1,163,102 | ||||||
| 5,310 | Wyndham Worldwide Corp. | 303,891 | ||||||
| 28,498 | Wynn Resorts Ltd. | 3,647,744 | ||||||
| 24,978 | Yum! Brands, Inc. | 1,731,975 | ||||||
|
| |||||||
| 11,179,201 | ||||||||
|
| |||||||
| Diversified Financials – 5.9% | ||||||||
| 12,435 | Ameriprise Financial, Inc. | 1,005,743 | ||||||
| 25,706 | Apollo Investment Corp. | 198,964 | ||||||
| 28,423 | BGC Partners, Inc. Class A | 167,412 | ||||||
| 21,640 | Capital One Financial Corp. | 1,359,208 | ||||||
| 14,027 | Cash America International, Inc. | 637,667 | ||||||
| 14,465 | CBOE Holdings, Inc. | 674,648 | ||||||
| 68,745 | Citigroup, Inc. | 3,297,698 | ||||||
| 31,348 | Cohen & Steers, Inc.(a) | 1,065,205 | ||||||
| 29,252 | FXCM, Inc. Class A | 480,025 | ||||||
| 7,271 | Greenhill & Co., Inc. | 332,576 | ||||||
| 5,706 | Interactive Brokers Group, Inc. Class A | 91,125 | ||||||
| 8,745 | Investment Technology Group, Inc.* | 122,255 | ||||||
| 28,440 | Janus Capital Group, Inc. | 242,024 | ||||||
| 153,495 | JPMorgan Chase & Co. | 8,103,001 | ||||||
| 13,021 | Leucadia National Corp. | 341,411 | ||||||
| 9,720 | LPL Financial Holdings, Inc. | 367,027 | ||||||
| 20,856 | Morgan Stanley | 509,512 | ||||||
| 11,360 | PHH Corp.* | 231,517 | ||||||
| 174,389 | TD Ameritrade Holding Corp. | 4,235,909 | ||||||
| 8,807 | WisdomTree Investments, Inc.* | 101,897 | ||||||
|
| |||||||
| 23,564,824 | ||||||||
|
| |||||||
| Energy – 9.8% | ||||||||
| 32,635 | Alon USA Energy, Inc. | 471,902 | ||||||
| 47,903 | Chevron Corp. | 5,668,841 | ||||||
| 70,833 | ConocoPhillips | 4,285,397 | ||||||
| 11,910 | CVR Energy, Inc. | 564,534 | ||||||
| 5,344 | Delek US Holdings, Inc. | 153,800 | ||||||
| 6,150 | Exterran Holdings, Inc.* | 172,938 | ||||||
| 127,465 | Exxon Mobil Corp. | 11,516,463 | ||||||
| 40,501 | Green Plains Renewable Energy, Inc.* | 539,473 | ||||||
|
| |||||||
| 38 | The accompanying notes are an integral part of these financial statements. |
GOLDMAN SACHS STRUCTURED TAX-MANAGED EQUITY FUND
| Shares | Description | Value | ||||||
| Common Stocks – (continued) | ||||||||
| Energy – (continued) | ||||||||
| 42,992 | Hess Corp. | $ | 2,858,538 | |||||
| 44,514 | Marathon Petroleum Corp. | 3,163,165 | ||||||
| 2,426 | Occidental Petroleum Corp. | 216,472 | ||||||
| 76,241 | Phillips 66 | 4,491,357 | ||||||
| 44,040 | Ultra Petroleum Corp.*(a) | 872,873 | ||||||
| 89,185 | Valero Energy Corp. | 3,100,962 | ||||||
| 29,668 | Western Refining, Inc. | 832,781 | ||||||
|
| |||||||
| 38,909,496 | ||||||||
|
| |||||||
| Food & Staples Retailing – 1.1% | ||||||||
| 1,972 | Costco Wholesale Corp. | 218,044 | ||||||
| 48,060 | CVS Caremark Corp. | 2,748,071 | ||||||
| 31,304 | Safeway, Inc. | 740,653 | ||||||
| 11,362 | The Pantry, Inc.* | 138,389 | ||||||
| 5,457 | Wal-Mart Stores, Inc. | 406,492 | ||||||
|
| |||||||
| 4,251,649 | ||||||||
|
| |||||||
| Food, Beverage & Tobacco – 3.9% | ||||||||
| 67,825 | Archer-Daniels-Midland Co. | 2,299,946 | ||||||
| 15,795 | Fresh Del Monte Produce, Inc. | 440,364 | ||||||
| 22,257 | Lancaster Colony Corp. | 1,735,823 | ||||||
| 9,880 | Philip Morris International, Inc. | 855,806 | ||||||
| 298,329 | Pilgrim’s Pride Corp.* | 4,457,035 | ||||||
| 58,253 | Sanderson Farms, Inc. | 3,869,164 | ||||||
| 12,845 | The Hershey Co. | 1,146,802 | ||||||
| 4,145 | Tyson Foods, Inc. Class A | 106,444 | ||||||
| 12,346 | Universal Corp. | 714,216 | ||||||
|
| |||||||
| 15,625,600 | ||||||||
|
| |||||||
| Health Care Equipment & Services – 3.0% | ||||||||
| 122,705 | Abbott Laboratories | 4,279,950 | ||||||
| 12,250 | Becton, Dickinson and Co. | 1,210,668 | ||||||
| 179,530 | Boston Scientific Corp.* | 1,664,243 | ||||||
| 29,477 | Medtronic, Inc. | 1,517,181 | ||||||
| 100,323 | Skilled Healthcare Group, Inc. Class A* | 670,158 | ||||||
| 60,380 | St. Jude Medical, Inc. | 2,755,139 | ||||||
|
| |||||||
| 12,097,339 | ||||||||
|
| |||||||
| Household & Personal Products – 1.4% | ||||||||
| 20,503 | Kimberly-Clark Corp. | 1,991,661 | ||||||
| 34,866 | Nu Skin Enterprises, Inc. Class A | 2,131,010 | ||||||
| 12,514 | The Female Health Co. | 123,388 | ||||||
| 8,185 | The Procter & Gamble Co. | 630,163 | ||||||
| 8,571 | USANA Health Sciences, Inc.* | 620,369 | ||||||
|
| |||||||
| 5,496,591 | ||||||||
|
| |||||||
| Insurance – 4.1% | ||||||||
| 22,280 | Aflac, Inc. | 1,294,914 | ||||||
| 58,457 | Berkshire Hathaway, Inc. Class B* | 6,542,507 | ||||||
| 17,026 | Marsh & McLennan Companies, Inc. | 679,678 | ||||||
| 54,692 | MetLife, Inc. | 2,502,706 | ||||||
| 66,309 | Prudential Financial, Inc. | 4,842,546 | ||||||
| 10,305 | Unum Group | 302,658 | ||||||
|
| |||||||
| 16,165,009 | ||||||||
|
| |||||||
| Common Stocks – (continued) | ||||||||
| Materials – 2.9% | ||||||||
| 2,551 | AEP Industries, Inc.* | $ | 189,769 | |||||
| 3,356 | Bemis Co., Inc. | 131,354 | ||||||
| 20,380 | Globe Specialty Metals, Inc. | 221,531 | ||||||
| 1,400 | Kaiser Aluminum Corp. | 86,716 | ||||||
| 66,105 | LyondellBasell Industries NV Class A | 4,380,117 | ||||||
| 14,360 | Minerals Technologies, Inc. | 593,642 | ||||||
| 8,040 | OM Group, Inc.* | 248,597 | ||||||
| 8,231 | PPG Industries, Inc. | 1,205,101 | ||||||
| 32,498 | Reliance Steel & Aluminum Co. | 2,130,569 | ||||||
| 41,926 | Resolute Forest Products, Inc.* | 552,165 | ||||||
| 13,260 | Schnitzer Steel Industries, Inc. Class A | 310,019 | ||||||
| 3,465 | Schweitzer-Mauduit International, Inc. | 172,834 | ||||||
| 25,080 | SunCoke Energy, Inc.* | 351,622 | ||||||
| 12,293 | The Valspar Corp. | 794,988 | ||||||
|
| |||||||
| 11,369,024 | ||||||||
|
| |||||||
| Media – 2.3% | ||||||||
| 74,301 | DIRECTV* | 4,578,428 | ||||||
| 14,898 | Regal Entertainment Group Class A(a) | 266,674 | ||||||
| 62,130 | Viacom, Inc. Class B | 4,227,946 | ||||||
|
| |||||||
| 9,073,048 | ||||||||
|
| |||||||
| Pharmaceuticals, Biotechnology & Life Sciences – 12.1% | ||||||||
| 77,032 | AbbVie, Inc. | 3,184,503 | ||||||
| 39,538 | Alexion Pharmaceuticals, Inc.* | 3,646,985 | ||||||
| 1,432 | Allergan, Inc. | 120,632 | ||||||
| 19,843 | Amgen, Inc. | 1,957,710 | ||||||
| 16,914 | Biogen Idec, Inc.* | 3,639,893 | ||||||
| 48,696 | Cambrex Corp.* | 680,283 | ||||||
| 6,816 | Celgene Corp.* | 796,859 | ||||||
| 7,560 | Cubist Pharmaceuticals, Inc.* | 365,148 | ||||||
| 8,785 | Forest Laboratories, Inc.* | 360,185 | ||||||
| 8,509 | Genomic Health, Inc.*(a) | 269,820 | ||||||
| 101,303 | Johnson & Johnson | 8,697,876 | ||||||
| 20,007 | Life Technologies Corp.* | 1,480,718 | ||||||
| 126,887 | Merck & Co., Inc. | 5,893,901 | ||||||
| 369,345 | PDL BioPharma, Inc.(a) | 2,851,343 | ||||||
| 279,552 | Pfizer, Inc. | 7,830,252 | ||||||
| 16,654 | Pharmacyclics, Inc.* | 1,323,493 | ||||||
| 14,856 | Questcor Pharmaceuticals, Inc. | 675,354 | ||||||
| 6,353 | Santarus, Inc.* | 133,731 | ||||||
| 31,212 | Vertex Pharmaceuticals, Inc.* | 2,492,902 | ||||||
| 98,272 | Warner Chilcott PLC Class A | 1,953,647 | ||||||
|
| |||||||
| 48,355,235 | ||||||||
|
| |||||||
| Real Estate – 4.8% | ||||||||
| 53,031 | American Tower Corp. (REIT) | 3,880,278 | ||||||
| 28,860 | Apartment Investment & Management Co. Class A (REIT) | 866,954 | ||||||
| 14,677 | Corrections Corp. of America (REIT) | 497,110 | ||||||
| 17,180 | Cousins Properties, Inc. (REIT) | 173,518 | ||||||
| 10,500 | Equity Lifestyle Properties, Inc. (REIT) | 825,195 | ||||||
| 17,100 | Equity Residential (REIT) | 992,826 | ||||||
| 28,074 | Extra Space Storage, Inc. (REIT) | 1,177,143 | ||||||
|
| |||||||
| The accompanying notes are an integral part of these financial statements. | 39 |
GOLDMAN SACHS STRUCTURED TAX-MANAGED EQUITY FUND
Schedule of Investments (continued)
June 30, 2013 (Unaudited)
| Shares | Description | Value | ||||||
| Common Stocks – (continued) | ||||||||
| Real Estate – (continued) | ||||||||
| 21,071 | Health Care Real Estate Investment Trust, Inc. (REIT) | $ | 1,412,389 | |||||
| 2,876 | Healthcare Realty Trust, Inc. (REIT) | 73,338 | ||||||
| 41,632 | Rayonier, Inc. (REIT) | 2,305,997 | ||||||
| 5,740 | Realogy Holdings Corp.* | 275,750 | ||||||
| 16,421 | Simon Property Group, Inc. (REIT) | 2,593,204 | ||||||
| 51,239 | Taubman Centers, Inc. (REIT) | 3,850,619 | ||||||
|
| |||||||
| 18,924,321 | ||||||||
|
| |||||||
| Retailing – 5.3% | ||||||||
| 90,586 | American Eagle Outfitters, Inc. | 1,654,100 | ||||||
| 3,461 | AutoZone, Inc.* | 1,465,606 | ||||||
| 57,272 | GameStop Corp. Class A(a) | 2,407,142 | ||||||
| 7,937 | Group 1 Automotive, Inc. | 510,587 | ||||||
| 4,080 | Guess?, Inc. | 126,602 | ||||||
| 9,840 | L Brands, Inc. | 484,620 | ||||||
| 178,063 | Liberty Interactive Corp. Series A* | 4,097,230 | ||||||
| 10,000 | Lowe’s Companies, Inc. | 409,000 | ||||||
| 5,167 | Lumber Liquidators Holdings, Inc.* | 402,354 | ||||||
| 38,121 | O’Reilly Automotive, Inc.* | 4,293,187 | ||||||
| 5,981 | Priceline.com, Inc.* | 4,947,064 | ||||||
| 2,503 | TripAdvisor, Inc.* | 152,358 | ||||||
| 6,800 | Urban Outfitters, Inc.* | 273,496 | ||||||
|
| |||||||
| 21,223,346 | ||||||||
|
| |||||||
| Semiconductors & Semiconductor Equipment – 1.0% | ||||||||
| 20,607 | Advanced Energy Industries, Inc.* | 358,768 | ||||||
| 4,020 | First Solar, Inc.* | 179,815 | ||||||
| 40,120 | Intel Corp. | 971,706 | ||||||
| 3,200 | KLA-Tencor Corp. | 178,336 | ||||||
| 85,780 | LSI Corp.* | 612,469 | ||||||
| 12,600 | Rambus, Inc.* | 108,234 | ||||||
| 78,832 | SunPower Corp.*(a) | 1,631,822 | ||||||
|
| |||||||
| 4,041,150 | ||||||||
|
| |||||||
| Software & Services – 8.8% | ||||||||
| 89,702 | Activision Blizzard, Inc. | 1,279,151 | ||||||
| 25,774 | Aspen Technology, Inc.* | 742,041 | ||||||
| 25,301 | eBay, Inc.* | 1,308,568 | ||||||
| 18,780 | Electronic Arts, Inc.* | 431,377 | ||||||
| 3,803 | Euronet Worldwide, Inc.* | 121,164 | ||||||
| 8,674 | Google, Inc. Class A* | 7,636,329 | ||||||
| 7,365 | IAC/InterActiveCorp | 350,279 | ||||||
| 40,515 | International Business Machines Corp. | 7,742,822 | ||||||
| 6,061 | Lender Processing Services, Inc. | 196,073 | ||||||
| 3,480 | ManTech International Corp. Class A | 90,898 | ||||||
| 8,885 | Mastercard, Inc. Class A | 5,104,432 | ||||||
| 36,898 | Mentor Graphics Corp. | 721,356 | ||||||
| 81,304 | Microsoft Corp.(b) | 2,807,427 | ||||||
| 17,420 | Pandora Media, Inc.* | 320,528 | ||||||
| 10,026 | Shutterstock, Inc.* | 559,250 | ||||||
| 7,659 | TeleTech Holdings, Inc.* | 179,450 | ||||||
| 14,390 | Travelzoo, Inc.* | 392,271 | ||||||
| 15,005 | VASCO Data Security International, Inc.* | 124,692 | ||||||
| 12,293 | VeriSign, Inc.* | 549,005 | ||||||
|
| |||||||
| Common Stocks – (continued) | ||||||||
| Software & Services – (continued) | ||||||||
| 6,244 | VistaPrint NV*(a) | $ | 308,266 | |||||
| 5,880 | VMware, Inc. Class A* | 393,901 | ||||||
| 38,363 | Vringo, Inc.*(a) | 121,611 | ||||||
| 61,075 | Zillow, Inc. Class A*(a) | 3,438,523 | ||||||
|
| |||||||
| 34,919,414 | ||||||||
|
| |||||||
| Technology Hardware & Equipment – 4.2% | ||||||||
| 18,630 | Apple, Inc.(b) | 7,378,971 | ||||||
| 37,269 | Ciena Corp.* | 723,764 | ||||||
| 176,994 | Corning, Inc. | 2,518,625 | ||||||
| 34,310 | Daktronics, Inc. | 352,021 | ||||||
| 24,038 | EchoStar Corp. Class A* | 940,126 | ||||||
| 6,000 | FLIR Systems, Inc. | 161,820 | ||||||
| 25,520 | Lexmark International, Inc. Class A | 780,146 | ||||||
| 8,981 | Polycom, Inc.* | 94,707 | ||||||
| 1,611 | QUALCOMM, Inc. | 98,400 | ||||||
| 34,181 | Western Digital Corp. | 2,122,251 | ||||||
| 170,320 | Xerox Corp. | 1,544,802 | ||||||
|
| |||||||
| 16,715,633 | ||||||||
|
| |||||||
| Telecommunication Services – 2.2% | ||||||||
| 232,934 | AT&T, Inc.(b) | 8,245,863 | ||||||
| 11,271 | Verizon Communications, Inc. | 567,336 | ||||||
|
| |||||||
| 8,813,199 | ||||||||
|
| |||||||
| Transportation – 3.7% | ||||||||
| 14,103 | Allegiant Travel Co. | 1,494,777 | ||||||
| 11,928 | Arkansas Best Corp. | 273,748 | ||||||
| 15,629 | CSX Corp. | 362,436 | ||||||
| 28,966 | Delta Air Lines, Inc.* | 541,954 | ||||||
| 3,220 | FedEx Corp. | 317,428 | ||||||
| 24,289 | Heartland Express, Inc. | 336,888 | ||||||
| 51,198 | Hertz Global Holdings, Inc.* | 1,269,710 | ||||||
| 23,000 | Knight Transportation, Inc. | 386,860 | ||||||
| 4,878 | Norfolk Southern Corp. | 354,387 | ||||||
| 5,745 | Saia, Inc.* | 172,178 | ||||||
| 124,239 | SkyWest, Inc. | 1,682,196 | ||||||
| 30,565 | Spirit Airlines, Inc.* | 971,050 | ||||||
| 159,879 | U.S. Airways Group, Inc.*(a) | 2,625,213 | ||||||
| 9,688 | Union Pacific Corp. | 1,494,665 | ||||||
| 16,477 | United Parcel Service, Inc. Class B | 1,424,931 | ||||||
| 36,159 | Werner Enterprises, Inc. | 873,963 | ||||||
|
| |||||||
| 14,582,384 | ||||||||
|
| |||||||
| Utilities – 1.4% | ||||||||
| 9,873 | American Water Works Co., Inc. | 407,064 | ||||||
| 6,662 | Consolidated Edison, Inc. | 388,461 | ||||||
| 150,471 | Dynegy, Inc.*(a) | 3,393,121 | ||||||
| 6,584 | Entergy Corp. | 458,773 | ||||||
| 18,272 | Pinnacle West Capital Corp. | 1,013,548 | ||||||
|
| |||||||
| 5,660,967 | ||||||||
|
| |||||||
| | TOTAL INVESTMENTS BEFORE SECURITIES LENDING REINVESTMENT VEHICLE | | ||||||
| (Cost $334,069,281) | $ | 382,513,939 | ||||||
|
| |||||||
| 40 | The accompanying notes are an integral part of these financial statements. |
GOLDMAN SACHS STRUCTURED TAX-MANAGED EQUITY FUND
| Shares | Rate | Value | ||||
| Securities Lending Reinvestment Vehicle(c)(d) – 5.2% | ||||||
Goldman Sachs Financial Square Money Market Fund — FST Shares |
| |||||
| 20,804,975 | 0.069% | $ | 20,804,975 | |||
| (Cost $20,804,975) | ||||||
| ||||||
| TOTAL INVESTMENTS – 101.2% | ||||||
| (Cost $354,874,256) | $ | 403,318,914 | ||||
| ||||||
LIABILITIES IN EXCESS OF OTHER ASSETS – (1.2)% | (4,922,092 | ) | ||||
| ||||||
| NET ASSETS – 100.0% | $ | 398,396,822 | ||||
| ||||||
| The percentage shown for each investment category reflects the value of investments in that category as a percentage of net assets. | ||
* | Non-income producing security. | |
(a) | All or a portion of security is on loan. | |
(b) | All or a portion of security is segregated as collateral for initial margin requirements on futures transactions. | |
(c) | Variable rate security. Interest rate disclosed is that which is in effect at June 30, 2013. | |
(d) | Represents an affiliated issuer. | |
| ||
Investment Abbreviation: | ||
REIT | —Real Estate Investment Trust | |
| ||
| ADDITIONAL INVESTMENT INFORMATION |
FUTURES CONTRACTS — At June 30, 2013, the Fund had the following futures contracts:
| Type | Number of Contracts Long (Short) | Expiration Date | Current Value | Unrealized Gain (Loss) | ||||||||||
Russell 2000 Mini Index | 10 | September 2013 | $ | 974,700 | $ | (21,516 | ) | |||||||
S&P 500 E-mini Index | 125 | September 2013 | 9,995,625 | (287,406 | ) | |||||||||
| TOTAL | $ | (308,922 | ) | |||||||||||
| The accompanying notes are an integral part of these financial statements. | 41 |
GOLDMAN SACHS STRUCTURED INTERNATIONAL TAX-MANAGED EQUITY FUND
Schedule of Investments
June 30, 2013 (Unaudited)
| Shares | Description | Value | ||||||
| Common Stocks – 92.2% | ||||||||
| Australia – 6.8% | ||||||||
| 60,230 | Australia & New Zealand Banking Group Ltd. (Banks) | $ | 1,563,532 | |||||
| 32,512 | BHP Billiton Ltd. (Materials) | 935,787 | ||||||
| 30,957 | BlueScope Steel Ltd. (Materials)* | 131,699 | ||||||
| 5,391 | Caltex Australia Ltd. (Energy) | 88,672 | ||||||
| 40,590 | Charter Hall Group (REIT) | 143,186 | ||||||
| 44,744 | Coca-Cola Amatil Ltd. (Food, Beverage & Tobacco) | 518,407 | ||||||
| 213,255 | Commonwealth Property Office Fund (REIT) | 213,727 | ||||||
| 518 | CSL Ltd. (Pharmaceuticals, Biotechnology & Life Sciences) | 29,100 | ||||||
| 134,635 | GPT Group (REIT) | 472,747 | ||||||
| 51,811 | Insurance Australia Group Ltd. (Insurance) | 257,174 | ||||||
| 2,435 | McMillan Shakespeare Ltd. (Commercial & Professional Services) | 35,975 | ||||||
| 38,244 | National Australia Bank Ltd. (Banks) | 1,034,499 | ||||||
| 4,679 | Newcrest Mining Ltd. (Materials) | 43,193 | ||||||
| 88,192 | NIB Holdings Ltd. (Insurance) | 171,990 | ||||||
| 150,943 | Primary Health Care Ltd. (Health Care Equipment & Services) | 661,068 | ||||||
| 16,903 | Ramsay Health Care Ltd. (Health Care Equipment & Services) | 552,485 | ||||||
| 33,746 | Sonic Healthcare Ltd. (Health Care Equipment & Services) | 458,448 | ||||||
| 43,518 | Treasury Wine Estates Ltd. (Food, Beverage & Tobacco) | 231,243 | ||||||
| 75,681 | Westpac Banking Corp. (Banks) | 1,986,996 | ||||||
| 11,795 | Woodside Petroleum Ltd. (Energy) | 375,646 | ||||||
| 50,311 | Woolworths Ltd. (Food & Staples Retailing) | 1,507,149 | ||||||
|
| |||||||
| 11,412,723 | ||||||||
|
| |||||||
| Austria – 0.0% | ||||||||
| 1,393 | Raiffeisen Bank International AG (Banks)*(a) | 40,556 | ||||||
|
| |||||||
| Belgium – 1.2% | ||||||||
| 6,916 | Anheuser-Busch InBev NV (Food, Beverage & Tobacco) | 622,670 | ||||||
| 9,440 | Delhaize Group SA (Food & Staples Retailing) | 583,604 | ||||||
| 20,399 | KBC Groep NV (Banks) | 760,462 | ||||||
| 885 | Sofina SA (Diversified Financials) | 80,188 | ||||||
|
| |||||||
| 2,046,924 | ||||||||
|
| |||||||
| Bermuda – 0.3% | ||||||||
| 29,270 | Catlin Group Ltd. (Insurance) | 222,385 | ||||||
| 23,486 | Hiscox Ltd. (Insurance) | 203,824 | ||||||
|
| |||||||
| 426,209 | ||||||||
|
| |||||||
| China – 0.0% | ||||||||
| 40,000 | China Minzhong Food Corp. Ltd. (Food, Beverage & Tobacco)* | 32,783 | ||||||
|
| |||||||
| Common Stocks – (continued) | ||||||||
| Denmark – 0.8% | ||||||||
| 11,475 | Chr. Hansen Holding A/S (Materials) | $ | 392,581 | |||||
| 9,877 | GN Store Nord A/S (Health Care Equipment & Services) | 186,533 | ||||||
| 3,204 | Novo Nordisk A/S Class B (Pharmaceuticals, Biotechnology & Life Sciences) | 498,102 | ||||||
| 11,855 | Topdanmark A/S (Insurance)* | 301,728 | ||||||
|
| |||||||
| 1,378,944 | ||||||||
|
| |||||||
| Finland – 0.3% | ||||||||
| 2,020 | Cramo Oyj (Capital Goods) | 23,393 | ||||||
| 10,289 | Metso Oyj (Capital Goods) | 348,518 | ||||||
| 15,663 | Ramirent Oyj (Capital Goods) | 135,199 | ||||||
|
| |||||||
| 507,110 | ||||||||
|
| |||||||
| France – 10.2% | ||||||||
| 40,355 | AXA SA (Insurance) | 795,507 | ||||||
| 13,604 | BNP Paribas SA (Banks) | 744,752 | ||||||
| 1,028 | Compagnie de Saint-Gobain (Capital Goods) | 41,673 | ||||||
| 26,635 | Compagnie Generale des Etablissements Michelin Class B (Automobiles & Components)(a) | 2,381,594 | ||||||
| 19,275 | Credit Agricole SA (Banks)* | 165,897 | ||||||
| 10,557 | Danone SA (Food, Beverage & Tobacco) | 794,608 | ||||||
| 3,711 | Fonciere Des Regions (REIT) | 278,141 | ||||||
| 3,162 | Gecina SA (REIT) | 349,478 | ||||||
| 2,125 | Hermes International (Consumer Durables & Apparel) | 685,883 | ||||||
| 60,073 | Legrand SA (Capital Goods) | 2,785,299 | ||||||
| 13,214 | MPI (Energy) | 57,792 | ||||||
| 20,614 | Natixis (Banks) | 86,553 | ||||||
| 14,461 | Renault SA (Automobiles & Components) | 974,057 | ||||||
| 32,055 | Sanofi (Pharmaceuticals, Biotechnology & Life Sciences) | 3,313,865 | ||||||
| 5,699 | Schneider Electric SA (Capital Goods) | 413,900 | ||||||
| 29,981 | Total SA (Energy) | 1,464,368 | ||||||
| 34,300 | Vinci SA (Capital Goods) | 1,720,508 | ||||||
|
| |||||||
| 17,053,875 | ||||||||
|
| |||||||
| Germany – 4.6% | ||||||||
| 6,330 | Allianz SE (Registered) (Insurance) | 923,935 | ||||||
| 28,928 | BASF SE (Materials) | 2,580,192 | ||||||
| 15,296 | Bayer AG (Registered) (Pharmaceuticals, Biotechnology & Life Sciences) | 1,628,575 | ||||||
| 5,879 | Commerzbank AG (Banks)* | 51,072 | ||||||
| 8,158 | Continental AG (Automobiles & Components) | 1,087,536 | ||||||
| 634 | Daimler AG (Registered) (Automobiles & Components) | 38,274 | ||||||
| 6,946 | Deutsche Bank AG (Registered) (Diversified Financials) | 291,266 | ||||||
|
| |||||||
| 42 | The accompanying notes are an integral part of these financial statements. |
GOLDMAN SACHS STRUCTURED INTERNATIONAL TAX-MANAGED EQUITY FUND
| Shares | Description | Value | ||||||
| Common Stocks – (continued) | ||||||||
| Germany – (continued) | ||||||||
| 14,755 | Deutsche Telekom AG (Registered) (Telecommunication Services) | $ | 171,904 | |||||
| 706 | Henkel AG & Co. KGaA (Household & Personal Products) | 55,294 | ||||||
| 12,590 | SAP AG (Software & Services) | 919,360 | ||||||
|
| |||||||
| 7,747,408 | ||||||||
|
| |||||||
| Hong Kong – 2.7% | ||||||||
| 198,200 | AIA Group Ltd. (Insurance) | 835,017 | ||||||
| 83,000 | BOC Hong Kong Holdings Ltd. (Banks) | 253,904 | ||||||
| 71,000 | Champion REIT (REIT) | 32,508 | ||||||
| 72,000 | CLP Holdings Ltd. (Utilities) | 582,035 | ||||||
| 3,600 | Dah Sing Financial Holdings Ltd. (Banks) | 14,404 | ||||||
| 38,000 | First Pacific Co. Ltd. (Diversified Financials) | 40,622 | ||||||
| 3,000 | Guoco Group Ltd. (Diversified Financials) | 33,967 | ||||||
| 19,600 | Hang Seng Bank Ltd. (Banks) | 288,642 | ||||||
| 31,000 | Hutchison Whampoa Ltd. (Capital Goods) | 324,330 | ||||||
| 1,200 | Jardine Matheson Holdings Ltd. (Capital Goods) | 72,423 | ||||||
| 116,800 | MGM China Holdings Ltd. (Consumer Services) | 309,947 | ||||||
| 27,360 | Noble Group Ltd. (Capital Goods) | 20,809 | ||||||
| 25,000 | Road King Infrastructure Ltd. (Transportation) | 23,068 | ||||||
| 111,000 | SJM Holdings Ltd. (Consumer Services) | 269,376 | ||||||
| 42,000 | Sun Hung Kai & Co. Ltd. (Diversified Financials) | 23,827 | ||||||
| 94,000 | Sunlight Real Estate Investment Trust (REIT) | 38,353 | ||||||
| 35,500 | Swire Pacific Ltd. Class A (Real Estate) | 427,714 | ||||||
| 24,000 | Wharf Holdings Ltd. (Real Estate) | 200,314 | ||||||
| 97,000 | Wheelock & Co. Ltd. (Real Estate) | 483,968 | ||||||
| 73,200 | Wynn Macau Ltd. (Consumer Services) | 196,891 | ||||||
|
| |||||||
| 4,472,119 | ||||||||
|
| |||||||
| Israel – 0.4% | ||||||||
| 10,970 | Bank Hapoalim B.M. (Banks)* | 49,508 | ||||||
| 8,970 | Bank Leumi Le-Israel BM (Banks)* | 29,632 | ||||||
| 7,022 | Mizrahi Tefahot Bank Ltd. (Banks)* | 70,303 | ||||||
| 839 | NICE Systems Ltd. ADR (Software & Services) | 30,951 | ||||||
| 12,566 | Teva Pharmaceutical Industries Ltd. ADR (Pharmaceuticals, Biotechnology & Life Sciences) | 492,587 | ||||||
| 91 | The Israel Corp. Ltd. (Materials)* | 54,255 | ||||||
|
| |||||||
| 727,236 | ||||||||
|
| |||||||
| Common Stocks – (continued) | ||||||||
| Italy – 2.9% | ||||||||
| 6,149 | ASTM SpA (Transportation)* | $ | 69,966 | |||||
| 9,350 | De’Longhi SpA (Consumer Durables & Apparel) | 146,099 | ||||||
| 105,938 | Enel SpA (Utilities) | 332,430 | ||||||
| 52,581 | Eni SpA (Energy) | 1,079,171 | ||||||
| 1,626 | Exor SpA (Diversified Financials) | 48,155 | ||||||
| 18,973 | Gtech SpA (Consumer Services) | 474,754 | ||||||
| 884,957 | Intesa Sanpaolo SpA (Banks) | 1,348,914 | ||||||
| 200,071 | Iren SpA (Utilities)* | 222,947 | ||||||
| 131,653 | Mediaset SpA (Media)* | 495,902 | ||||||
| 135,322 | UniCredit SpA (Banks) | 632,615 | ||||||
|
| |||||||
| 4,850,953 | ||||||||
|
| |||||||
| Japan – 22.4% | ||||||||
| 198 | Accordia Golf Co. Ltd. (Consumer Services) | 207,793 | ||||||
| 16,700 | AEON Financial Service Co. Ltd. (Diversified Financials) | 473,068 | ||||||
| 3,200 | Agrex, Inc. (Software & Services) | 26,732 | ||||||
| 2,800 | Aisin Seiki Co. Ltd. (Automobiles & Components) | 106,911 | ||||||
| 3,400 | Alfresa Holdings Corp. (Health Care Equipment & Services) | 182,053 | ||||||
| 21,000 | Amada Co. Ltd. (Capital Goods) | 138,256 | ||||||
| 208,000 | Aozora Bank Ltd. (Banks) | 649,599 | ||||||
| 21,000 | Asahi Glass Co. Ltd. (Capital Goods) | 136,118 | ||||||
| 3,500 | Asahi Group Holdings Ltd. (Food, Beverage & Tobacco) | 86,701 | ||||||
| 22,200 | Astellas Pharma, Inc. (Pharmaceuticals, Biotechnology & Life Sciences) | 1,205,995 | ||||||
| 700 | Canon, Inc. (Technology Hardware & Equipment) | 22,941 | ||||||
| 3,800 | Central Japan Railway Co. (Transportation) | 463,144 | ||||||
| 13,100 | Chubu Electric Power Co., Inc. (Utilities) | 185,562 | ||||||
| 21,900 | Credit Saison Co. Ltd. (Diversified Financials) | 550,283 | ||||||
| 62,000 | Daihatsu Motor Co. Ltd. (Automobiles & Components) | 1,174,326 | ||||||
| 33,700 | Daiichi Sankyo Co. Ltd. (Pharmaceuticals, Biotechnology & Life Sciences) | 561,604 | ||||||
| 41,000 | Daiwa Securities Group, Inc. (Diversified Financials) | 343,372 | ||||||
| 3,400 | Eisai Co. Ltd. (Pharmaceuticals, Biotechnology & Life Sciences) | 138,564 | ||||||
| 20,100 | Electric Power Development Co. Ltd. (Utilities) | 628,420 | ||||||
| 24,000 | Fuji Heavy Industries Ltd. (Automobiles & Components) | 592,662 | ||||||
| 617 | Fuji Media Holdings, Inc. (Media) | 1,240,331 | ||||||
| 8,300 | FUJIFILM Holdings Corp. (Technology Hardware & Equipment) | 182,547 | ||||||
| 298,000 | Fujitsu Ltd. (Software & Services) | 1,232,824 | ||||||
|
| |||||||
| The accompanying notes are an integral part of these financial statements. | 43 |
GOLDMAN SACHS STRUCTURED INTERNATIONAL TAX-MANAGED EQUITY FUND
Schedule of Investments (continued)
June 30, 2013 (Unaudited)
| Shares | Description | Value | ||||||
| Common Stocks – (continued) | ||||||||
| Japan – (continued) | ||||||||
| 14,400 | Heiwa Real Estate Co. Ltd. (Real Estate) | $ | 239,943 | |||||
| 1,400 | HIS Co. Ltd. (Consumer Services) | 59,825 | ||||||
| 4,000 | Hisaka Works Ltd. (Capital Goods) | 34,092 | ||||||
| 1,500 | Hitachi Capital Corp. (Diversified Financials) | 29,643 | ||||||
| 68,000 | Hitachi Ltd. (Technology Hardware & Equipment) | 435,710 | ||||||
| 7,600 | Hokuriku Electric Power Co. (Utilities) | 119,254 | ||||||
| 16,100 | Honda Motor Co. Ltd. (Automobiles & Components) | 598,106 | ||||||
| 21,100 | Ibiden Co. Ltd. (Technology Hardware & Equipment) | 328,415 | ||||||
| 11,000 | IHI Corp. (Capital Goods) | 41,619 | ||||||
| 2,700 | Information Services International-Dentsu Ltd. (Software & Services) | 30,605 | ||||||
| 174,000 | Isuzu Motors Ltd. (Automobiles & Components) | 1,189,455 | ||||||
| 16,300 | Japan Airlines Co. Ltd. (Transportation) | 839,135 | ||||||
| 3,500 | Japan Petroleum Exploration Co. (Energy) | 141,715 | ||||||
| 43,900 | JFE Holdings, Inc. (Materials) | 961,759 | ||||||
| 10,200 | JTEKT Corp. (Capital Goods) | 114,330 | ||||||
| 165,000 | Kawasaki Kisen Kaisha Ltd. (Transportation) | 335,400 | ||||||
| 6,000 | KDDI Corp. (Telecommunication Services) | 312,441 | ||||||
| 59,000 | Kirin Holdings Co. Ltd. (Food, Beverage & Tobacco) | 924,194 | ||||||
| 6,300 | Kirindo Co. Ltd. (Food & Staples Retailing) | 42,627 | ||||||
| 28,500 | Konica Minolta, Inc. (Technology Hardware & Equipment) | 214,512 | ||||||
| 5,500 | Konoike Transport Co. Ltd. (Transportation) | 76,474 | ||||||
| 18,100 | Kyokuto Securities Co. Ltd. (Diversified Financials) | 288,618 | ||||||
| 32,000 | Kyowa Hakko Kirin Co. Ltd. (Pharmaceuticals, Biotechnology & Life Sciences) | 361,707 | ||||||
| 1,000 | Maruichi Steel Tube Ltd. (Materials) | 25,552 | ||||||
| 12,000 | Mito Securities Co. Ltd. (Diversified Financials) | 50,234 | ||||||
| 83,000 | Mitsubishi Chemical Holdings Corp. (Materials) | 388,997 | ||||||
| 8,900 | Mitsubishi Corp. (Capital Goods) | 152,045 | ||||||
| 97,000 | Mitsubishi Heavy Industries Ltd. (Capital Goods) | 539,277 | ||||||
| 16,000 | Mitsubishi Materials Corp. (Materials) | 56,329 | ||||||
| 279,600 | Mitsubishi UFJ Financial Group, Inc. (Banks) | 1,726,773 | ||||||
| 2,500 | Mitsui & Co. Ltd. (Capital Goods) | 31,351 | ||||||
| 227,400 | Mizuho Financial Group, Inc. (Banks) | 472,240 | ||||||
|
| |||||||
| Common Stocks – (continued) | ||||||||
| Japan – (continued) | ||||||||
| 45,300 | MS&AD Insurance Group Holdings (Insurance) | $ | 1,147,458 | |||||
| 14,400 | Namco Bandai Holdings, Inc. (Consumer Durables & Apparel) | 233,387 | ||||||
| 4,800 | Nexon Co. Ltd. (Software & Services) | 53,016 | ||||||
| 3,000 | NGK Insulators Ltd. (Capital Goods) | 37,073 | ||||||
| 5,600 | Nihon Eslead Corp. (Consumer Durables & Apparel) | 60,099 | ||||||
| 85,000 | Nippon Electric Glass Co. Ltd. (Technology Hardware & Equipment) | 413,770 | ||||||
| 7,600 | Nippon Telegraph & Telephone Corp. (Telecommunication Services) | 396,119 | ||||||
| 2,500 | Noevir Holdings Co. Ltd. (Household & Personal Products) | 39,010 | ||||||
| 114,500 | Nomura Holdings, Inc. (Diversified Financials) | 842,808 | ||||||
| 7,400 | Nomura Real Estate Holdings, Inc. (Real Estate) | 163,464 | ||||||
| 52 | Nomura Real Estate Office Fund, Inc. (REIT) | 228,036 | ||||||
| 232 | NTT Data Corp. (Software & Services) | 826,374 | ||||||
| 90 | NTT DoCoMo, Inc. (Telecommunication Services) | 140,013 | ||||||
| 35 | NTT Urban Development Corp. (Real Estate) | 42,959 | ||||||
| 25,000 | OKK Corp. (Capital Goods) | 35,017 | ||||||
| 43,200 | Otsuka Holdings Co. Ltd. (Pharmaceuticals, Biotechnology & Life Sciences) | 1,426,418 | ||||||
| 71,900 | Round One Corp. (Consumer Services) | 435,080 | ||||||
| 19,000 | Sekisui Chemical Co. Ltd. (Consumer Durables & Apparel) | 201,752 | ||||||
| 28,900 | Seven & I Holdings Co. Ltd. (Food & Staples Retailing) | 1,058,415 | ||||||
| 7,900 | Showa Corp. (Automobiles & Components) | 101,708 | ||||||
| 11,800 | Softbank Corp. (Telecommunication Services) | 686,877 | ||||||
| 2,700 | Sony Financial Holdings, Inc. (Insurance) | 42,510 | ||||||
| 2,500 | Step Co. Ltd. (Consumer Services) | 21,065 | ||||||
| 43,500 | Sumitomo Corp. (Capital Goods) | 542,166 | ||||||
| 67,200 | Sumitomo Electric Industries Ltd. (Capital Goods) | 799,952 | ||||||
| 13,000 | Sumitomo Metal Mining Co. Ltd. (Materials) | 144,803 | ||||||
| 16,700 | Sumitomo Mitsui Financial Group, Inc. (Banks) | 764,410 | ||||||
| 257,000 | Sumitomo Mitsui Trust Holdings, Inc. (Banks) | 1,199,126 | ||||||
| 26,600 | T&D Holdings, Inc. (Insurance) | 355,817 | ||||||
| 3,200 | Taikisha Ltd. (Capital Goods) | 78,673 | ||||||
| 5,000 | Tanseisha Co. Ltd. (Commercial & Professional Services) | 21,506 | ||||||
|
| |||||||
| 44 | The accompanying notes are an integral part of these financial statements. |
GOLDMAN SACHS STRUCTURED INTERNATIONAL TAX-MANAGED EQUITY FUND
| Shares | Description | Value | ||||||
| Common Stocks – (continued) | ||||||||
| Japan – (continued) | ||||||||
| 7,800 | The Chugoku Electric Power Co., Inc. (Utilities) | $ | 122,306 | |||||
| 282 | The Dai-ichi Life Insurance Co. Ltd. (Insurance) | 404,824 | ||||||
| 5,000 | The Kansai Electric Power Co., Inc. (Utilities)* | 68,442 | ||||||
| 11,700 | Tohoku Electric Power Co., Inc. (Utilities)* | 146,085 | ||||||
| 4,300 | Tokio Marine Holdings, Inc. (Insurance) | 135,686 | ||||||
| 18,000 | Tokyo Tatemono Co. Ltd. (Real Estate) | 149,779 | ||||||
| 4,000 | Tokyu Land Corp. (Real Estate) | 36,616 | ||||||
| 3,000 | Topre Corp. (Automobiles & Components) | 25,930 | ||||||
| 2,100 | Toukei Computer Co. Ltd. (Software & Services) | 27,959 | ||||||
| 27,100 | Toyota Motor Corp. (Automobiles & Components) | 1,634,614 | ||||||
| 9,800 | Tv Tokyo Holdings Corp. (Media) | 168,316 | ||||||
| 2,900 | Wacom Co. Ltd. (Technology Hardware & Equipment) | 32,057 | ||||||
| 2,500 | West Japan Railway Co. (Transportation) | 106,026 | ||||||
| 21,000 | Wood One Co. Ltd. (Materials) | 63,657 | ||||||
| 600 | Yakult Honsha Co. Ltd. (Food, Beverage & Tobacco) | 24,880 | ||||||
|
| |||||||
| 37,378,241 | ||||||||
|
| |||||||
| Luxembourg – 1.6% | ||||||||
| 12,406 | ArcelorMittal (Materials) | 138,852 | ||||||
| 86,197 | SES SA FDR (Media) | 2,469,682 | ||||||
|
| |||||||
| 2,608,534 | ||||||||
|
| |||||||
| Netherlands – 4.7% | ||||||||
| 8,779 | BinckBank NV (Diversified Financials) | 74,075 | ||||||
| 2,789 | Heineken NV (Food, Beverage & Tobacco) | 177,524 | ||||||
| 127,308 | ING Groep NV CVA (Diversified Financials)* | 1,163,479 | ||||||
| 97,863 | Koninklijke Ahold NV (Food & Staples Retailing) | 1,455,513 | ||||||
| 3,776 | Royal Dutch Shell PLC Class A (Energy) | 120,620 | ||||||
| 67,583 | Royal Dutch Shell PLC Class A (Energy)(a) | 2,159,537 | ||||||
| 54,158 | Royal Dutch Shell PLC Class B (Energy) | 1,793,656 | ||||||
| 22,769 | Unilever NV CVA (Food, Beverage & Tobacco) | 896,286 | ||||||
|
| |||||||
| 7,840,690 | ||||||||
|
| |||||||
| Norway – 3.7% | ||||||||
| 29,574 | DNB ASA (Banks) | 429,020 | ||||||
| 9,853 | Fred Olsen Energy ASA (Energy) | 390,177 | ||||||
|
| |||||||
| Common Stocks – (continued) | ||||||||
| Norway – (continued) | ||||||||
| 110,662 | Gjensidige Forsikring ASA (Insurance) | $ | 1,630,290 | |||||
| 5,635 | Kongsberg Gruppen AS (Capital Goods) | 101,855 | ||||||
| 129,637 | Orkla ASA (Food, Beverage & Tobacco) | 1,061,405 | ||||||
| 2,622,265 | Renewable Energy Corp. ASA (Semiconductors & Semiconductor Equipment)* | 963,932 | ||||||
| 47,379 | Statoil ASA (Energy) | 978,759 | ||||||
| 29,051 | Telenor ASA (Telecommunication Services) | 577,040 | ||||||
|
| |||||||
| 6,132,478 | ||||||||
|
| |||||||
| Singapore – 1.4% | ||||||||
| 64,000 | CapitaCommercial Trust (REIT) | 73,831 | ||||||
| 224,000 | Cityspring Infrastructure Trust (Utilities) | 82,978 | ||||||
| 18,000 | ComfortDelGro Corp. Ltd. (Transportation) | 25,868 | ||||||
| 57,504 | DBS Group Holdings Ltd. (Banks) | 699,703 | ||||||
| 88,000 | Fortune Real Estate Investment Trust (REIT) | 80,261 | ||||||
| 3,000 | Jardine Cycle & Carriage Ltd. (Retailing) | 100,302 | ||||||
| 20,000 | Keppel Corp. Ltd. (Capital Goods) | 163,587 | ||||||
| 21,800 | Keppel Real Estate Investment Trust (REIT) | 22,224 | ||||||
| 5,000 | Oversea-Chinese Banking Corp. Ltd. (Banks) | 39,306 | ||||||
| 16,000 | Singapore Airlines Ltd. (Transportation) | 127,711 | ||||||
| 134,000 | Singapore Telecommunications Ltd. (Telecommunication Services) | 396,883 | ||||||
| 24,000 | Suntec Real Estate Investment Trust (REIT) | 29,796 | ||||||
| 10,000 | United Overseas Bank Ltd. (Banks) | 156,161 | ||||||
| 74,000 | UOL Group Ltd. (Real Estate) | 391,193 | ||||||
| 9,000 | Wilmar International Ltd. (Food, Beverage & Tobacco) | 22,259 | ||||||
|
| |||||||
| 2,412,063 | ||||||||
|
| |||||||
| Spain – 3.3% | ||||||||
| 2,482 | ACS Actividades de Construccion y Servicios SA (Capital Goods) | 65,659 | ||||||
| 89,214 | Amadeus IT Holding SA Class A (Software & Services) | 2,855,310 | ||||||
| 39,960 | Banco Santander SA (Banks) | 255,714 | ||||||
| 2,259 | Endesa SA (Utilities) | 48,244 | ||||||
| 67,162 | Ferrovial SA (Capital Goods) | 1,072,244 | ||||||
| 6,472 | Grupo Catalana Occidente SA (Insurance) | 143,304 | ||||||
| 23,745 | Mediaset Espana Comunicacion SA (Media)* | 206,836 | ||||||
| 15,840 | Repsol SA (Energy) | 334,303 | ||||||
|
| |||||||
| The accompanying notes are an integral part of these financial statements. | 45 |
GOLDMAN SACHS STRUCTURED INTERNATIONAL TAX-MANAGED EQUITY FUND
Schedule of Investments (continued)
June 30, 2013 (Unaudited)
| Shares | Description | Value | ||||||
| Common Stocks – (continued) | ||||||||
| Spain – (continued) | ||||||||
| 11,907 | Telefonica SA (Telecommunication Services) | $ | 153,188 | |||||
| 28,775 | Vueling Airlines SA (Transportation)* | 344,586 | ||||||
|
| |||||||
| 5,479,388 | ||||||||
|
| |||||||
| Sweden – 2.5% | ||||||||
| 4,588 | Axfood AB (Food & Staples Retailing) | 191,784 | ||||||
| 3,830 | BioGaia AB Class B (Pharmaceuticals, Biotechnology & Life Sciences) | 130,059 | ||||||
| 9,893 | Hennes & Mauritz AB Class B (Retailing) | 325,493 | ||||||
| 2,733 | Investor AB Class A (Diversified Financials) | 71,218 | ||||||
| 5,725 | Kinnevik Investment AB Class B (Diversified Financials) | 146,772 | ||||||
| 2,767 | Modern Times Group AB Class B (Media) | 118,051 | ||||||
| 216,928 | Nordea Bank AB (Banks) | 2,422,493 | ||||||
| 3,303 | Oresund Investment AB (Diversified Financials)* | 54,672 | ||||||
| 108,331 | SAS AB (Transportation)* | 206,396 | ||||||
| 18,969 | Swedbank AB Class A (Banks) | 434,477 | ||||||
|
| |||||||
| 4,101,415 | ||||||||
|
| |||||||
| Switzerland – 6.8% | ||||||||
| 17,894 | Actelion Ltd. (Registered) (Pharmaceuticals, Biotechnology & Life Sciences)* | 1,077,893 | ||||||
| 3,776 | Basilea Pharmaceutica (Registered) (Pharmaceuticals, Biotechnology & Life Sciences)* | 279,570 | ||||||
| 3,524 | EMS-Chemie Holding AG (Registered) (Materials) | 1,043,759 | ||||||
| 5,140 | Geberit AG (Registered) (Capital Goods) | 1,273,299 | ||||||
| 5,582 | Kudelski SA (Technology Hardware & Equipment) | 69,425 | ||||||
| 24 | Lindt & Spruengli AG (Registered) (Food, Beverage & Tobacco) | 1,044,267 | ||||||
| 16,615 | Nestle SA (Registered) (Food, Beverage & Tobacco) | 1,090,283 | ||||||
| 14,028 | Novartis AG (Registered) (Pharmaceuticals, Biotechnology & Life Sciences) | 993,611 | ||||||
| 75,899 | OC Oerlikon Corp. AG (Registered) (Capital Goods)* | 899,206 | ||||||
| 545 | Partners Group Holding AG (Diversified Financials) | 147,520 | ||||||
| 7,944 | Roche Holding AG (Pharmaceuticals, Biotechnology & Life Sciences) | 1,971,552 | ||||||
|
| |||||||
| Common Stocks – (continued) | ||||||||
| Switzerland – (continued) | ||||||||
| 17,358 | Swiss Re AG (Insurance)* | $ | 1,291,451 | |||||
| 312 | Vaudoise Assurances Holding SA (Insurance) | 114,935 | ||||||
|
| |||||||
| 11,296,771 | ||||||||
|
| |||||||
| United Kingdom – 15.6% | ||||||||
| 16,828 | Aberdeen Asset Management PLC (Diversified Financials) | 97,933 | ||||||
| 4,294 | Admiral Group PLC (Insurance) | 86,498 | ||||||
| 18,222 | AstraZeneca PLC (Pharmaceuticals, Biotechnology & Life Sciences) | 861,515 | ||||||
| 69,647 | BAE Systems PLC (Capital Goods) | 405,588 | ||||||
| 318,362 | Barclays PLC (Banks) | 1,355,823 | ||||||
| 20,217 | BHP Billiton PLC (Materials) | 515,490 | ||||||
| 9,846 | Bodycote PLC (Capital Goods) | 78,423 | ||||||
| 15,251 | BP PLC ADR (Energy) | 636,577 | ||||||
| 51,015 | British American Tobacco PLC (Food, Beverage & Tobacco) | 2,616,538 | ||||||
| 7,605 | Centrica PLC (Utilities) | 41,597 | ||||||
| 14,449 | Cobham PLC (Capital Goods) | 57,609 | ||||||
| 18,444 | Diageo PLC (Food, Beverage & Tobacco) | 528,906 | ||||||
| 78,621 | easyJet PLC (Transportation) | 1,549,692 | ||||||
| 58,626 | GlaxoSmithKline PLC ADR (Pharmaceuticals, Biotechnology & Life Sciences)(b) | 2,929,541 | ||||||
| 37,773 | Hammerson PLC (REIT) | 280,075 | ||||||
| 29,335 | Hansteen Holdings PLC (REIT) | 36,086 | ||||||
| 218,620 | HSBC Holdings PLC (Banks) | 2,263,187 | ||||||
| 5,923 | IG Group Holdings PLC (Diversified Financials) | 52,305 | ||||||
| 30,387 | IMI PLC (Capital Goods) | 572,750 | ||||||
| 119,083 | Intermediate Capital Group PLC (Diversified Financials) | 787,628 | ||||||
| 113,350 | ITV PLC (Media) | 241,668 | ||||||
| 141,972 | Ladbrokes PLC (Consumer Services) | 431,293 | ||||||
| 7,482 | Lancashire Holdings Ltd. (Insurance) | 90,231 | ||||||
| 3,221 | Land Securities Group PLC (REIT) | 43,260 | ||||||
| 93,620 | Lavendon Group PLC (Capital Goods) | 244,235 | ||||||
| 104,522 | Mondi PLC (Materials) | 1,301,361 | ||||||
| 35,719 | National Grid PLC (Utilities) | 404,897 | ||||||
| 9,667 | Next PLC (Retailing) | 669,635 | ||||||
| 90,633 | Rexam PLC (Materials) | 657,745 | ||||||
| 9,999 | Rio Tinto PLC (Materials) | 406,649 | ||||||
| 28,913 | Soco International PLC (Energy)* | 153,715 | ||||||
| 29,887 | Standard Chartered PLC (Banks) | 648,858 | ||||||
| 12,330 | TalkTalk Telecom Group PLC (Telecommunication Services) | 42,159 | ||||||
| 44,537 | Tate & Lyle PLC (Food, Beverage & Tobacco) | 558,791 | ||||||
| 25,361 | Tetragon Financial Group Ltd. (Diversified Financials) | 276,831 | ||||||
| 191,371 | TUI Travel PLC (Consumer Services) | 1,037,571 | ||||||
| 20,110 | Unilever PLC (Food, Beverage & Tobacco) | 814,097 | ||||||
|
| |||||||
| 46 | The accompanying notes are an integral part of these financial statements. |
GOLDMAN SACHS STRUCTURED INTERNATIONAL TAX-MANAGED EQUITY FUND
| Shares | Description | Value | ||||||
| Common Stocks – (continued) | ||||||||
| United Kingdom – (continued) | ||||||||
| 75,809 | Vodafone Group PLC ADR (Telecommunication Services) | $ | 2,178,751 | |||||
| 11,045 | William Hill PLC (Consumer Services) | 74,066 | ||||||
|
| |||||||
| 26,029,574 | ||||||||
|
| |||||||
| TOTAL COMMON STOCKS | ||||||||
| (Cost $138,918,200) | $ | 153,975,994 | ||||||
|
| |||||||
| Preferred Stocks – 1.4% | ||||||||
| Germany – 1.4% | ||||||||
| 13,177 | Henkel AG & Co. KGaA Preference Shares (Household & Personal Products) | $ | 1,237,449 | |||||
| 12,782 | Porsche Automobil Holding SE Preference Shares (Automobiles & Components) | 987,060 | ||||||
| 4,580 | ProSiebenSat.1 Media AG Preference Shares (Media)* | 196,438 | ||||||
|
| |||||||
| TOTAL PREFERRED STOCKS | ||||||||
| (Cost $2,152,774) | $ | 2,420,947 | ||||||
|
| |||||||
|
| TOTAL INVESTMENTS BEFORE SECURITIES LENDING REINVESTMENT VEHICLE |
| ||||||
| (Cost $141,070,974) | $ | 156,396,941 | ||||||
|
| |||||||
| Shares | Rate | Value | ||||||
| Securities Lending Reinvestment Vehicle(c)(d) – 0.1% | ||||||||
| Goldman Sachs Financial Square Money Market Fund — | | ||||||
| 154,577 | 0.069% | $154,577 | ||||||
| (Cost $154,577) | ||||||||
|
| |||||||
| TOTAL INVESTMENTS – 93.7% | ||||||||
| (Cost $141,225,551) | $ | 156,551,518 | ||||||
|
| |||||||
| | OTHER ASSETS IN EXCESS OF LIABILITIES – 6.3% | 10,452,686 | ||||||
|
| |||||||
| NET ASSETS – 100.0% | $ | 167,004,204 | ||||||
|
| |||||||
| The percentage shown for each investment category reflects the value of investments in that category as a percentage of net assets. | ||||
* | Non-income producing security. | |||
(a) | All or a portion of security is on loan. | |||
(b) | All or a portion of security is segregated as collateral for initial margin requirements on futures transactions. | |||
(c) | Variable rate security. Interest rate disclosed is that which is in effect at June 30, 2013. | |||
(d) | Represents an affiliated issuer. | |||
| ||
Investment Abbreviations: | ||
ADR | —American Depositary Receipt | |
CVA | —Dutch Certification | |
FDR | —Fiduciary Depositary Receipt | |
REIT | —Real Estate Investment Trust | |
| ||
| ADDITIONAL INVESTMENT INFORMATION |
FUTURES CONTRACTS — At June 30, 2013, the Fund had the following futures contracts:
| Type | Number of Contracts Long (Short) | Expiration Date | Current Value | Unrealized Gain (Loss) | ||||||||||
EURO STOXX 50 Index | 145 | September 2013 | $ | 4,903,446 | $ | (67,559 | ) | |||||||
FTSE 100 Index | 24 | September 2013 | 2,249,120 | (21,925 | ) | |||||||||
Hang Seng Index | 1 | July 2013 | 133,631 | 2,788 | ||||||||||
MSCI Singapore Index | 2 | July 2013 | 111,527 | 1,016 | ||||||||||
SPI 200 Index | 8 | September 2013 | 872,298 | (352 | ) | |||||||||
TSE TOPIX Index | 19 | September 2013 | 2,166,667 | 42,655 | ||||||||||
| TOTAL | $ | (43,377 | ) | |||||||||||
| The accompanying notes are an integral part of these financial statements. | 47 |
GOLDMAN SACHS STRUCTURED TAX-ADVANTAGED EQUITY FUNDS
Statements of Assets and Liabilities
June 30, 2013 (Unaudited)
U.S. Equity Dividend and Premium Fund | International Equity | Structured Tax-Managed Equity Fund | Structured International Tax-Managed Equity Fund | |||||||||||||||
| Assets: | ||||||||||||||||||
Investments in unaffiliated issuers, at value (cost $1,170,796,645, $409,055,468, $334,069,281 and $141,070,974)(a) | $ | 1,233,271,773 | $ | 370,055,291 | $ | 382,513,939 | $ | 156,396,941 | ||||||||||
Investments in affiliated securities lending reinvestment vehicle, at value which equals cost | — | — | 20,804,975 | 154,577 | ||||||||||||||
Cash | 51,406,083 | — | 16,108,710 | 5,333,087 | ||||||||||||||
Foreign currencies, at value (cost $0, $7,179,311, $0 and $4,545,813) | — | 7,086,080 | — | 4,469,830 | ||||||||||||||
Receivables: | ||||||||||||||||||
Investments sold | 133,093,978 | 96,768,700 | — | 10,761 | ||||||||||||||
Dividends | 2,255,829 | 1,172,183 | 285,767 | 391,938 | ||||||||||||||
Fund shares sold | 2,125,517 | 445,539 | 496,592 | 549,418 | ||||||||||||||
Reimbursement from investment adviser | 33,849 | 15,074 | 23,827 | 38,445 | ||||||||||||||
Foreign tax reclaims | — | 858,318 | — | 165,153 | ||||||||||||||
Securities lending income | — | — | 26,287 | 7,662 | ||||||||||||||
Other assets | 7,016 | 2,304 | 2,089 | 840 | ||||||||||||||
| Total assets | 1,422,194,045 | 476,403,489 | 420,262,186 | 167,518,652 | ||||||||||||||
| Liabilities: | ||||||||||||||||||
Payables: | ||||||||||||||||||
Investments purchased | 149,342,582 | 91,402,319 | — | 2,070 | ||||||||||||||
Written options, at value (premiums received $11,992,800, $4,548,045, $0 and $0) | 14,517,600 | 5,555,179 | — | — | ||||||||||||||
Fund shares redeemed | 1,579,239 | 334,164 | 533,028 | 38,799 | ||||||||||||||
Amounts owed to affiliates | 912,027 | 277,967 | 259,456 | 121,032 | ||||||||||||||
Futures variation margin | 147,217 | 6,549 | 47,425 | 73,861 | ||||||||||||||
Payable upon return of securities loaned | — | — | 20,804,975 | 154,577 | ||||||||||||||
Due to custodian | — | 1,034,478 | — | — | ||||||||||||||
Accrued expenses and other liabilities | 137,136 | 141,833 | 220,480 | 124,109 | ||||||||||||||
| Total liabilities | 166,635,801 | 98,752,489 | 21,865,364 | 514,448 | ||||||||||||||
| Net Assets: | ||||||||||||||||||
Paid-in capital | 1,164,022,586 | 408,936,544 | 342,544,007 | 192,544,148 | ||||||||||||||
Undistributed (distributions in excess of) net investment income (loss) | (12,687 | ) | 15,233 | 2,606,890 | 2,909,203 | |||||||||||||
Accumulated net realized gain (loss) | 31,546,608 | 8,896,056 | 5,110,189 | (43,648,355 | ) | |||||||||||||
Net unrealized gain (loss) | 60,001,737 | (40,196,833 | ) | 48,135,736 | 15,199,208 | |||||||||||||
| NET ASSETS | $ | 1,255,558,244 | $ | 377,651,000 | $ | 398,396,822 | $ | 167,004,204 | ||||||||||
Net Assets: | ||||||||||||||||||
Class A | $ | 160,641,475 | $ | 13,376,161 | $ | 30,184,542 | $ | 3,729,538 | ||||||||||
Class B | — | — | 594,699 | — | ||||||||||||||
Class C | 56,473,210 | 2,090,149 | 9,078,339 | 33,135 | ||||||||||||||
Institutional | 1,011,644,598 | 360,127,098 | 357,844,079 | 163,055,981 | ||||||||||||||
Service | — | — | 41,461 | — | ||||||||||||||
Class IR | 26,798,961 | 2,057,592 | 653,702 | 185,550 | ||||||||||||||
Total Net Assets | $ | 1,255,558,244 | $ | 377,651,000 | $ | 398,396,822 | $ | 167,004,204 | ||||||||||
Shares outstanding $0.001 par value (unlimited shares authorized): | ||||||||||||||||||
Class A | 15,212,792 | 1,855,254 | 2,304,346 | 468,602 | ||||||||||||||
Class B | — | — | 46,945 | — | ||||||||||||||
Class C | 5,357,130 | 296,973 | 723,269 | 4,217 | ||||||||||||||
Institutional | 96,009,849 | 50,660,179 | 26,903,170 | 20,539,797 | ||||||||||||||
Service | — | — | 3,147 | — | ||||||||||||||
Class IR | 2,540,399 | 289,889 | 49,120 | 23,196 | ||||||||||||||
Net asset value, offering and redemption price per share:(b) | ||||||||||||||||||
Class A | $10.56 | $7.21 | $13.10 | $7.96 | ||||||||||||||
Class B | — | — | 12.67 | — | ||||||||||||||
Class C | 10.54 | 7.04 | 12.55 | 7.86 | ||||||||||||||
Institutional | 10.54 | 7.11 | 13.30 | 7.94 | ||||||||||||||
Service | — | — | 13.18 | — | ||||||||||||||
Class IR | 10.55 | 7.10 | 13.31 | 8.00 | ||||||||||||||
| (a) | Includes loaned securities having a market value of $20,319,156 and $145,946 for the Structured Tax-Managed Equity Fund and Structured International Tax-Managed Equity, respectively. |
| (b) | Maximum public offering price per share for Class A shares of the U.S. Equity Dividend and Premium Fund, International Equity Dividend and Premium, Structured Tax-Managed Equity and Structured International Tax-Managed Equity Funds is $11.17, $7.63 and $13.86, $8.42, respectively. At redemption, Class B and Class C Shares may be subject to a contingent deferred sales charge assessed on the amount equal to the lesser of the current NAV or the original purchase price of the shares. |
| 48 | The accompanying notes are an integral part of these financial statements. |
GOLDMAN SACHS STRUCTURED TAX-ADVANTAGED EQUITY FUNDS
Statements of Operations
For the Six Months Ended June 30, 2013 (Unaudited)
U.S. Equity Dividend and Premium Fund | International Equity | Structured Tax-Managed Equity Fund | Structured International Tax-Managed Equity Fund | |||||||||||||||
| Investment income: | ||||||||||||||||||
Dividends (net of foreign taxes withheld of $23,490, $757,774, $10,293 and $286,857) | $ | 18,718,739 | $ | 9,965,098 | $ | 3,728,239 | $ | 3,837,238 | ||||||||||
Securities lending income — affiliated issuer | — | — | 304,934 | 130,817 | ||||||||||||||
| Total investment income | 18,718,739 | 9,965,098 | 4,033,173 | 3,968,055 | ||||||||||||||
| Expenses: | ||||||||||||||||||
Management fees | 4,439,087 | 1,605,895 | 1,336,177 | 688,957 | ||||||||||||||
Distribution and Service fees(a) | 459,485 | 28,316 | 88,332 | 12,427 | ||||||||||||||
Transfer Agent fees(a) | 416,888 | 93,568 | 108,449 | 39,875 | ||||||||||||||
Custody, accounting and administrative services | 60,119 | 126,287 | 32,909 | 70,859 | ||||||||||||||
Registration fees | 48,688 | 31,240 | 51,233 | 35,380 | ||||||||||||||
Printing and mailing costs | 47,215 | 20,483 | 19,941 | 18,886 | ||||||||||||||
Professional fees | 44,282 | 33,176 | 46,776 | 42,453 | ||||||||||||||
Trustee fees | 10,013 | 9,222 | 9,156 | 8,869 | ||||||||||||||
Service share fees — Service Plan | — | — | 50 | — | ||||||||||||||
Service share fees — Shareholder Administration Plan | — | — | 50 | — | ||||||||||||||
Other | 12,949 | 7,906 | 10,566 | 7,268 | ||||||||||||||
| Total expenses | 5,538,726 | 1,956,093 | 1,703,639 | 924,974 | ||||||||||||||
Less — expense reductions | (68,756 | ) | (75,586 | ) | (206,142 | ) | (172,279 | ) | ||||||||||
| Net expenses | 5,469,970 | 1,880,507 | 1,497,497 | 752,695 | ||||||||||||||
| NET INVESTMENT INCOME | 13,248,769 | 8,084,591 | 2,535,676 | 3,215,360 | ||||||||||||||
| Realized and unrealized gain (loss): | ||||||||||||||||||
Net realized gain (loss) from: | ||||||||||||||||||
Investments | 49,843,366 | 24,431,709 | (3,120,190 | ) | (10,144,157 | ) | ||||||||||||
Futures contracts | 2,544,104 | 453,124 | 2,210,018 | (27,746 | ) | |||||||||||||
Forward foreign currency exchange contracts | — | — | — | (26,447 | ) | |||||||||||||
Foreign currency transactions | — | (578,196 | ) | — | 180,395 | |||||||||||||
Written options | (23,341,154 | ) | (6,128,079 | ) | — | — | ||||||||||||
Net change in unrealized gain (loss) on: | ||||||||||||||||||
Investments | 85,970,581 | (23,506,140 | ) | 52,256,158 | 13,749,791 | |||||||||||||
Futures contracts | 31,253 | (78,823 | ) | (421,782 | ) | (55,603 | ) | |||||||||||
Forward foreign currency exchange contracts | — | — | — | 446 | ||||||||||||||
Foreign currency translation | — | (138,740 | ) | — | (101,016 | ) | ||||||||||||
Written options | (2,769,779 | ) | 250,044 | — | — | |||||||||||||
| Net realized and unrealized gain (loss) | 112,278,371 | (5,295,101 | ) | 50,924,204 | 3,575,663 | |||||||||||||
| NET INCREASE IN NET ASSETS RESULTING FROM OPERATIONS | $ | 125,527,140 | $ | 2,789,490 | $ | 53,459,880 | $ | 6,791,023 | ||||||||||
| (a) | Class specific Distribution and Service, and Transfer Agent fees were as follows: |
| Distribution and Service Fees | Transfer Agent Fees | |||||||||||||||||||||||||||||||||||
Fund | Class A | Class B | Class C | Class A | Class B | Class C | Institutional | Service | Class IR | |||||||||||||||||||||||||||
U.S. Equity Dividend and Premium | $ | 199,844 | $ | — | $ | 259,641 | $ | 151,882 | $ | — | $ | 49,332 | $ | 193,725 | $ | — | $ | 21,949 | ||||||||||||||||||
International Equity Dividend and Premium | 18,603 | — | 9,713 | 14,139 | — | 1,845 | 75,500 | — | 2,084 | |||||||||||||||||||||||||||
Structured Tax-Managed Equity | 40,925 | 3,037 | 44,370 | 31,103 | 577 | 8,430 | 67,787 | 8 | 544 | |||||||||||||||||||||||||||
Structured International Tax-Managed Equity | 12,260 | — | 167 | 9,317 | — | 32 | 30,434 | — | 92 | |||||||||||||||||||||||||||
| The accompanying notes are an integral part of these financial statements. | 49 |
GOLDMAN SACHS STRUCTURED TAX-ADVANTAGED EQUITY FUNDS
Statements of Changes in Net Assets
| U.S. Equity Dividend and Premium Fund | ||||||||||||
For the Six Months Ended June 30, 2013 (Unaudited) | For the Fiscal December 31, 2012 | |||||||||||
| From operations: | ||||||||||||
Net investment income | $ | 13,248,769 | $ | 29,474,160 | ||||||||
Net realized gain (loss) | 29,046,316 | 53,662,444 | ||||||||||
Net change in unrealized gain (loss) | 83,232,055 | 12,717,605 | ||||||||||
| Net increase in net assets resulting from operations | 125,527,140 | 95,854,209 | ||||||||||
| Distributions to shareholders: | ||||||||||||
From net investment income | ||||||||||||
Class A Shares | (1,547,564 | ) | (3,355,936 | ) | ||||||||
Class B Shares | — | — | ||||||||||
Class C Shares | (330,558 | ) | (658,283 | ) | ||||||||
Institutional Shares | (11,491,735 | ) | (25,086,206 | ) | ||||||||
Service Shares | — | — | ||||||||||
Class IR Shares | (269,093 | ) | (431,612 | ) | ||||||||
From net realized gains | ||||||||||||
Class A Shares | — | (7,111,148 | ) | |||||||||
Class C Shares | — | (2,239,420 | ) | |||||||||
Institutional Shares | — | (46,453,558 | ) | |||||||||
Class IR Shares | — | (976,489 | ) | |||||||||
| Total distributions to shareholders | (13,638,950 | ) | (86,312,652 | ) | ||||||||
| From share transactions: | ||||||||||||
Proceeds from sales of shares | 226,653,037 | 575,881,173 | ||||||||||
Reinvestment of distributions | 11,572,762 | 74,352,894 | ||||||||||
Cost of shares redeemed | (200,028,991 | ) | (331,796,812 | ) | ||||||||
| Net increase (decrease) in net assets resulting from share transactions | 38,196,808 | 318,437,255 | ||||||||||
| TOTAL INCREASE (DECREASE) | 150,084,998 | 327,978,812 | ||||||||||
| Net assets: | ||||||||||||
Beginning of period | 1,105,473,246 | 777,494,434 | ||||||||||
End of period | $ | 1,255,558,244 | $ | 1,105,473,246 | ||||||||
| Undistributed (distributions in excess of) net investment income (loss) | $ | (12,687 | ) | $ | 377,494 | |||||||
| 50 | The accompanying notes are an integral part of these financial statements. |
GOLDMAN SACHS STRUCTURED TAX-ADVANTAGED EQUITY FUNDS
| International Equity Dividend and Premium Fund | Structured Tax-Managed Equity Fund | Structured International Tax-Managed Equity Fund | ||||||||||||||||||||||||||||||||
For the Six Months Ended June 30, 2013 (Unaudited) | For the Fiscal December 31, 2012 | For the Six Months Ended June 30, 2013 (Unaudited) | For the Fiscal Year Ended December 31, 2012 | For the Six Months Ended June 30, 2013 (Unaudited) | For the Fiscal Year Ended December 31, 2012 | |||||||||||||||||||||||||||||
| $ | 8,084,591 | $ | 10,802,941 | $ | 2,535,676 | $ | 5,017,357 | $ | 3,215,360 | $ | 3,808,562 | |||||||||||||||||||||||
| 18,178,558 | (8,233,892 | ) | (910,172 | ) | 53,314,012 | (10,017,955 | ) | 17,668,650 | ||||||||||||||||||||||||||
| (23,473,659 | ) | 45,186,054 | 51,834,376 | (10,305,446 | ) | 13,593,618 | 2,586,424 | |||||||||||||||||||||||||||
| 2,789,490 | 47,755,103 | 53,459,880 | 48,025,923 | 6,791,023 | 24,063,636 | |||||||||||||||||||||||||||||
| (254,088 | ) | (4,158,788 | ) | — | (434,347 | ) | — | (453,626 | ) | |||||||||||||||||||||||||
| — | — | — | (1,336 | ) | — | — | ||||||||||||||||||||||||||||
| (32,272 | ) | (31,554 | ) | — | (36,625 | ) | — | (679 | ) | |||||||||||||||||||||||||
| (7,622,207 | ) | (6,410,718 | ) | — | (4,463,846 | ) | — | (3,919,930 | ) | |||||||||||||||||||||||||
| — | — | — | (416 | ) | — | — | ||||||||||||||||||||||||||||
| (42,893 | ) | (70,292 | ) | — | (6,583 | ) | — | (24 | ) | |||||||||||||||||||||||||
| — | (117,731 | ) | — | — | — | — | ||||||||||||||||||||||||||||
| — | (12,980 | ) | — | — | — | — | ||||||||||||||||||||||||||||
| — | (2,941,344 | ) | — | — | — | — | ||||||||||||||||||||||||||||
| — | (16,476 | ) | — | — | — | — | ||||||||||||||||||||||||||||
| (7,951,460 | ) | (13,759,883 | ) | — | (4,943,153 | ) | — | (4,374,259 | ) | |||||||||||||||||||||||||
| 63,534,076 | 349,510,707 | 93,059,523 | 95,171,403 | 45,465,649 | 47,480,065 | |||||||||||||||||||||||||||||
| 7,678,068 | 13,353,842 | — | 4,905,467 | — | 4,371,275 | |||||||||||||||||||||||||||||
| (73,259,498 | ) | (301,902,751 | ) | (97,774,824 | ) | (81,030,747 | ) | (34,959,316 | ) | (63,856,394 | ) | |||||||||||||||||||||||
| (2,047,354 | ) | 60,961,798 | (4,715,301 | ) | 19,046,123 | 10,506,333 | (12,005,054 | ) | ||||||||||||||||||||||||||
| (7,209,324 | ) | 94,957,018 | 48,744,579 | 62,128,893 | 17,297,356 | 7,684,323 | ||||||||||||||||||||||||||||
| 384,860,324 | 289,903,306 | 349,652,243 | 287,523,350 | 149,706,848 | 142,022,525 | |||||||||||||||||||||||||||||
| $ | 377,651,000 | $ | 384,860,324 | $ | 398,396,822 | $ | 349,652,243 | $ | 167,004,204 | $ | 149,706,848 | |||||||||||||||||||||||
| $ | 15,233 | $ | (117,898 | ) | $ | 2,606,890 | $ | 71,214 | $ | 2,909,203 | $ | (306,157 | ) | |||||||||||||||||||||
| The accompanying notes are an integral part of these financial statements. | 51 |
GOLDMAN SACHS U.S. EQUITY DIVIDEND AND PREMIUM FUND
Financial Highlights
Selected Data for a Share Outstanding Throughout Each Period
| Income (loss) from investment operations | Distributions to shareholders | |||||||||||||||||||||||||||||
| Year - Share Class | Net asset | Net investment income(a) | Net realized and unrealized gain (loss) | Total from investment operations | From net investment income | From net realized gains | Total distributions | |||||||||||||||||||||||
| FOR THE SIX MONTHS ENDED JUNE 30, (UNAUDITED) | ||||||||||||||||||||||||||||||
2013 - A | $ | 9.60 | $ | 0.10 | $ | 0.96 | $ | 1.06 | $ | (0.10 | ) | $ | — | $ | (0.10 | ) | ||||||||||||||
2013 - C | 9.59 | 0.06 | 0.95 | 1.01 | (0.06 | ) | — | (0.06 | ) | |||||||||||||||||||||
2013 - Institutional | 9.58 | 0.12 | 0.96 | 1.08 | (0.12 | ) | — | (0.12 | ) | |||||||||||||||||||||
2013 - IR | 9.59 | 0.11 | 0.96 | 1.07 | (0.11 | ) | — | (0.11 | ) | |||||||||||||||||||||
| FOR THE FISCAL YEARS ENDED DECEMBER 31, | ||||||||||||||||||||||||||||||
2012 - A | 9.39 | 0.25 | 0.71 | 0.96 | (0.24 | ) | (0.51 | ) | (0.75 | ) | ||||||||||||||||||||
2012 - C | 9.38 | 0.18 | 0.71 | 0.89 | (0.17 | ) | (0.51 | ) | (0.68 | ) | ||||||||||||||||||||
2012 - Institutional | 9.37 | 0.28 | 0.72 | 1.00 | (0.28 | ) | (0.51 | ) | (0.79 | ) | ||||||||||||||||||||
2012 - IR | 9.38 | 0.29 | 0.70 | 0.99 | (0.27 | ) | (0.51 | ) | (0.78 | ) | ||||||||||||||||||||
2011 - A | 9.38 | 0.18 | (e) | 0.27 | 0.45 | (0.19 | ) | (0.25 | ) | (0.44 | ) | |||||||||||||||||||
2011 - C | 9.38 | 0.11 | (e) | 0.27 | 0.38 | (0.13 | ) | (0.25 | ) | (0.38 | ) | |||||||||||||||||||
2011 - Institutional | 9.36 | 0.22 | (e) | 0.27 | 0.49 | (0.23 | ) | (0.25 | ) | (0.48 | ) | |||||||||||||||||||
2011 - IR | 9.38 | 0.21 | (e) | 0.26 | 0.47 | (0.22 | ) | (0.25 | ) | (0.47 | ) | |||||||||||||||||||
2010 - A | 8.29 | 0.16 | (f) | 1.08 | 1.24 | (0.15 | ) | — | (0.15 | ) | ||||||||||||||||||||
2010 - C | 8.29 | 0.13 | (f) | 1.05 | 1.18 | (0.09 | ) | — | (0.09 | ) | ||||||||||||||||||||
2010 - Institutional | 8.28 | 0.26 | (f) | 1.01 | 1.27 | (0.19 | ) | — | (0.19 | ) | ||||||||||||||||||||
2010 - IR (Commenced August 31, 2010) | 8.06 | 0.11 | (f) | 1.30 | 1.41 | (0.09 | ) | — | (0.09 | ) | ||||||||||||||||||||
2009 - A | 6.86 | 0.13 | 1.43 | 1.56 | (0.13 | ) | — | (0.13 | ) | |||||||||||||||||||||
2009 - C | 6.87 | 0.08 | 1.42 | 1.50 | (0.08 | ) | — | (0.08 | ) | |||||||||||||||||||||
2009 - Institutional | 6.85 | 0.17 | 1.42 | 1.59 | (0.16 | ) | — | (0.16 | ) | |||||||||||||||||||||
2008 - A | 10.34 | 0.19 | (3.46 | ) | (3.27 | ) | (0.19 | ) | (0.02 | ) | (0.21 | ) | ||||||||||||||||||
2008 - C | 10.35 | 0.12 | (3.46 | ) | (3.34 | ) | (0.12 | ) | (0.02 | ) | (0.14 | ) | ||||||||||||||||||
2008 - Institutional | 10.34 | 0.23 | (3.47 | ) | (3.24 | ) | (0.23 | ) | (0.02 | ) | (0.25 | ) | ||||||||||||||||||
| (a) | Calculated based on the average shares outstanding methodology. |
| (b) | Assumes investment at the net asset value at the beginning of the period, reinvestment of all distributions, a complete redemption of the investment at the net asset value at the end of the period and no sales or redemption charges. Total returns would be reduced if a sales or redemption charge was taken into account. Returns do not reflect the deduction of taxes that a shareholder would pay on Fund distributions or the redemption of Fund shares. Total returns for periods less than one full year are not annualized. |
| (c) | The Fund’s portfolio turnover rate is calculated in accordance with regulatory requirements, without regard to transactions involving short term investments and certain derivatives. If such transactions were included, the Fund’s portfolio turnover rate may be higher. |
| (d) | Annualized. |
| (e) | Reflects income recognized from special dividends which amounted to $0.01 per share and 0.12% of average net assets. |
| (f) | Reflects income recognized from special dividends which amounted to $0.05 per share and 0.56% of average net assets. |
| 52 | The accompanying notes are an integral part of these financial statements. |
GOLDMAN SACHS U.S. EQUITY DIVIDEND AND PREMIUM FUND
Net asset of period | Total return(b) | Net assets, end of period (in 000s) | Ratio of net expenses to average net assets | Ratio of total expenses to average net assets | Ratio of to average net assets | Portfolio turnover rate(c) | ||||||||||||||||||||||||||||||||||
| $ | 10.56 | 11.06 | % | $ | 160,641 | 1.20 | %(d) | 1.21 | %(d) | 1.91 | %(d) | 52 | % | |||||||||||||||||||||||||||
| 10.54 | 10.58 | 56,473 | 1.95 | (d) | 1.96 | (d) | 1.16 | (d) | 52 | |||||||||||||||||||||||||||||||
| 10.54 | 11.30 | 1,011,645 | 0.80 | (d) | 0.81 | (d) | 2.31 | (d) | 52 | |||||||||||||||||||||||||||||||
| 10.55 | 11.21 | 26,799 | 0.95 | (d) | 0.96 | (d) | 2.16 | (d) | 52 | |||||||||||||||||||||||||||||||
| 9.60 | 10.30 | 145,184 | 1.21 | 1.22 | 2.48 | 67 | ||||||||||||||||||||||||||||||||||
| 9.59 | 9.57 | 45,243 | 1.96 | 1.97 | 1.83 | 67 | ||||||||||||||||||||||||||||||||||
| 9.58 | 10.74 | 895,258 | 0.81 | 0.82 | 2.83 | 67 | ||||||||||||||||||||||||||||||||||
| 9.59 | 10.60 | 19,787 | 0.96 | 0.97 | 2.90 | 67 | ||||||||||||||||||||||||||||||||||
| 9.39 | 4.90 | 70,499 | 1.24 | 1.25 | 1.94 | (e) | 90 | |||||||||||||||||||||||||||||||||
| 9.38 | 4.03 | 17,378 | 1.99 | 2.00 | 1.14 | (e) | 90 | |||||||||||||||||||||||||||||||||
| 9.37 | 5.31 | 688,194 | 0.84 | 0.85 | 2.29 | (e) | 90 | |||||||||||||||||||||||||||||||||
| 9.38 | 5.05 | 1,425 | 0.99 | 1.00 | 2.20 | (e) | 90 | |||||||||||||||||||||||||||||||||
| 9.38 | 15.07 | 37,112 | 1.24 | 1.26 | 1.84 | (f) | 140 | |||||||||||||||||||||||||||||||||
| 9.38 | 14.32 | 10,851 | 1.99 | 2.01 | 1.52 | (f) | 140 | |||||||||||||||||||||||||||||||||
| 9.36 | 15.53 | 408,032 | 0.84 | 0.86 | 2.95 | (f) | 140 | |||||||||||||||||||||||||||||||||
| 9.38 | 17.53 | 1 | 0.99 | (d) | 1.01 | (d) | 4.04 | (d)(f) | 140 | |||||||||||||||||||||||||||||||
| 8.29 | 23.03 | 139,340 | 1.24 | 1.30 | 1.85 | 125 | ||||||||||||||||||||||||||||||||||
| 8.29 | 21.93 | 9,540 | 1.99 | 2.05 | 1.10 | 125 | ||||||||||||||||||||||||||||||||||
| 8.28 | 23.55 | 147,446 | 0.84 | 0.90 | 2.30 | 125 | ||||||||||||||||||||||||||||||||||
| 6.86 | (31.86 | ) | 115,172 | 1.24 | 1.29 | 2.12 | 61 | |||||||||||||||||||||||||||||||||
| 6.87 | (32.36 | ) | 8,577 | 1.99 | 2.04 | 1.37 | 61 | |||||||||||||||||||||||||||||||||
| 6.85 | (31.65 | ) | 75,190 | 0.84 | 0.89 | 2.62 | 61 | |||||||||||||||||||||||||||||||||
| The accompanying notes are an integral part of these financial statements. | 53 |
GOLDMAN SACHS INTERNATIONAL EQUITY DIVIDEND AND PREMIUM FUND
Financial Highlights
Selected Data for a Share Outstanding Throughout Each Period
| Income (loss) from investment operations | Distributions to shareholders | |||||||||||||||||||||||||||||||||
| Year - Share Class | Net asset | Net investment income | Net realized and unrealized gain (loss) | Total from investment operations | From net investment income | From net realized gains | From capital | Total distributions | ||||||||||||||||||||||||||
| FOR THE SIX MONTHS ENDED JUNE 30, (UNAUDITED) | ||||||||||||||||||||||||||||||||||
2013 - A | $ | 7.31 | $ | 0.14 | (c) | $ | (0.11 | ) | $ | 0.03 | $ | (0.13 | ) | $ | — | $ | — | $ | (0.13 | ) | ||||||||||||||
2013 - C | 7.15 | 0.12 | (c) | (0.12 | ) | — | (d) | (0.11 | ) | — | — | (0.11 | ) | |||||||||||||||||||||
2013 - Institutional | 7.21 | 0.15 | (c) | (0.10 | ) | 0.05 | (0.15 | ) | — | — | (0.15 | ) | ||||||||||||||||||||||
2013 - IR | 7.20 | 0.14 | (c) | (0.10 | ) | 0.04 | (0.14 | ) | — | — | (0.14 | ) | ||||||||||||||||||||||
| FOR THE FISCAL YEARS ENDED DECEMBER 31, | ||||||||||||||||||||||||||||||||||
2012 - A | 6.60 | 0.16 | 0.78 | 0.94 | (0.17 | ) | (0.06 | ) | — | (0.23 | ) | |||||||||||||||||||||||
2012 - C | 6.47 | 0.13 | 0.74 | 0.87 | (0.13 | ) | (0.06 | ) | — | (0.19 | ) | |||||||||||||||||||||||
2012 - Institutional | 6.52 | 0.21 | 0.74 | 0.95 | (0.20 | ) | (0.06 | ) | — | (0.26 | ) | |||||||||||||||||||||||
2012 - IR | 6.52 | 0.26 | 0.67 | 0.93 | (0.19 | ) | (0.06 | ) | — | (0.25 | ) | |||||||||||||||||||||||
2011 - A | 8.17 | 0.21 | (f) | (1.20 | ) | (0.99 | ) | (0.23 | ) | (0.35 | ) | — | (0.58 | ) | ||||||||||||||||||||
2011 - C | 8.02 | 0.16 | (f) | (1.19 | ) | (1.03 | ) | (0.17 | ) | (0.35 | ) | — | (0.52 | ) | ||||||||||||||||||||
2011 - Institutional | 8.07 | 0.24 | (f) | (1.18 | ) | (0.94 | ) | (0.26 | ) | (0.35 | ) | — | (0.61 | ) | ||||||||||||||||||||
2011 - IR | 8.06 | 0.24 | (f) | (1.18 | ) | (0.94 | ) | (0.25 | ) | (0.35 | ) | — | (0.60 | ) | ||||||||||||||||||||
2010 - A | 7.86 | 0.16 | (c) | 0.41 | 0.57 | (0.14 | ) | (0.12 | ) | — | (0.26 | ) | ||||||||||||||||||||||
2010 - C | 7.73 | 0.10 | (c) | 0.41 | 0.51 | (0.10 | ) | (0.12 | ) | — | (0.22 | ) | ||||||||||||||||||||||
2010 - Institutional | 7.76 | 0.18 | (c) | 0.42 | 0.60 | (0.17 | ) | (0.12 | ) | — | (0.29 | ) | ||||||||||||||||||||||
2010 - IR (Commenced August 31, 2010) | 7.08 | 0.04 | (c) | 1.10 | 1.14 | (0.04 | ) | (0.12 | ) | — | (0.16 | ) | ||||||||||||||||||||||
2009 - A | 6.36 | 0.09 | (c) | 1.53 | 1.62 | (0.12 | ) | — | — | (0.12 | ) | |||||||||||||||||||||||
2009 - C | 6.28 | 0.02 | (c) | 1.52 | 1.54 | (0.09 | ) | — | — | (0.09 | ) | |||||||||||||||||||||||
2009 - Institutional | 6.30 | 0.14 | (c) | 1.47 | 1.61 | (0.15 | ) | — | — | (0.15 | ) | |||||||||||||||||||||||
| FOR THE PERIOD ENDED DECEMBER 31, | ||||||||||||||||||||||||||||||||||
2008 - A (Commenced January 31, 2008) | 10.00 | 0.18 | (c) | (3.55 | ) | (3.37 | ) | (0.21 | ) | — | (0.06 | ) | (0.27 | ) | ||||||||||||||||||||
2008 - C (Commenced January 31, 2008) | 10.00 | 0.15 | (c) | (3.66 | ) | (3.51 | ) | (0.15 | ) | — | (0.06 | ) | (0.21 | ) | ||||||||||||||||||||
2008 - Institutional (Commenced January 31, 2008) | 10.00 | 0.31 | (c) | (3.73 | ) | (3.42 | ) | (0.22 | ) | — | (0.06 | ) | (0.28 | ) | ||||||||||||||||||||
| (a) | Assumes investment at the net asset value at the beginning of the period, reinvestment of all distributions, a complete redemption of the investment at the net asset value at the end of the period and no sales or redemption charges. Total returns would be reduced if a sales or redemption charge was taken into account. Returns do not reflect the deduction of taxes that a shareholder would pay on Fund distributions or the redemption of Fund shares. Total returns for periods less than one full year are not annualized. |
| (b) | The Fund’s portfolio turnover rate is calculated in accordance with regulatory requirements, without regard to transactions involving short term investments and certain derivatives. If such transactions were included, the Fund’s portfolio turnover rate may be higher. |
| (c) | Calculated based on average shares outstanding methodology. |
| (d) | Amount is less than $0.005 per share. |
| (e) | Annualized. |
| (f) | Reflects income recognized from a corporate action which amounted to $0.01 per share and 0.13% of average net assets. |
| 54 | The accompanying notes are an integral part of these financial statements. |
GOLDMAN SACHS INTERNATIONAL EQUITY DIVIDEND AND PREMIUM FUND
| Net asset value, end of period | Total return(a) | Net assets, period (in 000s) | Ratio of net expenses to average net assets | Ratio of total expenses to average net assets | Ratio of to average net assets | Portfolio turnover rate(b) | ||||||||||||||||||||||||||||||||||
| $ | 7.21 | 0.47 | % | $ | 13,376 | 1.33 | %(e) | 1.36 | %(e) | 3.68 | %(e) | 72 | % | |||||||||||||||||||||||||||
| 7.04 | 0.00 | 2,090 | 2.08 | (e) | 2.12 | (e) | 3.19 | (e) | 72 | |||||||||||||||||||||||||||||||
| 7.11 | 0.68 | 360,127 | 0.93 | (e) | 0.97 | (e) | 4.10 | (e) | 72 | |||||||||||||||||||||||||||||||
| 7.10 | 0.61 | 2,058 | 1.08 | (e) | 1.11 | (e) | 3.90 | (e) | 72 | |||||||||||||||||||||||||||||||
| 7.31 | 14.48 | 14,952 | 1.30 | 1.37 | 3.51 | 60 | ||||||||||||||||||||||||||||||||||
| 7.15 | 13.71 | 1,640 | 2.05 | 2.11 | 1.99 | 60 | ||||||||||||||||||||||||||||||||||
| 7.21 | 14.93 | 366,136 | 0.90 | 0.95 | 2.68 | 60 | ||||||||||||||||||||||||||||||||||
| 7.20 | 14.56 | 2,133 | 1.05 | 1.10 | 4.06 | 60 | ||||||||||||||||||||||||||||||||||
| 6.60 | (12.44 | ) | 171,063 | 1.30 | 1.38 | 2.74 | (f) | 51 | ||||||||||||||||||||||||||||||||
| 6.47 | (13.06 | ) | 1,502 | 2.05 | 2.13 | 1.87 | (f) | 51 | ||||||||||||||||||||||||||||||||
| 6.52 | (11.99 | ) | 116,023 | 0.90 | 0.98 | 3.17 | (f) | 51 | ||||||||||||||||||||||||||||||||
| 6.52 | (12.01 | ) | 1,315 | 1.05 | 1.13 | 0.54 | (f) | 51 | ||||||||||||||||||||||||||||||||
| 8.17 | 7.59 | 158,348 | 1.30 | 1.45 | 2.06 | 41 | ||||||||||||||||||||||||||||||||||
| 8.02 | 6.81 | 1,342 | 2.05 | 2.20 | 1.28 | 41 | ||||||||||||||||||||||||||||||||||
| 8.07 | 8.10 | 97,651 | 0.90 | 1.05 | 2.38 | 41 | ||||||||||||||||||||||||||||||||||
| 8.06 | 16.12 | 1 | 1.05 | (e) | 1.20 | (e) | 1.48 | (e) | 41 | |||||||||||||||||||||||||||||||
| 7.86 | 26.17 | 67,681 | 1.30 | 2.09 | 1.23 | 98 | ||||||||||||||||||||||||||||||||||
| 7.73 | 25.12 | 894 | 2.05 | 2.84 | 0.28 | 98 | ||||||||||||||||||||||||||||||||||
| 7.76 | 26.06 | 35,883 | 0.90 | 1.69 | 2.07 | 98 | ||||||||||||||||||||||||||||||||||
| 6.36 | (34.60 | ) | 9,673 | 1.30 | (e) | 3.50 | (e) | 2.71 | (e) | 130 | ||||||||||||||||||||||||||||||
| 6.28 | (35.82 | ) | 23 | 2.05 | (e) | 4.25 | (e) | 2.20 | (e) | 130 | ||||||||||||||||||||||||||||||
| 6.30 | (34.98 | ) | 12,275 | 0.90 | (e) | 3.10 | (e) | 4.05 | (e) | 130 | ||||||||||||||||||||||||||||||
| The accompanying notes are an integral part of these financial statements. | 55 |
GOLDMAN SACHS STRUCTURED TAX-MANAGED EQUITY FUND
Financial Highlights
Selected Data for a Share Outstanding Throughout Each Period
| Income (loss) from investment operations | ||||||||||||||||||||||
| Year - Share Class | Net asset value, beginning of period | Net investment income(a) | Net realized and unrealized gain (loss) | Total from investment operations | Distributions to Shareholders from net investment income | |||||||||||||||||
| FOR THE SIX MONTHS ENDED JUNE 30, (UNAUDITED) | ||||||||||||||||||||||
2013 - A | $ | 11.38 | $ | 0.06 | $ | 1.66 | $ | 1.72 | $ | — | ||||||||||||
2013 - B | 11.05 | 0.02 | 1.60 | 1.62 | — | |||||||||||||||||
2013 - C | 10.95 | 0.01 | 1.59 | 1.60 | — | |||||||||||||||||
2013 - Institutional | 11.54 | 0.09 | 1.67 | 1.76 | — | |||||||||||||||||
2013 - Service | 11.46 | 0.06 | 1.66 | 1.72 | — | |||||||||||||||||
2013 - IR | 11.55 | 0.08 | 1.68 | 1.76 | — | |||||||||||||||||
| FOR THE FISCAL YEARS ENDED DECEMBER 31, | ||||||||||||||||||||||
2012 - A | 9.94 | 0.12 | 1.44 | (e) | 1.56 | (0.12 | ) | |||||||||||||||
2012 - B | 9.64 | 0.04 | 1.39 | (e) | 1.43 | (0.02 | ) | |||||||||||||||
2012 - C | 9.57 | 0.05 | 1.38 | (e) | 1.43 | (0.05 | ) | |||||||||||||||
2012 - Institutional | 10.08 | 0.18 | 1.46 | (e) | 1.64 | (0.18 | ) | |||||||||||||||
2012 - Service | 10.01 | 0.12 | 1.45 | (e) | 1.57 | (0.12 | ) | |||||||||||||||
2012 - IR | 10.09 | 0.16 | 1.46 | (e) | 1.62 | (0.16 | ) | |||||||||||||||
2011 - A | 9.73 | 0.09 | (f) | 0.20 | 0.29 | (0.08 | ) | |||||||||||||||
2011 - B | 9.44 | 0.01 | (f) | 0.21 | 0.22 | (0.02 | ) | |||||||||||||||
2011 - C | 9.39 | 0.01 | (f) | 0.20 | 0.21 | (0.03 | ) | |||||||||||||||
2011 - Institutional | 9.89 | 0.13 | (f) | 0.21 | 0.34 | (0.15 | ) | |||||||||||||||
2011 - Service | 9.81 | 0.07 | (f) | 0.22 | 0.29 | (0.09 | ) | |||||||||||||||
2011 - IR | 9.89 | 0.10 | (f) | 0.23 | 0.33 | (0.13 | ) | |||||||||||||||
2010 - A | 8.64 | 0.08 | 1.08 | 1.16 | (0.07 | ) | ||||||||||||||||
2010 - B | 8.38 | 0.01 | 1.05 | 1.06 | — | |||||||||||||||||
2010 - C | 8.33 | 0.01 | 1.05 | 1.06 | — | |||||||||||||||||
2010 - Institutional | 8.78 | 0.11 | 1.11 | 1.22 | (0.11 | ) | ||||||||||||||||
2010 - Service | 8.72 | 0.07 | 1.09 | 1.16 | (0.07 | ) | ||||||||||||||||
2010 - IR (Commenced August 31, 2010) | 8.18 | 0.03 | 1.78 | 1.81 | (0.10 | ) | ||||||||||||||||
2009 - A | 7.20 | 0.09 | (g) | 1.45 | 1.54 | (0.10 | ) | |||||||||||||||
2009 - B | 6.97 | 0.04 | (g) | 1.39 | 1.43 | (0.02 | ) | |||||||||||||||
2009 - C | 6.94 | 0.04 | (g) | 1.39 | 1.43 | (0.04 | ) | |||||||||||||||
2009 - Institutional | 7.31 | 0.14 | (g) | 1.47 | 1.61 | (0.14 | ) | |||||||||||||||
2009 - Service | 7.26 | 0.09 | (g) | 1.46 | 1.55 | (0.09 | ) | |||||||||||||||
2008 - A | 11.50 | 0.08 | (4.31 | ) | (4.23 | ) | (0.07 | ) | ||||||||||||||
2008 - B | 11.10 | — | (h) | (4.13 | ) | (4.13 | ) | — | ||||||||||||||
2008 - C | 11.06 | 0.01 | (4.13 | ) | (4.12 | ) | — | |||||||||||||||
2008 - Institutional | 11.69 | 0.12 | (4.38 | ) | (4.26 | ) | (0.12 | ) | ||||||||||||||
2008 - Service | 11.49 | 0.06 | (4.29 | ) | (4.23 | ) | — | |||||||||||||||
| (a) | Calculated based on the average shares outstanding methodology. |
| (b) | Assumes investment at the net asset value at the beginning of the period, reinvestment of all distributions, a complete redemption of the investment at the net asset value at the end of the period and no sales or redemption charges. Total returns would be reduced if a sales or redemption charge was taken into account. Returns do not reflect the deduction of taxes that a shareholder would pay on Fund distributions or the redemption of Fund shares. Total returns for periods less than one full year are not annualized. |
| (c) | The Fund’s portfolio turnover rate is calculated in accordance with regulatory requirements, without regard to transactions involving short term investments and certain derivatives. If such transactions were included, the Fund’s portfolio turnover rate may be higher. |
| (d) | Annualized. |
| (e) | Reflects payment from affiliate relating to certain investment transactions which amounted to $0.02 per share. Excluding such payment, the total return would have been 15.49%, 14.74%, 14.68%, 15.92%, 15.36% and 15.80%, respectively. |
| (f) | Reflects income recognized from special dividends which amounted to $0.02 per share and 0.18% of average net assets. |
| (g) | Reflects income recognized from special dividends which amounted to $0.01 per share and 0.01% of average net assets. |
| (h) | Amount is less than $0.005 per share. |
| 56 | The accompanying notes are an integral part of these financial statements. |
GOLDMAN SACHS STRUCTURED TAX-MANAGED EQUITY FUND
| Net asset value, end of period | Total return(b) | Net assets, (in 000s) | Ratio of net expenses to average net assets | Ratio of total expenses to average net assets | Ratio of net investment income (loss) to average net assets | Portfolio turnover rate(c) | ||||||||||||||||||||||||||||||||||
| $ | 13.10 | 15.11 | % | $ | 30,185 | 1.12 | %(d) | 1.23 | %(d) | 1.00 | %(d) | 65 | % | |||||||||||||||||||||||||||
| 12.67 | 14.66 | 595 | 1.87 | (d) | 1.98 | (d) | 0.25 | (d) | 65 | |||||||||||||||||||||||||||||||
| 12.55 | 14.61 | 9,078 | 1.87 | (d) | 1.98 | (d) | 0.25 | (d) | 65 | |||||||||||||||||||||||||||||||
| 13.30 | 15.35 | 357,844 | 0.72 | (d) | 0.83 | (d) | 1.39 | (d) | 65 | |||||||||||||||||||||||||||||||
| 13.18 | 15.11 | 41 | 1.22 | (d) | 1.33 | (d) | 0.90 | (d) | 65 | |||||||||||||||||||||||||||||||
| 13.31 | 15.24 | 654 | 0.87 | (d) | 0.98 | (d) | 1.23 | (d) | 65 | |||||||||||||||||||||||||||||||
| 11.38 | 15.69 | (e) | 35,890 | 1.09 | 1.23 | 1.13 | 184 | |||||||||||||||||||||||||||||||||
| 11.05 | 14.95 | (e) | 584 | 1.84 | 1.98 | 0.35 | 184 | |||||||||||||||||||||||||||||||||
| 10.95 | 14.89 | (e) | 8,228 | 1.84 | 1.97 | 0.44 | 184 | |||||||||||||||||||||||||||||||||
| 11.54 | 16.12 | (e) | 304,435 | 0.69 | 0.82 | 1.65 | 184 | |||||||||||||||||||||||||||||||||
| 11.46 | 15.56 | (e) | 40 | 1.19 | 1.32 | 1.11 | 184 | |||||||||||||||||||||||||||||||||
| 11.55 | 16.01 | (e) | 476 | 0.84 | 0.97 | 1.42 | 184 | |||||||||||||||||||||||||||||||||
| 9.94 | 3.02 | 51,064 | 1.09 | 1.24 | 0.85 | (f) | 99 | |||||||||||||||||||||||||||||||||
| 9.64 | 2.18 | 895 | 1.84 | 1.99 | 0.12 | (f) | 99 | |||||||||||||||||||||||||||||||||
| 9.57 | 2.22 | 7,964 | 1.84 | 1.99 | 0.14 | (f) | 99 | |||||||||||||||||||||||||||||||||
| 10.08 | 3.43 | 227,070 | 0.69 | 0.84 | 1.31 | (f) | 99 | |||||||||||||||||||||||||||||||||
| 10.01 | 2.92 | 36 | 1.19 | 1.34 | 0.72 | (f) | 99 | |||||||||||||||||||||||||||||||||
| 10.09 | 3.35 | 494 | 0.84 | 0.99 | 1.01 | (f) | 99 | |||||||||||||||||||||||||||||||||
| 9.73 | 13.46 | 91,857 | 1.09 | 1.25 | 0.82 | 200 | ||||||||||||||||||||||||||||||||||
| 9.44 | 12.65 | 1,539 | 1.84 | 2.00 | 0.08 | 200 | ||||||||||||||||||||||||||||||||||
| 9.39 | 12.59 | 9,484 | 1.84 | 2.00 | 0.07 | 200 | ||||||||||||||||||||||||||||||||||
| 9.89 | 14.04 | 200,795 | 0.69 | 0.85 | 1.22 | 200 | ||||||||||||||||||||||||||||||||||
| 9.81 | 13.34 | 59 | 1.19 | 1.35 | 0.69 | 200 | ||||||||||||||||||||||||||||||||||
| 9.89 | 22.18 | 1 | 0.84 | (d) | 1.00 | (d) | 0.97 | (d) | 200 | |||||||||||||||||||||||||||||||
| 8.64 | 21.43 | 90,909 | 1.09 | 1.28 | 1.37 | (g) | 352 | |||||||||||||||||||||||||||||||||
| 8.38 | 20.48 | 2,259 | 1.84 | 2.03 | 0.62 | (g) | 352 | |||||||||||||||||||||||||||||||||
| 8.33 | 20.56 | 10,887 | 1.84 | 2.03 | 0.63 | (g) | 352 | |||||||||||||||||||||||||||||||||
| 8.78 | 21.90 | 133,016 | 0.69 | 0.88 | 1.88 | (g) | 352 | |||||||||||||||||||||||||||||||||
| 8.72 | 21.41 | 48 | 1.19 | 1.38 | 1.28 | (g) | 352 | |||||||||||||||||||||||||||||||||
| 7.20 | (36.66 | ) | 112,426 | 1.09 | 1.27 | 0.81 | 153 | |||||||||||||||||||||||||||||||||
| 6.97 | (37.13 | ) | 5,169 | 1.84 | 2.02 | (0.02 | ) | 153 | ||||||||||||||||||||||||||||||||
| 6.94 | (37.08 | ) | 13,977 | 1.84 | 2.02 | 0.06 | 153 | |||||||||||||||||||||||||||||||||
| 7.31 | (36.34 | ) | 67,367 | 0.69 | 0.87 | 1.27 | 153 | |||||||||||||||||||||||||||||||||
| 7.26 | (36.74 | ) | 55 | 1.19 | 1.37 | 0.57 | 153 | |||||||||||||||||||||||||||||||||
| The accompanying notes are an integral part of these financial statements. | 57 |
GOLDMAN SACHS STRUCTURED INTERNATIONAL TAX-MANAGED EQUITY FUND
Financial Highlights
Selected Data for a Share Outstanding Throughout Each Period
| Income (loss) from investment operations | ||||||||||||||||||||||
| Year - Share Class | Net asset value, beginning of period | Net investment income | Net realized and unrealized gain (loss) | Total from investment operations | Distributions to shareholders from net investment income | |||||||||||||||||
| FOR THE SIX MONTHS ENDED JUNE 30, (UNAUDITED) | ||||||||||||||||||||||
2013 - A | $ | 7.62 | $ | 0.09 | (c) | $ | 0.25 | $ | 0.34 | $ | — | |||||||||||
2013 - C | 7.55 | 0.11 | (c) | 0.20 | 0.31 | — | ||||||||||||||||
2013 - Institutional | 7.59 | 0.16 | (c) | 0.19 | 0.35 | — | ||||||||||||||||
2013 - IR | 7.66 | 0.23 | (c) | 0.11 | 0.34 | — | ||||||||||||||||
| FOR THE FISCAL YEARS ENDED DECEMBER 31, | ||||||||||||||||||||||
2012 - A | 6.65 | 0.17 | (c) | 0.98 | 1.15 | (0.18 | ) | |||||||||||||||
2012 - C | 6.64 | 0.11 | (c) | 0.96 | 1.07 | (0.16 | ) | |||||||||||||||
2012 - Institutional | 6.64 | 0.19 | (c) | 0.98 | 1.17 | (0.22 | ) | |||||||||||||||
2012 - IR | 6.64 | 0.35 | (c) | 0.82 | 1.17 | (0.15 | ) | |||||||||||||||
2011 - A | 7.90 | 0.20 | (c)(e) | (1.25 | ) | (1.05 | ) | (0.20 | ) | |||||||||||||
2011 - C | 7.88 | 0.13 | (c)(e) | (1.23 | ) | (1.10 | ) | (0.14 | ) | |||||||||||||
2011 - Institutional | 7.90 | 0.21 | (c)(e) | (1.23 | ) | (1.02 | ) | (0.24 | ) | |||||||||||||
2011 - IR | 7.90 | 0.20 | (c)(e) | (1.24 | ) | (1.04 | ) | (0.22 | ) | |||||||||||||
2010 - A | 7.40 | 0.13 | (c) | 0.51 | 0.64 | (0.14 | ) | |||||||||||||||
2010 - C | 7.39 | 0.08 | (c) | 0.50 | 0.58 | (0.09 | ) | |||||||||||||||
2010 - Institutional | 7.39 | 0.15 | (c) | 0.53 | 0.68 | (0.17 | ) | |||||||||||||||
2010 - IR (Commenced August 31, 2010) | 6.82 | 0.03 | (c) | 1.21 | 1.24 | (0.16 | ) | |||||||||||||||
2009 - A | 6.07 | 0.13 | (c) | 1.32 | 1.45 | (0.12 | ) | |||||||||||||||
2009 - C | 6.06 | 0.09 | (c) | 1.31 | 1.40 | (0.07 | ) | |||||||||||||||
2009 - Institutional | 6.06 | 0.15 | (c) | 1.33 | 1.48 | (0.15 | ) | |||||||||||||||
| FOR THE PERIOD ENDED DECEMBER 31, | ||||||||||||||||||||||
2008 - A (Commenced January 31, 2008) | 10.00 | 0.17 | (3.93 | ) | (3.76 | ) | (0.17 | ) | ||||||||||||||
2008 - C (Commenced January 31, 2008) | 10.00 | 0.13 | (3.94 | ) | (3.81 | ) | (0.13 | ) | ||||||||||||||
2008 - Institutional (Commenced January 31, 2008) | 10.00 | 0.19 | (3.94 | ) | (3.75 | ) | (0.19 | ) | ||||||||||||||
| (a) | Assumes investment at the net asset value at the beginning of the period, reinvestment of all distributions, a complete redemption of the investment at the net asset value at the end of the period and no sales or redemption charges. Total returns would be reduced if a sales or redemption charge was taken into account. Returns do not reflect the deduction of taxes that a shareholder would pay on Fund distributions or the redemption of Fund shares. Total returns for periods less than one full year are not annualized. |
| (b) | The Fund’s portfolio turnover rate is calculated in accordance with regulatory requirements, without regard to transactions involving short term investments and certain derivatives. If such transactions were included, the Fund’s portfolio turnover rate may be higher. |
| (c) | Calculated based on the average shares outstanding methodology. |
| (d) | Annualized. |
| (e) | Reflects income recognized from special dividends which amounted to $0.01 per share and 0.16% of average net assets. |
| 58 | The accompanying notes are an integral part of these financial statements. |
GOLDMAN SACHS STRUCTURED INTERNATIONAL TAX-MANAGED EQUITY FUND
| Net asset value, end of period | Total return(a) | Net assets, end of period (in 000s) | Ratio of net expenses to average net assets | Ratio of total expenses to average net assets | Ratio of net investment income to average net assets | Portfolio turnover rate(b) | ||||||||||||||||||||||||||||||||||
| $ | 7.96 | 4.46 | % | $ | 3,730 | 1.28 | %(d) | 1.53 | %(d) | 2.27 | %(d) | 54 | % | |||||||||||||||||||||||||||
| 7.86 | 4.11 | 33 | 2.05 | (d) | 2.27 | (d) | 2.90 | (d) | 54 | |||||||||||||||||||||||||||||||
| 7.94 | 4.61 | 163,056 | 0.91 | (d) | 1.12 | (d) | 4.07 | (d) | 54 | |||||||||||||||||||||||||||||||
| 8.00 | 4.44 | 186 | 1.09 | (d) | 1.24 | (d) | 5.71 | (d) | 54 | |||||||||||||||||||||||||||||||
| 7.62 | 17.25 | 15,384 | 1.26 | 1.59 | 2.44 | 182 | ||||||||||||||||||||||||||||||||||
| 7.55 | 16.20 | 32 | 2.01 | 2.30 | 1.52 | 182 | ||||||||||||||||||||||||||||||||||
| 7.59 | 17.71 | 134,290 | 0.86 | 1.17 | 2.69 | 182 | ||||||||||||||||||||||||||||||||||
| 7.66 | 17.68 | 1 | 1.02 | 1.36 | 5.14 | 182 | ||||||||||||||||||||||||||||||||||
| 6.65 | (13.33 | ) | 40,837 | 1.26 | 1.57 | 2.60 | (e) | 88 | ||||||||||||||||||||||||||||||||
| 6.64 | (13.88 | ) | 19 | 2.01 | 2.32 | 1.72 | (e) | 88 | ||||||||||||||||||||||||||||||||
| 6.64 | (12.92 | ) | 101,165 | 0.86 | 1.17 | 2.81 | (e) | 88 | ||||||||||||||||||||||||||||||||
| 6.64 | (13.11 | ) | 1 | 1.01 | 1.32 | 2.68 | (e) | 88 | ||||||||||||||||||||||||||||||||
| 7.90 | 8.64 | 75,854 | 1.26 | 1.56 | 1.75 | 70 | ||||||||||||||||||||||||||||||||||
| 7.88 | 7.89 | 24 | 2.01 | 2.31 | 1.05 | 70 | ||||||||||||||||||||||||||||||||||
| 7.90 | 9.17 | 85,604 | 0.86 | 1.16 | 2.12 | 70 | ||||||||||||||||||||||||||||||||||
| 7.90 | 18.21 | 1 | 1.01 | (d) | 1.31 | (d) | 1.26 | (d) | 70 | |||||||||||||||||||||||||||||||
| 7.40 | 23.98 | 77,469 | 1.26 | 1.67 | 2.00 | 101 | ||||||||||||||||||||||||||||||||||
| 7.39 | 23.13 | 8 | 2.01 | 2.42 | 1.38 | 101 | ||||||||||||||||||||||||||||||||||
| 7.39 | 24.47 | 53,159 | 0.86 | 1.27 | 2.24 | 101 | ||||||||||||||||||||||||||||||||||
| 6.07 | (37.56 | ) | 71,917 | 1.26 | (d) | 1.80 | (d) | 2.53 | (d) | 243 | ||||||||||||||||||||||||||||||
| 6.06 | (38.02 | ) | 8 | 2.01 | (d) | 2.55 | (d) | 1.83 | (d) | 243 | ||||||||||||||||||||||||||||||
| 6.06 | (37.40 | ) | 17,652 | 0.86 | (d) | 1.40 | (d) | 2.05 | (d) | 243 | ||||||||||||||||||||||||||||||
| The accompanying notes are an integral part of these financial statements. | 59 |
GOLDMAN SACHS STRUCTURED TAX-ADVANTAGED EQUITY FUNDS
Notes to Financial Statements
June 30, 2013 (Unaudited)
| 1. ORGANIZATION |
Goldman Sachs Trust (the “Trust”) is a Delaware statutory trust registered under the Investment Company Act of 1940, as amended (the “Act”), as an open-end management investment company. The following table lists those series of the Trust that are included in this report (collectively, the “Funds” or individually a “Fund”), along with their corresponding share classes and respective diversification status under the Act:
| Fund | Share Classes Offered* | Diversified/ Non-diversified | ||
U.S. Equity Dividend and Premium, International Equity Dividend and Premium, Structured International Tax-Managed Equity | A, C, Institutional and IR | Diversified | ||
Structured Tax-Managed Equity | A, B, C, Institutional, Service and IR | Diversified |
| * | Class B Shares are generally no longer available for purchase by current or prospective investors. |
Class A Shares are sold with a front-end sales charge of up to 5.50%. Class B Shares were sold with a contingent deferred sales charge (“CDSC”) that declines from 5.00% to zero, depending upon the period of time the shares are held. Class C Shares are sold with a CDSC of 1.00%, which is imposed on redemptions made within 12 months of purchase. Institutional, Service and Class IR Shares are not subject to a sales charge.
Goldman Sachs Asset Management, L.P. (“GSAM”), an affiliate of Goldman, Sachs & Co. (“Goldman Sachs”), serves as investment adviser to the Funds pursuant to a management agreement (the “Agreement”) with the Trust.
| 2. SIGNIFICANT ACCOUNTING POLICIES |
The financial statements have been prepared in accordance with accounting principles generally accepted in the United States of America (“GAAP”) and require management to make estimates and assumptions that may affect the reported amounts and disclosures. Actual results may differ from those estimates and assumptions.
A. Investment Valuation — The Funds’ valuation policy is to value investments at fair value.
B. Investment Income and Investments — Investment income includes interest income and dividend income, net of any foreign withholding taxes, less any amounts reclaimable. Interest income is accrued daily and adjusted for amortization of premiums and accretion of discounts. Dividend income is recognized on ex-dividend date or, for certain foreign securities, as soon as such information is obtained subsequent to the ex-dividend date. Investment transactions are reflected on trade date. Realized gains and losses are calculated using identified cost. Investment transactions are recorded on the following business day for daily net asset value (“NAV”) calculations. Any foreign capital gains tax is accrued daily based upon net unrealized gains, and is payable upon sale of such investments. Distributions received from the Funds’ investments in United States (“U.S.”) real estate investment trusts (“REITs”) may be characterized as ordinary income, net capital gain or a return of capital. A return of capital is recorded by the Funds as a reduction to the cost basis of the REIT.
For derivative contracts, realized gains and losses are recorded upon settlement of the contract.
C. Class Allocations and Expenses — Investment income, realized and unrealized gain (loss), and non-class specific expenses of each Fund are allocated daily based upon the proportion of net assets of each class. Class specific expenses, where applicable, are borne by the respective share classes and include Distribution and Service, Transfer Agent and Service and Shareholder Administration fees. Non-class specific expenses directly incurred by a Fund are charged to that Fund, while such expenses incurred by the Trust are allocated across the respective Funds on a straight-line and/or pro-rata basis depending upon the nature of the expenses.
D. Federal Taxes and Distributions to Shareholders — It is each Fund’s policy to comply with the requirements of the Internal Revenue Code of 1986, as amended (the “Code”), applicable to regulated investment companies (mutual funds) and to
60
GOLDMAN SACHS STRUCTURED TAX-ADVANTAGED EQUITY FUNDS
| 2. SIGNIFICANT ACCOUNTING POLICIES (continued) |
distribute each year substantially all of its investment company taxable income and capital gains to its shareholders. Accordingly, the Funds are not required to make any provisions for the payment of federal income tax. Distributions to shareholders are recorded on the ex-dividend date. Income and capital gains distributions, if any, are declared and paid according to the following schedule:
| Fund | Income Distributions Declared/Paid | Capital Gains Distributions Declared/Paid | ||||
U.S. Equity Dividend and Premium | Quarterly | Annually | ||||
Structured Tax-Managed Equity | Annually | Annually |
Net capital losses are carried forward to future fiscal years and may be used to the extent allowed by the Code to offset any future capital gains. Utilization of capital loss carryforwards will reduce the requirement of future capital gains distributions.
Under the Regulated Investment Company Modernization Act of 2010, the Funds are permitted to carry forward capital losses incurred in taxable years beginning after December 22, 2010 for an unlimited period. However, any losses incurred during those future taxable years will be required to be utilized prior to the losses incurred in pre-enactment taxable years. As a result of this ordering rule, pre-enactment capital loss carryforwards may be more likely to expire unused. Additionally, post-enactment capital losses that are carried forward will retain their character as either short-term or long-term capital losses rather than being considered all short-term as under previous law.
The characterization of distributions to shareholders for financial reporting purposes is determined in accordance with federal income tax rules, which may differ from GAAP. The source of each Fund’s distributions may be shown in the accompanying financial statements as either from net investment income, net realized gain or capital. Certain components of the Funds’ net assets on the Statements of Assets and Liabilities reflect permanent GAAP/tax differences based on the appropriate tax character.
E. Foreign Currency Translation — The accounting records and reporting currency of the Funds are maintained in U.S. dollars. Assets and liabilities denominated in foreign currencies are translated into U.S. dollars using the current exchange rates at the close of each business day. The effect of changes in foreign currency exchange rates on investments is included within net realized and unrealized gain (loss) on investments. Changes in the value of other assets and liabilities as a result of fluctuations in foreign exchange rates are included in the Statements of Operations within net change in unrealized gain (loss) on foreign currency transactions. Transactions denominated in foreign currencies are translated into U.S. dollars on the date the transaction occurred, the effects of which are included within net realized gain (loss) on foreign currency transactions.
The fair value of a financial instrument is the amount that would be received to sell an asset or paid to transfer a liability in an orderly transaction between market participants at the measurement date (i.e., the exit price). GAAP establishes a fair value hierarchy that prioritizes the inputs to valuation techniques used to measure fair value. The hierarchy gives the highest priority to unadjusted quoted prices in active markets for identical assets or liabilities (Level 1 measurements) and the lowest priority to unobservable inputs (Level 3 measurements). The levels used for classifying investments are not necessarily an indication of the risk associated with investing in these investments. The three levels of the fair value hierarchy are described below:
Level 1 — Unadjusted quoted prices in active markets that are accessible at the measurement date for identical, unrestricted assets or liabilities;
Level 2 — Quoted prices in markets that are not active or financial instruments for which significant inputs are observable (including, but not limited to, quoted prices for similar investments, interest rates, foreign exchange rates, volatility and credit spreads), either directly or indirectly;
Level 3 — Prices or valuations that require significant unobservable inputs (including GSAM’s assumptions in determining fair value measurement).
61
GOLDMAN SACHS STRUCTURED TAX-ADVANTAGED EQUITY FUNDS
Notes to Financial Statements (continued)
June 30, 2013 (Unaudited)
| 3. INVESTMENTS AND FAIR VALUE MEASUREMENTS |
The Trustees have adopted Valuation Procedures that govern the valuation of the portfolio investments held by the Funds, including investments for which market quotations are not readily available. The Trustees have delegated to GSAM day-to-day responsibility for implementing and maintaining internal controls and procedures related to the valuation of the Funds’ portfolio investments. To assess the continuing appropriateness of pricing sources and methodologies, GSAM regularly performs price verification procedures and issues challenges as necessary to third party pricing vendors or brokers, and any differences are reviewed in accordance with the Valuation Procedures.
A. Level 1 and Level 2 Fair Value Investments — The valuation techniques and significant inputs used in determining the fair values for investments classified as Level 1 and Level 2 are as follows:
Equity Securities — Equity securities and investment companies traded on a U.S. securities exchange or the NASDAQ system, or those located on certain foreign exchanges, including but not limited to the Americas, are valued daily at their last sale price or official closing price on the principal exchange or system on which they are traded. If no sale occurs, equity securities and exchange traded investment companies are valued at the last bid price for long positions and at the last ask price for short positions. Investments in investment companies (other than those that are exchange traded) are valued at the NAV on the valuation date. To the extent these investments are actively traded, they are classified as Level 1 of the fair value hierarchy.
Unlisted equity securities for which market quotations are available are valued at the last sale price on the valuation date, or if no sale occurs, at the last bid price. Securities traded on certain foreign securities exchanges are valued daily at fair value determined by an independent fair value service (if available) under Valuation Procedures approved by the Trustees and consistent with applicable regulatory guidance. The independent fair value service takes into account multiple factors including, but not limited to, movements in the securities markets, certain depositary receipts, futures contracts and foreign currency exchange rates that have occurred subsequent to the close of the foreign securities exchange. These investments are generally classified as Level 2 of the fair value hierarchy.
Debt Securities — Debt securities for which market quotations are readily available are valued daily on the basis of quotations supplied by dealers or an independent pricing service approved by the Trustees. The pricing services may use valuation models or matrix pricing, which consider: (i) yield or price with respect to bonds that are considered comparable in characteristics such as rating, interest rate and maturity date or (ii) quotations from securities dealers to determine current value. Short-term debt obligations that mature in sixty days or less and that do not exhibit signs of credit deterioration are valued at amortized cost, which approximates fair value. With the exception of treasury securities, which are generally classified as Level 1, these investments are generally classified as Level 2 of the fair value hierarchy.
Derivative Contracts — A derivative is an instrument whose value is derived from underlying assets, indices, reference rates or a combination of these factors.
Exchange-traded derivatives, including futures contracts, typically fall within Level 1 of the fair value hierarchy. Over-the-counter (“OTC”) derivatives are valued using market transactions and other market evidence, including market-based inputs to models, calibration to market-clearing transactions, broker or dealer quotations, or other alternative pricing sources. Where models are used, the selection of a particular model to value an OTC derivative depends upon the contractual terms of, and specific risks inherent in, the instrument, as well as the availability of pricing information in the market. Valuation models require a variety of inputs, including contractual terms, market prices, yield curves, credit curves, measures of volatility, voluntary and involuntary prepayment rates, loss severity rates and correlations of such inputs. For OTC derivatives that trade in liquid markets, model inputs can generally be verified and model selection does not involve significant management judgment. OTC derivatives are classified within Level 2 of the fair value hierarchy when significant inputs are corroborated by market evidence.
i. Forward Foreign Currency Exchange Contracts — In a forward foreign currency contract, a Fund agrees to receive or deliver a fixed quantity of one currency for another, at a pre-determined price at a future date. All forward foreign currency exchange contracts are marked-to-market daily at the applicable forward rate.
62
GOLDMAN SACHS STRUCTURED TAX-ADVANTAGED EQUITY FUNDS
| 3. INVESTMENTS AND FAIR VALUE MEASUREMENTS (continued) |
ii. Futures Contracts — Futures contracts are contracts to buy or sell a standardized quantity of a specified commodity or security and are valued based on exchanged settlement prices or independent market quotes. Futures contracts are valued at the last settlement price, or in the absence of a sale, the last bid price for long positions and at the last ask price for short positions, at the end of each day on the board of trade or exchange upon which they are traded. Upon entering into a futures contract, a Fund deposits cash or securities in an account on behalf of the broker in an amount sufficient to meet the initial margin requirement. Subsequent payments are made or received by the Fund equal to the daily change in the contract value and are recorded as variation margin receivable or payable with a corresponding offset to unrealized gains or losses.
iii. Options — When a Fund writes call or put options, an amount equal to the premium received is recorded as a liability and is subsequently marked-to-market to reflect the current value of the option written. Swaptions are options on interest rate swap contracts. Options on a futures contract may be written with premiums to be determined on a future date. The premiums for these options are based upon implied volatility parameters at specified terms.
Upon the purchase of a call option or a put option by a Fund, the premium paid is recorded as an investment and subsequently marked-to-market to reflect the current value of the option. Certain options may be purchased with premiums to be determined on a future date. The premiums for these options are based upon implied volatility parameters at specified terms.
B. Level 3 Fair Value Investments — To the extent that the aforementioned significant inputs are unobservable, or if quotations are not readily available, or if GSAM believes that such quotations do not accurately reflect fair value, the fair value of the Funds’ investments may be determined under Valuation Procedures approved by the Trustees. GSAM, consistent with its procedures and applicable regulatory guidance, may make an adjustment to the most recent valuation prices of either domestic or foreign securities in light of significant events to reflect what it believes to be the fair value of the securities at the time of determining a Fund’s NAV. Significant events which could affect a large number of securities in a particular market may include, but are not limited to: significant fluctuations in U.S. or foreign markets; market dislocations; market disruptions; or unscheduled market closings. Significant events which could also affect a single issuer may include, but are not limited to: corporate actions such as reorganizations, mergers and buy-outs; ratings downgrades; and bankruptcies.
63
GOLDMAN SACHS STRUCTURED TAX-ADVANTAGED EQUITY FUNDS
Notes to Financial Statements (continued)
June 30, 2013 (Unaudited)
| 3. INVESTMENTS AND FAIR VALUE MEASUREMENTS (continued) |
C. Fair Value Hierarchy — The following is a summary of the Funds’ investments and derivatives classified in the fair value hierarchy as of June 30, 2013:
| U.S. EQUITY DIVIDEND AND PREMIUM | ||||||||||||
| Investment Type | Level 1 | Level 2 | Level 3 | |||||||||
| Assets | ||||||||||||
Common Stock and/or Other Equity Investments | $ | 1,233,271,773 | $ | — | $ | — | ||||||
| Derivative Type | ||||||||||||
| Assets(a) | ||||||||||||
Futures Contracts | $ | 51,409 | $ | — | $ | — | ||||||
| Liabilities | ||||||||||||
Written Options | $ | (14,517,600 | ) | $ | — | $ | — | |||||
| INTERNATIONAL EQUITY DIVIDEND AND PREMIUM | ||||||||||||
| Investment Type | Level 1 | Level 2 | Level 3 | |||||||||
| Assets | ||||||||||||
Common Stock and/or Other Equity Investments | ||||||||||||
North and South America | $ | — | $ | — | $ | — | ||||||
Other | 29,624,276 | 340,431,015 | (b) | — | ||||||||
| Derivative Type | ||||||||||||
| Assets(a) | ||||||||||||
Futures Contracts | $ | 110,392 | $ | — | $ | — | ||||||
| Liabilities | ||||||||||||
Futures Contracts(a) | $ | (184,423 | ) | $ | — | $ | — | |||||
Written Options | (5,555,179 | ) | — | — | ||||||||
| Total | $ | (5,739,602 | ) | $ | — | $ | — | |||||
| STRUCTURED TAX-MANAGED EQUITY | ||||||||||||
| Investment Type | Level 1 | Level 2 | Level 3 | |||||||||
| Assets | ||||||||||||
Common Stock and/or Other Equity Investments | $ | 382,513,939 | $ | — | $ | — | ||||||
Securities Lending Reinvestment Vehicle | 20,804,975 | — | — | |||||||||
| Total | $ | 403,318,914 | $ | — | $ | — | ||||||
| Derivative Type | ||||||||||||
| Liabilities(a) | ||||||||||||
Futures Contracts | $ | (308,922 | ) | $ | — | $ | — | |||||
64
GOLDMAN SACHS STRUCTURED TAX-ADVANTAGED EQUITY FUNDS
| 3. INVESTMENTS AND FAIR VALUE MEASUREMENTS (continued) |
| STRUCTURED INTERNATIONAL TAX-MANAGED EQUITY | ||||||||||||
| Investment Type | Level 1 | Level 2 | Level 3 | |||||||||
| Assets | ||||||||||||
Common Stock and/or Other Equity Investments | ||||||||||||
North and South America | $ | — | $ | 426,209 | (b) | $ | — | |||||
Other | 6,268,407 | 149,702,325 | (b) | — | ||||||||
Securities Lending reinvestment Vehicle | 154,577 | — | ||||||||||
| Total | $ | 6,422,984 | $ | 150,128,534 | $ | — | ||||||
| Derivative Type | ||||||||||||
| Assets(a) | ||||||||||||
Futures Contracts | $ | 46,459 | $ | — | $ | — | ||||||
| Liabilities(a) | ||||||||||||
Futures Contracts | $ | (89,836 | ) | $ | — | $ | — | |||||
| (a) | Amount shown represents unrealized gain (loss) at period end. |
| (b) | To adjust for the time difference between local market close and the calculation of net asset value, the Funds utilize fair value model prices for international equities provided by an independent fair value service resulting in a Level 2 classification. |
For further information regarding security characteristics, see the Schedules of Investments.
| 4. INVESTMENTS IN DERIVATIVES |
The following table sets forth, by certain risk types, the gross value of derivative contracts as of June 30, 2013. These instruments were used to meet the Funds’ investment objectives and to obtain and/or manage exposure related to the risks below. The values in the tables below exclude the effects of cash collateral received or posted pursuant to these derivative contracts, and therefore are not representative of the Funds’ net exposure.
| Fund | Risk | Statements of Assets and Liabilities | Assets(a) | Statements of Assets and Liabilities | Liabilities | |||||||||
U.S. Equity Dividend and Premium | Equity | Receivable for unrealized gain on futures variation margin | $ | 51,409 | Payable for written options, at value | $ | (14,517,600) | |||||||
International Equity Dividend and Premium | Equity | Receivable for unrealized gain on futures variation margin | 110,392 | Payable for unrealized loss on futures variation margin, Payable for written options, at value | (5,739,602) | (a) | ||||||||
Structured Tax-Managed Equity | Equity | — | — | Payable for unrealized loss on futures variation margin | (308,922) | (a) | ||||||||
Structured International Tax-Managed Equity | Equity | Receivable for unrealized gain on futures variation margin | 46,459 | Payable for unrealized loss on futures variation margin | (89,836) | (a) | ||||||||
| Total | $ | 208,260 | $ | (20,655,960) | ||||||||||
| (a) | Includes cumulative appreciation (depreciation) on futures contracts described in the Additional Investment Information sections of the Schedules of Investments. Only current day’s variation margin is reported within the Statements of Assets and Liabilities. |
65
GOLDMAN SACHS STRUCTURED TAX-ADVANTAGED EQUITY FUNDS
Notes to Financial Statements (continued)
June 30, 2013 (Unaudited)
| 4. INVESTMENTS IN DERIVATIVES (continued) |
The following table sets forth, by certain risk types, the Funds’ gains (losses) related to these derivatives and their indicative volumes for the six months ended June 30, 2013. These gains (losses) should be considered in the context that these derivative contracts may have been executed to economically hedge certain investments, and accordingly, certain gains (losses) on such derivative contracts may offset certain (losses) gains attributable to investments. These gains (losses) are included in “Net realized gain (loss)” or “Net change in unrealized gain (loss)” on the Statements of Operations:
| Fund | Risk | Statements of Operations | Net Gain (Loss) | Net Change in Unrealized Gain (Loss) | Average Number of Contracts(a) | |||||||||||
| U.S. Equity Dividend and Premium | Equity | Net realized gain (loss) from futures contracts and written options/Net change in unrealized gain (loss) on futures contracts and written options | $ | (20,797,050 | ) | $ | (2,738,526 | ) | 3,415 | |||||||
| International Equity Dividend and Premium | Equity | Net realized gain (loss) from futures contracts and written options/Net change in unrealized gain (loss) on futures contracts and written options | (5,674,955 | ) | 171,221 | 3,173 | ||||||||||
| Structured Tax-Managed Equity | Equity | Net realized gain (loss) from futures contracts/Net change in unrealized gain (loss) on futures contracts | $ | 2,210,018 | $ | (421,782 | ) | 131 | ||||||||
| Structured International Tax-Managed Equity | Risk | Statements of Operations | Net Gain (Loss) | Net Change in Unrealized Gain (Loss) | Average Number of Contracts(a) | |||||||||||
| Equity | Net realized gain (loss) from futures contracts/Net change in unrealized gain (loss) on futures contracts | $ | (27,746 | ) | $ | (55,603 | ) | 107 | ||||||||
| Currency | Net realized gain (loss) from forward foreign currency exchange contract/Net change in unrealized gain (loss) on forward foreign currency exchange | (26,447 | ) | 446 | 1 | |||||||||||
| Total | (54,193 | ) | (55,157 | ) | 108 | |||||||||||
| (a) | Average number of contracts is based on the average of month end balances for the period ended June 30, 2013. |
In December 2011, the Financial Accounting Standards Board (“FASB”) issued an Accounting Standards Update (“ASU”) No. 2011-11: Disclosures about Offsetting Assets and Liabilities (“netting”) on the Statements of Assets and Liabilities that are subject to master netting arrangements or similar agreements. ASU 2011-11 was amended by ASU No. 2013-01, clarifying which investments and transactions are subject to the netting disclosure. The scope of the disclosure requirements is limited to derivative instruments, repurchase agreements and reverse repurchase agreements, and securities borrowing and securities lending transactions. This information is intended to enable users of the Funds’ financial statements to evaluate the effect or potential effect of netting arrangements on the Funds’ financial position. The ASU is effective for financial statements with fiscal years beginning on or after January 1, 2013, and interim periods within those fiscal years. The Funds adopted the disclosure requirement on netting for the current reporting period. Since these amended principles require additional disclosures concerning offsetting and related arrangements, adoption did not affect the Funds’ financial condition or result of operations.
For financial reporting purposes, the Funds do not offset financial assets and financial liabilities that are subject to master netting arrangements or similar agreements on the Statements of Assets and Liabilities.
66
GOLDMAN SACHS STRUCTURED TAX-ADVANTAGED EQUITY FUNDS
| 4. INVESTMENTS IN DERIVATIVES (continued) |
In order to better define its contractual rights and to secure rights that will help a Fund mitigate its counterparty risk, a Fund may enter into an International Swaps and Derivatives Association, Inc. Master Agreement (“ISDA Master Agreement”) or similar agreement with its derivatives counterparties. An ISDA Master Agreement is a bilateral agreement between a Fund and a counterparty that governs OTC derivatives, including foreign exchange contracts, and typically contains, among other things, collateral posting terms and netting provisions in the event of a default and/or termination event. The provisions of the ISDA Master Agreement typically permit a single net payment in the event of a default (close-out netting) or similar event, including the bankruptcy or insolvency of the counterparty.
Collateral and margin requirements differ between exchange traded derivatives and OTC derivatives. Margin requirements are established by the broker or clearing house for exchange-traded and centrally cleared derivatives (financial futures contracts, options and centrally cleared swaps) pursuant to governing agreements for those instrument types. Brokers can ask for margin in excess of the minimum in certain circumstances. Collateral terms are contract-specific for OTC derivatives (foreign currency exchange contracts, options and certain swaps). For derivatives traded under an ISDA Master Agreement, the collateral requirements are typically calculated by netting the mark to market amount for each transaction under such agreement and comparing that amount to the value of any collateral currently pledged by a Fund and the counterparty. Additionally, a Fund may be required to post additional collateral to the counterparty in the form of initial margin, the terms of which would be outlined in the confirmation of the OTC transaction.
For financial reporting purposes, cash collateral that has been pledged to cover obligations of a Fund and cash collateral received from the counterparty, if any, is reported separately on the Statements of Assets and Liabilities as receivables/payables for collateral on certain derivative contracts. Non-cash collateral pledged by a Fund, if any, is noted in the Schedule of Investments. Generally, the amount of collateral due from or to a counterparty must exceed a minimum transfer amount threshold (e.g., $250,000) before a transfer is required to be made. To the extent amounts due to a Fund from its counterparties are not fully collateralized, contractually or otherwise, the Fund bears the risk of loss from counterparty nonperformance. A Fund attempts to mitigate counterparty risk by only entering into agreements with counterparties that it believes to be of good standing and by monitoring the financial stability of those counterparties.
Additionally, the netting of assets and liabilities and the offsetting of collateral pledged or received are based on contractual netting/set-off provisions in the ISDA Master Agreement or similar agreements. However, in the event of a default or insolvency of a counterparty, a court could determine that such rights are not enforceable due to the restrictions or prohibitions against the right of setoff that may be imposed due to a particular jurisdiction’s bankruptcy or insolvency laws.
The following tables set forth the Funds' net exposure for derivative instruments that are subject to enforceable master netting arrangements or similar agreements as of June 30, 2013:
U.S. EQUITY DIVIDEND AND PREMIUM Offsetting of Derivatives Liabilities: | ||||||||||||
| Derivatives | Gross Amount of Recognized Liabilities | Gross Amounts Offset in the Statement of Assets and Liabilities | Net Amounts of Liabilities Presented in the | |||||||||
Over the Counter: | ||||||||||||
Written Options | $ | 14,517,600 | $ | — | $ | 14,517,600 | ||||||
Exchange Traded: | ||||||||||||
Futures Contracts | 147,217 | — | 147,217 | |||||||||
Total | $ | 14,664,817 | $ | — | $ | 14,664,817 | ||||||
67
GOLDMAN SACHS STRUCTURED TAX-ADVANTAGED EQUITY FUNDS
Notes to Financial Statements (continued)
June 30, 2013 (Unaudited)
| 4. INVESTMENTS IN DERIVATIVES (continued) |
| Derivative Liabilities and Collateral Pledged by Counterparty: | ||||||||||||||||
| Gross Amounts Available for Offset but Not Netted in the Statement of Assets and Liabilities | ||||||||||||||||
| Counterparty | Net Amounts of Liabilities in the Statement of Assets and Liabilities | Financial Instruments | Cash Collateral Pledged | Net Amount(1) | ||||||||||||
Goldman Sachs & Co. | $ | 14,517,600 | $ | (14,517,600 | ) | $ | — | $ | — | |||||||
Goldman Sachs & Co.* | 147,217 | (147,217 | ) | — | — | |||||||||||
Total | $ | 14,664,817 | $ | (14,664,817 | ) | $ | — | $ | — | |||||||
| * | Exchange Traded Futures — Goldman Sachs & Co. as Futures Commission Merchant |
| (1) | Net amount represents the net amount due to the counterparty in the event of a default based on the contractual set-off rights under the agreement. |
INTERNATIONAL EQUITY DIVIDEND AND PREMIUM Offsetting of Derivatives Liabilities: | ||||||||||||
| Derivatives | Gross Amount of Recognized Liabilities | Gross Amounts Offset in the Statement of Assets and Liabilities | Net Amounts of Liabilities Presented in the Statement of Assets and Liabilities | |||||||||
Over the Counter: | ||||||||||||
Written Options | $ | 5,555,179 | $ | — | $ | 5,555,179 | ||||||
Exchange Traded: | ||||||||||||
Futures Contracts | 6,549 | — | 6,549 | |||||||||
Total | $ | 5,561,728 | $ | — | $ | 5,561,728 | ||||||
| Derivative Liabilities and Collateral Pledged by Counterparty: | ||||||||||||||||
| Gross Amounts Available for Offset but Not Netted in the Statement of Assets and Liabilities | ||||||||||||||||
| Counterparty | Net Amounts of Liabilities in the Statement of Assets and Liabilities | Financial Instruments | Cash Collateral Pledged | Net Amount(1) | ||||||||||||
Goldman Sachs & Co. | $ | 5,555,179 | $ | (5,555,179 | ) | $ | — | $ | — | |||||||
Goldman Sachs & Co.* | 6,549 | (6,549 | ) | — | — | |||||||||||
Total | $ | 5,561,728 | $ | (5,561,728 | ) | $ | — | $ | — | |||||||
| * | Exchange Traded Futures — Goldman Sachs & Co. as Futures Commission Merchant |
| (1) | Net amount represents the net amount due to the counterparty in the event of a default based on the contractual set-off rights under the agreement. |
STRUCTURED TAX-MANAGED EQUITY Offsetting of Derivatives Liabilities: | ||||||||||||
| Derivatives | Gross Amount of Recognized Liabilities | Gross Amounts Offset in the Statement of Assets and Liabilities | Net Amounts of Liabilities Presented in the Statement of Assets and Liabilities | |||||||||
Exchange Traded: | ||||||||||||
Futures Contracts | $ | 47,425 | $ | — | $ | 47,425 | ||||||
68
GOLDMAN SACHS STRUCTURED TAX-ADVANTAGED EQUITY FUNDS
| 4. INVESTMENTS IN DERIVATIVES (continued) |
| Derivative Liabilities and Collateral Pledged by Counterparty: | ||||||||||||||||
| Gross Amounts Available for Offset but Not Netted in the Statement of Assets and Liabilities | ||||||||||||||||
| Counterparty | Net Amounts of Liabilities in the Statement of Assets and Liabilities | Financial Instruments | Cash Collateral Pledged | Net Amount(1) | ||||||||||||
Goldman Sachs & Co.* | $ | 47,425 | $ | (47,425 | ) | $ | — | $ | — | |||||||
| * | Exchange Traded Futures — Goldman Sachs & Co. as Futures Commission Merchant |
| (1) | Net amount represents the net amount due to the counterparty in the event of a default based on the contractual set-off rights under the agreement. |
STRUCTURED INTERNATIONAL TAX-MANAGED EQUITY Offsetting of Derivatives Liabilities: | ||||||||||||
| Derivatives | Gross Amount of Recognized Liabilities | Gross Amounts Offset in the Statement of Assets and Liabilities | Net Amounts of Liabilities Presented in the Statement of Assets and Liabilities | |||||||||
Exchange Traded: | ||||||||||||
Futures Contracts | $ | 73,861 | $ | — | $ | 73,861 | ||||||
| Derivative Liabilities and Collateral Pledged by Counterparty: | ||||||||||||||||
| Gross Amounts Available for Offset but Not Netted in the Statement of Assets and Liabilities | ||||||||||||||||
| Counterparty | Net Amounts of Liabilities in the Statement of Assets and Liabilities | Financial Instruments | Cash Collateral Pledged | Net Amount(1) | ||||||||||||
Goldman Sachs & Co.* | $ | 73,861 | $ | (73,861 | ) | $ | — | $ | — | |||||||
| * | Exchange Traded Futures — Goldman Sachs & Co. as Futures Commission Merchant |
| (1) | Net amount represents the net amount due to the counterparty in the event of a default based on the contractual set-off rights under the agreement. |
| 5. AGREEMENTS AND AFFILIATED TRANSACTIONS |
A. Management Agreement — Under the Agreement, GSAM manages the Funds, subject to the general supervision of the Trustees.
As compensation for the services rendered pursuant to the Agreement, the assumption of the expenses related thereto and administration of the Funds’ business affairs, including providing facilities, GSAM is entitled to a management fee, accrued daily and paid monthly, equal to an annual percentage rate of each Fund’s average daily net assets.
69
GOLDMAN SACHS STRUCTURED TAX-ADVANTAGED EQUITY FUNDS
Notes to Financial Statements (continued)
June 30, 2013 (Unaudited)
| 5. AGREEMENTS AND AFFILIATED TRANSACTIONS (continued) |
For the six months ended June 30, 2013, contractual and effective net management fees with GSAM were at the following rates:
| Contractual Management Fee Rate | Effective Net Management Fee Rate | |||||||||||||||||||||||||||||
| Fund | First $1 billion | Next $1 billion | Next $3 billion | Next $3 billion | Over $8 billion | Effective Rate | ||||||||||||||||||||||||
U.S. Equity Dividend and Premium | 0.75 | % | 0.68 | % | 0.65 | % | 0.64 | % | 0.63 | % | 0.74 | % | 0.74 | % | ||||||||||||||||
International Equity Dividend and Premium | 0.81 | 0.73 | 0.69 | 0.68 | 0.67 | 0.81 | 0.81 | |||||||||||||||||||||||
Structured Tax-Managed Equity | 0.70 | 0.63 | 0.60 | 0.59 | 0.58 | 0.70 | 0.67 | * | ||||||||||||||||||||||
Structured International Tax-Managed Equity | 0.85 | 0.77 | 0.73 | 0.72 | 0.71 | 0.85 | 0.82 | * | ||||||||||||||||||||||
| * | GSAM waived a portion of its management fees equal to 0.04% of the average daily net assets of the Structured International Tax-Managed Equity Fund and 0.05% of the Structured Tax-Managed Equity Fund. These waivers have been discontinued effective April 30, 2013. |
B. Distribution and Service Plans — The Trust, on behalf of each Fund, has adopted Distribution and Service Plans (the “Plans”). Under the Plans, Goldman Sachs, which serves as distributor (the “Distributor”), is entitled to a fee accrued daily and paid monthly for distribution services and personal and account maintenance services, which may then be paid by Goldman Sachs to authorized dealers, at the following annual rates calculated on a Fund’s average daily net assets of each respective share class:
| Distribution and Service Plan Rates | ||||||||||||
| Class A* | Class B | Class C | ||||||||||
Distribution Plan | 0.25 | % | 0.75 | % | 0.75 | % | ||||||
Service Plan | — | 0.25 | 0.25 | |||||||||
| * | With respect to Class A Shares, the Distributor at its discretion may use compensation for distribution services paid under the Distribution Plan to compensate service organizations for personal and account maintenance services and expenses as long as such total compensation does not exceed the maximum cap on “service fees” imposed by the Financial Industry Regulatory Authority. |
C. Distribution Agreement — Goldman Sachs, as Distributor of the shares of the Funds pursuant to a Distribution Agreement, may retain a portion of the Class A front end sales charge and Class B and Class C Shares’ CDSC. During the six months ended June 30, 2013, Goldman Sachs advised that it retained front end sales charges of $19,185, $1,677, $1,612 and $379 for the U.S. Equity Dividend and Premium, International Equity Dividend and Premium, Structured Tax-Managed Equity and Structured International Tax-Managed Equity Funds, respectively. Goldman Sachs retained $2 of contingent deferred sales charges for the Structured Tax-Managed Equity Fund.
D. Service Plan and Shareholder Administration Plan — The Trust, on behalf of each Fund that offers Service Shares, has adopted a Service Plan and a Shareholder Administration Plan. These plans allow for service organizations to provide varying levels of personal and account maintenance and shareholder administration services to their customers who are beneficial owners of such shares. The Service Plan and Shareholder Administration Plan each provide for compensation to the service organizations which is accrued daily and paid monthly at an annual rate of 0.25% (0.50% in aggregate) of the average daily net assets of the Service Shares.
E. Transfer Agency Agreement — Goldman Sachs also serves as the transfer agent of the Funds for a fee pursuant to Transfer Agency Agreement. The fees charged for such transfer agency services are accrued daily and paid monthly at annual rates as follows: 0.19% of the average daily net assets of Class A, Class B, Class C and Class IR Shares; and 0.04% of the average daily net assets of Institutional and Service Shares.
70
GOLDMAN SACHS STRUCTURED TAX-ADVANTAGED EQUITY FUNDS
| 5. AGREEMENTS AND AFFILIATED TRANSACTIONS (continued) |
F. Other Expense Agreements and Affiliated Transactions — GSAM has agreed to limit certain “Other Expense” of the Funds (excluding transfer agent fees and expenses, service fees and shareholder administration fees (as applicable), taxes, interest, brokerage fees, litigation, indemnification, shareholder meeting, and other extraordinary expenses) to the extent such expenses exceed, on an annual basis, a percentage rate of the average daily net assets of each Fund. Such Other Expense reimbursements, if any, are accrued daily and paid monthly. In addition, the Funds are not obligated to reimburse GSAM for prior fiscal year expense reimbursements, if any. The Other Expense limitations as an annual percentage rate of average daily net assets for the U.S. Equity Dividend and Premium, International Equity Dividend and Premium, Structured Tax-Managed Equity and Structured International Tax-Managed Equity Funds are 0.014%, 0.124%, 0.044% and 0.094%, respectively. Prior to April 30, 2013, the Other Expense limitations for U.S. Equity Dividend and Premium, International Equity Dividend and Premium, Structured Tax-Managed Equity and Structured International Tax-Managed Equity Funds were 0.054%, 0.054%, 0.004% and 0.014%, respectively. These Other Expense limitations will remain in place through at least April 30, 2014, and prior to such date GSAM may not terminate the arrangements without the approval of the Trustees. In addition, the Funds have entered into certain offset arrangements with the custodian and the transfer agent, which may result in a reduction of the Funds’ expenses and are received irrespective of the application of the “Other Expense” limitations described above.
For the six months ended June 30, 2013, these expense reductions, including any fee waivers and Other Expense reimbursements, were as follows:
| Fund | Management Fee Waiver | Other Expense Reimbursement | Custody Fee Credits | Total Expense Reductions | ||||||||||||||
U.S. Equity Dividend and Premium | $ | — | $ | 52,547 | $ | 16,209 | $ | 68,756 | ||||||||||
International Equity Dividend and Premium | — | 74,233 | 1,353 | 75,586 | ||||||||||||||
Structured Tax-Managed Equity | 62,506 | 136,581 | 7,055 | 206,142 | ||||||||||||||
Structured International Tax-Managed Equity | 21,264 | 150,070 | 945 | 172,279 | ||||||||||||||
As of June 30, 2013, the amounts owed to affiliates of the Funds were as follows:
| Fund | Management Fees | Distribution and Service Fees | Transfer Agent Fees | Total | ||||||||||||||
U.S. Equity Dividend and Premium | $ | 760,417 | $ | 79,900 | $ | 71,710 | $ | 912,027 | ||||||||||
International Equity Dividend and Premium | 258,224 | 4,703 | 15,040 | 277,967 | ||||||||||||||
Structured Tax-Managed Equity | 227,113 | 14,321 | 18,022 | 259,456 | ||||||||||||||
Structured International Tax-Managed Equity | 114,336 | 816 | 5,880 | 121,032 | ||||||||||||||
G. Line of Credit Facility — As of June 30, 2013, the Funds participated in a $780,000,000 committed, unsecured revolving line of credit facility (the “facility”) together with other funds of the Trust and registered investment companies having management agreements with GSAM or its affiliates (“Other Borrowers”). Pursuant to the terms of the facility, the Funds and Other Borrowers could increase the credit amount by an additional $220,000,000, for a total of up to $1,000,000,000. This facility is to be used solely for temporary or emergency purposes, which may include the funding of redemptions. The interest rate on borrowings is based on the federal funds rate. The facility also requires a fee to be paid by the Funds based on the amount of the commitment that has not been utilized. For the six months ended June 30, 2013, the Funds did not have any borrowings under the facility. Prior to May 8, 2013, the committed amount available through the facility was $630,000,000.
71
GOLDMAN SACHS STRUCTURED TAX-ADVANTAGED EQUITY FUNDS
Notes to Financial Statements (continued)
June 30, 2013 (Unaudited)
| 5. AGREEMENTS AND AFFILIATED TRANSACTIONS (continued) |
H. Other Transactions with Affiliates — For the six months ended June 30, 2013, Goldman Sachs earned $2,543, $11,690, $2,267, and $3,940 in brokerage commissions from portfolio transactions, including futures transactions executed with Goldman Sachs as the Futures Commission Merchant, on behalf of the U.S. Equity Dividend and Premium, International Equity Dividend and Premium, Structured Tax-Managed Equity and Structured International Tax-Managed Equity Funds, respectively.
On October 1, 2012, GSAM reimbursed the Structured Tax-Managed Equity Fund in the amount of $709,713 to rectify a data issue in its portfolio management decision making process.
As of June 30, 2013, the following Goldman Sachs Fund of Funds Portfolios were the beneficial owners of 5% or more of total outstanding shares of the following Funds:
| Fund | Goldman Sachs Enhanced Dividend | Goldman Sachs Tax-Advantaged | ||||||||
U.S. Equity Dividend and Premium | 9 | % | — | % | ||||||
International Equity Dividend and Premium | 15 | — | ||||||||
Structured Tax-Managed Equity | — | 86 | ||||||||
Structured International Tax-Managed Equity | — | 87 | ||||||||
As of June 30, 2013, the Goldman Sachs Group, Inc. was the beneficial owner of 26% of the Class C Shares of the Structured International Tax-Managed Equity Fund.
| 6. PORTFOLIO SECURITIES TRANSACTIONS |
The cost of purchases and proceeds from sales and maturities of long-term securities for the six months ended June 30, 2013, were as follows:
| Fund | Purchases | Sales | ||||||||
U.S. Equity Dividend and Premium | $ | 612,345,150 | $ | 616,527,608 | ||||||
International Equity Dividend and Premium | 282,895,919 | 298,680,500 | ||||||||
Structured Tax-Managed Equity | 234,519,835 | 234,762,080 | ||||||||
Structured International Tax-Managed Equity | 86,804,011 | 84,365,268 | ||||||||
| 7. SECURITIES LENDING |
Pursuant to exemptive relief granted by the Securities and Exchange Commission (“SEC”) and the terms and conditions contained therein, the Funds may lend their securities through a securities lending agent, Goldman Sachs Agency Lending (“GSAL”), a wholly-owned subsidiary of Goldman Sachs, to certain qualified borrowers including Goldman Sachs and affiliates. In accordance with the Funds’ securities lending procedures, the Funds receive cash collateral at least equal to the market value of the securities on loan. The market value of the loaned securities is determined at the close of business of the Funds, at their last sale price or official closing price on the principal exchange or system on which they are traded, and any additional required collateral is delivered to the Funds on the next business day. As with other extensions of credit, the Funds may experience delay in the recovery of their securities or incur a loss should the borrower of the securities breach its agreement with the Funds or become insolvent at a time when the collateral is insufficient to cover the cost of repurchasing securities on loan. Dividend income received from
72
GOLDMAN SACHS STRUCTURED TAX-ADVANTAGED EQUITY FUNDS
| 7. SECURITIES LENDING (continued) |
securities on loan may not be subject to withholding taxes and therefore withholding taxes paid may differ from the amounts listed in the Statement of Operations.
The Funds invest the cash collateral received in connection with securities lending transactions in the Goldman Sachs Financial Square Money Market Fund (“Money Market Fund”), a separate series of the Trust. The Money Market Fund, deemed an affiliate of the Trust, is registered under the Act as an open end investment company, is subject to Rule 2a-7 under the Act, and is managed by GSAM, for which GSAM may receive an investment advisory fee of up to 0.205% on an annualized basis of the average daily net assets of the Money Market Fund.
In the event of a default by a borrower with respect to any loan, GSAL will exercise any and all remedies provided under the applicable borrower agreement to make the Funds whole. These remedies include purchasing replacement securities by applying the collateral held from the defaulting broker against the purchase cost of the replacement securities. If, despite such efforts by GSAL to exercise these remedies, the Funds sustain losses as a result of a borrower’s default, GSAL indemnifies the Funds by purchasing replacement securities at its expense, or paying the Funds an amount equal to the market value of the replacement securities, subject to an exclusion for any shortfalls resulting from a loss of value in the cash collateral pool due to reinvestment risk and a requirement that the Funds agree to assign rights to the collateral to GSAL for purpose of using the collateral to cover purchase of replacement securities as more fully described in the Securities Lending Agency Agreement.
At June 30, 2013, the Funds’ loaned securities were all subject to enforceable Securities Lending Agreements. Securities lending transactions on a net basis were as follows:
| Securities Lending Transactions | STRUCTURED TAX-MANAGED EQUITY | STRUCTURED INTERNATIONAL TAX-MANAGED EQUITY | ||||||
Total gross amount presented in Statements of Assets and Liabilities | $ | 20,319,156 | $ | 145,946 | ||||
Cash Collateral offsetting(1) | (20,319,156 | ) | (145,946 | ) | ||||
Net Amount(2) | $ | — | $ | — | ||||
| (1) | At June 30, 2013 the value of the collateral received from each borrower exceeded the value of the related securities on loan. |
| (2) | Net amount represents the net amount due from the borrower or GSAL in the event of a default based on the contractual set-off rights under the agreement. |
Both the Funds and GSAL received compensation relating to the lending of the Funds’ securities. The amounts earned by the Funds for the six months ended June 30, 2013, are reported under Investment Income on the Statements of Operations.
The table below details securities lending activity with affiliates of Goldman Sachs:
| For the Six Months Ended June 30, 2013 | Amounts Payable to Goldman Sachs Upon Return of Securities Loaned as of June 30, 2013 | |||||||||||||
| Fund | Earnings of GSAL Relating to Securities Loaned | Amounts Received by the Funds from Lending to Goldman Sachs | ||||||||||||
Structured Tax-Managed Equity | $ | 34,210 | $ | 59,804 | $ | 3,012,050 | ||||||||
Structured International Tax-Managed Equity | 14,526 | 11,916 | — | |||||||||||
73
GOLDMAN SACHS STRUCTURED TAX-ADVANTAGED EQUITY FUNDS
Notes to Financial Statements (continued)
June 30, 2013 (Unaudited)
| 7. SECURITIES LENDING (continued) |
The following table provides information about the Funds’ investment in the Money Market Fund for the six months ended June 30, 2013:
| Fund | Number of Shares Held Beginning of Period | Shares Bought | Shares Sold | Number of Shares Held End of Period | Value at End of Period | |||||||||||||||||
Structured Tax-Managed Equity | 11,054,335 | 95,952,532 | (86,201,892 | ) | 20,804,975 | $ | 20,804,975 | |||||||||||||||
Structured International Tax-Managed Equity | 1,198,865 | 45,759,856 | (46,804,144 | ) | 154,577 | 154,577 | ||||||||||||||||
| 8. TAX INFORMATION |
As of the Funds’ most recent fiscal year end, December 31, 2012, the Funds’ capital loss carryforwards and certain timing differences on a tax-basis were as follows:
| U.S. Equity Dividend and Premium | International Equity Dividend and Premium | Structured Tax-Managed Equity | Structured International Tax-Managed Equity | |||||||||||||
Capital loss carryforwards:(1) | ||||||||||||||||
Expiring 2016 | $ | — | $ | — | $ | — | $ | (2,082,427 | ) | |||||||
Expiring 2017 | — | — | — | (31,387,420 | ) | |||||||||||
Perpetual Long-term | — | (2,392,420 | ) | — | — | |||||||||||
Perpetual Short-term | — | (5,296,739 | ) | — | — | |||||||||||
Total capital loss carryforwards | $ | — | $ | (7,689,159 | ) | $ | — | $ | (33,469,847 | ) | ||||||
Timing differences (Qualified late year loss and straddle loss deferrals) | $ | 6,273 | $ | (326,711 | ) | $ | — | $ | — | |||||||
| (1) | With the exception of perpetual capital loss carryforwards, expiration occurs on December 31 of the year indicated. |
As of June 30, 2013, the Funds’ aggregate security unrealized gains and losses based on cost for U.S. federal income tax purposes were as follows:
| U.S. Equity Dividend and Premium | International Equity Dividend and Premium | Structured Tax- Managed Equity | Structured International Tax-Managed Equity | |||||||||||||
Tax cost | $ | 1,172,024,264 | $ | 410,563,054 | $ | 354,902,072 | $ | 141,692,707 | ||||||||
Gross unrealized gain | 103,617,509 | 7,218,461 | 51,062,730 | 17,420,835 | ||||||||||||
Gross unrealized loss | (42,370,000 | ) | (47,726,224 | ) | (2,645,888 | ) | (2,562,024 | ) | ||||||||
Net unrealized security gain (loss) | $ | 61,247,509 | $ | (40,507,763 | ) | $ | 48,416,842 | $ | 14,858,811 | |||||||
The difference between GAAP-basis and tax-basis unrealized gains (losses) is attributable primarily to wash sales, net mark to market gains (losses) on regulated futures and options contracts and differences related to the tax treatment of passive foreign investment companies.
GSAM has reviewed the Funds’ tax positions for all open tax years (the current and prior three years, as applicable) and has concluded that no provision for income tax is required in the Funds’ financial statements. Such open tax years remain subject to examination and adjustment by tax authorities.
74
GOLDMAN SACHS STRUCTURED TAX-ADVANTAGED EQUITY FUNDS
| 9. OTHER RISKS |
The Funds’ risks include, but are not limited to, the following:
Foreign Custody Risk — A Fund that invests in foreign securities may hold such securities and foreign currency with foreign banks, agents, and securities depositories appointed by the Fund’s custodian (each a “Foreign Custodian”). In some countries, Foreign Custodians may be subject to little or no regulatory oversight or independent evaluation of their operations. Further, the laws of certain countries may place limitations on a Fund’s ability to recover its assets if a Foreign Custodian enters into bankruptcy. Investments in emerging markets may be subject to greater custody risks than investments in more developed markets. Custody services in emerging market countries are often undeveloped and may be less regulated than in more developed countries, and thus may not afford the same level of investor protection as would apply in developed countries.
Shareholder Concentration Risk — Certain funds, accounts, individuals or Goldman Sachs affiliates may from time to time own (beneficially or of record) or control a significant percentage of the Funds’ shares. Redemptions by these entities of their holdings in the Funds may impact the Funds’ liquidity and NAV. These redemptions may also force the Funds to sell securities.
Liquidity Risk — The Funds may make investments that are illiquid or that may become less liquid in response to market developments or adverse investor perceptions. Illiquid investments may be more difficult to value. Liquidity risk may also refer to the risk that a Fund will not be able to pay redemption proceeds within the allowable time period because of unusual market conditions, an unusually high volume of redemption requests, or other reasons. To meet redemption requests, a Fund may be forced to sell investments at an unfavorable time and/or under unfavorable conditions.
Market and Credit Risks — In the normal course of business, the Funds trade financial instruments and enter into financial transactions where risk of potential loss exists due to changes in the market (market risk). Additionally, the Funds may also be exposed to credit risk in the event that an issuer fails to perform or that an institution or entity with which the Funds have unsettled or open transactions defaults.
Investing in foreign markets may involve special risks and considerations not typically associated with investing in the U.S. These risks include revaluation of currencies, high rates of inflation, repatriation restrictions on income and capital, and adverse political and economic developments. Moreover, securities issued in these markets may be less liquid, be subject to government ownership controls, have delayed settlements and their prices may be more volatile than those of comparable securities in the U.S.
| 10. INDEMNIFICATIONS |
Under the Trust’s organizational documents, its Trustees, officers, employees and agents are indemnified, to the extent permitted by the Act and state law, against certain liabilities that may arise out of performance of their duties to the Funds. Additionally, in the course of business, the Funds enter into contracts that contain a variety of indemnification clauses. The Funds’ maximum exposure under these arrangements is unknown, as this would involve future claims that may be made against the Funds that have not yet occurred. However, GSAM believes the risk of loss under these arrangements to be remote.
| 11. SUBSEQUENT EVENTS |
Subsequent events after the Statements of Assets and Liabilities date have been evaluated through the date the financial statements were issued. GSAM has concluded that there is no impact requiring adjustment or disclosure in the financial statements.
75
GOLDMAN SACHS STRUCTURED TAX-ADVANTAGED EQUITY FUNDS
Notes to Financial Statements (continued)
June 30, 2013 (Unaudited)
| 12. SUMMARY OF SHARE TRANSACTIONS |
Share activity is as follows:
| U.S. Equity Dividend and Premium Fund | ||||||||||||||||
|
| |||||||||||||||
| For the Six Months Ended June 30, 2013 (Unaudited) | For the Fiscal Year Ended December 31, 2012 | |||||||||||||||
|
| |||||||||||||||
| Shares | Dollars | Shares | Dollars | |||||||||||||
|
| |||||||||||||||
| Class A Shares | ||||||||||||||||
Shares sold | 3,817,680 | $ | 38,983,190 | 13,471,135 | $ | 134,360,217 | ||||||||||
Reinvestment of distributions | 139,767 | 1,455,722 | 1,026,012 | 9,855,934 | ||||||||||||
Shares redeemed | (3,863,020 | ) | (39,825,139 | ) | (6,886,184 | ) | (68,404,056 | ) | ||||||||
| 94,427 | 613,773 | 7,610,963 | 75,812,095 | |||||||||||||
| Class C Shares | ||||||||||||||||
Shares sold | 1,088,105 | 11,117,759 | 3,213,883 | 31,979,521 | ||||||||||||
Reinvestment of distributions | 23,305 | 242,329 | 216,786 | 2,070,256 | ||||||||||||
Shares redeemed | (472,542 | ) | (4,870,257 | ) | (564,308 | ) | (5,563,935 | ) | ||||||||
| 638,868 | 6,489,831 | 2,866,361 | 28,485,842 | |||||||||||||
| Institutional Shares | ||||||||||||||||
Shares sold | 16,545,599 | 169,650,051 | 39,336,120 | 389,519,502 | ||||||||||||
Reinvestment of distributions | 924,315 | 9,608,480 | 6,362,691 | 61,034,070 | ||||||||||||
Shares redeemed | (14,889,236 | ) | (153,121,999 | ) | (25,712,076 | ) | (255,438,956 | ) | ||||||||
| 2,580,678 | 26,136,532 | 19,986,735 | 195,114,616 | |||||||||||||
| Class IR Shares | ||||||||||||||||
Shares sold | 670,424 | 6,902,037 | 2,004,655 | 20,021,933 | ||||||||||||
Reinvestment of distributions | 25,552 | 266,231 | 145,320 | 1,392,634 | ||||||||||||
Shares redeemed | (218,102 | ) | (2,211,596 | ) | (239,274 | ) | (2,389,865 | ) | ||||||||
| 477,874 | 4,956,672 | 1,910,701 | 19,024,702 | |||||||||||||
NET INCREASE | 3,791,847 | $ | 38,196,808 | 32,374,760 | $ | 318,437,255 | ||||||||||
76
GOLDMAN SACHS STRUCTURED TAX-ADVANTAGED EQUITY FUNDS
| 12. SUMMARY OF SHARE TRANSACTIONS (continued) |
Share activity is as follows:
| International Equity Dividend and Premium Fund | ||||||||||||||||
|
| |||||||||||||||
| For the Six Months Ended June 30, 2013 (Unaudited) | For the Fiscal Year Ended December 31, 2012 | |||||||||||||||
|
| |||||||||||||||
| Shares | Dollars | Shares | Dollars | |||||||||||||
|
| |||||||||||||||
| Class A Shares | ||||||||||||||||
Shares sold | 364,268 | $ | 2,734,840 | 9,590,418 | $ | 67,117,434 | ||||||||||
Reinvestment of distributions | 34,660 | 252,604 | 647,277 | 4,266,924 | ||||||||||||
Shares redeemed | (588,093 | ) | (4,407,544 | ) | (34,123,936 | ) | (220,819,168 | ) | ||||||||
| (189,165 | ) | (1,420,100 | ) | (23,886,241 | ) | (149,434,810 | ) | |||||||||
| Class C Shares | ||||||||||||||||
Shares sold | 67,095 | 488,516 | 28,724 | 200,563 | ||||||||||||
Reinvestment of distributions | 4,539 | 32,272 | 6,698 | 44,294 | ||||||||||||
Shares redeemed | (4,179 | ) | (30,891 | ) | (38,279 | ) | (246,289 | ) | ||||||||
| 67,455 | 489,897 | (2,857 | ) | (1,432 | ) | |||||||||||
| Institutional Shares | ||||||||||||||||
Shares sold | 8,098,075 | 59,969,638 | 42,705,998 | 275,961,348 | ||||||||||||
Reinvestment of distributions | 1,022,322 | 7,350,299 | 1,323,372 | 8,970,362 | ||||||||||||
Shares redeemed | (9,218,831 | ) | (68,395,611 | ) | (11,076,408 | ) | (75,542,019 | ) | ||||||||
| (98,434 | ) | (1,075,674 | ) | 32,952,962 | 209,389,691 | |||||||||||
| Class IR Shares | ||||||||||||||||
Shares sold | 46,155 | 341,082 | 894,625 | 6,231,362 | ||||||||||||
Reinvestment of distributions | 5,973 | 42,893 | 10,550 | 72,262 | ||||||||||||
Shares redeemed | (58,392 | ) | (425,452 | ) | (810,700 | ) | (5,295,275 | ) | ||||||||
| (6,264 | ) | (41,477 | ) | 94,475 | 1,008,349 | |||||||||||
NET INCREASE (DECREASE) | (226,408 | ) | $ | (2,047,354 | ) | 9,158,339 | $ | 60,961,798 | ||||||||
77
GOLDMAN SACHS STRUCTURED TAX-ADVANTAGED EQUITY FUNDS
Notes to Financial Statements (continued)
June 30, 2013 (Unaudited)
| 12. SUMMARY OF SHARE TRANSACTIONS (continued) |
Share activity is as follows:
| Structured Tax-Managed Equity Fund | ||||||||||||||||
|
| |||||||||||||||
| For the Six Months Ended June 30, 2013 (Unaudited) | For the Fiscal Year Ended December 31, 2012 | |||||||||||||||
|
| |||||||||||||||
| Shares | Dollars | Shares | Dollars | |||||||||||||
|
| |||||||||||||||
| Class A Shares | ||||||||||||||||
Shares sold | 206,416 | $ | 2,706,515 | 317,155 | $ | 3,534,598 | ||||||||||
Shares converted from Class B(a) | 333 | 4,408 | 4,978 | 56,343 | ||||||||||||
Reinvestment of distributions | — | — | 36,190 | 406,774 | ||||||||||||
Shares redeemed | (1,055,401 | ) | (13,173,693 | ) | (2,344,011 | ) | (26,046,567 | ) | ||||||||
| (848,652 | ) | (10,462,770 | ) | (1,985,688 | ) | (22,048,852 | ) | |||||||||
| Class B Shares | ||||||||||||||||
Shares sold | 1,195 | 14,661 | 155 | 1,652 | ||||||||||||
Shares converted to Class A(a) | (344 | ) | (4,408 | ) | (5,150 | ) | (56,343 | ) | ||||||||
Reinvestment of distributions | — | — | 85 | 923 | ||||||||||||
Shares redeemed | (6,730 | ) | (82,407 | ) | (35,112 | ) | (371,401 | ) | ||||||||
| (5,879 | ) | (72,154 | ) | (40,022 | ) | (425,169 | ) | |||||||||
| Class C Shares | ||||||||||||||||
Shares sold | 11,722 | 139,802 | 15,165 | 159,600 | ||||||||||||
Reinvestment of distributions | — | — | 3,081 | 33,308 | ||||||||||||
Shares redeemed | (40,030 | ) | (487,697 | ) | (99,031 | ) | (1,039,097 | ) | ||||||||
| (28,308 | ) | (347,895 | ) | (80,785 | ) | (846,189 | ) | |||||||||
| Institutional Shares | ||||||||||||||||
Shares sold | 7,090,389 | 90,059,425 | 8,201,347 | 91,440,764 | ||||||||||||
Reinvestment of distributions | — | — | 391,349 | 4,457,463 | ||||||||||||
Shares redeemed | (6,575,040 | ) | (83,989,299 | ) | (4,736,794 | ) | (53,441,011 | ) | ||||||||
| 515,349 | 6,070,126 | 3,855,902 | 42,457,216 | |||||||||||||
| Service Shares | ||||||||||||||||
Shares sold | — | — | 9 | 100 | ||||||||||||
Reinvestment of distributions | — | — | 37 | 416 | ||||||||||||
Shares redeemed | (328 | ) | (3,902 | ) | (199 | ) | (2,101 | ) | ||||||||
| (328 | ) | (3,902 | ) | (153 | ) | (1,585 | ) | |||||||||
| Class IR Shares | ||||||||||||||||
Shares sold | 10,908 | 139,120 | 3,049 | 34,689 | ||||||||||||
Reinvestment of distributions | — | — | 577 | 6,583 | ||||||||||||
Shares redeemed | (2,982 | ) | (37,826 | ) | (11,427 | ) | (130,570 | ) | ||||||||
| 7,926 | 101,294 | (7,801 | ) | (89,298 | ) | |||||||||||
NET INCREASE (DECREASE) | (359,892 | ) | $ | (4,715,301 | ) | 1,741,453 | $ | 19,046,123 | ||||||||
| (a) | Class B Shares automatically convert into Class A Shares on or about the fifteenth day of the last month of the calendar quarter that is eight years after the initial purchase date of either the Fund or another Goldman Sachs Fund. |
78
GOLDMAN SACHS STRUCTURED TAX-ADVANTAGED EQUITY FUNDS
| 12. SUMMARY OF SHARE TRANSACTIONS (continued) |
Share activity is as follows:
| Structured International Tax-Managed Equity Fund | ||||||||||||||||
|
| |||||||||||||||
| For the Six Months Ended June 30, 2013 (Unaudited) | For the Fiscal Year Ended December 31, 2012 | |||||||||||||||
|
| |||||||||||||||
| Shares | Dollars | Shares | Dollars | |||||||||||||
|
| |||||||||||||||
| Class A Shares | ||||||||||||||||
Shares sold | 396,493 | $ | 3,064,438 | 793,411 | $ | 5,749,953 | ||||||||||
Reinvestment of distributions | — | — | 60,734 | 450,642 | ||||||||||||
Shares redeemed | (1,945,431 | ) | (15,496,853 | ) | (4,973,782 | ) | (35,206,763 | ) | ||||||||
| (1,548,938 | ) | $ | (12,432,415 | ) | (4,119,637 | ) | $ | (29,006,168 | ) | |||||||
| Class C Shares | ||||||||||||||||
Shares sold | 12 | 100 | 1,319 | 9,600 | ||||||||||||
Reinvestment of distributions | — | — | 92 | 679 | ||||||||||||
Shares redeemed | (28 | ) | (223 | ) | (91 | ) | (606 | ) | ||||||||
| (16 | ) | (123 | ) | 1,320 | 9,673 | |||||||||||
| Institutional Shares | ||||||||||||||||
Shares sold | 5,300,838 | 42,216,093 | 5,883,620 | 41,704,588 | ||||||||||||
Reinvestment of distributions | — | — | 531,156 | 3,919,930 | ||||||||||||
Shares redeemed | (2,455,307 | ) | (19,462,240 | ) | (3,953,046 | ) | (28,634,393 | ) | ||||||||
| 2,845,531 | 22,753,853 | 2,461,730 | 16,990,125 | |||||||||||||
| Class IR Shares | ||||||||||||||||
Shares sold | 23,038 | 185,018 | 2,135 | 15,924 | ||||||||||||
Reinvestment of distributions | — | — | 3 | 24 | ||||||||||||
Shares redeemed | — | — | (2,135 | ) | (14,632 | ) | ||||||||||
| 23,038 | 185,018 | 3 | 1,316 | |||||||||||||
NET INCREASE (DECREASE) | 1,319,615 | $ | 10,506,333 | (1,656,584 | ) | $ | (12,005,054 | ) | ||||||||
79
GOLDMAN SACHS STRUCTURED TAX-ADVANTAGED EQUITY FUNDS
Fund Expenses — Six Month Period Ended June 30, 2013 (Unaudited)
As a shareholder of Class A, Class B, Class C, Institutional, Service or Class IR Shares of a Fund you incur types of costs: (1) transaction costs, including sales charges on purchase payments (with respect to Class A Shares), contingent deferred sales charges on redemptions (with respect to Class B and Class C Shares), (if any); and (2) ongoing costs, including management fees; distribution and service (12b-1) fees (with respect to Class A, Class B and Class C Shares); and other Fund expenses. This example is intended to help you understand your ongoing costs (in dollars) of investing in Class A, Class B, Class C, Institutional, Service or Class IR Shares of the Funds and to compare these costs with the ongoing costs of investing in other mutual funds.
The example is based on an investment of $1,000 invested at the beginning of the period and held for the entire period from January 1, 2013 through June 30, 2013.
Actual Expenses — The first line under each share class in the table below provides information about actual account values and actual expenses. You may use the information in this line, together with the amount you invested, to estimate the expenses that you paid over the period. Simply divide your account value by $1,000 (for example, an $8,600 account value divided by $1,000=8.6), then multiply the result by the number in the first line under the heading entitled “Expenses Paid” to estimate the expenses you paid on your account during this period.
Hypothetical Example for Comparison Purposes — The second line under each share class in the table below provides information about hypothetical account values and hypothetical expenses based on the Funds’ actual net expense ratio and an assumed rate of return of 5% per year before expenses, which is not the Funds’ actual return. The hypothetical account values and expenses may not be used to estimate the actual ending account balance or expenses you paid for the period. You may use this information to compare the ongoing costs of investing in the Funds and other funds. To do so, compare this 5% hypothetical example with the 5% hypothetical examples that appear in the shareholder reports of the other funds.
Please note that the expenses shown in the table are meant to highlight your ongoing costs only and do not reflect any transactional costs, such as sales charges, redemption fees, or exchange fees. Therefore, the second line of the table is useful in comparing ongoing costs only, and will not help you determine the relative total costs of owning different funds. In addition, if these transactional costs were included, your costs would have been higher.
| U.S. Equity Dividend and Premium Fund | International Equity Dividend and Premium Fund | Structured Tax-Managed Equity Fund | Structured International Tax-Managed Equity Fund | |||||||||||||||||||||||||||||||||||||||||||||
| Share Class | Beginning Account Value 1/1/13 | Ending Value | Expenses Paid for the 6 Months Ended 6/30/13* | Beginning Account Value 1/1/13 | Ending Value | Expenses Paid for the 6 Months Ended 6/30/13* | Beginning Account Value 1/1/13 | Ending Value | Expenses Paid for the 6 Months Ended 6/30/13* | Beginning Account Value 1/1/13 | Ending Value | Expenses Paid for the 6 Months Ended 6/30/13* | ||||||||||||||||||||||||||||||||||||
| Class A | ||||||||||||||||||||||||||||||||||||||||||||||||
Actual | $ | 1,000 | $ | 1,110.60 | $ | 6.28 | $ | 1,000 | $ | 1,004.70 | $ | 6.61 | $ | 1,000 | $ | 1,151.10 | $ | 5.97 | $ | 1,000 | $ | 1,044.60 | $ | 6.49 | ||||||||||||||||||||||||
Hypothetical 5% return | 1,000 | 1,018.84 | + | 6.01 | 1,000 | 1,018.20 | + | 6.66 | 1,000 | 1,019.24 | + | 5.61 | 1,000 | 1,018.45 | + | 6.41 | ||||||||||||||||||||||||||||||||
| Class B | ||||||||||||||||||||||||||||||||||||||||||||||||
Actual | N/A | N/A | N/A | N/A | N/A | N/A | 1,000 | 1,146.60 | 9.95 | N/A | N/A | N/A | ||||||||||||||||||||||||||||||||||||
Hypothetical 5% return | N/A | N/A | N/A | N/A | N/A | N/A | 1,000 | 1,015.52 | + | 9.35 | N/A | N/A | N/A | |||||||||||||||||||||||||||||||||||
| Class C | ||||||||||||||||||||||||||||||||||||||||||||||||
Actual | 1,000 | 1,105.80 | 10.18 | 1,000 | 1,000.00 | 10.31 | 1,000 | 1,146.10 | 9.95 | 1,000 | 1,041.10 | 10.37 | ||||||||||||||||||||||||||||||||||||
Hypothetical 5% return | 1,000 | 1,015.12 | + | 9.74 | 1,000 | 1,014.48 | + | 10.39 | 1,000 | 1,015.52 | + | 9.35 | 1,000 | 1,014.63 | + | 10.24 | ||||||||||||||||||||||||||||||||
| Institutional | ||||||||||||||||||||||||||||||||||||||||||||||||
Actual | 1,000 | 1,113.00 | 4.19 | 1,000 | 1,006.80 | 4.63 | 1,000 | 1,153.50 | 3.84 | 1,000 | 1,046.10 | 4.62 | ||||||||||||||||||||||||||||||||||||
Hypothetical 5% return | 1,000 | 1,020.83 | + | 4.01 | 1,000 | 1,020.18 | + | 4.66 | 1,000 | 1,021.22 | + | 3.61 | 1,000 | 1,020.28 | + | 4.56 | ||||||||||||||||||||||||||||||||
| Service | ||||||||||||||||||||||||||||||||||||||||||||||||
Actual | N/A | N/A | N/A | N/A | N/A | N/A | 1,000 | 1,151.10 | 6.51 | N/A | N/A | N/A | ||||||||||||||||||||||||||||||||||||
Hypothetical 5% return | N/A | N/A | N/A | N/A | N/A | N/A | 1,000 | 1,018.74 | + | 6.11 | N/A | N/A | N/A | |||||||||||||||||||||||||||||||||||
| Class IR | ||||||||||||||||||||||||||||||||||||||||||||||||
Actual | 1,000 | 1,112.10 | 4.98 | 1,000 | 1,006.10 | 5.37 | 1,000 | 1,152.40 | 4.64 | 1,000 | 1,044.40 | 5.53 | ||||||||||||||||||||||||||||||||||||
Hypothetical 5% return | 1,000 | 1,020.08 | + | 4.76 | 1,000 | 1,019.44 | + | 5.41 | 1,000 | 1,020.48 | + | 4.36 | 1,000 | 1,019.39 | + | 5.46 | ||||||||||||||||||||||||||||||||
| * | Expenses are calculated using each Fund’s annualized net expense ratio for each class, which represents the ongoing expenses as a percentage of net assets for the six months ended June 30, 2013. Expenses are calculated by multiplying the annualized net expense ratio by the average account value for the period; then multiplying the result by the number of days in the most recent fiscal half year; and then dividing that result by the number of days in the fiscal year. The annualized net expense ratios for the period were as follows: |
| Fund | Class A | Class B | Class C | Institutional | Service | Class IR | ||||||||||||||||||
U.S. Equity Dividend and Premium | 1.20 | % | N/A | 1.95 | % | 0.80 | % | N/A | 0.95 | % | ||||||||||||||
International Equity Dividend and Premium | 1.33 | N/A | 2.08 | 0.93 | N/A | 1.08 | ||||||||||||||||||
Structured Tax-Managed Equity | 1.12 | 1.87 | % | 1.87 | 0.72 | 1.22 | % | 0.87 | ||||||||||||||||
Structured International Tax-Managed Equity | 1.28 | N/A | 2.05 | 0.91 | N/A | 1.09 | ||||||||||||||||||
| + | Hypothetical expenses are based on each Fund’s actual annualized net expense ratios and an assumed rate of return of 5% per year before expenses. |
80
GOLDMAN SACHS STRUCTURED TAX-ADVANTAGED EQUITY FUNDS
Statement Regarding Basis for Approval of Management Agreement (Unaudited)
Background
The Goldman Sachs International Equity Dividend and Premium, Goldman Sachs Structured International Tax-Managed Equity, Goldman Sachs Structured Tax-Managed Equity and Goldman Sachs U.S. Equity Dividend and Premium Funds (the “Funds”) are investment portfolios of Goldman Sachs Trust (the “Trust”). The Board of Trustees oversees the management of the Trust and reviews the investment performance and expenses of the Funds at regularly scheduled meetings held during the year. In addition, the Board of Trustees determines annually whether to approve the continuance of the Trust’s investment management agreement (the “Management Agreement”) with Goldman Sachs Asset Management, L.P. (the “Investment Adviser”) on behalf of the Funds.
The Management Agreement was most recently approved for continuation until June 30, 2014 by the Board of Trustees, including those Trustees who are not parties to the Management Agreement or “interested persons” (as defined in the Investment Company Act of 1940, as amended) of any party thereto (the “Independent Trustees”), at a meeting held on June 12-13, 2013 (the “Annual Meeting”).
The review process undertaken by the Trustees spans the course of the year and culminates with the Annual Meeting. To assist the Trustees in their deliberations, the Trustees have established a Contract Review Committee (the “Committee”), comprised of the Independent Trustees. The Committee held four meetings over the course of the year since the Management Agreement was last approved. At those Committee meetings, regularly scheduled Board or other committee meetings and/or the Annual Meeting, the Board, or the Independent Trustees, as applicable, considered matters relating to the Management Agreement, including:
| (a) | the nature and quality of the advisory, administrative and other services provided to the Funds by the Investment Adviser and its affiliates, including information about: |
| (i) | the structure, staff and capabilities of the Investment Adviser and its portfolio management teams; |
| (ii) | the groups within the Investment Adviser and its affiliates that support the portfolio management teams or provide other types of necessary services, including fund services groups (i.e., accounting and financial reporting, tax, shareholder services and operations), controls and risk management groups (i.e., legal, compliance, valuation oversight, credit risk management, internal audit, compliance testing, market risk analysis, finance and strategy and central funding), sales and distribution support groups and others (i.e., information technology and training); |
| (iii) | trends in headcount; |
| (iv) | the Investment Adviser’s financial resources and ability to hire and retain talented personnel and strengthen its operations; and |
| (v) | the parent company’s support of the Investment Adviser and its mutual fund business, as expressed by the firm’s senior management; |
81
GOLDMAN SACHS STRUCTURED TAX-ADVANTAGED EQUITY FUNDS
Statement Regarding Basis for Approval of Management Agreement (Unaudited) (continued)
| (b) | information on the investment performance of the Funds, including comparisons to the performance of similar mutual funds, as provided by a third party mutual fund data provider engaged as part of the contract review process (the “Outside Data Provider”), and benchmark performance indices, and general investment outlooks in the markets in which the Funds invest; |
| (c) | the terms of the Management Agreement and agreements with affiliated service providers entered into by the Trust on behalf of the Funds; |
| (d) | expense information for the Funds, including: |
| (i) | the relative management fee and expense levels of the Funds as compared to those of comparable funds managed by other advisers, as provided by the Outside Data Provider; and |
| (ii) | each Fund’s expense trends over time; |
| (e) | with respect to the extensive investment performance and expense comparison data provided by the Outside Data Provider, its processes in producing that data for the Funds; |
| (f) | the undertakings of the Investment Adviser to limit certain expenses of the Funds that exceed specified levels, and a summary of contractual fee reductions made by the Investment Adviser and its affiliates over the past several years with respect to the Funds; |
| (g) | information relating to the profitability of the Management Agreement and the transfer agency and distribution and service arrangements of each of the Funds and the Trust as a whole to the Investment Adviser and its affiliates; |
| (h) | whether each Fund’s existing management fee schedule adequately addressed any economies of scale; |
| (i) | a summary of the “fall-out” benefits derived by the Investment Adviser and its affiliates from their relationships with the Funds, including the fees received by the Investment Adviser’s affiliates from the Funds for transfer agency, securities lending, portfolio trading, distribution and other services; |
| (j) | a summary of potential benefits derived by the Funds as a result of their relationship with the Investment Adviser; |
| (k) | information regarding commissions paid by the Funds and broker oversight, other information regarding portfolio trading and how the Investment Adviser carries out its duty to seek best execution; |
| (l) | portfolio manager ownership of Fund shares; the manner in which portfolio manager compensation is determined; and the number and types of accounts managed by the portfolio managers; |
| (m) | the nature and quality of the services provided to the Funds by their unaffiliated service providers, and the Investment Adviser’s general oversight and evaluation (including reports on due diligence) of those service providers as part of the administration services provided under the Management Agreement; and |
| (n) | the Investment Adviser’s processes and policies addressing various types of potential conflicts of interest; its approach to risk management; the annual review of the effectiveness of the Funds’ compliance program; and periodic compliance reports. |
82
GOLDMAN SACHS STRUCTURED TAX-ADVANTAGED EQUITY FUNDS
Statement Regarding Basis for Approval of Management Agreement (Unaudited) (continued)
The Trustees also received an overview of the Funds’ distribution arrangements. They received information regarding the Funds’ assets, share purchase and redemption activity and the payment of Rule 12b-1 distribution and service fees by the Funds and the payment of non-Rule 12b-1 shareholder service and/or administration fees by the Structured Tax-Managed Equity Fund’s Service Shares. Information was also provided to the Trustees relating to revenue sharing payments made by and services provided by the Investment Adviser and its affiliates to intermediaries that promote the sale, distribution and/or servicing of Fund shares.
The presentations made at the Board and Committee meetings and at the Annual Meeting encompassed the Funds and other mutual fund portfolios for which the Board of Trustees has responsibility. In evaluating the Management Agreement at the Annual Meeting, the Trustees relied upon their knowledge, resulting from their meetings and other interactions throughout the year, of the Investment Adviser, its affiliates, their services and the Funds. In conjunction with these meetings, the Trustees received written materials and oral presentations on the topics covered, and were advised by their independent legal counsel regarding their responsibilities and other regulatory requirements related to the approval and continuation of mutual fund investment management agreements under applicable law. In addition, the Investment Adviser and its affiliates provided the Independent Trustees with a written response to a formal request for information sent on behalf of the Independent Trustees by their independent legal counsel. During the course of their deliberations, the Independent Trustees met in executive sessions with their independent legal counsel, without representatives of the Investment Adviser or its affiliates present. The Independent Trustees also discussed the broad range of other investment choices that are available to Fund investors, including the availability of comparable funds managed by other advisers.
Nature, Extent and Quality of the Services Provided Under the Management Agreement
As part of their review, the Trustees considered the nature, extent and quality of the services provided by the Investment Adviser. In this regard, the Trustees considered both the investment advisory services and non-advisory services that are provided to the Funds by the Investment Adviser and its affiliates. The Trustees noted the transition in the leadership and changes in personnel of various of the Investment Adviser’s portfolio management teams that had occurred in recent periods, and the ongoing recruitment efforts aimed at bringing high quality investment talent to the Investment Adviser. The Trustees concluded that the Investment Adviser continued to commit substantial financial and operational resources to the Funds and expressed confidence that the Investment Adviser would continue to do so in the future. The Trustees also recognized that the Investment Adviser had made significant commitments to address regulatory compliance requirements applicable to the Funds and the Investment Adviser.
83
GOLDMAN SACHS STRUCTURED TAX-ADVANTAGED EQUITY FUNDS
Statement Regarding Basis for Approval of Management Agreement (Unaudited) (continued)
Investment Performance
The Trustees also considered the investment performance of the Funds. In this regard, they compared the investment performance of each Fund to its peers using rankings and ratings compiled by the Outside Data Provider as of December 31, 2012, and updated performance information prepared by the Investment Adviser using the peer groups identified by the Outside Data Provider as of March 31, 2013. The information on each Fund’s investment performance was provided for the one-, three-, five- and ten-year periods ending on the applicable dates, to the extent that each Fund had been in existence for those periods. The Trustees also reviewed each Fund’s investment performance over time (including on a year-by-year basis) relative to its performance benchmark. In addition, they considered the investment performance trends of the Funds over time, and reviewed the investment performance of each Fund in light of its investment objective and policies and market conditions.
In addition, the Trustees considered materials prepared and presentations made by the Investment Adviser’s senior management and portfolio management personnel, in which Fund performance was assessed. The Trustees also considered the Investment Adviser’s periodic reports with respect to the Funds’ risk profiles, and how the Investment Adviser’s approach to risk monitoring and management influences portfolio management.
The Trustees noted that the International Equity Dividend and Premium Fund’s Class A Shares had placed in the top half of the Fund’s peer group for the five-year period, in the third quartile for the three-year period, and in the fourth quartile for the one-year period, and had underperformed the Fund’s benchmark index for the one-, three-, and five-year periods ended March 31, 2013. The Trustees also observed that the Structured International Tax-Managed Equity Fund’s Class A Shares had placed in the top half of the Fund’s peer group for the one- and three-year periods and in the third quartile for the five-year period, and had underperformed the Fund’s benchmark index for the one-, three-, and five-year periods ended March 31, 2013. They noted that the Structured Tax-Managed Equity Fund’s Class A Shares had placed in the top half of the Fund’s peer group for the one-, three-, five-, and ten-year periods, and had underperformed the Fund’s benchmark index for the one-, three-, five-, and ten-year periods ended March 31, 2013. They noted that the U.S. Equity Dividend and Premium Fund’s Class A Shares had placed in the top half of the Fund’s peer group for the three- and five-year periods and in the fourth quartile for the one-year period, and had underperformed the Fund’s benchmark index for the one-, three-, and five-year periods ended March 31, 2013.
The Trustees noted that the U.S. Equity Dividend and Premium and the International Equity Dividend and Premium Funds had certain significant differences from their peer groups and benchmark indexes that caused the peer groups and benchmark indexes to be imperfect bases for performance comparison. They noted the addition of certain key hires in 2011 to the senior management of the Funds’ portfolio management team, as well as ongoing efforts to further enhance the portfolio management team’s investment models.
84
GOLDMAN SACHS STRUCTURED TAX-ADVANTAGED EQUITY FUNDS
Statement Regarding Basis for Approval of Management Agreement (Unaudited) (continued)
Costs of Services Provided and Competitive Information
The Trustees considered the contractual terms of the Management Agreement and the fee rates payable by each Fund thereunder. In this regard, the Trustees considered information on the services rendered by the Investment Adviser to the Funds, which included both advisory and administrative services that were directed to the needs and operations of the Funds as registered mutual funds.
In particular, the Trustees reviewed analyses prepared by the Outside Data Provider regarding the expense rankings of the Funds. The analyses provided a comparison of the Funds’ management fees and breakpoints to those of relevant peer groups and category universes; an expense analysis which compared each Fund’s overall net and gross expenses to a peer group and a category universe; and a five-year history comparing each Fund’s net expenses to the peer and category medians. The analyses also compared each Fund’s transfer agency, custody, and distribution fees, other expenses and fee waivers/reimbursements to those of the peer group and category medians. The Trustees concluded that the comparisons provided by the Outside Data Provider were useful in evaluating the reasonableness of the management fees and total expenses paid by the Funds.
In addition, the Trustees considered the Investment Adviser’s undertakings to limit certain expenses of the Funds that exceed specified levels. They also noted that the Investment Adviser did not manage institutional accounts or collective investment vehicles having investment objectives and policies similar to those of the Funds, and therefore this type of fee comparison was not possible.
In addition, the Trustees noted that shareholders are able to redeem their Fund shares at any time if they believe that the Fund fees and expenses are too high or if they are dissatisfied with the performance of the Fund.
Profitability
The Trustees reviewed the Investment Adviser’s revenues and pre-tax profit margins with respect to the Trust and each of the Funds. In this regard the Trustees noted that they had received, among other things, profitability analyses and summaries, revenue and expense schedules by Fund and by function (i.e., investment management, transfer agency and distribution and service) and the Investment Adviser’s expense allocation methodology. They observed that the profitability and expense figures are substantially similar to those used by the Investment Adviser for many internal purposes, including compensation decisions among various business groups, and are thus subject to a vigorous internal debate about how certain revenue and expenses should be allocated. The Trustees also reviewed the report of the internal audit group within the Goldman Sachs organization, which included an assessment of the reasonableness and consistency of the Investment Adviser’s expense allocation methodology and an evaluation of the accuracy of the Investment Adviser’s profitability analysis calculations. Profitability data for the Trust and each Fund were provided for 2012 and 2011, and the Trustees considered this information in relation to the Investment Adviser’s overall profitability. The Trustees considered the Investment Adviser’s revenues and pre-tax profit margins both in absolute terms and in comparison to information on the reported pre-tax profit margins earned by certain other asset management firms.
85
GOLDMAN SACHS STRUCTURED TAX-ADVANTAGED EQUITY FUNDS
Statement Regarding Basis for Approval of Management Agreement (Unaudited) (continued)
Economies of Scale
The Trustees considered the information that had been provided regarding the Investment Adviser’s profitability. The Trustees also considered the breakpoints in the fee rate payable under the Management Agreement for each of the Funds at the following annual percentage rates of the average daily net assets of the Funds:
| International Equity Dividend and Premium Fund | Structured International Tax-Managed Equity Fund | Structured Tax-Managed Equity Fund | U.S. Equity Dividend and Premium Fund | |||||||||||||
| First $1 billion | 0.81 | % | 0.85 | % | 0.70 | % | 0.75 | % | ||||||||
| Next $1 billion | 0.73 | 0.77 | 0.63 | 0.68 | ||||||||||||
| Next $3 billion | 0.69 | 0.73 | 0.60 | 0.65 | ||||||||||||
| Next $3 billion | 0.68 | 0.72 | 0.59 | 0.64 | ||||||||||||
| Over $8 billion | 0.67 | 0.71 | 0.58 | 0.63 | ||||||||||||
The Trustees noted that the breakpoints were meant to share potential economies of scale, if any, with the Funds and their shareholders as assets under management reach those asset levels. The Trustees considered the amounts of assets in the Funds; the Funds’ recent share purchase and redemption activity; the information provided by the Investment Adviser relating to the costs of the services provided by the Investment Adviser and its affiliates and their realized profits; information comparing fee rates charged by the Investment Adviser with fee rates charged to other funds in the peer groups; and the Investment Adviser’s undertakings to limit certain expenses of the Funds that exceed specified levels. Upon reviewing these matters at the Annual Meeting, the Trustees concluded that the fee breakpoints represented a means of assuring that benefits of scalability, if any, would be passed along to shareholders at the specified asset levels. They also noted that the Investment Adviser had passed along savings to shareholders of the U.S. Equity Dividend and Premium Fund, which had asset levels above at least the first breakpoint during the prior fiscal year.
86
GOLDMAN SACHS STRUCTURED TAX-ADVANTAGED EQUITY FUNDS
Statement Regarding Basis for Approval of Management Agreement (Unaudited) (continued)
Other Benefits to the Investment Adviser and Its Affiliates
The Trustees also considered the other benefits derived by the Investment Adviser and its affiliates from their relationship with the Funds as stated above, including: (a) transfer agency fees received by Goldman, Sachs & Co. (“Goldman Sachs”); (b) brokerage and futures commissions earned by Goldman Sachs for executing securities and futures transactions on behalf of the Funds; (c) trading efficiencies resulting from aggregation of orders of the Funds with those for other funds or accounts managed by the Investment Adviser; (d) fees earned by Goldman Sachs Agency Lending, an affiliate of the Investment Adviser, as securities lending agent (and fees earned by the Investment Adviser for managing the fund in which the Funds’ cash collateral is invested); (e) the Investment Adviser’s ability to leverage the infrastructure designed to service the Funds on behalf of its other clients; (f) the Investment Adviser’s ability to cross-market other products and services to Fund shareholders; (g) Goldman Sachs’ retention of certain fees as Fund Distributor; (h) the Investment Adviser’s ability to negotiate better pricing with custodians on behalf of its other clients, as a result of the relationship with the Funds; and (i) the possibility that the working relationship between the Investment Adviser and the Funds’ third party service providers may cause those service providers to be open to doing business with other areas of Goldman Sachs. In the course of considering the foregoing, the Independent Trustees requested and received further information quantifying certain of these fall-out benefits. In looking at the benefits to Goldman Sachs Agency Lending and the Investment Adviser from the securities lending program, they noted that the Funds also benefited from their participation in the securities lending program.
Other Benefits to the Funds and Their Shareholders
The Trustees also noted that the Funds receive certain potential benefits as a result of their relationship with the Investment Adviser, including: (a) trading efficiencies resulting from aggregation of orders of the Funds with those of other funds or accounts managed by the Investment Adviser; (b) improved servicing from vendors because of the volume of business generated by the Investment Adviser and its affiliates; (c) improved servicing from broker-dealers because of the volume of business generated by the Investment Adviser and its affiliates; (d) the Investment Adviser’s ability to negotiate favorable terms with derivatives counterparties as a result of the size and reputation of the Goldman Sachs organization; (e) the Investment Adviser’s knowledge and experience gained from managing other accounts and products; (f) the Investment Adviser’s ability to hire and retain qualified personnel to provide services to the Funds because of the reputation of the Goldman Sachs organization; (g) the Funds’ access, through the Investment Adviser, to certain firmwide resources (i.e., proprietary risk management systems and databases), subject to certain restrictions; and (h) the Funds’ access to certain affiliated distribution channels. The Trustees noted the competitive nature of the mutual fund marketplace, and noted further that many of the Funds’ shareholders invested in the Funds in part because of the Funds’ relationship with the Investment Adviser and that those shareholders have a general expectation that the relationship will continue.
87
GOLDMAN SACHS STRUCTURED TAX-ADVANTAGED EQUITY FUNDS
Statement Regarding Basis for Approval of Management Agreement (Unaudited) (continued)
Conclusion
In connection with their consideration of the Management Agreement, the Trustees gave weight to each of the factors described above, but did not identify any particular factor as controlling their decision. After deliberation and consideration of all of the information provided, including the factors described above, the Trustees concluded, in the exercise of their business judgment, that the management fees paid by each of the Funds were reasonable in light of the services provided to it by the Investment Adviser, the Investment Adviser’s costs and each Fund’s current and reasonably foreseeable asset levels. The Trustees unanimously concluded that the Investment Adviser’s continued management likely would benefit each Fund and its shareholders and that the Management Agreement should be approved and continued with respect to each Fund until June 30, 2014.
88
FUNDS PROFILE
Goldman Sachs Funds

Goldman Sachs is a premier financial services firm, known since 1869 for creating thoughtful and customized investment solutions in complex global markets.
Today, the Investment Management Division of Goldman Sachs serves a diverse set of clients worldwide, including private institutions, public entities and individuals. With approximately $739.4 billion in assets under management as of June 30, 2013, Goldman Sachs Asset Management (“GSAM”) has portfolio management teams located around the world and our investment professionals bring firsthand knowledge of local markets to every investment decision. GSAM’s assets under management includes assets managed by Goldman Sachs Asset Management, L.P. and its Investment Advisory Affiliates.
| OVERVIEW OF GOLDMAN SACHS FUNDS |

Money Market1
Financial Square FundsSM
| n | Financial Square Tax-Exempt Funds |
| n | Financial Square Federal Fund |
| n | Financial Square Government Fund |
| n | Financial Square Money Market Fund |
| n | Financial Square Prime Obligations Fund |
| n | Financial Square Treasury Instruments Fund |
| n | Financial Square Treasury Obligations Fund |
Fixed Income
Short Duration and Government
| n | Enhanced Income Fund |
| n | High Quality Floating Rate Fund |
| n | Short Duration Government Fund |
| n | Short Duration Income Fund |
| n | Government Income Fund |
| n | Inflation Protected Securities Fund |
Multi-Sector
| n | Core Fixed Income Fund |
| n | Core Plus Fixed Income Fund |
| n | Global Income Fund |
| n | Strategic Income Fund |
| n | World Bond Fund |
Municipal and Tax-Free
| n | High Yield Municipal Fund |
| n | Municipal Income Fund |
| n | Short Duration Tax-Free Fund |
Single Sector
| n | Investment Grade Credit Fund |
| n | U.S. Mortgages Fund |
| n | High Yield Fund |
| n | High Yield Floating Rate Fund |
| n | Emerging Markets Debt Fund |
| n | Local Emerging Markets Debt Fund |
| n | Dynamic Emerging Markets Debt Fund |
Corporate Credit
| n | Credit Strategies Fund |
Fundamental Equity
| n | Growth and Income Fund |
| n | Small Cap Value Fund |
| n | Mid Cap Value Fund |
| n | Large Cap Value Fund |
| n | Capital Growth Fund |
| n | Strategic Growth Fund |
| n | Focused Growth Fund |
| n | Small/Mid Cap Growth Fund |
| n | Flexible Cap Growth Fund |
| n | Concentrated Growth Fund |
| n | Technology Tollkeeper Fund |
| n | Growth Opportunities Fund |
| n | Rising Dividend Growth Fund |
| n | U.S. Equity Fund |
| n | Income Builder Fund |
Structured Equity
| n | Structured Tax-Managed Equity Fund |
| n | Structured International Tax-Managed Equity Fund |
| n | U.S. Equity Dividend and Premium Fund |
| n | International Equity Dividend and Premium Fund |
Equity Insights2
| n | Small Cap Equity Insights Fund |
| n | U.S. Equity Insights Fund |
| n | Small Cap Growth Insights Fund |
| n | Large Cap Growth Insights Fund |
| n | Large Cap Value Insights Fund |
| n | Small Cap Value Insights Fund |
| n | International Small Cap Insights Fund |
| n | International Equity Insights Fund |
| n | Emerging Markets Equity Insights Fund |
Fundamental Equity International
| n | Strategic International Equity Fund |
| n | Concentrated International Equity Fund |
| n | International Small Cap Fund |
| n | Asia Equity Fund |
| n | Emerging Markets Equity Fund |
| n | BRIC Fund (Brazil, Russia, India, China) |
| n | N-11 Equity Fund |
| n | China Equity Fund |
Select Satellite3
| n | Real Estate Securities Fund |
| n | International Real Estate Securities Fund |
| n | Commodity Strategy Fund |
| n | Dynamic Allocation Fund |
| n | Absolute Return Tracker Fund |
| n | Managed Futures Strategy Fund |
| n | MLP Energy Infrastructure Fund |
| n | Multi-Manager Alternatives Fund |
| n | Retirement Portfolio Completion Fund |
| n | Income Strategies Portfolio |
Total Portfolio Solutions3
| n | Balanced Strategy Portfolio |
| n | Growth and Income Strategy Portfolio |
| n | Growth Strategy Portfolio |
| n | Equity Growth Strategy Portfolio |
| n | Satellite Strategies Portfolio |
| n | Enhanced Dividend Global Equity Portfolio |
| n | Tax Advantaged Global Equity Portfolio |
| 1 | An investment in a money market fund is neither insured nor guaranteed by the Federal Deposit Insurance Corporation (“FDIC”) or any other government agency. Although the Funds seek to preserve the value of your investment at $1.00 per share, it is possible to lose money by investing in the Funds. |
| 2 | Effective at the close of business May 3, 2013, the Goldman Sachs Structured Large Cap Growth, Structured Large Cap Value, Structured Small Cap Equity, Structured Small Cap Growth, Structured Small Cap Value, Structured U.S. Equity, Structured Emerging Markets Equity, Structured International Equity and Structured International Small Cap Funds were renamed the Goldman Sachs Large Cap Growth Insights, Large Cap Value Insights, Small Cap Equity Insights, Small Cap Growth Insights, Small Cap Value Insights, U.S. Equity Insights, Emerging Markets Equity Insights, International Equity Insights and International Small Cap Insights Funds, respectively. |
| 3 | Individual Funds within the Total Portfolio Solutions and Select Satellite categories will have various placement on the risk/return spectrum and may have greater or lesser risk than that indicated by the placement of the general Total Portfolio Solutions or Select Satellite category. |
Financial Square FundsSM is a registered service mark of Goldman, Sachs & Co.
TRUSTEES Ashok N. Bakhru, Chairman Donald C. Burke John P. Coblentz, Jr. Diana M. Daniels Joseph P. LoRusso James A. McNamara Jessica Palmer Alan A. Shuch Richard P. Strubel | OFFICERS James A. McNamara, President George F. Travers, Principal Financial Officer Caroline L. Kraus, Secretary Scott M. McHugh, Treasurer | |
GOLDMAN, SACHS & CO. Distributor and Transfer Agent | GOLDMAN SACHS ASSET MANAGEMENT, L.P. Investment Adviser | |
Visit our web site at www.goldmansachsfunds.com to obtain the most recent month-end returns.
Goldman Sachs Asset Management, L.P., 200 West Street, New York, New York 10282
The reports concerning the Funds included in this shareholder report may contain certain forward-looking statements about the factors that may affect the performance of the Funds in the future. These statements are based on Fund management’s predictions and expectations concerning certain future events and their expected impact on the Funds, such as performance of the economy as a whole and of specific industry sectors, changes in the levels of interest rates, the impact of developing world events, and other factors that may influence the future performance of the Funds. Management believes these forward-looking statements to be reasonable, although they are inherently uncertain and difficult to predict. Actual events may cause adjustments in portfolio management strategies from those currently expected to be employed.
A description of the policies and procedures that the Funds use to determine how to vote proxies relating to portfolio securities and information regarding how a Fund voted proxies relating to portfolio securities during the most recent 12-month period ended June 30 is available (i) without charge, upon request by calling 1-800-526-7384 (for Retail Shareholders) or 1-800-621-2550 (for Institutional Shareholders); and (ii) on the Securities and Exchange Commission (“SEC”) web site at http://www.sec.gov.
The Funds file their complete schedule of portfolio holdings with the SEC for the first and third quarters of each fiscal year on Form N-Q. The Funds’ Forms N-Q are available on the SEC’s web site at http://www.sec.gov within 60 days after the Funds’ first and third fiscal quarters. The Funds’ Forms N-Q may be reviewed and copied at the SEC’s Public Reference Room in Washington, D.C. and information on the operation of the Public Reference Room may also be obtained by calling 1-800-SEC-0330. Forms N-Q may be obtained upon request and without charge by calling 1-800-526-7384 (for Retail Shareholders) or 1-800-621-2550 (for Institutional Shareholders).
Goldman, Sachs & Co. (‘‘Goldman Sachs’’) does not provide legal, tax or accounting advice. Any statement contained in this communication (including any attachments) concerning U.S. tax matters was not intended or written to be used, and cannot be used, for the purpose of avoiding penalties under the Internal Revenue Code, and was written to support the promotion or marketing of the transaction(s) or matter(s) addressed. Clients of Goldman Sachs should obtain their own independent tax advice based on their particular circumstances.
Holdings and allocations shown are as of June 30, 2013 and may not be representative of future investments. Fund holdings should not be relied on in making investment decisions and should not be construed as research or investment advice regarding particular securities. Current and future holdings are subject to risk.
The Global Industry Classification Standard (GICS) was developed by and is the exclusive property and a service mark of Morgan Stanley Capital International Inc. (MSCI) and Standard & Poor’s, a division of The McGraw-Hill Companies, Inc. (S&P) and is licensed for use by Goldman Sachs. Neither MSCI, S&P nor any other party involved in making or compiling the GICS or any GICS classifications makes any express or implied warranties or representations with respect to such standard or classification (or the results to be obtained by the use thereof), and all such parties hereby expressly disclaim all warranties of originality, accuracy, completeness, merchantability or fitness for a particular purpose with respect to any of such standard or classification. Without limiting any of the foregoing, in no event shall MSCI, S&P, any of their affiliates or any third party involved in making or compiling the GICS or any GICS classifications have any liability for any direct, indirect, special, punitive, consequential or any other damages (including lost profits) even if notified of the possibility of such damages.
The portfolio risk management process includes an effort to monitor and manage risk, but does not imply low risk.
This material is not authorized for distribution to prospective investors unless preceded or accompanied by a current Prospectus or summary prospectus, if applicable. Investors should consider a Fund’s objective, risks, and charges and expenses, and read the summary prospectus, if available, and/or the Prospectus carefully before investing or sending money. The summary prospectus, if available, and the Prospectus contain this and other information about a Fund and may be obtained from your Authorized Institution or from Goldman, Sachs & Co. by calling (retail – 1-800-526-7384) (institutional – 1-800-621-2550).
© 2013 Goldman Sachs. All rights reserved. 107274.MF.MED.TMPL/8/2013 TAXADVSAR13/14.4K
| ITEM 2. | CODE OF ETHICS. |
| The information required by this Item is only required in an annual report on this Form N-CSR. |
| ITEM 3. | AUDIT COMMITTEE FINANCIAL EXPERT. |
| The information required by this Item is only required in an annual report on this Form N-CSR. |
| ITEM 4. | PRINCIPAL ACCOUNTANT FEES AND SERVICES. |
| The information required by this Item is only required in an annual report on this Form N-CSR. |
| ITEM 5. | AUDIT COMMITTEE OF LISTED REGISTRANTS. |
| Not applicable. |
| ITEM 6. | SCHEDULE OF INVESTMENTS. |
| Schedule of Investments is included as part of the Report to Stockholders filed under Item 1. |
| ITEM 7. | DISCLOSURE OF PROXY VOTING POLICIES AND PROCEDURES FOR CLOSED-END MANAGEMENT INVESTMENT COMPANIES. |
| Not applicable. |
| ITEM 8. | PORTFOLIO MANAGERS OF CLOSED-END MANAGEMENT INVESTMENT COMPANIES. |
| Not applicable. |
| ITEM 9. | PURCHASES OF EQUITY SECURITIES BY CLOSED-END MANAGEMENT INVESTMENT COMPANY AND AFFILIATED PURCHASERS. |
| Not applicable. |
| ITEM 10. | SUBMISSION OF MATTERS TO A VOTE OF SECURITY HOLDERS. |
| There have been no material changes to the procedures by which shareholders may recommend nominees to the registrant’s board of trustees. |
| ITEM 11. | CONTROLS AND PROCEDURES. |
| (a) | The registrant’s principal executive and principal financial officers, or persons performing similar functions have concluded that the registrant’s disclosure controls and procedures (as defined in Rule 30a-3(c) under the Investment Company Act of 1940, as amended (the “1940 Act”)) are effective as of a date within 90 days of the filing of this report that includes the disclosure required by this paragraph, based on the evaluation of these controls and procedures required by Rule 30a-3(b) under the 1940 Act and 15d-15(b) under the Securities Exchange Act of 1934, as amended. |
| (b) | There were no changes in the registrant’s internal control over financial reporting (as defined in Rule 30a-3(d) under the 1940 Act) that occurred during the registrant’s second fiscal quarter of the period covered by this report that have materially affected, or are reasonably likely to materially affect, the registrant’s internal control over financial reporting. |
| ITEM 12. | EXHIBITS. |
| (a)(1) | The information required by this Item is only required in connection with an annual report on this Form N-CSR. | |||
| (a)(2) | Exhibit 99.CERT | Certifications pursuant to Section 302 of the Sarbanes-Oxley Act of 2002 filed herewith. | ||
| (b) | Exhibit 99.906CERT | Certifications pursuant to Section 906 of the Sarbanes-Oxley Act of 2002 filed herewith. | ||
SIGNATURES
Pursuant to the requirements of the Securities Exchange Act of 1934 and the Investment Company Act of 1940, the registrant has duly caused this report to be signed on its behalf by the undersigned, thereunto duly authorized.
| Goldman Sachs Trust | ||||
| By: | /s/ James A. McNamara | |||
| James A. McNamara | ||||
| President/Principal Executive Officer | ||||
| Goldman Sachs Trust | ||||
| Date: | August 13, 2013 | |||
Pursuant to the requirements of the Securities Exchange Act of 1934 and the Investment Company Act of 1940, this report has been signed below by the following persons on behalf of the registrant and in the capacities and on the dates indicated.
| By: | /s/ James A. McNamara | |||
| James A. McNamara | ||||
| President/Principal Executive Officer | ||||
| Goldman Sachs Trust | ||||
| Date: | August 13, 2013 | |||
| By: | /s/ George F. Travers | |||
| George F. Travers | ||||
| Principal Financial Officer | ||||
| Goldman Sachs Trust | ||||
| Date: | August 14, 2013 | |||