UNITED STATES
SECURITIES AND EXCHANGE COMMISSION
Washington, D.C. 20549
FORM N-CSR
CERTIFIED SHAREHOLDER REPORT OF REGISTERED
MANAGEMENT INVESTMENT COMPANIES
Investment Company Act file number 811-05349
Goldman Sachs Trust
(Exact name of registrant as specified in charter)
71 South Wacker Drive, Chicago, Illinois 60606
(Address of principal executive offices) (Zip code)
| Caroline Kraus, Esq. | Copies to: | |
| Goldman, Sachs & Co. | Geoffrey R.T. Kenyon, Esq. | |
| 200 West Street | Dechert LLP | |
| New York, New York 10282 | 100 Oliver Street | |
| 40th Floor | ||
| Boston, MA 02110-2605 |
(Name and address of agents for service)
Registrant’s telephone number, including area code: (312) 655-4400
Date of fiscal year end: October 31
Date of reporting period: April 30, 2014
| ITEM 1. | REPORTS TO STOCKHOLDERS. |
| The Semi-Annual Report to Stockholders is filed herewith. |
Goldman Sachs Funds

| Semi-Annual Report | April 30, 2014 | |||
Fundamental International Equity Funds | ||||
Focused International Equity* | ||||
International Small Cap | ||||
Strategic International Equity | ||||
*Effective at the close of business on February 28, 2014, the Goldman Sachs Concentrated International Equity Fund was renamed the Goldman Sachs Focused International Equity Fund.

Goldman Sachs Fundamental International Equity Funds
| n | FOCUSED INTERNATIONAL EQUITY |
| n | INTERNATIONAL SMALL CAP |
| n | STRATEGIC INTERNATIONAL EQUITY |
TABLE OF CONTENTS | ||||
Principal Investment Strategies and Risks | 1 | |||
Investment Process | 2 | |||
Market Review | 3 | |||
Portfolio Management Discussions and Performance Summaries | 5 | |||
Schedule of Investments | 23 | |||
Financial Statements | 30 | |||
Financial Highlights | 34 | |||
Notes to Financial Statements | 40 | |||
Other Information | 52 | |||
| NOT FDIC-INSURED | May Lose Value | No Bank Guarantee | ||
GOLDMAN SACHS FUNDAMENTAL EQUITY INTERNATIONAL FUNDS
Principal Investment Strategies and Risks
This is not a complete list of risks that may affect the Funds. For additional information concerning the risks applicable to the Funds, please see the Funds’ Prospectus.
The Goldman Sachs Focused International Equity Fund (formerly, Concentrated International Equity) invests primarily in a diversified portfolio of equity investments in companies that are organized outside the United States or whose securities are principally traded outside the United States. The Fund is subject to market risk, which means that the value of the securities in which it invests may go up or down in response to the prospects of individual companies, particular sectors and/or general economic conditions. Foreign and emerging markets investments may be more volatile and less liquid than investments in U.S. securities and are subject to the risks of currency fluctuations and adverse economic or political developments. Because the Fund may invest in a relatively small number of issuers, the Fund is subject to greater risk of loss.
The Goldman Sachs International Small Cap Fund invests primarily in a diversified portfolio of equity investments in non-U.S. small-capitalization companies. The Fund is subject to market risk, which means that the value of the securities in which it invests may go up or down in response to the prospects of individual companies, particular sectors and/or general economic conditions. Foreign and emerging markets investments may be more volatile and less liquid than investments in U.S. securities and are subject to the risks of currency fluctuations and adverse economic or political developments. The securities of mid- and small-capitalization companies involve greater risks than those associated with larger, more established companies and may be subject to more abrupt or erratic price movements.
The Goldman Sachs Strategic International Equity Fund invests primarily in a diversified portfolio of equity investments in companies that are organized outside the United States or whose securities are principally traded outside the United States. The Fund is subject to market risk, which means that the value of the securities in which it invests may go up or down in response to the prospects of individual companies, particular sectors and/or general economic conditions. Foreign and emerging markets investments may be more volatile and less liquid than investments in U.S. securities and are subject to the risks of currency fluctuations and adverse economic or political developments.
1
GOLDMAN SACHS FUNDAMENTAL EQUITY INTERNATIONAL FUNDS
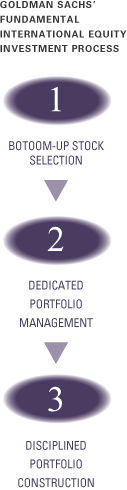
What Differentiates Goldman Sachs’ Fundamental International Equity Investment Process?
Goldman Sachs’ Fundamental International Equity investment process is based on the belief that strong, consistent results are best achieved through expert stock selection, performed by research teams working together on a global scale. Our deep, diverse and experienced team of research analysts and portfolio managers combines local insights with global, industry-specific expertise to identify its best investment ideas.

| n | Fundamental research teams based in the United States, United Kingdom, Japan, China, Australia, Singapore, Brazil and India and focusing on long-term business and management quality |
| n | Analysts collaborate regularly to leverage regional and industry-specific research and insights |
| n | Global perspective is informed by local market expertise |
| n | A common valuation framework, focusing on long-term earnings power, ensures consistency when valuing and comparing a company to its peers globally |

| n | Team of experienced Research Analysts is regionally aligned and has sector expertise |
| n | Team leverages the research of the approximately 80+ regional investment professionals |
| n | Decision-making process is informed by active participation in the global research process |

| n | Security selections are aligned with level of investment conviction |
| n | Risk monitoring considers whether investment and other risks to the Funds are intended and justified |
| n | Dedicated portfolio construction team assists in ongoing monitoring and adjustment of the Funds |

International equity portfolios that strive to offer:
| n | Access to markets across the world |
| n | Disciplined approach to stock selection |
| n | Optimal risk/return profiles |
2
MARKET REVIEW
Goldman Sachs Fundamental Equity International Funds
Market Review
International equities generated solid gains during the six-month period ended April 30, 2014 (the “Reporting Period”). The MSCI Europe, Australasia, Far East (EAFE) Index (Net, USD, Unhedged) (the “MSCI EAFE Index”) posted a return of 4.44%.*
Stock markets in Japan and Europe continued to make fresh highs through the end of 2013, with Japan’s Nikkei 225 Stock Average closing the year at a six-year high. The Japanese equity market’s strength reflected optimism about Prime Minister Shinzo Abe’s bold reforms and big stimulus. Encouragingly, Japan’s consumer price index (“CPI”) steadily increased through the end of the calendar year, boosting confidence that its economy was on a path to achieve its government’s inflation target of 2%. Germany’s Xetra Dax also reached a new high in December 2013, as European equity markets continued to benefit from the European Central Bank’s commitment to easy monetary policy and as economic growth returned to the region. (The Nikkei 225 Stock Average is the leading and most respected index of Japanese stocks. It is a price-weighted index comprised of Japan’s top 225 blue chip companies on the Tokyo Stock Exchange. The Xetra Dax is a blue chip index in Germany that tracks the performance of the 30 most actively traded stocks on the Frankfurt Stock Exchange.) Weak performance from commodity-related sectors and a depreciating currency negatively impacted the Australian equity market toward the end of 2013.
January 2014 got off to a volatile start, as global developed equity market performance reflected a number of concerns in the emerging markets. However, most developed international equity markets then rebounded to make gains through April 2014. During the first quarter of 2014, it was reported that the Eurozone economy had grown at a stronger than expected 0.5% year over year rate during the fourth quarter of 2013, and the European Commission raised its estimates for Gross Domestic Product (“GDP”) growth in the region to 1.2% in 2014 and 1.8% in 2015. The Euro-area Flash Services Composite Purchasing Managers Index (“PMI”) recorded its highest level since 2011, while peripheral bond markets continued to normalize, with yields on Italian and Spanish bonds approximately half of what they were two years prior. (Flash Services Composite PMI is an early estimate of the Services PMI for a region, designed to provide an accurate advance indication of the final Services PMI data. As flash PMIs are among the first economic indicators for each month, providing evidence of changing economic conditions ahead of comparable government statistics, they can have a significant effect on currency markets.) However, many corporate earnings reports and conservative guidance from company managements disappointed, and disinflation according to many economists and analysts, remained a near-term threat. Japanese equities were weak for most of the calendar year through April 2014 in anticipation of the April 1, 2014 consumption tax increase, which is expected to obscure some economic data in the near term. Wage growth and business and consumer sentiment in Japan also disappointed.
For the Reporting Period overall, Denmark, Israel and Ireland were the best performing constituents of the MSCI EAFE Index, while Luxembourg, Greece and Japan were weakest. All sectors gained during the Reporting Period, but health care had the strongest performance due to an increasing level of merger and acquisition activity. The energy sector also significantly outperformed the MSCI EAFE Index during the Reporting Period, as rising geopolitical tensions between Russia and Ukraine pushed oil prices higher. Consumer discretionary, information technology and financials posted positive returns but significantly underperformed the MSCI EAFE Index.
| *All | index returns are expressed in U.S. dollar terms. |
3
MARKET REVIEW
Looking Ahead
At the end of the Reporting Period, we believed increased spending was likely to benefit innovative companies and industries in the developed markets. At the same time, however, with an increasing dispersion of equity returns, markets near record highs and valuations near historical averages, we believe stock selection will be increasingly critical to outperforming the broad international equity market going forward.
Already, merger and acquisition activity had picked up in early 2014, which we view as a sign that company managements are becoming more confident and ready to spend on growth initiatives. Chief executive officers appear to be getting positive reinforcement from equity investors, who are increasingly rewarding the share prices of acquiring companies, not just the target companies. We believe an increase in capital expenditure spending is likely to follow and contribute to the better global GDP growth we expect for 2014 as a whole. Indeed, in our view, global macroeconomic growth should be an additional tailwind for developed equity markets, where central banks continue to be accommodative and where inflation remains low.
European economic growth was recovering in 2014 year-to-date through April as expected, but earnings marginally disappointed, as an appreciating euro translated to lackluster top-line results. However, we believe Europe is nearing a turning point. Consumer sentiment appears to be improving, and while banks are still shrinking balance sheets, we believe lending activity in the region may well be stable to increasing in another six to nine months. At the end of the Reporting Period, corporate earnings in the region were still well below peak, unlike many other developed markets, which, in our view, leaves more room for operating leverage and earnings growth should the economy re-accelerate as widely anticipated.
In our view, Japan is the global market most exposed to capital expenditure, and the weak yen is a competitive advantage for Japanese industrial companies. While Japanese equities lagged the other developed markets during the Reporting Period, we believe there could be a number of catalysts on the horizon. These catalysts include the normalization of spending patterns after the consumption tax hike that took effect on April 1, 2014; the potential for wage increases for the majority of the population by June 2014; likely action from the Bank of Japan over the summer of 2014; and the possibility of corporate earnings estimate increases in the second half of the year.
As companies differentiate themselves with revenue and earnings growth, we believe fundamental active managers have an excellent opportunity to similarly differentiate their portfolios and performance. As always, we maintain our focus on seeking companies that we believe will generate long-term growth in today’s ever-changing market conditions.
4
PORTFOLIO RESULTS
Goldman Sachs Focused International Equity Fund
Investment Objective
The Fund seeks long-term capital appreciation.
Portfolio Management Discussion and Analysis
Effective at the close of business on February 28, 2014, the Goldman Sachs Concentrated International Equity Fund was renamed the Goldman Sachs Focused International Equity Fund (the “Fund”). Below, the Goldman Sachs Global Equity Team discusses the Fund’s performance and positioning for the six-month period ended April 30, 2014 (the “Reporting Period”).
| Q | How did the Fund perform during Reporting Period? |
| A | During the Reporting Period, the Fund’s Class A, B, C, Institutional, Service and IR Shares generated cumulative total returns, without sales charges, of 0.87%, 0.51%, 0.48%, 1.07%, 0.81% and 0.99%, respectively. These returns compare to the 4.44% cumulative total return of the Fund’s benchmark, the MSCI Europe, Australasia, Far East (EAFE) Index (Net, USD, Unhedged) (the “MSCI Index”), during the same period. |
| Q | What key factors were responsible for the Fund’s performance during the Reporting Period? |
| A | The Fund’s underperformance of the MSCI Index during the Reporting Period can be primarily attributed to individual stock selection. |
| Q | Which stocks detracted significantly from the Fund’s performance during the Reporting Period? |
| A | The biggest detractors from Fund performance relative to the MSCI Index during the Reporting Period were Nomura Real Estate, Credit Saison and Sumitomo Mitsui Financial Group. |
| Nomura Real Estate, a Japanese real estate holding company, detracted from the Fund’s relative returns during the Reporting Period. The company underperformed the MSCI Index in spite of better than consensus fiscal second quarter 2014 results and upward revision of its fiscal year forecasts. Nomura Real Estate had benefited from a spike in demand of condo contracts before Japan’s consumption tax increase took effect. However, its shares declined after investors began to have concerns about a possible decline in demand for condos after the consumption tax hike. We decided to exit the Fund’s position in Nomura Real Estate in favor of higher conviction opportunities. |
Japanese credit services company Credit Saison was a top detractor from the Fund’s relative results during the Reporting Period. Its shares were challenged by concerns over possible charges for consumer finance overpaid interest. Formerly, many consumer finance companies would lend money at an interest rate above the legal limit. Now, borrowers can claim to have their overpaid interest refunded, requiring credit finance companies to put provisions in place to repay those claims. During the Reporting Period, one competitor company increased its provision for overpaid interest charges to cover more than four years, causing investors to worry that other consumer finance companies, with only a one to two year provision level, may also increase their provisions. At the end of the Reporting Period, we believed this should be a short-term headwind and that Credit Saison’s shares should stabilize once all provisions for overpaid interest are finalized. We also maintained the Fund’s position in its stock because we believe the company is well positioned to benefit from government programs |
5
PORTFOLIO RESULTS
expected to help stimulate spending, leading to a positive impact on Credit Saison’s credit card business segment. |
| Japanese bank group Sumitomo Mitsui Financial Group detracted from the Fund’s relative performance. Its stock underperformed the MSCI Index after it announced its quarterly net income, which declined substantially compared to last fiscal year due to lower bond trading gains. The loan-deposit spread in its banking unit also narrowed. We decided to sell the Fund’s position in Sumitomo Mitsui Financial Group. |
| Q | What were some of the Fund’s best-performing individual stocks? |
| A | The greatest contributors to Fund performance relative to the MSCI Index during the Reporting Period were Shire, Novo-Nordisk and Computershare. |
| U.K.-based biopharmaceuticals company Shire was the top positive contributor to the Fund’s relative results during the Reporting Period. Its shares rose after the company announced better than expected third quarter results and raised its 2013 guidance. At the end of the Reporting Period, we believed Shire had a strong product pipeline that should continue to provide attractive long-term growth opportunities and was trading at an attractive valuation relative to its peers. |
| Denmark-based pharmaceutical company Novo-Nordisk was a strong contributor during the Reporting Period. The company delivered a good set of fiscal year 2013 results in February 2014, and a number of concerns that had impacted its performance during 2013 began to diminish. Namely, one of its key competitors was not able to show superiority to Novo-Nordisk’s Type 2 diabetes drug. Further, the impact of losing a supply contract with Express Script seemed to be less severe than initially anticipated, as a number of patients already on Novo-Nordisk’s drugs were grandfathered in and allowed to continue usage. Lastly, Novo-Nordisk’s pipeline was starting to attract attention, as its oral insulin drug completed Phase 1 trials and progressed into Phase 2. The company has a dominant presence in the U.S. and Europe and was growing its revenues in the emerging markets. At the end of the Reporting Period, we believed the company was well positioned to perform well over the longer term given the sustainability of growth in its diabetes franchise and its innovative product pipeline. |
| The Fund’s holding in Australian investor services company Computershare performed well during the Reporting Period. The company announced strong first half fiscal year results, driven by better than expected earnings, and raised its fiscal 2014 guidance as well. Following the company’s strong performance, we decided to take profits and sell the position in favor of other high conviction ideas. |
| Q | Which equity market sectors most significantly affected Fund performance during the Reporting Period? |
| A | The sectors that detracted most from the Fund’s relative results during the Reporting Period were financials, consumer discretionary and industrials, where stock selection in each weighed most negatively on performance. |
| The sectors that contributed most to the Fund’s performance relative to the MSCI Index were health care and consumer staples, due primarily to effective stock selection in each. To a more modest degree, allocation positioning in information technology also helped. |
| Q | Which countries most affected the Fund’s performance during the Reporting Period? |
| A | Typically, the Fund’s individual stock holdings will significantly influence the Fund’s performance within a particular country or region relative to the MSCI Index. This effect may be even more pronounced in a concentrated portfolio or in countries that represent only a modest proportion of the MSCI Index. |
| That said, the countries that detracted most from the Fund’s performance during the Reporting Period were Japan, France and Finland, where stock selection in each hampered results. Effective stock selection in Australia and Denmark and having no exposure to Hong Kong, which significantly lagged the MSCI Index during the Reporting Period, boosted the Fund’s relative returns most. |
| Q | How did the Fund use derivatives and similar instruments during the Reporting Period? |
| A | During the Reporting Period, we did not use derivatives to hedge positions or as part of an active management strategy, but we used index futures on an opportunistic basis to ensure the Fund remained almost fully exposed to equities following cash inflows or stock sales. |
| Q | Did the Fund make any significant purchases or sales during the Reporting Period? |
| A | We established new Fund positions during the Reporting Period in Swiss agricultural chemicals company Syngenta, French electrical supply company Rexel and Swiss bank company UBS. |
6
PORTFOLIO RESULTS
| We initiated a Fund position in Syngenta, a company engaged in the production of specialty chemicals for crop productivity, during the Reporting Period. Recent one-off costs, which we believe have little to no impact on results beyond 2013, had weakened market sentiment on the company, creating what we considered to be an attractive opportunity to establish the position. The company is, in our view, a fundamentally strong business, with steady returns and improving margins. We believe the company’s margins and returns should further improve as its management executes on its cost saving plans, its seed business gains scale and its operating leverage begins to even out. |
| We also established a Fund position in Rexel, one of the largest distributors of low and ultra-low voltage electrical components. The company’s core business is to sell installation equipment (breakers, switches, sockets, plugs) and cables and conduits, lighting, security devices and tools to electricians and electrical contractors. In our view, Rexel is a well-run business with strong cost control and focus on increasing efficiency. Furthermore, we believe the company is well positioned to benefit from cyclical recovery and market consolidation in Europe, which, in our view, should help drive margin improvement going forward. |
| We initiated a Fund position in UBS because we believe concerns around Swiss capital requirements have been overdone but offered an attractive opportunity to buy what we consider to be a strong private banking franchise. |
| In addition to those sales already mentioned, we sold out of the Fund’s positions in Telecity and BP during the Reporting Period. |
| We exited the Fund’s position in Telecity, a U.K.-based operator of European data centers, as we lost conviction that our investment thesis — that its operating profits and cash flow would grow quickly as new capacity matured — would play out. The company continued to reduce pricing and margin progression expectations, suggesting increased competition and excess capacity. Given diminished conviction in our investment thesis, we concluded that we would reallocate the capital to what we considered to be more attractive investment opportunities. |
| We eliminated the Fund’s position in U.K.-based oil and gas company BP. The stock had performed well, and we decided to sell and take profits. |
| Q | Were there any notable changes in the Fund’s weightings during the Reporting Period? |
| A | In this Fund, both sector weightings and country allocations are largely the result of our bottom-up stock selection process rather than any top-down macroeconomic views or regional, country, sector or industry bets. We seek to outpace the MSCI Index by overweighting stocks that we expect to outperform and underweighting those we think may lag. Consequently, changes in its sector or country weightings are generally the direct result of individual stock selection or of stock appreciation or depreciation. That said, during the Reporting Period, there were no notable changes in the Fund’s sector or country weightings. |
| Q | Were there any changes to the Fund’s portfolio management team during the Reporting Period? |
| A | During the Reporting Period, Eddie Perkin, managing director and chief investment officer (“CIO”) of International and Emerging Markets Equity and a lead portfolio manager of the Fund, left the firm. Suneil Mahindru, current lead portfolio manager for the firm’s Global Equity Partners strategy, became the CIO of International Equity and was named a lead portfolio manager on the Fund with Alexis Deladerriere. |
| Q | How was the Fund positioned relative to the MSCI Index at the end of the Reporting Period? |
| A | At the end of the Reporting Period, the Fund had more exposure to South Korea, France, Switzerland, Sweden, Ireland and Finland and less exposure to Australia and Germany relative to the MSCI Index. At the end of the Reporting Period, the Fund held neutral positions relative to the MSCI Index in several countries and had no position at all in several other countries, most notably Spain, Hong Kong, Italy, the Netherlands and Singapore. |
| From a sector allocation perspective, the Fund had overweight positions relative to the MSCI Index in industrials and materials at the end of the Reporting Period. On the same date, the Fund had underweighted positions compared to the MSCI Index in utilities, energy, consumer staples, telecommunication services, information technology, health care and financials and was rather neutrally weighted compared to the MSCI Index in consumer discretionary. |
| As always, we remained focused on individual stock selection, with sector and country positioning being a secondary, closely-monitored effect. |
7
FUND BASICS
Focused International Equity Fund
as of April 30, 2014
| PERFORMANCE REVIEW | ||||||||||
| November 1, 2013–April 30, 2014 | Fund Total Return (based on NAV)1 | MSCI EAFE Index (Net, USD, Unhedged)2 | ||||||||
| Class A | 0.87 | % | 4.44 | % | ||||||
| Class B | 0.51 | 4.44 | ||||||||
| Class C | 0.48 | 4.44 | ||||||||
| Institutional | 1.07 | 4.44 | ||||||||
| Service | 0.81 | 4.44 | ||||||||
| Class IR | 0.99 | 4.44 | ||||||||
| 1 | The net asset value (“NAV”) represents the net assets of the class of the Fund (ex-dividend) divided by the total number of shares of the class outstanding. The Fund’s performance assumes the reinvestment of dividends and other distributions. The Fund’s performance does not reflect the deduction of any applicable sales charges. |
| 2 | The MSCI EAFE Index (net, USD, unhedged) is a market capitalization-weighted composite of securities in 22 developed markets. The Index approximates the minimum possible dividend reinvestment. The dividend is reinvested after deduction for withholding tax, applying the rate to non-resident individuals who do not benefit from double taxation treaties. MSCI Barra uses withholding tax rates applicable to Luxembourg holding companies, as Luxembourg applies the highest rates. The Index is unmanaged and the figures for the Index do not include any deduction for fees or expenses. It is not possible to invest directly in an index. |
| STANDARDIZED TOTAL RETURNS3 | ||||||||||||||||
| For the period ended 3/31/14 | One Year | Five Years | Ten Years | Since Inception | Inception Date | |||||||||||
| Class A | 11.99 | % | 13.74% | 3.94% | 4.98 | % | 12/01/92 | |||||||||
| Class B | 12.64 | 13.98 | 3.90 | 3.64 | 5/01/96 | |||||||||||
| Class C | 16.62 | 14.19 | 3.76 | 2.32 | 8/15/97 | |||||||||||
| Institutional | 19.01 | 15.51 | 4.96 | 4.83 | 2/07/96 | |||||||||||
| Service | 18.39 | 14.93 | 4.42 | 4.22 | 3/06/96 | |||||||||||
| Class IR | 18.79 | N/A | N/A | 11.50 | 8/31/10 | |||||||||||
| 3 | The Standardized Total Returns are average annual total returns as of the most recent calendar quarter-end. They assume reinvestment of all distributions at NAV. These returns reflect a maximum initial sales charge of 5.5% for Class A Shares, the assumed contingent deferred sales charge for Class B Shares (5% maximum declining to 0% after six years) and the assumed contingent deferred sales charge for Class C Shares (1% if redeemed within 12 months of purchase). Class B Shares convert to Class A Shares on or about the fifteenth day of the last month of the calendar quarter that is eight years after purchase. Returns for Class B Shares for the period after conversion reflect the performance of Class A Shares. Because Institutional, Service and Class IR Shares do not involve a sales charge, such a charge is not applied to their Standardized Total Returns. The Fund’s Class B Shares are no longer available for purchase by new or existing shareholders (although current Class B shareholders may continue to reinvest income and capital gains distributions into Class B Shares, and Class B shareholders may continue to exchange their shares for Class B Shares of certain other Goldman Sachs Funds). |
The returns set forth in the tables above represent past performance. Past performance does not guarantee future results. The Fund’s investment return and principal value will fluctuate so that an investor’s shares, when redeemed, may be worth more or less than their original cost. Current performance may be lower or higher than the performance quoted above. Please visit our web site at www.GSAMFUNDS.com to obtain the most recent month-end returns. Performance reflects applicable fee waivers and/or expense limitations in effect during the periods shown. In their absence, performance would be reduced. Returns do not reflect the deduction of taxes that a shareholder would pay on Fund distributions or the redemption of Fund shares.
8
FUND BASICS
| EXPENSE RATIOS4 | ||||||||||
| Net Expense Ratio (Current) | Gross Expense Ratio (Before Waivers) | |||||||||
| Class A | 1.32 | % | 1.69 | % | ||||||
| Class B | 2.07 | 2.43 | ||||||||
| Class C | 2.06 | 2.44 | ||||||||
| Institutional | 0.92 | 1.29 | ||||||||
| Service | 1.42 | 1.79 | ||||||||
| Class IR | 1.06 | 1.44 | ||||||||
| 4 | The expense ratios of the Fund, both current (net of applicable fee waivers and/or expense limitations) and before waivers (gross of applicable fee waivers and/or expense limitations) are as set forth above according to the most recent publicly available Prospectus for the Fund and may differ from the expense ratios disclosed in the Financial Highlights in this report. The Fund’s waivers and/or expense limitations will remain in place through at least February 28, 2015, and prior to such date the Investment Adviser may not terminate the arrangements without the approval of the Fund’s Board of Trustees. If these arrangements are discontinued in the future, the expense ratios may change without shareholder approval. |
| TOP TEN HOLDINGS AS OF 4/30/145 | ||||||||||
| Holding | % of Net Assets | Line of Business | Country | |||||||
| Air Liquide SA | 5.1 | % | Materials | France | ||||||
| Kubota Corp. | 5.0 | Capital Goods | Japan | |||||||
| BG Group PLC | 4.4 | Energy | United Kingdom | |||||||
| Beiersdorf AG | 4.0 | Household & Personal Products | Germany | |||||||
| Adidas AG | 3.8 | Consumer Durables & Apparel | Germany | |||||||
| BNP Paribas SA | 3.7 | Banks | France | |||||||
| Syngenta AG (Registered) | 3.1 | Materials | Switzerland | |||||||
| Julius Baer Group Ltd. | 3.0 | Diversified Financials | Switzerland | |||||||
| Rexel SA | 3.0 | Capital Goods | France | |||||||
| Sanofi | 3.0 | Pharmaceuticals, Biotechnology & Life Sciences | France | |||||||
| 5 | The top 10 holdings may not be representative of the Fund’s future investments. |
9
FUND BASICS
| FUND VS. BENCHMARK SECTOR ALLOCATIONS6 |
| As of April 30, 2014 |
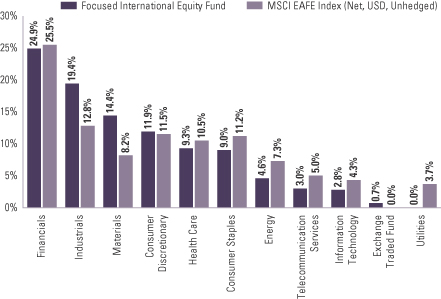
| 6 | The Fund is actively managed and, as such, its composition may differ over time. Consequently, the Fund’s overall sector allocations may differ from percentages contained in the graph above. The graph categorizes investments using Global Industry Classification Standard (“GICS”), however, the sector classifications used by the portfolio management team may differ from GICS. Underlying sector allocations of exchange traded funds held by the Fund are not reflected in the graph above. The percentage shown for each investment category reflects the value of investments in that category as a percentage of market value. The graph depicts the Fund’s investments but may not represent the Fund’s market exposure due to the exclusion of certain derivatives, if any, as listed in the Additional Investment Information section of the Schedule of Investments. |
10
PORTFOLIO RESULTS
Goldman Sachs International Small Cap Fund
Investment Objective
The Fund seeks long-term capital appreciation.
Portfolio Management Discussion and Analysis
Below, the Goldman Sachs Global Equity Team discusses the Goldman Sachs International Small Cap Fund’s (the “Fund”) performance and positioning for the six-month period ended April 30, 2014 (the “Reporting Period”).
| Q | How did the Fund perform during the Reporting Period? |
| A | During the Reporting Period, the Fund’s Class A, B, C, Institutional, Service and IR Shares generated cumulative total returns, without sales charges, of 4.80%, 4.44%, 4.44%, 4.98%, 4.72% and 4.93%, respectively. These returns compare to the 6.44% cumulative total return of the Fund’s benchmark, the Standard and Poor’s (S&P) Developed Ex-US Small Cap Index (Net, USD, Unhedged) (the “S&P Index”), during the same period. |
| Q | What key factors were responsible for the Fund’s performance during the Reporting Period? |
| A | The Fund’s underperformance of the S&P Index during the Reporting Period can be primarily attributed to individual stock selection. Sector and country allocation detracted as well, albeit more modestly. |
| Q | Which stocks detracted significantly from the Fund’s performance during the Reporting Period? |
| A | The biggest detractors from Fund performance relative to the S&P Index during the Reporting Period were Nokian Renkaat, En-Japan and Telecity Group. |
| Nokian Renkaat detracted from the Fund’s relative performance most during the Reporting Period, as the market reacted negatively to the Finnish tire manufacturer’s exposure to Russia given recent geopolitical tensions in the area. Approximately 35% of Nokian Renkaat’s sales can be attributed to Russia and approximately 80% of its production. At the end of the Reporting Period, the season for selling winter tires was largely behind us, so we did not anticipate a significant negative impact from persistent regional turmoil going forward from a sales perspective. From a production perspective, the decline in the ruble was a positive, as it lowered costs for the company. We maintained the Fund’s position in Nokian Renkaat at the end of the Reporting Period. |
| En-Japan is a recruitment consulting company. The position weighed negatively on the Fund’s relative performance, as during the Reporting Period, it announced a downward revision to its earnings forecast for the current fiscal year, resulting from a charge for the planned closure and migration of its existing new graduate recruitment website. At the end of the Reporting Period, we maintained our conviction in the company’s stock potential. |
| Telecity Group, one of the largest data center providers in Europe, based in the U.K., detracted from the Fund’s relative performance. We sold the Fund’s position following several consecutive quarters of disappointing numbers. Along with low growth, the company reduced pricing and margin progression expectations. Our investment thesis had been built around the potential for the company’s operating profits to grow quickly as a result of maturing new capacity. However, given the company’s reported results, we believe the probability of the thesis playing out stands significantly reduced, and we therefore sold the position. |
| Q | What were some of the Fund’s best-performing individual stocks? |
| A | The greatest contributors to Fund performance relative to the S&P Index during the Reporting Period were Hanssem, AZ Electronic Materials and Unione di Banche Italiane (“UBI Bank”). |
South Korean-listed Hanssem was the greatest contributor to the Fund’s relative performance during the Reporting Period. The company reported strong first quarter 2014 sales revenue growth and gained market share on effective branding and on its distribution channel strategy. The kitchen and interior furniture producer particularly benefited from a shift in consumer behavior toward selecting key brand name products over the non-brand market. In our view, major |
11
PORTFOLIO RESULTS
competitors of Hanssem have not yet been successful reading this change in the market, causing them to lose market share. |
| AZ Electronic Materials, a U.K.-listed specialty chemicals company, was also a strong contributor to the Fund’s relative results. It was bid for by global pharmaceuticals and chemicals company Merck KgaA (not to be confused with Merck & Co.) in early December 2013. We felt the bid was fair and sold the Fund’s position in the stock. |
| UBI Bank performed well during the Reporting Period. UBI Bank is the second-largest Italian Popolare Bank, having arisen from the merger of BPU Banca and Banca Lombarda in April 2007. Italian banking stocks exhibited broad strength during the Reporting Period overall, as Italian bond yields declined. UBI Bank also reported a solid earnings report for the final quarter of 2013, giving investors greater confidence in its 2014 earnings estimates. |
| Q | Which equity market sectors most significantly affected Fund performance during the Reporting Period? |
| A | The biggest detractors from the Fund’s results during the Reporting Period were information technology, industrials and health care, where stock selection overall hurt relative performance. |
| The sectors that contributed most to the Fund’s performance relative to the S&P Index were financials, consumer staples and consumer discretionary, due primarily to effective stock selection in each. |
| Q | Which countries most affected the Fund’s performance during the Reporting Period? |
| A | Typically, the Fund’s individual stock holdings will significantly influence the Fund’s performance within a particular country or region relative to the S&P Index. This effect may be even more pronounced in countries that represent only a modest proportion of the S&P Index. |
| That said, the countries that detracted most from the Fund’s performance during the Reporting Period were Japan, Canada and Sweden, where stock selection in each proved disappointing. Having an underweighted exposure to Sweden, which outpaced the S&P Index during the Reporting Period, also hurt. Conversely, the Fund’s stock selection in the U.K., Australia and South Korea contributed most positively to the Fund’s performance during the Reporting Period. Having an overweighted allocation to the U.K., which outpaced the S&P Index during the Reporting Period, also boosted results. |
| Q | How did the Fund use derivatives and similar instruments during the Reporting Period? |
| A | During the Reporting Period, we did not use derivatives to hedge positions or as part of an active management strategy, but we used index futures on an opportunistic basis to ensure the portfolio remained almost fully exposed to equities following cash inflows or stock sales. |
| Q | Did the Fund make any significant purchases or sales during the Reporting Period? |
| A | We established Fund positions in Jupiter Fund Management, Ashtead Group and Corio during the Reporting Period. |
| Jupiter Fund Management is a U.K.-based retail-focused fund manager, which we believe has the potential to perform well given a combination of underlying fundamentals and valuation. Fundamentally, we believe this business is well positioned with the majority of its assets under management outperforming its peer group, an expanding distribution network and what we consider to be best-in-class margins. We also believe Jupiter Fund Management should benefit from improving sentiment toward European equities. From a valuation perspective, the stock was trading at the time of purchase at attractive levels relative to both asset management peers and the market in general, in our view. |
| Ashtead Group is a U.K.-based construction equipment and rental business focused on the non-residential sector generating approximately 90% of its profits in the U.S. Ashtead Group used the market downturn to refresh its equipment fleet, improve its balance sheet and build out detailed expansion plans. With early indications the U.S. non-residential cycle may have turned, the business appears to be benefiting from its earlier efforts. Recent results show what we believe to be encouraging progress both on its top and bottom lines. |
| Corio is a continental European shopping center operator with most of its assets in France, Italy and the Netherlands. In our view, the company has been historically under-managed. It had instituted a restructuring program in 2012 through which the company aimed to dispose of smaller |
12
PORTFOLIO RESULTS
assets and re-focus on improving the operating performance of its larger assets. This program is now close to completion. Additionally, the stock’s valuation was compelling to us at the time of purchase, and we believed there was room for significant re-rating. (Re-rating is when the market changes its view of a company sufficiently to make calculation ratios, such as its price/earnings ratio, substantially higher or lower.) |
| In addition to those sales already mentioned, we eliminated the Fund’s positions in Derwent London and Aberdeen Asset Management during the Reporting Period. |
| We eliminated the Fund’s position in Derwent London, a company that owns, operates and develops offices in central London. In our view, Derwent London is a high quality company with a strong track record, however, its valuation was getting stretched, with the stock trading at a premium. While rents in London rose rapidly during the Reporting Period, we believe we may be getting close to the top of the cycle, as rents at the end of the Reporting Period were in range of the previous cycle peak. |
| We sold the Fund’s position in U.K.-based Aberdeen Asset Management during the second half of 2013. We feared the structural drivers at the firm were deteriorating with weaker alpha, or value, generation, sentiment turning away from emerging markets, and margin improvements becoming harder to achieve. After the stock recovered from its mid-2013 lows, we took the opportunity to sell the position in mid-December 2013. |
| Q | Were there any changes to the Fund’s portfolio management team during the Reporting Period? |
| A | During the Reporting Period, Eddie Perkin, managing director and chief investment officer (“CIO”) of International and Emerging Markets Equity, left the firm. |
| Q | Were there any notable changes in the Fund’s weightings during the Reporting Period? |
| A | In this Fund, both sector weightings and country allocations are largely the result of our bottom-up stock selection process rather than any top-down macroeconomic views or industry bets. We seek to outpace the S&P Index by overweighting stocks that we expect to outperform and underweighting those we think may lag. Consequently, changes in its sector or country weightings are generally the direct result of individual stock selection or of stock appreciation or depreciation. That said, during the Reporting Period, there were no notable changes in the Fund’s sector or country weightings during the Reporting Period. |
| Q | How was the Fund positioned relative to the S&P Index at the end of the Reporting Period? |
| A | At the end of the Reporting Period, the Fund had more exposure to the U.K., the Netherlands and China and less exposure to Sweden, Hong Kong, Spain and Germany relative to the S&P Index. At the end of the Reporting Period, the Fund held neutral positions relative to the S&P Index in several countries, most notably Canada, and had no position at all in several other countries, most notably Denmark. |
| From a sector allocation perspective, the Fund had overweighted positions relative to the S&P Index in information technology and consumer discretionary at the end of the Reporting Period. On the same date, the Fund had underweighted positions compared to the S&P Index in financials, and was rather neutrally weighted relative to the S&P Index in energy, health care, materials, utilities, industrials, consumer staples and telecommunication services. |
| As always, we remained focused on individual stock selection, with sector and country positioning being a secondary, closely-monitored effect. |
13
FUND BASICS
International Small Cap Fund
as of April 30, 2014
| PERFORMANCE REVIEW | ||||||||||
| November 1, 2013–April 30, 2014 | Fund Total Return (based on NAV)1 | S&P Developed ex-US Small Cap Index (Net, USD, Unhedged)2 | ||||||||
| Class A | 4.80 | % | 6.44 | % | ||||||
| Class B | 4.44 | 6.44 | ||||||||
| Class C | 4.44 | 6.44 | ||||||||
| Institutional | 4.98 | 6.44 | ||||||||
| Service | 4.72 | 6.44 | ||||||||
| Class IR | 4.93 | 6.44 | ||||||||
| 1 | The net asset value (“NAV”) represents the net assets of the class of the Fund (ex-dividend) divided by the total number of shares of the class outstanding. The Fund’s performance assumes the reinvestment of dividends and other distributions. The Fund’s performance does not reflect the deduction of any applicable sales charges. |
| 2 | The S&P Developed ex-US Small Cap Index (Net, USD, Unhedged) is the small capitalization stock component of the S&P Developed Broad Market Index (BMI). The BMI is a float-weighted index that spans 22 countries (inclusive of the US) and includes the listed shares of all companies with an available market capitalization (float) of at least $100 million at the annual rebalance. At rebalance, companies are deleted from the index if their float falls below $75 million. The Small Cap ex-US is defined as those stocks falling in the bottom 15% of the cumulative available capital in each country. The Index reflects returns net of withholding taxes applied to foreign investors, calculated daily based on tax rates that would be applied to a Luxembourg-based investor. The Index is unmanaged and the figures for the Index do not include any deduction for fees or expenses. It is not possible to invest directly in an index. |
| STANDARDIZED TOTAL RETURNS3 | ||||||||||||||||||||
| For the period ended 3/31/14 | One Year | Five Years | Ten Years | Since Inception | Inception Date | |||||||||||||||
| Class A | 15.18 | % | 19.86 | % | 6.68 | % | 6.17 | % | 5/01/98 | |||||||||||
| Class B | 15.94 | 20.17 | 6.63 | 6.25 | 5/01/98 | |||||||||||||||
| Class C | 19.93 | 20.36 | 6.49 | 5.86 | 5/01/98 | |||||||||||||||
| Institutional | 22.39 | 21.78 | 7.74 | 7.08 | 5/01/98 | |||||||||||||||
| Service | 21.69 | 21.13 | 7.18 | 6.53 | 5/01/98 | |||||||||||||||
| Class IR | 22.16 | N/A | N/A | 16.16 | 8/31/10 | |||||||||||||||
| 3 | The Standardized Total Returns are average annual total returns as of the most recent calendar quarter-end. They assume reinvestment of all distributions at NAV. These returns reflect a maximum initial sales charge of 5.5% for Class A Shares, the assumed contingent deferred sales charge for Class B Shares (5% maximum declining to 0% after six years) and the assumed contingent deferred sales charge for Class C Shares (1% if redeemed within 12 months of purchase). Class B Shares convert to Class A Shares on or about the fifteenth day of the last month of the calendar quarter that is eight years after purchase. Returns for Class B Shares for the period after conversion reflect the performance of Class A Shares. Because Institutional, Service and Class IR Shares do not involve a sales charge, such a charge is not applied to their Standardized Total Returns. The Fund’s Class B Shares are no longer available for purchase by new or existing shareholders (although current Class B shareholders may continue to reinvest income and capital gains distributions into Class B Shares, and Class B shareholders may continue to exchange their shares for Class B Shares of certain other Goldman Sachs Funds). |
The returns set forth in the tables above represent past performance. Past performance does not guarantee future results. The Fund’s investment return and principal value will fluctuate so that an investor’s shares, when redeemed, may be worth more or less than their original cost. Current performance may be lower or higher than the performance quoted above. Please visit our web site at www.GSAMFUNDS.com to obtain the most recent month-end returns. Performance reflects applicable fee waivers and/or expense limitations in effect during the periods shown. In their absence, performance would be reduced. Returns do not reflect the deduction of taxes that a shareholder would pay on Fund distributions or the redemption of Fund shares.
14
FUND BASICS
| EXPENSE RATIOS4 | ||||||||||
| Net Expense Ratio (Current) | Gross Expense Ratio (Before Waivers) | |||||||||
| Class A | 1.56 | % | 1.88 | % | ||||||
| Class B | 2.31 | 2.63 | ||||||||
| Class C | 2.31 | 2.63 | ||||||||
| Institutional | 1.16 | 1.46 | ||||||||
| Service | 1.66 | 1.98 | ||||||||
| Class IR | 1.31 | 1.62 | ||||||||
| 4 | The expense ratios of the Fund, both current (net of applicable fee waivers and/or expense limitations) and before waivers (gross of applicable fee waivers and/or expense limitations) are as set forth above according to the most recent publicly available Prospectus for the Fund and may differ from the expense ratios disclosed in the Financial Highlights in this report. The Fund’s waivers and/or expense limitations will remain in place through at least February 28, 2015, and prior to such date the Investment Adviser may not terminate the arrangements without the approval of the Fund’s Board of Trustees. If these arrangements are discontinued in the future, the expense ratios may change without shareholder approval. |
| TOP TEN HOLDINGS AS OF 4/30/145 | ||||||||||
| Holding | % of Net Assets | Line of Business | Country | |||||||
| Tecnicas Reunidas SA | 1.4 | % | Energy | Spain | ||||||
| Gategroup Holding AG | 1.3 | Commercial & Professional Services | Switzerland | |||||||
| Jupiter Fund Management PLC | 1.3 | Diversified Financials | United Kingdom | |||||||
| bpost SA | 1.3 | Transportation | Belgium | |||||||
| Cap Gemini SA | 1.3 | Software & Services | France | |||||||
| Flughafen Zuerich AG (Registered) | 1.3 | Transportation | Switzerland | |||||||
| Regus PLC | 1.3 | Commercial & Professional Services | Luxembourg | |||||||
| Greene King PLC | 1.3 | Consumer Services | United Kingdom | |||||||
| Ashtead Group PLC | 1.3 | Capital Goods | United Kingdom | |||||||
| Corio NV | 1.2 | Real Estate | Netherlands | |||||||
| 5 | The top 10 holdings may not be representative of the Fund’s future investments. |
15
FUND BASICS
| FUND VS. BENCHMARK SECTOR ALLOCATIONS6 |
| As of April 30, 2014 |
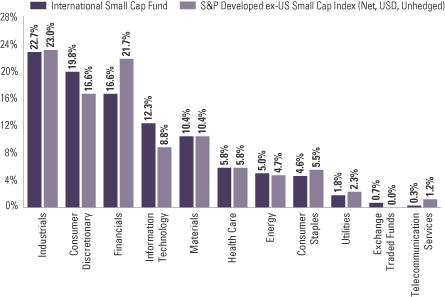
| 6 | The Fund is actively managed and, as such, its composition may differ over time. Consequently, the Fund’s overall sector allocations may differ from percentages contained in the graph above. The graph categorizes investments using Global Industry Classification Standard (“GICS”), however, the sector classifications used by the portfolio management team may differ from GICS. Underlying sector allocations of exchange traded funds held by the Fund are not reflected in the graph above. The percentage shown for each investment category reflects the value of investments in that category as a percentage of market value. The graph depicts the Fund’s investments but may not represent the Fund’s market exposure due to the exclusion of certain derivatives, if any, as listed in the Additional Investment Information section of the Schedule of Investments. |
16
PORTFOLIO RESULTS
Goldman Sachs Strategic International Equity Fund
Investment Objective
The Fund seeks long-term growth of capital.
Portfolio Management Discussion and Analysis
Below, the Goldman Sachs Global Equity Team discusses the Goldman Sachs Strategic International Equity Fund’s (the “Fund”) performance and positioning for the six-month period ended April 30, 2014 (the “Reporting Period”).
| Q | How did the Fund perform during the Reporting Period? |
| A | During the Reporting Period, the Fund’s Class A, B, C, Institutional, IR and R Shares generated cumulative total returns, without sales charges, of 3.04%, 2.73%, 2.73%, 3.30%, 3.24% and 2.99%, respectively. These returns compare to the 4.44% cumulative total return of the Fund’s benchmark, the MSCI Europe, Australasia, Far East (EAFE) Index (Net, USD, Unhedged) (the “MSCI Index”), during the same period. |
| Q | What key factors were responsible for the Fund’s performance during the Reporting Period? |
| A | The Fund’s underperformance relative to the MSCI Index during the Reporting Period can be primarily attributed to individual stock selection. |
| Q | Which stocks detracted significantly from the Fund’s performance during the Reporting Period? |
| A | Among the biggest detractors from Fund performance relative to the MSCI Index during the Reporting Period were Nomura Real Estate, Magnit and Unicharm. |
| Nomura Real Estate, a Japanese real estate holding company, detracted from the Fund’s relative returns during the Reporting Period. The company underperformed the MSCI Index in spite of better than consensus fiscal second quarter 2014 results and upward revision of its fiscal year forecasts. Nomura Real Estate had benefited from a spike in demand of condo contracts before Japan’s consumption tax increase took effect. However, its shares declined after investors began to have concerns about a possible decline in demand for condos after the consumption tax hike. We decided to exit the Fund’s position in Nomura Real Estate in favor of higher conviction opportunities. |
| Magnit, Russia’s biggest retailer, performed poorly during the Reporting Period due to heightened tensions in Ukraine and worries around potential sanctions imposed by the West. |
| Unicharm, a Japan-based baby products and feminine hygiene products manufacturer, performed poorly during the Reporting Period. Baby product sales were weaker than expected, as Unicharm faced fierce competition from Kimberly-Clark and Kao. Unicharm also saw its shares decline on concerns the company would not achieve its earnings forecast for its fiscal year. |
| Q | What were some of the Fund’s best-performing individual stocks? |
| A | The greatest contributors to Fund performance relative to the MSCI Index during the Reporting Period were Scania, Novo-Nordisk and Total. |
| Sweden-based truck manufacturer Scania was the top contributor to the Fund’s relative results during the Reporting Period. Its shares rose after Volkswagen announced it would make an offer for the remaining outstanding shares of Scania that it does not already own. We decided to sell out of the Fund’s position in Scania in favor of higher conviction opportunities. |
Denmark-based pharmaceutical company Novo-Nordisk was a strong contributor during the Reporting Period. The company delivered a good set of fiscal year 2013 results in February 2014, and a number of concerns that had impacted its performance during 2013 began to diminish. Namely, one of its key competitors was not able to show superiority to Novo-Nordisk’s Type 2 diabetes drug. Further, the impact |
17
PORTFOLIO RESULTS
of losing a supply contract with Express Script seemed to be less severe than initially anticipated, as a number of patients already on Novo-Nordisk’s drugs were grandfathered in and allowed to continue usage. Lastly, Novo-Nordisk’s pipeline was starting to attract attention, as its oral insulin drug completed Phase 1 trials and progressed into Phase 2. The company has a dominant presence in the U.S. and Europe and was growing its revenues in the emerging markets. At the end of the Reporting Period, we believe the company was well positioned to perform well over the longer term given the sustainability of growth in its diabetes franchise and its innovative product pipeline. |
| Total was another top contributor to the Fund’s relative results, as the France-based integrated oil company has entered the harvest phase of its investment cycle, resulting in high production growth. (The harvest phase of an investment cycle is when a company is getting its money out of an earlier made investment.) Total continued to be one of our team’s top picks in big oil globally given its attractive valuation, near-years production growth, improving free cash flow profile and low consensus expectations. At the end of the Reporting Period, we believed there was also potential to see further re-rating in big oil, as the group begins to deliver positive free cash flow after dividends. (Re-rating is when the market changes its view of a company sufficiently to make calculation ratios, such as its price/earnings ratio, substantially higher or lower.) |
| Q | Which equity market sectors most significantly affected Fund performance during the Reporting Period? |
| A | The biggest detractors from the Fund’s results during the Reporting Period were financials, consumer staples and utilities, where weak stock selection in each hurt most. |
| The sectors that contributed most to the Fund’s performance relative to the MSCI Index were consumer discretionary, health care and information technology. Stock selection in all three sectors proved effective during the Reporting Period. |
| Q | Which countries most affected the Fund’s performance during the Reporting Period? |
| A | Typically, the Fund’s individual stock holdings will significantly influence the Fund’s performance within a particular country or region relative to the MSCI Index. |
| This effect may be even more pronounced in countries that represent only a modest proportion of the MSCI Index. |
| That said, the countries that detracted most from the Fund’s relative performance were the U.K., Russia and Japan. Stock selection in the U.K. and Japan proved disappointing. Having exposure to Russia, which is not a component of the MSCI Index and which significantly lagged the MSCI Index, also hurt. |
| Conversely, effective individual stock selection in France, Sweden and Australia contributed most positively to the Fund’s results relative to the MSCI Index. Having an overweighted allocation to France, which outpaced the MSCI Index during the Reporting Period, and an underweighted exposure to Australia, which lagged the MSCI Index during the Reporting Period, also boosted the Fund’s relative results. |
| Q | How did the Fund use derivatives and similar instruments during the Reporting Period? |
| A | During the Reporting Period, we did not use derivatives to hedge positions or as part of an active management strategy. |
| Q | Did the Fund make any significant purchases or sales during the Reporting Period? |
| A | During the Reporting Period, we purchased Fund positions in Mitsubishi Financial Group, Standard Chartered and UBS. |
| We initiated a Fund position in Mitsubishi Financial Group because its next fiscal year’s net profit looks better than that of Sumitomo Mitsui Financial Group’s (discussed below), supported by overseas companies linked on its balance sheet, such as Morgan Stanley and Bank of Ayudhya. Also, we expect Mitsubishi Financial Group to launch either share buybacks or a dividend increase on the back of its foreseeable capital equity tier 1 (“CET1”) capital ratio. (CET1 capital ratio is a measurement of a bank’s core equity capital compared with its total risk-weighted assets. This is the measure of a bank’s financial strength.) In our view, the company’s valuation at the time of purchase looked attractive compared to that of its peers. |
We established a Fund position in U.K.-based banking company Standard Chartered during the Reporting Period. Its stock had been underperforming due to concerns that a slowdown in the emerging markets would create asset quality issues. We believe the concerns were overdone and viewed the downturn as an attractive entry point to initiate the position. In our view, the company has done a strong job of |
18
PORTFOLIO RESULTS
controlling its defaulted loans and loans at risk. Furthermore, we believe the stock was well positioned to see improved margins, as the company’s peers have been struggling and appeared to be becoming less competitive. |
| We initiated a Fund position in UBS because we believe concerns around Swiss capital requirements have been overdone but offered an attractive opportunity to buy what we consider to be a strong private banking franchise. |
| In addition to the sales already mentioned, we sold out of the Fund’s positions in Sumitomo Mitsui Financial Group, LVMH Moet Hennessy Louis Vuitton (“LVMH”) and Unilever during the Reporting Period. |
| Japanese bank group Sumitomo Mitsui Financial Group detracted from the Fund’s relative performance during the Reporting Period. Its stock underperformed the MSCI Index after it announced its quarterly net income, which declined substantially compared to last fiscal year due to lower bond trading gains. The loan-deposit spread in its banking unit also narrowed. We decided to sell the Fund’s position in Sumitomo Mitsui Financial Group. |
| We sold the Fund’s position in French luxury goods company LVMH after successive data points made it clear the Chinese economy was slowing meaningfully. Given its significant store base in China and its exposure to global Chinese tourist spending, we were concerned that LVMH’s sales would likely suffer for some time owing to this development. |
| We eliminated the Fund’s position in Netherlands-based consumer goods company Unilever on concerns about the company’s exposure to the emerging markets. We decided to reallocate the sales proceeds to higher conviction opportunities. |
| Q | Were there any notable changes in the Fund’s weightings during the Reporting Period? |
| A | In this Fund, both sector weightings and country allocations are largely the result of our bottom-up stock selection process rather than any top-down macroeconomic views or regional, country, sector or industry bets. We seek to outpace the MSCI Index by overweighting stocks that we expect to outperform and underweighting those we think may lag. Consequently, changes in its sector or country weightings are generally the direct result of individual stock selection or of stock appreciation or depreciation. That said, during the Reporting Period, there were no notable changes in the Fund’s sector or country weightings during the Reporting Period. |
| Q | Were there any changes to the Fund’s portfolio management team during the Reporting Period? |
| A | During the Reporting Period, Eddie Perkin, managing director and chief investment officer (“CIO”) of International and Emerging Markets Equity and a lead portfolio manager of the Fund, left the firm. Suneil Mahindru, current lead portfolio manager for the firm’s Global Equity Partners strategy, became the CIO of International Equity and was named a lead portfolio manager on the Fund with Alexis Deladerriere. |
| Q | How was the Fund positioned relative to the MSCI Index at the end of the Reporting Period? |
| A | At the end of the Reporting Period, the Fund had more exposure to France, Belgium, Sweden, South Korea, Taiwan, Russia, Ireland and Switzerland relative to the MSCI Index and less exposure to the U.K., Australia, Germany and Japan relative to the MSCI Index. At the end of the Reporting Period, the Fund held neutral positions relative to the MSCI Index in several countries and had no position at all in several other countries, most notably Spain, Hong Kong, Italy and the Netherlands. |
| From a sector allocation perspective, the Fund had overweight positions relative to the MSCI Index in materials and consumer staples at the end of the Reporting Period. On the same date, the Fund had underweighted positions compared to the MSCI Index in financials, utilities and telecommunication services and rather neutral positions relative to the MSCI Index in energy, information technology, health care, consumer discretionary and industrials. |
| As always, we remained focused on individual stock selection, with sector and country positioning being a secondary, closely-monitored effect. |
19
FUND BASICS
Strategic International Equity Fund
as of April 30, 2014
| PERFORMANCE REVIEW | ||||||||||
| November 1, 2013–April 30, 2014 | Fund Total Return (based on NAV)1 | MSCI EAFE Index (Net, USD, Unhedged)2 | ||||||||
| Class A | 3.04 | % | 4.44 | % | ||||||
| Class B | 2.73 | 4.44 | ||||||||
| Class C | 2.73 | 4.44 | ||||||||
| Institutional | 3.30 | 4.44 | ||||||||
| Class IR | 3.24 | 4.44 | ||||||||
| Class R | 2.99 | 4.44 | ||||||||
| 1 | The net asset value (“NAV”) represents the net assets of the class of the Fund (ex-dividend) divided by the total number of shares of the class outstanding. The Fund’s performance assumes the reinvestment of dividends and other distributions. The Fund’s performance does not reflect the deduction of any applicable sales charges. |
| 2 | The MSCI EAFE Index (net, USD, unhedged) is a market capitalization-weighted composite of securities in 22 developed markets. The Index approximates the minimum possible dividend reinvestment. The dividend is reinvested after deduction for withholding tax, applying the rate to non-resident individuals who do not benefit from double taxation treaties. MSCI Barra uses withholding tax rates applicable to Luxembourg holding companies, as Luxembourg applies the highest rates. The Index is unmanaged and the figures for the Index do not include any deduction for fees or expenses. It is not possible to invest directly in an index. |
| STANDARDIZED TOTAL RETURNS3 | ||||||||||||
| For the period ended 3/31/14 | One Year | FIve Years | Since Inception | Inception Date | ||||||||
| Class A | 11.51 | % | 13.59% | -0.90% | 6/25/07 | |||||||
| Class B | 12.25 | 13.78 | -0.83 | 6/25/07 | ||||||||
| Class C | 16.26 | 14.01 | -0.82 | 6/25/07 | ||||||||
| Institutional | 18.55 | 15.29 | 0.31 | 6/25/07 | ||||||||
| Class IR | 18.44 | 15.27 | -0.91 | 11/30/07 | ||||||||
| Class R | 17.89 | 14.59 | -1.47 | 11/30/07 | ||||||||
| 3 | The Standardized Total Returns are average annual total returns as of the most recent calendar quarter-end. They assume reinvestment of all distributions at NAV. These returns reflect a maximum initial sales charge of 5.5% for Class A Shares, the assumed contingent deferred sales charge for Class B Shares (5% maximum declining to 0% after six years) and the assumed contingent deferred sales charge for Class C Shares (1% if redeemed within 12 months of purchase). Class B Shares convert to Class A Shares on or about the fifteenth day of the last month of the calendar quarter that is eight years after purchase. Returns for Class B Shares for the period after conversion reflect the performance of Class A Shares. Because Institutional, Class R and Class IR Shares do not involve a sales charge, such a charge is not applied to their Standardized Total Returns. The Fund’s Class B Shares are no longer available for purchase by new or existing shareholders (although current Class B shareholders may continue to reinvest income and capital gains distributions into Class B Shares, and Class B shareholders may continue to exchange their shares for Class B Shares of certain other Goldman Sachs Funds). |
The returns set forth in the tables above represent past performance. Past performance does not guarantee future results. The Fund’s investment return and principal value will fluctuate so that an investor’s shares, when redeemed, may be worth more or less than their original cost. Current performance may be lower or higher than the performance quoted above. Please visit our web site at www.GSAMFUNDS.com to obtain the most recent month-end returns. Performance reflects applicable fee waivers and/or expense limitations in effect during the periods shown. In their absence, performance would be reduced. Returns do not reflect the deduction of taxes that a shareholder would pay on Fund distributions or the redemption of Fund shares.
20
FUND BASICS
| EXPENSE RATIOS4 | ||||||||||
| Net Expense Ratio (Current) | Gross Expense Ratio (Before Waivers) | |||||||||
| Class A | 1.33 | % | 1.88 | % | ||||||
| Class B | 2.08 | 2.63 | ||||||||
| Class C | 2.08 | 2.63 | ||||||||
| Institutional | 0.93 | 1.48 | ||||||||
| Class IR | 1.08 | 1.63 | ||||||||
| Class R | 1.58 | 2.12 | ||||||||
| 4 | The expense ratios of the Fund, both current (net of applicable fee waivers and/or expense limitations) and before waivers (gross of applicable fee waivers and/or expense limitations) are as set forth above according to the most recent publicly available Prospectus for the Fund and may differ from the expense ratios disclosed in the Financial Highlights in this report. The Fund’s waivers and/or expense limitations will remain in place through at least February 28, 2015, and prior to such date the Investment Adviser may not terminate the arrangements without the approval of the Fund’s Board of Trustees. If these arrangements are discontinued in the future, the expense ratios may change without shareholder approval. |
| TOP TEN HOLDINGS AS OF 4/30/145 | ||||||||||
| Holding | % of Net Assets | Line of Business | Country | |||||||
| Total SA | 4.4 | % | Energy | France | ||||||
| Novartis AG (Registered) | 3.4 | Pharmaceuticals, Biotechnology & Life Sciences | Switzerland | |||||||
| BG Group PLC | 3.0 | Energy | United Kingdom | |||||||
| HSBC Holdings PLC | 2.9 | Banks | United Kingdom | |||||||
| Vodafone Group PLC | 2.4 | Telecommunication Services | United Kingdom | |||||||
| Air Liquide SA | 2.4 | Materials | France | |||||||
| Rio Tinto PLC | 2.4 | Materials | United Kingdom | |||||||
| Anheuser-Busch InBev NV | 2.3 | Food, Beverage & Tobacco | Belgium | |||||||
| Bayer AG (Registered) | 2.2 | Pharmaceuticals, Biotechnology & Life Sciences | Germany | |||||||
| Mitsubishi UFJ Financial Group, Inc. | 2.1 | Bank | Japan | |||||||
| 5 | The top 10 holdings may not be representative of the Fund’s future investments. |
21
FUND BASICS
| FUND VS. BENCHMARK SECTOR ALLOCATIONS6 |
| As of April 30, 2014 |
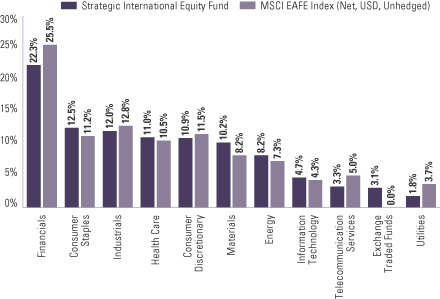
| 6 | The Fund is actively managed and, as such, its composition may differ over time. Consequently, the Fund’s overall sector allocations may differ from percentages contained in the graph above. The graph categorizes investments using Global Industry Classification Standard (“GICS”), however, the sector classifications used by the portfolio management team may differ from GICS. Underlying sector allocations of exchange traded funds held by the Fund are not reflected in the graph above. The percentage shown for each investment category reflects the value of investments in that category as a percentage of market value. The graph depicts the Fund’s investments but may not represent the Fund’s market exposure due to the exclusion of certain derivatives, if any, as listed in the Additional Investment Information section of the Schedule of Investments. |
22
GOLDMAN SACHS FOCUSED INTERNATIONAL EQUITY FUND
Schedule of Investments
April 30, 2014 (Unaudited)
| Shares | Description | Value | ||||||
| Common Stocks – 96.1% | ||||||||
| Australia – 4.1% | ||||||||
| 1,175,256 | Aurizon Holdings Ltd. (Transportation) | $ | 5,674,395 | |||||
| 182,772 | Australia & New Zealand Banking Group Ltd. (Banks) | 5,877,539 | ||||||
|
| |||||||
| 11,551,934 | ||||||||
|
| |||||||
| Belgium – 2.1% | ||||||||
| 35,840 | Solvay SA (Materials) | 5,808,056 | ||||||
|
| |||||||
| Denmark – 1.9% | ||||||||
| 119,423 | Novo Nordisk A/S Class B (Pharmaceuticals, Biotechnology & Life Sciences) | 5,420,135 | ||||||
|
| |||||||
| Finland – 2.1% | ||||||||
| 147,056 | Nokian Renkaat Oyj (Automobiles & Components) | 5,851,937 | ||||||
|
| |||||||
| France – 14.9% | ||||||||
| 101,380 | Air Liquide SA (Materials) | 14,504,194 | ||||||
| 138,490 | BNP Paribas SA (Banks) | 10,406,765 | ||||||
| 339,744 | Rexel SA (Capital Goods) | 8,578,458 | ||||||
| 78,576 | Sanofi (Pharmaceuticals, Biotechnology & Life Sciences) | 8,479,914 | ||||||
|
| |||||||
| 41,969,331 | ||||||||
|
| |||||||
| Germany – 7.8% | ||||||||
| 100,612 | Adidas AG (Consumer Durables & Apparel) | 10,755,600 | ||||||
| 113,428 | Beiersdorf AG (Household & Personal Products) | 11,386,434 | ||||||
|
| |||||||
| 22,142,034 | ||||||||
|
| |||||||
| Ireland – 3.9% | ||||||||
| 858,850 | C&C Group PLC (Food, Beverage & Tobacco) | 5,111,645 | ||||||
| 101,870 | Shire PLC (Pharmaceuticals, Biotechnology & Life Sciences) | 5,826,148 | ||||||
|
| |||||||
| 10,937,793 | ||||||||
|
| |||||||
| Japan – 19.1% | ||||||||
| 390,500 | Credit Saison Co. Ltd. (Diversified Financials) | 8,318,913 | ||||||
| 1,348,000 | Isuzu Motors Ltd. (Automobiles & Components) | 7,828,582 | ||||||
| 1,087,000 | Kubota Corp. (Capital Goods) | 14,009,828 | ||||||
| 96,600 | Makita Corp. (Capital Goods) | 5,138,000 | ||||||
| 1,498,100 | Mitsubishi UFJ Financial Group, Inc. (Banks) | 7,969,140 | ||||||
| 1,309,000 | Sumitomo Osaka Cement Co. Ltd. (Materials) | 5,206,056 | ||||||
| 737,000 | Tokyu Fudosan Holdings Corp. (Real Estate) | 5,357,957 | ||||||
|
| |||||||
| 53,828,476 | ||||||||
|
| |||||||
| Common Stocks – (continued) | ||||||||
| South Korea – 4.5% | ||||||||
| 138,580 | Hana Financial Group, Inc. (Banks) | $ | 4,889,947 | |||||
| 142,623 | Kia Motors Corp. (Automobiles & Components) | 7,913,042 | ||||||
|
| |||||||
| 12,802,989 | ||||||||
|
| |||||||
| Sweden – 4.7% | ||||||||
| 643,494 | Telefonaktiebolaget LM Ericsson Class B (Technology Hardware & Equipment) | 7,759,546 | ||||||
| 355,732 | Volvo AB Class B (Capital Goods) | 5,632,714 | ||||||
|
| |||||||
| 13,392,260 | ||||||||
|
| |||||||
| Switzerland – 14.1% | ||||||||
| 183,535 | �� | Julius Baer Group Ltd. (Diversified Financials)* | 8,596,859 | |||||
| 66,360 | Novartis AG (Registered) (Pharmaceuticals, Biotechnology & Life Sciences) | 5,768,846 | ||||||
| 22,352 | Syngenta AG (Registered) (Materials)* | 8,851,205 | ||||||
| 400,610 | UBS AG (Registered) (Diversified Financials)* | 8,378,310 | ||||||
| 143,322 | Wolseley PLC (Capital Goods) | 8,304,706 | ||||||
|
| |||||||
| 39,899,926 | ||||||||
|
| |||||||
| United Kingdom – 16.9% | ||||||||
| 620,569 | BG Group PLC (Energy) | 12,553,699 | ||||||
| 1,148,955 | Melrose Industries PLC (Capital Goods) | 5,548,389 | ||||||
| 101,303 | Reckitt Benckiser Group PLC (Household & Personal Products) | 8,177,786 | ||||||
| 92,157 | Rio Tinto PLC (Materials) | 5,010,369 | ||||||
| 372,287 | Standard Chartered PLC (Banks) | 8,062,713 | ||||||
| 2,166,785 | Vodafone Group PLC (Telecommunication Services) | 8,226,442 | ||||||
|
| |||||||
| 47,579,398 | ||||||||
|
| |||||||
| TOTAL COMMON STOCKS | ||||||||
| (Cost $269,167,142) | $ | 271,184,269 | ||||||
|
| |||||||
| Exchange Traded Fund – 0.7% | ||||||||
| Japan – 0.7% | ||||||||
| 173,731 | iShares MSCI Japan Fund | $ | 1,924,939 | |||||
| (Cost $2,019,050) | ||||||||
|
| |||||||
| TOTAL INVESTMENTS – 96.8% | ||||||||
| (Cost $271,186,192) | $ | 273,109,208 | ||||||
|
| |||||||
| | OTHER ASSETS IN EXCESS OF LIABILITIES – 3.2% | 9,053,653 | ||||||
|
| |||||||
| NET ASSETS – 100.0% | $ | 282,162,861 | ||||||
|
| |||||||
| The percentage shown for each investment category reflects the value of investments in that category as a percentage of net assets. | ||
* | Non-income producing security. | |
| The accompanying notes are an integral part of these financial statements. | 23 |
GOLDMAN SACHS INTERNATIONAL SMALL CAP FUND
Schedule of Investments (continued)
April 30, 2014 (Unaudited)
| Shares | Description | Value | ||||||
| Common Stocks – 96.4% | ||||||||
| Australia – 5.2% | ||||||||
| 282,053 | Amcom Telecommunications Ltd. (Telecommunication Services) | $ | 551,819 | |||||
| 681,437 | Arrium Ltd. (Materials) | 759,431 | ||||||
| 439,092 | Aveo Group (Real Estate) | 830,713 | ||||||
| 91,202 | Bank of Queensland Ltd. (Banks) | 1,042,670 | ||||||
| 150,328 | Boral Ltd. (Materials) | 797,816 | ||||||
| 32,692 | Caltex Australia Ltd. (Energy) | 678,633 | ||||||
| 151,975 | Computershare Ltd. (Software & Services) | 1,751,772 | ||||||
| 376,700 | David Jones Ltd. (Retailing) | 1,379,982 | ||||||
| 217,304 | Echo Entertainment Group Ltd. (Consumer Services) | 571,551 | ||||||
| 100,444 | GrainCorp Ltd. Class A (Food, Beverage & Tobacco) | 828,407 | ||||||
| 75,722 | Seek Ltd. (Commercial & Professional Services) | 1,185,944 | ||||||
| 55,026 | Super Retail Group Ltd. (Retailing) | 520,838 | ||||||
|
| |||||||
| 10,899,576 | ||||||||
|
| |||||||
| Belgium – 1.3% | ||||||||
| 120,966 | bpost SA (Transportation) | 2,724,593 | ||||||
|
| |||||||
| Canada – 8.7% | ||||||||
| 48,800 | Aimia, Inc. (Media) | 785,840 | ||||||
| 153,700 | Air Canada Class A (Transportation)* | 1,072,766 | ||||||
| 54,400 | Alamos Gold, Inc. (Materials) | 508,736 | ||||||
| 11,200 | AltaGas Ltd. (Energy) | 477,205 | ||||||
| 110,100 | Bellatrix Exploration Ltd. (Energy)* | 1,070,814 | ||||||
| 34,200 | Bonavista Energy Corp. (Energy) | 537,315 | ||||||
| 12,700 | Canadian Real Estate Investment Trust (REIT) | 523,504 | ||||||
| 21,728 | Canadian Solar, Inc. (Semiconductors & Semiconductor Equipment)* | 589,263 | ||||||
| 29,000 | Canadian Western Bank (Banks) | 982,674 | ||||||
| 221,900 | Capstone Mining Corp. (Materials)* | 585,093 | ||||||
| 27,900 | Dominion Diamond Corp. (Materials)* | 350,516 | ||||||
| 24,900 | Dorel Industries, Inc. Class B (Consumer Durables & Apparel) | 892,361 | ||||||
| 33,500 | Enerflex Ltd. (Energy) | 533,041 | ||||||
| 18,500 | Ensign Energy Services, Inc. (Energy) | 291,159 | ||||||
| 38,500 | Evertz Technologies Ltd. (Technology Hardware & Equipment) | 572,556 | ||||||
| 119,500 | Gran Tierra Energy, Inc. (Energy)* | 849,327 | ||||||
| 30,003 | Legacy Oil + Gas, Inc. (Energy)* | 233,498 | ||||||
| 21,300 | Linamar Corp. (Automobiles & Components) | 1,066,312 | ||||||
| 10,389 | MacDonald Dettwiler & Associates Ltd. (Capital Goods) | 805,680 | ||||||
| 6,400 | Methanex Corp. (Materials) | 396,420 | ||||||
| 53,000 | New Gold, Inc. (Materials)* | 267,889 | ||||||
| 46,100 | Progressive Waste Solutions Ltd. (Commercial & Professional Services) | 1,122,164 | ||||||
| 15,400 | ShawCor Ltd. (Energy) | 685,943 | ||||||
|
| |||||||
| Common Stocks – (continued) | ||||||||
| Canada – (continued) | ||||||||
| 74,406 | Sierra Wireless, Inc. (Technology Hardware & Equipment)* | $ | 1,606,173 | |||||
| 27,600 | Toromont Industries Ltd. (Capital Goods) | 682,666 | ||||||
| 15,600 | West Fraser Timber Co. Ltd. (Materials) | 697,413 | ||||||
|
| |||||||
| 18,186,328 | ||||||||
|
| |||||||
| China – 2.2% | ||||||||
| 10,341 | Ctrip.com International Ltd. ADR (Retailing)* | 483,338 | ||||||
| 92,000 | ENN Energy Holdings Ltd. (Utilities) | 643,477 | ||||||
| 885,000 | FIH Mobile Ltd. (Technology Hardware & Equipment)* | 478,022 | ||||||
| 248,000 | Haitian International Holdings Ltd. (Capital Goods) | 499,625 | ||||||
| 45,178 | Hollysys Automation Technologies Ltd. (Technology Hardware & Equipment)* | 967,261 | ||||||
| 218,000 | Shanghai Fosun Pharmaceutical Group Co. Ltd. Class H (Pharmaceuticals, Biotechnology & Life Sciences) | 739,819 | ||||||
| 31,321 | TAL Education Group ADR (Consumer Services)* | 692,821 | ||||||
|
| |||||||
| 4,504,363 | ||||||||
|
| |||||||
| Finland – 0.6% | ||||||||
| 29,413 | Nokian Renkaat OYJ (Automobiles & Components) | 1,170,459 | ||||||
|
| |||||||
| France – 7.5% | ||||||||
| 12,101 | bioMerieux (Health Care Equipment & Services) | 1,321,409 | ||||||
| 38,515 | Cap Gemini SA (Software & Services) | 2,721,228 | ||||||
| 29,028 | Ingenico (Technology Hardware & Equipment) | 2,533,026 | ||||||
| 47,435 | JCDecaux SA (Media) | 1,947,212 | ||||||
| 52,901 | Klepierre (REIT) | 2,427,147 | ||||||
| 112,411 | Metropole Television SA (Media) | 2,407,920 | ||||||
| 52,874 | Nexity SA (Consumer Durables & Apparel) | 2,371,800 | ||||||
|
| |||||||
| 15,729,742 | ||||||||
|
| |||||||
| Germany – 5.7% | ||||||||
| 14,096 | Brenntag AG (Capital Goods) | 2,553,499 | ||||||
| 45,950 | Gerry Weber International AG (Consumer Durables & Apparel) | 2,426,877 | ||||||
| 41,190 | GfK SE (Media) | 2,125,792 | ||||||
| 102,200 | Infineon Technologies AG (Semiconductors & Semiconductor Equipment) | 1,188,310 | ||||||
| 16,459 | Leoni AG (Automobiles & Components) | 1,226,847 | ||||||
| 2,880 | Rational AG (Capital Goods) | 919,855 | ||||||
| 34,773 | Salzgitter AG (Materials) | 1,477,013 | ||||||
|
| |||||||
| 11,918,193 | ||||||||
|
| |||||||
| 24 | The accompanying notes are an integral part of these financial statements. |
GOLDMAN SACHS INTERNATIONAL SMALL CAP FUND
| Shares | Description | Value | ||||||
| Common Stocks – (continued) | ||||||||
| Ireland – 1.6% | ||||||||
| 448,272 | Beazley PLC (Insurance) | $ | 1,859,603 | |||||
| 40,047 | ICON PLC (Pharmaceuticals, Biotechnology & Life Sciences)* | 1,552,622 | ||||||
|
| |||||||
| 3,412,225 | ||||||||
|
| |||||||
| Italy – 1.8% | ||||||||
| 97,042 | MARR SpA (Food & Staples Retailing) | 1,879,484 | ||||||
| 11,452 | Moncler SpA (Consumer Durables & Apparel)* | 201,655 | ||||||
| 187,123 | Unione di Banche Italiane SCpA (Banks) | 1,786,182 | ||||||
|
| |||||||
| 3,867,321 | ||||||||
|
| |||||||
| Japan – 17.4% | ||||||||
| 33,300 | Asahi Intecc Co. Ltd. (Health Care Equipment & Services) | 1,218,764 | ||||||
| 91,000 | Asics Corp. (Consumer Durables & Apparel) | 1,771,164 | ||||||
| 47,800 | Daibiru Corp. (Real Estate) | 476,999 | ||||||
| 45,800 | Daiichikosho Co. Ltd. (Media) | 1,319,760 | ||||||
| 60,100 | Doutor Nichires Holdings Co. Ltd. (Consumer Services) | 1,077,192 | ||||||
| 199,000 | Ebara Corp. (Capital Goods) | 1,183,685 | ||||||
| 73,900 | Eiken Chemical Co. Ltd. (Health Care Equipment & Services) | 1,198,053 | ||||||
| 87,900 | en-japan, Inc. (Commercial & Professional Services) | 1,549,342 | ||||||
| 43,800 | FP Corp. (Materials) | 1,362,231 | ||||||
| 43,900 | Fuji Seal International, Inc. (Materials) | 1,428,332 | ||||||
| 73,100 | GMO internet, Inc. (Software & Services) | 645,814 | ||||||
| 36,000 | HIS Co. Ltd. (Consumer Services) | 998,389 | ||||||
| 46,200 | Hitachi High-Technologies Corp. (Technology Hardware & Equipment) | 1,056,875 | ||||||
| 100,300 | Hitachi Transport System Ltd. (Transportation) | 1,539,090 | ||||||
| 53,060 | Iida Group Holdings Co. Ltd. (Consumer Durables & Apparel) | 791,832 | ||||||
| 93,000 | J. Front Retailing Co. Ltd. (Retailing) | 591,159 | ||||||
| 23,500 | Jafco Co. Ltd. (Diversified Financials) | 900,419 | ||||||
| 59,000 | Japan Aviation Electronics Industry Ltd. (Technology Hardware & Equipment) | 1,004,295 | ||||||
| 101,800 | M3, Inc. (Health Care Equipment & Services) | 1,396,550 | ||||||
| 66,400 | Maeda Kosen Co. Ltd. (Capital Goods) | 988,651 | ||||||
| 450,000 | Mitsui Chemicals, Inc. (Materials) | 1,096,549 | ||||||
| 126,000 | Nachi-Fujikoshi Corp. (Capital Goods) | 779,274 | ||||||
| 59,000 | Oyo Corp. (Commercial & Professional Services) | 818,431 | ||||||
| 174,400 | Pocket Card Co. Ltd. (Diversified Financials) | 1,143,050 | ||||||
|
| |||||||
| Common Stocks – (continued) | ||||||||
| Japan – (continued) | ||||||||
| 92,000 | Sanken Electric Co. Ltd. (Semiconductors & Semiconductor Equipment) | $ | 640,912 | |||||
| 173,000 | Sapporo Holdings Ltd. (Food, Beverage & Tobacco) | 733,523 | ||||||
| 52,400 | SCSK Corp. (Software & Services) | 1,386,065 | ||||||
| 417,000 | Seiko Holdings Corp. (Consumer Durables & Apparel) | 1,523,789 | ||||||
| 100,600 | Sohgo Security Services Co. Ltd. (Commercial & Professional Services) | 2,132,823 | ||||||
| 226,000 | The 77 Bank Ltd. (Banks) | 1,020,284 | ||||||
| 183,000 | The Higo Bank Ltd. (Banks) | 940,589 | ||||||
| 100,500 | Toshiba Plant Systems & Services Corp. (Capital Goods) | 1,478,627 | ||||||
| 40,000 | Zeon Corp. (Materials) | 371,934 | ||||||
|
| |||||||
| 36,564,446 | ||||||||
|
| |||||||
| Luxembourg – 1.3% | ||||||||
| 754,680 | Regus PLC (Commercial & Professional Services) | 2,668,680 | ||||||
|
| |||||||
| Netherlands – 3.5% | ||||||||
| 55,815 | Corio NV (REIT) | 2,615,363 | ||||||
| 65,536 | Delta Lloyd NV (Insurance) | 1,724,776 | ||||||
| 17,994 | Fugro NV CVA (Energy) | 1,192,366 | ||||||
| 39,999 | Nutreco NV (Food, Beverage & Tobacco) | 1,862,082 | ||||||
|
| |||||||
| 7,394,587 | ||||||||
|
| |||||||
| New Zealand – 0.6% | ||||||||
| 149,449 | Fletcher Building Ltd. (Materials) | 1,263,946 | ||||||
|
| |||||||
| Portugal – 1.1% | ||||||||
| 328,598 | ZON OPTIMUS SGPS SA (Media) | 2,377,203 | ||||||
|
| |||||||
| Singapore – 1.3% | ||||||||
| 603,000 | CapitaCommercial Trust (REIT) | 771,687 | ||||||
| 303,000 | OSIM International Ltd. (Retailing) | 702,020 | ||||||
| 9,201,000 | SIIC Environment Holdings Ltd. (Utilities)* | 1,232,840 | ||||||
|
| |||||||
| 2,706,547 | ||||||||
|
| |||||||
| South Korea – 3.7% | ||||||||
| 12,770 | CJ CGV Co. Ltd. (Media) | 595,370 | ||||||
| 54,720 | Hanjin Kal Corp. (Transportation)* | 1,174,849 | ||||||
| 3,211 | Hanssem Co. Ltd. (Consumer Durables & Apparel) | 262,713 | ||||||
| 25,650 | Hyundai Development Co. – Engineering & Construction (Capital Goods) | 735,400 | ||||||
| 95,731 | Jinsung T.E.C. (Capital Goods) | 638,969 | ||||||
| 21,260 | Kolon Industries, Inc. (Materials) | 1,411,435 | ||||||
| 16,520 | KONA I Co. Ltd. (Technology Hardware & Equipment) | 617,036 | ||||||
| 24,470 | KT Skylife Co. Ltd. (Media) | 572,978 | ||||||
| 4,481 | POSCO Chemtech Co. Ltd. (Materials) | 647,287 | ||||||
|
| |||||||
| The accompanying notes are an integral part of these financial statements. | 25 |
GOLDMAN SACHS INTERNATIONAL SMALL CAP FUND
Schedule of Investments (continued)
April 30, 2014 (Unaudited)
| Shares | Description | Value | ||||||
| Common Stocks – (continued) | ||||||||
| South Korea – (continued) | ||||||||
| 24,889 | Seoul Semiconductor Co. Ltd. (Semiconductors & Semiconductor Equipment) | $ | 1,001,841 | |||||
|
| |||||||
| 7,657,878 | ||||||||
|
| |||||||
| Spain – 1.9% | ||||||||
| 74,152 | Almirall SA (Pharmaceuticals, Biotechnology & Life Sciences) | 1,241,961 | ||||||
| 47,123 | Tecnicas Reunidas SA (Energy) | 2,838,397 | ||||||
|
| |||||||
| 4,080,358 | ||||||||
|
| |||||||
| Sweden – 1.0% | ||||||||
| 63,150 | Boliden AB (Materials) | 964,446 | ||||||
| 26,420 | Indutrade AB (Capital Goods) | 1,149,710 | ||||||
|
| |||||||
| 2,114,156 | ||||||||
|
| |||||||
| Switzerland – 7.8% | ||||||||
| 23,543 | Aryzta AG (Food, Beverage & Tobacco)* | 2,176,208 | ||||||
| 4,231 | Flughafen Zuerich AG (Registered) (Transportation) | 2,669,260 | ||||||
| 90,412 | Gategroup Holding AG (Commercial & Professional Services)* | 2,817,139 | ||||||
| 5,485 | Geberit AG (Registered) (Capital Goods) | 1,831,936 | ||||||
| 29,520 | Implenia AG (Registered) (Capital Goods)* | 2,164,609 | ||||||
| 47,390 | Julius Baer Group Ltd. (Diversified Financials)* | 2,219,768 | ||||||
| 389 | Lindt & Spruengli AG (Food, Beverage & Tobacco) | 1,891,740 | ||||||
| 3,791 | Sonova Holding AG (Registered) (Health Care Equipment & Services)* | 547,666 | ||||||
|
| |||||||
| 16,318,326 | ||||||||
|
| |||||||
| Taiwan – 0.8% | ||||||||
| 593,000 | Chipbond Technology Corp. (Semiconductors & Semiconductor Equipment) | 1,015,661 | ||||||
| 77,000 | Silergy Corp. (Semiconductors & Semiconductor Equipment)* | 638,618 | ||||||
|
| |||||||
| 1,654,279 | ||||||||
|
| |||||||
| United Kingdom – 21.2% | ||||||||
| 202,519 | Abcam PLC (Pharmaceuticals, Biotechnology & Life Sciences) | 1,350,636 | ||||||
| 187,366 | Alent PLC (Materials) | 1,005,989 | ||||||
| 177,136 | Ashtead Group PLC (Capital Goods) | 2,624,482 | ||||||
| 39,063 | Bellway PLC (Consumer Durables & Apparel) | 951,291 | ||||||
| 181,071 | Big Yellow Group PLC (REIT) | 1,573,921 | ||||||
| 131,586 | Bodycote PLC (Capital Goods) | 1,623,707 | ||||||
| 264,625 | Cairn Energy PLC (Energy)* | 824,248 | ||||||
|
| |||||||
| Common Stocks – (continued) | ||||||||
| United Kingdom – (continued) | ||||||||
| 80,628 | Close Brothers Group PLC (Diversified Financials) | $ | 1,904,536 | |||||
| 42,791 | Croda International PLC (Materials) | 1,863,742 | ||||||
| 177,144 | Greene King PLC (Consumer Services) | 2,666,936 | ||||||
| 190,781 | Halma PLC (Technology Hardware & Equipment) | 1,812,567 | ||||||
| 218,439 | Inchcape PLC (Retailing) | 2,372,949 | ||||||
| 418,540 | Jupiter Fund Management PLC (Diversified Financials) | 2,750,315 | ||||||
| 953,346 | Londonmetric Property PLC (REIT) | 2,226,674 | ||||||
| 475,589 | Melrose Industries PLC (Capital Goods) | 2,296,654 | ||||||
| 39,368 | Mondi PLC (Materials) | 654,451 | ||||||
| 138,165 | Pennon Group PLC (Utilities) | 1,768,743 | ||||||
| 82,266 | Persimmon PLC (Consumer Durables & Apparel)* | 1,825,648 | ||||||
| 173,145 | Rexam PLC (Materials) | 1,451,635 | ||||||
| 221,777 | Smart Metering Systems PLC (Technology Hardware & Equipment) | 1,460,816 | ||||||
| 38,724 | Spectris PLC (Technology Hardware & Equipment) | 1,457,056 | ||||||
| 43,874 | Spirax-Sarco Engineering PLC (Capital Goods) | 2,150,757 | ||||||
| 176,784 | St. James’s Place PLC (Insurance) | 2,303,968 | ||||||
| 270,404 | The Unite Group PLC (Real Estate) | 1,930,921 | ||||||
| 48,108 | Victrex PLC (Materials) | 1,514,691 | ||||||
|
| |||||||
| 44,367,333 | ||||||||
|
| |||||||
| United States – 0.2% | ||||||||
| 27,937 | Stillwater Mining Co. (Materials)* | 440,846 | ||||||
|
| |||||||
| TOTAL COMMON STOCKS | ||||||||
| (Cost $184,013,776) | $ | 202,021,385 | ||||||
|
| |||||||
| Preferred Stock – 0.6% | ||||||||
| Germany – 0.6% | ||||||||
| 10,180 | Sartorius AG (Health Care Equipment & Services) | $ | 1,325,722 | |||||
| (Cost $1,141,808) | ||||||||
|
| |||||||
| Exchange Traded Funds – 0.7% | ||||||||
| Israel – 0.5% | ||||||||
| 20,913 | iShares MSCI Israel Capped Fund | $ | 1,078,902 | |||||
|
| |||||||
| South Korea – 0.2% | ||||||||
| 6,842 | iShares MSCI South Korea Capped Fund | 427,967 | ||||||
|
| |||||||
| TOTAL EXCHANGE TRADED FUNDS | ||||||||
| (Cost $1,371,625) | $ | 1,506,869 | ||||||
|
| |||||||
| 26 | The accompanying notes are an integral part of these financial statements. |
GOLDMAN SACHS INTERNATIONAL SMALL CAP FUND
| Units | Description | Expiration Month | Value | |||||||
| Right – 0.0% | ||||||||||
| Australia – 0.0% | ||||||||||
| 10,523 | Bank of Queensland Ltd. (Banks)* | 05/14 | $ | 15,214 | ||||||
| (Cost $0) | ||||||||||
| ||||||||||
| TOTAL INVESTMENTS – 97.7% | ||||||||||
| (Cost $186,527,209) | $ | 204,869,190 | ||||||||
| ||||||||||
| OTHER ASSETS IN EXCESS OF LIABILITIES – 2.3% | 4,769,086 | |||||||||
| ||||||||||
| NET ASSETS – 100.0% | $ | 209,638,276 | ||||||||
| ||||||||||
| The percentage shown for each investment category reflects the value of investments in that category as a percentage of net assets. | ||
* | Non-income producing security. | |
| ||
Investment Abbreviations: | ||
ADR | —American Depositary Receipt | |
CVA | —Dutch Certification | |
REIT | —Real Estate Investment Trust | |
| ||
| ADDITIONAL INVESTMENT INFORMATION |
FUTURES CONTRACTS — At April 30, 2014, the Fund had the following futures contracts:
| Type | Number of Contracts Long (Short) | Expiration Date | Current Value | Unrealized Gain (Loss) | ||||||||||
MSCI Singapore Index | 11 | May 2014 | $ | 646,470 | $ | 8,014 | ||||||||
Stoxx Europe Small 200 Index | 102 | June 2014 | 1,632,314 | 23,729 | ||||||||||
| TOTAL | $ | 31,743 | ||||||||||||
| The accompanying notes are an integral part of these financial statements. | 27 |
GOLDMAN SACHS STRATEGIC INTERNATIONAL EQUITY FUND
Schedule of Investments
April 30, 2014 (Unaudited)
| Shares | Description | Value | ||||||
| Common Stocks – 94.8% | ||||||||
| Australia – 5.7% | ||||||||
| 47,612 | AGL Energy Ltd. (Utilities) | $ | 698,943 | |||||
| 224,763 | Aurizon Holdings Ltd. (Transportation) | 1,085,205 | ||||||
| 42,498 | Australia & New Zealand Banking Group Ltd. (Banks) | 1,366,641 | ||||||
| 24,452 | Caltex Australia Ltd. (Energy) | 507,584 | ||||||
| 72,803 | Computershare Ltd. (Software & Services) | 839,179 | ||||||
|
| |||||||
| 4,497,552 | ||||||||
|
| |||||||
| Belgium – 3.4% | ||||||||
| 16,662 | Anheuser-Busch InBev NV (Food, Beverage & Tobacco) | 1,816,089 | ||||||
| 5,325 | Solvay SA (Materials) | 862,944 | ||||||
|
| |||||||
| 2,679,033 | ||||||||
|
| |||||||
| China – 0.8% | ||||||||
| 116,000 | China Mengniu Dairy Co. Ltd. (Food, Beverage & Tobacco) | 596,951 | ||||||
|
| |||||||
| Denmark – 1.6% | ||||||||
| 27,877 | Novo Nordisk A/S Class B (Pharmaceuticals, Biotechnology & Life Sciences) | 1,265,226 | ||||||
|
| |||||||
| Finland – 1.3% | ||||||||
| 25,890 | Nokian Renkaat Oyj (Automobiles & Components) | 1,030,265 | ||||||
|
| |||||||
| France – 14.0% | ||||||||
| 13,114 | Air Liquide SA (Materials) | 1,876,189 | ||||||
| 3,742 | Air Liquide SA-Prime De Fidelite (Materials)* | 535,359 | ||||||
| 38,628 | AXA SA (Insurance) | 1,008,037 | ||||||
| 20,450 | BNP Paribas SA (Banks) | 1,536,706 | ||||||
| 17,879 | Safran SA (Capital Goods) | 1,203,296 | ||||||
| 12,466 | Sanofi (Pharmaceuticals, Biotechnology & Life Sciences) | 1,345,329 | ||||||
| 48,179 | Total SA (Energy) | 3,446,929 | ||||||
|
| |||||||
| 10,951,845 | ||||||||
|
| |||||||
| Germany – 7.8% | ||||||||
| 14,657 | Adidas AG (Consumer Durables & Apparel) | 1,566,859 | ||||||
| 12,300 | Bayer AG (Registered) (Pharmaceuticals, Biotechnology & Life Sciences) | 1,710,214 | ||||||
| 10,448 | Bayerische Motoren Werke AG (Automobiles & Components) | 1,313,366 | ||||||
| 15,297 | Beiersdorf AG (Household & Personal Products) | 1,535,585 | ||||||
|
| |||||||
| 6,126,024 | ||||||||
|
| |||||||
| India – 0.8% | ||||||||
| 16,682 | Hero MotoCorp Ltd. (Automobiles & Components) | 610,032 | ||||||
|
| |||||||
| Indonesia – 0.5% | ||||||||
| 1,626,500 | PT Media Nusantara Citra Tbk (Media) | 383,470 | ||||||
|
| |||||||
| Common Stocks – (continued) | ||||||||
| Ireland – 3.2% | ||||||||
| 14,301 | Kerry Group PLC Class A (Food, Beverage & Tobacco) | $ | 1,128,576 | |||||
| 24,697 | Shire PLC (Pharmaceuticals, Biotechnology & Life Sciences) | 1,412,471 | ||||||
|
| |||||||
| 2,541,047 | ||||||||
|
| |||||||
| Japan – 14.8% | ||||||||
| 38,500 | Credit Saison Co. Ltd. (Diversified Financials) | 820,175 | ||||||
| 75,000 | Ebara Corp. (Capital Goods) | 446,112 | ||||||
| 42,600 | Fujitec Co. Ltd. (Capital Goods) | 491,195 | ||||||
| 36,000 | Japan Tobacco, Inc. (Food, Beverage & Tobacco) | 1,183,269 | ||||||
| 12,000 | KDDI Corp. (Telecommunication Services) | 639,980 | ||||||
| 67,000 | Kubota Corp. (Capital Goods) | 863,531 | ||||||
| 11,600 | Makita Corp. (Capital Goods) | 616,986 | ||||||
| 305,100 | Mitsubishi UFJ Financial Group, Inc. (Banks) | 1,622,979 | ||||||
| 12,700 | Nidec Corp. (Capital Goods) | 718,001 | ||||||
| 16,100 | Pola Orbis Holdings, Inc. (Household & Personal Products) | 630,084 | ||||||
| 10,000 | Rinnai Corp. (Consumer Durables & Apparel) | 833,387 | ||||||
| 143,000 | Sumitomo Osaka Cement Co. Ltd. (Materials) | 568,729 | ||||||
| 136,800 | Tokyu Fudosan Holdings Corp. (Real Estate) | 994,530 | ||||||
| 21,500 | Unicharm Corp. (Household & Personal Products) | 1,165,903 | ||||||
|
| |||||||
| 11,594,861 | ||||||||
|
| |||||||
| Luxembourg – 1.1% | ||||||||
| 23,033 | SES SA FDR (Media) | 867,414 | ||||||
|
| |||||||
| Russia – 1.3% | ||||||||
| 3,264 | OJSC Magnit (Food & Staples Retailing) | 648,257 | ||||||
| 42,296 | Sberbank of Russia ADR (Banks)* | 356,305 | ||||||
|
| |||||||
| 1,004,562 | ||||||||
|
| |||||||
| Singapore – 1.2% | ||||||||
| 70,000 | DBS Group Holdings Ltd. (Banks) | 948,302 | ||||||
|
| |||||||
| South Korea – 1.9% | ||||||||
| 20,380 | Hana Financial Group, Inc. (Banks) | 719,130 | ||||||
| 14,404 | Kia Motors Corp. (Automobiles & Components) | 799,166 | ||||||
|
| |||||||
| 1,518,296 | ||||||||
|
| |||||||
| Sweden – 5.3% | ||||||||
| 24,187 | Hennes & Mauritz AB Class B (Retailing) | 990,045 | ||||||
| 30,947 | Svenska Cellulosa AB SCA Class B (Household & Personal Products) | 870,014 | ||||||
|
| |||||||
| 28 | The accompanying notes are an integral part of these financial statements. |
GOLDMAN SACHS STRATEGIC INTERNATIONAL EQUITY FUND
| Shares | Description | Value | ||||||
| Common Stocks – (continued) | ||||||||
| Sweden – (continued) | ||||||||
| 111,958 | Telefonaktiebolaget LM Ericsson Class B (Technology Hardware & Equipment) | $ | 1,350,041 | |||||
| 58,386 | Volvo AB Class B (Capital Goods) | 924,493 | ||||||
|
| |||||||
| 4,134,593 | ||||||||
|
| |||||||
| Switzerland – 11.4% | ||||||||
| 47,566 | Credit Suisse Group AG (Registered) (Diversified Financials)* | 1,507,968 | ||||||
| 25,009 | Julius Baer Group Ltd. (Diversified Financials)* | 1,171,432 | ||||||
| 30,904 | Novartis AG (Registered) (Pharmaceuticals, Biotechnology & Life Sciences) | 2,686,564 | ||||||
| 3,671 | Syngenta AG (Registered) (Materials)* | 1,453,685 | ||||||
| 59,050 | UBS AG (Registered) (Diversified Financials)* | 1,234,965 | ||||||
| 15,545 | Wolseley PLC (Capital Goods) | 900,746 | ||||||
|
| |||||||
| 8,955,360 | ||||||||
|
| |||||||
| Taiwan – 1.8% | ||||||||
| 54,000 | MediaTek, Inc. (Semiconductors & Semiconductor Equipment) | 846,180 | ||||||
| 28,898 | Taiwan Semiconductor Manufacturing Co. Ltd. ADR (Semiconductors & Semiconductor Equipment) | 580,850 | ||||||
|
| |||||||
| 1,427,030 | ||||||||
|
| |||||||
| Thailand – 0.8% | ||||||||
| 98,600 | Airports of Thailand PCL (Transportation) | 595,471 | ||||||
|
| |||||||
| United Kingdom – 16.1% | ||||||||
| 116,513 | BG Group PLC (Energy) | 2,356,981 | ||||||
| 19,728 | BHP Billiton PLC (Materials) | 640,458 | ||||||
| 2,175 | BP PLC (Energy) | 18,364 | ||||||
| 59,067 | Drax Group PLC (Utilities) | 661,197 | ||||||
| 226,154 | HSBC Holdings PLC (Banks) | 2,310,756 | ||||||
| 155,710 | Melrose Industries PLC (Capital Goods) | 751,935 | ||||||
| 34,186 | Rio Tinto PLC (Materials) | 1,858,616 | ||||||
| 13,101 | Spirax-Sarco Engineering PLC (Capital Goods) | 642,227 | ||||||
| 69,569 | Standard Chartered PLC (Banks) | 1,506,673 | ||||||
| 501,179 | Vodafone Group PLC (Telecommunication Services) | 1,902,782 | ||||||
|
| |||||||
| 12,649,989 | ||||||||
|
| |||||||
| TOTAL COMMON STOCKS | ||||||||
| (Cost $67,340,833) | $ | 74,377,323 | ||||||
|
| |||||||
| Exchange Traded Fund – 3.1% | ||||||||
| Japan – 3.1% | ||||||||
| 217,804 | iShares MSCI Japan Fund | $ | 2,413,268 | |||||
| (Cost $2,577,198) | ||||||||
|
| |||||||
| TOTAL INVESTMENTS – 97.9% | ||||||||
| (Cost $69,918,031) | $ | 76,790,591 | ||||||
|
| |||||||
| | OTHER ASSETS IN EXCESS OF LIABILITIES – 2.1% | 1,653,400 | ||||||
|
| |||||||
| NET ASSETS – 100.0% | $ | 78,443,991 | ||||||
|
| |||||||
| The percentage shown for each investment category reflects the value of investments in that category as a percentage of net assets. | ||
* | Non-income producing security. | |
| ||
Investment Abbreviations: | ||
ADR | —American Depositary Receipt | |
FDR | —Fiduciary Depositary Receipt | |
| ||
| The accompanying notes are an integral part of these financial statements. | 29 |
GOLDMAN SACHS FUNDAMENTAL INTERNATIONAL EQUITY FUNDS
Statements of Assets and Liabilities
April 30, 2014 (Unaudited)
Focused International Equity Fund | International Small Cap | Strategic International Equity Fund | ||||||||||||
| Assets: | ||||||||||||||
Investments, at value (cost $271,186,192, $186,527,209 and $69,918,031) | $ | 273,109,208 | $ | 204,869,190 | $ | 76,790,591 | ||||||||
Cash | 3,399,670 | 7,362,102 | 1,155,099 | |||||||||||
Foreign currencies, at value (cost $105,009, $139,810 and $302,231) | 105,773 | 140,422 | 304,217 | |||||||||||
Receivables: | ||||||||||||||
Investments sold | 3,864,732 | 3,761,209 | 2,226,557 | |||||||||||
Dividends | 943,729 | 860,455 | 208,356 | |||||||||||
Fund shares sold | 826,863 | 167,951 | 132,801 | |||||||||||
Foreign tax reclaims | 480,950 | 129,152 | 187,244 | |||||||||||
Reimbursement from investment adviser | 43,935 | 38,759 | 38,847 | |||||||||||
Collateral on certain derivative contracts(a) | — | 140,445 | — | |||||||||||
Variation margin on certain derivative contracts | — | 114,333 | — | |||||||||||
Other assets | 140,585 | 9,103 | — | |||||||||||
| Total assets | 282,915,445 | 217,593,121 | 81,043,712 | |||||||||||
| Liabilities: | ||||||||||||||
Payables: | ||||||||||||||
Fund shares redeemed | 392,434 | 3,226,604 | 61,842 | |||||||||||
Amounts owed to affiliates | 244,602 | 203,529 | 71,320 | |||||||||||
Investments purchased | — | 4,413,894 | 2,377,033 | |||||||||||
Foreign capital gains taxes | — | — | 13,771 | |||||||||||
Accrued expenses | 115,548 | 110,818 | 75,755 | |||||||||||
| Total liabilities | 752,584 | 7,954,845 | 2,599,721 | |||||||||||
| Net Assets: | ||||||||||||||
Paid-in capital | 481,149,882 | 206,566,522 | 115,796,975 | |||||||||||
Undistributed (distributions in excess of) net investment income | 6,238,171 | (62,853 | ) | 1,848,932 | ||||||||||
Accumulated net realized loss | (207,192,202 | ) | (15,245,571 | ) | (46,074,319 | ) | ||||||||
Net unrealized gain | 1,967,010 | 18,380,178 | 6,872,403 | |||||||||||
| NET ASSETS | $ | 282,162,861 | $ | 209,638,276 | $ | 78,443,991 | ||||||||
Net Assets: | ||||||||||||||
Class A | $ | 68,260,246 | $ | 16,872,811 | $ | 24,602,442 | ||||||||
Class B | 430,883 | 337,593 | 1,977,082 | |||||||||||
Class C | 20,454,933 | �� | 3,047,273 | 5,482,950 | ||||||||||
Institutional | 188,265,193 | 184,440,564 | 46,297,054 | |||||||||||
Service | 356,806 | 1,077,275 | — | |||||||||||
Class IR | 4,394,800 | 3,862,760 | 67,023 | |||||||||||
Class R | — | — | 17,440 | |||||||||||
Total Net Assets | $ | 282,162,861 | $ | 209,638,276 | $ | 78,443,991 | ||||||||
Shares outstanding $0.001 par value (unlimited shares authorized): | ||||||||||||||
Class A | 3,397,745 | 850,542 | 1,740,862 | |||||||||||
Class B | 21,773 | 17,298 | 156,600 | |||||||||||
Class C | 1,091,892 | 159,445 | 429,300 | |||||||||||
Institutional | 9,205,912 | 9,040,140 | 3,139,337 | |||||||||||
Service | 17,677 | 55,007 | — | |||||||||||
Class IR | 215,973 | 189,740 | 4,738 | |||||||||||
Class R | — | — | 1,228 | |||||||||||
Net asset value, offering and redemption price per share:(b) | ||||||||||||||
Class A | $20.09 | $19.84 | $14.13 | |||||||||||
Class B | 19.79 | 19.52 | 12.63 | |||||||||||
Class C | 18.73 | 19.11 | 12.77 | |||||||||||
Institutional | 20.45 | 20.40 | 14.75 | |||||||||||
Service | 20.19 | 19.58 | — | |||||||||||
Class IR | 20.35 | 20.36 | 14.15 | |||||||||||
Class R | — | — | 14.20 | |||||||||||
| (a) | Represents segregated cash for the International Small Cap Fund relating to collateral on futures transactions. |
| (b) | Maximum public offering price per share for Class A shares of the Focused International Equity, International Small Cap and Strategic International Equity Funds is $21.26, $20.99 and $14.95, respectively. At redemption, Class B and Class C Shares may be subject to a contingent deferred sales charge assessed on the amount equal to the lesser of the current NAV or the original purchase price of the shares. |
| 30 | The accompanying notes are an integral part of these financial statements. |
GOLDMAN SACHS FUNDAMENTAL INTERNATIONAL EQUITY FUNDS
Statements of Operations
For the Six Months Ended April 30, 2014 (Unaudited)
| Focused International Equity Fund | International Small Cap Fund | Strategic International Equity Fund | ||||||||||||
| Investment income: | ||||||||||||||
Dividends (net of foreign taxes withheld of $256,444, $175,397 and $86,846) | $ | 7,617,670 | $ | 2,731,654 | $ | 2,505,056 | ||||||||
| Expenses: | ||||||||||||||
Management fees | 1,193,094 | 1,103,636 | 315,227 | |||||||||||
Distribution and Service fees(a) | 176,568 | 34,981 | 68,476 | |||||||||||
Transfer Agent fees(a) | 112,354 | 55,093 | 38,527 | |||||||||||
Custody, accounting and administrative services | 95,405 | 104,302 | 60,994 | |||||||||||
Professional fees | 48,268 | 46,188 | 50,202 | |||||||||||
Registration fees | 35,422 | 37,635 | 38,953 | |||||||||||
Printing and mailing costs | 23,613 | 15,226 | 17,924 | |||||||||||
Trustee fees | 17,376 | 17,702 | 17,083 | |||||||||||
Service share fees — Service Plan | 454 | 1,306 | — | |||||||||||
Service share fees — Shareholder Administration Plan | 454 | 1,306 | — | |||||||||||
Other | 17,468 | 13,021 | 2,163 | |||||||||||
| Total expenses | 1,720,476 | 1,430,396 | 609,549 | |||||||||||
Less — expense reductions | (341,353 | ) | (217,115 | ) | (168,362 | ) | ||||||||
| Net expenses | 1,379,123 | 1,213,281 | 441,187 | |||||||||||
| NET INVESTMENT INCOME | 6,238,547 | 1,518,373 | 2,063,869 | |||||||||||
| Realized and unrealized gain (loss): | ||||||||||||||
Net realized gain (loss) from: | ||||||||||||||
Investments | 7,631,521 | 10,318,659 | 3,779,682 | |||||||||||
Futures contracts | (523 | ) | 2,357 | — | ||||||||||
Foreign currency transactions | 3,519 | (13,950 | ) | (5,040 | ) | |||||||||
Net change in unrealized gain (loss) on: | ||||||||||||||
Investments (including the effects of the net change in the foreign capital gains | (11,327,642 | ) | (1,917,954 | ) | (3,444,411 | ) | ||||||||
Futures contracts | — | 30,904 | — | |||||||||||
Foreign currency translation | 21,892 | 8,734 | 2,727 | |||||||||||
| Net realized and unrealized gain (loss) | (3,671,233 | ) | 8,428,750 | 332,958 | ||||||||||
| NET INCREASE IN NET ASSETS RESULTING FROM OPERATIONS | $ | 2,567,314 | $ | 9,947,123 | $ | 2,396,827 | ||||||||
| (a) | Class specific Distribution and Service, and Transfer Agent fees were as follows: |
| Distribution and Service Fees | Transfer Agent Fees | |||||||||||||||||||||||||||||||||||||||||||
Fund | Class A | Class B | Class C | Class R | Class A | Class B | Class C | Institutional | Service | Class IR | Class R | |||||||||||||||||||||||||||||||||
Focused International Equity | $ | 79,630 | $ | 2,597 | $ | 94,341 | $ | — | $ | 60,519 | $ | 493 | $ | 17,925 | $ | 30,417 | $ | 72 | $ | 2,928 | $ | — | ||||||||||||||||||||||
International Small Cap | 19,352 | 1,999 | 13,630 | — | 14,708 | 380 | 2,590 | 35,934 | 209 | 1,272 | — | |||||||||||||||||||||||||||||||||
Strategic International Equity | 29,703 | 11,297 | 27,434 | 42 | 22,574 | 2,147 | 5,213 | 8,516 | — | 61 | 16 | |||||||||||||||||||||||||||||||||
| The accompanying notes are an integral part of these financial statements. | 31 |
GOLDMAN SACHS FUNDAMENTAL INTERNATIONAL EQUITY FUNDS
Statements of Changes in Net Assets
| Focused International Equity Fund | ||||||||||
For the Six Months Ended April 30, 2014 (Unaudited) | For the Fiscal Year Ended October 31, 2013 | |||||||||
| From operations: | ||||||||||
Net investment income | $ | 6,238,547 | $ | 1,504,045 | ||||||
Net realized gain | 7,634,517 | 27,455,110 | ||||||||
Net change in unrealized gain (loss) | (11,305,750 | ) | 12,676,809 | |||||||
| Net increase in net assets resulting from operations | 2,567,314 | 41,635,964 | ||||||||
| Distributions to shareholders: | ||||||||||
From net investment income | ||||||||||
Class A Shares | (228,497 | ) | (1,458,280 | ) | ||||||
Class B Shares | — | (17,987 | ) | |||||||
Class C Shares | — | (358,173 | ) | |||||||
Institutional Shares | (930,005 | ) | (2,144,339 | ) | ||||||
Service Shares | (940 | ) | (8,887 | ) | ||||||
Class IR Shares | (14,137 | ) | (12,406 | ) | ||||||
Class R Shares | — | — | ||||||||
| Total distributions to shareholders | (1,173,579 | ) | (4,000,072 | ) | ||||||
| From share transactions: | ||||||||||
Proceeds from sales of shares | 99,335,890 | 50,132,344 | ||||||||
Reinvestment of distributions | 1,140,136 | 3,889,489 | ||||||||
Cost of shares redeemed | (14,099,539 | ) | (26,886,640 | ) | ||||||
| Net increase in net assets resulting from share transactions | 86,376,487 | 27,135,193 | ||||||||
| TOTAL INCREASE | 87,770,222 | 64,771,085 | ||||||||
| Net assets: | ||||||||||
Beginning of period | 194,392,639 | 129,621,554 | ||||||||
End of period | $ | 282,162,861 | $ | 194,392,639 | ||||||
| Undistributed (distributions in excess of) net investment income | $ | 6,238,171 | $ | 1,173,203 | ||||||
| 32 | The accompanying notes are an integral part of these financial statements. |
GOLDMAN SACHS FUNDAMENTAL INTERNATIONAL EQUITY FUNDS
| International Small Cap Fund | Strategic International Equity Fund | |||||||||||||||||||||
For the Six Months Ended April 30, 2014 | For the Fiscal Year Ended October 31, 2013 | For the Six Months Ended April 30, 2014 (Unaudited) | For the Fiscal Year Ended October 31, 2013 | |||||||||||||||||||
| $ | 1,518,373 | $ | 1,674,890 | $ | 2,063,869 | $ | 746,999 | |||||||||||||||
| 10,307,066 | 13,974,773 | 3,774,642 | 8,048,712 | |||||||||||||||||||
| (1,878,316 | ) | 16,727,035 | (3,441,684 | ) | 5,964,099 | |||||||||||||||||
| 9,947,123 | 32,376,698 | 2,396,827 | 14,759,810 | |||||||||||||||||||
| (252,522 | ) | (82,903 | ) | (181,701 | ) | (373,449 | ) | |||||||||||||||
| (3,621 | ) | (1,373 | ) | (1,078 | ) | (41,315 | ) | |||||||||||||||
| (29,832 | ) | (5,492 | ) | (8,305 | ) | (70,264 | ) | |||||||||||||||
| (3,353,326 | ) | (1,022,695 | ) | (464,488 | ) | (545,277 | ) | |||||||||||||||
| (16,362 | ) | (9,020 | ) | — | — | |||||||||||||||||
| (18,633 | ) | (5,265 | ) | (623 | ) | (1,935 | ) | |||||||||||||||
| — | — | (111 | ) | (121 | ) | |||||||||||||||||
| (3,674,296 | ) | (1,126,748 | ) | (656,306 | ) | (1,032,361 | ) | |||||||||||||||
| 38,353,746 | 100,581,076 | 8,502,176 | 17,704,507 | |||||||||||||||||||
| 3,530,834 | 1,108,249 | 650,708 | 1,014,248 | |||||||||||||||||||
| (28,863,682 | ) | (24,175,346 | ) | (5,657,430 | ) | (13,212,250 | ) | |||||||||||||||
| 13,020,898 | 77,513,979 | 3,495,454 | 5,506,505 | |||||||||||||||||||
| 19,293,725 | 108,763,929 | 5,235,975 | 19,233,954 | |||||||||||||||||||
| 190,344,551 | 81,580,622 | 73,208,016 | 53,974,062 | |||||||||||||||||||
| $ | 209,638,276 | $ | 190,344,551 | $ | 78,443,991 | $ | 73,208,016 | |||||||||||||||
| $ | (62,853 | ) | $ | 2,093,070 | $ | 1,848,932 | $ | 441,369 | ||||||||||||||
| The accompanying notes are an integral part of these financial statements. | 33 |
GOLDMAN SACHS FOCUSED INTERNATIONAL EQUITY FUND
Financial Highlights
Selected Data for a Share Outstanding Throughout Each Period
| Income (loss) from investment operations | ||||||||||||||||||||||
| Year - Share Class | Net asset value, beginning of period | Net investment income (loss)(a) | Net realized and unrealized gain (loss) | Total from investment operations | Distributions to shareholders from net investment income | |||||||||||||||||
| FOR THE SIX MONTHS ENDED APRIL 30, (UNAUDITED) | ||||||||||||||||||||||
2014 - A | $ | 20.00 | $ | 0.47 | (d) | $ | (0.31 | ) | $ | 0.16 | $ | (0.07 | ) | |||||||||
2014 - B | 19.70 | 0.33 | (d) | (0.24 | ) | 0.09 | — | |||||||||||||||
2014 - C | 18.65 | 0.37 | (d) | (0.29 | ) | 0.08 | — | |||||||||||||||
2014 - Institutional | 20.39 | 0.56 | (d) | (0.35 | ) | 0.21 | (0.15 | ) | ||||||||||||||
2014 - Service | 20.08 | 0.44 | (d) | (0.28 | ) | 0.16 | (0.05 | ) | ||||||||||||||
2014 - IR | 20.29 | 0.63 | (d) | (0.43 | ) | 0.20 | (0.14 | ) | ||||||||||||||
| FOR THE FISCAL YEARS ENDED OCTOBER 31, | ||||||||||||||||||||||
2013 - A | 15.58 | 0.15 | 4.71 | 4.86 | (0.44 | ) | ||||||||||||||||
2013 - B | 15.37 | 0.01 | 4.66 | 4.67 | (0.34 | ) | ||||||||||||||||
2013 - C | 14.60 | 0.02 | 4.41 | 4.43 | (0.38 | ) | ||||||||||||||||
2013 - Institutional | 15.92 | 0.23 | 4.79 | 5.02 | (0.55 | ) | ||||||||||||||||
2013 - Service | 15.69 | 0.14 | 4.72 | 4.86 | (0.47 | ) | ||||||||||||||||
2013 - IR | 15.87 | 0.16 | 4.82 | 4.98 | (0.56 | ) | ||||||||||||||||
2012 - A | 14.74 | 0.28 | 0.93 | 1.21 | (0.47 | ) | ||||||||||||||||
2012 - B | 14.48 | 0.16 | 0.94 | 1.10 | (0.31 | ) | ||||||||||||||||
2012 - C | 13.82 | 0.16 | 0.87 | 1.03 | (0.35 | ) | ||||||||||||||||
2012 - Institutional | 15.07 | 0.32 | 0.97 | 1.29 | (0.54 | ) | ||||||||||||||||
2012 - Service | 14.85 | 0.26 | 0.94 | 1.20 | (0.46 | ) | ||||||||||||||||
2012 - IR | 15.06 | 0.28 | 0.98 | 1.26 | (0.55 | ) | ||||||||||||||||
2011 - A | 16.81 | 0.42 | (g) | (2.22 | ) | (1.80 | ) | (0.27 | ) | |||||||||||||
2011 - B | 16.46 | 0.28 | (g) | (2.15 | ) | (1.87 | ) | (0.11 | ) | |||||||||||||
2011 - C | 15.79 | 0.29 | (g) | (2.09 | ) | (1.80 | ) | (0.17 | ) | |||||||||||||
2011 - Institutional | 17.18 | 0.50 | (g) | (2.27 | ) | (1.77 | ) | (0.34 | ) | |||||||||||||
2011 - Service | 16.92 | 0.42 | (g) | (2.24 | ) | (1.82 | ) | (0.25 | ) | |||||||||||||
2011 - IR | 17.22 | 0.63 | (g) | (2.45 | ) | (1.82 | ) | (0.34 | ) | |||||||||||||
2010 - A | 15.22 | 0.10 | 1.79 | 1.89 | (0.30 | ) | ||||||||||||||||
2010 - B | 14.90 | (0.01 | ) | 1.74 | 1.73 | (0.17 | ) | |||||||||||||||
2010 - C | 14.35 | (0.02 | ) | 1.69 | 1.67 | (0.23 | ) | |||||||||||||||
2010 - Institutional | 15.55 | 0.16 | 1.82 | 1.98 | (0.35 | ) | ||||||||||||||||
2010 - Service | 15.32 | 0.08 | 1.80 | 1.88 | (0.28 | ) | ||||||||||||||||
2010 - IR (Commenced August 31, 2010) | 15.13 | 0.02 | 2.07 | 2.09 | — | |||||||||||||||||
2009 - A | 13.18 | 0.21 | 2.41 | 2.62 | (0.75 | ) | ||||||||||||||||
2009 - B | 12.72 | 0.12 | 2.36 | 2.48 | (0.47 | ) | ||||||||||||||||
2009 - C | 12.40 | 0.10 | 2.29 | 2.39 | (0.61 | ) | ||||||||||||||||
2009 - Institutional | 13.50 | 0.26 | 2.48 | 2.74 | (0.86 | ) | ||||||||||||||||
2009 - Service | 13.28 | 0.19 | 2.43 | 2.62 | (0.75 | ) | ||||||||||||||||
| (a) | Calculated based on the average shares outstanding methodology. |
| (b) | Assumes investment at the net asset value at the beginning of the period, reinvestment of all distributions, a complete redemption of the investment at the net asset value at the end of the period and no sales or redemption charges. Total returns would be reduced if a sales or redemption charge was taken into account. Returns do not reflect the deduction of taxes that a shareholder would pay on Fund distributions or the redemption of Fund shares. Total returns for periods less than one full year are not annualized. |
| (c) | The Fund's portfolio turnover rate is calculated in accordance with regulatory requirements, without regard to transactions involving short term investments and certain derivatives. If such transactions were included, the Fund's portfolio turnover rate may be higher. |
| (d) | Reflects income recognized from several corporate actions which amounted to $0.45 per share and 4.54% of average net assets. |
| (e) | Annualized. |
| (f) | Total returns reflects the impact of payments for regulatory settlements entitled to be received during the year and recorded as an increase to capital by the Fund. Excluding such payments, the total return would have been: |
| Class A | Class B | Class C | Institutional | Service | Class IR | |||||||||||||||||||
For the Fiscal Year Ended October 31, 2012 | 8.66 | % | 7.91 | % | 7.81 | % | 9.15 | % | 8.57 | % | 8.92 | % | ||||||||||||
For the Fiscal Year Ended October 31, 2009 | 21.64 | 20.44 | 20.79 | 21.99 | 21.50 | N/A | ||||||||||||||||||
| (g) | Reflects income recognized from a corporate action which amounted to $0.26 per share and 1.55% of average net assets. |
| 34 | The accompanying notes are an integral part of these financial statements. |
GOLDMAN SACHS FOCUSED INTERNATIONAL EQUITY FUND
| Increase from regulatory settlements | Net asset value, end of period | Total return(b) | Net assets, (in 000s) | Ratio of net expenses to average net assets | Ratio of total expenses to average net assets | Ratio of net assets | Portfolio turnover rate(c) | |||||||||||||||||||||||||||||||||||||||
| $ | — | $ | 20.09 | 0.87 | % | $ | 68,260 | 1.36 | %(e) | 1.64 | %(e) | 4.75 | %(d)(e) | 52 | % | |||||||||||||||||||||||||||||||
| — | 19.79 | 0.51 | 431 | 2.11 | (e) | 2.38 | (e) | 3.42 | (d)(e) | 52 | ||||||||||||||||||||||||||||||||||||
| — | 18.73 | 0.48 | 20,455 | 2.11 | (e) | 2.39 | (e) | 4.00 | (d)(e) | 52 | ||||||||||||||||||||||||||||||||||||
| — | 20.45 | 1.07 | 188,265 | 0.95 | (e) | 1.24 | (e) | 5.57 | (d)(e) | 52 | ||||||||||||||||||||||||||||||||||||
| — | 20.19 | 0.81 | 357 | 1.46 | (e) | 1.73 | (e) | 4.44 | (d)(e) | 52 | ||||||||||||||||||||||||||||||||||||
| — | 20.35 | 0.99 | 4,395 | 1.09 | (e) | 1.40 | (e) | 6.35 | (d)(e) | 52 | ||||||||||||||||||||||||||||||||||||
| — | 20.00 | 31.94 | 61,224 | 1.46 | 1.69 | 0.89 | 189 | |||||||||||||||||||||||||||||||||||||||
| — | 19.70 | 30.93 | 578 | 2.21 | 2.43 | 0.07 | 189 | |||||||||||||||||||||||||||||||||||||||
| — | 18.65 | 30.97 | 17,910 | 2.20 | 2.44 | 0.15 | 189 | |||||||||||||||||||||||||||||||||||||||
| — | 20.39 | 32.50 | 112,707 | 1.06 | 1.29 | 1.29 | 189 | |||||||||||||||||||||||||||||||||||||||
| — | 20.08 | 31.86 | 364 | 1.56 | 1.79 | 0.80 | 189 | |||||||||||||||||||||||||||||||||||||||
| — | 20.29 | 32.36 | 1,609 | 1.20 | 1.44 | 0.89 | 189 | |||||||||||||||||||||||||||||||||||||||
| 0.10 | 15.58 | 9.36 | (f) | 52,564 | 1.48 | 1.72 | 1.95 | 144 | ||||||||||||||||||||||||||||||||||||||
| 0.10 | 15.37 | 8.61 | (f) | 815 | 2.23 | 2.47 | 1.13 | 144 | ||||||||||||||||||||||||||||||||||||||
| 0.10 | 14.60 | 8.55 | (f) | 14,039 | 2.23 | 2.47 | 1.14 | 144 | ||||||||||||||||||||||||||||||||||||||
| 0.10 | 15.92 | 9.84 | (f) | 61,874 | 1.08 | 1.31 | 2.11 | 144 | ||||||||||||||||||||||||||||||||||||||
| 0.10 | 15.69 | 9.26 | (f) | 299 | 1.58 | 1.82 | 1.77 | 144 | ||||||||||||||||||||||||||||||||||||||
| 0.10 | 15.87 | 9.61 | (f) | 30 | 1.23 | 1.46 | 1.87 | 144 | ||||||||||||||||||||||||||||||||||||||
| — | 14.74 | (10.89 | ) | 118,977 | 1.53 | 1.67 | 2.55 | (g) | 135 | |||||||||||||||||||||||||||||||||||||
| — | 14.48 | (11.46 | ) | 1,225 | 2.28 | 2.42 | 1.70 | (g) | 135 | |||||||||||||||||||||||||||||||||||||
| — | 13.82 | (11.55 | ) | 15,883 | 2.28 | 2.42 | 1.86 | (g) | 135 | |||||||||||||||||||||||||||||||||||||
| — | 15.07 | (10.53 | ) | 28,105 | 1.13 | 1.27 | 2.94 | (g) | 135 | |||||||||||||||||||||||||||||||||||||
| — | 14.85 | (10.96 | ) | 300 | 1.63 | 1.77 | 2.51 | (g) | 135 | |||||||||||||||||||||||||||||||||||||
| — | 15.06 | (10.80 | ) | 3 | 1.28 | 1.42 | 3.87 | (g) | 135 | |||||||||||||||||||||||||||||||||||||
| — | 16.81 | 12.48 | 162,231 | 1.54 | 1.61 | 0.66 | 182 | |||||||||||||||||||||||||||||||||||||||
| — | 16.46 | 11.69 | 1,944 | 2.29 | 2.36 | (0.07 | ) | 182 | ||||||||||||||||||||||||||||||||||||||
| — | 15.79 | 11.72 | 20,031 | 2.29 | 2.36 | (0.11 | ) | 182 | ||||||||||||||||||||||||||||||||||||||
| — | 17.18 | 12.95 | 36,693 | 1.14 | 1.21 | 1.05 | 182 | |||||||||||||||||||||||||||||||||||||||
| — | 16.92 | 12.37 | 354 | 1.64 | 1.71 | 0.54 | 182 | |||||||||||||||||||||||||||||||||||||||
| — | 17.22 | 13.81 | 1 | 1.29 | (e) | 1.36 | (e) | 0.08 | (e) | 182 | ||||||||||||||||||||||||||||||||||||
| 0.17 | 15.22 | 22.88 | (f) | 165,054 | 1.54 | 1.65 | 1.65 | 129 | ||||||||||||||||||||||||||||||||||||||
| 0.17 | 14.90 | 21.81 | (f) | 2,893 | 2.29 | 2.40 | 0.93 | 129 | ||||||||||||||||||||||||||||||||||||||
| 0.17 | 14.35 | 21.84 | (f) | 18,510 | 2.29 | 2.40 | 0.80 | 129 | ||||||||||||||||||||||||||||||||||||||
| 0.17 | 15.55 | 23.28 | (f) | 30,009 | 1.14 | 1.25 | 1.95 | 129 | ||||||||||||||||||||||||||||||||||||||
| 0.17 | 15.32 | 22.69 | (f) | 493 | 1.64 | 1.75 | 1.51 | 129 | ||||||||||||||||||||||||||||||||||||||
| The accompanying notes are an integral part of these financial statements. | 35 |
GOLDMAN SACHS INTERNATIONAL SMALL CAP FUND
Financial Highlights
Selected Data for a Share Outstanding Throughout Each Period
| Income (loss) from investment operations | ||||||||||||||||||||||
| Year - Share Class | Net asset value, beginning of period | Net investment income (loss)(a) | Net realized and unrealized gain (loss) | Total from investment operations | Distributions to shareholders from net investment income | |||||||||||||||||
| FOR THE SIX MONTHS ENDED APRIL 30, (UNAUDITED) | ||||||||||||||||||||||
2014 - A | $ | 19.26 | $ | 0.12 | (d) | $ | 0.79 | $ | 0.91 | $ | (0.33 | ) | ||||||||||
2014 - B | 18.85 | 0.02 | (d) | 0.81 | 0.83 | (0.16 | ) | |||||||||||||||
2014 - C | 18.52 | 0.05 | (d) | 0.76 | 0.81 | (0.22 | ) | |||||||||||||||
2014 - Institutional | 19.82 | 0.15 | (d) | 0.81 | 0.96 | (0.38 | ) | |||||||||||||||
2014 - Service | 19.00 | 0.10 | (d) | 0.78 | 0.88 | (0.30 | ) | |||||||||||||||
2014 - IR | 19.77 | 0.19 | (d) | 0.76 | 0.95 | (0.36 | ) | |||||||||||||||
| FOR THE FISCAL YEARS ENDED OCTOBER 31, | ||||||||||||||||||||||
2013 - A | 15.18 | 0.16 | (f) | 4.04 | 4.20 | (0.12 | ) | |||||||||||||||
2013 - B | 14.90 | 0.03 | (f) | 3.97 | 4.00 | (0.05 | ) | |||||||||||||||
2013 - C | 14.65 | 0.04 | (f) | 3.88 | 3.92 | (0.05 | ) | |||||||||||||||
2013 - Institutional | 15.67 | 0.25 | (f) | 4.14 | 4.39 | (0.24 | ) | |||||||||||||||
2013 - Service | 15.04 | 0.14 | (f) | 3.99 | 4.13 | (0.17 | ) | |||||||||||||||
2013 - IR | 15.65 | 0.25 | (f) | 4.10 | 4.35 | (0.23 | ) | |||||||||||||||
2012 - A | 14.06 | 0.11 | 1.26 | 1.37 | (0.25 | ) | ||||||||||||||||
2012 - B | 13.74 | (0.01 | ) | 1.27 | 1.26 | (0.10 | ) | |||||||||||||||
2012 - C | 13.54 | — | (g) | 1.24 | 1.24 | (0.13 | ) | |||||||||||||||
2012 - Institutional | 14.53 | 0.17 | 1.29 | 1.46 | (0.32 | ) | ||||||||||||||||
2012 - Service | 13.98 | 0.09 | 1.25 | 1.34 | (0.28 | ) | ||||||||||||||||
2012 - IR | 14.50 | 0.14 | 1.30 | 1.44 | (0.29 | ) | ||||||||||||||||
2011 - A | 14.62 | 0.08 | (h) | (0.39 | ) | (0.31 | ) | (0.25 | ) | |||||||||||||
2011 - B | 14.29 | (0.04 | )(h) | (0.38 | ) | (0.42 | ) | (0.13 | ) | |||||||||||||
2011 - C | 14.10 | (0.03 | )(h) | (0.38 | ) | (0.41 | ) | (0.15 | ) | |||||||||||||
2011 - Institutional | 15.06 | 0.15 | (h) | (0.38 | ) | (0.23 | ) | (0.30 | ) | |||||||||||||
2011 - Service | 14.53 | 0.06 | (h) | (0.38 | ) | (0.32 | ) | (0.23 | ) | |||||||||||||
2011 - IR | 15.09 | 0.18 | (h) | (0.47 | ) | (0.29 | ) | (0.30 | ) | |||||||||||||
2010 - A | 12.27 | 0.04 | (i) | 2.74 | 2.78 | (0.43 | ) | |||||||||||||||
2010 - B | 12.01 | (0.06 | )(i) | 2.69 | 2.63 | (0.35 | ) | |||||||||||||||
2010 - C | 11.85 | (0.05 | )(i) | 2.64 | 2.59 | (0.34 | ) | |||||||||||||||
2010 - Institutional | 12.62 | 0.10 | (i) | 2.81 | 2.91 | (0.47 | ) | |||||||||||||||
2010 - Service | 12.20 | 0.03 | (i) | 2.72 | 2.75 | (0.42 | ) | |||||||||||||||
2010 - IR (Commenced August 31, 2010) | �� | 12.90 | 0.02 | (i) | 2.17 | 2.19 | — | |||||||||||||||
2009 - A | 9.48 | 0.10 | 3.25 | 3.35 | (0.56 | ) | ||||||||||||||||
2009 - B | 9.12 | 0.02 | 3.20 | 3.22 | (0.33 | ) | ||||||||||||||||
2009 - C | 9.06 | 0.01 | 3.17 | 3.18 | (0.39 | ) | ||||||||||||||||
2009 - Institutional | 9.82 | 0.15 | 3.35 | 3.50 | (0.70 | ) | ||||||||||||||||
2009 - Service | 9.42 | 0.09 | 3.24 | 3.33 | (0.55 | ) | ||||||||||||||||
| (a) | Calculated based on the average shares outstanding methodology. |
| (b) | Assumes investment at the net asset value at the beginning of the period, reinvestment of all distributions, a complete redemption of the investment at the net asset value at the end of the period and no sales or redemption charges. Total returns would be reduced if a sales or redemption charge was taken into account. Returns do not reflect the deduction of taxes that a shareholder would pay on Fund distributions or the redemption of Fund shares. Total returns for periods less than one full year are not annualized. |
| (c) | The Fund’s portfolio turnover rate is calculated in accordance with regulatory requirements, without regard to transactions involving short term investments and certain derivatives. If such transactions were included, the Fund’s portfolio turnover rate may be higher. |
| (d) | Reflects income recognized from a corporate action which amounted to $0.04 per share and 0.43% of average net assets. |
| (e) | Annualized. |
| (f) | Reflects income recognized from non-recurring special dividends which amounted to $0.06 per share and 0.31% of average net assets. |
| (g) | Amount is less than $0.005 per share. |
| (h) | Reflects income recognized from special dividends which amounted to $0.03 per share and 0.16% of average net assets. |
| (i) | Reflects income recognized from special dividends which amounted to $0.01 per share and 0.10% of average net assets. |
| 36 | The accompanying notes are an integral part of these financial statements. |
GOLDMAN SACHS INTERNATIONAL SMALL CAP FUND
| Net asset value, end of period | Total return(b) | Net assets, end of period (in 000s) | Ratio of net expenses to average net assets | Ratio of total expenses to average net assets | Ratio of net investment income (loss) to average net assets | Portfolio turnover rate(c) | ||||||||||||||||||||||||||||||||||
| $ | 19.84 | 4.80 | % | $ | 16,873 | 1.56 | %(e) | 1.77 | %(e) | 1.19 | %(d)(e) | 47 | % | |||||||||||||||||||||||||||
| 19.52 | 4.44 | 338 | 2.31 | (e) | 2.52 | (e) | 0.25 | (d)(e) | 47 | |||||||||||||||||||||||||||||||
| 19.11 | 4.44 | 3,047 | 2.31 | (e) | 2.53 | (e) | 0.49 | (d)(e) | 47 | |||||||||||||||||||||||||||||||
| 20.40 | 4.98 | 184,441 | 1.16 | (e) | 1.37 | (e) | 1.56 | (d)(e) | 47 | |||||||||||||||||||||||||||||||
| 19.58 | 4.72 | 1,077 | 1.66 | (e) | 1.87 | (e) | 1.03 | (d)(e) | 47 | |||||||||||||||||||||||||||||||
| 20.36 | 4.93 | 3,863 | 1.31 | (e) | 1.54 | (e) | 1.91 | (d)(e) | 47 | |||||||||||||||||||||||||||||||
| 19.26 | 27.90 | 14,029 | 1.56 | 1.88 | 0.94 | (f) | 89 | |||||||||||||||||||||||||||||||||
| 18.85 | 26.90 | 450 | 2.31 | 2.63 | 0.17 | (f) | 89 | |||||||||||||||||||||||||||||||||
| 18.52 | 26.81 | 2,389 | 2.31 | 2.63 | 0.22 | (f) | 89 | |||||||||||||||||||||||||||||||||
| 19.82 | 28.43 | 171,473 | 1.16 | 1.46 | 1.39 | (f) | 89 | |||||||||||||||||||||||||||||||||
| 19.00 | 27.75 | 1,035 | 1.66 | 1.98 | 0.87 | (f) | 89 | |||||||||||||||||||||||||||||||||
| 19.77 | 28.20 | 968 | 1.31 | 1.62 | 1.44 | (f) | 89 | |||||||||||||||||||||||||||||||||
| 15.18 | 9.84 | 10,551 | 1.58 | 2.18 | 0.80 | 85 | ||||||||||||||||||||||||||||||||||
| 14.90 | 9.10 | 452 | 2.33 | 2.92 | (0.05 | ) | 85 | |||||||||||||||||||||||||||||||||
| 14.65 | 9.14 | 1,796 | 2.33 | 2.92 | (0.01 | ) | 85 | |||||||||||||||||||||||||||||||||
| 15.67 | 10.49 | 67,614 | 1.18 | 1.73 | 1.14 | 85 | ||||||||||||||||||||||||||||||||||
| 15.04 | 9.77 | 805 | 1.68 | 2.25 | 0.65 | 85 | ||||||||||||||||||||||||||||||||||
| 15.65 | 10.13 | 362 | 1.33 | 1.84 | 0.93 | 85 | ||||||||||||||||||||||||||||||||||
| 14.06 | (1.97 | ) | 22,537 | 1.60 | 1.94 | 0.54 | (h) | 117 | ||||||||||||||||||||||||||||||||
| 13.74 | (2.71 | ) | 622 | 2.35 | 2.69 | (0.25 | )(h) | 117 | ||||||||||||||||||||||||||||||||
| 13.54 | (2.68 | ) | 2,177 | 2.35 | 2.69 | (0.23 | )(h) | 117 | ||||||||||||||||||||||||||||||||
| 14.53 | (1.59 | ) | 36,067 | 1.20 | 1.54 | 0.95 | (h) | 117 | ||||||||||||||||||||||||||||||||
| 13.98 | (2.05 | ) | 730 | 1.70 | 2.04 | 0.41 | (h) | 117 | ||||||||||||||||||||||||||||||||
| 14.50 | (1.72 | ) | 24 | 1.35 | 1.69 | 1.12 | (h) | 117 | ||||||||||||||||||||||||||||||||
| 14.62 | 23.11 | 23,503 | 1.60 | 1.86 | 0.31 | (i) | 155 | |||||||||||||||||||||||||||||||||
| 14.29 | 22.24 | 919 | 2.35 | 2.61 | (0.45 | )(i) | 155 | |||||||||||||||||||||||||||||||||
| 14.10 | 22.18 | 2,120 | 2.35 | 2.61 | (0.43 | )(i) | 155 | |||||||||||||||||||||||||||||||||
| 15.06 | 23.61 | 89,035 | 1.20 | 1.46 | 0.78 | (i) | 155 | |||||||||||||||||||||||||||||||||
| 14.53 | 22.91 | 490 | 1.70 | 1.96 | 0.23 | (i) | 155 | |||||||||||||||||||||||||||||||||
| 15.09 | 16.74 | 1 | 1.35 | (e) | 1.61 | (e) | 0.73 | (e)(i) | 155 | |||||||||||||||||||||||||||||||
| 12.27 | 37.78 | 22,952 | 1.60 | 2.08 | 0.93 | 161 | ||||||||||||||||||||||||||||||||||
| 12.01 | 36.79 | 1,015 | 2.35 | 2.83 | 0.18 | 161 | ||||||||||||||||||||||||||||||||||
| 11.85 | 36.79 | 1,924 | 2.35 | 2.83 | 0.12 | 161 | ||||||||||||||||||||||||||||||||||
| 12.62 | 38.50 | 68,199 | 1.20 | 1.68 | 1.45 | 161 | ||||||||||||||||||||||||||||||||||
| 12.20 | 37.85 | 414 | 1.70 | 2.18 | 0.86 | 161 | ||||||||||||||||||||||||||||||||||
| The accompanying notes are an integral part of these financial statements. | 37 |
GOLDMAN SACHS STRATEGIC INTERNATIONAL EQUITY FUND
Financial Highlights
Selected Data for a Share Outstanding Throughout Each Period
| Income (loss) from investment operations | ||||||||||||||||||||||
| Year - Share Class | Net asset value, beginning of period | Net investment income(a) | Net realized and unrealized gain (loss) | Total from investment operations | Distributions to shareholders from net investment income | |||||||||||||||||
| FOR THE SIX MONTHS ENDED APRIL 30, (UNAUDITED) | ||||||||||||||||||||||
2014 - A | $ | 13.81 | $ | 0.37 | (d) | $ | 0.06 | $ | 0.43 | $ | (0.11 | ) | ||||||||||
2014 - B | 12.30 | 0.26 | (d) | 0.08 | 0.34 | (0.01 | ) | |||||||||||||||
2014 - C | 12.45 | 0.28 | (d) | 0.06 | 0.34 | (0.02 | ) | |||||||||||||||
2014 - Institutional | 14.44 | 0.42 | (d) | 0.05 | 0.47 | (0.16 | ) | |||||||||||||||
2014 - IR | 13.84 | 0.38 | (d) | 0.06 | 0.44 | (0.13 | ) | |||||||||||||||
2014 - R | 13.88 | 0.35 | (d) | 0.06 | 0.41 | (0.09 | ) | |||||||||||||||
| FOR THE FISCAL YEARS ENDED OCTOBER 31, | ||||||||||||||||||||||
2013 - A | 11.06 | 0.14 | 2.80 | 2.94 | (0.19 | ) | ||||||||||||||||
2013 - B | 9.88 | 0.05 | 2.50 | 2.55 | (0.13 | ) | ||||||||||||||||
2013 - C | 10.01 | 0.04 | 2.54 | 2.58 | (0.14 | ) | ||||||||||||||||
2013 - Institutional | 11.58 | 0.19 | 2.93 | 3.12 | (0.26 | ) | ||||||||||||||||
2013 - IR | 11.11 | 0.18 | 2.80 | 2.98 | (0.25 | ) | ||||||||||||||||
2013 - R | 11.14 | 0.08 | 2.85 | 2.93 | (0.19 | ) | ||||||||||||||||
2012 - A | 10.62 | 0.20 | 0.61 | 0.81 | (0.37 | ) | ||||||||||||||||
2012 - B | 9.51 | 0.09 | 0.57 | 0.66 | (0.29 | ) | ||||||||||||||||
2012 - C | 9.64 | 0.10 | 0.57 | 0.67 | (0.30 | ) | ||||||||||||||||
2012 - Institutional | 11.11 | 0.19 | 0.71 | 0.90 | (0.43 | ) | ||||||||||||||||
2012 - IR | 10.70 | 0.21 | 0.63 | 0.84 | (0.43 | ) | ||||||||||||||||
2012 - R | 10.57 | 0.16 | 0.64 | 0.80 | �� | (0.23 | ) | |||||||||||||||
2011 - A | 11.71 | 0.28 | (f) | (1.25 | ) | (0.97 | ) | (0.12 | ) | |||||||||||||
2011 - B | 10.49 | 0.17 | (f) | (1.12 | ) | (0.95 | ) | (0.03 | ) | |||||||||||||
2011 - C | 10.63 | 0.17 | (f) | (1.12 | ) | (0.95 | ) | (0.04 | ) | |||||||||||||
2011 - Institutional | 12.24 | 0.25 | (f) | (1.22 | ) | (0.97 | ) | (0.16 | ) | |||||||||||||
2011 - IR | 11.70 | 0.17 | (f) | (1.06 | ) | (0.89 | ) | (0.11 | ) | |||||||||||||
2011 - R | 11.64 | 0.27 | (f) | (1.26 | ) | (0.99 | ) | (0.08 | ) | |||||||||||||
2010 - A | 10.55 | 0.10 | 1.19 | 1.29 | (0.13 | ) | ||||||||||||||||
2010 - B | 9.46 | 0.01 | 1.07 | 1.08 | (0.05 | ) | ||||||||||||||||
2010 - C | 9.59 | 0.01 | 1.09 | 1.10 | (0.06 | ) | ||||||||||||||||
2010 - Institutional | 11.02 | 0.10 | 1.28 | 1.38 | (0.16 | ) | ||||||||||||||||
2010 - IR | 10.54 | 0.12 | 1.19 | 1.31 | (0.15 | ) | ||||||||||||||||
2010 - R | 10.52 | 0.07 | 1.19 | 1.26 | (0.14 | ) | ||||||||||||||||
2009 - A | 9.01 | 0.14 | 1.77 | 1.91 | (0.38 | ) | ||||||||||||||||
2009 - B | 8.08 | 0.07 | 1.58 | 1.65 | (0.28 | ) | ||||||||||||||||
2009 - C | 8.17 | 0.07 | 1.61 | 1.68 | (0.27 | ) | ||||||||||||||||
2009 - Institutional | 9.42 | 0.19 | 1.84 | 2.03 | (0.44 | ) | ||||||||||||||||
2009 - IR | 9.03 | 0.17 | 1.76 | 1.93 | (0.43 | ) | ||||||||||||||||
2009 - R | 8.99 | 0.08 | 1.80 | 1.88 | (0.36 | ) | ||||||||||||||||
| (a) | Calculated based on the average shares outstanding methodology. |
| (b) | Assumes investment at the net asset value at the beginning of the period, reinvestment of all distributions, a complete redemption of the investment at the net asset value at the end of the period and no sales or redemption charges. Total returns would be reduced if a sales or redemption charge was taken into account. Returns do not reflect the deduction of taxes that a shareholder would pay on Fund distributions or the redemption of Fund shares. Total returns for periods less than one full year are not annualized. |
| (c) | The Fund’s portfolio turnover rate is calculated in accordance with regulatory requirements, without regard to transactions involving short term investments and certain derivatives. If such transactions were included, the Fund’s portfolio turnover rate may be higher. |
| (d) | Reflects income recognized from several corporate actions which amounted to $0.36 per share and 5.15% of average net assets. |
| (e) | Annualized. |
| (f) | Reflects income recognized from a corporate action which amounted to $0.14 per share and 1.22% of average net assets. |
| (g) | Total return reflects the impact of payments for regulatory settlements entitled to be received during the year and recorded as an increase to capital by the Fund. Excluding such payments, the total return would have been: |
| Class A | Class B | Class C | Institutional | Class IR | Class R | |||||||||||||||||||
For the Fiscal Year Ended October 31, 2009 | 22.37 | % | 21.40 | % | 21.31 | % | 22.76 | % | 22.57 | % | 22.02 | % | ||||||||||||
| 38 | The accompanying notes are an integral part of these financial statements. |
GOLDMAN SACHS STRATEGIC INTERNATIONAL EQUITY FUND
| Increase from regulatory settlements | Net asset value, end of period | Total return(b) | Net assets, (in 000s) | Ratio of net expenses to average net assets | Ratio of total expenses to average net assets | Ratio of to average net assets | Portfolio turnover rate(c) | |||||||||||||||||||||||||||||||||||||||
| $ | — | $ | 14.13 | 3.04 | % | $ | 24,602 | 1.34 | %(e) | 1.79 | %(e) | 5.38 | %(d)(e) | 49 | % | |||||||||||||||||||||||||||||||
| — | 12.63 | 2.73 | 1,977 | 2.10 | (e) | 2.53 | (e) | 4.25 | (d)(e) | 49 | ||||||||||||||||||||||||||||||||||||
| — | 12.77 | 2.73 | 5,483 | 2.09 | (e) | 2.54 | (e) | 4.53 | (d)(e) | 49 | ||||||||||||||||||||||||||||||||||||
| — | 14.75 | 3.30 | 46,297 | 0.94 | (e) | 1.40 | (e) | 5.87 | (d)(e) | 49 | ||||||||||||||||||||||||||||||||||||
| — | 14.15 | 3.24 | 67 | 1.09 | (e) | 1.54 | (e) | 5.61 | (d)(e) | 49 | ||||||||||||||||||||||||||||||||||||
| — | 14.20 | 2.99 | 17 | 1.60 | (e) | 2.04 | (e) | 5.10 | (d)(e) | 49 | ||||||||||||||||||||||||||||||||||||
| — | 13.81 | 27.11 | 23,850 | 1.47 | 1.87 | 1.16 | 102 | |||||||||||||||||||||||||||||||||||||||
| — | 12.30 | 26.15 | 2,518 | 2.22 | 2.62 | 0.41 | 102 | |||||||||||||||||||||||||||||||||||||||
| — | 12.45 | 26.06 | 5,700 | 2.22 | 2.62 | 0.37 | 102 | |||||||||||||||||||||||||||||||||||||||
| — | 14.44 | 27.63 | 41,058 | 1.07 | 1.47 | 1.51 | 102 | |||||||||||||||||||||||||||||||||||||||
| — | 13.84 | 27.37 | 65 | 1.22 | 1.62 | 1.49 | 102 | |||||||||||||||||||||||||||||||||||||||
| — | 13.88 | 26.72 | 17 | 1.72 | 2.11 | 0.61 | 102 | |||||||||||||||||||||||||||||||||||||||
| — | 11.06 | 8.17 | 21,854 | 1.45 | 1.95 | 1.91 | 119 | |||||||||||||||||||||||||||||||||||||||
| — | 9.88 | 7.41 | 3,203 | 2.20 | 2.70 | 1.00 | 119 | |||||||||||||||||||||||||||||||||||||||
| — | 10.01 | 7.35 | 5,147 | 2.20 | 2.70 | 1.01 | 119 | |||||||||||||||||||||||||||||||||||||||
| — | 11.58 | 8.58 | 23,684 | 1.05 | 1.51 | 1.68 | 119 | |||||||||||||||||||||||||||||||||||||||
| — | 11.11 | 8.42 | 79 | 1.20 | 1.68 | 2.01 | 119 | |||||||||||||||||||||||||||||||||||||||
| — | 11.14 | 7.87 | 7 | 1.70 | 2.19 | 1.49 | 119 | |||||||||||||||||||||||||||||||||||||||
| — | 10.62 | (8.40 | ) | 41,862 | 1.45 | 1.78 | 2.36 | (f) | 139 | |||||||||||||||||||||||||||||||||||||
| — | 9.51 | (9.08 | ) | 4,344 | 2.20 | 2.53 | 1.57 | (f) | 139 | |||||||||||||||||||||||||||||||||||||
| — | 9.64 | (9.00 | ) | 6,643 | 2.20 | 2.53 | 1.63 | (f) | 139 | |||||||||||||||||||||||||||||||||||||
| — | 11.11 | (8.04 | ) | 6,416 | 1.05 | 1.38 | 2.02 | (f) | 139 | |||||||||||||||||||||||||||||||||||||
| — | 10.70 | (7.69 | ) | 56 | 1.20 | 1.53 | 1.56 | (f) | 139 | |||||||||||||||||||||||||||||||||||||
| — | 10.57 | (8.61 | ) | 7 | 1.70 | 2.03 | 2.30 | (f) | 139 | |||||||||||||||||||||||||||||||||||||
| — | 11.71 | 12.34 | 60,561 | 1.45 | 1.71 | 0.89 | 121 | |||||||||||||||||||||||||||||||||||||||
| — | 10.49 | 11.44 | 6,814 | 2.20 | 2.46 | 0.12 | 121 | |||||||||||||||||||||||||||||||||||||||
| — | 10.63 | 11.48 | 8,845 | 2.20 | 2.46 | 0.13 | 121 | |||||||||||||||||||||||||||||||||||||||
| — | 12.24 | 12.69 | 21,434 | 1.05 | 1.31 | 0.90 | 121 | |||||||||||||||||||||||||||||||||||||||
| — | 11.70 | 12.55 | 7 | 1.20 | 1.46 | 1.13 | 121 | |||||||||||||||||||||||||||||||||||||||
| — | 11.64 | 12.06 | 28 | 1.70 | 1.96 | 0.67 | 121 | |||||||||||||||||||||||||||||||||||||||
| 0.01 | 10.55 | 22.50 | (g) | 55,454 | 1.45 | 1.98 | 1.52 | 133 | ||||||||||||||||||||||||||||||||||||||
| 0.01 | 9.46 | 21.58 | (g) | 8,958 | 2.20 | 2.73 | 0.93 | 133 | ||||||||||||||||||||||||||||||||||||||
| 0.01 | 9.59 | 21.47 | (g) | 9,520 | 2.20 | 2.73 | 0.92 | 133 | ||||||||||||||||||||||||||||||||||||||
| 0.01 | 11.02 | 22.91 | (g) | 6,408 | 1.05 | 1.58 | 2.02 | 133 | ||||||||||||||||||||||||||||||||||||||
| 0.01 | 10.54 | 22.71 | (g) | 6 | 1.20 | 1.73 | 1.88 | 133 | ||||||||||||||||||||||||||||||||||||||
| 0.01 | 10.52 | 22.07 | (g) | 33 | 1.70 | 2.23 | 0.81 | 133 | ||||||||||||||||||||||||||||||||||||||
| The accompanying notes are an integral part of these financial statements. | 39 |
GOLDMAN SACHS FUNDAMENTAL INTERNATIONAL EQUITY FUNDS
Notes to Financial Statements
April 30, 2014
| 1. ORGANIZATION |
Goldman Sachs Trust (the “Trust”) is a Delaware statutory trust registered under the Investment Company Act of 1940, as amended (the “Act”), as an open-end management investment company. The following table lists those series of the Trust that are included in this report (collectively, the “Funds” or individually a “Fund”), along with their corresponding share classes and respective diversification status under the Act:
| Fund | Share Classes Offered* | Diversified/ Non-diversified | ||
Focused International Equity+ and International Small Cap | A, B, C, Institutional, Service and IR | Diversified | ||
Strategic International Equity | A, B, C, Institutional, IR and R | Diversified |
| + | Formerly, Goldman Sachs Concentrated International Equity Fund. Effective at the close of business on February 28, 2014, the Fund changed its name to the Goldman Sachs Focused International Equity Fund. |
| * | Class B Shares are generally no longer available for purchase by current or prospective investors. |
Class A Shares are sold with a front-end sales charge of up to 5.50%. Class B Shares were sold with a contingent deferred sales charge (“CDSC”) that declines from 5.00% to zero, depending upon the period of time the shares are held. Class C Shares are sold with a CDSC of 1.00%, which is imposed on redemptions made within 12 months of purchase. Institutional, Service, Class IR and Class R Shares are not subject to a sales charge.
Goldman Sachs Asset Management International (“GSAMI”), an affiliate of Goldman, Sachs & Co. (“Goldman Sachs”), serves as investment adviser to the Funds pursuant to a management agreement (the “Agreement”) with the Trust.
| 2. SIGNIFICANT ACCOUNTING POLICIES |
The financial statements have been prepared in accordance with accounting principles generally accepted in the United States of America (“GAAP”) and require management to make estimates and assumptions that may affect the reported amounts and disclosures. Actual results may differ from those estimates and assumptions.
A. Investment Valuation — The Funds’ valuation policy is to value investments at fair value.
B. Investment Income and Investments — Investment income includes interest income and dividend income, net of any foreign withholding taxes, less any amounts reclaimable. Interest income is accrued daily and adjusted for amortization of premiums and accretion of discounts. Dividend income is recognized on ex-dividend date or, for certain foreign securities, as soon as such information is obtained subsequent to the ex-dividend date. Investment transactions are reflected on trade date. Realized gains and losses are calculated using identified cost. Investment transactions are recorded on the following business day for daily net asset value (“NAV”) calculations. Any foreign capital gains tax is accrued daily based upon net unrealized gains, and is payable upon sale of such investments.
For derivative contracts, realized gains and losses are recorded upon settlement of the contract.
C. Class Allocations and Expenses — Investment income, realized and unrealized gain (loss), and non-class specific expenses of each Fund are allocated daily based upon the proportion of net assets of each class. Class specific expenses, where applicable, are borne by the respective share classes and include Distribution and Service, Transfer Agent and Service and Shareholder Administration fees. Non-class specific expenses directly incurred by a Fund are charged to that Fund, while such expenses incurred by the Trust are allocated across the respective Funds on a straight-line and/or pro-rata basis depending upon the nature of the expenses.
D. Federal Taxes and Distributions to Shareholders — It is each Fund’s policy to comply with the requirements of the Internal Revenue Code of 1986, as amended (the “Code”), applicable to regulated investment companies (mutual funds) and to distribute each year substantially all of its investment company taxable income and capital gains to its shareholders. Accordingly,
40
GOLDMAN SACHS FUNDAMENTAL INTERNATIONAL EQUITY FUNDS
| 2. SIGNIFICANT ACCOUNTING POLICIES (continued) |
the Funds are not required to make any provisions for the payment of federal income tax. Distributions to shareholders are recorded on the ex-dividend date. Income and capital gains distributions, if any, are declared and paid annually.
Net capital losses are carried forward to future fiscal years and may be used to the extent allowed by the Code to offset any future capital gains. Utilization of capital loss carryforwards will reduce the requirement of future capital gains distributions.
Under the Regulated Investment Company Modernization Act of 2010, the Funds are permitted to carry forward capital losses incurred in taxable years beginning after December 22, 2010 for an unlimited period. However, any losses incurred during those future taxable years will be required to be utilized prior to the losses incurred in pre-enactment taxable years. As a result of this ordering rule, pre-enactment capital loss carryforwards may be more likely to expire unused. Additionally, post-enactment capital losses that are carried forward will retain their character as either short-term or long-term capital losses rather than being considered all short-term as under previous law.
The characterization of distributions to shareholders for financial reporting purposes is determined in accordance with federal income tax rules, which may differ from GAAP. The source of each Fund’s distributions may be shown in the accompanying financial statements as either from net investment income, net realized gain or capital. Certain components of the Funds’ net assets on the Statements of Assets and Liabilities reflect permanent GAAP/tax differences based on the appropriate tax character.
E. Foreign Currency Translation — The accounting records and reporting currency of the Funds are maintained in United States (“U.S.”) dollars. Assets and liabilities denominated in foreign currencies are translated into U.S. dollars using the current exchange rates at the close of each business day. The effect of changes in foreign currency exchange rates on investments is included within net realized and unrealized gain (loss) on investments. Changes in the value of other assets and liabilities as a result of fluctuations in foreign exchange rates are included in the Statements of Operations within net change in unrealized gain (loss) on foreign currency transactions. Transactions denominated in foreign currencies are translated into U.S. dollars on the date the transaction occurred, the effects of which are included within net realized gain (loss) on foreign currency transactions.
| 3. INVESTMENTS AND FAIR VALUE MEASUREMENTS |
The fair value of a financial instrument is the amount that would be received to sell an asset or paid to transfer a liability in an orderly transaction between market participants at the measurement date (i.e., the exit price). GAAP establishes a fair value hierarchy that prioritizes the inputs to valuation techniques used to measure fair value. The hierarchy gives the highest priority to unadjusted quoted prices in active markets for identical assets or liabilities (Level 1 measurements) and the lowest priority to unobservable inputs (Level 3 measurements). The levels used for classifying investments are not necessarily an indication of the risk associated with investing in these investments. The three levels of the fair value hierarchy are described below:
Level 1 — Unadjusted quoted prices in active markets that are accessible at the measurement date for identical, unrestricted assets or liabilities;
Level 2 — Quoted prices in markets that are not active or financial instruments for which significant inputs are observable (including, but not limited to, quoted prices for similar investments, interest rates, foreign exchange rates, volatility and credit spreads), either directly or indirectly;
Level 3 — Prices or valuations that require significant unobservable inputs (including GSAMI’s assumptions in determining fair value measurement).
The Trustees have adopted Valuation Procedures that govern the valuation of the portfolio investments held by the Funds, including investments for which market quotations are not readily available. The Trustees have delegated to GSAMI day-to-day responsibility for implementing and maintaining internal controls and procedures related to the valuation of the Funds’ portfolio investments. To assess the continuing appropriateness of pricing sources and methodologies, GSAMI regularly performs price verification procedures and issues challenges as necessary to third party pricing vendors or brokers, and any differences are reviewed in accordance with the Valuation Procedures.
41
GOLDMAN SACHS FUNDAMENTAL INTERNATIONAL EQUITY FUNDS
Notes to Financial Statements (continued)
April 30, 2014
| 3. INVESTMENTS AND FAIR VALUE MEASUREMENTS (continued) |
A. Level 1 and Level 2 Fair Value Investments — The valuation techniques and significant inputs used in determining the fair values for investments classified as Level 1 and Level 2 are as follows:
Equity Securities — Equity securities and investment companies traded on a U.S. securities exchange or the NASDAQ system, or those located on certain foreign exchanges, including but not limited to the Americas, are valued daily at their last sale price or official closing price on the principal exchange or system on which they are traded. If no sale occurs, equity securities and exchange traded investment companies are valued at the last bid price for long positions and at the last ask price for short positions. Investments in investment companies (other than those that are exchange traded) are valued at the NAV on the valuation date. To the extent these investments are actively traded, they are classified as Level 1 of the fair value hierarchy, otherwise they are generally classifies as Level 2.
Unlisted equity securities for which market quotations are available are valued at the last sale price on the valuation date, or if no sale occurs, at the last bid price. Securities traded on certain foreign securities exchanges are valued daily at fair value determined by an independent fair value service (if available) under Valuation Procedures approved by the Trustees and consistent with applicable regulatory guidance. The independent fair value service takes into account multiple factors including, but not limited to, movements in the securities markets, certain depositary receipts, futures contracts and foreign currency exchange rates that have occurred subsequent to the close of the foreign securities exchange. These investments are generally classified as Level 2 of the fair value hierarchy.
Debt Securities — Debt securities for which market quotations are readily available are valued daily on the basis of quotations supplied by dealers or an independent pricing service approved by the Trustees. The pricing services may use valuation models or matrix pricing, which consider: (i) yield or price with respect to bonds that are considered comparable in characteristics such as rating, interest rate and maturity date or (ii) quotations from securities dealers to determine current value. Short-term debt obligations that mature in sixty days or less and that do not exhibit signs of credit deterioration are valued at amortized cost, which approximates fair value. With the exception of treasury securities of G8 countries (not held in money market funds), which are generally classified as Level 1, these investments are generally classified as Level 2 of the fair value hierarchy.
Derivative Contracts — A derivative is an instrument whose value is derived from underlying assets, indices, reference rates or a combination of these factors.
Exchange-traded derivatives, including futures contracts, typically fall within Level 1 of the fair value hierarchy.
i. Futures Contracts — Futures contracts are contracts to buy or sell a standardized quantity of a specified commodity or security and are valued based on exchanged settlement prices or independent market quotes. Futures contracts are valued at the last settlement price, or in the absence of a sale, the last bid price for long positions and at the last ask price for short positions, at the end of each day on the board of trade or exchange upon which they are traded. Upon entering into a futures contract, a Fund deposits cash or securities in an account on behalf of the broker in an amount sufficient to meet the initial margin requirement. Subsequent payments are made or received by a Fund equal to the daily change in the contract value and are recorded as variation margin receivable or payable with a corresponding offset to unrealized gains or losses.
B. Level 3 Fair Value Investments — To the extent that the aforementioned significant inputs are unobservable, or if quotations are not readily available, or if GSAMI believes that such quotations do not accurately reflect fair value, the fair value of the Funds’ investments may be determined under Valuation Procedures approved by the Trustees. GSAMI, consistent with its procedures and applicable regulatory guidance, may make an adjustment to the most recent valuation prices of either domestic or foreign securities in light of significant events to reflect what it believes to be the fair value of the securities at the time of determining a Fund’s NAV. Significant events which could affect a large number of securities in a particular market may include, but are not limited to: significant fluctuations in U.S. or foreign markets; market dislocations; market disruptions; or unscheduled market closings. Significant events which could also affect a single issuer may include, but are not limited to: corporate actions such as reorganizations, mergers and buy-outs; ratings downgrades; and bankruptcies.
42
GOLDMAN SACHS FUNDAMENTAL INTERNATIONAL EQUITY FUNDS
| 3. INVESTMENTS AND FAIR VALUE MEASUREMENTS (continued) |
C. Fair Value Hierarchy — The following is a summary of the Funds’ investments and derivatives classified in the fair value hierarchy as of April 30, 2014:
| FOCUSED INTERNATIONAL EQUITY | ||||||||||||
| Investment Type | Level 1 | Level 2 | Level 3 | |||||||||
| Assets | ||||||||||||
Common Stock and/or Other Equity Investments | ||||||||||||
Asia, Australia, and Europe | $ | 1,924,939 | $ | 271,184,269 | (a) | $ | — | |||||
| INTERNATIONAL SMALL CAP | ||||||||||||
| Investment Type | Level 1 | Level 2 | Level 3 | |||||||||
| Assets | ||||||||||||
Common Stock and/or Other Equity Investments | ||||||||||||
North and South America | $ | 18,627,174 | $ | — | $ | — | ||||||
Asia, Australia, and Europe | 5,202,911 | 181,039,105 | (a) | — | ||||||||
| Total | $ | 23,830,085 | $ | 181,039,105 | $ | — | ||||||
| Derivative Type | ||||||||||||
| Assets(b) | ||||||||||||
| Futures Contracts | $ | 31,743 | $ | — | $ | — | ||||||
| STRATEGIC INTERNATIONAL EQUITY | ||||||||||||
| Investment Type | Level 1 | Level 2 | Level 3 | |||||||||
| Assets | ||||||||||||
Common Stock and/or Other Equity Investments | ||||||||||||
Asia, Australia, and Europe | $ | 2,994,118 | $ | 73,796,473 | (a) | $ | — | |||||
| (a) | To adjust for the time difference between local market close and the calculation of net asset value, the Funds utilize fair value model prices for certain international equities provided by an independent fair value service resulting in a Level 2 classification. |
| (b) | Amount shown represents unrealized gain at period end. |
For further information regarding security characteristics, see the Schedules of Investments.
| 4. INVESTMENTS IN DERIVATIVES |
The following table sets forth, by certain risk types, the gross value of derivative contracts as of April 30, 2014. These instruments were used to meet the Fund’s investment objectives and to obtain and/or manage exposure related to the risks below. The values in the table below exclude the effects of cash collateral received or posted pursuant to these derivative contracts, and therefore are not representative of the Fund’s net exposure:
| Fund | Risk | Statements of Assets and Liabilities | Assets | |||||||
International Small Cap | Equity | Variation margin on certain derivative contracts | $ | 31,743 | (a) | |||||
| (a) | Includes unrealized gain (loss) on futures contracts described in the Additional Investment Information sections of the Schedules of Investments. Only current day’s variation margin is reported within the Statement of Assets and Liabilities. |
43
GOLDMAN SACHS FUNDAMENTAL INTERNATIONAL EQUITY FUNDS
Notes to Financial Statements (continued)
April 30, 2014
| 4. INVESTMENTS IN DERIVATIVES (continued) |
The following table sets forth, by certain risk types, the Funds’ gains (losses) related to these derivatives and their indicative volumes for the six months ended April 30, 2014. These gains (losses) should be considered in the context that these derivative contracts may have been executed to create investment opportunities and/or economically hedge certain investments, and accordingly, certain gains (losses) on such derivative contracts may offset certain (losses) gains attributable to investments. These gains (losses) are included in “Net realized gain (loss)” or “Net change in unrealized gain (loss)” on the Statements of Operations:
| Fund | Risk | Statements of Operations | Net Realized Gain (Loss) | Net Change in Unrealized Gain (Loss) | Average Number of Contracts(a) | |||||||||||
Focused International Equity | Equity | Net realized gain (loss) from futures contracts/Net change in unrealized gain (loss) on futures contracts | $ | (523 | ) | $ | — | 1 | ||||||||
International Small Cap | Equity | Net realized gain (loss) from futures contracts/Net change in unrealized gain (loss) on futures contracts | 2,357 | 30,904 | 93 | |||||||||||
| (a) | Average number of contracts is based on the average of month end balances for the period ended April 30, 2014. |
| 5. AGREEMENTS AND AFFILIATED TRANSACTIONS |
A. Management Agreement — Under the Agreement, GSAMI manages the Funds, subject to the general supervision of the Trustees.
As compensation for the services rendered pursuant to the Agreement, the assumption of the expenses related thereto and administration of the Funds’ business affairs, including providing facilities, GSAMI is entitled to a management fee, accrued daily and paid monthly, equal to an annual percentage rate of each Fund’s average daily net assets.
For the six months ended April 30, 2014, contractual and effective net management fees with GSAMI were at the following rates:
| Contractual Management Fee Rate | Effective Net Management Fee Rate | |||||||||||||||||||||||||||||
| Fund | First $1 billion | Next $1 billion | Next $3 billion | Next $3 billion | Over $8 billion | Effective Rate | ||||||||||||||||||||||||
Focused International Equity | 1.00 | % | 0.90 | % | 0.86 | % | 0.84 | % | 0.82 | % | 1.00 | % | 0.88 | %* | ||||||||||||||||
International Small Cap | 1.10 | 1.10 | 0.99 | 0.94 | 0.92 | 1.10 | 1.08 | * | ||||||||||||||||||||||
Strategic International Equity | 0.85 | 0.77 | 0.73 | 0.72 | 0.71 | 0.85 | 0.85 | |||||||||||||||||||||||
| * | GSAMI agreed to waive a portion of its management fee in order to achieve an effective net management fee rate of 0.85% and 1.08% for the Focused International Equity and International Small Cap Funds, respectively, through at least February 28, 2015. Prior to such date, GSAMI may not terminate the arrangement without the approval of the trustees. Prior to January 1, 2014, the effective net management fee rate for the Focused International Equity Fund was 0.94%. |
B. Distribution and Service Plans — The Trust, on behalf of each Fund, has adopted Distribution and Service Plans (the “Plans”). Under the Plans, Goldman Sachs, which serves as distributor (the “Distributor”), is entitled to a fee accrued daily and paid monthly, for distribution services and personal and account maintenance services, which may then be paid by Goldman Sachs to authorized dealers, at the following annual rates calculated on a Fund’s average daily net assets of each respective share class:
| Distribution and Service Plan Rates | ||||||||||||||||
| Class A* | Class B | Class C | Class R* | |||||||||||||
Distribution Plan | 0.25 | % | 0.75 | % | 0.75 | % | 0.50 | % | ||||||||
Service Plan | — | 0.25 | 0.25 | — | ||||||||||||
| * | With respect to Class A and Class R Shares, the Distributor at its discretion may use compensation for distribution services paid under the Distribution Plan to compensate service organizations for personal and account maintenance services and expenses as long as such total compensation does not exceed the maximum cap on “service fees” imposed by the Financial Industry Regulatory Authority. |
44
GOLDMAN SACHS FUNDAMENTAL INTERNATIONAL EQUITY FUNDS
| 5. AGREEMENTS AND AFFILIATED TRANSACTIONS (continued) |
C. Distribution Agreement — Goldman Sachs, as Distributor of the shares of the Funds pursuant to a Distribution Agreement, may retain a portion of the Class A front end sales charge and Class B and Class C Shares’ CDSC. During the six months ended April 30, 2014, Goldman Sachs advised that it retained the following amounts:
| Front End Sales Charge | Contingent Deferred Sales Charge* | |||||||||
| Fund | Class A | Class C | ||||||||
Focused International Equity | $ | 7,821 | $ | 336 | ||||||
International Small Cap | 1,581 | — | ||||||||
Strategic International Equity | 1,780 | — | ||||||||
| * | Goldman Sachs did not retain any contingent deferred sales charges for Class B Shares. |
D. Service Plan and Shareholder Administration Plan — The Trust, on behalf of each Fund that offers Service Shares, has adopted a Service Plan and a Shareholder Administration Plan. These plans allow for service organizations to provide varying levels of personal and account maintenance and shareholder administration services to their customers who are beneficial owners of such shares. The Service Plan and Shareholder Administration Plan each provide for compensation to the service organizations which is accrued daily and paid monthly at an annual rate of 0.25% (0.50% in aggregate) of the average daily net assets of the Service Shares.
E. Transfer Agency Agreement — Goldman Sachs also serves as the transfer agent of the Funds for a fee pursuant to Transfer Agency Agreement. The fees charged for such transfer agency services are accrued daily and paid monthly at annual rates as follows: 0.19% of the average daily net assets of Class A, Class B, Class C, Class IR and Class R Shares; and 0.04% of the average daily net assets of Institutional and Service Shares.
F. Other Expense Agreements and Affiliated Transactions — GSAMI has agreed to limit certain “Other Expense” of the Funds (excluding transfer agent fees and expenses, service fees and shareholder administration fees (as applicable), taxes, interest, brokerage fees, shareholder meetings, litigation, indemnification, and other extraordinary expenses) to the extent such expenses exceed, on an annual basis, a percentage rate of the average daily net assets of each Fund. Such Other Expense reimbursements, if any, are accrued daily and paid monthly. In addition, the Funds are not obligated to reimburse GSAMI for prior fiscal year expense reimbursements, if any. The Other Expense limitations as an annual percentage rate of average daily net assets for the Focused International Equity, International Small Cap and Strategic International Equity Funds are 0.014%, 0.034% and 0.014%, respectively. Prior to January 1, 2014, the Other Expense limitation was 0.064% and 0.164% for the Focused International Equity and Strategic International Equity Funds, respectively. These Other Expense limitations will remain in place through at least February 28, 2015, and prior to such date GSAMI may not terminate the arrangements without the approval of the Trustees. The Funds bear their respective share of costs related to proxy and shareholder meetings, and GSAMI has agreed to reimburse each Fund to the extent such expense exceed a specified percentage of the Fund’s net assets. In addition, the Funds have entered into certain offset arrangements with the custodian and the transfer agent, which may result in a reduction of the Funds’ expenses and are received irrespective of the application of the “Other Expense” limitations described above.
For the six months ended April 30, 2014, these expense reductions, including any fee waivers and Other Expense reimbursements, were as follows:
| Fund | Management Fee Waiver | Custody Fee Credits | Other Expense | Total Expense | ||||||||||||||
Focused International Equity | $ | 147,499 | $ | 1,645 | $ | 192,209 | $ | 341,353 | ||||||||||
International Small Cap | 20,064 | 2,876 | 194,175 | 217,115 | ||||||||||||||
Strategic International Equity | — | 395 | 167,967 | 168,362 | ||||||||||||||
45
GOLDMAN SACHS FUNDAMENTAL INTERNATIONAL EQUITY FUNDS
Notes to Financial Statements (continued)
April 30, 2014
| 5. AGREEMENTS AND AFFILIATED TRANSACTIONS (continued) |
As of April 30, 2014, the amounts owed to affiliates of the Funds were as follows:
| Fund | Management Fees | Distribution and Service Fees | Transfer Agent Fees | Total | ||||||||||||||
Focused International Equity | $ | 193,227 | $ | 30,902 | $ | 20,473 | $ | 244,602 | ||||||||||
International Small Cap | 187,128 | 6,661 | 9,740 | 203,529 | ||||||||||||||
Strategic International Equity | 53,693 | 11,164 | 6,463 | 71,320 | ||||||||||||||
G. Line of Credit Facility — As of April 30, 2014, the Funds participated in a $780,000,000 committed, unsecured revolving line of credit facility (the “facility”) together with other funds of the Trust and registered investment companies having management agreements with GSAMI or its affiliates (“Other Borrowers”). Pursuant to the terms of the facility, the Funds and Other Borrowers could increase the credit amount by an additional $220,000,000, for a total of up to $1,000,000,000. This facility is to be used solely for temporary or emergency purposes, which may include the funding of redemptions. The interest rate on borrowings is based on the federal funds rate. The facility also requires a fee to be paid by the Funds based on the amount of the commitment that has not been utilized. For the six months ended April 30, 2014, the Funds did not have any borrowings under the facility. The facility was increased to $1,080,000,000 effective May 6, 2014.
H. Other Transactions with Affiliates — For the six months ended April 30, 2014. Goldman Sachs earned $958 and $272 in brokerage commissions from portfolio transactions, including futures transactions executed with Goldman Sachs as the Futures Commission Merchant, on behalf of the Focused International Equity, and International Small Cap, respectively.
As of April 30, 2014, the Goldman Sachs Satellite Strategies Portfolio was the beneficial owner of 32% or more of the total outstanding shares of the International Small Cap Fund.
As of April 30, 2014, the Goldman Sachs Group, Inc. was the beneficial owner of approximately 14% and 53% of the Class IR and Class R Shares of the Strategic International Equity Fund, respectively.
| 6. PORTFOLIO SECURITIES TRANSATIONS |
The cost of purchases and proceeds from sales and maturities of long-term securities for the six months ended April 30, 2014, were as follows:
| Fund | Purchases | Sales and Maturities | ||||||||
Focused International Equity | $ | 210,272,264 | $ | 122,531,945 | ||||||
International Small Cap | 103,566,597 | 93,009,615 | ||||||||
Strategic International Equity | 40,391,970 | 36,234,061 | ||||||||
46
GOLDMAN SACHS FUNDAMENTAL INTERNATIONAL EQUITY FUNDS
| 7. TAX INFORMATION |
As of the Fund’s most recent fiscal year end, October 31, 2013, the Funds’ capital loss carryforwards on a tax-basis were as follows:
Focused Equity | International Small Cap | Strategic International Equity | ||||||||||
Capital loss carryforwards:(1) | ||||||||||||
Expiring 2016 | $ | (99,325,971 | ) | $ | (6,313,340 | ) | $ | (21,286,348 | ) | |||
Expiring 2017 | (106,107,378 | ) | (19,170,113 | ) | (28,233,535 | ) | ||||||
Expiring 2019 | (9,250,431 | ) | — | — | ||||||||
Total capital loss carryforwards | $ | (214,683,780 | ) | $ | (25,483,453 | ) | $ | (49,519,883 | ) | |||
| (1) | Expiration occurs on October 31 of the year indicated. |
As of April 30, 2014, the Funds’ aggregate security unrealized gains and losses based on cost for U.S. federal income tax purposes were as follows:
Focused Equity | International Small Cap | Strategic International Equity | ||||||||||
Tax cost | $ | 271,329,131 | $ | 188,176,856 | $ | 70,247,109 | ||||||
Gross unrealized gain | 11,969,820 | 22,996,325 | 9,119,911 | |||||||||
Gross unrealized loss | (10,189,743 | ) | (6,303,991 | ) | (2,576,429 | ) | ||||||
Net unrealized security gain | $ | 1,780,077 | $ | 16,692,334 | $ | 6,543,482 | ||||||
The difference between GAAP-basis and tax-basis unrealized gains (losses) is attributable primarily to wash sales and differences related to the tax treatment of passive foreign investment company investments.
GSAMI has reviewed the Funds’ tax positions for all open tax years (the current and prior three years, as applicable) and has concluded that no provision for income tax is required in the Funds’ financial statements. Such open tax years remain subject to examination and adjustment by tax authorities.
| 8. OTHER RISKS |
The Funds’ risks include, but are not limited to, the following:
Foreign Custody Risk — A Fund that invests in foreign securities may hold such securities and foreign currency with foreign banks, agents, and securities depositories appointed by the Fund’s custodian (each a “Foreign Custodian”). In some countries, Foreign Custodians may be subject to little or no regulatory oversight or independent evaluation of their operations. Further, the laws of certain countries may place limitations on a Fund’s ability to recover its assets if a Foreign Custodian enters into bankruptcy. Investments in emerging markets may be subject to greater custody risks than investments in more developed markets. Custody services in emerging market countries are often undeveloped and may be less regulated than in more developed countries, and thus may not afford the same level of investor protection as would apply in developed countries.
Shareholder Concentration Risk — Certain funds, accounts, individuals or Goldman Sachs affiliates may from time to time own (beneficially or of record) or control a significant percentage of the Funds’ shares. Redemptions by these entities of their holdings in the Funds may impact the Funds’ liquidity and NAV. These redemptions may also force the Funds to sell securities.
47
GOLDMAN SACHS FUNDAMENTAL INTERNATIONAL EQUITY FUNDS
Notes to Financial Statements (continued)
April 30, 2014
| 8. OTHER RISKS (continued) |
Issuer Concentration Risk — The Focused International Equity Fund intends to invest in a relatively small number of issuers. As a result, it may be subject to greater risks than a fund that invests in a greater number of issuers. A change in the value of any single investment held by the Fund may affect the overall value of the Fund more than it would affect a mutual fund that holds more investments. In particular, the Fund may be more susceptible to adverse developments affecting any single issuer in the Fund and may be susceptible to greater losses because of these developments.
Investments in Other Investment Companies — As a shareholder of another investment company, including an exchange traded fund (“ETF”), a Fund will directly bear its proportionate share of any management fees and other expenses paid by such other investment companies, in addition to the fees and expenses regularly borne by the Fund. ETFs are subject to risks that do not apply to conventional mutual funds, including but not limited to the following: (i) the market price of the ETF’s shares may trade at a premium or a discount to their NAV; and (ii) an active trading market for an ETF’s shares may not develop or be maintained.
Liquidity Risk — The Funds may make investments that are illiquid or that may become less liquid in response to market developments or adverse investor perceptions. Illiquid investments may be more difficult to value. Liquidity risk may also refer to the risk that a Fund will not be able to pay redemption proceeds within the allowable time period because of unusual market conditions, an unusually high volume of redemption requests, or other reasons. To meet redemption requests, a Fund may be forced to sell investments at an unfavorable time and/or under unfavorable conditions.
Market and Credit Risks — In the normal course of business, the Funds trade financial instruments and enter into financial transactions where risk of potential loss exists due to changes in the market (market risk). Additionally, the Funds may also be exposed to credit risk in the event that an issuer or guarantor fails to perform or that an institution or entity with which the Funds have unsettled or open transactions defaults.
Investing in foreign markets may involve special risks and considerations not typically associated with investing in the U.S. Foreign securities may be subject to risk of loss because of more or less foreign government regulation, less public information and less economic, political and social stability in the countries in which the Fund invests. Loss may also result from the imposition of exchange controls, confiscations and other government restrictions by the U.S. or other governments, or from problems in registration, settlement or custody. Foreign risk also involves the risk of negative foreign currency rate fluctuations, which may cause the value of securities denominated in such foreign currency (or other instruments through which the Fund has exposure to foreign currencies) to decline in value. Currency exchange rates may fluctuate significantly over short periods of time. To the extent that the Fund also invests in securities of issuers located in emerging markets, these risks may be more pronounced.
| 9. INDEMNIFICATIONS |
Under the Trust’s organizational documents, its Trustees, officers, employees and agents are indemnified, to the extent permitted by the Act and state law, against certain liabilities that may arise out of performance of their duties to the Funds. Additionally, in the course of business, the Funds enter into contracts that contain a variety of indemnification clauses. The Funds’ maximum exposure under these arrangements is unknown, as this would involve future claims that may be made against the Funds that have not yet occurred. However, GSAMI believes the risk of loss under these arrangements to be remote.
| 10. SUBSEQUENT EVENTS |
Subsequent events after the Statement of Assets and Liabilities date have been evaluated through the date the financial statements were issued. GSAMI has concluded that there is no impact requiring adjustment or disclosure in the financial statements.
Effective on July 1, 2014, GSAMI agreed to waive a portion of its management fee in order to achieve an effective net management fee rate of 0.90% as an annual percentage rate of the International Small Cap Fund’s average daily net assets.
48
GOLDMAN SACHS FUNDAMENTAL INTERNATIONAL EQUITY FUNDS
| 11. SUMMARY OF SHARE TRANSACTIONS |
Share activity is as follows:
| Focused International Equity Fund | ||||||||||||||||
|
| |||||||||||||||
For the Six Months Ended April 30, 2014 (Unaudited) | For the Fiscal Year Ended October 31, 2013 | |||||||||||||||
|
| |||||||||||||||
| Shares | Dollars | Shares | Dollars | |||||||||||||
|
| |||||||||||||||
| Class A Shares | ||||||||||||||||
Shares sold | 562,868 | $ | 11,211,112 | 378,015 | $ | 6,966,587 | ||||||||||
Shares converted from Class B(a) | 1,059 | 20,799 | 2,956 | 51,654 | ||||||||||||
Reinvestment of distributions | 11,140 | 220,455 | 91,194 | 1,418,987 | ||||||||||||
Shares redeemed | (239,150 | ) | (4,745,643 | ) | (784,048 | ) | (13,442,524 | ) | ||||||||
| 335,917 | 6,706,723 | (311,883 | ) | (5,005,296 | ) | |||||||||||
| Class B Shares | ||||||||||||||||
Shares sold | 1,969 | 37,924 | 1,571 | 27,933 | ||||||||||||
Shares converted to Class A(a) | (1,073 | ) | (20,799 | ) | (2,989 | ) | (51,654 | ) | ||||||||
Reinvestment of distributions | — | — | 1,140 | 17,595 | ||||||||||||
Shares redeemed | (8,490 | ) | (165,957 | ) | (23,376 | ) | (402,111 | ) | ||||||||
| (7,594 | ) | (148,832 | ) | (23,654 | ) | (408,237 | ) | |||||||||
| Class C Shares | ||||||||||||||||
Shares sold | 222,232 | 4,136,153 | 190,565 | 3,154,648 | ||||||||||||
Reinvestment of distributions | — | — | 23,511 | 343,499 | ||||||||||||
Shares redeemed | (90,853 | ) | (1,687,607 | ) | (215,028 | ) | (3,495,722 | ) | ||||||||
| 131,379 | 2,448,546 | (952 | ) | 2,425 | ||||||||||||
| Institutional Shares | ||||||||||||||||
Shares sold | 3,979,152 | 80,693,263 | 2,022,023 | 37,999,300 | ||||||||||||
Reinvestment of distributions | 45,024 | 905,437 | 132,560 | 2,095,772 | ||||||||||||
Shares redeemed | (346,804 | ) | (7,003,168 | ) | (511,677 | ) | (8,898,836 | ) | ||||||||
| 3,677,372 | 74,595,532 | 1,642,906 | 31,196,236 | |||||||||||||
| Service Shares | ||||||||||||||||
Shares sold | 815 | 16,340 | 493 | 7,740 | ||||||||||||
Reinvestment of distributions | 5 | 107 | 79 | 1,230 | ||||||||||||
Shares redeemed | (1,268 | ) | (25,138 | ) | (1,504 | ) | (25,605 | ) | ||||||||
| (448 | ) | (8,691 | ) | (932 | ) | (16,635 | ) | |||||||||
| Class IR Shares | ||||||||||||||||
Shares sold | 159,690 | 3,241,098 | 108,795 | 1,976,136 | ||||||||||||
Reinvestment of distributions | 706 | 14,137 | 788 | 12,406 | ||||||||||||
Shares redeemed | (23,714 | ) | (472,026 | ) | (32,209 | ) | (621,842 | ) | ||||||||
| 136,682 | 2,783,209 | 77,374 | 1,366,700 | |||||||||||||
NET INCREASE | 4,273,308 | $ | 86,376,487 | 1,382,859 | $ | 27,135,193 | ||||||||||
| (a) | Class B Shares convert into Class A Shares on or about the fifteenth day of the last month of the calendar quarter that is eight years after the initial purchase date of either the Fund or another Goldman Sachs Fund. |
49
GOLDMAN SACHS FUNDAMENTAL INTERNATIONAL EQUITY FUNDS
Notes to Financial Statements (continued)
April 30, 2014
| 11. SUMMARY OF SHARE TRANSACTIONS (continued) |
Share activity is as follows:
| International Small Cap Fund | ||||||||||||||||
|
| |||||||||||||||
For the Six Months Ended April 30, 2014 (Unaudited) | For the Fiscal Year Ended October 31, 2013 | |||||||||||||||
|
| |||||||||||||||
| Shares | Dollars | Shares | Dollars | |||||||||||||
|
| |||||||||||||||
| Class A Shares | ||||||||||||||||
Shares sold | 202,070 | $ | 3,917,643 | 268,667 | $ | 4,694,053 | ||||||||||
Shares converted from Class B(a) | 383 | 7,313 | 1,869 | 32,142 | ||||||||||||
Reinvestment of distributions | 11,580 | 217,128 | 5,193 | 78,988 | ||||||||||||
Shares redeemed | (92,071 | ) | (1,793,263 | ) | (242,021 | ) | (4,047,413 | ) | ||||||||
| 121,962 | 2,348,821 | 33,708 | 757,770 | |||||||||||||
| Class B Shares | ||||||||||||||||
Shares sold | 218 | 4,115 | 336 | 5,477 | ||||||||||||
Shares converted to Class A(a) | (388 | ) | (7,313 | ) | (1,903 | ) | (32,142 | ) | ||||||||
Reinvestment of distributions | 164 | 3,040 | 82 | 1,223 | ||||||||||||
Shares redeemed | (6,546 | ) | (124,254 | ) | (4,987 | ) | (81,934 | ) | ||||||||
| (6,552 | ) | (124,412 | ) | (6,472 | ) | (107,376 | ) | |||||||||
| Class C Shares | ||||||||||||||||
Shares sold | 40,074 | 746,088 | 25,108 | 434,622 | ||||||||||||
Reinvestment of distributions | 1,298 | 23,503 | 300 | 4,425 | ||||||||||||
Shares redeemed | (10,907 | ) | (204,283 | ) | (19,062 | ) | (303,130 | ) | ||||||||
| 30,465 | 565,308 | 6,346 | 135,917 | |||||||||||||
| Institutional Shares | ||||||||||||||||
Shares sold | 1,539,865 | 30,687,542 | 5,412,841 | 94,847,665 | ||||||||||||
Reinvestment of distributions | 168,944 | 3,252,168 | 64,742 | 1,009,328 | ||||||||||||
Shares redeemed | (1,322,187 | ) | (26,570,313 | ) | (1,137,755 | ) | (19,574,533 | ) | ||||||||
| 386,622 | 7,369,397 | 4,339,828 | 76,282,460 | |||||||||||||
| Service Shares | ||||||||||||||||
Shares sold | — | — | 375 | 6,040 | ||||||||||||
Reinvestment of distributions | 884 | 16,362 | 601 | 9,020 | ||||||||||||
Shares redeemed | (382 | ) | (7,173 | ) | — | — | ||||||||||
| 502 | 9,189 | 976 | 15,060 | |||||||||||||
| Class IR Shares | ||||||||||||||||
Shares sold | 148,011 | 2,998,358 | 35,017 | 593,219 | ||||||||||||
Reinvestment of distributions | 969 | 18,633 | 338 | 5,265 | ||||||||||||
Shares redeemed | (8,207 | ) | (164,396 | ) | (9,503 | ) | (168,336 | ) | ||||||||
| 140,773 | 2,852,595 | 25,852 | 430,148 | |||||||||||||
NET INCREASE | 673,772 | $ | 13,020,898 | 4,400,238 | $ | 77,513,979 | ||||||||||
| (a) | Class B Shares convert into Class A Shares on or about the fifteenth day of the last month of the calendar quarter that is eight years after the initial purchase date of either the Fund or another Goldman Sachs Fund. |
50
GOLDMAN SACHS FUNDAMENTAL INTERNATIONAL EQUITY FUNDS
| 11. SUMMARY OF SHARE TRANSACTIONS (continued) |
Share activity is as follows:
| Strategic International Equity Fund | ||||||||||||||||
|
| |||||||||||||||
For the Six Months Ended April 30, 2014 (Unaudited) | For the Fiscal Year Ended October 31, 2013 | |||||||||||||||
|
| |||||||||||||||
| Shares | Dollars | Shares | Dollars | |||||||||||||
|
| |||||||||||||||
| Class A Shares | ||||||||||||||||
Shares sold | 120,321 | $ | 1,654,238 | 154,622 | $ | 1,873,207 | ||||||||||
Shares converted from Class B(a) | 16,016 | 217,733 | 42,523 | 518,619 | ||||||||||||
Reinvestment of distributions | 13,124 | 178,224 | 32,705 | 366,299 | ||||||||||||
Shares redeemed | (135,191 | ) | (1,870,714 | ) | (478,751 | ) | (5,774,966 | ) | ||||||||
| 14,270 | 179,481 | (248,901 | ) | (3,016,841 | ) | |||||||||||
| Class B Shares | ||||||||||||||||
Shares sold | 641 | 7,954 | 7,600 | 81,587 | ||||||||||||
Shares converted to Class A(a) | (17,895 | ) | (217,733 | ) | (47,564 | ) | (518,619 | ) | ||||||||
Reinvestment of distributions | 87 | 1,060 | 4,050 | 40,625 | ||||||||||||
Shares redeemed | (30,975 | ) | (381,600 | ) | (83,416 | ) | (899,467 | ) | ||||||||
| (48,142 | ) | (590,319 | ) | (119,330 | ) | (1,295,874 | ) | |||||||||
| Class C Shares | ||||||||||||||||
Shares sold | 32,075 | 400,079 | 92,764 | 1,014,981 | ||||||||||||
Reinvestment of distributions | 605 | 7,442 | 6,073 | 61,707 | ||||||||||||
Shares redeemed | (61,081 | ) | (763,045 | ) | (155,235 | ) | (1,697,502 | ) | ||||||||
| (28,401 | ) | (355,524 | ) | (56,398 | ) | (620,814 | ) | |||||||||
| Institutional Shares | ||||||||||||||||
Shares sold | 447,611 | 6,439,852 | 1,125,983 | 14,712,297 | ||||||||||||
Reinvestment of distributions | 32,742 | 463,301 | 46,618 | 543,561 | ||||||||||||
Shares redeemed | (185,191 | ) | (2,642,071 | ) | (374,284 | ) | (4,792,796 | ) | ||||||||
| 295,162 | 4,261,082 | 798,317 | 10,463,062 | |||||||||||||
| Class IR Shares | ||||||||||||||||
Shares sold | — | — | 1,327 | 14,860 | ||||||||||||
Reinvestment of distributions | 46 | 623 | 173 | 1,935 | ||||||||||||
Shares redeemed | — | — | (3,908 | ) | (47,428 | ) | ||||||||||
| 46 | 623 | (2,408 | ) | (30,633 | ) | |||||||||||
| Class R Shares | ||||||||||||||||
Shares sold | 4 | 53 | 584 | 7,575 | ||||||||||||
Reinvestment of distributions | 4 | 58 | 11 | 121 | ||||||||||||
Shares redeemed | — | — | (7 | ) | (91 | ) | ||||||||||
| 8 | 111 | 588 | 7,605 | |||||||||||||
NET INCREASE | 232,943 | $ | 3,495,454 | 371,868 | $ | 5,506,505 | ||||||||||
| (a) | Class B Shares convert into Class A Shares on or about the fifteenth day of the last month of the calendar quarter that is eight years after the initial purchase date of either the Fund or another Goldman Sachs Fund. |
51
GOLDMAN SACHS FUNDAMENTAL INTERNATIONAL EQUITY FUNDS
Fund Expenses — Six Month Period Ended April 30, 2014 (Unaudited)
As a shareholder of Class A, Class B, Class C, Institutional, Service, Class IR or Class R Shares of a Fund you incur two types of costs: (1) transaction costs, including sales charges on purchase payments (with respect to Class A Shares) and contingent deferred sales charges on redemptions (with respect to Class B and Class C Shares); and (2) ongoing costs, including management fees; distribution and service (12b-1) fees (with respect to Class A, Class B, Class C and Class R Shares); and other Fund expenses. This example is intended to help you understand your ongoing costs (in dollars) of investing in Class A, Class B, Class C, Institutional, Service, Class IR and Class R Shares of the Funds and to compare these costs with the ongoing costs of investing in other mutual funds.
The example is based on an investment of $1,000 invested at the beginning of the period and held for the entire period from November 1, 2013 through April 30, 2014.
Actual Expenses — The first line under each share class in the table below provides information about actual account values and actual expenses. You may use the information in this line, together with the amount you invested, to estimate the expenses that you paid over the period. Simply divide your account value by $1,000 (for example, an $8,600 account value divided by $1,000=8.6), then multiply the result by the number in the first line under the heading entitled “Expenses Paid” to estimate the expenses you paid on your account during this period.
Hypothetical Example for Comparison Purposes — The second line under each share class in the table below provides information about hypothetical account values and hypothetical expenses based on the Funds’ actual net expense ratio and an assumed rate of return of 5% per year before expenses, which is not the Funds’ actual return. The hypothetical account values and expenses may not be used to estimate the actual ending account balance or expenses you paid for the period. You may use this information to compare the ongoing costs of investing in the Funds and other funds. To do so, compare this 5% hypothetical example with the 5% hypothetical examples that appear in the shareholder reports of the other funds.
Please note that the expenses shown in the table are meant to highlight your ongoing costs only and do not reflect any transactional costs, such as sales charges, redemption fee or exchange fees. Therefore, the second line of the table is useful in comparing ongoing costs only, and will not help you determine the relative total costs of owning different funds. In addition, if these transactional costs were included, your costs would have been higher.
| Focused International Equity Fund | International Small Cap Fund | Strategic International Equity Fund | ||||||||||||||||||||||||||||||||||
| Share Class | Beginning Account Value 11/01/13 | Ending Account Value 4/30/2014 | Expenses Paid for the 6 Months Ended 04/30/14* | Beginning Account Value 11/01/13 | Ending Account Value 4/30/2014 | Expenses Paid for the 6 Months Ended 04/30/14* | Beginning Account Value 11/01/13 | Ending Account Value 4/30/2014 | Expenses Paid for the 04/30/14* | |||||||||||||||||||||||||||
| Class A | ||||||||||||||||||||||||||||||||||||
Actual | $ | 1,000 | $ | 1,008.70 | $ | 6.77 | $ | 1,000 | $ | 1,048.00 | $ | 7.92 | $ | 1,000 | $ | 1,030.40 | $ | 6.75 | ||||||||||||||||||
Hypothetical 5% return | 1,000 | 1,018.05 | + | 6.81 | 1,000 | 1,017.06 | + | 7.80 | 1,000 | 1,018.15 | + | 6.71 | ||||||||||||||||||||||||
| Class B | ||||||||||||||||||||||||||||||||||||
Actual | 1,000 | 1,005.10 | 10.49 | 1,000 | 1,044.40 | 11.71 | 1,000 | 1,027.30 | 10.56 | |||||||||||||||||||||||||||
Hypothetical 5% return | 1,000 | 1,014.33 | + | 10.54 | 1,000 | 1,013.34 | + | 11.53 | 1,000 | 1,014.38 | + | 10.49 | ||||||||||||||||||||||||
| Class C | ||||||||||||||||||||||||||||||||||||
Actual | 1,000 | 1,004.80 | 10.49 | 1,000 | 1,044.40 | 11.71 | 1,000 | 1,027.30 | 10.51 | |||||||||||||||||||||||||||
Hypothetical 5% return | 1,000 | 1,014.33 | + | 10.54 | 1,000 | 1,013.34 | + | 11.53 | 1,000 | 1,014.43 | + | 10.44 | ||||||||||||||||||||||||
| Institutional | ||||||||||||||||||||||||||||||||||||
Actual | 1,000 | 1,010.70 | 4.74 | 1,000 | 1,049.80 | 5.90 | 1,000 | 1,033.00 | 4.74 | |||||||||||||||||||||||||||
Hypothetical 5% return | 1,000 | 1,020.08 | + | 4.76 | 1,000 | 1,019.04 | + | 5.81 | 1,000 | 1,020.13 | + | 4.71 | ||||||||||||||||||||||||
| Service | ||||||||||||||||||||||||||||||||||||
Actual | 1,000 | 1,008.10 | 7.27 | 1,000 | 1,047.20 | 8.43 | N/A | N/A | N/A | |||||||||||||||||||||||||||
Hypothetical 5% return | 1,000 | 1,017.55 | + | 7.30 | 1,000 | 1,016.56 | + | 8.30 | N/A | N/A | N/A | |||||||||||||||||||||||||
| Class IR | ||||||||||||||||||||||||||||||||||||
Actual | 1,000 | 1,009.90 | 5.43 | 1,000 | 1,049.30 | 6.66 | 1,000 | 1,032.40 | 5.49 | |||||||||||||||||||||||||||
Hypothetical 5% return | 1,000 | 1,019.39 | + | 5.46 | 1,000 | 1,018.30 | + | 6.56 | 1,000 | 1,019.39 | + | 5.46 | ||||||||||||||||||||||||
| Class R | ||||||||||||||||||||||||||||||||||||
Actual | N/A | N/A | N/A | N/A | N/A | N/A | 1,000 | 1,029.90 | 8.05 | |||||||||||||||||||||||||||
Hypothetical 5% return | N/A | N/A | N/A | N/A | N/A | N/A | 1,000 | 1,016.86 | + | 8.00 | ||||||||||||||||||||||||||
| * | Expenses are calculated using each Fund’s annualized net expense ratio for each class, which represents the ongoing expenses as a percentage of net assets for the six months ended April 30, 2014. Expenses are calculated by multiplying the annualized net expense ratio by the average account value for the period; then multiplying the result by the number of days in the most recent fiscal half year; and then dividing that result by the number of days in the fiscal year. The annualized net expense ratios for the period were as follows: |
| Fund | Class A | Class B | Class C | Institutional | Service | Class IR | Class R | |||||||||||||||||||||
Focused International Equity | 1.36 | % | 2.11 | % | 2.11 | % | 0.95 | % | 1.46 | % | 1.09 | % | N/A | |||||||||||||||
International Small Cap | 1.56 | 2.31 | 2.31 | 1.16 | 1.66 | 1.31 | N/A | |||||||||||||||||||||
Strategic International Equity | 1.34 | 2.10 | 2.09 | 0.94 | N/A | 1.09 | 1.60 | % | ||||||||||||||||||||
| + | Hypothetical expenses are based on each Fund’s actual annualized net expense ratios and an assumed rate of return of 5% per year before expenses. |
52
FUNDS PROFILE
Goldman Sachs Funds

Goldman Sachs is a premier financial services firm, known since 1869 for creating thoughtful and customized investment solutions in complex global markets.
Today, the Investment Management Division of Goldman Sachs serves a diverse set of clients worldwide, including private institutions, public entities and individuals. With approximately $935.2 billion in assets under supervision as of March 31, 2014, Goldman Sachs Asset Management (“GSAM”) has portfolio management teams located around the world and our investment professionals bring firsthand knowledge of local markets to every investment decision. Assets under supervision includes assets under management and other client assets for which Goldman Sachs does not have full discretion. GSAM leverages the resources of Goldman, Sachs & Co. subject to legal, internal and regulatory restrictions.

Money Market1
Financial Square FundsSM
| n | Financial Square Tax-Exempt Funds |
| n | Financial Square Federal Fund |
| n | Financial Square Government Fund |
| n | Financial Square Money Market Fund |
| n | Financial Square Prime Obligations Fund |
| n | Financial Square Treasury Instruments Fund |
| n | Financial Square Treasury Obligations Fund |
Fixed Income
Short Duration and Government
| n | Enhanced Income Fund |
| n | High Quality Floating Rate Fund |
| n | Limited Maturity Obligations Fund |
| n | Short Duration Government Fund |
| n | Short Duration Income Fund |
| n | Government Income Fund |
| n | Inflation Protected Securities Fund |
Multi-Sector
| n | Core Fixed Income Fund |
| n | Core Plus Fixed Income Fund |
| n | Global Income Fund |
| n | Strategic Income Fund |
| n | World Bond Fund |
Municipal and Tax-Free
| n | High Yield Municipal Fund |
| n | Municipal Income Fund |
| n | Short Duration Tax-Free Fund |
Single Sector
| n | Investment Grade Credit Fund |
| n | U.S. Mortgages Fund |
| n | High Yield Fund |
| n | High Yield Floating Rate Fund |
| n | Emerging Markets Debt Fund |
| n | Local Emerging Markets Debt Fund |
| n | Dynamic Emerging Markets Debt Fund |
Corporate Credit
| n | Long Short Credit Strategies Fund2 |
Fundamental Equity
| n | Growth and Income Fund |
| n | Small Cap Value Fund |
| n | Small/Mid Cap Value Fund |
| n | Mid Cap Value Fund |
| n | Large Cap Value Fund |
| n | Capital Growth Fund |
| n | Strategic Growth Fund |
| n | Focused Growth Fund |
| n | Small/Mid Cap Growth Fund |
| n | Flexible Cap Growth Fund |
| n | Concentrated Growth Fund |
| n | Technology Tollkeeper Fund |
| n | Growth Opportunities Fund |
| n | Rising Dividend Growth Fund |
| n | U.S. Equity Fund |
| n | Income Builder Fund |
Tax-Advantaged Equity
| n | U.S. Tax-Managed Equity Fund3 |
| n | International Tax-Managed Equity Fund3 |
| n | U.S. Equity Dividend and Premium Fund |
| n | International Equity Dividend and Premium Fund |
Equity Insights
| n | Small Cap Equity Insights Fund |
| n | U.S. Equity Insights Fund |
| n | Small Cap Growth Insights Fund |
| n | Large Cap Growth Insights Fund |
| n | Large Cap Value Insights Fund |
| n | Small Cap Value Insights Fund |
| n | International Small Cap Insights Fund |
| n | International Equity Insights Fund |
| n | Emerging Markets Equity Insights Fund |
Fundamental Equity International
| n | Strategic International Equity Fund |
| n | Focused International Equity Fund4 |
| n | International Small Cap Fund |
| n | Asia Equity Fund |
| n | Emerging Markets Equity Fund |
| n | BRIC Fund (Brazil, Russia, India, China) |
| n | N-11 Equity Fund |
Select Satellite5
| n | Real Estate Securities Fund |
| n | International Real Estate Securities Fund |
| n | Commodity Strategy Fund |
| n | Dynamic Commodity Strategy Fund |
| n | Dynamic Allocation Fund |
| n | Absolute Return Tracker Fund |
| n | Managed Futures Strategy Fund |
| n | MLP Energy Infrastructure Fund |
| n | Multi-Manager Alternatives Fund |
| n | Multi-Asset Real Return Fund |
| n | Retirement Portfolio Completion Fund |
| n | Fixed Income Macro Strategies Fund |
Total Portfolio Solutions5
| n | Balanced Strategy Portfolio |
| n | Growth and Income Strategy Portfolio |
| n | Growth Strategy Portfolio |
| n | Equity Growth Strategy Portfolio |
| n | Satellite Strategies Portfolio |
| n | Enhanced Dividend Global Equity Portfolio |
| n | Tax Advantaged Global Equity Portfolio |
| 1 | An investment in a money market fund is neither insured nor guaranteed by the Federal Deposit Insurance Corporation (“FDIC”) or any other government agency. Although the Funds seek to preserve the value of your investment at $1.00 per share, it is possible to lose money by investing in the Funds. |
| 2 | Effective at the close of business on March 21, 2014, the Goldman Sachs Credit Strategies Fund was reorganized with and into the Goldman Sachs Long Short Credit Strategies Fund. |
| 3 | Effective at the close of business on April 30, 2014, the Goldman Sachs Structured Tax-Managed Equity and Structured International Tax-Managed Equity Funds were renamed the Goldman Sachs U.S. Tax-Managed Equity and International Tax-Managed Equity Funds respectively. |
| 4 | Effective at the close of business on February 28, 2014, the Goldman Sachs Concentrated International Equity Fund was renamed the Goldman Sachs Focused International Equity Fund. |
| 5 | Individual Funds within the Total Portfolio Solutions and Select Satellite categories will have various placement on the risk/return spectrum and may have greater or lesser risk than that indicated by the placement of the general Total Portfolio Solutions or Select Satellite category. |
Financial Square FundsSM is a registered service mark of Goldman, Sachs & Co.
| *This | list covers open-end funds only. Please visit our website at www.GSAMFUNDS.com to learn about our closed-end fund. |
TRUSTEES Ashok N. Bakhru, Chairman Donald C. Burke John P. Coblentz, Jr. Diana M. Daniels Joseph P. LoRusso Herbert J. Markley James A. McNamara Jessica Palmer Alan A. Shuch Richard P. Strubel Roy W. Templin | OFFICERS James A. McNamara, President Scott M. McHugh, Principal Financial Officer and Treasurer Caroline L. Kraus, Secretary | |
GOLDMAN, SACHS & CO. Distributor and Transfer Agent | GOLDMAN SACHS ASSET MANAGEMENT, L.P. Investment Adviser | |
Visit our Web site at www.GSAMFUNDS.com to obtain the most recent month-end returns.
Goldman Sachs Asset Management, L.P., 200 West Street, New York, New York 10282
The reports concerning the Funds included in this shareholder report may contain certain forward-looking statements about the factors that may affect the performance of the Funds in the future. These statements are based on Fund management’s predictions and expectations concerning certain future events and their expected impact on the Funds, such as performance of the economy as a whole and of specific industry sectors, changes in the levels of interest rates, the impact of developing world events, and other factors that may influence the future performance of the Funds. Management believes these forward-looking statements to be reasonable, although they are inherently uncertain and difficult to predict. Actual events may cause adjustments in portfolio management strategies from those currently expected to be employed.
A description of the policies and procedures that the Funds use to determine how to vote proxies relating to portfolio securities and information regarding how a Fund voted proxies relating to portfolio securities during the most recent 12-month period ended June 30 is available (I) without charge, upon request by calling 1-800-526-7384 (for Retail Shareholders) or 1-800-621-2550 (for Institutional Shareholders); and (II) on the Securities and Exchange Commission Web site at http://www.sec.gov.
The Funds file their complete schedule of portfolio holdings with the SEC for the first and third quarters of each fiscal year on Form N-Q. The Funds’ Forms N-Q are available on the SEC’s web site at http://www.sec.gov within 60 days after the Funds’ first and third fiscal quarters. The Funds’ Forms N-Q may be reviewed and copied at the SEC’s Public Reference Room in Washington, D.C. and information on the operation of the Public Reference Room may also be obtained by calling 1-800-SEC-0330. Forms N-Q may be obtained upon request and without charge by calling 1-800-526-7384 (for Retail Shareholders) or 1-800-621-2550 (for Institutional Shareholders).
The website links provided are for your convenience only and are not an endorsement or recommendation by GSAM of any of these websites or the products or services offered. GSAM is not responsible for the accuracy and validity of the content of these websites.
Holdings and allocations shown are as of April 30, 2014 and may not be representative of future investments. Fund holdings should not be relied on in making investment decisions and should not be construed as research or investment advice regarding particular securities. Current and future holdings are subject to risk.
The Global Industry Classification Standard (GICS) was developed by and is the exclusive property and a service mark of Morgan Stanley Capital International Inc. (MSCI) and Standard & Poor’s, a division of The McGraw-Hill Companies, Inc. (S&P) and is licensed for use by Goldman Sachs. Neither MSCI, S&P nor any other party involved in making or compiling the GICS or any GICS classifications makes any express or implied warranties or representations with respect to such standard or classification (or the results to be obtained by the use thereof), and all such parties hereby expressly disclaim all warranties of originality, accuracy, completeness, merchantability or fitness for a particular purpose with respect to any of such standard or classification. Without limiting any of the foregoing, in no event shall MSCI, S&P, any of their affiliates or any third party involved in making or compiling the GICS or any GICS classifications have any liability for any direct, indirect, special, punitive, consequential or any other damages (including lost profits) even if notified of the possibility of such damages.
The portfolio risk management process includes an effort to monitor and manage risk, but does not imply low risk.
This material is not authorized for distribution to prospective investors unless preceded or accompanied by a current Prospectus or summary prospectus, if applicable. Investors should consider a Fund’s objective, risks, and charges and expenses, and read the summary prospectus, if available, and/or the Prospectus carefully before investing or sending money. The summary prospectus, if available, and the Prospectus contain this and other information about a Fund and may be obtained from your authorized dealer or from Goldman, Sachs & Co. by calling (retail – 1-800-526-7384) (institutional – 1-800-621-2550).
© 2014 Goldman Sachs. All rights reserved. 131638.MF.MED.TMPL /6/2014 EQINTSAR14 / 12K
| ITEM 2. | CODE OF ETHICS. |
The information required by this Item is only required in an annual report on this Form N-CSR.
| ITEM 3. | AUDIT COMMITTEE FINANCIAL EXPERT. |
The information required by this Item is only required in an annual report on this Form N-CSR.
| ITEM 4. | PRINCIPAL ACCOUNTANT FEES AND SERVICES. |
The information required by this Item is only required in an annual report on this Form N-CSR.
| ITEM 5. | AUDIT COMMITTEE OF LISTED REGISTRANTS. |
| Not applicable. |
| ITEM 6. | SCHEDULE OF INVESTMENTS. |
| Schedule of Investments is included as part of the Report to Stockholders filed under Item 1. |
| ITEM 7. | DISCLOSURE OF PROXY VOTING POLICIES AND PROCEDURES FOR CLOSED-END MANAGEMENT INVESTMENT COMPANIES. |
| Not applicable. |
| ITEM 8. | PORTFOLIO MANAGERS OF CLOSED-END MANAGEMENT INVESTMENT COMPANIES. |
| Not applicable. |
| ITEM 9. | PURCHASES OF EQUITY SECURITIES BY CLOSED-END MANAGEMENT INVESTMENT COMPANY AND AFFILIATED PURCHASERS. |
| Not applicable. |
| ITEM 10. | SUBMISSION OF MATTERS TO A VOTE OF SECURITY HOLDERS. |
| There have been no material changes to the procedures by which shareholders may recommend nominees to the registrant’s board of trustees. |
| ITEM 11. | CONTROLS AND PROCEDURES. |
| (a) | The registrant’s principal executive and principal financial officers, or persons performing similar functions have concluded that the registrant’s disclosure controls and procedures (as defined in Rule 30a-3(c) under the Investment Company Act of 1940, as amended (the “1940 Act”)) are effective as of a date within 90 days of the filing of this report that includes the disclosure required by this paragraph, based on the evaluation of these controls and procedures required by Rule 30a-3(b) under the 1940 Act and 15d-15(b) under the Securities Exchange Act of 1934, as amended. |
| (b) | There were no changes in the registrant’s internal control over financial reporting (as defined in Rule 30a-3(d) under the 1940 Act) that occurred during the registrant’s second fiscal quarter of the period covered by this report that have materially affected, or are reasonably likely to materially affect, the registrant’s internal control over financial reporting. |
| ITEM 12. | EXHIBITS. |
| (a)(1) | The information required by this Item is only required in connection with an annual report on this Form N-CSR. | |||
| (a)(2) | Exhibit 99.CERT | Certifications pursuant to Section 302 of the Sarbanes-Oxley Act of 2002 filed herewith. | ||
| (b) | Exhibit 99.906CERT | Certifications pursuant to Section 906 of the Sarbanes-Oxley Act of 2002 filed herewith. | ||
SIGNATURES
Pursuant to the requirements of the Securities Exchange Act of 1934 and the Investment Company Act of 1940, the registrant has duly caused this report to be signed on its behalf by the undersigned, thereunto duly authorized.
| Goldman Sachs Trust | ||
| By: | /s/ James A. McNamara | |
| ||
James A. McNamara | ||
| President/Principal Executive Officer | ||
| Goldman Sachs Trust | ||
| Date: | June 30, 2014 | |
Pursuant to the requirements of the Securities Exchange Act of 1934 and the Investment Company Act of 1940, this report has been signed below by the following persons on behalf of the registrant and in the capacities and on the dates indicated.
| By: | /s/ James A. McNamara | |
| ||
James A. McNamara | ||
| President/Principal Executive Officer | ||
| Goldman Sachs Trust | ||
| Date: | June 30, 2014 | |
| By: | /s/ Scott McHugh | |
| ||
Scott McHugh | ||
| Principal Financial Officer | ||
| Goldman Sachs Trust | ||
| Date: | June 30, 2014 | |