UNITED STATES
SECURITIES AND EXCHANGE COMMISSION
Washington, D.C. 20549
FORM N-CSR
CERTIFIED SHAREHOLDER REPORT OF REGISTERED
MANAGEMENT INVESTMENT COMPANIES
Investment Company Act file number 811-05349
Goldman Sachs Trust
(Exact name of registrant as specified in charter)
71 South Wacker Drive, Chicago, Illinois 60606
(Address of principal executive offices) (Zip code)
| Caroline Kraus, Esq. | Copies to: | |
| Goldman, Sachs & Co. | Geoffrey R.T. Kenyon, Esq. | |
| 200 West Street | Dechert LLP | |
| New York, New York 10282 | 100 Oliver Street | |
| 40th Floor | ||
| Boston, MA 02110-2605 |
(Name and address of agents for service)
Registrant’s telephone number, including area code: (312) 655-4400
Date of fiscal year end: October 31
Date of reporting period: April 30, 2014
| ITEM 1. | REPORTS TO STOCKHOLDERS. |
| The Semi-Annual Report to Stockholders is filed herewith. |
Goldman Sachs Funds

| Semi-Annual Report | April 30, 2014 | |||
International Equity Insights Funds | ||||
Emerging Markets Equity Insights | ||||
International Equity Insights | ||||
International Small Cap Insights | ||||

Goldman Sachs International Equity
Insights Funds
| n | EMERGING MARKETS EQUITY INSIGHTS |
| n | INTERNATIONAL EQUITY INSIGHTS |
| n | INTERNATIONAL SMALL CAP INSIGHTS |
TABLE OF CONTENTS | ||||
Principal Investment Strategies and Risks | 1 | |||
Investment Process | 2 | |||
Market Review | 4 | |||
Portfolio Management Discussions and Performance Summaries | 7 | |||
Schedules of Investments | 22 | |||
Financial Statements | 42 | |||
Financial Highlights | 46 | |||
Notes to the Financial Statements | 52 | |||
Other Information | 68 | |||
| NOT FDIC-INSURED | May Lose Value | No Bank Guarantee | ||
GOLDMAN SACHS INTERNATIONAL EQUITY INSIGHTS FUNDS
Principal Investment Strategies and Risks
This is not a complete list of risks that may affect the Funds. For additional information concerning the risks applicable to the Funds, please see the Funds’ Prospectus.
The Goldman Sachs Emerging Markets Equity Insights Fund invests primarily in a diversified portfolio of equity investments in emerging country issuers. The Fund’s investments are subject to market risk, which means that the value of the securities in which it invests may go up or down in response to the prospects of individual companies, particular sectors and/or general economic conditions. Foreign and emerging markets investments may be more volatile and less liquid than investments in U.S. securities and are subject to the risks of currency fluctuations and adverse economic and political developments. The securities markets of emerging countries have less government regulation and are subject to less extensive accounting and financial reporting requirements than the markets of more developed countries. At times, the Fund may be unable to sell certain of its illiquid investments without a substantial drop in price, if at all. The Investment Adviser’s use of quantitative models to execute the Fund’s investment strategy may fail to produce the intended result. Different investment styles (e.g., “quantitative”) tend to shift in and out of favor, and at times the Fund may underperform other funds that invest in similar asset classes. The Fund may have a high rate of portfolio turnover, which involves correspondingly greater expenses which must be borne by the Fund, and is also likely to result in short-term capital gains taxable to shareholders.
The Goldman Sachs International Equity Insights Fund invests primarily in a broadly diversified portfolio of equity investments in companies that are organized outside the United States or whose securities are principally traded outside the United States. The Fund’s investments are subject to market risk, which means that the value of the securities in which it invests may go up or down in response to the prospects of individual companies, particular sectors and/or general economic conditions. Foreign and emerging markets investments may be more volatile and less liquid than investments in U.S. securities and are subject to the risks of currency fluctuations and adverse economic or political developments. The Investment Adviser’s use of quantitative models to execute the Fund’s investment strategy may fail to produce the intended result. Different investment styles (e.g., “quantitative”) tend to shift in and out of favor, and at times the Fund may underperform other funds that invest in similar asset classes. The Fund may have a high rate of portfolio turnover, which involves correspondingly greater expenses which must be borne by the Fund, and is also likely to result in short-term capital gains taxable to shareholders.
The Goldman Sachs International Small Cap Insights Fund invests primarily in a broadly diversified portfolio of equity investments in small capitalization non-U.S. issuers. The Fund’s investments are subject to market risk, which means that the value of the securities in which it invests may go up or down in response to the prospects of individual companies, particular sectors and/or general economic conditions. Foreign and emerging markets investments may be more volatile and less liquid than investments in U.S. securities and are subject to the risks of currency fluctuations and adverse economic or political developments. The securities of mid- and small-capitalization companies involve greater risks than those associated with larger, more established companies and may be subject to more abrupt or erratic price movements. The Investment Adviser’s use of quantitative models to execute the Fund’s investment strategy may fail to produce the intended result. Different investment styles (e.g., “quantitative”) tend to shift in and out of favor, and at times the Fund may underperform other funds that invest in similar asset classes. The Fund may have a high rate of portfolio turnover, which involves correspondingly greater expenses which must be borne by the Fund, and is also likely to result in short-term capital gains taxable to shareholders.
1
GOLDMAN SACHS INTERNATIONAL EQUITY INSIGHTS FUNDS
Goldman Sachs’ International Equity Insights Investment Process
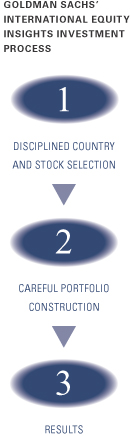

| n | Comprehensive – We forecast returns on over 8,000 international stocks and 43 equity markets on a daily basis. |
| n | Rigorous – We evaluate stocks, countries and currencies based on fundamental investment criteria that have outperformed historically. |
| n | Objective – Our stock and equity market selection process is free from emotion that may lead to biased investment decisions. |

| n | Our computer optimization process allocates risk to our best investment ideas and constructs funds that strive to neutralize systematic risks and deliver better returns. |
| n | We use proprietary risk models that are designed to be more precise, more focused and faster to respond because they seek to identify, track and manage risk specific to our process, using daily data. |

Fully invested, well-diversified international portfolio that seeks to:
| n | Blend top-down market views with bottom-up stock selection. |
| n | Maintain style, sector, risk and capitalization characteristics similar to the benchmark. |
| n | Achieve excess returns by taking many small diversified stock positions. Additionally, in the Goldman Sachs Emerging Markets Equity Insights and the International Equity Insights Funds we take intentional country bets. |
The portfolio risk management process includes an effort to monitor and manage risk, but does not imply low risk.
2
GOLDMAN SACHS INTERNATIONAL EQUITY INSIGHTS FUNDS
Enhancements Made to Proprietary Quantitative Model during the Six-Month Period Ended April 30, 2014
We continuously look for ways to improve our investment process. Accordingly, we introduced a number of enhancements to our proprietary quantitative model during the six-month period ended April 30, 2014.
In the fourth quarter of 2013, we implemented an enhancement to our Profitability theme to incorporate cash returns on cash invested metrics. We believe this additional metric should further help us to select the stocks of companies that efficiently reinvest and grow earnings. In addition, we extended an enhancement to our Sentiment theme for the U.K. and Japan regions, seeking to identify investment trends through natural language processing. We use natural language processing to analyze hundreds of research reports from professional stock analysts. Rather than relying on broad stock recommendations, we read through the body of the text to gain a more nuanced understanding of the reports. Analysts’ evolving views are generally reflected in the body of their research reports before changes are made in their official recommendations. By reading the full text of the reports, we gain insight into the direction of future ratings changes.
We made no enhancements to our proprietary quantitative model within the international or emerging markets regions during the first quarter of 2014.
3
MARKET REVIEW
Goldman Sachs International Equity Insights Funds
Market Review
During the six-month period ended April 30, 2014 (the “Reporting Period”), emerging markets equities recorded a decline, while developed international equities generated solid gains.
Emerging Markets Equities
Emerging markets equities significantly lagged developed markets equities during the Reporting Period, as concerns over slowing economic growth, high inflation and election uncertainty weighed on many of the growth and emerging markets. Also contributing to weak performance of emerging market equities during the Reporting Period was the December 2013 announcement by the U.S. Federal Reserve (the “Fed”) that it would begin tapering its asset purchases in January 2014. The announcement ended seven months of speculation about the beginning of the end of ultra-loose monetary policy that had fueled many emerging market economies in recent years. Further, Argentina’s currency devaluation in January 2014 rippled through emerging market currency and equity markets, forcing many central banks to hike interest rates, which further pressured equity markets.
Looking at some key individual emerging markets more specifically, Chinese equities struggled during most of the Reporting Period amidst renewed concerns about China’s shadow banking system, credit quality and decelerating growth. The Russian equity market plunged during the Reporting Period due to the rapidly escalating geopolitical situation in Ukraine. Weakness in Latin American equity markets persisted into early 2014, though the region began to rebound later in the Reporting Period. After a slow start, Indian equities also rallied sharply later in the Reporting Period, as polls suggested that the Bharatiya Janata Party (“BJP”), which is perceived as business-friendly, is likely to win in the country’s upcoming election. Protest movements increased the political risk of some countries, such as Turkey, which was one of the worst performing markets during the Reporting Period. At the other end of the spectrum, Indonesia’s equity market rallied, largely due to an improving current account balance and strong foreign flows.
For the Reporting Period overall, the MSCI® Emerging Markets Standard Index (unhedged, with dividends reinvested, net of dividend withholding taxes) (the “MSCI® EM Index”) returned -2.98% .* Thirteen of the 21 countries in the MSCI® EM Index were down for the Reporting Period, with Russia (-22.95%) and Hungary (-14.20%) posting the largest losses. Russia was also the largest decliner on the basis of impact, which takes both weightings and total returns into account.
Seven of the 10 sectors in the MSCI® EM Index were down for the Reporting Period, with energy (-10.80%) and materials (-6.46%) declining the most. The financials sector (-4.92%) was the largest detractor to MSCI® EM Index returns on the basis of impact.
4
MARKET REVIEW
International Equities
Developed international equities generated solid gains during the Reporting Period. Stock markets in Japan and Europe continued to make fresh highs through the end of 2013, with Japan’s Nikkei 225 Stock Average closing the year at a six-year high. The Japanese equity market’s strength reflected optimism about Prime Minister Shinzo Abe’s bold reforms and big stimulus. Encouragingly, Japan’s consumer price index (“CPI”) steadily increased through the end of the calendar year, boosting confidence that its economy was on a path to achieve its government’s inflation target of 2%. Germany’s Xetra Dax also reached a new high in December 2013, as European equity markets continued to benefit from the European Central Bank’s commitment to easy monetary policy and as economic growth returned to the region. (The Nikkei 225 Stock Average is a price-weighted index comprised of Japan’s top 225 blue chip companies on the Tokyo Stock Exchange. The Xetra Dax is a blue chip index in Germany that tracks the performance of the 30 most actively traded stocks on the Frankfurt Stock Exchange.) Weak performance from commodity-related sectors and a depreciating currency negatively impacted the Australian equity market toward the end of 2013.
January 2014 got off to a volatile start, as global developed equity market performance reflected a number of concerns in the emerging markets. However, most developed international equity markets then rebounded to make gains through April 2014. During the first quarter of 2014, it was reported that the Eurozone economy had grown at a stronger than expected 0.5% year over year rate during the fourth quarter of 2013, and the European Commission raised its estimates for Gross Domestic Product (“GDP”) growth in the region to 1.2% in 2014 and 1.8% in 2015. The Euro-area Flash Services Composite Purchasing Managers Index (“PMI”) recorded its highest level since 2011, while peripheral bond markets continued to normalize, with yields on Italian and Spanish bonds approximately half of what they were two years prior. (Flash Services Composite PMI is an early estimate of the Services PMI for a region, designed to provide an accurate advance indication of the final Services PMI data. As flash PMIs are among the first economic indicators for each month, providing evidence of changing economic conditions ahead of comparable government statistics, they can have a significant effect on currency markets.) However, many corporate earnings reports and conservative guidance from company managements disappointed, and disinflation remained a near-term threat. Japanese equities were weak for most of the calendar year through April 2014 in anticipation of the April 1, 2014 consumption tax increase, which is expected to obscure some economic data in the near term. Wage growth and business and consumer sentiment in Japan also disappointed.
For the Reporting Period overall, the MSCI® Europe, Australasia, Far East (“EAFE®”) Standard Index (unhedged, with dividends reinvested, net of dividend withholding taxes) (“MSCI® EAFE® Index”) returned 4.44% .* Seventeen of the 21 countries in the MSCI® EAFE® Index were up for the Reporting Period, with Denmark (+26.85%) and Israel (+22.71%) recording the largest gains. The U.K. (+7.18%) was the largest contributor on the basis of impact, which takes both weightings and total returns into account.
All 10 sectors in the MSCI® EAFE® Index generated positive returns for the Reporting Period, with health care (+12.58%) and energy (+11.75%) gaining the most. The health care sector was also the largest contributor to MSCI® EAFE® Index returns on the basis of impact.
In the international small cap arena, the MSCI® EAFE® Small Cap Index (unhedged, with dividends reinvested, net of dividend withholding taxes) (“MSCI® EAFE® Small Cap Index”) returned 5.38%* during the Reporting Period. Seventeen of the 22 countries in the MSCI®
5
MARKET REVIEW
EAFE® Small Cap Index were up for the Reporting Period, with Portugal (+47.10%) and Denmark (+19.51%) posting the largest gains. The U.K. (+7.51%) was the largest contributor on the basis of impact, which takes both weightings and total returns into account.
Nine of the 10 sectors in the MSCI® EAFE® Small Cap Index recorded positive results for the Reporting Period, with telecommunication services (+15.15%) and utilities (+11.68%) gaining the most. The industrials sector (+7.06%) was the largest contributor to MSCI® EAFE® Small Cap Index returns on the basis of impact.
Looking Ahead
At the end of the Reporting Period, we continued to believe that less expensive stocks are likely to outpace more expensive stocks. In addition, we believe stocks with good momentum would outperform those with poor momentum. We plan to focus on seeking companies about which fundamental research analysts are becoming more positive as well as profitable companies with sustainable earnings and a track record of using their capital to enhance shareholder value. As such, we anticipate remaining fully invested, with long-term performance likely to be the result of stock selection rather than sector or capitalization allocations.
We stand behind our investment philosophy that sound economic investment principles, coupled with a disciplined quantitative approach, can provide strong, uncorrelated returns over the long term. Our research agenda is robust, and we continue to enhance our existing models, add new proprietary forecasting signals and improve our trading execution as we seek to provide the most value to our shareholders.
| * | All index returns are expressed in U.S. dollar terms. |
6
PORTFOLIO RESULTS
Goldman Sachs Emerging Markets Equity Insights Fund
Investment Objective
The Fund seeks long-term growth of capital.
Portfolio Management Discussion and Analysis
Below, the Goldman Sachs Quantitative Investment Strategies Team discusses the Goldman Sachs Emerging Markets Equity Insights Fund’s (the “Fund”) performance and positioning for the six-month period ended April 30, 2014 (the “Reporting Period”).
| Q | How did the Fund perform during the Reporting Period? |
| A | During the Reporting Period, the Fund’s Class A, C, Institutional and IR Shares generated cumulative total returns, without sales charges, of -3.92%, -4.21%, -3.79% and -3.74%, respectively. These returns compare to the -2.98% cumulative total return of the Fund’s benchmark, the MSCI® Emerging Markets Standard Index (unhedged, with dividends reinvested, net of dividend withholding taxes) (the MSCI® “EM Index”), during the same period. During the period from inception on February 28, 2014 to April 30, 2014, the Fund’s Class R Shares generated a cumulative total return, without sales charges, of 2.78% . This compares to the 3.41% cumulative total return of the Index during the same time period. |
| Q | What key factors were most responsible for the Fund’s performance during the Reporting Period? |
| A | We use two distinct strategies — a bottom-up stock selection strategy and a top-down country/currency selection strategy — to manage the Fund. These strategies are uncorrelated, that is, they tend to perform independently of each other over time, which enables us to greater diversify the portfolio. During the Reporting Period, our country/currency selection strategy detracted from the Fund’s relative returns. Our stock selection strategy, which uses fundamental research and stock selection models based on six investment themes, added to relative performance. |
| Q | Which investment themes helped and which hurt within the Team’s stock selection strategy? |
| A | Our bottom-up stock selection strategy enhanced relative returns during the Reporting Period. We use a quantitative model and six investment themes to take a long-term view of market patterns and look for inefficiencies, selecting stocks for the Fund and overweighting or underweighting those stocks chosen by the model. Over time and by design, the performance of any one of our model’s investment themes tends to have a low correlation with the model’s other themes, demonstrating the diversification benefit of our theme-driven quantitative model. The variance in performance supports our research indicating that the diversification provided by our different investment themes is a significant investment advantage over the long term, even though the Fund may experience underperformance in the short term. Of course, diversification does not protect an investor from market risk nor does it ensure a profit. |
| During the Reporting Period, five of our six investment themes added to the Fund’s relative results. Momentum was our best performing theme. Momentum seeks to predict drifts in stock prices caused by delayed investor reaction to company-specific information and information about related companies. Our Valuation and Sentiment themes also contributed positively, while our Profitability and Quality themes added more modestly to relative returns. The Valuation theme attempts to capture potential mispricings of securities, typically by comparing a measure of the company’s intrinsic value to its market value. The Sentiment theme reflects selected investment views and decisions of individuals and financial intermediaries. The Profitability theme assesses whether a company is earning more than its cost of capital. The Quality theme seeks to assess both firm and management quality. |
| Our Management theme, which assesses the characteristics, policies and strategic decisions of company management, modestly detracted from relative results during the Reporting Period. |
| Q | How did the Fund’s sector and industry allocations affect relative results? |
| A | In constructing the portfolio, we focus on picking stocks rather than on making sector or industry bets. Consequently, |
7
PORTFOLIO RESULTS
the Fund is similar to the MSCI® EM Index in terms of its sector and industry allocations and its style. Changes in its sector or industry weights historically have not had a meaningful impact on relative returns. |
| Q | Did stock selection help or hurt Fund performance during the Reporting Period? |
| A | We seek to outpace the MSCI® EM Index by overweighting stocks we expect to outperform and underweighting those we think may lag. At the same time, we strive to maintain a risk profile similar to the Index. The Fund’s investments are selected using fundamental research and a variety of quantitative techniques based on our investment themes. For example, the Fund aims to hold a basket of stocks with better Momentum characteristics than the benchmark. |
| During the Reporting Period, our security selection added to the Fund’s relative returns. Investments in the health care, information technology and energy sectors contributed most positively. Our stock picks in the materials, consumer discretionary and industrials sectors hurt relative performance. |
| Q | Which stock positions contributed most to the Fund’s relative returns during the Reporting Period? |
| A | The Fund benefited from overweight positions in HCL Technologies, an India-based IT services company; Infosys, an Indian provider of business consulting, technology, engineering and outsourcing services; and Kroton Educacional, a Brazilian educational company. The overweights in HCL Technologies and Infosys were the result of our positive views on Momentum and Valuation. We chose to overweight Kroton Educacional because of our positive views on Momentum and Sentiment. |
| Q | Which Fund positions detracted most from results during the Reporting Period? |
| A | The Fund was hampered during the Reporting Period by its overweights in Brazilian steelmaker Cia Siderurgica Nacional, Russian telecommunications provider Mobile Telesystems and Russian bank Sberbank Rossii. The Fund was overweight Cia Siderurgica given our positive views on Momentum and Valuation, while the overweight in Mobile Telesystems was due to our positive views on Momentum and Profitability. We chose to overweight Sberbank as a result of our positive views on Valuation and Profitability. |
| Q | What impact did the Team’s country/currency selection strategy have on the Fund’s relative performance during the Reporting Period? |
| A | Our country/currency strategy detracted from relative performance during the Reporting Period. The Fund was hurt by its overweight positions in Russia, Hungary and Turkey. On the positive side, Fund performance was enhanced by overweight positions in Brazil and the Czech Republic as well as by an underweight position in Chile. |
| We made our picks using our proprietary models, which, during the Reporting Period, were based on three investment themes specific to our country/currency strategy — Valuation, Risk Premium and Macro. Valuation favors equity and currency markets that appear cheap relative to accounting measures of value and purchasing power. Risk Premium evaluates whether a country is overcompensating investors for various types of risk. Macro assesses a market’s macroeconomic environment and growth prospects. |
| Q | How did the Fund use derivatives and similar instruments during the Reporting Period? |
| A | During the Reporting Period, we did not use derivatives to hedge positions or as part of an active management strategy. |
| Q | What changes did you make to the Fund’s country weightings during the Reporting Period? |
| A | During the Reporting Period, we moved the Fund from underweight positions relative to the Index in Taiwan, Mexico and Poland to overweight positions. We shifted the Fund from overweight positions in South Africa and Brazil to underweight positions. We also decreased the Fund’s overweight in Russia. |
| Q | What were the Fund’s sector and country weightings at the end of the Reporting Period? |
| A | At the end of the Reporting Period, the Fund was overweight relative to the MSCI® EM Index in the information technology, health care, utilities, materials and industrials sectors relative to the Index. Compared to the Index, the Fund was underweight the consumer staples, telecommunication services, consumer discretionary and financials sectors at the end of the Reporting Period. Compared to the Index, the Fund was relatively neutral to the energy sector at the end of the Reporting Period. |
| In terms of countries, the Fund was overweight China, India, Turkey, Mexico, Poland, Taiwan, Hungary and Russia relative to the Index at the end of the Reporting Period. It was underweight in Malaysia, Korea, South Africa, Colombia, Chile, the Philippines, Greece, Peru, Indonesia, the Czech Republic and Egypt. Compared to the Index, the Fund was neutral in Thailand and Brazil at the end of the Reporting Period. |
8
FUND BASICS
Emerging Markets Equity Insights Fund
as of April 30, 2014
| PERFORMANCE REVIEW | ||||||||||
| November 1, 2013–April 30, 2014 | Fund Total Return (based on NAV)1 | MSCI® EMF Index2 | ||||||||
| Class A | -3.92 | % | -2.98 | % | ||||||
| Class C | -4.21 | -2.98 | ||||||||
| Institutional | -3.79 | -2.98 | ||||||||
| Class IR | -3.74 | -2.98 | ||||||||
| February 28, 2014–April 30, 2014 | MSCI® EM Index2 | |||||||||
| Class R | 2.78 | % | 3.41 | % | ||||||
| 1 | The net asset value (NAV) represents the net assets of the class of the Fund (ex-dividend) divided by the total number of shares of the class outstanding. The Fund’s performance assumes the reinvestment of dividends and other distributions. The Fund’s performance does not reflect the deduction of any applicable sales charges. |
| 2 | The MSCI® EM Index is a free float-adjusted market capitalization index that is designed to measure equity market performance of emerging markets. As of November 27, 2013, the MSCI® EM Index consisted of the following 21 emerging market country indices: Brazil, Chile, China, Colombia, Czech Republic, Egypt, Greece, Hungary, India, Indonesia, Korea, Malaysia, Mexico, Peru, Philippines, Poland, Russia, South Africa, Taiwan, Thailand, and Turkey. Index figures do not reflect any deduction for fees, expenses or taxes. It is not possible to invest directly in an index. |
| STANDARDIZED TOTAL RETURNS3 | ||||||||||||
| For the period ended 3/31/14 | One Year | Five Years | Since Inception | Inception Date | ||||||||
| Class A | -9.72 | % | 13.80% | -2.30% | 10/5/07 | |||||||
| Class C | -6.25 | 14.25 | -2.12 | 10/5/07 | ||||||||
| Institutional | -4.25 | 15.55 | -1.07 | 10/5/07 | ||||||||
| Class IR | -4.31 | N/A | 4.45 | 8/31/10 | ||||||||
| Class R | N/A | N/A | 2.78 | 2/28/14 | ||||||||
| 3 | The Standardized Total Returns are average annual total returns as of the most recent calendar quarter-end. They assume reinvestment of all distributions at NAV. These returns reflect a maximum initial sales charge of 5.5% for Class A Shares and the assumed contingent deferred sales charge for Class C Shares (1% if redeemed within 12 months of purchase). Because Institutional, Class R and Class IR Shares do not involve a sales charge, such a charge is not applied to their Standardized Total Returns. |
The returns set forth in the tables above represent past performance. Past performance does not guarantee future results. The Fund’s investment return and principal value will fluctuate so that an investor’s shares, when redeemed, may be worth more or less than their original cost. Current performance may be lower or higher than the performance quoted above. Please visit our web site at www.GSAMFUNDS.com to obtain the most recent month-end returns. Performance reflects applicable fee waivers and/or expense limitations in effect during the periods shown. In their absence, performance would be reduced. Returns do not reflect the deduction of taxes that a shareholder would pay on Fund distributions or the redemption of Fund shares.
9
FUND BASICS
| EXPENSE RATIOS4 | ||||||||||
| Net Expense Ratio (Current) | Gross Expense Ratio (Before Waivers) | |||||||||
| Class A | 1.58 | % | 1.65 | % | ||||||
| Class C | 2.33 | 2.48 | ||||||||
| Institutional | 1.18 | 1.27 | ||||||||
| Class IR | 1.33 | 1.50 | ||||||||
| Class R | 1.83 | 1.92 | ||||||||
| 4 | The expense ratios of the Fund, both current (net of applicable fee waivers and/or expense limitations) and before waivers (gross of applicable fee waivers and/or expense limitations) are as set forth above according to the most recent publicly available Prospectus for the Fund and may differ from the expense ratios disclosed in the Financial Highlights in this report. The Fund’s waivers and/or expense limitations will remain in place through at least February 28, 2015, and prior to such date the Investment Adviser may not terminate the arrangements without the approval of the Fund’s Board of Trustees. If these arrangements are discontinued in the future, the expense ratios may change without shareholder approval. |
| TOP TEN HOLDINGS AS OF 4/30/145 | ||||||||||
| Holding | % of Total Net Assets | Line of Business | Country | |||||||
| Samsung Electronics Co. Ltd. | 4.4 | % | Semiconductors & Semiconductor Equipment | South Korea | ||||||
| Taiwan Semiconductor Manufacturing Co. Ltd. ADR | 4.1 | Semiconductors & Semiconductor Equipment | Taiwan | |||||||
| China Construction Bank Corp. Class H | 2.9 | Banks | China | |||||||
| Itau Unibanco Holding SA ADR | 2.5 | Banks | Brazil | |||||||
| Bank of China Ltd. Class H | 2.5 | Banks | China | |||||||
| SK Hynix, Inc. | 2.1 | Semiconductors & Semiconductor Equipment | South Korea | |||||||
| BRF SA | 1.9 | Food, Beverage & Tobacco | Brazil | |||||||
| Kia Motors Corp. | 1.9 | Automobiles & Components | South Korea | |||||||
| America Movil SAB de CV Series L ADR | 1.9 | Telecommunication Services | Mexico | |||||||
| Industrial & Commercial Bank of China Ltd. Class H | 1.8 | Banks | China | |||||||
| 5 | The top 10 holdings may not be representative of the Fund’s future investments. |
10
FUND BASICS
| FUND VS. BENCHMARK SECTOR ALLOCATIONS6 |
| As of April 30, 2014 |
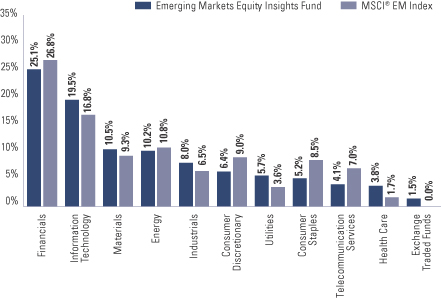
| 6 | The Fund is actively managed and, as such, its composition may differ over time. Consequently, the Fund’s overall industry sector allocations may differ from percentages contained in the graph above. The graph categorizes investments using Global Industry Classification Standard (“GICS”), however, the sector classifications used by the portfolio management team may differ from GICS. Underlying sector allocations of exchange traded funds held by the Fund are not reflected in the graph above. The percentage shown for each investment category reflects the value of investments in that category as a percentage of market value (excluding investments in the securities lending reinvestment vehicle, if any). Investments in the securities lending reinvestment vehicle represented 2.4% of the Fund’s net assets at April 30, 2014. The graph depicts the Fund’s investments but may not represent the Fund’s market exposure due to the exclusion of certain derivatives, if any, as listed in the Additional Investment Information section of the Schedule of Investments. |
11
PORTFOLIO RESULTS
Goldman Sachs International Equity Insights Fund
Investment Objective
The Fund seeks long-term growth of capital.
Portfolio Management Discussion and Analysis
Below, the Goldman Sachs Quantitative Investment Strategies Team discusses the Goldman Sachs International Equity Insights Fund’s (the “Fund”) performance and positioning for the six-month period ended April 30, 2014 (the “Reporting Period”).
| Q | How did the Fund perform during the Reporting Period? |
| A | During the Reporting Period, the Fund’s Class A, B, C, Institutional, Service, IR and R Shares generated cumulative total returns, without sales charges, of 4.63%, 4.28%, 4.24%, 4.79%, 4.66%, 4.78% and 4.50%, respectively. These returns compare to the 4.44% cumulative total return of the Fund’s benchmark, the MSCI® EAFE® Standard Index (unhedged, with dividends reinvested, net of dividend withholding taxes) (the “MSCI® EAFE® (net) Index”), during the same period. |
| Q | What key factors were most responsible for the Fund’s performance during the Reporting Period? |
| A | We use two distinct strategies — a bottom-up stock selection strategy and a top-down country/currency selection strategy — to manage the Fund. These strategies are uncorrelated, that is, they tend to perform independently of each other over time, which enables us to greater diversify the portfolio. Our bottom-up stock selection strategy, which uses fundamental research and stock selection models based on six investment themes, contributed positively during the Reporting Period. Our country/currency selection strategy detracted from the Fund’s relative performance. |
| Q | Which investment themes helped and which hurt within the Team’s stock selection strategy? |
| A | Our bottom-up stock selection strategy added to relative returns during the Reporting Period. We use a quantitative model and six investment themes to take a long-term view of market patterns and look for inefficiencies, selecting stocks for the Fund and overweighting or underweighting those stocks chosen by the model. Over time and by design, the performance of any one of our model’s investment themes tends to have a low correlation with the model’s other themes, demonstrating the diversification benefit of our theme-driven quantitative model. The variance in performance supports our research indicating that the diversification provided by our different investment themes is a significant investment advantage over the long term, even though the Fund may experience underperformance in the short term. Of course, diversification does not protect an investor from market risk nor does it ensure a profit. |
| During the Reporting Period, five of our six investment themes added to the Fund’s relative returns. Our best-performing theme was Momentum. The Momentum theme seeks to predict drifts in stock prices caused by delayed investor reaction to company-specific information and information about related companies. Sentiment, Profitability, Quality and Valuation also added to relative returns. The Sentiment theme reflects selected investment views and decisions of individuals and financial intermediaries. The Profitability theme assesses whether a company is earning more than its cost of capital. The Quality theme seeks to assess both firm and management quality. The Valuation theme attempts to capture potential mispricings of securities, typically by comparing a measure of the company’s intrinsic value to its market value. |
| The impact of our Management theme was relatively neutral during the Reporting Period. Management assesses the characteristics, policies and strategic decisions of company management. |
| Q | How did the Fund’s sector and industry allocations affect relative results? |
| A | In constructing the portfolio, we focus on picking stocks rather than on making sector or industry bets. Consequently, the Fund is similar to the MSCI® EAFE® (net) Index in terms of its sector and industry allocations and its style. Changes in its sector or industry weights historically have not had a meaningful impact on relative returns. |
| Q | Did stock selection help or hurt Fund performance during the Reporting Period? |
| A | We seek to outpace the MSCI® EAFE® (net) Index by overweighting stocks we expect to outperform and |
12
PORTFOLIO RESULTS
underweighting those we think may lag. At the same time, we strive to maintain a risk profile similar to the Index. The Fund’s investments are selected using fundamental research and a variety of quantitative techniques based on our investment themes. For example, the Fund aims to hold a basket of stocks with better Momentum characteristics than the benchmark. |
| During the Reporting Period, our security selection added to the Fund’s relative returns. Investments in the industrials, telecommunication services and information technology sectors contributed most positively. Stock picks in the consumer staples, materials and utilities sectors detracted from relative performance. |
| Q | Which stock positions contributed most to the Fund’s relative returns during the Reporting Period? |
| A | The Fund benefited from overweighted positions in AstraZeneca, a British-Swedish pharmaceutical and biologic company; Vestas Wind Systems, a Danish manufacturer of wind turbines; and easyJet, a London-headquartered airline company. We chose to overweight AstraZeneca because of our positive views on Valuation and Management. The Fund was overweight Vestas Wind Systems given our positive views on Momentum and Quality. Our positive views on Momentum and Sentiment led us to overweight easyJet. |
| Q | Which Fund positions detracted most from results during the Reporting Period? |
| A | An underweight in Novartis, a Swiss pharmaceutical company, detracted from the Fund’s relative performance. The Fund was also hampered by overweighted positions in Nomura Holdings, a Japanese financial holding company, and Sumitomo Mitsui Financial Group, a Japanese bank holding and financial services company. Our negative views on Momentum and Profitability resulted in the Fund’s underweight in Novartis. We assumed the overweight in Nomura Holdings due to our positive views on Profitability and Valuation, while the overweight in Sumitomo was because of our positive views on Momentum and Profitability. |
| Q | What impact did the Team’s country/currency selection strategy have on the Fund’s relative performance during the Reporting Period? |
| A | Our country/currency selection strategy detracted from Fund returns during the Reporting Period. The Fund was hurt by its overweight in Japan and its underweighted positions in Italy and Spain. It benefited from overweighted positions in Switzerland and Germany and an underweight in Hong Kong. We made our picks using our proprietary models, which, during the Reporting Period, were based on five investment factors specific to our country/currency strategy — Valuation, Momentum, Risk Premium, Fund Flows and Macro. Valuation favors equity and currency markets that appear cheap relative to accounting measures of value and purchasing power. The Momentum factor favors countries and currencies that have had strong recent outperformance. Risk Premium evaluates whether a country is overcompensating investors for various types of risk, while Fund Flows evaluates the strength of capital market inflows. Finally, Macro assesses a market’s macroeconomic environment and growth prospects. |
| Q | How did the Fund use derivatives and similar instruments during the Reporting Period? |
| A | During the Reporting Period, we used financial futures contracts to equitize the Fund’s cash holdings. In other words, we put the Fund’s cash holdings to work by using them as collateral for the purchase of financial futures contracts. |
| Q | What changes did you make to the Fund’s country weightings during the Reporting Period? |
| A | During the Reporting Period, we shifted the Fund from an underweighted position in Finland to an overweighted position. We decreased the Fund’s underweights in Spain and Hong Kong, but maintained underweighted positions. We moved the Fund from overweighted positions in France, the U.K. and Belgium to underweighted positions. |
| Q | What were the Fund’s sector and country weightings at the end of the Reporting Period? |
| A | At the end of the Reporting Period, the Fund was overweight the health care sector relative to the Index. The Fund was underweight compared to the Index in the financials, consumer discretionary and consumer staples sectors at the end of the Reporting Period. Compared to the Index, the Fund was relatively neutral in the information technology, industrials, utilities, energy, telecommunications and materials sectors at the end of the Reporting Period. |
| In terms of countries, the Fund was overweight relative to the Index in Japan, Switzerland, Finland, Norway, Germany and Singapore at the end of the Reporting Period. The Fund was underweight compared to the Index in Sweden, Australia, the U.K., Spain, Israel, France, Italy, the Netherlands, Ireland, Belgium, Denmark, Portugal, New Zealand and Austria at the end of the Reporting Period. Compared to the Index, the Fund was relatively neutral in Hong Kong at the end of the Reporting Period. |
13
FUND BASICS
International Equity Insights Fund
as of April 30, 2014
| PERFORMANCE REVIEW | ||||||||||
| November 1, 2013–April 30, 2014 | Fund Total Return (based on NAV)1 | MSCI EAFE (Net) Index2 | ||||||||
| Class A | 4.63 | % | 4.44 | % | ||||||
| Class B | 4.28 | 4.44 | ||||||||
| Class C | 4.24 | 4.44 | ||||||||
| Institutional | 4.79 | 4.44 | ||||||||
| Service | 4.66 | 4.44 | ||||||||
| Class IR | 4.78 | 4.44 | ||||||||
| Class R | 4.50 | 4.44 | ||||||||
| 1 | The net asset value (NAV) represents the net assets of the class of the Fund (ex-dividend) divided by the total number of shares of the class outstanding. The Fund’s performance assumes the reinvestment of dividends and other distributions. The Fund’s performance does not reflect the deduction of any applicable sales charges. |
| 2 | The unmanaged MSCI® EAFE® (net) Index is a market capitalization-weighted composite of securities in 21 developed markets (as of November 27, 2013). The Index figures do not reflect any deduction for fees, expenses or taxes. It is not possible to invest directly in an index. |
| STANDARDIZED TOTAL RETURNS3 | ||||||||||||||
| For the period ended 3/31/14 | One Year | Five Years | Ten Years | Since Inception | Inception Date | |||||||||
| Class A | 12.89 | % | 13.21% | 5.14% | 3.49% | 8/15/97 | ||||||||
| Class B | 13.58 | 13.33 | 5.09 | 3.58 | 8/15/97 | |||||||||
| Class C | 17.64 | 13.61 | 4.96 | 3.19 | 8/15/97 | |||||||||
| Institutional | 20.07 | 14.94 | 6.16 | 4.37 | 8/15/97 | |||||||||
| Service | 19.31 | 14.34 | 5.63 | 3.85 | 8/15/97 | |||||||||
| Class IR | 19.76 | 14.74 | N/A | -0.89 | 11/30/07 | |||||||||
| Class R | 19.19 | 14.22 | N/A | -1.35 | 11/30/07 | |||||||||
| 3 | The Standardized Total Returns are average annual total returns as of the most recent calendar quarter-end. They assume reinvestment of all distributions at NAV. These returns reflect a maximum initial sales charge of 5.5% for Class A Shares, the assumed contingent deferred sales charge for Class B Shares (5% maximum declining to 0% after six years) and the assumed contingent deferred sales charge for Class C Shares (1% if redeemed within 12 months of purchase). Class B Shares convert to Class A Shares on or about the fifteenth day of the last month of the calendar quarter that is eight years after purchase. Returns for Class B Shares for the period after conversion reflect the performance of Class A Shares. Because Institutional, Service, Class IR and Class R Shares do not involve a sales charge, such a charge is not applied to their Standardized Total Returns. The Fund’s Class B Shares are no longer available for purchase by new or existing shareholders (although current Class B shareholders may continue to reinvest income and capital gains distributions into Class B Shares, and Class B shareholders may continue to exchange their shares for Class B Shares of certain other Goldman Sachs Funds). |
The returns set forth in the tables above represent past performance. Past performance does not guarantee future results. The Fund’s investment return and principal value will fluctuate so that an investor’s shares, when redeemed, may be worth more or less than their original cost. Current performance may be lower or higher than the performance quoted above. Please visit our web site at www.GSAMFUNDS.com to obtain the most recent month-end returns. Performance reflects applicable fee waivers and/or expense limitations in effect during the periods shown. In their absence, performance would be reduced. Returns do not reflect the deduction of taxes that a shareholder would pay on Fund distributions or the redemption of Fund shares.
14
FUND BASICS
| EXPENSE RATIOS4 | ||||||||||
| Net Expense Ratio (Current) | Gross Expense Ratio (Before Waivers) | |||||||||
| Class A | 1.29 | % | 1.37 | % | ||||||
| Class B | 2.04 | 2.11 | ||||||||
| Class C | 2.04 | 2.11 | ||||||||
| Institutional | 0.89 | 0.96 | ||||||||
| Service | 1.39 | 1.46 | ||||||||
| Class IR | 1.04 | 1.11 | ||||||||
| Class R | 1.54 | 1.61 | ||||||||
| 4 | The expense ratios of the Fund, both current (net of applicable fee waivers and/or expense limitations) and before waivers (gross of applicable fee waivers and/or expense limitations) are as set forth above according to the most recent publicly available Prospectus for the Fund and may differ from the expense ratios disclosed in the Financial Highlights in this report. The Fund’s waivers and/or expense limitations will remain in place through at least February 28, 2015, and prior to such date the Investment Adviser may not terminate the arrangements without the approval of the Fund’s Board of Trustees. If these arrangements are discontinued in the future, the expense ratios may change without shareholder approval. |
| TOP TEN HOLDINGS AS OF 4/30/145 | ||||||||||
| Holding | % of Total Net Assets | Line of Business | Country | |||||||
| Roche Holding AG | 3.2 | % | Pharmaceuticals, Biotechnology & Life Sciences | Switzerland | ||||||
| HSBC Holdings PLC | 2.9 | Banks | United Kingdom | |||||||
| BP PLC ADR | 2.4 | Energy | United Kingdom | |||||||
| British American Tobacco PLC | 1.9 | Food, Beverage & Tobacco | United Kingdom | |||||||
| Royal Dutch Shell PLC Class A | 1.5 | Energy | Netherlands | |||||||
| BHP Billiton PLC | 1.5 | Materials | United Kingdom | |||||||
| Vodafone Group PLC ADR | 1.5 | Telecommunication Services | United Kingdom | |||||||
| ABB Ltd. (Registered) | 1.4 | Capital Goods | Switzerland | |||||||
| Commonwealth Bank of Australia | 1.3 | Banks | Australia | |||||||
| GlaxoSmith Kline PLC ADR | 1.3 | Pharmaceuticals, Biotechnology & Life Sciences | Netherlands | |||||||
| 5 | The top 10 holdings may not be representative of the Fund’s future investments. |
15
FUND BASICS
| FUND VS. BENCHMARK SECTOR ALLOCATIONS6 |
| As of April 30, 2014 |
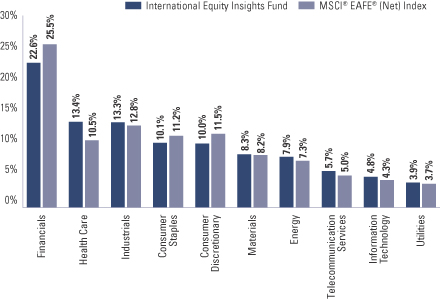
| 6 | The Fund is actively managed and, as such, its composition may differ over time. Consequently, the Fund’s overall industry sector allocations may differ from percentages contained in the graph above. The graph categorizes investments using Global Industry Classification Standard (“GICS”), however, the sector classifications used by the portfolio management team may differ from GICS. The percentage shown for each investment category reflects the value of investments in that category as a percentage of market value (excluding investments in the securities lending reinvestment vehicle, if any). Investments in the securities lending reinvestment vehicle represented 6.6% of the Fund’s net assets at April 30, 2014. The graph depicts the Fund’s investments but may not represent the Fund’s market exposure due to the exclusion of certain derivatives, if any, as listed in the Additional Investment Information section of the Schedule of Investments. |
16
PORTFOLIO RESULTS
Goldman Sachs International Small Cap Insights Fund
Investment Objective
The Fund seeks long-term growth of capital.
Portfolio Management Discussion and Analysis
Below, the Goldman Sachs Quantitative Investment Strategies Team discusses the Goldman Sachs International Small Cap Insights Fund’s (the “Fund”) performance and positioning for the six-month period ended April 30, 2014 (the “Reporting Period”).
| Q | How did the Fund perform during the Reporting Period? |
| A | During the Reporting Period, the Fund’s Class A, C, Institutional and IR Shares generated cumulative total returns, without sales charges, of 5.00%, 4.56%, 5.22% and 5.20%, respectively. These returns compare to the 5.38% cumulative total return of the Fund’s benchmark, the MSCI® EAFE® Small Cap Index (unhedged, with dividends reinvested, net of dividend withholding taxes) (the “MSCI® EAFE® Small Cap (net) Index”), during the same period. |
| Q | What key factors were most responsible for the Fund’s performance during the Reporting Period? |
| A | Although our quantitative model and its investment themes added to relative returns, the Fund underperformed the Index during the Reporting Period due mainly to stock selection. |
| Q | What impact did the Fund’s investment themes have on performance during the Reporting Period? |
| A | As expected, and in keeping with our investment approach, our quantitative model and six investment themes had the greatest impact on relative performance. We use these themes to take a long-term view of market patterns and look for inefficiencies, selecting stocks for the Fund and overweighting or underweighting those stocks chosen by the model. Over time and by design, the performance of any one of our model’s investment themes tends to have a low correlation with the model’s other themes, demonstrating the diversification benefit of our theme-driven quantitative model. The variance in performance supports our research indicating that the diversification provided by our different investment themes is a significant investment advantage over the long term, even though the Fund may experience underperformance in the short term. Of course, diversification does not protect an investor from market risk nor does it ensure a profit. |
| During the Reporting Period, all six of our investment themes added to the Fund’s relative returns. Momentum was the Fund’s best performing theme. Momentum seeks to predict drifts in stock prices caused by delayed investor reaction to company-specific information and information about related companies. Valuation and Sentiment also contributed positively. The Valuation theme attempts to capture potential mispricings of securities, typically by comparing a measure of the company’s intrinsic value to its market value. The Sentiment theme reflects selected investment views and decisions of individuals and financial intermediaries. In addition, Quality, Management and Profitability added value, though to a lesser extent. Quality seeks to assess both firm and management quality. Management assesses the characteristics, policies and strategic decisions of company management. Profitability assesses whether a company is earning more than its cost of capital. |
| Q | How did the Fund’s sector and industry allocations affect relative results? |
| A | In constructing the portfolio, we focus on picking stocks rather than on making sector or industry bets. Consequently, the Fund is similar to the MSCI® EAFE® Small Cap (net) Index in terms of its sector and industry allocations and its style. Changes in its sector or industry weights historically have not had a meaningful impact on relative returns. |
17
PORTFOLIO RESULTS
| Q | Did stock selection help or hurt Fund performance during the Reporting Period? |
| A | We seek to outpace the MSCI® EAFE® Small Cap (net) Index by overweighting stocks we expect to outperform and underweighting those we think may lag. At the same time, we strive to maintain a risk profile similar to the MSCI® EAFE® Small Cap (net) Index. The Fund’s investments are selected using fundamental research and a variety of quantitative techniques based on our investment themes. For example, the Fund aims to hold a basket of stocks with better Momentum characteristics than the benchmark. |
| During the Reporting Period, our stock picks dampened relative performance. Security selection in the health care, information technology and energy sectors detracted from relative returns. Investments in the financials, consumer discretionary and telecommunication services sectors contributed positively. |
| Q | Which Fund positions detracted most from results during the Reporting Period? |
| A | Detracting from relative returns was the Fund’s overweight in Takara Bio, a Japanese biomedical business; Tella, a Japanese company that engages in the research and development of regenerative and cell medicines; and Blinkx, a London-based Internet media platform. The Fund was overweight Takara Bio and Tella given our positive views on Momentum and Sentiment. The overweight in Blinkx was established because of our positive views on Momentum and Profitability. |
| Q | Which stock positions contributed most to the Fund’s relative returns during the Reporting Period? |
| A | The Fund benefited from overweighted positions in Adways, a Japanese digital advertising network and game publisher; Banca Popolare di Milano, an Italian cooperative bank; and Aperam, a Luxembourg-based producer of stainless and specialty steel. We chose to overweight Adways and Aperam because of our positive views on Momentum and Sentiment. The Fund’s overweight in Banca Popolare di Milano was due to our positive views on Momentum and Valuation. |
| Q | What impact did country selection have on the Fund’s relative performance during the Reporting Period? |
| A | To construct the portfolio, we focus on security selection rather than on making country bets. As a result, the Fund is similar to the MSCI® EAFE® Small Cap (net) Index in terms of its country allocation; changes in its country weightings are generally the result of our stock picking. That said, the Fund benefited during the Reporting Period from its overweights relative to the MSCI® EAFE® Small Cap (net) Index in the Netherlands, Germany and Switzerland. Compared to the MSCI® EAFE® Small Cap (net) Index, the Fund was hurt by its overweight in Japan and by its underweighted positions in Singapore and Finland. Security selection in all six countries added to returns. |
| Q | How did the Fund use derivatives and similar instruments during the Reporting Period? |
| A | During the Reporting Period, we used financial futures contracts to equitize the Fund’s cash holdings. In other words, we put the Fund’s cash holdings to work by using them as collateral for the purchase of financial futures contracts. |
| Q | What changes did you make to the Fund’s country weightings during the Reporting Period? |
| A | During the Reporting Period, we moved the Fund from an underweighted position relative to the Index in Hong Kong to an overweighted position. We increased the Fund’s overweights in Italy and France. In addition, we shifted the Fund from overweighted positions in Spain and Belgium to underweighted positions. We also increased the Fund’s underweight compared to the Index in the U.K. |
| Q | What were the Fund’s sector and country weightings at the end of the Reporting Period? |
| A | At the end of the Reporting Period, the Fund was overweight the industrials, information technology and utilities sectors relative to the Index. Compared to the Index, the Fund was underweight the consumer staples, financials, energy, consumer discretionary and telecommunication services sectors at the end of the Reporting Period. Compared to the Index, the Fund was relatively neutral to the health care and materials sectors at the end of the Reporting Period. |
| In terms of countries, the Fund was overweight Germany, Australia, Italy, the Netherlands, Switzerland, Japan, France and Sweden relative to the Index. The Fund was underweight compared to the Index in the U.K., Singapore, Finland, Norway, Israel, Ireland, Belgium and New Zealand at the end of the Reporting Period. At the end of the Reporting Period, the Fund was relatively neutral compared to the Index in Hong Kong, Denmark, Spain, Portugal and Austria. |
18
FUND BASICS
International Small Cap Insights Fund
as of April 30, 2014
| PERFORMANCE REVIEW | ||||||||||
| November 1, 2013–April 30, 2014 | Fund Total Return (based on NAV)1 | MSCI® EAFE® Small Cap (net) Index2 | ||||||||
| Class A | 5.00 | % | 5.38 | % | ||||||
| Class C | 4.56 | 5.38 | ||||||||
| Institutional | 5.22 | 5.38 | ||||||||
| Class IR | 5.20 | 5.38 | ||||||||
| 1 | The net asset value (NAV) represents the net assets of the class of the Fund (ex-dividend) divided by the total number of shares of the class outstanding. The Fund’s performance assumes the reinvestment of dividends and other distributions. The Fund’s performance does not reflect the deduction of any applicable sales charge. |
| 2 | The MSCI EAFE Small Cap (Net) Index (unhedged and net of dividend withholding taxes) is a free float-adjusted market capitalization index that is designed to measure developed market equity performance, excluding the US and Canada. MSCI selects the most liquid securities across developed markets relative to their market capitalization, and targets for index inclusion 40% of the full market capitalization of the eligible small cap universe within each industry group, within each country. Its returns include net reinvested dividends but, unlike Fund returns, do not reflect the payment of sales commissions or other expenses incurred in the purchase or sale of the securities included in the Index. It is not possible to invest directly in an index. |
| STANDARDIZED TOTAL RETURNS3 | ||||||||||||||||
| For the period ended 3/31/14 | One Year | Five Years | Since Inception | Inception Date | ||||||||||||
| Class A | 17.05 | % | 22.55 | % | 3.52 | % | 9/28/07 | |||||||||
| Class C | 21.85 | 23.00 | 3.67 | 9/28/07 | ||||||||||||
| Institutional | 24.47 | 24.40 | 4.85 | 9/28/07 | ||||||||||||
| Class IR | 24.22 | N/A | 17.64 | 8/31/10 | ||||||||||||
| 3 | The Standardized Total Returns are average annual total returns as of the most recent calendar quarter-end. They assume reinvestment of all distributions at NAV. These returns reflect a maximum initial sales charge of 5.5% for Class A Shares and the assumed contingent deferred sales charge for Class C Shares (1% if redeemed within 12 months of purchase). Because Institutional and Class IR Shares do not involve a sales charge, such a charge is not applied to their Standardized Total Returns. |
The returns set forth in the tables above represent past performance. Past performance does not guarantee future results. The Fund’s investment return and principal value will fluctuate so that an investor’s shares, when redeemed, may be worth more or less than their original cost. Current performance may be lower or higher than the performance quoted above. Please visit our web site at www.GSAMFUNDS.com to obtain the most recent month-end returns. Performance reflects applicable fee waivers and/or expense limitations in effect during the periods shown. In their absence, performance would be reduced. Returns do not reflect the deduction of taxes that a shareholder would pay on Fund distributions or the redemption of Fund shares.
19
FUND BASICS
| EXPENSE RATIOS4 | ||||||||||
| Net Expense Ratio (Current) | Gross Expense Ratio (Before Waivers) | |||||||||
| Class A | 1.30 | % | 1.48 | % | ||||||
| Class C | 2.05 | 2.24 | ||||||||
| Institutional | 0.90 | 1.07 | ||||||||
| Class IR | 1.05 | 1.26 | ||||||||
| 4 | The expense ratios of the Fund, both current (net of applicable fee waivers and/or expense limitations) and before waivers (gross of applicable fee waivers and/or expense limitations) are as set forth above according to the most recent publicly available Prospectus for the Fund and may differ from the expense ratios disclosed in the Financial Highlights in this report. The Fund’s waivers and/or expense limitations will remain in place through at least February 28, 2015, and prior to such date the Investment Adviser may not terminate the arrangements without the approval of the Fund’s Board of Trustees. If these arrangements are discontinued in the future, the expense ratios may change without shareholder approval. |
| TOP TEN HOLDINGS AS OF 4/30/145 | ||||||||||
| Holding | % of Total Net Assets | Line of Business | Country | |||||||
| Vestas Wind Systems A/S | 1.2 | % | Capital Goods | Denmark | ||||||
| Pennon Group PLC | 0.8 | Utilities | United Kingdom | |||||||
| Challenger Ltd. | 0.8 | Diversified Financials | Australia | |||||||
| CSR Ltd. | 0.7 | Materials | Australia | |||||||
| Banca Popolare di Milano Scarl | 0.7 | Banks | Italy | |||||||
| Leoni AG | 0.7 | Automobiles & Components | Germany | |||||||
| Thomas Cook Group PLC | 0.7 | Consumer Services | United Kingdom | |||||||
| Gamesa Corp. Tecnologica SA | 0.7 | Capital Goods | Spain | |||||||
| Investa Office Fund (REIT) | 0.7 | Real Estate | Australia | |||||||
| Nordex SE | 0.7 | Capital Goods | Germany | |||||||
| 5 | The top 10 holdings may not be representative of the Fund’s future investments. |
20
FUND BASICS
| FUND VS. BENCHMARK SECTOR ALLOCATIONS6 |
| As of April 30, 2014 |
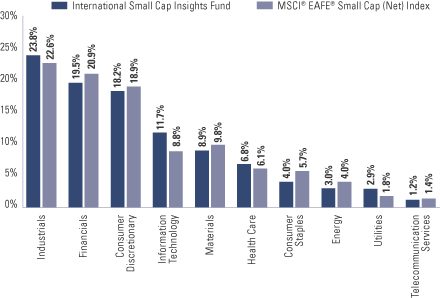
| 6 | The Fund is actively managed and, as such, its composition may differ over time. Consequently, the Fund’s overall industry sector allocations may differ from percentages contained in the graph above. The graph categorizes investments using Global Industry Classification Standard (“GICS”), however, the sector classifications used by the portfolio management team may differ from GICS. The percentage shown for each investment category reflects the value of investments in that category as a percentage of market value (excluding investments in the securities lending reinvestment vehicle, if any). Investments in the securities lending reinvestment vehicle represented 7.7% of the Fund’s net assets at April 30, 2014. The graph depicts the Fund’s investments but may not represent the Fund’s market exposure due to the exclusion of certain derivatives, if any, as listed in the Additional Investment Information section of the Schedule of Investments. |
21
GOLDMAN SACHS EMERGING MARKETS EQUITY INSIGHTS FUND
Schedule of Investments
April 30, 2014 (Unaudited)
Shares | Description | Value | ||||||
| Common Stocks – 92.0% | ||||||||
| Brazil – 6.4% | ||||||||
| 247,400 | AMBEV SA ADR (Food, Beverage & Tobacco) | $ | 1,793,650 | |||||
| 651,500 | Banco Bradesco SA (Banks) | 10,007,344 | ||||||
| 295,500 | Banco do Brasil SA (Banks) | 3,102,435 | ||||||
| 43,600 | Banco Santander Brasil SA ADR (Banks) | 289,940 | ||||||
| 550,000 | BRF SA (Food, Beverage & Tobacco) | 12,456,553 | ||||||
| 703,100 | Companhia de Saneamento Basico do Estado de Sao Paulo ADR (Utilities)(a) | 6,665,388 | ||||||
| 48,900 | Mahle-Metal Leve SA Industria e Comercio (Automobiles & Components) | 482,695 | ||||||
| 425,500 | Porto Seguro SA (Insurance) | 6,201,929 | ||||||
| 54,200 | Sul America SA (Insurance) | 397,430 | ||||||
|
| |||||||
| 41,397,364 | ||||||||
|
| |||||||
| Chile – 0.6% | ||||||||
| 73,093 | Latam Airlines Group SA (Transportation) | 1,116,794 | ||||||
| 86,854 | Sociedad Quimica y Minera de Chile SA ADR (Materials)(a) | 2,770,643 | ||||||
|
| |||||||
| 3,887,437 | ||||||||
|
| |||||||
| China – 17.2% | ||||||||
| 63,000 | AAC Technologies Holdings, Inc. (Technology Hardware & Equipment) | 352,758 | ||||||
| 22,731,000 | Agricultural Bank of China Ltd. Class H (Banks) | 9,564,767 | ||||||
| 2,241,500 | Anhui Conch Cement Co. Ltd. Class H (Materials)(a) | 8,369,205 | ||||||
| 36,255,000 | Bank of China Ltd. Class H (Banks) | 15,973,898 | ||||||
| 27,102,000 | China Construction Bank Corp. Class H (Banks) | 18,764,710 | ||||||
| 4,407,000 | China Merchants Bank Co. Ltd. Class H (Banks) | 7,896,376 | ||||||
| 1,194,000 | China Railway Construction Corp. Ltd. Class H (Capital Goods) | 990,837 | ||||||
| 1,595,000 | China Shanshui Cement Group Ltd. (Materials) | 616,987 | ||||||
| 1,464,000 | CNOOC Ltd. (Energy) | 2,419,771 | ||||||
| 3,912,500 | Fosun International Ltd. (Materials)(a) | 4,743,597 | ||||||
| 944,000 | Haitian International Holdings Ltd. (Capital Goods) | 1,901,799 | ||||||
| 3,246,000 | Huaneng Power International, Inc. Class H (Utilities) | 3,177,468 | ||||||
| 19,962,000 | Industrial & Commercial Bank of China Ltd. Class H (Banks) | 11,927,659 | ||||||
| 686,000 | Jiangsu Expressway Co. Ltd. Class H (Transportation) | 772,853 | ||||||
| 8,530,000 | PetroChina Co. Ltd. Class H (Energy) | 9,841,702 | ||||||
| 173,500 | Shanghai Pharmaceuticals Holding Co. Ltd. Class H (Health Care Equipment & Services) | 317,776 | ||||||
|
| |||||||
| Common Stocks – (continued) | ||||||||
| China – (continued) | ||||||||
| 6,041,000 | Sihuan Pharmaceutical Holdings Group Ltd. (Pharmaceuticals, Biotechnology & Life Sciences) | $ | 6,677,185 | |||||
| 116,600 | Tencent Holdings Ltd. (Software & Services) | 7,341,130 | ||||||
|
| |||||||
| 111,650,478 | ||||||||
|
| |||||||
| Greece – 0.1% | ||||||||
| 26,675 | Hellenic Telecommunications Organization SA (Telecommunication Services)* | 426,153 | ||||||
|
| |||||||
| Hong Kong – 3.0% | ||||||||
| 376,000 | China Gas Holdings Ltd. (Utilities) | 612,053 | ||||||
| 3,844,000 | China Power International Development Ltd. (Utilities) | 1,384,078 | ||||||
| 1,040,000 | China Resources Cement Holdings Ltd. (Materials) | 724,016 | ||||||
| 4,236,000 | China Resources Power Holdings Co. Ltd. (Utilities) | 10,646,591 | ||||||
| 8,860,000 | GCL-Poly Energy Holdings Ltd. (Semiconductors & Semiconductor Equipment)* | 2,661,284 | ||||||
| 728,000 | Guangdong Investment Ltd. (Utilities) | 791,487 | ||||||
| 803,500 | NetDragon Websoft, Inc. (Software & Services) | 1,375,678 | ||||||
| 1,572,000 | Sino Biopharmaceutical Ltd. (Pharmaceuticals, Biotechnology & Life Sciences) | 1,233,671 | ||||||
|
| |||||||
| 19,428,858 | ||||||||
|
| |||||||
| Hungary – 0.6% | ||||||||
| 229,992 | Magyar Telekom Telecommunications PLC (Telecommunication Services) | 328,124 | ||||||
| 192,914 | Richter Gedeon Nyrt (Pharmaceuticals, Biotechnology & Life Sciences) | 3,304,124 | ||||||
|
| |||||||
| 3,632,248 | ||||||||
|
| |||||||
| India – 8.2% | ||||||||
| 58,196 | Bajaj Holdings and Investment Ltd. (Diversified Financials) | 1,012,725 | ||||||
| 1,525,396 | Cairn India Ltd. (Energy) | 8,484,077 | ||||||
| 59,398 | CESC Ltd. (Utilities) | 448,578 | ||||||
| 582,504 | GAIL India Ltd. (Utilities) | 3,577,622 | ||||||
| 283,304 | HCL Technologies Ltd. (Software & Services) | 6,592,597 | ||||||
| 182,056 | Lupin Ltd. (Pharmaceuticals, Biotechnology & Life Sciences) | 3,108,179 | ||||||
| 1,215,282 | Oil & Natural Gas Corp. Ltd. (Energy) | 6,560,141 | ||||||
| 502,620 | Reliance Industries Ltd. (Energy) | 7,812,785 | ||||||
| 671,208 | Sun Pharmaceutical Industries Ltd. (Pharmaceuticals, Biotechnology & Life Sciences) | 7,051,197 | ||||||
|
| |||||||
| 22 | The accompanying notes are an integral part of these financial statements. |
GOLDMAN SACHS EMERGING MARKETS EQUITY INSIGHTS FUND
Shares | Description | Value | ||||||
| Common Stocks – (continued) | ||||||||
| India – (continued) | ||||||||
| 610,117 | Tata Motors Ltd. (Automobiles & Components) | $ | 4,220,339 | |||||
| 482,711 | Wipro Ltd. (Software & Services) | 4,183,534 | ||||||
|
| |||||||
| 53,051,774 | ||||||||
|
| |||||||
| Indonesia – 2.2% | ||||||||
| 479,600 | PT Astra Agro Lestari Tbk (Food, Beverage & Tobacco) | 1,221,151 | ||||||
| 1,537,000 | PT Astra International Tbk (Automobiles & Components) | 990,277 | ||||||
| 7,521,400 | PT Bank Mandiri (Persero) Tbk (Banks) | 6,426,406 | ||||||
| 1,520,500 | PT Bank Negara Indonesia (Persero) Tbk (Banks) | 635,485 | ||||||
| 1,901,400 | PT Bank Rakyat Indonesia (Persero) Tbk (Banks) | 1,632,838 | ||||||
| 1,222,900 | PT Indofood Sukses Makmur Tbk (Food, Beverage & Tobacco) | 748,087 | ||||||
| 3,040,800 | PT Perusahaan Gas Negara (Persero) Tbk (Utilities) | 1,404,405 | ||||||
| 659,600 | PT United Tractors Tbk (Capital Goods) | 1,240,134 | ||||||
|
| |||||||
| 14,298,783 | ||||||||
|
| |||||||
| Malaysia – 1.1% | ||||||||
| 5,601,200 | Genting Malaysia Bhd (Consumer Services) | 7,244,911 | ||||||
| 462,105 | YTL Power International Bhd (Utilities)* | 222,369 | ||||||
|
| |||||||
| 7,467,280 | ||||||||
|
| |||||||
| Mexico – 6.6% | ||||||||
| 602,580 | America Movil SAB de CV Series L ADR (Telecommunication Services) | 12,099,806 | ||||||
| 548,376 | Cemex SAB de CV ADR (Materials)* | 6,931,473 | ||||||
| 389,900 | Gruma SAB de CV Class B (Food, Beverage & Tobacco)* | 3,444,585 | ||||||
| 58,910 | Grupo Aeroportuario del Pacifico SAB de CV ADR (Transportation) | 3,552,273 | ||||||
| 77,760 | Grupo Aeroportuario del Sureste SAB de CV ADR (Transportation) | 9,506,160 | ||||||
| 464,800 | Grupo Bimbo SAB de CV Series A (Food, Beverage & Tobacco) | 1,283,971 | ||||||
| 90,900 | Grupo Carso SAB de CV Series A-1 (Capital Goods) | 462,047 | ||||||
| 1,978,600 | Kimberly-Clark de Mexico SAB de CV Class A (Household & Personal Products) | 5,143,581 | ||||||
| 37,800 | Promotora y Operadora de Infraestructura SAB de CV (Capital Goods)* | 528,338 | ||||||
|
| |||||||
| 42,952,234 | ||||||||
|
| |||||||
| Philippines – 0.1% | ||||||||
| 262,870 | Universal Robina Corp. (Food, Beverage & Tobacco) | 863,203 | ||||||
|
| |||||||
| Common Stocks – (continued) | ||||||||
| Poland – 3.2% | ||||||||
| 9,842 | Bank Pekao SA (Banks) | $ | 631,664 | |||||
| 7,531 | Bank Zachodni WBK SA (Banks) | 925,949 | ||||||
| 77,702 | KGHM Polska Miedz SA (Materials) | 2,813,429 | ||||||
| 776,384 | PGE SA (Utilities) | 5,394,940 | ||||||
| 78,120 | Powszechny Zaklad Ubezpieczen SA (Insurance) | 11,081,404 | ||||||
|
| |||||||
| 20,847,386 | ||||||||
|
| |||||||
| Russia – 4.9% | ||||||||
| 1,624,925 | OAO Gazprom ADR (Energy) | 11,743,231 | ||||||
| 87,506 | OAO Lukoil ADR (Energy) | 4,632,520 | ||||||
| 571,880 | OAO Rosneft GDR (Energy) | 3,595,467 | ||||||
| 40,696 | OAO Tatneft ADR (Energy) | 1,399,802 | ||||||
| 5,005,340 | Sberbank of Russia (Banks)* | 10,214,288 | ||||||
|
| |||||||
| 31,585,308 | ||||||||
|
| |||||||
| South Africa – 6.3% | ||||||||
| 98,195 | African Rainbow Minerals Ltd. (Materials) | 1,848,927 | ||||||
| 183,871 | Investec Ltd. (Diversified Financials) | 1,618,327 | ||||||
| 366,527 | Liberty Holdings Ltd. (Insurance) | 4,396,533 | ||||||
| 612,825 | Life Healthcare Group Holdings Ltd. (Health Care Equipment & Services) | 2,436,928 | ||||||
| 465,040 | Mondi Ltd. (Materials) | 7,743,665 | ||||||
| 402,558 | MTN Group Ltd. (Telecommunication Services) | 8,076,043 | ||||||
| 95,390 | Nedbank Group Ltd. (Banks) | 2,044,867 | ||||||
| 62,716 | Sasol Ltd. (Energy) | 3,514,876 | ||||||
| 1,444,796 | Sibanye Gold Ltd. (Materials) | 3,731,955 | ||||||
| 123,706 | Sun International Ltd. (Consumer Services) | 1,222,891 | ||||||
| 568,608 | Super Group Ltd. (Retailing)* | 1,532,070 | ||||||
| 225,509 | Vodacom Group Ltd. (Telecommunication Services) | 2,691,259 | ||||||
|
| |||||||
| 40,858,341 | ||||||||
|
| |||||||
| South Korea – 12.7% | ||||||||
| 3,432 | Dong-A ST Co. Ltd. (Pharmaceuticals, Biotechnology & Life Sciences) | 352,526 | ||||||
| 97,490 | Hansol Paper Co. Ltd. (Materials) | 1,073,774 | ||||||
| 20,790 | Hyundai Corp. (Capital Goods) | 634,889 | ||||||
| 30,330 | Hyundai Development Co. – Engineering & Construction (Capital Goods) | 869,578 | ||||||
| 1,195 | Hyundai Mobis (Automobiles & Components) | 341,392 | ||||||
| 2,054 | Hyundai Motor Co. (Automobiles & Components) | 457,973 | ||||||
| 5,240 | KCC Corp. (Capital Goods) | 2,613,061 | ||||||
| 223,565 | Kia Motors Corp. (Automobiles & Components) | 12,403,885 | ||||||
| 21,893 | Korea Gas Corp. (Utilities)* | 1,311,098 | ||||||
| 39,526 | KT&G Corp. (Food, Beverage & Tobacco) | 3,167,694 | ||||||
| 171,280 | LG Uplus Corp. (Telecommunication Services) | 1,686,910 | ||||||
|
| |||||||
| The accompanying notes are an integral part of these financial statements. | 23 |
GOLDMAN SACHS EMERGING MARKETS EQUITY INSIGHTS FUND
Schedule of Investments (continued)
April 30, 2014 (Unaudited)
Shares | Description | Value | ||||||
| Common Stocks – (continued) | ||||||||
| South Korea – (continued) | ||||||||
| 27,166 | Mando Corp. (Automobiles & Components) | $ | 3,268,009 | |||||
| 11,456 | NCSoft Corp. (Software & Services) | 2,279,507 | ||||||
| 21,767 | Samsung Electronics Co. Ltd. (Semiconductors & Semiconductor Equipment) | 28,383,322 | ||||||
| 14,855 | Samyang Holdings Corp. (Food, Beverage & Tobacco) | 1,035,969 | ||||||
| 39,762 | SK Holdings Co. Ltd. (Capital Goods) | 7,052,997 | ||||||
| 345,130 | SK Hynix, Inc. (Semiconductors & Semiconductor Equipment)* | 13,457,821 | ||||||
| 3,920 | SK Telecom Co. Ltd. (Telecommunication Services) | 811,656 | ||||||
| 88,764 | Sungwoo Hitech Co. Ltd. (Automobiles & Components) | 1,433,805 | ||||||
|
| |||||||
| 82,635,866 | ||||||||
|
| |||||||
| Taiwan – 13.1% | ||||||||
| 1,231,000 | AcBel Polytech, Inc. (Capital Goods) | 1,617,519 | ||||||
| 3,025,000 | Asia Cement Corp. (Materials) | 3,979,676 | ||||||
| 348,000 | Chicony Electronics Co. Ltd. (Technology Hardware & Equipment) | 906,249 | ||||||
| 1,006,000 | Chin-Poon Industrial Co. Ltd. (Technology Hardware & Equipment) | 1,888,269 | ||||||
| 1,795,000 | Elitegroup Computer Systems Co. Ltd. (Technology Hardware & Equipment) | 1,330,326 | ||||||
| 1,354,000 | Faraday Technology Corp. (Semiconductors & Semiconductor Equipment) | 1,845,614 | ||||||
| 4,420,000 | Fubon Financial Holding Co. Ltd. (Diversified Financials) | 5,720,728 | ||||||
| 636,000 | Gigabyte Technology Co. Ltd. (Technology Hardware & Equipment) | 993,368 | ||||||
| 545,000 | Grape King Bio Ltd. (Household & Personal Products) | 2,443,788 | ||||||
| 156,000 | Holtek Semiconductor, Inc. (Semiconductors & Semiconductor Equipment) | 280,900 | ||||||
| 775,000 | Hon Hai Precision Industry Co. Ltd. (Technology Hardware & Equipment) | 2,225,770 | ||||||
| 729,000 | Huang Hsiang Construction Co. (Real Estate) | 1,109,118 | ||||||
| 1,659,000 | King Yuan Electronics Co. Ltd. (Semiconductors & Semiconductor Equipment) | 1,266,879 | ||||||
| 1,098,000 | Lite-On Technology Corp. (Technology Hardware & Equipment) | 1,679,690 | ||||||
| 80,000 | Merry Electronics Co. Ltd. (Consumer Durables & Apparel) | 434,976 | ||||||
| 552,000 | Nien Hsing Textile Co. Ltd. (Consumer Durables & Apparel) | 544,689 | ||||||
| 170,000 | Radiant Opto-Electronics Corp. (Semiconductors & Semiconductor Equipment) | 685,401 | ||||||
| 356,000 | Simplo Technology Co. Ltd. (Technology Hardware & Equipment) | 1,854,608 | ||||||
|
| |||||||
| Common Stocks – (continued) | ||||||||
| Taiwan – (continued) | ||||||||
| 111,000 | Sirtec International Co. Ltd. (Technology Hardware & Equipment) | $ | 201,940 | |||||
| 1,787,000 | Taiflex Scientific Co. Ltd. (Technology Hardware & Equipment) | 3,473,675 | ||||||
| 4,516,000 | Taiwan Cement Corp. (Materials) | 7,175,645 | ||||||
| 1,314,200 | Taiwan Semiconductor Manufacturing Co. Ltd. ADR (Semiconductors & Semiconductor Equipment) | 26,415,420 | ||||||
| 6,466,000 | Teco Electric and Machinery Co. Ltd. (Capital Goods) | 7,031,512 | ||||||
| 820,000 | TXC Corp. (Technology Hardware & Equipment) | 1,184,794 | ||||||
| 515,000 | United Integrated Services Co. Ltd. (Capital Goods) | 562,859 | ||||||
| 4,015,000 | Vanguard International Semiconductor Corp. (Semiconductors & Semiconductor Equipment) | 5,502,115 | ||||||
| 1,163,000 | Wistron NeWeb Corp. (Technology Hardware & Equipment) | 2,717,401 | ||||||
|
| |||||||
| 85,072,929 | ||||||||
|
| |||||||
| Thailand – 2.4% | ||||||||
| 1,428,700 | Airports of Thailand PCL (Transportation) | 8,628,291 | ||||||
| 2,670,100 | BTS Group Holdings PCL (Transportation) | 690,316 | ||||||
| 245,800 | Delta Electronics Thailand PCL (Technology Hardware & Equipment) | 434,206 | ||||||
| 744,800 | PTT Exploration & Production PCL (Energy) | 3,676,183 | ||||||
| 465,500 | PTT Global Chemical PCL (Materials) | 1,004,804 | ||||||
| 112,700 | PTT PCL (Energy) | 1,091,119 | ||||||
| 486,000 | Thai Beverage PCL (Food, Beverage & Tobacco) | 229,306 | ||||||
|
| |||||||
| 15,754,225 | ||||||||
|
| |||||||
| Turkey – 3.3% | ||||||||
| 210,063 | Aksa Akrilik Kimya Sanayii (Consumer Durables & Apparel) | 732,603 | ||||||
| 69,405 | Arcelik AS (Consumer Durables & Apparel) | 429,007 | ||||||
| 88,420 | Cimsa Cimento Sanayi VE Tica (Materials) | 516,476 | ||||||
| 773,855 | Emlak Konut Gayrimenkul Yatirim Ortakligi AS (REIT) | 1,016,160 | ||||||
| 7,295,031 | Eregli Demir ve Celik Fabrikalari TAS (Materials) | 10,150,870 | ||||||
| 314,330 | Koza Altin Isletmeleri AS (Materials) | 3,152,022 | ||||||
| 687,135 | Tofas Turk Otomobil Fabrikasi AS (Automobiles & Components) | 4,217,488 | ||||||
| 448,891 | Turk Hava Yollari (Transportation) | 1,441,299 | ||||||
|
| |||||||
| 21,655,925 | ||||||||
|
| |||||||
| TOTAL COMMON STOCKS | ||||||||
| (Cost $572,339,903) | $ | 597,465,792 | ||||||
|
| |||||||
| 24 | The accompanying notes are an integral part of these financial statements. |
GOLDMAN SACHS EMERGING MARKETS EQUITY INSIGHTS FUND
Shares | Description | Value | ||||||
| Preferred Stocks – 5.5% | ||||||||
| Brazil – 4.5% | ||||||||
| 116,300 | Companhia Energetica de Minas Gerais (Utilities) | $ | 886,170 | |||||
| 1,007,600 | Itau Unibanco Holding SA ADR (Banks) | 16,484,336 | ||||||
| 2,696,300 | Itausa – Investimentos Itau SA (Banks) | 11,850,539 | ||||||
|
| |||||||
| 29,221,045 | ||||||||
|
| |||||||
| Russia – 0.2% | ||||||||
| 1,187,584 | OAO Surgutneftegas (Energy) | 829,538 | ||||||
| 283,900 | Sberbank of Russia (Banks)* | 480,932 | ||||||
|
| |||||||
| 1,310,470 | ||||||||
|
| |||||||
| South Korea – 0.8% | ||||||||
| 7,683 | Hyundai Motor Co. (Automobiles & Components) | 1,078,566 | ||||||
| 3,919 | Samsung Electronics Co. Ltd. (Semiconductors & Semiconductor Equipment) | 3,940,866 | ||||||
|
| |||||||
| 5,019,432 | ||||||||
|
| |||||||
| TOTAL PREFERRED STOCKS | ||||||||
| (Cost $27,086,150) | $ | 35,550,947 | ||||||
|
| |||||||
| Exchange Traded Fund – 1.5% | ||||||||
| United States – 1.5% | ||||||||
| 235,548 | Vanguard FTSE Emerging Markets Fund(a) | $ | 9,643,335 | |||||
| (Cost $9,205,574) | ||||||||
|
| |||||||
| Units | Description | Expiration Month | Value | |||||||
| Right – 0.0% | ||||||||||
| China – 0.0% | ||||||||||
| 305,175 | Fosun International Ltd. (Materials)* | 05/14 | $ | 1,378 | ||||||
| (Cost $0) | ||||||||||
| ||||||||||
| Warrant – 0.0% | ||||||||||
| Thailand – 0.0% | ||||||||||
| 1,567,600 | BTS Group Holdings PCL (Transportation)* | 01/18 | $ | 39,239 | ||||||
| (Cost $0) | ||||||||||
| ||||||||||
| TOTAL INVESTMENTS BEFORE SECURITIES LENDING REINVESTMENT VEHICLE | ||||||||||
| (Cost $608,631,627) | $ | 642,700,691 | ||||||||
| ||||||||||
| Shares | Distribution Rate | Value | ||||
| Securities Lending Reinvestment Vehicle(a)(b)(c) – 2.4% | ||||||
Goldman Sachs Financial Square Money Market Fund – FST Shares |
| |||||
| 15,680,600 | 0.067% | $ | 15,680,600 | |||
| (Cost $15,680,600) | ||||||
| ||||||
| TOTAL INVESTMENTS – 101.4% | ||||||
| (Cost $624,312,227) | $ | 658,381,291 | ||||
| ||||||
| LIABILITIES IN EXCESS OF OTHER ASSETS – (1.4)% | (9,383,214 | ) | ||||
| ||||||
| NET ASSETS – 100.0% | $ | 648,998,077 | ||||
| ||||||
| The percentage shown for each investment category reflects the value of investments in that category as a percentage of net assets. | ||
* | Non-income producing security. | |
(a) | All or a portion of security is on loan. | |
(b) | Variable rate security. Interest rate or distribution rate disclosed is that which is in effect at April 30, 2014. | |
(c) | Represents an affiliated issuer. | |
| ||
Investment Abbreviations: | ||
ADR | —American Depositary Receipt | |
GDR | —Global Depositary Receipt | |
REIT | —Real Estate Investment Trust | |
| ||
| The accompanying notes are an integral part of these financial statements. | 25 |
GOLDMAN SACHS INTERNATIONAL EQUITY INSIGHTS FUND
Schedule of Investments
April 30, 2014 (Unaudited)
| Shares | Description | Value | ||||||
| Common Stocks – 94.5% | ||||||||
| Australia – 6.6% | ||||||||
| 4,291,684 | Arrium Ltd. (Materials) | $ | 4,782,890 | |||||
| 183,942 | Aurizon Holdings Ltd. (Transportation) | 888,113 | ||||||
| 260,150 | Australand Property Group (REIT) | 1,036,815 | ||||||
| 258,397 | BHP Billiton Ltd. (Materials) | 9,099,867 | ||||||
| 169,208 | Commonwealth Bank of Australia (Banks) | 12,447,097 | ||||||
| 392,682 | CSR Ltd. (Materials) | 1,337,322 | ||||||
| 198,156 | Goodman Group (REIT) | 920,425 | ||||||
| 375,579 | Investa Office Fund (REIT) | 1,169,279 | ||||||
| 111,107 | Macquarie Group Ltd. (Diversified Financials) | 5,985,988 | ||||||
| 295,402 | Metcash Ltd. (Food & Staples Retailing) | 763,119 | ||||||
| 2,080,095 | Mount Gibson Iron Ltd. (Materials) | 1,420,554 | ||||||
| 30,592 | National Australia Bank Ltd. (Banks) | 1,007,314 | ||||||
| 204,121 | Origin Energy Ltd. (Energy) | 2,835,627 | ||||||
| 52,053 | Ramsay Health Care Ltd. (Health Care Equipment & Services) | 2,174,983 | ||||||
| 1,196,003 | Telstra Corp. Ltd. (Telecommunication Services) | 5,815,092 | ||||||
| 498,327 | Westfield Group (REIT) | 5,085,062 | ||||||
| 182,803 | Woodside Petroleum Ltd. (Energy) | 6,948,547 | ||||||
|
| |||||||
| 63,718,094 | ||||||||
|
| |||||||
| Austria – 0.1% | ||||||||
| 14,316 | OMV AG (Energy) | 669,337 | ||||||
| 12,493 | Voestalpine AG (Materials) | 570,673 | ||||||
|
| |||||||
| 1,240,010 | ||||||||
|
| |||||||
| Belgium – 0.9% | ||||||||
| 145,974 | KBC Groep NV (Banks) | 8,907,761 | ||||||
|
| |||||||
| China – 0.3% | ||||||||
| 473,000 | AAC Technologies Holdings, Inc. (Technology Hardware & Equipment) | 2,648,484 | ||||||
|
| |||||||
| Denmark – 1.1% | ||||||||
| 19,814 | H Lundbeck A/S (Pharmaceuticals, Biotechnology & Life Sciences) | 577,478 | ||||||
| 215,250 | Vestas Wind Systems A/S (Capital Goods)* | 9,559,492 | ||||||
|
| |||||||
| 10,136,970 | ||||||||
|
| |||||||
| Finland – 1.9% | ||||||||
| 335,935 | Neste Oil OYJ (Energy)(a) | 6,897,679 | ||||||
| 69,604 | Sampo (Insurance) | 3,459,293 | ||||||
| 628,007 | Stora Enso OYJ (Materials)(a) | 6,412,972 | ||||||
| 76,826 | UPM-Kymmene OYJ (Materials) | 1,345,516 | ||||||
|
| |||||||
| 18,115,460 | ||||||||
|
| |||||||
| France – 9.3% | ||||||||
| 142,912 | BNP Paribas SA (Banks) | 10,739,054 | ||||||
| 21,862 | Cap Gemini SA (Software & Services) | 1,544,632 | ||||||
|
| |||||||
| Common Stocks – (continued) | ||||||||
| France – (continued) | ||||||||
| 95,271 | Compagnie Generale des Etablissements Michelin (Automobiles & Components) | $ | 11,683,163 | |||||
| 331,818 | Credit Agricole SA (Banks) (REIT)* | 5,235,576 | ||||||
| 186,467 | Electricite de France (Utilities) | 7,160,509 | ||||||
| 2,545 | Euler Hermes SA (Insurance) | 307,064 | ||||||
| 34,797 | Fonciere Des Regions (REIT)* | 3,534,499 | ||||||
| 9,942 | Gecina SA(a) | 1,338,216 | ||||||
| 167,650 | Lagardere SCA (Media) | 7,026,306 | ||||||
| 16,424 | L’Oreal SA (Household & Personal Products)(a) | 2,830,599 | ||||||
| 19,239 | Metropole Television SA (Media) | 412,113 | ||||||
| 1,240,483 | Natixis (Banks) | 8,805,768 | ||||||
| 30,525 | Plastic Omnium SA (Automobiles & Components)* | 1,038,625 | ||||||
| 3,221 | Renault SA (Automobiles & Components) | 314,917 | ||||||
| 290,765 | Suez Environnement Co. (Utilities) | 5,713,398 | ||||||
| 36,996 | Thales SA (Capital Goods) | 2,355,730 | ||||||
| 61,823 | Total SA (Energy) | 4,423,078 | ||||||
| 24,776 | Valeo SA (Automobiles & Components) | 3,402,471 | ||||||
| 158,563 | Vinci SA (Capital Goods) | 11,972,523 | ||||||
|
| |||||||
| 89,838,241 | ||||||||
|
| |||||||
| Germany – 8.6% | ||||||||
| 9,064 | Axel Springer SE (Media) | 553,466 | ||||||
| 68,460 | BASF SE (Materials)*(a) | 7,941,757 | ||||||
| 17,301 | Celesio AG (Health Care Equipment & Services)(a) | 601,285 | ||||||
| 6,022 | Continental AG (Automobiles & Components) | 1,417,006 | ||||||
| 235,174 | Deutsche Lufthansa AG (Registered) (Transportation)(a) | 5,905,886 | ||||||
| 645,235 | Deutsche Telekom AG (Registered) (Telecommunication Services) | 10,840,645 | ||||||
| 79,748 | Drillisch AG (Telecommunication Services)(a) | 2,977,650 | ||||||
| 41,403 | Duerr AG (Capital Goods)*(a) | 3,276,045 | ||||||
| 483,159 | E.ON SE (Utilities)(a) | 9,254,844 | ||||||
| 131,519 | Freenet AG (Telecommunication Services)* | 4,554,917 | ||||||
| 19,745 | Henkel AG & Co. KGaA (Household & Personal Products) | 2,030,149 | ||||||
| 3,488 | Hochtief AG (Capital Goods) | 325,206 | ||||||
| 82,477 | Leoni AG (Automobiles & Components) | 6,147,799 | ||||||
| 44,251 | Merck KGaA (Pharmaceuticals, Biotechnology & Life Sciences)* | 7,480,361 | ||||||
| 339,177 | Nordex SE (Capital Goods)* | 5,430,465 | ||||||
| 65,862 | ProSiebenSat.1 Media AG (Registered) (Media) | 2,882,640 | ||||||
| 9,623 | Sixt SE (Transportation) | 389,107 | ||||||
|
| |||||||
| 26 | The accompanying notes are an integral part of these financial statements. |
GOLDMAN SACHS INTERNATIONAL EQUITY INSIGHTS FUND
| Shares | Description | Value | ||||||
| Common Stocks – (continued) | ||||||||
| Germany – (continued) | ||||||||
| 342,911 | TUI AG (Consumer Services) | $ | 5,709,876 | |||||
| 118,570 | United Internet AG (Registered) (Software & Services) | 5,093,672 | ||||||
|
| |||||||
| 82,812,776 | ||||||||
|
| |||||||
| Hong Kong – 2.5% | ||||||||
| 134,000 | Cheung Kong Infrastructure Holdings Ltd. (Utilities) | 875,697 | ||||||
| 471,000 | Hutchison Whampoa Ltd. (Capital Goods) | 6,461,885 | ||||||
| 509,200 | MGM China Holdings Ltd. (Consumer Services) | 1,779,239 | ||||||
| 851,000 | Noble Group Ltd. (Capital Goods) | 876,259 | ||||||
| 192,400 | Sands China Ltd. (Consumer Services) | 1,412,555 | ||||||
| 1,906,000 | SJM Holdings Ltd. (Consumer Services) | 5,302,364 | ||||||
| 393,000 | Wheelock & Co. Ltd. (Real Estate) | 1,622,158 | ||||||
| 1,346,400 | Wynn Macau Ltd. (Consumer Services) | 5,328,475 | ||||||
|
| |||||||
| 23,658,632 | ||||||||
|
| |||||||
| Ireland – 0.5% | ||||||||
| 489,992 | Beazley PLC (Insurance) | 2,032,673 | ||||||
| 40,301 | Shire PLC (Pharmaceuticals, Biotechnology & Life Sciences) | 2,304,895 | ||||||
|
| |||||||
| 4,337,568 | ||||||||
|
| |||||||
| Italy – 2.1% | ||||||||
| 1,181,628 | A2A SpA (Utilities) | 1,445,963 | ||||||
| 16,804,750 | Banca Monte dei Paschi di Siena SpA (Banks)*(a) | 5,616,499 | ||||||
| 5,713,059 | Banca Popolare di Milano Scarl (Banks)*(a) | 5,777,643 | ||||||
| 109,239 | Buzzi Unicem SpA (Materials) | 1,937,937 | ||||||
| 43,094 | Credito Emiliano SpA (Banks)(a) | 441,764 | ||||||
| 68,718 | Fiat SpA (Automobiles & Components)* | 829,614 | ||||||
| 111,874 | Parmalat SpA (Food, Beverage & Tobacco) | 388,675 | ||||||
| 361,759 | Salini Impregilo SpA (Capital Goods) | 2,310,984 | ||||||
| 122,015 | UniCredit SpA (Banks) | 1,093,212 | ||||||
| 53,149 | Unione di Banche Italiane SCpA (Banks) | 507,334 | ||||||
|
| |||||||
| 20,349,625 | ||||||||
|
| |||||||
| Japan – 20.5% | ||||||||
| 25,500 | Alpine Electronics, Inc. (Consumer Durables & Apparel) | 304,023 | ||||||
| 185,000 | Amada Co. Ltd. (Capital Goods) | 1,337,957 | ||||||
| 566,500 | Astellas Pharma, Inc. (Pharmaceuticals, Biotechnology & Life Sciences) | 6,316,188 | ||||||
| 117,500 | Calbee, Inc. (Food, Beverage & Tobacco) | 2,881,550 | ||||||
|
| |||||||
| Common Stocks – (continued) | ||||||||
| Japan – (continued) | ||||||||
| 93,200 | Chubu Electric Power Co., Inc. (Utilities)* | $ | 1,061,602 | |||||
| 406,800 | Daiichi Sankyo Co. Ltd. (Pharmaceuticals, Biotechnology & Life Sciences) | 6,823,784 | ||||||
| 278,000 | Daiwa Securities Group, Inc. (Diversified Financials) | 2,084,567 | ||||||
| 205,800 | FUJIFILM Holdings Corp. (Technology Hardware & Equipment) | 5,316,242 | ||||||
| 92,000 | Fujitsu General Ltd. (Consumer Durables & Apparel) | 1,061,673 | ||||||
| 119,900 | GMO Internet, Inc. (Software & Services) | 1,059,276 | ||||||
| 84,300 | Gree, Inc. (Software & Services)(a) | 824,350 | ||||||
| 64,500 | ITOCHU Corp. (Capital Goods) | 723,032 | ||||||
| 99,700 | Japan Airlines Co. Ltd. (Transportation) | 5,161,412 | ||||||
| 283,500 | Japan Tobacco, Inc. (Food, Beverage & Tobacco) | 9,318,241 | ||||||
| 2,581,000 | Kawasaki Kisen Kaisha Ltd. (Transportation) | 5,182,510 | ||||||
| 6,300 | KDDI Corp. (Telecommunication Services) | 335,990 | ||||||
| 93,800 | Kirin Holdings Co. Ltd. (Food, Beverage & Tobacco) | 1,299,133 | ||||||
| 399,000 | Konica Minolta, Inc. (Technology Hardware & Equipment) | 3,717,934 | ||||||
| 510,000 | Kubota Corp. (Capital Goods) | 6,573,148 | ||||||
| 149,800 | Kyocera Corp. (Technology Hardware & Equipment) | 7,045,079 | ||||||
| 37,900 | Kyushu Electric Power Co., Inc. (Utilities) | 382,395 | ||||||
| 1,590,000 | Mazda Motor Corp. (Automobiles & Components) | 7,109,275 | ||||||
| 221,000 | Mitsubishi Electric Corp. (Capital Goods) | 2,516,490 | ||||||
| 2,121,000 | Mitsubishi UFJ Financial Group, Inc. (Banks) | 11,282,654 | ||||||
| 1,479,000 | Mitsui OSK Lines Ltd. (Transportation) | 4,934,046 | ||||||
| 625,100 | Mizuho Financial Group, Inc. (Banks) | 1,224,326 | ||||||
| 54,400 | MS&AD Insurance Group Holdings, Inc. (Insurance) | 1,220,309 | ||||||
| 148,300 | Nexon Co. Ltd. (Software & Services) | 1,155,059 | ||||||
| 1,268,000 | Nippon Electric Glass Co. Ltd. (Technology Hardware & Equipment) | 6,202,952 | ||||||
| 135,000 | Nippon Meat Packers, Inc. (Food, Beverage & Tobacco) | 2,339,736 | ||||||
| 75,600 | Nippon Telegraph & Telephone Corp. (Telecommunication Services) | 4,195,254 | ||||||
| 19,300 | Nissin Foods Holdings Co. Ltd. (Food, Beverage & Tobacco) | 923,829 | ||||||
| 1,173,500 | Nomura Holdings, Inc. (Diversified Financials) | 6,795,591 | ||||||
|
| |||||||
| The accompanying notes are an integral part of these financial statements. | 27 |
GOLDMAN SACHS INTERNATIONAL EQUITY INSIGHTS FUND
Schedule of Investments (continued)
April 30, 2014 (Unaudited)
| Shares | Description | Value | ||||||
| Common Stocks – (continued) | ||||||||
| Japan – (continued) | ||||||||
| 528,500 | ORIX Corp. (Diversified Financials) | $ | 7,657,883 | |||||
| 2,800 | Otsuka Corp. (Software & Services) | 331,463 | ||||||
| 265,100 | Otsuka Holdings Co. Ltd. (Pharmaceuticals, Biotechnology & Life Sciences) | 7,636,946 | ||||||
| 29,100 | Seiko Epson Corp. (Technology Hardware & Equipment) | 794,139 | ||||||
| 103,000 | Sekisui Chemical Co. Ltd. (Consumer Durables & Apparel) | 1,043,823 | ||||||
| 338,200 | Shionogi & Co. Ltd. (Pharmaceuticals, Biotechnology & Life Sciences) | 5,928,114 | ||||||
| 46,700 | SoftBank Corp. (Telecommunication Services) | 3,478,123 | ||||||
| 145,500 | Start Today Co. Ltd. (Retailing) | 3,049,168 | ||||||
| 104,000 | Sumitomo Electric Industries Ltd. (Capital Goods) | 1,439,483 | ||||||
| 243,400 | Sumitomo Mitsui Financial Group, Inc. (Banks) | 9,621,678 | ||||||
| 36,200 | T&D Holdings, Inc. (Insurance) | 432,094 | ||||||
| 1,775,000 | Taiheiyo Cement Corp. (Materials) | 6,226,507 | ||||||
| 15,800 | Taisho Pharmaceutical Holdings Co. Ltd. (Pharmaceuticals, Biotechnology & Life Sciences) | 1,164,581 | ||||||
| 193,000 | Takeda Pharmaceutical Co. Ltd. (Pharmaceuticals, Biotechnology & Life Sciences) | 8,681,166 | ||||||
| 27,700 | The Chugoku Electric Power Co., Inc. (Utilities) | 362,951 | ||||||
| 183,100 | The Dai-ichi Life Insurance Co. Ltd. (Insurance) | 2,537,172 | ||||||
| 99,500 | The Kansai Electric Power Co., Inc. (Utilities)* | 834,322 | ||||||
| 118,300 | Tokio Marine Holdings, Inc. (Insurance) | 3,485,820 | ||||||
| 402,000 | Toko, Inc. (Technology Hardware & Equipment)(a) | 1,169,497 | ||||||
| 213,800 | Toyota Motor Corp. (Automobiles & Components) | 11,551,221 | ||||||
| 43,200 | TS Tech Co. Ltd. (Automobiles & Components) | 1,152,136 | ||||||
| 33,100 | Wacom Co. Ltd. (Technology Hardware & Equipment)(a) | 216,470 | ||||||
|
| |||||||
| 197,504,364 | ||||||||
|
| |||||||
| Luxembourg – 0.2% | ||||||||
| 67,288 | APERAM (Materials)* | 1,750,740 | ||||||
|
| |||||||
| Netherlands – 4.8% | ||||||||
| 487,257 | Koninklijke Ahold NV (Food & Staples Retailing)(a) | 9,419,608 | ||||||
| 79,090 | Randstad Holding NV (Commercial & Professional Services)(a) | 4,621,998 | ||||||
| 365,678 | Royal Dutch Shell PLC Class A (Energy) | 14,464,432 | ||||||
| 257,067 | Royal Dutch Shell PLC Class B (Energy) | 10,915,324 | ||||||
|
| |||||||
| Common Stocks – (continued) | ||||||||
| Netherlands – (continued) | ||||||||
| 458,644 | TomTom NV (Consumer Durables & Apparel)* | $ | 3,252,072 | |||||
| 5,502 | Wereldhave NV (REIT) | 462,670 | ||||||
| 69,182 | Ziggo NV (Telecommunication Services) | 3,004,080 | ||||||
|
| |||||||
| 46,140,184 | ||||||||
|
| |||||||
| Norway – 1.6% | ||||||||
| 438,267 | DNB ASA (Banks)(a) | 7,768,517 | ||||||
| 1,239,235 | Norsk Hydro ASA (Materials) | 6,646,259 | ||||||
| 28,563 | Statoil ASA (Energy) | 870,755 | ||||||
|
| |||||||
| 15,285,531 | ||||||||
|
| |||||||
| Singapore – 1.4% | ||||||||
| 12,399,000 | Golden Agri-Resources Ltd. (Food, Beverage & Tobacco) | 6,048,669 | ||||||
| 22,000 | Jardine Cycle & Carriage Ltd. (Retailing) | 824,911 | ||||||
| 45,000 | Oversea-Chinese Banking Corp. Ltd. (Banks) | 347,048 | ||||||
| 2,259,000 | Wilmar International Ltd. (Food, Beverage & Tobacco) | 6,139,544 | ||||||
|
| |||||||
| 13,360,172 | ||||||||
|
| |||||||
| Spain – 2.2% | ||||||||
| 34,312 | Banco Bilbao Vizcaya Argentaria SA (Banks) | 422,647 | ||||||
| 62,185 | Bankinter SA (Banks) | 476,118 | ||||||
| 1,034,598 | CaixaBank SA (Banks) | 6,305,601 | ||||||
| 73,807 | Enagas SA (Utilities) | 2,273,904 | ||||||
| 520,035 | Gamesa Corp. Tecnologica SA (Capital Goods)* | 5,169,063 | ||||||
| 231,767 | Gas Natural SDG SA (Utilities) | 6,645,933 | ||||||
|
| |||||||
| 21,293,266 | ||||||||
|
| |||||||
| Sweden – 1.5% | ||||||||
| 341,721 | Nordea Bank AB (Banks) | 4,951,744 | ||||||
| 454,705 | Skandinaviska Enskilda Banken AB (Banks) | 6,280,804 | ||||||
| 32,925 | Skanska AB (Capital Goods) | 755,935 | ||||||
| 58,829 | Swedbank AB (Banks) | 1,574,377 | ||||||
| 12,053 | Swedish Match AB (Food, Beverage & Tobacco)* | 413,501 | ||||||
|
| |||||||
| 13,976,361 | ||||||||
|
| |||||||
| Switzerland – 11.0% | ||||||||
| 557,302 | ABB Ltd. (Registered) (Capital Goods)* | 13,417,655 | ||||||
| 116,534 | Actelion Ltd. (Registered) (Pharmaceuticals, Biotechnology & Life Sciences)* | 11,473,200 | ||||||
| 51,191 | Ascom Holding AG (Registered) (Technology Hardware & Equipment) | 952,316 | ||||||
|
| |||||||
| 28 | The accompanying notes are an integral part of these financial statements. |
GOLDMAN SACHS INTERNATIONAL EQUITY INSIGHTS FUND
| Shares | Description | Value | ||||||
| Common Stocks – (continued) | ||||||||
| Switzerland – (continued) | ||||||||
| 2,221 | Autoneum Holding AG (Automobiles & Components)* | $ | 471,187 | |||||
| 51,458 | Baloise Holding AG (Registered) (Insurance) | 6,266,224 | ||||||
| 14,269 | Basilea Pharmaceutica (Registered) (Pharmaceuticals, Biotechnology & Life Sciences)* | 1,495,079 | ||||||
| 14,166 | EMS-Chemie Holding AG (Registered) (Materials) | 5,527,539 | ||||||
| 968 | Flughafen Zuerich AG (Registered) (Transportation) | 610,694 | ||||||
| 8,574 | Georg Fischer AG (Registered) (Capital Goods)* | 6,801,802 | ||||||
| 28 | Lindt & Spruengli AG (Registered) (Food, Beverage & Tobacco) | 1,633,042 | ||||||
| 80,145 | Lonza Group AG (Registered) (Pharmaceuticals, Biotechnology & Life Sciences)* | 8,388,023 | ||||||
| 43,432 | Nestle SA (Registered) (Food, Beverage & Tobacco) | 3,356,611 | ||||||
| 370,920 | OC Oerlikon Corp. AG (Registered) (Capital Goods)* | 5,908,643 | ||||||
| 105,393 | Roche Holding AG (Pharmaceuticals, Biotechnology & Life Sciences) | 30,894,517 | ||||||
| 97,483 | Swiss Re AG (Insurance)* | 8,524,019 | ||||||
|
| |||||||
| 105,720,551 | ||||||||
|
| |||||||
| United Kingdom – 17.4% | ||||||||
| 186,972 | Aberdeen Asset Management PLC (Diversified Financials) | 1,382,927 | ||||||
| 408,998 | ARM Holdings PLC (Semiconductors & Semiconductor Equipment) | 6,190,274 | ||||||
| 107,172 | AstraZeneca PLC (Pharmaceuticals, Biotechnology & Life Sciences) | 8,459,590 | ||||||
| 67,211 | Berendsen PLC (Commercial & Professional Services) | 1,174,576 | ||||||
| 29,963 | BG Group PLC (Energy) | 606,132 | ||||||
| 437,917 | BHP Billiton PLC (Materials) | 14,216,707 | ||||||
| 16,769 | BP PLC (Energy) | 141,583 | ||||||
| 462,486 | BP PLC ADR (Energy) | 23,411,041 | ||||||
| 315,082 | British American Tobacco PLC (Food, Beverage & Tobacco) | 18,194,407 | ||||||
| 509,414 | BT Group PLC (Telecommunication Services) | 3,180,093 | ||||||
| 223,637 | GlaxoSmithKline PLC ADR (Pharmaceuticals, Biotechnology & Life Sciences)(b) | 12,382,781 | ||||||
| 2,737,340 | HSBC Holdings PLC (Banks) | 27,969,108 | ||||||
| 759,045 | International Consolidated Airlines Group SA (Transportation)* | 5,194,174 | ||||||
| 29,100 | Keller Group PLC (Capital Goods) | 490,949 | ||||||
| 396,488 | Mondi PLC (Materials) | 6,591,186 | ||||||
| 88,408 | Reckitt Benckiser Group PLC (Household & Personal Products) | 7,136,825 | ||||||
|
| |||||||
| Common Stocks – (continued) | ||||||||
| United Kingdom – (continued) | ||||||||
| 64,601 | SABMiller PLC (Food, Beverage & Tobacco) | $ | 3,517,589 | |||||
| 11,084 | Severn Trent PLC (Utilities) | 345,505 | ||||||
| 32,568 | Standard Chartered PLC (Banks) | 705,333 | ||||||
| 854,925 | TUI Travel PLC (Consumer Services) | 6,183,885 | ||||||
| 107,309 | Unilever PLC (Food, Beverage & Tobacco) | 4,800,265 | ||||||
| 139,861 | Vodafone Group PLC (Telecommunication Services) | 530,998 | ||||||
| 355,898 | Vodafone Group PLC ADR (Telecommunication Services)(b) | 13,509,888 | ||||||
| 53,999 | WH Smith PLC (Retailing) | 1,001,445 | ||||||
|
| |||||||
| 167,317,261 | ||||||||
|
| |||||||
| TOTAL COMMON STOCKS | ||||||||
| (Cost $848,416,126) | $ | 908,112,051 | ||||||
|
| |||||||
| Preferred Stock – 0.9% | ||||||||
| Germany – 0.9% | ||||||||
| 80,937 | Henkel AG & Co. KGaA (Household & Personal Products) | $ | 9,028,543 | |||||
| (Cost $7,620,356) | ||||||||
|
| |||||||
| | TOTAL INVESTMENTS BEFORE SECURITIES LENDING REINVESTMENT VEHICLE | | ||||||
| (Cost $856,036,482) | $ | 917,140,594 | ||||||
|
| |||||||
| Shares | Distribution Rate | Value | ||||
| Securities Lending Reinvestment Vehicle(a)(c)(d) – 6.6% | ||||||
| Goldman Sachs Financial Square Money Market Fund – FST Shares | ||||||
| 63,772,469 | 0.067% | $ | 63,772,469 | |||
| (Cost $63,772,469) | ||||||
| ||||||
| TOTAL INVESTMENTS – 102.0% | ||||||
| (Cost $919,808,951) | $ | 980,913,063 | ||||
| ||||||
| LIABILITIES IN EXCESS OF OTHER ASSETS – (2.0)% | (19,517,861 | ) | ||||
| ||||||
| NET ASSETS – 100.0% | $ | 961,395,202 | ||||
| ||||||
| The accompanying notes are an integral part of these financial statements. | 29 |
GOLDMAN SACHS INTERNATIONAL EQUITY INSIGHTS FUND
Schedule of Investments (continued)
April 30, 2014 (Unaudited)
| The percentage shown for each investment category reflects the value of investments in that category as a percentage of net assets. | ||
* | Non-income producing security. | |
(a) | All or a portion of security is on loan. | |
(b) | All or a portion of security is segregated as collateral for initial margin requirements on futures transactions. | |
(c) | Variable rate security. Interest rate or distribution rate disclosed is that which is in effect at April 30, 2014. | |
(d) | Represents an affiliated issuer. | |
| ||
Investment Abbreviations: | ||
ADR | —American Depositary Receipt | |
REIT | —Real Estate Investment Trust | |
| ||
| ADDITIONAL INVESTMENT INFORMATION |
FUTURES CONTRACTS — At April 30, 2014, the Fund had the following futures contracts:
| Type | Number of Contracts Long (Short) | Expiration Date | Current Value | Unrealized Gain (Loss) | ||||||||||
EURO STOXX 50 Index | 258 | June 2014 | $ | 11,257,097 | $ | 129,171 | ||||||||
FTSE 100 Index | 48 | June 2014 | 5,465,959 | 124,846 | ||||||||||
Hang Seng Index | 3 | May 2014 | 422,491 | (9,529 | ) | |||||||||
MSCI Singapore Index | 5 | May 2014 | 293,850 | 1,652 | ||||||||||
SPI 200 Index | 16 | June 2014 | 2,032,280 | 14,017 | ||||||||||
TSE TOPIX Index | 42 | June 2014 | 4,747,004 | (49,252 | ) | |||||||||
| TOTAL | $ | 210,905 | ||||||||||||
| 30 | The accompanying notes are an integral part of these financial statements. |
GOLDMAN SACHS INTERNATIONAL SMALL CAP INSIGHTS FUND
Schedule of Investments
April 30, 2014 (Unaudited)
| Shares | Description | Value | ||||||
| Common Stocks – 91.7% | ||||||||
| Australia – 8.2% | ||||||||
| 346,171 | Abacus Property Group (REIT) | $ | 785,981 | |||||
| 976,301 | Adelaide Brighton Ltd. (Materials) | 3,558,635 | ||||||
| 428,785 | Amcom Telecommunications Ltd. (Telecommunication Services) | 838,892 | ||||||
| 4,588,108 | Arrium Ltd. (Materials) | 5,113,241 | ||||||
| 285,457 | Aurora Oil & Gas Ltd. (Energy)* | 1,084,634 | ||||||
| 1,408,929 | Australand Property Group (REIT) | 5,615,220 | ||||||
| 65,468 | AWE Ltd. (Energy)* | 95,639 | ||||||
| 349,891 | BC Iron Ltd. (Materials) | 1,425,528 | ||||||
| 744,834 | Beach Energy Ltd. (Energy) | 1,192,006 | ||||||
| 65,439 | BT Investment Management Ltd. (Diversified Financials) | 408,445 | ||||||
| 141,661 | Cabcharge Australia Ltd. (Commercial & Professional Services) | 511,348 | ||||||
| 980,646 | Challenger Ltd. (Diversified Financials) | 6,451,947 | ||||||
| 658,364 | Charter Hall Group (REIT) | 2,576,479 | ||||||
| 10,576 | Credit Corp. Group Ltd. (Commercial & Professional Services) | 88,609 | ||||||
| 1,746,141 | CSR Ltd. (Materials) | 5,946,678 | ||||||
| 435,571 | David Jones Ltd. (Retailing) | 1,595,647 | ||||||
| 328,802 | Drillsearch Energy Ltd. (Energy)* | 492,364 | ||||||
| 810,299 | DUET Group (Utilities) | 1,636,251 | ||||||
| 1,475,272 | Envestra Ltd. (Utilities) | 1,601,067 | ||||||
| 843,613 | G8 Education Ltd. (Consumer Services) | 3,679,361 | ||||||
| 93,649 | GUD Holdings Ltd. (Consumer Durables & Apparel) | 466,407 | ||||||
| 141,941 | Hills Ltd. (Capital Goods) | 223,358 | ||||||
| 677,554 | iiNET Ltd. (Telecommunication Services) | 4,523,341 | ||||||
| 1,838,233 | Investa Office Fund (REIT) | 5,722,916 | ||||||
| 94,814 | JB Hi-Fi Ltd. (Retailing) | 1,703,804 | ||||||
| 47,552 | Magellan Financial Group Ltd. (Diversified Financials) | 555,711 | ||||||
| 138,758 | McMillan Shakespeare Ltd. (Commercial & Professional Services) | 1,256,872 | ||||||
| 3,682,702 | Mount Gibson Iron Ltd. (Materials) | 2,515,018 | ||||||
| 465,624 | Navitas Ltd. (Consumer Services) | 3,192,988 | ||||||
| 1,162,729 | Northern Star Resources Ltd. (Materials) | 1,271,880 | ||||||
| 203,021 | RCR Tomlinson Ltd. (Capital Goods) | 516,997 | ||||||
| 51,517 | Retail Food Group Ltd. (Consumer Services) | 200,357 | ||||||
| 244,701 | Roc Oil Co. Ltd. (Energy)* | 109,117 | ||||||
| 152,569 | Senex Energy Ltd. (Energy)* | 94,767 | ||||||
| 111,517 | Skilled Group Ltd. (Commercial & Professional Services) | 285,199 | ||||||
| 89,300 | Spark Infrastructure Group (Utilities) | 146,746 | ||||||
| 116,107 | Tassal Group Ltd. (Food, Beverage & Tobacco) | 447,633 | ||||||
| 615,362 | Transpacific Industries Group Ltd. (Commercial & Professional Services)* | 639,922 | ||||||
|
| |||||||
| 68,571,005 | ||||||||
|
| |||||||
| Common Stocks – (continued) | ||||||||
| Austria – 0.6% | ||||||||
| 79,286 | CA Immobilien Anlagen AG (Real Estate)* | $ | 1,511,371 | |||||
| 14,931 | Flughafen Wien AG (Transportation)(a) | 1,464,310 | ||||||
| 30,077 | Oesterreichische Post AG (Transportation)(a) | 1,537,160 | ||||||
| 4,747 | RHI AG (Materials) | 166,163 | ||||||
| 1,698 | Schoeller-Bleckmann Oilfield Equipment AG (Energy) | 215,848 | ||||||
|
| |||||||
| 4,894,852 | ||||||||
|
| |||||||
| Belgium – 0.7% | ||||||||
| 20,374 | Arseus NV (Health Care Equipment & Services) | 1,154,070 | ||||||
| 16,636 | Compagnie Maritime Belge SA (Transportation) | 494,357 | ||||||
| 25,691 | Euronav NV (Energy)* | 310,887 | ||||||
| 69,390 | Exmar NV (Energy) | 1,158,163 | ||||||
| 4,922 | Gimv NV (Diversified Financials) | 255,182 | ||||||
| 5,624 | Kinepolis Group NV (Media) | 1,100,537 | ||||||
| 31,842 | Melexis NV (Semiconductors & Semiconductor Equipment) | 1,280,430 | ||||||
| 42,360 | Rezidor Hotel Group AB (Consumer Services)*(a) | 263,194 | ||||||
| 42,360 | Rezidor Hotel Group AB (Consumer Services)* | 19,653 | ||||||
|
| |||||||
| 6,036,473 | ||||||||
|
| |||||||
| Bermuda – 0.6% | ||||||||
| 247,295 | Catlin Group Ltd. (Insurance) | 2,208,647 | ||||||
| 874,651 | Golden Ocean Group Ltd. (Transportation)(a) | 1,551,102 | ||||||
| 90,327 | Hiscox Ltd. (Insurance)* | 1,076,707 | ||||||
|
| |||||||
| 4,836,456 | ||||||||
|
| |||||||
| Canada – 0.0% | ||||||||
| 52,117 | Entertainment One Ltd. (Media)* | 260,463 | ||||||
|
| |||||||
| China – 0.2% | ||||||||
| 3,351,000 | FIH Mobile Ltd. (Technology Hardware & Equipment)* | 1,810,001 | ||||||
|
| |||||||
| Denmark – 2.6% | ||||||||
| 1,469 | ALK-Abello A/S (Pharmaceuticals, Biotechnology & Life Sciences)(a) | 203,829 | ||||||
| 108,514 | Bakkafrost P/F (Food, Beverage & Tobacco) | 1,699,314 | ||||||
| 6,249 | Dfds A/S (Transportation) | 494,132 | ||||||
| 72,893 | Jyske Bank A/S (Registered) (Banks)* | 4,007,650 | ||||||
| 3,281 | Rockwool International A/S (Capital Goods) | 632,884 | ||||||
| 20,172 | Schouw & Co. A/S (Food, Beverage & Tobacco) | 1,126,002 | ||||||
| 141,309 | Sydbank A/S (Banks)* | 3,768,981 | ||||||
| 221,114 | Vestas Wind Systems A/S (Capital Goods)* | 9,819,919 | ||||||
|
| |||||||
| The accompanying notes are an integral part of these financial statements. | 31 |
GOLDMAN SACHS INTERNATIONAL SMALL CAP INSIGHTS FUND
Schedule of Investments (continued)
April 30, 2014 (Unaudited)
| Shares | Description | Value | ||||||
| Common Stocks – (continued) | ||||||||
| Denmark – (continued) | ||||||||
| 23,991 | Zealand Pharma A/S (Pharmaceuticals, Biotechnology & Life Sciences)*(a) | $ | 296,543 | |||||
|
| |||||||
| 22,049,254 | ||||||||
|
| |||||||
| Finland – 0.3% | ||||||||
| 33,910 | Citycon OYJ (Real Estate) | 127,237 | ||||||
| 50,737 | Cramo OYJ (Capital Goods) | 1,133,666 | ||||||
| 79,987 | Ramirent OYJ (Capital Goods) | 896,579 | ||||||
| 69,080 | Sponda OYJ (Real Estate) | 356,215 | ||||||
|
| |||||||
| 2,513,697 | ||||||||
|
| |||||||
| France – 4.3% | ||||||||
| 32,526 | ABC Arbitrage (Diversified Financials)(a) | 231,491 | ||||||
| 260,970 | Air France-KLM (Transportation)* | 3,754,327 | ||||||
| 35,278 | Altamir (Diversified Financials) | 534,457 | ||||||
| 39,576 | Assystem (Commercial & Professional Services) | 1,275,693 | ||||||
| 21,396 | Boiron SA (Pharmaceuticals, Biotechnology & Life Sciences) | 1,804,178 | ||||||
| 3,272 | Bourbon SA (Energy) | 107,972 | ||||||
| 20,806 | Cegid Group (Software & Services) | 871,649 | ||||||
| 5,031 | Club Mediterranee SA (Consumer Services)* | 131,219 | ||||||
| 12,699 | Euler Hermes SA (Insurance) | 1,532,186 | ||||||
| 5,806 | Faurecia (Automobiles & Components)* | 261,343 | ||||||
| 52,084 | Ipsen SA (Pharmaceuticals, Biotechnology & Life Sciences) | 2,312,533 | ||||||
| 2,700 | Korian-Medica (Health Care Equipment & Services) | 101,437 | ||||||
| 72,745 | Mercialys SA (REIT) | 1,673,300 | ||||||
| 87,540 | Metropole Television SA (Media) | 1,875,167 | ||||||
| 21,926 | Montupet SA (Automobiles & Components) | 1,814,877 | ||||||
| 58,326 | Neopost SA (Technology Hardware & Equipment)(a) | 4,789,333 | ||||||
| 146,574 | Plastic Omnium SA (Automobiles & Components) | 4,987,237 | ||||||
| 12,978 | Rubis SCA (Utilities) | 924,082 | ||||||
| 48,471 | Saft Groupe SA (Capital Goods) | 1,723,803 | ||||||
| 3,297 | SEB SA (Consumer Durables & Apparel) | 304,119 | ||||||
| 5,015 | Societe de la Tour Eiffel (REIT) | 361,654 | ||||||
| 48,430 | Societe Television Francaise 1 (Media)(a) | 824,666 | ||||||
| 173,537 | Technicolor SA (Registered) (Media)* | 1,297,480 | ||||||
| 138,948 | UBISOFT Entertainment (Software & Services)* | 2,593,009 | ||||||
| 3,991 | Vicat (Materials)* | 346,355 | ||||||
|
| |||||||
| 36,433,567 | ||||||||
|
| |||||||
| Georgia – 0.3% | ||||||||
| 51,809 | Bank of Georgia Holdings PLC (Banks) | 2,278,711 | ||||||
|
| |||||||
| Common Stocks – (continued) | ||||||||
| Germany – 7.5% | ||||||||
| 45,726 | Aurelius AG (Diversified Financials) | $ | 1,699,280 | |||||
| 227,696 | Balda AG (Health Care Equipment & Services)(a) | 1,060,140 | ||||||
| 305,824 | Borussia Dortmund GmbH & Co. KGaA (Media) | 1,594,463 | ||||||
| 37,608 | CENTROTEC Sustainable AG (Capital Goods) | 962,624 | ||||||
| 3,858 | Cewe Stiftung & Co. KGAA (Commercial & Professional Services) | 303,975 | ||||||
| 20,757 | Comdirect Bank AG (Banks) | 239,283 | ||||||
| 1,564 | CTS Eventim AG (Media) | 99,624 | ||||||
| 23,034 | Deutsche Beteiligungs AG (Diversified Financials) | 620,591 | ||||||
| 6,856 | Deutsche Euroshop AG (Real Estate) | 330,546 | ||||||
| 208,257 | Deutz AG (Capital Goods)* | 1,741,445 | ||||||
| 27,675 | Drillisch AG (Telecommunication Services) | 1,033,336 | ||||||
| 71,101 | Duerr AG (Capital Goods)*(a) | 5,625,923 | ||||||
| 60,801 | Freenet AG (Telecommunication Services) | 2,105,730 | ||||||
| 65,621 | Gerresheimer AG (Pharmaceuticals, Biotechnology & Life Sciences)*(a) | 4,454,805 | ||||||
| 50,943 | Grammer AG (Automobiles & Components) | 2,815,338 | ||||||
| 479,595 | Heidelberger Druckmaschinen AG (Capital Goods)*(a) | 1,521,143 | ||||||
| 21,807 | Homag Group AG (Capital Goods) | 637,167 | ||||||
| 78,016 | Leoni AG (Automobiles & Components) | 5,815,278 | ||||||
| 115,752 | LPKF Laser & Electronics AG (Technology Hardware & Equipment) | 2,603,424 | ||||||
| 28,244 | MorphoSys AG (Pharmaceuticals, Biotechnology & Life Sciences)* | 2,422,605 | ||||||
| 4,262 | Nemetschek AG (Software & Services) | 371,043 | ||||||
| 353,278 | Nordex SE (Capital Goods)* | 5,656,232 | ||||||
| 4,720 | Norma Group SE (Capital Goods) | 247,707 | ||||||
| 18,139 | QSC AG (Telecommunication Services) | 93,342 | ||||||
| 5,749 | R Stahl AG (Capital Goods) | 341,367 | ||||||
| 157,828 | SAF-Holland SA (Automobiles & Components) | 2,361,462 | ||||||
| 46,852 | Sixt SE (Transportation) | 1,894,467 | ||||||
| 6,698 | Stada Arzneimittel AG (Pharmaceuticals, Biotechnology & Life Sciences) | 292,071 | ||||||
| 46,470 | Symrise AG (Materials) | 2,347,509 | ||||||
| 50,780 | Takkt AG (Retailing) | 1,030,041 | ||||||
| 336,743 | TUI AG (Consumer Services) | 5,607,171 | ||||||
| 3,623 | Vossloh AG (Capital Goods) | 358,093 | ||||||
| 72,106 | Wincor Nixdorf AG (Technology Hardware & Equipment) | 4,723,539 | ||||||
| 1,497 | XING AG (Software & Services) | 191,801 | ||||||
|
| |||||||
| 63,202,565 | ||||||||
|
| |||||||
| 32 | The accompanying notes are an integral part of these financial statements. |
GOLDMAN SACHS INTERNATIONAL SMALL CAP INSIGHTS FUND
| Shares | Description | Value | ||||||
| Common Stocks – (continued) | ||||||||
| Hong Kong – 2.5% | ||||||||
| 616,000 | Brightoil Petroleum Holdings Ltd. (Energy)* | $ | 191,331 | |||||
| 332,000 | Champion REIT (REIT) | 156,500 | ||||||
| 148,000 | Chow Sang Sang Holdings International Ltd. (Retailing) | 363,937 | ||||||
| 262,400 | Dah Sing Financial Holdings Ltd. (Banks) | 1,169,702 | ||||||
| 472,451 | Dickson Concepts International Ltd. (Retailing) | 284,978 | ||||||
| 503,817 | Dorsett Hospitality International Ltd. (Consumer Services) | 89,800 | ||||||
| 890,000 | Emperor Entertainment Hotel Ltd. (Consumer Services) | 387,809 | ||||||
| 1,418,000 | Emperor International Holdings (Real Estate) | 318,628 | ||||||
| 149,000 | Great Eagle Holdings Ltd. (Real Estate) | 534,076 | ||||||
| 166,000 | Haitong International Securities Group Ltd. (Diversified Financials) | 83,456 | ||||||
| 538,100 | HKR International Ltd. (Real Estate) | 220,711 | ||||||
| 1,216,000 | Hutchison Telecommunications Hong Kong Holdings Ltd. (Telecommunication Services) | 398,538 | ||||||
| 427,000 | Johnson Electric Holdings Ltd. (Capital Goods) | 408,423 | ||||||
| 77,000 | Kowloon Development Co. Ltd. (Real Estate) | 94,187 | ||||||
| 1,818,000 | Newocean Energy Holdings Ltd. (Energy) | 1,200,619 | ||||||
| 172,000 | Pacific Textiles Holdings Ltd. (Consumer Durables & Apparel) | 218,301 | ||||||
| 768,000 | Pico Far East Holdings Ltd. (Media) | 205,052 | ||||||
| 326,000 | Prosperity REIT (REIT) | 96,307 | ||||||
| 210,000 | Regal Hotels International Holdings Ltd. (Consumer Services) | 121,812 | ||||||
| 1,453,000 | Samson Holding Ltd. (Consumer Durables & Apparel) | 191,342 | ||||||
| 3,506,000 | Shun Tak Holdings Ltd. (Capital Goods) | 1,726,905 | ||||||
| 718,000 | Singamas Container Holdings Ltd. (Capital Goods) | 155,761 | ||||||
| 109,138 | SOCAM Development Ltd. (Capital Goods) | 132,836 | ||||||
| 70,000 | Stella International Holdings Ltd. (Consumer Durables & Apparel) | 172,631 | ||||||
| 607,000 | Sunlight Real Estate Investment Trust | 239,063 | ||||||
| 872,000 | Techtronic Industries Co. (Consumer Durables & Apparel) | 2,786,146 | ||||||
| 1,642,000 | The United Laboratories International Holdings Ltd. (Pharmaceuticals, Biotechnology & Life Sciences)* | 1,060,674 | ||||||
| 100,000 | Tian An China Investments Co. Ltd. (Real Estate) | 78,378 | ||||||
| 2,962,000 | Truly International Holdings Ltd. (Technology Hardware & Equipment) | 2,002,158 | ||||||
|
| |||||||
| Common Stocks – (continued) | ||||||||
| Hong Kong – (continued) | ||||||||
| 657,600 | VST Holdings Ltd. (Technology Hardware & Equipment) | $ | 167,633 | |||||
| 222,400 | VTech Holdings Ltd. (Technology Hardware & Equipment) | 3,069,387 | ||||||
| 3,556,000 | Xinyi Glass Holdings Ltd. (Automobiles & Components) | 2,810,378 | ||||||
|
| |||||||
| 21,137,459 | ||||||||
|
| |||||||
| India – 0.7% | ||||||||
| 345,859 | Vedanta Resources PLC (Materials)(a) | 5,538,323 | ||||||
|
| |||||||
| Ireland – 0.7% | ||||||||
| 283,636 | Beazley PLC (Insurance) | 1,176,630 | ||||||
| 147,113 | Grafton Group PLC (Capital Goods) | 1,446,996 | ||||||
| 716,810 | Henderson Group PLC (Diversified Financials) | 3,045,422 | ||||||
| 12,941 | Irish Continental Group PLC (Transportation) | 520,029 | ||||||
|
| |||||||
| 6,189,077 | ||||||||
|
| |||||||
| Israel – 0.0% | ||||||||
| 5,114 | Rami Levi Chain Stores Hashikma Marketing 2006 Ltd. (Food & Staples Retailing) | 264,862 | ||||||
|
| |||||||
| Italy – 5.1% | ||||||||
| 4,104,801 | A2A SpA (Utilities) | 5,023,060 | ||||||
| 23,322 | ACEA SpA (Utilities) | 334,681 | ||||||
| 143,944 | Ascopiave SpA (Utilities) | 461,309 | ||||||
| 48,601 | Astaldi SpA (Capital Goods) | 526,685 | ||||||
| 134,855 | ASTM SpA (Transportation)(a) | 2,285,697 | ||||||
| 48,385 | Autogrill SpA (Consumer Services)* | 464,462 | ||||||
| 14,148 | Banca Generali SpA (Diversified Financials) | 445,341 | ||||||
| 72,437 | Banca IFIS SpA (Diversified Financials) | 1,564,100 | ||||||
| 5,822,416 | Banca Popolare di Milano Scarl (Banks)*(a) | 5,888,236 | ||||||
| 166,664 | Beni Stabili SpA (REIT) | 148,987 | ||||||
| 41,623 | Brembo SpA (Automobiles & Components) | 1,538,349 | ||||||
| 38,475 | Buzzi Unicem SpA (Materials) | 682,559 | ||||||
| 67,325 | Cairo Communication SpA (Media) | 583,771 | ||||||
| 218,925 | Cementir Holding SpA (Materials) | 2,085,864 | ||||||
| 7,198 | Cosmo Pharmaceuticals SpA (Pharmaceuticals, Biotechnology & Life Sciences) | 974,030 | ||||||
| 187,748 | Credito Emiliano SpA (Banks)(a) | 1,924,638 | ||||||
| 85,743 | ERG SpA (Energy) | 1,479,807 | ||||||
| 170,381 | Gruppo Editoriale L’Espresso SpA (Media)*(a) | 393,397 | ||||||
| 1,336,477 | Hera SpA (Utilities) | 3,934,530 | ||||||
| 7,407 | Indesit Co. SpA (Consumer Durables & Apparel) | 105,778 | ||||||
| 30,171 | Industria Macchine Automatiche SpA (Capital Goods) | 1,483,671 | ||||||
|
| |||||||
| The accompanying notes are an integral part of these financial statements. | 33 |
GOLDMAN SACHS INTERNATIONAL SMALL CAP INSIGHTS FUND
Schedule of Investments (continued)
April 30, 2014 (Unaudited)
| Shares | Description | Value | ||||||
| Common Stocks – (continued) | ||||||||
| Italy – (continued) | ||||||||
| 1,060,752 | Iren SpA (Utilities) | $ | 1,802,465 | |||||
| 72,114 | Italcementi SpA (Materials)* | 560,265 | ||||||
| 164,734 | Italcementi SpA (Materials)(a) | 2,001,372 | ||||||
| 6,751 | Italmobiliare SpA (Materials)* | 209,177 | ||||||
| 322,729 | Maire Tecnimont SpA (Capital Goods)*(a) | 1,177,193 | ||||||
| 131,825 | Recordati SpA (Pharmaceuticals, Biotechnology & Life Sciences) | 2,307,621 | ||||||
| 8,155 | Reply SpA (Software & Services) | 736,900 | ||||||
| 102,896 | Saras SpA (Energy)* | 178,529 | ||||||
| 41,252 | Societa Cattolica di Assicurazioni SCRL (Insurance)(a) | 1,020,282 | ||||||
| 8,955 | Societa Iniziative Autostradali e Servizi SpA (Transportation)(a) | 106,489 | ||||||
| 86,036 | Sogefi SpA (Automobiles & Components)* | 546,816 | ||||||
| 9,124 | Trevi Finanziaria Industriale SpA (Capital Goods) | 105,227 | ||||||
| 7,842 | Vittoria Assicurazioni SpA (Insurance) | 115,210 | ||||||
|
| |||||||
| 43,196,498 | ||||||||
|
| |||||||
| Japan – 23.9% | �� | |||||||
| 47,900 | Aisan Industry Co. Ltd. (Automobiles & Components) | 381,138 | ||||||
| 104,900 | Alpine Electronics, Inc. (Consumer Durables & Apparel) | 1,250,666 | ||||||
| 14,200 | Ariake Japan Co. Ltd. (Food, Beverage & Tobacco) | 342,998 | ||||||
| 20,800 | Asatsu-DK, Inc. (Media) | 470,527 | ||||||
| 40,900 | Avex Group Holdings, Inc. (Media) | 757,545 | ||||||
| 10,600 | C. Uyemura & Co. Ltd. (Materials) | 490,438 | ||||||
| 323,000 | Calsonic Kansei Corp. (Automobiles & Components) | 1,591,143 | ||||||
| 79,100 | Capcom Co. Ltd. (Software & Services) | 1,377,702 | ||||||
| 27,000 | Central Glass Co. Ltd. (Capital Goods) | 88,542 | ||||||
| 2,700 | Century Tokyo Leasing Corp. (Diversified Financials) | 78,137 | ||||||
| 50,900 | Chiyoda Integre Co. Ltd. (Capital Goods) | 701,837 | ||||||
| 198,200 | CKD Corp. (Capital Goods) | 1,805,528 | ||||||
| 18,600 | Cleanup Corp. (Consumer Durables & Apparel) | 169,477 | ||||||
| 13,600 | Coca-Cola East Japan Co. Ltd. (Food, Beverage & Tobacco) | 306,497 | ||||||
| 4,900 | Cocokara fine, Inc. (Food & Staples Retailing) | 138,925 | ||||||
| 47,600 | COMSYS Holdings Corp. (Capital Goods) | 780,357 | ||||||
| 3,000 | Cosmos Pharmaceutical Corp. (Food & Staples Retailing) | 320,892 | ||||||
| 159,000 | Daihen Corp. (Capital Goods) | 602,583 | ||||||
| 78,700 | Daiichikosho Co. Ltd. (Media) | 2,267,797 | ||||||
| 8,000 | Daikoku Denki Co. Ltd. (Consumer Durables & Apparel) | 142,990 | ||||||
|
| |||||||
| Common Stocks – (continued) | ||||||||
| Japan – (continued) | ||||||||
| 669,000 | Dainippon Screen Manufacturing Co. Ltd. (Semiconductors & Semiconductor Equipment) | $ | 2,917,935 | |||||
| 31,000 | Daiwa Industries Ltd. (Capital Goods) | 191,208 | ||||||
| 445 | Daiwa Office Investment Corp. (REIT)(a) | 2,278,200 | ||||||
| 6,500 | Doshisha Co. Ltd. (Retailing) | 97,457 | ||||||
| 77,400 | Doutor Nichires Holdings Co. Ltd. (Consumer Services) | 1,387,265 | ||||||
| 99,900 | Eagle Industry Co. Ltd. (Automobiles & Components) | 1,581,194 | ||||||
| 173,500 | EDION Corp. (Retailing) | 1,011,058 | ||||||
| 37,300 | Eizo Corp. (Technology Hardware & Equipment) | 1,011,300 | ||||||
| 54,000 | en-japan, Inc. (Commercial & Professional Services) | 951,814 | ||||||
| 128,100 | Fancl Corp. (Household & Personal Products) | 1,420,646 | ||||||
| 123,300 | Foster Electric Co. Ltd. (Consumer Durables & Apparel) | 1,493,498 | ||||||
| 205,800 | Fuji Machine Manufacturing Co. Ltd. (Capital Goods) | 1,819,791 | ||||||
| 263,300 | Fuji Oil Co. Ltd. (Food, Beverage & Tobacco) | 3,557,402 | ||||||
| 38,300 | Fuji Soft, Inc. (Software & Services) | 801,180 | ||||||
| 101,000 | Fujikura Ltd. (Capital Goods) | 434,903 | ||||||
| 272,000 | Fujitsu General Ltd. (Consumer Durables & Apparel) | 3,138,859 | ||||||
| 33,100 | Funai Electric Co. Ltd. (Consumer Durables & Apparel) | 355,448 | ||||||
| 34,800 | Geo Holdings Corp. (Retailing) | 318,836 | ||||||
| 810 | Global One Real Estate Investment Corp. (REIT) | 2,534,357 | ||||||
| 8,300 | Goldcrest Co. Ltd. (Real Estate) | 173,752 | ||||||
| 85,200 | G-Tekt Corp. (Automobiles & Components) | 953,651 | ||||||
| 42,000 | Gunze Ltd. (Consumer Durables & Apparel) | 114,688 | ||||||
| 17,000 | H2O Retailing Corp. (Retailing) | 128,291 | ||||||
| 433 | Hankyu REIT, Inc. (REIT) | 2,327,339 | ||||||
| 12,700 | Heiwa Real Estate Co. Ltd. (Real Estate) | 199,379 | ||||||
| 9,500 | Heiwado Co. Ltd. (Food & Staples Retailing) | 134,486 | ||||||
| 224,800 | Hitachi Capital Corp. (Diversified Financials) | 5,540,745 | ||||||
| 344,000 | Hitachi Kokusai Electric, Inc. (Technology Hardware & Equipment) | 3,932,474 | ||||||
| 137,700 | Hitachi Transport System Ltd. (Transportation) | 2,112,988 | ||||||
| 17,200 | Horiba Ltd. (Technology Hardware & Equipment) | 594,541 | ||||||
| 9,200 | House Foods Group, Inc. (Food, Beverage & Tobacco) | 153,090 | ||||||
| 10,600 | IBJ Leasing Co. Ltd. (Diversified Financials) | 242,563 | ||||||
|
| |||||||
| 34 | The accompanying notes are an integral part of these financial statements. |
GOLDMAN SACHS INTERNATIONAL SMALL CAP INSIGHTS FUND
| Shares | Description | Value | ||||||
| Common Stocks – (continued) | ||||||||
| Japan – (continued) | ||||||||
| 821 | Ichigo Real Estate Investment Corp. (REIT) | $ | 494,212 | |||||
| 45,000 | Ikyu Corp. (Retailing)(a) | 488,852 | ||||||
| 28,700 | Inabata & Co. Ltd. (Capital Goods) | 270,090 | ||||||
| 112 | Industrial & Infrastructure Fund Investment Corp. (REIT) | 938,587 | ||||||
| 18,200 | Internet Initiative Japan, Inc. (Software & Services) | 422,271 | ||||||
| 8,600 | Iriso Electronics Co. Ltd. (Technology Hardware & Equipment) | 432,863 | ||||||
| 260,400 | IT Holdings Corp. (Software & Services) | 4,036,722 | ||||||
| 35,900 | Iwai Cosmo Holdings, Inc. (Diversified Financials) | 349,676 | ||||||
| 72,200 | Jafco Co. Ltd. (Diversified Financials) | 2,766,394 | ||||||
| 2,161 | Japan Hotel REIT Investment Corp. (REIT) | 994,038 | ||||||
| 1,838 | Japan Rental Housing Investments, Inc. (REIT) | 1,137,097 | ||||||
| 43,700 | Japan Securities Finance Co. Ltd. (Diversified Financials) | 240,542 | ||||||
| 145,000 | Japan Vilene Co. Ltd. (Consumer Durables & Apparel) | 798,856 | ||||||
| 342,100 | JVC Kenwood Corp. (Consumer Durables & Apparel)* | 723,166 | ||||||
| 13,100 | Kanematsu Electronics Ltd. (Technology Hardware & Equipment) | 174,945 | ||||||
| 38,600 | Kasumi Co. Ltd. (Food & Staples Retailing) | 272,336 | ||||||
| 4,700 | Kato Sangyo Co. Ltd. (Food & Staples Retailing) | 97,754 | ||||||
| 182,000 | Kato Works Co. Ltd. (Capital Goods) | 1,049,712 | ||||||
| 2,620,000 | Kawasaki Kisen Kaisha Ltd. (Transportation) | 5,260,820 | ||||||
| 57,900 | Keihin Corp. (Automobiles & Components) | 840,268 | ||||||
| 19 | Kenedix Office Investment Corp. (REIT) | 94,914 | ||||||
| 162,600 | Kewpie Corp. (Food, Beverage & Tobacco) | 2,338,923 | ||||||
| 119,700 | Kissei Pharmaceutical Co. Ltd. (Pharmaceuticals, Biotechnology & Life Sciences) | 2,803,263 | ||||||
| 14,900 | Koa Corp. (Technology Hardware & Equipment) | 143,207 | ||||||
| 12,800 | Kohnan Shoji Co. Ltd. (Retailing) | 129,577 | ||||||
| 14,200 | Kokuyo Co. Ltd. (Commercial & Professional Services) | 108,589 | ||||||
| 85,700 | Komori Corp. (Capital Goods) | 1,090,005 | ||||||
| 6,300 | Konishi Co. Ltd. (Materials) | 112,713 | ||||||
| 104,000 | Krosaki Harima Corp. (Materials) | 217,252 | ||||||
| 3,600 | K’s Holdings Corp. (Retailing) | 104,473 | ||||||
| 210,000 | Kurabo Industries Ltd. (Consumer Durables & Apparel) | 357,708 | ||||||
| 83,000 | Kuroda Electric Co. Ltd. (Capital Goods) | 1,333,483 | ||||||
|
| |||||||
| Common Stocks – (continued) | ||||||||
| Japan – (continued) | ||||||||
| 446,000 | KYB Co. Ltd. (Automobiles & Components) | $ | 1,816,792 | |||||
| 44,800 | Kyokuto Kaihatsu Kogyo Co. Ltd. (Capital Goods) | 588,974 | ||||||
| 103,200 | Kyokuto Securities Co. Ltd. (Diversified Financials)(a) | 1,618,632 | ||||||
| 41,500 | KYORIN Holdings, Inc. (Pharmaceuticals, Biotechnology & Life Sciences) | 799,914 | ||||||
| 30,300 | Kyoritsu Maintenance Co. Ltd. (Consumer Services)(a) | 1,034,872 | ||||||
| 55,000 | Kyosan Electric Manufacturing Co. Ltd. (Capital Goods) | 190,232 | ||||||
| 45,600 | Kyowa Exeo Corp. (Capital Goods) | 589,868 | ||||||
| 99,300 | Lifenet Insurance Co. (Insurance)* | 432,853 | ||||||
| 62,000 | Lion Corp. (Household & Personal Products) | 339,649 | ||||||
| 25,400 | Macnica, Inc. (Technology Hardware & Equipment) | 753,136 | ||||||
| 228,000 | Maeda Road Construction Co. Ltd. (Capital Goods) | 3,535,272 | ||||||
| 19,000 | Makino Milling Machine Co. Ltd. (Capital Goods) | 141,454 | ||||||
| 28,000 | Marudai Food Co. Ltd. (Food, Beverage & Tobacco) | 83,342 | ||||||
| 6,900 | Maruha Nichiro Corp. (Food, Beverage & Tobacco)* | 109,336 | ||||||
| 4,300 | Maruwa Co. Ltd. (Technology Hardware & Equipment) | 152,569 | ||||||
| 75,000 | Matsumotokiyoshi Holdings Co. Ltd. (Food & Staples Retailing) | 2,213,212 | ||||||
| 43,400 | Megmilk Snow Brand Co. Ltd. (Food, Beverage & Tobacco) | 575,875 | ||||||
| 39,000 | Melco Holdings, Inc. (Technology Hardware & Equipment) | 593,040 | ||||||
| 293 | MID REIT, Inc. (REIT) | 662,942 | ||||||
| 11,800 | Ministop Co. Ltd. (Food & Staples Retailing) | 178,711 | ||||||
| 87,100 | Mirait Holdings Corp. (Capital Goods) | 766,138 | ||||||
| 200,000 | Mito Securities Co. Ltd. (Diversified Financials) | 698,679 | ||||||
| 84,500 | Mitsui High-Tec, Inc. (Semiconductors & Semiconductor Equipment) | 532,960 | ||||||
| 73,000 | Mitsui Sugar Co. Ltd. (Food, Beverage & Tobacco) | 302,890 | ||||||
| 61,200 | Modec, Inc. (Energy) | 1,356,151 | ||||||
| 155 | Mori Hills REIT Investment Corp. (REIT) | 206,842 | ||||||
| 324 | Mori Trust Sogo REIT, Inc. (REIT) | 486,271 | ||||||
| 371,000 | Morinaga Milk Industry Co. Ltd. (Food, Beverage & Tobacco) | 1,384,871 | ||||||
| 21,800 | NEC Capital Solutions Ltd. (Capital Goods)(a) | 377,273 | ||||||
| 78,100 | NEC Networks & System Integration Corp. (Software & Services) | 1,649,967 | ||||||
|
| |||||||
| The accompanying notes are an integral part of these financial statements. | 35 |
GOLDMAN SACHS INTERNATIONAL SMALL CAP INSIGHTS FUND
Schedule of Investments (continued)
April 30, 2014 (Unaudited)
| Shares | Description | Value | ||||||
| Common Stocks – (continued) | ||||||||
| Japan – (continued) | ||||||||
| 13,000 | Neturen Co. Ltd. (Materials) | $ | 89,190 | |||||
| 164,600 | Nichicon Corp. (Technology Hardware & Equipment) | 1,220,917 | ||||||
| 18,000 | Nichi-iko Pharmaceutical Co. Ltd. (Pharmaceuticals, Biotechnology & Life Sciences) | 279,195 | ||||||
| 13,300 | NIFTY Corp. (Software & Services) | 188,659 | ||||||
| 237,000 | Nippo Corp. (Capital Goods) | 3,621,242 | ||||||
| 213 | Nippon Accommodations Fund, Inc. (REIT) | 751,247 | ||||||
| 447,000 | Nippon Chemi-Con Corp. (Technology Hardware & Equipment)* | 1,428,859 | ||||||
| 176,000 | Nippon Flour Mills Co. Ltd. (Food, Beverage & Tobacco) | 981,970 | ||||||
| 7,000 | Nippon Kayaku Co. Ltd. (Materials) | 83,300 | ||||||
| 160,100 | Nippon Light Metal Holdings Co. Ltd. (Materials) | 225,753 | ||||||
| 115,100 | Nippon Paper Industries Co. Ltd. (Materials)(a) | 2,103,534 | ||||||
| 17,000 | Nippon Seiki Co. Ltd. (Automobiles & Components) | 297,250 | ||||||
| 28,000 | Nippon Shinyaku Co. Ltd. (Pharmaceuticals, Biotechnology & Life Sciences) | 493,246 | ||||||
| 1,238,400 | Nippon Suisan Kaisha Ltd. (Food, Beverage & Tobacco)* | 2,849,774 | ||||||
| 139,000 | Nippon Thompson Co. Ltd. (Capital Goods) | 633,480 | ||||||
| 83,800 | Nisshin Steel Co. Ltd. (Materials) | 860,660 | ||||||
| 12,000 | Nisshinbo Holdings, Inc. (Capital Goods) | 102,807 | ||||||
| 261,000 | Nissin Electric Co. Ltd. (Capital Goods) | 1,451,537 | ||||||
| 12,200 | Nitto Kogyo Corp. (Capital Goods) | 252,948 | ||||||
| 5,300 | Nitto Kohki Co. Ltd. (Capital Goods) | 96,498 | ||||||
| 349 | Nomura Real Estate Office Fund, Inc. (REIT) | 1,510,347 | ||||||
| 202 | Nomura Real Estate Residential Fund, Inc. (REIT) | 1,117,659 | ||||||
| 25,400 | Noritz Corp. (Capital Goods) | 451,255 | ||||||
| 151,300 | North Pacific Bank Ltd. (Banks) | 612,867 | ||||||
| 407,000 | NS United Kaiun Kaisha Ltd. (Transportation) | 914,560 | ||||||
| 439,000 | NTN Corp. (Capital Goods) | 1,502,443 | ||||||
| 3,700 | Odelic Co. Ltd. (Capital Goods) | 100,538 | ||||||
| 23,700 | Okabe Co. Ltd. (Capital Goods) | 325,877 | ||||||
| 21,200 | Otsuka Kagu Ltd. (Retailing) | 206,854 | ||||||
| 34,400 | Paltac Corp. (Retailing) | 424,926 | ||||||
| 170,500 | Pioneer Corp. (Consumer Durables & Apparel)* | 368,398 | ||||||
| 23,300 | Pocket Card Co. Ltd. (Diversified Financials) | 152,713 | ||||||
| 48,000 | Pola Orbis Holdings, Inc. (Household & Personal Products) | 1,878,512 | ||||||
| 196 | Premier Investment Corp. (REIT) | 757,188 | ||||||
|
| |||||||
| Common Stocks – (continued) | ||||||||
| Japan – (continued) | ||||||||
| 42,000 | Rengo Co. Ltd. (Materials) | $ | 187,686 | |||||
| 34,900 | Riso Kagaku Corp. (Technology Hardware & Equipment) | 860,920 | ||||||
| 178,700 | Rohto Pharmaceutical Co. Ltd. (Pharmaceuticals, Biotechnology & Life Sciences) | 3,152,539 | ||||||
| 47,400 | Roland Corp. (Consumer Durables & Apparel) | 673,769 | ||||||
| 15,000 | Roland DG Corp. (Technology Hardware & Equipment) | 507,001 | ||||||
| 119,000 | Ryobi Ltd. (Capital Goods) | 352,532 | ||||||
| 21,300 | Saizeriya Co. Ltd. (Consumer Services) | 244,050 | ||||||
| 26,900 | Sakata INX Corp. (Materials) | 237,262 | ||||||
| 49,800 | Sakata Seed Corp. (Food, Beverage & Tobacco) | 695,684 | ||||||
| 16,100 | San-A Co. Ltd. (Food & Staples Retailing) | 464,008 | ||||||
| 114,000 | Sankyu, Inc. (Transportation) | 434,548 | ||||||
| 51,200 | Sanshin Electronics Co. Ltd. (Technology Hardware & Equipment) | 321,360 | ||||||
| 182,000 | Sanwa Holdings Corp. (Capital Goods) | 1,111,881 | ||||||
| 59,000 | Sanyo Denki Co. Ltd. (Capital Goods) | 397,398 | ||||||
| 339,000 | Sanyo Special Steel Co. Ltd. (Materials) | 1,322,205 | ||||||
| 13,300 | Sawada Holdings Co. Ltd. (Diversified Financials) | 112,808 | ||||||
| 11,900 | Sawai Pharmaceutical Co. Ltd. (Pharmaceuticals, Biotechnology & Life Sciences) | 736,473 | ||||||
| 75,700 | Seikagaku Corp. (Pharmaceuticals, Biotechnology & Life Sciences) | 906,385 | ||||||
| 109,000 | Seino Holdings Co. Ltd. (Transportation) | 1,077,328 | ||||||
| 2,858 | Sekisui House SI Investment Co. (REIT)(a) | 2,700,181 | ||||||
| 10,000 | Sekisui Jushi Corp. (Capital Goods) | 133,144 | ||||||
| 484,000 | Senko Co. Ltd. (Transportation)(a) | 2,212,179 | ||||||
| 16,800 | Shima Seiki Manufacturing Ltd. (Capital Goods) | 280,366 | ||||||
| 31,000 | Shimachu Co. Ltd. (Retailing) | 681,151 | ||||||
| 197,000 | Shindengen Electric Manufacturing Co. Ltd. (Semiconductors & Semiconductor Equipment) | 804,829 | ||||||
| 273,500 | Shinko Electric Industries Co. Ltd. (Semiconductors & Semiconductor Equipment) | 1,801,188 | ||||||
| 13,900 | Shinko Shoji Co. Ltd. (Technology Hardware & Equipment) | 128,066 | ||||||
| 335,000 | Sinfonia Technology Co. Ltd. (Capital Goods) | 515,312 | ||||||
| 212,800 | Skymark Airlines, Inc. (Transportation) | 650,646 | ||||||
| 188,000 | SMK Corp. (Technology Hardware & Equipment) | 701,346 | ||||||
|
| |||||||
| 36 | The accompanying notes are an integral part of these financial statements. |
GOLDMAN SACHS INTERNATIONAL SMALL CAP INSIGHTS FUND
| Shares | Description | Value | ||||||
| Common Stocks – (continued) | ||||||||
| Japan – (continued) | ||||||||
| 62,300 | Sodick Co. Ltd. (Capital Goods) | $ | 231,329 | |||||
| 312,600 | Square Enix Holdings Co. Ltd. (Software & Services)(a) | 5,028,056 | ||||||
| 13,600 | St. Marc Holdings Co. Ltd. (Consumer Services) | 644,559 | ||||||
| 81,900 | Start Today Co. Ltd. (Retailing) | 1,716,336 | ||||||
| 241,000 | Sumitomo Bakelite Co. Ltd. (Materials) | 917,839 | ||||||
| 34,200 | Sumitomo Densetsu Co. Ltd. (Capital Goods) | 421,740 | ||||||
| 56,000 | Sumitomo Seika Chemicals Co. Ltd. (Materials) | 352,314 | ||||||
| 3,400 | Sundrug Co. Ltd. (Food & Staples Retailing) | 139,103 | ||||||
| 230,000 | T RAD Co. Ltd. (Automobiles & Components) | 600,574 | ||||||
| 10,000 | Tadano Ltd. (Capital Goods) | 141,398 | ||||||
| 75,000 | Taikisha Ltd. (Capital Goods) | 1,622,758 | ||||||
| 13,600 | Takaoka Toko Co. Ltd. (Capital Goods) | 194,169 | ||||||
| 19,000 | Takara Bio, Inc. (Pharmaceuticals, Biotechnology & Life Sciences)(a) | 206,267 | ||||||
| 183,900 | Tecmo Koei Holdings Co. Ltd. (Software & Services) | 2,196,880 | ||||||
| 239,000 | The 77 Bank Ltd. (Banks) | 1,078,973 | ||||||
| 29,000 | The Hokkoku Bank Ltd. (Banks) | 97,109 | ||||||
| 25,000 | The Juroku Bank Ltd. (Banks) | 87,331 | ||||||
| 7,100 | The Kiyo Bank Ltd. (Banks) | 83,546 | ||||||
| 8,100 | The Musashino Bank Ltd. (Banks) | 259,564 | ||||||
| 107,000 | The Nippon Road Co. Ltd. (Capital Goods) | 544,705 | ||||||
| 10,800 | The Nippon Signal Co. Ltd. (Capital Goods) | 89,555 | ||||||
| 54,000 | The Nippon Synthetic Chemical Industry Co. Ltd. (Materials) | 359,794 | ||||||
| 73,000 | The Nisshin Oillio Group Ltd. (Food, Beverage & Tobacco) | 244,419 | ||||||
| 56,000 | The Ogaki Kyoritsu Bank Ltd. (Banks) | 151,259 | ||||||
| 5,600 | The Okinawa Electric Power Co., Inc. (Utilities) | 183,028 | ||||||
| 77,000 | The San-In Godo Bank Ltd. (Banks) | 508,212 | ||||||
| 54,000 | Toa Corp. (Capital Goods) | 101,583 | ||||||
| 19,000 | Toagosei Co. Ltd. (Materials) | 79,505 | ||||||
| 15,100 | Tocalo Co. Ltd. (Capital Goods) | 236,072 | ||||||
| 32,000 | Toei Co. Ltd. (Media) | 179,150 | ||||||
| 19,900 | Tohokushinsha Film Corp. (Media) | 153,968 | ||||||
| 154,000 | Tokai Carbon Co. Ltd. (Materials) | 494,073 | ||||||
| 68,000 | Toko, Inc. (Technology Hardware & Equipment)(a) | 197,825 | ||||||
| 187,000 | Tokuyama Corp. (Materials) | 542,335 | ||||||
| 56,200 | Tokyo Seimitsu Co. Ltd. (Semiconductors & Semiconductor Equipment) | 947,078 | ||||||
| 166 | Top REIT, Inc. (REIT) | 720,582 | ||||||
|
| |||||||
| Common Stocks – (continued) | ||||||||
| Japan – (continued) | ||||||||
| 19,100 | Topre Corp. (Automobiles & Components) | $ | 193,270 | |||||
| 5,200 | Torii Pharmaceutical Co. Ltd. (Pharmaceuticals, Biotechnology & Life Sciences) | 147,720 | ||||||
| 140,000 | Toshiba Machine Co. Ltd. (Capital Goods) | 628,758 | ||||||
| 33,000 | Towa Pharmaceutical Co. Ltd. (Pharmaceuticals, Biotechnology & Life Sciences) | 1,409,935 | ||||||
| 52,000 | Toyo Engineering Corp. (Capital Goods) | 229,448 | ||||||
| 47,000 | Toyo Ink SC Holdings Co. Ltd. (Materials) | 191,730 | ||||||
| 72,000 | Toyo Securities Co. Ltd. (Diversified Financials) | 198,346 | ||||||
| 43,000 | Toyo Tire & Rubber Co. Ltd. (Automobiles & Components) | 320,645 | ||||||
| 20,800 | TS Tech Co. Ltd. (Automobiles & Components) | 554,732 | ||||||
| 19,000 | Tsukishima Kikai Co. Ltd. (Capital Goods) | 202,198 | ||||||
| 39,900 | TV Asahi Holdings Corp. (Media) | 695,229 | ||||||
| 4,100 | Union Tool Co. (Capital Goods) | 96,116 | ||||||
| 6,100 | Unipres Corp. (Automobiles & Components) | 117,859 | ||||||
| 24,030 | Usen Corp. (Media)* | 88,661 | ||||||
| 50,100 | Ushio, Inc. (Capital Goods) | 654,387 | ||||||
| 50,600 | Valor Co. Ltd. (Food & Staples Retailing) | 655,830 | ||||||
| 86,600 | Wacom Co. Ltd. (Technology Hardware & Equipment)(a) | 566,354 | ||||||
| 193,000 | Wakita & Co. Ltd. (Capital Goods) | 2,190,653 | ||||||
| 82,600 | West Holdings Corp. (Consumer Durables & Apparel)(a) | 1,111,930 | ||||||
| 13,600 | Xebio Co. Ltd. (Retailing) | 251,520 | ||||||
| 183,500 | Yokogawa Bridge Holdings Corp. (Capital Goods) | 2,433,229 | ||||||
| 51,300 | Yokohama Reito Co. Ltd. (Food & Staples Retailing) | 415,264 | ||||||
| 8,300 | Yoshinoya Holdings Co. Ltd. (Consumer Services) | 105,111 | ||||||
| 7,500 | Yusen Logistics Co. Ltd. (Transportation) | 86,372 | ||||||
| 20,300 | Zensho Holdings Co. Ltd. (Consumer Services) | 205,216 | ||||||
| 5,300 | ZERIA Pharmaceutical Co. Ltd. (Pharmaceuticals, Biotechnology & Life Sciences) | 111,118 | ||||||
|
| |||||||
| 201,127,149 | ||||||||
|
| |||||||
| Jersey – 0.3% | ||||||||
| 1,939,409 | Centamin PLC (Materials)* | 2,119,609 | ||||||
| 151,669 | Highland Gold Mining Ltd. (Materials) | 157,631 | ||||||
|
| |||||||
| The accompanying notes are an integral part of these financial statements. | 37 |
GOLDMAN SACHS INTERNATIONAL SMALL CAP INSIGHTS FUND
Schedule of Investments (continued)
April 30, 2014 (Unaudited)
| Shares | Description | Value | ||||||
| Common Stocks – (continued) | ||||||||
| Jersey – (continued) | ||||||||
| 71,082 | Petra Diamonds Ltd. (Materials)* | $ | 196,083 | |||||
|
| |||||||
| 2,473,323 | ||||||||
|
| |||||||
| Luxembourg – 0.6% | ||||||||
| 199,985 | APERAM (Materials)* | 5,203,333 | ||||||
|
| |||||||
| Netherlands – 2.0% | ||||||||
| 77,154 | Aalberts Industries NV (Capital Goods) | 2,570,139 | ||||||
| 153,520 | BE Semiconductor Industries NV (Semiconductors & Semiconductor Equipment)* | 2,619,704 | ||||||
| 225,009 | BinckBank NV (Diversified Financials)(a) | 2,542,366 | ||||||
| 20,050 | Brunel International NV (Commercial & Professional Services) | 1,358,218 | ||||||
| 12,930 | Corbion NV (Food, Beverage & Tobacco) | 299,881 | ||||||
| 3,601 | Eurocommercial Properties NV CVA (Real Estate) | 165,320 | ||||||
| 200,792 | PostNL NV (Transportation)* | 882,546 | ||||||
| 349,050 | SNS REAAL NV (Diversified Financials)*(a) | — | ||||||
| 575,531 | TomTom NV (Consumer Durables & Apparel)* | 4,080,874 | ||||||
| 100,116 | USG People NV (Commercial & Professional Services) | 1,732,156 | ||||||
| 9,534 | Wereldhave NV (REIT) | 801,725 | ||||||
|
| |||||||
| 17,052,929 | ||||||||
|
| |||||||
| New Zealand – 0.7% | ||||||||
| 2,556,586 | Air New Zealand Ltd. (Transportation) | 4,632,704 | ||||||
| 72,267 | Infratil Ltd. (Utilities) | 143,426 | ||||||
| 256,644 | New Zealand Oil & Gas Ltd. (Energy) | 171,511 | ||||||
| 239,042 | Summerset Group Holdings Ltd. (Health Care Equipment & Services) | 720,113 | ||||||
|
| |||||||
| 5,667,754 | ||||||||
|
| |||||||
| Norway – 0.4% | ||||||||
| 74,409 | Borregaard ASA (Materials) | 517,183 | ||||||
| 30,425 | Leroey Seafood Group ASA (Food, Beverage & Tobacco) | 1,077,595 | ||||||
| 69,339 | Nordic Semiconductor ASA (Semiconductors & Semiconductor Equipment)*(a) | 389,024 | ||||||
| 106,419 | SpareBanken 1 SMN (Banks) | 945,092 | ||||||
|
| |||||||
| 2,928,894 | ||||||||
|
| |||||||
| Portugal – 0.5% | ||||||||
| 308,135 | Mota-Engil SGPS SA (Capital Goods) | 2,358,810 | ||||||
| 255,253 | Portucel SA (Materials) | 1,210,301 | ||||||
| 105,950 | REN – Redes Energeticas Nacionais SGPS SA (Utilities) | 398,467 | ||||||
|
| |||||||
| 3,967,578 | ||||||||
|
| |||||||
| Common Stocks – (continued) | ||||||||
| Singapore – 1.1% | ||||||||
| 21,353 | Cape PLC (Commercial & Professional Services) | $ | 108,273 | |||||
| 448,000 | Chip Eng Seng Corp. Ltd. (Capital Goods) | 273,802 | ||||||
| 749,000 | CSE Global Ltd. (Software & Services) | 355,693 | ||||||
| 3,752,000 | Ezra Holdings Ltd. (Energy) | 3,151,444 | ||||||
| 167,000 | First Resources Ltd. (Food, Beverage & Tobacco) | 342,971 | ||||||
| 100,000 | Frasers Commercial Trust (REIT) | 101,472 | ||||||
| 219,000 | Hi-P International Ltd. (Technology Hardware & Equipment) | 101,497 | ||||||
| 216,000 | Ho Bee Land Ltd. (Real Estate) | 395,317 | ||||||
| 785,000 | Indofood Agri Resources Ltd. (Food, Beverage & Tobacco) | 668,537 | ||||||
| 340,000 | Mapletree Industrial Trust (REIT) | 391,245 | ||||||
| 2,451,000 | Mapletree Logistics Trust (REIT) | 2,152,649 | ||||||
| 303,000 | Midas Holdings Ltd. (Materials) | 113,905 | ||||||
| 254,000 | Stamford Land Corp. Ltd. (Consumer Services) | 120,666 | ||||||
| 561,000 | Wing Tai Holdings Ltd. (Real Estate) | 897,274 | ||||||
|
| |||||||
| 9,174,745 | ||||||||
|
| |||||||
| Spain – 2.2% | ||||||||
| 333,271 | Bankinter SA (Banks) | 2,551,681 | ||||||
| 74,120 | Bolsas y Mercados Espanoles SA (Diversified Financials) | 3,229,067 | ||||||
| 32,086 | Duro Felguera SA (Capital Goods) | 218,918 | ||||||
| 454,838 | Ence Energia y Celulosa SA (Materials)* | 1,339,670 | ||||||
| 112,924 | Fomento de Construcciones y Contratas SA (Capital Goods)*(a) | 2,490,985 | ||||||
| 576,391 | Gamesa Corp. Tecnologica SA (Capital Goods)* | 5,729,233 | ||||||
| 396,828 | Liberbank SA (Banks)*(a) | 495,365 | ||||||
| 82,414 | Papeles y Cartones de Europa SA (Materials) | 455,945 | ||||||
| 41,911 | Sacyr SA (Capital Goods)*(a) | 276,043 | ||||||
| 27,003 | Tecnicas Reunidas SA (Energy) | 1,626,493 | ||||||
| 119,699 | Zeltia SA (Pharmaceuticals, Biotechnology & Life Sciences)*(a) | 451,566 | ||||||
|
| |||||||
| 18,864,966 | ||||||||
|
| |||||||
| Sweden – 4.3% | ||||||||
| 20,291 | B&B Tools AB (Capital Goods) | 372,337 | ||||||
| 44,906 | Betsson AB (Consumer Services)* | 1,641,682 | ||||||
| 86,571 | Bilia AB (Retailing)(a) | 2,874,450 | ||||||
| 25,966 | BioGaia AB (Pharmaceuticals, Biotechnology & Life Sciences)* | 778,716 | ||||||
| 69,817 | Castellum AB (Real Estate) | 1,190,569 | ||||||
| 58,703 | Eniro AB (Media)* | 469,711 | ||||||
| 152,587 | Fabege AB (Real Estate) | 2,143,528 | ||||||
| 121,178 | Fastighets AB Balder (Real Estate)* | 1,554,614 | ||||||
| 73,353 | Haldex AB (Capital Goods) | 940,906 | ||||||
| 1,900 | Hexpol AB (Materials) | 180,023 | ||||||
|
| |||||||
| 38 | The accompanying notes are an integral part of these financial statements. |
GOLDMAN SACHS INTERNATIONAL SMALL CAP INSIGHTS FUND
| Shares | Description | Value | ||||||
| Common Stocks – (continued) | ||||||||
| Sweden – (continued) | ||||||||
| 45,778 | Industrial & Financial Systems AB (Software & Services)(a) | $ | 1,313,205 | |||||
| 91,942 | JM AB (Consumer Durables & Apparel)(a) | 3,124,182 | ||||||
| 116,139 | Klovern AB (Real Estate)(a) | 638,687 | ||||||
| 34,214 | Kungsleden AB (Real Estate) | 279,461 | ||||||
| 20,738 | Lindab International AB (Capital Goods)* | 258,538 | ||||||
| 295,818 | Meda AB (Pharmaceuticals, Biotechnology & Life Sciences) | 5,317,316 | ||||||
| 85,404 | NCC AB (Capital Goods) | 2,992,174 | ||||||
| 23,182 | Net Entertainment NE AB (Software & Services)* | 10,696 | ||||||
| 23,182 | Net Entertainment NE AB (Software & Services)* | 557,962 | ||||||
| 185,678 | Nobia AB (Consumer Durables & Apparel) | 1,684,815 | ||||||
| 85,789 | Nolato AB (Capital Goods) | 1,958,884 | ||||||
| 40,939 | Orexo AB (Pharmaceuticals, Biotechnology & Life Sciences)*(a) | 664,672 | ||||||
| 839,687 | SAS AB (Transportation)*(a) | 1,805,761 | ||||||
| 175,942 | Swedish Orphan Biovitrum AB (Pharmaceuticals, Biotechnology & Life Sciences)* | 1,934,733 | ||||||
| 54,279 | Wallenstam AB (Real Estate)(a) | 890,982 | ||||||
| 26,696 | Wihlborgs Fastigheter AB (Real Estate) | 514,698 | ||||||
|
| |||||||
| 36,093,302 | ||||||||
|
| |||||||
| Switzerland – 4.9% | ||||||||
| 12,938 | AFG Arbonia-Forster Holding AG (Registered) (Capital Goods)* | 431,306 | ||||||
| 61,909 | Ascom Holding AG (Registered) (Technology Hardware & Equipment) | 1,151,705 | ||||||
| 11,790 | Autoneum Holding AG (Automobiles & Components)* | 2,501,260 | ||||||
| 10,294 | Basilea Pharmaceutica (Registered) (Pharmaceuticals, Biotechnology & Life Sciences)* | 1,078,586 | ||||||
| 10,562 | Bossard Holding AG (Registered) (Capital Goods)* | 1,454,865 | ||||||
| 434 | Emmi AG (Registered) (Food, Beverage & Tobacco)* | 159,246 | ||||||
| 3,624 | Flughafen Zuerich AG (Registered) (Transportation) | 2,286,315 | ||||||
| 4,024 | Galenica AG (Registered) (Pharmaceuticals, Biotechnology & Life Sciences) | 4,097,557 | ||||||
| 6,315 | Georg Fischer AG (Registered) (Capital Goods)* | 5,009,725 | ||||||
| 2,274 | Helvetia Holding AG (Registered) (Insurance) | 1,133,472 | ||||||
| 37,074 | Implenia AG (Registered) (Capital Goods)* | 2,718,520 | ||||||
|
| |||||||
| Common Stocks – (continued) | ||||||||
| Switzerland – (continued) | ||||||||
| 7,673 | Inficon Holding AG (Registered) (Technology Hardware & Equipment)* | $ | 2,746,273 | |||||
| 428 | Intershop Holdings AG (Real Estate) | 165,429 | ||||||
| 10,897 | Komax Holding AG (Registered) (Capital Goods)* | 1,686,707 | ||||||
| 47,990 | Kudelski SA (Technology Hardware & Equipment) | 827,641 | ||||||
| 5,028 | Kuoni Reisen Holding AG (Registered) (Consumer Services)* | 2,220,430 | ||||||
| 184 | LEM Holding SA (Registered) (Technology Hardware & Equipment) | 151,992 | ||||||
| 40,153 | Logitech International SA (Registered) (Technology Hardware & Equipment) | 544,583 | ||||||
| 1,415 | Mobimo Holding AG (Registered) (Real Estate)* | 304,120 | ||||||
| 118,753 | OC Oerlikon Corp. AG (Registered) (Capital Goods)* | 1,891,699 | ||||||
| 31,238 | PSP Swiss Property AG (Registered) (Real Estate)* | 3,002,445 | ||||||
| 4,103 | Siegfried Holding AG (Registered) (Pharmaceuticals, Biotechnology & Life Sciences)* | 768,864 | ||||||
| 29,412 | U-Blox AG (Semiconductors & Semiconductor Equipment)* | 3,600,946 | ||||||
| 24,923 | Zehnder Group AG (Capital Goods)(a) | 1,087,426 | ||||||
|
| |||||||
| 41,021,112 | ||||||||
|
| |||||||
| United Kingdom – 16.5% | ||||||||
| 57,439 | Advanced Medical Solutions Group PLC (Health Care Equipment & Services) | 120,498 | ||||||
| 450,486 | Afren PLC (Energy)* | 1,196,592 | ||||||
| 23,132 | Alent PLC (Materials) | 124,198 | ||||||
| 264,751 | Ashmore Group PLC (Diversified Financials)(a) | 1,572,586 | ||||||
| 129,854 | Barratt Developments PLC (Consumer Durables & Apparel) | 812,129 | ||||||
| 148,927 | Berendsen PLC (Commercial & Professional Services) | 2,602,641 | ||||||
| 21,103 | Berkeley Group Holdings PLC (Consumer Durables & Apparel) | 818,832 | ||||||
| 83,736 | Betfair Group PLC (Consumer Services) | 1,367,143 | ||||||
| 153,530 | Big Yellow Group PLC (REIT) | 1,334,527 | ||||||
| 138,134 | Bodycote PLC (Capital Goods) | 1,704,506 | ||||||
| 662,098 | Booker Group PLC (Food & Staples Retailing) | 1,647,024 | ||||||
| 93,838 | BTG PLC (Pharmaceuticals, Biotechnology & Life Sciences)* | 843,790 | ||||||
| 294,776 | Cairn Energy PLC (Energy)* | 918,162 | ||||||
| 78,979 | Capital & Counties Properties PLC (Real Estate) | 445,512 | ||||||
| 149,209 | Chesnara PLC (Insurance) | 830,091 | ||||||
|
| |||||||
| The accompanying notes are an integral part of these financial statements. | 39 |
GOLDMAN SACHS INTERNATIONAL SMALL CAP INSIGHTS FUND
Schedule of Investments (continued)
April 30, 2014 (Unaudited)
| Shares | Description | Value | ||||||
| Common Stocks – (continued) | ||||||||
| United Kingdom – (continued) | ||||||||
| 52,985 | Clinigen Group PLC (Pharmaceuticals, Biotechnology & Life Sciences)* | $ | 434,104 | |||||
| 11,751 | Close Brothers Group PLC (Diversified Financials) | 277,573 | ||||||
| 75,043 | Computacenter PLC (Software & Services) | 826,140 | ||||||
| 68,740 | Concentric AB (Capital Goods)* | 972,571 | ||||||
| 22,042 | Costain Group PLC (Capital Goods) | 100,188 | ||||||
| 236,483 | CSR PLC (Semiconductors & Semiconductor Equipment) | 2,297,772 | ||||||
| 7,717 | Daily Mail & General Trust PLC (Media) | 106,372 | ||||||
| 38,967 | Dairy Crest Group PLC (Food, Beverage & Tobacco) | 304,024 | ||||||
| 163,618 | Dart Group PLC (Transportation) | 815,551 | ||||||
| 4,220 | Derwent London PLC (REIT) | 194,131 | ||||||
| 202,883 | Diploma PLC (Capital Goods) | 2,264,224 | ||||||
| 34,001 | Drax Group PLC (Utilities) | 380,608 | ||||||
| 861,478 | DS Smith PLC (Materials) | 4,590,865 | ||||||
| 394,116 | Elementis PLC (Materials) | 1,850,138 | ||||||
| 877,990 | EnQuest PLC (Energy)* | 2,037,800 | ||||||
| 261,997 | Fenner PLC (Capital Goods) | 1,833,065 | ||||||
| 193,044 | Galliford Try PLC (Capital Goods) | 3,885,857 | ||||||
| 1,383,678 | Globo PLC (Software & Services)*(a) | 1,284,911 | ||||||
| 59,906 | Go-Ahead Group PLC (Transportation) | 1,997,818 | ||||||
| 603,891 | Halfords Group PLC (Retailing) | 4,531,442 | ||||||
| 1,308,094 | Hansteen Holdings PLC (REIT) | 2,277,606 | ||||||
| 131,009 | Hays PLC (Commercial & Professional Services) | 334,230 | ||||||
| 168,123 | Hikma Pharmaceuticals PLC (Pharmaceuticals, Biotechnology & Life Sciences) | 4,411,862 | ||||||
| 20,329 | Hill & Smith Holdings PLC (Materials) | 192,024 | ||||||
| 1,182,581 | Home Retail Group PLC (Retailing) | 4,086,187 | ||||||
| 76,283 | Homeserve PLC (Commercial & Professional Services) | 435,172 | ||||||
| 490,426 | IG Group Holdings PLC (Diversified Financials) | 5,273,849 | ||||||
| 642,574 | Intermediate Capital Group PLC (Diversified Financials) | 4,823,042 | ||||||
| 268,276 | Interserve PLC (Capital Goods) | 3,006,604 | ||||||
| 30,217 | JD Wetherspoon PLC (Consumer Services) | 430,501 | ||||||
| 239,149 | John Wood Group PLC (Energy) | 3,171,053 | ||||||
| 127,353 | Keller Group PLC (Capital Goods) | 2,148,585 | ||||||
| 699,907 | Ladbrokes PLC (Consumer Services) | 1,814,978 | ||||||
| 264,792 | Lancashire Holdings Ltd. (Insurance) | 3,129,524 | ||||||
| 66,862 | Lookers PLC (Retailing) | 157,832 | ||||||
| 790,491 | Man Group PLC (Diversified Financials) | 1,319,211 | ||||||
| 228,434 | Micro Focus International PLC (Software & Services) | 2,995,779 | ||||||
|
| |||||||
| Common Stocks – (continued) | ||||||||
| United Kingdom – (continued) | ||||||||
| 38,675 | Mitchells & Butlers PLC (Consumer Services)* | $ | 288,148 | |||||
| 285,281 | Mondi PLC (Materials) | 4,742,490 | ||||||
| 475,053 | Moneysupermarket.com Group PLC (Software & Services) | 1,465,489 | ||||||
| 13,785 | Morgan Sindall Group PLC (Capital Goods) | 184,451 | ||||||
| 285,745 | N Brown Group PLC (Retailing) | 2,476,571 | ||||||
| 140,098 | Northgate PLC (Transportation) | 1,226,365 | ||||||
| 48,019 | Pace PLC (Technology Hardware & Equipment) | 295,893 | ||||||
| 199,747 | Paragon Group of Companies PLC (Banks) | 1,208,559 | ||||||
| 523,922 | Pennon Group PLC (Utilities) | 6,707,078 | ||||||
| 297,572 | Premier Foods PLC (Food, Beverage & Tobacco)* | 288,892 | ||||||
| 114,406 | Premier Oil PLC (Energy) | 655,095 | ||||||
| 491,545 | QinetiQ Group PLC (Capital Goods) | 1,751,244 | ||||||
| 402,970 | Redefine International PLC (REIT) | 377,608 | ||||||
| 89,761 | Rightmove PLC (Media) | 3,656,802 | ||||||
| 8,208 | Rotork PLC (Capital Goods) | 359,973 | ||||||
| 25,274 | RPC Group PLC (Materials) | 256,146 | ||||||
| 20,570 | RPS Group PLC (Commercial & Professional Services) | 102,879 | ||||||
| 28,661 | Savills PLC (Real Estate) | 290,347 | ||||||
| 42,754 | Senior PLC (Capital Goods) | 206,628 | ||||||
| 38,029 | Shaftesbury PLC (REIT) | 425,200 | ||||||
| 61,541 | Shanks Group PLC (Commercial & Professional Services) | 106,241 | ||||||
| 389,172 | SIG PLC (Capital Goods) | 1,261,269 | ||||||
| 188,857 | Soco International PLC (Energy)* | 1,380,293 | ||||||
| 861,670 | Speedy Hire PLC (Capital Goods) | 820,434 | ||||||
| 39,446 | ST Modwen Properties PLC (Real Estate) | 247,421 | ||||||
| 50,422 | Stagecoach Group PLC (Transportation) | 316,188 | ||||||
| 184,266 | Stobart Group Ltd. (Transportation)(a) | 426,227 | ||||||
| 3,585 | Telecom Plus PLC (Utilities) | 93,699 | ||||||
| 39,703 | The Restaurant Group PLC (Consumer Services) | 419,221 | ||||||
| 1,951,285 | Thomas Cook Group PLC (Consumer Services)* | 5,768,196 | ||||||
| 18,737 | Tipp24 SE (Consumer Services)(a) | 1,351,890 | ||||||
| 146,626 | Trinity Mirror PLC (Media)* | 429,707 | ||||||
| 309,732 | TT electronics PLC (Technology Hardware & Equipment) | 1,095,583 | ||||||
| 41,898 | Tullett Prebon PLC (Diversified Financials) | 225,207 | ||||||
| 64,201 | Vectura Group PLC (Pharmaceuticals, Biotechnology & Life Sciences)* | 152,840 | ||||||
| 13,698 | Vesuvius PLC (Capital Goods) | 96,620 | ||||||
| 105,891 | Victrex PLC (Materials) | 3,334,002 | ||||||
| 288,444 | WH Smith PLC (Retailing) | 5,349,373 | ||||||
| 49,682 | Workspace Group PLC (REIT) | 481,489 | ||||||
| 27,251 | WS Atkins PLC (Commercial & Professional Services) | 591,029 | ||||||
|
| |||||||
| 40 | The accompanying notes are an integral part of these financial statements. |
GOLDMAN SACHS INTERNATIONAL SMALL CAP INSIGHTS FUND
| Shares | Description | Value | ||||||
| Common Stocks – (continued) | ||||||||
| United Kingdom – (continued) | ||||||||
| 97,989 | Xchanging PLC (Software & Services) | $ | 263,574 | |||||
|
| |||||||
| 138,507,785 | ||||||||
|
| |||||||
| TOTAL COMMON STOCKS | ||||||||
| (Cost $690,511,857) | $ | 771,296,133 | ||||||
|
| |||||||
| Preferred Stocks – 0.4% | ||||||||
| Germany – 0.3% | ||||||||
| 10,210 | Biotest AG (Pharmaceuticals, Biotechnology & Life Sciences) | $ | 1,345,401 | |||||
| 1,122 | Jungheinrich AG (Capital Goods) | 83,520 | ||||||
| 23,846 | Sixt SE (Transportation) | 771,674 | ||||||
| 595 | Sto AG (Materials) | 119,281 | ||||||
|
| |||||||
| 2,319,876 | ||||||||
|
| |||||||
| Italy – 0.1% | ||||||||
| 158,887 | Unipol Gruppo Finanziario SpA (Insurance) | 1,050,176 | ||||||
|
| |||||||
| 1,050,176 | ||||||||
|
| |||||||
| TOTAL PREFERRED STOCKS | ||||||||
| (Cost $2,542,933) | $ | 3,370,052 | ||||||
|
| |||||||
| Units | Description | Expiration Month | Value | |||||||||
| Right – 0.0% | ||||||||||||
| Portugal – 0.0% | ||||||||||||
| 193,770 | Mota-Engil SGPS SA (Capital Goods)* | 03/14 | $ | 110,219 | ||||||||
| (Cost $0) | ||||||||||||
|
| |||||||||||
| | TOTAL INVESTMENTS BEFORE SECURITIES LENDING REINVESTMENT VEHICLE | | ||||||||||
| (Cost $693,054,790) | $ | 774,776,404 | ||||||||||
|
| |||||||||||
| Shares | Distribution Rate | Value | ||||||
| Securities Lending Reinvestment Vehicle(b)(c) – 7.7% | ||||||||
| Goldman Sachs Financial Square Money Market Fund – | | ||||||
| 64,485,537 | 0.067% | $ | 64,485,537 | |||||
| (Cost $64,485,537) | ||||||||
|
| |||||||
| TOTAL INVESTMENTS– 99.8% | ||||||||
| (Cost $757,540,327) | $ | 839,261,941 | ||||||
|
| |||||||
| | OTHER ASSETS IN EXCESS OF LIABILITIES – 0.2% | 2,038,387 | ||||||
|
| |||||||
| NET ASSETS – 100.0% | $ | 841,300,328 | ||||||
|
| |||||||
| The percentage shown for each investment category reflects the value of investments in that category as a percentage of net assets. | ||
* | Non-income producing security. | |
(a) | All or a portion of security is on loan. | |
(b) | Variable rate security. Interest rate or distribution rate disclosed is that which is in effect at April 30, 2014. | |
(c) | Represents an affiliated issuer. | |
Investment Abbreviations: | ||
| ||
CVA | — Dutch Certification | |
REIT | — Real Estate Investment Trust | |
| ||
| ADDITIONAL INVESTMENT INFORMATION |
FUTURES CONTRACTS — At April 30, 2014, the Fund had the following futures contracts:
| Type | Number of Contracts Long (Short) | Expiration Date | Current Value | Unrealized Gain (Loss) | ||||||||||
EURO STOXX 50 Index | 553 | June 2014 | $ | 24,128,583 | $ | 157,402 | ||||||||
FTSE 100 Index | 110 | June 2014 | 12,526,155 | 219,779 | ||||||||||
Hang Seng Index | 9 | May 2014 | 1,267,472 | (26,614 | ) | |||||||||
MSCI Singapore Index | 23 | May 2014 | 1,351,711 | 7,678 | ||||||||||
SPI 200 Index | 43 | June 2014 | 5,461,753 | 21,834 | ||||||||||
TSE TOPIX Index | 133 | June 2014 | 15,032,181 | (216,094 | ) | |||||||||
| TOTAL | $ | 163,985 | ||||||||||||
| The accompanying notes are an integral part of these financial statements. | 41 |
GOLDMAN SACHS INTERNATIONAL EQUITY INSIGHTS FUNDS
Statements of Assets and Liabilities
April 30, 2014 (Unaudited)
| Emerging Markets Equity Insights Fund | International Equity Insights Fund | International Small Cap Insights Fund | ||||||||||||
| Assets: | ||||||||||||||
Investments in unaffiliated issuers, at value (cost $608,631,627, $856,036,482 and $693,054,790)(a) | $ | 642,700,691 | $ | 917,140,594 | $ | 774,776,404 | ||||||||
Investments in affiliated securities lending reinvestment vehicle, at value which equals cost | 15,680,600 | 63,772,469 | 64,485,537 | |||||||||||
Cash | 4,670,835 | 3,289,631 | 38,030,922 | |||||||||||
Foreign currencies, at value (cost $0, $25,499,664 and $62,292,495) | — | 25,613,768 | 62,572,074 | |||||||||||
Due from custodian | — | — | 2,613,386 | |||||||||||
Receivables: | ||||||||||||||
Investments sold | 10,698,264 | 11,414,008 | 11,913,863 | |||||||||||
Dividends | 547,798 | 4,413,679 | 3,333,805 | |||||||||||
Fund shares sold | 276,150 | 64,446 | 2,975,870 | |||||||||||
Reimbursement from investment adviser | 27,933 | 44,884 | 54,023 | |||||||||||
Foreign tax reclaims | 26,136 | 919,477 | 300,438 | |||||||||||
Securities lending income | 11,170 | 166,495 | 105,197 | |||||||||||
Collateral on certain derivative contracts(b) | — | — | 3,208,372 | |||||||||||
Other assets | 7,243 | 60,778 | 7,957 | |||||||||||
| Total assets | 674,646,820 | 1,026,900,229 | 964,377,848 | |||||||||||
| Liabilities: | ||||||||||||||
Due to custodian | 3,482,329 | — | — | |||||||||||
Payables: | ||||||||||||||
Payable upon return of securities loaned | 15,680,600 | 63,772,469 | 64,485,537 | |||||||||||
Fund shares redeemed | 5,555,842 | 622,287 | 5,385,755 | |||||||||||
Amounts owed to affiliates | 572,857 | 733,579 | 623,861 | |||||||||||
Foreign capital gains taxes | 221,263 | — | — | |||||||||||
Investments purchased | — | 178,759 | 52,174,952 | |||||||||||
Variation margin on certain derivative contracts | — | 21,232 | 308,734 | |||||||||||
Accrued expenses | 135,852 | 176,701 | 98,681 | |||||||||||
| Total liabilities | 25,648,743 | 65,505,027 | 123,077,520 | |||||||||||
| Net Assets: | ||||||||||||||
Paid-in capital | 640,577,957 | 2,238,954,387 | 738,706,007 | |||||||||||
Undistributed (distributions in excess of) net investment income | (125,119 | ) | 12,276,549 | (1,884,187 | ) | |||||||||
Accumulated net realized gain (loss) | (25,324,234 | ) | (1,351,318,112 | ) | 22,289,735 | |||||||||
Net unrealized gain | 33,869,473 | 61,482,378 | 82,188,773 | |||||||||||
| NET ASSETS | $ | 648,998,077 | $ | 961,395,202 | $ | 841,300,328 | ||||||||
Net Assets: | ||||||||||||||
Class A | $ | 30,593,817 | $ | 88,105,403 | $ | 143,806,815 | ||||||||
Class B | — | 1,622,522 | — | |||||||||||
Class C | 880,311 | 3,318,741 | 12,203,842 | |||||||||||
Institutional | 616,813,192 | 863,536,998 | 666,948,071 | |||||||||||
Service | — | 4,243,582 | — | |||||||||||
Class IR | 685,066 | 427,974 | 18,341,600 | |||||||||||
Class R | 25,691 | (c) | 139,982 | — | ||||||||||
Total Net Assets | $ | 648,998,077 | $ | 961,395,202 | $ | 841,300,328 | ||||||||
Shares outstanding $0.001 par value (unlimited shares authorized): | ||||||||||||||
Class A | 3,591,708 | 7,865,728 | 13,387,475 | |||||||||||
Class B | — | 145,943 | — | |||||||||||
Class C | 104,228 | 300,309 | 1,163,146 | |||||||||||
Institutional | 72,601,416 | 75,263,223 | 62,119,332 | |||||||||||
Service | — | 376,369 | — | |||||||||||
Class IR | 80,719 | 38,822 | 1,713,408 | |||||||||||
Class R | 3,027 | (c) | 12,689 | — | ||||||||||
Net asset value, offering and redemption price per share:(d) | ||||||||||||||
Class A | $8.52 | $11.20 | $10.74 | |||||||||||
Class B | — | 11.12 | — | |||||||||||
Class C | 8.45 | 11.05 | 10.49 | |||||||||||
Institutional | 8.50 | 11.47 | 10.74 | |||||||||||
Service | — | 11.28 | — | |||||||||||
Class IR | 8.49 | 11.02 | 10.70 | |||||||||||
Class R | 8.49 | (c) | 11.03 | — | ||||||||||
| (a) | Includes loaned securities having a market value of $15,033,669, $59,745,568, and $60,823,201 for the International Equity Insights, Emerging Markets Equity Insights and International Small Cap Insights Funds, respectively. |
| (b) | Segregated for initial margin on futures transactions for the International Small Cap Insights Fund. |
| (c) | Commenced operations on February 28, 2014. |
| (d) | Maximum public offering price per share for Class A shares of the Emerging Markets Equity Insights, International Equity Insights and International Small Cap Insights Fund is $9.02, $11.85 and $11.37, respectively. At redemption, Class B and Class C Shares may be subject to a contingent deferred sales charge assessed on the amount equal to the lesser of the current NAV or the original purchase price of the shares. |
| 42 | The accompanying notes are an integral part of these financial statements. |
GOLDMAN SACHS INTERNATIONAL EQUITY INSIGHTS FUNDS
Statements of Operations
For the Six Months Ended April 30, 2014 (Unaudited)
| Emerging Markets Equity Insights Fund | International Equity Insights Fund | International Small Cap Insights Fund | ||||||||||||
| Investment income: | ||||||||||||||
Dividends (net of foreign taxes withheld of $653,240, $1,037,433 and $631,539) | $ | 5,959,187 | $ | 25,971,944 | $ | 7,452,432 | ||||||||
Securities lending income — affiliated issuer | 70,862 | 367,657 | 411,876 | |||||||||||
| Total investment income | 6,030,049 | 26,339,601 | 7,864,308 | |||||||||||
| Expenses: | ||||||||||||||
Management fees | 2,939,426 | 4,150,529 | 2,675,224 | |||||||||||
Custody, accounting and administrative services | 332,475 | 146,346 | 127,184 | |||||||||||
Transfer Agent fees(a) | 138,844 | 266,799 | 207,609 | |||||||||||
Professional fees | 97,273 | 59,100 | 66,445 | |||||||||||
Distribution and Service fees(a) | 37,099 | 136,864 | 152,610 | |||||||||||
Printing and mailing costs | 14,985 | 30,662 | 26,753 | |||||||||||
Registration fees | 13,403 | 10,542 | 21,049 | |||||||||||
Trustee fees | 12,614 | 16,166 | 12,557 | |||||||||||
Service share fees — Service Plan | — | 6,703 | — | |||||||||||
Service share fees — Shareholder Administration Plan | — | 6,703 | — | |||||||||||
Other | 28,661 | 27,304 | 18,626 | |||||||||||
| Total expenses | 3,614,780 | 4,857,718 | 3,308,057 | |||||||||||
Less — expense reductions | (70,818 | ) | (263,346 | ) | (221,328 | ) | ||||||||
| Net expenses | 3,543,962 | 4,594,372 | 3,086,729 | |||||||||||
| NET INVESTMENT INCOME | 2,486,087 | 21,745,229 | 4,777,579 | |||||||||||
| Realized and unrealized gain (loss): | ||||||||||||||
Net realized gain (loss) from: | ||||||||||||||
Investments | (2,846,909 | ) | 67,727,196 | 22,707,883 | ||||||||||
Futures contracts | — | 3,541,083 | 282,654 | |||||||||||
Foreign currency transactions | (555,928 | ) | (964,741 | ) | 185,564 | |||||||||
Net change in unrealized gain (loss) on: | ||||||||||||||
Investments (including the effects of the net change in the foreign capital gains tax liability of $278,202, $0 and $0) | (21,516,097 | ) | (46,239,280 | ) | 3,464,040 | |||||||||
Futures contracts | — | (811,519 | ) | (246,918 | ) | |||||||||
Foreign currency translation | 358,095 | 260,221 | 215,493 | |||||||||||
| Net realized and unrealized gain (loss) | (24,560,839 | ) | 23,512,960 | 26,608,716 | ||||||||||
| NET INCREASE (DECREASE) IN NET ASSETS RESULTING FROM OPERATIONS | $ | (22,074,752 | ) | $ | 45,258,189 | $ | 31,386,295 | |||||||
| (a) | Class specific Distribution and Service, and Transfer Agent fees were as follows: |
| Distribution and Service Fees | Transfer Agent Fees | |||||||||||||||||||||||||||||||||||||||||||
Fund | Class A | Class B | Class C | Class R | Class A | Class B | Class C | Institutional | Service | Class IR | Class R | |||||||||||||||||||||||||||||||||
Emerging Markets Equity Insights | $ | 32,473 | N/A | $ | 4,606 | $ | 20 | $ | 24,680 | N/A | $ | 875 | $ | 111,906 | N/A | $ | 1,375 | $ | 8(b) | |||||||||||||||||||||||||
International Equity Insights | 111,800 | $ | 8,746 | 15,974 | 344 | 84,969 | $ | 1,662 | 3,035 | 175,525 | $ | 1,073 | 405 | 130 | ||||||||||||||||||||||||||||||
International Small Cap Insights | 115,905 | N/A | 36,705 | N/A | 88,088 | N/A | 6,974 | 104,103 | N/A | 8,444 | N/A | |||||||||||||||||||||||||||||||||
| (b) | Commenced operations on February 28, 2014. |
| The accompanying notes are an integral part of these financial statements. | 43 |
GOLDMAN SACHS INTERNATIONAL EQUITY INSIGHTS FUNDS
Statements of Changes in Net Assets
| Emerging Markets Equity Insights Fund | ||||||||||
| For the Six Months Ended April 30, 2014 (Unaudited) | For the Fiscal Year Ended October 31, 2013 | |||||||||
| From operations: | ||||||||||
Net investment income | $ | 2,486,087 | $ | 10,674,666 | ||||||
Net realized gain (loss) | (3,402,837 | ) | 7,093,221 | |||||||
Net change in unrealized gain (loss) | (21,158,002 | ) | 18,827,037 | |||||||
| Net increase (decrease) in net assets resulting from operations | (22,074,752 | ) | 36,594,924 | |||||||
| Distributions to shareholders: | ||||||||||
From net investment income | ||||||||||
Class A Shares | (223,899 | ) | (646,730 | ) | ||||||
Class B Shares | — | — | ||||||||
Class C Shares | (9,186 | ) | (1,269 | ) | ||||||
Institutional Shares | (7,745,349 | ) | (7,459,492 | ) | ||||||
Service Shares | — | — | ||||||||
Class IR Shares | (21,586 | ) | (1,842 | ) | ||||||
Class R Shares | — | (a) | — | |||||||
From net realized gains | ||||||||||
Class A Shares | — | — | ||||||||
Class B Shares | — | — | ||||||||
Class C Shares | — | — | ||||||||
Institutional Shares | — | — | ||||||||
Service Shares | — | — | ||||||||
Class IR Shares | — | — | ||||||||
Class R Shares | — | (a) | — | |||||||
| Total distributions to shareholders | (8,000,020 | ) | (8,109,333 | ) | ||||||
| From share transactions: | ||||||||||
Proceeds from sales of shares | 170,664,443 | 368,051,067 | ||||||||
Reinvestment of distributions | 7,753,915 | 8,086,923 | ||||||||
Cost of shares redeemed | (83,176,043 | ) | (336,079,347 | ) | ||||||
| Net increase (decrease) in net assets resulting from share transactions | 95,242,315 | 40,058,643 | ||||||||
| TOTAL INCREASE (DECREASE) | 65,167,543 | 68,544,234 | ||||||||
| Net assets: | ||||||||||
Beginning of period | 583,830,534 | 515,286,300 | ||||||||
End of period | $ | 648,998,077 | $ | 583,830,534 | ||||||
| Undistributed (distributions in excess of) net investment income | $ | (125,119 | ) | $ | 5,388,814 | |||||
| (a) | Commenced operations on February 28, 2014. |
| 44 | The accompanying notes are an integral part of these financial statements. |
GOLDMAN SACHS INTERNATIONAL EQUITY INSIGHTS FUNDS
| International Equity Insights Fund | International Small Cap Insights Fund | |||||||||||||||||||||
| For the Six Months Ended April 30, 2014 (Unaudited) | For the Fiscal Year Ended October 31, 2013 | For the Six Months Ended April 30, 2014 (Unaudited) | For the Fiscal Year Ended October 31, 2013 | |||||||||||||||||||
| $ | 21,745,229 | $ | 27,398,632 | $ | 4,777,579 | $ | 9,321,525 | |||||||||||||||
| 70,303,538 | 127,734,924 | 23,176,101 | 40,015,452 | |||||||||||||||||||
| (46,790,578 | ) | 70,192,523 | 3,432,615 | 55,173,555 | ||||||||||||||||||
| 45,258,189 | 225,326,079 | 31,386,295 | 104,510,532 | |||||||||||||||||||
| (2,365,617 | ) | (6,802,694 | ) | (1,904,636 | ) | (812,215 | ) | |||||||||||||||
| (33,551 | ) | (64,323 | ) | — | — | |||||||||||||||||
| (69,048 | ) | (73,960 | ) | (136,885 | ) | (34,519 | ) | |||||||||||||||
| (28,809,684 | ) | (21,631,288 | ) | (14,879,493 | ) | (10,634,235 | ) | |||||||||||||||
| (158,000 | ) | (268,276 | ) | — | — | |||||||||||||||||
| (12,760 | ) | (4,577 | ) | (148,164 | ) | (17,900 | ) | |||||||||||||||
| (3,366 | ) | (2,185 | ) | — | — | |||||||||||||||||
| — | — | (413,382 | ) | — | ||||||||||||||||||
| — | — | — | — | |||||||||||||||||||
| — | — | (32,138 | ) | — | ||||||||||||||||||
| — | — | (3,027,072 | ) | — | ||||||||||||||||||
| — | — | — | — | |||||||||||||||||||
| — | — | (30,480 | ) | — | ||||||||||||||||||
| — | — | — | — | |||||||||||||||||||
| (31,452,026 | ) | (28,847,303 | ) | (20,572,250 | ) | (11,498,869 | ) | |||||||||||||||
| 91,997,798 | 379,701,366 | 383,837,959 | 247,421,409 | |||||||||||||||||||
| 31,175,399 | 28,534,242 | 18,076,085 | 10,415,151 | |||||||||||||||||||
| (225,964,689 | ) | (375,686,850 | ) | (74,075,326 | ) | (112,490,991 | ) | |||||||||||||||
| (102,791,492 | ) | 32,548,758 | 327,838,718 | 145,345,569 | ||||||||||||||||||
| (88,985,329 | ) | 229,027,534 | 338,652,763 | 238,357,232 | ||||||||||||||||||
| 1,050,380,531 | 821,352,997 | 502,647,565 | 264,290,333 | |||||||||||||||||||
| $ | 961,395,202 | $ | 1,050,380,531 | $ | 841,300,328 | $ | 502,647,565 | |||||||||||||||
| $ | 12,276,549 | $ | 21,983,346 | $ | (1,884,187 | ) | $ | 10,407,412 | ||||||||||||||
| The accompanying notes are an integral part of these financial statements. | 45 |
GOLDMAN SACHS EMERGING MARKETS EQUITY INSIGHTS FUND
Financial Highlights
Selected Data for a Share Outstanding Throughout Each Period
| Income (loss) from investment operations | ||||||||||||||||||||||
| Year - Share Class | Net asset value, beginning of period | Net investment income(a) | Net realized and unrealized gain (loss) | Total from investment operations | Distributions to shareholders from net investment income | |||||||||||||||||
| FOR THE SIX MONTHS ENDED APRIL 30, (UNAUDITED) | ||||||||||||||||||||||
2014 - A | $ | 8.95 | $ | 0.02 | $ | (0.37 | ) | $ | (0.35 | ) | $ | (0.08 | ) | |||||||||
2014 - C | 8.90 | (0.01 | ) | (0.36 | ) | (0.37 | ) | (0.08 | ) | |||||||||||||
2014 - Institutional | 8.95 | 0.04 | (0.37 | ) | (0.33 | ) | (0.12 | ) | ||||||||||||||
2014 - IR | 8.94 | 0.03 | (0.36 | ) | (0.33 | ) | (0.12 | ) | ||||||||||||||
2014 - R (Commenced February 28, 2014) | 8.26 | 0.01 | 0.22 | 0.23 | — | |||||||||||||||||
| FOR THE FISCAL YEARS ENDED OCTOBER 31, | ||||||||||||||||||||||
2013 - A | 8.40 | 0.07 | 0.60 | 0.67 | (0.12 | ) | ||||||||||||||||
2013 - C | 8.36 | 0.04 | 0.55 | 0.59 | (0.05 | ) | ||||||||||||||||
2013 - Institutional | 8.40 | 0.16 | 0.53 | 0.69 | (0.14 | ) | ||||||||||||||||
2013 - IR | 8.39 | 0.14 | 0.54 | 0.68 | (0.13 | ) | ||||||||||||||||
2012 - A | 8.08 | 0.13 | 0.28 | 0.41 | (0.09 | ) | ||||||||||||||||
2012 - C | 8.00 | 0.08 | 0.28 | 0.36 | — | |||||||||||||||||
2012 - Institutional | 8.12 | 0.16 | 0.28 | 0.44 | (0.16 | ) | ||||||||||||||||
2012 - IR | 8.11 | 0.25 | 0.18 | 0.43 | (0.15 | ) | ||||||||||||||||
2011 - A | 8.91 | 0.11 | (0.87 | ) | (0.76 | ) | (0.07 | ) | ||||||||||||||
2011 - C | 8.82 | — | (e) | (0.81 | ) | (0.81 | ) | (0.01 | ) | |||||||||||||
2011 - Institutional | 8.96 | 0.16 | (0.88 | ) | (0.72 | ) | (0.12 | ) | ||||||||||||||
2011 - IR | 8.98 | 0.15 | (0.90 | ) | (0.75 | ) | (0.12 | ) | ||||||||||||||
2010 - A | 7.14 | 0.08 | 1.76 | 1.84 | (0.07 | ) | ||||||||||||||||
2010 - C | 7.11 | — | (e) | 1.77 | 1.77 | (0.06 | ) | |||||||||||||||
2010 - Institutional | 7.17 | 0.10 | 1.79 | 1.89 | (0.10 | ) | ||||||||||||||||
2010 - IR (Commenced August 31, 2010) | 7.67 | 0.01 | 1.30 | 1.31 | — | |||||||||||||||||
2009 - A | 4.45 | 0.12 | (f) | 2.61 | 2.73 | (0.04 | ) | |||||||||||||||
2009 - C | 4.41 | 0.07 | (f) | 2.64 | 2.71 | (0.01 | ) | |||||||||||||||
2009 - Institutional | 4.47 | 0.13 | (f) | 2.62 | 2.75 | (0.05 | ) | |||||||||||||||
| (a) | Calculated based on the average shares outstanding methodology. |
| (b) | Assumes investment at the net asset value at the beginning of the period, reinvestment of all distributions, a complete redemption of the investment at the net asset value at the end of the period and no sales or redemption charges. Total returns would be reduced if a sales or redemption charge was taken into account. Returns do not reflect the deduction of taxes that a shareholder would pay on Fund distributions or the redemption of Fund shares. Total returns for periods less than one full year are not annualized. |
| (c) | The Fund’s portfolio turnover rate is calculated in accordance with regulatory requirements, without regard to transactions involving short term investments and certain derivatives. If such transactions were included, the Fund’s portfolio turnover rate may be higher. |
| (d) | Annualized. |
| (e) | Amount is less than $0.005 per share. |
| (f) | Reflects income recognized from special dividends which amounted to $0.02 per share and 0.34% of average net assets. |
| 46 | The accompanying notes are an integral part of these financial statements. |
GOLDMAN SACHS EMERGING MARKETS EQUITY INSIGHTS FUND
Net asset value, end of period | Total return(b) | Net assets, period (in 000s) | Ratio of net expenses to average net assets | Ratio of total expenses to average net assets | Ratio of net investment income (loss) to average net assets | Portfolio turnover rate(c) | ||||||||||||||||||||||||||||||||||
| $ | 8.52 | (3.92 | )% | $ | 30,594 | 1.59 | %(d) | 1.61 | %(d) | 0.45 | %(d) | 86 | % | |||||||||||||||||||||||||||
| 8.45 | (4.21 | ) | 880 | 2.34 | (d) | 2.36 | (d) | (0.22 | )(d) | 86 | ||||||||||||||||||||||||||||||
| 8.50 | (3.79 | ) | 616,813 | 1.19 | (d) | 1.21 | (d) | 0.87 | (d) | 86 | ||||||||||||||||||||||||||||||
| 8.49 | (3.74 | ) | 685 | 1.34 | (d) | 1.36 | (d) | 0.70 | (d) | 86 | ||||||||||||||||||||||||||||||
| 8.49 | 2.78 | 26 | 1.83 | (d) | 1.87 | (d) | 0.54 | (d) | 86 | |||||||||||||||||||||||||||||||
| 8.95 | 8.00 | 24,758 | 1.52 | 1.65 | 0.82 | 249 | ||||||||||||||||||||||||||||||||||
| 8.90 | 7.02 | 989 | 2.31 | 2.48 | 0.51 | 249 | ||||||||||||||||||||||||||||||||||
| 8.95 | 8.41 | 556,434 | 1.14 | 1.27 | 1.87 | 249 | ||||||||||||||||||||||||||||||||||
| 8.94 | 8.16 | 1,649 | 1.32 | 1.50 | 1.59 | 249 | ||||||||||||||||||||||||||||||||||
| 8.40 | 5.26 | 50,760 | 1.45 | 1.69 | 1.58 | 180 | ||||||||||||||||||||||||||||||||||
| 8.36 | 4.49 | 228 | 2.20 | 2.46 | 0.97 | 180 | ||||||||||||||||||||||||||||||||||
| 8.40 | 5.68 | 464,180 | 1.05 | 1.30 | 1.98 | 180 | ||||||||||||||||||||||||||||||||||
| 8.39 | 5.48 | 118 | 1.20 | 1.41 | 3.06 | 180 | ||||||||||||||||||||||||||||||||||
| 8.08 | (8.58 | ) | 17,089 | 1.45 | 1.71 | 1.17 | 200 | |||||||||||||||||||||||||||||||||
| 8.00 | (9.23 | ) | 207 | 2.20 | 2.46 | 0.01 | 200 | |||||||||||||||||||||||||||||||||
| 8.12 | (8.19 | ) | 273,027 | 1.05 | 1.31 | 1.75 | 200 | |||||||||||||||||||||||||||||||||
| 8.11 | (8.54 | ) | 1 | 1.20 | 1.46 | 1.67 | 200 | |||||||||||||||||||||||||||||||||
| 8.91 | 25.91 | 52,030 | 1.45 | 1.70 | 0.99 | 214 | ||||||||||||||||||||||||||||||||||
| 8.82 | 25.07 | 1,282 | 2.20 | 2.45 | 0.04 | 214 | ||||||||||||||||||||||||||||||||||
| 8.96 | 26.56 | 364,053 | 1.05 | 1.30 | 1.25 | 214 | ||||||||||||||||||||||||||||||||||
| 8.98 | 17.08 | 1 | 1.20 | (d) | 1.45 | (d) | 0.51 | (d) | 214 | |||||||||||||||||||||||||||||||
| 7.14 | 61.83 | 2,694 | 1.45 | 1.76 | 2.04 | (f) | 182 | |||||||||||||||||||||||||||||||||
| 7.11 | 61.28 | 1,426 | 2.20 | 2.51 | 1.13 | (f) | 182 | |||||||||||||||||||||||||||||||||
| 7.17 | 62.25 | 311,960 | 1.05 | 1.36 | 2.38 | (f) | 182 | |||||||||||||||||||||||||||||||||
| The accompanying notes are an integral part of these financial statements. | 47 |
GOLDMAN SACHS INTERNATIONAL EQUITY INSIGHTS FUND
Financial Highlights
Selected Data for a Share Outstanding Throughout Each Period
| Income (loss) from investment operations | ||||||||||||||||||||||
| Year - Share Class | Net asset value, beginning of period | Net investment income(a) | Net realized and unrealized gain (loss) | Total from investment operations | Distributions to shareholders from net investment income | |||||||||||||||||
| FOR THE SIX MONTHS ENDED APRIL 30, (UNAUDITED) | ||||||||||||||||||||||
2014 - A | $ | 10.99 | $ | 0.22 | (d) | $ | 0.27 | $ | 0.49 | $ | (0.28 | ) | ||||||||||
2014 - B | 10.86 | 0.17 | (d) | 0.29 | 0.46 | (0.20 | ) | |||||||||||||||
2014 - C | 10.83 | 0.19 | (d) | 0.26 | 0.45 | (0.23 | ) | |||||||||||||||
2014 - Institutional | 11.29 | 0.25 | (d) | 0.27 | 0.52 | (0.34 | ) | |||||||||||||||
2014 - Service | 11.06 | 0.19 | (d) | 0.31 | 0.50 | (0.28 | ) | |||||||||||||||
2014 - IR | 10.86 | 0.24 | (d) | 0.25 | 0.49 | (0.33 | ) | |||||||||||||||
2014 - R | 10.85 | 0.22 | (d) | 0.25 | 0.47 | (0.29 | ) | |||||||||||||||
| FOR THE FISCAL YEARS ENDED OCTOBER 31, | ||||||||||||||||||||||
2013 - A | 9.00 | 0.19 | 2.11 | 2.30 | (0.31 | ) | ||||||||||||||||
2013 - B | 8.89 | 0.16 | 2.04 | 2.20 | (0.23 | ) | ||||||||||||||||
2013 - C | 8.87 | 0.16 | 2.04 | 2.20 | (0.24 | ) | ||||||||||||||||
2013 - Institutional | 9.25 | 0.30 | 2.09 | 2.39 | (0.35 | ) | ||||||||||||||||
2013 - Service | 9.06 | 0.22 | 2.08 | 2.30 | (0.30 | ) | ||||||||||||||||
2013 - IR | 8.91 | 0.22 | 2.08 | 2.30 | (0.35 | ) | ||||||||||||||||
2013 - R | 8.88 | 0.21 | 2.04 | 2.25 | (0.28 | ) | ||||||||||||||||
2012 - A | 9.02 | 0.19 | 0.21 | 0.40 | (0.42 | ) | ||||||||||||||||
2012 - B | 8.89 | 0.13 | 0.20 | 0.33 | (0.33 | ) | ||||||||||||||||
2012 - C | 8.89 | 0.13 | 0.20 | 0.33 | (0.35 | ) | ||||||||||||||||
2012 - Institutional | 9.27 | 0.24 | 0.21 | 0.45 | (0.47 | ) | ||||||||||||||||
2012 - Service | 9.08 | 0.18 | 0.21 | 0.39 | (0.41 | ) | ||||||||||||||||
2012 - IR | 8.97 | 0.20 | 0.21 | 0.41 | (0.47 | ) | ||||||||||||||||
2012 - R | 8.93 | 0.17 | 0.20 | 0.37 | (0.42 | ) | ||||||||||||||||
2011 - A | 10.21 | 0.28 | (1.26 | ) | (0.98 | ) | (0.21 | ) | ||||||||||||||
2011 - B | 10.06 | 0.19 | (1.23 | ) | (1.04 | ) | (0.13 | ) | ||||||||||||||
2011 - C | 10.06 | 0.19 | (1.23 | ) | (1.04 | ) | (0.13 | ) | ||||||||||||||
2011 - Institutional | 10.49 | 0.33 | (1.30 | ) | (0.97 | ) | (0.25 | ) | ||||||||||||||
2011 - Service | 10.27 | 0.27 | (1.27 | ) | (1.00 | ) | (0.19 | ) | ||||||||||||||
2011 - IR | 10.15 | 0.23 | (1.18 | ) | (0.95 | ) | (0.23 | ) | ||||||||||||||
2011 - R | 10.12 | 0.19 | (1.18 | ) | (0.99 | ) | (0.20 | ) | ||||||||||||||
2010 - A | 9.61 | 0.18 | 0.63 | 0.81 | (0.21 | ) | ||||||||||||||||
2010 - B | 9.47 | 0.11 | 0.62 | 0.73 | (0.14 | ) | ||||||||||||||||
2010 - C | 9.47 | 0.10 | 0.63 | 0.73 | (0.14 | ) | ||||||||||||||||
2010 - Institutional | 9.86 | 0.22 | 0.66 | 0.88 | (0.25 | ) | ||||||||||||||||
2010 - Service | 9.67 | 0.16 | 0.65 | 0.81 | (0.21 | ) | ||||||||||||||||
2010 - IR | 9.56 | 0.20 | 0.63 | 0.83 | (0.24 | ) | ||||||||||||||||
2010 - R | 9.55 | 0.15 | 0.63 | 0.78 | (0.21 | ) | ||||||||||||||||
2009 - A | 8.06 | 0.17 | 1.77 | 1.94 | (0.39 | ) | ||||||||||||||||
2009 - B | 7.91 | 0.12 | 1.73 | 1.85 | (0.29 | ) | ||||||||||||||||
2009 - C | 7.90 | 0.12 | 1.74 | 1.86 | (0.29 | ) | ||||||||||||||||
2009 - Institutional | 8.29 | 0.21 | 1.81 | 2.02 | (0.45 | ) | ||||||||||||||||
2009 - Service | 8.08 | 0.16 | 1.79 | 1.95 | (0.36 | ) | ||||||||||||||||
2009 - IR | 8.04 | 0.20 | 1.75 | 1.95 | (0.43 | ) | ||||||||||||||||
2009 - R | 8.01 | 0.08 | 1.84 | 1.92 | (0.38 | ) | ||||||||||||||||
| (a) | Calculated based on the average shares outstanding methodology. |
| (b) | Assumes investment at the net asset value at the beginning of the period, reinvestment of all distributions, a complete redemption of the investment at the net asset value at the end of the period and no sales or redemption charges. Total returns would be reduced if a sales or redemption charge was taken into account. Returns do not reflect the deduction of taxes that a shareholder would pay on Fund distributions or the redemption of Fund shares. Total returns for periods less than one full year are not annualized. |
| (c) | The Fund’s portfolio turnover rate is calculated in accordance with regulatory requirements, without regard to transactions involving short term investments and certain derivatives. If such transactions were included, the Fund’s portfolio turnover rate may be higher. |
| (d) | Reflects income recognized from several corporate actions which amounted to $0.14 per share and 2.55% of average net assets. |
| (e) | Annualized. |
| 48 | The accompanying notes are an integral part of these financial statements. |
GOLDMAN SACHS INTERNATIONAL EQUITY INSIGHTS FUND
| Net asset value, end of period | Total return(b) | Net assets, end of period (in 000s) | Ratio of net expenses to average net assets | Ratio of total expenses to average net assets | Ratio of net investment income to average net assets | Portfolio turnover rate(c) | ||||||||||||||||||||||||||||||||||
| $ | 11.20 | 4.63 | % | $ | 88,105 | 1.29 | %(e) | 1.35 | %(e) | 4.07 | %(d)(e) | 65 | % | |||||||||||||||||||||||||||
| 11.12 | 4.28 | 1,623 | 2.04 | (e) | 2.10 | (e) | 3.16 | (d)(e) | 65 | |||||||||||||||||||||||||||||||
| 11.05 | 4.24 | 3,319 | 2.04 | (e) | 2.10 | (e) | 3.48 | (d)(e) | 65 | |||||||||||||||||||||||||||||||
| 11.47 | 4.79 | 863,537 | 0.89 | (e) | 0.95 | (e) | 4.50 | (d)(e) | 65 | |||||||||||||||||||||||||||||||
| 11.28 | 4.66 | 4,244 | 1.39 | (e) | 1.45 | (e) | 3.47 | (d)(e) | 65 | |||||||||||||||||||||||||||||||
| 11.02 | 4.78 | 428 | 1.04 | (e) | 1.10 | (e) | 4.39 | (d)(e) | 65 | |||||||||||||||||||||||||||||||
| 11.03 | 4.50 | 140 | 1.54 | (e) | 1.60 | (e) | 4.10 | (d)(e) | 65 | |||||||||||||||||||||||||||||||
| 10.99 | 26.31 | 92,919 | 1.29 | 1.37 | 1.98 | 189 | ||||||||||||||||||||||||||||||||||
| 10.86 | 25.31 | 1,950 | 2.04 | 2.11 | 1.67 | 189 | ||||||||||||||||||||||||||||||||||
| 10.83 | 25.33 | 3,166 | 2.04 | 2.11 | 1.61 | 189 | ||||||||||||||||||||||||||||||||||
| 11.29 | 26.71 | 945,546 | 0.89 | 0.96 | 2.99 | 189 | ||||||||||||||||||||||||||||||||||
| 11.06 | 26.13 | 6,237 | 1.39 | 1.46 | 2.25 | 189 | ||||||||||||||||||||||||||||||||||
| 10.86 | 26.55 | 468 | 1.04 | 1.11 | 2.22 | 189 | ||||||||||||||||||||||||||||||||||
| 10.85 | 25.99 | 95 | 1.54 | 1.61 | 2.14 | 189 | ||||||||||||||||||||||||||||||||||
| 9.00 | 4.94 | 210,612 | 1.28 | 1.37 | 2.21 | 203 | ||||||||||||||||||||||||||||||||||
| 8.89 | 4.13 | 2,587 | 2.04 | 2.12 | 1.47 | 203 | ||||||||||||||||||||||||||||||||||
| 8.87 | 4.10 | 3,087 | 2.04 | 2.12 | 1.48 | 203 | ||||||||||||||||||||||||||||||||||
| 9.25 | 5.47 | 596,986 | 0.88 | 0.97 | 2.69 | 203 | ||||||||||||||||||||||||||||||||||
| 9.06 | 4.77 | 7,945 | 1.38 | 1.47 | 2.09 | 203 | ||||||||||||||||||||||||||||||||||
| 8.91 | 5.16 | 65 | 1.04 | 1.11 | 2.33 | 203 | ||||||||||||||||||||||||||||||||||
| 8.88 | 4.69 | 71 | 1.53 | 1.62 | 1.98 | 203 | ||||||||||||||||||||||||||||||||||
| 9.02 | (9.87 | ) | 314,225 | 1.25 | 1.31 | 2.74 | 101 | |||||||||||||||||||||||||||||||||
| 8.89 | (10.52 | ) | 3,916 | 2.00 | 2.06 | 1.93 | 101 | |||||||||||||||||||||||||||||||||
| 8.89 | (10.50 | ) | 3,660 | 2.00 | 2.06 | 1.94 | 101 | |||||||||||||||||||||||||||||||||
| 9.27 | (9.52 | ) | 1,013,458 | 0.85 | 0.91 | 3.18 | 101 | |||||||||||||||||||||||||||||||||
| 9.08 | (9.91 | ) | 12,982 | 1.35 | 1.41 | 2.60 | 101 | |||||||||||||||||||||||||||||||||
| 8.97 | (9.58 | ) | 45 | 1.00 | 1.06 | 2.53 | 101 | |||||||||||||||||||||||||||||||||
| 8.93 | (9.99 | ) | 116 | 1.50 | 1.56 | 1.87 | 101 | |||||||||||||||||||||||||||||||||
| 10.21 | 8.59 | 530,086 | 1.25 | 1.29 | 1.89 | 111 | ||||||||||||||||||||||||||||||||||
| 10.06 | 7.83 | 6,563 | 2.00 | 2.04 | 1.13 | 111 | ||||||||||||||||||||||||||||||||||
| 10.06 | 7.78 | 5,023 | 2.00 | 2.04 | 1.12 | 111 | ||||||||||||||||||||||||||||||||||
| 10.49 | 9.05 | 1,819,375 | 0.85 | 0.89 | 2.24 | 111 | ||||||||||||||||||||||||||||||||||
| 10.27 | 8.49 | 23,267 | 1.35 | 1.39 | 1.68 | 111 | ||||||||||||||||||||||||||||||||||
| 10.15 | 8.77 | 8 | 1.00 | 1.04 | 2.13 | 111 | ||||||||||||||||||||||||||||||||||
| 10.12 | 8.30 | 192 | 1.50 | 1.54 | 1.59 | 111 | ||||||||||||||||||||||||||||||||||
| 9.61 | 25.56 | 656,289 | 1.25 | 1.32 | 2.17 | 167 | ||||||||||||||||||||||||||||||||||
| 9.47 | 24.49 | 7,620 | 2.00 | 2.07 | 1.50 | 167 | ||||||||||||||||||||||||||||||||||
| 9.47 | 24.68 | 5,622 | 2.00 | 2.07 | 1.52 | 167 | ||||||||||||||||||||||||||||||||||
| 9.86 | 26.03 | 1,770,267 | 0.85 | 0.92 | 2.55 | 167 | ||||||||||||||||||||||||||||||||||
| 9.67 | 25.46 | 29,882 | 1.35 | 1.42 | 1.96 | 167 | ||||||||||||||||||||||||||||||||||
| 9.56 | 25.94 | 7 | 1.00 | 1.07 | 2.51 | 167 | ||||||||||||||||||||||||||||||||||
| 9.55 | 25.32 | 155 | 1.50 | 1.57 | 0.95 | 167 | ||||||||||||||||||||||||||||||||||
| The accompanying notes are an integral part of these financial statements. | 49 |
GOLDMAN SACHS INTERNATIONAL SMALL CAP INSIGHTS FUND
Financial Highlights
Selected Data for a Share Outstanding Throughout Each Period
| Income (loss) from investment operations | Distributions to shareholders | |||||||||||||||||||||||||||||
| Year - Share Class | Net asset | Net investment income(a) | Net realized and unrealized gain (loss) | Total from investment operations | From net investment income | From net realized gains | Total distributions | |||||||||||||||||||||||
| FOR THE SIX MONTHS ENDED APRIL 30, (UNAUDITED) | ||||||||||||||||||||||||||||||
2014 - A | $ | 10.62 | $ | 0.07 | $ | 0.44 | $ | 0.51 | $ | (0.32 | ) | $ | (0.07 | ) | $ | (0.39 | ) | |||||||||||||
2014 - C | 10.40 | 0.03 | 0.43 | 0.46 | (0.30 | ) | (0.07 | ) | (0.37 | ) | ||||||||||||||||||||
2014 - Institutional | 10.62 | 0.08 | 0.45 | 0.53 | (0.34 | ) | (0.07 | ) | (0.41 | ) | ||||||||||||||||||||
2014 - IR | 10.59 | 0.10 | 0.42 | 0.52 | (0.34 | ) | (0.07 | ) | (0.41 | ) | ||||||||||||||||||||
| FOR THE FISCAL YEARS ENDED OCTOBER 31, | ||||||||||||||||||||||||||||||
2013 - A | 8.29 | 0.23 | 2.49 | 2.72 | (0.39 | ) | — | (0.39 | ) | |||||||||||||||||||||
2013 - C | 8.13 | 0.14 | 2.47 | 2.61 | (0.34 | ) | — | (0.34 | ) | |||||||||||||||||||||
2013 - Institutional | 8.30 | 0.26 | 2.50 | 2.76 | (0.44 | ) | — | (0.44 | ) | |||||||||||||||||||||
2013 - IR | 8.28 | 0.22 | 2.52 | 2.74 | (0.43 | ) | — | (0.43 | ) | |||||||||||||||||||||
2012 - A | 7.92 | 0.17 | 0.38 | 0.55 | (0.18 | ) | — | (0.18 | ) | |||||||||||||||||||||
2012 - C | 7.79 | 0.11 | 0.38 | 0.49 | (0.15 | ) | — | (0.15 | ) | |||||||||||||||||||||
2012 - Institutional | 7.94 | 0.20 | 0.38 | 0.58 | (0.22 | ) | — | (0.22 | ) | |||||||||||||||||||||
2012 - IR | 7.93 | 0.16 | 0.40 | 0.56 | (0.21 | ) | — | (0.21 | ) | |||||||||||||||||||||
2011 - A | 8.20 | 0.17 | (0.21 | ) | (0.04 | ) | (0.24 | ) | — | (0.24 | ) | |||||||||||||||||||
2011 - C | 8.08 | 0.13 | (0.23 | ) | (0.10 | ) | (0.19 | ) | — | (0.19 | ) | |||||||||||||||||||
2011 - Institutional | 8.21 | 0.20 | (0.20 | ) | — | (0.27 | ) | — | (0.27 | ) | ||||||||||||||||||||
2011 - IR | 8.21 | 0.20 | (0.21 | ) | (0.01 | ) | (0.27 | ) | — | (0.27 | ) | |||||||||||||||||||
2010 - A | 7.03 | 0.12 | (e) | 1.21 | 1.33 | (0.16 | ) | — | (0.16 | ) | ||||||||||||||||||||
2010 - C | 6.95 | 0.09 | (e) | 1.17 | 1.26 | (0.13 | ) | — | (0.13 | ) | ||||||||||||||||||||
2010 - Institutional | 7.04 | 0.16 | (e) | 1.19 | 1.35 | (0.18 | ) | — | (0.18 | ) | ||||||||||||||||||||
2010 - IR (Commenced August 31, 2010) | 7.00 | 0.03 | (e) | 1.18 | 1.21 | — | — | — | ||||||||||||||||||||||
2009 - A | 4.94 | 0.09 | 2.19 | 2.28 | (0.19 | ) | — | (0.19 | ) | |||||||||||||||||||||
2009 - C | 4.91 | 0.06 | 2.17 | 2.23 | (0.19 | ) | — | (0.19 | ) | |||||||||||||||||||||
2009 - Institutional | 4.96 | 0.12 | 2.19 | 2.31 | (0.23 | ) | — | (0.23 | ) | |||||||||||||||||||||
| (a) | Calculated based on the average shares outstanding methodology. |
| (b) | Assumes investment at the net asset value at the beginning of the period, reinvestment of all distributions, a complete redemption of the investment at the net asset value at the end of the period and no sales or redemption charges. Total returns would be reduced if a sales or redemption charge was taken into account. Returns do not reflect the deduction of taxes that a shareholder would pay on Fund distributions or the redemption of Fund shares. Total returns for periods less than one full year are not annualized. |
| (c) | The Fund’s portfolio turnover rate is calculated in accordance with regulatory requirements, without regard to transactions involving short term investments and certain derivatives. If such transactions were included, the Fund’s portfolio turnover rate may be higher. |
| (d) | Annualized. |
| (e) | Reflects income recognized from special dividends which amounted to $0.01 per share and 0.19% of average net assets. |
| 50 | The accompanying notes are an integral part of these financial statements. |
GOLDMAN SACHS INTERNATIONAL SMALL CAP INSIGHTS FUND
| Net asset value, end of period | Total return(b) | Net assets, period (in 000s) | Ratio of net expenses to average net assets | Ratio of total expenses to average net assets | Ratio of to average net assets | Portfolio turnover rate(c) | ||||||||||||||||||||||||||||||||||
| $ | 10.74 | 5.00 | % | $ | 143,807 | 1.31 | %(d) | 1.38 | %(d) | 1.35 | %(d) | 62 | % | |||||||||||||||||||||||||||
| 10.49 | 4.56 | 12,204 | 2.06 | (d) | 2.13 | (d) | 0.65 | (d) | 62 | |||||||||||||||||||||||||||||||
| 10.74 | 5.22 | 666,948 | 0.91 | (d) | 0.98 | (d) | 1.55 | (d) | 62 | |||||||||||||||||||||||||||||||
| 10.70 | 5.20 | 18,342 | 1.06 | (d) | 1.13 | (d) | 1.99 | (d) | 62 | |||||||||||||||||||||||||||||||
| 10.62 | 34.41 | 53,564 | 1.30 | 1.48 | 2.52 | 166 | ||||||||||||||||||||||||||||||||||
| 10.40 | 33.40 | 3,514 | 2.05 | 2.24 | 1.53 | 166 | ||||||||||||||||||||||||||||||||||
| 10.62 | 34.96 | 441,964 | 0.90 | 1.07 | 2.85 | 166 | ||||||||||||||||||||||||||||||||||
| 10.59 | 34.77 | 3,605 | 1.05 | 1.26 | 2.28 | 166 | ||||||||||||||||||||||||||||||||||
| 8.29 | 7.32 | 18,914 | 1.30 | 1.51 | 2.13 | 150 | ||||||||||||||||||||||||||||||||||
| 8.13 | 6.56 | 896 | 2.05 | 2.26 | 1.44 | 150 | ||||||||||||||||||||||||||||||||||
| 8.30 | 7.80 | 244,135 | 0.90 | 1.11 | 2.59 | 150 | ||||||||||||||||||||||||||||||||||
| 8.28 | 7.54 | 345 | 1.05 | 1.26 | 2.06 | 150 | ||||||||||||||||||||||||||||||||||
| 7.92 | (0.68 | ) | 29,729 | 1.30 | 1.47 | 1.95 | 79 | |||||||||||||||||||||||||||||||||
| 7.79 | (1.39 | ) | 856 | 2.05 | 2.22 | 1.56 | 79 | |||||||||||||||||||||||||||||||||
| 7.94 | (0.16 | ) | 249,545 | 0.90 | 1.07 | 2.30 | 79 | |||||||||||||||||||||||||||||||||
| 7.93 | (0.33 | ) | 1,368 | 1.05 | 1.22 | 2.39 | 79 | |||||||||||||||||||||||||||||||||
| 8.20 | 19.36 | 34,154 | 1.30 | 1.50 | 1.71 | (e) | 113 | |||||||||||||||||||||||||||||||||
| 8.08 | 18.50 | 213 | 2.05 | 2.25 | 1.24 | (e) | 113 | |||||||||||||||||||||||||||||||||
| 8.21 | 19.67 | 236,265 | 0.90 | 1.10 | 2.18 | (e) | 113 | |||||||||||||||||||||||||||||||||
| 8.21 | 17.29 | 1 | 1.05 | (d) | 1.25 | (d) | 2.49 | (d)(e) | 113 | |||||||||||||||||||||||||||||||
| 7.03 | 48.17 | 36,310 | 1.30 | 1.74 | 1.62 | 209 | ||||||||||||||||||||||||||||||||||
| 6.95 | 47.36 | 40 | 2.05 | 2.49 | 1.16 | 209 | ||||||||||||||||||||||||||||||||||
| 7.04 | 48.80 | 207,776 | 0.90 | 1.34 | 1.99 | 209 | ||||||||||||||||||||||||||||||||||
| The accompanying notes are an integral part of these financial statements. | 51 |
GOLDMAN SACHS INTERNATIONAL EQUITY INSIGHTS FUNDS
Notes to Financial Statements
April 30, 2014 (Unaudited)
| 1. ORGANIZATION |
Goldman Sachs Trust (the “Trust”) is a Delaware statutory trust registered under the Investment Company Act of 1940, as amended (the “Act”), as an open-end management investment company. The following table lists those series of the Trust that are included in this report (collectively, the “Funds” or individually a “Fund”), along with their corresponding share classes and respective diversification status under the Act:
| Fund | Share Classes Offered* | Diversified/ Non-diversified | ||
Emerging Markets Equity Insights | A, C, Institutional, IR and R | Diversified | ||
International Small Cap Insights | A, C, Institutional and IR | Diversified | ||
International Equity Insights | A, B, C, Institutional, Service, IR and R | Diversified |
| * | Class B Shares are generally no longer available for purchase by current or prospective investors. |
Class A Shares are sold with a front-end sales charge of up to 5.50%. Class B Shares were sold with a contingent deferred sales charge (“CDSC”) that declines from 5.00% to zero, depending upon the period of time the shares are held. Class C Shares are sold with a CDSC of 1.00%, which is imposed on redemptions made within 12 months of purchase. Institutional, Service, Class IR and Class R Shares are not subject to a sales charge.
Goldman Sachs Asset Management, L.P. (“GSAM”), an affiliate of Goldman, Sachs & Co. (“Goldman Sachs”), serves as investment adviser to the Funds pursuant to a management agreement (the “Agreement”) with the Trust.
| 2. SIGNIFICANT ACCOUNTING POLICIES |
The financial statements have been prepared in accordance with accounting principles generally accepted in the United States of America (“GAAP”) and require management to make estimates and assumptions that may affect the reported amounts and disclosures. Actual results may differ from those estimates and assumptions.
A. Investment Valuation — The Funds’ valuation policy is to value investments at fair value.
B. Investment Income and Investments — Investment income includes interest income and dividend income, net of any foreign withholding taxes, less any amounts reclaimable. Interest income is accrued daily and adjusted for amortization of premiums and accretion of discounts. Dividend income is recognized on ex-dividend date or, for certain foreign securities, as soon as such information is obtained subsequent to the ex-dividend date. Investment transactions are reflected on trade date. Realized gains and losses are calculated using identified cost. Investment transactions are recorded on the following business day for daily net asset value (“NAV”) calculations. Any foreign capital gains tax is accrued daily based upon net unrealized gains, and is payable upon sale of such investments. Distributions received from the Funds’ investments in U.S. real estate investment trusts (“REITs”) may be characterized as ordinary income, net capital gain or a return of capital. A return of capital is recorded by the Funds as a reduction to the cost basis of the REIT.
For derivative contracts, realized gains and losses are recorded upon settlement of the contract.
C. Class Allocations and Expenses — Investment income, realized and unrealized gain (loss), and non-class specific expenses of each Fund are allocated daily based upon the proportion of net assets of each class. Class specific expenses, where applicable, are borne by the respective share classes and include Distribution and Service, Transfer Agent and Service and Shareholder Administration fees. Non-class specific expenses directly incurred by a Fund are charged to that Fund, while such expenses incurred by the Trust are allocated across the respective Funds on a straight-line and/or pro-rata basis depending upon the nature of the expenses.
D. Federal Taxes and Distributions to Shareholders — It is each Fund’s policy to comply with the requirements of the Internal Revenue Code of 1986, as amended (the “Code”), applicable to regulated investment companies (mutual funds) and to distribute each year substantially all of its investment company taxable income and capital gains to its shareholders. Accordingly,
52
GOLDMAN SACHS INTERNATIONAL EQUITY INSIGHTS FUNDS
| 2. SIGNIFICANT ACCOUNTING POLICIES (continued) |
the Funds are not required to make any provisions for the payment of federal income tax. Distributions to shareholders are recorded on the ex-dividend date. Income and capital gains distributions, if any, are declared and paid annually.
Net capital losses are carried forward to future fiscal years and may be used to the extent allowed by the Code to offset any future capital gains. Utilization of capital loss carryforwards will reduce the requirement of future capital gains distributions.
Under the Regulated Investment Company Modernization Act of 2010, the Funds are permitted to carry forward capital losses incurred in taxable years beginning after December 22, 2010 for an unlimited period. However, any losses incurred during those future taxable years will be required to be utilized prior to the losses incurred in pre-enactment taxable years. As a result of this ordering rule, pre-enactment capital loss carryforwards may be more likely to expire unused. Additionally, post-enactment capital losses that are carried forward will retain their character as either short-term or long term capital losses rather than being considered all short-term as under previous law.
The characterization of distributions to shareholders for financial reporting purposes is determined in accordance with federal income tax rules, which may differ from GAAP. The source of each Fund’s distributions may be shown in the accompanying financial statements as either from net investment income, net realized gain or capital. Certain components of the Funds’ net assets on the Statements of Assets and Liabilities reflect permanent GAAP/tax differences based on the appropriate tax character.
E. Foreign Currency Translation — The accounting records and reporting currency of the Funds are maintained in United States (“U.S.”) dollars. Assets and liabilities denominated in foreign currencies are translated into U.S. dollars using the current exchange rates at the close of each business day. The effect of changes in foreign currency exchange rates on investments is included within net realized and unrealized gain (loss) on investments. Changes in the value of other assets and liabilities as a result of fluctuations in foreign exchange rates are included in the Statements of Operations within net change in unrealized gain (loss) on foreign currency transactions. Transactions denominated in foreign currencies are translated into U.S. dollars on the date the transaction occurred, the effects of which are included within net realized gain (loss) on foreign currency transactions.
| 3. INVESTMENTS AND FAIR VALUE MEASUREMENTS |
The fair value of a financial instrument is the amount that would be received to sell an asset or paid to transfer a liability in an orderly transaction between market participants at the measurement date (i.e., the exit price). GAAP establishes a fair value hierarchy that prioritizes the inputs to valuation techniques used to measure fair value. The hierarchy gives the highest priority to unadjusted quoted prices in active markets for identical assets or liabilities (Level 1 measurements) and the lowest priority to unobservable inputs (Level 3 measurements). The levels used for classifying investments are not necessarily an indication of the risk associated with investing in these investments. The three levels of the fair value hierarchy are described below:
Level 1 — Unadjusted quoted prices in active markets that are accessible at the measurement date for identical, unrestricted assets or liabilities;
Level 2 — Quoted prices in markets that are not active or financial instruments for which significant inputs are observable (including, but not limited to, quoted prices for similar investments, interest rates, foreign exchange rates, volatility and credit spreads), either directly or indirectly;
Level 3 — Prices or valuations that require significant unobservable inputs (including GSAM’s assumptions in determining fair value measurement).
The Trustees have adopted Valuation Procedures that govern the valuation of the portfolio investments held by the Funds, including investments for which market quotations are not readily available. The Trustees have delegated to GSAM day-to-day responsibility for implementing and maintaining internal controls and procedures related to the valuation of the Funds’ portfolio investments. To assess the continuing appropriateness of pricing sources and methodologies, GSAM regularly performs price verification procedures and issues challenges as necessary to third party pricing vendors or brokers, and any differences are reviewed in accordance with the Valuation Procedures.
53
GOLDMAN SACHS INTERNATIONAL EQUITY INSIGHTS FUNDS
Notes to Financial Statements (continued)
April 30, 2014 (Unaudited)
| 3. INVESTMENTS AND FAIR VALUE MEASUREMENTS (continued) |
A. Level 1 and Level 2 Fair Value Investments — The valuation techniques and significant inputs used in determining the fair values for investments classified as Level 1 and Level 2 are as follows:
Equity Securities — Equity securities and investment companies traded on a U.S. securities exchange or the NASDAQ system, or those located on certain foreign exchanges, including but not limited to the Americas, are valued daily at their last sale price or official closing price on the principal exchange or system on which they are traded. If no sale occurs, equity securities and exchange traded investment companies are valued at the last bid price for long positions and at the last ask price for short positions. Investments in investment companies (other than those that are exchange traded) are valued at the NAV on the valuation date. To the extent these investments are actively traded, they are classified as Level 1 of the fair value hierarchy, otherwise they are generally classified as Level 2.
Unlisted equity securities for which market quotations are available are valued at the last sale price on the valuation date, or if no sale occurs, at the last bid price. Securities traded on certain foreign securities exchanges are valued daily at fair value determined by an independent fair value service (if available) under Valuation Procedures approved by the Trustees and consistent with applicable regulatory guidance. The independent fair value service takes into account multiple factors including, but not limited to, movements in the securities markets, certain depositary receipts, futures contracts and foreign currency exchange rates that have occurred subsequent to the close of the foreign securities exchange. These investments are generally classified as Level 2 of the fair value hierarchy.
Derivative Contracts — A derivative is an instrument whose value is derived from underlying assets, indices, reference rates or a combination of these factors.
Exchange-traded derivatives, including futures contracts, typically fall within Level 1 of the fair value hierarchy.
i. Futures Contracts — Futures contracts are contracts to buy or sell a standardized quantity of a specified commodity or security and are valued based on exchanged settlement prices or independent market quotes. Futures contracts are valued at the last settlement price, or in the absence of a sale, the last bid price for long positions and at the last ask price for short positions, at the end of each day on the board of trade or exchange upon which they are traded. Upon entering into a futures contract, a Fund deposits cash or securities in an account on behalf of the broker in an amount sufficient to meet the initial margin requirement. Subsequent payments are made or received by a Fund equal to the daily change in the contract value and are recorded as variation margin receivable or payable with a corresponding offset to unrealized gains or losses.
B. Level 3 Fair Value Investments — To the extent that the aforementioned significant inputs are unobservable, or if quotations are not readily available, or if GSAM believes that such quotations do not accurately reflect fair value, the fair value of the Funds’ investments may be determined under Valuation Procedures approved by the Trustees. GSAM, consistent with its procedures and applicable regulatory guidance, may make an adjustment to the most recent valuation prices of either domestic or foreign securities in light of significant events to reflect what it believes to be the fair value of the securities at the time of determining a Fund’s NAV. Significant events which could affect a large number of securities in a particular market may include, but are not limited to: significant fluctuations in U.S. or foreign markets; market dislocations; market disruptions; or unscheduled market closings. Significant events which could also affect a single issuer may include, but are not limited to: corporate actions such as reorganizations, mergers and buy-outs; ratings downgrades; and bankruptcies.
54
GOLDMAN SACHS INTERNATIONAL EQUITY INSIGHTS FUNDS
| 3. INVESTMENTS AND FAIR VALUE MEASUREMENTS (continued) |
C. Fair Value Hierarchy — The following is a summary of the Funds’ investments and derivatives classified in the fair value hierarchy as of April 30, 2014:
| EMERGING MARKETS EQUITY INSIGHTS FUND | ||||||||||||
| Investment Type | Level 1 | Level 2 | Level 3 | |||||||||
| Assets | ||||||||||||
Common Stock and/or Other Equity Investments | ||||||||||||
North and South America | $ | 114,364,706 | (a) | $ | 12,736,709 | (b) | $ | — | ||||
Australia and Europe | 26,415,420 | 489,183,856 | (b) | — | ||||||||
Securities Lending Reinvestment Vehicle | 15,680,600 | — | — | |||||||||
| Total | $ | 156,460,726 | $ | 501,920,565 | $ | — | ||||||
| INTERNATIONAL EQUITY INSIGHTS FUND | ||||||||||||
| Investment Type | Level 1 | Level 2 | Level 3 | |||||||||
| Assets | ||||||||||||
Common Stock and/or Other Equity Investments | ||||||||||||
Asia, Australia and Europe | $ | 49,303,710 | $ | 867,836,884 | (b) | $ | — | |||||
Securities Lending Reinvestment Vehicle | 63,772,469 | — | — | |||||||||
| Total | $ | 113,076,179 | $ | 867,836,884 | $ | — | ||||||
| Derivative Type | ||||||||||||
| Assets(c) | ||||||||||||
Futures Contracts | $ | 269,686 | $ | — | $ | — | ||||||
| Liabilities(c) | ||||||||||||
Futures Contracts | $ | (58,781 | ) | $ | — | $ | — | |||||
| INTERNATIONAL SMALL CAP INSIGHTS FUND | ||||||||||||
| Investment Type | Level 1 | Level 2 | Level 3 | |||||||||
| Assets | ||||||||||||
Common Stock and/or Other Equity Investments | ||||||||||||
North and South America | $ | — | $ | 5,096,919 | (b) | $ | — | |||||
Asia, Australia and Europe | — | 769,679,485 | (b) | — | ||||||||
Securities Lending Reinvestment Vehicle | 64,485,537 | — | — | |||||||||
| Total | $ | 64,485,537 | $ | 774,776,404 | $ | — | ||||||
| Derivative Type | ||||||||||||
| Assets(c) | ||||||||||||
Futures Contracts | $ | 406,693 | $ | — | $ | — | ||||||
| Liabilities(c) | ||||||||||||
Futures Contracts | $ | (242,708 | ) | $ | — | $ | — | |||||
| (a) | For the reporting period $32,648,386 was transferred from Level 2 to Level 1 due to time zone changes whereby certain securities aligned with the timing of the net asset value calculation and therefore fair value model pricing was not applicable at the reporting period. |
| (b) | To adjust for the time difference between local market close and the calculation of net asset value, the Funds utilize fair value model prices for international equities provided by an independent fair value service resulting in a Level 2 classification. |
| (c) | Amount shown represents unrealized gain at fiscal period end. |
For further information regarding security characteristics, see the Schedules of Investments.
55
GOLDMAN SACHS INTERNATIONAL EQUITY INSIGHTS FUNDS
Notes to Financial Statements (continued)
April 30, 2014 (Unaudited)
| 4. INVESTMENTS IN DERIVATIVES |
The following table sets forth, by certain risk types, the gross value of derivative contracts as of April 30, 2014. These instruments were used to meet the Funds’ investment objectives and to obtain and/or manage exposure related to the risks below. The values in the table below exclude the effects of cash collateral received or posted pursuant to these derivative contracts, and therefore are not representative of the Funds’ net exposure:
| International Equity Insights | ||||||||||||
| Risk | Statements of Assets and Liabilities | Assets(a) | Statements of Assets and Liabilities | Liabilities(a) | ||||||||
Equity | Receivable for unrealized gain on futures variation margin | $ | 269,686 | Payable for unrealized gain on futures variation margin | $ | (58,781) | ||||||
| International Small Cap Insights | ||||||||||||
| Risk | Statements of Assets and Liabilities | Assets(a) | Statements of Assets and Liabilities | Liabilities(a) | ||||||||
Equity | Receivable for unrealized gain on futures variation margin | $ | 406,693 | Payable for unrealized gain on futures variation margin | $ | (242,708) | ||||||
| (a) | Includes unrealized gain on futures contracts described in the Additional Investment Information sections of the Schedules of Investments. Only current day’s variation margin is reported within the Statements of Assets and Liabilities. |
The following table sets forth, by certain risk types, the Funds’ gains (losses) related to these derivatives and their indicative volumes for the six months ended April 30, 2014. These gains (losses) should be considered in the context that these derivative contracts may have been executed to create investment opportunities and/or economically hedge certain investments, and accordingly, certain gains (losses) on such derivative contracts may offset certain (losses) gains attributable to investments. These gains (losses) are included in “Net realized gain (loss)” or “Net change in unrealized gain (loss)” on the Statements of Operations:
| International Equity Insights | ||||||||||||||
| Risk | Statements of Operations | Net Realized Gain (Loss) | Net Change in Unrealized Gain (Loss) | Average Number of Contracts(a) | ||||||||||
| Equity | Net realized gain (loss) from futures contracts/Net change in unrealized gain (loss) on futures contracts | $ | 3,541,083 | $ | (811,519 | ) | 279 | |||||||
| International Small Cap Insights | ||||||||||||||
| Risk | Statements of Operations | Net Realized Gain (Loss) | Net Change in Unrealized Gain (Loss) | Average Number of Contracts(a) | ||||||||||
| Equity | Net realized gain (loss) from futures contracts/Net change in unrealized gain (loss) on futures contracts | $ | 282,654 | $ | (246,918 | ) | 312 | |||||||
| (a) | Average number of contracts is based on the average of month end balances for the period ended April 30, 2014. |
56
GOLDMAN SACHS INTERNATIONAL EQUITY INSIGHTS FUNDS
| 5. AGREEMENTS AND AFFILIATED TRANSACTIONS |
A. Management Agreement — Under the Agreement, GSAM manages the Funds, subject to the general supervision of the Trustees.
As compensation for the services rendered pursuant to the Agreement, the assumption of the expenses related thereto and administration of the Funds’ business affairs, including providing facilities, GSAM is entitled to a management fee, accrued daily and paid monthly, equal to an annual percentage rate of each Fund’s average daily net assets.
For the six months ended April 30, 2014, contractual and effective net management fees with GSAM were at the following rates:
| Contractual Management Fee Rate | ||||||||||||||||||||||||||
| Fund | First $1 billion | Next $1 billion | Next $3 billion | Next $3 billion | Over $8 billion | Effective Fee Rate | ||||||||||||||||||||
Emerging Markets Equity Insights | 1.00 | % | 1.00 | % | 0.90 | % | 0.86 | % | 0.84 | % | 1.00 | % | ||||||||||||||
International Equity Insights | 0.85 | 0.77 | 0.73 | 0.72 | 0.71 | 0.85 | ||||||||||||||||||||
International Small Cap Insights | 0.85 | 0.85 | 0.77 | 0.73 | 0.72 | 0.85 | ||||||||||||||||||||
B. Distribution and Service Plans — The Trust, on behalf of each Fund, has adopted Distribution and Service Plans (the “Plans”). Under the Plans, Goldman Sachs, which serves as distributor (the “Distributor”), is entitled to a fee accrued daily and paid monthly, for distribution services and personal and account maintenance services, which may then be paid by Goldman Sachs to authorized dealers, at the following annual rates calculated on a Fund’s average daily net assets of each respective share class:
| Distribution and Service Plan Rates | ||||||||||||||||
| Class A* | Class B | Class C | Class R* | |||||||||||||
Distribution Plan | 0.25 | % | 0.75 | % | 0.75 | % | 0.50 | % | ||||||||
Service Plan | — | 0.25 | 0.25 | — | ||||||||||||
| * | With respect to Class A and Class R Shares, the Distributor at its discretion may use compensation for distribution services paid under the Distribution Plan to compensate service organizations for personal and account maintenance services and expenses as long as such total compensation does not exceed the maximum cap on “service fees” imposed by the Financial Industry Regulatory Authority. |
57
GOLDMAN SACHS INTERNATIONAL EQUITY INSIGHTS FUNDS
Notes to Financial Statements (continued)
April 30, 2014 (Unaudited)
| 5. AGREEMENTS AND AFFILIATED TRANSACTIONS (continued) |
C. Distribution Agreement — Goldman Sachs, as Distributor of the shares of the Funds pursuant to a Distribution Agreement, may retain a portion of the Class A front end sales charge and Class B and Class C Shares’ CDSC. During the six months ended April 30, 2014, Goldman Sachs advised that it retained the following amounts:
| Front End Sales Charge | Contingent Deferred Sales Charge* | |||||||||
| Fund | Class A | Class C | ||||||||
Emerging Markets Equity Insights | $ | 1,097 | $ | — | ||||||
International Equity Insights | 2,789 | — | ||||||||
International Small Cap Insights | 32,142 | 38 | ||||||||
| * | Goldman Sachs did not retain any contingent deferred sales charges for Class B Shares. |
D. Service Plan and Shareholder Administration Plan — The Trust, on behalf of each Fund that offers Service Shares, has adopted a Service Plan and a Shareholder Administration Plan. These plans allow for service organizations to provide varying levels of personal and account maintenance and shareholder administration services to their customers who are beneficial owners of such shares. The Service Plan and Shareholder Administration Plan each provide for compensation to the service organizations which is accrued daily and paid monthly at an annual rate of 0.25% (0.50% in aggregate) of the average daily net assets of the Service Shares.
E. Transfer Agency Agreement — Goldman Sachs also serves as the transfer agent of the Funds for a fee pursuant to Transfer Agency Agreement. The fees charged for such transfer agency services are accrued daily and paid monthly at annual rates as follows: 0.19% of the average daily net assets of Class A, Class B, Class C, Class IR and Class R Shares and 0.04% of the average daily net assets of Institutional and Service Shares.
58
GOLDMAN SACHS INTERNATIONAL EQUITY INSIGHTS FUNDS
| 5. AGREEMENTS AND AFFILIATED TRANSACTIONS (continued) |
F. Other Expense Agreements and Affiliated Transactions — GSAM has agreed to limit certain “Other Expense” of the Funds (excluding transfer agent fees and expenses, service fees and shareholder administration fees (as applicable), taxes, interest, brokerage fees, shareholder meetings, litigation, indemnification, and other extraordinary expenses) to the extent such expenses exceed, on an annual basis, a percentage rate of the average daily net assets of each Fund. Such Other Expense reimbursements, if any, are accrued daily and paid monthly. In addition, the Funds are not obligated to reimburse GSAM for prior fiscal year expense reimbursements, if any. The Other Expense limitations as an annual percentage rate of average daily net assets for the Emerging Markets Equity Insights, International Equity Insights and International Small Cap Insights Funds are 0.144%, 0.004% and 0.014%, respectively. These Other Expense limitations will remain in place through at least February 28, 2015, and prior to such date GSAM may not terminate the arrangements without the approval of the Trustees. In addition, the Funds have entered into certain offset arrangements with the custodian and the transfer agent, which may result in a reduction of the Funds’ expenses and are received irrespective of the application of the “Other Expense” limitations described above.
For the six months ended April 30, 2014, these expense reductions, including any fee waivers and Other Expense reimbursements, were as follows:
| Fund | Custody Fee Credits | Other Expense Reimbursement | Total Expense Reductions | |||||||||||
Emerging Markets Equity Insights | $ | 1,910 | $ | 68,908 | $ | 70,818 | ||||||||
International Equity Insights | 3,270 | 260,076 | 263,346 | |||||||||||
International Small Cap Insights | 4,488 | 216,840 | 221,328 | |||||||||||
As of April 30, 2014, the amounts owed to affiliates of the Funds were as follows:
| Fund | Management Fees | Distribution and Service Fees | Transfer Agent Fees | Total | ||||||||||||||
Emerging Markets Equity Insights | $ | 540,503 | $ | 6,858 | $ | 25,496 | $ | 572,857 | ||||||||||
International Equity Insights | 665,484 | 24,652 | 43,443 | 733,579 | ||||||||||||||
International Small Cap Insights | 541,438 | 36,906 | 45,517 | 623,861 | ||||||||||||||
G. Line of Credit Facility — As of April 30, 2014, the Funds participated in a $780,000,000 committed, unsecured revolving line of credit facility (the “facility”) together with other funds of the Trust and registered investment companies having management agreements with GSAM or its affiliates (“Other Borrowers”). Pursuant to the terms of the facility, the Funds and Other Borrowers could increase the credit amount by an additional $220,000,000, for a total of up to $1,000,000,000. This facility is to be used solely for temporary or emergency purposes, which may include the funding of redemptions. The interest rate on borrowings is based on the federal funds rate. The facility also requires a fee to be paid by the Funds based on the amount of the commitment that has not been utilized. For the six months ended April 30, 2014, the Funds did not have any borrowings under the facility. The facility was increased to $1,080,000,000 effective May 6, 2014.
59
GOLDMAN SACHS INTERNATIONAL EQUITY INSIGHTS FUNDS
Notes to Financial Statements (continued)
April 30, 2014 (Unaudited)
| 5. AGREEMENTS AND AFFILIATED TRANSACTIONS (continued) |
H. Other Transactions with Affiliates — For the six months ended April 30, 2014, Goldman Sachs earned $12,466 in brokerage commissions from portfolio transactions, including futures transactions executed with Goldman Sachs as the Futures Commission Merchant, on behalf of the International Equity Insights Fund.
As of April 30, 2014, the following Goldman Sachs Fund of Funds Portfolios were the beneficial owners of 5% or more of total outstanding shares of the following Funds:
| Fund | Goldman Sachs Balanced Strategy Portfolio | Goldman Sachs Equity Growth Strategy Portfolio | Goldman Sachs Growth Portfolio | Goldman Sachs Growth and Strategy Portfolio | Goldman Sachs Satellite | Goldman Sachs Tax-Advantaged Global Equity Portfolio | ||||||||||||||||||||
Emerging Markets Equity Insights | — | % | 5 | % | 10 | % | 8 | % | 11 | % | 12 | % | ||||||||||||||
International Equity Insights | 5 | 15 | 24 | 19 | — | — | ||||||||||||||||||||
International Small Cap Insights | — | — | — | — | 12 | — | ||||||||||||||||||||
As of April 30, 2014, the Goldman Sachs Group, Inc. was the beneficial owner of approximately 100% and 7% of the Class R Shares of the Emerging Market Equity Insights and International Equity Insight Funds, respectively.
| 6. PORTFOLIO SECURITIES TRANSACTIONS |
The cost of purchases and proceeds from sales and maturities of long-term securities for the six months ended April 30, 2014, were as follows:
| Fund | Purchases | Sales and Maturities | ||||||||
Emerging Markets Equity Insights | $ | 599,413,611 | $ | 512,469,025 | ||||||
International Equity Insights | 624,519,267 | 744,446,030 | ||||||||
International Small Cap Insights | 646,525,975 | 381,393,952 | ||||||||
| 7. SECURITIES LENDING |
Pursuant to exemptive relief granted by the Securities and Exchange Commission (“SEC”) and the terms and conditions contained therein, the Funds may lend their securities through a securities lending agent, Goldman Sachs Agency Lending (“GSAL”), a wholly-owned subsidiary of Goldman Sachs, to certain qualified borrowers including Goldman Sachs and affiliates. In accordance with the Funds’ securities lending procedures, the Funds receive cash collateral at least equal to the market value of the securities on loan. The market value of the loaned securities is determined at the close of business of the Funds, at their last sale price or official closing price on the principal exchange or system on which they are traded, and any additional required collateral is delivered to the Funds on the next business day. As with other extensions of credit, the Funds may experience delay in the recovery of their securities or incur a loss should the borrower of the securities breach its agreement with the Funds or become insolvent at a time when the collateral is insufficient to cover the cost of repurchasing securities on loan. Dividend income received from securities on loan may not be subject to withholding taxes and therefore withholding taxes paid may differ from the amounts listed in the Statement of Operations.
60
GOLDMAN SACHS INTERNATIONAL EQUITY INSIGHTS FUNDS
| 7. SECURITIES LENDING (continued) |
The Funds invest the cash collateral received in connection with securities lending transactions in the Goldman Sachs Financial Square Money Market Fund (“Money Market Fund”), an affiliated series of the Trust. The Money Market Fund, is registered under the Act as an open end investment company, is subject to Rule 2a-7 under the Act, and is managed by GSAM, for which GSAM may receive an investment advisory fee of up to 0.205% on an annualized basis of the average daily net assets of the Money Market Fund.
In December 2011, the Financial Accounting Standards Board (“FASB”) issued an Accounting Standards Update (“ASU”) No. 2011-11: Disclosures about Offsetting Assets and Liabilities (“netting”) on the Statements of Assets and Liabilities that are subject to master netting arrangements or similar agreements. ASU 2011-11 was amended by ASU No. 2013-01, clarifying which investments and transactions are subject to the netting disclosure. The scope of the disclosure requirements is limited to derivative instruments, repurchase agreements and reverse repurchase agreements, and securities borrowing and securities lending transactions. This information is intended to enable users of the Funds’ financial statements to evaluate the effect or potential effect of netting arrangements on the Funds’ financial position. The ASU is effective for financial statements with fiscal years beginning on or after January 1, 2013, and interim periods within those fiscal years. The Funds adopted the disclosure requirement of netting for the current reporting period. Since these amended principles only require additional disclosures concerning offsetting and related arrangements, adoption did not affect the Funds’ financial condition or result of operations.
For financial reporting purposes, the Funds do not offset financial assets and financial liabilities that are subject to master netting arrangements or similar agreements on the Statements of Assets and Liabilities.
In the event of a default by a borrower with respect to any loan, GSAL will exercise any and all remedies provided under the applicable borrower agreement to make the Funds whole. These remedies include purchasing replacement securities by applying the collateral held from the defaulting broker against the purchase cost of the replacement securities. If, despite such efforts by GSAL to exercise these remedies, the Funds sustain losses as a result of a borrower’s default, GSAL indemnifies the Funds by purchasing replacement securities at its expense, or paying the Funds an amount equal to the market value of the replacement securities, subject to an exclusion for any shortfalls resulting from a loss of value in the cash collateral pool due to reinvestment risk and a requirement that the Funds agree to assign rights to the collateral to GSAL for purpose of using the collateral to cover purchase of replacement securities as more fully described in the Securities Lending Agency Agreement.
At April 30, 2014, the Funds’ loaned securities were all subject to enforceable Securities Lending Agreements. Securities lending transactions on a net basis were as follows:
| Security Lending Transactions | Emerging Markets Equity Insights | International Equity Insights | International Small Cap Insights | |||||||||
Total gross amount presented in Statements of Assets and Liabilities | $ | 15,033,669 | $ | 59,745,568 | $ | 60,823,201 | ||||||
Cash Collateral offsetting(1) | (15,033,669 | ) | (59,745,568 | ) | (60,823,201 | ) | ||||||
Net Amount(2) | — | — | — | |||||||||
| (1) | At April 30, 2014 the value of the collateral received from each borrower exceeded the value of the related securities on loan. |
| (2) | Net amount represents the net amount due from the borrower or GSAL in the event of a default based on the contractual set-off rights under the agreement. |
61
GOLDMAN SACHS INTERNATIONAL EQUITY INSIGHTS FUNDS
Notes to Financial Statements (continued)
April 30, 2014 (Unaudited)
| 7. SECURITIES LENDING (continued) |
Both the Funds and GSAL received compensation relating to the lending of the Funds’ securities. The amounts earned by the Funds for the six months ended April 30, 2014, are reported under Investment Income on the Statements of Operations.
The table below details securities lending activity with affiliates of Goldman Sachs:
| For the Six Months Ended April 30, 2014 | Amounts Payable to Goldman Sachs Upon Return of Securities Loaned as of April 30, 2014 | |||||||||||||
| Fund | Earnings of GSAL Relating to Securities Loaned | Amounts Received by the Funds from Lending to Goldman Sachs | ||||||||||||
Emerging Markets Equity Insights | $ | 7,863 | $ | 3,384 | $ | — | ||||||||
International Equity Insights | 39,860 | 96,482 | 13,799,385 | |||||||||||
International Small Cap Insights | 46,310 | 73,773 | 11,771,876 | |||||||||||
The following table provides information about the Funds’ investment in the Money Market Fund for the six months ended April 30, 2014:
| Fund | Number of Shares Held Beginning of Period | Shares Bought | Shares Sold | Number of Shares Held End of Period | Value at End of Period | |||||||||||||||||
Emerging Markets Equity Insights | 13,500,753 | 164,028,185 | (161,848,338 | ) | 15,680,600 | $ | 15,680,600 | |||||||||||||||
International Equity Insights | 5,863,207 | 217,319,185 | (159,409,923 | ) | 63,772,469 | 63,772,469 | ||||||||||||||||
International Small Cap Insights | 32,970,675 | 114,888,388 | (83,373,526 | ) | 64,485,537 | 64,485,537 | ||||||||||||||||
| 8. TAX INFORMATION |
As the Fund’s most recent fiscal year end, October 31, 2013, the Funds’ capital loss carryforwards on a tax-basis were as follows:
| Emerging Markets Equity Insights | International Equity Insights | |||||||
Capital loss carryforwards: | ||||||||
Expiring 2016(1) | $ | — | $ | (455,911,785 | ) | |||
Expiring 2017(1) | (16,672,089 | ) | (940,883,655 | ) | ||||
Expiring 2019(1) | — | (2,867,280 | ) | |||||
Perpetual Long-term | — | (5,963,410 | ) | |||||
Perpetual Short-term | — | (11,601,860 | ) | |||||
Total capital loss carryforwards | $ | (16,672,089 | ) | $ | (1,417,227,990 | ) | ||
| (1) | Expiration occurs on October 31 of the year indicated. |
62
GOLDMAN SACHS INTERNATIONAL EQUITY INSIGHTS FUNDS
8. TAX INFORMATION (continued) |
As of April 30, 2014, the Funds’ aggregate security unrealized gains and losses based on cost for U.S. federal income tax purposes were as follows:
| Emerging Markets Equity Insights | International Equity Insights | International Small Cap Insights | ||||||||||
Tax cost | $ | 629,653,498 | $ | 925,400,161 | $ | 763,291,049 | ||||||
Gross unrealized gain | 50,725,504 | 89,970,316 | 102,453,068 | |||||||||
Gross unrealized loss | (21,997,711 | ) | (34,457,414 | ) | (26,482,176 | ) | ||||||
Net unrealized security gain | $ | 28,727,793 | $ | 55,512,902 | $ | 75,970,892 | ||||||
The difference between GAAP-basis and tax-basis unrealized gains (losses) is attributable primarily to wash sales, net mark to market gains (losses) on regulated futures contracts and differences related to the tax treatment of passive foreign investment company investments.
GSAM has reviewed the Funds’ tax positions for all open tax years (the current and prior three years, as applicable) and has concluded that no provision for income tax is required in the Funds’ financial statements. Such open tax years remain subject to examination and adjustment by tax authorities.
| 9. OTHER RISKS |
The Funds’ risks include, but are not limited to, the following:
Foreign Custody Risk — A Fund that invests in foreign securities may hold such securities and foreign currency with foreign banks, agents, and securities depositories appointed by the Fund’s custodian (each a “Foreign Custodian”). In some countries, Foreign Custodians may be subject to little or no regulatory oversight or independent evaluation of their operations. Further, the laws of certain countries may place limitations on a Fund’s ability to recover its assets if a Foreign Custodian enters into bankruptcy. Investments in emerging markets may be subject to greater custody risks than investments in more developed markets. Custody services in emerging market countries are often undeveloped and may be less regulated than in more developed countries, and thus may not afford the same level of investor protection as would apply in developed countries.
Shareholder Concentration Risk — Certain funds, accounts, individuals or Goldman Sachs affiliates may from time to time own (beneficially or of record) or control a significant percentage of the Funds’ shares. Redemptions by these entities of their holdings in the Funds may impact the Funds’ liquidity and NAV. These redemptions may also force the Funds to sell securities.
Investments in Other Investment Companies — As a shareholder of another investment company, including an exchange traded fund (“ETF”), a Fund will directly bear its proportionate share of any management fees and other expenses paid by such other investment companies, in addition to the fees and expenses regularly borne by the Fund. ETFs are subject to risks that do not apply to conventional mutual funds, including but not limited to the following: (i) the market price of the ETF’s shares may trade at a premium or a discount to their NAV; and (ii) an active trading market for an ETF’s shares may not develop or be maintained.
63
GOLDMAN SACHS INTERNATIONAL EQUITY INSIGHTS FUNDS
Notes to Financial Statements (continued)
April 30, 2014 (Unaudited)
| 9. OTHER RISKS (continued) |
Liquidity Risk — The Funds may make investments that are illiquid or that may become less liquid in response to market developments or adverse investor perceptions. Illiquid investments may be more difficult to value. Liquidity risk may also refer to the risk that a Fund will not be able to pay redemption proceeds within the allowable time period because of unusual market conditions, an unusually high volume of redemption requests, or other reasons. To meet redemption requests, a Fund may be forced to sell investments at an unfavorable time and/or under unfavorable conditions.
Market and Credit Risks — In the normal course of business, the Funds trade financial instruments and enter into financial transactions where risk of potential loss exists due to changes in the market (market risk). Additionally, the Funds may also be exposed to credit risk in the event that an issuer or guarantor fails to perform or that an institution or entity with which the Funds have unsettled or open transactions defaults.
Investing in foreign markets may involve special risks and considerations not typically associated with investing in the U.S. Foreign securities may be subject to risk of loss because of more or less foreign government regulation, less public information and less economic, political and social stability in the countries in which the Fund invests. Loss may also result from the imposition of exchange controls, confiscations and other government restrictions by the U.S. or other governments, or from problems in registration, settlement or custody. Foreign risk also involves the risk of negative foreign currency rate fluctuations, which may cause the value of securities denominated in such foreign currency (or other instruments through which the Fund has exposure to foreign currencies) to decline in value. Currency exchange rates may fluctuate significantly over short periods of time. To the extent that the Fund also invests in securities of issuers located in emerging markets, these risks may be more pronounced.
| 10. IDEMNIFICATIONS |
Under the Trust’s organizational documents, its Trustees, officers, employees and agents are indemnified, to the extent permitted by the Act and state law, against certain liabilities that may arise out of performance of their duties to the Funds. Additionally, in the course of business, the Funds enter into contracts that contain a variety of indemnification clauses. The Funds’ maximum exposure under these arrangements is unknown, as this would involve future claims that may be made against the Funds that have not yet occurred. However, GSAM believes the risk of loss under these arrangements to be remote.
| 11. SUBSEQUENT EVENTS |
Subsequent events after the Statement of Assets and Liabilities date have been evaluated through the date the financial statements were issued. GSAM has concluded that there is no impact requiring adjustment or disclosure in the financial statements.
64
GOLDMAN SACHS INTERNATIONAL EQUITY INSIGHTS FUNDS
| 12. SUMMARY OF SHARE TRANSACTIONS |
Share activity is as follows:
| Emerging Markets Equity Insights Fund | ||||||||||||||||
|
| |||||||||||||||
For the Six Months Ended April 30, 2014 (Unaudited) | For the Fiscal Year Ended October 31, 2013 | |||||||||||||||
|
| |||||||||||||||
| Shares | Dollars | Shares | Dollars | |||||||||||||
|
| |||||||||||||||
| Class A Shares | ||||||||||||||||
Shares sold | 1,501,899 | $ | 12,478,681 | 2,322,240 | $ | 20,618,692 | ||||||||||
Reinvestment of distributions | 24,616 | 213,173 | 73,688 | 645,508 | ||||||||||||
Shares redeemed | (701,134 | ) | (5,774,035 | ) | (5,669,845 | ) | (50,290,832 | ) | ||||||||
| 825,381 | 6,917,819 | (3,273,917 | ) | (29,026,632 | ) | |||||||||||
| Class C Shares | ||||||||||||||||
Shares sold | 41,323 | 346,358 | 101,643 | 859,533 | ||||||||||||
Reinvestment of distributions | 921 | 7,932 | 127 | 1,115 | ||||||||||||
Shares redeemed | (49,134 | ) | (405,029 | ) | (17,990 | ) | (158,348 | ) | ||||||||
| (6,890 | ) | (50,739 | ) | 83,780 | 702,300 | |||||||||||
| Institutional Shares | ||||||||||||||||
Shares sold | 18,551,347 | 157,247,802 | 39,610,954 | 344,944,264 | ||||||||||||
Reinvestment of distributions | 871,372 | 7,511,224 | 852,057 | 7,438,458 | ||||||||||||
Shares redeemed | (8,970,968 | ) | (75,536,091 | ) | (33,585,825 | ) | (285,409,911 | ) | ||||||||
| 10,451,751 | 89,222,935 | 6,877,186 | 66,972,811 | |||||||||||||
| Class IR Shares | ||||||||||||||||
Shares sold | 68,590 | 566,597 | 196,365 | 1,628,578 | ||||||||||||
Reinvestment of distributions | 2,504 | 21,586 | 211 | 1,842 | ||||||||||||
Shares redeemed | (174,839 | ) | (1,460,888 | ) | (26,122 | ) | (220,256 | ) | ||||||||
| (103,745 | ) | (872,705 | ) | 170,454 | 1,410,164 | |||||||||||
| Class R Shares(a) | ||||||||||||||||
Shares sold | 3,027 | 25,005 | — | — | ||||||||||||
| 3,027 | 25,005 | — | — | |||||||||||||
NET INCREASE | 11,169,524 | $ | 95,242,315 | 3,857,503 | $ | 40,058,643 | ||||||||||
| (a) | Commenced operations on February 28, 2014. |
65
GOLDMAN SACHS INTERNATIONAL EQUITY INSIGHTS FUNDS
Notes to Financial Statements (continued)
April 30, 2014 (Unaudited)
| 12. SUMMARY OF SHARE TRANSACTIONS (continued) |
Share activity is as follows:
| International Equity Insights Fund | ||||||||||||||||
|
| |||||||||||||||
For the Six Months Ended April 30, 2014 (Unaudited) | For the Fiscal Year Ended October 31, 2013 | |||||||||||||||
|
| |||||||||||||||
| Shares | Dollars | Shares | Dollars | |||||||||||||
|
| |||||||||||||||
| Class A Shares | ||||||||||||||||
Shares sold | 557,081 | $ | 6,094,329 | 2,943,527 | $ | 27,769,199 | ||||||||||
Shares converted from Class B(a) | 4,102 | 44,091 | 10,576 | 103,931 | ||||||||||||
Reinvestment of distributions | 213,135 | 2,272,021 | 751,842 | 6,751,544 | ||||||||||||
Shares redeemed | (1,361,863 | ) | (14,964,418 | ) | (18,647,168 | ) | (178,420,646 | ) | ||||||||
| (587,545 | ) | (6,553,977 | ) | (14,941,223 | ) | (143,795,972 | ) | |||||||||
| Class B Shares | ||||||||||||||||
Shares sold | 3,496 | 38,280 | 4,432 | 43,113 | ||||||||||||
Shares converted to Class A(a) | (4,126 | ) | (44,091 | ) | (10,664 | ) | (103,931 | ) | ||||||||
Reinvestment of distributions | 3,037 | 32,250 | 6,687 | 59,782 | ||||||||||||
Shares redeemed | (35,954 | ) | (390,235 | ) | (111,982 | ) | (1,085,097 | ) | ||||||||
| (33,547 | ) | (363,796 | ) | (111,527 | ) | (1,086,133 | ) | |||||||||
| Class C Shares | ||||||||||||||||
Shares sold | 29,475 | 319,722 | 33,474 | 326,046 | ||||||||||||
Reinvestment of distributions | 5,864 | 61,859 | 7,377 | 65,731 | ||||||||||||
Shares redeemed | (27,271 | ) | (293,576 | ) | (96,554 | ) | (910,697 | ) | ||||||||
| 8,068 | 88,005 | (55,703 | ) | (518,920 | ) | |||||||||||
| Institutional Shares | ||||||||||||||||
Shares sold | 7,587,495 | 85,372,531 | 35,951,844 | 349,612,138 | ||||||||||||
Reinvestment of distributions | 2,634,973 | 28,747,556 | 2,346,076 | 21,583,896 | ||||||||||||
Shares redeemed | (18,713,689 | ) | (207,996,648 | ) | (19,117,164 | ) | (190,484,919 | ) | ||||||||
| (8,491,221 | ) | (93,876,561 | ) | 19,180,756 | 180,711,115 | |||||||||||
| Service Shares | ||||||||||||||||
Shares sold | 8,172 | 88,918 | 157,165 | 1,507,427 | ||||||||||||
Reinvestment of distributions | 4,316 | 46,355 | 7,351 | 66,527 | ||||||||||||
Shares redeemed | (199,796 | ) | (2,215,471 | ) | (477,512 | ) | (4,689,651 | ) | ||||||||
| (187,308 | ) | (2,080,198 | ) | (312,996 | ) | (3,115,697 | ) | |||||||||
| Class IR Shares | ||||||||||||||||
Shares sold | 2,382 | 26,142 | 44,468 | 435,067 | ||||||||||||
Reinvestment of distributions | 1,216 | 12,760 | 517 | 4,577 | ||||||||||||
Shares redeemed | (7,859 | ) | (85,664 | ) | (9,205 | ) | (92,933 | ) | ||||||||
| (4,261 | ) | (46,762 | ) | 35,780 | 346,711 | |||||||||||
| Class R Shares | ||||||||||||||||
Shares sold | 5,407 | 57,876 | 867 | 8,376 | ||||||||||||
Reinvestment of distributions | 247 | 2,598 | 246 | 2,185 | ||||||||||||
Shares redeemed | (1,712 | ) | (18,677 | ) | (320 | ) | (2,907 | ) | ||||||||
| 3,942 | 41,797 | 793 | 7,654 | |||||||||||||
NET INCREASE (DECREASE) | (9,291,872 | ) | $ | (102,791,492 | ) | 3,795,880 | $ | 32,548,758 | ||||||||
| (a) | Class B Shares convert into Class A Shares on or about the fifteenth day of the last month of the calendar quarter that is eight years after the initial purchase date of either the Fund or another Goldman Sachs Fund. |
66
GOLDMAN SACHS INTERNATIONAL EQUITY INSIGHTS FUNDS
| 12. SUMMARY OF SHARE TRANSACTIONS (continued) |
Share activity is as follows:
| International Small Cap Insights Fund | ||||||||||||||||
|
| |||||||||||||||
For the Six Months Ended April 30, 2014 (Unaudited) | For the Fiscal Year Ended October 31, 2013 | |||||||||||||||
|
| |||||||||||||||
| Shares | Dollars | Shares | Dollars | |||||||||||||
|
| |||||||||||||||
| Class A Shares | ||||||||||||||||
Shares sold | 8,953,570 | $ | 94,595,169 | 4,782,870 | $ | 45,566,381 | ||||||||||
Reinvestment of distributions | 218,400 | 2,232,053 | 100,341 | 802,726 | ||||||||||||
Shares redeemed | (827,033 | ) | (8,717,622 | ) | (2,122,156 | ) | (18,869,127 | ) | ||||||||
| 8,344,937 | 88,109,600 | 2,761,055 | 27,499,980 | |||||||||||||
| Class C Shares | ||||||||||||||||
Shares sold | 826,858 | 8,573,114 | 256,792 | 2,479,909 | ||||||||||||
Reinvestment of distributions | 14,055 | 140,694 | 4,103 | 32,332 | ||||||||||||
Shares redeemed | (15,707 | ) | (161,406 | ) | (33,257 | ) | (292,641 | ) | ||||||||
| 825,206 | 8,552,402 | 227,638 | 2,219,600 | |||||||||||||
| Institutional Shares | ||||||||||||||||
Shares sold | 25,025,063 | 265,334,424 | 21,486,763 | 195,958,498 | ||||||||||||
Reinvestment of distributions | 1,522,029 | 15,524,694 | 1,199,773 | 9,562,193 | ||||||||||||
Shares redeemed | (6,049,882 | ) | (64,282,884 | ) | (10,479,262 | ) | (92,855,065 | ) | ||||||||
| 20,497,210 | 216,576,234 | 12,207,274 | 112,665,626 | |||||||||||||
| Class IR Shares | ||||||||||||||||
Shares sold | 1,442,088 | 15,335,252 | 348,331 | 3,416,621 | ||||||||||||
Reinvestment of distributions | 17,549 | 178,644 | 2,249 | 17,900 | ||||||||||||
Shares redeemed | (86,575 | ) | (913,414 | ) | (51,893 | ) | (474,158 | ) | ||||||||
| 1,373,062 | 14,600,482 | 298,687 | 2,960,363 | |||||||||||||
NET INCREASE | 31,040,415 | $ | 327,838,718 | 15,494,654 | $ | 145,345,569 | ||||||||||
67
GOLDMAN SACHS INTERNATIONAL EQUITY INSIGHTS FUNDS
Fund Expenses — Six Month Period Ended April 30, 2014 (Unaudited)
As a shareholder of Class A, Class B, Class C, Institutional, Service, Class IR or Class R Shares of a Fund you incur two types of costs: (1) transaction costs, including sales charges on purchase payments (with respect to Class A Shares) and contingent deferred sales charges on redemptions (with respect to Class B and Class C Shares); and (2) ongoing costs, including management fees; distribution and service (12b-1) fees (with respect to Class A, Class B, Class C and Class R Shares); and other Fund expenses. This example is intended to help you understand your ongoing costs (in dollars) of investing in Class A, Class B, Class C, Institutional, Service, Class IR and Class R Shares of the Funds and to compare these costs with the ongoing costs of investing in other mutual funds.
The example is based on an investment of $1,000 invested at the beginning of the period and held for the entire period from November 1, 2013 through April 30, 2014.
Actual Expenses — The first line under each share class in the table below provides information about actual account values and actual expenses. You may use the information in this line, together with the amount you invested, to estimate the expenses that you paid over the period. Simply divide your account value by $1,000 (for example, an $8,600 account value divided by $1,000=8.6), then multiply the result by the number in the first line under the heading entitled “Expenses Paid” to estimate the expenses you paid on your account during this period.
Hypothetical Example for Comparison Purposes — The second line under each share class in the table below provides information about hypothetical account values and hypothetical expenses based on the Funds’ actual net expense ratio and an assumed rate of return of 5% per year before expenses, which is not the Funds’ actual return. The hypothetical account values and expenses may not be used to estimate the actual ending account balance or expenses you paid for the period. You may use this information to compare the ongoing costs of investing in the Funds and other funds. To do so, compare this 5% hypothetical example with the 5% hypothetical examples that appear in the shareholder reports of the other funds.
Please note that the expenses shown in the table are meant to highlight your ongoing costs only and do not reflect any transactional costs, such as sales charges, redemption fees or exchange fees. Therefore, the second line of the table is useful in comparing ongoing costs only, and will not help you determine the relative total costs of owning different funds. In addition, if these transactional costs were included, your costs would have been higher.
| Emerging Markets Equity Insights Fund | International Equity Insights Fund | International Small Cap Insights Fund | ||||||||||||||||||||||||||||||||||
| Share Class | Beginning Account Value 11/01/13 | Ending Account Value 4/30/14 | Expenses Paid for the 6 Months Ended 4/30/14* | Beginning Account Value 11/01/13 | Ending Account Value 4/30/14 | Expenses Paid for the 6 Months Ended 4/30/14* | Beginning Account Value 11/01/13 | Ending Account Value 4/30/14 | Expenses Paid for the 6 Months Ended 4/30/14* | |||||||||||||||||||||||||||
| Class A | ||||||||||||||||||||||||||||||||||||
Actual | $ | 1,000 | $ | 960.80 | $ | 7.73 | $ | 1,000 | $ | 1,046.30 | $ | 6.55 | $ | 1,000 | $ | 1,050.00 | $ | 6.66 | ||||||||||||||||||
Hypothetical 5% return | 1,000 | 1,016.91 | + | 7.95 | 1,000 | 1,018.40 | + | 6.46 | 1,000 | 1,018.30 | + | 6.56 | ||||||||||||||||||||||||
| Class B | ||||||||||||||||||||||||||||||||||||
Actual | N/A | N/A | N/A | 1,000 | 1,042.80 | 10.33 | N/A | N/A | N/A | |||||||||||||||||||||||||||
Hypothetical 5% return | N/A | N/A | N/A | 1,000 | 1,014.68 | + | 10.19 | N/A | N/A | N/A | ||||||||||||||||||||||||||
| Class C | ||||||||||||||||||||||||||||||||||||
Actual | 1,000 | 957.90 | 11.36 | 1,000 | 1,042.40 | 10.33 | 1,000 | 1,045.60 | 10.45 | |||||||||||||||||||||||||||
Hypothetical 5% return | 1,000 | 1,013.19 | + | 11.68 | 1,000 | 1,014.68 | + | 10.19 | 1,000 | 1,014.58 | + | 10.29 | ||||||||||||||||||||||||
| Institutional | ||||||||||||||||||||||||||||||||||||
Actual | 1,000 | 962.10 | 5.79 | 1,000 | 1,047.90 | 4.52 | 1,000 | 1,052.20 | 4.63 | |||||||||||||||||||||||||||
Hypothetical 5% return | 1,000 | 1,018.89 | + | 5.96 | 1,000 | 1,020.38 | + | 4.46 | 1,000 | 1,020.28 | + | 4.56 | ||||||||||||||||||||||||
| Service | ||||||||||||||||||||||||||||||||||||
Actual | N/A | N/A | N/A | 1,000 | 1,046.60 | 7.05 | N/A | N/A | N/A | |||||||||||||||||||||||||||
Hypothetical 5% return | N/A | N/A | N/A | 1,000 | 1,017.90 | + | 6.95 | N/A | N/A | N/A | ||||||||||||||||||||||||||
| Class IR | ||||||||||||||||||||||||||||||||||||
Actual | 1,000 | 962.60 | 6.52 | 1,000 | 1,047.80 | 5.28 | 1,000 | 1,052.00 | 5.39 | |||||||||||||||||||||||||||
Hypothetical 5% return | 1,000 | 1,018.15 | + | 6.71 | 1,000 | 1,019.64 | + | 5.21 | 1,000 | 1,019.54 | + | 5.31 | ||||||||||||||||||||||||
| Class R(a) | ||||||||||||||||||||||||||||||||||||
Actual | 1,000 | 1,027.80 | 3.00 | 1,000 | 1,045.00 | 7.81 | N/A | N/A | N/A | |||||||||||||||||||||||||||
Hypothetical 5% return | 1,000 | 1,015.72 | + | 9.15 | 1,000 | 1,017.16 | + | 7.70 | N/A | N/A | N/A | |||||||||||||||||||||||||
| (a) | Commenced operations on February 28, 2014 for the Emerging Markets Equity Insights Fund. |
| * | Expenses are calculated using each Fund’s annualized net expense ratio for each class, which represents the ongoing expenses as a percentage of net assets for the six months ended April 30, 2014. Expenses are calculated by multiplying the annualized net expense ratio by the average account value for the period; then multiplying the result by the number of days in the most recent fiscal half year; and then dividing that result by the number of days in the fiscal year. The annualized net expense ratios for the period were as follows: |
| Fund | Class A | Class B | Class C | Institutional | Service | Class IR | Class R | |||||||||||||||||||||
Emerging Markets Equity Insights | 1.59 | % | N/A | 2.34 | % | 1.19 | % | N/A | 1.34 | % | 1.83 | % | ||||||||||||||||
International Equity Insights | 1.29 | 2.04 | % | 2.04 | 0.89 | 1.39 | % | 1.04 | 1.54 | |||||||||||||||||||
International Small Cap Insights | 1.31 | N/A | 2.06 | 0.91 | N/A | 1.06 | N/A | |||||||||||||||||||||
| + | Hypothetical expenses are based on each Fund's actual annualized net expense ratios and an assumed rate of return of 5% per year before expenses. |
68
FUNDS PROFILE
Goldman Sachs Funds

Goldman Sachs is a premier financial services firm, known since 1869 for creating thoughtful and customized investment solutions in complex global markets.
Today, the Investment Management Division of Goldman Sachs serves a diverse set of clients worldwide, including private institutions, public entities and individuals. With approximately $935.2 billion in assets under supervision as of March 31, 2014, Goldman Sachs Asset Management (“GSAM”) has portfolio management teams located around the world and our investment professionals bring firsthand knowledge of local markets to every investment decision. Assets under supervision includes assets under management and other client assets for which Goldman Sachs does not have full discretion. GSAM leverages the resources of Goldman, Sachs & Co. subject to legal, internal and regulatory restrictions.

Money Market1
Financial Square FundsSM
| n | Financial Square Tax-Exempt Funds |
| n | Financial Square Federal Fund |
| n | Financial Square Government Fund |
| n | Financial Square Money Market Fund |
| n | Financial Square Prime Obligations Fund |
| n | Financial Square Treasury Instruments Fund |
| n | Financial Square Treasury Obligations Fund |
Fixed Income
Short Duration and Government
| n | Enhanced Income Fund |
| n | High Quality Floating Rate Fund |
| n | Limited Maturity Obligations Fund |
| n | Short Duration Government Fund |
| n | Short Duration Income Fund |
| n | Government Income Fund |
| n | Inflation Protected Securities Fund |
Multi-Sector
| n | Core Fixed Income Fund |
| n | Core Plus Fixed Income Fund |
| n | Global Income Fund |
| n | Strategic Income Fund |
| n | World Bond Fund |
Municipal and Tax-Free
| n | High Yield Municipal Fund |
| n | Municipal Income Fund |
| n | Short Duration Tax-Free Fund |
Single Sector
| n | Investment Grade Credit Fund |
| n | U.S. Mortgages Fund |
| n | High Yield Fund |
| n | High Yield Floating Rate Fund |
| n | Emerging Markets Debt Fund |
| n | Local Emerging Markets Debt Fund |
| n | Dynamic Emerging Markets Debt Fund |
Corporate Credit
| n | Long Short Credit Strategies Fund2 |
Fundamental Equity
| n | Growth and Income Fund |
| n | Small Cap Value Fund |
| n | Small/Mid Cap Value Fund |
| n | Mid Cap Value Fund |
| n | Large Cap Value Fund |
| n | Capital Growth Fund |
| n | Strategic Growth Fund |
| n | Focused Growth Fund |
| n | Small/Mid Cap Growth Fund |
| n | Flexible Cap Growth Fund |
| n | Concentrated Growth Fund |
| n | Technology Tollkeeper Fund |
| n | Growth Opportunities Fund |
| n | Rising Dividend Growth Fund |
| n | U.S. Equity Fund |
| n | Income Builder Fund |
Tax-Advantaged Equity
| n | U.S. Tax-Managed Equity Fund3 |
| n | International Tax-Managed Equity Fund3 |
| n | U.S. Equity Dividend and Premium Fund |
| n | International Equity Dividend and Premium Fund |
Equity Insights
| n | Small Cap Equity Insights Fund |
| n | U.S. Equity Insights Fund |
| n | Small Cap Growth Insights Fund |
| n | Large Cap Growth Insights Fund |
| n | Large Cap Value Insights Fund |
| n | Small Cap Value Insights Fund |
| n | International Small Cap Insights Fund |
| n | International Equity Insights Fund |
| n | Emerging Markets Equity Insights Fund |
Fundamental Equity International
| n | Strategic International Equity Fund |
| n | Focused International Equity Fund4 |
| n | International Small Cap Fund |
| n | Asia Equity Fund |
| n | Emerging Markets Equity Fund |
| n | BRIC Fund (Brazil, Russia, India, China) |
| n | N-11 Equity Fund |
Select Satellite5
| n | Real Estate Securities Fund |
| n | International Real Estate Securities Fund |
| n | Commodity Strategy Fund |
| n | Dynamic Commodity Strategy Fund |
| n | Dynamic Allocation Fund |
| n | Absolute Return Tracker Fund |
| n | Managed Futures Strategy Fund |
| n | MLP Energy Infrastructure Fund |
| n | Multi-Manager Alternatives Fund |
| n | Multi-Asset Real Return Fund |
| n | Retirement Portfolio Completion Fund |
| n | Fixed Income Macro Strategies Fund |
Total Portfolio Solutions5
| n | Balanced Strategy Portfolio |
| n | Growth and Income Strategy Portfolio |
| n | Growth Strategy Portfolio |
| n | Equity Growth Strategy Portfolio |
| n | Satellite Strategies Portfolio |
| n | Enhanced Dividend Global |
Equity Portfolio
| n | Tax Advantaged Global Equity Portfolio |
| 1 | An investment in a money market fund is neither insured nor guaranteed by the Federal Deposit Insurance Corporation (“FDIC”) or any other government agency. Although the Funds seek to preserve the value of your investment at $1.00 per share, it is possible to lose money by investing in the Funds. |
| 2 | Effective at the close of business on March 21, 2014, the Goldman Sachs Credit Strategies Fund was reorganized with and into the Goldman Sachs Long Short Credit Strategies Fund. |
| 3 | Effective at the close of business on April 30, 2014, the Goldman Sachs Structured Tax-Managed Equity and Structured International Tax-Managed Equity Funds were renamed the Goldman Sachs U.S. Tax-Managed Equity and International Tax-Managed Equity Funds respectively. |
| 4 | Effective at the close of business on February 28, 2014, the Goldman Sachs Concentrated International Equity Fund was renamed the Goldman Sachs Focused International Equity Fund. |
| 5 | Individual Funds within the Total Portfolio Solutions and Select Satellite categories will have various placement on the risk/return spectrum and may have greater or lesser risk than that indicated by the placement of the general Total Portfolio Solutions or Select Satellite category. |
Financial Square FundsSM is a registered service mark of Goldman, Sachs & Co.
| *This | list covers open-end funds only. Please visit our website at www.GSAMFUNDS.com to learn about our closed-end fund. |
TRUSTEES Ashok N. Bakhru, Chairman Donald C. Burke John P. Coblentz, Jr. Diana M. Daniels Joseph P. LoRusso Herbert J. Markley James A. McNamara Jessica Palmer Alan A. Shuch Richard P. Strubel Roy W. Templin | OFFICERS James A. McNamara, President Scott M. McHugh, Principal Financial Officer and Treasurer Caroline L. Kraus, Secretary | |
GOLDMAN, SACHS & CO. Distributor and Transfer Agent | GOLDMAN SACHS ASSET MANAGEMENT, L.P. Investment Adviser | |
Visit our Web site at www.GSAMFUNDS.com to obtain the most recent month-end returns.
Goldman Sachs Asset Management, L.P., 200 West Street, New York, New York 10282
The reports concerning the Funds included in this shareholder report may contain certain forward-looking statements about the factors that may affect the performance of the Funds in the future. These statements are based on Fund management’s predictions and expectations concerning certain future events and their expected impact on the Funds, such as performance of the economy as a whole and of specific industry sectors, changes in the levels of interest rates, the impact of developing world events, and other factors that may influence the future performance of the Funds. Management believes these forward-looking statements to be reasonable, although they are inherently uncertain and difficult to predict. Actual events may cause adjustments in portfolio management strategies from those currently expected to be employed.
A description of the policies and procedures that the Funds use to determine how to vote proxies relating to portfolio securities and information regarding how a Fund voted proxies relating to portfolio securities during the most recent 12-month period ended June 30 is available (I) without charge, upon request by calling 1-800-526-7384 (for Retail Shareholders) or 1-800-621-2550 (for Institutional Shareholders); and (II) on the Securities and Exchange Commission Web site at http://www.sec.gov.
The Funds file their complete schedule of portfolio holdings with the SEC for the first and third quarters of each fiscal year on Form N-Q. The Funds’ Forms N-Q are available on the SEC’s web site at http://www.sec.gov within 60 days after the Funds’ first and third fiscal quarters. The Funds’ Forms N-Q may be reviewed and copied at the SEC’s Public Reference Room in Washington, D.C., and information on the operation of the Public Reference Room may also be obtained by calling 1-800-SEC-0330. Forms N-Q may be obtained upon request and without charge by calling 1-800-526-7384 (for Retail Shareholders) or 1-800-621-2550 (for Institutional Shareholders).
The website links provided are for your convenience only and are not an endorsement or recommendation by GSAM of any of these websites or the products or services offered. GSAM is not responsible for the accuracy and validity of the content of these websites.
Holdings and allocations shown are as of April 30, 2014 and may not be representative of future investments. Fund holdings should not be relied on in making investment decisions and should not be construed as research or investment advice regarding particular securities. Current and future holdings are subject to risk.
Economic and market forecasts presented herein reflect a series of assumptions and judgments as of the date of this presentation and are subject to change without notice. These forecasts do not take into account the specific investment objectives, restrictions, tax and financial situation or other needs of any specific client. Actual data will vary and may not be reflected here. These forecasts are subject to high levels of uncertainty that may affect actual performance. Accordingly, these forecasts should be viewed as merely representative of a broad range of possible outcomes. These forecasts are estimated, based on assumptions, and are subject to significant revision and may change materially as economic and market conditions change. Goldman Sachs has no obligation to provide updates or changes to these forecasts. Case studies and examples are for illustrative purposes only.
The Global Industry Classification Standard (GICS) was developed by and is the exclusive property and a service mark of Morgan Stanley Capital International Inc. (MSCI) and Standard & Poor’s, a division of The McGraw-Hill Companies, Inc. (S&P) and is licensed for use by Goldman Sachs. Neither MSCI, S&P nor any other party involved in making or compiling the GICS or any GICS classifications makes any express or implied warranties or representations with respect to such standard or classification (or the results to be obtained by the use thereof), and all such parties hereby expressly disclaim all warranties of originality, accuracy, completeness, merchantability or fitness for a particular purpose with respect to any of such standard or classification. Without limiting any of the foregoing, in no event shall MSCI, S&P, any of their affiliates or any third party involved in making or compiling the GICS or any GICS classifications have any liability for any direct, indirect, special, punitive, consequential or any other damages (including lost profits) even if notified of the possibility of such damages.
The portfolio risk management process includes an effort to monitor and manage risk, but does not imply low risk.
This material is not authorized for distribution to prospective investors unless preceded or accompanied by a current Prospectus or summary prospectus, if applicable. Investors should consider a Fund’s objective, risks, and charges and expenses, and read the summary prospectus, if available, and/or the Prospectus carefully before investing or sending money. The summary prospectus, if available, and the Prospectus contain this and other information about a Fund and may be obtained from your authorized dealer or from Goldman, Sachs & Co. by calling (retail – 1-800-526-7384) (institutional – 1-800-621-2550).
© 2014 Goldman Sachs. All rights reserved. 131662.MF.MED.TMPL /6/2014 INTINSSAR14 / 19K
| ITEM 2. | CODE OF ETHICS. |
The information required by this Item is only required in an annual report on this Form N-CSR.
| ITEM 3. | AUDIT COMMITTEE FINANCIAL EXPERT. |
The information required by this Item is only required in an annual report on this Form N-CSR.
| ITEM 4. | PRINCIPAL ACCOUNTANT FEES AND SERVICES. |
The information required by this Item is only required in an annual report on this Form N-CSR.
| ITEM 5. | AUDIT COMMITTEE OF LISTED REGISTRANTS. |
| Not applicable. |
| ITEM 6. | SCHEDULE OF INVESTMENTS. |
| Schedule of Investments is included as part of the Report to Stockholders filed under Item 1. |
| ITEM 7. | DISCLOSURE OF PROXY VOTING POLICIES AND PROCEDURES FOR CLOSED-END MANAGEMENT INVESTMENT COMPANIES. |
| Not applicable. |
| ITEM 8. | PORTFOLIO MANAGERS OF CLOSED-END MANAGEMENT INVESTMENT COMPANIES. |
| Not applicable. |
| ITEM 9. | PURCHASES OF EQUITY SECURITIES BY CLOSED-END MANAGEMENT INVESTMENT COMPANY AND AFFILIATED PURCHASERS. |
| Not applicable. |
| ITEM 10. | SUBMISSION OF MATTERS TO A VOTE OF SECURITY HOLDERS. |
| There have been no material changes to the procedures by which shareholders may recommend nominees to the registrant’s board of trustees. |
| ITEM 11. | CONTROLS AND PROCEDURES. |
| (a) | The registrant’s principal executive and principal financial officers, or persons performing similar functions have concluded that the registrant’s disclosure controls and procedures (as defined in Rule 30a-3(c) under the Investment Company Act of 1940, as amended (the “1940 Act”)) are effective as of a date within 90 days of the filing of this report that includes the disclosure required by this paragraph, based on the evaluation of these controls and procedures required by Rule 30a-3(b) under the 1940 Act and 15d-15(b) under the Securities Exchange Act of 1934, as amended. |
| (b) | There were no changes in the registrant’s internal control over financial reporting (as defined in Rule 30a-3(d) under the 1940 Act) that occurred during the registrant’s second fiscal quarter of the period covered by this report that have materially affected, or are reasonably likely to materially affect, the registrant’s internal control over financial reporting. |
| ITEM 12. | EXHIBITS. |
| (a)(1) | The information required by this Item is only required in connection with an annual report on this Form N-CSR. | |||
| (a)(2) | Exhibit 99.CERT | Certifications pursuant to Section 302 of the Sarbanes-Oxley Act of 2002 filed herewith. | ||
| (b) | Exhibit 99.906CERT | Certifications pursuant to Section 906 of the Sarbanes-Oxley Act of 2002 filed herewith. | ||
SIGNATURES
Pursuant to the requirements of the Securities Exchange Act of 1934 and the Investment Company Act of 1940, the registrant has duly caused this report to be signed on its behalf by the undersigned, thereunto duly authorized.
| Goldman Sachs Trust | ||
| By: | /s/ James A. McNamara | |
| ||
James A. McNamara | ||
| President/Principal Executive Officer | ||
| Goldman Sachs Trust | ||
| Date: | June 30, 2014 | |
Pursuant to the requirements of the Securities Exchange Act of 1934 and the Investment Company Act of 1940, this report has been signed below by the following persons on behalf of the registrant and in the capacities and on the dates indicated.
| By: | /s/ James A. McNamara | |
| ||
James A. McNamara | ||
| President/Principal Executive Officer | ||
| Goldman Sachs Trust | ||
| Date: | June 30, 2014 | |
| By: | /s/ Scott McHugh | |
| ||
Scott McHugh | ||
| Principal Financial Officer | ||
| Goldman Sachs Trust | ||
| Date: | June 30, 2014 | |