UNITED STATES
SECURITIES AND EXCHANGE COMMISSION
Washington, D.C. 20549
FORM N-CSR
CERTIFIED SHAREHOLDER REPORT OF REGISTERED
MANAGEMENT INVESTMENT COMPANIES
Investment Company Act file number 811-05349
Goldman Sachs Trust
(Exact name of registrant as specified in charter)
71 South Wacker Drive, Chicago, Illinois 60606
(Address of principal executive offices) (Zip code)
| Caroline Kraus, Esq. | Copies to: | |
| Goldman, Sachs & Co. | Geoffrey R.T. Kenyon, Esq. | |
| 200 West Street | Dechert LLP | |
| New York, New York 10282 | 100 Oliver Street | |
| 40th Floor | ||
| Boston, MA 02110-2605 |
(Name and address of agents for service)
Registrant’s telephone number, including area code: (312) 655-4400
Date of fiscal year end: October 31
Date of reporting period: April 30, 2014
| ITEM 1. | REPORTS TO STOCKHOLDERS. |
| The Semi-Annual Report to Stockholders is filed herewith. |
Goldman Sachs Funds

| Semi-Annual Report | April 30, 2014 | |||
Dividend Focus Funds | ||||
Income Builder | ||||
Rising Dividend Growth | ||||
|

Goldman Sachs Dividend Focus Funds
| n | INCOME BUILDER |
| n | RISING DIVIDEND GROWTH |
TABLE OF CONTENTS | ||||
Principal Investment Strategies and Risks | 1 | |||
Investment Process — Income Builder | 3 | |||
Portfolio Management Discussion and Performance Summary — Income Builder | 4 | |||
Portfolio Management Discussion and Performance Summary — Rising Dividend Growth | 14 | |||
Schedules of Investments | 22 | |||
Financial Statements | 34 | |||
Financial Highlights | 38 | |||
Notes to Financial Statements | 42 | |||
Other Information | 60 | |||
| NOT FDIC-INSURED | May Lose Value | No Bank Guarantee | ||
GOLDMAN SACHS DIVIDEND FOCUS FUNDS
Principal Investment Strategies and Risks
This is not a complete list of risks that may affect the Funds. For additional information concerning the risks applicable to the Funds, please see the Funds’ Prospectus.
The Goldman Sachs Income Builder Fund seeks to provide income through investments in fixed income securities (bonds) and high dividend paying equities, preferred equities and other similar securities (stocks), and seeks to provide capital appreciation primarily through equity investments. The Fund’s investments in fixed income securities are subject to the risks associated with debt securities generally, including credit and interest rate risk. High yield, lower rated investments involve greater price volatility and present greater risks, including greater liquidity risk, than higher rated fixed income securities. The Fund’s equity investments will be subject to market risk, which means that the value of the securities in which it invests may go up or down in response to the prospects of individual companies, particular sectors and/or general economic conditions. Foreign and emerging markets investments may be more volatile than investments in U.S. securities and are subject to the risks of currency fluctuations and adverse economic or political developments. Derivative instruments may involve a high degree of financial risk. These risks include the risk that a small movement in the price of the underlying security or benchmark may result in a disproportionately large movement, unfavorable or favorable, in the price of the derivative instrument; the risk of default by a counterparty; and liquidity risk. Different investment styles tend to shift in and out of favor, and at times the Fund may underperform other funds that invest in similar asset classes. Investing in REITs involves certain unique risks in addition to those risks associated with investing in the real estate industry in general. REITs whose underlying properties are concentrated in a particular industry or geographic region are also subject to risks affecting such industries and regions. The securities of REITs involve greater risks than those associated with larger, more established companies and may be subject to more abrupt or erratic price movements because of interest rate changes, economic conditions and other factors. Investments in master limited partnerships (“MLPs”) are subject to certain risks, including risks related to limited control and limited rights to vote, potential conflicts of interest, cash flow risks, dilution risks, limited liquidity and risks related to the general partner’s right to force sales at undesirable times or prices.
The Goldman Sachs Rising Dividend Growth Fund invests primarily in equity investments of dividend paying U.S. and foreign companies with market capitalizations of at least $500 million. The equity investments in which the Fund invests may include common and preferred stocks as well as master limited partnerships (“MLPs”) and real estate investment trusts (“REITs”). The Fund’s equity investments are subject to market risk, which means that the value of the securities in which it invests may go up or down in response to the prospects of individual companies, particular sectors and/or general economic conditions. Different investment styles tend to shift in and out of favor, and the Fund’s emphasis on companies with rising dividend payments could cause the Fund to underperform other funds that invest in similar asset classes but employ different investment styles. Investments in MLPs are subject to certain risks, including risks related to limited control and limited rights to vote, potential conflicts of interest, cash flow risks, dilution risks, limited liquidity and risks related to the general partner’s right to force sales at undesirable times or prices. MLPs are also subject to risks relating to their complex tax structure, including the risk that a distribution received by the Fund from an MLP is treated as a return of capital, which may increase the Fund’s tax liability and require the Fund to restate the character of its distributions and amend shareholder tax reporting previously issued, and the risk that an MLP could lose its tax status as a partnership, resulting in a reduction in the value of the Fund’s investment in the MLP and lower income to the Fund. Many MLPs in which the Fund may invest operate facilities within the energy sector and are also subject to risks affecting the energy sector. The securities of REITs and mid- and small-capitalization companies involve greater risks than those associated with larger, more established companies and may be subject to more abrupt or erratic price movements (in the case of REITs, because of interest rate changes, economic conditions and other factors). REITs whose underlying properties are concentrated in a particular industry or region are also subject to risks affecting such industries and regions. The Fund may also invest in fixed income securities, which are subject to the
1
GOLDMAN SACHS DIVIDEND FOCUS FUNDS
risks associated with debt securities generally, including credit and interest rate risk. Foreign securities and emerging country securities may be more volatile and less liquid than investments in U.S. securities and are subject to the risks of currency fluctuations and adverse economic and political developments. The Fund’s investments in other investment companies (including ETFs) subject it to additional expenses. The Fund is “non-diversified” and may invest more of its assets in fewer issuers than “diversified” funds. Accordingly, the Fund may be more susceptible to adverse developments affecting any single issuer held in its portfolio and to greater losses resulting from these developments.
2
GOLDMAN SACHS INCOME BUILDER FUND
What Differentiates Goldman Sachs’ Income Builder Fund Investment Process?
Income Builder Fund is a broadly diversified portfolio that seeks to provide income and capital appreciation.
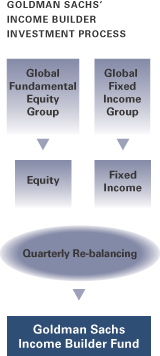

The Goldman Sachs Income Builder Fund provides exposure to the wealth-building opportunities of stocks and the regular income potential of bonds. The Fund invests in both equity and fixed income securities with a focus on yield enhancing strategies to earn a monthly income stream. The Fund seeks to maintain broad exposure to equities with lower than general equity market volatility.

We believe that similar themes can perform differently across asset classes. The Fund can potentially take advantage of these cross-asset class opportunities as it is a dynamic portfolio that allows the flexibility to allocate across equities and fixed income from a top-down perspective, given our views on macro opportunities and valuations.

In our risk management process, we identify, monitor and measure a fund’s risk profile. We consider the risk relative to the benchmark and the fund’s investment goal to seek income stability and capital growth.

The Fund’s portfolio comprises the ideas of two experienced Goldman Sachs investment groups:
Global Fundamental Equity Group: A group of investment professionals averaging over 17 years of investment experience and with a strong commitment to fundamental research.
Global Fixed Income Group: Broad, deep capabilities across global fixed income markets, with a total return investment philosophy.
3
PORTFOLIO RESULTS
Goldman Sachs Income Builder Fund
Investment Objective
The Goldman Sachs Income Builder Fund seeks to provide income and capital appreciation.
Portfolio Management Discussion and Analysis
Below, the Goldman Sachs Fundamental Equity Team and the Goldman Sachs Fixed Income Investment Management Team, collectively the Goldman Sachs Income Builder Team (the “Income Builder Team”), discuss the Goldman Sachs Income Builder Fund’s (the “Fund”) performance and positioning for the six-month period ended April 30, 2014 (the “Reporting Period”).
| Q | How did the Fund perform during the Reporting Period? |
| A | During the Reporting Period, the Fund’s Class A, B, C, Institutional and IR Shares generated cumulative total returns, without sales charges, of 5.70%, 5.34%, 5.32%, 5.89% and 5.83%, respectively. These returns compare to the 9.61% and 4.54% cumulative total returns of the Russell 1000® Value Index (with dividends reinvested) (the “Russell Index”) and the Bank of America Merrill Lynch BB to B U.S. High Yield Constrained Index (the “BofA Merrill Lynch Index”), respectively, during the same period. |
| Q | What economic and market factors most influenced the equity and fixed income markets as a whole during the Reporting Period? |
| A | When the Reporting Period began and through the end of 2013, the U.S. stock market continued to rally, reaching record highs during December 2013. Contributing to the strong performance of U.S. equities was the December announcement by the U.S. Federal Reserve (the “Fed”) that it would begin tapering its asset purchases in January 2014 — a signal of confidence in the U.S. economy. In the fixed income market, bond yields generally increased on improving economic data and the Fed’s taper announcement. |
| U. S. equities got off to a weak start in early 2014, but subsequently recovered, continuing to post fresh highs into April 2014 despite mixed news about the U.S. labor and housing markets as well as the broader U.S. economy. Many U. S. corporate earnings announcements reflected top-line growth, though overall management guidance for 2014 was less optimistic than consensus. In the fixed income market, bond yields declined overall as U.S. economic data weakened, primarily as a result of inclement winter weather. The Fed continued to reduce its asset purchases and suggested during March 2014 that it might adopt a more hawkish stance. That is, the Fed’s March 2014 policy announcements suggested a rate hike may come sooner than markets anticipated, possibly in mid-2015. At the same time, the Fed dropped the threshold of 6.5% unemployment as a condition for raising short-term interest rates. |
| Q | How did the Fund’s asset allocation affect performance during the Reporting Period? |
| A | As part of its principal investment strategies, the Fund has a baseline allocation of 60% to fixed income securities and 40% to equity securities, though in seeking to meet its investment objective, the Fund has the flexibility to opportunistically tilt the allocation to fixed income and equity securities up to 15% above or below that baseline allocation. The Fund seeks to provide a high and stable income stream with lower volatility than the equity market plus capital appreciation through investing in the highest conviction ideas of the Income Builder Team. Because of these stated goals of the Fund, the Income Builder Team believes the returns of the Russell Index and the BofA Merrill Lynch Index should be considered for reference only. |
At the beginning of the Reporting Period, the Fund was invested approximately 50% in equities and 48% in fixed income, with the balance in cash and cash equivalents. During the Reporting Period, the Fund’s allocation toward equities was trimmed to 47%, and its allocation to fixed income was increased to 52%, as the Income Builder Team sought to balance yield considerations and capital |
4
PORTFOLIO RESULTS
appreciation potential. Overall, this positioning had a positive impact on Fund performance during the Reporting Period. |
| Q | What was the Fund’s 12-month distribution rate during the Reporting Period? |
| A | The Fund seeks to provide investors with attractive and sustainable yield with lower volatility than the equity market by focusing its investments in fixed income securities and high dividend-paying equities, preferred equities and other similar securities (stocks). During the Reporting Period, the Fund’s Class A, B, C, Institutional and IR Shares provided attractive 12-month distribution rates of 3.60%, 2.88%, 2.97%, 3.90% and 3.77%, respectively. As of April 30, 2014, the Fund’s 30-day SEC yields (subsidized) for its Class A, B, C, Institutional and IR Shares were 2.97%, 2.39%, 2.40%, 3.54% and 3.39%, respectively. |
| Q | What key factors had the greatest impact on the performance of the Fund’s equity portfolio during the Reporting Period? |
| A | Relative to the Russell Index, stock selection had the greatest impact on the Fund’s equity portfolio during the Reporting Period. |
| Q | Which equity market sectors most significantly affected Fund performance during the Reporting Period? |
| A | During the Reporting Period, the Fund’s positioning in the consumer discretionary, consumer staples and utilities sectors detracted from its performance relative to the Russell Index. The Fund’s positioning in the health care, information technology and financials sectors contributed positively to its relative returns. |
| Q | Which stocks detracted significantly from the Fund’s relative performance during the Reporting Period? |
| A | The largest detractors from the Fund’s relative performance during the Reporting Period were utilities company FirstEnergy; Finnish tire manufacturer Nokian Renkaat Oyj; and fashion retailer L Brands. |
| FirstEnergy, a diversified utilities company primarily engaged in the generation and distribution of electricity in the Midwest and Mid-Atlantic regions of the United States, detracted most from the Fund’s returns during the Reporting Period. In our view, the stock had a strong dividend yield that was fully supported by its regulated power distribution business. However, its shares declined during the Reporting Period, as many investors seemed disappointed by the lack of improvement in competitive power prices. FirstEnergy also cut its quarterly dividend to be more in line with its peers. At the end of the Reporting Period, we believed competitive power prices were showing signs of stabilization. We also considered it positive that transmission capital expenditures could drive growth in FirstEnergy’s rate base through at least 2017. In addition, we believe the company is committed to growing its regulated earnings mix. |
| The Fund’s position in Nokian Renkaat Oyj dampened relative returns during the Reporting Period. Nokian Renkaat Oyj’s stock price declined amid rising concerns surrounding Russia’s involvement in Ukraine. Approximately 35% of the tire manufacturer’s sales and 80% of its production are in Russia. At the end of the Reporting Period, we did not expect the company’s sales to be significantly affected going forward, given that the season for selling winter tires is largely over. In addition, the depreciation of the Russian ruble appeared to be positive for Nokian Renkaat Oyj because it lowers the company’s production costs. |
L Brands, with subsidiaries that include Victoria’s Secret and Bath & Body Works, detracted from the Fund’s relative results during the Reporting Period. The company’s shares moved sharply lower after reporting same-store sales growth that was below consensus expectations in both November and December 2013. Despite such weakness, we were encouraged by the strength of L Brands’ U.S. business, and we believe many of the company’s brands resonate globally, which gives us a positive view of the company’s international business. We also have confidence in management’s disciplined approach towards future expansion. At the end of the Reporting Period, we maintained our positive outlook on the stock, based on our belief that long-term growth may be driven by the company’s continued growth in U.S. square footage, product expansion into natural adjacencies and international expansion. We also anticipate operating margin expansion through supply chain improvements. In our view, the company is also committed to returning excess free cash flow to shareholders through dividends and share repurchases. Indeed, during February 2014, L Brands |
5
PORTFOLIO RESULTS
announced a special dividend of $1.00 and raised its dividend by approximately 13%, sending its stock price sharply higher. |
| At the end of the Reporting Period, the Fund maintained its positions in all three stocks. |
| Q | Which stocks contributed significantly to the Fund’s relative performance during the Reporting Period? |
| A | During the Reporting Period, the Fund benefited most relative to the Russell Index from its positions in commercial mortgage real estate investment trust (REIT) Starwood Property Trust, diversified computer systems company Hewlett-Packard and insurance holding company Direct Line Insurance Group. |
| The Fund’s top contributor during the Reporting Period was Starwood Property Trust. In January 2014, Starwood Property Trust announced the spin-off of Starwood Waypoint Residential Trust (“Starwood Waypoint”), a wholly owned subsidiary that focuses on the single-family rental business. Investors appeared to view the spin-off as positive, and Starwood Property Trust’s stock price appreciated. On the distribution date, each shareholder of record received one Starwood Waypoint common share for every five shares of Starwood Property Trust common stock held on the record date. At the end of the Reporting Period, we continued to have a favorable view of select commercial mortgage REITs because we believe an improving U.S. economy could help demand, while supply remains in check in most areas. In addition, we believe Starwood Property Trust’s assets, which tend to be interest rate-sensitive, differentiate it from many other mortgage REITs and also increase the potential that Starwood Property Trust can benefit in a rising interest rate environment. We also continue to have confidence in management’s ability to source attractive loans. The Fund continued to hold the stock at the end of the Reporting Period. |
| Hewlett-Packard added to relative returns during the Reporting Period. Its stock traded up following the release of its fiscal first quarter 2014 earnings, which included better than expected top- and bottom-line results. In addition, the company provided guidance for its fiscal second quarter that was in line with expectations, while raising the low end of its full year targeted range for its earnings per share. Hewlett-Packard also surprised investors with strong commercial notebook sales and solid results in its enterprise business. In early 2014, reports that Hewlett-Packard was planning to re-nominate its entire board appeared to be viewed positively by the market. We originally purchased the stock at a discount, and at the end of the Reporting Period, its yield was approximately 2%. The Fund maintained a position in the stock at the end of the Reporting Period. |
| The Fund benefited from a position in an American Depositary Receipt (“ADR”) representing Direct Line Insurance Group. (An ADR is a negotiable security that represents securities of a non-U.S. company that trades in the U.S. financial markets.) Direct Line Insurance Group is a U.K.-based holding company that provides general insurance services and operates through five segments, including motor, home, rescue and other personal lines, commercial and international. Its share price traded higher at the end of November 2013 after it completed the sale of Direct Line Life Insurance Company Limited to fellow U.K. insurance company Chesnara. Proceeds of the sale were returned to shareholders in the form of a special dividend. After the sale, we continued to have a positive outlook on the company and its opportunity to improve profit margins. In addition, the ADR held by the Fund has an attractive yield, which we believe the company is capable of supporting in the months ahead. |
| Q | Did the equity portion of the Fund make any significant purchases or sales during the Reporting Period? |
| A | The Fund purchased telecommunication services giant Verizon Communications during the Reporting Period. Verizon Communications and its peers have been negatively impacted by changes in the upgrade policies of North American carriers. The company’s stock also came under pressure as a result of its 2014 free cash flow guidance, which we believe created a buying opportunity. We also believe Verizon Communications has some of the best assets in the telecommunications industry. In our opinion, the company’s top line and earnings per share can grow during the next few years. In addition, at end of the Reporting Period, the stock offered an attractive dividend yield. |
During the Reporting Period, the Fund initiated a position in The Gap, an apparel retail company with more 3,000 store locations. The Gap also has an accelerating e-commerce business, which we consider an important channel for retailers. In our view, The Gap is a high quality business led by a strong management team. We also believe the company’s share price did not fully reflect recent structural improvements wherein square footage was reduced by approximately 30%, putting the retailer in a position to accelerate growth domestically and expand its |
6
PORTFOLIO RESULTS
international presence. Additionally, in our opinion, The Gap stands to benefit from its strong inventory and supply chain management. Furthermore, we think the company could potentially increase shareholder value, as it recently participated in significant share repurchase activity. |
| The Fund exited its position in El Paso Pipeline Partners, LP during the Reporting Period. The master limited partnership (“MLP”) reported lower than expected distribution guidance at the end of 2013, which pushed down its share price. We reallocated the proceeds to MLP names in which we had higher conviction. |
| We eliminated the Fund’s position in MarkWest Energy Partners LP after the MLP reported lower than expected distribution guidance at the beginning of 2014, sending its stock lower. We reallocated the proceeds to MLP names that we viewed more favorably. |
| Q | What changes were made to the Fund’s equity weightings during the Reporting Period? |
| A | During the Reporting Period, we increased the Fund’s overweight relative to the Russell Index in the telecommunication services sector. We shifted the Fund from an underweight position in the financials sector to an overweight position. In addition, during the Reporting Period, we reduced the Fund’s overweighted position in the energy sector, and we increased its underweighted positions in the health care and industrials sectors. Compared to the Russell Index, at the end of the Reporting Period, the Fund was overweight the information technology, consumer discretionary and consumer staples sectors and was underweight the materials and utilities sectors. |
| Q | Which fixed income market sectors significantly affected the Fund’s performance during the Reporting Period? |
| A | Relative to the BofA Merrill Lynch Index, the Fund benefited from its holdings of investment grade corporate bonds and high yield corporate bonds in the commercial services and products industry and in the financial industry. In addition, the Fund’s credit quality positioning among corporate bonds — more specifically, its holdings of CCC-rated and B-rated securities — added to relative returns. |
| The Fund was hurt by its holdings of investment grade corporate bonds and high yield corporate bonds in the non-cellular telecommunications industry. |
| Q | How did the Fund’s duration and yield curve positioning strategies affect performance during the Reporting Period? |
| A | The Fund’s duration and yield curve positioning detracted from its results during the Reporting Period overall. Duration is a measure of the Fund’s sensitivity to changes in interest rates. Throughout the Reporting Period, the Fund held a short duration position relative to the BofA Merrill Lynch Index, which we tactically increased and decreased as we deemed necessary. The Fund was hurt by its short duration bias in January 2014 and April 2014 when U.S. Treasury prices increased. At the end of the Reporting Period, the Fund had a shorter duration bias than it did at the beginning of the Reporting Period because we believe U.S. interest rates should rise in response to the strengthening U.S. economy, a possible increase in inflation and potential changes in Fed monetary policy. |
| Q | What changes were made to the Fund’s fixed income weightings during the Reporting Period? |
| A | During the Reporting Period, we increased the Fund’s exposure to non-U.S. issuers because we see attractive investment opportunities outside of the U.S. |
| Q | How did the Fund use derivatives and similar instruments during the Reporting Period? |
| A | During the Reporting Period, the Income Builder Team did not use derivatives as part of its active management strategy within the equity portfolio. In the fixed income portfolio, the Fund used U.S. Treasury futures and Eurodollar futures to hedge and manage interest rate exposure and to facilitate specific duration and yield curve strategies. Eurodollar futures are contracts that have underlying assets linked to time deposits denominated in U.S. dollars at banks outside the U.S. The Fund also employed credit default swaps to implement specific credit-related investment strategies. It used forward foreign exchange contracts to hedge currency exposure. |
| Q | What is the Income Builder Team’s tactical view and strategy for the months ahead? |
| A | At the end of the Reporting Period, the Income Builder Team believed U.S. equities have further upside potential as the U.S. economy accelerates, with real earnings growth serving as a fundamental driver of performance. While we acknowledge that headwinds remain, such as geopolitical risks and political gridlock in Washington D.C., we believe |
7
PORTFOLIO RESULTS
there are ample tailwinds for U.S. equities, including the strengthening U.S. housing and employment markets. We believe U.S. corporate fundamentals are strong, evidenced by both healthy balance sheets and earnings resilience, which could provide companies with a number of ways to increase shareholder value. In addition, as the U.S. economy improves, we believe companies may potentially reinvest for future growth by increasing their capital expenditures, research and development, hiring and merger and acquisition activity, instead of keeping excess capital on their balance sheets. |
| Regardless of the direction of the U.S. equities market, our fundamental, bottom-up stock selection continues to drive our process, rather than headlines or sentiment. We maintain high conviction in the companies that we own and believe they have the potential to outperform relative to the broader market, whatever the growth environment. We maintain our disciplined approach, seeking to identify companies with strong or improving balance sheets, which are led by quality management teams. We continue to be focused on stocks trading at what we believe to be discounted valuations. At the end of the Reporting Period, we remained positive on financial companies that are improving returns on capital and those that could be beneficiaries of a rising rate environment. We also have a favorable view of high quality cyclical companies that have distinct growth opportunities and could benefit from a continued U.S. economic recovery. In addition, we remain constructive on the total return opportunity from dividend-paying technology stocks exposed to secular growth trends. We continue to find select non-U.S. common stocks attractive based on particular yield and valuation considerations. |
| Regarding the fixed income market, the Income Builder Team was concerned at the end of the Reporting Period that investors are too complacent about the situation in Ukraine and the potential for increased volatility stemming from geopolitical tensions. |
| Relative to high yield corporate bonds, the rally continued at the end of the Reporting Period, with the asset class benefiting from the strength of the U.S. Treasury market — as evidenced by the strong performance of higher credit quality securities. In addition, high yield corporate bond prices were supported by solid investment inflows. Going forward, continued strength in underlying credit fundamentals is likely, in our view, to help keep default rates near historic lows. At the end of the Reporting Period, we believe that low yields, upwardly trending interest rates and management teams’ increased willingness to engage in shareholder-friendly activities suggest high yield corporate bonds may experience more modest performance during 2014 than in recent time periods. |
| Within corporate credit, we see favorable trends among home builders and building products companies, as rising home prices have allowed for margin improvement and strengthening credit quality. We also continue to believe attractive income opportunities exist within consumer products names and in stable industries, such as cable, wireless and health care. In addition, we remain positive regarding the credit quality of banks given greater regulatory clarity, reasonable capital return programs and a lower probability for credit losses. |
8
FUND BASICS
Income Builder Fund
as of April 30, 2014
| PERFORMANCE REVIEW | ||||||||||||||
| November 1, 2013–April 30, 2014 | Fund Total Return (based on NAV)1 | Russell 1000 Value Index2 | BofA Merrill Lynch BB to B U.S. High Yield Constrained Index3 | |||||||||||
| Class A | 5.70 | % | 9.61 | % | 4.54 | % | ||||||||
| Class B | 5.34 | 9.61 | 4.54 | |||||||||||
| Class C | 5.32 | 9.61 | 4.54 | |||||||||||
| Institutional | 5.89 | 9.61 | 4.54 | |||||||||||
| Class IR | 5.83 | 9.61 | 4.54 | |||||||||||
| 1 | The net asset value (“NAV”) represents the net assets of the class of the Fund (ex-dividend) divided by the total number of shares of the class outstanding. The Fund’s performance assumes the reinvestment of dividends and other distributions. The Fund’s performance does not reflect the deduction of any applicable sales charges. |
| 2 | The Russell 1000 Value Index measures the performance of the large-cap value segment of the U.S. equity universe. It includes those Russell 1000 Index companies with lower price-to-book ratios and lower expected growth values. This index is constructed to provide a comprehensive and unbiased barometer for the large-cap value segment. The Index is completely reconstituted annually to ensure new and growing equities are included and that the represented companies continue to reflect value characteristics. |
| 3 | The BofA Merrill Lynch BB to B US High Yield Constrained Index contains all securities in The BofA Merrill Lynch US High Yield Index rated BB1 through B3, based on an average of Moody’s, S&P and Fitch, but caps issuer exposure at 2%. Index constituents are capitalization-weighted, based on their current amount outstanding, provided the total allocation to an individual issuer does not exceed 2%. Issuers that exceed the limit are reduced to 2% and the face value of each of their bonds is adjusted on a pro-rata basis. Similarly, the face values of bonds of all other issuers that fall below the 2% cap are increased on a pro-rata basis. In the event there are fewer than 50 issuers in the Index, each is equally weighted and the face values of their respective bonds are increased or decreased on a pro-rata basis. The Index figures do not include any deduction for fees, expenses or taxes. It is not possible to invest directly in an unmanaged index. |
The returns set forth in the tables above represent past performance. Past performance does not guarantee future results. The Fund’s investment return and principal value will fluctuate so that an investor’s shares, when redeemed, may be worth more or less than their original cost. Current performance may be lower or higher than the performance quoted above. Please visit our web site at www.GSAMFUNDS.com to obtain the most recent month-end returns. Performance reflects applicable fee waivers and/or expense limitations in effect during the periods shown. In their absence, performance would be reduced. Returns do not reflect the deduction of taxes that a shareholder would pay on Fund distributions or the redemption of Fund shares.
9
FUND BASICS
| PERFORMANCE REVIEW CONTINUED | ||||||||||||||
| November 1, 2013–April 30, 2014 | 12-Month Distribution Rate4 | 30-Day Standardized Subsidized Yield5 | 30-Day Standardized Unsubsidized Yield5 | |||||||||||
| Class A | 3.60 | % | 2.97 | % | 2.76 | % | ||||||||
| Class B | 2.88 | 2.39 | 2.18 | |||||||||||
| Class C | 2.97 | 2.40 | 2.18 | |||||||||||
| Institutional | 3.90 | 3.54 | 3.32 | |||||||||||
| Class IR | 3.77 | 3.39 | 3.17 | |||||||||||
| 4 | The 12 month distribution rate is calculated by taking the sum of all cash distributions over the past 12 months and dividing by the month end NAV in the last month of the period. Distributions may include interest from fixed income, dividends from equities, short term and long term capital gains, return of capital, and special distributions. Return of capital distribution may include a return of some or all of the money that an investor invested in Fund shares. Distributions from securities such as MLPs passing through the fund may also be characterized as return of capital. Special distributions may include any off-cycle distributions that occur outside of regular interest or dividend payment dates, such as when a company opts to pay a special dividend. The amounts and sources of distribution are not provided for tax reporting purposes. The Fund reports the character of distributions for federal income tax purposes each calendar year on Form 1099-DIV. Distributions will fluctuate over time and a large proportion of the distribution may occur at the end of the year in the form of capital gains. Distributions and market value movements affect the NAV of the fund and will also affect this calculation. 12 month distribution rate numbers are based on historical distributions and NAVs and are not predictive of future distributions or yields. 12 month distribution rate is calculated to provide a sense of the total cash flow associated with investment in the Fund, but should not be confused with SEC yield, dividend yield or interest yield. |
| 5 | The method of calculation of the 30-Day Standardized Subsidized Yield is mandated by the Securities and Exchange Commission and is determined by dividing the net investment income per share earned during the last 30 days of the period by the maximum public offering price (“POP”) per share on the last day of the period. This number is then annualized. The 30-Day Standardized Subsidized Yield reflects fee waivers and/or expense reimbursements recorded by the Fund during the period. Without waivers and/or reimbursements, yields would be reduced. This yield does not necessarily reflect income actually earned and distributed by the Fund and, therefore, may not be correlated with the dividends or other distributions paid to shareholders. The 30-Day Standardized Unsubsidized Yield does not adjust for any fee waivers and/or expense reimbursements in effect. If the Fund does not incur any fee waivers and/or expense reimbursements during the period, the 30-Day Standard Subsidized Yield and 30-Day Standardized Unsubsidized Yield will be identical. |
10
FUND BASICS
| STANDARDIZED TOTAL RETURNS6 | ||||||||||||||||
| For the period ended 3/31/14 | One Year | Five Years | Ten Years | Since Inception | Inception Date | |||||||||||
| Class A | 5.67 | % | 14.95% | 6.23% | 7.10 | % | 10/12/94 | |||||||||
| Class B | 5.73 | 15.13 | N/A | 6.10 | 5/1/96 | |||||||||||
| Class C | 9.89 | 15.38 | 6.04 | 4.35 | 8/15/97 | |||||||||||
| Institutional | 12.25 | 16.74 | 7.36 | 5.61 | 8/15/97 | |||||||||||
| Class IR | 12.02 | N/A | N/A | 13.70 | 8/31/10 | |||||||||||
| 6 | The Standardized Total Returns are average annual total returns as of the most recent calendar quarter-end. They assume reinvestment of all distributions at NAV. These returns reflect a maximum initial sales charge of 5.5% for Class A Shares, the assumed contingent deferred sales charge for Class B Shares (5% maximum declining to 0% after six years) and the assumed contingent deferred sales charge for Class C Shares (1% if redeemed within 12 months of purchase). Class B Shares convert to Class A Shares on or about the fifteenth day of the last month of the calendar quarter that is eight years after purchase. Returns for Class B Shares for the period after conversion reflect the performance of Class A Shares. Because Institutional and Class IR Shares do not involve a sales charge, such a charge is not applied to their Standardized Total Returns. The Fund’s Class B Shares are no longer available for purchase by new or existing shareholders (although current Class B shareholders may continue to reinvest income and capital gains distributions into Class B Shares, and Class B shareholders may continue to exchange their shares for Class B Shares of certain other Goldman Sachs Funds). |
The returns set forth in the table above represent past performance. Past performance does not guarantee future results. The Fund’s investment return and principal value will fluctuate so that an investor’s shares, when redeemed, may be worth more or less than their original cost. Current performance may be lower or higher than the performance quoted above. Please visit our web site at www.GSAMFUNDS.com to obtain the most recent month-end returns. Performance reflects applicable fee waivers and/or expense limitations in effect during the periods shown. In their absence, performance would be reduced. Returns do not reflect the deduction of taxes that a shareholder would pay on Fund distributions or the redemption of Fund shares.
| EXPENSE RATIOS7 | ||||||||||
| Net Expense Ratio (Current) | Gross Expense Ratio (Before Waivers) | |||||||||
| Class A | 0.95 | % | 1.27 | % | ||||||
| Class B | 1.70 | 2.03 | ||||||||
| Class C | 1.70 | 2.02 | ||||||||
| Institutional | 0.55 | 0.86 | ||||||||
| Class IR | 0.70 | 1.01 | ||||||||
| 7 | The expense ratios of the Fund, both current (net of applicable fee waivers and/or expense limitations) and before waivers (gross of applicable fee waivers and/or expense limitations) are as set forth above according to the most recent publicly available Prospectus for the Fund and may differ from the expense ratios disclosed in the Financial Highlights in this report. The Fund’s waivers and/or expense limitations will remain in place through at least February 28, 2015, and prior to such date the Investment Adviser may not terminate the arrangements without the approval of the Fund’s Board of Trustees. If these arrangements are discontinued in the future, the expense ratios may change without shareholder approval. |
11
FUND BASICS
| TOP TEN EQUITY HOLDINGS AS OF 4/30/148 | ||||||||
| Holding | % of Net Assets | Line of Business | ||||||
| General Electric Co. | 2.3 | % | Industrial Conglomerates | |||||
| JPMorgan Chase & Co. | 1.2 | Commercial Banks | ||||||
| Capital One Financial Corp. | 1.1 | Consumer Finance | ||||||
| Merck & Co., Inc. | 1.1 | Pharmaceuticals | ||||||
| Pfizer, Inc. | 1.1 | Pharmaceuticals | ||||||
| FirstEnergy Corp. | 1.0 | Electric Utilities | ||||||
| Ares Capital Corp. | 1.0 | Capital Markets | ||||||
| Total SA ADR | 0.9 | Oil, Gas & Consumable Fuels | ||||||
| Starwood Property Trust, Inc. | 0.9 | Real Estate Investment Trusts | ||||||
| Microsoft Corp. | 0.9 | Software | ||||||
| 8 | The top 10 holdings may not be representative of the Fund’s future investments. |
| FUND’S EQUITY SECTOR ALLOCATIONS VS. BENCHMARK9 |
| As of April 30, 2014 |
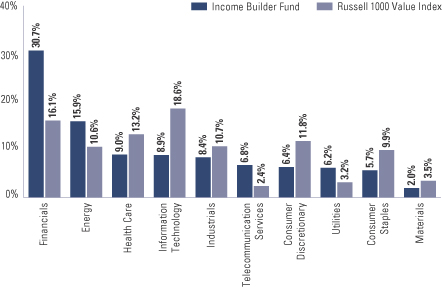
| 9 | The Fund is actively managed and, as such, its composition may differ over time. Consequently, the Fund’s overall sector allocations may differ from the percentages contained in the graph above. The graph categorizes investments using the Global Industry Classification Standard (“GICS”), however, the sector classifications used by the portfolio management team may differ from GICS. The percentage shown for each investment category reflects the value of investments in that category as a percentage of the total value of the Fund’s equity investments. The graph depicts the Fund’s investments but may not represent the Fund’s market exposure due to the exclusion of certain derivatives, if any, as listed in the Additional Investment Information section of the Schedule of Investments. |
12
FUND BASICS
| FUND’S FIXED INCOME FUND COMPOSITION10 |
| As of April 30, 2014 |
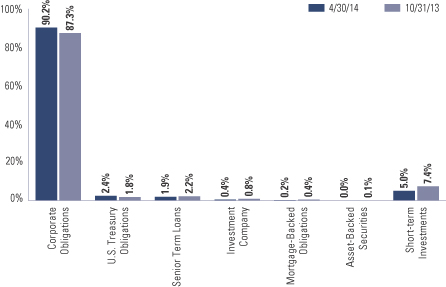
| 10 | The percentage shown for each investment category reflects the value of investments in that category as a percentage of the Fund’s fixed income investments. Short-term investments represent repurchase agreements. The graph depicts the Fund’s investments but may not represent the Fund’s market exposure due to the exclusion of certain derivatives, if any, as listed in the Additional Investment Information section of the Schedule of Investments. |
13
PORTFOLIO RESULTS
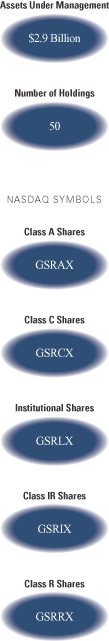
Goldman Sachs Rising Dividend Growth Fund
Investment Objective
The Fund seeks long-term growth of capital and current income.
Portfolio Management Discussion and Analysis
Below, the Dividend Assets Capital portfolio management team, the Fund’s sub-adviser, discusses the Goldman Sachs Rising Dividend Growth Fund’s (the “Fund”) performance and positioning for the six-month period ended April 30, 2014 (the “Reporting Period”).
| Q | How did the Fund perform during the Reporting Period? |
| A | During the Reporting Period, the Fund’s Class A, C, Institutional, IR and R Shares generated cumulative total returns, without sales charges, of 7.33%, 6.89%, 7.55%, 7.42% and 7.17%, respectively. These returns compare to the 8.36% cumulative total return of the Fund’s benchmark, the Standard & Poor’s® 500 Index (with dividends reinvested) (the “S&P 500 Index”), during the same time period. |
| Q | What economic and market factors most influenced the equity markets as a whole during the Reporting Period? |
| A | The performance of the U.S. equity markets during the Reporting Period was a tale of two markets. During the first two months of the Reporting Period, the S&P 500 Index was up 4.42%. During the last four months of the Reporting Period, the S&P 500 Index was up just 2.56%. |
| In our view, there was no single event that caused the slowdown in the last four months of the Reporting Period, but the list of concerns that were evident in late 2013, largely ignored for the year as a whole, became more pronounced in 2014. Further, with the S&P 500 Index up so strongly in calendar year 2013, some investors may have simply been taking some gains in the early months of 2014. |
| Clearly, one factor impacting the U.S. equity markets was a long list of geopolitical issues that paraded across the world stage during the Reporting Period, including political hotspots such as Russia, Ukraine and elsewhere, as heightened tensions and worries around potential sanctions imposed and/or possible military actions taken by the West weighed on investor sentiment. |
| Economic growth around the world remained subpar. The U.S., for example, produced Gross Domestic Product (“GDP”) for the first quarter of 2014 of only 0.1%, according to the “advance” estimate released by the Bureau of Economic Analysis (“advance estimate”). The harsh winter weather has been blamed for much of the poor result. It is possible, we believe, that monthly data received late in the first calendar quarter and not available for the advance estimate may cause the next estimate for U.S. GDP to be revised up. That said, early in the first calendar quarter, a number of data reports were erratic, probably affected by the harsh weather. For example, various measures of housing activity showed signs of weakening. However, as the weather turned more spring-like, employment numbers indicated strength, as evidenced by April 2014’s 288,000 addition to non-farm payrolls. Also, motor vehicle sales for April 2014 were 16.0 million on a seasonally adjusted annual rate for the second month in a row. |
The role of the Federal Reserve (the “Fed”) in the economy continued to be accommodative during the Reporting Period. |
14
PORTFOLIO RESULTS
The transition from the Bernanke-led Fed to new chair Janet Yellen was accomplished without upsetting either the fixed income or the equity markets. The tapering of purchases of mortgage-backed securities and long-term U.S. Treasuries, which began in January 2014 and continued each month of 2014 to date, also took place without major upset of either asset class market. The Fed continued to work on its twin objectives of lower unemployment and somewhat higher inflation. |
| Q | What key factors were responsible for the Fund’s performance during the Reporting Period? |
| A | The Fund generated solid absolute gains but underperformed the S&P 500 Index. The detracting impact of having an average 3.9% position in cash during a Reporting Period when the S&P 500 Index rose more than offset the positive contribution made by effective equity positioning overall and by its positioning in the energy sector in particular, the majority of which was achieved via energy-related Master Limited Partnerships (“MLPs”). |
| Q | Which equity market sectors most significantly affected Fund performance? |
| A | As indicated earlier, cash was a significant negative affecting Fund performance during the Reporting Period. Of the sectors within the S&P 500 Index, the largest detractors were materials, financials and information technology, in each case due primarily to stock selection. Having an underweighted allocation to information technology, which outpaced the S&P 500 Index during the Reporting Period, also hurt. It is worth noting that in financials, strong returns in the S&P 500 Index were mostly due to banks and real estate companies, which typically do not have 10-year consecutive dividend growth rates at averages of 10% per year. The Fund’s strategy of only buying the stocks of companies where the dividend has increased every year for at least ten years at an average rate of approximately 10% per year1 thus limited the Fund’s selections within the financials sector. Similarly, in information technology, strong performance in the S&P 500 Index was mostly driven by no-yield/high growth names in which the Fund can not participate. |
| Partially offsetting these detractors were the positive contributions made by positioning in the energy, health care and telecommunication services sectors. In energy, effective stock selection along with an overweighted allocation to the strongly performing sector contributed positively to Fund results. The Fund’s energy sector holdings were primarily comprised of MLPs, which are not components of the S&P 500 Index but which, as measured by the Alerian MLP Index, outperformed the S&P 500 Index during the Reporting Period. We placed a focus on U.S.-concentrated energy midstream companies based on our view they would perform well as demand for energy increases. (The midstream component of the energy industry is usually defined as those companies providing products or services that help link the supply side, i.e. energy producers, and the demand side, i.e. energy end-users, for any type of energy commodity. Such midstream business can include, but are not limited to, those that process, store, market and transport various energy commodities.) Indeed, North America experienced extreme winter weather from December 2013 through April 2014 that boosted demand for energy as did geopolitical tension between Ukraine and Russia and unrest in the Middle East. During the Reporting Period, West Texas Intermediate (“WTI”) crude oil prices rose 5.42% to end April 2014 at $99.74. Brent crude oil prices rose 2.04% during the same timeframe to end the Reporting Period at $108.07 per barrel, and Henry Hub natural gas prices soared 37.06% during the same timeframe to end the Reporting Period at $4.82 per million British thermal units (“BTUs”). (Henry Hub is a natural gas pipeline located in Erath, Louisiana that serves as the official delivery location for futures contracts on the New York Mercantile Exchange (“NYMEX”). The Henry Hub is owned by Sabine Pipe Line LLC and has access to many of the major gas markets in the United States. As of June 2007, the hub connects to four intrastate and nine interstate pipelines, including the Transcontinental, Acadian and Sabine pipeline. The settlement prices at the Henry Hub are used as benchmarks for the entire North American natural gas market.) |
| In health care, effective stock selection more than offset the detracting impact of the Fund’s underweight position in the strongly performing sector. The health care sector’s performance was mostly driven by improved revenue growth in the large pharmaceutical industry. The Fund had no exposure to the telecommunication services sector, and the sector significantly underperformed the S&P 500 Index during the Reporting Period. As the 10-year U.S. Treasury yield moved higher and the Fed continued tapering its monthly asset purchase program, investors appeared willing to take more risks and exited the traditionally defensive telecommunication services sector. |
| 1 | Dividends are not guaranteed and a company’s future ability to pay dividends may be limited. |
15
PORTFOLIO RESULTS
| Q | Which stocks detracted significantly from the Fund’s performance during the Reporting Period? |
| A | Detracting most from the Fund’s results relative to its benchmark index were positions in natural gas processor Markwest Energy Partners LP, natural gas transportation and terminaling facilities operator El Paso Pipeline Partners LP and industry supply distributor WW Grainger. |
| Markwest Energy Partners LP reaffirmed its 2014 guidance on distributable cash flow and increased its fee-based revenue expectation, but its unit price moved lower due to concern about its operational constraints and soft Southwest results. |
| Despite lower year over year maintenance expenditures, El Paso Pipeline Partners LP’s coverage ratio dropped during the Reporting Period. (Coverage ratio is a measure of a company’s ability to meet its financial obligations. In broad terms, the higher the coverage ratio, the better the ability of the enterprise to fulfill its obligations to its lenders.) Its near-term headwinds are related to adverse settlements and a lack of immediate organic growth projects. Further, after growing its distributions at an average annual rate of 16% over the past five years, its new distribution growth rate is projected to be only about 5% in 2014. Also, rate cases at a couple of its subsidiaries caused downward pressure on its stock price. We sold the Fund’s position in El Paso Pipeline Partners LP in mid-December 2013. |
| The harsh winter in North America impacted WW Grainger’s monthly sales particularly hard, as weather-related disruptions resulted in facility closures. Nearly 90% of the company’s sales are generated in the U.S. and Canada. Despite these difficulties, WW Grainger continued to realize price benefits and continued to execute product line expansion, further mature its e-commerce and improve customer experience. As of the end of 2013, WW Grainger had increased its dividends for 42 consecutive years and was among an elite 3% of S&P 500 Index companies that have increased its dividend each year for more than four decades. |
| Q | What were some of the Fund’s best-performing individual stocks? |
| A | The top contributors to the Fund’s relative performance during the Reporting Period were pharmaceuticals company Novo Nordisk and midstream natural gas companies EQT Midstream Partners LP and Energy Transfer Equity LP. |
| Novo Nordisk remained committed to returning excess cash to shareholders through dividend increases and share buybacks despite the Food and Drug Administration’s (“FDA”) rejection of the company’s new insulin drug Tresiba and its demand for more study on heart risk of the product. Novo Nordisk is the world leader in diabetes care, holding a global value market share of approximately 27% and also has one of the highest gross margins among its European Union large pharmaceuticals peers. Novo Nordisk announced it expected to have interim data on the cardiovascular outcomes trial for Tresiba in mid-2015, one year earlier than previously expected. At the end of 2013, Novo Nordisk split its stock five for one and gave shareholders a 25% dividend increase. At the beginning of 2014, the company announced it would reduce its share count by 3.6% through a share repurchase program. |
| EQT Midstream Partners LP performed well during the Reporting Period. The MLP has no debt on its balance sheet, and 80% of its revenue was being generated by fee-based long-term contracts. Its unit price strength continued, as the MLP generated 22% 3-year adjusted earnings before interest, taxes, depreciation and amortization (“EBITDA”) growth and guided 29% distribution growth for 2014 over 2013 and 22% distribution growth for 2015 over 2014 (not assuming any additional acquisitions). |
| Shares of Energy Transfer Equity LP rose during the Reporting Period on strong unit price appreciation, as the MLP announced its sixth consecutive quarterly cash distribution increase. |
| Q | How did the Fund use derivatives during the Reporting Period? |
| A | The Fund did not use derivatives during the Reporting Period. |
| Q | Did the Fund make any significant purchases or sales during the Reporting Period? |
| A | We initiated a Fund position in luxury jewelry store operator Tiffany & Co. during the Reporting Period. Our bullish view of high-end consumers’ spending power led us to search for names with strong brand recognition and the potential to participate in the global growth of the high-end jewelry market. In our view, Tiffany & Co. fit what we were looking for. As the costs of precious diamonds and metals appear to be retreating from their highs, we anticipate multi-year margin expansion for Tiffany & Co. The company has strong brand pricing power in a fragmented jewelry and specialty market, and despite a tough selling environment in recent |
16
PORTFOLIO RESULTS
years, it has seen a rebound with steady sales increases. We believe Tiffany & Co.’s focus on organic geographic expansion in low penetration markets, such as greater China, along with much anticipated new jewelry designs being rolled out in 2014, create an opportunity for an attractive long-term earnings per share growth rate. |
| We established a Fund position in aerospace and defense parts provider United Technologies. Based on our expectations for continued North American economic recovery, flat to moderate economic growth in the European Union and steady economic growth in China, we are positive in our view for cyclical industries. In turn, we see the potential for United Technologies to move to a premium valuation compared to the market and its peer group. We believe the fiscal year 2014 outlook for United Technologies’ risk profile seems substantially reduced by a well-positioned pension status, strong order momentum across its business segments and better than expected synergies from its Goodrich and IAE acquisitions. In our view, United Technologies’ strong balance sheet, positive cash flow and conversion rate allow the company to not only focus on research and development but also on shareholder returns through dividends, buybacks and debt reduction. |
| We initiated a Fund position in NGL Energy Partners LP in search of higher distribution growth midstream MLPs. NGL Energy Partners LP is a diversified midstream growth MLP offering stable cash flow, an attractive yield and potential to grow its distribution, in our view. Since its initial public offering in May 2011, the MLP has acquired and integrated 26 companies totaling $2.9 billion, while at the same time increasing its distribution every quarter at a compound annual growth rate of 21%. We believe NGL Energy Partners LP offers favorable growth potential in the water treatment, crude oil, propane and natural gas liquids businesses with strong geographic diversification, including coast-to-coast rail, terminal and retail operations. |
| In addition to those sales already mentioned, we sold the Fund’s position in mining industry safety products manufacturer MSA Safety during the Reporting Period. Having invested in MSA Safety since February 2011, we believe our investment thesis played out as expected. Its stock appreciated at an annual rate of more than 18%. MSA Safety was one of the few mid-capitalization stocks among our holdings with significant liquidity constraints, and our decision to exit the position was primarily based on what we considered to be increasing liquidity risks outweighing further appreciation potential. |
| We sold the Fund’s position in medical equipment manufacturer Danaher, taking profits. In our view, Danaher offers a less cyclical profile compared to its industrial peer group, primarily due to its diversified products offering. As Danaher failed to meet the qualifications of our investment criteria by failing to increase its quarterly dividend in December 2013, we exited the position. |
| Q | Were there any notable changes in the Fund’s weightings during the Reporting Period? |
| A | The most significant change we made during the Reporting Period was increasing the Fund’s allocation relative to the S&P 500 Index in the consumer discretionary sector. |
| Q | How was the Fund positioned relative to its benchmark index at the end of the Reporting Period? |
| A | At the end of April 2014, the Fund had overweighted positions relative to the S&P 500 Index in energy (mostly MLPs), materials, consumer discretionary, consumer staples and industrials. On the same date, the Fund had underweighted positions compared to the S&P 500 Index in health care and financials. The Fund had no exposure to the utilities and telecommunication services sectors at the end of the Reporting Period. |
| Q | What is the Fund’s tactical view and strategy for the months ahead? |
| A | At the end of the Reporting Period, we believed continued economic recovery was the theme for 2014, despite a weak first quarter U.S. GDP, based on positive economic data releases that supported a view of pent-up demand following disruption from a particularly harsh winter. Indeed, at the end of the Reporting Period, economists still projected 2.7% GDP growth for the U.S. in 2014 compared to 1.9% GDP growth in 2013; European GDP growth of 1.1% in 2014 compared to two consecutive years of contraction; and world GDP growth of 2.79% in 2014 compared to 2.06% in 2013. Should the global economy gradually improve, we believe such growth will likely be countered by low but gradually rising interest rates, which could lead to positive but volatile equity market returns. Given our view, we believe dividend growth stocks supported by strong balance sheets and growing businesses should perform well going forward. We particularly believe economic upside may come from improvement in disposable income, recovery of housing values, improvement in commercial construction, strength in industrial and manufacturing activities and an ongoing U.S. energy renaissance. In turn, we favored dividend growth stocks in the consumer discretionary, materials and industrials sectors at the end of the Reporting Period. |
17
PORTFOLIO RESULTS
| Similarly, we are constructive in our view for higher distribution growth energy MLPs that have reduced commodity exposure and strong drop down potential from their sponsor. (Drop down refers to the act of a parent company selling MLP-qualified assets to the associated MLP with favorable terms. Once an MLP is spun off from its integrated parent company, additional assets may be placed into the MLP to increase the capital base. Other drop downs may occur when the General Partner acquires another company with certain assets more suitable for the MLP than its own balance sheet.) Our emphasis is on those MLPs with attractive fee based revenue, long-term contracts and adequate access to capital markets. At the end of the Reporting Period, we preferred crude oil, refined products and natural gas liquid logistics MLPs. We also preferred gathering and processing MLPs focused on higher economic return basins, such as the liquid-rich Eagle Ford and Bakken basins, the Niobara-Wattenberg field and the Marcellus shale. |
| Factors that might impact our strategy include any sudden deterioration of the economy, or any sudden hike in interest rates due to high inflation, either of which could reverse secular bull market sentiment and result in a multi-year correction. Geopolitical risk or a negative regulatory environment could impact the supply/demand balance in the energy sector, thus resulting in price pressures on commodities, including oil and gas. |
| As always, we continue to monitor domestic and global economies, geopolitical factors, interest rates and equity market fundamentals as we actively manage the Fund, with a focus on income through quality in an effort to offer investors the potential for rising income and competitive total returns with lower volatility. |
18
FUND BASICS
Rising Dividend Growth Fund
as of April 30, 2014
| PERFORMANCE REVIEW | ||||||||||
| November 1, 2013–April 30, 2014 | Fund Total Return (based on NAV)1 | S&P 500 Index2 | ||||||||
| Class A | 7.33 | % | 8.36 | % | ||||||
| Class C | 6.89 | 8.36 | ||||||||
| Institutional | 7.55 | 8.36 | ||||||||
| Class IR | 7.42 | 8.36 | ||||||||
| Class R | 7.17 | 8.36 | ||||||||
| 1 | The net asset value (“NAV”) represents the net assets of the class of the Fund (ex-dividend) divided by the total number of shares of the class outstanding. The Fund’s performance reflects the reinvestment of dividends and other distributions. The Fund’s performance does not reflect the deduction of any applicable sales charges. |
| 2 | The S&P 500 Index is the Standard & Poor’s 500 Composite Index of 500 stocks, an unmanaged index of common stock prices. The Index figures do not reflect any deduction for fees, expenses or taxes. It is not possible to invest directly in an index. |
| STANDARDIZED TOTAL RETURNS3 | ||||||||||||||||
| For the period ended 3/31/14 | One Year | Five Years | Ten Years | Since Inception | Inception Date | |||||||||||
| Class A | 12.52 | % | 17.61% | 8.13% | 8.26 | % | 3/23/04 | |||||||||
| Class C | 17.20 | 18.35 | N/A | 8.61 | 4/14/05 | |||||||||||
| Institutional | 19.54 | 19.47 | N/A | 8.81 | 3/21/07 | |||||||||||
| Class IR | 19.32 | N/A | N/A | 15.64 | 2/27/12 | |||||||||||
| Class R | 18.79 | N/A | N/A | 15.09 | 2/27/12 | |||||||||||
| 3 | The Standardized Total Returns are average annual total returns as of the most recent calendar quarter-end. They assume reinvestment of all distributions at NAV. Effective February 27, 2012, the Rising Dividend Growth Fund, a series of Dividend Growth Trust (the “Predecessor Fund”), was reorganized into the Fund. As accounting successor to the Predecessor Fund, the Fund has assumed the Predecessor Fund’s historical performance. These returns reflect a maximum initial sales charge of 5.5% for Class A Shares and the assumed contingent deferred sales charge for Class C Shares (1% if redeemed within 12 months of purchase). Prior to February 27, 2012 (the effective date of the reorganization of the Predecessor Fund into the Fund), the maximum initial sales charge applicable to sales of Class A Shares of the Predecessor Fund was 5.75%, which is not reflected in the average annual total return figures shown. Because Institutional, Class IR and Class R Shares do not involve a sales charge, such a charge is not applied to their Standardized Total Returns. |
The returns set forth in the tables above represent past performance. Past performance does not guarantee future results. The Fund’s investment return and principal value will fluctuate so that an investor’s shares, when redeemed, may be worth more or less than their original cost. Current performance may be lower or higher than the performance quoted above. Please visit our web site at www.GSAMFUNDS.com to obtain the most recent month-end returns. Performance reflects applicable fee waivers and/or expense limitations in effect during the periods shown. In their absence, performance would be reduced. Returns do not reflect the deduction of taxes that a shareholder would pay on Fund distributions or the redemption of Fund shares.
19
FUND BASICS
| EXPENSE RATIOS4 | ||||||||||
| Net Expense Ratio (Current) | Gross Expense Ratio (Before Waivers) | |||||||||
| Class A | 1.18 | % | 1.21 | % | ||||||
| Class C | 1.93 | 1.96 | ||||||||
| Institutional | 0.78 | 0.81 | ||||||||
| Class IR | 0.93 | 0.96 | ||||||||
| Class R | 1.42 | 1.45 | ||||||||
| 4 | The expense ratios of the Fund, both current (net of applicable fee waivers and/or expense limitations) and before waivers (gross of applicable fee waivers and/or expense limitations) are as set forth above according to the most recent publicly available Prospectus for the Fund and may differ from the expense ratios disclosed in the Financial Highlights in this report. The Fund’s waivers and/or expense limitations will remain in place through at least February 28, 2015, and prior to such date the Investment Adviser may not terminate the arrangements without the approval of the Fund’s Board of Trustees. If these arrangements are discontinued in the future, the expense ratios may change without shareholder approval. |
| TOP TEN HOLDINGS AS OF 4/30/145 | ||||||||
| Holding | % of Net Assets | Line of Business | ||||||
| VF Corp. | 3.1 | % | Textiles, Apparel & Luxury Goods | |||||
| EOG Resources, Inc. | 2.9 | Oil, Gas & Consumable Fuels | ||||||
| Roche Holding AG ADR | 2.9 | Pharmaceuticals | ||||||
| Perrigo Co. PLC | 2.9 | Pharmaceuticals | ||||||
| The Sherwin-Williams Co. | 2.8 | Chemicals | ||||||
| Cardinal Health, Inc. | 2.6 | Health Care Providers & Services | ||||||
| Roper Industries, Inc. | 2.6 | Industrial Conglomerates | ||||||
| PepsiCo., Inc. | 2.6 | Beverages | ||||||
| Monsanto Co. | 2.5 | Chemicals | ||||||
| Polaris Industries, Inc. | 2.5 | Leisure Equipment & Products | ||||||
| 5 | The top 10 holdings may not be representative of the Fund’s future investments. |
20
FUND BASICS
| FUND VS. BENCHMARK SECTOR ALLOCATION6 |
| As of April 30, 2014 |
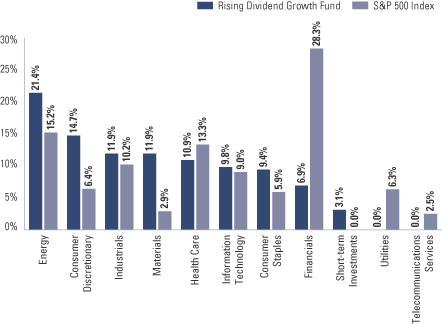
| 6 | The Fund is actively managed and, as such, its composition may differ over time. Consequently, the Fund’s overall sector allocations may differ from the percentages contained in the graph above. The graph categorizes investments using the Global Industry Classification Standard (“GICS”), however, the sector classifications used by the portfolio management team may differ from GICS. The percentage shown for each investment category reflects the value of investments in that category as a percentage of the total value of the Fund’s equity investments. The graph depicts the Fund’s investments but may not represent the Fund’s market exposure due to the exclusion of certain derivatives, if any, as listed in the Additional Investment Information section of the Schedule of Investments. |
21
GOLDMAN SACHS INCOME BUILDER FUND
Schedule of Investments
April 30, 2014 (Unaudited)
| Shares | Description | Value | ||||||
| Common Stocks – 45.4% | ||||||||
| Aerospace & Defense – 0.6% | ||||||||
| 62,284 | The Boeing Co. | $ | 8,035,882 | |||||
|
| |||||||
| Auto Components – 0.5% | ||||||||
| 363,161 | Nokian Renkaat OYJ ADR | 7,219,641 | ||||||
|
| |||||||
| Automobiles – 0.4% | ||||||||
| 145,772 | Bayerische Motoren Werke AG ADR | 6,083,066 | ||||||
|
| |||||||
| Beverages – 0.7% | ||||||||
| 38,486 | Anheuser-Busch InBev NV ADR | 4,072,588 | ||||||
| 61,392 | PepsiCo, Inc. | 5,272,959 | ||||||
|
| |||||||
| 9,345,547 | ||||||||
|
| |||||||
| Capital Markets – 2.1% | ||||||||
| 353,150 | AllianceBernstein Holding LP | 8,980,605 | ||||||
| 66,111 | Ameriprise Financial, Inc. | 7,379,971 | ||||||
| 790,744 | Ares Capital Corp. | 13,577,074 | ||||||
|
| |||||||
| 29,937,650 | ||||||||
|
| |||||||
| Chemicals – 0.4% | ||||||||
| 4,045 | Ashland, Inc. | 390,747 | ||||||
| 81,924 | Celanese Corp. Series A | 5,032,591 | ||||||
|
| |||||||
| 5,423,338 | ||||||||
|
| |||||||
| Commercial Banks – 2.8% | ||||||||
| 240,974 | Australia & New Zealand Banking Group Ltd. ADR | 7,730,446 | ||||||
| 170,204 | HSBC Holdings PLC ADR | 8,734,869 | ||||||
| 312,013 | JPMorgan Chase & Co. | 17,466,488 | ||||||
| 43,057 | M&T Bank Corp. | 5,253,385 | ||||||
|
| |||||||
| 39,185,188 | ||||||||
|
| |||||||
| Commercial Services & Supplies – 0.6% | ||||||||
| 202,519 | Waste Management, Inc. | 9,001,970 | ||||||
|
| |||||||
| Communications Equipment – 1.5% | ||||||||
| 372,091 | Cisco Systems, Inc. | 8,599,023 | ||||||
| 82,676 | QUALCOMM, Inc. | 6,507,428 | ||||||
| 470,207 | Telefonaktiebolaget LM Ericsson ADR | 5,637,782 | ||||||
|
| |||||||
| 20,744,233 | ||||||||
|
| |||||||
| Computers & Peripherals – 1.5% | ||||||||
| 11,085 | Apple, Inc. | 6,541,148 | ||||||
| 220,448 | EMC Corp. | 5,687,558 | ||||||
| 266,881 | Hewlett-Packard Co. | 8,823,086 | ||||||
|
| |||||||
| 21,051,792 | ||||||||
|
| |||||||
| Consumer Finance – 1.6% | ||||||||
| 162,442 | Capital One Financial Corp. | 12,004,464 | ||||||
| 404,066 | SLM Corp. | 10,404,699 | ||||||
|
| |||||||
| 22,409,163 | ||||||||
|
| |||||||
| Containers & Packaging – 0.6% | ||||||||
| 123,590 | Packaging Corp. of America | 8,234,802 | ||||||
|
| |||||||
| Common Stocks – (continued) | ||||||||
| Diversified Telecommunication Services – 2.0% | ||||||||
| 291,108 | AT&T, Inc. | $ | 10,392,555 | |||||
| 333,097 | Telefonica SA ADR | 5,579,375 | ||||||
| 256,012 | Verizon Communications, Inc. | 11,963,441 | ||||||
|
| |||||||
| 27,935,371 | ||||||||
|
| |||||||
| Electric Utilities – 2.0% | ||||||||
| 115,811 | Edison International | 6,550,270 | ||||||
| 418,723 | FirstEnergy Corp. | 14,131,901 | ||||||
| 81,151 | NextEra Energy, Inc. | 8,102,928 | ||||||
|
| |||||||
| 28,785,099 | ||||||||
|
| |||||||
| Energy Equipment & Services – 0.4% | ||||||||
| 180,448 | Seadrill Partners LLC | 5,606,519 | ||||||
|
| |||||||
| Food & Staples Retailing – 0.4% | ||||||||
| 73,264 | Wal-Mart Stores, Inc. | 5,839,873 | ||||||
|
| |||||||
| Food Products – 0.7% | ||||||||
| 308,030 | ConAgra Foods, Inc. | 9,397,995 | ||||||
|
| |||||||
| Health Care Providers & Services – 0.5% | ||||||||
| 113,540 | Cardinal Health, Inc. | 7,892,165 | ||||||
|
| |||||||
| Hotels, Restaurants & Leisure – 0.3% | ||||||||
| 63,302 | Starwood Hotels & Resorts Worldwide, Inc. | 4,852,098 | ||||||
|
| |||||||
| Household Products – 0.7% | ||||||||
| 114,185 | The Procter & Gamble Co. | 9,425,972 | ||||||
|
| |||||||
| Industrial Conglomerates – 2.3% | ||||||||
| 1,204,649 | General Electric Co. | 32,393,012 | ||||||
|
| |||||||
| Insurance – 3.5% | ||||||||
| 167,948 | Arthur J. Gallagher & Co. | 7,561,019 | ||||||
| 462,696 | Direct Line Insurance Group PLC ADR | 7,958,371 | ||||||
| 37,489 | Everest Re Group Ltd. | 5,924,387 | ||||||
| 156,387 | MetLife, Inc. | 8,186,859 | ||||||
| 102,440 | Prudential Financial, Inc. | 8,264,859 | ||||||
| 198,725 | Validus Holdings Ltd. | 7,366,736 | ||||||
| 145,939 | Zurich Insurance Group AG ADR | 4,197,206 | ||||||
|
| |||||||
| 49,459,437 | ||||||||
|
| |||||||
| Machinery – 0.6% | ||||||||
| 85,051 | Caterpillar, Inc. | 8,964,375 | ||||||
|
| |||||||
| Media – 0.5% | ||||||||
| 82,583 | Viacom, Inc. Class B | 7,017,903 | ||||||
|
| |||||||
| Multi-Utilities – 0.4% | ||||||||
| 130,557 | PG&E Corp. | 5,950,788 | ||||||
|
| |||||||
| Oil, Gas & Consumable Fuels – 7.4% | ||||||||
| 109,038 | BP PLC ADR | 5,519,504 | ||||||
| 130,170 | Chesapeake Energy Corp. | 3,742,387 | ||||||
| 152,736 | DCP Midstream Partners LP | 8,171,376 | ||||||
| 135,975 | Devon Energy Corp. | 9,518,250 | ||||||
| 171,074 | Energy Transfer Partners LP | 9,441,574 | ||||||
|
| |||||||
| 22 | The accompanying notes are an integral part of these financial statements. |
GOLDMAN SACHS INCOME BUILDER FUND
| Shares | Description | Value | ||||||
| Common Stocks – (continued) | ||||||||
| Oil, Gas & Consumable Fuels – (continued) | ||||||||
| 80,572 | Enterprise Products Partners LP | $ | 5,892,230 | |||||
| 55,112 | Exxon Mobil Corp. | 5,644,020 | ||||||
| 175,022 | NGL Energy Partners LP | 6,768,101 | ||||||
| 72,891 | ONEOK Partners LP | 4,154,058 | ||||||
| 113,759 | Plains All American Pipeline LP | 6,347,752 | ||||||
| 225,025 | Regency Energy Partners LP | 6,129,681 | ||||||
| 37,641 | Rose Rock Midstream LP | 1,569,630 | ||||||
| 90,334 | Spectra Energy Partners LP | 4,918,686 | ||||||
| 141,689 | Targa Resources Partners LP | 8,389,406 | ||||||
| 39,242 | TC Pipelines LP | 2,081,396 | ||||||
| 67,143 | Teekay LNG Partners LP | 2,874,392 | ||||||
| 183,985 | Total SA ADR | 13,107,091 | ||||||
|
| |||||||
| 104,269,534 | ||||||||
|
| |||||||
| Pharmaceuticals – 3.9% | ||||||||
| 178,504 | Eli Lilly & Co. | 10,549,587 | ||||||
| 272,606 | Merck & Co., Inc. | 15,963,807 | ||||||
| 80,583 | Novartis AG ADR | 7,005,886 | ||||||
| 475,261 | Pfizer, Inc. | 14,866,164 | ||||||
| 117,026 | Sanofi ADR | 6,295,999 | ||||||
|
| |||||||
| 54,681,443 | ||||||||
|
| |||||||
| Real Estate Investment Trusts – 2.3% | ||||||||
| 48,282 | AvalonBay Communities, Inc. | 6,592,907 | ||||||
| 11,135 | Simon Property Group, Inc. | 1,928,582 | ||||||
| 510,974 | Starwood Property Trust, Inc. | 12,288,925 | ||||||
| 1,108,038 | Two Harbors Investment Corp. | 11,501,434 | ||||||
|
| |||||||
| 32,311,848 | ||||||||
|
| |||||||
| Semiconductors & Semiconductor Equipment – 0.2% | ||||||||
| 72,149 | Altera Corp. | 2,346,285 | ||||||
|
| |||||||
| Software – 1.2% | ||||||||
| 301,168 | Microsoft Corp. | 12,167,187 | ||||||
| 135,830 | Oracle Corp. | 5,552,731 | ||||||
|
| |||||||
| 17,719,918 | ||||||||
|
| |||||||
| Specialty Retail – 1.3% | ||||||||
| 174,323 | L Brands, Inc. | 9,448,307 | ||||||
| 245,428 | The Gap, Inc. | 9,645,320 | ||||||
|
| |||||||
| 19,093,627 | ||||||||
|
| |||||||
| Thrifts & Mortgage Finance – 0.5% | ||||||||
| 501,910 | New York Community Bancorp, Inc. | 7,734,433 | ||||||
|
| |||||||
| Tobacco – 0.4% | ||||||||
| 133,778 | Altria Group, Inc. | 5,365,836 | ||||||
|
| |||||||
| Wireless Telecommunication Services – 0.6% | ||||||||
| 232,571 | Vodafone Group PLC ADR | 8,828,395 | ||||||
|
| |||||||
| TOTAL COMMON STOCKS | ||||||||
| (Cost $596,880,771) | $ | 642,544,198 | ||||||
|
| |||||||
| Preferred Stocks – 3.5% | ||||||||
| Consumer Finance – 0.4% | ||||||||
Capital One Financial Corp. |
| |||||||
| 175,000 | 6.000 | % | $ | 4,168,500 | ||||
CoBank ACB(a)(b) |
| |||||||
| 10,000 | 6.250 | 1,022,188 | ||||||
|
| |||||||
| 5,190,688 | ||||||||
| ||||||||
| Diversified Telecommunication Services – 0.7% | ||||||||
Intelsat SA |
| |||||||
| 57,200 | 5.750 | 2,934,246 | ||||||
Verizon Communications, Inc. |
| |||||||
| 299,250 | 5.900 | 7,493,440 | ||||||
|
| |||||||
| 10,427,686 | ||||||||
| ||||||||
| Electric Utilities(a) – 0.6% | ||||||||
SCE Trust III |
| |||||||
| 320,000 | 5.750 | 8,259,200 | ||||||
| ||||||||
| Real Estate Investment Trusts – 1.8% | ||||||||
DDR Corp. |
| |||||||
| 110,000 | 6.250 | 2,592,700 | ||||||
DuPont Fabros Technology, Inc. |
| |||||||
| 76,935 | 7.625 | 1,991,078 | ||||||
Public Storage |
| |||||||
| 273,598 | 5.750 | 6,596,448 | ||||||
Taubman Centers, Inc. |
| |||||||
| 245,050 | 6.500 | 6,138,502 | ||||||
Ventas Realty LP/Ventas Capital Corp. |
| |||||||
| 120,000 | 5.450 | 2,935,200 | ||||||
Vornado Realty Trust |
| |||||||
| 238,902 | 6.625 | 6,080,056 | ||||||
|
| |||||||
| 26,333,984 | ||||||||
| ||||||||
| TOTAL PREFERRED STOCKS | ||||||||
| (Cost $47,247,313) | $ | 50,211,558 | ||||||
| ||||||||
| Principal Amount | Interest Rate | Maturity Date | Value | |||||||||||
| Corporate Obligations – 46.6% | ||||||||||||||
| Aerospace(c) – 0.2% | ||||||||||||||
| TransDigm, Inc. |
| ||||||||||||
| $ | 3,000,000 | 7.500 | % | 07/15/21 | $ | 3,307,500 | ||||||||
|
| |||||||||||||
| Airlines(b) – 0.2% | ||||||||||||||
| Air Canada |
| ||||||||||||
| 3,000,000 | 5.375 | 11/15/22 | 3,082,500 | |||||||||||
|
| |||||||||||||
| Automotive(b) – 0.1% | ||||||||||||||
| General Motors Co. |
| ||||||||||||
| 2,000,000 | 6.250 | 10/02/43 | 2,187,500 | |||||||||||
|
| |||||||||||||
| Banks – 8.8% | ||||||||||||||
| Banco Santander SA(a)(c) |
| ||||||||||||
| EUR | 3,500,000 | 6.250 | 03/12/49 | 4,886,071 | ||||||||||
|
| |||||||||||||
| The accompanying notes are an integral part of these financial statements. | 23 |
GOLDMAN SACHS INCOME BUILDER FUND
Schedule of Investments (continued)
April 30, 2014 (Unaudited)
| Principal Amount | Interest Rate | Maturity Date | Value | |||||||||||
| Corporate Obligations – (continued) | ||||||||||||||
| Banks – (continued) | ||||||||||||||
| Barclays Bank PLC(a)(c) |
| ||||||||||||
| EUR | 900,000 | 4.750 | % | 03/29/49 | $ | 1,161,664 | ||||||||
| GBP | 5,761,000 | 6.369 | 12/15/49 | 9,831,470 | ||||||||||
| EUR | 1,250,000 | 4.875 | 12/29/49 | 1,610,269 | ||||||||||
| BPCE SA(b) |
| ||||||||||||
| $ | 9,000,000 | 5.700 | 10/22/23 | 9,530,010 | ||||||||||
| Citigroup, Inc.(a)(c) |
| ||||||||||||
| 9,300,000 | 5.900 | 02/15/49 | 9,195,375 | |||||||||||
| 2,575,000 | 6.300 | 05/15/49 | 2,562,125 | |||||||||||
| Credit Agricole SA(a)(c) |
| ||||||||||||
| GBP | 938,000 | 5.000 | 06/20/49 | 1,578,439 | ||||||||||
| Credit Suisse AG(b) |
| ||||||||||||
| $ | 2,500,000 | 6.500 | 08/08/23 | 2,795,075 | ||||||||||
| Credit Suisse Group AG(a)(c) |
| ||||||||||||
| 1,000,000 | 7.500 | 12/11/49 | 1,087,500 | |||||||||||
| 12,150,000 | 7.500 | (b) | 12/11/49 | 13,213,125 | ||||||||||
| KBC Groep NV(a)(c) |
| ||||||||||||
| EUR | 3,000,000 | 5.625 | 03/19/49 | 4,107,871 | ||||||||||
| LBG Capital No.2 PLC |
| ||||||||||||
| 1,000,000 | 6.385 | 05/12/20 | 1,484,145 | |||||||||||
| Lloyds Banking Group PLC(a)(c) |
| ||||||||||||
| GBP | 1,065,000 | 7.000 | 06/27/49 | 1,825,528 | ||||||||||
| $ | 2,000,000 | 7.500 | 06/27/49 | 2,091,667 | ||||||||||
| M&T Bank Corp.(a)(c) |
| ||||||||||||
| 5,150,000 | 6.450 | 02/15/49 | 5,381,750 | |||||||||||
| Merrill Lynch & Co., Inc. |
| ||||||||||||
| 3,000,000 | 6.110 | 01/29/37 | 3,395,686 | |||||||||||
| 5,250,000 | 7.750 | 05/14/38 | 7,029,601 | |||||||||||
| Morgan Stanley(a)(c) |
| ||||||||||||
| 6,925,000 | 5.450 | 07/15/49 | 6,985,594 | |||||||||||
| Royal Bank of Scotland Group PLC |
| ||||||||||||
| 2,000,000 | 6.125 | 12/15/22 | 2,134,451 | |||||||||||
| 2,909,000 | 6.100 | 06/10/23 | 3,077,726 | |||||||||||
| 10,500,000 | 6.000 | 12/19/23 | 10,969,033 | |||||||||||
| SMFG Preferred Capital GBP 2 Ltd.(a)(c) |
| ||||||||||||
| GBP | 1,000,000 | 10.231 | 01/25/49 | 2,355,317 | ||||||||||
| Stichting AK Rabobank Certificaten |
| ||||||||||||
| EUR | 6,000,000 | 6.500 | 12/29/49 | 8,958,225 | ||||||||||
| Wells Fargo & Co.(a)(c) |
| ||||||||||||
| $ | 6,725,000 | 5.900 | 06/15/49 | 6,887,072 | ||||||||||
|
| |||||||||||||
| 124,134,789 | ||||||||||||||
|
| |||||||||||||
| Building Materials(c) – 0.5% | ||||||||||||||
| HD Supply, Inc. |
| ||||||||||||
| 4,000,000 | 7.500 | 07/15/20 | 4,330,000 | |||||||||||
| 1,985,000 | 11.500 | 07/15/20 | 2,357,188 | |||||||||||
|
| |||||||||||||
| 6,687,188 | ||||||||||||||
|
| |||||||||||||
| Chemicals(c) – 0.7% | ||||||||||||||
| Ashland, Inc. |
| ||||||||||||
| 2,000,000 | 4.750 | 08/15/22 | 1,980,000 | |||||||||||
| 2,000,000 | 6.875 | 05/15/43 | 2,112,500 | |||||||||||
| Hexion US Finance Corp./Hexion Nova Scotia Finance ULC |
| ||||||||||||
| 4,000,000 | 8.875 | 02/01/18 | 4,170,000 | |||||||||||
|
| |||||||||||||
| Corporate Obligations – (continued) | ||||||||||||||
| Chemicals(c) – (continued) | ||||||||||||||
| PQ Corp.(b) |
| ||||||||||||
| $ | 1,200,000 | 8.750 | % | 05/01/18 | $ | 1,308,000 | ||||||||
|
| |||||||||||||
| 9,570,500 | ||||||||||||||
|
| |||||||||||||
| Consumer Cyclical Services – Business(c) – 2.0% | ||||||||||||||
| CoreLogic, Inc. |
| ||||||||||||
| 3,400,000 | 7.250 | 06/01/21 | 3,693,250 | |||||||||||
| Equinix, Inc. |
| ||||||||||||
| 6,000,000 | 5.375 | 04/01/23 | 6,120,000 | |||||||||||
| First Data Corp. |
| ||||||||||||
| 5,000,000 | 8.250 | (b) | 01/15/21 | 5,400,000 | ||||||||||
| 3,000,000 | 11.250 | 01/15/21 | 3,420,000 | |||||||||||
| Sabre, Inc.(b) |
| ||||||||||||
| 4,000,000 | 8.500 | 05/15/19 | 4,440,000 | |||||||||||
| WEX, Inc.(b) |
| ||||||||||||
| 4,976,000 | 4.750 | 02/01/23 | 4,727,200 | |||||||||||
|
| |||||||||||||
| 27,800,450 | ||||||||||||||
|
| |||||||||||||
| Consumer Cyclical Services – Rental Equipment(b)(c) – 1.0% | ||||||||||||||
| Ahern Rentals, Inc. |
| ||||||||||||
| 4,750,000 | 9.500 | 06/15/18 | 5,284,375 | |||||||||||
| Algeco Scotsman Global Finance PLC |
| ||||||||||||
| 3,000,000 | 8.500 | 10/15/18 | 3,225,000 | |||||||||||
| 2,000,000 | 10.750 | 10/15/19 | 2,130,000 | |||||||||||
| Jurassic Holdings III, Inc. |
| ||||||||||||
| 2,850,000 | 6.875 | 02/15/21 | 2,935,500 | |||||||||||
|
| |||||||||||||
| 13,574,875 | ||||||||||||||
|
| |||||||||||||
| Consumer Products – 0.9% | ||||||||||||||
| Avon Products, Inc. |
| ||||||||||||
| 1,300,000 | 5.000 | 03/15/23 | 1,309,387 | |||||||||||
| 4,300,000 | 6.950 | 03/15/43 | 4,384,804 | |||||||||||
| Sally Holdings LLC(c) |
| ||||||||||||
| 2,000,000 | 5.750 | 06/01/22 | 2,125,000 | |||||||||||
| Spectrum Brands, Inc.(c) |
| ||||||||||||
| 4,000,000 | 6.625 | 11/15/22 | 4,370,000 | |||||||||||
|
| |||||||||||||
| 12,189,191 | ||||||||||||||
|
| |||||||||||||
| Consumer Products – Industrial(c) – 0.6% | ||||||||||||||
| ADS Waste Holdings, Inc. |
| ||||||||||||
| 8,000,000 | 8.250 | 10/01/20 | 8,690,000 | |||||||||||
|
| |||||||||||||
| Electric – 1.0% | ||||||||||||||
| Calpine Corp.(b)(c) |
| ||||||||||||
| 888,000 | 7.500 | 02/15/21 | 970,140 | |||||||||||
| 6,000,000 | 6.000 | 01/15/22 | 6,360,000 | |||||||||||
| Enel SpA(a)(b)(c) |
| ||||||||||||
| 4,000,000 | 8.750 | 09/24/73 | 4,570,000 | |||||||||||
| NRG Energy, Inc. |
| ||||||||||||
| 1,250,000 | 7.625 | 01/15/18 | 1,415,625 | |||||||||||
| Puget Sound Energy, Inc.(a)(c) |
| ||||||||||||
| 550,000 | 6.974 | 06/01/67 | 566,500 | |||||||||||
|
| |||||||||||||
| 13,882,265 | ||||||||||||||
|
| |||||||||||||
| Energy – 4.0% | ||||||||||||||
| Chaparral Energy, Inc.(c) |
| ||||||||||||
| 6,000,000 | 8.250 | 09/01/21 | 6,570,000 | |||||||||||
|
| |||||||||||||
| 24 | The accompanying notes are an integral part of these financial statements. |
GOLDMAN SACHS INCOME BUILDER FUND
| Principal Amount | Interest Rate | Maturity Date | Value | |||||||||||
| Corporate Obligations – (continued) | ||||||||||||||
| Energy – (continued) | ||||||||||||||
| Halcon Resources Corp.(c) |
| ||||||||||||
| $ | 1,000,000 | 9.750 | % | 07/15/20 | $ | 1,068,750 | ||||||||
| 2,000,000 | 9.750 | (b) | 07/15/20 | 2,137,500 | ||||||||||
| 4,500,000 | 8.875 | 05/15/21 | 4,657,500 | |||||||||||
| Kinder Morgan, Inc.(b)(c) |
| ||||||||||||
| 7,000,000 | 5.625 | 11/15/23 | 6,965,000 | |||||||||||
| Kodiak Oil & Gas Corp.(c) |
| ||||||||||||
| 3,000,000 | 5.500 | 01/15/21 | 3,097,500 | |||||||||||
| Magnum Hunter Resources Corp.(c) |
| ||||||||||||
| 2,000,000 | 9.750 | 05/15/20 | 2,220,000 | |||||||||||
| MEG Energy Corp.(b)(c) |
| ||||||||||||
| 5,375,000 | 6.375 | 01/30/23 | 5,576,563 | |||||||||||
| 8,500,000 | 7.000 | 03/31/24 | 9,010,000 | |||||||||||
| Nexen Energy ULC |
| ||||||||||||
| 5,000 | 6.400 | 05/15/37 | 5,721 | |||||||||||
| 50,000 | 7.500 | 07/30/39 | 65,570 | |||||||||||
| Oasis Petroleum, Inc.(b)(c) |
| ||||||||||||
| 3,650,000 | 6.875 | 03/15/22 | 3,942,000 | |||||||||||
| Peabody Energy Corp.(c) |
| ||||||||||||
| 1,000,000 | 4.750 | 12/15/41 | 788,766 | |||||||||||
| Seadrill Ltd.(b) |
| ||||||||||||
| 10,000,000 | 6.125 | 09/15/20 | 9,950,000 | |||||||||||
| Vanguard Natural Resourses LLC/VNR Finance Corp.(c) |
| ||||||||||||
| 1,000,000 | 7.875 | 04/01/20 | 1,075,000 | |||||||||||
|
| |||||||||||||
| 57,129,870 | ||||||||||||||
|
| |||||||||||||
| Entertainment(b)(c) – 0.4% | ||||||||||||||
| WMG Acquisition Corp. |
| ||||||||||||
| 6,000,000 | 5.625 | 04/15/22 | 6,075,000 | |||||||||||
|
| |||||||||||||
| Financial Co. – Non Captive(c) – 1.0% | ||||||||||||||
| GE Capital Trust I(a) |
| ||||||||||||
| 74,000 | 6.375 | 11/15/67 | 81,955 | |||||||||||
| General Electric Capital Corp.(a) |
| ||||||||||||
| 6,100,000 | 5.250 | 06/15/49 | 6,016,125 | |||||||||||
| Harbinger Group, Inc. |
| ||||||||||||
| 2,000,000 | 7.875 | 07/15/19 | 2,185,000 | |||||||||||
| 1,500,000 | 7.750 | 01/15/22 | 1,500,000 | |||||||||||
| Nationstar Mortgage LLC/Nationstar Capital Corp. |
| ||||||||||||
| 5,000,000 | 6.500 | 07/01/21 | 4,762,500 | |||||||||||
|
| |||||||||||||
| 14,545,580 | ||||||||||||||
|
| |||||||||||||
| Food & Beverage – 1.8% | ||||||||||||||
| B&G Foods, Inc.(c) |
| ||||||||||||
| 4,500,000 | 4.625 | 06/01/21 | 4,477,500 | |||||||||||
| Barry Callebaut Services NV(b) |
| ||||||||||||
| 2,500,000 | 5.500 | 06/15/23 | 2,609,473 | |||||||||||
| Chiquita Brands International, Inc./Chiquita Brands LLC(c) |
| ||||||||||||
| 1,953,000 | 7.875 | 02/01/21 | 2,177,595 | |||||||||||
| Constellation Brands, Inc. |
| ||||||||||||
| 3,000,000 | 4.250 | 05/01/23 | 2,940,000 | |||||||||||
| Post Holdings, Inc.(c) |
| ||||||||||||
| 6,250,000 | 6.750 | (b) | 12/01/21 | 6,531,250 | ||||||||||
| 1,300,000 | 7.375 | (b) | 02/15/22 | 1,394,250 | ||||||||||
| 4,950,000 | 7.375 | 02/15/22 | 5,308,875 | |||||||||||
|
| |||||||||||||
| 25,438,943 | ||||||||||||||
|
| |||||||||||||
| Corporate Obligations – (continued) | ||||||||||||||
| Gaming – 2.4% | ||||||||||||||
| Caesars Entertainment Operating Co., Inc.(c) |
| ||||||||||||
| $ | 6,000,000 | 9.000 | % | 02/15/20 | $ | 5,220,000 | ||||||||
| Churchill Downs, Inc.(b)(c) |
| ||||||||||||
| 750,000 | 5.375 | 12/15/21 | 765,000 | |||||||||||
| CyrusOne LP/CyrusOne Finance Corp.(c) |
| ||||||||||||
| 2,699,000 | 6.375 | 11/15/22 | 2,867,687 | |||||||||||
| GLP Capital LP/GLP Financing II, Inc.(b)(c) |
| ||||||||||||
| 5,600,000 | 5.375 | 11/01/23 | 5,782,000 | |||||||||||
| Graton Economic Development Authority(b)(c) |
| ||||||||||||
| 50,000 | 9.625 | 09/01/19 | 57,125 | |||||||||||
| MGM Resorts International |
| ||||||||||||
| 2,000,000 | 6.750 | 10/01/20 | 2,205,000 | |||||||||||
| 7,000,000 | 6.625 | 12/15/21 | 7,682,500 | |||||||||||
| 3,500,000 | 7.750 | 03/15/22 | 4,051,250 | |||||||||||
| Wynn Macau Ltd.(b)(c) |
| ||||||||||||
| 5,000,000 | 5.250 | 10/15/21 | 5,050,000 | |||||||||||
|
| |||||||||||||
| 33,680,562 | ||||||||||||||
|
| |||||||||||||
| Health Care – 3.0% | ||||||||||||||
| CHS/Community Health Systems, Inc.(b)(c) |
| ||||||||||||
| 15,000,000 | 6.875 | 02/01/22 | 15,525,000 | |||||||||||
| DaVita HealthCare Partners, Inc.(c) |
| ||||||||||||
| 6,000,000 | 5.750 | 08/15/22 | 6,360,000 | |||||||||||
| Fresenius Medical Care US Finance II, Inc.(b) |
| ||||||||||||
| 5,000,000 | 5.875 | 01/31/22 | 5,325,000 | |||||||||||
| HCA, Inc. | ||||||||||||||
| 2,000,000 | 5.875 | 03/15/22 | 2,145,000 | |||||||||||
| 8,000,000 | 4.750 | 05/01/23 | 7,860,000 | |||||||||||
| 2,000,000 | 5.875 | 05/01/23 | 2,040,000 | |||||||||||
| MPH Acquisition Holdings LLC(b)(c) |
| ||||||||||||
| 3,000,000 | 6.625 | 04/01/22 | 3,097,500 | |||||||||||
|
| |||||||||||||
| 42,352,500 | ||||||||||||||
|
| |||||||||||||
| Health Care – Pharmaceuticals(b)(c) – 0.4% | ||||||||||||||
| Valeant Pharmaceuticals International |
| ||||||||||||
| 5,000,000 | 6.750 | 08/15/21 | 5,368,750 | |||||||||||
|
| |||||||||||||
| Health Care – Services(c) – 0.3% | ||||||||||||||
| MPT Operating Partnership LP/MPT Finance Corp. |
| ||||||||||||
| 3,000,000 | 6.875 | 05/01/21 | 3,262,500 | |||||||||||
| 1,320,000 | 6.375 | 02/15/22 | 1,415,700 | |||||||||||
|
| |||||||||||||
| 4,678,200 | ||||||||||||||
|
| |||||||||||||
| Home Construction(c) – 1.4% | ||||||||||||||
| Beazer Homes USA, Inc. |
| ||||||||||||
| 1,650,000 | 7.500 | 09/15/21 | 1,749,000 | |||||||||||
| Brookfield Residential Properties, Inc.(b) |
| ||||||||||||
| 3,000,000 | 6.125 | 07/01/22 | 3,071,250 | |||||||||||
| Lennar Corp. |
| ||||||||||||
| 3,000,000 | 4.750 | 11/15/22 | 2,917,500 | |||||||||||
| MDC Holdings, Inc. |
| ||||||||||||
| 2,000,000 | 5.500 | 01/15/24 | 2,063,869 | |||||||||||
| 2,000,000 | 6.000 | 01/15/43 | 1,805,419 | |||||||||||
| Toll Brothers Finance Corp. |
| ||||||||||||
| 4,000,000 | 5.875 | 02/15/22 | 4,305,000 | |||||||||||
|
| |||||||||||||
| The accompanying notes are an integral part of these financial statements. | 25 |
GOLDMAN SACHS INCOME BUILDER FUND
Schedule of Investments (continued)
April 30, 2014 (Unaudited)
| Principal Amount | Interest Rate | Maturity Date | Value | |||||||||||
| Corporate Obligations – (continued) | ||||||||||||||
| Home Construction(c) – (continued) | ||||||||||||||
| William Lyon Homes, Inc. |
| ||||||||||||
| $ | 2,985,000 | 8.500 | % | 11/15/20 | $ | 3,358,125 | ||||||||
|
| |||||||||||||
| 19,270,163 | ||||||||||||||
|
| |||||||||||||
| Lodging(b)(c) – 0.2% | ||||||||||||||
| MCE Finance Ltd. |
| ||||||||||||
| 3,000,000 | 5.000 | 02/15/21 | 2,977,500 | |||||||||||
| Studio City Finance Ltd. |
| ||||||||||||
| 550,000 | 8.500 | 12/01/20 | 611,875 | |||||||||||
|
| |||||||||||||
| 3,589,375 | ||||||||||||||
|
| |||||||||||||
| Media – Cable – 0.9% | ||||||||||||||
| Cablevision Systems Corp. |
| ||||||||||||
| 2,000,000 | 8.000 | 04/15/20 | 2,310,000 | |||||||||||
| Cequel Communications Holdings I LLC/Cequel Capital | | ||||||||||||
| 5,000,000 | 5.125 | 12/15/21 | 4,875,000 | |||||||||||
| CSC Holdings LLC |
| ||||||||||||
| 1,000,000 | 6.750 | 11/15/21 | 1,112,500 | |||||||||||
| Numericable Group SA(b)(c) |
| ||||||||||||
| 3,850,000 | 6.000 | 05/15/22 | 3,945,292 | |||||||||||
|
| |||||||||||||
| 12,242,792 | ||||||||||||||
|
| |||||||||||||
| Media – Non Cable(c) – 1.6% | ||||||||||||||
| CBS Outdoor Americas Capital LLC/CBS Outdoor Americas | | ||||||||||||
| 300,000 | 5.625 | 02/15/24 | 307,875 | |||||||||||
| Clear Channel Communications, Inc. |
| ||||||||||||
| 3,000,000 | 9.000 | 03/01/21 | 3,187,500 | |||||||||||
| Griffey Intermediate, Inc./Griffey Finance Sub LLC(b) |
| ||||||||||||
| 1,750,000 | 7.000 | 10/15/20 | 1,557,500 | |||||||||||
| Lamar Media Corp. |
| ||||||||||||
| 7,500,000 | 5.000 | 05/01/23 | 7,528,125 | |||||||||||
| 750,000 | 5.375 | (b) | 01/15/24 | 772,500 | ||||||||||
| Videotron Ltd.(b) |
| ||||||||||||
| 9,000,000 | 5.375 | 06/15/24 | 9,066,059 | |||||||||||
|
| |||||||||||||
| 22,419,559 | ||||||||||||||
|
| |||||||||||||
| Metals & Mining – 0.1% | ||||||||||||||
| ArcelorMittal | ||||||||||||||
| 950,000 | 6.750 | 02/25/22 | 1,053,822 | |||||||||||
|
| |||||||||||||
| Packaging – 2.1% | ||||||||||||||
| Ardagh Packaging Finance PLC(b)(c) |
| ||||||||||||
| 4,000,000 | 6.250 | 01/31/19 | 4,170,000 | |||||||||||
| 2,500,000 | 9.125 | 10/15/20 | 2,781,250 | |||||||||||
| 132,353 | 7.000 | 11/15/20 | 137,978 | |||||||||||
| Crown Americas LLC/Crown Americas Capital Corp. IV |
| ||||||||||||
| 3,000,000 | 4.500 | 01/15/23 | 2,865,000 | |||||||||||
| Reynolds Group Issuer, Inc.(c) |
| ||||||||||||
| 3,500,000 | 9.875 | 08/15/19 | 3,885,000 | |||||||||||
| 8,450,000 | 8.250 | 02/15/21 | 9,147,125 | |||||||||||
| Sealed Air Corp.(b) |
| ||||||||||||
| 4,000,000 | 5.250 | (c) | 04/01/23 | 4,040,000 | ||||||||||
| 2,490,000 | 6.875 | 07/15/33 | 2,533,575 | |||||||||||
|
| |||||||||||||
| 29,559,928 | ||||||||||||||
|
| |||||||||||||
| Corporate Obligations – (continued) | ||||||||||||||
| Pipelines(c) – 0.4% | ||||||||||||||
| Enterprise Products Operating LLC(a) |
| ||||||||||||
| $ | 100,000 | 8.375 | % | 08/01/66 | $ | 113,250 | ||||||||
| 1,000,000 | 7.000 | 06/01/67 | 1,050,000 | |||||||||||
| Regency Energy Partners LP/Regency Energy Finance Corp. |
| ||||||||||||
| 3,000,000 | 5.875 | 03/01/22 | 3,135,000 | |||||||||||
| TransCanada PipeLines Ltd.(a) |
| ||||||||||||
| 1,100,000 | 6.350 | 05/15/67 | 1,138,500 | |||||||||||
|
| |||||||||||||
| 5,436,750 | ||||||||||||||
|
| |||||||||||||
| Property/Casualty Insurance – 0.4% | ||||||||||||||
| AIG Life Holdings, Inc. |
| ||||||||||||
| 3,500,000 | 8.500 | 07/01/30 | 4,550,000 | |||||||||||
| MetLife, Inc.(c) |
| ||||||||||||
| 200,000 | 6.400 | 12/15/36 | 216,000 | |||||||||||
| Standard Life PLC(a)(c) |
| ||||||||||||
| GBP | 750,000 | 6.750 | 07/29/49 | 1,415,089 | ||||||||||
| Transatlantic Holdings, Inc. |
| ||||||||||||
| $ | 75,000 | 8.000 | 11/30/39 | 100,565 | ||||||||||
|
| |||||||||||||
| 6,281,654 | ||||||||||||||
|
| |||||||||||||
| Real Estate(c) – 0.4% | ||||||||||||||
| CBL & Associates LP |
| ||||||||||||
| 1,000,000 | 5.250 | 12/01/23 | 1,042,146 | |||||||||||
| DuPont Fabros Technology LP |
| ||||||||||||
| 2,000,000 | 5.875 | 09/15/21 | 2,085,000 | |||||||||||
| MPT Operating Partnership LP/MPT Finance Corp. |
| ||||||||||||
| 2,355,000 | 5.500 | 05/01/24 | 2,402,100 | |||||||||||
|
| |||||||||||||
| 5,529,246 | ||||||||||||||
|
| |||||||||||||
| Restaurants(b)(c) – 0.3% | ||||||||||||||
| Seminole Hard Rock Entertainment, Inc. |
| ||||||||||||
| 3,925,000 | 5.875 | 05/15/21 | 3,915,188 | |||||||||||
|
| |||||||||||||
| Retailers – 1.4% | ||||||||||||||
| Best Buy Co., Inc.(c) |
| ||||||||||||
| 5,000,000 | 5.500 | 03/15/21 | 5,125,000 | |||||||||||
| Claire’s Stores, Inc.(b)(c) |
| ||||||||||||
| 1,150,000 | 7.750 | 06/01/20 | 787,750 | |||||||||||
| L Brands, Inc. |
| ||||||||||||
| 6,000,000 | 5.625 | 02/15/22 | 6,315,000 | |||||||||||
| Neiman Marcus Group Ltd., Inc.(b)(c) |
| ||||||||||||
| 5,000,000 | 8.000 | 10/15/21 | 5,475,000 | |||||||||||
| The Neiman Marcus Group, Inc. |
| ||||||||||||
| 1,500,000 | 7.125 | 06/01/28 | 1,513,125 | |||||||||||
|
| |||||||||||||
| 19,215,875 | ||||||||||||||
|
| |||||||||||||
| Retailers – Food & Drug(c) – 0.6% | ||||||||||||||
| Ingles Markets, Inc. |
| ||||||||||||
| 9,000,000 | 5.750 | 06/15/23 | 8,955,000 | |||||||||||
|
| |||||||||||||
| Technology – Hardware(b)(c) – 0.5% | ||||||||||||||
| NCR Corp. |
| ||||||||||||
| 4,000,000 | 5.875 | 12/15/21 | 4,230,000 | |||||||||||
| NXP BV/NXP Funding LLC |
| ||||||||||||
| 3,000,000 | 5.750 | 03/15/23 | 3,180,000 | |||||||||||
|
| |||||||||||||
| 7,410,000 | ||||||||||||||
|
| |||||||||||||
| 26 | The accompanying notes are an integral part of these financial statements. |
GOLDMAN SACHS INCOME BUILDER FUND
| Principal Amount | Interest Rate | Maturity Date | Value | |||||||||||
| Corporate Obligations – (continued) | ||||||||||||||
| Technology – Software(b)(c) – 0.5% | ||||||||||||||
| BMC Software Finance, Inc. |
| ||||||||||||
| $ | 4,000,000 | 8.125 | % | 07/15/21 | $ | 4,190,000 | ||||||||
| Nuance Communications, Inc. |
| ||||||||||||
| 3,000,000 | 5.375 | 08/15/20 | 3,015,000 | |||||||||||
|
| |||||||||||||
| 7,205,000 | ||||||||||||||
|
| |||||||||||||
| Transportation(b)(c) – 0.1% | ||||||||||||||
| Florida East Coast Holdings Corp. |
| ||||||||||||
| 850,000 | 6.750 | 05/01/19 | 871,250 | |||||||||||
|
| |||||||||||||
| Wireless Telecommunications – 5.4% | ||||||||||||||
| Altice Finco SA(b)(c) |
| ||||||||||||
| 2,000,000 | 8.125 | 01/15/24 | 2,156,000 | |||||||||||
| Crown Castle International Corp. |
| ||||||||||||
| 5,000,000 | 5.250 | 01/15/23 | 5,131,250 | |||||||||||
| Digicel Group Ltd.(b)(c) |
| ||||||||||||
| 3,800,000 | 8.250 | 09/30/20 | 4,049,375 | |||||||||||
| 7,000,000 | 7.125 | 04/01/22 | 7,070,000 | |||||||||||
| Digicel Ltd.(b)(c) |
| ||||||||||||
| 950,000 | 7.000 | 02/15/20 | 993,938 | |||||||||||
| Intelsat Jackson Holdings SA(c) |
| ||||||||||||
| 3,000,000 | 6.625 | 12/15/22 | 3,078,750 | |||||||||||
| Intelsat Luxembourg SA(c) |
| ||||||||||||
| 6,000,000 | 7.750 | 06/01/21 | 6,270,000 | |||||||||||
| 2,500,000 | 8.125 | 06/01/23 | 2,625,000 | |||||||||||
| Softbank Corp.(b) |
| ||||||||||||
| 7,000,000 | 4.500 | 04/15/20 | 6,986,875 | |||||||||||
| Sprint Capital Corp. |
| ||||||||||||
| 5,500,000 | 6.875 | 11/15/28 | 5,458,750 | |||||||||||
| Sprint Corp.(b) |
| ||||||||||||
| 4,425,000 | 7.250 | 09/15/21 | 4,812,187 | |||||||||||
| 12,200,000 | 7.875 | 09/15/23 | 13,389,500 | |||||||||||
| 3,000,000 | 7.125 | 06/15/24 | 3,135,000 | |||||||||||
| T-Mobile USA, Inc.(c) |
| ||||||||||||
| 2,000,000 | 6.250 | 04/01/21 | 2,127,500 | |||||||||||
| 2,200,000 | 6.625 | 04/01/23 | 2,354,000 | |||||||||||
| VimpelCom Holdings BV |
| ||||||||||||
| 1,000,000 | 7.504 | 03/01/22 | 985,000 | |||||||||||
| Wind Acquisition Finance SA(b)(c) |
| ||||||||||||
| 6,000,000 | 7.375 | 04/23/21 | 6,165,000 | |||||||||||
|
| |||||||||||||
| 76,788,125 | ||||||||||||||
|
| |||||||||||||
| Wirelines Telecommunications – 1.0% | ||||||||||||||
| Frontier Communications Corp. |
| ||||||||||||
| 5,276,000 | 8.500 | 04/15/20 | 6,153,135 | |||||||||||
| Koninklijke KPN NV(a)(c) |
| ||||||||||||
| 3,500,000 | 7.000 | 03/28/73 | 3,653,079 | |||||||||||
| Level 3 Financing, Inc.(b)(c) |
| ||||||||||||
| 3,150,000 | 6.125 | 01/15/21 | 3,307,500 | |||||||||||
| Windstream Corp.(c) |
| ||||||||||||
| 1,150,000 | 7.750 | 10/15/20 | 1,240,563 | |||||||||||
|
| |||||||||||||
| 14,354,277 | ||||||||||||||
|
| |||||||||||||
| TOTAL CORPORATE OBLIGATIONS | ||||||||||||||
| (Cost $646,570,252) | $ | 658,474,167 | ||||||||||||
|
| |||||||||||||
| Mortgage-Backed Obligations – 0.1% | ||||||||||||||
| Collateralized Mortgage Obligations – 0.1% | ||||||||||||||
| Adjustable Rate Non-Agency(a) – 0.1% | ||||||||||||||
| Countrywide Alternative Loan Trust Series 2005-31, Class 2A1 |
| ||||||||||||
| $ | 185,093 | 0.454 | % | 08/25/35 | $ | 158,199 | ||||||||
| Countrywide Alternative Loan Trust Series 2005-38, Class A3 |
| ||||||||||||
| 205,454 | 0.504 | 09/25/35 | 175,805 | |||||||||||
| Countrywide Home Loan Mortgage Pass-Through Trust | | ||||||||||||
| 13,598 | 2.527 | 11/20/34 | 12,931 | |||||||||||
| JPMorgan Alternative Loan Trust Series 2005-A2, Class 1A1 |
| ||||||||||||
| 193,628 | 0.414 | 01/25/36 | 171,838 | |||||||||||
| Merrill Lynch Alternative Note Asset Trust Series 2007-0AR3, | | ||||||||||||
| 420,428 | 0.342 | 07/25/47 | 319,540 | |||||||||||
| Structured Adjustable Rate Mortgage Loan Trust Series 2004-06, | | ||||||||||||
| 191,144 | 2.401 | 06/25/34 | 190,831 | |||||||||||
| Wells Fargo Mortgage Backed Securities Trust Series 2005- | | ||||||||||||
| 97,559 | 2.633 | 08/25/33 | 99,559 | |||||||||||
|
| |||||||||||||
| 1,128,703 | ||||||||||||||
|
| |||||||||||||
| Interest Only(d) – 0.0% | ||||||||||||||
| CS First Boston Mortgage Securities Corp. Series 2003-19, | | ||||||||||||
| 4,586 | 5.250 | 07/25/33 | 207 | |||||||||||
| CS First Boston Mortgage Securities Corp. Series 2003-AR18, | | ||||||||||||
| 45,733 | 0.000 | 07/25/33 | — | |||||||||||
| CS First Boston Mortgage Securities Corp. Series 2003-AR20, | | ||||||||||||
| 58,539 | 0.000 | 08/25/33 | — | |||||||||||
| Master Adjustable Rate Mortgages Trust Series 2003-2, | | ||||||||||||
| 49,466 | 0.123 | 08/25/33 | 335 | |||||||||||
| Master Adjustable Rate Mortgages Trust Series 2003-2, | | ||||||||||||
| 15,970 | 0.320 | 07/25/33 | 136 | |||||||||||
|
| |||||||||||||
| 678 | ||||||||||||||
|
| |||||||||||||
| TOTAL MORTGAGE-BACKED OBLIGATIONS | ||||||||||||||
| (Cost $995,423) | $ | 1,129,381 | ||||||||||||
|
| |||||||||||||
| Asset-Backed Securities – 0.0% | ||||||||||||||
| Home Equity(a) – 0.0% | ||||||||||||||
| Countrywide Home Equity Loan Trust Series 2003-D, Class A |
| ||||||||||||
| $ | 10,085 | 0.412 | % | 06/15/29 | $ | 9,920 | ||||||||
| Countrywide Home Equity Loan Trust Series 2004-N, Class 2A |
| ||||||||||||
| 88,485 | 0.432 | 02/15/34 | 72,772 | |||||||||||
| GMAC Mortgage Corp. Loan Trust Series 2007-HE3, Class 1A1 |
| ||||||||||||
| 25,697 | 7.000 | 09/25/37 | 25,659 | |||||||||||
|
| |||||||||||||
| The accompanying notes are an integral part of these financial statements. | 27 |
GOLDMAN SACHS INCOME BUILDER FUND
Schedule of Investments (continued)
April 30, 2014 (Unaudited)
| Principal Amount | Interest Rate | Maturity Date | Value | |||||||||||
| Asset-Backed Securities – (continued) | ||||||||||||||
| Home Equity(a) – (continued) | ||||||||||||||
| GMAC Mortgage Corp. Loan Trust Series 2007-HE3, Class 2A1 |
| ||||||||||||
| $ | 38,439 | 6.862 | % | 09/25/37 | $ | 38,277 | ||||||||
|
| |||||||||||||
| 146,628 | ||||||||||||||
|
| |||||||||||||
| Manufactured Housing – 0.0% | ||||||||||||||
| Mid-State Trust Series 4, Class A |
| ||||||||||||
| 51,826 | 8.330 | 04/01/30 | 52,917 | |||||||||||
|
| |||||||||||||
| TOTAL ASSET-BACKED SECURITIES | ||||||||||||||
| (Cost $225,547) | $ | 199,545 | ||||||||||||
|
| |||||||||||||
| Senior Term Loans(e) – 1.0% | ||||||||||||||
| Health Care – Services – 0.0% | ||||||||||||||
| U.S. Renal Care, Inc. |
| ||||||||||||
| $ | 191,000 | 10.250 | % | 01/03/20 | $ | 193,388 | ||||||||
|
| |||||||||||||
| Media – Broadcasting & Radio – 0.5% | ||||||||||||||
| Clear Channel Communications, Inc. |
| ||||||||||||
| 2,550,000 | 3.830 | 01/29/16 | 2,528,096 | |||||||||||
| Getty Images, Inc. |
| ||||||||||||
| 4,328,086 | 4.750 | 10/18/19 | 4,137,736 | |||||||||||
|
| |||||||||||||
| 6,665,832 | ||||||||||||||
|
| |||||||||||||
| Retailers – 0.3% | ||||||||||||||
| True Religion Apparel, Inc. |
| ||||||||||||
| 4,328,250 | 5.875 | 07/30/19 | 4,111,837 | |||||||||||
|
| |||||||||||||
| Technology – Software/Services – 0.1% | ||||||||||||||
| BMC Software Finance, Inc. |
| ||||||||||||
| 1,995,000 | 5.000 | 09/10/20 | 1,986,681 | |||||||||||
|
| |||||||||||||
| Wireless Telecommunications – 0.1% | ||||||||||||||
| Alcatel-Lucent USA, Inc. |
| ||||||||||||
| 987,500 | 4.500 | 01/30/19 | 987,322 | |||||||||||
|
| |||||||||||||
| TOTAL SENIOR TERM LOANS | ||||||||||||||
| (Cost $13,739,333) | $ | 13,945,060 | ||||||||||||
|
| |||||||||||||
| U.S. Treasury Obligation(f) – 1.2% | ||||||||||||||
| United States Treasury Note |
| ||||||||||||
| $ | 17,200,000 | 0.375 | % | 01/31/16 | $ | 17,219,264 | ||||||||
| (Cost $17,212,462) | ||||||||||||||
|
| |||||||||||||
| Shares | Description | Value | ||||
| Investment Company(g) – 0.2% | ||||||
| 403,380 | Goldman Sachs High Yield Fund – Institutional Shares | $ | 2,924,504 | |||
| (Cost $2,961,789) | ||||||
| ||||||
| Principal Amount | Interest Rate | Maturity Date | Value | |||||||||||
| Short-term Investment(h) – 2.6% | ||||||||||||||
| Repurchase Agreement – 2.6% | ||||||||||||||
| Joint Repurchase Agreement Account II |
| ||||||||||||
| $ | 36,400,000 | 0.056 | % | 05/01/14 | $ | 36,400,000 | ||||||||
| (Cost $36,400,000) | ||||||||||||||
|
| |||||||||||||
| TOTAL INVESTMENTS – 100.6% | ||||||||||||||
| (Cost $1,362,232,890) | $ | 1,423,047,677 | ||||||||||||
|
| |||||||||||||
| | LIABILITIES IN EXCESS OF OTHER ASSETS – (0.6)% | | (8,502,627 | ) | ||||||||||
|
| |||||||||||||
| NET ASSETS – 100.0% | $ | 1,414,545,050 | ||||||||||||
|
| |||||||||||||
| The percentage shown for each investment category reflects the value of investments in that category as a percentage of net assets. | ||
(a) | Variable rate security. Interest rate or distribution rate disclosed is that which is in effect at April 30, 2014. | |
(b) | Exempt from registration under Rule 144A of the Securities Act of 1933. Under procedures approved by the Board of Trustees, such securities have been determined to be liquid by the investment adviser and may be resold, normally to qualified institutional buyers in transactions exempt from registration. Total market value of Rule 144A securities amounts to $286,919,241, which represents approximately 20.3% of net assets as of April 30, 2014. | |
(c) | Security with “Call” features with resetting interest rates. Maturity dates disclosed are the final maturity dates. | |
(d) | Security with a notional or nominal principal amount. The actual effective yield of this security is different than the stated interest rate. | |
(e) | Senior Term Loans often require prepayments from excess cash flows or permit the borrower to repay at its election. The degree to which borrowers repay, whether as a contractual requirement or at their election, cannot be predicted with accuracy. As a result, the actual remaining maturity may be substantially less than the stated maturities shown. The stated interest rate represents the weighted average interest rate of all contracts within the senior loan facility at April 30, 2014. Senior Term Loans typically have rates of interest which are predetermined either daily, monthly, quarterly or semi-annually by reference to a base lending rate, plus a premium. These base lending rates are primarily the London Interbank Offered Rate (“LIBOR”), and secondarily the prime rate offered by one or more major United States banks (the “Prime Rate”) and the certificate of deposit (“CD”) rate or other base lending rates used by commercial lenders. | |
(f) | All or a portion of security is segregated as collateral for initial margin requirements on futures transactions. | |
(g) | Represents an affiliated issuer. | |
(h) | Joint repurchase agreement was entered into on April 30, 2014. Additional information appears on page 33. | |
| ||
Currency Abbreviations: | ||
EUR | —Euro | |
GBP | —British Pound | |
Investment Abbreviations: | ||
ADR | —American Depositary Receipt | |
BP | —British Pound Offered Rate | |
| ||
| 28 | The accompanying notes are an integral part of these financial statements. |
GOLDMAN SACHS INCOME BUILDER FUND
| ADDITIONAL INVESTMENT INFORMATION |
FORWARD FOREIGN CURRENCY EXCHANGE CONTRACTS — At April 30, 2014, the Fund had the following forward foreign currency exchange contracts:
FORWARD FOREIGN CURRENCY EXCHANGE CONTRACTS WITH UNREALIZED GAIN
| Counterparty | Contracts to Buy/Sell | Settlement Date | Current Value | Unrealized Gain | ||||||||||
Royal Bank of Canada | USD/EUR | 05/07/14 | $ | 5,988,470 | $ | 3,803 | ||||||||
UBS AG (London) | USD/EUR | 05/07/14 | 8,204,042 | 2,094 | ||||||||||
| TOTAL | $ | 5,897 | ||||||||||||
FORWARD FOREIGN CURRENCY EXCHANGE CONTRACTS WITH UNREALIZED LOSS
| Counterparty | Contracts to Buy/Sell | Settlement Date | Current Value | Unrealized Loss | ||||||||||
Deutsche Bank AG (London) | USD/GBP | 06/06/14 | $ | 17,065,399 | $ | (59,410 | ) | |||||||
Royal Bank of Canada | USD/EUR | 05/07/14 | 12,045,423 | (9,907 | ) | |||||||||
| TOTAL | $ | (69,317 | ) | |||||||||||
FUTURES CONTRACTS — At April 30, 2014, the Fund had the following futures contracts:
| Type | Number of Contracts Long (Short) | Expiration Date | Current Value | Unrealized Gain (Loss) | ||||||||||
Ultra Long U.S. Treasury Bonds | (93 | ) | June 2014 | $ | (13,697,156 | ) | $ | (404,504 | ) | |||||
2 Year U.S Treasury Notes | 259 | June 2014 | 56,947,625 | (7,227 | ) | |||||||||
5 Year U.S Treasury Notes | (1,516 | ) | June 2014 | (181,090,938 | ) | 105,188 | ||||||||
10 Year U.S Treasury Notes | (1,551 | ) | June 2014 | (192,978,328 | ) | (245,300 | ) | |||||||
20 Year U.S. Treasury Bonds | (915 | ) | June 2014 | (123,467,812 | ) | (2,258,540 | ) | |||||||
| TOTAL | $ | (2,810,383 | ) | |||||||||||
| The accompanying notes are an integral part of these financial statements. | 29 |
GOLDMAN SACHS INCOME BUILDER FUND
Schedule of Investments (continued)
April 30, 2014 (Unaudited)
| ADDITIONAL INVESTMENT INFORMATION (continued) |
SWAP CONTRACTS — At April 30, 2014, the Fund had the following swap contracts:
OVER THE COUNTER CREDIT DEFAULT SWAP CONTRACTS
| Referenced Obligation | Notional Amount (000s) | Rates Received (Paid) | Termination Date | Credit Spread at April 30, 2014(a) | Market Value | |||||||||||||||||||||
| Counterparty | Upfront Payments Made (Received) | Unrealized Gain (Loss) | ||||||||||||||||||||||||
Protection Purchased: | ||||||||||||||||||||||||||
Bank of America Securities LLC | CDX North America Investment Grade Index 16 | $ | 200 | (1.000 | )% | 06/20/14 | 0.016 | % | $ | (101 | ) | $ | (407 | ) | ||||||||||||
JPMorgan Securities, Inc. | 1,700 | (1.000 | ) | 06/20/14 | 0.016 | (958 | ) | (3,361 | ) | |||||||||||||||||
Morgan Stanley Capital Services, Inc. | 400 | (1.000 | ) | 06/20/14 | 0.016 | (188 | ) | (829 | ) | |||||||||||||||||
Protection Sold: | ||||||||||||||||||||||||||
Bank of America Securities LLC | 700 | 1.000 | 06/20/16 | 0.216 | 427 | 12,805 | ||||||||||||||||||||
Morgan Stanley Capital Services, Inc. | 800 | 1.000 | 06/20/16 | 0.216 | 467 | 14,656 | ||||||||||||||||||||
| TOTAL | $ | (353 | ) | $ | 22,864 | |||||||||||||||||||||
| (a) | Credit spread on the Referenced Obligation, together with the term of the swap contract, are indicators of payment/performance risk. The likelihood of a credit event occurring which would require a fund to make a payment or otherwise be required to perform under the swap contract is generally greater as the credit spread and the term of the swap contract increase. |
| 30 | The accompanying notes are an integral part of these financial statements. |
GOLDMAN SACHS RISING DIVIDEND GROWTH FUND
Schedule of Investments
April 30, 2014 (Unaudited)
| Shares | Description | Value | ||||||
| Common Stocks – 96.6% | ||||||||
| Aerospace & Defense – 2.0% | ||||||||
| 500,700 | United Technologies Corp. | $ | 59,247,831 | |||||
|
| |||||||
| Beverages – 2.6% | ||||||||
| 890,380 | PepsiCo., Inc. | 76,474,738 | ||||||
|
| |||||||
| Capital Markets – 4.8% | ||||||||
| 1,350,700 | Franklin Resources, Inc. | 70,709,145 | ||||||
| 850,735 | T. Rowe Price Group, Inc. | 69,870,866 | ||||||
|
| |||||||
| 140,580,011 | ||||||||
|
| |||||||
| Chemicals – 11.8% | ||||||||
| 662,700 | Ecolab, Inc. | 69,344,928 | ||||||
| 672,400 | Monsanto Co. | 74,434,680 | ||||||
| 380,600 | Praxair, Inc. | 49,687,330 | ||||||
| 331,988 | Rentech Nitrogen Partners LP | 6,002,343 | ||||||
| 412,000 | The Sherwin-Williams Co. | 82,334,080 | ||||||
| 915,208 | The Valspar Corp. | 66,846,792 | ||||||
|
| |||||||
| 348,650,153 | ||||||||
|
| |||||||
| Communications Equipment – 1.9% | ||||||||
| 752,500 | Harris Corp. | 55,323,800 | ||||||
|
| |||||||
| Food Products – 4.5% | ||||||||
| 1,014,600 | Hormel Foods Corp. | 48,386,274 | ||||||
| 708,400 | McCormick & Co., Inc. | 50,438,080 | ||||||
| 449,575 | Nestle SA ADR | 34,698,198 | ||||||
|
| |||||||
| 133,522,552 | ||||||||
|
| |||||||
| Health Care Providers & Services – 2.6% | ||||||||
| 1,109,400 | Cardinal Health, Inc. | 77,114,394 | ||||||
|
| |||||||
| Household Products – 2.2% | ||||||||
| 957,700 | Church & Dwight Co., Inc. | 66,090,877 | ||||||
|
| |||||||
| Industrial Conglomerates – 2.6% | ||||||||
| 551,900 | Roper Industries, Inc. | 76,686,505 | ||||||
|
| |||||||
| Insurance – 2.1% | ||||||||
| 1,323,000 | HCC Insurance Holdings, Inc. | 60,778,620 | ||||||
|
| |||||||
| IT Services – 4.2% | ||||||||
| 793,000 | Automatic Data Processing, Inc. | 61,822,280 | ||||||
| 312,400 | International Business Machines Corp. | 61,377,228 | ||||||
|
| |||||||
| 123,199,508 | ||||||||
|
| |||||||
| Leisure Equipment & Products – 2.5% | ||||||||
| 551,000 | Polaris Industries, Inc. | 74,015,830 | ||||||
|
| |||||||
| Machinery – 2.3% | ||||||||
| 534,000 | Parker Hannifin Corp. | 67,753,920 | ||||||
|
| |||||||
| Oil, Gas & Consumable Fuels – 21.4% | ||||||||
| 675,828 | Access Midstream Partners LP | 40,110,392 | ||||||
| 933,800 | Energy Transfer Equity LP | 43,505,742 | ||||||
| 704,900 | Enterprise Products Partners LP | 51,549,337 | ||||||
| 885,600 | EOG Resources, Inc. | 86,788,800 | ||||||
| 508,316 | EQT Midstream Partners LP | 39,155,581 | ||||||
| 782,940 | Genesis Energy LP | 43,390,535 | ||||||
|
| |||||||
| Common Stocks – (continued) | ||||||||
| Oil, Gas & Consumable Fuels – (continued) | ||||||||
| 557,500 | Kinder Morgan Energy Partners LP | $ | 42,024,350 | |||||
| 736,100 | Magellan Midstream Partners LP | 54,625,981 | ||||||
| 654,500 | MarkWest Energy Partners LP | 41,456,030 | ||||||
| 411,500 | NGL Energy Partners LP | 15,912,705 | ||||||
| 280,000 | ONEOK Partners LP | 15,957,200 | ||||||
| 902,800 | Plains All American Pipeline LP | 50,376,240 | ||||||
| 474,550 | Sunoco Logistics Partners LP | 43,165,068 | ||||||
| 592,870 | Western Gas Partners LP | 40,315,160 | ||||||
| 417,900 | Williams Partners LP | 21,555,282 | ||||||
|
| |||||||
| 629,888,403 | ||||||||
|
| |||||||
| Pharmaceuticals – 8.3% | ||||||||
| 1,569,000 | Novo Nordisk A/S ADR | 71,216,910 | ||||||
| 593,400 | Perrigo Co. PLC | 85,959,924 | ||||||
| 2,356,058 | Roche Holding AG ADR | 86,349,526 | ||||||
|
| |||||||
| 243,526,360 | ||||||||
|
| |||||||
| Road & Rail – 2.5% | ||||||||
| 1,248,700 | Canadian National Railway Co. | 73,136,359 | ||||||
|
| |||||||
| Semiconductors & Semiconductor Equipment – 2.3% | ||||||||
| 2,524,336 | Intel Corp. | 67,374,528 | ||||||
|
| |||||||
| Software – 1.4% | ||||||||
| 382,320 | FactSet Research Systems, Inc. | 40,717,080 | ||||||
|
| |||||||
| Specialty Retail – 6.7% | ||||||||
| 1,544,400 | Lowe’s Cos., Inc. | 70,903,404 | ||||||
| 692,300 | Tiffany & Co. | 60,569,327 | ||||||
| 1,114,481 | TJX Cos., Inc. | 64,840,505 | ||||||
|
| |||||||
| 196,313,236 | ||||||||
|
| |||||||
| Textiles, Apparel & Luxury Goods – 5.5% | ||||||||
| 962,400 | NIKE, Inc. Class B | 70,207,080 | ||||||
| 1,486,780 | VF Corp. | 90,827,390 | ||||||
|
| |||||||
| 161,034,470 | ||||||||
|
| |||||||
| Trading Companies & Distributors – 2.4% | ||||||||
| 284,175 | W.W. Grainger, Inc. | 72,294,120 | ||||||
|
| |||||||
| TOTAL COMMON STOCKS | ||||||||
| (Cost $2,326,533,161) | $ | 2,843,723,295 | ||||||
|
| |||||||
| The accompanying notes are an integral part of these financial statements. | 31 |
GOLDMAN SACHS RISING DIVIDEND GROWTH FUND
Schedule of Investments (continued)
April 30, 2014 (Unaudited)
| Principal Amount | Interest Rate | Maturity Date | Value | |||||||||||
| Short-term Investment(a) – 3.2% | ||||||||||||||
| Repurchase Agreement – 3.2% | ||||||||||||||
| Joint Repurchase Agreement Account II |
| ||||||||||||
| $ | 92,300,000 | 0.056 | % | 05/01/14 | $ | 92,300,000 | ||||||||
| (Cost $92,300,000) | ||||||||||||||
|
| |||||||||||||
| TOTAL INVESTMENTS – 99.8% | ||||||||||||||
| (Cost $2,418,833,161) | $ | 2,936,023,295 | ||||||||||||
|
| |||||||||||||
| | OTHER ASSETS IN EXCESS OF LIABILITIES – 0.2% | | 7,328,381 | |||||||||||
|
| |||||||||||||
| NET ASSETS – 100.0% | $ | 2,943,351,676 | ||||||||||||
|
| |||||||||||||
| The percentage shown for each investment category reflects the value of investments in that category as a percentage of net assets. | ||
(a) | Joint repurchase agreement was entered into on April 30, 2014. Additional information appears on page 33. | |
| ||
Investment Abbreviation: | ||
ADR | —American Depositary Receipt | |
| ||
| 32 | The accompanying notes are an integral part of these financial statements. |
GOLDMAN SACHS DIVIDEND FOCUS FUNDS
Schedule of Investments
April 30, 2014 (Unaudited)
| ADDITIONAL INVESTMENT INFORMATION |
JOINT REPURCHASE AGREEMENT ACCOUNT II — At April 30, 2014, the Funds had undivided interests in the Joint Repurchase Agreement Account II, with a maturity date of May 1, 2014, as follows:
| Fund | Principal Amount | Maturity Value | Collateral Allocation Value | |||||||||
Income Builder | $ | 36,400,000 | $ | 36,400,057 | $ | 24,700,073 | ||||||
Rising Dividend Growth | 92,300,000 | 92,300,144 | 90,000,268 | |||||||||
REPURCHASE AGREEMENTS — At April 30, 2014, the Principal Amounts of the Funds’ interest in the Joint Repurchase Agreement Account II were as follows:
| Counterparty | Interest Rate | Income Builder | Rising Dividend Growth | |||||||||
BNP Paribas Securities Co. | 0.060 | % | $ | 7,501,085 | $ | 19,020,607 | ||||||
Citigroup Global Capital Markets, Inc. | 0.060 | 5,592,914 | 14,182,032 | |||||||||
Merrill Lynch & Co., Inc. | 0.050 | 9,049,993 | 22,948,196 | |||||||||
TD Securities USA LLC | 0.050 | 4,605,929 | 11,679,320 | |||||||||
TD Securities USA LLC | 0.060 | 4,605,929 | 11,679,320 | |||||||||
Wells Fargo Securities LLC | 0.060 | 5,044,150 | 12,790,525 | |||||||||
| TOTAL | $ | 36,400,000 | $ | 92,300,000 | ||||||||
At April 30, 2014, the Joint Repurchase Agreement Account II was fully collateralized by:
| Issuer | Interest Rates | Maturity Dates | ||||||
Federal Farm Credit Banks | 0.155 to 0.181 | % | 10/01/15 to 06/03/16 | |||||
Federal Home Loan Bank | 5.375 | 05/18/16 | ||||||
Federal Home Loan Bank Discount Notes | 0.000 | 10/24/14 | ||||||
Federal Home Loan Mortgage Corp. | 0.500 to 6.000 | 04/17/15 to 05/01/44 | ||||||
Federal National Mortgage Association | 1.375 to 7.000 | 03/01/15 to 05/01/44 | ||||||
Government National Mortgage Association | 3.000 to 9.000 | 06/15/20 to 03/20/44 | ||||||
U.S. Treasury Coupon-Only Stripped Security | 0.000 | 05/15/23 | ||||||
U.S. Treasury Notes | 0.250 to 7.500 | 02/28/15 to 11/15/16 | ||||||
| The accompanying notes are an integral part of these financial statements. | 33 |
GOLDMAN SACHS DIVIDEND FOCUS FUNDS
Statements of Assets and Liabilities
April 30, 2014 (Unaudited)
| Income Builder Fund | Rising Dividend Growth Fund | |||||||||
| Assets: | ||||||||||
Investments of unaffiliated issuers, at value (cost $1,359,271,101 and $2,418,833,161) | $ | 1,420,123,173 | $ | 2,936,023,295 | ||||||
Investments of affiliated issuers, at value (cost $2,961,789 and $0) | 2,924,504 | — | ||||||||
Cash | 259,237 | 25,626 | ||||||||
Receivables: | ||||||||||
Investment sold | 19,716,688 | 63,120 | ||||||||
Dividends and interest | 12,355,461 | 4,432,770 | ||||||||
Fund shares sold | 12,173,029 | 11,562,033 | ||||||||
Collateral on certain derivative contracts | 110,000 | — | ||||||||
Reimbursement from investment adviser | 105,284 | 148,566 | ||||||||
Foreign tax reclaims | 80,100 | 1,063,685 | ||||||||
Unrealized gain on swap contracts | 27,461 | — | ||||||||
Unrealized gain on forward foreign currency exchange contracts | 5,897 | — | ||||||||
Upfront payments made on swap contracts | 894 | — | ||||||||
Other assets | 9,198 | 41,045 | ||||||||
| Total assets | 1,467,890,926 | 2,953,360,140 | ||||||||
| Liabilities: | ||||||||||
Payables: | ||||||||||
Investments purchased | 30,716,423 | 3,659,110 | ||||||||
Investments purchased on an extended settlement basis | 15,871,201 | — | ||||||||
Fund shares redeemed | 3,745,461 | 3,473,572 | ||||||||
Variation margin on certain derivative contracts | 1,688,018 | — | ||||||||
Amounts owed to affiliates | 1,108,697 | 2,584,329 | ||||||||
Unrealized loss on forward foreign currency exchange contracts | 69,317 | — | ||||||||
Unrealized loss on swap contracts | 4,597 | — | ||||||||
Distributions payable | 1,626 | — | ||||||||
Upfront payments received on swap contracts | 1,247 | — | ||||||||
Accrued expenses and other liabilities | 139,289 | 291,453 | ||||||||
| Total liabilities | 53,345,876 | 10,008,464 | ||||||||
| Net Assets: | ||||||||||
Paid-in capital | 1,348,504,769 | 2,416,622,005 | ||||||||
Undistributed (distributions in excess of) net investment income | 3,923,703 | (2,559,876 | ) | |||||||
Accumulated net realized gain | 4,156,770 | 12,099,413 | ||||||||
Net unrealized gain | 57,959,808 | 517,190,134 | ||||||||
| NET ASSETS | $ | 1,414,545,050 | $ | 2,943,351,676 | ||||||
Net Assets: | ||||||||||
Class A | $ | 528,975,800 | $ | 1,004,005,704 | ||||||
Class B | 4,206,001 | — | ||||||||
Class C | 357,491,802 | 506,780,972 | ||||||||
Institutional | 456,405,629 | 1,102,624,921 | ||||||||
Class IR | 67,465,818 | 324,225,236 | ||||||||
Class R | — | 5,714,843 | ||||||||
Total Net Assets | $ | 1,414,545,050 | $ | 2,943,351,676 | ||||||
Shares Outstanding $0.001 par value (unlimited shares authorized): | ||||||||||
Class A | 22,942,564 | 50,794,021 | ||||||||
Class B | 183,772 | — | ||||||||
Class C | 15,719,305 | 25,442,164 | ||||||||
Institutional | 19,442,112 | 54,652,893 | ||||||||
Class IR | 2,880,307 | 16,081,087 | ||||||||
Class R | — | 289,779 | ||||||||
Net asset value, offering and redemption price per share:(a) | ||||||||||
Class A | $23.06 | $19.77 | ||||||||
Class B | 22.89 | — | ||||||||
Class C | 22.74 | 19.92 | ||||||||
Institutional | 23.48 | 20.18 | ||||||||
Class IR | 23.42 | 20.16 | ||||||||
Class R | — | 19.72 | ||||||||
| (a) | Maximum public offering price per share for Class A shares of the Income Builder and the Rising Dividend Growth Funds is $24.40 and $20.92, respectively. At redemption, Class B and Class C Shares may be subject to a contingent deferred sales charge, assessed on the amount equal to the lesser of the current net asset value or the original purchase price of the shares. |
| 34 | The accompanying notes are an integral part of these financial statements. |
GOLDMAN SACHS DIVIDEND FOCUS FUNDS
Statements of Operations
For the Six Months Ended April 30, 2014 (Unaudited)
| Income Builder Fund | Rising Dividend Growth Fund | |||||||||
| Investment income: | ||||||||||
Dividends — unaffiliated issuers (net of foreign withholding taxes of $171,028 and $812,326) | $ | 15,599,153 | $ | 29,711,049 | ||||||
Dividends — affiliated issuers | 86,705 | — | ||||||||
Interest | 15,139,244 | 23,831 | ||||||||
| Total investment income | 30,825,102 | 29,734,880 | ||||||||
| Expenses: | ||||||||||
Management fees | 3,265,211 | 9,349,562 | ||||||||
Distribution and Service fees(a) | 1,762,950 | 3,400,749 | ||||||||
Transfer Agent fees(a) | 726,538 | 1,795,295 | ||||||||
Custody, accounting and administrative services | 110,665 | 92,617 | ||||||||
Printing and mailing costs | 75,195 | 173,700 | ||||||||
Registration fees | 62,624 | 95,482 | ||||||||
Professional fees | 49,419 | 49,301 | ||||||||
Shareholder meeting expense | 13,537 | 60,400 | ||||||||
Trustee fees | 13,023 | 16,044 | ||||||||
Other | 7,118 | 51,868 | ||||||||
| Total expenses | 6,086,280 | 15,085,018 | ||||||||
Less — expense reductions | (983,401 | ) | (290,761 | ) | ||||||
| Net expenses | 5,102,879 | 14,794,257 | ||||||||
| NET INVESTMENT INCOME | 25,722,223 | 14,940,623 | ||||||||
| Realized and unrealized gain (loss): | ||||||||||
Capital gain distributions from Affiliated Underlying Funds | 97,239 | — | ||||||||
Net realized gain (loss) from: | ||||||||||
Investments — unaffiliated issuers | 7,976,238 | 27,421,383 | ||||||||
Futures contracts | (3,402,275 | ) | — | |||||||
Swap contracts | 286 | — | ||||||||
Forward foreign currency exchange contracts | (488,065 | ) | — | |||||||
Foreign currency transactions | 74,854 | (1,215 | ) | |||||||
Net change in unrealized gain (loss) on: | ||||||||||
Investments — unaffiliated issuers | 33,254,515 | 147,861,776 | ||||||||
Investments — affiliated issuers | (47,333 | ) | — | |||||||
Futures contracts | (2,337,094 | ) | — | |||||||
Swap contracts | 4,951 | — | ||||||||
Forward foreign currency exchange contracts | (149,709 | ) | — | |||||||
Foreign currency transactions | (6,265 | ) | — | |||||||
| Net realized and unrealized gain | 34,977,342 | 175,281,944 | ||||||||
| NET INCREASE IN NET ASSETS RESULTING FROM OPERATIONS | $ | 60,699,565 | $ | 190,222,567 | ||||||
| (a) | Class specific Distribution and Service and Transfer Agent fees were as follows: |
| Distribution and Service Fees | Transfer Agent Fees | |||||||||||||||||||||||||||||||||||||||
Fund | Class A | Class B | Class C | Class R | Class A | Class B | Class C | Institutional | Class IR | Class R | ||||||||||||||||||||||||||||||
Income Builder | $ | 492,371 | $ | 22,499 | $ | 1,248,080 | $ | — | $ | 374,202 | $ | 4,275 | $ | 237,135 | $ | 63,444 | $ | 47,482 | $ | — | ||||||||||||||||||||
Rising Dividend Growth | 1,165,240 | — | 2,223,715 | 11,794 | 885,582 | — | 422,506 | 202,541 | 280,184 | 4,482 | ||||||||||||||||||||||||||||||
| The accompanying notes are an integral part of these financial statements. | 35 |
GOLDMAN SACHS DIVIDEND FOCUS FUNDS
Statements of Changes in Net Assets
| Income Builder Fund | ||||||||||
| For the Six Months Ended April 30, 2014 (Unaudited) | For the Fiscal Year Ended October 31, 2013 | |||||||||
| From operations: | ||||||||||
Net investment income | $ | 25,722,223 | $ | 8,765,397 | ||||||
Net realized gain | 4,258,277 | 8,649,292 | ||||||||
Net change in unrealized gain | 30,719,065 | 18,809,728 | ||||||||
| Net increase in net assets resulting from operations | 60,699,565 | 36,224,417 | ||||||||
| Distributions to shareholders: | ||||||||||
From net investment income | ||||||||||
Class A Shares | (8,482,199 | ) | (5,386,133 | ) | ||||||
Class B Shares | (72,715 | ) | (173,759 | ) | ||||||
Class C Shares | (4,606,540 | ) | (1,715,911 | ) | ||||||
Institutional Shares | (7,602,797 | ) | (2,603,684 | ) | ||||||
Class IR Shares | (1,123,653 | ) | (348,795 | ) | ||||||
From net realized gains | ||||||||||
Class A Shares | (3,114,648 | ) | (2,637,969 | ) | ||||||
Class B Shares | (45,932 | ) | (167,366 | ) | ||||||
Class C Shares | (1,878,189 | ) | (586,841 | ) | ||||||
Institutional Shares | (2,050,389 | ) | (487,343 | ) | ||||||
Class IR Shares | (375,740 | ) | (47,368 | ) | ||||||
| Total distributions to shareholders | (29,352,802 | ) | (14,155,169 | ) | ||||||
| From share transactions: | ||||||||||
Proceeds from sales of shares | 812,160,576 | 563,499,563 | ||||||||
Reinvestment of distributions | 25,453,495 | 12,342,444 | ||||||||
Cost of shares redeemed | (108,732,235 | ) | (78,493,813 | ) | ||||||
| Net increase in net assets resulting from share transactions | 728,881,836 | 497,348,194 | ||||||||
| TOTAL INCREASE | 760,228,599 | 519,417,442 | ||||||||
| Net assets: | ||||||||||
Beginning of period | 654,316,451 | 134,899,009 | ||||||||
End of period | $ | 1,414,545,050 | $ | 654,316,451 | ||||||
| Undistributed net investment income | $ | 3,923,703 | $ | 89,384 | ||||||
| 36 | The accompanying notes are an integral part of these financial statements. |
GOLDMAN SACHS DIVIDEND FOCUS FUNDS
Statements of Changes in Net Assets
| Rising Dividend Growth Fund | ||||||||||
| For the Six Months Ended April 30, 2014 (Unaudited) | For the Fiscal Year Ended October 31, 2013 | |||||||||
| From operations: | ||||||||||
Net investment income (loss) | $ | 14,940,623 | $ | (1,709,791 | ) | |||||
Net realized gain (loss) | 27,420,168 | (5,025,601 | ) | |||||||
Net change in unrealized gain | 147,861,776 | 319,757,880 | ||||||||
| Net increase in net assets resulting from operations | 190,222,567 | 313,022,488 | ||||||||
| Distributions to shareholders: | ||||||||||
From net investment income | ||||||||||
Class A Shares | (4,121,959 | ) | (1,091,632 | ) | ||||||
Class C Shares | (376,598 | ) | (119,284 | ) | ||||||
Institutional Shares | (6,296,729 | ) | (1,607,247 | ) | ||||||
Class IR Shares | (1,628,250 | ) | (342,163 | ) | ||||||
Class R Shares | (16,034 | ) | (3,776 | ) | ||||||
Return of Capital | ||||||||||
Class A Shares | — | (3,951,552 | ) | |||||||
Class C Shares | — | (431,793 | ) | |||||||
Institutional Shares | — | (5,818,006 | ) | |||||||
Class IR Shares | — | (1,238,583 | ) | |||||||
Class R Shares | — | (13,668 | ) | |||||||
| Total distributions to shareholders | (12,439,570 | ) | (14,617,704 | ) | ||||||
| From share transactions: | ||||||||||
Proceeds from sales of shares | 657,733,321 | 1,880,312,307 | ||||||||
Reinvestment of distributions | 10,665,052 | 12,790,523 | ||||||||
Cost of shares redeemed | (327,111,010 | ) | (347,379,569 | ) | ||||||
| Net increase in net assets resulting from share transactions | 341,287,363 | 1,545,723,261 | ||||||||
| TOTAL INCREASE | 519,070,360 | 1,844,128,045 | ||||||||
| Net assets: | ||||||||||
Beginning of period | 2,424,281,316 | 580,153,271 | ||||||||
End of period | $ | 2,943,351,676 | $ | 2,424,281,316 | ||||||
| Distribution in excess of net investment income | $ | (2,559,876 | ) | $ | (5,060,929 | ) | ||||
| The accompanying notes are an integral part of these financial statements. | 37 |
GOLDMAN SACHS INCOME BUILDER FUND
Financial Highlights
Selected Data for a Share Outstanding Throughout Each Period
| Income (loss) from investment operations | Distributions to shareholders | |||||||||||||||||||||||||||||
| Year - Share Class | Net asset | Net investment income(a) | Net realized and unrealized gain | Total from investment operations | From net investment income | From net realized gains | Total distributions | |||||||||||||||||||||||
| FOR THE SIX MONTHS ENDED APRIL 30, (UNAUDITED) | ||||||||||||||||||||||||||||||
2014 - A | $ | 22.47 | $ | 0.57 | $ | 0.69 | $ | 1.26 | $ | (0.46 | ) | $ | (0.21 | ) | $ | (0.67 | ) | |||||||||||||
2014 - B | 22.30 | 0.47 | 0.70 | 1.17 | (0.37 | ) | (0.21 | ) | (0.58 | ) | ||||||||||||||||||||
2014 - C | 22.17 | 0.48 | 0.68 | 1.16 | (0.38 | ) | (0.21 | ) | (0.59 | ) | ||||||||||||||||||||
2014 - Institutional | 22.86 | 0.64 | 0.69 | 1.33 | (0.50 | ) | (0.21 | ) | (0.71 | ) | ||||||||||||||||||||
2014 - IR | 22.81 | 0.61 | 0.70 | 1.31 | (0.49 | ) | (0.21 | ) | (0.70 | ) | ||||||||||||||||||||
| FOR THE FISCAL YEARS ENDED OCTOBER 31, | ||||||||||||||||||||||||||||||
2013 - A | 20.99 | 0.75 | 2.21 | 2.96 | (0.88 | ) | (0.60 | ) | (1.48 | ) | ||||||||||||||||||||
2013 - B | 20.84 | 0.61 | 2.17 | 2.78 | (0.72 | ) | (0.60 | ) | (1.32 | ) | ||||||||||||||||||||
2013 - C | 20.74 | 0.57 | 2.19 | 2.76 | (0.73 | ) | (0.60 | ) | (1.33 | ) | ||||||||||||||||||||
2013 - Institutional | 21.33 | 0.83 | 2.27 | 3.10 | (0.97 | ) | (0.60 | ) | (1.57 | ) | ||||||||||||||||||||
2013 - IR | 21.29 | 0.79 | 2.27 | 3.06 | (0.94 | ) | (0.60 | ) | (1.54 | ) | ||||||||||||||||||||
2012 - A | 19.01 | 0.55 | 1.95 | 2.50 | (0.52 | ) | — | (0.52 | ) | |||||||||||||||||||||
2012 - B | 18.87 | 0.39 | 1.94 | 2.33 | (0.36 | ) | — | (0.36 | ) | |||||||||||||||||||||
2012 - C | 18.79 | 0.42 | 1.90 | 2.32 | (0.37 | ) | — | (0.37 | ) | |||||||||||||||||||||
2012 - Institutional | 19.31 | 0.66 | 1.97 | 2.63 | (0.61 | ) | — | (0.61 | ) | |||||||||||||||||||||
2012 - IR | 19.28 | 0.57 | 2.02 | 2.59 | (0.58 | ) | — | (0.58 | ) | |||||||||||||||||||||
2011 - A | 18.21 | 0.42 | (f) | 0.83 | 1.25 | (0.45 | ) | — | (0.45 | ) | ||||||||||||||||||||
2011 - B | 18.07 | 0.28 | (f) | 0.83 | 1.11 | (0.31 | ) | — | (0.31 | ) | ||||||||||||||||||||
2011 - C | 18.01 | 0.26 | (f) | 0.84 | 1.10 | (0.32 | ) | — | (0.32 | ) | ||||||||||||||||||||
2011 - Institutional | 18.50 | �� | 0.47 | (f) | 0.87 | 1.34 | (0.53 | ) | — | (0.53 | ) | |||||||||||||||||||
2011 - IR | 18.48 | 0.40 | (f) | 0.90 | 1.30 | (0.50 | ) | — | (0.50 | ) | ||||||||||||||||||||
2010 - A | 16.32 | 0.48 | (g) | 1.97 | 2.45 | (0.56 | ) | — | (0.56 | ) | ||||||||||||||||||||
2010 - B | 16.19 | 0.35 | (g) | 1.96 | 2.31 | (0.43 | ) | — | (0.43 | ) | ||||||||||||||||||||
2010 - C | 16.14 | 0.34 | (g) | 1.97 | 2.31 | (0.44 | ) | — | (0.44 | ) | ||||||||||||||||||||
2010 - Institutional | 16.57 | 0.55 | (g) | 2.01 | 2.56 | (0.63 | ) | — | (0.63 | ) | ||||||||||||||||||||
2010 - IR (Commenced August 31, 2010) | 17.28 | 0.06 | (g) | 1.28 | 1.34 | (0.14 | ) | — | (0.14 | ) | ||||||||||||||||||||
2009 - A | 14.64 | 0.46 | 1.71 | 2.17 | (0.49 | ) | — | (0.49 | ) | |||||||||||||||||||||
2009 - B | 14.53 | 0.35 | 1.69 | 2.04 | (0.38 | ) | — | (0.38 | ) | |||||||||||||||||||||
2009 - C | 14.49 | 0.35 | 1.68 | 2.03 | (0.38 | ) | — | (0.38 | ) | |||||||||||||||||||||
2009 - Institutional | 14.86 | 0.53 | 1.73 | 2.26 | (0.55 | ) | — | (0.55 | ) | |||||||||||||||||||||
| (a) | Calculated based on the average shares outstanding methodology. |
| (b) | Assumes investment at the net asset value at the beginning of the period, reinvestment of all dividends and distributions, a complete redemption of the investment at the net asset value at the end of the period and no sales or redemption charges. Total returns would be reduced if a sales or redemption charge was taken into account. Returns do not reflect the deduction of taxes that a shareholder would pay on Fund distributions or the redemption of Fund shares. Total returns for periods less than one full year are not annualized. |
| (c) | Expense ratios exclude the expenses of the Underlying Funds in which the Fund invests. |
| (d) | The Fund’s portfolio turnover rate is calculated in accordance with regulatory requirements, without regard to transactions involving short term investments and certain derivatives. If such transactions were included, the Fund’s portfolio turnover rate may be higher. |
| (e) | Annualized. |
| (f) | Reflects income recognized from special dividends which amounted to $0.08 per share and 0.40% of average net assets. |
| (g) | Reflects income recognized from special dividends which amounted to $0.05 per share and 0.28% of average net assets. |
| 38 | The accompanying notes are an integral part of these financial statements. |
GOLDMAN SACHS INCOME BUILDER FUND
| Net asset value, end of period | Total return(b) | Net assets, end of period (in 000s) | Ratio of net expenses to average net assets(c) | Ratio of total expenses to average net assets(c) | Ratio of net investment income to average net assets | Portfolio turnover rate(d) | ||||||||||||||||||||||||||||||||||
| $ | 23.06 | 5.70 | % | $ | 528,976 | 0.95 | %(e) | 1.15 | %(e) | 5.06 | %(e) | 26 | % | |||||||||||||||||||||||||||
| 22.89 | 5.34 | 4,206 | 1.70 | (e) | 1.90 | (e) | 4.23 | (e) | 26 | |||||||||||||||||||||||||||||||
| 22.74 | 5.32 | 357,492 | 1.70 | (e) | 1.90 | (e) | 4.34 | (e) | 26 | |||||||||||||||||||||||||||||||
| 23.48 | 5.89 | 456,406 | 0.55 | (e) | 0.75 | (e) | 5.62 | (e) | 26 | |||||||||||||||||||||||||||||||
| 23.42 | 5.83 | 67,466 | 0.70 | (e) | 0.90 | (e) | 5.34 | (e) | 26 | |||||||||||||||||||||||||||||||
| 22.47 | 14.81 | 279,374 | 0.97 | 1.27 | 3.48 | 53 | ||||||||||||||||||||||||||||||||||
| 22.30 | 13.94 | 4,873 | 1.73 | 2.03 | 2.85 | 53 | ||||||||||||||||||||||||||||||||||
| 22.17 | 13.94 | 155,764 | 1.71 | 2.02 | 2.64 | 53 | ||||||||||||||||||||||||||||||||||
| 22.86 | 15.25 | 180,419 | 0.56 | 0.86 | 3.74 | 53 | ||||||||||||||||||||||||||||||||||
| 22.81 | 15.06 | 33,886 | 0.71 | 1.01 | 3.55 | 53 | ||||||||||||||||||||||||||||||||||
| 20.99 | 13.26 | 95,116 | 1.05 | 1.44 | 2.73 | 369 | ||||||||||||||||||||||||||||||||||
| 20.84 | 12.38 | 5,843 | 1.80 | 2.19 | 1.97 | 369 | ||||||||||||||||||||||||||||||||||
| 20.74 | 12.39 | 18,699 | 1.80 | 2.21 | 2.09 | 369 | ||||||||||||||||||||||||||||||||||
| 21.33 | 13.74 | 13,601 | 0.65 | 1.06 | 3.21 | 369 | ||||||||||||||||||||||||||||||||||
| 21.29 | 13.55 | 1,639 | 0.80 | 1.19 | 2.77 | 369 | ||||||||||||||||||||||||||||||||||
| 19.01 | 6.95 | 94,819 | 1.05 | 1.38 | 2.20 | (f) | 357 | |||||||||||||||||||||||||||||||||
| 18.87 | 6.16 | 6,332 | 1.80 | 2.13 | 1.47 | (f) | 357 | |||||||||||||||||||||||||||||||||
| 18.79 | 6.13 | 9,297 | 1.80 | 2.13 | 1.38 | (f) | 357 | |||||||||||||||||||||||||||||||||
| 19.31 | 7.33 | 6,610 | 0.65 | 0.98 | 2.44 | (f) | 357 | |||||||||||||||||||||||||||||||||
| 19.28 | 7.09 | 177 | 0.80 | (e) | 1.13 | (e) | 2.06 | (e)(f) | 357 | |||||||||||||||||||||||||||||||
| 18.21 | 15.29 | 108,710 | 1.05 | 1.40 | 2.75 | (g) | 238 | |||||||||||||||||||||||||||||||||
| 18.07 | 14.46 | 7,991 | 1.80 | 2.15 | 2.03 | (g) | 238 | |||||||||||||||||||||||||||||||||
| 18.01 | 14.48 | 7,665 | 1.80 | 2.15 | 1.99 | (g) | 238 | |||||||||||||||||||||||||||||||||
| 18.50 | 15.76 | 2,919 | 0.65 | 1.00 | 3.14 | (g) | 238 | |||||||||||||||||||||||||||||||||
| 18.48 | 7.77 | 1 | 0.80 | 1.15 | 2.10 | (g) | 238 | |||||||||||||||||||||||||||||||||
| 16.32 | 15.32 | 111,326 | 1.05 | 1.38 | 3.20 | 173 | ||||||||||||||||||||||||||||||||||
| 16.19 | 14.41 | 8,970 | 1.80 | 2.13 | 2.47 | 173 | ||||||||||||||||||||||||||||||||||
| 16.14 | 14.43 | 7,022 | 1.80 | 2.13 | 2.44 | 173 | ||||||||||||||||||||||||||||||||||
| 16.57 | 15.76 | 2,572 | 0.65 | 0.98 | 3.58 | 173 | ||||||||||||||||||||||||||||||||||
| The accompanying notes are an integral part of these financial statements. | 39 |
GOLDMAN SACHS RISING DIVIDEND GROWTH FUND
Financial Highlights
Selected Data for a Share Outstanding Throughout Each Period
| Income (loss) from investment operations | Distributions to shareholders | |||||||||||||||||||||||||||||||||
| Year - Share Class | Net asset | Net investment income (loss) | Net realized and unrealized gain (loss) | Total from investment operations | From net investment income | From capital | In excess Investment income | Total distributions | ||||||||||||||||||||||||||
| FOR THE SIX MONTHS ENDED APRIL 30, (UNAUDITED) | ||||||||||||||||||||||||||||||||||
2014 - A | $ | 18.50 | $ | 0.10 | (c) | $ | 1.25 | $ | 1.35 | $ | (0.08 | ) | $ | — | $ | — | $ | (0.08 | ) | |||||||||||||||
2014 - C | 18.65 | 0.03 | (c) | 1.26 | 1.29 | (0.02 | ) | — | — | (0.02 | ) | |||||||||||||||||||||||
2014 - Institutional | 18.88 | 0.14 | (c) | 1.28 | 1.42 | (0.12 | ) | — | — | (0.12 | ) | |||||||||||||||||||||||
2014 - IR | 18.87 | 0.13 | (c) | 1.27 | 1.40 | (0.11 | ) | — | — | (0.11 | ) | |||||||||||||||||||||||
2014 - R | 18.46 | 0.08 | (c) | 1.24 | 1.32 | (0.06 | ) | — | — | (0.06 | ) | |||||||||||||||||||||||
| FOR THE FISCAL YEARS ENDED OCTOBER 31, | ||||||||||||||||||||||||||||||||||
2013 - A | 15.16 | (0.03 | )(c) | 3.54 | 3.51 | (0.04 | ) | (0.13 | ) | — | (0.17 | ) | ||||||||||||||||||||||
2013 - C | 15.30 | (0.17 | )(c) | 3.58 | 3.41 | (0.02 | ) | (0.04 | ) | — | (0.06 | ) | ||||||||||||||||||||||
2013 - Institutional | 15.46 | 0.04 | (c) | 3.61 | 3.65 | (0.06 | ) | (0.17 | ) | — | (0.23 | ) | ||||||||||||||||||||||
2013 - IR | 15.46 | — | (c)(e) | 3.61 | 3.61 | (0.04 | ) | (0.16 | ) | — | (0.20 | ) | ||||||||||||||||||||||
2013 - R | 15.15 | (0.11 | )(c) | 3.57 | 3.46 | (0.02 | ) | (0.13 | ) | — | (0.15 | ) | ||||||||||||||||||||||
| FOR THE PERIOD ENDED OCTOBER 1, 2012 TO OCTOBER 31* | ||||||||||||||||||||||||||||||||||
2012 - A | 15.35 | (0.01 | )(c) | (0.18 | ) | (0.19 | ) | — | — | — | — | |||||||||||||||||||||||
2012 - C | 15.50 | (0.02 | )(c) | (0.18 | ) | (0.20 | ) | — | — | — | — | |||||||||||||||||||||||
2012 - Institutional | 15.65 | (0.01 | )(c) | (0.18 | ) | (0.19 | ) | — | — | — | — | |||||||||||||||||||||||
2012 - IR | 15.65 | (0.01 | )(c) | (0.18 | ) | (0.19 | ) | — | — | — | — | |||||||||||||||||||||||
2012 - R | 15.34 | (0.02 | )(c) | (0.17 | ) | (0.19 | ) | — | — | — | — | |||||||||||||||||||||||
| FOR THE FISCAL YEARS ENDED SEPTEMBER 30, | ||||||||||||||||||||||||||||||||||
2012 - A | 12.82 | 0.05 | (c) | 2.66 | 2.71 | (0.16 | ) | (0.02 | ) | — | (0.18 | ) | ||||||||||||||||||||||
2012 - C | 12.97 | (0.07 | )(c) | 2.71 | 2.64 | (0.09 | ) | (0.02 | ) | — | (0.11 | ) | ||||||||||||||||||||||
2012 - Institutional | 13.06 | 0.11 | (c) | 2.71 | 2.82 | (0.21 | ) | (0.02 | ) | — | (0.23 | ) | ||||||||||||||||||||||
2012 - IR | 15.25 | (0.01 | )(c) | 0.57 | 0.56 | (0.14 | ) | (0.02 | ) | — | (0.16 | ) | ||||||||||||||||||||||
2012 - R | 14.96 | (0.07 | )(c) | 0.57 | 0.50 | (0.10 | ) | (0.02 | ) | — | (0.12 | ) | ||||||||||||||||||||||
2011 - A | 12.94 | 0.02 | (c) | 0.12 | 0.14 | (0.03 | ) | (0.15 | ) | (0.08 | ) | (0.26 | ) | |||||||||||||||||||||
2011 - C | 13.08 | (0.07 | )(c) | 0.15 | 0.08 | (0.02 | ) | (0.11 | ) | (0.06 | ) | (0.19 | ) | |||||||||||||||||||||
2011 - Institutional | 13.16 | 0.07 | (c) | 0.14 | 0.21 | (0.03 | ) | (0.18 | ) | (0.10 | ) | (0.31 | ) | |||||||||||||||||||||
2010 - A | 11.07 | 0.01 | 2.05 | 2.06 | (0.01 | ) | — | (0.18 | ) | (0.19 | ) | |||||||||||||||||||||||
2010 - C | 11.14 | (0.07 | ) | 2.12 | 2.05 | — | (e) | — | (0.11 | ) | (0.11 | ) | ||||||||||||||||||||||
2010 - Institutional | 11.25 | 0.10 | 2.05 | 2.15 | (0.01 | ) | — | (0.23 | ) | (0.24 | ) | |||||||||||||||||||||||
2009 - A | 11.31 | 0.04 | (0.04 | ) | — | (0.06 | ) | (0.10 | ) | (0.08 | ) | (0.24 | ) | |||||||||||||||||||||
2009 - C | 11.39 | (0.02 | ) | (0.05 | ) | (0.07 | ) | (0.04 | ) | (0.08 | ) | (0.06 | ) | (0.18 | ) | |||||||||||||||||||
2009 - Institutional | 11.50 | 0.09 | (0.06 | ) | 0.03 | (0.07 | ) | (0.12 | ) | (0.09 | ) | (0.28 | ) | |||||||||||||||||||||
| * | The Fund changed its fiscal year end from September 30 to October 31. |
| (a) | Assumes investment at the net asset value at the beginning of the period, reinvestment of all dividends and distributions, a complete redemption of the investment at the net asset value at the beginning of the period and no sales or redemption charges. Total returns would be reduced if a sales or redemption charge was taken into account. Returns do not reflect the deduction of taxes that a shareholder would pay on Fund distributions or the redemption of Fund shares. Total returns for periods less than one full year are not annualized. The Goldman Sachs Rising Dividend Growth Fund’s predecessor was the Rising Dividend Growth Fund (the “Predecessor Fund”). On February 27, 2012, the Predecessor Fund was reorganized as a new series of the Goldman Sachs Trust. Performance prior to February 27, 2012 is that of the Predecessor Fund. Total return information of the Predecessor Fund is provided in the above table because the Predecessor Fund is considered the accounting survivor of the reorganization. |
| (b) | The Fund’s portfolio turnover rate is calculated in accordance with regulatory requirements, without regard to transactions involving short term investments and certain derivatives. If such transactions were included, the Fund’s portfolio turnover rate may be higher. |
| (c) | Calculated based on the average shares outstanding methodology. |
| (d) | Annualized. |
| (e) | Amount is less than $0.005 per share. |
| (f) | Expense ratios include the effect of the operating expenses of the Predecessor Fund prior to Reorganization. |
| 40 | The accompanying notes are an integral part of these financial statements. |
GOLDMAN SACHS RISING DIVIDEND GROWTH FUND
| Net asset value, end of period | Total return(a) | Net assets, end of period (in 000s) | Ratio of net expenses to average net assets | Ratio of total expenses to average net assets | Ratio of net investment income (loss) to average net assets | Portfolio turnover rate(b) | ||||||||||||||||||||||||||||||||||
| $ | 19.77 | $ | 7.33 | $ | 1,004,006 | 1.15 | %(d) | 1.17 | %(d) | 1.05 | %(d) | 5 | % | |||||||||||||||||||||||||||
| 19.92 | 6.89 | 506,781 | 1.90 | (d) | 1.92 | (d) | 0.31 | (d) | 5 | |||||||||||||||||||||||||||||||
| 20.18 | 7.55 | 1,102,625 | 0.75 | (d) | 0.78 | (d) | 1.45 | (d) | 5 | |||||||||||||||||||||||||||||||
| 20.16 | 7.42 | 324,225 | 0.90 | (d) | 0.92 | (d) | 1.31 | (d) | 5 | |||||||||||||||||||||||||||||||
| 19.72 | 7.17 | 5,715 | 1.40 | (d) | 1.43 | (d) | 0.81 | (d) | 5 | |||||||||||||||||||||||||||||||
| 18.50 | 23.27 | 858,185 | 1.18 | 1.21 | (0.18 | ) | 13 | |||||||||||||||||||||||||||||||||
| 18.65 | 22.35 | 384,551 | 1.93 | 1.96 | (0.98 | ) | 13 | |||||||||||||||||||||||||||||||||
| 18.88 | 23.77 | 918,912 | 0.78 | 0.81 | 0.21 | 13 | ||||||||||||||||||||||||||||||||||
| 18.87 | 23.55 | 258,492 | 0.93 | 0.96 | 0.03 | 13 | ||||||||||||||||||||||||||||||||||
| 18.46 | 22.98 | 4,141 | 1.42 | 1.45 | (0.63 | ) | 13 | |||||||||||||||||||||||||||||||||
| 15.16 | (1.24 | ) | 252,945 | 1.20 | (d) | 1.32 | (d) | (0.69 | )(d) | 2 | ||||||||||||||||||||||||||||||
| 15.30 | (1.29 | ) | 61,464 | 1.94 | (d) | 2.06 | (d) | (1.39 | )(d) | 2 | ||||||||||||||||||||||||||||||
| 15.46 | (1.21 | ) | 220,145 | 0.80 | (d) | 0.93 | (d) | (0.31 | )(d) | 2 | ||||||||||||||||||||||||||||||
| 15.46 | (1.21 | ) | 45,472 | 0.95 | (d) | 1.07 | (d) | (0.40 | )(d) | 2 | ||||||||||||||||||||||||||||||
| 15.15 | (1.24 | ) | 127 | 1.45 | (d) | 1.57 | (d) | (0.99 | )(d) | 2 | ||||||||||||||||||||||||||||||
| 15.35 | 21.15 | 230,319 | 1.31 | (f) | 1.49 | (f) | 0.35 | (f) | 18 | |||||||||||||||||||||||||||||||
| 15.50 | 20.38 | 51,158 | 2.04 | (f) | 2.16 | (f) | (0.45 | )(f) | 18 | |||||||||||||||||||||||||||||||
| 15.65 | 21.64 | 195,794 | 0.93 | (f) | 1.10 | (f) | 0.74 | (f) | 18 | |||||||||||||||||||||||||||||||
| 15.65 | 3.70 | 36,122 | 0.95 | (d) | 1.14 | (d) | 0.50 | (d) | 18 | |||||||||||||||||||||||||||||||
| 15.34 | 3.36 | 127 | 1.42 | (d) | 1.60 | (d) | (0.17 | )(d) | 18 | |||||||||||||||||||||||||||||||
| 12.82 | 0.95 | 66,336 | 1.65 | 1.68 | 0.12 | 52 | ||||||||||||||||||||||||||||||||||
| 12.97 | 0.51 | 12,332 | 2.25 | 2.28 | (0.48 | ) | 52 | |||||||||||||||||||||||||||||||||
| 13.06 | 1.47 | 55,565 | 1.25 | 1.28 | 0.51 | 52 | ||||||||||||||||||||||||||||||||||
| 12.94 | 18.69 | 46,003 | 1.65 | 1.86 | 0.01 | 25 | ||||||||||||||||||||||||||||||||||
| 13.08 | 18.50 | 4,456 | 2.25 | 2.46 | (0.59 | ) | 25 | |||||||||||||||||||||||||||||||||
| 13.16 | 19.21 | 18,092 | 1.25 | 1.46 | 0.41 | 25 | ||||||||||||||||||||||||||||||||||
| 11.07 | 0.33 | 39,998 | 1.65 | 1.92 | 0.51 | 39 | ||||||||||||||||||||||||||||||||||
| 11.14 | (0.37 | ) | 3,898 | 2.25 | 2.52 | (0.10 | ) | 39 | ||||||||||||||||||||||||||||||||
| 11.25 | 0.63 | 12,628 | 1.25 | 1.52 | 0.97 | 39 | ||||||||||||||||||||||||||||||||||
| The accompanying notes are an integral part of these financial statements. | 41 |
GOLDMAN SACHS DIVIDEND FOCUS FUNDS
Notes to Financial Statements
April 30, 2014 (Unaudited)
| 1. ORGANIZATION |
Goldman Sachs Trust (the “Trust”) is a Delaware statutory trust registered under the Investment Company Act of 1940, as amended (the “Act”), as an open-end management investment company. The following table lists those series of the Trust that are included in this report (collectively, the “Funds” or individually a “Fund”), along with their corresponding share classes and respective diversification status under the Act:
| Fund | Share Classes Offered* | Diversified/ Non-diversified | ||
Income Builder | A, B, C, Institutional and IR | Diversified | ||
Rising Dividend Growth | A, C, Institutional, IR and R | Non-Diversified |
| * | Class B Shares are generally no longer available for purchase by current or prospective investors. |
Class A Shares are sold with a front-end sales charge of up to 5.50%. Class B Shares were sold with a contingent deferred sales charge (“CDSC”) that declines from 5.00% to zero, depending upon the period of time the shares are held. Class C Shares are sold with CDSC of 1.00% which is imposed on redemptions made within 12 months of purchase.
Goldman Sachs Asset Management, L.P. (“GSAM”), an affiliate of Goldman, Sachs & Co. (“Goldman Sachs”), serves as investment adviser to the Fund pursuant to a management agreement (the “Agreement”) with the Trust.
| 2. SIGNIFICANT ACCOUNTING POLICIES |
The financial statements have been prepared in accordance with accounting principles generally accepted in the United States of America (“GAAP”) and require management to make estimates and assumptions that may affect the reported amounts and disclosures. Actual results may differ from those estimates and assumptions.
A. Investment Valuation — The Funds’ valuation policy is to value investments at fair value.
B. Investment Income and Investments — Investment income includes interest income and dividend income, net of any foreign withholding taxes, less any amounts reclaimable. Interest income is accrued daily and adjusted for amortization of premiums and accretion of discounts. Dividend income is recognized on ex-dividend date or, for certain foreign securities, as soon as such information is obtained subsequent to the ex-dividend date. Investment transactions are reflected on trade date. Realized gains and losses are calculated using identified cost. Investment transactions are recorded on the following business day for daily net asset value (“NAV”) calculations. Any foreign capital gains tax is accrued daily based upon net unrealized gains, and is payable upon sale of such investments. Distributions received from the Funds’ investments in United States (“U.S.”) real estate investment trusts (“REITs”) may be characterized as ordinary income, net capital gain or a return of capital. A return of capital is recorded by the Funds as a reduction to the cost basis of the REIT. Distributions from Master Limited Partnerships (“MLPs”) are generally recorded based on the characterization reported on the MLP’s tax return.
For derivative contracts, realized gains and losses are recorded upon settlement of the contract. Upfront payments are made or received upon entering into a swap agreement and are reflected in the Statement of Assets and Liabilities. Upfront payments are recognized over the contract’s term/event as realized gains or losses, with the exception of forward starting interest rate swaps whose realized gains or losses are recognized from the effective start date.
42
GOLDMAN SACHS DIVIDEND FOCUS FUNDS
| 2. SIGNIFICANT ACCOUNTING POLICIES (continued) |
C. Class Allocations and Expenses — Investment income, realized and unrealized gain (loss), and non-class specific expenses of each Fund are allocated daily based upon the proportion of net assets of each class. Class specific expenses, where applicable, are borne by the respective share classes and include Distribution and Service, Transfer Agent and Service and Shareholder Administration fees. Non-class specific expenses directly incurred by a Fund are charged to that Fund, while such expenses incurred by the Trust are allocated across the respective Funds on a straight-line and/or pro-rata basis depending upon the nature of the expenses.
D. Federal Taxes and Distributions to Shareholders — It is each Fund’s policy to comply with the requirements of the Internal Revenue Code of 1986, as amended (the “Code”), applicable to regulated investment companies (mutual funds) and to distribute each year substantially all of its investment company taxable income and capital gains to its shareholders. Accordingly, the Funds are not required to make any provisions for the payment of federal income tax. Distributions to shareholders are recorded on the ex-dividend date. Income and capital gains distributions, if any, are declared and paid according to the following schedule:
| Fund | Income Distributions Declared/Paid | Capital Gains Distributions Declared/Paid | ||||
Income Builder | Monthly | Annually | ||||
Rising Dividend Growth | Quarterly | Annually |
Net capital losses are carried forward to future fiscal years and may be used to the extent allowed by the Code to offset any future capital gains. Utilization of capital loss carryforwards will reduce the requirement of future capital gains distributions.
Under the Regulated Investment Company Modernization Act of 2010, the Funds are permitted to carry forward capital losses incurred in taxable years beginning after December 22, 2010 for an unlimited period. However, any losses incurred during those future taxable years will be required to be utilized prior to the losses incurred in pre-enactment taxable years. As a result of this ordering rule, pre-enactment capital loss carryforwards may be more likely to expire unused. Additionally, post-enactment capital losses that are carried forward will retain their character as either short-term or long-term capital losses rather than being considered all short-term as under previous law.
The characterization of distributions to shareholders for financial reporting purposes is determined in accordance with federal income tax rules, which may differ from GAAP. The source of each Fund’s distributions may be shown in the accompanying financial statements as either from net investment income, net realized gain or capital. Certain components of the Funds’ net assets on the Statements of Assets and Liabilities reflect permanent GAAP/tax differences based on the appropriate tax character.
E. Foreign Currency Translation — The accounting records and reporting currency of the Funds are maintained in U.S. dollars. Assets and liabilities denominated in foreign currencies are translated into U.S. dollars using the current exchange rates at the close of each business day. The effect of changes in foreign currency exchange rates on investments is included within net realized and unrealized gain (loss) on investments. Changes in the value of other assets and liabilities as a result of fluctuations in foreign exchange rates are included in the Statements of Operations within net change in unrealized gain (loss) on foreign currency transactions. Transactions denominated in foreign currencies are translated into U.S. dollars on the date the transaction occurred, the effects of which are included within net realized gain (loss) on foreign currency transactions.
43
GOLDMAN SACHS DIVIDEND FOCUS FUNDS
Notes to Financial Statements (continued)
April 30, 2014 (Unaudited)
| 3. INVESTMENTS AND FAIR VALUE MEASUREMENTS |
The fair value of a financial instrument is the amount that would be received to sell an asset or paid to transfer a liability in an orderly transaction between market participants at the measurement date (i.e., the exit price). GAAP establishes a fair value hierarchy that prioritizes the inputs to valuation techniques used to measure fair value. The hierarchy gives the highest priority to unadjusted quoted prices in active markets for identical assets or liabilities (Level 1 measurements) and the lowest priority to unobservable inputs (Level 3 measurements). The levels used for classifying investments are not necessarily an indication of the risk associated with investing in these investments. The three levels of the fair value hierarchy are described below:
Level 1 — Unadjusted quoted prices in active markets that are accessible at the measurement date for identical, unrestricted assets or liabilities;
Level 2 — Quoted prices in markets that are not active or financial instruments for which significant inputs are observable (including, but not limited to, quoted prices for similar investments, interest rates, foreign exchange rates, volatility and credit spreads), either directly or indirectly;
Level 3 — Prices or valuations that require significant unobservable inputs (including GSAM’s assumptions in determining fair value measurement).
The Trustees have adopted Valuation Procedures that govern the valuation of the portfolio investments held by the Funds, including investments for which market quotations are not readily available. The Trustees have delegated to GSAM day-to-day responsibility for implementing and maintaining internal controls and procedures related to the valuation of the Funds’ portfolio investments. To assess the continuing appropriateness of pricing sources and methodologies, GSAM regularly performs price verification procedures and issues challenges as necessary to third party pricing vendors or brokers, and any differences are reviewed in accordance with the Valuation Procedures.
A. Level 1 and Level 2 Fair Value Investments — The valuation techniques and significant inputs used in determining the fair values for investments classified as Level 1 and Level 2 are as follows:
Equity Securities — Equity securities and investment companies traded on a U.S. securities exchange or the NASDAQ system, or those located on certain foreign exchanges, including but not limited to the Americas, are valued daily at their last sale price or official closing price on the principal exchange or system on which they are traded. If no sale occurs, equity securities and exchange traded investment companies are valued at the last bid price for long positions and at the last ask price for short positions. Investments in investment companies (other than those that are exchange traded) are valued at the NAV on the valuation date. To the extent these investments are actively traded, they are classified as Level 1 of the fair value hierarchy, otherwise they are generally classified as Level 2.
Unlisted equity securities for which market quotations are available are valued at the last sale price on the valuation date, or if no sale occurs, at the last bid price. Securities traded on certain foreign securities exchanges are valued daily at fair value determined by an independent fair value service (if available) under Valuation Procedures approved by the Trustees and consistent with applicable regulatory guidance. The independent fair value service takes into account multiple factors including, but not limited to, movements in the securities markets, certain depositary receipts, futures contracts and foreign currency exchange rates that have occurred subsequent to the close of the foreign securities exchange. These investments are generally classified as Level 2 of the fair value hierarchy.
44
GOLDMAN SACHS DIVIDEND FOCUS FUNDS
| 3. INVESTMENTS AND FAIR VALUE MEASUREMENTS (continued) |
Debt Securities — Debt securities for which market quotations are readily available are valued daily on the basis of quotations supplied by dealers or an independent pricing service approved by the Trustees. The pricing services may use valuation models or matrix pricing, which consider: (i) yield or price with respect to bonds that are considered comparable in characteristics such as rating, interest rate and maturity date or (ii) quotations from securities dealers to determine current value. Short-term debt obligations that mature in sixty days or less and that do not exhibit signs of credit deterioration are valued at amortized cost, which approximates fair value. With the exception of treasury securities of G8 countries (not held in money market funds), which are generally classified as Level 1, these investments are generally classified as Level 2 of the fair value hierarchy.
i. Mortgage-Backed and Asset-Backed Securities — Mortgage-backed securities represent direct or indirect participations in, or are collateralized by and payable from, mortgage loans secured by residential and/or commercial real estate property. Asset-backed securities include securities whose principal and interest payments are collateralized by pools of other assets or receivables. The value of certain mortgage-backed and asset-backed securities (including adjustable rate mortgage loans) may be particularly sensitive to changes in prevailing interest rates. The value of these securities may also fluctuate in response to the market’s perception of the creditworthiness of the issuers.
Asset-backed securities may present credit risks that are not presented by mortgage-backed securities because they generally do not have the benefit of a security interest in collateral that is comparable to mortgage assets. Some asset-backed securities may only have a subordinated claim on collateral.
Stripped mortgage-backed securities are usually structured with two different classes: one that receives substantially all interest payments (interest-only, or “IO” and/or high coupon rate with relatively low principal amount, or “IOette”), and the other that receives substantially all principal payments (principal-only, or “PO”) from a pool of mortgage loans. Little to no principal will be received at the maturity of an IO; as a result, periodic adjustments are recorded to reduce the cost of the security until maturity. These adjustments are included in interest income.
ii. Senior Term Loans — Senior term loans (“Loans”) are interests in amounts owed by corporate, governmental, or other borrowers to lenders or lending syndicates. Loans are arranged through private negotiations between the borrower and one or more financial institutions (“Lenders”). A Fund’s investments in Loans are in the form of either participations in Loans (“Participations”) or assignments of all or a portion of Loans from third parties (“Assignments”). With respect to Participations, a Fund has the right to receive payments of principal, interest and any fees to which it is entitled from the Lender selling the Participations and only upon receipt by the Lender of the payments from the borrower. A Fund generally has no right to enforce compliance by the borrower with the terms of the loan agreement with respect to Participations. Conversely, Assignments result in a Fund having a direct contractual relationship with the borrower, and the Fund may enforce compliance by the borrower with the terms of the loan agreement.
Derivative Contracts — A derivative is an instrument whose value is derived from underlying assets, indices, reference rates or a combination of these factors.
Exchange-traded derivatives, including futures contracts, typically fall within Level 1 of the fair value hierarchy. Over-the-counter (“OTC”) and centrally cleared derivatives are valued using market transactions and other market evidence, including market-based inputs to models, calibration to market-clearing transactions, broker or dealer quotations, or other alternative pricing sources. Where models are used, the selection of a particular model to value OTC and centrally cleared derivative depends upon the contractual terms of, and specific risks inherent in, the instrument, as well as the availability of pricing information in the
45
GOLDMAN SACHS DIVIDEND FOCUS FUNDS
Notes to Financial Statements (continued)
April 30, 2014 (Unaudited)
| 3. INVESTMENTS AND FAIR VALUE MEASUREMENTS (continued) |
market. Valuation models require a variety of inputs, including contractual terms, market prices, yield curves, credit curves, measures of volatility, voluntary and involuntary prepayment rates, loss severity rates and correlations of such inputs. For OTC and centrally cleared derivatives that trade in liquid markets, model inputs can generally be verified and model selection does not involve significant management judgment. OTC and centrally cleared derivatives are classified within Level 2 of the fair value hierarchy when significant inputs are corroborated by market evidence.
i. Forward Foreign Currency Exchange Contracts — In a forward foreign currency contract, a Fund agrees to receive or deliver a fixed quantity of one currency for another, at a pre-determined price at a future date. All forward currency exchange contracts are marked-to-market daily at the applicable forward rate. Non-deliverable forward foreign currency exchange contracts are settled with the counterparty in cash without the delivery of foreign currency.
ii. Futures Contracts — Futures contracts are contracts to buy or sell a standardized quantity of a specified commodity or security and are valued based on exchanged settlement prices or independent market quotes. Futures contracts are valued at the last settlement price, or in the absence of a sale, the last bid price for long positions and at the last ask price for short positions, at the end of each day on the board of trade or exchange upon which they are traded. Upon entering into a futures contract, a Fund deposits cash or securities in an account on behalf of the broker in an amount sufficient to meet the initial margin requirement. Subsequent payments are made or received by a Fund equal to the daily change in the contract value and are recorded as variation margin receivable or payable with a corresponding offset to unrealized gains or losses.
iii. Swap Contracts — Swaps are marked-to-market daily using pricing vendor quotations, counterparty or clearninghouse prices or model prices, and the change in value, if any, is recorded as an unrealized gain or loss.
A credit default swap is an agreement that involves one party (the buyer of protection) making a stream of payments to another party (the seller of protection) in exchange for the right to receive protection on a reference security or obligation, including a group of assets or exposure to the performance of an index. A Fund’s investment in credit default swaps may involve greater risks than if the Fund had invested in the referenced obligation directly. Credit events are contract specific but may include bankruptcy, failure to pay, restructuring and obligation acceleration. If a Fund buys protection through a credit default swap and no credit event occurs, its payments are limited to the periodic payments previously made to the counterparty. Upon the occurrence of a specified credit event, a Fund, as a buyer of credit protection, is entitled to receive an amount equal to the notional amount of the swap and deliver to the seller the defaulted reference obligation in a physically settled trade. A Fund may also receive a net settlement amount in the form of cash or securities equal to the notional amount of the swap reduced by the recovery value of the reference obligation in cash settled trade.
As a seller of protection, a Fund generally receives a payment stream throughout the term of the swap, provided that there is no credit event. In addition, if a Fund sells protection through a credit default swap, a Fund could suffer a loss because the value of the referenced obligation and the premium payments received may be less than the notional amount of the swap paid to the buyer of protection. Upon the occurrence of a specified credit event, a Fund, as a seller of credit protection, may be required to take possession of the defaulted reference obligation and pay the buyer an amount equal to the notional amount of the swap in a physically settled trade. A Fund may also pay a net settlement amount in the form of cash or securities equal to the notional amount of the swap reduced by the recovery value of the reference obligation in cash settled trade. Recovery values are at times established through the credit event auction process in which market participants are ensured that a
46
GOLDMAN SACHS DIVIDEND FOCUS FUNDS
| 3. INVESTMENTS AND FAIR VALUE MEASUREMENTS (continued) |
transparent price has been set for the defaulted security or obligation. In addition, a Fund is entitled to a return of any assets, which have been pledged as collateral to the counterparty.
The maximum potential amount of future payments (undiscounted) that a Fund as seller of protection could be required to make under a credit default swap would be an amount equal to the notional amount of the agreement. These potential amounts would be partially offset by any recovery values of the respective referenced obligations or net amounts received from a settlement of a credit default swap for the same reference security or obligation where a Fund bought credit protection.
Short Term Investments — Short-term investments having a maturity of 60 days or less are generally valued at amortized cost which approximates fair market value. These investments are classified as Level 2 of the fair value hierarchy.
i. Repurchase Agreements — Repurchase agreements involve the purchase of securities subject to the seller’s agreement to repurchase the securities at a mutually agreed upon date and price, under the terms of a Master Repurchase Agreement (“MRA”). During the term of a repurchase agreement, the value of the underlying securities held as collateral on behalf of a Fund, including accrued interest is required to exceed the value of the repurchase agreement, including accrued interest. The underlying securities for all repurchase agreements are held at the Funds’ custodian or designated sub-custodians under tri-party repurchase agreements.
In December 2011, the Financial Accounting Standards Board (“FASB”) issued an Accounting Standards Update (“ASU”) No. 2011-11: Disclosures about Offsetting Assets and Liabilities (“netting”) on the Statements of Assets and Liabilities that are subject to master netting arrangements or similar agreements. ASU 2011-11 was amended by ASU No. 2013-01, clarifying which investments and transactions are subject to the netting disclosure. The scope of the disclosure requirements is limited to derivative instruments, repurchase agreements and reverse repurchase agreements, and securities borrowing and securities lending transactions. This information is intended to enable users of the Funds’ financial statements to evaluate the effect or potential effect of netting arrangements on the Funds’ financial position. The Funds adopted the disclosure requirement of netting for the current reporting period. Since these amended principles only require additional disclosures concerning offsetting and related arrangements, adoption did not affect the Funds’ financial condition or result of operations.
For financial reporting purposes, the Funds’ do not offset financial assets and financial liabilities that are subject to master netting arrangements or similar agreements on the Statements of Assets and Liabilities.
A MRA governs transactions between a Fund and select counterparties. A MRA contains provisions for, among other things, initiation, income payments, events of default and maintenance of securities for repurchase agreements. A MRA also permits offsetting with collateral to create one single net payment in the event of default or similar events, including the bankruptcy or insolvency of a counterparty.
If the seller defaults, a Fund could suffer a loss to the extent that the proceeds from the sale of the underlying securities and other collateral held by the Fund are less than the repurchase price and the Fund’s costs associated with delay and enforcement of the repurchase agreement. In addition, in the event of default or insolvency of the seller, a court could determine that a Fund’s interest in the collateral is not enforceable, resulting in additional losses to the Fund.
47
GOLDMAN SACHS DIVIDEND FOCUS FUNDS
Notes to Financial Statements (continued)
April 30, 2014 (Unaudited)
| 3. INVESTMENTS AND FAIR VALUE MEASUREMENTS (continued) |
At April 30, 2014, the Funds’ investment in a repurchase agreement was subject to enforceable MRAs. The repurchase agreement on a net basis was as follows:
| Repurchase Agreements | Income Builder | Rising Dividend Growth | ||||||
Total gross amount presented in Statements of Assets and Liabilities | $ | 36,400,000 | $ | 92,300,000 | ||||
Non-cash Collateral offsetting(1) | (36,400,000 | ) | (92,300,000 | ) | ||||
Net Amount(2) | $ | — | $ | — | ||||
| (1) | At April 30, 2014, the value of the collateral received from each seller exceeded the value of the related repurchase agreements. |
| (2) | Net amount represents the net amount due from the counterparty in the event of a default based on the contractual set-off rights under the agreement. |
Pursuant to exemptive relief granted by the Securities and Exchange Commission (“SEC”) and terms and conditions contained therein, the Funds, together with other funds of the Trust and registered investment companies having management agreements with GSAM or its affiliates, may transfer uninvested cash into joint accounts, the daily aggregate balance of which is invested in one or more repurchase agreements. Under these joint accounts, the Funds maintain pro-rata credit exposure to the underlying repurchase agreements’ counterparties. With the exception of certain transaction fees, the Funds are not subject to any expenses in relation to these investments.
B. Level 3 Fair Value Investments — To the extent that the aforementioned significant inputs are unobservable, or if quotations are not readily available, or if GSAM believes that such quotations do not accurately reflect fair value, the fair value of the Funds’ investments may be determined under Valuation Procedures approved by the Trustees. GSAM, consistent with its procedures and applicable regulatory guidance, may make an adjustment to the most recent valuation prices of either domestic or foreign securities in light of significant events to reflect what it believes to be the fair value of the securities at the time of determining a Fund’s NAV. Significant events which could affect a large number of securities in a particular market may include, but are not limited to: significant fluctuations in U.S. or foreign markets; market dislocations; market disruptions; or unscheduled market closings. Significant events which could also affect a single issuer may include, but are not limited to: corporate actions such as reorganizations, mergers and buy-outs; ratings downgrades; and bankruptcies.
48
GOLDMAN SACHS DIVIDEND FOCUS FUNDS
| 3. INVESTMENTS AND FAIR VALUE MEASUREMENTS (continued) |
C. Fair Value Hierarchy — The following is a summary of the Funds’ investments and derivatives classified in the fair value hierarchy as of April 30, 2014:
| INCOME BUILDER | ||||||||||||
| Investment Type | Level 1 | Level 2 | Level 3 | |||||||||
| Assets | ||||||||||||
Common Stocks | $ | 642,544,198 | $ | — | $ | — | ||||||
Preferred Stocks | 26,333,984 | 23,877,574 | — | |||||||||
Fixed Income | ||||||||||||
Corporate Obligations | — | 658,474,167 | — | |||||||||
Mortgage-Backed Obligations | — | 1,129,381 | — | |||||||||
Asset-Backed Securities | — | 199,545 | — | |||||||||
Senior Term Loans | — | 13,751,672 | 193,388 | |||||||||
U.S. Treasury Obligations | 17,219,264 | — | — | |||||||||
Investment Companies | 2,924,504 | — | — | |||||||||
Short-term Investments | — | 36,400,000 | — | |||||||||
| Total | $ | 689,021,950 | $ | 733,832,339 | $ | 193,388 | ||||||
| Derivative Type | ||||||||||||
| Assets(a) | ||||||||||||
Forward Foreign Currency Exchange Contracts | $ | — | $ | 5,897 | $ | — | ||||||
Futures Contracts | 105,188 | — | — | |||||||||
Credit Default Swap Contracts | — | 27,461 | — | |||||||||
| Total | $ | 105,188 | $ | 33,358 | $ | — | ||||||
| Liabilities(a) | ||||||||||||
Forward Foreign Currency Exchange Contracts | $ | — | $ | (69,317 | ) | $ | — | |||||
Futures Contracts | (2,915,571 | ) | — | — | ||||||||
Credit Default Swap Contracts | — | (4,597 | ) | — | ||||||||
| Total | $ | (2,915,571 | ) | $ | (73,914 | ) | $ | — | ||||
49
GOLDMAN SACHS DIVIDEND FOCUS FUNDS
Notes to Financial Statements (continued)
April 30, 2014 (Unaudited)
| 3. INVESTMENTS AND FAIR VALUE MEASUREMENTS (continued) |
| RISING DIVIDED GROWTH | ||||||||||||
| Investment Type | Level 1 | Level 2 | Level 3 | |||||||||
| Assets | ||||||||||||
Common Stocks | $ | 2,843,723,295 | $ | — | $ | — | ||||||
Short-term Investments | — | 92,300,000 | — | |||||||||
| Total | $ | 2,843,723,295 | $ | 92,300,000 | $ | — | ||||||
| (a) | Amount shown represents unrealized gain (loss) at period end. |
For further information regarding security characteristics, see the Schedules of Investments.
| 4. INVESTMENTS IN DERIVATIVES |
The following tables set forth, by certain risk types, the gross value of derivative contracts as of April 30, 2014. These instruments were used to meet the Funds’ investment objectives and to obtain and/or manage exposure related to the risks below. The values in the tables below exclude the effects of cash collateral received or posted pursuant to these derivative contracts, and therefore are not representative of the Funds’ net exposure.
| Income Builder | ||||||||||||
| Risk | Statement of Assets and Liabilities | Assets | Statement of Assets and Liabilities | Liabilities | ||||||||
Interest rate | Variation margin on certain derivative contracts | $ | 105,188 | (a) | Variation margin on certain derivative contracts | $ | (2,915,571) | (a) | ||||
Credit | Receivable for unrealized gain on swap contracts | 27,461 | Payable for unrealized loss on swap contracts | (4,597) | (b) | |||||||
Currency | Receivable for unrealized gain on forward foreign currency exchange contracts | 5,897 | Payable for unrealized loss on forward foreign currency exchange contracts | (69,317) | ||||||||
| Total | $ | 138,546 | $ | (2,989,485) | ||||||||
| (a) | Includes unrealized gain (loss) on futures contracts and centrally cleared swaps described in the Additional Investment Information sections of the Schedules of Investments. Only current day’s variation margin is reported within the Statements of Assets and Liabilities. |
| (b) | Amount represents the payments to be made pursuant to bilateral agreements should counterparties exercise their “right to terminate” provisions based on, among others, the Fund’s performance, its failure to pay on its obligations or failure to pledge collateral. Such amount does not include incremental charges directly associated with the close-out of the agreements. It also does not reflect the fair value of any assets pledged as collateral which, through the daily margining process, substantially offsets the aforementioned amounts and for which the Fund is entitled to a full return. |
50
GOLDMAN SACHS DIVIDEND FOCUS FUNDS
| 4. INVESTMENTS IN DERIVATIVES (continued) |
The following tables set forth, by certain risk types, the Funds’ gains (losses) related to these derivatives and their indicative volumes For the six months ended April 30, 2014. These gains (losses) should be considered in the context that these derivative contracts may have been executed to create investment opportunities and/or economically hedge certain investments, and accordingly, certain gains (losses) on such derivative contracts may offset certain (losses) gains attributable to investments. These gains (losses) are included in “Net realized gain (loss)” or “Net change in unrealized gain (loss)” on the Statements of Operations:
| Income Builder | ||||||||||||||
| Risk | Statements of Operations | Net Realized Gain (Loss) | Net Change in Unrealized Gain (Loss) | Average Number of Contracts(a) | ||||||||||
| Interest rate | Net realized gain (loss) from futures contracts/Net change in unrealized gain (loss) on futures contracts | $ | (3,402,275 | ) | $ | (2,337,094 | ) | 3,553 | (a) | |||||
| Credit | Net realized gain (loss) from swap contracts/Net change in unrealized gain (loss) on swap contracts | 286 | 4,951 | 5 | ||||||||||
| Currency | Net realized gain (loss) from forward foreign currency exchange contracts/Net change in unrealized gain (loss) on forward foreign currency exchange contracts | (488,065 | ) | (149,710 | ) | 5 | ||||||||
| Total | $ | (3,890,054 | ) | $ | (2,481,853 | ) | 3,563 | |||||||
| (a) | Average number of contracts is based on the average of month end balances for the six months ended April 30, 2014. |
In order to better define its contractual rights and to secure rights that will help a Fund mitigate its counterparty risk, a Fund may enter into an International Swaps and Derivatives Association, Inc. Master Agreement (“ISDA Master Agreement”) or similar agreement with its derivatives counterparties. An ISDA Master Agreement is a bilateral agreement between a Fund and a counterparty that governs OTC derivatives, including foreign exchange contracts, and typically contains, among other things, collateral posting terms and netting provisions in the event of a default and/or termination event. The provisions of the ISDA Master Agreement typically permit a single net payment in the event of a default (close-out netting) or similar event, including the bankruptcy or insolvency of the counterparty.
Collateral and margin requirements differ between exchange traded derivatives and OTC derivatives. Margin requirements are established by the broker or clearing house for exchange-traded and centrally cleared derivatives (financial futures contracts, options and centrally cleared swaps) pursuant to governing agreements for those instrument types. Brokers can ask for margin in excess of the minimum in certain circumstances. Collateral terms are contract-specific for OTC derivatives (foreign currency exchange contracts, and certain options and swaps). For derivatives traded under an ISDA Master Agreement, the collateral requirements are typically calculated by netting the marked to market amount for each transaction under such agreement and comparing that amount to the value of any collateral currently pledged by a Fund and the counterparty. Additionally, a Fund may be required to post initial margin to the counterparty, the terms of which would be outlined in the confirmation of the OTC transaction.
51
GOLDMAN SACHS DIVIDEND FOCUS FUNDS
Notes to Financial Statements (continued)
April 30, 2014 (Unaudited)
| 4. INVESTMENTS IN DERIVATIVES (continued) |
For financial reporting purposes, cash collateral that has been pledged to cover obligations of a Fund and cash collateral received from the counterparty, if any, is reported separately on the Statements of Assets and Liabilities as receivables/payables for collateral on certain derivative contracts. Non-cash collateral pledged by a Fund, if any, is noted in the Schedules of Investments. Generally, the amount of collateral due from or to a counterparty must exceed a minimum transfer amount threshold before a transfer is required to be made. To the extent amounts due to a Fund from its counterparties are not fully collateralized, contractually or otherwise, the Fund bears the risk of loss from counterparty nonperformance. A Fund attempts to mitigate counterparty risk by only entering into agreements with counterparties that it believes to be of good standing and by monitoring the financial stability of those counterparties.
Additionally, the netting of assets and liabilities and the offsetting of collateral pledged or received are based on contractual netting/set-off provisions in the ISDA Master Agreement or similar agreements. However, in the event of a default or insolvency of a counterparty, a court could determine that such rights are not enforceable due the restrictions or prohibitions against the right of setoff that may be imposed due to a particular jurisdiction’s bankruptcy or insolvency laws.
The following tables set forth the Funds’ net exposure for derivative instruments that are subject to enforceable master netting arrangements or similar agreements as of April 30, 2014:
| Income Builder Fund | ||||||||||||||||||||||||||||||||||
Derivative Assets(1) | Derivative Liabilities(1) | Net Derivative Asset (Liabilities) | Collateral (Received) Pledged(1) | Net Amount(2) | ||||||||||||||||||||||||||||||
| Counterparty | Swaps | Forward Currency Contracts | Total | Swaps | Forward Currency Contracts | Total | ||||||||||||||||||||||||||||
Bank of America Securities LLC | $12,805 | $ | — | $ | 12,805 | $ | (407 | ) | $ | — | $ | (407 | ) | $ | 12,398 | $ | — | $ | 12,398 | |||||||||||||||
Deutsche Bank AG (London) | — | — | — | — | (59,410 | ) | (59,410 | ) | (59,410 | ) | — | (59,410 | ) | |||||||||||||||||||||
JPMorgan Securities, Inc. | — | — | — | (3,361 | ) | — | (3,361 | ) | (3,361 | ) | — | (3,361 | ) | |||||||||||||||||||||
Morgan Stanley Capital Services, Inc. | 14,656 | — | 14,656 | (829 | ) | — | (829 | ) | 13,827 | — | 13,827 | |||||||||||||||||||||||
Royal Bank of Canada | — | 3,803 | 3,803 | — | (9,907 | ) | (9,907 | ) | (6,104 | ) | — | (6,104 | ) | |||||||||||||||||||||
UBS AG (London) | — | 2,094 | 2,094 | — | — | — | 2,094 | — | 2,094 | |||||||||||||||||||||||||
Total | $27,461 | $ | 5,897 | $ | 33,358 | $ | (4,597 | ) | $ | (69,317 | ) | $ | (73,914 | ) | $ | (40,556 | ) | $ | — | $ | (40,556 | ) | ||||||||||||
| (1) | Gross amounts available for offset but not netted in the Statement of Assets and Liabilities. |
| (2) | Net amount represents the net amount due (to) from counterparty in the event of a default based on the contractual set-off rights under the agreement. Net amount excludes any over-collateralized amounts. |
| 5. AGREEMENTS AND AFFILIATED TRANSACTIONS |
A. Management Agreement — Under the Agreement, GSAM manages the Funds, subject to the general supervision of the Trustees.
As compensation for the services rendered pursuant to the Agreement, the assumption of the expenses related thereto and administration of the Funds’ business affairs, including providing facilities, GSAM is entitled to a management fee, accrued daily and paid monthly, equal to an annual percentage rate of each Fund’s average daily net assets.
52
GOLDMAN SACHS DIVIDEND FOCUS FUNDS
| 5. AGREEMENTS AND AFFILIATED TRANSACTIONS (continued) |
For the six months ended April 30, 2014, contractual and effective net management fees with GSAM were at the following rates:
| Contractual Management Rate | Effective Net Management Rate | |||||||||||||||||||||||||||||
| Fund | First $1 billion | Next $1 billion | Next $3 billion | Next $3 billion | Over $8 billion | Effective Rate | ||||||||||||||||||||||||
Income Builder | 0.65 | % | 0.59 | % | 0.56 | % | 0.55 | % | 0.54 | % | 0.64 | % | 0.51 | %* | ||||||||||||||||
Rising Dividend Growth | 0.75 | 0.68 | 0.64 | 0.63 | 0.62 | 0.70 | 0.70 | |||||||||||||||||||||||
| * | GSAM has agreed to waive a portion of its management fee in order to achieve net management rates, as defined in the funds’ most recent prospectuses. These waivers will be effective through at least February 28, 2015, and prior to such date GSAM may not terminate the arrangements without the approval of the Trustees. The Effective Net Management Rates above are calculated based on management rates before and after waivers had been adjusted, if applicable. |
Dividend Assets Capital, LLC (“DAC”, or the “Sub-Adviser”) serves as the sub-adviser to the Rising Dividend Growth Fund. As compensation for its services as Sub-Advisor, DAC is entitled to a fee, payable by GSAM accrued daily and paid each calendar quarter, at the annual rate of 0.20% of the Rising Dividend Growth Fund’s average daily net assets.
B. Distribution and Service Plans — The Trust, on behalf of each Fund, has adopted Distribution and Service Plans (the “Plans”). Under the Plans, Goldman Sachs, which serves as distributor (the “Distributor”), is entitled to a fee accrued daily and paid monthly, for distribution services and personal and account maintenance services, which may then be paid by Goldman Sachs to authorized dealers, at the following annual rates calculated on a Fund’s average daily net assets of each respective share class:
| Distribution and Service Plan Rates | ||||||||||||||||
| Class A* | Class B | Class C | Class R* | |||||||||||||
Distribution Plan | 0.25 | % | 0.75 | % | 0.75 | % | 0.50 | % | ||||||||
Service Plan | — | 0.25 | 0.25 | — | ||||||||||||
| * | With respect to Class A and Class R Shares, the Distributor at its discretion may use compensation for distribution services paid under the Distribution Plan to compensate service organizations for personal and account maintenance services and expenses as long as such total compensation does not exceed the maximum cap on “service fees” imposed by the Financial Industry Regulatory Authority. |
C. Distribution Agreement — Goldman Sachs, as Distributor of the shares of the Funds pursuant to a Distribution Agreement, may retain a portion of the Class A front end sales charge and Class B and Class C Shares’ CDSC. For the six months ended April 30, 2014, Goldman Sachs advised that it retained the following amounts:
| Front End Sales Charge | Contingent Deferred Sales Charge* | |||||||||
| Fund | Class A | Class C | ||||||||
Income Builder | $ | 264,026 | $ | 326 | ||||||
Rising Dividend Growth | 236,274 | 402 | ||||||||
| * | Goldman Sachs did not retain any Contingent Deferred Sales Charges for Class B shares. |
53
GOLDMAN SACHS DIVIDEND FOCUS FUNDS
Notes to Financial Statements (continued)
April 30, 2014 (Unaudited)
| 5. AGREEMENTS AND AFFILIATED TRANSACTIONS (continued) |
D. Transfer Agency Agreement — Goldman Sachs also serves as the transfer agent of the Funds for a fee pursuant to a Transfer Agency Agreement. The fees charged for such transfer agency services are accrued daily and paid monthly at annual rates as follows: 0.19% of the average daily net assets of Class A, Class B, Class C, Class IR and Class R Shares and 0.04% of the average daily net assets of Institutional and Service Shares.
E. Other Expense Agreements and Affiliated Transactions — GSAM has agreed to limit certain “Other Expense” of the Funds (excluding transfer agent fees and expenses, service fees and shareholder administration fees (as applicable), taxes, interest, brokerage fees, shareholder meetings, litigation, indemnification and extraordinary expenses) to the extent such expenses exceed, on an annual basis, a percentage rate of the average daily net assets of each Fund. Such Other Expense reimbursements, if any, are accrued daily and paid monthly. In addition, the Funds are not obligated to reimburse GSAM for prior fiscal year expense reimbursements, if any. The Other Expense limitations as an annual percentage rate of average daily net assets for the Income Builder and Rising Dividend Growth are 0.004% and 0.014%, respectively. These Other Expense limitations will remain in place through at least February 28, 2015, and prior to such date GSAM may not terminate the arrangements without the approval of the Trustees. In addition, the Funds have entered into certain offset arrangements with the custodian and the transfer agent, which may result in a reduction of the Funds’ expenses and are received irrespective of the application of the “Other Expense” limitations described above.
For the six months ended April 30, 2014, these expense reductions, including any fee waivers and Other Expense reimbursements, were as follows:
| Fund | Management Fee Waiver | Other Expense Reimbursements | Total Expense Reductions | |||||||||||
Income Builder | $ | 676,418 | $ | 306,983 | $ | 983,401 | ||||||||
Rising Dividend Growth | — | 290,761 | 290,761 | |||||||||||
As of April 30, 2014, the amounts owed to affiliates of the Funds were as follows:
| Fund | Management Fees | Distribution and Service Fees | Transfer Agent Fees | Total | ||||||||||||||
Income Builder | $ | 565,806 | $ | 385,614 | $ | 157,277 | $ | 1,108,697 | ||||||||||
Rising Dividend Growth | 1,650,343 | 614,786 | 319,200 | 2,584,329 | ||||||||||||||
F. Line of Credit Facility — As of April 30, 2014, the Funds participated in a $780,000,000 committed, unsecured revolving line of credit facility (the “facility”) together with other funds of the Trust and registered investment companies having management agreements with GSAM or its affiliates (“Other Borrowers”). Pursuant to the terms of the facility, the Funds and Other Borrowers could increase the credit amount by an additional $220,000,000, for a total of up to $1,000,000,000. This facility is to be used solely for temporary or emergency purposes, which may include the funding of redemptions. The interest rate on borrowings is based on the federal funds rate. The facility also requires a fee to be paid by the Funds based on the amount of the commitment that has not been utilized. For the six months ended April 30, 2014, the Funds did not have any borrowings under the facility. The Facility was increased to $1,080,000,000 effective May 6, 2014.
54
GOLDMAN SACHS DIVIDEND FOCUS FUNDS
| 5. AGREEMENTS AND AFFILIATED TRANSACTIONS (continued) |
G. Other Transactions with Affiliates — For the six months ended April 30, 2014, Goldman Sachs earned $32,283, in brokerage commissions from portfolio transactions, including future transactions executed with Goldman Sachs as the Futures Commission Merchant, on behalf of the Income Builder Fund.
The Income Builder Fund invests primarily in the Institutional Shares of the Goldman Sachs High Yield Fund. This Underlying Fund is considered to be affiliated with the Fund. The table below shows the transactions in and earnings from investments in this affiliated Fund For the six months ended April 30, 2014:
| Fund | Market Value 11/1/2013 | Purchases at Cost | Proceeds from Sales | Realized Gain (Loss) | Change in Unrealized Gain (Loss) | Market Value 4/30/2014 | Dividend Income | Capital Gains Distributions | ||||||||||||||||||||||||
High Yield Fund | $ | 2,787,890 | $ | 183,947 | $ | — | $ | — | ($ | 47,333 | ) | $ | 2,924,504 | $ | 86,705 | $ | 97,239 | |||||||||||||||
| 6. PORTFOLIO SECURITIES TRANSACTIONS |
The cost of purchases and proceeds from sales and maturities of long-term securities for the six months ended April 30, 2014, were as follows:
| Fund | Purchases | Sales and Maturities | ||||||||
Income Builder | $ | 976,399,270 | $ | 261,686,122 | ||||||
Rising Dividend Growth | 463,003,136 | 128,640,727 | ||||||||
| 7. TAX INFORMATION |
As of the Funds’ most recent fiscal year end, October 31, 2013, the Funds’ capital loss carryforwards on a tax basis were as follows:
| Income Builder | Rising Dividend Growth | |||||||
Capital loss carryovers:(1) | ||||||||
Expiring 2017 | $ | — | $ | (3,608,556 | ) | |||
Perpetual Short-Term | — | (11,602,451 | ) | |||||
Total capital loss carryovers | $ | — | $ | (15,211,007 | ) | |||
| (1) | Expiration occurs on October 31 of the year indicated. |
As of April 30, 2014, the Funds’ aggregate security unrealized gains and losses based on cost for U.S. federal income tax purposes were as follows:
| Income Builder | Rising Dividend Growth | |||||||
Tax Cost | $ | 1,361,130,272 | $ | 2,413,395,615 | ||||
Gross unrealized gain | 73,071,682 | 547,085,568 | ||||||
Gross unrealized loss | (11,154,277 | ) | (24,457,888 | ) | ||||
Net unrealized gain | $ | 61,917,405 | $ | 522,627,680 | ||||
55
GOLDMAN SACHS DIVIDEND FOCUS FUNDS
Notes to Financial Statements (continued)
April 30, 2014 (Unaudited)
| 7. TAX INFORMATION (continued) |
The differences between GAAP-basis and tax-basis unrealized gains (losses) is attributable primarily to wash sales, and differences related to the tax treatment of partnerships and underlying fund investments.
GSAM has reviewed the Funds’ tax positions for all open tax years (the current and prior three years, as applicable) and has concluded that no provision for income tax is required in the Funds’ financial statements. Such open tax years remain subject to examination and adjustment by tax authorities.
| 8. OTHER RISKS |
The Funds’ risks include, but are not limited to, the following:
Foreign Custody Risk — A Fund that invests in foreign securities may hold such securities and foreign currency with foreign banks, agents, and securities depositories appointed by the Fund’s custodian (each a “Foreign Custodian”). In some countries, Foreign Custodians may be subject to little or no regulatory oversight or independent evaluation of their operations. Further, the laws of certain countries may place limitations on a Fund’s ability to recover its assets if a Foreign Custodian enters into bankruptcy. Investments in emerging markets may be subject to greater custody risks than investments in more developed markets. Custody services in emerging market countries are often undeveloped and may be less regulated than in more developed countries, and thus may not afford the same level of investor protection as would apply in developed countries.
Investments in Other Investment Companies — As a shareholder of another investment company, including an exchange traded fund (“ETF”), a Fund will directly bear its proportionate share of any management fees and other expenses paid by such other investment companies, in addition to the fees and expenses regularly borne by the Fund. ETFs are subject to risks that do not apply to conventional mutual funds, including but not limited to the following: (i) the market price of the ETF’s shares may trade at a premium or a discount to their NAV; and (ii) an active trading market for an ETF’s shares may not develop or be maintained.
Liquidity Risk — The Funds may make investments that are illiquid or that may become less liquid in response to market developments or adverse investor perceptions. Illiquid investments may be more difficult to value. Liquidity risk may also refer to the risk that a Fund will not be able to pay redemption proceeds within the allowable time period because of unusual market conditions, an unusually high volume of redemption requests, or other reasons. To meet redemption requests, a Fund may be forced to sell investments at an unfavorable time and/or under unfavorable conditions.
Market and Credit Risks — In the normal course of business, the Funds trade financial instruments and enter into financial transactions where risk of potential loss exists due to changes in the market (market risk). Additionally, the Funds may also be exposed to credit risk in the event that an issuer or guarantor fails to perform or that an institution or entity with which the Funds have unsettled or open transactions defaults.
Investing in foreign markets may involve special risks and considerations not typically associated with investing in the U.S. Foreign securities may be subject to risk of loss because of more or less foreign government regulation, less public information and less economic, political and social stability in the countries in which the Fund invests. Loss may also result from the imposition of exchange controls, confiscations and other government restrictions by the United States or other governments, or from problems in registration, settlement or custody. Foreign risk also involves the risk of negative foreign currency rate fluctuations, which may cause the value of securities denominated in such foreign currency (or other instruments through which the Fund has exposure to
56
GOLDMAN SACHS DIVIDEND FOCUS FUNDS
| 8. OTHER RISKS (continued) |
foreign currencies) to decline in value. Currency exchange rates may fluctuate significantly over short periods of time. To the extent that the Fund also invests in securities of issuers located in emerging markets, these risks may be more pronounced.
Master Limited Partnership Risk — Investments in securities of MLPs involve risks that differ from investments in common stock, including risks related to limited control and limited rights to vote on matters affecting the MLP, risks related to potential conflicts of interest between the MLP and the MLP’s general partner, cash flow risks, dilution risks, limited liquidity and risks related to the general partner’s right to require unit-holders to sell their common units at an undesirable time or price.
Non-Diversification Risk — The Rising Dividend Growth Fund is non-diversified, meaning that it is permitted to invest a larger percentage of its assets in fewer issuers than diversified mutual funds. Thus, the Fund may be more susceptible to adverse developments affecting any single issuer held in its portfolio, and may be more susceptible to greater losses because of these developments.
Portfolio Concentration Risk — As a result of the Fund’s ability to invest a large percentage of its assets in obligations of issuers within the same country, state, region, currency or economic sector, an adverse economic, business or political development may affect the value of the Fund’s investments more than if its investments were not so concentrated.
Shareholder Concentration Risk — Certain funds, accounts, individuals or Goldman Sachs affiliates may from time to time own (beneficially or of record) or control a significant percentage of the Funds’ shares. Redemptions by these entities of their holdings in the Funds may impact the Funds’ liquidity and NAV. These redemptions may also force the Funds to sell securities.
| 9. INDEMNIFICATIONS |
Under the Trust’s organizational documents, its Trustees, officers, employees and agents are indemnified, to the extent permitted by the Act and state law, against certain liabilities that may arise out of performance of their duties to the Funds. Additionally, in the course of business, the Funds enter into contracts that contain a variety of indemnification clauses. The Funds’ maximum exposure under these arrangements is unknown, as this would involve future claims that may be made against the Funds that have not yet occurred. However, GSAM believes the risk of loss under these arrangements to be remote.
| 10. SUBSEQUENT EVENTS |
Subsequent events after the Statement of Assets and Liabilities date have been evaluated through the date the financial statements were issued. GSAM has concluded that there is no impact requiring adjustment or disclosure in the financial statements.
Effective on July 1, 2014, the fee DAC is entitled to, as compensation for its services as the Sub-Advisor for the Rising Dividend Growth Fund, which is payable by GSAM, will apply a breakpoint schedule with annual rates listed below as a percentage of the average daily net assets of the Rising Dividend Growth Fund:
| Annual Rate | Average Daily Net Assets | |
| 0.200% | First $1 Billion | |
| 0.181% | Next $1 Billion | |
| 0.171% | Next $3 Billion | |
| 0.168% | Next $3 Billion | |
| 0.165% | Over $8 Billion |
57
GOLDMAN SACHS DIVIDEND FOCUS FUNDS
Notes to Financial Statements (continued)
April 30, 2014 (Unaudited)
| 11. SUMMARY OF SHARE TRANSACTIONS |
Share activity is as follows:
| Income Builder Fund | ||||||||||||||||
|
| |||||||||||||||
| For the Six Months Ended April 30, 2014 (Unaudited) | For the Fiscal Year Ended October 31, 2013 | |||||||||||||||
|
| |||||||||||||||
| Shares | Dollars | Shares | Dollars | |||||||||||||
|
| |||||||||||||||
| Class A Shares | ||||||||||||||||
Shares sold | 11,658,758 | $ | 264,363,415 | 9,145,682 | $ | 200,173,382 | ||||||||||
Reinvestment of distributions | 492,716 | 11,142,095 | 365,954 | 7,757,576 | ||||||||||||
Shares converted from Class B(a) | 2,541 | 57,407 | 6,144 | 131,152 | ||||||||||||
Shares redeemed | (1,647,160 | ) | (37,366,929 | ) | (1,613,618 | ) | (34,734,689 | ) | ||||||||
| 10,506,855 | 238,195,988 | 7,904,162 | 173,327,421 | |||||||||||||
| Class B Shares | ||||||||||||||||
Shares sold | 8,586 | 193,109 | 41,548 | 891,611 | ||||||||||||
Reinvestment of distributions | 4,802 | 107,443 | 14,765 | 306,758 | ||||||||||||
Shares converted to Class A(a) | (2,560 | ) | (57,407 | ) | (6,190 | ) | (131,152 | ) | ||||||||
Shares redeemed | (45,570 | ) | (1,021,396 | ) | (111,931 | ) | (2,373,925 | ) | ||||||||
| (34,742 | ) | (778,251 | ) | (61,808 | ) | (1,306,708 | ) | |||||||||
| Class C Shares | ||||||||||||||||
Shares sold | 9,073,521 | 202,840,132 | 6,385,622 | 138,022,253 | ||||||||||||
Reinvestment of distributions | 236,930 | 5,285,633 | 87,209 | 1,837,077 | ||||||||||||
Shares redeemed | (616,067 | ) | (13,799,554 | ) | (349,303 | ) | (7,515,254 | ) | ||||||||
| 8,694,384 | 194,326,211 | 6,123,528 | 132,344,076 | |||||||||||||
| Institutional Shares | ||||||||||||||||
Shares sold | 13,462,914 | 309,241,399 | 8,650,548 | 192,464,583 | ||||||||||||
Reinvestment of distributions | 321,666 | 7,418,931 | 93,304 | 2,044,871 | ||||||||||||
Shares redeemed | (2,235,233 | ) | (51,574,598 | ) | (1,488,721 | ) | (32,942,424 | ) | ||||||||
| 11,549,347 | 265,085,732 | 7,255,131 | 161,567,030 | |||||||||||||
| Class IR Shares | ||||||||||||||||
Shares sold | 1,543,971 | 35,522,521 | 1,432,780 | 31,947,734 | ||||||||||||
Reinvestment of distributions | 65,245 | 1,499,393 | 18,013 | 396,162 | ||||||||||||
Shares redeemed | (214,422 | ) | (4,969,758 | ) | (42,264 | ) | (927,521 | ) | ||||||||
| 1,394,794 | 32,052,156 | 1,408,529 | 31,416,375 | |||||||||||||
NET INCREASE | 32,110,638 | $ | 728,881,836 | 22,629,542 | $ | 497,348,194 | ||||||||||
| (a) | Class B Shares convert into Class A Shares on or about the fifteenth day of the last month of the calendar quarter that is eight years after the initial purchase date of either the Fund or another Goldman Sachs Fund. |
58
GOLDMAN SACHS DIVIDEND FOCUS FUNDS
| 11. SUMMARY OF SHARE TRANSACTIONS (continued) |
Share activity is as follows:
| Rising Dividend Growth Fund | ||||||||||||||||
|
| |||||||||||||||
| For the Six Months Ended April 30, 2014 (Unaudited) | For the Fiscal Year Ended October 31, 2012 | |||||||||||||||
|
| |||||||||||||||
| Shares | Dollars | Shares | Dollars | |||||||||||||
|
| |||||||||||||||
| Class A Shares | ||||||||||||||||
Shares sold | 10,035,655 | $ | 191,946,566 | 1,934,520 | $ | 29,756,843 | ||||||||||
Reinvestment of distributions | 206,929 | 3,960,518 | — | — | ||||||||||||
Shares redeemed | (5,831,220 | ) | (111,570,278 | ) | (253,743 | ) | (3,907,164 | ) | ||||||||
| 4,411,364 | 84,336,806 | 1,680,777 | 25,849,679 | |||||||||||||
| Class C Shares | ||||||||||||||||
Shares sold | 6,114,126 | 117,952,921 | 736,424 | 11,434,139 | ||||||||||||
Reinvestment of distributions | 16,332 | 319,422 | — | — | ||||||||||||
Shares redeemed | (1,310,107 | ) | (25,387,973 | ) | (19,195 | ) | (298,118 | ) | ||||||||
| 4,820,351 | 92,884,370 | 717,229 | 11,136,021 | |||||||||||||
| Institutional Shares | ||||||||||||||||
Shares sold | 13,330,752 | 259,703,029 | 1,950,001 | 30,815,742 | ||||||||||||
Reinvestment of distributions | 243,912 | 4,757,168 | — | — | ||||||||||||
Shares redeemed | (7,588,863 | ) | (147,952,151 | ) | (222,617 | ) | (3,513,639 | ) | ||||||||
| 5,985,801 | 116,508,046 | 1,727,384 | 27,302,103 | |||||||||||||
| Class IR Shares | ||||||||||||||||
Shares sold | 4,420,144 | 86,287,835 | 660,073 | 10,354,250 | ||||||||||||
Reinvestment of distributions | 83,261 | 1,624,788 | — | — | ||||||||||||
Shares redeemed | (2,120,881 | ) | (41,621,051 | ) | (26,668 | ) | (416,389 | ) | ||||||||
| 2,382,524 | 46,291,572 | 633,405 | 9,937,861 | |||||||||||||
| Class R Shares | ||||||||||||||||
Shares sold | 95,756 | 1,842,970 | 137 | 2,093 | ||||||||||||
Reinvestment of distributions | 164 | 3,156 | — | — | ||||||||||||
Shares redeemed | (30,444 | ) | (579,557 | ) | — | — | ||||||||||
| 65,476 | 1,266,569 | 137 | 2,093 | |||||||||||||
NET INCREASE | 17,665,516 | $ | 341,287,363 | 4,758,932 | $ | 74,227,757 | ||||||||||
59
GOLDMAN SACHS DIVIDEND FOCUS FUNDS
Fund Expenses — Six Month Period Ended April 30, 2014 (Unaudited) |
As a shareholder of Class A, Class B, Class C, Institutional, Service, Class IR or Class R Shares of a Fund, you incur two types of costs: (1) transaction costs, including sales charges on purchase payments (with respect to Class A Shares), contingent deferred sales charges on redemptions (with respect to Class B and Class C Shares), and (2) ongoing costs, including management fees; distribution and service (12b-1) fees (with respect to Class A, Class B, Class C and Class R Shares); and other Fund expenses. This Example is intended to help you understand your ongoing costs (in dollars) of investing in Class A, Class B, Class C, Institutional, Service, Class IR or Class R Shares of the Funds and to compare these costs with the ongoing costs of investing in other mutual funds.
The Example is based on an investment of $1,000 invested at the beginning of the period and held for the entire period from November 1, 2013 through April 30, 2014.
Actual Expenses — The first line under each share class in the table below provides information about actual account values and actual expenses. You may use the information in this line, together with the amount you invested, to estimate the expenses that you paid over the period. Simply divide your account value by $1,000 (for example, an $8,600 account value divided by $1,000=8.6), then multiply the result by the number in the first line under the heading entitled “Expenses Paid” to estimate the expenses you paid on your account during this period.
Hypothetical Example for Comparison Purposes — The second line under each share class in the table below provides information about hypothetical account values and hypothetical expenses based on the Funds’ actual net expense ratios and an assumed rate of return of 5% per year before expenses, which is not the Funds’ actual return. The hypothetical account values and expenses may not be used to estimate the actual ending account balance or expenses you paid for the period. You may use this information to compare the ongoing costs of investing in the Funds and other funds. To do so, compare this 5% hypothetical example with the 5% hypothetical examples that appear in the shareholder reports of the other funds.
Please note that the expenses shown in the table are meant to highlight your ongoing costs only and do not reflect any transactional costs, such as sales charges, redemption fees, or exchange fees. Therefore, the second line of the table is useful in comparing ongoing costs only, and will not help you determine the relative total costs of owning different funds. In addition, if these transactional costs were included, your costs would have been higher.
| Income Builder Fund | Rising Dividend Growth Fund | |||||||||||||||||||||||
| Share Class | Beginning Account Value 11/1/13 | Ending Account Value 4/30/14 | Expenses Paid for the 6 Months Ended 4/30/14* | Beginning Account Value 11/1/13 | Ending Account Value 4/30/14 | Expenses Paid for the 6 Months Ended 4/30/14* | ||||||||||||||||||
| Class A | ||||||||||||||||||||||||
Actual | $ | 1,000.00 | $ | 1,057.00 | $ | 4.85 | $ | 1,000.00 | $ | 1,073.30 | $ | 5.91 | ||||||||||||
Hypothetical 5% return | 1,000.00 | 1,020.08 | + | 4.76 | 1,000.00 | 1,019.09 | + | 5.76 | ||||||||||||||||
| Class B | ||||||||||||||||||||||||
Actual | 1,000.00 | 1,053.40 | 8.66 | N/A | N/A | N/A | ||||||||||||||||||
Hypothetical 5% return | 1,000.00 | 1,016.36 | 8.50 | N/A | N/A | N/A | ||||||||||||||||||
| Class C | ||||||||||||||||||||||||
Actual | 1,000.00 | 1,053.20 | 8.65 | 1,000.00 | 1,068.90 | 9.75 | ||||||||||||||||||
Hypothetical 5% return | 1,000.00 | 1,016.36 | 8.50 | 1,000.00 | 1,015.37 | 9.49 | ||||||||||||||||||
| Institutional | ||||||||||||||||||||||||
Actual | 1,000.00 | 1,058.90 | 2.81 | 1,000.00 | 1,075.50 | 3.86 | ||||||||||||||||||
Hypothetical 5% return | 1,000.00 | 1,022.07 | 2.76 | 1,000.00 | 1,021.08 | 3.76 | ||||||||||||||||||
| Class IR | ||||||||||||||||||||||||
Actual | 1,000.00 | 1,058.30 | 3.57 | 1,000.00 | 1,074.20 | 4.63 | ||||||||||||||||||
Hypothetical 5% return | 1,000.00 | 1,021.32 | 3.51 | 1,000.00 | 1,020.33 | 4.51 | ||||||||||||||||||
| Class R | ||||||||||||||||||||||||
Actual | N/A | N/A | N/A | 1,000.00 | 1,071.70 | 7.19 | ||||||||||||||||||
Hypothetical 5% return | N/A | N/A | N/A | 1,000.00 | 1,017.85 | 7.00 | ||||||||||||||||||
| * | Expenses for each share class are calculated using each Fund’s annualized net expense ratio for each class, which represents the ongoing expenses as a percentage of net assets for the six months ended April 30, 2014. Expenses are calculated by multiplying the annualized net expense ratio by the average account value for the period; then multiplying the result by the number of days in the most recent fiscal half year; and then dividing that result by the number of days in the fiscal year. The annualized net expense ratios for the period were as follows: |
| Fund | Class A | Class B | Class C | Institutional | Class IR | Class R | ||||||||||||||||||
Income Builder | 0.95 | % | 1.70 | % | 1.70 | % | 0.55 | % | 0.70 | % | N/A | |||||||||||||
Rising Dividend Growth | 1.15 | N/A | 1.90 | 0.75 | 0.90 | 1.40 | % | |||||||||||||||||
| + | Hypothetical expenses are based on each Fund’s actual annualized net expense ratios and an assumed rate of return of 5% per year before expenses. |
60
FUNDS PROFILE
Goldman Sachs Funds

Goldman Sachs is a premier financial services firm, known since 1869 for creating thoughtful and customized investment solutions in complex global markets.
Today, the Investment Management Division of Goldman Sachs serves a diverse set of clients worldwide, including private institutions, public entities and individuals. With approximately $935.2 billion in assets under supervision as of March 31, 2014, Goldman Sachs Asset Management (“GSAM”) has portfolio management teams located around the world and our investment professionals bring firsthand knowledge of local markets to every investment decision. Assets under supervision includes assets under management and other client assets for which Goldman Sachs does not have full discretion. GSAM leverages the resources of Goldman, Sachs & Co. subject to legal, internal and regulatory restrictions.

Money Market1
Financial Square FundsSM
| n | Financial Square Tax-Exempt Funds |
| n | Financial Square Federal Fund |
| n | Financial Square Government Fund |
| n | Financial Square Money Market Fund |
| n | Financial Square Prime Obligations Fund |
| n | Financial Square Treasury Instruments Fund |
| n | Financial Square Treasury Obligations Fund |
Fixed Income
Short Duration and Government
| n | Enhanced Income Fund |
| n | High Quality Floating Rate Fund |
| n | Limited Maturity Obligations Fund |
| n | Short Duration Government Fund |
| n | Short Duration Income Fund |
| n | Government Income Fund |
| n | Inflation Protected Securities Fund |
Multi-Sector
| n | Core Fixed Income Fund |
| n | Core Plus Fixed Income Fund |
| n | Global Income Fund |
| n | Strategic Income Fund |
| n | World Bond Fund |
Municipal and Tax-Free
| n | High Yield Municipal Fund |
| n | Municipal Income Fund |
| n | Short Duration Tax-Free Fund |
Single Sector
| n | Investment Grade Credit Fund |
| n | U.S. Mortgages Fund |
| n | High Yield Fund |
| n | High Yield Floating Rate Fund |
| n | Emerging Markets Debt Fund |
| n | Local Emerging Markets Debt Fund |
| n | Dynamic Emerging Markets Debt Fund |
Corporate Credit
| n | Long Short Credit Strategies Fund2 |
Fundamental Equity
| n | Growth and Income Fund |
| n | Small Cap Value Fund |
| n | Small/Mid Cap Value Fund |
| n | Mid Cap Value Fund |
| n | Large Cap Value Fund |
| n | Capital Growth Fund |
| n | Strategic Growth Fund |
| n | Focused Growth Fund |
| n | Small/Mid Cap Growth Fund |
| n | Flexible Cap Growth Fund |
| n | Concentrated Growth Fund |
| n | Technology Tollkeeper Fund |
| n | Growth Opportunities Fund |
| n | Rising Dividend Growth Fund |
| n | U.S. Equity Fund |
| n | Income Builder Fund |
Tax-Advantaged Equity
| n | U.S. Tax-Managed Equity Fund3 |
| n | International Tax-Managed Equity Fund3 |
| n | U.S. Equity Dividend and Premium Fund |
| n | International Equity Dividend and Premium Fund |
Equity Insights
| n | Small Cap Equity Insights Fund |
| n | U.S. Equity Insights Fund |
| n | Small Cap Growth Insights Fund |
| n | Large Cap Growth Insights Fund |
| n | Large Cap Value Insights Fund |
| n | Small Cap Value Insights Fund |
| n | International Small Cap Insights Fund |
| n | International Equity Insights Fund |
| n | Emerging Markets Equity Insights Fund |
Fundamental Equity International
| n | Strategic International Equity Fund |
| n | Focused International Equity Fund4 |
| n | International Small Cap Fund |
| n | Asia Equity Fund |
| n | Emerging Markets Equity Fund |
| n | BRIC Fund (Brazil, Russia, India, China) |
| n | N-11 Equity Fund |
Select Satellite5
| n | Real Estate Securities Fund |
| n | International Real Estate Securities Fund |
| n | Commodity Strategy Fund |
| n | Dynamic Commodity Strategy Fund |
| n | Dynamic Allocation Fund |
| n | Absolute Return Tracker Fund |
| n | Managed Futures Strategy Fund |
| n | MLP Energy Infrastructure Fund |
| n | Multi-Manager Alternatives Fund |
| n | Multi-Asset Real Return Fund |
| n | Retirement Portfolio Completion Fund |
| n | Fixed Income Macro Strategies Fund |
Total Portfolio Solutions5
| n | Balanced Strategy Portfolio |
| n | Growth and Income Strategy Portfolio |
| n | Growth Strategy Portfolio |
| n | Equity Growth Strategy Portfolio |
| n | Satellite Strategies Portfolio |
| n | Enhanced Dividend Global Equity Portfolio |
| n | Tax Advantaged Global |
| n | Equity Portfolio |
| 1 | An investment in a money market fund is neither insured nor guaranteed by the Federal Deposit Insurance Corporation (“FDIC”) or any other government agency. Although the Funds seek to preserve the value of your investment at $1.00 per share, it is possible to lose money by investing in the Funds. |
| 2 | Effective at the close of business on March 21, 2014, the Goldman Sachs Credit Strategies Fund was reorganized with and into the Goldman Sachs Long Short Credit Strategies Fund. |
| 3 | Effective at the close of business on April 30, 2014, the Goldman Sachs Structured Tax-Managed Equity and Structured International Tax-Managed Equity Funds were renamed the Goldman Sachs U.S. Tax-Managed Equity and International Tax-Managed Equity Funds respectively. |
| 4 | Effective at the close of business on February 28, 2014, the Goldman Sachs Concentrated International Equity Fund was renamed the Goldman Sachs Focused International Equity Fund. |
| 5 | Individual Funds within the Total Portfolio Solutions and Select Satellite categories will have various placement on the risk/return spectrum and may have greater or lesser risk than that indicated by the placement of the general Total Portfolio Solutions or Select Satellite category. |
Financial Square FundsSM is a registered service mark of Goldman, Sachs & Co.
| *This | list covers open-end funds only. Please visit our website at www.GSAMFUNDS.com to learn about our closed-end fund. |
TRUSTEES Ashok N. Bakhru, Chairman Donald C. Burke John P. Coblentz, Jr. Diana M. Daniels Joseph P. LoRusso Herbert J. Markley James A. McNamara Jessica Palmer Alan A. Shuch Richard P. Strubel Roy W. Templin | OFFICERS James A. McNamara, President Scott M. McHugh, Principal Financial Officer and Treasurer Caroline L. Kraus, Secretary | |
GOLDMAN, SACHS & CO. Distributor and Transfer Agent | GOLDMAN SACHS ASSET MANAGEMENT, L.P. Investment Adviser | |
Visit our Web site at www.GSAMFUNDS.com to obtain the most recent month-end returns.
Goldman Sachs Asset Management, L.P., 200 West Street, New York, New York 10282
The reports concerning the Funds included in this shareholder report may contain certain forward-looking statements about the factors that may affect the performance of the Funds in the future. These statements are based on Fund management’s predictions and expectations concerning certain future events and their expected impact on the Funds, such as performance of the economy as a whole and of specific industry sectors, changes in the levels of interest rates, the impact of developing world events, and other factors that may influence the future performance of the Funds. Management believes these forward-looking statements to be reasonable, although they are inherently uncertain and difficult to predict. Actual events may cause adjustments in portfolio management strategies from those currently expected to be employed.
A description of the policies and procedures that the Funds use to determine how to vote proxies relating to portfolio securities and information regarding how a Fund voted proxies relating to portfolio securities during the most recent 12-month period ended June 30 is available (I) without charge, upon request by calling 1-800-526-7384 (for Retail Shareholders) or 1-800-621-2550 (for Institutional Shareholders); and (II) on the Securities and Exchange Commission (“SEC”) Web site at http://www.sec.gov.
The Funds file their complete schedule of portfolio holdings with the SEC for the first and third quarters of each fiscal year on Form N-Q. The Funds’ Forms N-Q are available on the SEC’s web site at http://www.sec.gov within 60 days after the Funds’ first and third fiscal quarters. The Funds’ Forms N-Q may be reviewed and copied at the SEC’s Public Reference Room in Washington, D.C., and information on the operation of the Public Reference Room may also be obtained by calling 1-800-SEC-0330. Forms N-Q may be obtained upon request and without charge by calling 1-800-526-7384 (for Retail Shareholders) or 1-800-621-2550 (for Institutional Shareholders).
The website links provided are for your convenience only and are not an endorsement or recommendation by GSAM of any of these websites or the products or services offered. GSAM is not responsible for the accuracy and validity of the content of these websites.
Holdings and allocations shown are as of April 30, 2014 and may not be representative of future investments. Fund holdings should not be relied on in making investment decisions and should not be construed as research or investment advice regarding particular securities. Current and future holdings are subject to risk.
The Global Industry Classification Standard (GICS) was developed by and is the exclusive property and a service mark of Morgan Stanley Capital International Inc. (MSCI) and Standard & Poor’s, a division of The McGraw-Hill Companies, Inc. (S&P) and is licensed for use by Goldman Sachs. Neither MSCI, S&P nor any other party involved in making or compiling the GICS or any GICS classifications makes any express or implied warranties or representations with respect to such standard or classification (or the results to be obtained by the use thereof), and all such parties hereby expressly disclaim all warranties of originality, accuracy, completeness, merchantability or fitness for a particular purpose with respect to any of such standard or classification. Without limiting any of the foregoing, in no event shall MSCI, S&P, any of their affiliates or any third party involved in making or compiling the GICS or any GICS classifications have any liability for any direct, indirect, special, punitive, consequential or any other damages (including lost profits) even if notified of the possibility of such damages.
The portfolio risk management process includes an effort to monitor and manage risk, but does not imply low risk.
This material is not authorized for distribution to prospective investors unless preceded or accompanied by a current Prospectus or summary prospectus, if applicable. Investors should consider a Fund’s objective, risks, and charges and expenses, and read the summary prospectus, if available, and/or the Prospectus carefully before investing or sending money. The summary prospectus, if available, and the Prospectus contain this and other information about a Fund and may be obtained from your authorized dealer or from Goldman, Sachs & Co. by calling (retail – 1-800-526-7384) (institutional – 1-800-621-2550).
© 2014 Goldman Sachs. All rights reserved. 131661.MF.MED.TMPL /6/2014 DIVFOSAR14 / 93.3k
| ITEM 2. | CODE OF ETHICS. |
The information required by this Item is only required in an annual report on this Form N-CSR.
| ITEM 3. | AUDIT COMMITTEE FINANCIAL EXPERT. |
The information required by this Item is only required in an annual report on this Form N-CSR.
| ITEM 4. | PRINCIPAL ACCOUNTANT FEES AND SERVICES. |
The information required by this Item is only required in an annual report on this Form N-CSR.
| ITEM 5. | AUDIT COMMITTEE OF LISTED REGISTRANTS. |
| Not applicable. |
| ITEM 6. | SCHEDULE OF INVESTMENTS. |
| Schedule of Investments is included as part of the Report to Stockholders filed under Item 1. |
| ITEM 7. | DISCLOSURE OF PROXY VOTING POLICIES AND PROCEDURES FOR CLOSED-END MANAGEMENT INVESTMENT COMPANIES. |
| Not applicable. |
| ITEM 8. | PORTFOLIO MANAGERS OF CLOSED-END MANAGEMENT INVESTMENT COMPANIES. |
| Not applicable. |
| ITEM 9. | PURCHASES OF EQUITY SECURITIES BY CLOSED-END MANAGEMENT INVESTMENT COMPANY AND AFFILIATED PURCHASERS. |
| Not applicable. |
| ITEM 10. | SUBMISSION OF MATTERS TO A VOTE OF SECURITY HOLDERS. |
| There have been no material changes to the procedures by which shareholders may recommend nominees to the registrant’s board of trustees. |
| ITEM 11. | CONTROLS AND PROCEDURES. |
| (a) | The registrant’s principal executive and principal financial officers, or persons performing similar functions have concluded that the registrant’s disclosure controls and procedures (as defined in Rule 30a-3(c) under the Investment Company Act of 1940, as amended (the “1940 Act”)) are effective as of a date within 90 days of the filing of this report that includes the disclosure required by this paragraph, based on the evaluation of these controls and procedures required by Rule 30a-3(b) under the 1940 Act and 15d-15(b) under the Securities Exchange Act of 1934, as amended. |
| (b) | There were no changes in the registrant’s internal control over financial reporting (as defined in Rule 30a-3(d) under the 1940 Act) that occurred during the registrant’s second fiscal quarter of the period covered by this report that have materially affected, or are reasonably likely to materially affect, the registrant’s internal control over financial reporting. |
| ITEM 12. | EXHIBITS. |
| (a)(1) | The information required by this Item is only required in connection with an annual report on this Form N-CSR. | |||
| (a)(2) | Exhibit 99.CERT | Certifications pursuant to Section 302 of the Sarbanes-Oxley Act of 2002 filed herewith. | ||
| (b) | Exhibit 99.906CERT | Certifications pursuant to Section 906 of the Sarbanes-Oxley Act of 2002 filed herewith. | ||
SIGNATURES
Pursuant to the requirements of the Securities Exchange Act of 1934 and the Investment Company Act of 1940, the registrant has duly caused this report to be signed on its behalf by the undersigned, thereunto duly authorized.
| Goldman Sachs Trust | ||
| By: | /s/ James A. McNamara | |
| ||
James A. McNamara | ||
| President/Principal Executive Officer | ||
| Goldman Sachs Trust | ||
| Date: | June 30, 2014 | |
Pursuant to the requirements of the Securities Exchange Act of 1934 and the Investment Company Act of 1940, this report has been signed below by the following persons on behalf of the registrant and in the capacities and on the dates indicated.
| By: | /s/ James A. McNamara | |
| ||
James A. McNamara | ||
| President/Principal Executive Officer | ||
| Goldman Sachs Trust | ||
| Date: | June 30, 2014 | |
| By: | /s/ Scott McHugh | |
| ||
Scott McHugh | ||
| Principal Financial Officer | ||
| Goldman Sachs Trust | ||
| Date: | June 30, 2014 | |