UNITED STATES
SECURITIES AND EXCHANGE COMMISSION
Washington, D.C. 20549
FORM N-CSR
CERTIFIED SHAREHOLDER REPORT OF REGISTERED
MANAGEMENT INVESTMENT COMPANIES
Investment Company Act file number 811-05349
Goldman Sachs Trust
(Exact name of registrant as specified in charter)
71 South Wacker Drive, Chicago, Illinois 60606
(Address of principal executive offices) (Zip code)
| Caroline Kraus, Esq. | Copies to: | |
| Goldman, Sachs & Co. | Geoffrey R.T. Kenyon, Esq. | |
| 200 West Street | Dechert LLP | |
| New York, New York 10282 | 100 Oliver Street | |
| 40th Floor | ||
| Boston, MA 02110-2605 |
(Name and address of agents for service)
Registrant’s telephone number, including area code: (312) 655-4400
Date of fiscal year end: March 31
Date of reporting period: September 30, 2014
| ITEM 1. | REPORTS TO STOCKHOLDERS. |
| The Semi-Annual Report to Stockholders is filed herewith. |
Goldman Sachs Funds

| Semi-Annual Report | September 30, 2014 | |||
Short Duration and Government | ||||
Enhanced Income | ||||
Government Income | ||||
High Quality Floating Rate | ||||
Inflation Protected Securities | ||||
Limited Maturity Obligations | ||||
Short Duration Government | ||||
Short Duration Income | ||||

Goldman Sachs Short Duration and Government Fixed Income Funds
| n | ENHANCED INCOME |
| n | GOVERNMENT INCOME |
| n | HIGH QUALITY FLOATING RATE |
| n | INFLATION PROTECTED SECURITIES |
| n | LIMITED MATURITY OBLIGATIONS |
| n | SHORT DURATION GOVERNMENT |
| n | SHORT DURATION INCOME |
TABLE OF CONTENTS | ||||
Principal Investment Strategies and Risks | 1 | |||
Investment Process | 4 | |||
Market Review | 5 | |||
Portfolio Management Discussions and Performance Summaries | 7 | |||
Schedules of Investments | 41 | |||
Financial Statements | 88 | |||
Financial Highlights | 96 | |||
Notes to Financial Statements | 110 | |||
Other Information | 140 | |||
| NOT FDIC-INSURED | May Lose Value | No Bank Guarantee | ||
GOLDMAN SACHS SHORT DURATION AND GOVERNMENT FIXED INCOME FUNDS
Principal Investment Strategies and Risks
This is not a complete list of risks that may affect the Funds. For additional information concerning the risks applicable to the Funds, please see the Funds’ Prospectuses.
The Goldman Sachs Enhanced Income Fund invests primarily in a portfolio of U.S. dollar denominated fixed income securities, including non-mortgage U.S. government securities, corporate notes, commercial paper, fixed and floating rate asset-backed securities and foreign securities. The Fund’s investments in fixed income securities are subject to the risks associated with debt securities generally, including credit, liquidity and interest rate risk. Any guarantee on U.S. government securities applies only to the underlying securities of the Fund if held to maturity and not to the value of the Fund’s shares. Foreign investments may be more volatile and less liquid than investments in U.S. securities and are subject to the risks of adverse economic or political developments. Derivative instruments may involve a high degree of financial risk. These risks include the risk that a small movement in the price of the underlying security or benchmark may result in a disproportionately large movement, unfavorable or favorable, in the price of the derivative instrument; the risk of default by a counterparty; and liquidity risk. At times, the Fund may be unable to sell certain of its illiquid investments without a substantial drop in price, if at all.
The Goldman Sachs Government Income Fund invests primarily in U.S. government securities and in repurchase agreements collateralized by such securities. The Fund’s investments in fixed income securities are subject to the risks associated with debt securities generally, including credit, liquidity and interest rate risk. The Fund’s net asset value and yield are not guaranteed by the U.S. government or by its agencies, instrumentalities or sponsored enterprises. Any guarantee on U.S. government securities applies only to the underlying securities of the Fund if held to maturity and not to the value of the Fund’s shares. Investments in mortgage-backed securities are also subject to prepayment risk (i.e., the risk that in a declining interest rate environment, issuers may pay principal more quickly than expected, causing the Fund to reinvest proceeds at lower prevailing interest rates). Derivative instruments may involve a high degree of financial risk. These risks include the risk that a small movement in the price of the underlying security or benchmark may result in a disproportionately large movement, unfavorable or favorable, in the price of the derivative instrument; the risk of default by a counterparty; and liquidity risk (i.e., the risk that an investment may not be able to be sold without a substantial drop in price, if at all).
The Goldman Sachs High Quality Floating Rate Fund invests primarily in high quality floating rate or variable rate obligations, and the Fund considers “high quality” obligations to be (i) those rated AAA or Aaa by a nationally recognized statistical rating organization at the time of purchase (or, if unrated, determined by the Investment Adviser to be of comparable quality), and (ii) U.S. government securities, including mortgage-backed securities, and repurchase agreements collateralized by U.S. government securities. The Fund’s investments in fixed income securities are subject to the risks associated with debt securities generally, including credit, liquidity and interest rate risk. Any guarantee on U.S. government securities applies only to the underlying securities of the Fund if held to maturity and not to the value of the Fund’s shares. Investments in mortgage-backed securities are also subject to prepayment risk (i.e., the risk that in a declining interest rate environment, issuers may pay principal more quickly than expected, causing the Fund to reinvest proceeds at lower prevailing interest rates). Foreign investments may be more volatile and less liquid than investments in U.S. securities and are subject to the risks of adverse economic or political developments. Derivative instruments may involve a high degree of financial risk. These risks include the risk that a small movement in the price of the underlying security or benchmark may result in a disproportionately large movement, unfavorable or favorable, in the price of the derivative instrument; the risk of default by a counterparty; and liquidity risk. At times, the Fund may be unable to sell certain of its illiquid investments without a substantial drop in price, if at all.
1
GOLDMAN SACHS SHORT DURATION AND GOVERNMENT FIXED INCOME FUNDS
The Goldman Sachs Inflation Protected Securities Fund invests primarily in inflation protected securities (IPS) of varying maturities issued by the U.S. Treasury and other U.S. and non-U.S. Government agencies and corporations. Fixed income securities are subject to the risks associated with debt securities generally, including credit, liquidity and interest rate risk. IPS are fixed income securities whose interest and principal payments are periodically adjusted according to the rate of inflation. The market value of IPS is not guaranteed, and will fluctuate in response to changes in real interest rates. The market for IPS may be less developed or liquid, and more volatile, than certain other securities markets. If deflation were to occur, IPS would likely decline in price. Any guarantee on U.S. government securities applies only to the underlying securities of the Fund if held to maturity and not to the value of the Fund’s shares.
The Goldman Sachs Limited Maturity Obligations Fund invests in a broad range of high quality, U.S. dollar-denominated money market and other fixed income instruments, including obligations issued or guaranteed by the U.S. Government, its agencies, authorities, instrumentalities or sponsored enterprises, obligations of U.S. banks, corporate notes, commercial paper and other short-term obligations of U.S. companies, states, municipalities and other entities, fixed and floating rate asset-backed securities and repurchase agreements. The Fund may also invest in U.S. dollar-denominated obligations issued or guaranteed by foreign banks, companies and governments or their agencies, authorities, instrumentalities or sponsored enterprises. The Fund is not a money market fund and does not attempt to maintain a stable net asset value. The Fund is subject to NAV risk, which means that the net asset value of the Fund and the value of investments in the Fund will fluctuate. The Fund’s investments in fixed income securities are subject to the risks associated with debt securities generally, including credit, liquidity and interest rate risk. Any guarantee on U.S. government securities applies only to the underlying securities of the Fund if held to maturity and not to the value of the Fund’s shares. Because the Fund may invest heavily in specific sectors (for example, the financial services sector), the Fund is subject to greater risk of loss as a result of adverse economic, business or other developments affecting such sectors. Foreign investments may be more volatile and less liquid than investments in U.S. securities and are subject to the risks of adverse economic or political developments. Investments in asset-backed and receivables-backed securities are subject to prepayment risk (i.e., the risk that in a declining interest rate environment, issuers may pay principal more quickly than expected, causing the Fund to reinvest proceeds at lower prevailing interest rates).
The Goldman Sachs Short Duration Government Fund invests primarily in U.S. government securities and in repurchase agreements collateralized by such securities. The Fund’s investments in fixed income securities are subject to the risks associated with debt securities generally, including credit, liquidity and interest rate risk. The Fund’s net asset value and yield are not guaranteed by the U.S. government or by its agencies, instrumentalities or sponsored enterprises. Any guarantee on U.S. government securities applies only to the underlying securities of the Fund if held to maturity and not to the value of the Fund’s shares. Investments in mortgage-backed securities are also subject to prepayment risk (i.e., the risk that in a declining interest rate environment, issuers may pay principal more quickly than expected, causing the Fund to reinvest proceeds at lower prevailing interest rates). Derivative instruments may involve a high degree of financial risk. These risks include the risk that a small movement in the price of the underlying security or benchmark may result in a disproportionately large movement, unfavorable or favorable, in the price of the derivative instrument; the risk of default by a counterparty; and liquidity risk. At times, the Fund may be unable to sell certain of its illiquid investments without a substantial drop in price, if at all.
The Goldman Sachs Short Duration Income Fund invests primarily in U.S. or foreign fixed income securities, including U.S. government securities, corporate debt securities, collateralized loan obligations, agency and privately issued mortgage-backed securities, asset-backed securities, high yield non-investment grade securities, bank loans and emerging countries debt. Investments in fixed income securities are subject to the risks associated with debt securities generally, including credit, liquidity,
2
GOLDMAN SACHS SHORT DURATION AND GOVERNMENT FIXED INCOME FUNDS
interest rate, call and extension risk. Any guarantee on U.S. government securities applies only to the underlying securities of the Fund if held to maturity and not to the value of the Fund’s shares. Investments in mortgage-backed securities are also subject to prepayment risk (i.e., the risk that in a declining interest rate environment, issuers may pay principal more quickly than expected, causing the Fund to reinvest proceeds at lower prevailing interest rates). High yield, lower rated investments involve greater price volatility and present greater risks than higher rated fixed income securities. Indirect loan participations may subject the Fund to greater delays, expenses and risks than direct obligations in the case that a borrower fails to pay scheduled principal and interest. Foreign and emerging markets investments may be more volatile and less liquid than investments in U.S. securities and are subject to the risks of currency fluctuations and adverse economic and political developments. Derivative instruments may involve a high degree of financial risk. These risks include the risk that a small movement in the price of the underlying security or benchmark may result in a disproportionately large movement, unfavorable or favorable, in the price of the derivative instrument; risks of default by a counterparty; and liquidity risk (i.e., the risk that an investment may not be able to be sold without a substantial drop in price, if at all). The Fund’s use of derivatives may result in leverage, which can make the Fund more volatile. The Fund’s investments in other investment companies subject it to additional expenses. The Fund may be more sensitive to adverse economic, business or political developments if it invests a substantial portion of its assets in bonds of similar projects or in particular types of municipal securities.
3
GOLDMAN SACHS SHORT DURATION AND GOVERNMENT FIXED INCOME FUNDS
What Differentiates Goldman Sachs Asset Management’s Fixed Income Investment Process?
At Goldman Sachs Asset Management, L.P. (“GSAM”), the goal of our fixed income investment process is to provide consistent, strong performance by actively managing our portfolios within a research-intensive, risk-managed framework.
A key element of our fixed income investment philosophy is to evaluate the broadest global opportunity set to capture relative value across sectors and instruments. Our globally integrated investment process involves managing dynamically along the risk/return spectrum, as we continue to develop value-added strategies through:

| n | Assess relative value among securities and sectors |
| n | Leverage the vast resources of GSAM in selecting securities for each portfolio |

| n | Team approach to decision making |
| n | Manage risk by avoiding significant sector and interest rate bets |
| n | Careful management of yield curve strategies — while closely managing portfolio duration |

Fixed Income portfolios that:
| n | Include domestic and global investment options, income opportunities, and access to areas of specialization such as high yield |
| n | Capitalize on GSAM’s industry-renowned credit research capabilities |
| n | Use a risk-managed framework to seek total return, recognizing the importance of investors’ capital accumulation goals as well as their need for income |
4
MARKET REVIEW
Goldman Sachs Short Duration and
Government Fixed Income Funds
Market Review
Economic conditions, geopolitical tensions and monetary policies of global central banks drove the performance of the global fixed income markets during the six months ended September 30, 2014 (the “Reporting Period”).
When the Reporting Period began in April 2014, spread, or non-government bond, sectors rallied as global bond yields fell. Markets focused in part on events in Ukraine, as Russia’s intervention led to sanctions by the U.S. and Europe. Emerging markets debt overall appeared to benefit from investment flows diverted from Russia. Economic influences included the U.S. Commerce Department’s announcement that first quarter 2014 Gross Domestic Product (“GDP”) had declined, indicating an economic contraction. However, second calendar quarter economic data releases, such as auto sales, jobless claims and manufacturing activity, suggested a rebound was underway. This supported the view of some market participants that the first quarter 2014 contraction might have been due to inclement winter weather and that economic growth could accelerate in the remainder of the calendar year. From a monetary policy perspective, in June 2014, the European Central Bank (“ECB”) cut interest rates by 10 basis points, moving the deposit rate for the Eurozone into negative territory for the first time in history. (The Eurozone is a geographic and economic region that consists of all the European Union countries that have fully incorporated the euro as their national currency.) (A basis point is 1/100th of a percentage point.) The ECB also announced it would be implementing additional liquidity measures targeted at stimulating lending. Meanwhile, India’s elections delivered a victory to its existing government, which is seeking to revive the country’s economic growth, tame inflation and remove roadblocks to reform.
At the beginning of the third calendar quarter, spread sectors generally continued to rally. In July 2014, core European government bond yields fell, while U.S. Treasury yields rose modestly. U.S. economic data was mixed, with labor and manufacturing indicators continuing to improve and housing data showing signs of weakening. In the U.K., economic growth continued at a brisk pace, broadly in line with market expectations. During August 2014, global spread sectors continued to post gains. Eurozone GDP came in below expectations, with Italy, France and Germany surprising to the downside. In the U.S., Treasury yields fell despite the release of positive durable goods orders and manufacturing data. The decline in U.S. Treasury yields may have reflected market concern about increased geopolitical risk in Ukraine and the Middle East. Meanwhile, Federal Reserve (“Fed”) comments suggested a modest shift in tone towards policy tightening. In the U.K., data continued to indicate strong economic momentum. However, heightened concerns about European economic growth appeared to decrease the likelihood of a rate hike by the Bank of England in the near term.
In September 2014, the spread sector rally ended. Core government bond yields in the U.S., U.K., Eurozone and Japan also rose during the month. In the U.S., economic data remained generally positive, despite a disappointing August 2014 payroll number, with employment, auto sales and manufacturing showing improvement. In the Eurozone, the ECB cut interest rates to record lows and announced plans to start purchasing asset-backed securities as it sought to combat a drop in inflation and weak economic growth. In the U.K., unemployment continued to fall rapidly. Scotland voted to remain part of the United Kingdom, although this had little effect on U.K. government yields.
For the Reporting Period overall, sovereign emerging markets debt generated the strongest positive returns within the broad fixed income market. Mortgage-backed securities also outperformed U.S. Treasuries, followed at some distance by agency securities, asset-backed
5
MARKET REVIEW
securities and commercial mortgage-backed securities. Conversely, high yield corporate bonds underperformed U.S. Treasuries, while investment grade corporate bonds also lagged, albeit more modestly. The U.S. Treasury yield curve, or spectrum of maturities, flattened during the Reporting Period, as intermediate-term and longer-term yields declined and shorter-term maturities edged up. The yield on the bellwether 10-year U.S. Treasury fell approximately 23 basis points during the Reporting Period to 2.49%.
Looking Ahead
At the end of the Reporting Period, we believed global macroeconomic conditions had diverged and that the divergence was continuing to intensify. In our opinion, the U.S. is the growth leader among developed nations, while the Eurozone appears to be falling further behind. We believe the Eurozone’s economic weakness could persist for some time and could also affect other economies. Most notably, we think Eurozone weakness could pose a risk to the U.K.’s economic expansion. Inflation seems to be trending higher in the U.S. and Japan, but Eurozone inflation is significantly below the ECB’s target rate, and we do not expect a change in the near term. Meanwhile, developed central bank activity is also moving in opposite directions. The Fed has indicated it will end its quantitative easing asset purchase program in October 2014, and we believe the first short-term rate hike could occur in mid-2015, unless the recent increase in market volatility leads to slower economic growth. By contrast, the ECB has committed to bolder stimulus, and we think it may resort to full-scale quantitative easing in 2015. The Bank of Japan remains in easing, or accommodative, mode, but we do not expect any action in the near term as the impact of its sales tax hike, put into effect in April 2014, works its way through the nation’s economy.
We are also seeing divergence in the emerging markets, with investors seemingly favoring countries that have passed reforms necessary for sustainable growth. These countries include India, Mexico and Indonesia. In China, we believe the balancing act between that nation’s economic reforms and a potential 2014 growth rate of 7.5% has tilted in favor of the growth target. However, in our view, the economy’s longer-term health depends on China switching to more sustainable economic drivers. At the end of the Reporting Period, wage inflation was eroding China’s competitiveness, with credit growth and the slowing real estate sector as our key concerns.
In the near term, we believe the divergence in macroeconomic conditions around the globe could stir volatility. However, we believe economic growth and strong corporate fundamentals should support the corporate credit sector. Meanwhile, geopolitical risks have increased and may also contribute to market volatility, but, in our view, are unlikely to have much impact on global GDP. Energy prices have fallen, suggesting to us that global oversupply was a stronger market driver than geopolitics at the end of the Reporting Period.
6
PORTFOLIO RESULTS
Goldman Sachs Enhanced Income Fund
Investment Objective
The Fund seeks to generate return in excess of traditional money market products while maintaining an emphasis on preservation of capital and liquidity.
Portfolio Management Discussion and Analysis
Below, the Goldman Sachs U.S. Fixed Income Investment Management Team discusses the Goldman Sachs Enhanced Income Fund’s (the “Fund”) performance and positioning for the six-month period ended September 30, 2014 (the “Reporting Period”).
| Q | How did the Fund perform during the Reporting Period? |
| A | During the Reporting Period, the Fund’s Class A, B, Institutional, Administration and IR Shares generated cumulative total returns, without sales charges, of -0.18%, -0.10%, 0.09%, -0.04% and 0.04%, respectively. These returns compare to the 0.12% cumulative total return of the Goldman Sachs Enhanced Income Fund Composite Index (the “Enhanced Income Composite”) during the same period. The Enhanced Income Composite is comprised 50% of the Bank of America Merrill Lynch Six-Month U.S. Treasury Bill Index and 50% of the Bank of America Merrill Lynch One-Year U.S. Treasury Note Index, which generated cumulative total returns of 0.06% and 0.17%, respectively, over the same time period. |
| Q | What key factors were responsible for the Fund’s performance during the Reporting Period? |
| A | Both top-down and bottom-up strategies had an impact on the Fund’s performance during the Reporting Period. Within our top-down strategies, our duration and yield curve positioning strategy detracted from the Fund’s results during the Reporting Period. Duration is a measure of the Fund’s sensitivity to changes in interest rates. Yield curve indicates the spectrum of maturities within a particular sector. On the other hand, our cross-sector strategy contributed positively to the Fund’s results during the Reporting Period. Our cross-sector strategy is one in which we invest Fund assets across a variety of fixed income sectors, including some that may not be included in the Fund’s benchmark. Bottom-up individual issue selection amongst corporate bonds also boosted results. |
| Q | Which fixed income market sectors most significantly affected Fund performance? |
| A | Our individual security selection strategies were the primary positive contributor to the Fund’s relative results during the Reporting Period, especially individual selection of corporate bonds. The key contributor to relative results was selection amongst short-dated corporate bonds. |
Our cross-sector strategy contributed positively to the Fund’s results during the Reporting Period overall, with positioning in corporate bonds and asset-backed securities helping most. An exposure to corporate bonds benefited the Fund, as the sector performed well, particularly at the beginning of the Reporting Period. We continued to see what we believe were supportive credit fundamentals, though valuations were close to fair value, in our opinion, at the end of the Reporting Period. In our view, better economic growth, weak inflation and accommodative monetary policy supported credit risk appetite. Our constructive credit view was underpinned by our macro outlooks for the U.S. and Europe, which foresee modestly improving economic growth against a backdrop of persistent slack and hence continued low to moderate inflation. The asset-backed securities sector rallied, particularly during the first half of the Reporting Period. The Fund’s exposure to covered bonds had a positive impact on Fund performance, albeit more modest, as well, while exposure to U.S. swap spreads detracted from performance. (Covered bonds are debt securities backed by cash flows from mortgage loans or public sector loans. Swap spreads are defined as the difference between the swap rate on a contract and the yield on a government bond of the same maturity. It is used to represent the risk associated with the investment, since changes in interest rates will ultimately affect return. |
7
PORTFOLIO RESULTS
Swap spreads are based on LIBOR rates, the creditworthiness of the swap’s parties, and other economic factors that could influence the terms of the investment’s interest rates.) |
| Q | Did the Fund’s duration and yield curve positioning strategy help or hurt its results during the Reporting Period? |
| A | Tactical management of the Fund’s duration and yield curve positioning detracted from the Fund’s results during the Reporting Period. U.S. Treasury yields at the short-term end of the yield curve declined during the Reporting Period overall as did longer-term U.S. Treasury yields. The 10-year U.S. Treasury yield fell approximately 23 basis points to end the Reporting Period at 2.49%. (A basis point is 1/100th of a percentage point.) |
| During the second quarter of 2014, U.S. Treasury yields fell despite U.S. economic data, including manufacturing and housing market activity, continuing to improve. The U.S. Treasury yield curve flattened during the third calendar quarter, meaning the differential in yields between shorter- term and longer-term securities narrowed. Five-year U.S. Treasury yields rose by 13 basis points during the third quarter of 2014, while 10-year U.S. Treasury yields fell by 4 basis points during the same period. Federal Reserve (“Fed”) chair Janet Yellen’s tone was notably balanced in September 2014’s press conference. Though the language in the Fed’s statement around guidance and the labor market was little changed, the press conference focused on the shift up in Fed rate projections, consistent with a first interest rate hike in June 2015. |
| During the Reporting Period, the Fund maintained a significant short duration position relative to the Enhanced Income Composite. The Fund’s short positions were mainly in the six-month and one-year nodes, or points, of the U.S. Treasury yield curve as well as in the five-year node. In our view, U.S. economic growth data remained healthy overall, and we continue to anticipate a gradual rise in interest rates. As mentioned earlier, duration is a measure of the Fund’s sensitivity to changes in interest rates. Yield curve indicates the spectrum of maturities within a particular sector. |
| Q | How did the Fund use derivatives and similar instruments during the Reporting Period? |
| A | The Fund used Treasury futures and Eurodollar futures during the Reporting Period for the purpose of managing the duration and term structure of the Fund. (Term structure, most often depicted as a yield curve, refers to the term structure of interest rates, which is the relationship between the yield to maturity and the time to maturity for pure discount bonds.) The Fund employed credit default swaps to manage the credit profile of the Fund. |
| Q | Were there any notable changes in the Fund’s weightings during the Reporting Period? |
| A | The Fund’s exposure to U.S. Treasury securities, agency government guaranteed securities and cash decreased during the Reporting Period. A corresponding increase in allocation was concentrated in asset-backed securities, investment grade corporate bonds and covered bonds. |
| Additionally, we modestly shifted the Fund’s duration positioning during the Reporting Period as market conditions changed. |
| Q | How was the Fund positioned relative to its benchmark index at the end of September 2014? |
| A | While the Fund is benchmarked to U.S. Treasuries, it continued to hold a portion of its assets in non-Treasury sectors not represented in the Enhanced Income Composite. Indeed, the Fund maintained exposures to high quality spread, or non-Treasury, sectors throughout the Reporting Period, most notably quasi-government securities, including agency-issued debentures, as well as asset-backed securities, covered bonds and investment grade corporate bonds. The Fund maintained an underweighted exposure to government bonds at the end of the Reporting Period. |
8
FUND BASICS
Enhanced Income Fund
as of September 30, 2014
| PERFORMANCE REVIEW | ||||||||||||||||||||||||||
| April 1, 2014– September 30, 2014 | Fund Total Return (based on NAV)1 | Goldman Sachs Enhanced Income Fund Composite Index2 | BofA Six- Month U.S. Treasury Bill Index3 | BofA One- Year U.S. Treasury Note Index3 | 30-Day Standardized Subsidized Yield4 | 30-Day Standardized Unsubsidized Yield4 | ||||||||||||||||||||
| Class A | -0.18 | % | 0.12 | % | 0.06 | % | 0.17 | % | -0.09 | % | -0.19 | % | ||||||||||||||
| Class B | -0.10 | 0.12 | 0.06 | 0.17 | -0.13 | -0.94 | ||||||||||||||||||||
| Institutional | 0.09 | 0.12 | 0.06 | 0.17 | 0.24 | 0.13 | ||||||||||||||||||||
| Administration | -0.04 | 0.12 | 0.06 | 0.17 | -0.01 | -0.11 | ||||||||||||||||||||
| Class IR | 0.04 | 0.12 | 0.06 | 0.17 | 0.15 | 0.04 | ||||||||||||||||||||
| 1 | The net asset value (NAV) represents the net assets of the class of the Fund (ex-dividend) divided by the total number of shares of the class outstanding. The Fund’s performance assumes the reinvestment of dividends and other distributions. The Fund’s performance does not reflect the deduction of any applicable sales charges. |
| 2 | The Goldman Sachs Enhanced Income Fund Composite Index is an equal weight blend of the BofA Six-Month U.S. Treasury Bill Index and the BofA One-Year U.S. Treasury Note Index. |
| 3 | The BofA Six-Month U.S. Treasury Bill Index and BofA One-Year U.S. Treasury Note Index, as reported by Bank of America Merrill Lynch, do not reflect any deduction for fees, expenses or taxes. It is not possible to invest directly in an index. |
| 4 | The method of calculation of the 30-Day Standardized Subsidized Yield is mandated by the Securities and Exchange Commission and is determined by dividing the net investment income per share earned during the last 30 days of the period by the maximum public offering price (“POP”) per share on the last day of the period. This number is then annualized. The 30-Day Standardized Subsidized Yield reflects fee waivers and/or expense reimbursements recorded by the Fund during the period. Without waivers and/or reimbursements, yields would be reduced. This yield does not necessarily reflect income actually earned and distributed by the Fund and, therefore, may not be correlated with the dividends or other distributions paid to shareholders. The 30-Day Standardized Unsubsidized Yield does not adjust for any fee waivers and/ or expense reimbursements in effect. If the Fund does not incur any fee waivers and/or expense reimbursements during the period, the 30-Day Standardized Subsidized Yield and 30-Day Standardized Unsubsidized Yield will be identical. |
The returns set forth in the table above represent past performance. Past performance does not guarantee future results. The Fund’s investment return and principal value will fluctuate so that an investor’s shares, when redeemed, may be worth more or less than their original cost. Current performance may be lower or higher than the performance quoted above. Please visit our web site at www.GSAMFUNDS.com to obtain the most recent month-end returns. Performance reflects applicable fee waivers and/or expense limitations in effect during the periods shown. In their absence, performance would be reduced. Returns do not reflect the deduction of taxes that a shareholder would pay on Fund distributions or the redemption of Fund shares.
9
FUND BASICS
| STANDARDIZED TOTAL RETURNS5 | ||||||||||||||||||||
| For the period ended 9/30/14 | One Year | Five Years | Ten Years | Since Inception | Inception Date | |||||||||||||||
| Class A | -1.50 | % | -0.04 | % | 1.60 | % | 2.15 | % | 8/2/00 | |||||||||||
| Class B | -4.99 | -0.70 | N/A | 0.53 | 6/20/07 | |||||||||||||||
| Institutional | 0.40 | 0.63 | 2.13 | 2.63 | 8/2/00 | |||||||||||||||
| Administration | 0.15 | 0.38 | 1.89 | 2.39 | 8/2/00 | |||||||||||||||
| Class IR | 0.31 | N/A | N/A | 0.46 | 7/30/10 | |||||||||||||||
| 5 | The Standardized Total Returns are average annual total returns as of the most recent calendar quarter-end. They assume reinvestment of all distributions at NAV. These returns reflect a maximum initial sales charge of 1.5% for Class A Shares and the assumed contingent deferred sales charge for Class B Shares (5% maximum declining to 0% after six years). Class B shares convert automatically to Class A shares on or about the fifteenth day of the last month of the calendar quarter that is eight years after purchase. Because Institutional Shares, Class IR Shares and Administration Shares do not involve a sales charge, such a charge is not applied to their Standardized Total Returns. The Fund’s Class B Shares are no longer available for purchase by new or existing shareholders (although current Class B shareholders may continue to reinvest income and capital gains distributions into Class B Shares, and Class B shareholders may continue to exchange their shares for Class B Shares of certain other Goldman Sachs Funds). |
The returns set forth in the table above represent past performance. Past performance does not guarantee future results. The Fund’s investment return and principal value will fluctuate so that an investor’s shares, when redeemed, may be worth more or less than their original cost. Current performance may be lower or higher than the performance quoted above. Please visit our web site at www.GSAMFUNDS.com to obtain the most recent month-end returns. Performance reflects applicable fee waivers and/or expense limitations in effect during the periods shown. In their absence, performance would be reduced. Returns do not reflect the deduction of taxes that a shareholder would pay on Fund distributions or the redemption of Fund shares.
| EXPENSE RATIOS6 | ||||||||||
| Net Expense Ratio (Current) | Gross Expense Ratio (Before Waivers) | |||||||||
| Class A | 0.73 | % | 0.73 | % | ||||||
| Class B | 1.48 | 1.48 | ||||||||
| Institutional | 0.38 | 0.38 | ||||||||
| Administration | 0.64 | 0.64 | ||||||||
| Class IR | 0.48 | 0.48 | ||||||||
| 6 | The expense ratios of the Fund, both current (net of applicable fee waivers and/or expense limitations) and before waivers (gross of applicable fee waivers and/or expense limitations) are as set forth above according to the most recent publicly available Prospectus for the Fund and may differ from the expense ratios disclosed in the Financial Highlights in this report. |
10
FUND BASICS
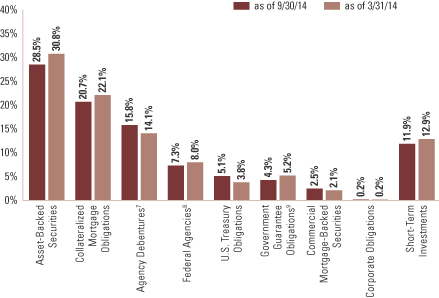
| FUND COMPOSITION7 |
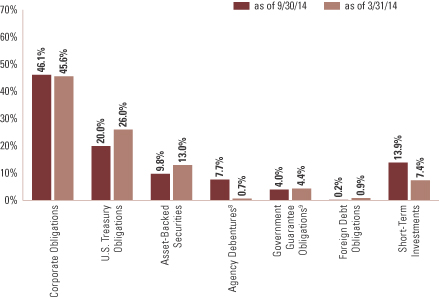
| 7 | The percentage shown for each investment category reflects the value of investments in that category as a percentage of net assets. Short-term Investments represents certificates of deposit and repurchase agreements. Figures in the graph may not sum to 100% due to the exclusion of other assets and liabilities. The graph depicts the Fund’s investments but may not represent the Fund’s market exposure due to the exclusion of certain derivatives, if any, as listed in the Additional Investment Information section of the Schedule of Investments. |
| 8 | “Agency Debentures” include agency securities offered by companies such as the Federal National Mortgage Association and the Federal Home Loan Mortgage Corp., which operate under a government charter. While they are required to report to a government regulator, their assets are not explicitly guaranteed by the government and they otherwise operate like any other publicly traded company. |
| 9 | “Government Guarantee Obligations” are guaranteed by a foreign government guarantee program and are backed by the full faith and credit of the United States or the government of a foreign country. |
11
PORTFOLIO RESULTS
Goldman Sachs Government Income Fund
Investment Objective
The Fund seeks a high level of current income, consistent with safety of principal.
Portfolio Management Discussion and Analysis
Below, the Goldman Sachs U.S. Fixed Income Investment Management Team discusses the Goldman Sachs Government Income Fund’s (the “Fund”) performance and positioning for the six-month period ended September 30, 2014 (the “Reporting Period”).
| Q | How did the Fund perform during the Reporting Period? |
| A | During the Reporting Period, the Fund’s Class A, B, C, Institutional, Service, IR and R Shares generated cumulative total returns, without sales charges, of 1.56%, 1.18%, 1.18%, 1.81%, 1.49%, 1.69% and 1.44%, respectively. These returns compare to the 2.06% cumulative total return of the Fund’s benchmark, the Barclays U.S. Government/Mortgage Index (the “Barclays Index”), during the same time period. |
| Q | What key factors were responsible for the Fund’s performance during the Reporting Period? |
| A | Our duration strategy detracted most from the Fund’s performance during the Reporting Period. Duration is a measure of the Fund’s sensitivity to changes in interest rates. To a lesser extent, individual issue selection within the government/swaps sector also hampered relative results. |
| The primary positive contributors to the Fund’s performance were individual issue selection within the securitized sector and our top-down cross-sector strategy. Our cross-sector strategy is one in which we invest Fund assets across a variety of fixed income sectors, including some that may not be included in the Fund’s benchmark. |
| Q | Which fixed income market sectors most significantly affected Fund performance? |
| A | Individual issue selection within the government/swaps sector detracted from the Fund’s performance during the Reporting Period. Conversely, the Fund’s performance was bolstered most by individual issue selection in the securitized sector. Selection between agencies and regions of the coupon stack as well as specific selection of individual issues proved beneficial. (Coupon stack is the spectrum of coupons available on securities within a given sector.) For example, an overweight relative to the Barclays Index in premium, or higher, coupon mortgage-backed securities benefited the Fund early in the Reporting Period, as rates rose and the higher coupon mortgage-backed securities’ collateral benefited from lower prepayment speeds. Exposure to collateralized mortgage obligations also added value. |
| Selection of and an overweighted exposure relative to the Barclays Index to commercial mortgage-backed securities also contributed positively to the Fund’s performance during the Reporting Period. Tactical positioning in agency securities and asset-backed securities — within our cross-sector strategy — proved prudent as well, more than offsetting the detracting effect of its exposure to mortgage- backed securities overall. |
| Q | Did the Fund’s duration and yield curve positioning strategy help or hurt its results during the Reporting Period? |
| A | The combination of the Fund’s U.S. duration and yield curve positioning detracted from relative results during the Reporting Period. Overall, the Fund had a short duration relative to that of the Barclays Index throughout the Reporting Period. This positioning particularly hurt in April, May and August 2014, as longer-dated bonds on the U.S. yield curve sold off and rates declined. |
| Q | How did the Fund use derivatives and similar instruments during the Reporting Period? |
| A | The Fund used Treasury futures and Eurodollar futures to hedge interest rate exposure, i.e., to manage exposure to fluctuations in interest rates, and to facilitate specific duration and yield curve strategies. Interest rate swaps were used to hedge interest rate exposure and express an outright |
12
PORTFOLIO RESULTS
term structure view. (Term structure, most often depicted as a yield curve, refers to the term structure of interest rates, which is the relationship between the yield to maturity and the time to maturity for pure discount bonds.) The Fund employed swaptions (or options on interest rate swap contracts) to hedge and express an outright term structure view and to help manage volatility. The Fund used forward contracts to help manage duration. Overall, we employ derivatives for the efficient management of the Fund’s portfolio. Derivatives and similar instruments allow us to manage interest rate risks more effectively by allowing us both to apply active investment views with greater versatility and to afford greater risk management precision than we would otherwise be able to implement. |
| Q | Were there any notable changes in the Fund’s weightings during the Reporting Period? |
| A | We held an underweight bias to agency mortgage-backed securities through much of the Reporting Period, but adjusted the Fund’s allocation to the sector based on how we felt the market would react to key comments from the Federal Reserve (the “Fed”) regarding tapering of its asset purchases as well as on developments within the sector, including net issuance data. We also further shortened the Fund’s duration positioning relative to that of the Barclays Index over the course of the Reporting Period. |
| Q | How was the Fund positioned relative to its benchmark index at the end of September 2014? |
| A | At the end of September 2014, the Fund had overweighted allocations relative to the Barclays Index in quasi- government securities, especially agency non-government guaranteed securities, as well as in commercial mortgage- backed securities and asset-backed securities. The Fund was underweight residential mortgage-backed securities overall, but within the sector, the Fund was overweight relative to the Barclays Index in agency collateralized mortgage obligations and agency adjustable-rate mortgages and underweight mortgage-backed security pass-throughs. The Fund was underweighted relative to the Barclays Index in U.S. government securities. The Fund had a shorter duration than that of the Barclays Index at the end of the Reporting Period. |
13
FUND BASICS
Government Income Fund
as of September 30, 2014
| PERFORMANCE REVIEW | ||||||||||||||||||
April 1, 2014– September 30, 2014 | Fund Total Return (based on NAV)1 | Barclays U.S. Government/ Mortgage Index2 | 30-Day Standardized Subsidized Yield3 | 30-Day Standardized Unsubsidized Yield3 | ||||||||||||||
| Class A | 1.56 | % | 2.06 | % | 0.92 | % | 0.80 | % | ||||||||||
| Class B | 1.18 | 2.06 | 0.21 | 0.09 | ||||||||||||||
| Class C | 1.18 | 2.06 | 0.22 | 0.09 | ||||||||||||||
| Institutional | 1.81 | 2.06 | 1.30 | 1.17 | ||||||||||||||
| Service | 1.49 | 2.06 | 0.80 | 0.67 | ||||||||||||||
| Class IR | 1.69 | 2.06 | 1.21 | 1.08 | ||||||||||||||
| Class R | 1.44 | 2.06 | 0.71 | 0.58 | ||||||||||||||
| 1 | The net asset value (NAV) represents the net assets of the class of the Fund (ex-dividend) divided by the total number of shares of the class outstanding. The Fund’s performance assumes the reinvestment of dividends and other distributions. The Fund’s performance does not reflect the deduction of any applicable sales charges. |
| 2 | The Barclays U.S. Government/Mortgage Index, an unmanaged index, does not reflect any deduction for fees, expenses or taxes. It is not possible to invest directly in an index. |
| 3 | The method of calculation of the 30-Day Standardized Subsidized Yield is mandated by the Securities and Exchange Commission and is determined by dividing the net investment income per share earned during the last 30 days of the period by the maximum public offering price (“POP”) per share on the last day of the period. This number is then annualized. The 30-Day Standardized Subsidized Yield reflects fee waivers and/or expense reimbursements recorded by the Fund during the period. Without waivers and/or reimbursements, yields would be reduced. This yield does not necessarily reflect income actually earned and distributed by the Fund and, therefore, may not be correlated with the dividends or other distributions paid to shareholders. The 30-Day Standardized Unsubsidized Yield does not adjust for any fee waivers and/or expense reimbursements in effect. If the Fund does not incur any fee waivers and/or expense reimbursements during the period, the 30-Day Standardized Subsidized Yield and 30-Day Standardized Unsubsidized Yield will be identical. |
The returns set forth in the table above represent past performance. Past performance does not guarantee future results. The Fund’s investment return and principal value will fluctuate so that an investor’s shares, when redeemed, may be worth more or less than their original cost. Current performance may be lower or higher than the performance quoted above. Please visit our web site at www.GSAMFUNDS.com to obtain the most recent month-end returns. Performance reflects applicable fee waivers and/or expense limitations in effect during the periods shown. In their absence, performance would be reduced. Returns do not reflect the deduction of taxes that a shareholder would pay on Fund distributions or the redemption of Fund shares.
14
FUND BASICS
| STANDARDIZED TOTAL RETURNS4 | ||||||||||||||||||||
| For the period ended 9/30/14 | One Year | Five Years | Ten Years | Since Inception | Inception Date | |||||||||||||||
| Class A | -1.28 | % | 2.07 | % | 3.29 | % | 5.03 | % | 2/10/93 | |||||||||||
| Class B | -3.26 | 1.69 | 3.05 | 4.70 | 5/1/96 | |||||||||||||||
| Class C | 0.78 | 2.10 | 2.92 | 4.01 | 8/15/97 | |||||||||||||||
| Institutional | 2.90 | 3.21 | 4.06 | 5.17 | 8/15/97 | |||||||||||||||
| Service | 2.39 | 2.68 | 3.53 | 4.65 | 8/15/97 | |||||||||||||||
| Class IR | 2.81 | 3.10 | N/A | 3.76 | 11/30/07 | |||||||||||||||
| Class R | 2.30 | 2.59 | N/A | 3.27 | 11/30/07 | |||||||||||||||
| 4 | The Standardized Total Returns are average annual total returns as of the most recent calendar quarter-end. They assume reinvestment of all distributions at NAV. These returns reflect a maximum initial sales charge of 3.75% for Class A Shares, the assumed contingent deferred sales charge for Class B Shares (5% maximum declining to 0% after six years), and the assumed contingent deferred sales charge for Class C Shares (1% if redeemed within 12 months of purchase). Class B Shares convert automatically to Class A Shares on or about the fifteenth day of the last month of the calendar quarter that is eight years after purchase. Returns for Class B Shares for the period after conversion reflect the performance of Class A Shares. Prior to July 29, 2009, the maximum initial sales charge applicable to Class A Shares of the Fund was 4.5%, which is not reflected in the figures shown. Because Institutional Shares, Service Shares, Class IR and R Shares do not involve a sales charge, such a charge is not applied to their Standardized Total Returns. The Fund’s Class B Shares are no longer available for purchase by new or existing shareholders (although current Class B shareholders may continue to reinvest income and capital gains distributions into Class B Shares, and Class B shareholders may continue to exchange their shares for Class B Shares of certain other Goldman Sachs Funds). |
The returns set forth in the table above represent past performance. Past performance does not guarantee future results. The Fund’s investment return and principal value will fluctuate so that an investor’s shares, when redeemed, may be worth more or less than their original cost. Current performance may be lower or higher than the performance quoted above. Please visit our web site at www.GSAMFUNDS.com to obtain the most recent month-end returns. Performance reflects applicable fee waivers and/or expense limitations in effect during the periods shown. In their absence, performance would be reduced. Returns do not reflect the deduction of taxes that a shareholder would pay on Fund distributions or the redemption of Fund shares.
| EXPENSE RATIOS5 | ||||||||||
| Net Expense Ratio (Current) | Gross Expense Ratio (Before Waivers) | |||||||||
| Class A | 0.92 | % | 1.02 | % | ||||||
| Class B | 1.62 | 1.78 | ||||||||
| Class C | 1.62 | 1.78 | ||||||||
| Institutional | 0.58 | 0.69 | ||||||||
| Service | 1.08 | 1.18 | ||||||||
| Class IR | 0.67 | 0.78 | ||||||||
| Class R | 1.17 | 1.28 | ||||||||
| 5 | The expense ratios of the Fund, both current (net of applicable fee waivers and/or expense limitations) and before waivers (gross of applicable fee waivers and/or expense limitations) are as set forth above according to the most recent publicly available Prospectus for the Fund and may differ from the expense ratios disclosed in the Financial Highlights in this report. Pursuant to a contractual arrangement, the Fund’s waivers and/or expense limitations will remain in place through at least July 29, 2015, and prior to such date the Investment Adviser may not terminate the arrangements without the approval of the Fund’s Board of Trustees. If these arrangements are discontinued in the future, the expense ratios may change without shareholder approval. |
15
FUND BASICS
| SECTOR ALLOCATIONS6 |
| Percentage of Net Assets |
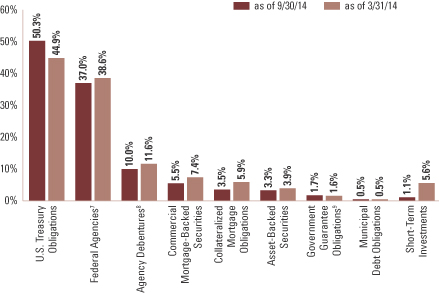
| 6 | The percentage shown for each investment category reflects the value of investments in that category as a percentage of net assets. Short-term Investments represents certificates of deposit and repurchase agreements. Figures in the graph may not sum to 100% due to the exclusion of other assets and liabilities. The graph depicts the Fund’s investments but may not represent the Fund’s market exposure due to the exclusion of certain derivatives, if any, as listed in the Additional Investment Information section of the Schedule of Investments. |
| 7 | “Federal Agencies” are mortgage-backed securities guaranteed by the Government National Mortgage Association (“GNMA”), the Federal National Mortgage Association (“FNMA”) and the Federal Home Loan Mortgage Corp. (“FHLMC”). GNMA instruments are backed by the full faith and credit of the U.S. Government. |
| 8 | “Agency Debentures” include agency securities offered by companies such as FNMA and FHLMC, which operate under a government charter. While they are required to report to a government regulator, their assets are not explicitly guaranteed by the government and they otherwise operate like any other publicly traded company. |
| 9 | “Government Guarantee Obligations” are guaranteed by a foreign government guarantee program and are backed by the full faith and credit of the United States or the government of a foreign country. |
16
PORTFOLIO RESULTS
Goldman Sachs High Quality Floating Rate Fund
Investment Objective
The Fund seeks to provide a high level of current income, consistent with low volatility of principal.
Portfolio Management Discussion and Analysis
Below, the Goldman Sachs U.S. Fixed Income Investment Management Team discusses the Goldman Sachs High Quality Floating Rate Fund’s (the “Fund”) performance and positioning for the six-month period ended September 30, 2014 (the “Reporting Period”).
| Q | How did the Fund perform during the Reporting Period? |
| A | During the Reporting Period, the Fund’s Class A, Institutional, Service and IR Shares generated cumulative total returns, without sales charges, of 0.09%, 0.15%, -0.08% and 0.10%, respectively. These returns compare to the 0.02% cumulative total return of the Fund’s benchmark, the Bank of America Merrill Lynch Three-Month U.S. Treasury Bill Index (“BofA Three-Month Index”). |
| Q | What key factors were responsible for the Fund’s performance during the Reporting Period? |
| A | Both top-down and bottom-up strategies had an impact on the Fund’s performance during the Reporting Period. Within our top-down strategies, our duration and yield curve positioning strategy detracted from Fund performance. Duration is a measure of the Fund’s sensitivity to changes in interest rates. Yield curve indicates the spectrum of maturities within a particular sector. |
| Our cross-sector strategy contributed positively to the Fund’s results during the Reporting Period. Our cross- sector strategy is one in which we invest Fund assets across a variety of fixed income sectors, including some that may not be included in the Fund’s benchmark. |
| Bottom-up individual issue selection amongst agency mortgage-backed securities and asset-backed securities detracted from relative performance, partially offset by issue selection amongst corporate bonds and government/ swap securities, which contributed positively. |
| Q | Which fixed income market sectors most significantly affected Fund performance? |
| A | Sector positioning was the primary positive contributor to the Fund’s results during the Reporting Period, with exposures to agency mortgage-backed securities helping most. Agency mortgage-backed securities performed well during the first half of the Reporting Period, as spreads, or yield differentials to U.S. Treasury securities, tightened, or narrowed, on the back of muted housing activity and limited supply of mortgage-backed securities. This trend reversed in the second half of the Reporting Period, as continued Federal Reserve (“Fed”) tapering of its asset purchases impacted net mortgage-backed securities supply. Exposure to asset-backed securities and corporate bonds also contributed positively to Fund results during the Reporting Period. |
| Individual issue selection of asset-backed securities and mortgage-backed securities within the securitized sector detracted from Fund results during the Reporting Period. This was somewhat offset by effective selection within the corporate bond and government securities sectors, which contributed positively. |
| Q | Did the Fund’s duration and yield curve positioning strategy help or hurt its results during the Reporting Period? |
| A | Tactical management of the Fund’s duration and yield curve positioning detracted from its results during the Reporting Period, with the majority of negative return attributable to a core underweighted position in U.S. Treasury securities held during the Reporting Period. A shorter duration position than the BofA Three-Month Index in April and May 2014 detracted from returns, as an underweight to the intermediate segment of the U.S. Treasury yield curve as well as to the 10-year and 20-year segments of the U.S. Treasury yield curve weighed on performance. We maintained our core bearish view through most of the Reporting Period. U.S. Treasury yields at the short-term end of the yield curve declined during the Reporting Period as did longer-term U.S. Treasury yields. The 10-year U.S. Treasury yield fell approximately |
17
PORTFOLIO RESULTS
23 basis points to end the Reporting Period at 2.49%. (A basis point is 1/100th of a percentage point.) |
| During the second quarter of 2014, U.S. Treasury yields fell despite U.S. economic data, including manufacturing and housing market activity, continuing to improve. The U.S. Treasury yield curve flattened during the third calendar quarter, meaning the differential in yields between shorter-term and longer-term securities narrowed. Five-year U.S. Treasury yields rose by 13 basis points during the third quarter of 2014, while 10-year U.S. Treasury yields fell by 4 basis points during the same period. Fed chair Janet Yellen’s tone was notably balanced in September 2014’s press conference. Though the language in the Fed’s statement around guidance and the labor market was little changed, the press conference focused on the shift up in Fed rate projections, consistent with a first interest rate hike in June 2015. As mentioned earlier, duration is a measure of the Fund’s sensitivity to changes in interest rates. Yield curve indicates the spectrum of maturities within a particular sector. |
| Q | How did the Fund use derivatives and similar instruments during the Reporting Period? |
| A | The Fund used Treasury futures, Eurodollar futures and interest rate swaps during the Reporting Period for the purpose of managing the duration and term structure of the Fund. (Term structure, most often depicted as a yield curve, refers to the term structure of interest rates, which is the relationship between the yield to maturity and the time to maturity for pure discount bonds.) The Fund employed swaptions (or options on interest rate swap contracts) for the purpose of taking modest short volatility positions, that is, positions that pay a modest return when market volatility remains relatively stable. |
| Q | Were there any notable changes in the Fund’s weightings during the Reporting Period? |
| A | The Fund’s exposure to government securities, quasi- government securities, commercial mortgage-backed securities and cash increased during the Reporting Period. A corresponding decrease in allocation was concentrated in asset-backed securities and mortgage-backed securities. Additionally, we shifted the Fund’s duration positioning during the Reporting Period as market conditions changed. At the start of the Reporting Period, the Fund maintained a shorter duration position than the BofA Three-Month Index. |
| We maintained that position through the Reporting Period and shortened duration further by the end of the Reporting Period. |
| Q | How was the Fund positioned relative to its benchmark index at the end of September 2014? |
| A | While the Fund is benchmarked to U.S. Treasuries, it held a significant portion of its assets in non-Treasury sectors not represented in the benchmark index at the end of the Reporting Period. Indeed, the Fund maintained exposures to high quality spread, or non-Treasury, sectors throughout the Reporting Period, most notably agency mortgage-backed securities, quasi-government securities (may include taxable municipal debt obligations or municipal securities) and asset-backed securities. The Fund maintained an underweighted exposure to government bonds at the end of the Reporting Period. |
18
FUND BASICS
High Quality Floating Rate Fund
as of September 30, 2014
| PERFORMANCE REVIEW | ||||||||||||||||||
April 1, 2014– September 30, 2014 | Fund Total Return (based on NAV)1 | BofA ML Three- Month U.S. Treasury Bill Index2 | 30-Day Standardized Subsidized Yield3 | 30-Day Standardized Unsubsidized Yield3 | ||||||||||||||
| Class A | 0.09 | % | 0.02 | % | 0.03 | % | -0.37 | % | ||||||||||
| Institutional | 0.15 | 0.02 | 0.35 | -0.05 | ||||||||||||||
| Service | -0.08 | 0.02 | 0.02 | -0.53 | ||||||||||||||
| Class IR | 0.10 | 0.02 | 0.27 | -0.13 | ||||||||||||||
| 1 | The net asset value (NAV) represents the net assets of the class of the Fund (ex-dividend) divided by the total number of shares of the class outstanding. The Fund’s performance assumes the reinvestment of dividends and other distributions. The Fund’s performance does not reflect the deduction of any applicable sales charges. |
| 2 | The BofA ML Three-Month U.S. Treasury Bill Index measures total return on cash, including price and interest income, based on short-term government Treasury Bills of about 90-day maturity, as reported by BofA Merrill Lynch, and does not reflect any deduction for fees, expenses or taxes. It is not possible to invest directly in an unmanaged index. |
| 3 | The method of calculation of the 30-Day Standardized Subsidized Yield is mandated by the Securities and Exchange Commission and is determined by dividing the net investment income per share earned during the last 30 days of the period by the maximum public offering price (“POP”) per share on the last day of the period. This number is then annualized. The 30-Day Standardized Subsidized Yield reflects fee waivers and/or expense reimbursements recorded by the Fund during the period. Without waivers and/or reimbursements, yields would be reduced. This yield does not necessarily reflect income actually earned and distributed by the Fund and, therefore, may not be correlated with the dividends or other distributions paid to shareholders. The 30-Day Standardized Unsubsidized Yield does not adjust for any fee waivers and/or expense reimbursements in effect. If the Fund does not incur any fee waivers and/or expense reimbursements during the period, the 30-Day Standardized Subsidized Yield and 30-Day Standardized Unsubsidized Yield will be identical. |
| STANDARDIZED TOTAL RETURNS4 | ||||||||||||||||||||
| For the period ended 9/30/14 | One Year | Five Years | Ten Years | Since Inception | Inception Date | |||||||||||||||
| Class A | -1.52 | % | -0.11 | % | 1.31 | % | 2.86 | % | 5/15/95 | |||||||||||
| Institutional | 0.39 | 0.50 | 1.79 | 3.54 | 7/17/91 | |||||||||||||||
| Service | -0.19 | 0.02 | 1.30 | 2.46 | 3/27/97 | |||||||||||||||
| Class IR | 0.18 | 0.39 | N/A | 0.67 | 11/30/07 | |||||||||||||||
| 4 | The Standardized Total Returns are average annual total returns as of the most recent calendar quarter-end. They assume reinvestment of all distributions at NAV. These returns reflect a maximum initial sales charge of 1.5% for Class A Shares. Because Institutional Shares, Service Shares and Class IR Shares do not involve a sales charge, such a charge is not applied to their Standardized Total Returns. |
The returns set forth in the tables above represent past performance. Past performance does not guarantee future results. The Fund’s investment return and principal value will fluctuate so that an investor’s shares, when redeemed, may be worth more or less than their original cost. Current performance may be lower or higher than the performance quoted above. Please visit our web site at www.GSAMFUNDS.com to obtain the most recent month-end returns. Performance reflects applicable fee waivers and/or expense limitations in effect during the periods shown. In their absence, performance would be reduced. Returns do not reflect the deduction of taxes that a shareholder would pay on Fund distributions or the redemption of Fund shares.
19
FUND BASICS
| EXPENSE RATIOS5 | ||||||||||
| Net Expense Ratio (Current) | Gross Expense Ratio (Before Waivers) | |||||||||
| Class A | 0.70 | % | 0.93 | % | ||||||
| Institutional | 0.36 | 0.59 | ||||||||
| Service | 0.86 | 1.09 | ||||||||
| Class IR | 0.45 | 0.68 | ||||||||
| 5 | The expense ratios of the Fund, both current (net of applicable fee waivers and/or expense limitations) and before waivers (gross of applicable fee waivers and/or expense limitations) are as set forth above according to the most recent publicly available Prospectus for the Fund and may differ from the expense ratios disclosed in the Financial Highlights in this report. Pursuant to a contractual arrangement, the Fund’s waivers and/or expense limitations will remain in place through at least July 29, 2015, and prior to such date the Investment Adviser may not terminate the arrangements without the approval of the Fund’s Board of Trustees. If these arrangements are discontinued in the future, the expense ratios may change without shareholder approval. |
20
FUND BASICS
| FUND COMPOSITION6 |
| 6 | The percentage shown for each investment category reflects the value of investments in that category as a percentage of net assets. Short-term Investments represents repurchase agreements. Figures in the graph may not sum to 100% due to the exclusion of other assets and liabilities. The graph depicts the Fund’s investments but may not represent the Fund’s market exposure due to the exclusion of certain derivatives, if any, as listed in the Additional Investment Information section of the Schedule of Investments. |
| 7 | “Agency Debentures” include agency securities offered by companies such as the Federal National Mortgage Association (“FNMA”) and the Federal Home Loan Mortgage Corp. (“FHLMC”), which operate under a government charter. While they are required to report to a government regulator, their assets are not explicitly guaranteed by the government and they otherwise operate like any other publicly traded company. |
| 8 | “Federal Agencies” are mortgage-backed securities guaranteed by the Government National Mortgage Association (“GNMA”), Federal National Mortgage Association (“FNMA”) and the Federal Home Loan Mortgage Corp. (“FHLMC”). GNMA instruments are backed by the full faith and credit of the U.S. Government. |
| 9 | “Government Guarantee Obligations” are guaranteed by a foreign government guarantee program and are backed by the full faith and credit of the United States or the government of a foreign country. |
21
PORTFOLIO RESULTS
Goldman Sachs Inflation Protected Securities Fund
Investment Objective
The Fund seeks real return consistent with preservation of capital.
Portfolio Management Discussion and Analysis
Below, the Goldman Sachs U.S. Fixed Income Investment Management Team discusses the Goldman Sachs Inflation Protected Securities Fund’s (the “Fund”) performance and positioning for the six-month period ended September 30, 2014 (the “Reporting Period”).
| Q | How did the Fund perform during the Reporting Period? |
| A | During the Reporting Period, the Fund’s Class A, C, Institutional, IR and R Shares generated cumulative total returns, without sales charges, of 1.40%, 1.05%, 1.52%, 1.49% and 1.22%, respectively. These returns compare to the 1.69% cumulative total return of the Fund’s benchmark, the Barclays U.S. Treasury Inflation-Protected Securities (“TIPS”) Index (“Barclays Index”), during the same time period. |
| Q | What key factors were responsible for the Fund’s performance during the Reporting Period? |
| A | Bottom-up individual issue selection of various maturity U.S. TIPS was the key positive contributor to the Fund’s performance during the Reporting Period. Yield curve positioning also contributed positively to Fund performance. Detracting from the Fund’s results was our duration strategy. Duration is a measure of the Fund’s sensitivity to changes in interest rates. Yield curve indicates the spectrum of maturities within a particular sector. |
| Q | Which fixed income market sectors most significantly affected Fund performance? |
| A | Individual issue selection of various maturity TIPS contributed most positively to Fund performance during the Reporting Period. Through the Reporting Period, we tactically re-positioned the Fund’s exposure to inflation as market conditions evolved, which added value overall. |
| Q | Did the Fund’s duration and yield curve positioning strategy help or hurt its results during the Reporting Period? |
| A | Active U.S. duration positioning detracted from the Fund’s performance during the Reporting Period. The Fund had a shorter duration stance than the Barclays Index, which hurt as interest rates generally declined during the Reporting Period. At the end of the Reporting Period, the Fund had a weighted average maturity of 5.75 years compared to 6.35 years for the Barclays Index. |
| On the positive side, yield curve positioning overall contributed positively to the Fund’s results. Particularly helpful was the Fund’s underweighted positioning relative to the Barclays Index in the two-year and five-year points of the TIPS yield curve. |
| Q | How did the Fund use derivatives and similar instruments during the Reporting Period? |
| A | The Fund used Treasury futures and Eurodollar futures to hedge interest rate exposure and to facilitate specific duration and yield curve strategies. We used interest rate and bond exchange traded futures contracts to help implement duration positioning within the Fund. Interest rate swaps were used to manage interest rate exposure and express an outright term structure view. (Term structure, most often depicted as a yield curve, refers to the term structure of interest rates, which is the relationship between the yield to maturity and |
22
PORTFOLIO RESULTS
the time to maturity for pure discount bonds.) The Fund employed swaptions (or options on interest rate swap contracts) to express our views on interest rate volatility and an outright term structure view. |
| Q | Were there any notable changes in the Fund’s weightings during the Reporting Period? |
| A | We tactically managed our views on inflation in the Fund via varying allocations to TIPS throughout the Reporting Period. For example, the summer months are usually highlighted by weak inflation technicals, and, as such, we modestly reduced the Fund’s exposure to TIPS during these months. Also, we adjusted the Fund’s duration and yield curve positioning as market conditions shifted during the Reporting Period. We reduced the Fund’s exposure to the short end of the yield curve, i.e., the three-month to two-year segment of the curve, through TIPS and other permitted securities. We also reduced the Fund’s exposure to the five-year and 10-year points of the yield curve and increased its exposure to the seven-year point of the yield curve. |
| Q | How was the Fund positioned relative to its benchmark index at the end of September 2014? |
| A | We expect inflation readings to increase to close to the 2% target of the Federal Reserve (the “Fed”) should unemployment rates continue to decline and the economy continue to recover. At the end of September 2014, the Fund had most of its total net assets invested in TIPS, with the remainder in cash. The Fund had a shorter duration than the Barclays Index at the end of the Reporting Period, as we expect the Fed to raise interest rates in 2015. |
23
FUND BASICS
Inflation Protected Securities Fund
as of September 30, 2014
| PERFORMANCE REVIEW | ||||||||||||||||||
| April 1, 2014– September 30, 2014 | Fund Total Return (based on NAV)1 | Barclays U.S. TIPS Index2 | 30-Day Standardized Subsidized Yield3 | 30-Day Standardized Unsubsidized Yield3 | ||||||||||||||
| Class A | 1.40 | % | 1.69 | % | -0.79 | % | -1.07 | % | ||||||||||
| Class C | 1.05 | 1.69 | -1.56 | -1.86 | ||||||||||||||
| Institutional | 1.52 | 1.69 | -0.48 | -0.78 | ||||||||||||||
| Class IR | 1.49 | 1.69 | -0.57 | -0.87 | ||||||||||||||
| Class R | 1.22 | 1.69 | -1.07 | -1.37 | ||||||||||||||
| 1 | The net asset value (NAV) represents the net assets of the class of the Fund (ex-dividend) divided by the total number of shares of the class outstanding. The Fund’s performance assumes the reinvestment of dividends and other distributions. The Fund’s performance does not reflect the deduction of any applicable sales charges. |
| 2 | The Barclays U.S. TIPS Index represents securities that protect against adverse inflation and provide a minimum level of real return. To be included in this index, bonds must have cash flows linked to an inflation index, be sovereign issues denominated in U.S. currency, and have more than one year to maturity, and, as a portion of the index, total a minimum amount outstanding of 100 million U.S. dollars. The Barclays U.S. TIPS Index does not reflect any deduction for fees, expenses or taxes. It is not possible to invest directly in an index. |
| 3 | The method of calculation of the 30-Day Standardized Subsidized Yield is mandated by the Securities and Exchange Commission and is determined by dividing the net investment income per share earned during the last 30 days of the period by the maximum public offering price (“POP”) per share on the last day of the period. This number is then annualized. The 30-Day Standardized Subsidized Yield reflects fee waivers and/or expense reimbursements recorded by the Fund during the period. Without waivers and/or reimbursements, yields would be reduced. This yield does not necessarily reflect income actually earned and distributed by the Fund and, therefore, may not be correlated with the dividends or other distributions paid to shareholders. The 30-Day Standardized Unsubsidized Yield does not adjust for any fee waivers and/or expense reimbursements in effect. If the Fund does not incur any fee waivers and/or expense reimbursements during the period, the 30-Day Standardized Subsidized Yield and 30-Day Standardized Unsubsidized Yield will be identical. |
| STANDARDIZED TOTAL RETURNS4 | ||||||||||||||||
| For the period ended 9/30/14 | One Year | Five Years | Since Inception | Inception Date | ||||||||||||
| Class A | -2.73 | % | 3.36 | % | 4.16 | % | 8/31/07 | |||||||||
| Class C | -0.58 | 3.41 | 4.01 | 8/31/07 | ||||||||||||
| Institutional | 1.38 | 4.51 | 5.12 | 8/31/07 | ||||||||||||
| Class IR | 1.35 | 4.40 | 4.26 | 11/30/07 | ||||||||||||
| Class R | 0.79 | 3.90 | 3.78 | 11/30/07 | ||||||||||||
| 4 | The Standardized Total Returns are average annual total returns as of the most recent calendar quarter-end. They assume reinvestment of all distributions at NAV. These returns reflect a maximum initial sales charge of 3.75% for Class A Shares and the assumed contingent deferred sales charge for Class C Shares (1% if redeemed within 12 months of purchase). Prior to July 29, 2009, the maximum initial sales charge applicable to Class A Shares of the Fund was 4.5%, which is not reflected in the figures shown. Because Institutional Shares, Class IR Shares and R Shares do not involve a sales charge, such a charge is not applied to their Standardized Total Returns. |
The returns set forth in the tables above represent past performance. Past performance does not guarantee future results. The Fund’s investment return and principal value will fluctuate so that an investor’s shares, when redeemed, may be worth more or less than their original cost. Current performance may be lower or higher than the performance quoted above. Please visit our web site at www.GSAMFUNDS.com to obtain the most recent month-end returns. Performance reflects applicable fee waivers and/or expense limitations in effect during the periods shown. In their absence, performance would be reduced. Returns do not reflect the deduction of taxes that a shareholder would pay on Fund distributions or the redemption of Fund shares.
24
FUND BASICS
| EXPENSE RATIOS5 | ||||||||||
| Net Expense Ratio (Current) | Gross Expense Ratio (Before Waivers) | |||||||||
| Class A | 0.73 | % | 0.84 | % | ||||||
| Class C | 1.48 | 1.59 | ||||||||
| Institutional | 0.39 | 0.50 | ||||||||
| Class IR | 0.48 | 0.59 | ||||||||
| Class R | 0.98 | 1.10 | ||||||||
| 5 | The expense ratios of the Fund, both current (net of applicable fee waivers and/or expense limitations) and before waivers (gross of applicable fee waivers and/or expense limitations) are as set forth above according to the most recent publicly available Prospectus for the Fund and may differ from the expense ratios disclosed in the Financial Highlights in this report. Pursuant to a contractual arrangement, the Fund’s waivers and/or expense limitations will remain in place through at least July 29, 2015, and prior to such date the Investment Adviser may not terminate the arrangements without the approval of the Fund’s Board of Trustees. If these arrangements are discontinued in the future, the expense ratios may change without shareholder approval. |
| FUND COMPOSITION6 |
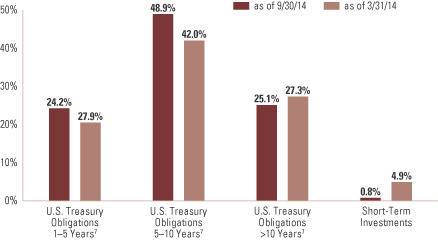
| 6 | The percentage shown for each investment category reflects the value of investments in that category as a percentage of net assets. Short-term Investments represents repurchase agreements. Figures in the graph may not sum to 100% due to the exclusion of other assets and liabilities. The graph depicts the Fund’s investments but may not represent the Fund’s market exposure due to the exclusion of certain derivatives, if any, as listed in the Additional Investment Information section of the Schedule of Investments. |
| 7 | “U.S. Treasury Obligations” percentages are grouped by effective maturity. The weighted average maturity was 9.23 and 7.9 years, respectively, at September 30, 2014 and March 31, 2014. |
25
PORTFOLIO RESULTS
Goldman Sachs Limited Maturity Obligations Fund
Investment Objective
The Fund seeks to generate current income while maintaining an emphasis on preservation of capital and liquidity.
Portfolio Management Discussion and Analysis
Below, the Goldman Sachs U.S. Fixed Income Investment Management Team discusses the Goldman Sachs Limited Maturity Obligations Fund’s (the “Fund”) performance and positioning for the six-month period ended September 30, 2014 (the “Reporting Period”).
| Q | How did the Fund perform during the Reporting Period? |
| A | During the Reporting Period, the Fund’s Institutional and Administration Shares generated cumulative total returns, without sales charges, of 0.16% and 0.04%, respectively. These returns compare to the 0.04% cumulative total return of the Fund’s benchmark, the Bank of America Merrill Lynch 3-6 Month U.S. Treasury Bill Index (“BofA 3-6 Month Index”), during the same time period. |
| Q | What key factors were responsible for the Fund’s performance during the Reporting Period? |
| A | Both top-down and bottom-up strategies had an impact on the Fund’s performance during the Reporting Period. Within our top-down strategies, our duration and yield curve positioning strategy detracted from the Fund’s performance. Duration is a measure of the Fund’s sensitivity to changes in interest rates. Yield curve indicates the spectrum of maturities within a particular sector. |
| Our cross-sector strategy contributed positively to the Fund’s results during the Reporting Period. Our cross-sector strategy is one in which we invest Fund assets across a variety of fixed income sectors, including some that may not be included in the Fund’s benchmark. |
| Bottom-up individual issue selection amongst corporate bonds, municipal securities and government/agency securities were the main drivers of performance during the Reporting Period. |
| Q | Which fixed income market sectors most significantly affected Fund performance? |
| A | Our individual security selection strategies were the primary positive contributor to the Fund’s relative results during the Reporting Period, especially individual selection of local government and municipal securities. The key contributor to relative results was selection amongst local government and municipal securities of short maturity. Selection amongst corporate bonds also proved effective. |
| Q | Did the Fund’s duration and yield curve positioning strategy help or hurt its results during the Reporting Period? |
| A | Tactical management of the Fund’s duration and yield curve positioning detracted from the Fund’s results during the Reporting Period. U.S. Treasury yields at the short-term end of the yield curve declined during the Reporting Period overall as did longer-term U.S. Treasury yields. The 10-year U.S. Treasury yield fell approximately 23 basis points to end the Reporting Period at 2.49%. (A basis point is 1/100th of a percentage point.) |
During the second quarter of 2014, U.S. Treasury yields fell despite U.S. economic data, including manufacturing and housing market activity, continuing to improve. The U.S. Treasury yield curve flattened during the third calendar quarter, meaning the differential in yields between shorter-term and longer-term securities narrowed. Federal Reserve |
26
FUND BASICS
(“Fed”) chair Janet Yellen’s tone was notably balanced in September 2014’s press conference. Though the language in the Fed’s statement around guidance and the labor market was little changed, the press conference focused on the shift up in Fed rate projections, consistent with a first interest rate hike in June 2015. |
| During the Reporting Period, the Fund maintained a short duration position relative to the BofA 3-6 Month Index, ending the Reporting Period with a weighted average maturity of 76 days. (The weighted average maturity of a fund is a measure of its price sensitivity to changes in interest rates.) In our view, U.S. economic growth data remained healthy overall, and we continue to anticipate a gradual rise in interest rates. As mentioned earlier, duration is a measure of the Fund’s sensitivity to changes in interest rates. Yield curve indicates the spectrum of maturities within a particular sector. |
| Q | How did the Fund use derivatives and similar instruments during the Reporting Period? |
| A | The Fund does not use derivatives. |
| Q | Were there any notable changes in the Fund’s weightings during the Reporting Period? |
| A | As the Fund launched on February 28, 2014, it was not a matter of making changes during the Reporting Period but of continuing to build the portfolio. |
| Q | How was the Fund positioned relative to its benchmark index at the end of September 2014? |
| A | At the end of the Reporting Period, the Fund had built an emphasis on local government and municipal securities, repurchase agreements, investment grade corporate credit and asset-backed commercial paper. The Fund also had a significant portion of its assets in cash at the end of September 2014. |
27
FUND BASICS
Limited Maturity Obligations Fund
as of September 30, 2014
| PERFORMANCE REVIEW | ||||||||||||||||||
April 1, 2014– September 30, 2014 | Fund Total Return (based on NAV)1 | BofA ML 3-6 Month U.S. Treasury Bill Index2 | 30-Day Standardized Subsidized Yield3 | 30-Day Standardized Unsubsidized Yield3 | ||||||||||||||
| Institutional | 0.16 | % | 0.04 | % | 0.37 | % | -5.57 | % | ||||||||||
| Administration | 0.04 | 0.04 | 0.12 | -5.82 | ||||||||||||||
| 1 | The net asset value (NAV) represents the net assets of the class of the Fund (ex-dividend) divided by the total number of shares of the class outstanding. The Fund’s performance assumes the reinvestment of dividends and other distributions. The Fund’s performance does not reflect the deduction of any applicable sales charges. |
| 2 | The Bank of America Merrill Lynch 3-6 Month U.S. Treasury Bill Index, as reported by Bank of America Merrill Lynch, does not reflect any deduction for fees, expenses or taxes. It is not possible to invest directly in an index. |
| 3 | The method of calculation of the 30-Day Standardized Subsidized Yield is mandated by the Securities and Exchange Commission and is determined by dividing the net investment income per share earned during the last 30 days of the period by the maximum public offering price (“POP”) per share on the last day of the period. This number is then annualized. The 30-Day Standardized Subsidized Yield reflects fee waivers and/or expense reimbursements recorded by the Fund during the period. Without waivers and/or reimbursements, yields would be reduced. This yield does not necessarily reflect income actually earned and distributed by the Fund and, therefore, may not be correlated with the dividends or other distributions paid to shareholders. The 30-Day Standardized Unsubsidized Yield does not adjust for any fee waivers and/or expense reimbursements in effect. If the Fund does not incur any fee waivers and/or expense reimbursements during the period, the 30-Day Standardized Subsidized Yield and 30-Day Standardized Unsubsidized Yield will be identical. |
| The returns set forth in the table above represent past performance. Past performance does not guarantee future results. The Fund’s investment return and principal value will fluctuate so that an investor’s shares, when redeemed, may be worth more or less than their original cost. Current performance may be lower or higher than the performance quoted above. Please visit our web site at www.GSAMFUNDS.com to obtain the most recent month-end returns. Performance reflects applicable fee waivers and/or expense limitations in effect during the periods shown. In their absence, performance would be reduced. Returns do not reflect the deduction of taxes that a shareholder would pay on Fund distributions or the redemption of Fund shares. |
| STANDARDIZED TOTAL RETURNS3 | ||||||||
| For the period ended 9/30/14 | Since Inception | Inception Date | ||||||
| Institutional | 0.16 | % | 2/28/14 | |||||
| Administration | 0.04 | 2/28/14 | ||||||
| 4 | The Standardized Total Returns are cumulative total returns as of the most recent calendar quarter-end. They assume reinvestment of all distributions at NAV. Because Institutional and Administration Shares do not involve a sales charge, such a charge is not applied to their Standardized Total Returns. |
The returns set forth in the tables above represent past performance. Past performance does not guarantee future results. The Fund’s investment return and principal value will fluctuate so that an investor’s shares, when redeemed, may be worth more or less than their original cost. Current performance may be lower or higher than the performance quoted above. Please visit our web site at www.GSAMFUNDS.com to obtain the most recent month-end returns. Performance reflects applicable fee waivers and/or expense limitations in effect during the periods shown. In their absence, performance would be reduced. Returns do not reflect the deduction of taxes that a shareholder would pay on Fund distributions or the redemption of Fund shares.
28
FUND BASICS
| EXPENSE RATIOS5 | ||||||||||
| Net Expense Ratio (Current) | Gross Expense Ratio (Before Waivers) | |||||||||
| Institutional | 0.19 | % | 2.57 | % | ||||||
| Administration | 0.44 | 2.82 | ||||||||
| 5 | The expense ratios of the Fund, both current (net of applicable fee waivers and/or expense limitations) and before waivers (gross of applicable fee waivers and/or expense limitations) are as set forth above according to the most recent publicly available Prospectus for the Fund and may differ from the expense ratios disclosed in the Financial Highlights in this report. Pursuant to a contractual arrangement, the Fund’s waivers and/or expense limitations will remain in place through at least July 29, 2015, and prior to such date the Investment Adviser may not terminate the arrangements without the approval of the Fund’s Board of Trustees. If these arrangements are discontinued in the future, the expense ratios may change without shareholder approval. |
| FUND COMPOSITION6 |
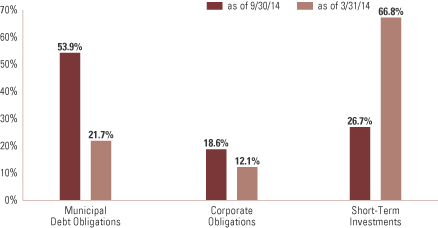
| 6 | The percentage shown for each investment category reflects the value of investments in that category as a percentage of net assets. Short-term Investments represents certificates of deposit and repurchase agreements. Figures in the graph may not sum to 100% due to the exclusion of other assets and liabilities. The graph depicts the Fund’s investments but may not represent the Fund’s market exposure due to the exclusion of certain derivatives, if any, as listed in the Additional Investment Information section of the Schedule of Investments. |
29
PORTFOLIO RESULTS
Goldman Sachs Short Duration Government Fund
Investment Objective
The Fund seeks a high level of current income and secondarily, in seeking current income, may also consider the potential for capital appreciation.
Portfolio Management Discussion and Analysis
Below, the Goldman Sachs U.S. Fixed Income Investment Management Team discusses the Goldman Sachs Short Duration Government Fund’s (the “Fund”) performance and positioning for the six-month period ended September 30, 2014 (the “Reporting Period”).
| Q | How did the Fund perform during the Reporting Period? |
| A | During the Reporting Period, the Fund’s Class A, C, Institutional, Service and IR Shares generated cumulative total returns, without sales charges, of 0.24%, 0.04%, 0.41%, 0.16% and 0.37%, respectively. These returns compare to the 0.36% cumulative total return of the Fund’s benchmark, the Bank of America Merrill Lynch Two-Year U.S. Treasury Note Index (“BofA Two-Year Index”), during the same time period. |
| Q | What key factors were responsible for the Fund’s performance during the Reporting Period? |
| A | Both top-down and bottom-up strategies had an impact on the Fund’s performance during the Reporting Period. Within our top-down strategies, our duration and yield curve positioning strategies detracted from relative performance. Duration is a measure of the Fund’s sensitivity to changes in interest rates. Yield curve indicates the spectrum of maturities within a particular sector. |
| Our cross-sector strategy was the primary positive contributor to relative performance. Our cross-sector strategy is one in which we invest Fund assets across a variety of fixed income sectors, including some that may not be included in the Fund’s benchmark. Bottom-up individual issue selection amongst mortgage-backed securities proved effective, partially offset by selection amongst government/ swap securities, which detracted. |
| Q | Which fixed income market sectors most significantly affected Fund performance? |
| A | Sector positioning was the primary positive contributor to the Fund’s results during the Reporting Period, with exposures to agency mortgage-backed securities and agency debentures helping most. Agency mortgage-backed securities performed well during the first half of the Reporting Period, as spreads, or yield differentials to U.S. Treasury securities, tightened, or narrowed, on the back of muted housing activity and limited supply of mortgage-backed securities. This trend reversed in the second half of the Reporting Period, as continued Federal Reserve (“Fed”) tapering of its asset purchases impacted net mortgage-backed securities supply. Exposure to the agency securities sector also contributed positively to Fund results during the Reporting Period. |
| Individual issue selection within the securitized sector contributed positively to Fund results, primarily our selection of premium coupon mortgage-backed securities. This was slightly offset by selection of agency securities and Treasury inflation protected securities (“TIPS”) within the government/swaps sector, which detracted. |
| Q | Did the Fund’s duration and yield curve positioning strategy help or hurt its results during the Reporting Period? |
| A | Tactical management of the Fund’s duration and yield curve positioning detracted from its results during the Reporting Period. A shorter duration position than the BofA Two-Year Index in April and May 2014 detracted from returns, as an underweight to the intermediate segment of the U.S. Treasury yield curve as well as to the 10-year and 20-year segments of the U.S. Treasury yield curve weighed on performance. We maintained our core bearish view through most of the Reporting Period. U.S. Treasury yields at the short-term end of the yield curve declined during the |
30
PORTFOLIO RESULTS
Reporting Period as did longer-term U.S. Treasury yields. The 10-year U.S. Treasury yield fell approximately 23 basis points to end the Reporting Period at 2.49%. (A basis point is 1/100th of a percentage point.) |
| During the second quarter of 2014, U.S. Treasury yields fell despite U.S. economic data, including manufacturing and housing market activity, continuing to improve. The U.S. Treasury yield curve flattened during the third calendar quarter, meaning the differential in yields between shorter-term and longer-term securities narrowed. Five-year U.S. Treasury yields rose by 13 basis points during the third quarter of 2014, while 10-year U.S. Treasury yields fell by 4 basis points during the same period. Fed chair Janet Yellen’s tone was notably balanced in September 2014’s press conference. Though the language in the Fed’s statement around guidance and the labor market was little changed, the press conference focused on the shift up in Fed rate projections, consistent with a first interest rate hike in June 2015. As mentioned earlier, duration is a measure of the Fund’s sensitivity to changes in interest rates. Yield curve indicates the spectrum of maturities within a particular sector. |
| Q | How did the Fund use derivatives and similar instruments during the Reporting Period? |
| A | The Fund used Treasury futures, Eurodollar futures and interest rate swaps during the Reporting Period for the purpose of managing the duration and term structure of the Fund. (Term structure, most often depicted as a yield curve, refers to the term structure of interest rates, which is the relationship between the yield to maturity and the time to maturity for pure discount bonds.) The Fund employed swaptions (or options on interest rate swap contracts) for the purpose of taking modest short volatility positions, that is, positions that pay a modest return when market volatility remains relatively stable. The Fund used forward sales contracts and futures contracts to help manage duration. |
| Q | Were there any notable changes in the Fund’s weightings during the Reporting Period? |
| A | The Fund’s exposure to quasi-government securities, mortgage-backed securities and cash decreased during the Reporting Period. A corresponding increase in allocation was concentrated in government securities. Additionally, we shifted the Fund’s duration positioning during the Reporting Period as market conditions changed. At the start of the Reporting Period, the Fund maintained a shorter duration position than the BofA Two-Year Index. We maintained that position through the Reporting Period and shortened duration further by the end of the Reporting Period. |
| Q | How was the Fund positioned relative to its benchmark index at the end of September 2014? |
| A | While the Fund is benchmarked to U.S. Treasuries, it continued to hold a portion of its assets in non-Treasury sectors not represented in the benchmark index. Indeed, the Fund maintained exposures to high quality spread, or non-Treasury, sectors throughout the Reporting Period, most notably quasi-government securities, including agency-issued debentures, as well as agency mortgage-backed securities. The Fund maintained an underweighted exposure to government bonds at the end of the Reporting Period. |
31
FUND BASICS
Short Duration Government Fund
as of September 30, 2014

| PERFORMANCE REVIEW | ||||||||||||||||||
April 1, 2014– September 30, 2014 | Fund Total Return (based on NAV)1 | BofA ML Two-Year U.S. Treasury Note Index2 | 30-Day Standardized Subsidized Yield3 | 30-Day Standardized Unsubsidized Yield3 | ||||||||||||||
| Class A | 0.24 | % | 0.36 | % | 0.56 | % | 0.43 | % | ||||||||||
| Class C | 0.04 | 0.36 | 0.17 | -0.31 | ||||||||||||||
| Institutional | 0.41 | 0.36 | 0.90 | 0.77 | ||||||||||||||
| Service | 0.16 | 0.36 | 0.41 | 0.27 | ||||||||||||||
| Class IR | 0.37 | 0.36 | 0.81 | 0.68 | ||||||||||||||
| 1 | The net asset value (NAV) represents the net assets of the class of the Fund (ex-dividend) divided by the total number of shares of the class outstanding. The Fund’s performance assumes the reinvestment of dividends and other distributions. The Fund’s performance does not reflect the deduction of any applicable sales charges. |
| 2 | The BofA ML Two-Year U.S. Treasury Note Index, as reported by Bank of America Merrill Lynch, does not reflect any deduction for fees, expenses or taxes. It is not possible to invest directly in an index. |
| 3 | The method of calculation of the 30-Day Standardized Subsidized Yield is mandated by the Securities and Exchange Commission and is determined by dividing the net investment income per share earned during the last 30 days of the period by the maximum public offering price (“POP”) per share on the last day of the period. This number is then annualized. The 30-Day Standardized Subsidized Yield reflects fee waivers and/or expense reimbursements recorded by the Fund during the period. Without waivers and/or reimbursements, yields would be reduced. This yield does not necessarily reflect income actually earned and distributed by the Fund and, therefore, may not be correlated with the dividends or other distributions paid to shareholders. The 30-Day Standardized Unsubsidized Yield does not adjust for any fee waivers and/or expense reimbursements in effect. If the Fund does not incur any fee waivers and/or expense reimbursements during the period, the 30-Day Standardized Subsidized Yield and 30-Day Standardized Unsubsidized Yield will be identical. |
The returns set forth in the table above represent past performance. Past performance does not guarantee future results. The Fund’s investment return and principal value will fluctuate so that an investor’s shares, when redeemed, may be worth more or less than their original cost. Current performance may be lower or higher than the performance quoted above. Please visit our web site at www.GSAMFUNDS.com to obtain the most recent month-end returns. Performance reflects applicable fee waivers and/or expense limitations in effect during the periods shown. In their absence, performance would be reduced. Returns do not reflect the deduction of taxes that a shareholder would pay on Fund distributions or the redemption of Fund shares.
32
FUND BASICS
| STANDARDIZED TOTAL RETURNS4 | ||||||||||||||||||
| For the period ended 9/30/14 | One Year | Five Years | Ten Years | Since Inception | Inception Date | |||||||||||||
| Class A | -1.07 | % | 0.53 | % | 2.55 | % | 3.67% | 5/1/97 | ||||||||||
| Class C | -0.47 | 0.42 | 2.11 | 2.99 | 8/15/97 | |||||||||||||
| Institutional | 0.83 | 1.18 | 3.07 | 5.13 | 8/15/88 | |||||||||||||
| Service | 0.32 | 0.69 | 2.56 | 3.79 | 4/10/96 | |||||||||||||
| Class IR | 0.74 | 1.10 | N/A | 2.55 | 11/30/07 | |||||||||||||
| 4 | The Standardized Total Returns are average annual total returns as of the most recent calendar quarter-end. They assume reinvestment of all distributions at NAV. These returns reflect a maximum initial sales charge of 1.5% for Class A Shares, the assumed contingent deferred sales charge for Class C Shares (0.65% if redeemed within 12 months of purchase). Prior to July 29, 2009, the maximum initial sales charge applicable to Class A Shares of the Fund was 2.0%, which is not reflected in the figures shown. Because Institutional Shares, Service Shares and Class IR Shares do not involve a sales charge, such a charge is not applied to their Standardized Total Returns. |
The returns set forth in the table above represent past performance. Past performance does not guarantee future results. The Fund’s investment return and principal value will fluctuate so that an investor’s shares, when redeemed, may be worth more or less than their original cost. Current performance may be lower or higher than the performance quoted above. Please visit our web site at www.GSAMFUNDS.com to obtain the most recent month-end returns. Performance reflects applicable fee waivers and/or expense limitations in effect during the periods shown. In their absence, performance would be reduced. Returns do not reflect the deduction of taxes that a shareholder would pay on Fund distributions or the redemption of Fund shares.
| EXPENSE RATIOS5 | ||||||||||
| Net Expense Ratio (Current) | Gross Expense Ratio (Before Waivers) | |||||||||
| Class A | 0.81 | % | 0.91 | % | ||||||
| Class C | 1.21 | 1.66 | ||||||||
| Institutional | 0.47 | 0.57 | ||||||||
| Service | 0.97 | 1.07 | ||||||||
| Class IR | 0.56 | 0.66 | ||||||||
| 5 | The expense ratios of the Fund, both current (net of applicable fee waivers and/or expense limitations) and before waivers (gross of applicable fee waivers and/or expense limitations) are as set forth above according to the most recent publicly available Prospectus for the Fund and may differ from the expense ratios disclosed in the Financial Highlights in this report. Pursuant to a contractual arrangement, the Fund’s waivers and/or expense limitations will remain in place through at least July 29, 2015, and prior to such date the Investment Adviser may not terminate the arrangements without the approval of the Fund’s Board of Trustees. If these arrangements are discontinued in the future, the expense ratios may change without shareholder approval. |
33
FUND BASICS
| FUND COMPOSITION6 |
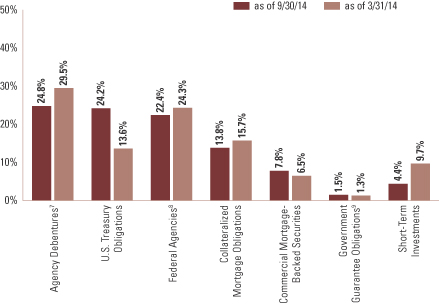
| 6 | The percentage shown for each investment category reflects the value of investments in that category as a percentage of net assets. Short-term Investments represents repurchase agreements. Figures in the graph may not sum to 100% due to the exclusion of other assets and liabilities. The graph depicts the Fund’s investments but may not represent the Fund’s market exposure due to the exclusion of certain derivatives, if any, as listed in the Additional Investment Information section of the Schedule of Investments. |
| 7 | “Agency Debentures” include agency securities offered by companies such as the Federal National Mortgage Association (“FNMA”) and the Federal Home Loan Mortgage Corp. (“FHLMC”), which operate under a government charter. While they are required to report to a government regulator, their assets are not explicitly guaranteed by the government and they otherwise operate like any other publicly traded company. |
| 8 | “Federal Agencies” are mortgage-backed securities guaranteed by the Government National Mortgage Association (“GNMA”), FNMA and FHLMC. GNMA instruments are backed by the full faith and credit of the U.S. Government. |
| 9 | “Government Guarantee Obligations” are guaranteed by a foreign government guarantee program and are backed by the full faith and credit of the United States or the government of a foreign country. |
34
PORTFOLIO RESULTS
Goldman Sachs Short Duration Income Fund
Investment Objective
The Fund seeks total return consisting of income and capital appreciation.
Portfolio Management Discussion and Analysis
Below, the Goldman Sachs Global Liquidity Management Team discusses the Goldman Sachs Short Duration Income Fund’s (the “Fund”) performance and positioning for the six-month period ended September 30, 2014 (the “Reporting Period”).
| Q | How did the Fund perform during the Reporting Period? |
| A | During the Reporting Period, the Fund’s Class A, C, Institutional, IR and R Shares generated cumulative total returns, without sales charges, of 0.38%, 0.18%, 0.56%, 0.51% and 0.26%, respectively. These returns compare to the 0.68% cumulative total return of the Goldman Sachs Short Duration Income Fund Composite Index (the “Short Duration Income Composite”) during the same period. The Short Duration Income Composite is comprised 50% of the Barclays U.S. 1-5 Year Corporate Bond Index and 50% of the Barclays U.S. 1-5 Year Government Bond Index, which generated cumulative total returns of 0.89% and 0.48%, respectively, over the same time period. |
| Q | What key factors were responsible for the Fund’s performance during the Reporting Period? |
| A | Both top-down and bottom-up strategies had an impact on the Fund’s performance during the Reporting Period. Within our top-down strategies, our duration and yield curve positioning strategy detracted from the Fund’s performance. Duration is a measure of the Fund’s sensitivity to changes in interest rates. Yield curve indicates the spectrum of maturities within a particular sector. |
| Our cross-sector strategy was the primary positive contributor to the Fund’s results during the Reporting Period. Our cross-sector strategy is one in which we invest Fund assets across a variety of fixed income sectors, including some that may not be included in the Fund’s benchmark. Our country strategy also added to relative performance, with performance driven by relative value trades. Our currency strategy also contributed positively, driven by the Fund’s underweighted exposure to the Swiss franc, which weakened versus the U.S. dollar during the Reporting Period amidst improving U.S. economic growth. Bottom-up individual issue selection amongst the securitized, government and emerging markets debt sectors contributed positively to the Fund’s results, while individual issue selection amongst corporate bonds and municipal bonds detracted. |
| Q | Which fixed income market sectors most significantly affected Fund performance? |
| A | Sector positioning contributed positively to the Fund’s results during the Reporting Period, with exposure to agency mortgage-backed securities helping most. Agency mortgage-backed securities performed well during the first half of the Reporting Period, as spreads, or yield differentials to U.S. Treasury securities, tightened, or narrowed, on the back of muted housing activity and limited supply of mortgage-backed securities. This trend reversed in the second half of the Reporting Period, as continued Federal Reserve (“Fed”) tapering of its assets purchased impacted net mortgage-backed securities supply. |
Exposure to asset-backed securities and corporate bonds also contributed positively to Fund results during the Reporting Period. The asset-backed securities sector rallied, particularly during the first half of the Reporting Period. An exposure to corporate bonds benefited the Fund, as the sector performed well, particularly at the beginning of the Reporting Period. We continued to see what we believe were supportive credit fundamentals, though valuations were close to fair value, in our opinion, at the end of the Reporting Period. In our view, better economic growth, weak inflation and accommodative monetary policy supported credit risk appetite. Our constructive credit view was underpinned by our macro outlooks for the U.S. and Europe, which foresee modestly improving economic growth against a backdrop of persistent slack and hence continued low to moderate inflation. (Slack is the difference between the current level of output and the level of output the economy could produce if all available resources were fully utilized.) The Fund’s exposure to |
35
PORTFOLIO RESULTS
emerging markets debt also had a positive impact on performance, albeit more modest. |
| Individual issue selection of high yield corporate bonds and shorter-dated corporate bonds detracted from Fund results during the Reporting Period. This was offset, however, by effective selection within the securitized sector, particularly selection of mortgage-backed securities, as well as security selection within the government/swap and emerging markets debt sectors, which contributed positively. |
| Q | Did the Fund’s duration and yield curve positioning strategy help or hurt its results during the Reporting Period? |
| A | Tactical management of the Fund’s duration and yield curve positioning detracted from its results during the Reporting Period, with the majority of negative return attributable to positioning in the three-year and 10-year segments of the U.S. Treasury yield curve, particularly in May 2014. A shorter duration position than the Short Duration Income Composite in May 2014 detracted from returns, as an underweight to the intermediate segment of the U.S. Treasury yield curve weighed on performance. We maintained our core bearish view through most of the Reporting Period. U.S. Treasury yields at the short-term end of the yield curve declined during the Reporting Period as did longer-term U.S. Treasury yields. The 10-year U.S. Treasury yield fell approximately 23 basis points to end the Reporting Period at 2.49%. (A basis point is 1/100th of a percentage point.) |
| During the second quarter of 2014, U.S. Treasury yields fell despite U.S. economic data, including manufacturing and housing market activity, continuing to improve. The U.S. Treasury yield curve flattened during the third calendar quarter, meaning the differential in yields between shorter-term and longer-term securities narrowed. Five-year U.S. Treasury yields rose by 13 basis points during the third quarter of 2014, while 10-year U.S. Treasury yields fell by 4 basis points during the same period. Fed chair Janet Yellen’s tone was notably balanced in September 2014’s press conference. Though the language in the Fed’s statement around guidance and the labor market was little changed, the press conference focused on the shift up in Fed rate projections, consistent with a first interest rate hike in June 2015. |
| We maintained a short position to U.K. sovereign bond duration, particularly in the 10-year node, or point, of its yield curve, which also weighed on Fund performance during the Reporting Period. As mentioned earlier, duration is a measure of the Fund’s sensitivity to changes in interest rates. Yield curve indicates the spectrum of maturities within a particular sector. |
| Q | How did the Fund use derivatives and similar instruments during the Reporting Period? |
| A | The Fund used Treasury futures, Eurodollar futures and interest rate swaps during the Reporting Period for the purpose of managing the duration and term structure of the Fund. (Term structure, most often depicted as a yield curve, refers to the term structure of interest rates, which is the relationship between the yield to maturity and the time to maturity for pure discount bonds.) The Fund employed credit default swaps to manage the credit profile of the Fund. The Fund used forward foreign currency transactions to hedge its exposure to foreign currency exposure and increase total return. The Fund employed swaptions (or options on interest rate swap contracts) to hedge and express an outright term structure view and to help manage volatility. |
| Q | Were there any notable changes in the Fund’s weightings during the Reporting Period? |
| A | The Fund’s allocations to U.S. Treasury securities, agency securities, high yield corporate bonds and emerging markets debt increased during the Reporting Period. A corresponding decrease in allocation was concentrated in agency collateralized mortgage obligations, investment grade corporate bonds and asset-backed securities. |
| At the start of the Reporting Period, the Fund maintained a shorter duration position than the Short Duration Income Composite. We maintained that short duration position relative to the benchmark index through the majority of the Reporting Period. |
36
PORTFOLIO RESULTS
| Q | How was the Fund positioned relative to its benchmark index at the end of September 2014? |
| A | While the Fund is benchmarked to an equally-balanced composite of the Barclays U.S. 1-5 Year Corporate Bond Index and the Barclays U.S. 1-5 Year Government Bond Index, it held a portion of its assets in non-Treasury sectors not represented in the Short Duration Income Composite. Indeed, the Fund maintained exposure to high quality spread, or non-Treasury, sectors throughout the Reporting Period, most notably agency mortgage-backed securities, asset-backed securities, high yield corporate bonds and emerging markets debt. The Fund also had exposure to government bonds and quasi-government securities at the end of the Reporting Period. |
37
FUND BASICS
Short Duration Income Fund
as of September 30, 2014
| PERFORMANCE REVIEW | ||||||||||||||||||||||||||
April 1, 2014– September 30, 2014 | Fund Total Return (based on NAV)1 | Goldman Sachs Short Duration | Barclays U.S. 1-5 Year Corporate Bond Index3 | Barclays U.S. 1-5 Year Government Bond Index4 | 30-Day Standardized Subsidized Yield5 | 30-Day Standardized Unsubsidized Yield5 | ||||||||||||||||||||
| Class A | 0.38 | % | 0.68 | % | 0.89 | % | 0.48 | % | 0.90 | % | 0.70 | % | ||||||||||||||
| Class C | 0.18 | 0.68 | 0.89 | 0.48 | 0.52 | -0.03 | ||||||||||||||||||||
| Institutional | 0.56 | 0.68 | 0.89 | 0.48 | 1.25 | 1.05 | ||||||||||||||||||||
| Class IR | 0.51 | 0.68 | 0.89 | 0.48 | 1.16 | 0.96 | ||||||||||||||||||||
| Class R | 0.26 | 0.68 | 0.89 | 0.48 | 0.70 | 0.50 | ||||||||||||||||||||
| 1 | The net asset value (NAV) represents the net assets of the class of the Fund (ex-dividend) divided by the total number of shares of the class outstanding. The Fund’s performance assumes the reinvestment of dividends and other distributions. The Fund’s performance does not reflect the deduction of any applicable sales charges. |
| 2 | The Goldman Sachs Short Duration Income Fund Composite Index is comprised of the Barclays U.S. 1-5 Year Corporate Bond Index (50%) and the Barclays U.S. 1-5 Year Government Bond Index (50%). |
| 3 | The Barclays U.S. 1-5 Year Corporate Bond Index provides a broad based measure of the global investment grade corporate sector with final maturities ranging between one and five years. The corporate sectors include industrial, utility and finance, for U.S. and non-U.S. corporations. The Barclays U.S. 1-5 Year Corporate Bond Index does not reflect any deduction for fees, expenses or taxes. It is not possible to invest directly in an index. |
| 4 | The Barclays U.S. 1-5 Year Government Bond Index provides a broad based measure of securities issued by the U.S. government with final maturities ranging from one to five years. This includes public obligations of the U.S. Treasury, U.S. government agencies, quasi-federal corporations and corporate or foreign debt guaranteed by the U.S. government. The Barclays U.S. 1-5 Year Government Bond Index does not reflect any deduction for fees, expenses or taxes. It is not possible to invest directly in an index. |
| 5 | The method of calculation of the 30-Day Standardized Subsidized Yield is mandated by the Securities and Exchange Commission and is determined by dividing the net investment income per share earned during the last 30 days of the period by the maximum public offering price (“POP”) per share on the last day of the period. This number is then annualized. The 30-Day Standardized Subsidized Yield reflects fee waivers and/or expense reimbursements recorded by the Fund during the period. Without waivers and/or reimbursements, yields would be reduced. This yield does not necessarily reflect income actually earned and distributed by the Fund and, therefore, may not be correlated with the dividends or other distributions paid to shareholders. The 30-Day Standardized Unsubsidized Yield does not adjust for any fee waivers and/or expense reimbursements in effect. If the Fund does not incur any fee waivers and/or expense reimbursements during the period, the 30-Day Standardized Subsidized Yield and 30-Day Standardized Unsubsidized Yield will be identical. |
The returns set forth in the table above represent past performance. Past performance does not guarantee future results. The Fund’s investment return and principal value will fluctuate so that an investor’s shares, when redeemed, may be worth more or less than their original cost. Current performance may be lower or higher than the performance quoted above. Please visit our web site at www.GSAMFUNDS.com to obtain the most recent month-end returns. Performance reflects applicable fee waivers and/or expense limitations in effect during the periods shown. In their absence, performance would be reduced. Returns do not reflect the deduction of taxes that a shareholder would pay on Fund distributions or the redemption of Fund shares.
38
FUND BASICS
| STANDARDIZED TOTAL RETURNS6 | ||||||||||||||
| For the period ended 9/30/14 | One Year | Since Inception | Inception Date | |||||||||||
| Class A | 0.32 | % | 1.34 | % | 2/29/2012 | |||||||||
| Class C | 0.75 | 1.52 | 2/29/2012 | |||||||||||
| Institutional | 2.16 | 2.31 | 2/29/2012 | |||||||||||
| Class IR | 2.07 | 2.22 | 2/29/2012 | |||||||||||
| Class R | 1.56 | 1.70 | 2/29/2012 | |||||||||||
| 6 | The Standardized Total Returns are average annual total returns as of the most recent calendar quarter-end. They assume reinvestment of all distributions at NAV. These returns reflect a maximum initial sales charge of 1.5% for Class A Shares and the assumed contingent deferred sales charge for Class C Shares (0.65% if redeemed within 12 months of purchase). Because Institutional Shares, Class IR Shares and Class R Shares do not involve a sales charge, such a charge is not applied to their Standardized Total Returns. |
The returns set forth in the table above represent past performance. Past performance does not guarantee future results. The Fund’s investment return and principal value will fluctuate so that an investor’s shares, when redeemed, may be worth more or less than their original cost. Current performance may be lower or higher than the performance quoted above. Please visit our web site at www.GSAMFUNDS.com to obtain the most recent month-end returns. Performance reflects applicable fee waivers and/or expense limitations in effect during the periods shown. In their absence, performance would be reduced. Returns do not reflect the deduction of taxes that a shareholder would pay on Fund distributions or the redemption of Fund shares.
| EXPENSE RATIOS7 | ||||||||||
| Net Expense Ratio (Current) | Gross Expense Ratio (Before Waivers) | |||||||||
| Class A | 0.80 | % | 1.18 | % | ||||||
| Class C | 1.20 | 1.93 | ||||||||
| Institutional | 0.46 | 0.84 | ||||||||
| Class IR | 0.55 | 0.93 | ||||||||
| Class R | 1.03 | 1.41 | ||||||||
| 7 | The expense ratios of the Fund, both current (net of applicable fee waivers and/or expense limitations) and before waivers (gross of applicable fee waivers and/or expense limitations) are as set forth above according to the most recent publicly available Prospectus for the Fund and may differ from the expense ratios disclosed in the Financial Highlights in this report. Pursuant to a contractual arrangement, the Fund’s waivers and/or expense limitations will remain in place through at least July 29, 2015, and prior to such date the Investment Adviser may not terminate the arrangements without the approval of the Fund’s Board of Trustees. If these arrangements are discontinued in the future, the expense ratios may change without shareholder approval. |
39
FUND BASICS
| FUND COMPOSITION8 |
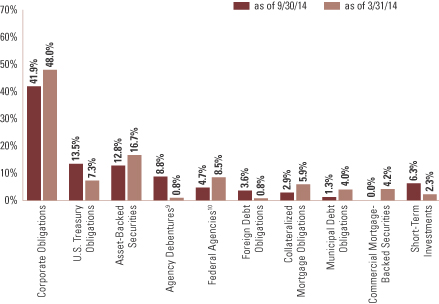
| 8 | The percentage shown for each investment category reflects the value of investments in that category as a percentage of net assets. Short-term Investments represents certificates of deposit and repurchase agreements. Figures in the graph may not sum to 100% due to the exclusion of other assets and liabilities. The graph depicts the Fund’s investments but may not represent the Fund’s market exposure due to the exclusion of certain derivatives, if any, as listed in the Additional Investment Information section of the Schedule of Investments. |
| 9 | “Agency Debentures” include agency securities offered by companies such as the Federal National Mortgage Association (“FNMA”) and the Federal Home Loan Mortgage Corp. (“FHLMC”), which operate under a government charter. While they are required to report to a government regulator, their assets are not explicitly guaranteed by the government and they otherwise operate like any other publicly traded company. |
| 10 | “Federal Agencies” are mortgage-backed securities guaranteed by the Government National Mortgage Association (“GNMA”), FNMA and FHLMC. GNMA instruments are backed by the full faith and credit of the U.S. Government. |
40
GOLDMAN SACHS ENHANCED INCOME FUND
Schedule of Investments
September 30, 2014 (Unaudited)
| Principal Amount | Interest Rate | Maturity Date | Value | |||||||||||
| Corporate Obligations – 46.1% | ||||||||||||||
| Aerospace/Defense – 0.3% | ||||||||||||||
| General Dynamics Corp. |
| ||||||||||||
| $ | 1,525,000 | 1.000 | % | 11/15/17 | $ | 1,497,335 | ||||||||
|
| |||||||||||||
| Banks – 23.2% | ||||||||||||||
| ABN AMRO Bank NV(a)(b) |
| ||||||||||||
| 3,950,000 | 1.035 | 10/28/16 | 3,985,629 | |||||||||||
| Australia & New Zealand Banking Group Ltd. |
| ||||||||||||
| 3,475,000 | 0.900 | 02/12/16 | 3,484,094 | |||||||||||
| 3,525,000 | 1.250 | 01/10/17 | 3,523,576 | |||||||||||
| Bank of America Corp. |
| ||||||||||||
| 6,125,000 | 6.000 | 09/01/17 | 6,817,906 | |||||||||||
| Bank of Montreal(a) |
| ||||||||||||
| 2,325,000 | 0.486 | 09/24/15 | 2,329,610 | |||||||||||
| Bank of Nova Scotia |
| ||||||||||||
| 2,625,000 | 0.750 | 10/09/15 | 2,630,698 | |||||||||||
| Bank of Scotland PLC(b) |
| ||||||||||||
| 100,000 | 5.250 | 02/21/17 | 109,286 | |||||||||||
| Bank of Tokyo-Mitsubishi UFJ Ltd.(b) |
| ||||||||||||
| 1,800,000 | 1.000 | 02/26/16 | 1,803,611 | |||||||||||
| 900,000 | 0.644 | (a) | 03/10/17 | 902,621 | ||||||||||
| Barclays Bank PLC(a) |
| ||||||||||||
| 4,350,000 | 0.811 | 02/17/17 | 4,367,422 | |||||||||||
| BPCE SA(a) |
| ||||||||||||
| 1,800,000 | 1.484 | 04/25/16 | 1,827,697 | |||||||||||
| Branch Banking & Trust Co.(a)(c) |
| ||||||||||||
| 3,425,000 | 0.565 | 10/28/15 | 3,426,473 | |||||||||||
| Capital One Bank USA NA(c) |
| ||||||||||||
| 2,075,000 | 1.150 | 11/21/16 | 2,073,387 | |||||||||||
| 1,325,000 | 0.734 | (a) | 02/13/17 | 1,326,557 | ||||||||||
| Citigroup, Inc. |
| ||||||||||||
| 3,205,000 | 3.953 | 06/15/16 | 3,351,429 | |||||||||||
| 1,425,000 | 6.125 | 11/21/17 | 1,604,886 | |||||||||||
| Commonwealth Bank of Australia(a)(b) |
| ||||||||||||
| 2,875,000 | 0.594 | 03/13/17 | 2,878,459 | |||||||||||
| Compass Bank(c) |
| ||||||||||||
| 1,250,000 | 1.850 | 09/29/17 | 1,249,715 | |||||||||||
| Cooperatieve Centrale Raiffeisen - Boerenleenbank BA(a) |
| ||||||||||||
| 3,450,000 | 0.714 | 03/18/16 | 3,467,273 | |||||||||||
| Credit Agricole SA(a)(b) |
| ||||||||||||
| 2,975,000 | 1.082 | 10/03/16 | 2,999,210 | |||||||||||
| Credit Suisse AG |
| ||||||||||||
| 8,075,000 | 1.625 | (b) | 03/06/15 | 8,118,431 | ||||||||||
| 3,900,000 | 0.725 | (a) | 05/26/17 | 3,913,276 | ||||||||||
| Fifth Third Bank(a)(c) |
| ||||||||||||
| 3,725,000 | 0.741 | 11/18/16 | 3,748,218 | |||||||||||
| ING Bank NV(b) |
| ||||||||||||
| 1,600,000 | 2.000 | 09/25/15 | 1,620,454 | |||||||||||
| 1,875,000 | 1.375 | 03/07/16 | 1,886,197 | |||||||||||
| Intesa Sanpaolo SPA |
| ||||||||||||
| 2,750,000 | 3.125 | 01/15/16 | 2,811,887 | |||||||||||
| JPMorgan Chase & Co. |
| ||||||||||||
| 1,200,000 | 6.400 | 10/02/17 | 1,354,716 | |||||||||||
| 3,925,000 | 0.865 | (a) | 01/28/19 | 3,953,382 | ||||||||||
| Macquarie Bank Ltd.(a)(b) |
| ||||||||||||
| 2,600,000 | 0.684 | 06/15/16 | 2,599,537 | |||||||||||
|
| |||||||||||||
| Corporate Obligations – (continued) | ||||||||||||||
| Banks – (continued) | ||||||||||||||
| Mizuho Corporate Bank Ltd.(b) |
| ||||||||||||
| $ | 1,475,000 | 2.550 | % | 03/17/17 | $ | 1,511,341 | ||||||||
| 1,150,000 | 1.550 | 10/17/17 | 1,140,730 | |||||||||||
| Morgan Stanley & Co. |
| ||||||||||||
| 1,525,000 | 4.750 | 03/22/17 | 1,639,649 | |||||||||||
| 4,525,000 | 1.083 | (a) | 01/24/19 | 4,576,684 | ||||||||||
| Nordea Bank AB(a)(b) |
| ||||||||||||
| 3,550,000 | 0.694 | 05/13/16 | 3,568,424 | |||||||||||
| Northern Rock Asset Management PLC(b) |
| ||||||||||||
| 1,400,000 | 5.625 | 06/22/17 | 1,554,275 | |||||||||||
| PNC Bank NA(c) |
| ||||||||||||
| 3,050,000 | 1.150 | 11/01/16 | 3,057,433 | |||||||||||
| Royal Bank of Canada |
| ||||||||||||
| 1,775,000 | 0.850 | 03/08/16 | 1,776,629 | |||||||||||
| Royal Bank of Scotland PLC |
| ||||||||||||
| 2,625,000 | 4.375 | 03/16/16 | 2,747,585 | |||||||||||
| Sparebank 1 Boligkreditt AS(b) |
| ||||||||||||
| 13,400,000 | 2.625 | 05/26/16 | 13,778,663 | |||||||||||
| Standard Chartered PLC(b) |
| ||||||||||||
| 3,625,000 | 3.850 | 04/27/15 | 3,693,186 | |||||||||||
| Sumitomo Mitsui Banking Corp.(a) |
| ||||||||||||
| 1,700,000 | 0.664 | 01/10/17 | 1,704,983 | |||||||||||
| Svenska Handelsbanken AB(a) |
| ||||||||||||
| 2,875,000 | 0.683 | 03/21/16 | 2,887,335 | |||||||||||
| The Bank of Tokyo-Mitsubishi UFJ Ltd.(b) |
| ||||||||||||
| 1,500,000 | 1.450 | 09/08/17 | 1,490,433 | |||||||||||
| The Huntington National Bank(a)(c) |
| ||||||||||||
| 1,800,000 | 0.658 | 04/24/17 | 1,801,141 | |||||||||||
| UBS AG |
| ||||||||||||
| 1,526,000 | 3.875 | 01/15/15 | 1,541,927 | |||||||||||
| Union Bank NA(a) |
| ||||||||||||
| 2,300,000 | 0.985 | 09/26/16 | 2,320,001 | |||||||||||
| Wells Fargo & Co. |
| ||||||||||||
| 4,125,000 | 1.250 | 02/13/15 | 4,139,025 | |||||||||||
|
| |||||||||||||
| 139,095,081 | ||||||||||||||
|
| |||||||||||||
| Chemicals – 0.5% | ||||||||||||||
| Praxair, Inc. |
| ||||||||||||
| 3,125,000 | 1.050 | 11/07/17 | 3,081,816 | |||||||||||
|
| |||||||||||||
| Diversified Manufacturing – 0.3% | ||||||||||||||
| Amphenol Corp. |
| ||||||||||||
| 925,000 | 1.550 | 09/15/17 | 925,054 | |||||||||||
| 1,000,000 | 2.550 | (c) | 01/30/19 | 1,007,610 | ||||||||||
|
| |||||||||||||
| 1,932,664 | ||||||||||||||
|
| |||||||||||||
| Electric – 1.6% | ||||||||||||||
| Alabama Power Co. |
| ||||||||||||
| 450,000 | 0.550 | 10/15/15 | 449,378 | |||||||||||
| Commonwealth Edison Co.(c) |
| ||||||||||||
| 525,000 | 2.150 | 01/15/19 | 524,777 | |||||||||||
| Duke Energy Progress, Inc.(a) |
| ||||||||||||
| 2,300,000 | 0.433 | 03/06/17 | 2,303,349 | |||||||||||
| Electricite de France(a)(b) |
| ||||||||||||
| 3,125,000 | 0.694 | 01/20/17 | 3,129,468 | |||||||||||
| Southern California Edison Co.(a) |
| ||||||||||||
| 1,975,000 | 0.285 | 10/01/14 | 1,975,000 | |||||||||||
|
| |||||||||||||
| The accompanying notes are an integral part of these financial statements. | 41 |
GOLDMAN SACHS ENHANCED INCOME FUND
Schedule of Investments (continued)
September 30, 2014 (Unaudited)
| Principal Amount | Interest Rate | Maturity Date | Value | |||||||||||
| Corporate Obligations – (continued) | ||||||||||||||
| Electric – (continued) | ||||||||||||||
| Virginia Electric and Power Co.(c) |
| ||||||||||||
| $ | 900,000 | 1.200 | % | 01/15/18 | $ | 885,363 | ||||||||
|
| |||||||||||||
| 9,267,335 | ||||||||||||||
|
| |||||||||||||
| Energy – 2.1% | ||||||||||||||
| Anadarko Petroleum Corp. |
| ||||||||||||
| 1,425,000 | 6.375 | 09/15/17 | 1,614,823 | |||||||||||
| BP Capital Markets PLC |
| ||||||||||||
| 4,425,000 | 3.125 | 10/01/15 | 4,535,479 | |||||||||||
| Halliburton Co. |
| ||||||||||||
| 1,925,000 | 1.000 | 08/01/16 | 1,930,001 | |||||||||||
| Statoil ASA(a) |
| ||||||||||||
| 1,200,000 | 0.524 | 05/15/18 | 1,200,063 | |||||||||||
| Transocean, Inc. |
| ||||||||||||
| 1,325,000 | 4.950 | 11/15/15 | 1,375,912 | |||||||||||
| Weatherford International Ltd. |
| ||||||||||||
| 1,250,000 | 9.625 | 03/01/19 | 1,605,270 | |||||||||||
|
| |||||||||||||
| 12,261,548 | ||||||||||||||
|
| |||||||||||||
| Finance – 0.3% | ||||||||||||||
| Caterpillar Financial Services Corp. |
| ||||||||||||
| 1,875,000 | 0.700 | 11/06/15 | 1,875,884 | |||||||||||
|
| |||||||||||||
| Food and Beverage – 4.2% | ||||||||||||||
| Anheuser-Busch InBev Worldwide, Inc. |
| ||||||||||||
| 4,125,000 | 0.800 | 07/15/15 | 4,137,140 | |||||||||||
| Cargill, Inc.(b) |
| ||||||||||||
| 1,700,000 | 1.900 | 03/01/17 | 1,723,793 | |||||||||||
| ConAgra Foods, Inc. |
| ||||||||||||
| 1,975,000 | 1.900 | 01/25/18 | 1,963,062 | |||||||||||
| Diageo Capital PLC |
| ||||||||||||
| 2,825,000 | 0.625 | 04/29/16 | 2,815,641 | |||||||||||
| Pernod-Ricard SA(b) |
| ||||||||||||
| 1,600,000 | 2.950 | 01/15/17 | 1,649,901 | |||||||||||
| SABMiller Holdings, Inc.(b) |
| ||||||||||||
| 1,625,000 | 2.450 | 01/15/17 | 1,660,103 | |||||||||||
| Starbucks Corp. |
| ||||||||||||
| 3,725,000 | 0.875 | 12/05/16 | 3,689,775 | |||||||||||
| Suntory Holdings, Ltd.(b) |
| ||||||||||||
| 2,850,000 | 1.650 | 09/29/17 | 2,850,513 | |||||||||||
| Sysco Corp. |
| ||||||||||||
| 2,500,000 | 1.450 | 10/02/17 | 2,506,017 | |||||||||||
| WM Wrigley Jr Co.(b) |
| ||||||||||||
| 1,900,000 | 2.000 | 10/20/17 | 1,917,767 | |||||||||||
|
| |||||||||||||
| 24,913,712 | ||||||||||||||
|
| |||||||||||||
| Health Care – Medical Products – 0.3% | ||||||||||||||
| Thermo Fisher Scientific, Inc. |
| ||||||||||||
| 1,675,000 | 1.300 | 02/01/17 | 1,667,420 | |||||||||||
|
| |||||||||||||
| Health Care Services – 1.0% | ||||||||||||||
| Covidien International Finance SA |
| ||||||||||||
| 2,525,000 | 2.800 | 06/15/15 | 2,565,945 | |||||||||||
| McKesson Corp. |
| ||||||||||||
| 950,000 | 3.250 | 03/01/16 | 978,400 | |||||||||||
| UnitedHealth Group, Inc. |
| ||||||||||||
| 2,725,000 | 1.400 | 10/15/17 | 2,715,493 | |||||||||||
|
| |||||||||||||
| 6,259,838 | ||||||||||||||
|
| |||||||||||||
| Corporate Obligations – (continued) | ||||||||||||||
| Life Insurance – 1.9% | ||||||||||||||
| American International Group, Inc. |
| ||||||||||||
| $ | 1,475,000 | 5.850 | % | 01/16/18 | $ | 1,658,475 | ||||||||
| Genworth Financial, Inc. |
| ||||||||||||
| 1,200,000 | 6.515 | 05/22/18 | 1,363,216 | |||||||||||
| Metropolitan Life Global Funding I(a)(b) |
| ||||||||||||
| 3,875,000 | 0.614 | 04/10/17 | 3,900,254 | |||||||||||
| Principal Life Global Funding II(b) |
| ||||||||||||
| 3,200,000 | 1.125 | 09/18/15 | 3,222,138 | |||||||||||
| Reliance Standard Life Global Funding II(b) |
| ||||||||||||
| 1,375,000 | 2.500 | 04/24/19 | 1,375,470 | |||||||||||
|
| |||||||||||||
| 11,519,553 | ||||||||||||||
|
| |||||||||||||
| Media – Cable – 0.7% | ||||||||||||||
| DIRECTV Holdings LLC/DIRECTV Financing Co., Inc. |
| ||||||||||||
| 2,450,000 | 2.400 | 03/15/17 | 2,504,278 | |||||||||||
| Time Warner Cable, Inc. |
| ||||||||||||
| 1,725,000 | 5.850 | 05/01/17 | 1,912,660 | |||||||||||
|
| |||||||||||||
| 4,416,938 | ||||||||||||||
|
| |||||||||||||
| Media – Non Cable – 0.7% | ||||||||||||||
| NBCUniversal Enterprise, Inc.(a)(b) |
| ||||||||||||
| 3,500,000 | 0.771 | 04/15/16 | 3,507,697 | |||||||||||
| Thomson Reuters Corp. |
| ||||||||||||
| 850,000 | 0.875 | 05/23/16 | 847,762 | |||||||||||
|
| |||||||||||||
| 4,355,459 | ||||||||||||||
|
| |||||||||||||
| Metals & Mining – 0.9% | ||||||||||||||
| BHP Billiton Finance USA Ltd.(a) |
| ||||||||||||
| 2,050,000 | 0.483 | 09/30/16 | 2,052,919 | |||||||||||
| Glencore Funding LLC(b) |
| ||||||||||||
| 1,625,000 | 2.700 | 10/25/17 | 1,652,113 | |||||||||||
| Rio Tinto Finance USA PLC(c) |
| ||||||||||||
| 1,750,000 | 2.000 | 03/22/17 | 1,779,265 | |||||||||||
|
| |||||||||||||
| 5,484,297 | ||||||||||||||
|
| |||||||||||||
| Noncaptive – Financial – 1.2% | ||||||||||||||
| American Express Credit Corp. |
| ||||||||||||
| 3,650,000 | 2.750 | 09/15/15 | 3,724,416 | |||||||||||
| General Electric Capital Corp. |
| ||||||||||||
| 2,875,000 | 5.625 | 09/15/17 | 3,208,803 | |||||||||||
|
| |||||||||||||
| 6,933,219 | ||||||||||||||
|
| |||||||||||||
| Pharmaceuticals – 0.6% | ||||||||||||||
| AbbVie, Inc. |
| ||||||||||||
| 1,750,000 | 1.750 | 11/06/17 | 1,744,334 | |||||||||||
| Forest Laboratories, Inc.(b) |
| ||||||||||||
| 1,825,000 | 4.375 | 02/01/19 | 1,925,375 | |||||||||||
|
| |||||||||||||
| 3,669,709 | ||||||||||||||
|
| |||||||||||||
| Real Estate Investment Trust – 2.8% | ||||||||||||||
| ERP Operating LP |
| ||||||||||||
| 1,725,000 | 5.750 | 06/15/17 | 1,912,442 | |||||||||||
| HCP, Inc. |
| ||||||||||||
| 2,550,000 | 6.000 | 01/30/17 | 2,814,394 | |||||||||||
| Health Care REIT, Inc. |
| ||||||||||||
| 2,575,000 | 4.700 | 09/15/17 | 2,792,247 | |||||||||||
| Senior Housing Properties Trust(c) |
| ||||||||||||
| 1,625,000 | 3.250 | 05/01/19 | 1,636,024 | |||||||||||
|
| |||||||||||||
| 42 | The accompanying notes are an integral part of these financial statements. |
GOLDMAN SACHS ENHANCED INCOME FUND
| Principal Amount | Interest Rate | Maturity Date | Value | |||||||||||
| Corporate Obligations – (continued) | ||||||||||||||
| Real Estate Investment Trust – (continued) | ||||||||||||||
| Simon Property Group LP(c) |
| ||||||||||||
| $ | 2,475,000 | 4.200 | % | 02/01/15 | $ | 2,482,259 | ||||||||
| Ventas Realty LP |
| ||||||||||||
| 1,714,000 | 1.550 | 09/26/16 | 1,724,501 | |||||||||||
| WEA Finance LLC/Westfield UK & Europe Finance PLC(b) |
| ||||||||||||
| 3,425,000 | 1.750 | 09/15/17 | 3,430,018 | |||||||||||
|
| |||||||||||||
| 16,791,885 | ||||||||||||||
|
| |||||||||||||
| Technology(a) – 1.1% | ||||||||||||||
| Cisco Systems, Inc. |
| ||||||||||||
| 2,675,000 | 0.514 | 03/03/17 | 2,683,983 | |||||||||||
| Hewlett-Packard Co. |
| ||||||||||||
| 4,000,000 | 1.174 | 01/14/19 | 4,053,748 | |||||||||||
|
| |||||||||||||
| 6,737,731 | ||||||||||||||
|
| |||||||||||||
| Transportation(b) – 0.5% | ||||||||||||||
| Penske Truck Leasing Co. LP/PTL Finance Corp. |
| ||||||||||||
| 1,300,000 | 3.750 | 05/11/17 | 1,367,496 | |||||||||||
| 1,625,000 | 2.875 | 07/17/18 | 1,662,280 | |||||||||||
|
| |||||||||||||
| 3,029,776 | ||||||||||||||
|
| |||||||||||||
| Wireless Telecommunications – 1.9% | ||||||||||||||
| Telefonica Emisiones SAU |
| ||||||||||||
| 1,050,000 | 3.992 | 02/16/16 | 1,092,245 | |||||||||||
| Verizon Communications, Inc. |
| ||||||||||||
| 10,550,000 | 0.700 | 11/02/15 | 10,542,388 | |||||||||||
|
| |||||||||||||
| 11,634,633 | ||||||||||||||
|
| |||||||||||||
| TOTAL CORPORATE OBLIGATIONS | ||||||||||||||
| (Cost $275,949,786) | $ | 276,425,833 | ||||||||||||
|
| |||||||||||||
| Agency Debentures – 7.7% | ||||||||||||||
| FFCB |
| ||||||||||||
| $ | 2,900,000 | 0.250 | % | 12/02/15 | $ | 2,895,769 | ||||||||
| FHLB |
| ||||||||||||
| 16,000,000 | 0.000 | (d) | 11/19/14 | 15,999,712 | ||||||||||
| 24,000,000 | 0.000 | (d) | 12/17/14 | 23,999,232 | ||||||||||
| 1,500,000 | 0.300 | 01/04/16 | 1,498,634 | |||||||||||
| FNMA(e) |
| ||||||||||||
| 1,700,000 | 0.375 | 03/16/15 | 1,701,805 | |||||||||||
|
| |||||||||||||
| TOTAL AGENCY DEBENTURES | ||||||||||||||
| (Cost $46,095,263) | $ | 46,095,152 | ||||||||||||
|
| |||||||||||||
| Asset-Backed Securities – 9.8% | ||||||||||||||
| Autos – 1.7% | ||||||||||||||
| Ally Master Owner Trust Series 2012-5, Class A |
| ||||||||||||
| $ | 4,600,000 | 1.540 | % | 09/15/19 | $ | 4,578,620 | ||||||||
| Ford Credit Floorplan Master Owner Trust Series 2013-1, | | ||||||||||||
| 4,400,000 | 0.534 | 01/15/18 | 4,409,033 | |||||||||||
|
| |||||||||||||
| Asset-Backed Securities – (continued) | ||||||||||||||
| Autos – (continued) | ||||||||||||||
| Huntington Auto Trust Series 2012-1,Class A3 |
| ||||||||||||
| $ | 1,318,493 | 0.810 | % | 09/15/16 | $ | 1,320,349 | ||||||||
| Motor PLC Series 2012-A, Class A1C(b) |
| ||||||||||||
| 246,960 | 1.286 | 02/25/20 | 247,337 | |||||||||||
|
| |||||||||||||
| 10,555,339 | ||||||||||||||
|
| |||||||||||||
| Credit Card – 2.1% | ||||||||||||||
| Bank of America Credit Card Trust Series 2014-A1, Class A(a) |
| ||||||||||||
| 7,000,000 | 0.534 | 06/15/21 | 6,999,398 | |||||||||||
| Citibank Credit Card Issuance Trust Series 2014-A2, Class A2 |
| ||||||||||||
| 5,400,000 | 1.020 | 02/22/19 | 5,372,887 | |||||||||||
|
| |||||||||||||
| 12,372,285 | ||||||||||||||
|
| |||||||||||||
| Home Equity(a) – 0.0% | ||||||||||||||
| Amresco Residential Securities Mortgage Loan Trust | | ||||||||||||
| 32,264 | 6.745 | 06/25/28 | 31,170 | |||||||||||
| Centex Home Equity Series 2004-D, Class MV3 |
| ||||||||||||
| 137,626 | 1.155 | 09/25/34 | 96,599 | |||||||||||
| Morgan Stanley ABS Capital I Series 2004-HE4, Class M3 |
| ||||||||||||
| 41,841 | 2.405 | 05/25/34 | 17,270 | |||||||||||
|
| |||||||||||||
| 145,039 | ||||||||||||||
|
| |||||||||||||
| Manufactured Housing – 0.0% | ||||||||||||||
| Lehman ABS Manufactured Housing Contract Series 2001-B, | | ||||||||||||
| 32,893 | 4.350 | 04/15/40 | 34,022 | |||||||||||
|
| |||||||||||||
| Student Loan(a) – 6.0% | ||||||||||||||
| Access Group, Inc. Series 2004-1, Class A2 |
| ||||||||||||
| 7,070,000 | 0.444 | 09/26/33 | 6,958,616 | |||||||||||
| Brazos Higher Education Authority, Inc. Series 2006-1, Class A3 |
| ||||||||||||
| 7,100,000 | 0.344 | 12/26/24 | 6,993,631 | |||||||||||
| Education Funding Capital Trust I Series 2004-1, Class A2 |
| ||||||||||||
| 20,253 | 0.394 | 12/15/22 | 20,244 | |||||||||||
| Education Loan Asset-Backed Trust I Series 2013-1, Class A1(b) |
| ||||||||||||
| 3,951,908 | 0.956 | 06/25/26 | 3,973,281 | |||||||||||
| Education Loan Asset-Backed Trust Series 2012-1, Class A1(b) |
| ||||||||||||
| 298,413 | 0.605 | 06/25/22 | 298,455 | |||||||||||
| Educational Services of America, Inc. Series 2010-1, Class A1(b) |
| ||||||||||||
| 3,671,667 | 1.084 | 07/25/23 | 3,694,887 | |||||||||||
| Educational Services of America, Inc. Series 2014-1, Class A(b) |
| ||||||||||||
| 4,056,844 | 0.855 | 02/25/39 | 4,065,647 | |||||||||||
| Northstar Education Finance, Inc. Series 2005-1, Class A1 |
| ||||||||||||
| 44,168 | 0.335 | 10/28/26 | 43,995 | |||||||||||
| Northstar Education Finance, Inc. Series 2012-1, Class A(b) |
| ||||||||||||
| 3,333,882 | 0.856 | 12/26/31 | 3,333,148 | |||||||||||
| Scholar Funding Trust Series 2012-B, Class A1(b) |
| ||||||||||||
| 3,147,031 | 0.552 | 10/28/25 | 3,139,036 | |||||||||||
| SLM Student Loan Trust Series 2003-12, Class A5(b) |
| ||||||||||||
| 2,256,368 | 0.514 | 09/15/22 | 2,256,201 | |||||||||||
| SLM Student Loan Trust Series 2007-2, Class A2 |
| ||||||||||||
| 951,418 | 0.234 | 07/25/17 | 950,205 | |||||||||||
|
| |||||||||||||
| The accompanying notes are an integral part of these financial statements. | 43 |
GOLDMAN SACHS ENHANCED INCOME FUND
Schedule of Investments (continued)
September 30, 2014 (Unaudited)
| Principal Amount | Interest Rate | Maturity Date | Value | |||||||||||
| Asset-Backed Securities – (continued) | ||||||||||||||
| Student Loan(a) – (continued) | ||||||||||||||
| US Education Loan Trust LLC Series 2006-1, Class A2(b) |
| ||||||||||||
| $ | 225,032 | 0.364 | % | 03/01/25 | $ | 224,775 | ||||||||
|
| |||||||||||||
| 35,952,121 | ||||||||||||||
|
| |||||||||||||
| TOTAL ASSET-BACKED SECURITIES | ||||||||||||||
| (Cost $59,058,825) | $ | 59,058,806 | ||||||||||||
|
| |||||||||||||
| Foreign Debt Obligation(b) – 0.2% | ||||||||||||||
| Sovereign – 0.2% | ||||||||||||||
| Kommunalbanken AS |
| ||||||||||||
| $ | 1,100,000 | 1.000 | % | 09/26/17 | $ | 1,091,334 | ||||||||
| (Cost $1,097,709) | ||||||||||||||
|
| |||||||||||||
| Government Guarantee Obligations(a)(f) – 4.0% | ||||||||||||||
| Achmea Bank NV(b) |
| ||||||||||||
| $ | 8,200,000 | 0.589 | % | 11/03/14 | $ | 8,202,427 | ||||||||
| FMS Wertmanagement |
| ||||||||||||
| 16,200,000 | 0.484 | 06/30/15 | 16,228,512 | |||||||||||
|
| |||||||||||||
| TOTAL GOVERNMENT GUARANTEE OBLIGATIONS | ||||||||||||||
| (Cost $24,428,544) | $ | 24,430,939 | ||||||||||||
|
| |||||||||||||
| U.S. Treasury Obligations – 20.0% | ||||||||||||||
| United States Treasury Inflation Protected Securities |
| ||||||||||||
| $ | 623,880 | 1.625 | % | 01/15/15 | $ | 624,560 | ||||||||
| 6,486,460 | 0.500 | 04/15/15 | 6,493,530 | |||||||||||
| 2,694,758 | 1.875 | 07/15/15 | 2,756,225 | |||||||||||
| United States Treasury Notes |
| ||||||||||||
| 24,900,000 | 0.250 | 11/30/14 | 24,907,968 | |||||||||||
| 85,000,000 | 0.125 | 04/30/15 | 85,031,453 | |||||||||||
|
| |||||||||||||
| TOTAL U.S. TREASURY OBLIGATIONS | ||||||||||||||
| (Cost $119,793,206) | $ | 119,813,736 | ||||||||||||
|
| |||||||||||||
| | TOTAL INVESTMENTS BEFORE SHORT-TERM INVESTMENT | | ||||||||||||
| (Cost $526,423,333) | $ | 526,915,800 | ||||||||||||
|
| |||||||||||||
| Short-term Investments – 13.9% | ||||||||||||||
| Certificate of Deposit – 2.3% | ||||||||||||||
| ABN AMRO Funding USA LLC |
| ||||||||||||
| $ | 2,525,000 | 0.233 | % | 12/23/14 | $ | 2,523,661 | ||||||||
| Cancara Asset Securitization LLC |
| ||||||||||||
| 5,650,000 | 0.183 | 12/18/14 | 5,647,796 | |||||||||||
| LMA-Americas LLC |
| ||||||||||||
| 5,675,000 | 0.243 | 12/10/14 | 5,672,352 | |||||||||||
|
| |||||||||||||
| 13,843,809 | ||||||||||||||
|
| |||||||||||||
| Repurchase Agreement(g) – 11.6% | ||||||||||||||
| Joint Repurchase Agreement Account II |
| ||||||||||||
| 69,300,000 | 0.012 | 10/01/14 | 69,300,000 | |||||||||||
|
| |||||||||||||
| TOTAL SHORT-TERM INVESTMENTS | ||||||||||||||
| (Cost $83,143,809) | $ | 83,143,809 | ||||||||||||
|
| |||||||||||||
| TOTAL INVESTMENTS – 101.7% | ||||||||||||||
| (Cost $609,567,142) | $ | 610,059,609 | ||||||||||||
|
| |||||||||||||
|
| LIABILITIES IN EXCESS OF OTHER ASSETS – (1.7)% |
| (10,309,540 | ) | ||||||||||
|
| |||||||||||||
| NET ASSETS – 100.0% | $ | 599,750,069 | ||||||||||||
|
| |||||||||||||
| The percentage shown for each investment category reflects the value of investments in that category as a percentage of net assets. | ||
(a) | Variable rate security. Interest rate or distribution rate disclosed is that which is in effect at September 30, 2014. | |
(b) | Exempt from registration under Rule 144A of the Securities Act of 1933. Under procedures approved by the Board of Trustees, such securities have been determined to be liquid by the investment adviser and may be resold, normally to qualified institutional buyers in transactions exempt from registration. Total market value of Rule 144A securities amounts to $119,141,401, which represents approximately 19.9% of net assets as of September 30, 2014. | |
(c) | Security with “Call” features with resetting interest rates. Maturity dates disclosed are the final maturity dates. | |
(d) | Issued with a zero coupon. Income is recognized through the accretion of discount. | |
(e) | A portion of this security is segregated as collateral for initial margin requirements on futures transactions. | |
(f) | Guaranteed by a foreign government until maturity. Total market value of these securities amounts to $24,430,939, which represents approximately 4.0% of net assets as of September 30, 2014. | |
(g) | Joint repurchase agreement was entered into on September 30, 2014. Additional information appears on page 87. | |
| ||
Investment Abbreviations: | ||
FFCB | —Federal Farm Credit Bank | |
FHLB | —Federal Home Loan Bank | |
FNMA | —Federal National Mortgage Association | |
REIT | —Real Estate Investment Trust | |
SPA | —Stand-by Purchase Agreement | |
| ||
| 44 | The accompanying notes are an integral part of these financial statements. |
GOLDMAN SACHS ENHANCED INCOME FUND
| ADDITIONAL INVESTMENT INFORMATION |
FUTURES CONTRACTS — At September 30, 2014, the Fund had the following futures contracts:
| Type | Number of Contracts Long (Short) | Expiration Date | Current Value | Unrealized Gain (Loss) | ||||||||||
2 Year U.S. Treasury Notes | (431 | ) | December 2014 | $ | (94,321,656 | ) | $ | 46,413 | ||||||
5 Year U.S. Treasury Notes | (296 | ) | December 2014 | (35,004,313 | ) | 109,057 | ||||||||
| TOTAL | $ | 155,470 | ||||||||||||
| The accompanying notes are an integral part of these financial statements. | 45 |
GOLDMAN SACHS GOVERNMENT INCOME FUND
Schedule of Investments
September 30, 2014 (Unaudited)
Principal Amount | Interest Rate | Maturity Date | Value | |||||||||||
| Mortgage-Backed Obligations – 46.0% | ||||||||||||||
| Collateralized Mortgage Obligations – 3.5% | ||||||||||||||
| Adjustable Rate Non-Agency(a) – 0.1% | ||||||||||||||
| MLCC Mortgage Investors, Inc. Series 2004-E, Class A2B |
| ||||||||||||
| $ | 657,823 | 1.052 | % | 11/25/29 | $ | 641,275 | ||||||||
|
| |||||||||||||
| Interest Only(b) – 0.0% | ||||||||||||||
| CS First Boston Mortgage Securities Corp. Series 2003-AR18, | | ||||||||||||
| 71,141 | 0.000 | 07/25/33 | — | |||||||||||
| CS First Boston Mortgage Securities Corp. Series 2003-AR20, | | ||||||||||||
| 91,061 | 0.000 | 08/25/33 | — | |||||||||||
| FNMA STRIPS Series 151, Class 2 |
| ||||||||||||
| 4,913 | 9.500 | 07/25/22 | 697 | |||||||||||
| Master Adjustable Rate Mortgages Trust Series 2003-2, | | ||||||||||||
| 29,271 | 0.123 | 08/25/33 | 185 | |||||||||||
| Master Adjustable Rate Mortgages Trust Series 2003-2, | | ||||||||||||
| 6,433 | 0.320 | 07/25/33 | 74 | |||||||||||
|
| |||||||||||||
| 956 | ||||||||||||||
|
| |||||||||||||
| Inverse Floaters(a) – 0.0% | ||||||||||||||
| GNMA Series 2001-48, Class SA |
| ||||||||||||
| 21,226 | 25.988 | 10/16/31 | 32,220 | |||||||||||
| GNMA Series 2001-51, Class SA |
| ||||||||||||
| 16,442 | 31.834 | 10/16/31 | 27,151 | |||||||||||
| GNMA Series 2001-51, Class SB |
| ||||||||||||
| 20,633 | 25.988 | 10/16/31 | 33,139 | |||||||||||
| GNMA Series 2002-13, Class SB |
| ||||||||||||
| 74,373 | 36.850 | 02/16/32 | 119,012 | |||||||||||
|
| |||||||||||||
| 211,522 | ||||||||||||||
|
| |||||||||||||
| Principal Only(c) – 0.0% | ||||||||||||||
| FNMA REMIC Series G-35, Class N |
| ||||||||||||
| 6,227 | 0.000 | 10/25/21 | 6,073 | |||||||||||
|
| |||||||||||||
| Regular Floater(a) – 0.1% | ||||||||||||||
| FDIC Structured Sale Guaranteed Notes Series 2010-S1, | | ||||||||||||
| 196,997 | 0.703 | 02/25/48 | 197,256 | |||||||||||
| FHLMC REMIC Series 1760, Class ZB |
| ||||||||||||
| 153,746 | 1.810 | 05/15/24 | 157,255 | |||||||||||
|
| |||||||||||||
| 354,511 | ||||||||||||||
|
| |||||||||||||
| Sequential Fixed Rate – 3.1% | ||||||||||||||
| FHLMC Multifamily Structured Pass-Through Certificates | | ||||||||||||
| 600,000 | 2.373 | 05/25/22 | 587,313 | |||||||||||
| FHLMC REMIC Series 2329, Class ZA |
| ||||||||||||
| 916,509 | 6.500 | 06/15/31 | 1,032,555 | |||||||||||
| FHLMC REMIC Series 4273, Class PD |
| ||||||||||||
| 1,842,905 | 6.500 | 11/15/43 | 2,123,049 | |||||||||||
| FNMA REMIC Series 2001-53, Class GH |
| ||||||||||||
| 26,324 | 8.000 | 09/25/16 | 27,070 | |||||||||||
| FNMA REMIC Series 2011-52, Class GB |
| ||||||||||||
| 1,400,000 | 5.000 | 06/25/41 | 1,553,403 | |||||||||||
| FNMA REMIC Series 2011-99, Class DB |
| ||||||||||||
| 1,225,000 | 5.000 | 10/25/41 | 1,364,362 | |||||||||||
|
| |||||||||||||
| Mortgage-Backed Obligations – (continued) | ||||||||||||||
| Sequential Fixed Rate – (continued) | ||||||||||||||
| FNMA REMIC Series 2012-111, Class B |
| ||||||||||||
| $ | 301,804 | 7.000 | % | 10/25/42 | $ | 342,401 | ||||||||
| FNMA REMIC Series 2012-153, Class B |
| ||||||||||||
| 1,055,347 | 7.000 | 07/25/42 | 1,196,910 | |||||||||||
| GNMA Series 2002-42, Class KZ |
| ||||||||||||
| 2,506,490 | 6.000 | 06/16/32 | 2,812,955 | |||||||||||
| NCUA Guaranteed Notes Series 2010-R1, Class 2A |
| ||||||||||||
| 120,582 | 1.840 | 10/07/20 | 121,096 | |||||||||||
| NCUA Guaranteed Notes Series A4 |
| ||||||||||||
| 3,400,000 | 3.000 | 06/12/19 | 3,559,054 | |||||||||||
|
| |||||||||||||
| 14,720,168 | ||||||||||||||
|
| |||||||||||||
| Sequential Floating Rate(a) – 0.2% | ||||||||||||||
| NCUA Guaranteed Notes Series 2010-R1, Class 1A |
| ||||||||||||
| 689,936 | 0.606 | 10/07/20 | 693,305 | |||||||||||
|
| |||||||||||||
| | TOTAL COLLATERALIZED MORTGAGE OBLIGATIONS | | $ | 16,627,810 | ||||||||||
|
| |||||||||||||
| Commercial Mortgage-Backed Securities – 5.5% | ||||||||||||||
| Sequential Floating Rate – 5.5% | ||||||||||||||
| Banc of America Commercial Mortgage Trust Series 2006-3, | | ||||||||||||
| 3,318,407 | 5.889 | 07/10/44 | 3,535,357 | |||||||||||
| Citigroup Commercial Mortgage Trust Series 2008-C7, | | ||||||||||||
| 5,365,366 | 6.253 | 12/10/49 | 5,977,731 | |||||||||||
| Credit Suisse Commercial Mortgage Trust Series 2007-C2, | | ||||||||||||
| 4,206,348 | 5.526 | 01/15/49 | 4,494,240 | |||||||||||
| LB Commercial Mortgage Trust Series 2007-C3, Class A1A(a) |
| ||||||||||||
| 3,135,918 | 6.056 | 07/15/44 | 3,458,338 | |||||||||||
| ML-CFC Commercial Mortgage Trust Series 2006-4, Class A1A |
| ||||||||||||
| 5,245,247 | 5.166 | 12/12/49 | 5,598,348 | |||||||||||
| Morgan Stanley Capital I Trust Series 2007-T25, Class A1A(a) |
| ||||||||||||
| 2,705,723 | 5.509 | 11/12/49 | 2,919,712 | |||||||||||
|
| |||||||||||||
|
| TOTAL COMMERCIAL MORTGAGE-BACKED SECURITIES |
| $ | 25,983,726 | ||||||||||
|
| |||||||||||||
| Federal Agencies – 37.0% | ||||||||||||||
| Adjustable Rate FHLMC(a) – 0.3% | ||||||||||||||
| 154,694 | 2.349 | 11/01/32 | 164,157 | |||||||||||
| 1,274,762 | 2.375 | 09/01/33 | 1,355,500 | |||||||||||
|
| |||||||||||||
| 1,519,657 | ||||||||||||||
|
| |||||||||||||
| Adjustable Rate FNMA(a) – 1.2% | ||||||||||||||
| 132,031 | 2.274 | 11/01/32 | 140,918 | |||||||||||
| 246,060 | 2.124 | 12/01/32 | 260,878 | |||||||||||
| 1,410,900 | 1.790 | 05/01/33 | 1,473,143 | |||||||||||
| 34,630 | 2.340 | 06/01/33 | 36,773 | |||||||||||
| 1,094,734 | 2.263 | 10/01/33 | 1,169,962 | |||||||||||
| 1,156,971 | 2.320 | 02/01/35 | 1,229,977 | |||||||||||
| 1,060,344 | 2.091 | 09/01/35 | 1,130,851 | |||||||||||
|
| |||||||||||||
| 5,442,502 | ||||||||||||||
|
| |||||||||||||
| 46 | The accompanying notes are an integral part of these financial statements. |
GOLDMAN SACHS GOVERNMENT INCOME FUND
Principal Amount | Interest Rate | Maturity Date | Value | |||||||||||
| Mortgage-Backed Obligations – (continued) | ||||||||||||||
| Adjustable Rate GNMA(a) – 0.8% | ||||||||||||||
| $ | 78,808 | 1.625 | % | 06/20/23 | $ | 80,441 | ||||||||
| 35,891 | 1.625 | 07/20/23 | 36,640 | |||||||||||
| 35,945 | 1.625 | 08/20/23 | 36,700 | |||||||||||
| 97,018 | 1.625 | 09/20/23 | 99,072 | |||||||||||
| 29,067 | 1.625 | 03/20/24 | 29,710 | |||||||||||
| 252,753 | 1.625 | 04/20/24 | 258,379 | |||||||||||
| 30,177 | 1.625 | 05/20/24 | 30,853 | |||||||||||
| 213,837 | 1.625 | 06/20/24 | 218,661 | |||||||||||
| 44,205 | 2.000 | 06/20/24 | 45,782 | |||||||||||
| 68,117 | 1.625 | 07/20/24 | 69,662 | |||||||||||
| 73,520 | 2.000 | 07/20/24 | 76,175 | |||||||||||
| 127,415 | 1.625 | 08/20/24 | 130,325 | |||||||||||
| 64,378 | 2.000 | 08/20/24 | 66,718 | |||||||||||
| 60,886 | 1.625 | 09/20/24 | 62,286 | |||||||||||
| 78,161 | 2.000 | 11/20/24 | 81,059 | |||||||||||
| 30,026 | 2.000 | 12/20/24 | 31,146 | |||||||||||
| 45,256 | 2.500 | 12/20/24 | 47,709 | |||||||||||
| 52,192 | 2.000 | 01/20/25 | 54,149 | |||||||||||
| 27,346 | 2.000 | 02/20/25 | 28,379 | |||||||||||
| 96,319 | 2.000 | 05/20/25 | 100,022 | |||||||||||
| 78,779 | 2.000 | 07/20/25 | 81,843 | |||||||||||
| 37,942 | 1.625 | 02/20/26 | 38,908 | |||||||||||
| 1,897 | 1.625 | 07/20/26 | 1,946 | |||||||||||
| 50,627 | 1.625 | 01/20/27 | 51,987 | |||||||||||
| 46,003 | 2.000 | 01/20/27 | 47,829 | |||||||||||
| 38,357 | 1.625 | 02/20/27 | 39,393 | |||||||||||
| 272,428 | 1.625 | 04/20/27 | 279,853 | |||||||||||
| 32,127 | 1.625 | 05/20/27 | 33,007 | |||||||||||
| 33,237 | 1.625 | 06/20/27 | 34,151 | |||||||||||
| 11,892 | 1.625 | 11/20/27 | 12,226 | |||||||||||
| 275 | 2.000 | 11/20/27 | 287 | |||||||||||
| 45,372 | 1.625 | 12/20/27 | 46,653 | |||||||||||
| 87,006 | 1.625 | 01/20/28 | 89,472 | |||||||||||
| 31,802 | 1.625 | 02/20/28 | 32,707 | |||||||||||
| 35,317 | 1.625 | 03/20/28 | 36,327 | |||||||||||
| 154,063 | 1.625 | 07/20/29 | 158,743 | |||||||||||
| 82,345 | 1.625 | 08/20/29 | 84,854 | |||||||||||
| 21,426 | 1.625 | 09/20/29 | 22,081 | |||||||||||
| 85,280 | 1.625 | 10/20/29 | 87,898 | |||||||||||
| 99,257 | 1.625 | 11/20/29 | 102,237 | |||||||||||
| 25,078 | 1.625 | 12/20/29 | 25,845 | |||||||||||
| 30,389 | 1.625 | 01/20/30 | 31,332 | |||||||||||
| 15,279 | 1.625 | 02/20/30 | 15,756 | |||||||||||
| 81,180 | 1.625 | 03/20/30 | 83,708 | |||||||||||
| 95,335 | 1.625 | 04/20/30 | 98,323 | |||||||||||
| 144,265 | 1.625 | 05/20/30 | 148,791 | |||||||||||
| 105,959 | 2.000 | 05/20/30 | 111,248 | |||||||||||
| 22,742 | 1.625 | 06/20/30 | 23,457 | |||||||||||
| 205,319 | 2.000 | 07/20/30 | 215,635 | |||||||||||
| 42,285 | 2.000 | 09/20/30 | 44,421 | |||||||||||
| 74,886 | 1.625 | 10/20/30 | 77,277 | |||||||||||
| 147,571 | 1.625 | 03/20/32 | 152,517 | |||||||||||
|
| |||||||||||||
| 3,894,580 | ||||||||||||||
|
| |||||||||||||
| Mortgage-Backed Obligations – (continued) | ||||||||||||||
| FHLMC – 2.3% | ||||||||||||||
| $ | 44,009 | 7.500 | % | 11/01/14 | $ | 44,213 | ||||||||
| 297 | 7.000 | 02/01/15 | 298 | |||||||||||
| 3,321 | 8.000 | 07/01/15 | 3,361 | |||||||||||
| 9,639 | 7.000 | 09/01/17 | 10,127 | |||||||||||
| 4,451 | 7.000 | 10/01/17 | 4,687 | |||||||||||
| 26,007 | 5.500 | 05/01/18 | 27,667 | |||||||||||
| 350,746 | 5.500 | 06/01/18 | 371,978 | |||||||||||
| 15,309 | 4.500 | 09/01/18 | 16,143 | |||||||||||
| 4,448 | 10.000 | 10/01/18 | 4,468 | |||||||||||
| 106,517 | 5.000 | 06/01/19 | 113,697 | |||||||||||
| 7,914 | 10.000 | 07/01/20 | 8,047 | |||||||||||
| 42,460 | 10.000 | 10/01/20 | 48,844 | |||||||||||
| 54,299 | 6.500 | 07/01/21 | 61,396 | |||||||||||
| 3,930 | 6.500 | 08/01/22 | 4,443 | |||||||||||
| 46,315 | 9.000 | 10/01/22 | 54,140 | |||||||||||
| 213,567 | 4.500 | 10/01/23 | 230,442 | |||||||||||
| 1,164,089 | 5.000 | 08/01/24 | 1,244,884 | |||||||||||
| 180,027 | 6.500 | 07/01/28 | 200,273 | |||||||||||
| 1,027,899 | 4.500 | 03/01/29 | 1,113,496 | |||||||||||
| 4,675 | 8.000 | 07/01/30 | 5,677 | |||||||||||
| 14,705 | 7.500 | 12/01/30 | 15,261 | |||||||||||
| 55,560 | 7.000 | 04/01/31 | 63,972 | |||||||||||
| 40,360 | 5.000 | 08/01/33 | 44,616 | |||||||||||
| 7,667 | 5.000 | 09/01/33 | 8,476 | |||||||||||
| 17,852 | 5.000 | 10/01/33 | 19,735 | |||||||||||
| 21,032 | 5.500 | 09/01/34 | 23,596 | |||||||||||
| 629,245 | 6.000 | 10/01/34 | 719,307 | |||||||||||
| 9,124 | 5.000 | 11/01/34 | 10,091 | |||||||||||
| 566,537 | 5.000 | 12/01/34 | 626,617 | |||||||||||
| 1,964 | 5.500 | 03/01/35 | 2,193 | |||||||||||
| 29,332 | 5.000 | 07/01/35 | 32,443 | |||||||||||
| 3,898 | 5.500 | 07/01/35 | 4,373 | |||||||||||
| 12,867 | 5.000 | 11/01/35 | 14,223 | |||||||||||
| 11,735 | 5.500 | 11/01/35 | 13,117 | |||||||||||
| 54,954 | 5.000 | 12/01/35 | 60,748 | |||||||||||
| 138,678 | 5.500 | 01/01/36 | 154,919 | |||||||||||
| 409 | 5.500 | 02/01/36 | 457 | |||||||||||
| 5,485 | 6.000 | 06/01/36 | 6,184 | |||||||||||
| 132,327 | 5.000 | 02/01/37 | 145,702 | |||||||||||
| 9,485 | 5.000 | 03/01/38 | 10,444 | |||||||||||
| 215,091 | 5.500 | 03/01/38 | 239,042 | |||||||||||
| 82,853 | 5.500 | 04/01/38 | 92,060 | |||||||||||
| 14,031 | 5.500 | 11/01/38 | 15,754 | |||||||||||
| 20,712 | 5.500 | 12/01/38 | 23,129 | |||||||||||
| 924,207 | 7.000 | 02/01/39 | 1,051,647 | |||||||||||
| 6,572 | 5.500 | 03/01/39 | 7,392 | |||||||||||
| 404,620 | 5.000 | 07/01/39 | 445,836 | |||||||||||
| 9,427 | 5.500 | 10/01/39 | 10,603 | |||||||||||
| 15,981 | 5.500 | 03/01/40 | 17,757 | |||||||||||
| 45,081 | 5.500 | 06/01/40 | 50,101 | |||||||||||
| 23,790 | 5.000 | 08/01/40 | 26,268 | |||||||||||
| 1,782,782 | 5.500 | 08/01/40 | 1,981,304 | |||||||||||
| 5,565 | 4.500 | 11/01/40 | 6,008 | |||||||||||
| 17,927 | 5.000 | 04/01/41 | 19,838 | |||||||||||
| 19,634 | 5.000 | 06/01/41 | 21,727 | |||||||||||
|
| |||||||||||||
| The accompanying notes are an integral part of these financial statements. | 47 |
GOLDMAN SACHS GOVERNMENT INCOME FUND
Schedule of Investments (continued)
September 30, 2014 (Unaudited)
Principal Amount | Interest Rate | Maturity Date | Value | |||||||||||
| Mortgage-Backed Obligations – (continued) | ||||||||||||||
| FHLMC – (continued) | ||||||||||||||
| $ | 750,881 | 5.000 | % | 07/01/41 | $ | 830,932 | ||||||||
| 28,051 | 3.000 | 05/01/42 | 27,714 | |||||||||||
| 342,271 | 3.500 | 06/01/42 | 351,924 | |||||||||||
| 28,715 | 3.000 | 08/01/42 | 28,370 | |||||||||||
| 31,143 | 3.000 | 01/01/43 | 30,768 | |||||||||||
| 108,929 | 3.000 | 02/01/43 | 107,619 | |||||||||||
|
| |||||||||||||
| 10,930,548 | ||||||||||||||
|
| |||||||||||||
| FNMA – 29.5% | ||||||||||||||
| 3,438 | 7.000 | 03/01/15 | 3,456 | |||||||||||
| 1,475 | 8.000 | 01/01/16 | 1,505 | |||||||||||
| 50,592 | 8.000 | 11/01/16 | 52,231 | |||||||||||
| 65,563 | 5.000 | 08/01/17 | 69,223 | |||||||||||
| 2,233,084 | 2.800 | 03/01/18 | 2,311,323 | |||||||||||
| 1,905,900 | 3.740 | 05/01/18 | 2,034,067 | |||||||||||
| 1,690,000 | 3.840 | 05/01/18 | 1,810,130 | |||||||||||
| 23,843 | 4.500 | 08/01/18 | 25,207 | |||||||||||
| 224,448 | 5.000 | 09/01/18 | 237,870 | |||||||||||
| 1,169,463 | 5.000 | 10/01/18 | 1,240,038 | |||||||||||
| 4,400,000 | 4.506 | 06/01/19 | 4,757,423 | |||||||||||
| 61,363 | 6.500 | 08/01/19 | 69,459 | |||||||||||
| 943,378 | 3.416 | 10/01/20 | 995,051 | |||||||||||
| 13,183 | 9.500 | 10/01/20 | 13,249 | |||||||||||
| 626,814 | 3.615 | 12/01/20 | 667,742 | |||||||||||
| 2,342,380 | 4.375 | 06/01/21 | 2,584,284 | |||||||||||
| 396,647 | 5.500 | 02/01/23 | 441,346 | |||||||||||
| 673,432 | 5.500 | 08/01/23 | 749,376 | |||||||||||
| 186,673 | 6.000 | 11/01/28 | 212,581 | |||||||||||
| 10,304 | 6.500 | 11/01/28 | 11,306 | |||||||||||
| 37,741 | 5.000 | 02/01/30 | 41,822 | |||||||||||
| 12,022 | 7.000 | 11/01/30 | 12,155 | |||||||||||
| 93,684 | 7.000 | 07/01/31 | 107,907 | |||||||||||
| 554 | 6.000 | 03/01/32 | 634 | |||||||||||
| 2,015 | 5.500 | 03/01/33 | 2,264 | �� | ||||||||||
| 6,335 | 6.000 | 03/01/33 | 7,244 | |||||||||||
| 5,998,659 | 5.500 | 04/01/33 | 6,756,674 | |||||||||||
| 2,304 | 6.000 | 05/01/33 | 2,634 | |||||||||||
| 9,017 | 5.000 | 07/01/33 | 10,077 | |||||||||||
| 1,478,498 | 5.500 | 07/01/33 | 1,618,637 | |||||||||||
| 52,954 | 5.000 | 08/01/33 | 58,695 | |||||||||||
| 53,125 | 5.000 | 09/01/33 | 58,684 | |||||||||||
| 29,217 | 5.500 | 09/01/33 | 32,812 | |||||||||||
| 4,093 | 5.000 | 12/01/33 | 4,522 | |||||||||||
| 46,627 | 5.500 | 12/01/33 | 52,387 | |||||||||||
| 2,075 | 6.000 | 12/01/33 | 2,345 | |||||||||||
| 277,993 | 5.000 | 02/01/34 | 307,081 | |||||||||||
| 80,520 | 5.500 | 02/01/34 | 90,447 | |||||||||||
| 3,666 | 5.500 | 03/01/34 | 4,119 | |||||||||||
| 8,357 | 5.500 | 04/01/34 | 9,402 | |||||||||||
| 406,883 | 5.500 | 05/01/34 | 457,131 | |||||||||||
| 234 | 5.500 | 06/01/34 | 262 | |||||||||||
| 17,250 | 5.500 | 08/01/34 | 19,473 | |||||||||||
| 8,007 | 5.500 | 09/01/34 | 8,996 | |||||||||||
| 9,337 | 5.500 | 10/01/34 | 10,493 | |||||||||||
| 42,421 | 5.500 | 11/01/34 | 47,657 | |||||||||||
| 81,701 | 5.500 | 12/01/34 | 91,610 | |||||||||||
|
| |||||||||||||
| Mortgage-Backed Obligations – (continued) | ||||||||||||||
| FNMA – (continued) | ||||||||||||||
| $ | 1,543,828 | 5.000 | % | 02/01/35 | $ | 1,705,371 | ||||||||
| 14,168 | 5.500 | 02/01/35 | 15,917 | |||||||||||
| 11,670 | 5.500 | 04/01/35 | 13,082 | |||||||||||
| 347,481 | 6.000 | 04/01/35 | 397,360 | |||||||||||
| 10,722 | 5.000 | 05/01/35 | 11,922 | |||||||||||
| 9,655 | 5.500 | 05/01/35 | 10,797 | |||||||||||
| 20,537 | 5.000 | 07/01/35 | 22,733 | |||||||||||
| 15,778 | 5.500 | 07/01/35 | 17,682 | |||||||||||
| 9,118 | 5.000 | 08/01/35 | 10,115 | |||||||||||
| 1,465 | 5.500 | 08/01/35 | 1,650 | |||||||||||
| 409 | 6.000 | 08/01/35 | 462 | |||||||||||
| 16,181 | 5.500 | 09/01/35 | 18,186 | |||||||||||
| 145,745 | 6.000 | 10/01/35 | 164,509 | |||||||||||
| 98,464 | 6.000 | 11/01/35 | 111,392 | |||||||||||
| 6,577 | 5.500 | 12/01/35 | 7,420 | |||||||||||
| 313 | 5.500 | 02/01/36 | 350 | |||||||||||
| 63,113 | 6.000 | 03/01/36 | 71,239 | |||||||||||
| 8,743 | 5.500 | 04/01/36 | 9,776 | |||||||||||
| 134,041 | 6.000 | 04/01/36 | 151,300 | |||||||||||
| 68,147 | 5.500 | 09/01/36 | 76,565 | |||||||||||
| 1,042 | 5.500 | 02/01/37 | 1,165 | |||||||||||
| 28,401 | 5.500 | 04/01/37 | 31,812 | |||||||||||
| 1,635 | 5.500 | 05/01/37 | 1,826 | |||||||||||
| 679 | 5.500 | 06/01/37 | 758 | |||||||||||
| 1,776,958 | 5.500 | 08/01/37 | 1,987,052 | |||||||||||
| 505,594 | 6.000 | 10/01/37 | 570,689 | |||||||||||
| 360,740 | 7.500 | 11/01/37 | 397,658 | |||||||||||
| 373 | 5.500 | 12/01/37 | 416 | |||||||||||
| 234,335 | 6.000 | 12/01/37 | 264,473 | |||||||||||
| 24,959 | 5.500 | 02/01/38 | 27,908 | |||||||||||
| 12,110 | 5.500 | 03/01/38 | 13,530 | |||||||||||
| 18,421 | 6.000 | 03/01/38 | 20,791 | |||||||||||
| 38,014 | 5.500 | 04/01/38 | 42,583 | |||||||||||
| 935,256 | 6.000 | 04/01/38 | 1,055,611 | |||||||||||
| 12,374 | 5.500 | 05/01/38 | 13,857 | |||||||||||
| 500,097 | 6.000 | 05/01/38 | 564,414 | |||||||||||
| 2,603 | 5.500 | 06/01/38 | 2,908 | |||||||||||
| 3,494 | 5.500 | 07/01/38 | 3,904 | |||||||||||
| 2,898 | 5.500 | 08/01/38 | 3,238 | |||||||||||
| 3,029 | 5.500 | 09/01/38 | 3,385 | |||||||||||
| 709,125 | 6.000 | 09/01/38 | 800,381 | |||||||||||
| 148,006 | 6.000 | 11/01/38 | 167,040 | |||||||||||
| 1,013 | 5.500 | 12/01/38 | 1,132 | |||||||||||
| 14,448 | 5.500 | 02/01/39 | 16,175 | |||||||||||
| 634,195 | 7.000 | 03/01/39 | 718,906 | |||||||||||
| 20,033 | 4.500 | 05/01/39 | 21,829 | |||||||||||
| 12,808 | 5.500 | 06/01/39 | 14,252 | |||||||||||
| 11,353 | 4.000 | 08/01/39 | 11,973 | |||||||||||
| 55,263 | 4.500 | 08/01/39 | 60,217 | |||||||||||
| 339,462 | 6.000 | 09/01/39 | 383,119 | |||||||||||
| 112,931 | 6.000 | 10/01/39 | 127,487 | |||||||||||
| 11,539 | 5.500 | 11/01/39 | 12,840 | |||||||||||
| 864,873 | 4.500 | 12/01/39 | 942,407 | |||||||||||
| 781,458 | 5.500 | 12/01/39 | 873,188 | |||||||||||
| 606,336 | 5.000 | 07/01/40 | 669,943 | |||||||||||
| 233,468 | 6.000 | 07/01/40 | 263,493 | |||||||||||
|
| |||||||||||||
| 48 | The accompanying notes are an integral part of these financial statements. |
GOLDMAN SACHS GOVERNMENT INCOME FUND
Principal Amount | Interest Rate | Maturity Date | Value | |||||||||||
| Mortgage-Backed Obligations – (continued) | ||||||||||||||
| FNMA – (continued) | ||||||||||||||
| $ | 515,891 | 6.000 | % | 10/01/40 | $ | 582,238 | ||||||||
| 1,468,628 | 6.000 | 05/01/41 | 1,657,504 | |||||||||||
| 69,291 | 6.000 | 06/01/41 | 78,202 | |||||||||||
| 297,031 | 5.000 | 07/01/41 | 328,219 | |||||||||||
| 326,395 | 4.500 | 08/01/41 | 352,851 | |||||||||||
| 84,386 | 4.500 | 10/01/41 | 91,187 | |||||||||||
| 314,228 | 5.000 | 10/01/41 | 347,222 | |||||||||||
| 614,206 | 5.000 | 04/01/42 | 678,697 | |||||||||||
| 137,109 | 3.000 | 05/01/42 | 135,589 | |||||||||||
| 157,785 | 3.000 | 06/01/42 | 156,036 | |||||||||||
| 1,166,003 | 3.000 | 08/01/42 | 1,158,710 | |||||||||||
| 1,062,550 | 3.000 | 09/01/42 | 1,055,962 | |||||||||||
| 141,231 | 3.000 | 10/01/42 | 140,365 | |||||||||||
| 752,393 | 3.000 | 11/01/42 | 747,568 | |||||||||||
| 6,594,679 | 3.000 | 12/01/42 | 6,550,006 | |||||||||||
| 806,145 | 2.500 | 01/01/43 | 764,976 | |||||||||||
| 5,337,531 | 3.000 | 01/01/43 | 5,302,777 | |||||||||||
| 2,233,464 | 3.000 | 02/01/43 | 2,217,659 | |||||||||||
| 1,027,624 | 2.500 | 03/01/43 | 975,145 | |||||||||||
| 1,221,766 | 3.000 | 03/01/43 | 1,213,922 | |||||||||||
| 1,722,177 | 3.000 | 04/01/43 | 1,710,506 | |||||||||||
| 1,006,243 | 3.000 | 05/01/43 | 999,915 | |||||||||||
| 179,288 | 3.000 | 06/01/43 | 178,077 | |||||||||||
| 1,559,753 | 3.000 | 07/01/43 | 1,548,725 | |||||||||||
| 23,000,000 | 3.500 | TBA-30yr | (e) | 23,504,921 | ||||||||||
| 42,000,000 | 4.500 | TBA-30yr | (e) | 45,202,500 | ||||||||||
|
| |||||||||||||
| 138,692,698 | ||||||||||||||
|
| |||||||||||||
| GNMA – 2.9% | ||||||||||||||
| 28 | 9.000 | 08/15/16 | 28 | |||||||||||
| 571,379 | 3.950 | 07/15/25 | 595,670 | |||||||||||
| 126,714 | 7.000 | 12/15/27 | 144,499 | |||||||||||
| 16,298 | 6.500 | 08/15/28 | 18,477 | |||||||||||
| 215,545 | 6.000 | 01/15/29 | 249,988 | |||||||||||
| 240,777 | 7.000 | 10/15/29 | 274,792 | |||||||||||
| 137,406 | 5.500 | 11/15/32 | 156,542 | |||||||||||
| 1,447,232 | 5.500 | 12/15/32 | 1,648,787 | |||||||||||
| 102,219 | 5.500 | 01/15/33 | 116,344 | |||||||||||
| 114,112 | 5.500 | 02/15/33 | 129,881 | |||||||||||
| 118,134 | 5.500 | 03/15/33 | 134,459 | |||||||||||
| 133,719 | 5.500 | 07/15/33 | 152,198 | |||||||||||
| 69,708 | 5.500 | 08/15/33 | 79,341 | |||||||||||
| 55,848 | 5.500 | 09/15/33 | 63,566 | |||||||||||
| 57,717 | 5.500 | 04/15/34 | 65,637 | |||||||||||
| 85,988 | 5.500 | 05/15/34 | 97,786 | |||||||||||
| 770,605 | 5.500 | 06/15/34 | 876,336 | |||||||||||
| 657,429 | 5.500 | 09/15/34 | 747,632 | |||||||||||
| 509,243 | 5.500 | 12/15/34 | 579,115 | |||||||||||
| 536,830 | 5.500 | 01/15/35 | 605,057 | |||||||||||
| 377,028 | 5.000 | 03/15/38 | 415,387 | |||||||||||
| 2,650 | 5.000 | 11/15/38 | 2,920 | |||||||||||
| 71,201 | 2.500 | 12/20/42 | 69,033 | |||||||||||
|
| |||||||||||||
| Mortgage-Backed Obligations – (continued) | ||||||||||||||
| $ | 4,000,000 | 3.500 | % | TBA-30yr | (e) | $ | 4,135,000 | |||||||
| 2,000,000 | 5.000 | TBA-30yr | (e) | 2,200,625 | ||||||||||
|
| |||||||||||||
| 13,559,100 | ||||||||||||||
|
| |||||||||||||
| TOTAL FEDERAL AGENCIES | $ | 174,039,085 | ||||||||||||
|
| |||||||||||||
| | TOTAL MORTGAGE-BACKED OBLIGATIONS | | ||||||||||||
| (Cost $212,432,992) | $ | 216,650,621 | ||||||||||||
|
| |||||||||||||
| Agency Debentures – 10.0% | ||||||||||||||
| FFCB |
| ||||||||||||
| $ | 1,500,000 | 1.460 | % | 11/19/19 | $ | 1,448,009 | ||||||||
| FHLB |
| ||||||||||||
| 1,500,000 | 1.530 | 11/21/19 | 1,459,800 | |||||||||||
| 2,200,000 | 1.875 | 03/13/20 | 2,183,956 | |||||||||||
| 2,800,000 | 3.000 | 09/10/21 | 2,887,258 | |||||||||||
| 3,700,000 | 2.125 | 06/09/23 | 3,507,537 | |||||||||||
| 1,900,000 | 3.250 | 06/09/23 | 1,960,525 | |||||||||||
| 2,100,000 | 3.375 | 09/08/23 | 2,197,387 | |||||||||||
| 300,000 | 3.375 | 12/08/23 | 312,378 | |||||||||||
| FHLMC |
| ||||||||||||
| 5,100,000 | 5.050 | 01/26/15 | 5,179,346 | |||||||||||
| FNMA |
| ||||||||||||
| 2,200,000 | 0.750 | 12/19/14 | 2,202,999 | |||||||||||
| 2,600,000 | 6.250 | 05/15/29 | 3,511,643 | |||||||||||
| 4,000,000 | 6.625 | 11/15/30 | 5,681,867 | |||||||||||
| New Valley Generation III |
| ||||||||||||
| 2,737,571 | 4.929 | 01/15/21 | 3,069,976 | |||||||||||
| Small Business Administration |
| ||||||||||||
| 21,344 | 7.500 | 04/01/17 | 22,240 | |||||||||||
| 46,162 | 6.300 | 05/01/18 | 48,583 | |||||||||||
| 25,463 | 6.300 | 06/01/18 | 26,677 | |||||||||||
| Tennessee Valley Authority |
| ||||||||||||
| 6,500,000 | 3.875 | 02/15/21 | 7,110,988 | |||||||||||
| Tennessee Valley Authority Series B |
| ||||||||||||
| 4,200,000 | 4.375 | 06/15/15 | 4,324,631 | |||||||||||
|
| |||||||||||||
| TOTAL AGENCY DEBENTURES | ||||||||||||||
| (Cost $46,958,586) | $ | 47,135,800 | ||||||||||||
|
| |||||||||||||
| Asset-Backed Securities(a) – 3.3% | ||||||||||||||
| Student Loan – 3.3% | ||||||||||||||
| Access Group, Inc. Series 2005-2, Class A3 |
| ||||||||||||
| $ | 2,226,572 | 0.415 | % | 11/22/24 | $ | 2,214,437 | ||||||||
| Alaska State Student Loan Corp. Series 2013, Class A |
| ||||||||||||
| 4,622,715 | 0.655 | 08/25/31 | 4,634,827 | |||||||||||
| Education Funding Capital Trust I Series 2004-1, Class A2 |
| ||||||||||||
| 16,202 | 0.394 | 12/15/22 | 16,195 | |||||||||||
| Northstar Education Finance, Inc. Series 2005-1, Class A1 |
| ||||||||||||
| 37,858 | 0.335 | 10/28/26 | 37,710 | |||||||||||
| Scholar Funding Trust Series 2013-A, Class A(d) |
| ||||||||||||
| 4,140,417 | 0.802 | 01/30/45 | 4,135,243 | |||||||||||
|
| |||||||||||||
| The accompanying notes are an integral part of these financial statements. | 49 |
GOLDMAN SACHS GOVERNMENT INCOME FUND
Schedule of Investments (continued)
September 30, 2014 (Unaudited)
Principal Amount | Interest Rate | Maturity Date | Value | |||||||||||
| Asset-Backed Securities(a) – (continued) | ||||||||||||||
| Student Loan – (continued) | ||||||||||||||
| SLM Student Loan Trust Series 2008-5, Class A4 |
| ||||||||||||
| $ | 3,900,000 | 1.934 | % | 07/25/23 | $ | 4,077,019 | ||||||||
| US Education Loan Trust LLC Series 2006-1, Class A2(d) |
| ||||||||||||
| 215,248 | 0.364 | 03/01/25 | 215,003 | |||||||||||
|
| |||||||||||||
| TOTAL ASSET-BACKED SECURITIES | ||||||||||||||
| (Cost $15,260,960) | $ | 15,330,434 | ||||||||||||
|
| |||||||||||||
| Municipal Debt Obligation – 0.5% | ||||||||||||||
| New Jersey – 0.5% | ||||||||||||||
| New Jersey Economic Development Authority Series A (MBIA) |
| ||||||||||||
| $ | 2,000,000 | 7.425 | % | 02/15/29 | $ | 2,559,000 | ||||||||
| (Cost $2,000,000) | ||||||||||||||
|
| |||||||||||||
| Government Guarantee Obligations(f) – 1.7% | ||||||||||||||
| Hashemite Kingdom of Jordan Government AID Bond |
| ||||||||||||
| $ | 4,600,000 | 2.503 | % | 10/30/20 | $ | 4,692,000 | ||||||||
| Israel Government AID Bond |
| ||||||||||||
| 1,400,000 | 5.500 | 09/18/23 | 1,704,857 | |||||||||||
| 500,000 | 5.500 | 12/04/23 | 609,198 | |||||||||||
| 700,000 | 5.500 | 04/26/24 | 854,909 | |||||||||||
|
| |||||||||||||
| | TOTAL GOVERNMENT GUARANTEE OBLIGATIONS | | ||||||||||||
| (Cost $7,883,969) | $ | 7,860,964 | ||||||||||||
|
| |||||||||||||
| U.S. Treasury Obligations – 50.3% | ||||||||||||||
| United States Treasury Bonds |
| ||||||||||||
| $ | 650,000 | 2.750 | % | 11/15/42 | $ | 594,633 | ||||||||
| 10,010,000 | 3.625 | (g) | 08/15/43 | 10,819,709 | ||||||||||
| 2,900,000 | 3.750 | (g) | 11/15/43 | 3,205,109 | ||||||||||
| 5,500,000 | 3.625 | 02/15/44 | 5,944,125 | |||||||||||
| 5,200,000 | 3.375 | 05/15/44 | 5,368,064 | |||||||||||
| United States Treasury Inflation Protected Securities |
| ||||||||||||
| 3,052,714 | 0.125 | 01/15/22 | 2,983,539 | |||||||||||
| 3,093,933 | 0.625 | 01/15/24 | 3,111,321 | |||||||||||
| 1,220,670 | 2.500 | 01/15/29 | 1,491,512 | |||||||||||
| 1,380,092 | 1.375 | 02/15/44 | 1,477,347 | |||||||||||
| United States Treasury Notes |
| ||||||||||||
| 39,900,000 | 0.375 | 01/31/16 | 39,957,854 | |||||||||||
| 78,800,000 | 0.375 | (g) | 02/15/16 | 78,904,806 | ||||||||||
| 5,400,000 | 0.750 | 01/15/17 | 5,396,760 | |||||||||||
| 2,700,000 | 0.875 | 04/15/17 | 2,699,973 | |||||||||||
| 5,200,000 | 0.875 | 08/15/17 | 5,174,988 | |||||||||||
| 13,800,000 | 1.500 | 01/31/19 | 13,714,578 | |||||||||||
| 5,700,000 | 1.625 | 03/31/19 | 5,683,812 | |||||||||||
| 2,500,000 | 1.625 | 04/30/19 | 2,490,600 | |||||||||||
| 3,800,000 | 1.625 | 06/30/19 | 3,779,898 | |||||||||||
| 9,800,000 | 1.625 | 08/31/19 | 9,733,164 | |||||||||||
| 10,700,000 | 1.750 | 09/30/19 | 10,684,485 | |||||||||||
| 6,200,000 | 2.125 | 01/31/21 | 6,199,256 | |||||||||||
| 11,100,000 | 2.250 | 04/30/21 | 11,154,501 | |||||||||||
|
| |||||||||||||
| U.S. Treasury Obligations – 50.3% | ||||||||||||||
| United States Treasury Notes – (continued) | ||||||||||||||
| $ | 1,000,000 | 2.500 | % | 05/15/24 | $ | 1,000,610 | ||||||||
| 5,500,000 | 2.375 | 08/15/24 | 5,435,980 | |||||||||||
|
| |||||||||||||
| TOTAL U.S. TREASURY OBLIGATIONS | ||||||||||||||
| (Cost $234,748,011) | $ | 237,006,624 | ||||||||||||
|
| |||||||||||||
Notional Amount | Exercise Rate | Expiration Date | Value | |||||||||||
| Options Purchased – 0.3% | ||||||||||||||
| Interest Rate Swaptions | ||||||||||||||
| Bank of America NA Put – OTC – 30 year Interest Rate Swap | | ||||||||||||
| $ | 1,100,000 | 3.950 | % | 01/29/16 | $ | 147,884 | ||||||||
| Bank of America NA Call – OTC – 30 year Interest Rate Swap | | ||||||||||||
| 1,100,000 | 3.950 | 01/29/16 | 29,002 | |||||||||||
| Deutsche Bank AG Put – OTC – 5 year Interest Rate Swap Strike | | ||||||||||||
| 1,700,000 | 2.550 | 09/28/15 | 27,597 | |||||||||||
| Deutsche Bank AG Call – OTC – 5 year Interest Rate Swap Strike | | ||||||||||||
| 1,700,000 | 2.550 | 09/28/15 | 25,983 | |||||||||||
| Deutsche Bank AG Put – OTC – 5 year Interest Rate Swap Strike | | ||||||||||||
| 2,000,000 | 2.940 | 09/29/16 | 45,627 | |||||||||||
| Deutsche Bank AG Call – OTC – 5 year Interest Rate Swap Strike | | ||||||||||||
| 2,000,000 | 2.940 | 09/29/16 | 47,832 | |||||||||||
| Deutsche Bank AG Put – OTC – 10 year Interest Rate Swap | | ||||||||||||
| 2,200,000 | 3.408 | 09/19/16 | 104,482 | |||||||||||
| Deutsche Bank AG Call – OTC – 10 year Interest Rate Swap | | ||||||||||||
| 2,200,000 | 3.408 | 09/19/16 | 76,773 | |||||||||||
| Deutsche Bank AG Put – OTC – 10 year Interest Rate Swap | | ||||||||||||
| 3,300,000 | 4.135 | 04/17/19 | 277,973 | |||||||||||
| Deutsche Bank AG Call – OTC – 10 year Interest Rate Swap | | ||||||||||||
| 3,300,000 | 4.135 | 04/17/19 | 128,608 | |||||||||||
| JPMorgan Securities, Inc. Call – OTC – 5 year Interest Rate Swap | | ||||||||||||
| 2,600,000 | 2.783 | 09/30/15 | 28,925 | |||||||||||
| JPMorgan Securities, Inc. Put – OTC – 5 year Interest Rate Swap | | ||||||||||||
| 2,800,000 | 2.973 | 09/26/16 | 66,226 | |||||||||||
| JPMorgan Securities, Inc. Call – OTC – 5 year Interest Rate Swap | | ||||||||||||
| 2,800,000 | 2.973 | 09/26/16 | 64,485 | |||||||||||
| JPMorgan Securities, Inc. Put – OTC – 5 year Interest Rate Swap | | ||||||||||||
| 2,000,000 | 3.000 | 09/22/16 | 48,689 | |||||||||||
|
| |||||||||||||
| 50 | The accompanying notes are an integral part of these financial statements. |
GOLDMAN SACHS GOVERNMENT INCOME FUND
Notional Amount | Exercise Rate | Expiration Date | Value | |||||||||||
| Options Purchased – (continued) | ||||||||||||||
| Interest Rate Swaptions – (continued) | ||||||||||||||
| JPMorgan Securities, Inc. Call – OTC – 5 year Interest Rate Swap | | ||||||||||||
| $ | 2,000,000 | 3.000 | % | 09/22/16 | $ | 44,780 | ||||||||
| Morgan Stanley Capital Services, Inc. Put – OTC – 5 year Interest | | ||||||||||||
| 2,200,000 | 2.950 | 09/26/16 | 50,799 | |||||||||||
| Morgan Stanley Capital Services, Inc. Call – OTC – 5 year | | ||||||||||||
| 2,200,000 | 2.950 | 09/26/16 | 51,712 | |||||||||||
| Morgan Stanley Capital Services, Inc. Call – OTC – 7 year | | ||||||||||||
| 2,000,000 | 3.010 | 09/29/15 | 29,841 | |||||||||||
|
| |||||||||||||
| TOTAL OPTIONS PURCHASED – 0.3% | ||||||||||||||
| (Cost $1,267,085) | $ | 1,297,218 | ||||||||||||
|
| |||||||||||||
| | TOTAL INVESTMENTS BEFORE SHORT-TERM INVESTMENT | | ||||||||||||
| (Cost $520,551,603) | $ | 527,840,661 | ||||||||||||
|
| |||||||||||||
Principal Amount | Interest Rate | Maturity Date | Value | |||||||||||
| Short-term Investment(h) – 1.1% | ||||||||||||||
| Repurchase Agreement – 1.1% | ||||||||||||||
| Joint Repurchase Agreement Account II |
| ||||||||||||
| $ | 5,100,000 | 0.012 | % | 10/01/14 | $ | 5,100,000 | ||||||||
| (Cost $5,100,000) | ||||||||||||||
|
| |||||||||||||
| TOTAL INVESTMENTS – 113.2% | ||||||||||||||
| (Cost $525,651,603) | $ | 532,940,661 | ||||||||||||
|
| |||||||||||||
| | LIABILITIES IN EXCESS OF OTHER ASSETS – (13.2)% | | (62,078,882 | ) | ||||||||||
|
| |||||||||||||
| NET ASSETS – 100.0% | $ | 470,861,779 | ||||||||||||
|
| |||||||||||||
| The percentage shown for each investment category reflects the value of investments in that category as a percentage of net assets. | ||
(a) | Variable rate security. Interest rate or distribution rate disclosed is that which is in effect at September 30, 2014. | |
(b) | Security with a notional or nominal principal amount. The actual effective yield of this security is different than the stated interest rate. | |
(c) | Issued with a zero coupon. Income is recognized through the accretion of discount. | |
(d) | Exempt from registration under Rule 144A of the Securities Act of 1933. Under procedures approved by the Board of Trustees, such securities have been determined to be liquid by the investment adviser and may be resold, normally to qualified institutional buyers in transactions exempt from registration. Total market value of Rule 144A securities amounts to $4,547,502, which represents approximately 1.0% of net assets as of September 30, 2014. | |
(e) | TBA (To Be Announced) Securities are purchased on a forward commitment basis with an approximate principal amount and no defined maturity date. The actual principal and maturity date will be determined upon settlement when the specific mortgage pools are assigned. Total market value of TBA securities (excluding forward sales contracts, if any) amounts to $75,043,046 which represents approximately 15.9% of net assets as of September 30, 2014. | |
(f) | Guaranteed by the United States Government until maturity. Total market value for these securities amounts to $7,860,964, which represents approximately 1.7% of net assets as of September 30, 2014. | |
(g) | A portion of this security is segregated as collateral for initial margin requirements on futures transactions. | |
(h) | Joint repurchase agreement was entered into on September 30, 2014. Additional information appears on page 87. | |
| ||
Investment Abbreviations: | ||
FDIC | —Federal Deposit Insurance Corp. | |
FFCB | —Federal Farm Credit Bank | |
FHLB | —Federal Home Loan Bank | |
FHLMC | —Federal Home Loan Mortgage Corp. | |
FNMA | —Federal National Mortgage Association | |
GNMA | —Government National Mortgage Association | |
LIBOR | —London Interbank Offered Rate | |
MBIA | —Insured by Municipal Bond Investors Insurance | |
NCUA | —National Credit Union Administration | |
OTC | —Over the Counter | |
REMIC | —Real Estate Mortgage Investment Conduit | |
STRIPS | —Separate Trading of Registered Interest and Principal of Securities | |
| ||
| The accompanying notes are an integral part of these financial statements. | 51 |
GOLDMAN SACHS GOVERNMENT INCOME FUND
Schedule of Investments (continued)
September 30, 2014 (Unaudited)
| ADDITIONAL INVESTMENT INFORMATION |
FORWARD SALES CONTRACTS — At September 30, 2014, the Fund had the following forward sales contracts:
| Description | Interest Rate | Maturity Date(e) | Settlement Date | Principal Amount | Value | |||||||||||
FNMA (Proceeds Receivable: $6,836,719) | 3.000% | TBA-30yr | 10/14/14 | $ | (7,000,000 | ) | $ | (6,898,828 | ) | |||||||
FUTURES CONTRACTS — At September 30, 2014, the Fund had the following futures contracts:
| Type | Number of Long (Short) | Expiration Date | Current Value | Unrealized Gain (Loss) | ||||||||||
Eurodollars | (241 | ) | March 2017 | $ | (58,788,938 | ) | $ | 76,578 | ||||||
Eurodollars | (188 | ) | June 2017 | (45,770,950 | ) | 73,067 | ||||||||
Eurodollars | (108 | ) | September 2017 | (26,253,450 | ) | 56,238 | ||||||||
Ultra Long U.S. Treasury Bonds | (28 | ) | December 2014 | (4,270,000 | ) | 66,882 | ||||||||
2 Year U.S. Treasury Notes | 114 | December 2014 | 24,948,188 | (5,801 | ) | |||||||||
5 Year U.S. Treasury Notes | 25 | December 2014 | 2,956,445 | 3,323 | ||||||||||
10 Year U.S. Treasury Notes | (242 | ) | December 2014 | (30,163,031 | ) | (85,173 | ) | |||||||
20 Year U.S. Treasury Bonds | 47 | December 2014 | 6,481,594 | (11,683 | ) | |||||||||
| TOTAL | $ | 173,431 | ||||||||||||
SWAP CONTRACTS — At September 30, 2014, the Fund had the following swap contracts:
CENTRALLY CLEARED INTEREST RATE SWAP CONTRACTS
| Rates Exchanged | Market Value | |||||||||||||||
| Notional Amount (000s)(a) | Termination Date | Payments Received | Payments Made | Upfront Made (Received) | Unrealized Gain (Loss) | |||||||||||
| $ | 1,500 | 02/01/17 | 3 month LIBOR | 1.625% | $ | (369 | ) | $ | 811 | |||||||
| 4,900 | 08/04/17 | 3 month LIBOR | 2.195 | (5,217 | ) | 3,611 | ||||||||||
| 11,000 | 12/17/19 | 3 month LIBOR | 2.250 | (98,372 | ) | 3,782 | ||||||||||
| 1,000 | 10/02/20 | 2.533% | 3 month LIBOR | 5 | — | |||||||||||
| 7,400 | 08/04/21 | 3.025 | 3 month LIBOR | 33,771 | 6,471 | |||||||||||
| 900 | 10/01/22 | 2.760 | 3 month LIBOR | 7 | (822 | ) | ||||||||||
| 4,000 | 01/30/24 | 4.252 | 3 month LIBOR | 4,698 | 143,170 | |||||||||||
| 4,000 | 08/04/26 | 3 month LIBOR | 3.409 | (31,486 | ) | (29,048 | ) | |||||||||
| 7,000 | 12/17/29 | 3 month LIBOR | 3.250 | (152,884 | ) | (55,208 | ) | |||||||||
| 1,300 | 01/30/39 | 3 month LIBOR | 4.370 | (37,980 | ) | (99,132 | ) | |||||||||
|
| |||||||||||||||
| TOTAL | $ | (287,827 | ) | $ | (26,365 | ) | ||||||||||
|
| |||||||||||||||
| (a) | Represents forward starting interest rate swaps whose effective dates of commencement of accruals and cash flows occur subsequent to September 30, 2014. |
| 52 | The accompanying notes are an integral part of these financial statements. |
GOLDMAN SACHS HIGH QUALITY FLOATING RATE FUND
Schedule of Investments
September 30, 2014 (Unaudited)
Principal Amount | Interest Rate | Maturity Date | Value | |||||||||||
| Corporate Obligations(a) – 0.2% | ||||||||||||||
| Banks – 0.2% | ||||||||||||||
| DnB Boligkreditt AS |
| ||||||||||||
| $ | 800,000 | 1.450 | % | 03/21/18 | $ | 792,622 | ||||||||
|
| |||||||||||||
| Mortgage-Backed Obligations – 30.5% | ||||||||||||||
| Collateralized Mortgage Obligations – 20.7% | ||||||||||||||
| Interest Only(b) – 0.0% | ||||||||||||||
| FNMA REMIC Series 1990-145, Class B |
| ||||||||||||
| $ | 416 | 1,004.961 | % | 12/25/20 | $ | 4,675 | ||||||||
|
| |||||||||||||
| Regular Floater(c) – 13.2% | ||||||||||||||
| Collateralized Mortgage Securities Corp. Series N, Class 2 |
| ||||||||||||
| 17,495 | 0.835 | 08/25/17 | 17,518 | |||||||||||
| FDIC Structured Sale Guaranteed Notes Series 2010-S1, | | ||||||||||||
| 590,990 | 0.703 | 02/25/48 | 591,768 | |||||||||||
| FHLMC REMIC Series 1826, Class F |
| ||||||||||||
| 44,233 | 0.554 | 09/15/21 | 44,259 | |||||||||||
| FHLMC REMIC Series 3208, Class FD |
| ||||||||||||
| 2,718,176 | 0.554 | 08/15/36 | 2,727,603 | |||||||||||
| FHLMC REMIC Series 3208, Class FE |
| ||||||||||||
| 4,652,734 | 0.554 | 08/15/36 | 4,668,870 | |||||||||||
| FHLMC REMIC Series 3208, Class FG |
| ||||||||||||
| 2,644,712 | 0.554 | 08/15/36 | 2,653,884 | |||||||||||
| FHLMC REMIC Series 3371, Class FA |
| ||||||||||||
| 898,023 | 0.754 | 09/15/37 | 907,996 | |||||||||||
| FHLMC REMIC Series 3374, Class FT |
| ||||||||||||
| 912,829 | 0.454 | 04/15/37 | 911,399 | |||||||||||
| FHLMC REMIC Series 3471, Class FB |
| ||||||||||||
| 4,129,957 | 1.154 | 08/15/35 | 4,224,112 | |||||||||||
| FHLMC REMIC Series 3545, Class FA |
| ||||||||||||
| 1,412,010 | 1.004 | 06/15/39 | 1,432,471 | |||||||||||
| FHLMC REMIC Series 3588, Class CW |
| ||||||||||||
| 3,594,412 | 2.504 | 10/15/37 | 3,752,418 | |||||||||||
| FHLMC REMIC Series 4039, Class FA |
| ||||||||||||
| 5,764,284 | 0.654 | 05/15/42 | 5,816,291 | |||||||||||
| FHLMC STRIPS Series 237, Class F23 |
| ||||||||||||
| 796,686 | 0.554 | 05/15/36 | 799,306 | |||||||||||
| FNMA REMIC Series 1990-145, Class A |
| ||||||||||||
| 169,343 | 1.105 | 12/25/20 | 170,188 | |||||||||||
| FNMA REMIC Series 06-72, Class XF |
| ||||||||||||
| 1,667,791 | 0.655 | 08/25/36 | 1,675,282 | |||||||||||
| FNMA REMIC Series 09-75, Class MF |
| ||||||||||||
| 2,137,629 | 1.305 | 09/25/39 | 2,175,039 | |||||||||||
| FNMA REMIC Series 1997-20, Class F |
| ||||||||||||
| 359,977 | 0.631 | 03/25/27 | 355,693 | |||||||||||
| FNMA REMIC Series 1998-66, Class FC |
| ||||||||||||
| 101,796 | 0.654 | 11/17/28 | 102,537 | |||||||||||
| FNMA REMIC Series 2007-33, Class HF |
| ||||||||||||
| 110,566 | 0.505 | 04/25/37 | 111,066 | |||||||||||
| FNMA REMIC Series 2007-92, Class OF |
| ||||||||||||
| 839,061 | 0.725 | 09/25/37 | 844,993 | |||||||||||
| FNMA REMIC Series 2008-22, Class FD |
| ||||||||||||
| 1,472,076 | 0.995 | 04/25/48 | 1,489,351 | |||||||||||
| FNMA REMIC Series 2010-123, Class FL |
| ||||||||||||
| 5,597,316 | 0.585 | 11/25/40 | 5,606,769 | |||||||||||
|
| |||||||||||||
| Mortgage-Backed Obligations – (continued) | ||||||||||||||
| Regular Floater(c) – (continued) | ||||||||||||||
| FNMA REMIC Series 2011-110, Class FE |
| ||||||||||||
| $ | 5,737,016 | 0.555 | % | 04/25/41 | $ | 5,747,512 | ||||||||
| FNMA REMIC Series 2012-56, Class FG |
| ||||||||||||
| 4,799,442 | 0.655 | 03/25/39 | 4,827,473 | |||||||||||
| GNMA REMIC Series 2010-53, Class FC |
| ||||||||||||
| 1,919,313 | 0.974 | 04/20/40 | 1,955,743 | |||||||||||
| GNMA REMIC Series 2012-12, Class HF |
| ||||||||||||
| 2,260,448 | 0.554 | 01/20/42 | 2,272,064 | |||||||||||
| NCUA Guaranteed Notes Series 2010-A1, Class A |
| ||||||||||||
| 479,663 | 0.504 | 12/07/20 | 480,557 | |||||||||||
| NCUA Guaranteed Notes Series 2011-R1, Class 1A |
| ||||||||||||
| 844,772 | 0.606 | 01/08/20 | 849,260 | |||||||||||
| NCUA Guaranteed Notes Series 2011-R2, Class 1A |
| ||||||||||||
| 2,478,304 | 0.556 | 02/06/20 | 2,486,243 | |||||||||||
| NCUA Guaranteed Notes Series 2011-R3, Class 1A |
| ||||||||||||
| 2,347,822 | 0.554 | 03/11/20 | 2,355,342 | |||||||||||
| NCUA Guaranteed Notes Series 2011-R4, Class 1A |
| ||||||||||||
| 2,681,534 | 0.536 | 03/06/20 | 2,687,399 | |||||||||||
| NCUA Guaranteed Notes Series 2011-R5, Class 1A |
| ||||||||||||
| 2,041,189 | 0.537 | 04/06/20 | 2,044,458 | |||||||||||
|
| |||||||||||||
| 66,784,864 | ||||||||||||||
|
| |||||||||||||
| Sequential Fixed Rate – 0.4% | ||||||||||||||
| FHLMC REMIC Series 4248, Class LM |
| ||||||||||||
| 1,598,393 | 6.500 | 05/15/41 | 1,838,013 | |||||||||||
| NCUA Guaranteed Notes Series 2010-R1, Class 2A |
| ||||||||||||
| 75,364 | 1.840 | 10/07/20 | 75,685 | |||||||||||
|
| |||||||||||||
| 1,913,698 | ||||||||||||||
|
| |||||||||||||
| Sequential Floating Rate(c) – 7.1% | ||||||||||||||
| FHLMC Multifamily Structured Pass Through Certificates, | | ||||||||||||
| 8,798,927 | 0.535 | 07/25/20 | 8,830,775 | |||||||||||
| FHLMC Multifamily Structured Pass Through Certificates, | | ||||||||||||
| 6,780,625 | 0.495 | 01/25/21 | 6,776,861 | |||||||||||
| FHLMC Multifamily Structured Pass Through Certificates, | | ||||||||||||
| 7,967,182 | 0.536 | 08/25/23 | 7,967,182 | |||||||||||
| FNMA ACES Series 2013-M11, Class FA |
| ||||||||||||
| 2,723,938 | 0.485 | 01/25/18 | 2,727,638 | |||||||||||
| FNMA ACES Series 2014-M5, Class FA |
| ||||||||||||
| 2,077,681 | 0.523 | 01/25/17 | 2,080,553 | |||||||||||
| Granite Master Issuer PLC Series 2006-3, Class A4 |
| ||||||||||||
| 5,820,501 | 0.234 | 12/20/54 | 5,790,816 | |||||||||||
| Granite Master Issuer PLC Series 2007-1, Class 2A1 |
| ||||||||||||
| 315,688 | 0.294 | 12/20/54 | 314,231 | |||||||||||
| Granite Master Issuer PLC Series 2007-1, Class 3A1 |
| ||||||||||||
| 315,688 | 0.354 | 12/20/54 | 314,439 | |||||||||||
|
| |||||||||||||
| The accompanying notes are an integral part of these financial statements. | 53 |
GOLDMAN SACHS HIGH QUALITY FLOATING RATE FUND
Schedule of Investments (continued)
September 30, 2014 (Unaudited)
Principal Amount | Interest Rate | Maturity Date | Value | |||||||||||
| Mortgage-Backed Obligations – (continued) | ||||||||||||||
| Sequential Floating Rate(c) – (continued) | ||||||||||||||
| Leek Finance PLC Series 2017A, Class A2B(a) |
| ||||||||||||
| $ | 385,644 | 0.513 | % | 12/21/37 | $ | 405,852 | ||||||||
| Leek Finance PLC Series 2018X, Class A2B |
| ||||||||||||
| 440,874 | 0.490 | 09/21/38 | �� | 460,266 | ||||||||||
|
| |||||||||||||
| 35,668,613 | ||||||||||||||
|
| |||||||||||||
|
| TOTAL COLLATERALIZED MORTGAGE OBLIGATIONS |
| $ | 104,371,850 | ||||||||||
|
| |||||||||||||
| Commercial Mortgage-Backed Securities(a)(c) – 2.5% | ||||||||||||||
| Sequential Floating Rate – 2.5% | ||||||||||||||
| Boca Hotel Portfolio Trust Series 2013-BOCA, Class A |
| ||||||||||||
| 517,828 | 1.304 | 08/15/26 | 518,176 | |||||||||||
| Commercial Mortgage Pass Through Certificates | | ||||||||||||
| 4,700,000 | 1.054 | 06/11/27 | 4,704,592 | |||||||||||
| Extended Stay America Trust Series 2013-ESFL, Class A2FL |
| ||||||||||||
| 1,400,000 | 0.856 | 12/05/31 | 1,397,038 | |||||||||||
| JPMorgan Chase Commercial Mortgage Securities Trust | | ||||||||||||
| 900,000 | 0.934 | 04/15/30 | 899,422 | |||||||||||
| JPMorgan Chase Commercial Mortgage Securities Trust | | ||||||||||||
| 5,300,000 | 1.104 | 12/15/28 | 5,299,999 | |||||||||||
|
| |||||||||||||
| | TOTAL COMMERCIAL MORTGAGE-BACKED SECURITIES | | $ | 12,819,227 | ||||||||||
|
| |||||||||||||
| Federal Agencies – 7.3% | ||||||||||||||
| Adjustable Rate FHLMC(c) – 2.5% | ||||||||||||||
| 22,030 | 1.951 | 08/01/16 | 22,168 | |||||||||||
| 29,291 | 2.936 | 08/01/18 | 30,002 | |||||||||||
| 17,263 | 2.531 | 11/01/18 | 17,587 | |||||||||||
| 132,917 | 2.715 | 11/01/18 | 134,671 | |||||||||||
| 5,769 | 2.469 | 02/01/19 | 5,877 | |||||||||||
| 23,380 | 1.936 | 03/01/19 | 23,685 | |||||||||||
| 15,159 | 2.915 | 03/01/19 | 15,517 | |||||||||||
| 23,117 | 2.215 | 06/01/19 | 23,534 | |||||||||||
| 7,764 | 2.395 | 07/01/19 | 7,915 | |||||||||||
| 471,222 | 2.790 | 11/01/19 | 483,210 | |||||||||||
| 288,760 | 6.876 | 11/01/19 | 309,513 | |||||||||||
| 23,068 | 2.753 | 01/01/20 | 23,445 | |||||||||||
| 42,818 | 1.932 | 05/01/21 | 43,609 | |||||||||||
| 13,349 | 1.936 | 10/01/26 | 13,516 | |||||||||||
| 550,555 | 3.392 | 08/01/28 | 581,853 | |||||||||||
| 236,035 | 2.387 | 05/01/29 | 244,985 | |||||||||||
| 23,500 | 4.168 | 06/01/29 | 25,543 | |||||||||||
| 42,216 | 1.959 | 04/01/30 | 43,507 | |||||||||||
| 37,260 | 4.359 | 06/01/30 | 40,500 | |||||||||||
| 139,928 | 2.427 | 12/01/30 | 146,584 | |||||||||||
| 34,561 | 2.470 | 02/01/31 | 36,432 | |||||||||||
| 8,916 | 2.280 | 06/01/31 | 9,474 | |||||||||||
| 2,139,516 | 2.360 | 05/01/34 | 2,293,294 | |||||||||||
| 2,108,099 | 2.252 | 05/01/35 | 2,259,618 | |||||||||||
| 238,595 | 3.432 | 05/01/35 | 248,776 | |||||||||||
| 5,092,497 | 2.407 | 01/01/38 | 5,526,128 | |||||||||||
|
| |||||||||||||
| 12,610,943 | ||||||||||||||
|
| |||||||||||||
| Mortgage-Backed Obligations – (continued) | ||||||||||||||
| Adjustable Rate FNMA(c) – 2.9% | ||||||||||||||
| $ | 50,376 | 6.750 | % | 04/01/17 | $ | 52,170 | ||||||||
| 18,830 | 4.258 | 08/01/17 | 19,175 | |||||||||||
| 58,043 | 2.741 | 09/01/17 | 60,337 | |||||||||||
| 5,064 | 2.000 | 12/01/17 | 5,124 | |||||||||||
| 1,814 | 4.875 | 12/01/17 | 1,889 | |||||||||||
| 62,621 | 2.102 | 03/01/18 | 63,392 | |||||||||||
| 30,812 | 2.743 | 03/01/18 | 31,683 | |||||||||||
| 357,201 | 2.111 | 07/01/18 | 361,742 | |||||||||||
| 5,962 | 1.736 | 10/01/18 | 5,976 | |||||||||||
| 16,889 | 1.877 | 10/01/18 | 17,138 | |||||||||||
| 18,814 | 2.677 | 10/01/18 | 19,525 | |||||||||||
| 39,371 | 2.739 | 10/01/18 | 40,711 | |||||||||||
| 56,196 | 1.973 | 01/01/19 | 57,009 | |||||||||||
| 185,622 | 4.004 | 04/01/19 | 194,603 | |||||||||||
| 10,741 | 5.995 | 04/01/19 | 11,360 | |||||||||||
| 104,185 | 1.917 | 05/01/19 | 106,734 | |||||||||||
| 322,140 | 1.968 | 05/01/19 | 327,348 | |||||||||||
| 37,031 | 6.122 | 07/01/19 | 39,390 | |||||||||||
| 130,072 | 4.293 | 08/01/19 | 137,028 | |||||||||||
| 148,942 | 5.849 | 05/01/20 | 158,188 | |||||||||||
| 189,614 | 1.990 | 06/01/20 | 192,632 | |||||||||||
| 13,066 | 6.676 | 02/01/22 | 14,005 | |||||||||||
| 48,264 | 2.468 | 05/20/22 | 53,021 | |||||||||||
| 187,185 | 2.096 | 02/01/23 | 191,711 | |||||||||||
| 257,564 | 2.211 | 01/01/24 | 266,109 | |||||||||||
| 310,526 | 2.269 | 03/01/24 | 321,279 | |||||||||||
| 226,796 | 2.038 | 06/20/24 | 252,911 | |||||||||||
| 10,050 | 3.364 | 08/01/24 | 10,276 | |||||||||||
| 65,717 | 5.082 | 01/01/25 | 70,440 | |||||||||||
| 17,256 | 3.547 | 06/01/27 | 18,240 | |||||||||||
| 11,317 | 4.250 | 12/01/27 | 12,301 | |||||||||||
| 21,374 | 4.502 | 01/01/28 | 23,233 | |||||||||||
| 13,895 | 1.978 | 06/01/29 | 14,293 | |||||||||||
| 15,134 | 2.048 | 06/01/29 | 15,600 | |||||||||||
| 1,829,106 | 2.390 | 07/01/33 | 1,946,622 | |||||||||||
| 570,331 | 2.485 | 11/01/34 | 612,674 | |||||||||||
| 10,793 | 3.794 | 05/01/36 | 11,560 | |||||||||||
| 2,825,130 | 2.513 | 03/01/37 | 3,028,186 | |||||||||||
| 579,916 | 2.351 | 09/01/37 | 605,319 | |||||||||||
| 4,935,070 | 2.293 | 12/01/37 | 5,281,978 | |||||||||||
| 92,472 | 1.518 | 06/01/40 | 95,286 | |||||||||||
| 9,571 | 1.318 | 02/01/41 | 9,815 | |||||||||||
|
| |||||||||||||
| 14,758,013 | ||||||||||||||
|
| |||||||||||||
| Adjustable Rate GNMA(c) – 0.5% | ||||||||||||||
| 1,516,623 | 1.625 | 04/20/33 | 1,569,260 | |||||||||||
| 308,657 | 1.625 | 05/20/33 | 320,497 | |||||||||||
| 582,893 | 1.625 | 08/20/34 | 603,643 | |||||||||||
|
| |||||||||||||
| 2,493,400 | ||||||||||||||
|
| |||||||||||||
| FHLMC – 0.3% | ||||||||||||||
| 58,054 | 8.000 | 12/01/15 | 59,029 | |||||||||||
| 172,571 | 5.500 | 01/01/20 | 184,766 | |||||||||||
| 116,803 | 7.000 | 04/01/21 | 127,309 | |||||||||||
| 53,996 | 7.000 | 08/01/21 | 60,618 | |||||||||||
| 188,890 | 7.000 | 05/01/22 | 214,217 | |||||||||||
|
| |||||||||||||
| 54 | The accompanying notes are an integral part of these financial statements. |
GOLDMAN SACHS HIGH QUALITY FLOATING RATE FUND
Principal Amount | Interest Rate | Maturity Date | Value | |||||||||||
| Mortgage-Backed Obligations – (continued) | ||||||||||||||
| FHLMC – (continued) | ||||||||||||||
| $ | 567,504 | 7.000 | % | 06/01/22 | $ | 627,032 | ||||||||
| 4,212 | 4.500 | 05/01/23 | 4,541 | |||||||||||
|
| |||||||||||||
| 1,277,512 | ||||||||||||||
|
| |||||||||||||
| FNMA – 1.1% | ||||||||||||||
| 11,517 | 8.000 | 01/01/16 | 11,613 | |||||||||||
| 18,789 | 7.000 | 05/01/17 | 19,099 | |||||||||||
| 27,623 | 5.500 | 03/01/18 | 29,290 | |||||||||||
| 66,749 | 5.500 | 04/01/18 | 70,448 | |||||||||||
| 5,598 | 5.000 | 09/01/19 | 5,956 | |||||||||||
| 1,717 | 5.000 | 11/01/19 | 1,823 | |||||||||||
| 9,747 | 5.000 | 01/01/20 | 10,356 | |||||||||||
| 55,485 | 7.000 | 07/01/21 | 62,031 | |||||||||||
| 110,566 | 7.000 | 11/01/21 | 125,326 | |||||||||||
| 51,859 | 7.000 | 12/01/21 | 53,653 | |||||||||||
| 136,618 | 7.000 | 01/01/22 | 145,833 | |||||||||||
| 26,463 | 7.000 | 02/01/22 | 29,697 | |||||||||||
| 103,672 | 7.000 | 01/01/28 | 116,085 | |||||||||||
| 21,495 | 6.500 | 04/01/33 | 24,763 | |||||||||||
| 59,103 | 6.000 | 05/01/38 | 66,704 | |||||||||||
| 74,003 | 6.000 | 11/01/38 | 83,520 | |||||||||||
| 169,730 | 6.000 | 09/01/39 | 191,560 | |||||||||||
| 56,465 | 6.000 | 10/01/39 | 63,744 | |||||||||||
| 42,292 | 6.000 | 10/01/40 | 47,731 | |||||||||||
| 61,216 | 6.000 | 05/01/41 | 69,089 | |||||||||||
| 333,576 | 3.000 | 08/01/42 | 331,525 | |||||||||||
| 287,210 | 3.000 | 09/01/42 | 285,449 | |||||||||||
| 128,372 | 3.000 | 11/01/42 | 127,532 | |||||||||||
| 1,791,168 | 3.000 | 12/01/42 | 1,778,984 | |||||||||||
| 1,297,686 | 3.000 | 01/01/43 | 1,289,114 | |||||||||||
| 400,791 | 3.000 | 02/01/43 | 397,844 | |||||||||||
| 102,700 | 3.000 | 03/01/43 | 102,006 | |||||||||||
| 244,383 | 3.000 | 04/01/43 | 242,587 | |||||||||||
|
| |||||||||||||
| 5,783,362 | ||||||||||||||
|
| |||||||||||||
| GNMA – 0.0% | ||||||||||||||
| 42,093 | 7.000 | 04/15/26 | 47,566 | |||||||||||
|
| |||||||||||||
| TOTAL FEDERAL AGENCIES | $ | 36,970,796 | ||||||||||||
|
| |||||||||||||
| TOTAL MORTGAGE-BACKED OBLIGATIONS | ||||||||||||||
| (Cost $153,510,971) | $ | 154,161,873 | ||||||||||||
|
| |||||||||||||
| Agency Debentures – 15.8% | ||||||||||||||
| FHLB | ||||||||||||||
| $ | 16,000,000 | 0.000 | %(e) | 11/19/14 | $ | 15,999,712 | ||||||||
| 24,000,000 | 0.000 | (e) | 12/17/14 | 23,999,232 | ||||||||||
| 40,000,000 | 0.102 | (c) | 02/03/15 | 40,002,840 | ||||||||||
|
| |||||||||||||
| TOTAL AGENCY DEBENTURES | ||||||||||||||
| (Cost $79,996,045) | $ | 80,001,784 | ||||||||||||
|
| |||||||||||||
| Asset-Backed Securities – 28.5% | ||||||||||||||
| Auto(c) – 0.5% | ||||||||||||||
| Ford Credit Floorplan Master Owner Trust Series 2013-1, | | ||||||||||||
| $ | 2,500,000 | 0.534 | % | 01/15/18 | $ | 2,505,133 | ||||||||
|
| |||||||||||||
| Collateralized Loan Obligations(c) – 8.0% | ||||||||||||||
| ACIS CLO Ltd. Series 2013-1A, Class A1(a) |
| ||||||||||||
| 1,150,000 | 1.104 | 04/18/24 | 1,119,571 | |||||||||||
| ACIS CLO Ltd. Series 2013-2A, Class A(a) |
| ||||||||||||
| 2,400,000 | 0.734 | 10/14/22 | 2,350,824 | |||||||||||
| Atrium X Series 2010-A, Class A(a) |
| ||||||||||||
| 2,750,000 | 1.353 | 07/16/25 | 2,704,072 | |||||||||||
| Black Diamond CLO Ltd. Series 2005-1A, Class A1(a) |
| ||||||||||||
| 254,884 | 0.503 | 06/20/17 | 254,667 | |||||||||||
| Black Diamond CLO Ltd. Series 2006-1A, Class AD(a) |
| ||||||||||||
| 1,449,174 | 0.484 | 04/29/19 | 1,424,732 | |||||||||||
| Brentwood CLO Corp. Series 2006-1A, Class A1A(a) |
| ||||||||||||
| 2,178,256 | 0.510 | 02/01/22 | 2,157,961 | |||||||||||
| Brentwood CLO Corp. Series 2006-1A, Class A1B(a) |
| ||||||||||||
| 1,726,165 | 0.510 | 02/01/22 | 1,706,611 | |||||||||||
| Crown Point CLO Ltd. Series 2012-1A, Class A1LA(a) |
| ||||||||||||
| 700,000 | 0.982 | 11/21/22 | 688,974 | |||||||||||
| Crown Point CLO Ltd. Series 2013-2A, Class A1L |
| ||||||||||||
| 2,850,000 | 1.204 | 12/14/23 | 2,791,187 | |||||||||||
| Dryden XXVI Senior Loan Fund Series 2013-26A, Class A(a) |
| ||||||||||||
| 1,800,000 | 1.334 | 07/15/25 | 1,773,954 | |||||||||||
| Gleneagles CLO Ltd. Series 2005-1A, Class A1(a) |
| ||||||||||||
| 624,645 | 0.515 | 11/01/17 | 623,896 | |||||||||||
| Goldentree Loan Opportunities V Ltd. Series 2007-5A, Class A(a) |
| ||||||||||||
| 603,800 | 0.929 | 10/18/21 | 603,088 | |||||||||||
| ICG US CLO Ltd. Series 2014-1A, Class A1(a) |
| ||||||||||||
| 2,100,000 | 1.386 | 04/20/26 | 2,050,879 | |||||||||||
| KKR Financial CLO Ltd. Series 2005-1A, Class A1(a) |
| ||||||||||||
| 21,871 | 0.505 | 04/26/17 | 21,866 | |||||||||||
| Liberty CLO Ltd. Series 2005-1A, Class A1C(a) |
| ||||||||||||
| 195,259 | 0.490 | 11/01/17 | 195,192 | |||||||||||
| Liberty CLO Ltd. Series 2005-1A, Class A2(a) |
| ||||||||||||
| 4,000,000 | 0.615 | 11/01/17 | 3,986,168 | |||||||||||
| OCP CLO Ltd. Series 2012-2A, Class A1(a) |
| ||||||||||||
| 1,050,000 | 1.055 | 11/22/23 | 1,029,196 | |||||||||||
| OCP CLO Ltd. Series 2014-5A, Class A1(a) |
| ||||||||||||
| 2,350,000 | 1.236 | 04/26/26 | 2,294,484 | |||||||||||
| OFSI Fund V Ltd. Series 2013-5A, Class A1LA(a) |
| ||||||||||||
| 1,000,000 | 1.163 | 04/17/25 | 986,376 | |||||||||||
| OFSI Fund V Ltd. Series 2014-7A, Class A(a) |
| ||||||||||||
| 2,100,000 | 1.715 | 10/18/26 | 2,083,116 | |||||||||||
| OFSI Fund VI Ltd. Series 2014-6A, Class A1(a) |
| ||||||||||||
| 2,250,000 | 1.393 | 03/20/25 | 2,195,597 | |||||||||||
| OZLM Funding III Ltd. Series 2013-3A, Class A1(a) |
| ||||||||||||
| 2,000,000 | 1.562 | 01/22/25 | 1,987,140 | |||||||||||
| Symphony CLO XI Ltd. Series 2013-11A, Class A(a) |
| ||||||||||||
| 2,000,000 | 1.533 | 01/17/25 | 1,987,222 | |||||||||||
| Westchester CLO Ltd. Series 2007-1X, Class A1A |
| ||||||||||||
| 1,605,062 | 0.465 | 08/01/22 | 1,590,119 | |||||||||||
| Zais CLO 1 Ltd. Series 2014-1A, Class A1(a) |
| ||||||||||||
| 1,700,000 | 1.634 | 04/15/26 | 1,690,761 | |||||||||||
|
| |||||||||||||
| 40,297,653 | ||||||||||||||
|
| |||||||||||||
| The accompanying notes are an integral part of these financial statements. | 55 |
GOLDMAN SACHS HIGH QUALITY FLOATING RATE FUND
Schedule of Investments (continued)
September 30, 2014 (Unaudited)
Principal Amount | Interest Rate | Maturity Date | Value | |||||||||||
| Asset-Backed Securities – (continued) | ||||||||||||||
| Credit Card(c) – 2.3% | ||||||||||||||
| BA Credit Card Trust Series 2007-A11, Class A11 |
| ||||||||||||
| $ | 1,667,000 | 0.224 | % | 12/15/19 | $ | 1,658,004 | ||||||||
| Bank of America Credit Card Trust Series 2014-A1, Class A |
| ||||||||||||
| 5,650,000 | 0.534 | 06/15/21 | 5,649,514 | |||||||||||
| Chase Issuance Trust Series 2013-A2, Class A2 |
| ||||||||||||
| 4,200,000 | 0.254 | 02/15/17 | 4,199,201 | |||||||||||
|
| |||||||||||||
| 11,506,719 | ||||||||||||||
|
| |||||||||||||
| Home Equity(a) – 2.2% | ||||||||||||||
| HLSS Servicer Advance Receivables Backed Notes Series 2013-T5, Class AT5 |
| ||||||||||||
| 3,600,000 | 1.979 | 08/15/46 | 3,616,416 | |||||||||||
| HLSS Servicer Advance Receivables Trust Series 2014-T1, | | ||||||||||||
| 6,400,000 | 1.244 | 01/17/45 | 6,406,564 | |||||||||||
| New Residential Advance Receivables Trust Advance | | ||||||||||||
| 1,175,000 | 1.274 | 03/15/45 | 1,176,292 | |||||||||||
|
| |||||||||||||
| 11,199,272 | ||||||||||||||
|
| |||||||||||||
| Student Loan(c) – 15.5% | ||||||||||||||
| Academic Loan Funding Trust Series 2013-1, Class A(a) |
| ||||||||||||
| 4,885,826 | 0.956 | 12/26/44 | 4,884,387 | |||||||||||
| Access Group, Inc. Series 2005-2, Class A3 |
| ||||||||||||
| 2,293,037 | 0.415 | 11/22/24 | 2,280,540 | |||||||||||
| Access Group, Inc. Series 2013-1, Class A(a) |
| ||||||||||||
| 2,414,023 | 0.655 | 02/25/36 | 2,386,960 | |||||||||||
| Access to Loans for Learning Student Loan Corp. Series 2013-I, | | ||||||||||||
| 3,223,380 | 0.956 | 02/25/41 | 3,221,450 | |||||||||||
| Alaska State Student Loan Corp. Series 2013, Class A |
| ||||||||||||
| 3,580,977 | 0.655 | 08/25/31 | 3,590,359 | |||||||||||
| Bank of America Student Loan Trust Series 2010-1A, Class A(a) |
| ||||||||||||
| 3,338,512 | 1.034 | 02/25/43 | 3,357,345 | |||||||||||
| Brazos Higher Education Authority, Inc. Series 2004-1, Class A-2 |
| ||||||||||||
| 179,653 | 0.394 | 06/27/22 | 179,527 | |||||||||||
| Brazos Higher Education Authority, Inc. Series 2005-2, | | ||||||||||||
| 2,289,445 | 0.354 | 12/26/19 | 2,282,780 | |||||||||||
| Education Funding Capital Trust I Series 2004-1, Class A2 |
| ||||||||||||
| 81,012 | 0.394 | 12/15/22 | 80,976 | |||||||||||
| Education Loan Asset-Backed Trust I Series 2013-1, Class A1(a) |
| ||||||||||||
| 4,643,492 | 0.956 | 06/25/26 | 4,668,606 | |||||||||||
| Education Loan Asset-Backed Trust Series 2012-1, Class A1(a) |
| ||||||||||||
| 149,206 | 0.605 | 06/25/22 | 149,227 | |||||||||||
| Educational Services of America, Inc. Series 2010-1, Class A1(a) |
| ||||||||||||
| 4,568,434 | 1.084 | 07/25/23 | 4,597,325 | |||||||||||
| Educational Services of America, Inc. Series 2012-1, Class A1(a) |
| ||||||||||||
| 4,477,554 | 1.305 | 09/25/40 | 4,571,186 | |||||||||||
| Educational Services of America, Inc. Series 2014-1, Class A(a) |
| ||||||||||||
| 4,536,685 | 0.855 | 02/25/39 | 4,546,529 | |||||||||||
| GCO Education Loan Funding Trust Series 2005-2, Class A6L |
| ||||||||||||
| 1,313,241 | 0.385 | 05/27/24 | 1,307,784 | |||||||||||
| GCO Education Loan Funding Trust Series 2006-1, Class A8L |
| ||||||||||||
| 2,873,613 | 0.365 | 05/25/25 | 2,816,217 | |||||||||||
|
| |||||||||||||
| Asset-Backed Securities – (continued) | ||||||||||||||
| Student Loan(a) – (continued) | ||||||||||||||
| Knowledgeworks Foundation Student Loan Series 2010-1, | | ||||||||||||
| $ | 843,855 | 1.185 | % | 02/25/42 | $ | 851,636 | ||||||||
| Missouri Higher Education Loan Authority Series 2010-2, | | ||||||||||||
| 4,899,470 | 1.077 | 08/27/29 | 4,935,183 | |||||||||||
| Nelnet Student Loan Trust Series 2008-3, Class A4 |
| ||||||||||||
| 4,500,000 | 1.885 | 11/25/24 | 4,659,977 | |||||||||||
| Northstar Education Finance, Inc. Series 2005-1, Class A1 |
| ||||||||||||
| 119,884 | 0.335 | 10/28/26 | 119,415 | |||||||||||
| Northstar Education Finance, Inc. Series 2012-1, Class A(a) |
| ||||||||||||
| 1,456,178 | 0.856 | 12/26/31 | 1,455,857 | |||||||||||
| Pennsylvania State Higher Education Assistance Agency | | ||||||||||||
| 195,738 | 0.834 | 04/25/19 | 195,836 | |||||||||||
| Rhode Island Student Loan Authority Series 2012-1, Class A1 |
| ||||||||||||
| 3,963,617 | 1.055 | 07/01/31 | 3,995,003 | |||||||||||
| Scholar Funding Trust Series 2012-B, Class A1(a) |
| ||||||||||||
| 4,373,841 | 0.552 | 10/28/25 | 4,362,729 | |||||||||||
| SLC Student Loan Trust Series 2010-1, Class A |
| ||||||||||||
| 1,387,321 | 1.110 | 11/25/42 | 1,404,737 | |||||||||||
| SLM Student Loan Trust Series 2003-12, Class A5(a) |
| ||||||||||||
| 1,629,599 | 0.514 | 09/15/22 | 1,629,478 | |||||||||||
| SLM Student Loan Trust Series 2005-9, Class A6 |
| ||||||||||||
| 3,100,000 | 0.706 | 10/26/26 | 3,110,813 | |||||||||||
| SLM Student Loan Trust Series 2006-7, Class A4 |
| ||||||||||||
| 97,807 | 0.304 | 04/25/22 | 97,742 | |||||||||||
| SLM Student Loan Trust Series 2006-8, Class A4 |
| ||||||||||||
| 250,920 | 0.314 | 10/25/21 | 250,337 | |||||||||||
| SLM Student Loan Trust Series 2008-5, Class A4 |
| ||||||||||||
| 1,250,000 | 1.934 | 07/25/23 | 1,306,737 | |||||||||||
| SLM Student Loan Trust Series 2012-3, Class A |
| ||||||||||||
| 1,833,072 | 0.805 | 12/26/25 | 1,849,457 | |||||||||||
| SLM Student Loan Trust Series 2012-6, Class A2 |
| ||||||||||||
| 684,057 | 0.435 | 09/25/19 | 683,969 | |||||||||||
| South Carolina Student Loan Corp. Series 2005, Class A2 |
| ||||||||||||
| 545,747 | 0.354 | 12/01/20 | 542,347 | |||||||||||
| South Carolina Student Loan Corp. Series 2006-1, Class A1 |
| ||||||||||||
| 93,127 | 0.324 | 12/02/19 | 93,078 | |||||||||||
| US Education Loan Trust LLC Series 2006-1, Class A2(a) |
| ||||||||||||
| 2,044,856 | 0.364 | 03/01/25 | 2,042,523 | |||||||||||
|
| |||||||||||||
| 78,508,052 | ||||||||||||||
|
| |||||||||||||
| TOTAL ASSET-BACKED SECURITIES | ||||||||||||||
| (Cost $143,276,588) | $ | 144,016,829 | ||||||||||||
|
| |||||||||||||
| Government Guarantee Obligations – 4.3% | ||||||||||||||
| FMS Wertmanagement(c)(f) |
| ||||||||||||
| $ | 17,800,000 | 0.484 | % | 06/30/15 | $ | 17,831,328 | ||||||||
| Hashemite Kingdom of Jordan Government AID Bond(d) |
| ||||||||||||
| 4,000,000 | 2.503 | 10/30/20 | 4,080,000 | |||||||||||
|
| |||||||||||||
| | TOTAL GOVERNMENT GUARANTEE OBLIGATIONS | | ||||||||||||
| (Cost $21,831,363) | $ | 21,911,328 | ||||||||||||
|
| |||||||||||||
| 56 | The accompanying notes are an integral part of these financial statements. |
GOLDMAN SACHS HIGH QUALITY FLOATING RATE FUND
Principal Amount | Interest Rate | Maturity Date | Value | |||||||||||
| U.S. Treasury Obligations – 5.1% | ||||||||||||||
| United States Treasury Bonds |
| ||||||||||||
| $ | 500,000 | 3.125 | % | 11/15/41 | $ | 495,990 | ||||||||
| 3,500,000 | 3.750 | (g) | 11/15/43 | 3,868,235 | ||||||||||
| United States Treasury Inflation Protected Securities |
| ||||||||||||
| 499,104 | 1.625 | 01/15/15 | 499,648 | |||||||||||
| 4,947,300 | 0.500 | 04/15/15 | 4,952,693 | |||||||||||
| 1,714,846 | 1.875 | 07/15/15 | 1,753,962 | |||||||||||
| 360,120 | 2.000 | 01/15/16 | 372,893 | |||||||||||
| 2,287,194 | 1.125 | 01/15/21 | 2,400,845 | |||||||||||
| 4,000,108 | 0.125 | 01/15/22 | 3,909,465 | |||||||||||
| 2,654,860 | 0.625 | 01/15/24 | 2,669,780 | |||||||||||
| 1,103,740 | 0.125 | 07/15/24 | 1,060,451 | |||||||||||
| United States Treasury Notes |
| ||||||||||||
| 3,900,000 | 2.125 | 01/31/21 | 3,899,532 | |||||||||||
|
| |||||||||||||
| TOTAL U.S. TREASURY OBLIGATIONS | ||||||||||||||
| (Cost $25,672,322) | $ | 25,883,494 | ||||||||||||
|
| |||||||||||||
Notional Amount | Exercise Rate | Expiration Date | Value | |||||||||||
| Options Purchased – 0.9% | ||||||||||||||
| Interest Rate Swaptions | ||||||||||||||
| Bank of America NA Call – OTC – 10 year Interest Rate Swap | | ||||||||||||
| $ | 4,000,000 | 3.590 | % | 03/22/16 | $ | 78,829 | ||||||||
| Bank of America NA Call – OTC – 10 year Interest Rate Swap | | ||||||||||||
| 3,600,000 | 4.070 | 03/29/16 | 37,251 | |||||||||||
| Bank of America NA Put – OTC – 30 year Interest Rate Swap | | ||||||||||||
| 1,400,000 | 3.950 | 01/29/16 | 188,216 | |||||||||||
| Bank of America NA Call – OTC – 30 year Interest Rate Swap | | ||||||||||||
| 1,400,000 | 3.950 | 01/29/16 | 36,911 | |||||||||||
| Citibank NA Put – OTC – 5 year Interest Rate Swap Strike Price 3.388% |
| ||||||||||||
| 2,500,000 | 3.388 | 09/19/16 | 116,317 | |||||||||||
| Citibank NA Call – OTC – 5 year Interest Rate Swap Strike Price 3.388% |
| ||||||||||||
| 2,500,000 | 3.388 | 09/19/16 | 88,997 | |||||||||||
| Citibank NA Call – OTC – 10 year Interest Rate Swap Strike Price 3.625% |
| ||||||||||||
| 2,100,000 | 3.625 | 02/22/16 | 36,342 | |||||||||||
| Citibank NA Call – OTC – 10 year Interest Rate Swap Strike Price 3.570% |
| ||||||||||||
| 2,000,000 | 3.570 | 02/22/16 | 37,357 | |||||||||||
| Deutsche Bank AG Put – OTC – 1 year Interest Rate Swap Strike | | ||||||||||||
| 3,300,000 | 4.113 | 04/16/19 | 274,315 | |||||||||||
| Deutsche Bank AG Call – OTC – 2 year Interest Rate Swap Strike | | ||||||||||||
| 8,600,000 | 1.950 | 10/26/15 | 48,660 | |||||||||||
| Deutsche Bank AG Call – OTC – 2 year Interest Rate Swap Strike | | ||||||||||||
| 8,600,000 | 2.030 | 10/26/15 | 43,617 | |||||||||||
|
| |||||||||||||
| Options Purchased – (continued) | ||||||||||||||
| Interest Rate Swaptions – (continued) | ||||||||||||||
| Deutsche Bank AG Put – OTC – 5 year Interest Rate Swap Strike | | ||||||||||||
| $ | 3,600,000 | 2.550 | % | 09/28/15 | $ | 58,441 | ||||||||
| Deutsche Bank AG Call – OTC – 5 year Interest Rate Swap Strike | | ||||||||||||
| 3,600,000 | 2.550 | 09/28/15 | 55,023 | |||||||||||
| Deutsche Bank AG Put – OTC – 5 year Interest Rate Swap Strike | | ||||||||||||
| 4,600,000 | 2.980 | 03/04/16 | 118,565 | |||||||||||
| Deutsche Bank AG Call – OTC – 5 year Interest Rate Swap Strike | | ||||||||||||
| 4,600,000 | 2.980 | 03/04/16 | 67,333 | |||||||||||
| Deutsche Bank AG Put – OTC – 10 year Interest Rate Swap | | ||||||||||||
| 2,300,000 | 3.408 | 09/19/16 | 109,232 | |||||||||||
| Deutsche Bank AG Call – OTC – 10 year Interest Rate Swap | | ||||||||||||
| 2,300,000 | 3.408 | 09/19/16 | 80,263 | |||||||||||
| Deutsche Bank AG Put – OTC – 10 year Interest Rate Swap | | ||||||||||||
| 3,000,000 | 3.503 | 07/02/15 | 175,891 | |||||||||||
| Deutsche Bank AG Call – OTC – 10 year Interest Rate Swap | | ||||||||||||
| 3,000,000 | 3.503 | 07/02/15 | 22,531 | |||||||||||
| Deutsche Bank AG Put – OTC – 10 year Interest Rate Swap | | ||||||||||||
| 3,000,000 | 4.135 | 04/17/19 | 252,702 | |||||||||||
| Deutsche Bank AG Call – OTC – 10 year Interest Rate Swap | | ||||||||||||
| 3,000,000 | 4.135 | 04/17/19 | 116,916 | |||||||||||
| Deutsche Bank AG Call – OTC – 10 year Interest Rate Swap | | ||||||||||||
| 3,300,000 | 4.113 | 04/16/19 | 130,476 | |||||||||||
| Deutsche Bank AG Call – OTC – 10 year Interest Rate Swap | | ||||||||||||
| 6,800,000 | 3.780 | 09/26/16 | 161,873 | |||||||||||
| JPMorgan Chase Bank NA Call – OTC – 2 year Interest Rate | | ||||||||||||
| 8,400,000 | 1.855 | 11/02/15 | 56,073 | |||||||||||
| JPMorgan Chase Bank NA Put – OTC – 5 year Interest Rate | | ||||||||||||
| 5,200,000 | 2.973 | 09/26/16 | 122,991 | |||||||||||
| JPMorgan Chase Bank NA Call – OTC – 5 year Interest Rate | | ||||||||||||
| 5,200,000 | 2.973 | 09/26/16 | 119,758 | |||||||||||
| JPMorgan Chase Bank NA Call – OTC – 5 year Interest Rate | | ||||||||||||
| 18,600,000 | 2.783 | 09/30/15 | 206,925 | |||||||||||
| JPMorgan Chase Bank NA Put – OTC – 10 year Interest Rate | | ||||||||||||
| 4,700,000 | 3.413 | 09/19/16 | 224,384 | |||||||||||
| JPMorgan Chase Bank NA Call – OTC – 10 year Interest Rate | | ||||||||||||
| 4,700,000 | 3.413 | 09/19/16 | 163,177 | |||||||||||
|
| |||||||||||||
| The accompanying notes are an integral part of these financial statements. | 57 |
GOLDMAN SACHS HIGH QUALITY FLOATING RATE FUND
Schedule of Investments (continued)
September 30, 2014 (Unaudited)
Notional Amount | Exercise Rate | Expiration Date | Value | |||||||||||
| Options Purchased – (continued) | ||||||||||||||
| Interest Rate Swaptions – (continued) | ||||||||||||||
| Morgan Stanley Capital Services, Inc. Put – OTC – 5 year Interest | | ||||||||||||
| $ | 3,000,000 | 2.550 | % | 09/28/15 | $ | 48,701 | ||||||||
| Morgan Stanley Capital Services, Inc. Call – OTC – 5 year | | ||||||||||||
| 3,000,000 | 2.550 | 09/28/15 | 45,853 | |||||||||||
| Morgan Stanley Capital Services, Inc. Put – OTC – 5 year Interest | | ||||||||||||
| 5,000,000 | 3.050 | 03/07/16 | 139,352 | |||||||||||
| Morgan Stanley Capital Services, Inc. Call – OTC – 5 year | | ||||||||||||
| 5,000,000 | 3.050 | 03/07/16 | 67,602 | |||||||||||
| Morgan Stanley Capital Services, Inc. Put – OTC – 5 year Interest | | ||||||||||||
| 11,500,000 | 2.950 | 09/26/16 | 265,538 | |||||||||||
| Morgan Stanley Capital Services, Inc. Call – OTC – 5 year | | ||||||||||||
| 11,500,000 | 2.950 | 09/26/16 | 270,310 | |||||||||||
| Morgan Stanley Capital Services, Inc. Call – OTC – 10 year | | ||||||||||||
| 3,300,000 | 3.652 | 02/22/16 | 54,991 | |||||||||||
| Morgan Stanley Capital Services, Inc. Put – OTC – 10 year | | ||||||||||||
| 5,300,000 | 3.640 | 03/04/16 | 327,280 | |||||||||||
| Morgan Stanley Capital Services, Inc. Call – OTC – 10 year | | ||||||||||||
| 5,300,000 | 3.640 | 03/04/16 | 93,211 | |||||||||||
|
| |||||||||||||
| TOTAL OPTIONS PURCHASED – 0.9% | ||||||||||||||
| (Cost $4,992,387) | $ | 4,542,204 | ||||||||||||
|
| |||||||||||||
| | TOTAL INVESTMENTS BEFORE SHORT-TERM INVESTMENT | | ||||||||||||
| (Cost $430,078,313) | $ | 431,310,134 | ||||||||||||
|
| |||||||||||||
| Principal Amount | Interest Rate | Maturity Date | Value | |||||||||||
| Short-term Investment(h) – 11.9% | ||||||||||||||
| Repurchase Agreement – 11.9% | ||||||||||||||
| Joint Repurchase Agreement Account II |
| ||||||||||||
| $ | 60,000,000 | 0.012 | % | 10/01/14 | $ | 60,000,000 | ||||||||
| (Cost $60,000,000) | ||||||||||||||
|
| |||||||||||||
| TOTAL INVESTMENTS – 97.2% | ||||||||||||||
| (Cost $490,078,313) | $ | 491,310,134 | ||||||||||||
|
| |||||||||||||
|
| OTHER ASSETS IN EXCESS OF LIABILITIES – 2.8% |
| 14,119,721 | |||||||||||
|
| |||||||||||||
| NET ASSETS – 100.0% | $ | 505,429,855 | ||||||||||||
|
| |||||||||||||
| The percentage shown for each investment category reflects the value of investments in that category as a percentage of net assets. | ||
(a) | Exempt from registration under Rule 144A of the Securities Act of 1933. Under procedures approved by the Board of Trustees, such securities have been determined to be liquid by the investment adviser and may be resold, normally to qualified institutional buyers in transactions exempt from registration. Total market value of Rule 144A securities amounts to $100,377,240, which represents approximately 19.9% of net assets as of September 30, 2014. | |
(b) | Security with a notional or nominal principal amount. The actual effective yield of this security is different than the stated interest rate. | |
(c) | Variable rate security. Interest rate or distribution rate disclosed is that which is in effect at September 30, 2014. | |
(d) | Guaranteed by the United States Government until maturity. Total market value for this security amounts to $84,081,784, which represents approximately 16.6% of net assets as of September 30, 2014. | |
(e) | Issued with a zero coupon. Income is recognized through the accretion of discount. | |
(f) | Guaranteed by a foreign government until maturity. Total market value of this security amounts to $17,831,328, which represents approximately 3.5% of net assets as of September 30, 2014. | |
(g) | A portion of this security is segregated as collateral for initial margin requirements on futures transactions. | |
(h) | Joint repurchase agreement was entered into on September 30, 2014. Additional information appears on page 87. | |
| ||
Investment Abbreviations: | ||
ACES | —Alternative Credit Enhancement Securities | |
CLO | —Collateralized Loan Obligation | |
FDIC | —Federal Deposit Insurance Corp. | |
FHLB | —Federal Home Loan Bank | |
FHLMC | —Federal Home Loan Mortgage Corp. | |
FNMA | —Federal National Mortgage Association | |
GNMA | —Government National Mortgage Association | |
LIBOR | —London Interbank Offered Rate | |
NCUA | —National Credit Union Administration | |
OTC | —Over the Counter | |
REMIC | —Real Estate Mortgage Investment Conduit | |
STRIPS | —Separate Trading of Registered Interest and Principal of Securities | |
| ||
| 58 | The accompanying notes are an integral part of these financial statements. |
GOLDMAN SACHS HIGH QUALITY FLOATING RATE FUND
| ADDITIONAL INVESTMENT INFORMATION |
FORWARD SALES CONTRACTS — At September 30, 2014, the Fund had the following forward sales contracts:
| Description | Interest Rate | Maturity Date(a) | Settlement Date | Principal Amount | Value | |||||||||||
FNMA (Proceeds Receivable: $3,948,750)
| 3.000 | % | TBA-30yr | $ | (4,000,000 | ) | $ | (3,942,188 | ) | |||||||
| (a) | TBA (To Be Announced) Securities are purchased on a forward commitment basis with an approximate principal amount and no defined maturity date. The actual principal and maturity date will be determined upon settlement when the specific mortgage pools are assigned. |
FUTURES CONTRACTS — At September 30, 2014, the Fund had the following futures contracts:
| Type | Number of Contracts Long (Short) | Expiration Date | Current Value | Unrealized Gain (Loss) | ||||||||||||
Ultra Long U.S. Treasury Bonds | 2 | December 2014 | $ | 305,000 | $ | 6,243 | ||||||||||
2 Year U.S. Treasury Notes | (234 | ) | December 2014 | (51,209,437 | ) | 24,574 | ||||||||||
5 Year U.S. Treasury Notes | (669 | ) | December 2014 | (79,114,477 | ) | 227,040 | ||||||||||
10 Year U.S. Treasury Notes | 378 | December 2014 | 47,114,156 | (338,056 | ) | |||||||||||
20 Year U.S. Treasury Bonds | (40 | ) | December 2014 | (5,516,250 | ) | 74,864 | ||||||||||
| TOTAL | $ | (5,335 | ) | |||||||||||||
SWAP CONTRACTS — At September 30, 2014, the Fund had the following swap contracts:
CENTRALLY CLEARED INTEREST RATE SWAP CONTRACTS
| Rates Exchanged | Market Value | |||||||||||||||
| Notional Amount (000s)(a) | Termination Date | Payments Received | Payments Made | Upfront Payments Made (Received) | Unrealized Gain (Loss) | |||||||||||
| $ | 11,300 | 12/17/16 | 3 month LIBOR | 1.000% | $ | (2,546 | ) | $ | 3,927 | |||||||
| 2,500 | 02/01/17 | 3 month LIBOR | 1.625 | 2,754 | (2,018 | ) | ||||||||||
| 9,400 | 08/04/17 | 3 month LIBOR | 2.195 | (8,071 | ) | 4,989 | ||||||||||
| 3,900 | 10/28/17 | 1.450% | 3 month LIBOR | (47,820 | ) | 16,207 | ||||||||||
| 15,900 | 12/17/19 | 3 month LIBOR | 2.250 | (146,384 | ) | 9,659 | ||||||||||
| 6,800 | 10/02/20 | 2.532 | 3 month LIBOR | 34 | — | |||||||||||
| 14,100 | 08/04/21 | 3.025 | 3 month LIBOR | 49,042 | 27,636 | |||||||||||
| 13,100 | 12/17/21 | 3 month LIBOR | 2.500 | (110,025 | ) | 37,372 | ||||||||||
| 7,100 | 01/30/24 | 4.252 | 3 month LIBOR | 79,362 | 183,103 | |||||||||||
| 2,800 | 12/17/24 | 3 month LIBOR | 3.000 | (73,424 | ) | 5,082 | ||||||||||
| 7,600 | 08/04/26 | 3 month LIBOR | 3.409 | (42,804 | ) | (72,210 | ) | |||||||||
| 2,300 | 09/28/26 | 3.280 | 3 month LIBOR | 18 | 3,095 | |||||||||||
| 12,600 | 12/17/29 | 3 month LIBOR | 3.250 | (300,249 | ) | (74,316 | ) | |||||||||
| 2,200 | 01/30/39 | 3 month LIBOR | 4.370 | (2,222 | ) | (229,813 | ) | |||||||||
| TOTAL | $ | (602,335 | ) | $ | (87,287 | ) | ||||||||||
| (a) | Represents forward starting interest rate swaps whose effective dates of commencement of accruals and cash flows occur subsequent to September 30, 2014. |
| The accompanying notes are an integral part of these financial statements. | 59 |
GOLDMAN SACHS INFLATION PROTECTED SECURITIES FUND
Schedule of Investments
September 30, 2014 (Unaudited)
Principal Amount | Interest Rate | Maturity Date | Value | |||||||||||
| U.S. Treasury Obligations – 98.2% | ||||||||||||||
| United States Treasury Bonds |
| ||||||||||||
| $ | 100,000 | 2.750 | % | 11/15/42 | $ | 91,482 | ||||||||
| 3,000,000 | 3.625 | 02/15/44 | 3,242,250 | |||||||||||
| 300,000 | 3.375 | 05/15/44 | 309,696 | |||||||||||
| United States Treasury Inflation Protected Securities |
| ||||||||||||
| 5,641,880 | 2.000 | 01/15/16 | 5,841,998 | |||||||||||
| 7,987,486 | 0.125 | 04/15/16 | 8,084,853 | |||||||||||
| 12,797,434 | 0.125 | 04/15/17 | 12,977,366 | |||||||||||
| 9,379,188 | 0.125 | 04/15/18 | 9,461,256 | |||||||||||
| 26,332,303 | 1.375 | 01/15/20 | 28,035,740 | |||||||||||
| 27,065,129 | 1.125 | (a) | 01/15/21 | 28,409,995 | ||||||||||
| 13,315,251 | 0.125 | 01/15/23 | 12,890,894 | |||||||||||
| 409,512 | 0.375 | 07/15/23 | 405,482 | |||||||||||
| 1,940,090 | 0.625 | 01/15/24 | 1,950,993 | |||||||||||
| 2,508,500 | 0.125 | 07/15/24 | 2,410,117 | |||||||||||
| 10,653,120 | 2.500 | 01/15/29 | 13,016,834 | |||||||||||
| 15,432,340 | 2.125 | 02/15/40 | 19,107,089 | |||||||||||
| 1,476,160 | 0.750 | 02/15/42 | 1,353,225 | |||||||||||
| 766,718 | 1.375 | 02/15/44 | 820,748 | |||||||||||
| United States Treasury Note |
| ||||||||||||
| 300,000 | 1.750 | 09/30/19 | 299,565 | |||||||||||
|
| |||||||||||||
| TOTAL U.S. TREASURY OBLIGATIONS | ||||||||||||||
| (Cost $149,116,793) | $ | 148,709,583 | ||||||||||||
|
| |||||||||||||
Notional Amount | Exercise Rate | Expiration Date | Value | |||||||||||
| Options Purchased – 0.2% | ||||||||||||||
| Interest Rate Swaptions | ||||||||||||||
| Bank of America NA Put – OTC – 30 year Interest Rate Swap | | ||||||||||||
| $ | 1,300,000 | 3.950 | % | 01/29/16 | $ | 174,772 | ||||||||
| Bank of America NA Call – OTC – 30 year Interest Rate Swap | | ||||||||||||
| 1,300,000 | 3.950 | 01/29/16 | 34,275 | |||||||||||
| Citibank NA Call – OTC – 10 year Interest Rate Swap Strike | | ||||||||||||
| 2,400,000 | 3.625 | 02/22/16 | 41,534 | |||||||||||
| Deutsche Bank AG Call – OTC – 2 year Interest Rate Swap Strike | | ||||||||||||
| 4,400,000 | 2.030 | 10/26/15 | 22,316 | |||||||||||
| JPMorgan Chase Bank NA Call – OTC – 2 year Interest Rate | | ||||||||||||
| 5,100,000 | 1.855 | 11/02/15 | 34,044 | |||||||||||
|
| |||||||||||||
| TOTAL OPTIONS PURCHASED – 0.2% | ||||||||||||||
| (Cost $358,838) | $ | 306,941 | ||||||||||||
|
| |||||||||||||
| | TOTAL INVESTMENTS BEFORE SHORT-TERM INVESTMENT | | ||||||||||||
| (Cost $149,475,631) | $ | 149,016,524 | ||||||||||||
|
| |||||||||||||
Principal Amount | Interest Rate | Maturity Date | Value | |||||||||||
| Short-term Investment(b) – 0.8% | ||||||||||||||
| Repurchase Agreement – 0.8% | ||||||||||||||
| Joint Repurchase Agreement Account II |
| ||||||||||||
| $ | 1,200,000 | 0.012 | % | 10/01/14 | $ | 1,200,000 | ||||||||
| (Cost $1,200,000) | ||||||||||||||
|
| |||||||||||||
| TOTAL INVESTMENTS – 99.2% | ||||||||||||||
| (Cost $150,675,631) | $ | 150,216,524 | ||||||||||||
|
| |||||||||||||
| | OTHER ASSETS IN EXCESS OF LIABILITIES – 0.8% | | 1,187,798 | |||||||||||
|
| |||||||||||||
| NET ASSETS – 100.0% | $ | 151,404,322 | ||||||||||||
|
| |||||||||||||
| The percentage shown for each investment category reflects the value of investments in that category as a percentage of net assets. | ||
(a) | All or a portion of security is segregated as collateral for initial margin requirements on futures transactions. | |
(b) | Joint repurchase agreement was entered into on September 30, 2014. Additional information appears on page 87. | |
| ||
Investment Abbreviations: | ||
LIBOR | —London Interbank Offered Rate | |
OTC | —Over the Counter | |
| ||
| 60 | The accompanying notes are an integral part of these financial statements. |
GOLDMAN SACHS INFLATION PROTECTED SECURITIES FUND
| ADDITIONAL INVESTMENT INFORMATION |
FUTURES CONTRACTS — At September 30, 2014, the Fund had the following futures contracts:
| Type | Number of Contracts Long (Short) | Expiration Date | Current Value | Unrealized Gain (Loss) | ||||||||||
Eurodollars | (73 | ) | March 2017 | $ | (17,807,438 | ) | $ | 20,833 | ||||||
Eurodollars | (69 | ) | June 2017 | (16,798,913 | ) | 16,120 | ||||||||
Eurodollars | (13 | ) | September 2017 | (3,160,137 | ) | 6,708 | ||||||||
Ultra Long U.S. Treasury Bonds | (67 | ) | December 2014 | (10,217,500 | ) | 151,590 | ||||||||
2 Year U.S. Treasury Notes | 30 | December 2014 | 6,565,313 | (1,555 | ) | |||||||||
5 Year U.S. Treasury Notes | (188 | ) | December 2014 | (22,232,469 | ) | 73,913 | ||||||||
10 Year U.S. Treasury Notes | 285 | December 2014 | 35,522,578 | (183,649 | ) | |||||||||
20 Year U.S. Treasury Bonds | (12 | ) | December 2014 | (1,654,875 | ) | 19,471 | ||||||||
| TOTAL | $ | 103,431 | ||||||||||||
SWAP CONTRACTS — At September 30, 2014, the Fund had the following swap contracts:
CENTRALLY CLEARED INTEREST RATE SWAP CONTRACTS
| Rates Exchanged | Market Value | |||||||||||||||||
Notional Amount (000s)(a) | Termination Date | Payments Received | Payments Made | Upfront Payments Made (Received) | Unrealized Gain (Loss) | |||||||||||||
| $ | 2,200 | 02/01/17 | 3 month LIBOR | 1.625% | $ | (542 | ) | $ | 1,189 | |||||||||
| 8,000 | 08/04/17 | 3 month LIBOR | 2.195 | (6,800 | ) | 4,178 | ||||||||||||
| 2,000 | 12/17/19 | 3 month LIBOR | 2.250 | (17,814 | ) | 616 | ||||||||||||
| 11,900 | 08/04/21 | 3.025% | 3 month LIBOR | 40,872 | 23,843 | |||||||||||||
| 6,300 | 12/17/21 | 3 month LIBOR | 2.500 | (16,191 | ) | (18,749 | ) | |||||||||||
| 5,800 | 01/30/24 | 4.252 | 3 month LIBOR | 6,812 | 207,597 | |||||||||||||
| 6,500 | 08/04/26 | 3 month LIBOR | 3.409 | (36,355 | ) | (62,013 | ) | |||||||||||
| 100 | 12/17/29 | 3 month LIBOR | 3.250 | (1,689 | ) | (1,284 | ) | |||||||||||
| 2,000 | 01/30/39 | 3 month LIBOR | 4.370 | (68,596 | ) | (142,345 | ) | |||||||||||
| TOTAL | $ | (100,303 | ) | $ | 13,032 | |||||||||||||
| (a) | Represents forward starting interest rate swaps whose effective dates of commencement of accruals and cash flows occur subsequent to September 30, 2014. |
| The accompanying notes are an integral part of these financial statements. | 61 |
GOLDMAN SACHS LIMITED MATURITY OBLIGATION FUND
Schedule of Investments
September 30, 2014 (Unaudited)
| Principal Amount | Interest Rate | Maturity Date | Value | |||||||||||
| Corporate Obligations(a) – 18.6% | ||||||||||||||
| Banks – 16.1% | ||||||||||||||
| Commonwealth Bank of Australia(b) |
| ||||||||||||
| $ | 400,000 | 0.733 | % | 09/20/16 | $ | 402,515 | ||||||||
| Royal Bank of Canada |
| ||||||||||||
| 400,000 | 0.692 | 09/09/16 | 402,561 | |||||||||||
| Svenska Handelsbanken AB |
| ||||||||||||
| 400,000 | 0.703 | 09/23/16 | 402,366 | |||||||||||
| The Toronto-Dominion Bank |
| ||||||||||||
| 400,000 | 0.692 | 09/09/16 | 402,174 | |||||||||||
|
| |||||||||||||
| 1,609,616 | ||||||||||||||
|
| |||||||||||||
| Health Care – 2.5% | ||||||||||||||
| Providence Health & Services Obligated Group |
| ||||||||||||
| 250,000 | 0.885 | 10/01/15 | 250,428 | |||||||||||
|
| |||||||||||||
| TOTAL CORPORATE OBLIGATIONS | ||||||||||||||
| (Cost $1,857,441) | $ | 1,860,044 | ||||||||||||
|
| |||||||||||||
| Municipal Debt Obligations – 53.9% | ||||||||||||||
| California – 10.5% | ||||||||||||||
| California State GO Bonds (Various Purposes) Series 2009 |
| ||||||||||||
| $ | 215,000 | 5.450 | % | 04/01/15 | $ | 220,328 | ||||||||
| California Statewide Communities Development Authority | | ||||||||||||
| 350,000 | 0.990 | 04/01/52 | 350,528 | |||||||||||
| Metropolitan Water District Southern California RB (Refunding – | | ||||||||||||
| 100,000 | 0.390 | 07/01/27 | 100,017 | |||||||||||
| University of California RB (Floating Rate Notes) | | ||||||||||||
| 175,000 | 0.754 | 07/01/41 | 175,655 | |||||||||||
| University of California RB (Taxable Floating Rate Notes) | | ||||||||||||
| 200,000 | 0.657 | 07/01/41 | 200,748 | |||||||||||
|
| |||||||||||||
| 1,047,276 | ||||||||||||||
|
| |||||||||||||
| Colorado – 1.1% | ||||||||||||||
| University of Colorado Enterprise RB Build America | | ||||||||||||
| 105,000 | 2.672 | 06/01/16 | 107,955 | |||||||||||
|
| |||||||||||||
| Connecticut – 1.3% | ||||||||||||||
| Connecticut State GO Bonds Series 2008 A |
| ||||||||||||
| 130,000 | 4.400 | 03/15/15 | 132,288 | |||||||||||
|
| |||||||||||||
| Illinois – 7.8% | ||||||||||||||
| Illinois Municipal Electric Agency Power Supply Taxable | | ||||||||||||
| 350,000 | 4.880 | 02/01/15 | 354,582 | |||||||||||
| Illinois State GO Bonds Series 2010 |
| ||||||||||||
| 420,000 | 4.421 | 01/01/15 | 423,767 | |||||||||||
|
| |||||||||||||
| 778,349 | ||||||||||||||
|
| |||||||||||||
| Kansas – 1.1% | ||||||||||||||
| Wichita Water & Sewer Utility RB Taxable Series 2009 B |
| ||||||||||||
| 110,000 | 4.270 | 10/01/14 | 110,000 | |||||||||||
|
| |||||||||||||
| Municipal Debt Obligations – (continued) | ||||||||||||||
| Massachusetts(a) – 0.5% | ||||||||||||||
| Commonwealth of Massachusetts State GO Bonds Refunding | | ||||||||||||
| $ | 50,000 | 0.330 | % | 02/01/16 | $ | 50,074 | ||||||||
|
| |||||||||||||
| Michigan – 2.0% | ||||||||||||||
| University of Michigan RB Build America Bonds Series 2010 |
| ||||||||||||
| 200,000 | 1.754 | 04/01/15 | 201,228 | |||||||||||
|
| |||||||||||||
| New York – 15.7% | ||||||||||||||
| New York City Transitional Finance Authority RB Build America | | ||||||||||||
| 350,000 | 3.062 | 05/01/15 | 355,474 | |||||||||||
| New York State Local Government Assistance Corp. RB | | ||||||||||||
| 225,000 | 0.105 | 04/01/17 | 220,294 | |||||||||||
| New York State Metropolitan Transportation Authority RB | | ||||||||||||
| 300,000 | 0.604 | 11/01/15 | 300,459 | |||||||||||
| New York State Urban Development Corp. RB (Personal Income | | ||||||||||||
| 295,000 | 2.626 | 12/15/14 | 296,407 | |||||||||||
| Puttable Floating Option Taxable Notes RB | | ||||||||||||
| 405,000 | 0.000 | 01/15/15 | 405,000 | |||||||||||
|
| |||||||||||||
| 1,577,634 | ||||||||||||||
|
| |||||||||||||
| North Carolina – 2.0% | ||||||||||||||
| University of North Carolina at Chapel Hill RB Build America | | ||||||||||||
| 200,000 | 2.453 | 02/01/15 | 201,304 | |||||||||||
|
| |||||||||||||
| Pennsylvania – 4.8% | ||||||||||||||
| Commonwealth of Pennsylvania Financing Authority Build | | ||||||||||||
| 320,000 | 4.180 | 06/01/15 | 327,779 | |||||||||||
| Pennsylvania Turnpike Commission RB Series 2013 B(a) |
| ||||||||||||
| 150,000 | 0.440 | 12/01/15 | 150,183 | |||||||||||
|
| |||||||||||||
| 477,962 | ||||||||||||||
|
| |||||||||||||
| South Carolina(a) – 4.0% | ||||||||||||||
| South Carolina State Public Service Authority RB (Taxable Libor | | ||||||||||||
| 400,000 | 1.257 | 06/01/16 | 402,440 | |||||||||||
|
| |||||||||||||
| Washington – 0.1% | ||||||||||||||
| Energy Northwest Washington Electric RB (Taxable-Refunding | | ||||||||||||
| 15,000 | 1.264 | 07/01/15 | 15,092 | |||||||||||
|
| |||||||||||||
| Wisconsin – 3.0% | ||||||||||||||
| Dane County GO Build America Bonds for Promisory Notes | | ||||||||||||
| 200,000 | 1.650 | 06/01/15 | 201,344 | |||||||||||
|
| |||||||||||||
| 62 | The accompanying notes are an integral part of these financial statements. |
GOLDMAN SACHS LIMITED MATURITY OBLIGATION FUND
| Principal Amount | Interest Rate | Maturity Date | Value | |||||||||||
| Municipal Debt Obligations – (continued) | ||||||||||||||
| Wisconsin – (continued) | ||||||||||||||
| Milwaukee County Airport RB Refunding (AMT) Series 2009 B |
| ||||||||||||
| $ | 100,000 | 4.000 | % | 12/01/14 | $ | 100,489 | ||||||||
|
| |||||||||||||
| 301,833 | ||||||||||||||
|
| |||||||||||||
| TOTAL MUNICIPAL DEBT OBLIGATIONS | ||||||||||||||
| (Cost $5,401,318) | $ | 5,403,435 | ||||||||||||
|
| |||||||||||||
| | TOTAL INVESTMENTS BEFORE SHORT-TERM INVESTMENT | | ||||||||||||
| (Cost $7,258,759) | $ | 7,263,479 | ||||||||||||
|
| |||||||||||||
| Short-term Investments – 26.7% | ||||||||||||||
| Certificate of Deposit – 4.0% | ||||||||||||||
| Agricultural Bank China |
| ||||||||||||
| $ | 400,000 | 0.800 | % | 10/01/14 | $ | 400,000 | ||||||||
|
| |||||||||||||
| Repurchase Agreement – 22.7% | ||||||||||||||
| Citigroup Global Markets, Inc. |
| ||||||||||||
| 490,000 | 1.133 | 03/23/15 | 490,000 | |||||||||||
| Maturity Value: $495,675 |
| ||||||||||||
| Settlement Date: 03/20/14 |
| ||||||||||||
| Collateralized by various asset-backed obligations, 0.302% to | | ||||||||||||
| Joint Repurchase Agreement Account II(c) |
| ||||||||||||
| 1,300,000 | 0.012 | 10/01/14 | 1,300,000 | |||||||||||
| Royal Bank of Scotland |
| ||||||||||||
| 490,000 | 1.156 | 03/23/15 | 490,000 | |||||||||||
| Maturity Value: $496,231 |
| ||||||||||||
| Settlement Date: 02/20/14 |
| ||||||||||||
| Collateralized by GNMA, 4.837% due 06/20/61. The aggregate | | ||||||||||||
|
| |||||||||||||
| TOTAL SHORT-TERM INVESTMENTS | ||||||||||||||
| (Cost $2,680,000) | $ | 2,680,000 | ||||||||||||
|
| |||||||||||||
| TOTAL INVESTMENTS – 99.2% | ||||||||||||||
| (Cost $9,938,759) | $ | 9,943,479 | ||||||||||||
|
| |||||||||||||
| | OTHER ASSETS IN EXCESS OF LIABILITIES – 0.8% | | 77,497 | |||||||||||
|
| |||||||||||||
| NET ASSETS – 100.0% | $ | 10,020,976 | ||||||||||||
|
| |||||||||||||
| The percentage shown for each investment category reflects the value of investments in that category as a percentage of net assets. | ||
(a) | Variable rate security. Interest rate or distribution rate disclosed is that which is in effect at September 30, 2014. | |
(b) | Exempt from registration under Rule 144A of the Securities Act of 1933. Under procedures approved by the Board of Trustees, such securities have been determined to be liquid by the investment adviser and may be resold, normally to qualified institutional buyers in transactions exempt from registration. Total market value of Rule 144A securities amounts to $807,515, which represents approximately 8.1% of net assets as of September 30, 2014. | |
(c) | Joint repurchase agreement was entered into on September 30, 2014. Additional information appears on page 87. | |
| ||
Investment Abbreviations: | ||
AMT | —Alternative Minimum Tax | |
GO | —General Obligation | |
RB | —Revenue Bond | |
| ||
| The accompanying notes are an integral part of these financial statements. | 63 |
GOLDMAN SACHS SHORT DURATION GOVERNMENT FUND
Schedule of Investments
September 30, 2014 (Unaudited)
| Principal Amount | Interest Rate | Maturity Date | Value | |||||||||||
| Mortgage-Backed Obligations – 44.0% | ||||||||||||||
| Collateralized Mortgage Obligations – 13.8% | ||||||||||||||
| Inverse Floaters(a) – 0.0% | ||||||||||||||
| FNMA REMIC Series 1990-134, Class SC |
| ||||||||||||
| $ | 13,525 | 21.368 | % | 11/25/20 | $ | 18,629 | ||||||||
|
| |||||||||||||
| IOette(b) – 0.0% | ||||||||||||||
| FHLMC REMIC Series 1161, Class U |
| ||||||||||||
| 288 | 1,172.807 | 11/15/21 | 7,313 | |||||||||||
|
| |||||||||||||
| Regular Floater(a) – 7.3% | ||||||||||||||
| FDIC Structured Sale Guaranteed Notes Series 2010-S1, | | ||||||||||||
| 8,076,865 | 0.703 | 02/25/48 | 8,087,494 | |||||||||||
| FNMA REMIC Series 1988-12, Class B |
| ||||||||||||
| 31,533 | 0.000 | 02/25/18 | 31,186 | |||||||||||
| FNMA REMIC Series 2007-33, Class HF |
| ||||||||||||
| 951,542 | 0.505 | 04/25/37 | 955,838 | |||||||||||
| NCUA Guaranteed Notes Series 2010-A1, Class A |
| ||||||||||||
| 2,957,916 | 0.504 | 12/07/20 | 2,963,431 | |||||||||||
| NCUA Guaranteed Notes Series 2010-R2, Class 1A |
| ||||||||||||
| 6,145,411 | 0.526 | 11/06/17 | 6,158,133 | |||||||||||
| NCUA Guaranteed Notes Series 2011-R1, Class 1A |
| ||||||||||||
| 4,947,951 | 0.606 | 01/08/20 | 4,974,238 | |||||||||||
| NCUA Guaranteed Notes Series 2011-R2, Class 1A |
| ||||||||||||
| 16,604,639 | 0.556 | 02/06/20 | 16,657,826 | |||||||||||
| NCUA Guaranteed Notes Series 2011-R3, Class 1A |
| ||||||||||||
| 15,913,017 | 0.554 | 03/11/20 | 15,963,988 | |||||||||||
| NCUA Guaranteed Notes Series 2011-R4, Class 1A |
| ||||||||||||
| 22,845,275 | 0.536 | 03/06/20 | 22,895,249 | |||||||||||
| NCUA Guaranteed Notes Series 2011-R5, Class 1A |
| ||||||||||||
| 12,724,288 | 0.536 | 04/06/20 | 12,744,667 | |||||||||||
| NCUA Guaranteed Notes Series 2011-R6, Class 1A |
| ||||||||||||
| 6,901,140 | 0.536 | 05/07/20 | 6,906,532 | |||||||||||
|
| |||||||||||||
| 98,338,582 | ||||||||||||||
|
| |||||||||||||
| Sequential Fixed Rate – 6.2% | ||||||||||||||
| FDIC Structured Sale Guaranteed Notes Series 2010-S1, | | ||||||||||||
| 8,117,844 | 3.250 | 04/25/38 | 8,250,106 | |||||||||||
| FHLMC REMIC Series 108, Class G |
| ||||||||||||
| 94,127 | 8.500 | 12/15/20 | 101,944 | |||||||||||
| FHLMC REMIC Series 1980, Class Z |
| ||||||||||||
| 633,691 | 7.000 | 07/15/27 | 722,746 | |||||||||||
| FHLMC REMIC Series 2019, Class Z |
| ||||||||||||
| 636,660 | 6.500 | 12/15/27 | 712,641 | |||||||||||
| FHLMC REMIC Series 2755, Class ZA |
| ||||||||||||
| 1,389,249 | 5.000 | 02/15/34 | 1,525,254 | |||||||||||
| FHLMC REMIC Series 3530, Class DB |
| ||||||||||||
| 11,071,790 | 4.000 | 05/15/24 | 11,799,491 | |||||||||||
| FHLMC REMIC Series 4273, Class PD |
| ||||||||||||
| 2,963,847 | 6.500 | 11/15/43 | 3,414,388 | |||||||||||
| FNMA REMIC Series 1989-66, Class J |
| ||||||||||||
| 156,399 | 7.000 | 09/25/19 | 168,911 | |||||||||||
| FNMA REMIC Series 1990-16, Class E |
| ||||||||||||
| 119,511 | 9.000 | 03/25/20 | 135,915 | |||||||||||
| FNMA REMIC Series 2005-65, Class WL |
| ||||||||||||
| 1,368,302 | 5.500 | 07/25/34 | 1,389,840 | |||||||||||
|
| |||||||||||||
| Mortgage-Backed Obligations – (continued) | ||||||||||||||
| Sequential Fixed Rate – (continued) | ||||||||||||||
| FNMA REMIC Series 2010-120, Class PC |
| ||||||||||||
| $ | 15,276,935 | 4.000 | % | 09/25/35 | $ | 16,040,262 | ||||||||
| FNMA REMIC Series 2012-111, Class B |
| ||||||||||||
| 1,534,169 | 7.000 | 10/25/42 | 1,740,540 | |||||||||||
| FNMA REMIC Series 2012-153, Class B |
| ||||||||||||
| 4,471,340 | 7.000 | 07/25/42 | 5,071,121 | |||||||||||
| NCUA Guaranteed Notes Series 2010-C1, Class A2 |
| ||||||||||||
| 20,000,000 | 2.900 | 10/29/20 | 20,654,680 | |||||||||||
| NCUA Guaranteed Notes Series 2010-R1, Class 2A |
| ||||||||||||
| 452,183 | 1.840 | 10/07/20 | 454,109 | |||||||||||
| NCUA Guaranteed Notes Series A4 |
| ||||||||||||
| 11,000,000 | 3.000 | 06/12/19 | 11,514,588 | |||||||||||
|
| |||||||||||||
| 83,696,536 | ||||||||||||||
|
| |||||||||||||
| Sequential Floating Rate(a) – 0.3% | ||||||||||||||
| FHLMC REMIC Series 4273, Class PS |
| ||||||||||||
| 3,856,801 | 5.946 | 11/15/43 | 568,888 | |||||||||||
| FNMA REMIC Series 1988-12, Class A |
| ||||||||||||
| 61,385 | 3.740 | 02/25/18 | 62,616 | |||||||||||
| NCUA Guaranteed Notes Series 2010-R1, Class 1A |
| ||||||||||||
| 4,238,178 | 0.606 | 10/07/20 | 4,258,872 | |||||||||||
|
| |||||||||||||
| 4,890,376 | ||||||||||||||
|
| |||||||||||||
| | TOTAL COLLATERALIZED MORTGAGE OBLIGATIONS | | $ | 186,951,436 | ||||||||||
|
| |||||||||||||
| Commercial Mortgage-Backed Securities – 7.8% | ||||||||||||||
| FHLMC Multifamily Structured Pass Through Certificates, | | ||||||||||||
| 41,541,090 | 0.535 | 07/25/20 | 41,691,448 | |||||||||||
| FHLMC Multifamily Structured Pass Through Certificates, | | ||||||||||||
| 13,162,389 | 0.495 | 01/25/21 | 13,155,082 | |||||||||||
| FNMA ACES Series 2009-M2, Class A2 |
| ||||||||||||
| 10,012,990 | 3.334 | 01/25/19 | 10,246,527 | |||||||||||
| FNMA ACES Series 2014-M1, Class ASQ2(a) |
| ||||||||||||
| 32,500,000 | 2.323 | 11/25/18 | 32,970,779 | |||||||||||
| FNMA ACES Series 2014-M5, Class FA(a) |
| ||||||||||||
| 6,684,712 | 0.523 | 01/25/17 | 6,693,953 | |||||||||||
|
| |||||||||||||
|
| TOTAL COMMERCIAL MORTGAGE-BACKED SECURITIES |
| $ | 104,757,789 | ||||||||||
|
| |||||||||||||
| Federal Agencies – 22.4% | ||||||||||||||
| Adjustable Rate FHLMC(a) – 0.4% | ||||||||||||||
| 36,222 | 1.740 | 05/01/18 | 36,461 | |||||||||||
| 40,860 | 2.799 | 10/01/25 | 41,471 | |||||||||||
| 654,071 | 2.425 | 11/01/34 | 701,083 | |||||||||||
| 3,186,543 | 2.375 | 06/01/35 | 3,427,861 | |||||||||||
| 306,667 | 2.831 | 05/01/36 | 328,709 | |||||||||||
| 83,412 | 2.137 | 10/01/36 | 88,411 | |||||||||||
| 149,465 | 2.654 | 11/01/36 | 160,208 | |||||||||||
|
| |||||||||||||
| 4,784,204 | ||||||||||||||
|
| |||||||||||||
| Adjustable Rate FNMA(a) – 3.2% | ||||||||||||||
| 1,914 | 1.820 | 11/01/17 | 1,916 | |||||||||||
| 53,758 | 2.529 | 02/01/18 | 54,125 | |||||||||||
| 52,366 | 2.076 | 06/01/18 | 52,561 | |||||||||||
|
| |||||||||||||
| 64 | The accompanying notes are an integral part of these financial statements. |
GOLDMAN SACHS SHORT DURATION GOVERNMENT FUND
| Principal Amount | Interest Rate | Maturity Date | Value | |||||||||||
| Mortgage-Backed Obligations – (continued) | ||||||||||||||
| Adjustable Rate FNMA(a) – (continued) | ||||||||||||||
| $ | 73,868 | 5.849 | % | 05/01/20 | $ | 78,453 | ||||||||
| 36,004 | 2.947 | 01/01/23 | 36,606 | |||||||||||
| 178,146 | 3.125 | 02/01/27 | 183,407 | |||||||||||
| 1,781,276 | 2.427 | 08/01/29 | 1,811,627 | |||||||||||
| 38,597 | 2.255 | 07/01/32 | 40,434 | |||||||||||
| 52,314 | 2.380 | 07/01/32 | 55,589 | |||||||||||
| 94,102 | 1.924 | 01/01/33 | 98,350 | |||||||||||
| 2,052,573 | 2.425 | 05/01/33 | 2,200,102 | |||||||||||
| 394,331 | 2.625 | 08/01/33 | 421,751 | |||||||||||
| 1,517,849 | 4.611 | 08/01/33 | 1,649,823 | |||||||||||
| 1,372,106 | 2.413 | 02/01/34 | 1,470,719 | |||||||||||
| 493,661 | 2.195 | 05/01/34 | 529,116 | |||||||||||
| 870,829 | 2.263 | 05/01/34 | 933,420 | |||||||||||
| 731,289 | 2.345 | 06/01/34 | 783,846 | |||||||||||
| 634,192 | 2.287 | 10/01/34 | 678,914 | |||||||||||
| 546,405 | 2.326 | 10/01/34 | 580,849 | |||||||||||
| 1,425,461 | 2.131 | 02/01/35 | 1,504,639 | |||||||||||
| 157,214 | 2.187 | 02/01/35 | 166,245 | |||||||||||
| 370,694 | 2.278 | 03/01/35 | 393,615 | |||||||||||
| 1,197,803 | 2.345 | 03/01/35 | 1,275,118 | |||||||||||
| 1,831,802 | 1.891 | 04/01/35 | 1,931,729 | |||||||||||
| 2,742,899 | 1.954 | 04/01/35 | 2,917,660 | |||||||||||
| 959,208 | 2.345 | 04/01/35 | 1,021,384 | |||||||||||
| 616,893 | 2.023 | 05/01/35 | 653,830 | |||||||||||
| 337,100 | 2.052 | 05/01/35 | 355,888 | |||||||||||
| 2,810,998 | 2.348 | 08/01/35 | 3,013,024 | |||||||||||
| 754,248 | 2.233 | 10/01/35 | 799,377 | |||||||||||
| 1,816,276 | 2.337 | 03/01/36 | 1,934,635 | |||||||||||
| 544,489 | 2.317 | 04/01/36 | 575,260 | |||||||||||
| 1,881,344 | 2.552 | 04/01/36 | 2,016,565 | |||||||||||
| 2,429,526 | 2.397 | 06/01/36 | 2,604,148 | |||||||||||
| 1,448,040 | 2.534 | 06/01/36 | 1,540,345 | |||||||||||
| 1,902,479 | 2.473 | 07/01/36 | 2,020,101 | |||||||||||
| 3,432,120 | 2.385 | 09/01/36 | 3,669,900 | |||||||||||
| 494,835 | 2.560 | 11/01/36 | 530,402 | |||||||||||
| 2,082,700 | 2.356 | 07/01/37 | 2,232,395 | |||||||||||
| 109,275 | 2.570 | 12/01/46 | 117,129 | |||||||||||
|
| |||||||||||||
| 42,934,997 | ||||||||||||||
|
| |||||||||||||
| Adjustable Rate GNMA(a) – 0.5% | ||||||||||||||
| 435,300 | 1.625 | 05/20/34 | 450,758 | |||||||||||
| 795,760 | 1.625 | 07/20/34 | 824,067 | |||||||||||
| 510,354 | 1.625 | 08/20/34 | 528,522 | |||||||||||
| 3,811,775 | 1.625 | 09/20/34 | 3,947,533 | |||||||||||
| 508,110 | 1.625 | 10/20/34 | 525,369 | |||||||||||
| 779,365 | 1.625 | 12/20/34 | 804,572 | |||||||||||
|
| |||||||||||||
| 7,080,821 | ||||||||||||||
|
| |||||||||||||
| FHLMC – 0.4% | ||||||||||||||
| 2,712 | 8.500 | 10/01/15 | 2,731 | |||||||||||
| 20,088 | 8.000 | 12/01/15 | 20,425 | |||||||||||
| 3,529 | 7.000 | 03/01/16 | 3,568 | |||||||||||
| 854,209 | 5.500 | 01/01/20 | 914,573 | |||||||||||
| 259,817 | 7.000 | 04/01/22 | 286,712 | |||||||||||
| 4,212 | 4.500 | 05/01/23 | 4,541 | |||||||||||
| 31,777 | 7.500 | 01/01/31 | 37,031 | |||||||||||
|
| |||||||||||||
| Mortgage-Backed Obligations – (continued) | ||||||||||||||
| FHLMC – (continued) | ||||||||||||||
| $ | 5,485 | 6.000 | % | 06/01/36 | $ | 6,184 | ||||||||
| 4,194,480 | 7.000 | 02/01/39 | 4,772,859 | |||||||||||
|
| |||||||||||||
| 6,048,624 | ||||||||||||||
|
| |||||||||||||
| FNMA – 17.3% | ||||||||||||||
| 348 | 8.500 | 09/01/15 | 349 | |||||||||||
| 15,367 | 8.500 | 10/01/15 | 15,716 | |||||||||||
| 1,594 | 8.500 | 12/01/15 | 1,604 | |||||||||||
| 8,783,873 | 3.660 | 01/01/18 | 9,333,870 | |||||||||||
| 2,203 | 5.500 | 01/01/18 | 2,331 | |||||||||||
| 7,257,524 | 2.800 | 03/01/18 | 7,511,800 | |||||||||||
| 59,913,260 | 3.743 | 06/01/18 | 63,908,372 | |||||||||||
| 123,817 | 5.500 | 07/01/18 | 131,522 | |||||||||||
| 93,825 | 5.500 | 08/01/18 | 99,481 | |||||||||||
| 183,355 | 5.500 | 09/01/18 | 195,011 | |||||||||||
| 15,800,000 | 2.960 | 11/01/18 | 16,339,194 | |||||||||||
| 25,715 | 5.500 | 12/01/18 | 27,421 | |||||||||||
| 13,551 | 5.500 | 01/01/19 | 14,476 | |||||||||||
| 75,101 | 6.000 | 01/01/19 | 84,792 | |||||||||||
| 18,934 | 5.500 | 03/01/19 | 20,227 | |||||||||||
| 1,817 | 5.500 | 08/01/19 | 1,925 | |||||||||||
| 8,118 | 5.000 | 09/01/19 | 8,674 | |||||||||||
| 28,315 | 7.000 | 11/01/19 | 30,217 | |||||||||||
| 40,986,286 | 4.317 | 07/01/21 | 45,069,667 | |||||||||||
| 35,184 | 6.000 | 03/01/22 | 39,724 | |||||||||||
| 214,361 | 5.000 | 07/01/23 | 236,491 | |||||||||||
| 2,455,761 | 5.500 | 09/01/23 | 2,662,625 | |||||||||||
| 593,475 | 5.500 | 10/01/23 | 643,882 | |||||||||||
| 10,344 | 6.000 | 07/01/24 | 11,681 | |||||||||||
| 5,254 | 7.000 | 12/01/24 | 6,021 | |||||||||||
| 109,051 | 5.000 | 06/01/25 | 120,277 | |||||||||||
| 83,302 | 6.000 | 02/01/26 | 94,678 | |||||||||||
| 321,779 | 6.000 | 08/01/27 | 364,082 | |||||||||||
| 1,594 | 7.000 | 08/01/27 | 1,861 | |||||||||||
| 1,595 | 7.000 | 10/01/28 | 1,760 | |||||||||||
| 33,303 | 6.000 | 01/01/29 | 37,600 | |||||||||||
| 1,647 | 7.000 | 01/01/29 | 1,852 | |||||||||||
| 1,457,503 | 4.500 | 09/01/29 | 1,578,705 | |||||||||||
| 407 | 7.000 | 11/01/29 | 412 | |||||||||||
| 1,144 | 7.000 | 04/01/31 | 1,277 | |||||||||||
| 9,624 | 7.000 | 05/01/32 | 11,103 | |||||||||||
| 8,670 | 7.000 | 06/01/32 | 9,668 | |||||||||||
| 4,150 | 7.000 | 08/01/32 | 4,648 | |||||||||||
| 30,476 | 6.000 | 03/01/33 | 34,850 | |||||||||||
| 4,123 | 5.000 | 04/01/33 | 4,555 | |||||||||||
| 8,049 | 6.000 | 04/01/33 | 9,204 | |||||||||||
| 2,042,592 | 6.500 | 04/01/33 | 2,349,551 | |||||||||||
| 967,952 | 5.000 | 12/01/33 | 1,069,237 | |||||||||||
| 1,988 | 7.000 | 04/01/34 | 2,215 | |||||||||||
| 31,722 | 6.000 | 01/01/35 | 36,246 | |||||||||||
| 3,735,426 | 6.000 | 04/01/35 | 4,271,617 | |||||||||||
| 107,130 | 6.000 | 06/01/35 | 121,195 | |||||||||||
| 255,843 | 6.000 | 09/01/35 | 289,433 | |||||||||||
| 550 | 6.000 | 11/01/35 | 621 | |||||||||||
| 63,816 | 6.000 | 01/01/36 | 72,195 | |||||||||||
| 109,741 | 6.000 | 05/01/36 | 123,886 | |||||||||||
|
| |||||||||||||
| The accompanying notes are an integral part of these financial statements. | 65 |
GOLDMAN SACHS SHORT DURATION GOVERNMENT FUND
Schedule of Investments (continued)
September 30, 2014 (Unaudited)
| Principal Amount | Interest Rate | Maturity Date | Value | |||||||||||
| Mortgage-Backed Obligations – (continued) | ||||||||||||||
| FNMA – (continued) | ||||||||||||||
| $ | 12,532 | 6.000 | % | 06/01/36 | $ | 14,148 | ||||||||
| 2,324,539 | 6.000 | 07/01/36 | 2,624,172 | |||||||||||
| 861,450 | 6.000 | 08/01/36 | 972,491 | |||||||||||
| 675,544 | 6.000 | 09/01/36 | 764,030 | |||||||||||
| 1,788,568 | 6.000 | 04/01/37 | 2,029,835 | |||||||||||
| 1,636,575 | 6.000 | 07/01/37 | 1,847,051 | |||||||||||
| 1,906,431 | 6.000 | 08/01/37 | 2,151,611 | |||||||||||
| 2,920,343 | 6.000 | 09/01/37 | 3,295,921 | |||||||||||
| 254,933 | 7.500 | 10/01/37 | 279,069 | |||||||||||
| 430,953 | 6.000 | 11/01/37 | 486,376 | |||||||||||
| 161,857 | 6.000 | 12/01/37 | 182,674 | |||||||||||
| 90,634 | 6.000 | 02/01/38 | 102,291 | |||||||||||
| 110,617 | 6.000 | 04/01/38 | 124,844 | |||||||||||
| 12,519,536 | 6.000 | 10/01/38 | 14,133,303 | |||||||||||
| 230,826 | 6.000 | 11/01/38 | 260,513 | |||||||||||
| 873,536 | 6.000 | 12/01/38 | 985,949 | |||||||||||
| 118,407 | 6.000 | 01/01/39 | 133,644 | |||||||||||
| 144,064 | 6.000 | 02/01/39 | 162,634 | |||||||||||
| 2,536,782 | 7.000 | 03/01/39 | 2,875,622 | |||||||||||
| 14,971 | 4.500 | 08/01/39 | 16,156 | |||||||||||
| 509,192 | 6.000 | 09/01/39 | 574,678 | |||||||||||
| 169,396 | 6.000 | 10/01/39 | 191,231 | |||||||||||
| 14,946 | 6.000 | 12/01/39 | 16,868 | |||||||||||
| 825,592 | 6.000 | 06/01/40 | 931,770 | |||||||||||
| 848,216 | 6.000 | 07/01/40 | 957,303 | |||||||||||
| 82,967 | 6.000 | 09/01/40 | 93,644 | |||||||||||
| 126,874 | 6.000 | 10/01/40 | 143,191 | |||||||||||
| 183,649 | 6.000 | 05/01/41 | 207,268 | |||||||||||
| 1,305,579 | 4.500 | 08/01/41 | 1,411,402 | |||||||||||
| 337,544 | 4.500 | 10/01/41 | 364,745 | |||||||||||
| 136,190 | 5.000 | 02/01/42 | 150,799 | |||||||||||
| 2,497,743 | 3.000 | 08/01/42 | 2,482,149 | |||||||||||
| 2,185,693 | 3.000 | 09/01/42 | 2,172,135 | |||||||||||
| 371,561 | 3.000 | 10/01/42 | 369,282 | |||||||||||
| 1,465,312 | 3.000 | 11/01/42 | 1,455,890 | |||||||||||
| 13,689,215 | 3.000 | 12/01/42 | 13,596,181 | |||||||||||
| 9,357,891 | 3.000 | 01/01/43 | 9,296,380 | |||||||||||
| 2,680,992 | 3.000 | 02/01/43 | 2,661,215 | |||||||||||
| 702,421 | 3.000 | 03/01/43 | 697,674 | |||||||||||
| 1,879,694 | 3.000 | 04/01/43 | 1,866,089 | |||||||||||
| 97,288 | 3.000 | 05/01/43 | 96,028 | |||||||||||
| 3,000,000 | 6.000 | TBA-30yr | (d) | 3,387,343 | ||||||||||
|
| |||||||||||||
| 233,575,400 | ||||||||||||||
|
| |||||||||||||
| GNMA – 0.6% | ||||||||||||||
| 348,440 | 5.500 | 07/15/20 | 369,254 | |||||||||||
| 7,023 | 6.500 | 01/15/32 | 8,005 | |||||||||||
| 13,385 | 6.500 | 02/15/32 | 15,245 | |||||||||||
| 14,090 | 6.500 | 08/15/34 | 16,491 | |||||||||||
| 25,740 | 6.500 | 05/15/35 | 29,449 | |||||||||||
| 6,670 | 6.500 | 06/15/35 | 7,580 | |||||||||||
| 13,091 | 6.500 | 07/15/35 | 14,849 | |||||||||||
| 3,442 | 6.500 | 08/15/35 | 3,902 | |||||||||||
| 15,525 | 6.500 | 09/15/35 | 17,616 | |||||||||||
| 8,108 | 6.500 | 10/15/35 | 9,192 | |||||||||||
| 51,704 | 6.500 | 11/15/35 | 58,849 | |||||||||||
|
| |||||||||||||
| Mortgage-Backed Obligations – (continued) | ||||||||||||||
| GNMA – (continued) | ||||||||||||||
| $ | 48,662 | 6.500 | % | 12/15/35 | $ | 55,321 | ||||||||
| 65,494 | 6.500 | 01/15/36 | 74,590 | |||||||||||
| 56,356 | 6.500 | 02/15/36 | 63,932 | |||||||||||
| 63,499 | 6.500 | 03/15/36 | 72,087 | |||||||||||
| 138,408 | 6.500 | 04/15/36 | 157,512 | |||||||||||
| 234,240 | 6.500 | 05/15/36 | 267,218 | |||||||||||
| 202,129 | 6.500 | 06/15/36 | 230,147 | |||||||||||
| 844,127 | 6.500 | 07/15/36 | 969,256 | |||||||||||
| 898,793 | 6.500 | 08/15/36 | 1,028,371 | |||||||||||
| 1,380,622 | 6.500 | 09/15/36 | 1,578,178 | |||||||||||
| 517,595 | 6.500 | 10/15/36 | 588,777 | |||||||||||
| 733,536 | 6.500 | 11/15/36 | 835,047 | |||||||||||
| 292,173 | 6.500 | 12/15/36 | 336,206 | |||||||||||
| 139,436 | 6.500 | 01/15/37 | 159,414 | |||||||||||
| 53,548 | 6.500 | 02/15/37 | 61,589 | |||||||||||
| 33,951 | 6.500 | 03/15/37 | 39,112 | |||||||||||
| 94,686 | 6.500 | 04/15/37 | 108,088 | |||||||||||
| 59,096 | 6.500 | 05/15/37 | 67,473 | |||||||||||
| 31,158 | 6.500 | 08/15/37 | 35,323 | |||||||||||
| 222,187 | 6.500 | 09/15/37 | 252,581 | |||||||||||
| 217,387 | 6.500 | 10/15/37 | 246,448 | |||||||||||
| 150,126 | 6.500 | 11/15/37 | 174,964 | |||||||||||
| 8,305 | 6.500 | 02/15/38 | 9,415 | |||||||||||
| 52,859 | 6.500 | 05/15/38 | 60,127 | |||||||||||
| 6,251 | 6.500 | 08/15/38 | 7,090 | |||||||||||
| 133,345 | 6.000 | 11/15/38 | 149,755 | |||||||||||
| 56,996 | 6.500 | 11/15/38 | 66,598 | |||||||||||
| 25,660 | 6.500 | 01/15/39 | 29,090 | |||||||||||
| 47,315 | 6.500 | 02/15/39 | 54,731 | |||||||||||
|
| |||||||||||||
| 8,328,872 | ||||||||||||||
|
| |||||||||||||
| TOTAL FEDERAL AGENCIES | $ | 302,752,918 | ||||||||||||
|
| |||||||||||||
| TOTAL MORTGAGE-BACKED OBLIGATIONS | ||||||||||||||
| (Cost $587,098,975) | $ | 594,462,143 | ||||||||||||
|
| |||||||||||||
| Agency Debentures – 24.8% | ||||||||||||||
| FFCB |
| ||||||||||||
| $ | 3,200,000 | 1.460 | % | 11/19/19 | $ | 3,089,085 | ||||||||
| 16,000,000 | 3.500 | 12/20/23 | 16,879,482 | |||||||||||
| FHLB |
| ||||||||||||
| 30,500,000 | 0.000 | (e) | 11/19/14 | 30,499,451 | ||||||||||
| 44,500,000 | 0.000 | (e) | 12/17/14 | 44,498,576 | ||||||||||
| 12,200,000 | 2.125 | 06/10/16 | 12,525,209 | |||||||||||
| 3,200,000 | 1.530 | 11/21/19 | 3,114,240 | |||||||||||
| 7,000,000 | 1.875 | 03/13/20 | 6,948,952 | |||||||||||
| 2,300,000 | 3.250 | 06/09/23 | 2,373,266 | |||||||||||
| 1,800,000 | 5.375 | 08/15/24 | 2,180,977 | |||||||||||
| FHLMC |
| ||||||||||||
| 9,700,000 | 0.500 | 08/28/15 | 9,728,693 | |||||||||||
| 2,780,000 | 0.850 | 12/26/17 | 2,733,763 | |||||||||||
| 4,800,000 | 1.000 | 01/17/18 | 4,742,074 | |||||||||||
|
| |||||||||||||
| 66 | The accompanying notes are an integral part of these financial statements. |
GOLDMAN SACHS SHORT DURATION GOVERNMENT FUND
| Principal Amount | Interest Rate | Maturity Date | Value | |||||||||||
| Agency Debentures – (continued) | ||||||||||||||
| FNMA |
| ||||||||||||
| $ | 6,900,000 | 0.750 | % | 12/19/14 | $ | 6,909,405 | ||||||||
| 26,100,000 | 0.375 | 03/16/15 | 26,127,718 | |||||||||||
| 7,900,000 | 0.500 | 05/27/15 | 7,918,123 | |||||||||||
| 8,000,000 | 0.500 | 07/02/15 | 8,018,616 | |||||||||||
| 16,500,000 | 0.500 | 10/22/15 | 16,543,027 | |||||||||||
| 96,700,000 | 2.375 | 04/11/16 | 99,511,833 | |||||||||||
| 5,200,000 | 6.250 | 05/15/29 | 7,023,286 | |||||||||||
| 16,080,000 | 7.125 | 01/15/30 | 23,704,158 | |||||||||||
| Small Business Administration |
| ||||||||||||
| 31,324 | 7.200 | 06/01/17 | 33,033 | |||||||||||
| 92,325 | 6.300 | 05/01/18 | 97,166 | |||||||||||
| 63,657 | 6.300 | 06/01/18 | 66,693 | |||||||||||
|
| |||||||||||||
| TOTAL AGENCY DEBENTURES | ||||||||||||||
| (Cost $334,423,205) | $ | 335,266,826 | ||||||||||||
|
| |||||||||||||
| Government Guarantee Obligation(f) – 1.5% | ||||||||||||||
| Hashemite Kingdom of Jordan Government AID Bond |
| ||||||||||||
| $ | 19,300,000 | 2.503 | % | 10/30/20 | $ | 19,686,000 | ||||||||
| (Cost $19,300,000) | ||||||||||||||
|
| |||||||||||||
| U.S. Treasury Obligations – 24.2% | ||||||||||||||
| United States Treasury Bonds |
| ||||||||||||
| $ | 1,000,000 | 2.750 | % | 11/15/42 | $ | 914,820 | ||||||||
| 2,100,000 | 3.625 | 08/15/43 | 2,269,869 | |||||||||||
| 4,500,000 | 3.750 | (g) | 11/15/43 | 4,973,445 | ||||||||||
| 7,300,000 | 3.375 | 05/15/44 | 7,535,936 | |||||||||||
| United States Treasury Inflation Protected Securities |
| ||||||||||||
| 1,622,088 | 1.625 | 01/15/15 | 1,623,856 | |||||||||||
| 17,150,640 | 0.500 | 04/15/15 | 17,169,334 | |||||||||||
| 6,001,961 | 1.875 | 07/15/15 | 6,138,866 | |||||||||||
| 1,320,440 | 2.000 | 01/15/16 | 1,367,276 | |||||||||||
| 4,901,130 | 1.125 | 01/15/21 | 5,144,667 | |||||||||||
| 11,263,462 | 0.125 | 01/15/22 | 11,008,232 | |||||||||||
| 2,252,316 | 0.375 | 07/15/23 | 2,230,153 | |||||||||||
| 9,026,524 | 0.625 | 01/15/24 | 9,077,253 | |||||||||||
| 903,060 | 0.125 | 07/15/24 | 867,642 | |||||||||||
| 1,380,092 | 1.375 | 02/15/44 | 1,477,347 | |||||||||||
| United States Treasury Notes |
| ||||||||||||
| 159,500,000 | 0.375 | 04/30/16 | 159,436,198 | |||||||||||
| 47,900,000 | 1.000 | (g) | 05/31/18 | 47,187,249 | ||||||||||
| 16,800,000 | 1.500 | 01/31/19 | 16,696,008 | |||||||||||
| 3,700,000 | 1.625 | 04/30/19 | 3,686,088 | |||||||||||
| 8,000,000 | 1.500 | 05/31/19 | 7,916,880 | |||||||||||
| 15,600,000 | 1.750 | 09/30/19 | 15,577,380 | |||||||||||
| 4,100,000 | 2.125 | 06/30/21 | 4,081,714 | |||||||||||
|
| |||||||||||||
| TOTAL U.S. TREASURY OBLIGATIONS | ||||||||||||||
| (Cost $326,050,616) | $ | 326,380,213 | ||||||||||||
|
| |||||||||||||
Notional Amount | Exercise Rate | Expiration Date | Value | |||||||||||
| Options Purchased – 0.4% | ||||||||||||||
| Interest Rate Swaptions | ||||||||||||||
| Bank of America NA Call – OTC – 10 year Interest Rate Swap | | ||||||||||||
| $ | 10,300,000 | 3.590 | % | 03/22/16 | $ | 202,985 | ||||||||
| Bank of America NA Call – OTC – 10 year Interest Rate Swap | | ||||||||||||
| 9,500,000 | 4.070 | 03/29/16 | 98,300 | |||||||||||
| Citibank Securities, Inc. Put – OTC – 10 year Interest Rate Swap | | ||||||||||||
| 2,100,000 | 3.388 | 09/19/16 | 97,706 | |||||||||||
| Citibank Securities, Inc. Call – OTC – 10 year Interest Rate Swap | | ||||||||||||
| 2,100,000 | 3.388 | 09/19/16 | 74,757 | |||||||||||
| Citibank Securities, Inc. Call – OTC – 10 year Interest Rate Swap | | ||||||||||||
| 14,500,000 | 3.633 | 02/19/16 | 247,313 | |||||||||||
| Citibank Securities, Inc. Call – OTC – 10 year Interest Rate Swap | | ||||||||||||
| 8,900,000 | 3.645 | 02/16/16 | 147,097 | |||||||||||
| Deutsche Bank AG Call – OTC – 2 year Interest Rate Swap Strike | | ||||||||||||
| 32,300,000 | 1.950 | 10/26/15 | 182,757 | |||||||||||
| Deutsche Bank AG Call – OTC – 2 year Interest Rate Swap Strike | | ||||||||||||
| 32,200,000 | 2.030 | 10/26/15 | 163,312 | |||||||||||
| Deutsche Bank AG Put – OTC – 30 year Interest Rate Swap | | ||||||||||||
| 9,000,000 | 2.550 | 09/28/15 | 146,103 | |||||||||||
| Deutsche Bank AG Call – OTC – 30 year Interest Rate Swap | | ||||||||||||
| 9,000,000 | 2.550 | 09/28/15 | 137,558 | |||||||||||
| Deutsche Bank AG Put – OTC – 5 year Interest Rate Swap Strike | | ||||||||||||
| 4,700,000 | 2.940 | 09/29/16 | 107,223 | |||||||||||
| Deutsche Bank AG Call – OTC – 5 year Interest Rate Swap Strike | | ||||||||||||
| 4,700,000 | 2.940 | 09/29/16 | 112,406 | |||||||||||
| Deutsche Bank AG Put – OTC – 5 year Interest Rate Swap Strike | | ||||||||||||
| 2,300,000 | 3.018 | 09/26/16 | 57,036 | |||||||||||
| Deutsche Bank AG Call – OTC – 5 year Interest Rate Swap Strike | | ||||||||||||
| 2,300,000 | 3.018 | 09/26/16 | 50,838 | |||||||||||
| Deutsche Bank AG Call – OTC – 10 year Interest Rate Swap | | ||||||||||||
| 5,600,000 | 3.670 | 03/08/16 | 95,189 | |||||||||||
| Deutsche Bank AG Call – OTC – 10 year Interest Rate Swap | | ||||||||||||
| 3,300,000 | 3.780 | 09/26/16 | 78,556 | |||||||||||
| Deutsche Bank AG Put – OTC – 30 Year Interest Rate Swap | | ||||||||||||
| 1,700,000 | 3.960 | 01/29/16 | 231,058 | |||||||||||
| Deutsche Bank AG Call – OTC – 30 Year Interest Rate Swap | | ||||||||||||
| 1,700,000 | 3.960 | 01/29/16 | 44,031 | |||||||||||
|
| |||||||||||||
| The accompanying notes are an integral part of these financial statements. | 67 |
GOLDMAN SACHS SHORT DURATION GOVERNMENT FUND
Schedule of Investments (continued)
September 30, 2014 (Unaudited)
Notional Amount | Exercise Rate | Expiration Date | Value | |||||||||||
| Options Purchased – (continued) | ||||||||||||||
| Interest Rate Swaptions – (continued) | ||||||||||||||
| Deutsche Bank AG Put – OTC – 30 year Interest Rate Swap | | ||||||||||||
| $ | 1,900,000 | 4.015 | % | 04/15/19 | $ | 287,354 | ||||||||
| Deutsche Bank AG Call – OTC – 30 year Interest Rate Swap | | ||||||||||||
| 1,900,000 | 4.015 | 04/15/19 | 137,899 | |||||||||||
| Deutsche Bank AG Put – OTC – 10 year Interest Rate Swap | | ||||||||||||
| 5,800,000 | 4.113 | 04/16/19 | 482,128 | |||||||||||
| Deutsche Bank AG Call – OTC – 10 year Interest Rate Swap | | ||||||||||||
| 5,800,000 | 4.113 | 04/16/19 | 229,321 | |||||||||||
| Deutsche Bank AG Put – OTC – 10 year Interest Rate Swap | | ||||||||||||
| 5,800,000 | 4.135 | 04/17/19 | 488,558 | |||||||||||
| Deutsche Bank AG Call – OTC – 10 year Interest Rate Swap | | ||||||||||||
| 5,800,000 | 4.135 | 04/17/19 | 226,038 | |||||||||||
| JPMorgan Chase Bank NA Call – OTC – 2 year Interest Rate | | ||||||||||||
| 31,100,000 | 1.855 | 11/02/15 | 207,602 | |||||||||||
| JPMorgan Chase Bank NA Call – OTC – 5 year Interest Rate | | ||||||||||||
| 9,300,000 | 2.783 | 09/30/15 | 103,463 | |||||||||||
| JPMorgan Chase Bank NA Put – OTC – 5 year Interest Rate | | ||||||||||||
| 7,200,000 | 2.973 | 09/26/16 | 170,296 | |||||||||||
| JPMorgan Chase Bank NA Call – OTC – 5 year Interest Rate | | ||||||||||||
| 7,200,000 | 2.973 | 09/26/16 | 165,819 | |||||||||||
| JPMorgan Chase Bank NA Put – OTC – 5 year Interest Rate | | ||||||||||||
| 2,000,000 | 2.988 | 09/26/16 | 48,062 | |||||||||||
| JPMorgan Chase Bank NA Call – OTC – 5 year Interest Rate | | ||||||||||||
| 2,000,000 | 2.988 | 09/26/16 | 45,436 | |||||||||||
| JPMorgan Chase Bank NA Put – OTC – 5 year Interest Rate | | ||||||||||||
| 3,100,000 | 3.000 | 09/22/16 | 75,469 | |||||||||||
| JPMorgan Chase Bank NA Call – OTC – 5 year Interest Rate | | ||||||||||||
| 3,100,000 | 3.000 | 09/22/16 | 69,409 | |||||||||||
| JPMorgan Chase Bank NA Put – OTC – 10 year Interest Rate | | ||||||||||||
| 2,600,000 | 3.413 | 09/19/16 | 124,127 | |||||||||||
| JPMorgan Chase Bank NA Call – OTC – 10 year Interest Rate | | ||||||||||||
| 2,600,000 | 3.413 | 09/19/16 | 90,268 | |||||||||||
| JPMorgan Chase Bank NA Put – OTC – 10 year Interest Rate | | ||||||||||||
| 7,000,000 | 3.498 | 07/02/15 | 407,889 | |||||||||||
| JPMorgan Chase Bank NA Call – OTC – 10 year Interest Rate | | ||||||||||||
| 7,000,000 | 3.498 | 07/02/15 | 53,150 | |||||||||||
|
| |||||||||||||
| Options Purchased – (continued) | ||||||||||||||
| Interest Rate Swaptions – (continued) | ||||||||||||||
| JPMorgan Chase Bank NA Call – OTC – 10 year Interest Rate | | ||||||||||||
| $ | 9,400,000 | 3.610 | % | 02/16/16 | $ | 163,216 | ||||||||
|
| |||||||||||||
| TOTAL OPTIONS PURCHASED – 0.4% | ||||||||||||||
| (Cost $7,137,278) | $ | 5,849,729 | ||||||||||||
|
| |||||||||||||
| | TOTAL INVESTMENTS BEFORE SHORT-TERM INVESTMENT | | ||||||||||||
| (Cost $1,274,010,074) | $ | 1,281,644,911 | ||||||||||||
|
| |||||||||||||
| Principal Amount | Interest Rate | Maturity Date | Value | |||||||||||
| Short-term Investment(h) – 4.4% | ||||||||||||||
| Repurchase Agreement – 4.4% | ||||||||||||||
| Joint Repurchase Agreement Account II |
| ||||||||||||
| $ | 59,200,000 | 0.012 | % | 10/01/14 | $ | 59,200,000 | ||||||||
| (Cost $59,200,000) | ||||||||||||||
|
| |||||||||||||
| TOTAL INVESTMENTS – 99.3% | ||||||||||||||
| (Cost $1,333,210,074) | $ | 1,340,844,911 | ||||||||||||
|
| |||||||||||||
|
| OTHER ASSETS IN EXCESS OF LIABILITIES – 0.7% |
| 8,811,233 | |||||||||||
|
| |||||||||||||
| NET ASSETS – 100.0% | $ | 1,349,656,144 | ||||||||||||
|
| |||||||||||||
| The percentage shown for each investment category reflects the value of investments in that category as a percentage of net assets. | ||
(a) | Variable rate security. Interest rate or distribution rate disclosed is that which is in effect at September 30, 2014. | |
(b) | Security with a notional or nominal principal amount. The actual effective yield of this security is different than the stated interest rate. | |
(c) | Exempt from registration under Rule 144A of the Securities Act of 1933. Under procedures approved by the Board of Trustees, such securities have been determined to be liquid by the investment adviser and may be resold, normally to qualified institutional buyers in transactions exempt from registration. Total market value of Rule 144A securities amounts to $16,337,600, which represents approximately 1.2% of net assets as of September 30, 2014. | |
(d) | TBA (To Be Announced) Securities are purchased on a forward commitment basis with an approximate principal amount and no defined maturity date. The actual principal and maturity date will be determined upon settlement when the specific mortgage pools are assigned. Total market value of TBA securities (excluding forward sales contracts, if any) amounts to $3,387,343 which represents approximately 0.3% of net assets as of September 30, 2014. | |
(e) | Issued with a zero coupon. Income is recognized through the accretion of discount. | |
(f) | Guaranteed by the United States Government until maturity. Total market value for these securities amounts to $19,686,000, which represents approximately 1.5% of net assets as of September 30, 2014. | |
(g) | A portion of this security is segregated as collateral for initial margin requirements on futures transactions. | |
(h) | Joint repurchase agreement was entered into on September 30, 2014. Additional information appears on page 87. | |
| 68 | The accompanying notes are an integral part of these financial statements. |
GOLDMAN SACHS SHORT DURATION GOVERNMENT FUND
| ||
Investment Abbreviations: | ||
ACES | —Alternative Credit Enhancement Securities | |
FDIC | —Federal Deposit Insurance Corp. | |
FFCB | —Federal Farm Credit Bank | |
FHLB | —Federal Home Loan Bank | |
FHLMC | —Federal Home Loan Mortgage Corp. | |
FNMA | —Federal National Mortgage Association | |
GNMA | —Government National Mortgage Association | |
LIBOR | —London Interbank Offered Rate | |
NCUA | —National Credit Union Administration | |
OTC | —Over the Counter | |
REMIC | —Real Estate Mortgage Investment Conduit | |
| ||
| ADDITIONAL INVESTMENT INFORMATION |
FORWARD SALES CONTRACTS — At September 30, 2014, the Fund had the following forward sales contracts:
| Description | Interest Rate | Maturity Date(d) | Settlement Date | Principal Amount | Value | |||||||||||
FNMA (Proceeds Receivable: $33,570,781) | 3.000 | % | TBA-30yr | 10/14/2014 | $(34,000,000) | $ | (33,508,595 | ) | ||||||||
FUTURES CONTRACTS — At September 30, 2014, the Fund had the following futures contracts:
| Type | Number of Contracts Long (Short) | Expiration Date | Current Value | Unrealized Gain (Loss) | ||||||||||
Eurodollars | (350 | ) | March 2017 | $ | (85,378,125 | ) | $ | 111,712 | ||||||
Eurodollars | (295 | ) | June 2017 | (71,821,437 | ) | 127,583 | ||||||||
Eurodollars | (172 | ) | September 2017 | (41,811,050 | ) | 89,575 | ||||||||
Ultra Long U.S. Treasury Bonds | (75 | ) | December 2014 | (11,437,500 | ) | 125,555 | ||||||||
2 Year U.S. Treasury Notes | 4,083 | December 2014 | 893,539,031 | (208,912 | ) | |||||||||
5 Year U.S. Treasury Notes | (122 | ) | December 2014 | (14,427,453 | ) | (260 | ) | |||||||
10 Year U.S. Treasury Notes | (190 | ) | December 2014 | (23,681,719 | ) | (88,663 | ) | |||||||
20 Year U.S. Treasury Bonds | (389 | ) | December 2014 | (53,645,531 | ) | 672,380 | ||||||||
| TOTAL | $ | 828,970 | ||||||||||||
| The accompanying notes are an integral part of these financial statements. | 69 |
GOLDMAN SACHS SHORT DURATION GOVERNMENT FUND
Schedule of Investments (continued)
September 30, 2014 (Unaudited)
| ADDITIONAL INVESTMENT INFORMATION (continued) |
SWAP CONTRACTS — At September 30, 2014, the Fund had the following swap contracts:
CENTRALLY CLEARED INTEREST RATE SWAP CONTRACTS
| Rates Exchanged | Market Value | |||||||||||||||||||||
| Notional Amount (000s) | Termination Date | Payments Received | Payments Made | Upfront Payments Made (Received) | Unrealized Gain (Loss) | |||||||||||||||||
| $ | 31,000 | 11/02/16 | 3 month LIBOR | 1.780% | $ | (567,282 | ) | $ | (234,741 | ) | ||||||||||||
| 4,200 | (a) | 02/01/17 | 3 month LIBOR | 1.625 | (3,473 | ) | 4,709 | |||||||||||||||
| 19,100 | (a) | 08/04/17 | 3 month LIBOR | 2.195 | (16,189 | ) | 9,928 | |||||||||||||||
| 14,500 | (a) | 10/28/17 | 1.450% | 3 month LIBOR | (177,793 | ) | 60,257 | |||||||||||||||
| 133,200 | (a) | 01/11/18 | 3 month LIBOR | 1.876 | 400 | (123,476 | ) | |||||||||||||||
| 201,500 | (a) | 12/17/19 | 3 month LIBOR | 2.250 | (2,108,133 | ) | 375,415 | |||||||||||||||
| 3,400 | (a) | 10/02/20 | 2.533 | 3 month LIBOR | 17 | — | ||||||||||||||||
| 28,900 | (a) | 08/04/21 | 3.025 | 3 month LIBOR | 99,705 | 57,459 | ||||||||||||||||
| 38,600 | (a) | 12/17/21 | 3 month LIBOR | 2.500 | (297,902 | ) | 83,826 | |||||||||||||||
| 12,400 | (a) | 01/30/24 | 4.252 | 3 month LIBOR | (9,401 | ) | 467,792 | |||||||||||||||
| 34,000 | (a) | 12/17/24 | 3 month LIBOR | 3.000 | (958,870 | ) | 128,997 | |||||||||||||||
| 17,300 | (a) | 03/10/26 | 3.170 | 3 month LIBOR | (1,254,104 | ) | 1,309,448 | |||||||||||||||
| 15,600 | (a) | 08/04/26 | 3 month LIBOR | 3.409 | (87,250 | ) | (148,833 | ) | ||||||||||||||
| 1,100 | (a) | 09/28/26 | 3.280 | 3 month LIBOR | 9 | 1,480 | ||||||||||||||||
| 8,100 | (a) | 12/17/29 | 3 month LIBOR | 3.250 | (178,120 | ) | (62,672 | ) | ||||||||||||||
| 4,100 | (a) | 01/30/39 | 3 month LIBOR | 4.370 | (133,535 | ) | (298,893 | ) | ||||||||||||||
| 1,400 | (a) | 12/17/44 | 3 month LIBOR | 3.500 | (34,682 | ) | (40,163 | ) | ||||||||||||||
| TOTAL | $ | (5,726,603 | ) | $ | 1,590,533 | |||||||||||||||||
| (a) | Represents forward starting interest rate swaps whose effective dates of commencement of accruals and cash flows occur subsequent to September 30, 2014. |
| 70 | The accompanying notes are an integral part of these financial statements. |
GOLDMAN SACHS SHORT DURATION INCOME FUND
Schedule of Investments
September 30, 2014 (Unaudited)
| Principal Amount | Interest Rate | Maturity Date | Value | |||||||||||
| Corporate Obligations – 41.9% | ||||||||||||||
| Automotive – 1.9% | ||||||||||||||
| Chrysler Group LLC/CG Co-Issuer, Inc.(a) |
| ||||||||||||
| $ | 600,000 | 8.000 | % | 06/15/19 | $ | 636,000 | ||||||||
| Ford Motor Credit Co. LLC |
| ||||||||||||
| 2,050,000 | 8.000 | 12/15/16 | 2,333,769 | |||||||||||
| Schaeffler Finance BV(b) |
| ||||||||||||
| 1,550,000 | 7.750 | 02/15/17 | 1,685,625 | |||||||||||
|
| |||||||||||||
| 4,655,394 | ||||||||||||||
|
| |||||||||||||
| Banks – 15.8% | ||||||||||||||
| ABN AMRO Bank NV(b)(c) |
| ||||||||||||
| 1,050,000 | 1.035 | 10/28/16 | 1,059,471 | |||||||||||
| Australia & New Zealand Banking Group Ltd. |
| ||||||||||||
| 300,000 | 1.000 | (b) | 10/06/16 | 301,404 | ||||||||||
| 1,350,000 | 1.250 | 01/10/17 | 1,349,455 | |||||||||||
| Banco de Bogota SA(b) |
| ||||||||||||
| 200,000 | 5.000 | 01/15/17 | 211,000 | |||||||||||
| Banco del Estado de Chile(b) |
| ||||||||||||
| 170,000 | 2.000 | 11/09/17 | 170,612 | |||||||||||
| Banco Nacional de Costa Rica(b) |
| ||||||||||||
| 400,000 | 4.875 | 11/01/18 | 403,000 | |||||||||||
| Bank of America Corp. |
| ||||||||||||
| 275,000 | 3.625 | 03/17/16 | 284,887 | |||||||||||
| 5,050,000 | 6.000 | 09/01/17 | 5,621,294 | |||||||||||
| 400,000 | 2.650 | 04/01/19 | 398,646 | |||||||||||
| BPCE SA(c) |
| ||||||||||||
| 1,075,000 | 1.484 | 04/25/16 | 1,091,541 | |||||||||||
| Capital One Financial Corp. |
| ||||||||||||
| 375,000 | 1.000 | 11/06/15 | 375,094 | |||||||||||
| Citigroup, Inc. |
| ||||||||||||
| 343,000 | 3.953 | 06/15/16 | 358,671 | |||||||||||
| 2,025,000 | 1.700 | 07/25/16 | 2,039,966 | |||||||||||
| Commonwealth Bank of Australia |
| ||||||||||||
| 525,000 | 1.900 | 09/18/17 | 529,877 | |||||||||||
| Credit Agricole SA(b)(c) |
| ||||||||||||
| 525,000 | 1.082 | 10/03/16 | 529,272 | |||||||||||
| Credit Suisse New York(c) |
| ||||||||||||
| 1,500,000 | 0.725 | 05/26/17 | 1,505,106 | |||||||||||
| HSBC Bank PLC(b) |
| ||||||||||||
| 1,400,000 | 3.100 | 05/24/16 | 1,453,859 | |||||||||||
| ING Bank NV(b) |
| ||||||||||||
| 400,000 | 2.000 | 09/25/15 | 405,114 | |||||||||||
| 350,000 | 1.375 | 03/07/16 | 352,090 | |||||||||||
| Intesa Sanpaolo SPA |
| ||||||||||||
| 2,100,000 | 3.875 | 01/16/18 | 2,185,202 | |||||||||||
| JPMorgan Chase & Co. |
| ||||||||||||
| 1,275,000 | 3.450 | 03/01/16 | 1,319,068 | |||||||||||
| 1,975,000 | 6.400 | 10/02/17 | 2,229,637 | |||||||||||
| Lloyds Bank PLC |
| ||||||||||||
| 525,000 | 4.875 | 01/21/16 | 552,465 | |||||||||||
| 1,000,000 | 2.300 | 11/27/18 | 1,003,919 | |||||||||||
| Morgan Stanley, Inc. |
| ||||||||||||
| 4,100,000 | 5.950 | 12/28/17 | 4,590,943 | |||||||||||
| Nomura Holdings, Inc. |
| ||||||||||||
| 600,000 | 2.000 | 09/13/16 | 605,549 | |||||||||||
| Regions Financial Corp. |
| ||||||||||||
| 355,000 | 5.750 | 06/15/15 | 366,315 | |||||||||||
|
| |||||||||||||
| Corporate Obligations – (continued) | ||||||||||||||
| Banks – (continued) | ||||||||||||||
| Resona Preferred Global Securities Ltd.(a)(b)(c) |
| ||||||||||||
| $ | 1,625,000 | 7.191 | % | 12/31/49 | $ | 1,694,062 | ||||||||
| Royal Bank of Scotland PLC |
| ||||||||||||
| 275,000 | 4.375 | 03/16/16 | 287,842 | |||||||||||
| 1,100,000 | 6.400 | 10/21/19 | 1,273,620 | |||||||||||
| Santander Holdings USA, Inc.(a) |
| ||||||||||||
| 1,675,000 | 3.450 | 08/27/18 | 1,736,970 | |||||||||||
| Sumitomo Mitsui Banking Corp.(c) |
| ||||||||||||
| 450,000 | 0.664 | 01/10/17 | 451,319 | |||||||||||
| Wells Fargo & Co. |
| ||||||||||||
| 525,000 | 1.500 | 07/01/15 | 529,274 | |||||||||||
| 1,125,000 | 5.625 | 12/11/17 | 1,259,539 | |||||||||||
|
| |||||||||||||
| 38,526,083 | ||||||||||||||
|
| |||||||||||||
| Chemicals – 0.3% | ||||||||||||||
| Incitec Pivot Ltd.(b) |
| ||||||||||||
| 375,000 | 4.000 | 12/07/15 | 386,794 | |||||||||||
| Polymer Group, Inc.(a) |
| ||||||||||||
| 360,000 | 7.750 | 02/01/19 | 371,700 | |||||||||||
|
| |||||||||||||
| 758,494 | ||||||||||||||
|
| |||||||||||||
| Construction Machinery – 0.6% | ||||||||||||||
| Case New Holland, Inc. |
| ||||||||||||
| 1,300,000 | 7.875 | 12/01/17 | 1,444,625 | |||||||||||
|
| |||||||||||||
| Consumer Products – 0.8% | ||||||||||||||
| Avon Products, Inc. |
| ||||||||||||
| 450,000 | 2.375 | 03/15/16 | 453,138 | |||||||||||
| Beam, Inc. |
| ||||||||||||
| 250,000 | 5.375 | 01/15/16 | 263,349 | |||||||||||
| Sally Holdings LLC/Sally Capital, Inc.(a) |
| ||||||||||||
| 1,250,000 | 6.875 | 11/15/19 | 1,320,312 | |||||||||||
|
| |||||||||||||
| 2,036,799 | ||||||||||||||
|
| |||||||||||||
| Diversified Manufacturing – 0.1% | ||||||||||||||
| Pentair Finance SA |
| ||||||||||||
| 125,000 | 1.350 | 12/01/15 | 125,496 | |||||||||||
|
| |||||||||||||
| Electric – 0.5% | ||||||||||||||
| Commonwealth Edison Co.(a) |
| ||||||||||||
| 300,000 | 2.150 | 01/15/19 | 299,873 | |||||||||||
| Electricite de France(b)(c) |
| ||||||||||||
| 975,000 | 0.694 | 01/20/17 | 976,394 | |||||||||||
|
| |||||||||||||
| 1,276,267 | ||||||||||||||
|
| |||||||||||||
| Energy – 1.6% | ||||||||||||||
| Anadarko Petroleum Corp. |
| ||||||||||||
| 375,000 | 6.375 | 09/15/17 | 424,953 | |||||||||||
| BP Capital Markets PLC |
| ||||||||||||
| 1,125,000 | 1.846 | 05/05/17 | 1,137,797 | |||||||||||
| Canadian Natural Resources Ltd.(c) |
| ||||||||||||
| 450,000 | 0.608 | 03/30/16 | 451,036 | |||||||||||
| Devon Energy Corp.(c) |
| ||||||||||||
| 450,000 | 0.774 | 12/15/16 | 452,760 | |||||||||||
| Noble Holding International Ltd. |
| ||||||||||||
| 100,000 | 2.500 | 03/15/17 | 101,245 | |||||||||||
| Pacific Rubiales Energy Corp.(a)(b) |
| ||||||||||||
| 280,000 | 5.375 | 01/26/19 | 282,100 | |||||||||||
|
| |||||||||||||
| The accompanying notes are an integral part of these financial statements. | 71 |
GOLDMAN SACHS SHORT DURATION INCOME FUND
Schedule of Investments (continued)
September 30, 2014 (Unaudited)
| Principal Amount | Interest Rate | Maturity Date | Value | |||||||||||
| Corporate Obligations – (continued) | ||||||||||||||
| Energy – (continued) | ||||||||||||||
| Transocean, Inc. |
| ||||||||||||
| $ | 985,000 | 2.500 | % | 10/15/17 | $ | 980,484 | ||||||||
|
| |||||||||||||
| 3,830,375 | ||||||||||||||
|
| |||||||||||||
| Energy – Exploration & Production – 0.4% | ||||||||||||||
| KazMunayGas National Co. |
| ||||||||||||
| 190,000 | 11.750 | 01/23/15 | 195,463 | |||||||||||
| Whiting Petroleum Corp.(a) |
| ||||||||||||
| 850,000 | 5.000 | 03/15/19 | 864,875 | |||||||||||
|
| |||||||||||||
| 1,060,338 | ||||||||||||||
|
| |||||||||||||
| Food & Beverage – 1.0% | ||||||||||||||
| ConAgra Foods, Inc. |
| ||||||||||||
| 350,000 | 1.300 | 01/25/16 | 351,292 | |||||||||||
| Kraft Foods, Inc. |
| ||||||||||||
| 400,000 | 4.125 | 02/09/16 | 417,451 | |||||||||||
| Pernod-Ricard SA(b) |
| ||||||||||||
| 525,000 | 2.950 | 01/15/17 | 541,374 | |||||||||||
| Sysco Corp. |
| ||||||||||||
| 1,075,000 | 1.450 | 10/02/17 | 1,077,587 | |||||||||||
|
| |||||||||||||
| 2,387,704 | ||||||||||||||
|
| |||||||||||||
| Health Care Products – 0.2% | ||||||||||||||
| Life Technologies Corp. |
| ||||||||||||
| 150,000 | 4.400 | 03/01/15 | 152,332 | |||||||||||
| Thermo Fisher Scientific, Inc. |
| ||||||||||||
| 450,000 | 3.250 | 11/20/14 | 451,815 | |||||||||||
|
| |||||||||||||
| 604,147 | ||||||||||||||
|
| |||||||||||||
| Health Care Services – 1.3% | ||||||||||||||
| CHS/Community Health Systems, Inc.(a) |
| ||||||||||||
| 800,000 | 5.125 | 08/15/18 | 822,000 | |||||||||||
| 1,100,000 | 8.000 | 11/15/19 | 1,174,250 | |||||||||||
| Express Scripts Holding Co. |
| ||||||||||||
| 175,000 | 3.125 | 05/15/16 | 180,805 | |||||||||||
| McKesson Corp. |
| ||||||||||||
| 175,000 | 1.400 | 03/15/18 | 171,221 | |||||||||||
| Providence Health & Services Obligated Group(c) |
| ||||||||||||
| 525,000 | 1.035 | 10/01/16 | 526,260 | |||||||||||
| UnitedHealth Group, Inc. |
| ||||||||||||
| 400,000 | 1.400 | 10/15/17 | 398,604 | |||||||||||
|
| |||||||||||||
| 3,273,140 | ||||||||||||||
|
| |||||||||||||
| Life Insurance – 0.1% | ||||||||||||||
| MetLife, Inc. |
| ||||||||||||
| 150,000 | 1.756 | 12/15/17 | 150,009 | |||||||||||
|
| |||||||||||||
| Media – Cable – 1.2% | ||||||||||||||
| CCO Holdings LLC/CCO Holdings Capital Corp.(a) |
| ||||||||||||
| 500,000 | 7.250 | 10/30/17 | 518,125 | |||||||||||
| COX Communications, Inc. |
| ||||||||||||
| 100,000 | 5.500 | 10/01/15 | 104,583 | |||||||||||
| DIRECTV Holdings LLC/DIRECTV Financing Co., Inc. |
| ||||||||||||
| 800,000 | 3.500 | 03/01/16 | 828,441 | |||||||||||
| Time Warner Cable, Inc. |
| ||||||||||||
| 720,000 | 5.850 | 05/01/17 | 798,328 | |||||||||||
|
| |||||||||||||
| Corporate Obligations – (continued) | ||||||||||||||
| Media – Cable – (continued) | ||||||||||||||
| Virgin Media Finance PLC(a) |
| ||||||||||||
| $ | 550,000 | 8.375 | % | 10/15/19 | $ | 573,100 | ||||||||
|
| |||||||||||||
| 2,822,577 | ||||||||||||||
|
| |||||||||||||
| Media – Non Cable – 0.7% | ||||||||||||||
| NBCUniversal Media LLC |
| ||||||||||||
| 675,000 | 2.875 | 04/01/16 | 696,081 | |||||||||||
| News America, Inc. |
| ||||||||||||
| 450,000 | 5.300 | 12/15/14 | 454,649 | |||||||||||
| The Walt Disney Co. |
| ||||||||||||
| 475,000 | 0.450 | 12/01/15 | 474,080 | |||||||||||
|
| |||||||||||||
| 1,624,810 | ||||||||||||||
|
| |||||||||||||
| Media – Non Cable(a)(b) – 0.3% | ||||||||||||||
| Univision Communications, Inc. |
| ||||||||||||
| 600,000 | 6.875 | 05/15/19 | 625,500 | |||||||||||
|
| |||||||||||||
| Metals & Mining – 1.6% | ||||||||||||||
| Anglo American Capital PLC(b)(c) |
| ||||||||||||
| 700,000 | 1.184 | 04/15/16 | 703,941 | |||||||||||
| BHP Billiton Finance USA Ltd.(c) |
| ||||||||||||
| 550,000 | 0.483 | 09/30/16 | 550,783 | |||||||||||
| CITIC Ltd. |
| ||||||||||||
| 340,000 | 6.800 | 01/17/23 | 391,315 | |||||||||||
| Freeport-McMoRan Copper & Gold, Inc. |
| ||||||||||||
| 475,000 | 1.400 | 02/13/15 | 476,337 | |||||||||||
| Glencore Funding LLC(b) |
| ||||||||||||
| 1,750,000 | 2.700 | 10/25/17 | 1,779,199 | |||||||||||
|
| |||||||||||||
| 3,901,575 | ||||||||||||||
|
| |||||||||||||
| Noncaptive – Financial – 1.2% | ||||||||||||||
| General Electric Capital Corp. |
| ||||||||||||
| 1,525,000 | 2.300 | 04/27/17 | 1,562,361 | |||||||||||
| Navient LLC |
| ||||||||||||
| 1,150,000 | 8.450 | 06/15/18 | 1,301,881 | |||||||||||
|
| |||||||||||||
| 2,864,242 | ||||||||||||||
|
| |||||||||||||
| Pharmaceuticals – 2.0% | ||||||||||||||
| Mylan, Inc.(a)(b) |
| ||||||||||||
| 500,000 | 7.875 | 07/15/20 | 546,250 | |||||||||||
| Perrigo Co. PLC(b) |
| ||||||||||||
| 750,000 | 1.300 | 11/08/16 | 748,344 | |||||||||||
| Roche Holdings, Inc.(b)(c) |
| ||||||||||||
| 2,350,000 | 0.324 | 09/29/17 | 2,348,576 | |||||||||||
| Valeant Pharmaceuticals International, Inc.(a)(b) |
| ||||||||||||
| 1,100,000 | 6.750 | 08/15/18 | 1,157,750 | |||||||||||
| Zoetis, Inc. |
| ||||||||||||
| 75,000 | 1.150 | 02/01/16 | 75,092 | |||||||||||
|
| |||||||||||||
| 4,876,012 | ||||||||||||||
|
| |||||||||||||
| Pipelines – 2.9% | ||||||||||||||
| El Paso Natural Gas Co. LLC |
| ||||||||||||
| 325,000 | 5.950 | 04/15/17 | 358,476 | |||||||||||
| El Paso Pipeline Partners Operating Co. LLC |
| ||||||||||||
| 550,000 | 4.100 | 11/15/15 | 566,865 | |||||||||||
|
| |||||||||||||
| 72 | The accompanying notes are an integral part of these financial statements. |
GOLDMAN SACHS SHORT DURATION INCOME FUND
| Principal Amount | Interest Rate | Maturity Date | Value | |||||||||||
| Corporate Obligations – (continued) | ||||||||||||||
| Pipelines – (continued) | ||||||||||||||
| Enterprise Products Operating LLC(a)(c) |
| ||||||||||||
| $ | 1,150,000 | 8.375 | % | 08/01/66 | $ | 1,262,125 | ||||||||
| 675,000 | 7.034 | 01/15/68 | 762,750 | |||||||||||
| Kinder Morgan, Inc. |
| ||||||||||||
| 2,250,000 | 7.000 | 06/15/17 | 2,475,230 | |||||||||||
| ONEOK Partners LP(a) |
| ||||||||||||
| 250,000 | 3.250 | 02/01/16 | 256,822 | |||||||||||
| Spectra Energy Partners LP(a) |
| ||||||||||||
| 350,000 | 2.950 | 06/15/16 | 361,030 | |||||||||||
| TransCanada PipeLines Ltd.(a)(c) |
| ||||||||||||
| 950,000 | 6.350 | 05/15/67 | 969,000 | |||||||||||
|
| |||||||||||||
| 7,012,298 | ||||||||||||||
|
| |||||||||||||
| Real Estate Investment Trust – 2.0% | ||||||||||||||
| HCP, Inc. |
| ||||||||||||
| 500,000 | 3.750 | 02/01/16 | 518,251 | |||||||||||
| Kilroy Realty LP |
| ||||||||||||
| 450,000 | 5.000 | 11/03/15 | 469,809 | |||||||||||
| Realty Income Corp.(a) |
| ||||||||||||
| 125,000 | 2.000 | 01/31/18 | 124,079 | |||||||||||
| Senior Housing Properties Trust(a) |
| ||||||||||||
| 750,000 | 3.250 | 05/01/19 | 755,088 | |||||||||||
| Ventas Realty LP/Ventas Capital Corp. |
| ||||||||||||
| 675,000 | 3.125 | 11/30/15 | 691,656 | |||||||||||
| 900,000 | 2.000 | (a) | 02/15/18 | 900,555 | ||||||||||
| WEA Finance LLC/Westfield UK & Europe Finance PLC(b) |
| ||||||||||||
| 1,475,000 | 1.750 | 09/15/17 | 1,477,161 | |||||||||||
|
| |||||||||||||
| 4,936,599 | ||||||||||||||
|
| |||||||||||||
| Restaurants – 0.1% | ||||||||||||||
| Brinker International, Inc. |
| ||||||||||||
| 150,000 | 2.600 | 05/15/18 | 149,846 | |||||||||||
|
| |||||||||||||
| Retailers – Food & Drug – 0.4% | ||||||||||||||
| The Kroger Co.(c) |
| ||||||||||||
| 550,000 | 0.763 | 10/17/16 | 551,565 | |||||||||||
| Walgreen Co. |
| ||||||||||||
| 500,000 | 1.000 | 03/13/15 | 501,264 | |||||||||||
|
| |||||||||||||
| 1,052,829 | ||||||||||||||
|
| |||||||||||||
| Technology – 0.6% | ||||||||||||||
| Hewlett-Packard Co. |
| ||||||||||||
| 600,000 | 3.000 | 09/15/16 | 621,085 | |||||||||||
| 900,000 | 1.174 | (c) | 01/14/19 | 912,094 | ||||||||||
|
| |||||||||||||
| 1,533,179 | ||||||||||||||
|
| |||||||||||||
| Technology – Hardware – 0.0% | ||||||||||||||
| Seagate Technology HDD Holdings |
| ||||||||||||
| 27,000 | 6.800 | 10/01/16 | 29,497 | |||||||||||
| Tech Data Corp. |
| ||||||||||||
| 75,000 | 3.750 | 09/21/17 | 78,049 | |||||||||||
|
| |||||||||||||
| 107,546 | ||||||||||||||
|
| |||||||||||||
| Transportation(b) – 0.3% | ||||||||||||||
| Penske Truck Leasing Co. LP/PTL Finance Corp. |
| ||||||||||||
| 701,000 | 3.375 | 03/15/18 | 729,650 | |||||||||||
|
| |||||||||||||
| Corporate Obligations – (continued) | ||||||||||||||
| Wireless Telecommunications – 1.3% | ||||||||||||||
| America Movil SAB de CV |
| ||||||||||||
| MXN | 2,760,000 | 6.000 | % | 06/09/19 | $ | 206,935 | ||||||||
| American Tower Corp. |
| ||||||||||||
| $ | 525,000 | 4.500 | 01/15/18 | 560,629 | ||||||||||
| Intelsat Jackson Holdings SA(a) |
| ||||||||||||
| 600,000 | 7.250 | 04/01/19 | 630,000 | |||||||||||
| Mobile Telesystems OJSC via MTS International Funding Ltd. |
| ||||||||||||
| 100,000 | 8.625 | 06/22/20 | 106,000 | |||||||||||
| Sprint Communications, Inc. |
| ||||||||||||
| 1,400,000 | 6.000 | 12/01/16 | 1,473,500 | |||||||||||
| 175,000 | 8.375 | 08/15/17 | 196,000 | |||||||||||
|
| |||||||||||||
| 3,173,064 | ||||||||||||||
|
| |||||||||||||
| Wirelines Telecommunications – 2.7% | ||||||||||||||
| AT&T, Inc. |
| ||||||||||||
| 725,000 | 2.400 | 08/15/16 | 743,411 | |||||||||||
| Frontier Communications Corp. |
| ||||||||||||
| 1,325,000 | 8.250 | 04/15/17 | 1,464,125 | |||||||||||
| PAETEC Holding Corp.(a) |
| ||||||||||||
| 500,000 | 9.875 | 12/01/18 | 528,125 | |||||||||||
| Telecom Italia Capital SA |
| ||||||||||||
| 816,000 | 5.250 | 10/01/15 | 838,440 | |||||||||||
| Telefonica Emisiones SAU |
| ||||||||||||
| 150,000 | 3.192 | 04/27/18 | 154,820 | |||||||||||
| Verizon Communications, Inc. |
| ||||||||||||
| 125,000 | 3.000 | 04/01/16 | 128,700 | |||||||||||
| 1,400,000 | 1.764 | (c) | 09/15/16 | 1,435,303 | ||||||||||
| 1,300,000 | 2.500 | 09/15/16 | 1,333,410 | |||||||||||
|
| |||||||||||||
| 6,626,334 | ||||||||||||||
|
| |||||||||||||
| TOTAL CORPORATE OBLIGATIONS | ||||||||||||||
| (Cost $102,458,075) | $ | 102,164,932 | ||||||||||||
|
| |||||||||||||
| Mortgage-Backed Obligations – 7.6% | ||||||||||||||
| Collateralized Mortgage Obligations – 2.9% | ||||||||||||||
| Interest Only(d) – 0.8% | ||||||||||||||
| FHLMC STRIPS Series 329, Class C1 |
| ||||||||||||
| $ | 1,000,000 | 4.000 | % | 12/15/41 | $ | 220,430 | ||||||||
| FNMA REMIC Series 2012-146, Class IO |
| ||||||||||||
| 6,969,151 | 3.500 | 01/25/43 | 1,565,893 | |||||||||||
| GNMA REMIC Series 2013-182, Class PI |
| ||||||||||||
| 440,963 | 4.500 | 12/20/43 | 98,059 | |||||||||||
|
| |||||||||||||
| 1,884,382 | ||||||||||||||
|
| |||||||||||||
| Inverse Floaters(c) – 0.3% | ||||||||||||||
| GNMA REMIC Series 2010-1, Class SD |
| ||||||||||||
| 67,257 | 5.637 | 01/20/40 | 10,119 | |||||||||||
| GNMA REMIC Series 2010-35, Class DS |
| ||||||||||||
| 193,566 | 5.527 | 03/20/40 | 30,825 | |||||||||||
| GNMA REMIC Series 2010-9, Class XD |
| ||||||||||||
| 436,333 | 6.446 | 01/16/40 | 84,967 | |||||||||||
| GNMA REMIC Series 2010-98, Class QS |
| ||||||||||||
| 465,734 | 6.447 | 01/20/40 | 77,855 | |||||||||||
|
| |||||||||||||
| The accompanying notes are an integral part of these financial statements. | 73 |
GOLDMAN SACHS SHORT DURATION INCOME FUND
Schedule of Investments (continued)
September 30, 2014 (Unaudited)
| Principal Amount | Interest Rate | Maturity Date | Value | |||||||||||
| Mortgage-Backed Obligations – (continued) | ||||||||||||||
| Inverse Floaters(c) – (continued) | ||||||||||||||
| GNMA REMIC Series 2011-17, Class SA |
| ||||||||||||
| $ | 529,311 | 5.947 | % | 09/20/40 | $ | 85,441 | ||||||||
| GNMA REMIC Series 2011-61, Class CS |
| ||||||||||||
| 442,129 | 6.527 | 12/20/35 | 59,757 | |||||||||||
| GNMA REMIC Series 2011-79, Class AS |
| ||||||||||||
| 327,557 | 5.957 | 07/20/37 | 26,540 | |||||||||||
| GNMA REMIC Series 2013-113, Class SA |
| ||||||||||||
| 419,588 | 6.547 | 08/20/43 | 81,714 | |||||||||||
| GNMA REMIC Series 2013-113, Class SD |
| ||||||||||||
| 376,767 | 6.546 | 08/16/43 | 60,467 | |||||||||||
| GNMA REMIC Series 2013-148, Class SA |
| ||||||||||||
| 449,110 | 6.047 | 10/20/43 | 77,667 | |||||||||||
| GNMA REMIC Series 2013-169, Class SE |
| ||||||||||||
| 841,082 | 5.896 | 11/16/43 | 144,539 | |||||||||||
|
| |||||||||||||
| 739,891 | ||||||||||||||
|
| |||||||||||||
| Sequential Fixed Rate – 0.5% | ||||||||||||||
| FHLMC Multifamily Structured Pass-Through Certificates | | ||||||||||||
| 286,264 | 2.779 | 09/25/22 | 293,555 | |||||||||||
| FHLMC Multifamily Structured Pass-Through Certificates | | ||||||||||||
| 59,201 | 1.337 | 06/25/16 | 59,308 | |||||||||||
| FHLMC Multifamily Structured Pass-Through Certificates | | ||||||||||||
| 200,000 | 1.655 | 11/25/16 | 202,650 | |||||||||||
| FHLMC Multifamily Structured Pass-Through Certificates | | ||||||||||||
| 100,000 | 2.220 | 12/25/18 | 101,043 | |||||||||||
| FHLMC Multifamily Structured Pass-Through Certificates | | ||||||||||||
| 100,000 | 1.883 | 05/25/19 | 99,365 | |||||||||||
| FNMA REMIC Series 2012-111, Class B |
| ||||||||||||
| 100,601 | 7.000 | 10/25/42 | 114,134 | |||||||||||
| FNMA REMIC Series 2012-153, Class B |
| ||||||||||||
| 277,723 | 7.000 | 07/25/42 | 314,976 | |||||||||||
|
| |||||||||||||
| 1,185,031 | ||||||||||||||
|
| |||||||||||||
| Sequential Floating Rate(c) – 1.3% | ||||||||||||||
| Darrowby PLC Series 2012- 1, Class A |
| ||||||||||||
| GBP | 54,220 | 2.228 | 02/20/44 | 89,691 | ||||||||||
| FHLMC Multifamily Structured Pass-Through Certificates | | ||||||||||||
| $ | 60,776 | 0.505 | 04/25/19 | 60,776 | ||||||||||
| FNMA REMIC Series 2007-33, Class HF |
| ||||||||||||
| 56,959 | 0.505 | 04/25/37 | 57,216 | |||||||||||
| Granite Master Issuer PLC Series 2005-1, Class A6 |
| ||||||||||||
| GBP | 19,731 | 0.749 | 12/20/54 | 31,878 | ||||||||||
| Granite Master Issuer PLC Series 2005-4, Class A6 |
| ||||||||||||
| 98,653 | 0.749 | 12/20/54 | 159,392 | |||||||||||
| Granite Master Issuer PLC Series 2006-1X, Class A7 |
| ||||||||||||
| 78,922 | 0.749 | 12/20/54 | 127,472 | |||||||||||
| Granite Master Issuer PLC Series 2006-2, Class A6 |
| ||||||||||||
| 59,192 | 0.729 | 12/20/54 | 95,604 | |||||||||||
| Granite Master Issuer PLC Series 2007-1, Class 2A1 |
| ||||||||||||
| $ | 138,114 | 0.294 | 12/20/54 | 137,476 | ||||||||||
|
| |||||||||||||
| Mortgage-Backed Obligations – (continued) | ||||||||||||||
| Sequential Floating Rate(c) – (continued) | ||||||||||||||
| Granite Master Issuer PLC Series 2007-1, Class 5A1 |
| ||||||||||||
| GBP | 81,538 | 0.729 | % | 12/20/54 | $ | 131,706 | ||||||||
| Granite Master Issuer PLC Series 2007-2, Class 4A2 |
| ||||||||||||
| 99,836 | 0.726 | 12/17/54 | 161,246 | |||||||||||
| Granite Mortgages PLC Series 2003-2, Class 1B |
| ||||||||||||
| $ | 64,002 | 1.214 | 07/20/43 | 64,456 | ||||||||||
| Granite Mortgages PLC Series 2003-2, Class 3A |
| ||||||||||||
| GBP | 201,089 | 1.036 | 07/20/43 | 325,939 | ||||||||||
| Granite Mortgages PLC Series 2004-2, Class 3A |
| ||||||||||||
| 287,310 | 0.886 | 06/20/44 | 464,748 | |||||||||||
| Granite Mortgages PLC Series 2004-3, Class 2A1 |
| ||||||||||||
| $ | 91,069 | 0.513 | 09/20/44 | 90,887 | ||||||||||
| Granite Mortgages PLC Series 2004-3, Class 3A2 |
| ||||||||||||
| GBP | 251,292 | 0.946 | 09/20/44 | 406,908 | ||||||||||
| Leek Finance Number Eighteen PLC Series 2018X, Class A2C |
| ||||||||||||
| EUR | 48,986 | 0.472 | 09/21/38 | 64,617 | ||||||||||
| Leek Finance PLC Series 2017X, Class A2C |
| ||||||||||||
| 32,137 | 0.492 | 12/21/37 | 42,771 | |||||||||||
| Leek Finance PLC Series 2018X, Class A2B |
| ||||||||||||
| $ | 195,944 | 0.490 | 09/21/38 | 204,562 | ||||||||||
| Quadrivio Finance Series 2011-1, Class A1 |
| ||||||||||||
| EUR | 221,152 | 0.708 | 07/25/60 | 279,012 | ||||||||||
| Springleaf Mortgage Loan Trust Series 2012-3A, Class A(b) |
| ||||||||||||
| $ | 108,503 | 1.570 | 12/25/59 | 108,267 | ||||||||||
| Thrones PLC Series 2013-1, Class A |
| ||||||||||||
| GBP | 85,717 | 2.028 | 07/20/44 | 141,465 | ||||||||||
|
| |||||||||||||
| 3,246,089 | ||||||||||||||
|
| |||||||||||||
| | TOTAL COLLATERALIZED MORTGAGE OBLIGATIONS | | $ | 7,055,393 | ||||||||||
|
| |||||||||||||
| Federal Agencies – 4.7% | ||||||||||||||
| FHLMC – 0.1% | ||||||||||||||
| $ | 355,464 | 7.000 | % | 02/01/39 | $ | 404,480 | ||||||||
|
| |||||||||||||
| FNMA – 4.6% | ||||||||||||||
| 399,452 | 6.000 | 05/01/26 | 454,339 | |||||||||||
| 239,028 | 6.000 | 04/01/27 | 270,867 | |||||||||||
| 290,869 | 6.000 | 07/01/32 | 328,276 | |||||||||||
| 19,588 | 6.000 | 11/01/34 | 22,382 | |||||||||||
| 1,109,819 | 6.000 | 10/01/35 | 1,260,430 | |||||||||||
| 9,253 | 6.000 | 11/01/35 | 10,445 | |||||||||||
| 6,252 | 6.000 | 02/01/37 | 7,056 | |||||||||||
| 299,138 | 6.000 | 06/01/37 | 337,609 | |||||||||||
| 795,278 | 6.000 | 08/01/37 | 897,556 | |||||||||||
| 256,648 | 6.000 | 09/01/37 | 289,655 | |||||||||||
| 290,802 | 6.000 | 12/01/37 | 328,202 | |||||||||||
| 355,400 | 6.000 | 07/01/38 | 401,136 | |||||||||||
| 1,347,213 | 6.000 | 11/01/38 | 1,520,547 | |||||||||||
| 729,070 | 6.000 | 12/01/38 | 822,891 | |||||||||||
| 211,399 | 7.000 | 03/01/39 | 239,635 | |||||||||||
| 540,165 | 6.000 | 07/01/39 | 609,678 | |||||||||||
| 169,730 | 6.000 | 09/01/39 | 191,560 | |||||||||||
| 56,465 | 6.000 | 10/01/39 | 63,744 | |||||||||||
| 1,002,646 | 6.000 | 06/01/40 | 1,131,673 | |||||||||||
| 42,292 | 6.000 | 10/01/40 | 47,731 | |||||||||||
| 61,216 | 6.000 | 05/01/41 | 69,089 | |||||||||||
|
| |||||||||||||
| 74 | The accompanying notes are an integral part of these financial statements. |
GOLDMAN SACHS SHORT DURATION INCOME FUND
| Principal Amount | Interest Rate | Maturity Date | Value | |||||||||||
| Mortgage-Backed Obligations – (continued) | ||||||||||||||
| FNMA – (continued) | ||||||||||||||
| $ | 14,269 | 6.000 | % | 09/01/41 | $ | 16,123 | ||||||||
| 157,242 | 3.000 | 08/01/42 | 156,280 | |||||||||||
| 143,527 | 3.000 | 09/01/42 | 142,647 | |||||||||||
| 47,791 | 3.000 | 11/01/42 | 47,473 | |||||||||||
| 663,668 | 3.000 | 12/01/42 | 659,105 | |||||||||||
| 508,783 | 3.000 | 01/01/43 | 505,398 | |||||||||||
| 192,147 | 3.000 | 02/01/43 | 190,741 | |||||||||||
| 51,322 | 3.000 | 03/01/43 | 50,975 | |||||||||||
| 70,704 | 3.000 | 04/01/43 | 70,227 | |||||||||||
|
| |||||||||||||
| 11,143,470 | ||||||||||||||
|
| |||||||||||||
| TOTAL FEDERAL AGENCIES | $ | 11,547,950 | ||||||||||||
|
| |||||||||||||
| TOTAL MORTGAGE-BACKED OBLIGATIONS | ||||||||||||||
| (Cost $18,346,766) | $ | 18,603,343 | ||||||||||||
|
| |||||||||||||
| Agency Debentures – 8.8% | ||||||||||||||
| FFCB |
| ||||||||||||
| $ | 1,300,000 | 3.500 | % | 12/20/23 | $ | 1,371,458 | ||||||||
| FHLB(e) |
| ||||||||||||
| 8,000,000 | 0.000 | 11/19/14 | 7,999,856 | |||||||||||
| 12,000,000 | 0.000 | 12/17/14 | 11,999,616 | |||||||||||
|
| |||||||||||||
| TOTAL AGENCY DEBENTURES | ||||||||||||||
| (Cost $21,296,591) | $ | 21,370,930 | ||||||||||||
|
| |||||||||||||
| Asset-Backed Securities – 12.8% | ||||||||||||||
| Auto – 0.5% | ||||||||||||||
| Ally Master Owner Trust Series 2012-5, Class A |
| ||||||||||||
| $ | 350,000 | 1.540 | % | 09/15/19 | $ | 348,373 | ||||||||
| Ford Credit Floorplan Master Owner Trust Series 2013-1, | | ||||||||||||
| 900,000 | 0.534 | 01/15/18 | 901,848 | |||||||||||
|
| |||||||||||||
| 1,250,221 | ||||||||||||||
|
| |||||||||||||
| Collateralized Loan Obligations – 6.9% | ||||||||||||||
| Aberdeen Loan Funding Ltd. Series 2008-1A, Class A(b)(c) |
| ||||||||||||
| 520,454 | 0.890 | 11/01/18 | 516,561 | |||||||||||
| ACIS CLO Ltd. Series 2013-1A, Class ACOM(b)(c) |
| ||||||||||||
| 600,000 | 1.461 | 04/18/24 | 578,280 | |||||||||||
| ACIS CLO Ltd. Series 2013-2A, Class A(b)(c) |
| ||||||||||||
| 100,000 | 0.734 | 10/14/22 | 97,951 | |||||||||||
| ACIS CLO Ltd. Series 2013-2A, Class ACOM(b)(c) |
| ||||||||||||
| 800,000 | 1.149 | 10/14/22 | 783,040 | |||||||||||
| B&M CLO Ltd. Series 2014-1A, Class A1(b)(c) |
| ||||||||||||
| 600,000 | 1.598 | 04/16/26 | 595,706 | |||||||||||
| B&M CLO Ltd. Series 2014-1A, Class A2(b)(c) |
| ||||||||||||
| 100,000 | 2.148 | 04/16/26 | 95,826 | |||||||||||
| Black Diamond CLO Ltd. Series 2006-1A, Class AD(b)(c) |
| ||||||||||||
| 467,475 | 0.484 | 04/29/19 | 459,591 | |||||||||||
| Brentwood CLO Corp. Series 2006-1A, Class A1A(b)(c) |
| ||||||||||||
| 698,686 | 0.510 | 02/01/22 | 692,176 | |||||||||||
|
| |||||||||||||
| Asset-Backed Securities – (continued) | ||||||||||||||
| Collateralized Loan Obligations – (continued) | ||||||||||||||
| Brentwood CLO Corp. Series 2006-1A, Class A1B(b)(c) |
| ||||||||||||
| $ | 328,793 | 0.510 | % | 02/01/22 | $ | 325,069 | ||||||||
| Crown Point CLO Ltd. Series 2012-1A, Class A1LA(b)(c) |
| ||||||||||||
| 100,000 | 0.982 | 11/21/22 | 98,425 | |||||||||||
| Crown Point CLO Ltd. Series 2013-2A, Class ACOM(c) |
| ||||||||||||
| 1,200,000 | 1.314 | 12/14/23 | 1,171,796 | |||||||||||
| Grayson CLO Ltd. Series 2006-1A, Class A1A(b)(c) |
| ||||||||||||
| 196,604 | 0.485 | 11/01/21 | 193,929 | |||||||||||
| ICG US CLO Ltd. Series 2014-1A, Class ACOM(b)(c) |
| ||||||||||||
| 1,100,000 | 1.506 | 04/20/26 | 1,067,440 | |||||||||||
| Jasper CLO Ltd. Series 2005-1A, Class A(b)(c) |
| ||||||||||||
| 41,345 | 0.510 | 08/01/17 | 41,267 | |||||||||||
| KKR Financial CLO Ltd. Series 2007-1A, Class A(b)(c) |
| ||||||||||||
| 1,879,942 | 0.584 | 05/15/21 | 1,865,484 | |||||||||||
| Magnetite VIII Ltd. Series 2014-8A, Class A(b)(c) |
| ||||||||||||
| 950,000 | 1.708 | 04/15/26 | 950,817 | |||||||||||
| Magnetite VIII Ltd. Series 2014-8A, Class B(b)(c) |
| ||||||||||||
| 200,000 | 2.228 | 04/15/26 | 195,889 | |||||||||||
| OCP CLO Ltd. Series 2012-2A, Class ACOM(b)(c) |
| ||||||||||||
| 300,000 | 1.475 | 11/22/23 | 294,450 | |||||||||||
| OCP CLO Ltd. Series 2014-5A, Class ACOM(b)(c) |
| ||||||||||||
| 1,150,000 | 0.000 | 04/26/26 | 1,116,190 | |||||||||||
| OFSI Fund V Ltd. Series 2013-5A, Class ACOM(b) |
| ||||||||||||
| 300,000 | 1.592 | 04/17/25 | 295,530 | |||||||||||
| OFSI Fund VI Ltd. Series 2014-6A, Class ACOM(b)(c) |
| ||||||||||||
| 1,050,000 | 1.550 | 03/20/25 | 1,021,650 | |||||||||||
| Red River CLO Ltd. Series 1A, Class A(b)(c) |
| ||||||||||||
| 288,122 | 0.510 | 07/27/18 | 286,580 | |||||||||||
| Shackleton CLO Ltd. Series 2014-5A, Class A(b)(c) |
| ||||||||||||
| 1,300,000 | 1.737 | 05/07/26 | 1,300,833 | |||||||||||
| Shackleton CLO Ltd. Series 2014-5A, Class B1(b)(c) |
| ||||||||||||
| 300,000 | 2.237 | 05/07/26 | 292,803 | |||||||||||
| Westchester CLO Ltd. Series 2007-1X, Class A1A(c) |
| ||||||||||||
| 200,633 | 0.465 | 08/01/22 | 198,765 | |||||||||||
| Whitehorse VIII Ltd. Series 2014-1A, Class A(b)(c) |
| ||||||||||||
| 1,250,000 | 1.740 | 05/01/26 | 1,249,639 | |||||||||||
| Whitehorse VIII Ltd. Series 2014-1A, Class B(b)(c) |
| ||||||||||||
| 250,000 | 2.290 | 05/01/26 | 244,960 | |||||||||||
| Zais CLO 1 Ltd. Series 2014-1A, Class ACOM(b)(c) |
| ||||||||||||
| 800,000 | 1.712 | 04/15/26 | 790,960 | |||||||||||
|
| |||||||||||||
| 16,821,607 | ||||||||||||||
|
| |||||||||||||
| Credit Card(c) – 0.9% | ||||||||||||||
| Bank of America Credit Card Trust Series 2014-A1, Class A |
| ||||||||||||
| 2,050,000 | 0.534 | 06/15/21 | 2,049,824 | |||||||||||
|
| |||||||||||||
| Home Equity(b) – 1.6% | ||||||||||||||
| HLSS Servicer Advance Receivables Trust Series 2014-T1, | | ||||||||||||
| 2,950,000 | 1.244 | 01/17/45 | 2,953,026 | |||||||||||
| New Residential Advance Receivables Trust Advance | | ||||||||||||
| 475,000 | 1.274 | 03/15/45 | 475,522 | |||||||||||
| Springleaf Mortgage Loan Trust Series 2013-2A, Class A(c) |
| ||||||||||||
| 464,234 | 1.780 | 12/25/65 | 462,170 | |||||||||||
|
| |||||||||||||
| 3,890,718 | ||||||||||||||
|
| |||||||||||||
| The accompanying notes are an integral part of these financial statements. | 75 |
GOLDMAN SACHS SHORT DURATION INCOME FUND
Schedule of Investments (continued)
September 30, 2014 (Unaudited)
| Principal Amount | Interest Rate | Maturity Date | Value | |||||||||||
| Asset-Backed Securities – (continued) | ||||||||||||||
| Student Loan(c) – 2.9% | ||||||||||||||
| Access to Loans for Learning Student Loan Corp. Series 2013-I, | | ||||||||||||
| $ | 934,313 | 0.956 | % | 02/25/41 | $ | 933,753 | ||||||||
| Education Loan Asset-Backed Trust Series 2012-1, Class A1(b) |
| ||||||||||||
| 19,462 | 0.605 | 06/25/22 | 19,464 | |||||||||||
| Educational Services of America, Inc. Series 2012-1, Class A1(b) |
| ||||||||||||
| 139,924 | 1.305 | 09/25/40 | 142,850 | |||||||||||
| Educational Services of America, Inc. Series 2014-1, Class A(b) |
| ||||||||||||
| 1,919,367 | 0.855 | 02/25/39 | 1,923,532 | |||||||||||
| EFS Volunteer No 3 LLC Series 2012-1, Class A2(b) |
| ||||||||||||
| 500,000 | 1.155 | 02/25/25 | 506,011 | |||||||||||
| Nelnet Student Loan Corp. Series 2004-2A, Class A4 |
| ||||||||||||
| 16,983 | 0.375 | 08/26/19 | 16,976 | |||||||||||
| Nelnet Student Loan Trust Series 2008-3, Class A4 |
| ||||||||||||
| 1,300,000 | 1.885 | 11/25/24 | 1,346,215 | |||||||||||
| Northstar Education Finance, Inc. Series 2012-1, Class A(b) |
| ||||||||||||
| 268,243 | 0.856 | 12/26/31 | 268,184 | |||||||||||
| Pennsylvania Higher Education Assistance Agency Series 12-1A, | | ||||||||||||
| 136,507 | 0.706 | 05/25/27 | 137,247 | |||||||||||
| SLC Student Loan Trust Series 2006-1, Class A4 |
| ||||||||||||
| 123,663 | 0.314 | 12/15/21 | 123,367 | |||||||||||
| SLM Student Loan Trust Series 2003-12, Class A5(b) |
| ||||||||||||
| 720,784 | 0.514 | 09/15/22 | 720,731 | |||||||||||
| SLM Student Loan Trust Series 2006-8, Class A4 |
| ||||||||||||
| 125,460 | 0.314 | 10/25/21 | 125,169 | |||||||||||
| SLM Student Loan Trust Series 2006-9, Class A4 |
| ||||||||||||
| 122,419 | 0.304 | 10/25/22 | 122,139 | |||||||||||
| SLM Student Loan Trust Series 2012-2, Class A |
| ||||||||||||
| 179,034 | 0.855 | 01/25/29 | 180,287 | |||||||||||
| US Education Loan Trust LLC Series 2006-1, Class A2(b) |
| ||||||||||||
| 587,040 | 0.364 | 03/01/25 | 586,370 | |||||||||||
|
| |||||||||||||
| 7,152,295 | ||||||||||||||
|
| |||||||||||||
| TOTAL ASSET-BACKED SECURITIES | ||||||||||||||
| (Cost $30,991,846) | $ | 31,164,665 | ||||||||||||
|
| |||||||||||||
| Foreign Debt Obligations – 3.6% | ||||||||||||||
| Sovereign – 3.6% | ||||||||||||||
| Dominican Republic |
| ||||||||||||
| $ | 200,000 | 7.500 | % | 05/06/21 | $ | 223,500 | ||||||||
| Kommunalbanken AS(b) |
| ||||||||||||
| 100,000 | 1.000 | 09/26/17 | 99,212 | |||||||||||
| Republic of Argentina(e) |
| ||||||||||||
| EUR | 330,000 | 0.000 | 12/15/35 | 30,844 | ||||||||||
| $ | 2,146,000 | 0.000 | 12/15/35 | 163,096 | ||||||||||
| Republic of Italy |
| ||||||||||||
| EUR | 420,000 | 1.150 | 05/15/17 | 538,492 | ||||||||||
| 242,618 | 2.350 | 09/15/19 | 338,614 | |||||||||||
| Republic of Panama |
| ||||||||||||
| $ | 29,000 | 7.250 | 03/15/15 | 29,774 | ||||||||||
| Republic of Turkey |
| ||||||||||||
| 170,000 | 7.000 | 09/26/16 | 185,725 | |||||||||||
|
| |||||||||||||
| Foreign Debt Obligations – (continued) | ||||||||||||||
| Sovereign – (continued) | ||||||||||||||
| United Mexican States |
| ||||||||||||
| MXN | 17,798,480 | 0.000 | %(e) | 10/16/14 | $ | 1,321,703 | ||||||||
| 2,665,790 | 0.000 | (e) | 11/20/14 | 197,394 | ||||||||||
| 15,990,560 | 0.000 | (e) | 11/27/14 | 1,183,381 | ||||||||||
| 3,058,840 | 0.000 | (e) | 12/11/14 | 226,119 | ||||||||||
| 4,795,020 | 0.000 | (e) | 12/18/14 | 354,811 | ||||||||||
| 7,953,570 | 0.000 | (e) | 02/05/15 | 585,184 | ||||||||||
| 38,755,910 | 0.000 | (e) | 02/19/15 | 2,848,186 | ||||||||||
| 1,707,150 | 0.000 | (e) | 03/19/15 | 125,343 | ||||||||||
| 3,853,419 | 5.000 | 06/16/16 | 311,644 | |||||||||||
|
| |||||||||||||
| TOTAL FOREIGN DEBT OBLIGATIONS | ||||||||||||||
| (Cost $8,983,670) | $ | 8,763,022 | ||||||||||||
|
| |||||||||||||
| Municipal Debt Obligations – 1.3% | ||||||||||||||
| Michigan – 0.4% | ||||||||||||||
| Michigan State Finance Authority Revenue Detroit School | | ||||||||||||
| $ | 1,000,000 | 2.850 | % | 08/20/15 | $ | 1,007,090 | ||||||||
|
| |||||||||||||
| New Jersey(e) – 0.2% | ||||||||||||||
| New Jersey Economic Development Authority RB Series B |
| ||||||||||||
| 550,000 | 0.000 | 02/15/16 | 538,516 | |||||||||||
|
| |||||||||||||
| Puerto Rico – 0.7% | ||||||||||||||
| Puerto Rico Commonwealth Aqueduct & Sewer Authority RB | | ||||||||||||
| 10,000 | 6.000 | 07/01/38 | 7,530 | |||||||||||
| 15,000 | 6.000 | 07/01/44 | 11,063 | |||||||||||
| Puerto Rico Commonwealth Aqueduct & Sewer Authority RB | | ||||||||||||
| 20,000 | 5.750 | 07/01/37 | 14,754 | |||||||||||
| Puerto Rico Commonwealth Aqueduct & Sewer Authority RB | | ||||||||||||
| 10,000 | 5.000 | 07/01/33 | 7,102 | |||||||||||
| Puerto Rico Commonwealth GO Bonds for Public Improvement | | ||||||||||||
| 10,000 | 5.750 | 07/01/41 | 7,505 | |||||||||||
| Puerto Rico Commonwealth GO Bonds Refunding for Public | | ||||||||||||
| 10,000 | 5.500 | 07/01/32 | 7,512 | |||||||||||
| Puerto Rico Commonwealth GO Bonds Refunding for Public | | ||||||||||||
| 10,000 | 5.875 | 07/01/36 | 7,776 | |||||||||||
| 10,000 | 6.000 | 07/01/39 | 7,674 | |||||||||||
| Puerto Rico Commonwealth GO Bonds Refunding for Public | | ||||||||||||
| 10,000 | 6.000 | 07/01/34 | 7,752 | |||||||||||
| Puerto Rico Commonwealth GO Bonds Refunding for Public | | ||||||||||||
| 10,000 | 5.500 | 07/01/26 | 7,957 | |||||||||||
| 60,000 | 5.500 | 07/01/39 | 44,843 | |||||||||||
| 15,000 | �� | 5.000 | 07/01/41 | 10,981 | ||||||||||
| Puerto Rico Commonwealth GO Bonds Series 2007 A |
| ||||||||||||
| 20,000 | 5.250 | 07/01/37 | 15,051 | |||||||||||
|
| |||||||||||||
| 76 | The accompanying notes are an integral part of these financial statements. |
GOLDMAN SACHS SHORT DURATION INCOME FUND
| Principal Amount | Interest Rate | Maturity Date | Value | |||||||||||
| Municipal Debt Obligations – (continued) | ||||||||||||||
| Puerto Rico – (continued) | ||||||||||||||
| Puerto Rico Commonwealth GO Bonds Series 2014 A |
| ||||||||||||
| $ | 900,000 | 8.000 | % | 07/01/35 | $ | 792,018 | ||||||||
| Puerto Rico Commonwealth GO Bonds Unrefunded Balance for | | ||||||||||||
| 10,000 | 5.250 | 07/01/27 | 7,719 | |||||||||||
| Puerto Rico Sales Tax Financing Corp. Sales Tax RB Capital | | ||||||||||||
| 10,000 | 0.000 | 08/01/35 | 1,690 | |||||||||||
| Puerto Rico Sales Tax Financing Corp. Sales Tax RB Capital | | ||||||||||||
| 10,000 | 0.000 | 08/01/37 | 1,479 | |||||||||||
| 10,000 | 0.000 | 08/01/38 | 1,398 | |||||||||||
| Puerto Rico Sales Tax Financing Corp. Sales Tax RB | | ||||||||||||
| 10,000 | 5.250 | 08/01/40 | 8,522 | |||||||||||
| Puerto Rico Sales Tax Financing Corp. Sales Tax RB | | ||||||||||||
| 5,000 | 5.250 | 08/01/27 | 4,162 | |||||||||||
| 120,000 | 0.000 | (e) | 08/01/32 | 94,421 | ||||||||||
| 60,000 | 5.750 | 08/01/37 | 48,992 | |||||||||||
| 5,000 | 6.375 | 08/01/39 | 4,203 | |||||||||||
| 165,000 | 6.000 | 08/01/42 | 132,368 | |||||||||||
| Puerto Rico Sales Tax Financing Corp. Sales Tax RB | | ||||||||||||
| 25,000 | 0.000 | (e) | 08/01/33 | 14,623 | ||||||||||
| 40,000 | 5.500 | 08/01/37 | 31,352 | |||||||||||
| 45,000 | 5.375 | 08/01/39 | 34,336 | |||||||||||
| 100,000 | 5.500 | 08/01/42 | 76,382 | |||||||||||
| Puerto Rico Sales Tax Financing Corp. Sales Tax RB | | ||||||||||||
| 20,000 | 5.375 | 08/01/38 | 15,512 | |||||||||||
| 5,000 | 6.000 | 08/01/39 | 4,093 | |||||||||||
| 165,000 | 5.250 | 08/01/41 | 121,750 | |||||||||||
| Puerto Rico Sales Tax Financing Corp. Sales Tax RB | | ||||||||||||
| 5,000 | 5.000 | 08/01/43 | 3,582 | |||||||||||
| 10,000 | 5.250 | 08/01/43 | 7,321 | |||||||||||
| Puerto Rico Sales Tax Financing Corp. Sales Tax RB Unrefunded | | ||||||||||||
| 90,000 | 5.500 | 08/01/28 | 76,032 | |||||||||||
| 50,000 | 6.125 | 08/01/29 | 42,514 | |||||||||||
|
| |||||||||||||
| 1,681,969 | ||||||||||||||
|
| |||||||||||||
| TOTAL MUNICIPAL DEBT OBLIGATIONS | ||||||||||||||
| (Cost $3,201,955) | $ | 3,227,575 | ||||||||||||
|
| |||||||||||||
| U.S. Treasury Obligations – 13.5% | ||||||||||||||
| United States Treasury Bonds |
| ||||||||||||
| $ | 350,000 | 2.750 | % | 11/15/42 | $ | 320,187 | ||||||||
| 809,000 | 3.625 | (f) | 08/15/43 | 874,440 | ||||||||||
| 400,000 | 3.750 | 11/15/43 | 442,084 | |||||||||||
| 1,900,000 | 3.625 | (f) | 02/15/44 | 2,053,425 | ||||||||||
| 2,800,000 | 3.375 | 05/15/44 | 2,890,496 | |||||||||||
|
| |||||||||||||
| U.S. Treasury Obligations – (continued) | ||||||||||||||
| United States Treasury Inflation Protected Securities |
| ||||||||||||
| $ | 2,736,916 | 0.125 | % | 01/15/22 | $ | 2,674,898 | ||||||||
| 1,204,898 | 0.625 | 01/15/24 | 1,211,670 | |||||||||||
| 501,700 | 0.125 | 07/15/24 | 482,023 | |||||||||||
| United States Treasury Notes |
| ||||||||||||
| 1,500,000 | 0.875 | 08/15/17 | 1,492,785 | |||||||||||
| 2,200,000 | 1.500 | 05/31/19 | 2,177,142 | |||||||||||
| 2,300,000 | 1.625 | 06/30/19 | 2,287,833 | |||||||||||
| 5,200,000 | 1.625 | 07/31/19 | 5,167,292 | |||||||||||
| 3,200,000 | 1.625 | 08/31/19 | 3,178,176 | |||||||||||
| 6,800,000 | 1.750 | 09/30/19 | 6,790,140 | |||||||||||
| 1,000,000 | 2.250 | 04/30/21 | 1,004,910 | |||||||||||
|
| |||||||||||||
| TOTAL U.S. TREASURY OBLIGATIONS | ||||||||||||||
| (Cost $32,793,716) | $ | 33,047,501 | ||||||||||||
|
| |||||||||||||
| Notional Amount | Exercise Rate | Expiration Date | Value | |||||||||||
| Options Purchased – 1.1% | ||||||||||||||
| Interest Rate Swaptions | ||||||||||||||
| Deutsche Bank AG Call – OTC – 2 year Interest Rate Swap Strike | | ||||||||||||
| $ | 9,300,000 | 2.030 | % | 10/26/15 | $ | 47,168 | ||||||||
| Deutsche Bank AG Put – OTC – 5 year Interest Rate Swap Strike | | ||||||||||||
| 6,700,000 | 2.550 | 09/28/15 | 108,766 | |||||||||||
| Deutsche Bank AG Call – OTC – 5 year Interest Rate Swap Strike | | ||||||||||||
| 6,700,000 | 2.550 | 09/28/15 | 102,404 | |||||||||||
| Deutsche Bank AG Put – OTC – 5 year Interest Rate Swap Strike | | ||||||||||||
| 4,700,000 | 2.940 | 09/29/16 | 107,223 | |||||||||||
| Deutsche Bank AG Call – OTC – 5 year Interest Rate Swap Strike | | ||||||||||||
| 4,700,000 | 2.940 | 09/29/16 | 112,406 | |||||||||||
| Deutsche Bank AG Call – OTC – 10 year Interest Rate Swap | | ||||||||||||
| 13,000,000 | 3.670 | 03/08/16 | 220,975 | |||||||||||
| Deutsche Bank AG Call – OTC – 10 year Interest Rate Swap | | ||||||||||||
| 3,100,000 | 3.780 | 09/26/16 | 73,795 | |||||||||||
| Deutsche Bank AG Put – OTC – 10 year Interest Rate Swap | | ||||||||||||
| 4,400,000 | 4.135 | 04/17/19 | 370,630 | |||||||||||
| Deutsche Bank AG Call – OTC – 10 year Interest Rate Swap | | ||||||||||||
| 4,400,000 | 4.135 | 04/17/19 | 171,477 | |||||||||||
| JPMorgan Chase Bank NA Call – OTC – 5 year Interest Rate | | ||||||||||||
| 9,300,000 | 2.783 | 09/30/15 | 103,462 | |||||||||||
| JPMorgan Chase Bank NA Call – OTC – 5 year Interest Rate | | ||||||||||||
| 5,300,000 | 2.973 | 09/26/16 | 122,061 | |||||||||||
| JPMorgan Chase Bank NA Put – OTC – 5 year Interest Rate | | ||||||||||||
| 5,300,000 | 2.973 | 09/26/16 | 125,357 | |||||||||||
|
| |||||||||||||
| The accompanying notes are an integral part of these financial statements. | 77 |
GOLDMAN SACHS SHORT DURATION INCOME FUND
Schedule of Investments (continued)
September 30, 2014 (Unaudited)
| Notional Amount | Exercise Rate | Expiration Date | Value | |||||||||||
| Options Purchased – (continued) | ||||||||||||||
| Interest Rate Swaptions – (continued) | ||||||||||||||
| JPMorgan Chase Bank NA Put – OTC – 5 year Interest Rate | | ||||||||||||
| $ | 2,400,000 | 3.000 | % | 09/22/16 | $ | 58,427 | ||||||||
| JPMorgan Chase Bank NA Call – OTC – 5 year Interest Rate | | ||||||||||||
| 2,400,000 | 3.000 | 09/22/16 | 53,736 | |||||||||||
| JPMorgan Chase Bank NA Put – OTC – 10 year Interest Rate | | ||||||||||||
| 3,800,000 | 3.413 | 09/19/16 | 181,417 | |||||||||||
| JPMorgan Chase Bank NA Call – OTC – 10 year Interest Rate | | ||||||||||||
| 3,800,000 | 3.413 | 09/19/16 | 131,931 | |||||||||||
| JPMorgan Chase Bank NA Put – OTC – 10 year Interest Rate | | ||||||||||||
| 3,000,000 | 3.498 | 07/02/15 | 174,810 | |||||||||||
| JPMorgan Chase Bank NA Call – OTC – 10 year Interest Rate | | ||||||||||||
| 3,000,000 | 3.498 | 07/02/15 | 22,778 | |||||||||||
| JPMorgan Chase Bank NA Put – OTC – 10 year Interest Rate | | ||||||||||||
| 3,600,000 | 4.105 | 04/29/19 | 297,630 | |||||||||||
| JPMorgan Chase Bank NA Call – OTC – 10 year Interest Rate | | ||||||||||||
| 3,600,000 | 4.105 | 04/29/19 | 143,812 | |||||||||||
|
| |||||||||||||
| TOTAL OPTIONS PURCHASED – 1.1% | ||||||||||||||
| (Cost $3,049,338) | $ | 2,730,265 | ||||||||||||
|
| |||||||||||||
| | TOTAL INVESTMENTS BEFORE SHORT-TERM INVESTMENT | | ||||||||||||
| (Cost $221,121,957) | $ | 221,072,233 | ||||||||||||
|
| |||||||||||||
| Principal Amount | Interest Rate | Maturity Date | Value | |||||||||||
| Short-term Investments – 6.3% | ||||||||||||||
| Certificate of Deposit – 2.4% | ||||||||||||||
| ABN Amro Funding USA LLC |
| ||||||||||||
| $ | 1,000,000 | 0.233 | % | 12/23/14 | $ | 999,470 | ||||||||
| Cancara Asset Securitization LLC |
| ||||||||||||
| 2,450,000 | 0.183 | 12/18/14 | 2,449,044 | |||||||||||
| LMA Americas LLC |
| ||||||||||||
| 2,400,000 | 0.243 | 12/10/14 | 2,398,880 | |||||||||||
|
| |||||||||||||
| 5,847,394 | ||||||||||||||
|
| |||||||||||||
| Short-term Investments – (continued) | ||||||||||||||
| Repurchase Agreement(g) – 3.9% | ||||||||||||||
| Joint Repurchase Agreement Account II |
| ||||||||||||
| $ | 9,400,000 | 0.012 | % | 10/01/14 | $ | 9,400,000 | ||||||||
|
| |||||||||||||
| TOTAL SHORT-TERM INVESTMENTS | ||||||||||||||
| (Cost $15,247,394) | $ | 15,247,394 | ||||||||||||
|
| |||||||||||||
| TOTAL INVESTMENTS – 96.9% | ||||||||||||||
| (Cost $236,369,351) | $ | 236,319,627 | ||||||||||||
|
| |||||||||||||
| | OTHER ASSETS IN EXCESS OF LIABILITIES – 3.1% | | 7,614,756 | |||||||||||
|
| |||||||||||||
| NET ASSETS – 100.0% | $ | 243,934,383 | ||||||||||||
|
| |||||||||||||
| The percentage shown for each investment category reflects the value of investments in that category as a percentage of net assets. | ||
(a) | Security with “Call” features with resetting interest rates. Maturity dates disclosed are the final maturity dates. | |
(b) | Exempt from registration under Rule 144A of the Securities Act of 1933. Under procedures approved by the Board of Trustees, such securities have been determined to be liquid by the investment adviser and may be resold, normally to qualified institutional buyers in transactions exempt from registration. Total market value of Rule 144A securities amounts to $44,422,174, which represents approximately 18.2% of net assets as of September 30, 2014. | |
(c) | Variable rate security. Interest rate or distribution rate disclosed is that which is in effect at September 30, 2014. | |
(d) | Security with a notional or nominal principal amount. The actual effective yield of this security is different than the stated interest rate. | |
(e) | Issued with a zero coupon. Income is recognized through the accretion of discount. | |
(f) | All or a portion of security is segregated as collateral for initial margin requirements on futures transactions. | |
(g) | Joint repurchase agreement was entered into on September 30, 2014. Additional information appears on pages page 87. | |
| 78 | The accompanying notes are an integral part of these financial statements. |
GOLDMAN SACHS SHORT DURATION INCOME FUND
| ||
Currency Abbreviations: | ||
AUD | —Australian Dollar | |
BRL | —Brazilian Real | |
CAD | —Canadian Dollar | |
CHF | —Swiss Franc | |
CNH | —Chinese Yuan Renminbi Offshore | |
EUR | —Euro | |
GBP | —British Pound | |
HUF | —Hungarian Forint | |
IDR | —Indonesian Rupiah | |
ILS | —Israeli Shekel | |
INR | —Indian Rupee | |
JPY | —Japanese Yen | |
KRW | —South Korean Won | |
MXN | —Mexican Peso | |
MYR | —Malaysian Ringgit | |
NOK | —Norwegian Krone | |
NZD | —New Zealand Dollar | |
PHP | —Philippine Peso | |
PLN | —Polish Zloty | |
RUB | —Russian Ruble | |
SEK | —Swedish Krona | |
SGD | —Singapore Dollar | |
TRY | —Turkish Lira | |
TWD | —Taiwan Dollar | |
USD | —U.S. Dollar | |
Investment Abbreviations: | ||
AUDOR | —Australian Dollar Offered Rate | |
BP | —British Pound Offered Rate | |
CLO | —Collateralized Loan Obligation | |
EURO | —Euro Offered Rate | |
FFCB | —Federal Farm Credit Bank | |
FHLB | —Federal Home Loan Bank | |
FHLMC | —Federal Home Loan Mortgage Corp. | |
FNMA | —Federal National Mortgage Association | |
GNMA | —Government National Mortgage Association | |
GO | —General Obligation | |
JYOR | —Japanese Yen Offered Rate | |
KWCDC | —South Korean Won Certificate of Deposit | |
LIBOR | —London Interbank Offered Rate | |
LP | —Limited Partnership | |
NZDOR | —New Zealand Dollar Offered Rate | |
OTC | —Over the Counter | |
RB | —Revenue Bond | |
REMIC | —Real Estate Mortgage Investment Conduit | |
SPA | —Stand-by Purchase Agreement | |
STIBOR | —Stockholm Interbank Offered Rate | |
STRIPS | —Separate Trading of Registered Interest and Principal of Securities | |
| ||
| ADDITIONAL INVESTMENT INFORMATION |
FORWARD FOREIGN CURRENCY EXCHANGE CONTRACTS — At September 30, 2014, the Fund had the following forward foreign currency exchange contracts:
FORWARD FOREIGN CURRENCY EXCHANGE CONTRACTS WITH UNREALIZED GAIN
| Counterparty | Contracts to Buy/Sell | Settlement Date | Current Value | Unrealized Gain | ||||||||||
Barclays Bank PLC | GBP/USD | 12/17/14 | $ | 427,689 | $ | 1,962 | ||||||||
| USD/AUD | 12/17/14 | 368,729 | 15,145 | |||||||||||
| USD/EUR | 12/17/14 | 139,014 | 3,569 | |||||||||||
| USD/GBP | 12/17/14 | 288,366 | 1,376 | |||||||||||
| USD/HUF | 12/17/14 | 183,988 | 4,619 | |||||||||||
| USD/ILS | 12/17/14 | 139,020 | 9,641 | |||||||||||
| USD/INR | 10/07/14 | 266,784 | 4,216 | |||||||||||
| USD/INR | 10/27/14 | 142,720 | 2,280 | |||||||||||
| USD/KRW | 10/27/14 | 215,422 | 2,078 | |||||||||||
| USD/MYR | 10/03/14 | 307,538 | 999 | |||||||||||
| USD/NZD | 12/17/14 | 136,312 | 5,463 | |||||||||||
| USD/SEK | 11/06/14 | 153,110 | 2,278 | |||||||||||
| USD/SEK | 12/17/14 | 196,390 | 3,401 | |||||||||||
| The accompanying notes are an integral part of these financial statements. | 79 |
GOLDMAN SACHS SHORT DURATION INCOME FUND
Schedule of Investments (continued)
September 30, 2014 (Unaudited)
| ADDITIONAL INVESTMENT INFORMATION (continued) |
FORWARD FOREIGN CURRENCY EXCHANGE CONTRACTS WITH UNREALIZED GAIN (continued)
| Counterparty | Contracts to Buy/Sell | Settlement Date | Current Value | Unrealized Gain | ||||||||||
BNP Paribas SA | EUR/PLN | 12/17/14 | $ | 142,508 | $ | 297 | ||||||||
| EUR/USD | 12/17/14 | 291,929 | 40 | |||||||||||
| GBP/EUR | 12/17/14 | 130,167 | 3,038 | |||||||||||
| NZD/USD | 12/17/14 | 289,662 | 642 | |||||||||||
| USD/AUD | 12/17/14 | 552,873 | 14,816 | |||||||||||
| USD/BRL | 10/14/14 | 286,715 | 3,285 | |||||||||||
| USD/BRL | 10/22/14 | 139,913 | 4,087 | |||||||||||
| USD/EUR | 12/17/14 | 2,896,539 | 87,049 | |||||||||||
| USD/GBP | 12/17/14 | 286,746 | 1,099 | |||||||||||
| USD/JPY | 12/17/14 | 184,926 | 1,071 | |||||||||||
| USD/MYR | 10/20/14 | 140,733 | 2,267 | |||||||||||
| USD/RUB | 10/27/14 | 285,148 | 4,852 | |||||||||||
| USD/TRY | 12/17/14 | 109,223 | 5,329 | |||||||||||
Citibank NA | CHF/EUR | 12/17/14 | 139,014 | 416 | ||||||||||
| GBP/EUR | 12/17/14 | 281,819 | 1,531 | |||||||||||
| NOK/EUR | 12/17/14 | 420,833 | 5,715 | |||||||||||
| PHP/USD | 10/20/14 | 73,015 | 15 | |||||||||||
| USD/CAD | 12/17/14 | 210,011 | 2,989 | |||||||||||
| USD/CHF | 12/17/14 | 389,305 | 7,850 | |||||||||||
| USD/INR | 10/14/14 | 280,092 | 4,908 | |||||||||||
| USD/NZD | 12/17/14 | 190,736 | 11,467 | |||||||||||
| USD/PHP | 10/14/14 | 69,359 | 1,641 | |||||||||||
| USD/SGD | 12/17/14 | 198,230 | 3,320 | |||||||||||
| USD/TRY | 12/17/14 | 137,417 | 4,583 | |||||||||||
| USD/TWD | 10/17/14 | 282,030 | 2,970 | |||||||||||
| USD/TWD | 10/20/14 | 283,485 | 2,515 | |||||||||||
Credit Suisse International (London) | USD/CHF | 12/17/14 | 419,700 | 8,744 | ||||||||||
| USD/RUB | 10/02/14 | 128,255 | 6,745 | |||||||||||
Deutsche Bank AG (London) | RUB/USD | 11/17/14 | 32,695 | 57 | ||||||||||
| USD/AUD | 12/17/14 | 633,422 | 25,721 | |||||||||||
| USD/CNH | 12/17/14 | 1,146,252 | 3,748 | |||||||||||
| USD/EUR | 12/17/14 | 139,014 | 3,467 | |||||||||||
| USD/GBP | 10/22/14 | 2,872,393 | 43,421 | |||||||||||
| USD/INR | 10/07/14 | 374,111 | 1,784 | |||||||||||
| USD/JPY | 12/17/14 | 278,681 | 6,319 | |||||||||||
| USD/KRW | 10/14/14 | 279,146 | 5,854 | |||||||||||
| USD/MXN | 12/17/14 | 284,192 | 3,808 | �� | ||||||||||
| USD/MYR | 10/03/14 | 114,921 | 1,079 | |||||||||||
| USD/MYR | 10/07/14 | 303,303 | 8,697 | |||||||||||
| USD/NZD | 12/17/14 | 563,834 | 11,330 | |||||||||||
| USD/PHP | 10/14/14 | 69,373 | 1,627 | |||||||||||
| USD/PHP | 10/20/14 | 141,014 | 1,986 | |||||||||||
| USD/RUB | 10/02/14 | 32,976 | 2 | |||||||||||
| USD/RUB | 11/17/14 | 129,826 | 9,244 | |||||||||||
| USD/SEK | 12/17/14 | 394,517 | 7,483 | |||||||||||
| USD/TWD | 10/20/14 | 27,612 | 194 | |||||||||||
| 80 | The accompanying notes are an integral part of these financial statements. |
GOLDMAN SACHS SHORT DURATION INCOME FUND
| ADDITIONAL INVESTMENT INFORMATION (continued) |
FORWARD FOREIGN CURRENCY EXCHANGE CONTRACTS WITH UNREALIZED GAIN (continued)
| Counterparty | Contracts to Buy/Sell | Settlement Date | Current Value | Unrealized Gain | ||||||||||
HSBC Bank PLC | GBP/USD | 12/17/14 | $ | 144,183 | $ | 1,233 | ||||||||
| SEK/EUR | 12/17/14 | 293,192 | 108 | |||||||||||
| TWD/USD | 10/20/14 | 145,091 | 91 | |||||||||||
| USD/BRL | 10/27/14 | 47,064 | 740 | |||||||||||
| USD/CNH | 12/17/14 | 580,385 | 615 | |||||||||||
| USD/GBP | 12/17/14 | 264,066 | 6,862 | |||||||||||
| USD/JPY | 12/17/14 | 139,934 | 3,066 | |||||||||||
| USD/KRW | 10/22/14 | 42,474 | 539 | |||||||||||
| USD/KRW | 10/23/14 | 99,708 | 1,292 | |||||||||||
| USD/NZD | 12/17/14 | 190,736 | 12,189 | |||||||||||
| USD/SGD | 12/17/14 | 285,625 | 5,367 | |||||||||||
| USD/TRY | 12/17/14 | 116,351 | 5,871 | |||||||||||
JPMorgan Chase Bank NA | GBP/EUR | 12/17/14 | 139,014 | 3,763 | ||||||||||
| MXN/USD | 12/17/14 | 145,479 | 479 | |||||||||||
| SEK/EUR | 12/17/14 | 540,889 | 1,971 | |||||||||||
| USD/EUR | 10/30/14 | 882,016 | 22,747 | |||||||||||
| USD/EUR | 12/17/14 | 144,069 | 1,205 | |||||||||||
| USD/IDR | 10/31/14 | 74,729 | 1,508 | |||||||||||
| USD/INR | 10/29/14 | 214,406 | 2,594 | |||||||||||
| USD/JPY | 12/17/14 | 419,588 | 18,909 | |||||||||||
| USD/MXN | 10/31/14 | 5,588,122 | 110,281 | |||||||||||
| USD/MXN | 12/17/14 | 729,873 | 12,727 | |||||||||||
| USD/RUB | 10/20/14 | 70,068 | 1,932 | |||||||||||
| USD/RUB | 11/17/14 | 127,124 | 8,126 | |||||||||||
| USD/TRY | 12/17/14 | 273,937 | 11,063 | |||||||||||
Morgan Stanley & Co. International PLC | TWD/USD | 10/17/14 | 292,155 | 155 | ||||||||||
| USD/AUD | 12/17/14 | 165,373 | 5,686 | |||||||||||
| USD/ILS | 12/17/14 | 225,766 | 13,849 | |||||||||||
| USD/TRY | 12/17/14 | 392,173 | 12,011 | |||||||||||
Royal Bank of Canada | NOK/EUR | 12/17/14 | 139,014 | 2,785 | ||||||||||
| USD/AUD | 12/17/14 | 286,449 | 1,058 | |||||||||||
| USD/CAD | 12/17/14 | 714,227 | 5,773 | |||||||||||
| USD/JPY | 12/17/14 | 142,911 | 1,089 | |||||||||||
| USD/MXN | 11/28/14 | 1,728,360 | 22,635 | |||||||||||
| USD/TRY | 12/17/14 | 106,473 | 5,407 | |||||||||||
State Street Bank and Trust | AUD/USD | 12/17/14 | 291,673 | 1,389 | ||||||||||
| USD/CHF | 12/17/14 | 392,149 | 8,592 | |||||||||||
| USD/JPY | 12/17/14 | 418,214 | 9,786 | |||||||||||
| USD/NZD | 12/17/14 | 205,408 | 12,967 | |||||||||||
| USD/SEK | 12/17/14 | 196,235 | 2,954 | |||||||||||
Westpac Banking Corp. | AUD/USD | 12/17/14 | 434,462 | 1,102 | ||||||||||
| USD/AUD | 12/17/14 | 597,507 | 23,164 | |||||||||||
| USD/EUR | 10/30/14 | 198,590 | 4,562 | |||||||||||
| USD/EUR | 12/17/14 | 665,473 | 15,992 | |||||||||||
| USD/MYR | 10/07/14 | 100,750 | 2,924 | |||||||||||
| USD/MYR | 10/20/14 | 123,856 | 2,420 | |||||||||||
| USD/NZD | 12/17/14 | 252,486 | 15,399 | |||||||||||
| USD/SGD | 12/17/14 | 249,283 | 4,705 | |||||||||||
| TOTAL | $ | 797,811 | ||||||||||||
| The accompanying notes are an integral part of these financial statements. | 81 |
GOLDMAN SACHS SHORT DURATION INCOME FUND
Schedule of Investments (continued)
September 30, 2014 (Unaudited)
| ADDITIONAL INVESTMENT INFORMATION (continued) |
FORWARD FOREIGN CURRENCY EXCHANGE CONTRACTS WITH UNREALIZED LOSS
| Counterparty | Contracts to Buy/Sell | Settlement Date | Current Value | Unrealized Loss | ||||||||||
Barclays Bank PLC | EUR/PLN | 12/17/14 | $ | 281,246 | $ | (1,955 | ) | |||||||
| EUR/USD | 12/17/14 | 424,624 | (6,567 | ) | ||||||||||
| ILS/USD | 12/17/14 | 61,689 | (1,869 | ) | ||||||||||
| INR/USD | 10/07/14 | 513,493 | (5,736 | ) | ||||||||||
| INR/USD | 10/27/14 | 63,214 | (1,145 | ) | ||||||||||
| JPY/USD | 12/17/14 | 755,368 | (27,632 | ) | ||||||||||
| MYR/USD | 10/20/14 | 115,828 | (172 | ) | ||||||||||
| MYR/USD | 10/29/14 | 378,706 | (1,737 | ) | ||||||||||
| NZD/USD | 12/17/14 | 133,214 | (7,898 | ) | ||||||||||
| PLN/USD | 12/17/14 | 185,670 | (6,101 | ) | ||||||||||
| TWD/USD | 10/27/14 | 144,040 | (960 | ) | ||||||||||
BNP Paribas SA | AUD/USD | 12/17/14 | 274,260 | (10,330 | ) | |||||||||
| BRL/USD | 10/14/14 | 266,739 | (17,261 | ) | ||||||||||
| GBP/USD | 12/17/14 | 139,766 | (3,557 | ) | ||||||||||
| ILS/USD | 12/17/14 | 211,272 | (2,728 | ) | ||||||||||
| INR/USD | 10/14/14 | 63,404 | (863 | ) | ||||||||||
| PLN/USD | 12/17/14 | 375,026 | (8,828 | ) | ||||||||||
| RUB/USD | 11/17/14 | 87,786 | (7,369 | ) | ||||||||||
Citibank NA | AUD/USD | 12/17/14 | 421,402 | (8,498 | ) | |||||||||
| EUR/CHF | 12/17/14 | 275,665 | (165 | ) | ||||||||||
| EUR/GBP | 12/17/14 | 142,022 | (1,745 | ) | ||||||||||
| IDR/USD | 10/31/14 | 74,729 | (2,942 | ) | ||||||||||
| ILS/USD | 12/17/14 | 121,942 | (3,058 | ) | ||||||||||
| MXN/USD | 12/17/14 | 248,986 | (3,362 | ) | ||||||||||
| MYR/USD | 10/03/14 | 235,975 | (5,672 | ) | ||||||||||
| NOK/EUR | 12/17/14 | 293,192 | (432 | ) | ||||||||||
| NZD/USD | 12/17/14 | 137,860 | (5,462 | ) | ||||||||||
| PHP/USD | 10/29/14 | 71,725 | (275 | ) | ||||||||||
Credit Suisse International (London) | CHF/USD | 12/17/14 | 139,837 | (3,163 | ) | |||||||||
| EUR/CHF | 12/17/14 | 293,356 | (164 | ) | ||||||||||
| RUB/USD | 10/02/14 | 126,620 | (8,380 | ) | ||||||||||
| RUB/USD | 10/27/14 | 280,758 | (8,242 | ) | ||||||||||
| RUB/USD | 11/17/14 | 72,965 | (3,775 | ) | ||||||||||
Deutsche Bank AG (London) | AUD/USD | 12/17/14 | 273,389 | (10,677 | ) | |||||||||
| CNH/USD | 12/17/14 | 565,177 | (2,823 | ) | ||||||||||
| EUR/GBP | 12/17/14 | 264,292 | (3,957 | ) | ||||||||||
| EUR/USD | 12/17/14 | 1,266,288 | (25,197 | ) | ||||||||||
| GBP/USD | 10/22/14 | 333,889 | (3,010 | ) | ||||||||||
| HUF/USD | 12/17/14 | 142,067 | (2,933 | ) | ||||||||||
| IDR/USD | 11/03/14 | 145,763 | (237 | ) | ||||||||||
| INR/USD | 10/29/14 | 371,776 | (2,720 | ) | ||||||||||
| KRW/USD | 10/14/14 | 145,972 | (28 | ) | ||||||||||
| MXN/USD | 12/17/14 | 410,234 | (8,889 | ) | ||||||||||
| PHP/USD | 10/20/14 | 144,904 | (96 | ) | ||||||||||
| PLN/USD | 12/17/14 | 262,543 | (8,613 | ) | ||||||||||
| RUB/USD | 10/02/14 | 34,610 | (1,817 | ) | ||||||||||
| TRY/USD | 12/17/14 | 446,437 | (16,452 | ) | ||||||||||
| 82 | The accompanying notes are an integral part of these financial statements. |
GOLDMAN SACHS SHORT DURATION INCOME FUND
| ADDITIONAL INVESTMENT INFORMATION (continued) |
FORWARD FOREIGN CURRENCY EXCHANGE CONTRACTS WITH UNREALIZED LOSS (continued)
| Counterparty | Contracts to Buy/Sell | Settlement Date | Current Value | Unrealized Loss | ||||||||||
HSBC Bank PLC | EUR/USD | 12/17/14 | $ | 213,576 | $ | (3,435 | ) | |||||||
| INR/USD | 10/27/14 | 58,444 | (903 | ) | ||||||||||
| MXN/USD | 12/17/14 | 246,633 | (3,133 | ) | ||||||||||
| RUB/USD | 10/17/14 | 68,949 | (2,051 | ) | ||||||||||
| SGD/USD | 12/17/14 | 286,603 | (2,397 | ) | ||||||||||
| TRY/USD | 12/17/14 | 143,561 | (1,439 | ) | ||||||||||
| USD/GBP | 12/17/14 | 285,126 | (917 | ) | ||||||||||
JPMorgan Chase Bank NA | EUR/GBP | 12/17/14 | 285,794 | (7,767 | ) | |||||||||
| EUR/NOK | 12/17/14 | 281,945 | (3,918 | ) | ||||||||||
| JPY/USD | 12/17/14 | 557,588 | (13,412 | ) | ||||||||||
| MYR/USD | 10/03/14 | 186,483 | (4,061 | ) | ||||||||||
| MYR/USD | 10/07/14 | 62,146 | (1,108 | ) | ||||||||||
| MYR/USD | 10/20/14 | 72,742 | (258 | ) | ||||||||||
| RUB/USD | 11/17/14 | 74,891 | (3,074 | ) | ||||||||||
| SEK/USD | 12/17/14 | 279,952 | (5,048 | ) | ||||||||||
| TRY/USD | 12/17/14 | 141,972 | (3,028 | ) | ||||||||||
| USD/MXN | 12/17/14 | 434,942 | (942 | ) | ||||||||||
Morgan Stanley & Co. International PLC | AUD/USD | 12/17/14 | 272,518 | (10,429 | ) | |||||||||
| BRL/USD | 10/14/14 | 103,567 | (4,526 | ) | ||||||||||
| BRL/USD | 10/27/14 | 141,911 | (3,089 | ) | ||||||||||
| CHF/USD | 12/17/14 | 140,000 | (3,000 | ) | ||||||||||
| EUR/CHF | �� | 12/17/14 | 283,307 | (225 | ) | |||||||||
| EUR/HUF | 12/17/14 | 70,843 | (1,336 | ) | ||||||||||
| EUR/USD | 12/17/14 | 868,203 | (4,552 | ) | ||||||||||
| INR/USD | 10/27/14 | 58,874 | (954 | ) | ||||||||||
| KRW/USD | 10/27/14 | 142,210 | (2,790 | ) | ||||||||||
Royal Bank of Canada | CAD/USD | 12/17/14 | 802,749 | (13,028 | ) | |||||||||
| EUR/USD | 12/17/14 | 279,291 | (5,253 | ) | ||||||||||
| GBP/USD | 12/17/14 | 285,126 | (4,605 | ) | ||||||||||
| JPY/USD | 12/17/14 | 271,298 | (12,702 | ) | ||||||||||
| MXN/USD | 12/17/14 | 667,793 | (9,687 | ) | ||||||||||
| NZD/USD | 12/17/14 | 137,086 | (5,985 | ) | ||||||||||
| USD/TRY | 12/17/14 | 145,509 | (509 | ) | ||||||||||
State Street Bank and Trust | AUD/USD | 12/17/14 | 140,177 | (3,039 | ) | |||||||||
| EUR/GBP | 12/17/14 | 132,478 | (2,311 | ) | ||||||||||
| EUR/USD | 12/17/14 | 279,291 | (6,111 | ) | ||||||||||
| GBP/USD | 12/17/14 | 280,266 | (3,734 | ) | ||||||||||
| JPY/USD | 12/17/14 | 503,296 | (4,204 | ) | ||||||||||
| USD/CHF | 12/17/14 | 268,259 | (259 | ) | ||||||||||
Westpac Banking Corp. | AUD/USD | 12/17/14 | 834,098 | (22,390 | ) | |||||||||
| INR/USD | 10/07/14 | 127,402 | (2,164 | ) | ||||||||||
| INR/USD | 10/14/14 | 702,955 | (8,148 | ) | ||||||||||
| NZD/USD | 12/17/14 | 650,190 | (28,908 | ) | ||||||||||
| TRY/USD | 12/17/14 | 137,778 | (4,222 | ) | ||||||||||
| TOTAL | $ | (480,543 | ) | |||||||||||
| The accompanying notes are an integral part of these financial statements. | 83 |
GOLDMAN SACHS SHORT DURATION INCOME FUND
Schedule of Investments (continued)
September 30, 2014 (Unaudited)
| ADDITIONAL INVESTMENT INFORMATION (continued) |
FORWARD SALES CONTRACTS — At September 30, 2014, the Fund had the following forward sales contracts:
| Description | Interest Rate | Maturity Date(a) | Settlement Date | Principal Amount | Value | |||||||||||||
FNMA (Proceeds Receivable: $987,188) | 3.000 | % | TBA-30yr | 10/14/14 | $ | (1,000,000 | ) | $ | (985,547 | ) | ||||||||
| (a) | TBA (To Be Announced) Securities are purchased on a forward commitment basis with an approximate principal amount and no defined maturity date. The actual principal and maturity date will be determined upon settlement when the specific mortgage pools are assigned. |
FUTURES CONTRACTS — At September 30, 2014, the Fund had the following futures contracts:
| Type | Number of Contracts Long (Short) | Expiration Date | Current Value | Unrealized Gain (Loss) | ||||||||||
Eurodollars | (66 | ) | December 2016 | $ | (13,090,950 | ) | $ | 6,255 | ||||||
Eurodollars | (138 | ) | March 2017 | (33,663,375 | ) | 44,207 | ||||||||
Eurodollars | (119 | ) | June 2017 | (28,972,038 | ) | 54,098 | ||||||||
Eurodollars | (58 | ) | September 2017 | (14,099,075 | ) | 30,226 | ||||||||
French 10 Year Government Bonds | (2 | ) | December 2014 | (363,127 | ) | (3,502 | ) | |||||||
Italian 10 Year Government Bonds | 2 | December 2014 | 329,606 | 3,129 | ||||||||||
Japan 10 Year Government Bonds | (7 | ) | December 2014 | (9,308,229 | ) | (17,714 | ) | |||||||
Ultra Long U.S. Treasury Bonds | (60 | ) | December 2014 | (9,150,000 | ) | 130,516 | ||||||||
10 Year German Euro-Bund | 6 | December 2014 | 1,134,472 | 4,752 | ||||||||||
10 Year U.K. Long Gilt | (12 | ) | December 2014 | (2,201,003 | ) | (13,868 | ) | |||||||
2 Year U.S. Treasury Notes | 330 | December 2014 | 72,218,438 | (17,545 | ) | |||||||||
5 Year U.S. Treasury Notes | 341 | December 2014 | 40,325,914 | (146,467 | ) | |||||||||
10 Year U.S. Treasury Notes | (81 | ) | December 2014 | (10,095,891 | ) | (19,165 | ) | |||||||
20 Year U.S. Treasury Bonds | 42 | December 2014 | 5,792,063 | (67,188 | ) | |||||||||
| TOTAL | $ | (12,266 | ) | |||||||||||
SWAP CONTRACTS — At September 30, 2014, the Fund had the following swap contracts:
OVER THE COUNTER INTEREST RATE SWAP CONTRACTS
| Rates Exchanged | ||||||||||||||||||||||
| Counterparty | Notional Amount (000s) | Termination Date | Payments Received | Payments Made | Unrealized Gain (Loss)* | |||||||||||||||||
| Barclays Bank PLC | KRW 126,360 | 05/10/23 | 3 month KWCDC | 2.735 | % | $ | (846 | ) | ||||||||||||||
| 141,900 | 05/20/23 | 3 month KWCDC | 2.830 | (2,008 | ) | |||||||||||||||||
| 141,900 | 05/20/23 | 3 month KWCDC | 2.840 | (2,113 | ) | |||||||||||||||||
| Deutsche Bank AG | 141,880 | 05/15/23 | 3 month KWCDC | 2.815 | (1,812 | ) | ||||||||||||||||
| TOTAL | $ | (6,779 | ) | |||||||||||||||||||
| * | There are no upfront payments on the swap contract(s), therefore the unrealized gain (loss) on the swap contracts is equal to their market value. |
| 84 | The accompanying notes are an integral part of these financial statements. |
GOLDMAN SACHS SHORT DURATION INCOME FUND
| ADDITIONAL INVESTMENT INFORMATION (continued) |
CENTRALLY CLEARED INTEREST RATE SWAP CONTRACTS
| Rates Exchanged | Market Value | |||||||||||||||||
| Notional Amount (000s)(b) | Termination Date | Payments Received | Payments Made | Upfront Payments Made (Received) | Unrealized Gain (Loss) | |||||||||||||
| $ | 5,400 | 12/17/16 | 3 month LIBOR | 1.000% | $ | (1,224 | ) | $ | 1,884 | |||||||||
| 600 | 02/01/17 | 3 month LIBOR | 1.625 | (118 | ) | 295 | ||||||||||||
| 1,200 | 08/04/17 | 3 month LIBOR | 2.195 | (1,437 | ) | 1,044 | ||||||||||||
| GBP | 1,010 | 09/12/17 | 6 month GBP | 2.250 | 2,227 | (2,779 | ) | |||||||||||
| JPY | 193,070 | 02/12/19 | 6 month JYOR | 0.420 | (458 | ) | (7,604 | ) | ||||||||||
| EUR | 1,740 | 12/17/19 | 1.000% | 6 month EURO | 53,099 | 3,270 | ||||||||||||
| $ | 8,200 | 12/17/19 | 3 month LIBOR | 2.250 | (71,659 | ) | 1,146 | |||||||||||
| SEK | 12,840 | 12/17/19 | 3 month STIBOR | 1.250 | (15,646 | ) | 4,091 | |||||||||||
| NZD | 3,130 | 12/17/19 | 4.500 | 3 month NZDOR | (3,464 | ) | 13,222 | |||||||||||
| AUD | 1,180 | 12/17/19 | 6 month AUDOR | 3.750 | (12,850 | ) | (4,900 | ) | ||||||||||
| $ | 3,400 | 10/02/20 | 2.533 | 3 month LIBOR | 17 | — | ||||||||||||
| GBP | 590 | 02/05/21 | 2.840 | 6 month GBP | (3,612 | ) | 18,770 | |||||||||||
| $ | 1,800 | 08/04/21 | 3.025 | 3 month LIBOR | 7,306 | 2,482 | ||||||||||||
| GBP | 1,030 | 09/12/21 | 2.680 | 6 month GBP | (13,385 | ) | 15,325 | |||||||||||
| $ | 19,400 | 12/17/21 | 3 month LIBOR | 2.500 | (97,720 | ) | (9,872 | ) | ||||||||||
| JPY | 271,790 | 02/12/22 | 1.080 | 6 month JYOR | 674 | 25,019 | ||||||||||||
| $ | 1,500 | 01/30/24 | 4.252 | 3 month LIBOR | 20,059 | 35,392 | ||||||||||||
| 210 | 04/04/24 | 4.000 | 3 month LIBOR | (1,085 | ) | 6,345 | ||||||||||||
| AUD | 1,160 | 09/17/24 | 4.500 | 6 month AUDOR | (4,279 | ) | 5,916 | |||||||||||
| GBP | 750 | 09/17/24 | 6 month GBP | 3.250 | (4,773 | ) | (5,678 | ) | ||||||||||
| $ | 4,300 | 12/17/24 | 3 month LIBOR | 3.000 | (114,674 | ) | 9,719 | |||||||||||
| AUD | 610 | 12/17/24 | 4.500 | 6 month AUDOR | 22,595 | 5,324 | ||||||||||||
| NZD | 770 | 12/17/24 | 5.000 | 3 month NZDOR | 11,618 | 7,583 | ||||||||||||
| JPY | 893,730 | 12/17/24 | 6 month JYOR | 0.750 | (70,286 | ) | 16,747 | |||||||||||
| GBP | 1,000 | 12/18/24 | 3.250 | 6 month GBP | 8,100 | 4,259 | ||||||||||||
| EUR | 1,400 | 12/18/24 | 6 month EURO | 2.000 | 2,661 | (8,695 | ) | |||||||||||
| JPY | 215,700 | 02/14/25 | 6 month JYOR | 1.720 | 189 | (23,402 | ) | |||||||||||
| 341,000 | 05/09/25 | 6 month JYOR | 1.650 | 46,418 | (72,765 | ) | ||||||||||||
| $ | 4,900 | 03/10/26 | 3.170 | 3 month LIBOR | (355,209 | ) | 370,884 | |||||||||||
| 1,000 | 08/04/26 | 3 month LIBOR | 3.409 | (5,273 | ) | (9,860 | ) | |||||||||||
| GBP | 560 | 09/12/26 | 6 month GBP | 2.980 | 8,714 | (14,377 | ) | |||||||||||
| $ | 1,100 | 09/28/26 | 3.280 | 3 month LIBOR | 9 | 1,480 | ||||||||||||
| JPY | 209,000 | 05/09/27 | 1.880 | 6 month JYOR | (41,691 | ) | 71,659 | |||||||||||
| $ | 11,600 | 12/17/29 | 3 month LIBOR | 3.250 | (271,749 | ) | (73,089 | ) | ||||||||||
| GBP | 330 | 02/05/36 | 6 month GBP | 3.500 | 2,855 | (43,632 | ) | |||||||||||
| $ | 600 | 01/30/39 | 3 month LIBOR | 4.370 | (22,879 | ) | (40,403 | ) | ||||||||||
| 650 | 12/17/44 | 3.500 | 3 month LIBOR | 21,561 | 13,188 | |||||||||||||
| GBP | 500 | 12/17/44 | 6 month GBP | 3.250 | (51,129 | ) | (8,473 | ) | ||||||||||
| TOTAL | $ | (956,498 | ) | $ | 309,515 | |||||||||||||
| (b) | Represents forward starting interest rate swaps whose effective dates of commencement of accruals and cash flows occur subsequent to September 30, 2014. |
| The accompanying notes are an integral part of these financial statements. | 85 |
GOLDMAN SACHS SHORT DURATION INCOME FUND
Schedule of Investments (continued)
September 30, 2014 (Unaudited)
| ADDITIONAL INVESTMENT INFORMATION (continued) |
CENTRALLY CLEARED CREDIT DEFAULT SWAP CONTRACT
| Market Value | ||||||||||||||||||||||
| Referenced Obligation | Notional Amount (000s) | Rates Received (Paid) | Termination Date | Credit Spread at September 30, 2014(c) | Upfront Payments Made (Received) | Unrealized Gain (Loss) | ||||||||||||||||
Protection Sold: | ||||||||||||||||||||||
CDX North America Investment Grade Index 21 | $3,625 | 1.000 | % | 12/20/18 | 0.563 | % | $ | 74,967 | $ | (9,335 | ) | |||||||||||
| (c) | Credit spread on the Referenced Obligation, together with the term of the swap contract, are indicators of payment/performance risk. The likelihood of a credit event occurring which would require a fund to make a payment or otherwise be required to perform under the swap contract is generally greater as the credit spread and the term of the swap contract increase. |
| 86 | The accompanying notes are an integral part of these financial statements. |
GOLDMAN SACHS SHORT DURATION AND GOVERNMENT FIXED INCOME FUNDS
Schedule of Investments
September 30, 2014 (Unaudited)
| ADDITIONAL INVESTMENT INFORMATION |
JOINT REPURCHASE AGREEMENT ACCOUNT II — At September 30, 2014, the Funds had undivided interests in the Joint Repurchase Agreement Account II, with a maturity date of October 1, 2014, as follows:
| Fund | Principal Amount | Maturity Value | Collateral Allocation Value | |||||||||
Enhanced Income | $ | 69,300,000 | $ | 69,300,023 | $ | 71,154,975 | ||||||
Government Income | 5,100,000 | 5,100,002 | 5,236,513 | |||||||||
High Quality Floating Rate | 60,000,000 | 60,000,020 | 61,606,039 | |||||||||
Inflation Protected Securities | 1,200,000 | 1,200,000 | 1,232,121 | |||||||||
Limited Maturity Obligations | 1,300,000 | 1,300,000 | 1,334,798 | |||||||||
Short Duration Government | 59,200,000 | 59,200,019 | 60,784,625 | |||||||||
Short Duration Income | 9,400,000 | 9,400,003 | 9,651,613 | |||||||||
REPURCHASE AGREEMENTS — At September 30, 2014, the Principal Amounts of the Funds’ interest in the Joint Repurchase Agreement Account II were as follows:
| Counterparty | Interest Rate | Enhanced Income | Government Income | High Quality Floating Rate | Inflation Protected Securities | Limited Maturity Obligations | Short Duration Government | Short Duration Income | ||||||||||||||||||||||||
BNP Paribas Securities Co. | 0.000 | % | $ | 19,010,340 | $ | 1,399,029 | $ | 16,459,169 | $ | 329,183 | $ | 356,615 | $ | 16,239,713 | $ | 2,578,603 | ||||||||||||||||
Citigroup Global Markets, Inc. | 0.010 | 2,032,644 | 149,588 | 1,759,865 | 35,197 | 38,131 | 1,736,400 | 275,712 | ||||||||||||||||||||||||
TD Securities (USA) LLC | 0.005 | 26,322,009 | 1,937,118 | 22,789,618 | 455,793 | 493,775 | 22,485,757 | 3,570,374 | ||||||||||||||||||||||||
Wells Fargo Securities LLC | 0.030 | 21,935,007 | 1,614,265 | 18,991,348 | 379,827 | 411,479 | 18,738,130 | 2,975,311 | ||||||||||||||||||||||||
| TOTAL | $ | 69,300,000 | $ | 5,100,000 | $ | 60,000,000 | $ | 1,200,000 | $ | 1,300,000 | $ | 59,200,000 | $ | 9,400,000 | ||||||||||||||||||
At September 30, 2014, the Joint Repurchase Agreement Account II was fully collateralized by:
| Issuer | Interest Rates | Maturity Dates | ||||||
Federal National Mortgage Association | 2.500 to 6.000 | % | 05/01/21 to 09/01/44 | |||||
Government National Mortgage Association | 3.500 to 4.500 | 08/15/42 to 06/20/44 | ||||||
U.S. Treasury Bond | 5.375 | 02/15/31 | ||||||
U.S. Treasury Note | 0.875 | 08/15/17 | ||||||
U.S. Treasury Inflation Protected Securities | 0.125 to 0.500 | 04/15/15 to 04/15/16 | ||||||
| The accompanying notes are an integral part of these financial statements. | 87 |
GOLDMAN SACHS SHORT DURATION AND GOVERNMENT FIXED INCOME FUNDS
Statements of Assets and Liabilities
September 30, 2014 (Unaudited)
| Enhanced Income Fund | ||||||
| Assets: | ||||||
Investments, at value (cost $540,267,142, $520,551,603, $430,078,313, $149,475,631, $7,658,759, $1,274,010,074 and $221,121,957) | $ | 540,759,609 | ||||
Repurchase agreement, at value which equals cost | 69,300,000 | |||||
Cash | 58,582 | |||||
Foreign currencies, at value (cost $28,439 for Short Duration Income Fund) | — | |||||
Receivables: | ||||||
Interest | 1,278,818 | |||||
Fund shares sold | 71,318 | |||||
Reimbursement from investment adviser | 51,622 | |||||
Investments sold | — | |||||
Investments sold on an extended-settlement basis | — | |||||
Unrealized gain on forward foreign currency exchange contracts | — | |||||
Collateral on certain derivative contracts(a) | — | |||||
Variation margin on certain derivative contracts | 27,340 | |||||
Deferred offering costs | — | |||||
Other assets | 4,084 | |||||
| Total assets | 611,551,373 | |||||
| Liabilities: | ||||||
Payables: | ||||||
Investments purchased | 9,747,508 | |||||
Investments purchased on an extended — settlement basis | — | |||||
Fund shares redeemed | 1,765,259 | |||||
Management fees | 116,474 | |||||
Distribution and Service fees and Transfer Agent fee | 30,327 | |||||
Income distribution | 7,040 | |||||
Collateral on certain derivative contracts | — | |||||
Forward sale contracts, at value (proceeds received $0, $6,836,719, $3,948,750, $0, $0, $33,570,781 and $987,188, respectively) | — | |||||
Unrealized loss on swap contracts | — | |||||
Unrealized loss on forward foreign currency exchange contracts | — | |||||
Payable for organizational costs | — | |||||
Due to broker — upfront payment | — | |||||
Accrued expenses and other liabilities | 134,696 | |||||
| Total liabilities | 11,801,304 | |||||
| Net Assets: | ||||||
Paid-in capital | 617,356,736 | |||||
Undistributed (distributions in excess of) net investment income | 406,495 | |||||
Accumulated net realized loss | (18,661,099 | ) | ||||
Net unrealized gain (loss) | 647,937 | |||||
| NET ASSETS | $ | 599,750,069 | ||||
Net Assets: | ||||||
Class A | $ | 39,617,968 | ||||
Class B | 87,664 | |||||
Class C | — | |||||
Institutional | 559,325,498 | |||||
Administration | 172,391 | |||||
Service | — | |||||
Class IR | 546,548 | |||||
Class R | — | |||||
Total Net Assets | $ | 599,750,069 | ||||
Shares Outstanding $0.001 par value (unlimited shares authorized): | ||||||
Class A | 4,190,319 | |||||
Class B | 9,285 | |||||
Class C | — | |||||
Institutional | 59,214,522 | |||||
Administration | 18,194 | |||||
Service | — | |||||
Class IR | 57,901 | |||||
Class R | — | |||||
Net asset value, offering and redemption price per share:(b) | ||||||
Class A | $9.45 | |||||
Class B | 9.44 | |||||
Class C | — | |||||
Institutional | 9.45 | |||||
Administration | 9.48 | |||||
Service | — | |||||
Class IR | 9.44 | |||||
Class R | — | |||||
| (a) | Segregated for initial margin on swap transactions of $487,459, $1,103,513, $237,451, $5,319,387 and $1,188,104 for the Government Income, High Quality Floating Rate, Inflation Protected Securities, Short Duration Government, and Short Duration Income Funds, respectively. |
| (b) | Maximum public offering price per share for Class A shares of the Enhanced Income, Government Income, High Quality Floating Rate, Inflation Protected Securities, Short Duration Government, and Short Duration Income Fund is $9.59, $15.37, $8.89, $10.72, $10.30 and $10.29, respectively. At redemption, Class B and Class C shares may be subject to a contingent deferred sales charge, assessed on the amount equal to the lesser of the current net asset value or the original purchase price of the shares. |
| 88 | The accompanying notes are an integral part of these financial statements. |
GOLDMAN SACHS SHORT DURATION AND GOVERNMENT FIXED INCOME FUNDS
| Government Income Fund | High Quality Floating Rate Fund | Inflation Protected Securities Fund | Limited Maturity Obligations Fund | Short Duration Government Fund | Short Duration Income Fund | |||||||||||||||||||||||||||||
| $ | 527,840,661 | $ | 431,310,134 | $ | 149,016,524 | $ | 7,663,479 | $ | 1,281,644,911 | $ | 221,072,233 | |||||||||||||||||||||||
| 5,100,000 | 60,000,000 | 1,200,000 | 2,280,000 | 59,200,000 | 15,247,394 | |||||||||||||||||||||||||||||
| 94,280 | 100,530 | 3,465 | 78,848 | 285,692 | 461,896 | |||||||||||||||||||||||||||||
| — | — | — | — | — | 27,846 | |||||||||||||||||||||||||||||
| 1,555,580 | 486,322 | 309,558 | 37,167 | 4,263,956 | 1,405,523 | |||||||||||||||||||||||||||||
| 2,107,979 | 20,423,926 | 431,544 | — | 5,541,537 | 2,908,206 | |||||||||||||||||||||||||||||
| 46,191 | 122,921 | 34,029 | 22,111 | 96,946 | 39,572 | |||||||||||||||||||||||||||||
| 16,544,393 | 128,799 | 695,283 | — | 8,008,055 | 6,991,392 | |||||||||||||||||||||||||||||
| 84,201,680 | 3,948,750 | — | — | 37,833,438 | 3,033,438 | |||||||||||||||||||||||||||||
| — | — | — | — | — | 797,811 | |||||||||||||||||||||||||||||
| 487,459 | 1,103,513 | 237,451 | — | 5,319,387 | 1,188,104 | |||||||||||||||||||||||||||||
| 103,448 | 73,625 | 58,333 | — | 393,490 | 197,365 | |||||||||||||||||||||||||||||
| — | — | — | 84,412 | — | — | |||||||||||||||||||||||||||||
| 4,315 | 3,957 | 1,299 | — | 9,228 | 1,764 | |||||||||||||||||||||||||||||
| 638,085,986 | 517,702,477 | 151,987,486 | 10,166,017 | 1,402,596,640 | 253,372,544 | |||||||||||||||||||||||||||||
| 5,127,142 | 3,812,718 | — | 50,998 | 1,432,973 | 2,323,882 | |||||||||||||||||||||||||||||
| 152,244,375 | — | — | — | 7,637,500 | 3,118,810 | |||||||||||||||||||||||||||||
| 1,931,428 | 1,609,974 | 29,372 | — | 4,396,435 | 219,044 | |||||||||||||||||||||||||||||
| 204,862 | 120,359 | 37,905 | 1,482 | 485,004 | 78,097 | |||||||||||||||||||||||||||||
| 93,490 | 26,874 | 27,447 | 88 | 140,217 | 9,424 | |||||||||||||||||||||||||||||
| 124,588 | 22,541 | — | — | 98,007 | 59 | |||||||||||||||||||||||||||||
| 390,000 | 2,650,000 | 390,000 | — | 4,985,139 | 1,930,000 | |||||||||||||||||||||||||||||
| 6,898,828 | 3,942,188 | — | — | 33,508,595 | 985,547 | |||||||||||||||||||||||||||||
| — | — | — | — | — | 6,779 | |||||||||||||||||||||||||||||
| — | — | — | — | — | 480,543 | |||||||||||||||||||||||||||||
| — | — | — | 12,000 | — | — | |||||||||||||||||||||||||||||
| 5 | 52 | — | — | 17 | 117,098 | |||||||||||||||||||||||||||||
| 209,489 | 87,916 | 98,440 | 80,473 | 256,609 | 168,878 | |||||||||||||||||||||||||||||
| 167,224,207 | 12,272,622 | 583,164 | 145,041 | 52,940,496 | 9,438,161 | |||||||||||||||||||||||||||||
| 474,710,364 | 535,801,188 | 169,039,920 | 10,016,331 | 1,348,514,730 | 243,841,686 | |||||||||||||||||||||||||||||
| 389,987 | (544,517 | ) | 378,401 | 22 | 6,026,508 | (136,962 | ) | |||||||||||||||||||||||||||
| (11,612,587 | ) | (30,972,579 | ) | (17,671,355 | ) | (97 | ) | (15,001,620 | ) | (321,017 | ) | |||||||||||||||||||||||
| 7,374,015 | 1,145,763 | (342,644 | ) | 4,720 | 10,116,526 | 550,676 | ||||||||||||||||||||||||||||
| $ | 470,861,779 | $ | 505,429,855 | $ | 151,404,322 | $ | 10,020,976 | $ | 1,349,656,144 | $ | 243,934,383 | |||||||||||||||||||||||
| $183,700,203 | $ | 41,339,432 | $ | 38,234,470 | $ | — | $ | 240,022,729 | $ | 4,067,644 | ||||||||||||||||||||||||
| 3,433,201 | — | — | — | — | — | |||||||||||||||||||||||||||||
| 13,813,012 | — | 9,325,538 | — | 41,898,490 | 947,882 | |||||||||||||||||||||||||||||
| 189,542,048 | 462,660,363 | 95,934,882 | 9,995,953 | 1,012,672,680 | 238,717,093 | |||||||||||||||||||||||||||||
| — | — | — | 25,023 | — | — | |||||||||||||||||||||||||||||
| 54,499,890 | 189,445 | — | — | 36,957,810 | — | |||||||||||||||||||||||||||||
| 3,934,937 | 1,240,615 | 2,067,211 | — | 18,104,435 | 191,316 | |||||||||||||||||||||||||||||
| 21,938,488 | — | 5,842,221 | — | — | 10,448 | |||||||||||||||||||||||||||||
| $470,861,779 | $ | 505,429,855 | $ | 151,404,322 | $ | 10,020,976 | $ | 1,349,656,144 | $ | 243,934,383 | ||||||||||||||||||||||||
| 12,420,026 | 4,719,956 | 3,704,665 | — | 23,641,236 | 401,188 | |||||||||||||||||||||||||||||
| 232,097 | — | — | — | — | — | |||||||||||||||||||||||||||||
| 933,901 | — | 906,663 | — | 4,154,161 | 93,475 | |||||||||||||||||||||||||||||
| 12,835,114 | 52,820,648 | 9,232,081 | 999,134 | 100,048,407 | 23,507,431 | |||||||||||||||||||||||||||||
| — | — | — | 2,501 | — | — | |||||||||||||||||||||||||||||
| 3,694,594 | 21,523 | — | — | 3,656,690 | — | |||||||||||||||||||||||||||||
| 266,222 | 141,911 | 199,750 | — | 1,781,557 | 18,848 | |||||||||||||||||||||||||||||
| 1,485,065 | — | 566,053 | — | — | 1,029 | |||||||||||||||||||||||||||||
| $14.79 | $8.76 | $10.32 | $ — | $10.15 | $10.14 | |||||||||||||||||||||||||||||
| 14.79 | — | — | — | — | — | |||||||||||||||||||||||||||||
| 14.79 | — | 10.29 | — | 10.09 | 10.14 | |||||||||||||||||||||||||||||
| 14.77 | 8.76 | 10.39 | 10.00 | 10.12 | 10.15 | |||||||||||||||||||||||||||||
| — | — | — | 10.00 | — | — | |||||||||||||||||||||||||||||
| 14.75 | 8.80 | — | — | 10.11 | — | |||||||||||||||||||||||||||||
| 14.78 | 8.74 | 10.35 | — | 10.16 | 10.15 | |||||||||||||||||||||||||||||
| 14.77 | — | 10.32 | — | — | 10.15 | |||||||||||||||||||||||||||||
| The accompanying notes are an integral part of these financial statements. | 89 |
GOLDMAN SACHS SHORT DURATION AND GOVERNMENT FIXED INCOME FUNDS
Statements of Operations
For the Six Months Ended September 30, 2014 (Unaudited)
| Enhanced Income Fund | ||||||
| Investment income: | ||||||
Interest | $ | 2,046,888 | ||||
| Expenses: | ||||||
Management fees | 687,191 | |||||
Transfer Agent fees(a) | 130,637 | |||||
Custody, accounting and administrative services | 74,738 | |||||
Registration fees | 74,164 | |||||
Distribution and Service fees(a) | 57,115 | |||||
Professional fees | 47,360 | |||||
Printing and mailing costs | 22,631 | |||||
Trustee fees | 11,644 | |||||
Shareholder meeting expense | 2,246 | |||||
Administration share fees | 234 | |||||
Service Share fees — Shareholder Administration Plan | — | |||||
Service Share fees — Service Plan | — | |||||
Amortization of offering costs | — | |||||
Other | 6,483 | |||||
| Total expenses | 1,114,443 | |||||
Less — expense reductions | (62,324 | ) | ||||
| Net expenses | 1,052,119 | |||||
| NET INVESTMENT INCOME | 994,769 | |||||
| Realized and unrealized gain (loss): | ||||||
Net realized gain (loss) from: | ||||||
Investments | 123,904 | |||||
Futures contracts | (207,407 | ) | ||||
Swap contracts | — | |||||
Forward foreign currency exchange contracts | — | |||||
Foreign currency transactions | — | |||||
Net change in unrealized gain (loss) on: | ||||||
Investments | (519,859 | ) | ||||
Futures contracts | (200,379 | ) | ||||
Swap contracts | — | |||||
Forward foreign currency exchange contracts | — | |||||
Foreign currency transactions | — | |||||
| Net realized and unrealized gain (loss) | (803,741 | ) | ||||
| NET INCREASE IN NET ASSETS RESULTING FROM OPERATIONS | $ | 191,028 | ||||
| (a) | Class specific Distribution and Service and Transfer Agent fees were as follows: |
| Distribution and Service Fees | Transfer Agent Fees | |||||||||||||||||||||||||||||||||||||||||||||||||||
Fund | Class A | Class B | Class C | Administration | Class R | Class A | Class B | Class C | Institutional | Administration | Service | Class IR | Class R | |||||||||||||||||||||||||||||||||||||||
Enhanced Income | $ | 56,629 | $ | 486 | $ | — | $ | — | $ | — | $ | 29,447 | $ | 63 | $ | — | $ | 100,719 | $ | 38 | $ | — | $ | 370 | $ | — | ||||||||||||||||||||||||||
Government Income | 235,225 | 19,758 | 73,154 | — | 53,879 | 122,317 | 2,569 | 9,510 | 38,505 | — | 10,980 | 2,608 | 14,008 | |||||||||||||||||||||||||||||||||||||||
High Quality Floating Rate | 52,561 | — | — | — | — | 27,332 | — | — | 78,589 | — | 40 | 864 | — | |||||||||||||||||||||||||||||||||||||||
Inflation Protected Securities | 49,315 | — | 49,804 | — | 13,395 | 25,644 | — | 6,474 | 19,233 | — | — | 1,380 | 3,483 | |||||||||||||||||||||||||||||||||||||||
Limited Maturity Obligations | — | — | — | 31 | — | — | — | — | 500 | 2 | — | — | — | |||||||||||||||||||||||||||||||||||||||
Short Duration Government | 327,301 | — | 225,129 | — | — | 170,197 | — | 29,267 | 205,684 | — | 7,582 | 11,476 | — | |||||||||||||||||||||||||||||||||||||||
Short Duration Income | 3,485 | — | 3,882 | — | 26 | 1,812 | — | 505 | 39,470 | — | — | 126 | 7 | |||||||||||||||||||||||||||||||||||||||
| 90 | The accompanying notes are an integral part of these financial statements. |
GOLDMAN SACHS SHORT DURATION AND GOVERNMENT FIXED INCOME FUNDS
| Government Income Fund | High Quality Floating Rate Fund | Inflation Protected Securities Fund | Limited Maturity Obligations Fund | Short Duration Government Fund | Short Duration Income Fund | |||||||||||||||||||||||||||||
| $ | 5,111,348 | $ | 1,970,809 | $ | 2,626,468 | $ | 25,329 | $ | 11,141,501 | $ | 1,974,702 | |||||||||||||||||||||||
| 1,295,327 | 873,049 | 252,543 | 12,544 | 3,380,107 | 402,230 | |||||||||||||||||||||||||||||
| 200,497 | 106,825 | 56,214 | 502 | 424,206 | 41,920 | |||||||||||||||||||||||||||||
| 115,593 | 98,163 | 39,093 | 15,660 | 150,481 | 99,629 | |||||||||||||||||||||||||||||
| 74,701 | 95,836 | 51,403 | 33,093 | 85,566 | 42,507 | |||||||||||||||||||||||||||||
| 382,016 | 52,561 | 112,514 | 31 | 552,430 | 7,393 | |||||||||||||||||||||||||||||
| 52,771 | 64,303 | 42,169 | 47,734 | 56,420 | 53,182 | |||||||||||||||||||||||||||||
| 27,081 | 22,629 | 13,838 | 25,465 | 50,015 | 16,095 | |||||||||||||||||||||||||||||
| 11,532 | 10,746 | 10,243 | 10,441 | 12,128 | 10,838 | |||||||||||||||||||||||||||||
| 7,528 | 1,846 | 3,004 | — | 11,242 | 995 | |||||||||||||||||||||||||||||
| — | — | — | — | — | — | |||||||||||||||||||||||||||||
| 68,627 | 251 | — | — | 47,388 | — | |||||||||||||||||||||||||||||
| 68,627 | 251 | — | — | 47,388 | — | |||||||||||||||||||||||||||||
| — | — | — | 84,264 | — | — | |||||||||||||||||||||||||||||
| 13,603 | 10,758 | 8,987 | 18,401 | 14,569 | 9,034 | |||||||||||||||||||||||||||||
| 2,317,903 | 1,337,218 | 590,008 | 248,135 | 4,831,940 | 683,823 | |||||||||||||||||||||||||||||
| (309,457 | ) | (467,913 | ) | (204,265 | ) | (238,375 | ) | (765,713 | ) | (217,949 | ) | |||||||||||||||||||||||
| 2,008,446 | 869,305 | 385,743 | 9,760 | 4,066,227 | 465,874 | |||||||||||||||||||||||||||||
| 3,102,902 | 1,101,504 | 2,240,725 | 15,569 | 7,075,274 | 1,508,828 | |||||||||||||||||||||||||||||
| 2,114,139 | 16,821 | 637,885 | (97 | ) | 520,396 | 671,263 | ||||||||||||||||||||||||||||
| (77,240 | ) | (38,094 | ) | (530,078 | ) | — | (1,832,921 | ) | (110,748 | ) | ||||||||||||||||||||||||
| (362,830 | ) | (462,127 | ) | (77,685 | ) | — | (3,804,113 | ) | (1,014,919 | ) | ||||||||||||||||||||||||
| — | — | — | — | — | 536,736 | |||||||||||||||||||||||||||||
| — | — | — | — | — | (55,824 | ) | ||||||||||||||||||||||||||||
| 3,354,435 | 284,252 | (437,293 | ) | 5,618 | 1,328,034 | (1,045,117 | ) | |||||||||||||||||||||||||||
| (339,741 | ) | 44,772 | 233,697 | — | 1,451,061 | 120,678 | ||||||||||||||||||||||||||||
| 33,960 | (250,395 | ) | 26,042 | — | 377,926 | 119,192 | ||||||||||||||||||||||||||||
| — | — | — | — | — | 311,390 | |||||||||||||||||||||||||||||
| — | 3 | — | — | — | (845 | ) | ||||||||||||||||||||||||||||
| 4,722,723 | (404,768 | ) | (147,432 | ) | 5,521 | (1,959,617 | ) | (468,194 | ) | |||||||||||||||||||||||||
| $ | 7,825,625 | $ | 696,736 | $ | 2,093,293 | $ | 21,090 | $ | 5,115,657 | $ | 1,040,634 | |||||||||||||||||||||||
| The accompanying notes are an integral part of these financial statements. | 91 |
GOLDMAN SACHS SHORT DURATION AND GOVERNMENT FIXED INCOME FUNDS
Statements of Changes in Net Assets
| Enhanced Income Fund | ||||||||||
For the Six Months Ended | For the Fiscal Year Ended March 31, 2014 | |||||||||
| From operations: | ||||||||||
Net investment income | $ | 994,769 | $ | 2,540,167 | ||||||
Net realized gain (loss) | (83,503 | ) | 462,446 | |||||||
Net change in unrealized gain (loss) | (720,238 | ) | (1,247,604 | ) | ||||||
| Net increase (decrease) in net assets resulting from operations | 191,028 | 1,755,009 | ||||||||
| Distributions to shareholders: | ||||||||||
From net investment income | ||||||||||
Class A Shares | (11,922 | ) | (168,540 | ) | ||||||
Class B Shares | — | (43 | ) | |||||||
Class C Shares | — | — | ||||||||
Institutional Shares | (975,418 | ) | (2,378,333 | ) | ||||||
Service Shares | — | — | ||||||||
Administration Shares | (131 | ) | (829 | ) | ||||||
Class IR Shares | (853 | ) | (4,962 | ) | ||||||
Class R Shares | — | — | ||||||||
From net realized gains | ||||||||||
Class A Shares | — | — | ||||||||
Class B Shares | — | — | ||||||||
Class C Shares | — | — | ||||||||
Institutional Shares | — | — | ||||||||
Service Shares | — | — | ||||||||
Class IR Shares | — | — | ||||||||
Class R Shares | — | — | ||||||||
| Total distributions to shareholders | (988,324 | ) | (2,552,707 | ) | ||||||
| From share transactions: | ||||||||||
Proceeds from sales of shares | 164,322,349 | 523,694,666 | ||||||||
Reinvestment of distributions | 940,010 | 2,366,563 | ||||||||
Cost of shares redeemed | (124,544,068 | ) | (313,998,234 | ) | ||||||
| Net increase (decrease) in net assets resulting from share transactions | 40,718,291 | 212,062,995 | ||||||||
| TOTAL INCREASE (DECREASE) | 39,920,995 | 211,265,297 | ||||||||
| Net assets: | ||||||||||
Beginning of period | 559,829,074 | 348,563,777 | ||||||||
End of period | $ | 599,750,069 | $ | 559,829,074 | ||||||
| Undistributed (distributions in excess of) net investment income | $ | 406,495 | $ | 400,050 | ||||||
| 92 | The accompanying notes are an integral part of these financial statements. |
GOLDMAN SACHS SHORT DURATION AND GOVERNMENT FIXED INCOME FUNDS
| Government Income Fund | High Quality Floating Rate Fund | ||||||||||||||||||||
For the Six Months Ended | For the Fiscal Year Ended | For the Six Months Ended | For the Fiscal Year Ended | |||||||||||||||||||
| $ | 3,102,902 | $ | 6,309,856 | $ | 1,101,504 | $ | 1,237,319 | |||||||||||||||
| 1,674,069 | (2,589,509 | ) | (483,400 | ) | 294,635 | |||||||||||||||||
| 3,048,654 | (10,672,086 | ) | 78,632 | (760,790 | ) | |||||||||||||||||
| 7,825,625 | (6,951,739 | ) | 696,736 | 771,164 | ||||||||||||||||||
| (1,390,081 | ) | (2,432,980 | ) | (38,307 | ) | (118,007 | ) | |||||||||||||||
| (14,545 | ) | (21,644 | ) | — | — | |||||||||||||||||
| (53,327 | ) | (67,299 | ) | — | — | |||||||||||||||||
| (1,751,758 | ) | (4,536,913 | ) | (1,007,569 | ) | (1,182,124 | ) | |||||||||||||||
| (360,993 | ) | (552,910 | ) | (58 | ) | (148 | ) | |||||||||||||||
| — | — | — | — | |||||||||||||||||||
| (34,699 | ) | (46,258 | ) | (2,885 | ) | (6,586 | ) | |||||||||||||||
| (131,873 | ) | (182,778 | ) | — | — | |||||||||||||||||
| — | (583,050 | ) | — | — | ||||||||||||||||||
| — | (15,972 | ) | — | — | ||||||||||||||||||
| — | (46,301 | ) | — | — | ||||||||||||||||||
| — | (906,210 | ) | — | — | ||||||||||||||||||
| — | (157,122 | ) | — | — | ||||||||||||||||||
| — | (10,605 | ) | — | — | ||||||||||||||||||
| — | (61,071 | ) | — | — | ||||||||||||||||||
| (3,737,276 | ) | (9,621,113 | ) | (1,048,819 | ) | (1,306,865 | ) | |||||||||||||||
| 67,204,010 | 205,256,305 | 232,894,562 | 424,591,357 | |||||||||||||||||||
| 2,937,878 | 7,606,248 | 840,752 | 1,083,551 | |||||||||||||||||||
| (92,551,228 | ) | (476,713,301 | ) | (152,286,965 | ) | (207,553,611 | ) | |||||||||||||||
| (22,409,340 | ) | (263,850,748 | ) | 81,448,349 | 218,121,297 | |||||||||||||||||
| (18,320,991 | ) | (280,423,600 | ) | 81,096,266 | 217,585,596 | |||||||||||||||||
| 489,182,770 | 769,606,370 | 424,333,589 | 206,747,993 | |||||||||||||||||||
| $ | 470,861,779 | $ | 489,182,770 | $ | 505,429,855 | $ | 424,333,589 | |||||||||||||||
| $ | 389,987 | $ | 1,024,361 | $ | (544,517 | ) | $ | (597,202 | ) | |||||||||||||
| The accompanying notes are an integral part of these financial statements. | 93 |
GOLDMAN SACHS SHORT DURATION AND GOVERNMENT FIXED INCOME FUNDS
Statements of Changes in Net Assets
| Inflation Protected Securities Fund | ||||||||||
For the Six Months Ended | For the Fiscal Year Ended March 31, 2014 | |||||||||
| From operations: | ||||||||||
Net investment income | $ | 2,240,725 | $ | 2,646,098 | ||||||
Net realized gain (loss) | 30,122 | (10,455,138 | ) | |||||||
Net change in unrealized gain (loss) | (177,554 | ) | (15,978,473 | ) | ||||||
| Net increase (decrease) in net assets resulting from operations | 2,093,293 | (23,787,513 | ) | |||||||
| Distributions to shareholders: | ||||||||||
From net investment income | ||||||||||
Class A Shares | (435,637 | ) | (137,956 | ) | ||||||
Class B Shares | — | — | ||||||||
Class C Shares | (85,273 | ) | (21,442 | ) | ||||||
Institutional Shares | (1,177,193 | ) | (752,866 | ) | ||||||
Service Shares | — | — | ||||||||
Administration Shares | — | — | ||||||||
Class IR Shares | (25,439 | ) | (8,598 | ) | ||||||
Class R Shares | (55,215 | ) | (4,463 | ) | ||||||
From net realized gains | ||||||||||
Class A Shares | — | (536,321 | ) | |||||||
Class C Shares | — | (184,901 | ) | |||||||
Institutional Shares | — | (2,494,656 | ) | |||||||
Class IR Shares | — | (32,509 | ) | |||||||
Class R Shares | — | (52,391 | ) | |||||||
Return of capital | ||||||||||
Class A Shares | — | (101,572 | ) | |||||||
Class C Shares | — | (15,787 | ) | |||||||
Institutional Shares | — | (554,306 | ) | |||||||
Class IR Shares | — | (6,330 | ) | |||||||
Class R Shares | — | (3,286 | ) | |||||||
| Total distributions to shareholders | (1,778,757 | ) | (4,907,384 | ) | ||||||
| From share transactions: | ||||||||||
Proceeds from sales of shares | 31,281,202 | 108,459,245 | ||||||||
Reinvestment of distributions | 1,432,220 | 4,410,842 | ||||||||
Cost of shares redeemed | (27,947,630 | ) | (312,574,656 | ) | ||||||
| Net increase (decrease) in net assets resulting from share transactions | 4,765,792 | (199,704,569 | ) | |||||||
| TOTAL INCREASE (DECREASE) | 5,080,328 | (228,399,466 | ) | |||||||
| Net assets: | ||||||||||
Beginning of period | 146,323,994 | 374,723,460 | ||||||||
End of period | $ | 151,404,322 | $ | 146,323,994 | ||||||
| Undistributed (distribution in excess of) net investment income (loss) | $ | 378,401 | $ | (83,567 | ) | |||||
| (a) | Commenced operations on February 28, 2014. |
| (b) | Short Duration Government Class B Shares liquidated on March 17, 2014. |
| 94 | The accompanying notes are an integral part of these financial statements. |
GOLDMAN SACHS SHORT DURATION AND GOVERNMENT FIXED INCOME FUNDS
| Limited Maturity Obligations Fund | Short Duration Government Fund | Short Duration Income Fund | |||||||||||||||||||||||||||||||
For the Six Months Ended | For the Period Ended | For the Six Months Ended | For the Fiscal Year Ended March 31, 2014 | For the Six Months Ended | For the Fiscal Year Ended | |||||||||||||||||||||||||||||
| $ | 15,569 | $ | 779 | $ | 7,075,274 | $ | 12,848,397 | $ | 1,508,828 | $ | 1,719,012 | |||||||||||||||||||||||
| (97 | ) | — | (5,116,638 | ) | 8,036,415 | 26,508 | (365,725 | ) | ||||||||||||||||||||||||||
| 5,618 | (898 | ) | 3,157,021 | (16,881,073 | ) | (494,702 | ) | 661,239 | ||||||||||||||||||||||||||
| 21,090 | (119 | ) | 5,115,657 | 4,003,739 | 1,040,634 | 2,014,526 | ||||||||||||||||||||||||||||
| — | — | (1,159,188 | ) | (2,590,556 | ) | (18,553 | ) | (18,439 | ) | |||||||||||||||||||||||||
| — | — | — | (247 | )(b) | — | — | ||||||||||||||||||||||||||||
| — | — | (109,644 | ) | (219,113 | ) | (3,602 | ) | (4,050 | ) | |||||||||||||||||||||||||
| (16,332 | ) | — | (6,282,735 | ) | (11,401,938 | ) | (1,655,165 | ) | (1,786,392 | ) | ||||||||||||||||||||||||
| — | — | (137,028 | ) | (281,585 | ) | — | — | |||||||||||||||||||||||||||
| (10 | ) | — | — | — | — | — | ||||||||||||||||||||||||||||
| — | — | (99,898 | ) | (197,559 | ) | (1,568 | ) | (1,831 | ) | |||||||||||||||||||||||||
| — | — | — | — | (58 | ) | (100 | ) | |||||||||||||||||||||||||||
| — | — | — | — | — | (810 | ) | ||||||||||||||||||||||||||||
| — | — | — | — | — | (256 | ) | ||||||||||||||||||||||||||||
| — | — | — | — | — | (61,468 | ) | ||||||||||||||||||||||||||||
| — | — | — | — | — | (57 | ) | ||||||||||||||||||||||||||||
| — | — | — | — | — | (5 | ) | ||||||||||||||||||||||||||||
| — | — | — | — | — | — | |||||||||||||||||||||||||||||
| — | — | — | — | — | — | |||||||||||||||||||||||||||||
| — | — | — | — | — | — | |||||||||||||||||||||||||||||
| — | — | — | — | — | — | |||||||||||||||||||||||||||||
| — | — | — | — | — | — | |||||||||||||||||||||||||||||
| (16,342 | ) | — | (7,788,493 | ) | (14,690,998 | ) | (1,678,946 | ) | (1,873,408 | ) | ||||||||||||||||||||||||
| — | 10,001,093 | 181,497,654 | 696,980,979 | 96,868,698 | 176,294,003 | |||||||||||||||||||||||||||||
| 16,342 | — | 7,046,785 | 13,265,520 | 1,678,569 | 1,871,870 | |||||||||||||||||||||||||||||
| (1,063 | ) | (25 | ) | (262,362,715 | ) | (1,026,096,373 | ) | (23,210,925 | ) | (88,973,271 | ) | |||||||||||||||||||||||
| 15,279 | 10,001,068 | (73,818,276 | ) | (315,849,874 | ) | 75,336,342 | 89,192,602 | |||||||||||||||||||||||||||
| 20,027 | 10,000,949 | (76,491,112 | ) | (326,537,133 | ) | 74,698,030 | 89,333,720 | |||||||||||||||||||||||||||
| 10,000,949 | — | 1,426,147,256 | 1,752,684,389 | 169,236,353 | 79,902,633 | |||||||||||||||||||||||||||||
| $ | 10,020,976 | $ | 10,000,949 | $ | 1,349,656,144 | $ | 1,426,147,256 | $ | 243,934,383 | $ | 169,236,353 | |||||||||||||||||||||||
| $ | 22 | $ | 795 | $ | 6,026,508 | $ | 6,739,727 | $ | (136,962 | ) | $ | 33,156 | ||||||||||||||||||||||
| The accompanying notes are an integral part of these financial statements. | 95 |
GOLDMAN SACHS ENHANCED INCOME FUND
Financial Highlights
Selected Data for a Share Outstanding Throughout Each Period
| Income (loss) from investment operations | ||||||||||||||||||||||
| Year - Share Class | Net asset value, beginning of period | Net investment income(a) | Net realized and unrealized gain (loss) | Total from investment operations | Distributions to shareholders from net investment income | |||||||||||||||||
| FOR THE SIX MONTHS ENDED SEPTEMBER 30, (UNAUDITED) | ||||||||||||||||||||||
2014 - A | $ | 9.47 | $ | — | (d) | $ | (0.02 | ) | $ | (0.02 | ) | $ | — | (d) | ||||||||
2014 - B | 9.45 | — | (d) | (0.01 | ) | (0.01 | ) | — | (d) | |||||||||||||
2014 - Institutional | 9.46 | 0.02 | (0.01 | ) | 0.01 | (0.02 | ) | |||||||||||||||
2014 - Administration | 9.49 | 0.01 | (0.01 | ) | — | (0.01 | ) | |||||||||||||||
2014 - IR | 9.45 | 0.01 | (0.01 | ) | — | (0.01 | ) | |||||||||||||||
| FOR THE FISCAL YEARS ENDED MARCH 31, | ||||||||||||||||||||||
2014 - A | 9.49 | 0.03 | (0.02 | ) | 0.01 | (0.03 | ) | |||||||||||||||
2014 - B | 9.48 | — | (d) | (0.03 | ) | (0.03 | ) | — | (d) | |||||||||||||
2014 - Institutional | 9.48 | 0.06 | (0.02 | ) | 0.04 | (0.06 | ) | |||||||||||||||
2014 - Administration | 9.51 | 0.04 | (0.02 | ) | 0.02 | (0.04 | ) | |||||||||||||||
2014 - IR | 9.48 | 0.06 | (0.04 | ) | 0.02 | (0.05 | ) | |||||||||||||||
2013 - A | 9.49 | 0.07 | — | (d) | 0.07 | (0.07 | ) | |||||||||||||||
2013 - B | 9.47 | 0.01 | 0.01 | 0.02 | (0.01 | ) | ||||||||||||||||
2013 - Institutional | 9.47 | 0.10 | 0.01 | 0.11 | (0.10 | ) | ||||||||||||||||
2013 - Administration | 9.51 | 0.08 | (0.01 | ) | 0.07 | (0.07 | ) | |||||||||||||||
2013 - IR | 9.47 | 0.09 | 0.01 | 0.10 | (0.09 | ) | ||||||||||||||||
2012 - A | 9.60 | 0.09 | (0.11 | ) | (0.02 | ) | (0.09 | ) | ||||||||||||||
2012 - B | 9.58 | 0.02 | (0.11 | ) | (0.09 | ) | (0.02 | ) | ||||||||||||||
2012 - Institutional | 9.59 | 0.12 | (0.11 | ) | 0.01 | (0.13 | ) | |||||||||||||||
2012 - Administration | 9.62 | 0.10 | (0.11 | ) | (0.01 | ) | (0.10 | ) | ||||||||||||||
2012 - IR | 9.58 | 0.11 | (0.10 | ) | 0.01 | (0.12 | ) | |||||||||||||||
2011 - A | 9.67 | 0.10 | (0.07 | ) | 0.03 | (0.10 | ) | |||||||||||||||
2011 - B | 9.66 | 0.03 | (0.08 | ) | (0.05 | ) | (0.03 | ) | ||||||||||||||
2011 - Institutional | 9.66 | 0.13 | (0.07 | ) | 0.06 | (0.13 | ) | |||||||||||||||
2011 - Administration | 9.69 | 0.11 | (0.07 | ) | 0.04 | (0.11 | ) | |||||||||||||||
2011 - IR (Commenced July 30, 2010) | 9.62 | 0.09 | (0.04 | ) | 0.05 | (0.09 | ) | |||||||||||||||
2010 - A | 9.51 | 0.12 | 0.19 | 0.31 | (0.15 | ) | ||||||||||||||||
2010 - B | 9.50 | 0.07 | 0.17 | 0.24 | (0.08 | ) | ||||||||||||||||
2010 - Institutional | 9.50 | 0.16 | 0.18 | 0.34 | (0.18 | ) | ||||||||||||||||
2010 - Administration | 9.53 | 0.14 | 0.18 | 0.32 | (0.16 | ) | ||||||||||||||||
| (a) | Calculated based on the average shares outstanding methodology. |
| (b) | Assumes investment at the net asset value at the beginning of the period, reinvestment of all dividends and distributions, a complete redemption of the investment at the net asset value at the end of the period and no sales or redemption charges. Total returns would be reduced if a sales or redemption charge was taken into account. Returns do not reflect the deduction of taxes that a shareholder would pay on Fund distributions or the redemption of Fund shares. Total returns for periods less than one full year are not annualized. |
| (c) | The Fund’s portfolio turnover rate is calculated in accordance with regulatory requirements, without regard to transactions involving short term investments and certain derivatives. If such transactions were included, the Fund’s portfolio turnover rate may be higher. |
| (d) | Amount is less than $0.005 per share. |
| (e) | Annualized. |
| 96 | The accompanying notes are an integral part of these financial statements. |
GOLDMAN SACHS ENHANCED INCOME FUND
| Net asset value, end of period | Total return(b) | Net assets, end of period (in 000s) | Ratio of net expenses to average net assets | Ratio of total expenses to average net assets | Ratio of net investment income to average net assets | Portfolio turnover rate(c) | ||||||||||||||||||||||||||||||||||
| $ | 9.45 | (0.18 | )% | $ | 39,618 | 0.69 | %(e) | 0.71 | %(e) | 0.05 | %(e) | 18 | % | |||||||||||||||||||||||||||
| 9.44 | (0.10 | ) | 88 | 0.74 | (e) | 1.46 | (e) | 0.01 | (e) | 18 | ||||||||||||||||||||||||||||||
| 9.45 | 0.09 | 559,325 | 0.35 | (e) | 0.38 | (e) | 0.39 | (e) | 18 | |||||||||||||||||||||||||||||||
| 9.48 | (0.04 | ) | 172 | 0.61 | (e) | 0.63 | (e) | 0.14 | (e) | 18 | ||||||||||||||||||||||||||||||
| 9.44 | 0.04 | 547 | 0.45 | (e) | 0.47 | (e) | 0.30 | (e) | 18 | |||||||||||||||||||||||||||||||
| 9.47 | 0.10 | 46,289 | 0.69 | 0.73 | 0.33 | 40 | ||||||||||||||||||||||||||||||||||
| 9.45 | (0.29 | ) | 102 | 1.03 | 1.48 | 0.03 | 40 | |||||||||||||||||||||||||||||||||
| 9.46 | 0.44 | 512,656 | 0.36 | 0.38 | 0.60 | 40 | ||||||||||||||||||||||||||||||||||
| 9.49 | 0.19 | 198 | 0.61 | 0.64 | 0.42 | 40 | ||||||||||||||||||||||||||||||||||
| 9.45 | 0.25 | 583 | 0.45 | 0.48 | 0.64 | 40 | ||||||||||||||||||||||||||||||||||
| 9.49 | 0.69 | 50,859 | 0.68 | 0.70 | 0.70 | 98 | ||||||||||||||||||||||||||||||||||
| 9.48 | 0.17 | 200 | 1.32 | 1.45 | 0.08 | 98 | ||||||||||||||||||||||||||||||||||
| 9.48 | 1.14 | 295,940 | 0.34 | 0.36 | 1.04 | 98 | ||||||||||||||||||||||||||||||||||
| 9.51 | 0.79 | 220 | 0.59 | 0.61 | 0.83 | 98 | ||||||||||||||||||||||||||||||||||
| 9.48 | 1.05 | 1,345 | 0.43 | 0.45 | 0.96 | 98 | ||||||||||||||||||||||||||||||||||
| 9.49 | (0.19 | ) | 110,136 | 0.64 | 0.69 | 0.94 | 86 | |||||||||||||||||||||||||||||||||
| 9.47 | (0.93 | ) | 476 | 1.39 | 1.44 | 0.19 | 86 | |||||||||||||||||||||||||||||||||
| 9.47 | 0.05 | 395,751 | 0.30 | 0.35 | 1.28 | 86 | ||||||||||||||||||||||||||||||||||
| 9.51 | (0.09 | ) | �� | 1,682 | 0.55 | 0.60 | 1.03 | 86 | ||||||||||||||||||||||||||||||||
| 9.47 | 0.06 | 2,040 | 0.39 | 0.44 | 1.17 | 86 | ||||||||||||||||||||||||||||||||||
| 9.60 | 0.29 | 225,355 | 0.63 | 0.68 | 1.01 | 71 | ||||||||||||||||||||||||||||||||||
| 9.58 | (0.56 | ) | 929 | 1.38 | 1.43 | 0.26 | 71 | |||||||||||||||||||||||||||||||||
| 9.59 | 0.63 | 578,458 | 0.29 | 0.34 | 1.35 | 71 | ||||||||||||||||||||||||||||||||||
| 9.62 | 0.38 | 2,779 | 0.54 | 0.59 | 1.11 | 71 | ||||||||||||||||||||||||||||||||||
| 9.58 | 0.53 | 1 | 0.38 | (e) | 0.43 | (e) | 1.39 | (e) | 71 | |||||||||||||||||||||||||||||||
| 9.67 | 3.26 | 371,906 | 0.63 | 0.68 | 1.25 | 66 | ||||||||||||||||||||||||||||||||||
| 9.66 | 2.49 | 1,393 | 1.38 | 1.43 | 0.75 | 66 | ||||||||||||||||||||||||||||||||||
| 9.66 | 3.62 | 847,623 | 0.29 | 0.34 | 1.64 | 66 | ||||||||||||||||||||||||||||||||||
| 9.69 | 3.35 | 2,814 | 0.54 | 0.59 | 1.45 | 66 | ||||||||||||||||||||||||||||||||||
| The accompanying notes are an integral part of these financial statements. | 97 |
GOLDMAN SACHS GOVERNMENT INCOME FUND
Financial Highlights
Selected Data for a Share Outstanding Throughout Each Period
| Income (loss) from investment operations | Distributions to shareholders | |||||||||||||||||||||||||||||
| Year - Share Class | Net asset value, beginning of period | Net investment income (loss)(a) | Net realized and unrealized gain (loss) | Total from investment operations | From net investment income | From net realized gains | Total distributions | |||||||||||||||||||||||
| FOR THE SIX MONTHS ENDED SEPTEMBER 30, (UNAUDITED) | ||||||||||||||||||||||||||||||
2014 - A | $ | 14.67 | $ | 0.09 | $ | 0.14 | $ | 0.23 | $ | (0.11 | ) | $ | — | $ | (0.11 | ) | ||||||||||||||
2014 - B | 14.67 | 0.04 | 0.13 | 0.17 | (0.05 | ) | — | (0.05 | ) | |||||||||||||||||||||
2014 - C | 14.67 | 0.03 | 0.14 | 0.17 | (0.05 | ) | — | (0.05 | ) | |||||||||||||||||||||
2014 - Institutional | 14.64 | 0.12 | 0.14 | 0.26 | (0.13 | ) | — | (0.13 | ) | |||||||||||||||||||||
2014 - Service | 14.63 | 0.08 | 0.14 | 0.22 | (0.10 | ) | — | (0.10 | ) | |||||||||||||||||||||
2014 - IR | 14.66 | 0.11 | 0.14 | 0.25 | (0.13 | ) | — | (0.13 | ) | |||||||||||||||||||||
2014 - R | 14.65 | 0.07 | 0.14 | 0.21 | (0.09 | ) | — | (0.09 | ) | |||||||||||||||||||||
| FOR THE FISCAL YEARS ENDED MARCH 31, | ||||||||||||||||||||||||||||||
2014 - A | 15.00 | 0.12 | (0.25 | ) | (0.13 | ) | (0.16 | ) | (0.04 | ) | (0.20 | ) | ||||||||||||||||||
2014 - B | 15.00 | 0.02 | (0.25 | ) | (0.23 | ) | (0.06 | ) | (0.04 | ) | (0.10 | ) | ||||||||||||||||||
2014 - C | 15.00 | 0.02 | (0.25 | ) | (0.23 | ) | (0.06 | ) | (0.04 | ) | (0.10 | ) | ||||||||||||||||||
2014 - Institutional | 14.97 | 0.17 | (0.25 | ) | (0.08 | ) | (0.21 | ) | (0.04 | ) | (0.25 | ) | ||||||||||||||||||
2014 - Service | 14.96 | 0.10 | (0.25 | ) | (0.15 | ) | (0.14 | ) | (0.04 | ) | (0.18 | ) | ||||||||||||||||||
2014 - IR | 14.99 | 0.18 | (0.27 | ) | (0.09 | ) | (0.20 | ) | (0.04 | ) | (0.24 | ) | ||||||||||||||||||
2014 - R | 14.98 | 0.09 | (0.25 | ) | (0.16 | ) | (0.13 | ) | (0.04 | ) | (0.17 | ) | ||||||||||||||||||
2013 - A | 15.37 | 0.11 | 0.24 | 0.35 | (0.17 | ) | (0.55 | ) | (0.72 | ) | ||||||||||||||||||||
2013 - B | 15.37 | (0.01 | ) | 0.24 | 0.23 | (0.05 | ) | (0.55 | ) | (0.60 | ) | |||||||||||||||||||
2013 - C | 15.37 | (0.01 | ) | 0.24 | 0.23 | (0.05 | ) | (0.55 | ) | (0.60 | ) | |||||||||||||||||||
2013 - Institutional | 15.34 | 0.15 | 0.25 | 0.40 | (0.22 | ) | (0.55 | ) | (0.77 | ) | ||||||||||||||||||||
2013 - Service | 15.33 | 0.08 | 0.24 | 0.32 | (0.14 | ) | (0.55 | ) | (0.69 | ) | ||||||||||||||||||||
2013 - IR | 15.36 | 0.14 | 0.25 | 0.39 | (0.21 | ) | (0.55 | ) | (0.76 | ) | ||||||||||||||||||||
2013 - R | 15.35 | 0.06 | 0.25 | 0.31 | (0.13 | ) | (0.55 | ) | (0.68 | ) | ||||||||||||||||||||
2012 - A | 14.95 | 0.18 | 0.76 | 0.94 | (0.18 | ) | (0.34 | ) | (0.52 | ) | ||||||||||||||||||||
2012 - B | 14.95 | 0.06 | 0.77 | 0.83 | (0.07 | ) | (0.34 | ) | (0.41 | ) | ||||||||||||||||||||
2012 - C | 14.95 | 0.06 | 0.77 | 0.83 | (0.07 | ) | (0.34 | ) | (0.41 | ) | ||||||||||||||||||||
2012 - Institutional | 14.92 | 0.23 | 0.77 | 1.00 | (0.24 | ) | (0.34 | ) | (0.58 | ) | ||||||||||||||||||||
2012 - Service | 14.91 | 0.15 | 0.77 | 0.92 | (0.16 | ) | (0.34 | ) | (0.50 | ) | ||||||||||||||||||||
2012 - IR | 14.94 | 0.21 | 0.77 | 0.98 | (0.22 | ) | (0.34 | ) | (0.56 | ) | ||||||||||||||||||||
2012 - R | 14.93 | 0.13 | 0.78 | 0.91 | (0.15 | ) | (0.34 | ) | (0.49 | ) | ||||||||||||||||||||
2011 - A | 15.18 | 0.24 | 0.30 | 0.54 | (0.23 | ) | (0.54 | ) | (0.77 | ) | ||||||||||||||||||||
2011 - B | 15.18 | 0.12 | 0.31 | 0.43 | (0.12 | ) | (0.54 | ) | (0.66 | ) | ||||||||||||||||||||
2011 - C | 15.18 | 0.12 | 0.31 | 0.43 | (0.12 | ) | (0.54 | ) | (0.66 | ) | ||||||||||||||||||||
2011 - Institutional | 15.16 | 0.29 | 0.30 | 0.59 | (0.29 | ) | (0.54 | ) | (0.83 | ) | ||||||||||||||||||||
2011 - Service | 15.15 | 0.21 | 0.30 | 0.51 | (0.21 | ) | (0.54 | ) | (0.75 | ) | ||||||||||||||||||||
2011 - IR | 15.18 | 0.27 | 0.30 | 0.57 | (0.27 | ) | (0.54 | ) | (0.81 | ) | ||||||||||||||||||||
2011 - R | 15.17 | 0.19 | 0.31 | 0.50 | (0.20 | ) | (0.54 | ) | (0.74 | ) | ||||||||||||||||||||
2010 - A | 15.14 | 0.42 | 0.25 | 0.67 | (0.39 | ) | (0.24 | ) | (0.63 | ) | ||||||||||||||||||||
2010 - B | 15.14 | 0.31 | 0.24 | 0.55 | (0.27 | ) | (0.24 | ) | (0.51 | ) | ||||||||||||||||||||
2010 - C | 15.14 | 0.30 | 0.25 | 0.55 | (0.27 | ) | (0.24 | ) | (0.51 | ) | ||||||||||||||||||||
2010 - Institutional | 15.12 | 0.47 | 0.25 | 0.72 | (0.44 | ) | (0.24 | ) | (0.68 | ) | ||||||||||||||||||||
2010 - Service | 15.11 | 0.39 | 0.25 | 0.64 | (0.36 | ) | (0.24 | ) | (0.60 | ) | ||||||||||||||||||||
2010 - IR | 15.14 | 0.41 | 0.30 | 0.71 | (0.43 | ) | (0.24 | ) | (0.67 | ) | ||||||||||||||||||||
2010 - R | 15.14 | 0.33 | 0.30 | 0.63 | (0.36 | ) | (0.24 | ) | (0.60 | ) | ||||||||||||||||||||
| (a) | Calculated based on the average shares outstanding methodology. |
| (b) | Assumes investment at the net asset value at the beginning of the period, reinvestment of all dividends and distributions, a complete redemption of the investment at the net asset value at the end of the period and no sales or redemption charges. Total returns would be reduced if a sales or redemption charge was taken into account. Returns do not reflect the deduction of taxes that a shareholder would pay on Fund distributions or the redemption of Fund shares. Total returns for periods less than one full year are not annualized. |
| (c) | The Fund’s portfolio turnover rate is calculated in accordance with regulatory requirements, without regard to transactions involving short term investments and certain derivatives. If such transactions were included, the Fund’s portfolio turnover rate may be higher. |
| (d) | Annualized. |
| 98 | The accompanying notes are an integral part of these financial statements. |
GOLDMAN SACHS GOVERNMENT INCOME FUND
| Net asset value, end of period | Total return(b) | Net assets, end of period (in 000s) | Ratio of net expenses to average net assets | Ratio of total expenses to average net assets | Ratio of net investment income (loss) to average net assets | Portfolio turnover rate(c) | ||||||||||||||||||||||||||||||||||
| $ | 14.79 | 1.56 | % | $ | 183,700 | 0.92 | %(d) | 1.05 | %(d) | 1.21 | %(d) | 240 | % | |||||||||||||||||||||||||||
| 14.79 | 1.18 | 3,433 | 1.67 | (d) | 1.80 | (d) | 0.47 | (d) | 240 | |||||||||||||||||||||||||||||||
| 14.79 | 1.18 | 13,813 | 1.67 | (d) | 1.80 | (d) | 0.46 | (d) | 240 | |||||||||||||||||||||||||||||||
| 14.77 | 1.81 | 189,542 | 0.58 | (d) | 0.71 | (d) | 1.55 | (d) | 240 | |||||||||||||||||||||||||||||||
| 14.75 | 1.49 | 54,500 | 1.08 | (d) | 1.21 | (d) | 1.05 | (d) | 240 | |||||||||||||||||||||||||||||||
| 14.78 | 1.69 | 3,935 | 0.67 | (d) | 0.80 | (d) | 1.47 | (d) | 240 | |||||||||||||||||||||||||||||||
| 14.77 | 1.44 | 21,938 | 1.17 | (d) | 1.30 | (d) | 0.96 | (d) | 240 | |||||||||||||||||||||||||||||||
| 14.67 | (0.83 | ) | 194,179 | 0.92 | 1.02 | 0.83 | 655 | |||||||||||||||||||||||||||||||||
| 14.67 | (1.53 | ) | 4,442 | 1.62 | 1.78 | 0.11 | 655 | |||||||||||||||||||||||||||||||||
| 14.67 | (1.53 | ) | 15,202 | 1.62 | 1.78 | 0.12 | 655 | |||||||||||||||||||||||||||||||||
| 14.64 | (0.50 | ) | 197,289 | 0.58 | 0.69 | 1.19 | 655 | |||||||||||||||||||||||||||||||||
| 14.63 | (1.00 | ) | 53,172 | 1.08 | 1.18 | 0.66 | 655 | |||||||||||||||||||||||||||||||||
| 14.66 | (0.58 | ) | 4,157 | 0.67 | 0.78 | 1.25 | 655 | |||||||||||||||||||||||||||||||||
| 14.65 | (1.08 | ) | 20,743 | 1.17 | 1.28 | 0.62 | 655 | |||||||||||||||||||||||||||||||||
| 15.00 | 2.26 | 285,955 | 0.91 | 1.00 | 0.69 | 943 | ||||||||||||||||||||||||||||||||||
| 15.00 | 1.50 | 8,180 | 1.66 | 1.75 | (0.05 | ) | 943 | |||||||||||||||||||||||||||||||||
| 15.00 | 1.50 | 25,655 | 1.66 | 1.75 | (0.06 | ) | 943 | |||||||||||||||||||||||||||||||||
| 14.97 | 2.61 | 346,782 | 0.57 | 0.66 | 0.97 | 943 | ||||||||||||||||||||||||||||||||||
| 14.96 | 2.07 | 79,620 | 1.07 | 1.16 | 0.51 | 943 | ||||||||||||||||||||||||||||||||||
| 14.99 | 2.51 | 1,509 | 0.67 | 0.75 | 0.93 | 943 | ||||||||||||||||||||||||||||||||||
| 14.98 | 2.00 | 21,907 | 1.16 | 1.25 | 0.41 | 943 | ||||||||||||||||||||||||||||||||||
| 15.37 | 6.32 | 396,439 | 0.92 | 1.00 | 1.14 | 763 | ||||||||||||||||||||||||||||||||||
| 15.37 | 5.53 | 12,109 | 1.67 | 1.75 | 0.39 | 763 | ||||||||||||||||||||||||||||||||||
| 15.37 | 5.53 | 32,148 | 1.67 | 1.75 | 0.38 | 763 | ||||||||||||||||||||||||||||||||||
| 15.34 | 6.69 | 241,382 | 0.58 | 0.66 | 1.48 | 763 | ||||||||||||||||||||||||||||||||||
| 15.33 | 6.17 | 89,677 | 1.08 | 1.16 | 0.97 | 763 | ||||||||||||||||||||||||||||||||||
| 15.36 | 6.59 | 1,669 | 0.67 | 0.75 | 1.35 | 763 | ||||||||||||||||||||||||||||||||||
| 15.35 | 6.07 | 20,368 | 1.17 | 1.25 | 0.87 | 763 | ||||||||||||||||||||||||||||||||||
| 14.95 | 3.63 | 442,915 | 0.92 | 0.99 | 1.53 | 545 | ||||||||||||||||||||||||||||||||||
| 14.95 | 2.86 | 17,358 | 1.67 | 1.74 | 0.79 | 545 | ||||||||||||||||||||||||||||||||||
| 14.95 | 2.86 | 33,279 | 1.67 | 1.74 | 0.78 | 545 | ||||||||||||||||||||||||||||||||||
| 14.92 | 3.92 | 266,217 | 0.58 | 0.65 | 1.86 | 545 | ||||||||||||||||||||||||||||||||||
| 14.91 | 3.40 | 98,072 | 1.08 | 1.15 | 1.36 | 545 | ||||||||||||||||||||||||||||||||||
| 14.94 | 3.89 | 663 | 0.67 | 0.74 | 1.74 | 545 | ||||||||||||||||||||||||||||||||||
| 14.93 | 3.31 | 13,913 | 1.17 | 1.24 | 1.24 | 545 | ||||||||||||||||||||||||||||||||||
| 15.18 | 4.48 | 513,457 | 0.92 | 1.00 | 2.74 | 366 | ||||||||||||||||||||||||||||||||||
| 15.18 | 3.70 | 29,438 | 1.67 | 1.75 | 2.02 | 366 | ||||||||||||||||||||||||||||||||||
| 15.18 | 3.68 | 39,255 | 1.67 | 1.75 | 1.99 | 366 | ||||||||||||||||||||||||||||||||||
| 15.16 | 4.84 | 253,997 | 0.58 | 0.66 | 3.06 | 366 | ||||||||||||||||||||||||||||||||||
| 15.15 | 4.32 | 100,242 | 1.08 | 1.16 | 2.56 | 366 | ||||||||||||||||||||||||||||||||||
| 15.18 | 4.67 | 239 | 0.67 | 0.75 | 2.68 | 366 | ||||||||||||||||||||||||||||||||||
| 15.17 | 4.22 | 5,106 | 1.17 | 1.25 | 2.21 | 366 | ||||||||||||||||||||||||||||||||||
| The accompanying notes are an integral part of these financial statements. | 99 |
GOLDMAN SACHS HIGH QUALITY FLOATING RATE FUND
Financial Highlights
Selected Data for a Share Outstanding Throughout Each Period
| Income (loss) from investment operations | ||||||||||||||||||||||
| Year - Share Class | Net asset value, beginning of period | Net investment income(a) | Net realized and unrealized gain (loss) | Total from investment operations | Distributions to shareholders investment income | |||||||||||||||||
| FOR THE SIX MONTHS ENDED SEPTEMBER 30, (UNAUDITED) | ||||||||||||||||||||||
2014 - A | $ | 8.76 | $ | 0.01 | $ | — | (d) | $ | 0.01 | $ | (0.01 | ) | ||||||||||
2014 - Institutional | 8.77 | 0.02 | (0.01 | ) | 0.01 | (0.02 | ) | |||||||||||||||
2014 - Service | 8.81 | — | (d) | (0.01 | ) | (0.01 | ) | — | (d) | |||||||||||||
2014 - IR | 8.75 | 0.02 | (0.01 | ) | 0.01 | (0.02 | ) | |||||||||||||||
| FOR THE FISCAL YEARS ENDED MARCH 31, | ||||||||||||||||||||||
2014 - A | 8.78 | 0.02 | (0.02 | ) | — | (0.02 | ) | |||||||||||||||
2014 - Institutional | 8.78 | 0.04 | — | (d) | 0.04 | (0.05 | ) | |||||||||||||||
2014 - Service | 8.83 | — | (d) | (0.01 | ) | (0.01 | ) | (0.01 | ) | |||||||||||||
2014 - IR | 8.77 | 0.04 | (0.02 | ) | 0.02 | (0.04 | ) | |||||||||||||||
2013 - A | 8.77 | 0.04 | — | (d) | 0.04 | (0.03 | ) | |||||||||||||||
2013 - Institutional | 8.77 | 0.07 | — | (d) | 0.07 | (0.06 | ) | |||||||||||||||
2013 - Service | 8.81 | 0.03 | 0.01 | 0.04 | (0.02 | ) | ||||||||||||||||
2013 - IR | 8.76 | 0.05 | 0.01 | 0.06 | (0.05 | ) | ||||||||||||||||
2012 - A | 8.81 | 0.05 | (0.07 | ) | (0.02 | ) | (0.02 | ) | ||||||||||||||
2012 - Institutional | 8.82 | 0.08 | (0.08 | ) | — | (0.05 | ) | |||||||||||||||
2012 - Service | 8.86 | 0.04 | (0.08 | ) | (0.04 | ) | (0.01 | ) | ||||||||||||||
2012 - IR | 8.81 | 0.07 | (0.08 | ) | (0.01 | ) | (0.04 | ) | ||||||||||||||
2011 - A | 8.86 | 0.06 | (0.06 | ) | — | (0.05 | )(f) | |||||||||||||||
2011 - Institutional | 8.86 | 0.09 | (0.05 | ) | 0.04 | (0.08 | )(f) | |||||||||||||||
2011 - Service | 8.90 | 0.04 | (0.04 | ) | — | (0.04 | )(f) | |||||||||||||||
2011 - IR | 8.85 | 0.08 | (0.05 | ) | 0.03 | (0.07 | )(f) | |||||||||||||||
2010 - A | 8.77 | 0.10 | 0.16 | 0.26 | (0.17 | )(f) | ||||||||||||||||
2010 - Institutional | 8.77 | 0.13 | 0.16 | 0.29 | (0.20 | )(f) | ||||||||||||||||
2010 - Service | 8.81 | 0.11 | 0.13 | 0.24 | (0.15 | )(f) | ||||||||||||||||
2010 - IR | 8.76 | 0.10 | 0.18 | 0.28 | (0.19 | )(f) | ||||||||||||||||
| (a) | Calculated based on the average shares outstanding methodology. |
| (b) | Assumes investment at the net asset value at the beginning of the period, reinvestment of all dividends and distributions, a complete redemption of the investment at the net asset value at the end of the period and no sales or redemption charges. Total returns would be reduced if a sales or redemption charge was taken into account. Returns do not reflect the deduction of taxes that a shareholder would pay on Fund distributions or the redemption of Fund shares. Total returns for periods less than one full year are not annualized. |
| (c) | The Fund’s portfolio turnover rate is calculated in accordance with regulatory requirements, without regard to transactions involving short term investments and certain derivatives. If such transactions were included, the Fund’s portfolio turnover rate may be higher. |
| (d) | Amount is less than $0.005 per share. |
| (e) | Annualized. |
| (f) | Includes a return of capital amounting to less than $0.005 per share. |
| 100 | The accompanying notes are an integral part of these financial statements. |
GOLDMAN SACHS HIGH QUALITY FLOATING RATE FUND
Net asset value, end of period | Total return(b) | Net assets, end of period (in 000s) | Ratio of net expenses to average net assets | Ratio of total expenses to average net assets | Ratio of net investment income to average net assets | Portfolio turnover rate(c) | ||||||||||||||||||||||||||||||||||
| $ | 8.76 | 0.09 | % | $ | 41,339 | 0.70 | %(e) | 0.92 | %(e) | 0.21 | %(e) | 24 | % | |||||||||||||||||||||||||||
| 8.76 | 0.15 | 462,660 | 0.37 | (e) | 0.58 | (e) | 0.54 | (e) | 24 | |||||||||||||||||||||||||||||||
| 8.80 | (0.08 | ) | 189 | 0.83 | (e) | 1.08 | (e) | 0.08 | (e) | 24 | ||||||||||||||||||||||||||||||
| 8.74 | 0.10 | 1,241 | 0.46 | (e) | 0.67 | (e) | 0.46 | (e) | 24 | |||||||||||||||||||||||||||||||
| 8.76 | (0.01 | ) | 43,550 | 0.72 | 0.95 | 0.20 | 130 | |||||||||||||||||||||||||||||||||
| 8.77 | 0.45 | 378,958 | 0.38 | 0.59 | 0.50 | 130 | ||||||||||||||||||||||||||||||||||
| 8.81 | (0.01 | ) | 255 | 0.85 | 1.10 | 0.05 | 130 | |||||||||||||||||||||||||||||||||
| 8.75 | 0.24 | 1,570 | 0.47 | 0.69 | 0.43 | 130 | ||||||||||||||||||||||||||||||||||
| 8.78 | 0.44 | 47,438 | 0.74 | 0.96 | 0.44 | 286 | ||||||||||||||||||||||||||||||||||
| 8.78 | 0.78 | 158,132 | 0.40 | 0.62 | 0.79 | 286 | ||||||||||||||||||||||||||||||||||
| 8.83 | 0.41 | 160 | 0.89 | 1.12 | 0.38 | 286 | ||||||||||||||||||||||||||||||||||
| 8.77 | 0.69 | 1,018 | 0.49 | 0.71 | 0.63 | 286 | ||||||||||||||||||||||||||||||||||
| 8.77 | (0.21 | ) | 85,905 | 0.75 | 0.90 | 0.53 | 178 | |||||||||||||||||||||||||||||||||
| 8.77 | 0.01 | 212,611 | 0.41 | 0.56 | 0.87 | 178 | ||||||||||||||||||||||||||||||||||
| 8.81 | (0.44 | ) | 448 | 0.86 | 1.06 | 0.41 | 178 | |||||||||||||||||||||||||||||||||
| 8.76 | (0.08 | ) | 930 | 0.50 | 0.65 | 0.79 | 178 | |||||||||||||||||||||||||||||||||
| 8.81 | 0.00 | 118,804 | 0.82 | 0.87 | 0.65 | 175 | ||||||||||||||||||||||||||||||||||
| 8.82 | 0.45 | 293,924 | 0.48 | 0.53 | 1.00 | 175 | ||||||||||||||||||||||||||||||||||
| 8.86 | (0.05 | ) | 924 | 0.98 | 1.03 | 0.49 | 175 | |||||||||||||||||||||||||||||||||
| 8.81 | 0.36 | 1,151 | 0.57 | 0.62 | 0.93 | 175 | ||||||||||||||||||||||||||||||||||
| 8.86 | 2.96 | 303,400 | 0.83 | 0.87 | 1.14 | 111 | ||||||||||||||||||||||||||||||||||
| 8.86 | 3.31 | 487,133 | 0.49 | 0.53 | 1.45 | 111 | ||||||||||||||||||||||||||||||||||
| 8.90 | 2.78 | 2,702 | 0.99 | 1.03 | 1.29 | 111 | ||||||||||||||||||||||||||||||||||
| 8.85 | 3.22 | 451 | 0.58 | 0.62 | 1.19 | 111 | ||||||||||||||||||||||||||||||||||
| The accompanying notes are an integral part of these financial statements. | 101 |
GOLDMAN SACHS INFLATION PROTECTED SECURITIES FUND
Financial Highlights
Selected Data for a Share Outstanding Throughout Each Period
| Income (loss) from investment operations | Distributions to shareholders | |||||||||||||||||||||||||||||||||
| Year - Share Class | Net asset value, beginning of period | Net investment | Net realized and unrealized gain (loss) | Total from investment operations | From net investment income | From net realized | From capital | Total distributions | ||||||||||||||||||||||||||
| FOR THE SIX MONTHS ENDED SEPTEMBER 30, (UNAUDITED) | ||||||||||||||||||||||||||||||||||
2014 - A | $ | 10.29 | $ | 0.15 | $ | — | (d) | $ | 0.15 | $ | (0.12 | ) | $ | — | $ | — | $ | (0.12 | ) | |||||||||||||||
2014 - C | 10.27 | 0.11 | — | (d) | 0.11 | (0.09 | ) | — | — | (0.09 | ) | |||||||||||||||||||||||
2014 - Institutional | 10.36 | 0.16 | — | (d) | 0.16 | (0.13 | ) | — | — | (0.13 | ) | |||||||||||||||||||||||
2014 - IR | 10.32 | 0.16 | — | (d) | 0.16 | (0.13 | ) | — | — | (0.13 | ) | |||||||||||||||||||||||
2014 - R | 10.30 | 0.13 | — | (d) | 0.13 | (0.11 | ) | — | — | (0.11 | ) | |||||||||||||||||||||||
| FOR THE FISCAL YEARS ENDED MARCH 31, | ||||||||||||||||||||||||||||||||||
2014 - A | 11.24 | 0.09 | (0.83 | ) | (0.74 | ) | (0.02 | ) | (0.16 | ) | (0.03 | ) | (0.21 | ) | ||||||||||||||||||||
2014 - C | 11.28 | — | (d) | (0.82 | ) | (0.82 | ) | — | (0.16 | ) | (0.03 | ) | (0.19 | ) | ||||||||||||||||||||
2014 - Institutional | 11.28 | 0.13 | (0.83 | ) | (0.70 | ) | (0.03 | ) | (0.16 | ) | (0.03 | ) | (0.22 | ) | ||||||||||||||||||||
2014 - IR | 11.25 | 0.11 | (0.83 | ) | (0.72 | ) | (0.02 | ) | (0.16 | ) | (0.03 | ) | (0.21 | ) | ||||||||||||||||||||
2014 - R | 11.27 | 0.01 | (0.78 | ) | (0.77 | ) | (0.01 | ) | (0.16 | ) | (0.03 | ) | (0.20 | ) | ||||||||||||||||||||
2013 - A | 11.16 | 0.04 | 0.56 | 0.60 | (0.16 | ) | (0.36 | ) | — | (0.52 | ) | |||||||||||||||||||||||
2013 - C | 11.20 | (0.03 | ) | 0.55 | 0.52 | (0.08 | ) | (0.36 | ) | — | (0.44 | ) | ||||||||||||||||||||||
2013 - Institutional | 11.20 | 0.06 | 0.58 | 0.64 | (0.20 | ) | (0.36 | ) | — | (0.56 | ) | |||||||||||||||||||||||
2013 - IR | 11.17 | 0.03 | 0.60 | 0.63 | (0.19 | ) | (0.36 | ) | — | (0.55 | ) | |||||||||||||||||||||||
2013 - R | 11.19 | — | (d) | 0.57 | 0.57 | (0.13 | ) | (0.36 | ) | — | (0.49 | ) | ||||||||||||||||||||||
2012 - A | 10.95 | 0.19 | 1.11 | 1.30 | (0.30 | ) | (0.79 | ) | — | (1.09 | ) | |||||||||||||||||||||||
2012 - C | 10.99 | 0.13 | 1.09 | 1.22 | (0.22 | ) | (0.79 | ) | — | (1.01 | ) | |||||||||||||||||||||||
2012 - Institutional | 10.99 | 0.23 | 1.11 | 1.34 | (0.34 | ) | (0.79 | ) | — | (1.13 | ) | |||||||||||||||||||||||
2012 - IR | 10.97 | 0.02 | 1.30 | 1.32 | (0.33 | ) | (0.79 | ) | — | (1.12 | ) | |||||||||||||||||||||||
2012 - R | 10.98 | 0.18 | 1.09 | 1.27 | (0.27 | ) | (0.79 | ) | — | (1.06 | ) | |||||||||||||||||||||||
2011 - A | 10.89 | 0.19 | 0.61 | 0.80 | (0.17 | ) | (0.57 | ) | — | (0.74 | ) | |||||||||||||||||||||||
2011 - C | 10.93 | 0.11 | 0.61 | 0.72 | (0.09 | ) | (0.57 | ) | — | (0.66 | ) | |||||||||||||||||||||||
2011 - Institutional | 10.93 | 0.22 | 0.62 | 0.84 | (0.21 | ) | (0.57 | ) | — | (0.78 | ) | |||||||||||||||||||||||
2011 - IR | 10.91 | 0.22 | 0.61 | 0.83 | (0.20 | ) | (0.57 | ) | — | (0.77 | ) | |||||||||||||||||||||||
2011 - R | 10.91 | 0.17 | 0.61 | 0.78 | (0.14 | ) | (0.57 | ) | — | (0.71 | ) | |||||||||||||||||||||||
2010 - A | 10.51 | 0.31 | 0.29 | 0.60 | (0.22 | ) | — | — | (0.22 | ) | ||||||||||||||||||||||||
2010 - C | 10.54 | 0.21 | 0.32 | 0.53 | (0.14 | ) | — | — | (0.14 | ) | ||||||||||||||||||||||||
2010 - Institutional | 10.54 | 0.33 | 0.32 | 0.65 | (0.26 | ) | — | — | (0.26 | ) | ||||||||||||||||||||||||
2010 - IR | 10.53 | 0.23 | 0.40 | 0.63 | (0.25 | ) | — | — | (0.25 | ) | ||||||||||||||||||||||||
2010 - R | 10.53 | 0.20 | 0.37 | 0.57 | (0.19 | ) | — | — | (0.19 | ) | ||||||||||||||||||||||||
| (a) | Calculated based on the average shares outstanding methodology. |
| (b) | Assumes investment at the net asset value at the beginning of the period, reinvestment of all dividends and distributions, a complete redemption of the investment at the net asset value at the end of the period and no sales or redemption charges. Total returns would be reduced if a sales or redemption charge was taken into account. Returns do not reflect the deduction of taxes that a shareholder would pay on Fund distributions or the redemption of Fund shares. Total returns for periods less than one full year are not annualized. |
| (c) | The Fund’s portfolio turnover rate is calculated in accordance with regulatory requirements, without regard to transactions involving short term investments and certain derivatives. If such transactions were included, the Fund’s portfolio turnover rate may be higher. |
| (d) | Amount is less than $0.005 per share. |
| (e) | Annualized. |
| 102 | The accompanying notes are an integral part of these financial statements. |
GOLDMAN SACHS INFLATION PROTECTED SECURITIES FUND
Net asset value, end of period | Total return(b) | Net assets, end of period (in 000s) | Ratio of net expenses to average net assets | Ratio of total expenses to average net assets | Ratio of net investment income (loss) to average net assets | Portfolio turnover rate(c) | ||||||||||||||||||||||||||||||||||
| $ | 10.32 | 1.40 | % | $ | 38,234 | 0.66 | %(e) | 0.93 | %(e) | 2.81 | %(e) | 56 | % | |||||||||||||||||||||||||||
| 10.29 | 1.05 | 9,326 | 1.41 | (e) | 1.68 | (e) | 2.08 | (e) | 56 | |||||||||||||||||||||||||||||||
| 10.39 | 1.52 | �� | 95,935 | 0.32 | (e) | 0.59 | (e) | 3.09 | (e) | 56 | ||||||||||||||||||||||||||||||
| 10.35 | 1.49 | 2,067 | 0.41 | (e) | 0.68 | (e) | 3.04 | (e) | 56 | |||||||||||||||||||||||||||||||
| 10.32 | 1.22 | 5,842 | 0.92 | (e) | 1.18 | (e) | 2.41 | (e) | 56 | |||||||||||||||||||||||||||||||
| 10.29 | (6.60 | ) | 37,940 | 0.63 | 0.84 | 0.88 | 262 | |||||||||||||||||||||||||||||||||
| 10.27 | (7.29 | ) | 10,173 | 1.38 | 1.59 | (0.01 | ) | 262 | ||||||||||||||||||||||||||||||||
| 10.36 | (6.22 | ) | 91,483 | 0.29 | 0.50 | 1.19 | 262 | |||||||||||||||||||||||||||||||||
| 10.32 | (6.35 | ) | 2,021 | 0.38 | 0.59 | 1.03 | 262 | |||||||||||||||||||||||||||||||||
| 10.30 | (6.82 | ) | 4,707 | 0.88 | 1.10 | 0.10 | 262 | |||||||||||||||||||||||||||||||||
| 11.24 | 5.37 | 73,665 | 0.62 | 0.81 | 0.39 | 230 | ||||||||||||||||||||||||||||||||||
| 11.28 | 4.57 | 19,203 | 1.38 | 1.56 | (0.29 | ) | 230 | |||||||||||||||||||||||||||||||||
| 11.28 | 5.71 | 276,216 | 0.28 | 0.46 | 0.53 | 230 | ||||||||||||||||||||||||||||||||||
| 11.25 | 5.63 | 3,617 | 0.37 | 0.55 | 0.24 | 230 | ||||||||||||||||||||||||||||||||||
| 11.27 | 5.10 | 2,023 | 0.87 | 1.05 | 0.02 | 230 | ||||||||||||||||||||||||||||||||||
| 11.16 | 11.99 | 123,135 | 0.63 | 0.83 | 1.63 | 194 | ||||||||||||||||||||||||||||||||||
| 11.20 | 11.24 | 24,312 | 1.28 | 1.58 | 1.17 | 194 | ||||||||||||||||||||||||||||||||||
| 11.20 | 12.34 | 159,075 | 0.29 | 0.49 | 2.05 | 194 | ||||||||||||||||||||||||||||||||||
| 11.17 | 12.16 | 393 | 0.38 | 0.58 | 0.21 | 194 | ||||||||||||||||||||||||||||||||||
| 11.19 | 11.70 | 1,411 | 0.88 | 1.08 | 1.61 | 194 | ||||||||||||||||||||||||||||||||||
| 10.95 | 7.53 | 79,215 | 0.67 | 0.83 | 1.71 | 211 | ||||||||||||||||||||||||||||||||||
| 10.99 | 6.72 | 22,111 | 1.42 | 1.58 | 0.96 | 211 | ||||||||||||||||||||||||||||||||||
| 10.99 | 7.88 | 108,491 | 0.33 | 0.49 | 1.99 | 211 | ||||||||||||||||||||||||||||||||||
| 10.97 | 7.80 | 116 | 0.42 | 0.58 | 1.93 | 211 | ||||||||||||||||||||||||||||||||||
| 10.98 | 7.36 | 1,145 | 0.92 | 1.08 | 1.50 | 211 | ||||||||||||||||||||||||||||||||||
| 10.89 | 5.76 | 83,263 | 0.67 | 0.91 | 2.88 | 82 | ||||||||||||||||||||||||||||||||||
| 10.93 | 5.05 | 21,962 | 1.42 | 1.66 | 1.91 | 82 | ||||||||||||||||||||||||||||||||||
| 10.93 | 6.20 | 133,980 | 0.33 | 0.57 | 3.05 | 82 | ||||||||||||||||||||||||||||||||||
| 10.91 | 6.01 | 125 | 0.42 | 0.66 | 2.15 | 82 | ||||||||||||||||||||||||||||||||||
| 10.91 | 5.49 | 361 | 0.92 | 1.16 | 1.86 | 82 | ||||||||||||||||||||||||||||||||||
| The accompanying notes are an integral part of these financial statements. | 103 |
GOLDMAN SACHS LIMITED MATURITY OBLIGATIONS FUND
Financial Highlights
Selected Data for a Share Outstanding Throughout Each Period
| Income (loss) from investment operations | ||||||||||||||||||||||
| Year - Share Class | Net asset value, beginning of period | Net investment income(a) | Net realized and unrealized gain (loss) | Total from investment operations | Distributions investment income | |||||||||||||||||
| FOR THE SIX MONTHS ENDED SEPTEMBER 30, (UNAUDITED) | ||||||||||||||||||||||
2014 - Institutional | $ | 10.00 | $ | 0.02 | $ | (0.01 | ) | $ | 0.01 | $ | (0.01 | ) | ||||||||||
2014 - Administration | 10.00 | — | (e) | — | (e) | — | — | (e) | ||||||||||||||
| FOR THE PERIOD ENDED MARCH 31, | ||||||||||||||||||||||
2014 - Institutional (Commenced February 28, 2014) | 10.00 | — | (e) | — | (e) | — | — | |||||||||||||||
2014 - Administration (Commenced February 28, 2014) | 10.00 | — | (e) | — | (e) | — | — | |||||||||||||||
| (a) | Calculated based on the average shares outstanding methodology. |
| (b) | Assumes investment at the net asset value at the beginning of the period, reinvestment of all dividends and distributions, a complete redemption of the investment at the net asset value at the end of the period and no sales or redemption charges. Total returns would be reduced if a sales or redemption charge was taken into account. Returns do not reflect the deduction of taxes that a shareholder would pay on Fund distributions or the redemption of Fund shares. Total returns for periods less than one full year are not annualized. |
| (c) | Annualized. |
| (d) | The Fund’s portfolio turnover rate is calculated in accordance with regulatory requirements, without regard to transactions involving short term investments and certain derivatives. If such transactions were included, the Fund’s portfolio turnover rate may be higher. |
| (e) | Amount is less than $0.005 per share. |
| 104 | The accompanying notes are an integral part of these financial statements. |
GOLDMAN SACHS LIMITED MATURITY OBLIGATIONS FUND
Net asset value, end of period | Total return(b) | Net assets, end of period (in 000s) | Ratio of net expenses to average net assets(c) | Ratio of total expenses to average net assets(c) | Ratio of net investment Income (loss) to average net assets(c) | Portfolio turnover rate(d) | ||||||||||||||||||||||||||||||||||
| $ | 10.00 | 0.16 | % | $ | 9,996 | 0.19 | % | 4.11 | % | 0.31 | % | 40 | % | |||||||||||||||||||||||||||
| 10.00 | 0.04 | 25 | 0.39 | 4.36 | 0.11 | 40 | ||||||||||||||||||||||||||||||||||
| 10.00 | — | 9,976 | 0.19 | 4.30 | 0.10 | — | ||||||||||||||||||||||||||||||||||
| 10.00 | — | 25 | 0.44 | 4.55 | (0.15 | ) | — | |||||||||||||||||||||||||||||||||
| The accompanying notes are an integral part of these financial statements. | 105 |
GOLDMAN SACHS SHORT DURATION GOVERNMENT FUND
Financial Highlights
Selected Data for a Share Outstanding Throughout Each Period
| Income (loss) from investment operations | Distributions to shareholders | |||||||||||||||||||||||||||||
| Year - Share Class | Net asset value, beginning of period | Net investment income(a) | Net realized gain (loss) | Total from investment operations | From net investment income | From net realized gains | Total distributions | |||||||||||||||||||||||
| FOR THE SIX MONTHS ENDED SEPTEMBER 30, (UNAUDITED) | ||||||||||||||||||||||||||||||
2014 - A | $ | 10.17 | $ | 0.04 | $ | (0.02 | ) | $ | 0.02 | $ | (0.04 | ) | $ | — | $ | (0.04 | ) | |||||||||||||
2014 - C | 10.11 | 0.02 | (0.02 | ) | — | (0.02 | ) | — | (0.02 | ) | ||||||||||||||||||||
2014 - Institutional | 10.14 | 0.06 | (0.02 | ) | 0.04 | (0.06 | ) | — | (0.06 | ) | ||||||||||||||||||||
2014 - Service | 10.13 | 0.03 | (0.01 | ) | 0.02 | (0.04 | ) | — | (0.04 | ) | ||||||||||||||||||||
2014 - IR | 10.18 | 0.05 | (0.01 | ) | 0.04 | (0.06 | ) | — | (0.06 | ) | ||||||||||||||||||||
| FOR THE FISCAL YEARS ENDED MARCH 31, | ||||||||||||||||||||||||||||||
2014 - A | 10.24 | 0.07 | �� | (0.06 | ) | 0.01 | (0.08 | ) | — | (0.08 | ) | |||||||||||||||||||
2014 - C | 10.17 | 0.03 | (0.05 | ) | (0.02 | ) | (0.04 | ) | — | (0.04 | ) | |||||||||||||||||||
2014 - Institutional | 10.21 | 0.10 | (0.06 | ) | 0.04 | (0.11 | ) | — | (0.11 | ) | ||||||||||||||||||||
2014 - Service | 10.20 | 0.05 | (0.06 | ) | (0.01 | ) | (0.06 | ) | — | (0.06 | ) | |||||||||||||||||||
2014 - IR | 10.25 | 0.09 | (0.05 | ) | 0.04 | (0.11 | ) | — | (0.11 | ) | ||||||||||||||||||||
2013 - A | 10.30 | 0.04 | (0.01 | ) | 0.03 | (0.06 | ) | (0.03 | ) | (0.09 | ) | |||||||||||||||||||
2013 - C | 10.23 | 0.01 | (0.02 | ) | (0.01 | ) | (0.02 | ) | (0.03 | ) | (0.05 | ) | ||||||||||||||||||
2013 - Institutional | 10.27 | 0.08 | (0.01 | ) | 0.07 | (0.10 | ) | (0.03 | ) | (0.13 | ) | |||||||||||||||||||
2013 - Service | 10.25 | 0.03 | — | (e) | 0.03 | (0.05 | ) | (0.03 | ) | (0.08 | ) | |||||||||||||||||||
2013 - IR | 10.30 | 0.07 | — | (e) | 0.07 | (0.09 | ) | (0.03 | ) | (0.12 | ) | |||||||||||||||||||
2012 - A | 10.23 | 0.05 | 0.06 | 0.11 | (0.04 | ) | — | (e) | (0.04 | ) | ||||||||||||||||||||
2012 - C | 10.17 | 0.02 | 0.05 | 0.07 | (0.01 | ) | — | (e) | (0.01 | ) | ||||||||||||||||||||
2012 - Institutional | 10.20 | 0.09 | 0.06 | 0.15 | (0.08 | ) | — | (e) | (0.08 | ) | ||||||||||||||||||||
2012 - Service | 10.19 | 0.04 | 0.05 | 0.09 | (0.03 | ) | — | (e) | (0.03 | ) | ||||||||||||||||||||
2012 - IR | 10.24 | 0.08 | 0.05 | 0.13 | (0.07 | ) | — | (e) | (0.07 | ) | ||||||||||||||||||||
2011 - A | 10.37 | 0.06 | 0.06 | 0.12 | (0.06 | ) | (0.20 | ) | (0.26 | ) | ||||||||||||||||||||
2011 - C | 10.30 | 0.01 | 0.07 | 0.08 | (0.01 | ) | (0.20 | ) | (0.21 | ) | ||||||||||||||||||||
2011 - Institutional | 10.33 | 0.10 | 0.06 | 0.16 | (0.09 | ) | (0.20 | ) | (0.29 | ) | ||||||||||||||||||||
2011 - Service | 10.32 | 0.05 | 0.06 | 0.11 | (0.04 | ) | (0.20 | ) | (0.24 | ) | ||||||||||||||||||||
2011 - IR | 10.37 | 0.09 | 0.06 | 0.15 | (0.08 | ) | (0.20 | ) | (0.28 | ) | ||||||||||||||||||||
2010 - A | 10.36 | 0.16 | 0.19 | 0.35 | (0.17 | ) | (0.17 | ) | (0.34 | ) | ||||||||||||||||||||
2010 - C | 10.30 | 0.08 | 0.18 | 0.26 | (0.09 | ) | (0.17 | ) | (0.26 | ) | ||||||||||||||||||||
2010 - Institutional | 10.33 | 0.19 | 0.18 | 0.37 | (0.20 | ) | (0.17 | ) | (0.37 | ) | ||||||||||||||||||||
2010 - Service | 10.31 | 0.14 | 0.19 | 0.33 | (0.15 | ) | (0.17 | ) | (0.32 | ) | ||||||||||||||||||||
2010 - IR | 10.36 | 0.16 | 0.21 | 0.37 | (0.19 | ) | (0.17 | ) | (0.36 | ) | ||||||||||||||||||||
| (a) | Calculated based on the average shares outstanding methodology. |
| (b) | Assumes investment at the net asset value at the beginning of the period, reinvestment of all dividends and distributions, a complete redemption of the investment at the net asset value at the end of the period and no sales or redemption charges. Total returns would be reduced if a sales or redemption charge was taken into account. Returns do not reflect the deduction of taxes that a shareholder would pay on Fund distributions or the redemption of Fund shares. |
| (c) | The Fund’s portfolio turnover rate is calculated in accordance with regulatory requirements, without regard to transactions involving short term investments and certain derivatives. If such transactions were included, the Fund’s portfolio turnover rate may be higher. |
| (d) | Annualized. |
| (e) | Amount is less than $0.005 per share. |
| 106 | The accompanying notes are an integral part of these financial statements. |
GOLDMAN SACHS SHORT DURATION GOVERNMENT FUND
Net asset value, end of period | Total return(b) | Net assets, end of period (in 000s) | Ratio of net expenses to average net assets | Ratio of total expenses to average | Ratio of net investment income (loss) to average net assets | Portfolio turnover rate(c) | ||||||||||||||||||||||||||||||||||
| $ | 10.15 | 0.24 | % | $ | 240,023 | 0.82 | %(d) | 0.92 | %(d) | 0.78 | %(d) | 76 | % | |||||||||||||||||||||||||||
| 10.09 | 0.04 | 41,898 | 1.22 | (d) | 1.67 | (d) | 0.38 | (d) | 76 | |||||||||||||||||||||||||||||||
| 10.12 | 0.41 | 1,012,673 | 0.48 | (d) | 0.58 | (d) | 1.12 | (d) | 76 | |||||||||||||||||||||||||||||||
| 10.11 | 0.16 | 36,958 | 0.98 | (d) | 1.08 | (d) | 0.62 | (d) | 76 | |||||||||||||||||||||||||||||||
| 10.16 | 0.37 | 18,104 | 0.57 | (d) | 0.67 | (d) | 1.03 | (d) | 76 | |||||||||||||||||||||||||||||||
| 10.17 | 0.10 | 277,312 | 0.82 | 0.91 | 0.65 | 211 | ||||||||||||||||||||||||||||||||||
| 10.11 | (0.20 | ) | 48,324 | 1.22 | 1.66 | 0.26 | 211 | |||||||||||||||||||||||||||||||||
| 10.14 | 0.44 | 1,043,676 | 0.48 | 0.57 | 1.00 | 211 | ||||||||||||||||||||||||||||||||||
| 10.13 | (0.06 | ) | 38,818 | 0.98 | 1.07 | 0.49 | 211 | |||||||||||||||||||||||||||||||||
| 10.18 | 0.35 | �� | 18,018 | 0.57 | 0.66 | 0.91 | 211 | |||||||||||||||||||||||||||||||||
| 10.24 | 0.32 | 471,348 | 0.81 | 0.89 | 0.42 | 640 | ||||||||||||||||||||||||||||||||||
| 10.17 | (0.06 | ) | 69,496 | 1.19 | 1.64 | 0.05 | 640 | |||||||||||||||||||||||||||||||||
| 10.21 | 0.66 | 1,133,613 | 0.47 | 0.55 | 0.77 | 640 | ||||||||||||||||||||||||||||||||||
| 10.20 | 0.26 | 53,464 | 0.97 | 1.05 | 0.27 | 640 | ||||||||||||||||||||||||||||||||||
| 10.25 | 0.67 | 24,501 | 0.56 | 0.64 | 0.68 | 640 | ||||||||||||||||||||||||||||||||||
| 10.30 | 1.10 | 808,034 | 0.79 | 0.87 | 0.53 | 359 | ||||||||||||||||||||||||||||||||||
| 10.23 | 0.65 | 95,446 | 1.15 | 1.62 | 0.18 | 359 | ||||||||||||||||||||||||||||||||||
| 10.27 | 1.45 | 1,265,479 | 0.45 | 0.53 | 0.87 | 359 | ||||||||||||||||||||||||||||||||||
| 10.25 | 0.85 | 69,463 | 0.95 | 1.03 | 0.39 | 359 | ||||||||||||||||||||||||||||||||||
| 10.30 | 1.25 | 36,019 | 0.54 | 0.62 | 0.77 | 359 | ||||||||||||||||||||||||||||||||||
| 10.23 | 1.11 | 1,013,335 | 0.82 | 0.87 | 0.61 | 312 | ||||||||||||||||||||||||||||||||||
| 10.17 | 0.74 | 126,533 | 1.31 | 1.62 | 0.12 | 312 | ||||||||||||||||||||||||||||||||||
| 10.20 | 1.56 | 1,512,908 | 0.48 | 0.53 | 0.95 | 312 | ||||||||||||||||||||||||||||||||||
| 10.19 | 1.05 | 128,073 | 0.98 | 1.03 | 0.45 | 312 | ||||||||||||||||||||||||||||||||||
| 10.24 | 1.46 | 9,395 | 0.57 | 0.62 | 0.85 | 312 | ||||||||||||||||||||||||||||||||||
| 10.37 | 3.38 | 1,503,139 | 0.84 | 0.88 | 1.53 | 175 | ||||||||||||||||||||||||||||||||||
| 10.30 | 2.53 | 179,424 | 1.59 | 1.63 | 0.80 | 175 | ||||||||||||||||||||||||||||||||||
| 10.33 | 3.64 | 1,921,023 | 0.50 | 0.54 | 1.84 | 175 | ||||||||||||||||||||||||||||||||||
| 10.32 | 3.23 | 190,628 | 1.00 | 1.04 | 1.31 | 175 | ||||||||||||||||||||||||||||||||||
| 10.37 | 3.64 | 3,366 | 0.59 | 0.63 | 1.54 | 175 | ||||||||||||||||||||||||||||||||||
| The accompanying notes are an integral part of these financial statements. | 107 |
GOLDMAN SACHS SHORT DURATION INCOME FUND
Financial Highlights
Selected Data for a Share Outstanding Throughout Each Period
| Income (loss) from investment operations | Distributions to shareholders | |||||||||||||||||||||||||||||
| Year - Share Class | Net asset value, beginning of period | Net investment | Net realized and unrealized gain (loss) | Total from investment operations | From net investment income | From net realized gains | Total distributions | |||||||||||||||||||||||
| FOR THE SIX MONTHS ENDED SEPTEMBER 30, (UNAUDITED) | ||||||||||||||||||||||||||||||
2014 - A | $ | 10.17 | $ | 0.06 | $ | (0.02 | ) | $ | 0.04 | $ | (0.07 | ) | $ | — | $ | (0.07 | ) | |||||||||||||
2014 - C | 10.17 | 0.04 | (0.02 | ) | 0.02 | (0.05 | ) | — | (0.05 | ) | ||||||||||||||||||||
2014 - Institutional | 10.18 | 0.08 | (0.02 | ) | 0.06 | (0.09 | ) | — | (0.09 | ) | ||||||||||||||||||||
2014 - IR | 10.18 | 0.07 | (0.02 | ) | 0.05 | (0.08 | ) | — | (0.08 | ) | ||||||||||||||||||||
2014 - R | 10.18 | 0.05 | (0.02 | ) | 0.03 | (0.06 | ) | — | (0.06 | ) | ||||||||||||||||||||
| FOR THE FISCAL YEARS ENDED MARCH 31, | ||||||||||||||||||||||||||||||
2014 - A | 10.17 | 0.12 | 0.01 | 0.13 | (0.13 | ) | — | (e) | (0.13 | ) | ||||||||||||||||||||
2014 - C | 10.17 | 0.08 | 0.01 | 0.09 | (0.09 | ) | — | (e) | (0.09 | ) | ||||||||||||||||||||
2014 - Institutional | 10.18 | 0.15 | 0.01 | 0.16 | (0.16 | ) | — | (e) | (0.16 | ) | ||||||||||||||||||||
2014 - IR | 10.18 | 0.15 | — | (e) | 0.15 | (0.15 | ) | — | (e) | (0.15 | ) | |||||||||||||||||||
2014 - R | 10.18 | 0.09 | 0.01 | 0.10 | (0.10 | ) | — | (e) | (0.10 | ) | ||||||||||||||||||||
2013 - A | 9.96 | 0.11 | 0.26 | 0.37 | (0.13 | ) | (0.03 | ) | (0.16 | ) | ||||||||||||||||||||
2013 - C | 9.97 | 0.08 | 0.24 | 0.32 | (0.09 | ) | (0.03 | ) | (0.12 | ) | ||||||||||||||||||||
2013 - Institutional | 9.97 | 0.14 | 0.26 | 0.40 | (0.16 | ) | (0.03 | ) | (0.19 | ) | ||||||||||||||||||||
2013 - IR | 9.97 | 0.13 | 0.26 | 0.39 | (0.15 | ) | (0.03 | ) | (0.18 | ) | ||||||||||||||||||||
2013 - R | 9.97 | 0.08 | 0.26 | 0.34 | (0.10 | ) | (0.03 | ) | (0.13 | ) | ||||||||||||||||||||
| FOR THE PERIOD ENDED MARCH 31, | ||||||||||||||||||||||||||||||
2012 - A (Commenced February 29, 2012) | 10.00 | 0.01 | (0.04 | ) | (0.03 | ) | (0.01 | ) | — | (0.01 | ) | |||||||||||||||||||
2012 - C (Commenced February 29, 2012) | 10.00 | — | (e) | (0.03 | ) | (0.03 | ) | — | (e) | — | — | (e) | ||||||||||||||||||
2012 - Institutional (Commenced February 29, 2012) | 10.00 | 0.01 | (0.03 | ) | (0.02 | ) | (0.01 | ) | — | (0.01 | ) | |||||||||||||||||||
2012 - IR (Commenced February 29, 2012) | 10.00 | 0.01 | (0.03 | ) | (0.02 | ) | (0.01 | ) | — | (0.01 | ) | |||||||||||||||||||
2012 - R (Commenced February 29, 2012) | 10.00 | — | (e) | (0.02 | ) | (0.02 | ) | (0.01 | ) | — | (0.01 | ) | ||||||||||||||||||
| (a) | Calculated based on the average shares outstanding methodology. |
| (b) | Assumes investment at the net asset value at the beginning of the period, reinvestment of all dividends and distributions, a complete redemption of the investment at the net asset value at the end of the period and no sales or redemption charges. Total returns would be reduced if a sales or redemption charge was taken into account. Returns do not reflect the deduction of taxes that a shareholder would pay on Fund distributions or the redemption of Fund shares. Total returns for periods less than one full year are not annualized. |
| (c) | The Fund’s portfolio turnover rate is calculated in accordance with regulatory requirements, without regard to transactions involving short term investments and certain derivatives. If such transactions were included, the Fund’s portfolio turnover rate may be higher. |
| (d) | Annualized. |
| (e) | Amount is less than $0.005 per share. |
| 108 | The accompanying notes are an integral part of these financial statements. |
GOLDMAN SACHS SHORT DURATION INCOME FUND
Net asset value, end | Total return(b) | Net assets, end of period (in 000s) | Ratio of net expenses to average net assets | Ratio of to average net assets | Ratio of net investment income to average net assets | Portfolio turnover rate(c) | ||||||||||||||||||||||||||||||||||
| $ | 10.14 | 1.81 | % | $ | 4,068 | 0.79 | %(d) | 1.01 | %(d) | 1.16 | %(d) | 57 | % | |||||||||||||||||||||||||||
| 10.14 | 1.40 | 948 | 1.20 | (d) | 1.76 | (d) | 0.76 | (d) | 57 | |||||||||||||||||||||||||||||||
| 10.15 | 2.16 | 238,717 | 0.46 | (d) | 0.67 | (d) | 1.51 | (d) | 57 | |||||||||||||||||||||||||||||||
| 10.15 | 2.07 | 191 | 0.55 | (d) | 0.77 | (d) | 1.44 | (d) | 57 | |||||||||||||||||||||||||||||||
| 10.15 | 1.56 | 10 | 1.02 | (d) | 1.24 | (d) | 0.93 | (d) | 57 | |||||||||||||||||||||||||||||||
| 10.17 | 1.28 | 2,327 | 0.80 | 1.19 | 1.16 | 157 | ||||||||||||||||||||||||||||||||||
| 10.17 | 0.87 | 564 | 1.20 | 1.93 | 0.77 | 157 | ||||||||||||||||||||||||||||||||||
| 10.18 | 1.62 | 166,129 | 0.46 | 0.84 | 1.50 | 157 | ||||||||||||||||||||||||||||||||||
| 10.18 | 1.53 | 206 | 0.55 | 0.93 | 1.43 | 157 | ||||||||||||||||||||||||||||||||||
| 10.18 | 1.02 | 10 | 1.03 | 1.44 | 0.91 | 157 | ||||||||||||||||||||||||||||||||||
| 10.17 | 3.69 | 870 | 0.79 | 1.89 | 1.05 | 707 | ||||||||||||||||||||||||||||||||||
| 10.17 | 3.19 | 174 | 1.17 | 1.83 | 0.75 | 707 | ||||||||||||||||||||||||||||||||||
| 10.18 | 4.04 | 78,696 | 0.45 | 1.67 | 1.42 | 707 | ||||||||||||||||||||||||||||||||||
| 10.18 | 3.94 | 152 | 0.54 | 1.51 | 1.32 | 707 | ||||||||||||||||||||||||||||||||||
| 10.18 | 3.40 | 10 | 1.06 | 2.74 | 0.77 | 707 | ||||||||||||||||||||||||||||||||||
| 9.96 | (0.34 | ) | 1,747 | 0.79 | (d) | 6.26 | (d) | 0.79 | (d) | 29 | ||||||||||||||||||||||||||||||
| 9.97 | (0.28 | ) | 10 | 1.19 | (d) | 7.01 | (d) | 0.38 | (d) | 29 | ||||||||||||||||||||||||||||||
| 9.97 | (0.21 | ) | 11,122 | 0.45 | (d) | 5.92 | (d) | 1.11 | (d) | 29 | ||||||||||||||||||||||||||||||
| 9.97 | (0.22 | ) | 10 | 0.54 | (d) | 6.01 | (d) | 0.97 | (d) | 29 | ||||||||||||||||||||||||||||||
| 9.97 | (0.25 | ) | 10 | 1.04 | (d) | 6.51 | (d) | 0.50 | (d) | 29 | ||||||||||||||||||||||||||||||
| The accompanying notes are an integral part of these financial statements. | 109 |
GOLDMAN SACHS SHORT DURATION AND GOVERNMENT FIXED INCOME FUNDS
Notes to Financial Statements
September 30, 2014 (Unaudited)
| 1. ORGANIZATION |
Goldman Sachs Trust (the “Trust”) is a Delaware statutory trust registered under the Investment Company Act of 1940, as amended (the “Act”), as an open-end management investment company. The following table lists those series of the Trust that are included in this report (collectively, the “Funds” or individually a “Fund”), along with their corresponding share classes and respective diversification status under the Act:
| Fund | Share Classes Offered | Diversified/ Non-diversified | ||
Enhanced Income | A, B, Institutional, Administration and IR | Diversified | ||
Government Income | A, B, C, Institutional, Service, IR and R | Diversified | ||
High Quality Floating Rate | A, Institutional, Service and IR | Diversified | ||
Inflation Protected Securities | A, C, Institutional, IR and R | Diversified | ||
Limited Maturity Obligations | Institutional and Administration | Diversified | ||
Short Duration Government | A, C, Institutional, Service and IR | Diversified | ||
Short Duration Income | A, C, Institutional, IR and R | Diversified |
Class B Shares are generally no longer available for purchase by current or prospective investors. Effective March 17, 2014, Class B Shares of Short Duration Government Fund converted to Class A Shares.
Class A Shares of the Enhanced Income, Government Income, High Quality Floating Rate, Inflation Protected Securities, Short Duration Government and Short Duration Income Funds are sold with a front-end sales charge of up to 1.50%, 3.75%, 1.50%, 3.75%, 1.50% and 1.50%, respectively. Class B Shares were sold with a contingent deferred sales charge (“CDSC”) that declines from 5.00% to zero, depending upon the period of time the shares are held. Class C Shares are sold with a CDSC of 1.00% (0.65% for Short Duration Government and Short Duration Income Funds), which is imposed on redemptions made within 12 months of purchase. Institutional, Administration, Service, Class IR and Class R Shares are not subject to a sales charge.
Goldman Sachs Asset Management, L.P. (“GSAM”), an affiliate of Goldman, Sachs & Co. (“Goldman Sachs”), serves as investment adviser to the Funds pursuant to a management agreement (each, an “Agreement”) with the Trust.
| 2. SIGNIFICANT ACCOUNTING POLICIES |
The financial statements have been prepared in accordance with accounting principles generally accepted in the United States of America (“GAAP”) and require management to make estimates and assumptions that may affect the reported amounts and disclosures. Actual results may differ from those estimates and assumptions.
A. Investment Valuation — The Funds’ valuation policy is to value investments at fair value.
B. Investment Income and Investments — Investment income includes interest income and dividend income, net of any foreign withholding taxes, less any amounts reclaimable. Interest income is accrued daily and adjusted for amortization of premiums and accretion of discounts. Dividend income is recognized on ex-dividend date or, for certain foreign securities, as soon as such information is obtained subsequent to the ex-dividend date. Investment transactions are reflected on trade date. Realized gains and losses are calculated using identified cost. Investment transactions are recorded on the following business day for daily net asset value (“NAV”) calculations. Any foreign capital gains tax is accrued daily based upon net unrealized gains, and is payable upon sale of such investments. Distributions received from the Funds’ investments in U.S. real estate investment trusts (“REITs”) may be characterized as ordinary income, net capital gain or a return of capital. A return of capital is recorded by the Funds as a reduction to the cost basis of the REIT.
110
GOLDMAN SACHS SHORT DURATION AND GOVERNMENT FIXED INCOME FUNDS
| 2. SIGNIFICANT ACCOUNTING POLICIES (continued) |
For derivative contracts, realized gains and losses are recorded upon settlement of the contract. Upfront payments are made or received upon entering into a swap agreement and are reflected in the Statement of Assets and Liabilities. Upfront payments are recognized over the contract’s term/event as realized gains or losses, with the exception of forward starting interest rate swaps whose realized gains or losses are recognized from the effective start date. For securities with paydown provisions, principal payments received are treated as a proportionate reduction to the cost basis of the securities, and excess or shortfall amounts are recorded as income. For treasury inflation protected securities (“TIPS”), adjustments to principal due to inflation/deflation are reflected as increases/decreases to interest income with a corresponding adjustment to cost.
C. Class Allocations and Expenses — Investment income, realized and unrealized gain (loss), and non-class specific expenses of each Fund are allocated daily based upon the proportion of net assets of each class. Class specific expenses, where applicable, are borne by the respective share classes and include Distribution and Service, Transfer Agent and Service and Shareholder Administration fees. Non-class specific expenses directly incurred by a Fund are charged to that Fund, while such expenses incurred by the Trust are allocated across the respective Funds on a straight-line and/or pro-rata basis depending upon the nature of the expenses.
D. Offering and Organization Costs — Offering costs paid in connection with the offering of shares of the Limited Maturity Obligations Fund are being amortized on a straight-line basis over 12 months from the date of commencement of operations. Organization costs paid in connection with the organization of the Limited Maturity Obligations Fund were expensed on the first day of operations.
E. Federal Taxes and Distributions to Shareholders — It is each Fund’s policy to comply with the requirements of the Internal Revenue Code of 1986, as amended (the “Code”), applicable to regulated investment companies (mutual funds) and to distribute each year substantially all of its investment company taxable income and capital gains to its shareholders. Accordingly, the Funds are not required to make any provisions for the payment of federal income tax. Distributions to shareholders are recorded on the ex-dividend date. Income distributions, if any, are declared daily and paid monthly, and capital gains distributions, if any, are declared and paid annually.
Net capital losses are carried forward to future fiscal years and may be used to the extent allowed by the Code to offset any future capital gains. Utilization of capital loss carryforwards will reduce the requirement of future capital gains distributions.
Under the Regulated Investment Company Modernization Act of 2010, the Funds are permitted to carry forward capital losses incurred in taxable years beginning after December 22, 2010 for an unlimited period. However, any losses incurred during those future taxable years will be required to be utilized prior to the losses incurred in pre-enactment taxable years. As a result of this ordering rule, pre-enactment capital loss carryforwards may be more likely to expire unused. Additionally, post-enactment capital losses that are carried forward will retain their character as either short-term or long-term capital losses rather than being considered all short-term as under previous law.
The characterization of distributions to shareholders for financial reporting purposes is determined in accordance with federal income tax rules, which may differ from GAAP. The source of each Fund’s distributions may be shown in the accompanying financial statements as either from net investment income, net realized gain or capital. Certain components of the Funds’ net assets on the Statements of Assets and Liabilities reflect permanent GAAP/tax differences based on the appropriate tax character.
F. Foreign Currency Translation — The accounting records and reporting currency of the Funds are maintained in U.S. dollars. Assets and liabilities denominated in foreign currencies are translated into U.S. dollars using the current exchange rates at the close of each business day. The effect of changes in foreign currency exchange rates on investments is included within net realized and unrealized gain (loss) on investments. Changes in the value of other assets and liabilities as a result of fluctuations in foreign exchange rates are included in the Statements of Operations within net change in unrealized gain (loss) on foreign currency transactions. Transactions denominated in foreign currencies are translated into U.S. dollars on the date the transaction occurred, the effects of which are included within net realized gain (loss) on foreign currency transactions.
111
GOLDMAN SACHS SHORT DURATION AND GOVERNMENT FIXED INCOME FUNDS
Notes to Financial Statements (continued)
September 30, 2014 (Unaudited)
| 3. INVESTMENTS AND FAIR VALUE MEASUREMENTS |
The fair value of a financial instrument is the amount that would be received to sell an asset or paid to transfer a liability in an orderly transaction between market participants at the measurement date (i.e., the exit price). GAAP establishes a fair value hierarchy that prioritizes the inputs to valuation techniques used to measure fair value. The hierarchy gives the highest priority to unadjusted quoted prices in active markets for identical assets or liabilities (Level 1 measurements) and the lowest priority to unobservable inputs (Level 3 measurements). The levels used for classifying investments are not necessarily an indication of the risk associated with investing in these investments. The three levels of the fair value hierarchy are described below:
Level 1 — Unadjusted quoted prices in active markets that are accessible at the measurement date for identical, unrestricted assets or liabilities;
Level 2 — Quoted prices in markets that are not active or financial instruments for which significant inputs are observable (including, but not limited to, quoted prices for similar investments, interest rates, foreign exchange rates, volatility and credit spreads), either directly or indirectly;
Level 3 — Prices or valuations that require significant unobservable inputs (including GSAM’s assumptions in determining fair value measurement).
The Trustees have adopted Valuation Procedures that govern the valuation of the portfolio investments held by the Funds, including investments for which market quotations are not readily available. The Trustees have delegated to GSAM day-to-day responsibility for implementing and maintaining internal controls and procedures related to the valuation of the Funds’ portfolio investments. To assess the continuing appropriateness of pricing sources and methodologies, GSAM regularly performs price verification procedures and issues challenges as necessary to third party pricing vendors or brokers, and any differences are reviewed in accordance with the Valuation Procedures.
A. Level 1 and Level 2 Fair Value Investments — The valuation techniques and significant inputs used in determining the fair values for investments classified as Level 1 and Level 2 are as follows:
Debt Securities — Debt securities for which market quotations are readily available are valued daily on the basis of quotations supplied by dealers or an independent pricing service approved by the Trustees. The pricing services may use valuation models or matrix pricing, which consider: (i) yield or price with respect to bonds that are considered comparable in characteristics such as rating, interest rate and maturity date or (ii) quotations from securities dealers to determine current value. Short-term debt obligations that mature in sixty days or less and that do not exhibit signs of credit deterioration are valued at amortized cost, which approximates fair value. With the exception of treasury securities of G8 countries (not held in money market funds), which are generally classified as Level 1, these investments are generally classified as Level 2 of the fair value hierarchy.
i. Inverse Floaters — The interest rate on inverse floating rate securities (“inverse floaters”) resets in the opposite direction from the market rate of interest to which the inverse floaters are indexed. An inverse floater may be considered to be leveraged to the extent that its interest rate varies by a magnitude that exceeds the magnitude of the change in the index rate of interest. The higher the degree of leverage of an inverse floater, the greater the volatility of its market value.
ii. Mortgage-Backed and Asset-Backed Securities — Mortgage-backed securities represent direct or indirect participations in, or are collateralized by and payable from, mortgage loans secured by residential and/or commercial real estate property. Asset-backed securities include securities whose principal and interest payments are collateralized by pools of other assets or receivables. The value of certain mortgage-backed and asset-backed securities (including adjustable rate mortgage loans) may be particularly sensitive to changes in prevailing interest rates. The value of these securities may also fluctuate in response to the market’s perception of the creditworthiness of the issuers.
Asset-backed securities may present credit risks that are not presented by mortgage-backed securities because they generally do not have the benefit of a security interest in collateral that is comparable to mortgage assets. Some asset-backed securities may only have a subordinated claim on collateral.
112
GOLDMAN SACHS SHORT DURATION AND GOVERNMENT FIXED INCOME FUNDS
| 3. INVESTMENTS AND FAIR VALUE MEASUREMENTS (continued) |
Stripped mortgage-backed securities are usually structured with two different classes: one that receives substantially all interest payments (interest-only, or “IO” and/or high coupon rate with relatively low principal amount, or “IOette”), and the other that receives substantially all principal payments (principal-only, or “PO”) from a pool of mortgage loans. Little to no principal will be received at the maturity of an IO; as a result, periodic adjustments are recorded to reduce the cost of the security until maturity. These adjustments are included in interest income.
iii. Mortgage Dollar Rolls — Mortgage dollar rolls are transactions whereby a Fund sells mortgage-backed-securities and simultaneously contracts with the same counterparty to repurchase similar securities on a specified future date. During the settlement period, a Fund will not be entitled to accrue interest and receive principal payments on the securities sold.
iv. Treasury Inflation Protected Securities — TIPS are treasury securities in which the principal amount is adjusted daily to keep pace with inflation, as measured by the U.S. Consumer Pricing Index for Urban Consumers. The repayment of the original bond principal upon maturity is guaranteed by the full faith and credit of the U.S. Government.
v. When-Issued Securities and Forward Commitments — When-issued securities, including TBA (“To Be Announced”) securities, are securities that are authorized but not yet issued in the market and purchased in order to secure what is considered to be an advantageous price or yield to a Fund. A forward commitment involves entering into a contract to purchase or sell securities, typically on an extended settlement basis, for a fixed price at a future date. The purchase of securities on a when-issued or forward commitment basis involves a risk of loss if the value of the security to be purchased declines before the settlement date. Conversely, the sale of securities on a forward commitment basis involves the risk that the value of the securities sold may increase before the settlement date. Although a Fund will generally purchase securities on a when-issued or forward commitment basis with the intention of acquiring the securities for its portfolio, the Fund may dispose of when-issued securities or forward commitments prior to settlement which may result in a realized gain or loss.
Equity Securities — Equity securities and investment companies traded on a United States (“U.S.”) securities exchange or the NASDAQ system, or those located on certain foreign exchanges, including but not limited to the Americas, are valued daily at their last sale price or official closing price on the principal exchange or system on which they are traded. If no sale occurs, equity securities and exchange traded investment companies are valued at the last bid price for long positions and at the last ask price for short positions. Investments in investment companies (other than those that are exchange traded) are valued at the NAV on the valuation date. To the extent these investments are actively traded, they are classified as Level 1 of the fair value hierarchy, otherwise they are generally classified as Level 2.
Unlisted equity securities for which market quotations are available are valued at the last sale price on the valuation date, or if no sale occurs, at the last bid price. Securities traded on certain foreign securities exchanges are valued daily at fair value determined by an independent fair value service (if available) under Valuation Procedures approved by the Trustees and consistent with applicable regulatory guidance. The independent fair value service takes into account multiple factors including, but not limited to, movements in the securities markets, certain depositary receipts, futures contracts and foreign currency exchange rates that have occurred subsequent to the close of the foreign securities exchange. These investments are generally classified as Level 2 of the fair value hierarchy.
Derivative Contracts — A derivative is an instrument whose value is derived from underlying assets, indices, reference rates or a combination of these factors.
Exchange-traded derivatives, including futures contracts, typically fall within Level 1 of the fair value hierarchy. Over-the-counter (“OTC”) and centrally cleared derivatives are valued using market transactions and other market evidence, including market-based inputs to models, calibration to market-clearing transactions, broker or dealer quotations, or other alternative pricing sources. Where models are used, the selection of a particular model to value OTC and centrally cleared derivatives depends upon the contractual terms of, and specific risks inherent in, the instrument, as well as the availability of pricing information in the market. Valuation models require a variety of inputs, including contractual terms, market prices, yield curves, credit curves,
113
GOLDMAN SACHS SHORT DURATION AND GOVERNMENT FIXED INCOME FUNDS
Notes to Financial Statements (continued)
September 30, 2014 (Unaudited)
| 3. INVESTMENTS AND FAIR VALUE MEASUREMENTS (continued) |
measures of volatility, voluntary and involuntary prepayment rates, loss severity rates and correlations of such inputs. For OTC and centrally cleared derivatives that trade in liquid markets, model inputs can generally be verified and model selection does not involve significant management judgment. OTC and centrally cleared derivatives are classified within Level 2 of the fair value hierarchy when significant inputs are corroborated by market evidence.
i. Forward Contracts — A forward contract is a contract between two parties to buy or sell an asset at a specified price on a future date. A forward contract settlement can occur on a cash or delivery basis. Forward contracts are marked-to-market daily using counterparty prices, and the change in value, if any, is recorded as an unrealized gain or loss.
A forward foreign currency contract is a forward contract in which a Fund agrees to receive or deliver a fixed quantity of one currency for another, at a pre-determined price at a future date. All forward foreign currency exchange contracts are marked-to-market daily at the applicable forward rate. Non-deliverable forward foreign currency exchange contracts are settled with the counterparty in cash without the delivery of foreign currency.
ii. Futures Contracts — Futures contracts are contracts to buy or sell a standardized quantity of a specified commodity or security and are valued based on exchanged settlement prices or independent market quotes. Futures contracts are valued at the last settlement price, or in the absence of a sale, the last bid price for long positions and at the last ask price for short positions, at the end of each day on the board of trade or exchange upon which they are traded. Upon entering into a futures contract, a Fund deposits cash or securities in an account on behalf of the broker in an amount sufficient to meet the initial margin requirement. Subsequent payments are made or received by a Fund equal to the daily change in the contract value and are recorded as variation margin receivable or payable with a corresponding offset to unrealized gains or losses.
iii. Options — When a Fund writes call or put options, an amount equal to the premium received is recorded as a liability and is subsequently marked-to-market to reflect the current value of the option written. Swaptions are options on interest rate swap contracts.
Upon the purchase of a call option or a put option by a Fund, the premium paid is recorded as an investment and subsequently marked-to-market to reflect the current value of the option. Certain options may be purchased with premiums to be determined on a future date. The premiums for these options are based upon implied volatility parameters at specified terms.
iv. Swap Contracts — Bilateral swap contracts are agreements in which a Fund and a counterparty agree to exchange periodic payments on a specified notional amount or make a net payment upon termination. Bilateral swap transactions are privately negotiated in the OTC market and payments are settled through direct payments between a Fund and the counterparty. By contrast, certain swap transactions are subject to mandatory central clearing. These swaps are executed through a derivatives clearing member (“DCM”), acting in an agency capacity, and submitted to a central counterparty (“CCP”)(“centrally cleared swaps”), in which case all payments are settled with the CCP through the DCM. Swaps are marked-to-market daily using pricing vendor quotations, counterparty or clearinghouse prices or model prices, and the change in value, if any, is recorded as an unrealized gain or loss. Upon entering into a swap contract, a Fund is required to satisfy an initial margin requirement by delivering cash or securities to the counterparty (or in some cases, segregated in a triparty account on behalf of the counterparty), which can be adjusted by any mark-to-market gains or losses pursuant to bilateral or centrally cleared arrangements. For centrally cleared swaps the daily change in valuation, if any, is recorded as a receivable or payable for variation margin.
An interest rate swap is an agreement that obligates two parties to exchange a series of cash flows at specified intervals, based upon or calculated by reference to changes in interest rates on a specified notional principal amount. The payment flows are usually netted against each other, with the difference being paid by one party to the other.
A credit default swap is an agreement that involves one party (the buyer of protection) making a stream of payments to another party (the seller of protection) in exchange for the right to receive protection on a reference security or obligation, including a group of assets or exposure to the performance of an index. A Fund’s investment in credit default swaps may
114
GOLDMAN SACHS SHORT DURATION AND GOVERNMENT FIXED INCOME FUNDS
| 3. INVESTMENTS AND FAIR VALUE MEASUREMENTS (continued) |
involve greater risks than if the Fund had invested in the referenced obligation directly. Credit events are contract specific but may include bankruptcy, failure to pay, restructuring and obligation acceleration. If a Fund buys protection through a credit default swap and no credit event occurs, its payments are limited to the periodic payments previously made to the counterparty. Upon the occurrence of a specified credit event, a Fund, as a buyer of credit protection, is entitled to receive an amount equal to the notional amount of the swap and deliver to the seller the defaulted reference obligation in a physically settled trade. A Fund may also receive a net settlement amount in the form of cash or securities equal to the notional amount of the swap reduced by the recovery value of the reference obligation in cash settled trade.
As a seller of protection, a Fund generally receives a payment stream throughout the term of the swap, provided that there is no credit event. In addition, if a Fund sells protection through a credit default swap, a Fund could suffer a loss because the value of the referenced obligation and the premium payments received may be less than the notional amount of the swap paid to the buyer of protection. Upon the occurrence of a specified credit event, a Fund, as a seller of credit protection, may be required to take possession of the defaulted reference obligation and pay the buyer an amount equal to the notional amount of the swap in a physically settled trade. A Fund may also pay a net settlement amount in the form of cash or securities equal to the notional amount of the swap reduced by the recovery value of the reference obligation in cash settled trade. Recovery values are at times established through the credit event auction process in which market participants are ensured that a transparent price has been set for the defaulted security or obligation. In addition, a Fund is entitled to a return of any assets, which have been pledged as collateral to the counterparty.
The maximum potential amount of future payments (undiscounted) that a Fund as seller of protection could be required to make under a credit default swap would be an amount equal to the notional amount of the agreement. These potential amounts would be partially offset by any recovery values of the respective referenced obligations or net amounts received from a settlement of a credit default swap for the same reference security or obligation where a Fund bought credit protection.
Short Term Investments — Short-term investments having a maturity of 60 days or less are generally valued at amortized cost which approximates fair market value. These investments are classified as Level 2 of the fair value hierarchy.
i. Repurchase Agreements — Repurchase agreements involve the purchase of securities subject to the seller’s agreement to repurchase the securities at a mutually agreed upon date and price, under the terms of a Master Repurchase Agreement (“MRA”). During the term of a repurchase agreement, the value of the underlying securities held as collateral on behalf of a Fund, including accrued interest, is required to exceed the value of the repurchase agreement, including accrued interest. The gross value of repurchase agreements is included in the Statements of Assets and Liabilities for financial reporting purposes. The underlying securities for all repurchase agreements are held at the Funds’ custodian or designated sub-custodians under tri-party repurchase agreements.
An MRA governs transactions between a Fund and select counterparties. An MRA contains provisions for, among other things, initiation, income payments, events of default and maintenance of securities for repurchase agreements. A MRA also permits offsetting with collateral to create one single net payment in the event of default or similar events, including the bankruptcy or insolvency of a counterparty.
If the seller defaults, a Fund could suffer a loss to the extent that the proceeds from the sale of the underlying securities and other collateral held by the Fund are less than the repurchase price and the Fund’s costs associated with delay and enforcement of the repurchase agreement. In addition, in the event of default or insolvency of the seller, a court could determine that a Fund’s interest in the collateral is not enforceable, resulting in additional losses to the Fund.
Pursuant to exemptive relief granted by the Securities and Exchange Commission (“SEC”) and terms and conditions contained therein, the Funds, together with other funds of the Trust and registered investment companies having management agreements with GSAM or its affiliates, may transfer uninvested cash into joint accounts, the daily aggregate balance of which is invested in one or more repurchase agreements. Under these joint accounts, the Funds maintain pro-rata credit exposure to the underlying repurchase agreements’ counterparties. With the exception of certain transaction fees, the Funds are not subject to any expenses in relation to these investments.
115
GOLDMAN SACHS SHORT DURATION AND GOVERNMENT FIXED INCOME FUNDS
Notes to Financial Statements (continued)
September 30, 2014 (Unaudited)
| 3. INVESTMENTS AND FAIR VALUE MEASUREMENTS (continued) |
B. Level 3 Fair Value Investments — To the extent that the aforementioned significant inputs are unobservable, or if quotations are not readily available, or if GSAM believes that such quotations do not accurately reflect fair value, the fair value of the Funds’ investments may be determined under Valuation Procedures approved by the Trustees. GSAM, consistent with its procedures and applicable regulatory guidance, may make an adjustment to the most recent valuation prices of either domestic or foreign securities in light of significant events to reflect what it believes to be the fair value of the securities at the time of determining a Fund’s NAV. Significant events which could affect a large number of securities in a particular market may include, but are not limited to: significant fluctuations in U.S. or foreign markets; market dislocations; market disruptions; or unscheduled market closings. Significant events which could also affect a single issuer may include, but are not limited to: corporate actions such as reorganizations, mergers and buy-outs; ratings downgrades; and bankruptcies.
C. Fair Value Hierarchy — The following is a summary of the Funds’ investments and derivatives classified in the fair value hierarchy as of September 30, 2014:
| ENHANCED INCOME | ||||||||||||
| Investment Type | Level 1 | Level 2 | Level 3 | |||||||||
| Assets | ||||||||||||
Fixed Income | ||||||||||||
Corporate Obligations | $ | — | $ | 276,425,833 | $ | — | ||||||
U.S. Treasury Obligations and/or Other U.S. Government Agencies | 119,813,736 | 46,095,152 | — | |||||||||
Asset-Backed Securities | — | 59,058,806 | — | |||||||||
Foreign Debt Obligation | — | 1,091,334 | — | |||||||||
Government Guarantee Obligations | — | 24,430,939 | — | |||||||||
Short-term Investments | — | 83,143,809 | — | |||||||||
| Total | $ | 119,813,736 | $ | 490,245,873 | $ | — | ||||||
| Derivative Type | ||||||||||||
| Assets(a) | ||||||||||||
Futures Contracts | $ | 155,470 | $ | — | $ | — | ||||||
116
GOLDMAN SACHS SHORT DURATION AND GOVERNMENT FIXED INCOME FUNDS
| 3. INVESTMENTS AND FAIR VALUE MEASUREMENTS (continued) |
| GOVERNMENT INCOME | ||||||||||||
| Investment Type | Level 1 | Level 2 | Level 3 | |||||||||
| Assets | ||||||||||||
Fixed Income | ||||||||||||
Mortgage-Backed Obligations | $ | — | $ | 216,650,621 | $ | — | ||||||
U.S. Treasury Obligations and/or Other U.S. Government Agencies | 237,006,624 | 47,135,800 | — | |||||||||
Asset-Backed Securities | — | 15,330,434 | — | |||||||||
Municipal Debt Obligation | — | 2,559,000 | — | |||||||||
Government Guarantee Obligations | — | 7,860,964 | — | |||||||||
Short-term Investments | — | 5,100,000 | — | |||||||||
| Total | $ | 237,006,624 | $ | 294,636,819 | $ | — | ||||||
| Liabilities | ||||||||||||
Fixed Income | ||||||||||||
Mortgage-Backed Obligations — Forward Sales Contracts | $ | — | $ | (6,898,828 | ) | $ | — | |||||
| Derivative Type | Level 1 | Level 2 | Level 3 | |||||||||
| Assets | ||||||||||||
Options Purchased | $ | — | $ | 1,297,218 | $ | — | ||||||
Futures Contracts(a) | 276,088 | — | — | |||||||||
Interest Rate Swap Contracts(a) | — | 157,845 | — | |||||||||
| Total | $ | 276,088 | $ | 1,455,063 | $ | — | ||||||
| Liabilities(a) | ||||||||||||
Futures Contracts | $ | (102,657 | ) | $ | — | $ | — | |||||
Interest Rate Swap Contracts | — | (184,210 | ) | — | ||||||||
| Total | $ | (102,657 | ) | $ | (184,210 | ) | $ | — | ||||
117
GOLDMAN SACHS SHORT DURATION AND GOVERNMENT FIXED INCOME FUNDS
Notes to Financial Statements (continued)
September 30, 2014 (Unaudited)
| 3. INVESTMENTS AND FAIR VALUE MEASUREMENTS (continued) |
| HIGH QUALITY FLOATING RATE | ||||||||||||
| Investment Type | Level 1 | Level 2 | Level 3 | |||||||||
| Assets | ||||||||||||
Fixed Income | ||||||||||||
Corporate Obligations | $ | — | $ | 792,622 | $ | — | ||||||
Mortgage-Backed Obligations | — | 154,161,873 | — | |||||||||
U.S. Treasury Obligations and/or Other U.S. Government Agencies | 25,883,494 | 80,001,784 | — | |||||||||
Asset-Backed Securities | — | 144,016,829 | — | |||||||||
Government Guarantee Obligations | — | 21,911,328 | — | |||||||||
Short-term Investments | — | 60,000,000 | — | |||||||||
| Total | $ | 25,883,494 | $ | 460,884,436 | $ | — | ||||||
| Liabilities | ||||||||||||
Fixed Income | ||||||||||||
Mortgage-Backed Obligations — Forward Sales Contracts | $ | — | $ | (3,942,188 | ) | $ | — | |||||
| Derivative Type | ||||||||||||
| Assets | ||||||||||||
Options Purchased | $ | — | $ | 4,542,204 | $ | — | ||||||
Futures Contracts(a) | 332,721 | — | — | |||||||||
Interest Rate Swap Contracts(a) | — | 291,070 | — | |||||||||
| Total | $ | 332,721 | $ | 4,833,274 | $ | — | ||||||
| Liabilities(a) | ||||||||||||
Futures Contracts | $ | (338,056 | ) | $ | — | $ | — | |||||
Interest Rate Swap Contracts | — | (378,357 | ) | — | ||||||||
| Total | $ | (338,056 | ) | $ | (378,357 | ) | $ | — | ||||
118
GOLDMAN SACHS SHORT DURATION AND GOVERNMENT FIXED INCOME FUNDS
| 3. INVESTMENTS AND FAIR VALUE MEASUREMENTS (continued) |
| INFLATION PROTECTED SECURITIES | ||||||||||||
| Investment Type | Level 1 | Level 2 | Level 3 | |||||||||
| Assets | ||||||||||||
Fixed Income | ||||||||||||
U.S. Treasury Obligations | $ | 148,709,583 | $ | — | $ | — | ||||||
Short-term Investments | — | 1,200,000 | — | |||||||||
| Total | $ | 148,709,583 | $ | 1,200,000 | $ | — | ||||||
| Derivative Type | ||||||||||||
| Assets | ||||||||||||
Options Purchased | $ | — | $ | 306,941 | $ | — | ||||||
Futures Contracts(a) | 288,635 | — | — | |||||||||
Interest Rate Swap Contracts(a) | — | 237,423 | — | |||||||||
| Total | $ | 288,635 | $ | 544,364 | $ | — | ||||||
| Liabilities(a) | ||||||||||||
Futures Contracts | $ | (185,204 | ) | $ | — | $ | — | |||||
Interest Rate Swap Contracts | — | (224,391 | ) | — | ||||||||
| Total | $ | (185,204 | ) | $ | (224,391 | ) | $ | — | ||||
| LIMITED MATURITY OBLIGATION FUND | ||||||||||||
| Investment Type | Level 1 | Level 2 | Level 3 | |||||||||
| Assets | ||||||||||||
Fixed Income | ||||||||||||
Corporate Obligations | $ | — | $ | 1,860,044 | $ | — | ||||||
Municipal Debt Obligations | — | 5,403,435 | — | |||||||||
Short-term Investments | — | 2,680,000 | — | |||||||||
| Total | $ | — | $ | 9,943,479 | $ | — | ||||||
119
GOLDMAN SACHS SHORT DURATION AND GOVERNMENT FIXED INCOME FUNDS
Notes to Financial Statements (continued)
September 30, 2014 (Unaudited)
| 3. INVESTMENTS AND FAIR VALUE MEASUREMENTS (continued) |
| SHORT DURATION GOVERNMENT | ||||||||||||
| Investment Type | Level 1 | Level 2 | Level 3 | |||||||||
| Assets | ||||||||||||
Fixed Income | ||||||||||||
Mortgage-Backed Obligations | $ | — | $ | 594,462,143 | $ | — | ||||||
U.S. Treasury Obligations and/or Other U.S. Government Agencies | 326,380,213 | 335,266,826 | — | |||||||||
Government Guarantee Obligation | — | 19,686,000 | — | |||||||||
Short-term Investments | — | 59,200,000 | — | |||||||||
| Total | $ | 326,380,213 | $ | 1,008,614,969 | $ | — | ||||||
| Liabilities | ||||||||||||
Fixed Income | ||||||||||||
Mortgage-Backed Obligations — Forward Sales Contracts | $ | — | $ | (33,508,595 | ) | $ | — | |||||
| Derivative Type | Level 1 | Level 2 | Level 3 | |||||||||
| Assets | ||||||||||||
Options Purchased | $ | — | $ | 5,849,729 | $ | — | ||||||
Futures Contracts(a) | 1,126,805 | — | — | |||||||||
Interest Rate Swap Contracts(a) | — | 2,499,311 | — | |||||||||
| Total | $ | 1,126,805 | $ | 8,349,040 | $ | — | ||||||
| Liabilities(a) | ||||||||||||
Futures Contracts | $ | (297,835 | ) | $ | — | $ | — | |||||
Interest Rate Swap Contracts | — | (908,778 | ) | — | ||||||||
| Total | $ | (297,835 | ) | $ | (908,778 | ) | $ | — | ||||
120
GOLDMAN SACHS SHORT DURATION AND GOVERNMENT FIXED INCOME FUNDS
| 3. INVESTMENTS AND FAIR VALUE MEASUREMENTS (continued) |
| SHORT DURATION INCOME | ||||||||||||
| Investment Type | Level 1 | Level 2 | Level 3 | |||||||||
| Assets | ||||||||||||
Fixed Income | ||||||||||||
Corporate Obligations | $ | — | $ | 102,164,932 | $ | — | ||||||
Mortgage-Backed Obligations | — | 18,603,343 | — | |||||||||
U.S. Treasury Obligations and/or Other U.S. Government Agencies | 33,047,501 | 21,370,930 | — | |||||||||
Asset-Backed Securities | — | 31,164,665 | — | |||||||||
Foreign Debt Obligations | 877,106 | 7,885,916 | — | |||||||||
Municipal Debt Obligations | — | 3,227,575 | — | |||||||||
Short-term Investments | — | 15,247,394 | — | |||||||||
| Total | $ | 33,924,607 | $ | 199,664,755 | $ | — | ||||||
| Liabilities | ||||||||||||
Fixed Income | ||||||||||||
Mortgage-Backed Obligations — Forward Sales Contracts | $ | — | $ | (985,547 | ) | $ | — | |||||
| Derivative Type | Level 1 | Level 2 | Level 3 | |||||||||
| Assets | ||||||||||||
Options Purchased | $ | — | $ | 2,730,265 | $ | — | ||||||
Forward Foreign Currency Exchange Contracts(a) | — | 797,811 | — | |||||||||
Futures Contracts(a) | 273,183 | — | — | |||||||||
Interest Rate Swap Contracts(a) | — | 635,044 | — | |||||||||
| Total | $ | 273,183 | $ | 4,163,120 | $ | — | ||||||
| Liabilities(a) | ||||||||||||
Forward Foreign Currency Exchange Contracts | $ | — | $ | (480,543 | ) | $ | — | |||||
Futures Contracts | (285,449 | ) | — | — | ||||||||
Interest Rate Swap Contracts | — | (332,308 | ) | — | ||||||||
Credit Default Swap Contracts | — | (9,335 | ) | — | ||||||||
| Total | $ | (285,449 | ) | $ | (822,186 | ) | $ | — | ||||
| (a) | Amount shown represents unrealized gain (loss) at period end. |
For further information regarding security characteristics, see the Schedule of Investments.
121
GOLDMAN SACHS SHORT DURATION AND GOVERNMENT FIXED INCOME FUNDS
Notes to Financial Statements (continued)
September 30, 2014 (Unaudited)
| 4. INVESTMENTS IN DERIVATIVES |
The following tables set forth, by certain risk types, the gross value of derivative contracts as of September 30, 2014. These instruments were used to meet the Funds’ investment objectives and to obtain and/or manage exposure related to the risks below. The values in the tables below exclude the effects of cash collateral received or posted pursuant to these derivative contracts, and therefore are not representative of the Funds’ net exposure.
| Enhanced Income | ||||||||||||
| Risk | Statement of Assets and Liabilities | Assets | Statement of Assets and Liabilities | Liabilities | ||||||||
Interest rate | Variation margin on certain derivative contracts | $ | 155,470 | (a) | — | $ | — | |||||
| Government Income | ||||||||||||
| Risk | Statement of Assets and Liabilities | Assets | Statement of Assets and Liabilities | Liabilities | ||||||||
Interest rate | Variation margin on certain derivative contracts; Investments, at value | $ | 1,731,151 | (a) | Variation margin on certain derivative contracts | $ | (286,867) | (a) | ||||
| High Quality Floating Rate | ||||||||||||
| Risk | Statement of Assets and Liabilities | Assets | Statement of Assets and Liabilities | Liabilities | ||||||||
Interest rate | Variation margin on certain derivative contracts; Investments, at value | $ | 5,165,995 | (a) | Variation margin on certain derivative contracts | $ | (716,413) | (a) | ||||
| Inflation Protected Securities | ||||||||||||
| Risk | Statement of Assets and Liabilities | Assets | Statement of Assets and Liabilities | Liabilities | ||||||||
Interest rate | Variation margin on certain derivative contracts; Investments, at value | $ | 832,999 | (a) | Variation margin on certain derivative contracts | $ | (409,595) | (a) | ||||
| Short Duration Government Fund | ||||||||||||
| Risk | Statement of Assets and Liabilities | Assets | Statement of Assets and Liabilities | Liabilities | ||||||||
Interest rate | Variation margin on certain derivative contracts; Investments, at value | $ | 9,475,845 | (a) | Variation margin on certain derivative contracts | $ | (1,206,613) | (a) | ||||
122
GOLDMAN SACHS SHORT DURATION AND GOVERNMENT FIXED INCOME FUNDS
| 4. INVESTMENTS IN DERIVATIVES (continued) |
| Short Duration Income | ||||||||||||
| Risk | Statement of Assets and Liabilities | Assets | Statement of Assets and Liabilities | Liabilities | ||||||||
Interest rate | Variation margin on certain derivative contracts; Investments, at value | $ | 3,638,492 | (a) | Payable for unrealized loss on swap contracts; Variation margin on certain derivative contracts | $ | (617,757) | (a)(b) | ||||
Credit | — | Variation margin on certain derivative contracts | (9,335) | |||||||||
Currency | Receivable for unrealized gain on forward foreign currency exchange contracts | 797,811 | Payable for unrealized loss on forward foreign currency exchange contracts | (480,543) | ||||||||
| Total | $ | 4,436,303 | $(1,107,635) | |||||||||
| (a) | Includes unrealized gain (loss) on futures contracts and centrally cleared swaps described in the Additional Investment Information sections of the Schedules of Investments. Only current day’s variation margin is reported within the Statements of Assets and Liabilities. |
| (b) | Aggregate of amounts include $6,779 for Short Duration Income Funds, which represent the payments to be made pursuant to bilateral agreements should counterparties exercise their “right to terminate” provisions based on, among others, the Fund’s performance, their failure to pay on their obligations or failure to pledge collateral. Such amounts do not include incremental charges directly associated with the close-out of the agreements. They also do not reflect the fair value of any assets pledged as collateral which, through the daily margining process, substantially offsets the aforementioned amounts and for which the Fund is entitled to a full return. |
The following tables set forth, by certain risk types, the Funds’ gains (losses) related to these derivatives and their indicative volumes for the six months ended September 30, 2014. These gains (losses) should be considered in the context that these derivative contracts may have been executed to create investment opportunities and/or economically hedge certain investments, and accordingly, certain gains (losses) on such derivative contracts may offset certain (losses) gains attributable to investments. These gains (losses) are included in “Net realized gain (loss)” or “Net change in unrealized gain (loss)” on the Statements of Operations:
| Enhanced Income | ||||||||||||||
| Risk | Statements of Operations | Net Realized Gain (Loss) | Net Change in Unrealized Gain (Loss) | Average Number of Contracts(a) | ||||||||||
| Interest rate | Net realized gain (loss) from futures contracts/Net change in unrealized gain (loss) on futures contracts | $ | (207,407 | ) | $ | (200,379 | ) | 606 | ||||||
123
GOLDMAN SACHS SHORT DURATION AND GOVERNMENT FIXED INCOME FUNDS
Notes to Financial Statements (continued)
September 30, 2014 (Unaudited)
| 4. INVESTMENTS IN DERIVATIVES (continued) |
| Government Income | ||||||||||||||
| Risk | Statements of Operations | Net Realized Gain (Loss) | Net Change in Unrealized Gain (Loss) | Average Number of Contracts(a) | ||||||||||
| Interest rate | Net realized gain (loss) from futures contracts and swap contracts/Net change in unrealized gain (loss) on investments, futures contracts and swap contracts | $ | (440,070 | ) | $ | (255,962 | ) | 1,148 | ||||||
| High Quality Floating Rate | ||||||||||||||
| Risk | Statements of Operations | Net Realized Gain (Loss) | Net Change in Unrealized Gain (Loss) | Average Number of Contracts(a) | ||||||||||
| Interest rate | Net realized gain (loss) from futures contracts and swap contracts/Net change in unrealized gain (loss) on investments, futures contracts and swap contracts | $ | (500,221 | ) | $ | (584,204 | ) | 1,259 | ||||||
| Inflation Protected Securities | ||||||||||||||
| Risk | Statements of Operations | Net Realized Gain (Loss) | Net Change in Unrealized Gain (Loss) | Average Number of Contracts(a) | ||||||||||
| Interest rate | Net realized gain (loss) from futures contracts and swap contracts/Net change in unrealized gain (loss) on futures contracts and swap contracts | $ | (607,763 | ) | $ | 198,896 | 854 | |||||||
| Short Duration Government Fund | ||||||||||||||
| Risk | Statements of Operations | Net Realized Gain (Loss) | Net Change in Unrealized Gain (Loss) | Average Number of Contracts(a) | ||||||||||
| Interest rate | Net realized gain (loss) from investments, futures contracts and swap contracts/Net change in unrealized gain (loss) on investments, futures contracts and swap contracts | $ | (5,608,044 | ) | $ | 447,324 | 6,296 | |||||||
124
GOLDMAN SACHS SHORT DURATION AND GOVERNMENT FIXED INCOME FUNDS
| 4. INVESTMENTS IN DERIVATIVES (continued) |
| Short Duration Income | ||||||||||||||
| Risk | Statements of Operations | Net Realized Gain (Loss) | Net Change in Unrealized Gain (Loss) | Average Number of Contracts(a) | ||||||||||
| Interest rate | Net realized gain (loss) from futures contracts and swap contracts/Net change in unrealized gain (loss) on investments, futures contracts and swap contracts | $ | (1,123,457 | ) | $ | 11,406 | 1,233 | |||||||
| Credit | Net realized gain (loss) from swap contracts/Net change in unrealized gain (loss) on swap contracts | (2,210 | ) | (22,358 | ) | 1 | ||||||||
| Currency | Net realized gain (loss) from forward foreign currency exchange contracts/Net change in unrealized gain (loss) on forward foreign currency exchange contracts | $ | 536,736 | $ | 311,390 | 313 | ||||||||
| Total | $ | (588,931 | ) | $ | 300,438 | 1,547 | ||||||||
| (a) | Average number of contracts is based on the average of month end balances for the six months ended September 30, 2014. |
In order to better define its contractual rights and to secure rights that will help a Fund mitigate its counterparty risk, a Fund may enter into an International Swaps and Derivatives Association, Inc. Master Agreement (“ISDA Master Agreement”) or similar agreement with its derivatives counterparties. An ISDA Master Agreement is a bilateral agreement between a Fund and a counterparty that governs OTC derivatives, including foreign exchange contracts, and typically contains, among other things, collateral posting terms and netting provisions in the event of a default and/or termination event. The provisions of the ISDA Master Agreement typically permit a single net payment in the event of a default (close-out netting) or similar event, including the bankruptcy or insolvency of the counterparty.
Collateral and margin requirements differ between exchange traded derivatives and OTC derivatives. Margin requirements are established by the broker or clearing house for exchange-traded and centrally cleared derivatives (financial futures contracts, options and centrally cleared swaps) pursuant to governing agreements for those instrument types. Brokers can ask for margin in excess of the minimum in certain circumstances. Collateral terms are contract-specific for OTC derivatives (foreign currency exchange contracts, and certain options and swaps). For derivatives traded under an ISDA Master Agreement, the collateral requirements are typically calculated by netting the marked to market amount for each transaction under such agreement and comparing that amount to the value of any collateral currently pledged by a Fund and the counterparty. Additionally, a Fund may be required to post initial margin to the counterparty, the terms of which would be outlined in the confirmation of the OTC transaction.
For financial reporting purposes, cash collateral that has been pledged to cover obligations of a Fund and cash collateral received from the counterparty, if any, is reported separately on the Statements of Assets and Liabilities as receivables/payables for collateral on certain derivative contracts. Non-cash collateral pledged by a Fund, if any, is noted in the Schedules of Investments. Generally, the amount of collateral due from or to a counterparty must exceed a minimum transfer amount threshold before a transfer is required to be made. To the extent amounts due to a Fund from its counterparties are not fully collateralized, contractually or otherwise, the Fund bears the risk of loss from counterparty nonperformance. A Fund attempts to mitigate counterparty risk by only entering into agreements with counterparties that it believes to be of good standing and by monitoring the financial stability of those counterparties.
125
GOLDMAN SACHS SHORT DURATION AND GOVERNMENT FIXED INCOME FUNDS
Notes to Financial Statements (continued)
September 30, 2014 (Unaudited)
| 4. INVESTMENTS IN DERIVATIVES (continued) |
Additionally, the netting of assets and liabilities and the offsetting of collateral pledged or received are based on contractual netting/set-off provisions in the ISDA Master Agreement or similar agreements. However, in the event of a default or insolvency of a counterparty, a court could determine that such rights are not enforceable due the restrictions or prohibitions against the right of setoff that may be imposed due to a particular jurisdiction’s bankruptcy or insolvency laws.
The following tables set forth the Funds’ net exposure for derivative instruments that are subject to enforceable master netting arrangements or similar agreements as of September 30, 2014:
| Short Duration Income Fund | ||||||||||||||||||||||||||||||||||||
| Derivative Assets(1) | Derivative Liabilities(1) | Net Derivative Asset (Liabilities) | Collateral (Received) Pledged(1) | Net Amount(2) | ||||||||||||||||||||||||||||||||
| Counterparty | Options Purchased | Forward Currency Contracts | Total | Swaps | Forward Currency Contracts | Total | ||||||||||||||||||||||||||||||
Barclays Bank PLC | $ | — | $ | 57,027 | $ | 57,027 | $ | (4,967 | ) | $ | (61,772 | ) | $ | (66,739 | ) | $ | (9,712 | ) | $ | — | $ | (9,712 | ) | |||||||||||||
BNP Paribas SA | — | 127,872 | 127,872 | — | (50,936 | ) | (50,936 | ) | 76,936 | — | 76,936 | |||||||||||||||||||||||||
Citibank NA | — | 49,920 | 49,920 | — | (31,611 | ) | (31,611 | ) | 18,309 | — | 18,309 | |||||||||||||||||||||||||
Credit Suisse International (London) | — | 15,489 | 15,489 | — | (23,724 | ) | (23,724 | ) | (8,235 | ) | — | (8,235 | ) | |||||||||||||||||||||||
Deutsche Bank AG (London) | — | 135,821 | 135,821 | — | (87,449 | ) | (87,449 | ) | 48,372 | — | 48,372 | |||||||||||||||||||||||||
Deutsche Bank AG | 1,314,844 | — | 1,314,844 | (1,812 | ) | — | (1,812 | ) | 1,313,032 | (1,020,000 | ) | 293,032 | ||||||||||||||||||||||||
HSBC Bank PLC | — | 37,973 | 37,973 | — | (14,275 | ) | (14,275 | ) | 23,698 | — | 23,698 | |||||||||||||||||||||||||
JPMorgan Chase Bank NA | 1,415,421 | 197,305 | 1,612,726 | — | (42,616 | ) | (42,616 | ) | 1,570,110 | (910,000 | ) | 660,110 | ||||||||||||||||||||||||
Morgan Stanley & Co. International PLC | — | 31,701 | 31,701 | — | (30,901 | ) | (30,901 | ) | 800 | — | 800 | |||||||||||||||||||||||||
Royal Bank of Canada | — | 38,747 | 38,747 | — | (51,769 | ) | (51,769 | ) | (13,022 | ) | — | (13,022 | ) | |||||||||||||||||||||||
State Street Bank and Trust | — | 35,688 | 35,688 | — | (19,658 | ) | (19,658 | ) | 16,030 | — | 16,030 | |||||||||||||||||||||||||
Westpac Banking Corp. | — | 70,268 | 70,268 | — | (65,832 | ) | (65,832 | ) | 4,436 | — | 4,436 | |||||||||||||||||||||||||
Total | $ | 2,730,265 | $ | 797,811 | $ | 3,528,076 | $ | (6,779 | ) | $ | (480,543 | ) | $ | (487,322 | ) | $ | 3,040,754 | $ | — | $ | 3,040,754 | |||||||||||||||
| (1) | Gross amounts available for offset but not netted in the Statement of Assets and Liabilities. |
| (2) | Net amount represents the net amount due (to) from counterparty in the event of a default based on the contractual set-off rights under the agreement. Net amount excludes any over-collateralized amounts. |
| 5. AGREEMENTS AND AFFILIATED TRANSACTIONS |
A. Management Agreement — Under the Agreement, GSAM manages the Funds, subject to the general supervision of the Trustees.
As compensation for the services rendered pursuant to the Agreement, the assumption of the expenses related thereto and administration of the Funds’ business affairs, including providing facilities, GSAM is entitled to a management fee, accrued daily and paid monthly, equal to an annual percentage rate of each Fund’s average daily net assets.
126
GOLDMAN SACHS SHORT DURATION AND GOVERNMENT FIXED INCOME FUNDS
| 5. AGREEMENTS AND AFFILIATED TRANSACTIONS (continued) |
For the six months ended September 30, 2014, contractual and effective net management fees with GSAM were at the following rates:
| Contractual Management Rate | Effective Net Management Rate | |||||||||||||||||||||||||||||
| Fund | First $1 billion | Next $1 billion | Next $3 billion | Next $3 billion | Over $8 billion | Effective Rate | ||||||||||||||||||||||||
Enhanced Income | 0.25 | % | 0.23 | % | 0.22 | % | 0.22 | % | 0.22 | % | 0.25 | % | 0.25 | % | ||||||||||||||||
Government Income | 0.54 | 0.49 | 0.47 | 0.46 | 0.45 | 0.54 | 0.53 | (1) | ||||||||||||||||||||||
High Quality Floating Rate | 0.40 | 0.36 | 0.34 | 0.33 | 0.32 | 0.40 | 0.31 | (1) | ||||||||||||||||||||||
Inflation Protected Securities | 0.33 | 0.30 | 0.28 | 0.27 | 0.26 | 0.33 | 0.24 | (1) | ||||||||||||||||||||||
Limited Maturity Obligations | 0.25 | 0.25 | 0.25 | 0.25 | 0.25 | 0.25 | 0.18 | (1) | ||||||||||||||||||||||
Short Duration Government | 0.50 | 0.45 | 0.43 | 0.42 | 0.41 | 0.49 | 0.44 | (1) | ||||||||||||||||||||||
Short Duration Income | 0.40 | 0.36 | 0.34 | 0.33 | 0.32 | 0.40 | 0.40 | |||||||||||||||||||||||
| (1) | GSAM has agreed to waive a portion of it management fee in order to achieve the effective net management rate shown above as an annual percentage rate of the average daily net assets of the Funds through at least July 29, 2015. Prior to such date GSAM may not terminate the arrangement without the approval of the Trustees. |
B. Distribution and Service Plans — The Trust, on behalf of each Fund, has adopted Distribution and Service Plans (the “Plans”). Under the Plans, Goldman Sachs, which serves as distributor (the “Distributor”), is entitled to a fee accrued daily and paid monthly, for distribution services and personal and account maintenance services, which may then be paid by Goldman Sachs to authorized dealers, at the following annual rates calculated on a Fund’s average daily net assets of each respective share class:
| Distribution and Service Plan Rates | ||||||||||||||||||
| Class A* | Class B | Class C | Class R* | |||||||||||||||
Distribution Plan | 0.25 | % | 0.75 | % | 0.75 | % | 0.50 | % | ||||||||||
Service Plan | — | 0.25 | 0.25 | — | ||||||||||||||
| * | With respect to Class A and Class R Shares, the Distributor at its discretion may use compensation for distribution services paid under the Distribution Plan to compensate service organizations for personal and account maintenance services and expenses as long as such total compensation does not exceed the maximum cap on “service fees” imposed by the Financial Industry Regulatory Authority. |
Goldman Sachs has agreed to waive a portion of the distribution and service fees applicable to the Short Duration Government Fund’s and Short Duration Income Fund’s Class C Shares in an amount equal to a minimum of 0.35% as an annual percentage rate of the average daily net assets. These arrangements will remain in place through July 29, 2015, for Short Duration Government and Short Duration Income Funds. Prior to such date Goldman Sachs may not terminate the arrangement without the approval of the trustees.
For the six months ended September 30, 2014, Goldman Sachs waived a portion of the distribution and service fees equal to 0.71% of the average daily net assets attributable to Class B Shares of the Enhanced Income Fund, 0.03% of the average daily net assets attributable to Service Shares of the High Quality Floating Rate Fund and 0.05% of the average daily net assets attributable to Administration Shares of the Limited Maturity Obligations Fund.
127
GOLDMAN SACHS SHORT DURATION AND GOVERNMENT FIXED INCOME FUNDS
Notes to Financial Statements (continued)
September 30, 2014 (Unaudited)
| 5. AGREEMENTS AND AFFILIATED TRANSACTIONS (continued) |
C. Distribution Agreement — Goldman Sachs, as Distributor of the shares of the Funds pursuant to a Distribution Agreement, may retain a portion of the Class A front end sales charge and Class B and Class C Shares’ CDSC. During the six months ended September 30, 2014, Goldman Sachs advised that it retained the following amounts:
| Front End Sales Charge | Contingent Deferred Sales Charge | |||||||||||||
| Fund | Class A | Class B | Class C | |||||||||||
Enhanced Income | $ | 255 | $ | — | N/A | |||||||||
Government Income | 1,026 | — | — | |||||||||||
High Quality Floating Rate | 530 | N/A | N/A | |||||||||||
Inflation Protected Securities | 739 | N/A | — | |||||||||||
Limited Maturity Obligations | N/A | N/A | N/A | |||||||||||
Short Duration Government | 2,615 | N/A | — | |||||||||||
Short Duration Income | 49 | N/A | — | |||||||||||
D. Service Plan and Shareholder Administration Plan — The Trust, on behalf of each Fund that offers Service Shares, has adopted a Service Plan and a Shareholder Administration Plan. These plans allow for service organizations to provide varying levels of personal and account maintenance and shareholder administration services to their customers who are beneficial owners of such shares. The Service Plan and Shareholder Administration Plan each provide for compensation to the service organizations which is accrued daily and paid monthly at an annual rate of 0.25% (0.50% in aggregate) of the average daily net assets of the Service Shares.
E. Transfer Agency Agreement — Goldman Sachs also serves as the transfer agent of the Funds for a fee pursuant to the Transfer Agency Agreement. The fees charged for such transfer agency services are accrued daily and paid monthly at annual rates as follows: 0.13% of the average daily net assets of Class A, Class B, Class C, Class IR and Class R Shares and 0.04% of the average daily net assets of Institutional, Administration and Service Shares. Goldman Sachs has agreed to waive a portion of its transfer agent fee in order to achieve an effective transfer agency fee rate of 0.01% of the average daily net assets of the Institutional and Administration Shares of the Limited Maturity Obligations Fund.
F. Other Expense Agreements and Affiliated Transactions — GSAM has agreed to limit certain “Other Expenses” of the Funds (excluding transfer agency fees and expenses, service fees and shareholder administration fees (as applicable), taxes, interest, brokerage fees, shareholder meetings, litigation, indemnification and extraordinary expenses) to the extent such expenses exceed, on an annual basis, a percentage rate of the average daily net assets of each Fund. Such Other Expense reimbursements, if any, are accrued daily and paid monthly. In addition, the Funds are not obligated to reimburse GSAM for prior fiscal year expense reimbursements, if any. The Other Expense limitations as an annual percentage rate of average daily net assets for Enhanced Income, Government Income, High Quality Floating Rate, Inflation Protected Securities, Limited Maturity Obligations, Short Duration Government and Short Duration Income Funds are 0.064%, 0.004%, 0.014%, 0.044%, 0.004%, 0.004% and 0.014% respectively. These Other Expense limitations will remain in place through at least July 29, 2015 (February 28, 2015 for the Limited Maturity Obligations Fund), and prior to such date GSAM may not terminate the arrangements without the approval of the Trustees. The Funds bear their respective share of costs related to proxy and shareholder meetings, and GSAM has agreed to
128
GOLDMAN SACHS SHORT DURATION AND GOVERNMENT FIXED INCOME FUNDS
| 5. AGREEMENTS AND AFFILIATED TRANSACTIONS (continued) |
reimburse each Fund to the extent such expenses exceed a specified percentage of the Fund’s net assets. In addition, the Funds have entered into certain offset arrangements with the custodian and the transfer agent, which may result in a reduction of the Funds’ expenses and are received irrespective of the application of the “Other Expense” limitations described above.
For the six months ended September 30, 2014, these expense reductions, including any fee waivers and Other Expense reimbursements, were as follows:
| Fee Waivers | ||||||||||||||||||||||||||||||
| Fund | Management Fees | Class A Distribution and Service Fees | Class B Distribution and Service Fees | Class C Distribution and Service Fees | Service Class Fees | Other Expense Reimbursements | Total Expense Reimbursements | |||||||||||||||||||||||
Enhanced Income | $ | — | $ | 880 | $ | 344 | N/A | N/A | $ | 61,100 | $ | 62,324 | ||||||||||||||||||
Government Income | 23,987 | — | — | $ | — | $ | — | 285,470 | 309,457 | |||||||||||||||||||||
High Quality Floating Rate | 196,436 | — | — | 393 | 35 | 271,049 | 467,913 | |||||||||||||||||||||||
Inflation Protected Securities | 72,441 | — | N/A | — | N/A | 131,824 | 204,265 | |||||||||||||||||||||||
Limited Maturity Obligations | 3,512 | N/A | N/A | N/A | N/A | 262,363 | 265,875 | |||||||||||||||||||||||
Short Duration Government | 347,714 | — | N/A | 78,794 | — | 339,205 | 765,713 | |||||||||||||||||||||||
Short Duration Income | — | — | N/A | 1,359 | N/A | 216,590 | 217,949 | |||||||||||||||||||||||
G. Line of Credit Facility — As of September 30, 2014, the Funds participated in a $1,080,000,000 committed, unsecured revolving line of credit facility (the “facility”) together with other funds of the Trust and registered investment companies having management agreements with GSAM or its affiliates (“Other Borrowers”). Pursuant to the terms of the facility, the Funds and Other Borrowers could increase the credit amount by an additional $120,000,000, for a total of up to $1,200,000,000. This facility is to be used solely for temporary or emergency purposes, which may include the funding of redemptions. The interest rate on borrowings is based on the federal funds rate. The facility also requires a fee to be paid by the Funds based on the amount of the commitment that has not been utilized. For the six months ended September 30, 2014, the Funds did not have any borrowings under the facility.
H. Other Transactions with Affiliates — For the six months ended September 30, 2014, Goldman Sachs earned approximately $4,884, $18,199, $11,555, $8,408, $64,181 and $33,702 in brokerage commissions from portfolio transactions, including futures transactions executed with Goldman Sachs as the Futures Commission Merchant, on behalf of the Enhanced Income, Government Income, High Quality Floating Rate, Inflation Protected Securities, Short Duration Government, and Short Duration Income Funds, respectively.
As of September 30, 2014, the Goldman Sachs Group, Inc. was a beneficial owner of approximately 5% or more of outstanding Class B, Institutional, Administration, Class IR and Class R Shares of the following funds:
| Fund | Class B | Institutional | Administration | Class IR | Class R | |||||||||||||||||
Enhanced Income | 12 | % | — | % | — | % | — | % | — | % | ||||||||||||
Limited Maturity Obligations | — | 100 | 100 | — | — | |||||||||||||||||
Short Duration Income | — | — | — | 6 | 100 | |||||||||||||||||
129
GOLDMAN SACHS SHORT DURATION AND GOVERNMENT FIXED INCOME FUNDS
Notes to Financial Statements (continued)
September 30, 2014 (Unaudited)
| 6. PORTFOLIO SECURITIES TRANSACTIONS |
The cost of purchases and proceeds from sales and maturities of long-term securities for the six months ended September 30, 2014, were as follows:
| Fund | Purchases of U.S. Government and Agency Obligations | Purchases (Excluding U.S. Government and Agency Obligations) | Sales and Maturities of U.S. Government and Agency Obligations | Sales and Maturities (Excluding U.S. Government and Agency Obligations) | ||||||||||||||
Enhanced Income | $ | 4,399,627 | $ | 81,528,220 | $ | 6,718,080 | $ | 77,438,139 | ||||||||||
Government Income | 1,282,654,788 | 1,091,415 | 1,307,675,752 | 13,896,426 | ||||||||||||||
High Quality Floating Rate | 75,518,467 | 47,566,091 | 56,589,826 | 30,674,716 | ||||||||||||||
Inflation Protected Securities | 89,304,156 | — | 84,780,350 | — | ||||||||||||||
Limited Maturity Obligations | — | 3,336,440 | — | 1,392,000 | ||||||||||||||
Short Duration Government | 989,614,655 | 3,493,718 | 1,082,531,066 | 12,858,714 | ||||||||||||||
Short Duration Income | 73,375,621 | 60,128,726 | 65,124,524 | 36,225,386 | ||||||||||||||
| 7. TAX INFORMATION |
As of the Funds’ most recent fiscal year end, March 31, 2014, the Funds’ capital loss carryfowards and certain timing differences on a tax basis were as follows:
Enhanced Income | Government Income | High Quality Floating Rate | Inflation Protected Securities | Limited Maturity Obligations | Short Duration Government | Short Duration Income | ||||||||||||||||||||||
Capital loss carryforwards |
| |||||||||||||||||||||||||||
Expiring 2015 | $ | (987,433 | ) | $ | — | $ | (4,261,952 | ) | $ | — | $ | — | $ | — | $ | — | ||||||||||||
Expiring 2016 | (2,472,185 | ) | — | — | — | — | — | — | ||||||||||||||||||||
Expiring 2018 | (1,658,767 | ) | — | (21,924,176 | ) | — | — | — | — | |||||||||||||||||||
Expiring 2019 | (9,056,394 | ) | — | (2,415,726 | ) | — | — | — | — | |||||||||||||||||||
Perpetual Short-Term | (2,382,403 | ) | (5,618,043 | ) | — | — | — | (2,346,006 | ) | — | ||||||||||||||||||
Perpetual Long-Term | (1,542,499 | ) | (6,152,124 | ) | (860,379 | ) | (6,742,978 | ) | — | (4,703,634 | ) | (316,723 | ) | |||||||||||||||
Total capital loss carryforwards | $ | (18,099,681 | ) | $ | (11,770,167 | ) | $ | (29,462,233 | ) | $ | (6,742,978 | ) | $ | — | $ | (7,049,640 | ) | $ | (316,723 | ) | ||||||||
Timing differences (Income Distributions Payable, Qualified Late Year and Straddle Loss Deferrals) | $ | (133,915 | ) | $ | (1,178,884 | ) | $ | (1,112,081 | ) | $ | (7,660,537 | ) | $ | — | $ | (3,590,828 | ) | $ | (189,946 | ) | ||||||||
130
GOLDMAN SACHS SHORT DURATION AND GOVERNMENT FIXED INCOME FUNDS
| 7. TAX INFORMATION (continued) |
As of September 30, 2014, the Funds’ aggregate security unrealized gains and losses based on cost for U.S. federal income tax purposes were as follows:
| Enhanced Income | Government Income | High Quality Floating Rate | Inflation Protected Securities | Limited Maturity Obligations | Short Duration Government | Short Duration Income | ||||||||||||||||||||||
Tax Cost | $ | 609,628,578 | $ | 525,097,716 | $ | 490,742,215 | $ | 154,125,244 | $ | 9,938,759 | $ | 1,326,484,801 | $ | 236,369,349 | ||||||||||||||
Gross unrealized gain | 1,227,552 | 10,241,656 | 57,529,822 | 788,571 | 6,149 | 19,159,286 | 1,685,352 | |||||||||||||||||||||
Gross unrealized loss | (796,521 | ) | (2,398,711 | ) | (56,961,903 | ) | (4,697,291 | ) | (1,429 | ) | (4,799,176 | ) | (1,735,074 | ) | ||||||||||||||
Net unrealized gains (losses) | $ | 431,031 | $ | 7,842,945 | $ | 567,919 | $ | (3,908,720 | ) | $ | 4,720 | $ | 14,360,110 | $ | (49,722 | ) | ||||||||||||
The difference between GAAP-basis and tax-basis unrealized gains (losses) is attributable primarily to wash sales and differences related to the tax treatment of inflation protected securities, premium amortization and the accretion of market discount. GSAM has reviewed the Funds’ tax positions for all open tax years (the current and prior three years, as applicable) and has concluded that no provision for income tax is required in the Funds’ financial statements. Such open tax years remain subject to examination and adjustment by tax authorities.
| 8. OTHER RISKS |
The Funds’ risks include, but are not limited to, the following:
Large Shareholder Transactions Risk — A Fund may experience adverse effects when certain large shareholders, such as other funds, institutional investors (including those trading by use of non-discretionary mathematical formulas), financial intermediaries (who may make investment decisions on behalf of underlying clients and/or include a Fund in their investment model), individuals, accounts and Goldman Sachs affiliates, purchase or redeem large amounts of shares of a Fund. Such large shareholder redemptions may cause the Fund to sell portfolio securities at times when it would not otherwise do so, which may negatively impact a Fund’s NAV and liquidity. Similarly, large Fund share purchases may adversely affect a Fund’s performance to the extent that a Fund is delayed in investing new cash and is required to maintain a larger cash position than it ordinarily would. These transactions may also accelerate the realization of taxable income to shareholders if such sales of investments resulted in gains, and may also increase transaction costs. In addition, a large redemption could result in a Fund’s current expenses being allocated over a smaller asset base, leading to an increase in the Fund’s expense ratio.
Liquidity Risk — The Funds may make investments that are illiquid or that may become less liquid in response to market developments or adverse investor perceptions. Illiquid investments may be more difficult to value. Liquidity risk may also refer to the risk that a Fund will not be able to pay redemption proceeds within the allowable time period because of unusual market conditions, an unusually high volume of redemption requests, or other reasons. To meet redemption requests, a Fund may be forced to sell investments at an unfavorable time and/or under unfavorable conditions. Liquidity risk may be the result of, among other things, the reduced number and capacity of traditional market participants to make a market in fixed income securities or the lack of an active market. The potential for liquidity risk may be magnified by a rising interest rate environment or other circumstances where investor redemptions from fixed income mutual funds may be higher than normal, potentially causing increased supply in the market due to selling activity.
131
GOLDMAN SACHS SHORT DURATION AND GOVERNMENT FIXED INCOME FUNDS
Notes to Financial Statements (continued)
September 30, 2014 (Unaudited)
| 8. OTHER RISKS (continued) |
Market and Credit Risks — In the normal course of business, the Funds trade financial instruments and enter into financial transactions where risk of potential loss exists due to changes in the market (market risk). Additionally, the Funds may also be exposed to credit risk in the event that an issuer or guarantor fails to perform or that an institution or entity with which the Funds have unsettled or open transactions defaults.
Investing in foreign markets may involve special risks and considerations not typically associated with investing in the U.S. Foreign securities may be subject to risk of loss because of more or less foreign government regulation, less public information and less economic, political and social stability in the countries in which the Fund invests. Loss may also result from the imposition of exchange controls, confiscations and other government restrictions by the United States or other governments, or from problems in registration, settlement or custody. Foreign risk also involves the risk of negative foreign currency rate fluctuations, which may cause the value of securities denominated in such foreign currency (or other instruments through which the Fund has exposure to foreign currencies) to decline in value. Currency exchange rates may fluctuate significantly over short periods of time. To the extent that the Fund also invests in securities of issuers located in emerging markets, these risks may be more pronounced.
| 9. INDEMNIFICATIONS |
Under the Trust’s organizational documents, its Trustees, officers, employees and agents are indemnified, to the extent permitted by the Act and state law, against certain liabilities that may arise out of performance of their duties to the Funds. Additionally, in the course of business, the Funds enter into contracts that contain a variety of indemnification clauses. The Funds’ maximum exposure under these arrangements is unknown, as this would involve future claims that may be made against the Funds that have not yet occurred. However, GSAM believes the risk of loss under these arrangements to be remote.
| 10. OTHER MATTERS |
At a meeting held on August 13-14, 2014, the Board of Trustees of the Goldman Sachs Trust approved the early conversion of each Fund’s Class B Shares into Class A Shares.
Accordingly, effective at the close of business on November 14, 2014 (the “Conversion Date”), Class B Shares of each Fund will convert to Class A Shares of the Fund, including Class B Shares that are scheduled to convert on a later date. No contingent deferred sales charges (“CDSCs”) will be assessed in connection with this early conversion. In addition, effective October 15, 2014, redemptions of a Fund’s Class B Shares before the Conversion Date will not be subject to a CDSC.
| 11. SUBSEQUENT EVENTS |
Subsequent events after the Statement of Assets and Liabilities date have been evaluated through the date the financial statements were issued. GSAM has concluded that there is no impact requiring adjustment or disclosure in the financial statements.
132
GOLDMAN SACHS SHORT DURATION AND GOVERNMENT FIXED INCOME FUNDS
| 12. SUMMARY OF SHARE TRANSACTIONS |
Share activity is as follows:
| Enhanced Income Fund | ||||||||||||||||
|
| |||||||||||||||
| For the Six Months Ended September 30, 2014 (Unaudited) | For the Fiscal Year Ended March 31, 2014 | |||||||||||||||
|
| |||||||||||||||
| Shares | Dollars | Shares | Dollars | |||||||||||||
|
| |||||||||||||||
| Class A Shares | ||||||||||||||||
Shares sold | 612,217 | $ | 5,796,125 | 4,894,243 | $ | 46,326,428 | ||||||||||
Reinvestment of distributions | 1,069 | 10,117 | 16,404 | 155,323 | ||||||||||||
Shares converted from Class B(a) | 1,200 | 11,356 | 2,998 | 28,386 | ||||||||||||
Shares redeemed | (1,313,115 | ) | (12,428,423 | ) | (5,382,420 | ) | (50,939,041 | ) | ||||||||
| (698,629 | ) | (6,610,825 | ) | (468,775 | ) | (4,428,904 | ) | |||||||||
| Class B Shares | ||||||||||||||||
Reinvestment of distributions | — | — | 4 | 39 | ||||||||||||
Shares converted to Class A(a) | (1,202 | ) | (11,356 | ) | (3,004 | ) | (28,386 | ) | ||||||||
Shares redeemed | (324 | ) | (3,073 | ) | (7,343 | ) | (69,365 | ) | ||||||||
| (1,526 | ) | (14,429 | ) | (10,343 | ) | (97,712 | ) | |||||||||
| Institutional Shares | ||||||||||||||||
Shares sold | 16,760,795 | 158,478,068 | 50,468,155 | 477,241,881 | ||||||||||||
Reinvestment of distributions | 98,227 | 928,909 | 233,157 | 2,205,425 | ||||||||||||
Shares redeemed | (11,842,547 | ) | (112,002,266 | ) | (27,712,680 | ) | (262,077,823 | ) | ||||||||
| 5,016,475 | 47,404,711 | 22,988,632 | 217,369,483 | |||||||||||||
| Administration Shares | ||||||||||||||||
Shares sold | 895 | 8,494 | 5,415 | 51,383 | ||||||||||||
Reinvestment of distributions | 14 | 131 | 86 | 814 | ||||||||||||
Shares redeemed | (3,567 | ) | (33,846 | ) | (7,742 | ) | (73,438 | ) | ||||||||
| (2,658 | ) | (25,221 | ) | (2,241 | ) | (21,241 | ) | |||||||||
| Class IR Shares | ||||||||||||||||
Shares sold | 4,196 | 39,662 | 7,934 | 74,974 | ||||||||||||
Reinvestment of distributions | 90 | 853 | 525 | 4,962 | ||||||||||||
Shares redeemed | (8,082 | ) | (76,460 | ) | (88,655 | ) | (838,567 | ) | ||||||||
| (3,796 | ) | (35,945 | ) | (80,196 | ) | (758,631 | ) | |||||||||
NET INCREASE | 4,309,866 | $ | 40,718,291 | 22,427,077 | $ | 212,062,995 | ||||||||||
| (a) | Class B Shares convert into Class A Shares on or about the fifteenth day of the last month of the calendar quarter that is eight years after the initial purchase date of either the Fund or another Goldman Sachs Fund. At a meeting held on August 13-14, 2014, the Board of Trustees of the Goldman Sachs Trust approved the early conversion of Class B Shares into Class A Shares. Accordingly, effective at the close of business on November 14, 2014, Class B shares will convert to Class A shares of the Fund, and no Contingent Deferred Sales Charges (“CSDCs”) will be assessed in connection with the redemptions of the Fund’s Class B Shares prior to this date. |
133
GOLDMAN SACHS SHORT DURATION AND GOVERNMENT FIXED INCOME FUNDS
Notes to Financial Statements (continued)
September 30, 2014 (Unaudited)
| 12. SUMMARY OF SHARE TRANSACTIONS (continued) |
| Government Income Fund | ||||||||||||||||
|
| |||||||||||||||
| For the Six Months Ended September 30, 2014 (Unaudited) | For the Fiscal Year Ended March 31, 2014 | |||||||||||||||
|
| |||||||||||||||
| Shares | Dollars | Shares | Dollars | |||||||||||||
|
| |||||||||||||||
| Class A Shares | ||||||||||||||||
Shares sold | 1,155,728 | $ | 17,086,483 | 2,526,336 | $ | 37,189,890 | ||||||||||
Reinvestment of distributions | 80,827 | 1,196,313 | 177,461 | 2,602,378 | ||||||||||||
Shares converted from Class B(a) | 13,776 | 203,361 | 43,709 | 640,896 | ||||||||||||
Shares redeemed | (2,069,207 | ) | (30,590,498 | ) | (8,576,221 | ) | (126,188,214 | ) | ||||||||
| (818,876 | ) | (12,104,341 | ) | (5,828,715 | ) | (85,755,050 | ) | |||||||||
| Class B Shares | ||||||||||||||||
Shares sold | 2,733 | 40,404 | 5,065 | 74,813 | ||||||||||||
Reinvestment of distributions | 857 | 12,683 | 2,195 | 32,097 | ||||||||||||
Shares converted to Class A(a) | (13,776 | ) | (203,361 | ) | (43,709 | ) | (640,896 | ) | ||||||||
Shares redeemed | (60,535 | ) | (893,213 | ) | (206,170 | ) | (3,025,108 | ) | ||||||||
| (70,721 | ) | (1,043,487 | ) | (242,619 | ) | (3,559,094 | ) | |||||||||
| Class C Shares | ||||||||||||||||
Shares sold | 67,091 | 992,104 | 156,230 | 2,297,713 | ||||||||||||
Reinvestment of distributions | 2,578 | 38,150 | 5,702 | 83,370 | ||||||||||||
Shares redeemed | (172,226 | ) | (2,545,348 | ) | (836,225 | ) | (12,321,276 | ) | ||||||||
| (102,557 | ) | (1,515,094 | ) | (674,293 | ) | (9,940,193 | ) | |||||||||
| Institutional Shares | ||||||||||||||||
Shares sold | 2,081,829 | 30,736,317 | 10,068,087 | 147,527,737 | ||||||||||||
Reinvestment of distributions | 82,947 | 1,225,860 | 274,034 | 4,012,063 | ||||||||||||
Shares redeemed | (2,801,592 | ) | (41,340,549 | ) | (20,033,256 | ) | (293,431,603 | ) | ||||||||
| (636,816 | ) | (9,378,372 | ) | (9,691,135 | ) | (141,891,803 | ) | |||||||||
| Service Shares | ||||||||||||||||
Shares sold | 1,051,375 | 15,476,154 | 652,854 | 9,556,456 | ||||||||||||
Reinvestment of distributions | 20,363 | 300,569 | 39,502 | 577,592 | ||||||||||||
Shares redeemed | (1,011,948 | ) | (14,905,926 | ) | (2,380,433 | ) | (34,836,291 | ) | ||||||||
| 59,790 | 870,797 | (1,688,077 | ) | (24,702,243 | ) | |||||||||||
| Class IR Shares | ||||||||||||||||
Shares sold | 18,210 | 268,984 | 256,984 | 3,760,295 | ||||||||||||
Reinvestment of distributions | 2,347 | 34,721 | 3,882 | 56,820 | ||||||||||||
Shares redeemed | (37,951 | ) | (561,405 | ) | (77,909 | ) | (1,143,790 | ) | ||||||||
| (17,394 | ) | (257,700 | ) | 182,957 | 2,673,325 | |||||||||||
| Class R Shares | ||||||||||||||||
Shares sold | 176,442 | 2,603,564 | 330,004 | 4,849,401 | ||||||||||||
Reinvestment of distributions | 8,766 | 129,582 | 16,536 | 241,928 | ||||||||||||
Shares redeemed | (116,092 | ) | (1,714,289 | ) | (393,153 | ) | (5,767,019 | ) | ||||||||
| 69,116 | 1,018,857 | (46,613 | ) | (675,690 | ) | |||||||||||
NET DECREASE | (1,517,458 | ) | $ | (22,409,340 | ) | (17,988,495 | ) | $ | (263,850,748 | ) | ||||||
| (a) | Class B Shares convert into Class A Shares on or about the fifteenth day of the last month of the calendar quarter that is eight years after the initial purchase date of either the Fund or another Goldman Sachs Fund. At a meeting held on August 13-14, 2014, the Board of Trustees of the Goldman Sachs Trust approved the early conversion of Class B Shares into Class A Shares. Accordingly, effective at the close of business on November 14, 2014, Class B shares will convert to Class A shares of the Fund, and no Contingent Deferred Sales Charges (“CSDCs”) will be assessed in connection with the redemptions of the Fund’s Class B Shares prior to this date. |
134
GOLDMAN SACHS SHORT DURATION AND GOVERNMENT FIXED INCOME FUNDS
| 12. SUMMARY OF SHARE TRANSACTIONS (continued) |
| High Quality Floating Rate Fund | ||||||||||||||||
|
| |||||||||||||||
| For the Six Months Ended September 30, 2014 (Unaudited) | For the Fiscal Year Ended March 31, 2014 | |||||||||||||||
|
| |||||||||||||||
| Shares | Dollars | Shares | Dollars | |||||||||||||
|
| |||||||||||||||
| Class A Shares | ||||||||||||||||
Shares sold | 865,523 | $ | 7,585,495 | 3,985,815 | $ | 34,999,602 | ||||||||||
Reinvestment of distributions | 4,319 | 37,846 | 12,318 | 108,057 | ||||||||||||
Shares redeemed | (1,118,559 | ) | (9,800,379 | ) | (4,431,261 | ) | (38,865,372 | ) | ||||||||
| (248,717 | ) | (2,177,038 | ) | (433,128 | ) | (3,757,713 | ) | |||||||||
| Institutional Shares | ||||||||||||||||
Shares sold | 25,704,323 | 225,226,154 | 44,276,816 | 388,307,061 | ||||||||||||
Reinvestment of distributions | 91,300 | 799,964 | 110,479 | 968,765 | ||||||||||||
Shares redeemed | (16,208,919 | ) | (142,006,308 | ) | (19,165,085 | ) | (168,047,886 | ) | ||||||||
| 9,586,704 | 84,019,810 | 25,222,210 | 221,227,940 | |||||||||||||
| Service Shares | ||||||||||||||||
Shares sold | — | — | 17,603 | 155,358 | ||||||||||||
Reinvestment of distributions | 7 | 58 | 16 | 145 | ||||||||||||
Shares redeemed | (7,481 | ) | (65,900 | ) | (6,695 | ) | (59,041 | ) | ||||||||
| (7,474 | ) | (65,842 | ) | 10,924 | 96,462 | |||||||||||
| Class IR Shares | ||||||||||||||||
Shares sold | 9,485 | 82,913 | 128,950 | 1,129,336 | ||||||||||||
Reinvestment of distributions | 330 | 2,884 | 752 | 6,584 | ||||||||||||
Shares redeemed | (47,367 | ) | (414,378 | ) | (66,389 | ) | (581,312 | ) | ||||||||
| (37,552 | ) | (328,581 | ) | 63,313 | 554,608 | |||||||||||
NET INCREASE | 9,292,961 | $ | 81,448,349 | 24,863,319 | $ | 218,121,297 | ||||||||||
135
GOLDMAN SACHS SHORT DURATION AND GOVERNMENT FIXED INCOME FUNDS
Notes to Financial Statements (continued)
September 30, 2014 (Unaudited)
| 12. SUMMARY OF SHARE TRANSACTIONS (continued) |
| Inflation Protected Securities Fund | ||||||||||||||||
|
| |||||||||||||||
| For the Six Months Ended September 30, 2014 (Unaudited) | For the Fiscal Year Ended March 31, 2014 | |||||||||||||||
|
| |||||||||||||||
| Shares | Dollars | Shares | Dollars | |||||||||||||
|
| |||||||||||||||
| Class A Shares | ||||||||||||||||
Shares sold | 1,082,224 | $ | 11,342,866 | 2,725,017 | $ | 28,360,212 | ||||||||||
Reinvestment of distributions | 28,891 | 306,094 | 62,076 | 640,962 | ||||||||||||
Shares redeemed | (1,092,448 | ) | (11,454,242 | ) | (5,652,722 | ) | (60,224,329 | ) | ||||||||
| 18,667 | 194,718 | (2,865,629 | ) | (31,223,155 | ) | |||||||||||
| Class C Shares | ||||||||||||||||
Shares sold | 55,235 | 577,823 | 107,102 | 1,140,195 | ||||||||||||
Reinvestment of distributions | 6,318 | 66,743 | 15,752 | 161,132 | ||||||||||||
Shares redeemed | (145,406 | ) | (1,521,815 | ) | (834,360 | ) | (8,833,941 | ) | ||||||||
| (83,853 | ) | (877,249 | ) | (711,506 | ) | (7,532,614 | ) | |||||||||
| Institutional Shares | ||||||||||||||||
Shares sold | 1,627,047 | 17,188,158 | 6,981,756 | 73,839,969 | ||||||||||||
Reinvestment of distributions | 91,900 | 980,092 | 337,580 | 3,502,836 | ||||||||||||
Shares redeemed | (1,319,035 | ) | (13,904,830 | ) | (22,965,291 | ) | (239,868,643 | ) | ||||||||
| 399,912 | 4,263,420 | (15,645,955 | ) | (162,525,838 | ) | |||||||||||
| Class IR Shares | ||||||||||||||||
Shares sold | 24,811 | 260,227 | 97,134 | 1,018,490 | ||||||||||||
Reinvestment of distributions | 2,393 | 25,425 | 4,458 | 46,003 | ||||||||||||
Shares redeemed | (23,299 | ) | (244,991 | ) | (227,274 | ) | (2,407,642 | ) | ||||||||
| 3,905 | 40,661 | (125,682 | ) | (1,343,149 | ) | |||||||||||
| Class R Shares | ||||||||||||||||
Shares sold | 182,173 | 1,912,128 | 390,550 | 4,100,379 | ||||||||||||
Reinvestment of distributions | 5,083 | 53,866 | 5,862 | 59,909 | ||||||||||||
Shares redeemed | (78,310 | ) | (821,752 | ) | (118,781 | ) | (1,240,101 | ) | ||||||||
| 108,946 | 1,144,242 | 277,631 | 2,920,187 | |||||||||||||
NET INCREASE (DECREASE) | 447,577 | $ | 4,765,792 | (19,071,141 | ) | $ | (199,704,569 | ) | ||||||||
136
GOLDMAN SACHS SHORT DURATION AND GOVERNMENT FIXED INCOME FUNDS
| 12. SUMMARY OF SHARE TRANSACTIONS (continued) |
| Limited Maturity Obligations Fund | ||||||||||||||||
| For the Six Months Ended September 30, 2014 (Unaudited) | For the Period Ended March 31, 2014(a) | |||||||||||||||
| Shares | Dollars | Shares | Dollars | |||||||||||||
|
| |||||||||||||||
| Institutional Shares | ||||||||||||||||
Shares sold | — | $ | — | 997,609 | $ | 9,976,082 | ||||||||||
Reinvestment of distributions | 1,633 | 16,332 | — | — | ||||||||||||
Shares redeemed | (106 | ) | (1,063 | ) | (2 | ) | (15 | ) | ||||||||
| 1,527 | 15,269 | 997,607 | 9,976,067 | |||||||||||||
| Administration Shares | ||||||||||||||||
Shares sold | — | — | 2,501 | 25,011 | ||||||||||||
Reinvestment of distributions | 1 | 10 | — | — | ||||||||||||
Shares redeemed | — | — | (1 | ) | (10 | ) | ||||||||||
| 1 | 10 | 2,500 | 25,001 | |||||||||||||
NET INCREASE | 1,528 | $ | 15,279 | 1,000,107 | $ | 10,001,068 | ||||||||||
| (a) | Commenced operations on February 28, 2014. |
137
GOLDMAN SACHS SHORT DURATION AND GOVERNMENT FIXED INCOME FUNDS
Notes to Financial Statements (continued)
September 30, 2014 (Unaudited)
| 12. SUMMARY OF SHARE TRANSACTIONS (continued) |
| Short Duration Government Fund | ||||||||||||||||
| For the Six Months Ended September 30, 2014 (Unaudited) | For the Fiscal Year Ended March 31, 2014 | |||||||||||||||
| Shares | Dollars | Shares | Dollars | |||||||||||||
|
| |||||||||||||||
| Class A Shares | ||||||||||||||||
Shares sold | 2,748,374 | $ | 27,948,942 | 9,832,423 | $ | 100,227,635 | ||||||||||
Reinvestment of distributions | 103,675 | 1,054,395 | 225,275 | 2,296,239 | ||||||||||||
Shares converted from Class B(a) | — | — | 718 | 7,314 | ||||||||||||
Shares redeemed | (6,471,519 | ) | (65,806,893 | ) | (28,818,164 | ) | (294,007,732 | ) | ||||||||
| (3,619,470 | ) | (36,803,556 | ) | (18,759,748 | ) | (191,476,544 | ) | |||||||||
| Class B Shares(b) | ||||||||||||||||
Reinvestment of distributions | — | — | 24 | 243 | ||||||||||||
Shares converted to Class A(a) | — | — | (721 | ) | (7,314 | ) | ||||||||||
Shares redeemed | — | — | (25,422 | ) | (258,313 | ) | ||||||||||
| — | — | (26,119 | ) | (265,384 | ) | |||||||||||
| Class C Shares | ||||||||||||||||
Shares sold | 126,831 | 1,281,325 | 566,290 | 5,734,163 | ||||||||||||
Reinvestment of distributions | 7,569 | 76,462 | 15,243 | 154,345 | ||||||||||||
Shares redeemed | (762,119 | ) | (7,699,568 | ) | (2,630,085 | ) | (26,636,769 | ) | ||||||||
| (627,719 | ) | (6,341,781 | ) | (2,048,552 | ) | (20,748,261 | ) | |||||||||
| Institutional Shares | ||||||||||||||||
Shares sold | 14,435,544 | 146,379,352 | 56,626,168 | 575,385,195 | ||||||||||||
Reinvestment of distributions | 561,706 | 5,695,436 | 1,020,467 | 10,367,205 | ||||||||||||
Shares redeemed | (17,861,058 | ) | (181,081,667 | ) | (65,773,753 | ) | (668,465,272 | ) | ||||||||
| (2,863,808 | ) | (29,006,879 | ) | (8,127,118 | ) | (82,712,872 | ) | |||||||||
| Service Shares | ||||||||||||||||
Shares sold | 228,427 | 2,313,069 | 314,187 | 3,188,151 | ||||||||||||
Reinvestment of distributions | 11,917 | 120,616 | 24,640 | 250,005 | ||||||||||||
Shares redeemed | (416,905 | ) | (4,220,591 | ) | (1,749,532 | ) | (17,750,133 | ) | ||||||||
| (176,561 | ) | (1,786,906 | ) | (1,410,705 | ) | (14,311,977 | ) | |||||||||
| Class IR Shares | ||||||||||||||||
Shares sold | 351,241 | 3,574,966 | 1,220,294 | 12,445,835 | ||||||||||||
Reinvestment of distributions | 9,812 | 99,876 | 19,359 | 197,483 | ||||||||||||
Shares redeemed | (349,108 | ) | (3,553,996 | ) | (1,860,378 | ) | (18,978,154 | ) | ||||||||
| 11,945 | 120,846 | (620,725 | ) | (6,334,836 | ) | |||||||||||
NET DECREASE | (7,275,613 | ) | $ | (73,818,276 | ) | (30,992,967 | ) | $ | (315,849,874 | ) | ||||||
| (a) | Class B Shares convert into Class A Shares on or about the fifteenth day of the last month of the calendar quarter that is eight years after the initial purchase date of either the Fund or another Goldman Sachs Fund. At a meeting held on August 13-14, 2014, the Board of Trustees of the Goldman Sachs Trust approved the early conversion of Class B Shares into Class A Shares. Accordingly, effective at the close of business on November 14, 2014, Class B shares will convert to Class A shares of the Fund, and no Contingent Deferred Sales Charges (“CSDCs”) will be assessed in connection with the redemptions of the Fund’s Class B Shares prior to this date. |
| (b) | Short Duration Government Class B Shares liquidated on March 17, 2014. |
138
GOLDMAN SACHS SHORT DURATION AND GOVERNMENT FIXED INCOME FUNDS
| 12. SUMMARY OF SHARE TRANSACTIONS (continued) |
| Short Duration Income Fund | ||||||||||||||||
| For the Six Months Ended September 30, 2014 (Unaudited) | For the Fiscal Year Ended March 31, 2014 | |||||||||||||||
| Shares | Dollars | Shares | Dollars | |||||||||||||
|
| |||||||||||||||
| Class A Shares | ||||||||||||||||
Shares sold | 268,524 | $ | 2,729,539 | 222,549 | $ | 2,251,401 | ||||||||||
Reinvestment of distributions | 1,815 | 18,444 | 1,900 | 19,277 | ||||||||||||
Shares redeemed | (98,034 | ) | (997,151 | ) | (81,093 | ) | (821,224 | ) | ||||||||
| 172,305 | 1,750,832 | 143,356 | 1,449,454 | |||||||||||||
| Class C Shares | ||||||||||||||||
Shares sold | 38,378 | 390,447 | 52,903 | 536,957 | ||||||||||||
Reinvestment of distributions | 354 | 3,602 | 424 | 4,300 | ||||||||||||
Shares redeemed | (710 | ) | (7,217 | ) | (15,018 | ) | (152,674 | ) | ||||||||
| 38,022 | 386,832 | 38,309 | 388,583 | |||||||||||||
| Institutional Shares | ||||||||||||||||
Shares sold | 9,205,048 | 93,748,712 | 17,058,301 | 173,339,220 | ||||||||||||
Reinvestment of distributions | 162,572 | 1,654,897 | 181,670 | 1,846,300 | ||||||||||||
Shares redeemed | (2,178,941 | ) | (22,190,402 | ) | (8,650,438 | ) | (87,883,820 | ) | ||||||||
| 7,188,679 | 73,213,207 | 8,589,533 | 87,301,700 | |||||||||||||
| Class IR Shares | ||||||||||||||||
Shares sold | — | — | 16,438 | 166,425 | ||||||||||||
Reinvestment of distributions | 154 | 1,568 | 185 | 1,888 | ||||||||||||
Shares redeemed | (1,587 | ) | (16,155 | ) | (11,306 | ) | (115,553 | ) | ||||||||
| (1,433 | ) | (14,587 | ) | 5,317 | 52,760 | |||||||||||
| Class R Shares | ||||||||||||||||
Reinvestment of distributions | 5 | 58 | 11 | 105 | ||||||||||||
NET INCREASE | 7,397,578 | $ | 75,336,342 | 8,776,526 | $ | 89,192,602 | ||||||||||
139
GOLDMAN SACHS SHORT DURATION AND GOVERNMENT FIXED INCOME FUNDS
Fund Expenses — Six Month Period Ended September 30, 2014 (Unaudited)
As a shareholder of Class A, Class B, Class C, Institutional, Service, Class IR, Class R or Administration Shares of a Fund, you incur two types of costs: (1) transaction costs, including sales charges on purchase payments (with respect to Class A Shares), contingent deferred sales charges on redemptions (with respect to Class B and Class C Shares), and (2) ongoing costs, including management fees; distribution and service (12b-1) fees (with respect to Class A, Class B, Class C and Class R Shares); and other Fund expenses. This Example is intended to help you understand your ongoing costs (in dollars) of investing in Class A, Class B, Class C, Institutional, Service, Class IR, Class R or Administration Shares of the Funds and to compare these costs with the ongoing costs of investing in other mutual funds.
The Example is based on an investment of $1,000 invested at the beginning of the period and held for the entire period from April 1, 2014 (February 28, 2014 for Limited Maturity Obligations Fund) through September 30, 2014.
Actual Expenses — The first line under each share class in the table below provides information about actual account values and actual expenses. You may use the information in this line, together with the amount you invested, to estimate the expenses that you paid over the period. Simply divide your account value by $1,000 (for example, an $8,600 account value divided by $1,000=8.6), then multiply the result by the number in the first line under the heading entitled “Expenses Paid” to estimate the expenses you paid on your account during this period.
Hypothetical Example for Comparison Purposes — The second line under each share class in the table below provides information about hypothetical account values and hypothetical expenses based on the Funds’ actual net expense ratios and an assumed rate of return of 5% per year before expenses, which is not the Funds’ actual return. The hypothetical account values and expenses may not be used to estimate the actual ending account balance or expenses you paid for the period. You may use this information to compare the ongoing costs of investing in the Funds and other funds. To do so, compare this 5% hypothetical example with the 5% hypothetical examples that appear in the shareholder reports of the other funds.
Please note that the expenses shown in the table are meant to highlight your ongoing costs only and do not reflect any transactional costs, such as sales charges, redemption fees, or exchange fees. Therefore, the second line of the table is useful in comparing ongoing costs only, and will not help you determine the relative total costs of owning different funds. In addition, if these transactional costs were included, your costs would have been higher.
| Enhanced Income Fund | Government Income Fund | High Quality Floating Rate Fund | Inflation Protected Securities Fund | |||||||||||||||||||||||||||||||||||||||||||||
| Share Class | Beginning Account Value 4/1/14 | Ending Account Value 9/30/14 | Expenses Paid for the | Beginning Account Value 4/1/14 | Ending Account Value 9/30/14 | Expenses Paid for the 6 months ended 9/30/14* | Beginning Account Value 4/1/14 | Ending Account Value 9/30/14 | Expenses Paid for the 6 months ended 9/30/14* | Beginning Account Value 4/1/14 | Ending Account Value 9/30/14 | Expenses Paid for the 6 months ended 9/30/14* | ||||||||||||||||||||||||||||||||||||
| Class A | ||||||||||||||||||||||||||||||||||||||||||||||||
Actual | $ | 1,000.00 | $ | 998.20 | $ | 3.46 | $ | 1,000.00 | $ | 1,015.60 | $ | 4.65 | $ | 1,000.00 | $ | 1,000.90 | $ | 3.51 | $ | 1,000.00 | $ | 1,014.00 | $ | 3.33 | ||||||||||||||||||||||||
Hypothetical 5% return | 1,000.00 | 1,021.61 | + | 3.50 | 1,000.00 | 1,020.46 | + | 4.66 | 1,000.00 | 1,021.56 | + | 3.55 | 1,000.00 | 1,021.76 | + | 3.35 | ||||||||||||||||||||||||||||||||
| Class B | ||||||||||||||||||||||||||||||||||||||||||||||||
Actual | 1,000.00 | 999.00 | 3.71 | 1,000.00 | 1,011.80 | 8.42 | N/A | N/A | N/A | N/A | N/A | N/A | ||||||||||||||||||||||||||||||||||||
Hypothetical 5% return | 1,000.00 | 1,021.36 | + | 3.75 | 1,000.00 | 1,016.70 | + | 8.44 | N/A | N/A | N/A | N/A | N/A | N/A | ||||||||||||||||||||||||||||||||||
| Class C | ||||||||||||||||||||||||||||||||||||||||||||||||
Actual | N/A | N/A | N/A | 1,000.00 | 1,011.80 | 8.42 | N/A | N/A | N/A | 1,000.00 | 1,010.50 | 7.11 | ||||||||||||||||||||||||||||||||||||
Hypothetical 5% return | N/A | N/A | N/A | 1,000.00 | 1,016.70 | + | 8.44 | N/A | N/A | N/A | 1,000.00 | 1,018.00 | + | 7.13 | ||||||||||||||||||||||||||||||||||
| Institutional | ||||||||||||||||||||||||||||||||||||||||||||||||
Actual | 1,000.00 | 1,000.90 | 1.76 | 1,000.00 | 1,018.10 | 2.93 | 1,000.00 | 1,001.50 | 1.86 | 1,000.00 | 1,015.20 | 1.62 | ||||||||||||||||||||||||||||||||||||
Hypothetical 5% return | 1,000.00 | 1,023.31 | + | 1.78 | 1,000.00 | 1,022.16 | + | 2.94 | 1,000.00 | 1,023.21 | + | 1.88 | 1,000.00 | 1,023.46 | + | 1.62 | ||||||||||||||||||||||||||||||||
| Service | ||||||||||||||||||||||||||||||||||||||||||||||||
Actual | N/A | N/A | N/A | 1,000.00 | 1,014.90 | 5.46 | 1,000.00 | 999.20 | 4.16 | N/A | N/A | N/A | ||||||||||||||||||||||||||||||||||||
Hypothetical 5% return | N/A | N/A | N/A | 1,000.00 | 1,019.65 | + | 5.47 | 1,000.00 | 1,020.91 | + | 4.20 | N/A | N/A | N/A | ||||||||||||||||||||||||||||||||||
| Class IR | ||||||||||||||||||||||||||||||||||||||||||||||||
Actual | 1,000.00 | 1,000.40 | 2.26 | 1,000.00 | 1,016.90 | 3.39 | 1,000.00 | 1,010.00 | 2.32 | 1,000.00 | 1,014.90 | 2.07 | ||||||||||||||||||||||||||||||||||||
Hypothetical 5% return | 1,000.00 | 1,022.81 | + | 2.28 | 1,000.00 | 1,021.71 | + | 3.40 | 1,000.00 | 1,022.76 | + | 2.33 | 1,000.00 | 1,023.01 | + | 2.08 | ||||||||||||||||||||||||||||||||
| Class R | ||||||||||||||||||||||||||||||||||||||||||||||||
Actual | N/A | N/A | N/A | 1,000.00 | 1,014.40 | 5.91 | N/A | N/A | N/A | 1,000.00 | 1,012.20 | 4.64 | ||||||||||||||||||||||||||||||||||||
Hypothetical 5% return | N/A | N/A | N/A | 1,000.00 | 1,019.20 | + | 5.92 | N/A | N/A | N/A | 1,000.00 | 1,020.46 | + | 4.66 | ||||||||||||||||||||||||||||||||||
| Administration | ||||||||||||||||||||||||||||||||||||||||||||||||
Actual | 1,000.00 | 999.60 | 3.06 | N/A | N/A | — | N/A | N/A | — | N/A | N/A | — | ||||||||||||||||||||||||||||||||||||
Hypothetical 5% return | 1,000.00 | 1,022.01 | + | 3.09 | N/A | N/A | N/A | N/A | N/A | N/A | N/A | N/A | N/A | |||||||||||||||||||||||||||||||||||
| * | Expenses for each share class are calculated using each Fund’s annualized net expense ratio for each class, which represents the ongoing expenses as a percentage of net assets for the six months ended September 30, 2014. Expenses are calculated by multiplying the annualized net expense ratio by the average account value for the period; then multiplying the result by the number of days in the most recent fiscal half year; and then dividing that result by the number of days in the fiscal year. The annualized net expense ratios for the period were as follows: |
140
GOLDMAN SACHS SHORT DURATION AND GOVERNMENT FIXED INCOME FUNDS
Fund Expenses — Six Month Period Ended September 30, 2014 (Unaudited) (continued)
| Limited Maturity Obligations Fund | Short Duration Government Fund | Short Duration Income Fund | ||||||||||||||||||||||||||||||||||
| Share Class | Beginning Account Value 4/1/14 | Ending Account Value 9/30/14 | Expenses Paid for the 6 months ended 9/30/14* | Beginning Value | Ending Value | Expenses Paid for the 6 months ended 9/30/14* | Beginning Value | Ending Value | Expenses Paid for the 6 months ended 9/30/14* | |||||||||||||||||||||||||||
| Class A | ||||||||||||||||||||||||||||||||||||
Actual | $ | N/A | $ | N/A | $ | N/A | $ | 1,000.00 | $ | 1,002.40 | $ | 4.12 | $ | 1,000.00 | $ | 1,003.80 | $ | 3.97 | ||||||||||||||||||
Hypothetical 5% return | N/A | N/A | N/A | 1,000.00 | 1,020.96 | + | 4.15 | 1,000.00 | 1,021.11 | + | 4.00 | |||||||||||||||||||||||||
| Class B | ||||||||||||||||||||||||||||||||||||
Actual | N/A | N/A | N/A | N/A | N/A | N/A | N/A | N/A | N/A | |||||||||||||||||||||||||||
Hypothetical 5% return | N/A | N/A | N/A | N/A | N/A | + | N/A | N/A | N/A | N/A | ||||||||||||||||||||||||||
| Class C | ||||||||||||||||||||||||||||||||||||
Actual | N/A | N/A | N/A | 1,000.00 | 1,000.40 | 6.12 | 1,000.00 | 1,001.80 | 6.02 | |||||||||||||||||||||||||||
Hypothetical 5% return | N/A | N/A | N/A | 1,000.00 | 1,018.95 | + | 6.17 | 1,000.00 | 1,019.05 | + | 6.07 | |||||||||||||||||||||||||
| Institutional | ||||||||||||||||||||||||||||||||||||
Actual | 1,000.00 | 1,001.60 | 0.95 | 1,000.00 | 1,004.10 | 2.41 | 1,000.00 | 1,005.60 | 2.31 | |||||||||||||||||||||||||||
Hypothetical 5% return | 1,000.00 | 1,024.12 | + | 0.96 | 1,000.00 | 1,022.66 | + | 2.43 | 1,000.00 | 1,022.76 | + | 2.33 | ||||||||||||||||||||||||
| Service | ||||||||||||||||||||||||||||||||||||
Actual | N/A | N/A | N/A | 1,000.00 | 1,001.60 | 4.92 | N/A | N/A | N/A | |||||||||||||||||||||||||||
Hypothetical 5% return | N/A | N/A | N/A | 1,000.00 | 1,020.15 | + | 4.96 | N/A | N/A | N/A | ||||||||||||||||||||||||||
| Class IR | ||||||||||||||||||||||||||||||||||||
Actual | N/A | N/A | N/A | 1,000.00 | 1,003.70 | 2.86 | 1,000.00 | 1,005.10 | 2.76 | |||||||||||||||||||||||||||
Hypothetical 5% return | N/A | N/A | N/A | 1,000.00 | 1,022.21 | + | 2.89 | 1,000.00 | 1,022.31 | + | 2.79 | |||||||||||||||||||||||||
| Class R | ||||||||||||||||||||||||||||||||||||
Actual | N/A | N/A | N/A | N/A | N/A | N/A | 1,000.00 | 1,002.60 | 5.12 | |||||||||||||||||||||||||||
Hypothetical 5% return | N/A | N/A | N/A | N/A | N/A | N/A | 1,000.00 | 1,019.95 | + | 5.16 | ||||||||||||||||||||||||||
| Administration | ||||||||||||||||||||||||||||||||||||
Actual | 1,000.00 | 1,000.40 | 0.05 | N/A | N/A | N/A | N/A | N/A | N/A | |||||||||||||||||||||||||||
Hypothetical 5% return | 1,000.00 | 1,025.02 | + | 0.05 | N/A | N/A | N/A | N/A | N/A | N/A | ||||||||||||||||||||||||||
| * | Expenses for each share class are calculated using each Fund’s annualized net expense ratio for each class, which represents the ongoing expenses as a percentage of net assets for the six months ended September 30, 2014. Expenses are calculated by multiplying the annualized net expense ratio by the average account value for the period; then multiplying the result by the number of days in the most recent fiscal half year; and then dividing that result by the number of days in the fiscal year. The annualized net expense ratios for the period were as follows: |
| Fund | Class A | Class B | Class C | Institutional | Service | Class IR | Class R | Administration | ||||||||||||||||||||||||
Enhanced Income | 0.69 | % | 0.74 | % | N/A | 0.35 | % | N/A | 0.45 | % | N/A | 0.61 | % | |||||||||||||||||||
Government Income | 0.92 | 1.67 | 1.67 | % | 0.58 | 1.08 | % | 0.67 | 1.17 | % | N/A | |||||||||||||||||||||
High Quality Floating Rate | 0.70 | N/A | N/A | 0.37 | 0.83 | 0.46 | N/A | N/A | ||||||||||||||||||||||||
Inflation Protected Securities | 0.66 | N/A | 1.41 | 0.32 | N/A | 0.41 | 0.92 | N/A | ||||||||||||||||||||||||
Limited Maturity Obligations Fund | N/A | N/A | N/A | 0.19 | N/A | N/A | N/A | 0.39 | ||||||||||||||||||||||||
Short Duration Government Fund | 0.82 | N/A | 1.22 | 0.48 | 0.98 | 0.57 | N/A | N/A | ||||||||||||||||||||||||
Short Duration Income | 0.79 | N/A | 1.20 | 0.46 | N/A | 0.55 | 1.02 | N/A | ||||||||||||||||||||||||
| + | Hypothetical expenses are based on each Fund’s actual annualized net expense ratios and an assumed rate of return of 5% per year before expenses. |
141
GOLDMAN SACHS SHORT DURATION AND GOVERNMENT FIXED INCOME FUNDS
Statement Regarding Basis for Approval of Management Agreements (Unaudited)
Background
The Goldman Sachs Enhanced Income Fund, Goldman Sachs Government Income Fund, Goldman Sachs High Quality Floating Rate Fund, Goldman Sachs Inflation Protected Securities Fund, Goldman Sachs Short Duration Government Fund, and Goldman Sachs Short Duration Income Fund (the “Funds”) are investment portfolios of Goldman Sachs Trust (the “Trust”). The Board of Trustees oversees the management of the Trust and reviews the investment performance and expenses of the Funds at regularly scheduled meetings held during the year. In addition, the Board of Trustees determines annually whether to approve the continuance of the Trust’s investment management agreements (the “Management Agreements”) with Goldman Sachs Asset Management, L.P. (the “Investment Adviser”) on behalf of the Funds.
The Management Agreements were most recently approved for continuation until June 30, 2015 by the Board of Trustees, including those Trustees who are not parties to the Management Agreements or “interested persons” (as defined in the Investment Company Act of 1940, as amended) of any party thereto (the “Independent Trustees”), at a meeting held on June 11-12, 2014 (the “Annual Meeting”).
The review process undertaken by the Trustees spans the course of the year and culminates with the Annual Meeting. To assist the Trustees in their deliberations, the Trustees have established a Contract Review Committee (the “Committee”), comprised of the Independent Trustees. The Committee held four meetings over the course of the year since the Management Agreements were last approved. At those Committee meetings, regularly scheduled Board or other committee meetings and/or the Annual Meeting, the Board, or the Independent Trustees, as applicable, considered matters relating to the Management Agreements, including:
| (a) | the nature and quality of the advisory, administrative and other services provided to the Funds by the Investment Adviser and its affiliates, including information about: |
| (i) | the structure, staff and capabilities of the Investment Adviser and its portfolio management teams; |
| (ii) | the groups within the Investment Adviser and its affiliates that support the portfolio management teams or provide other types of necessary services, including fund services groups (e.g., accounting and financial reporting, tax, shareholder services and operations), controls and risk management groups (e.g., legal, compliance, valuation oversight, credit risk management, internal audit, compliance testing, market risk analysis, finance and strategy and central funding), sales and distribution support groups and others (e.g., information technology and training); |
| (iii) | trends in headcount; |
| (iv) | the Investment Adviser’s financial resources and ability to hire and retain talented personnel and strengthen its operations; and |
| (v) | the parent company’s support of the Investment Adviser and its mutual fund business, as expressed by the firm’s senior management; |
| (b) | information on the investment performance of each Fund, including comparisons to the performance of similar mutual funds, as provided by a third party mutual fund data provider engaged as part of the contract review process (the “Outside Data Provider”), benchmark performance indices, and (in the case of the Enhanced Income, Short Duration Government, and Short Duration Income Funds) comparable institutional composites managed by the Investment Adviser, and general investment outlooks in the markets in which the Funds invest; |
| (c) | the terms of the Management Agreements and agreements with affiliated service providers entered into by the Trust on behalf of the Funds; |
| (d) | expense information for the Funds, including: |
| (i) | the relative management fee and expense levels of each Fund as compared to those of comparable funds managed by other advisers, as provided by the Outside Data Provider; |
| (ii) | each Fund’s expense trends over time; and |
| (iii) | to the extent the Investment Adviser manages institutional accounts or collective investment vehicles having investment objectives and policies similar to those of the Funds, comparative information on the advisory fees charged and services provided to those accounts by the Investment Adviser; |
| (e) | with respect to the extensive investment performance and expense comparison data provided by the Outside Data Provider, its processes in producing that data for the Funds; |
| (f) | the undertakings of the Investment Adviser and its affiliates to waive certain fees (with respect to each Fund other than the Enhanced Income Fund) and to limit certain expenses of each Fund that exceed specified levels, and a summary of contractual fee reductions made by the Investment Adviser and/or its affiliates over the past several years with respect to the Funds; |
| (g) | information relating to the profitability of the Management Agreements and the transfer agency and distribution and service arrangements of each Fund and the Trust as a whole to the Investment Adviser and its affiliates; |
142
GOLDMAN SACHS SHORT DURATION AND GOVERNMENT FIXED INCOME FUNDS
Statement Regarding Basis for Approval of Management Agreements (Unaudited) (continued)
| (h) | whether each Fund’s existing management fee schedule adequately addressed any economies of scale; |
| (i) | a summary of the “fall-out” benefits derived by the Investment Adviser and its affiliates from their relationships with the Funds, including the fees received by the Investment Adviser’s affiliates from the Funds for transfer agency, portfolio trading, distribution and other services; |
| (j) | a summary of potential benefits derived by the Funds as a result of their relationship with the Investment Adviser; |
| (k) | information regarding portfolio trading and how the Investment Adviser carries out its duty to seek best execution; |
| (l) | portfolio manager ownership of Fund shares; the manner in which portfolio manager compensation is determined; and the number and types of accounts managed by the portfolio managers; |
| (m) | the nature and quality of the services provided to the Funds by their unaffiliated service providers, and the Investment Adviser’s general oversight and evaluation (including reports on due diligence) of those service providers as part of the administration services provided under the Management Agreements; and |
| (n) | the Investment Adviser’s processes and policies addressing various types of potential conflicts of interest; its approach to risk management; the annual review of the effectiveness of the Funds’ compliance program; and periodic compliance reports. |
The Trustees also received an overview of the Funds’ distribution arrangements. They received information regarding the Funds’ assets, share purchase and redemption activity and the payment of Rule 12b-1 distribution and service fees by the Funds and the payment of non-Rule 12b-1 shareholder service and/or administration fees by those Funds offering Service or Administration Shares. Information was also provided to the Trustees relating to revenue sharing payments made by and services provided by the Investment Adviser and its affiliates to intermediaries that promote the sale, distribution and/or servicing of Fund shares.
The presentations made at the Board and Committee meetings and at the Annual Meeting encompassed the Funds and other mutual fund portfolios for which the Board of Trustees has responsibility. In evaluating the Management Agreements at the Annual Meeting, the Trustees relied upon their knowledge, resulting from their meetings and other interactions throughout the year, of the Investment Adviser, its affiliates, their services and the Funds. In conjunction with these meetings, the Trustees received written materials and oral presentations on the topics covered, and were advised by their independent legal counsel regarding their responsibilities and other regulatory requirements related to the approval and continuation of mutual fund investment management agreements under applicable law. In addition, the Investment Adviser and its affiliates provided the Independent Trustees with a written response to a formal request for information sent on behalf of the Independent Trustees by their independent legal counsel. During the course of their deliberations, the Independent Trustees met in executive sessions with their independent legal counsel, without representatives of the Investment Adviser or its affiliates present. The Independent Trustees also discussed the broad range of other investment choices that are available to Fund investors, including the availability of comparable funds managed by other advisers.
Nature, Extent and Quality of the Services Provided Under the Management Agreements
As part of their review, the Trustees considered the nature, extent and quality of the services provided by the Investment Adviser. In this regard, the Trustees considered both the investment advisory services and non-advisory services that are provided to the Funds by the Investment Adviser and its affiliates. The Trustees noted the transition in the leadership and changes in personnel of various of the Investment Adviser’s portfolio management teams that had occurred in recent periods, and the ongoing recruitment efforts aimed at bringing high quality investment talent to the Investment Adviser. They also noted the Investment Adviser’s commitment to maintaining high quality systems. The Trustees concluded that the Investment Adviser continued to commit substantial financial and operational resources to the Funds and expressed confidence that the Investment Adviser would continue to do so in the future. The Trustees also recognized that the Investment Adviser had made significant commitments to address regulatory compliance requirements applicable to the Funds and the Investment Adviser.
Investment Performance
The Trustees also considered the investment performance of the Funds. In this regard, they compared the investment performance of each Fund to its peers using rankings and ratings (rankings only for the Short Duration Income Fund) compiled by the Outside Data Provider as of December 31, 2013, and updated performance information prepared by the Investment Adviser using the peer groups identified by the Outside Data Provider as of March 31, 2014. The information on each Fund’s investment performance was provided for the one-, three-, five- and ten-year periods ending on the applicable dates, to the extent that each Fund had been in existence for those periods. The Trustees also reviewed each Fund’s investment performance over time (including on a year-by-year basis) relative to its performance benchmark. As part of this review, they considered the investment performance trends of the Funds over time, and reviewed the investment performance of each Fund in light of its investment
143
GOLDMAN SACHS SHORT DURATION AND GOVERNMENT FIXED INCOME FUNDS
Statement Regarding Basis for Approval of Management Agreements (Unaudited) (continued)
objective and policies and market conditions. The Trustees also received information comparing the Enhanced Income, Short Duration Government, and Short Duration Income Funds’ performance to that of composites of institutional accounts managed by the Investment Adviser having comparable investment characteristics.
In addition, the Trustees considered materials prepared and presentations made by the Investment Adviser’s senior management and portfolio management personnel, in which Fund performance was assessed. The Trustees also considered the Investment Adviser’s periodic reports with respect to the Funds’ risk profiles, and how the Investment Adviser’s approach to risk monitoring and management influences portfolio management.
The Trustees observed that the Enhanced Income Fund’s Class A Shares had placed in the third quartile of the Fund’s peer group for the five- and ten-year periods and in the fourth quartile for the one- and three-year periods, and had outperformed the Fund’s benchmark index for the five-year period and underperformed for the one-, three-, and ten-year periods ended March 31, 2014. They noted changes to the Enhanced Income Fund’s investment strategy in December 2013 designed to provide the Fund with additional security selection opportunities and improved diversification, by decreasing the Fund’s minimum eligible security rating to BBB. The Trustees noted that the Government Income Fund’s Class A Shares had placed in the second quartile of the Fund’s peer group for the one-, three-, and five-year periods and in the third quartile for the ten-year period, and had performed in-line with the Fund’s benchmark index for the five-year period and underperformed for the one-, three, and ten-year periods ended March 31, 2014. They observed that the High Quality Floating Rate Fund’s Class A Shares had placed in the fourth quartile of the Fund’s peer group for the one-, three-, five-, and ten-year periods, and had outperformed the Fund’s benchmark index for the five-year period and underperformed for the one-, three-, and ten-year periods ended March 31, 2014. The Trustees observed that the Inflation Protected Securities Fund’s Class A Shares had placed in the top half of the Fund’s peer group and had underperformed the Fund’s benchmark index for the one-, three-, and five-year periods ended March 31, 2014. They noted that the Short Duration Government Fund’s Class A Shares had placed in the top half of the Fund’s peer group for the one- and ten-year periods and in the third quartile for the three- and five-year periods, and had outperformed the Fund’s benchmark index for the five- and ten-year periods and underperformed for the one- and three-year periods ended March 31, 2014. They observed that the Short Duration Income Fund’s Class A Shares had placed in the first quartile of the Fund’s peer group and had outperformed the Fund’s benchmark index for the one-year period ended March 31, 2014.
Costs of Services Provided and Competitive Information
The Trustees considered the contractual terms of the Management Agreements and the fee rates payable by each applicable Fund thereunder. In this regard, the Trustees considered information on the services rendered by the Investment Adviser to the Funds, which included both advisory and administrative services that were directed to the needs and operations of the Funds as registered mutual funds.
In particular, the Trustees reviewed analyses prepared by the Outside Data Provider regarding the expense rankings of the Funds. The analyses provided a comparison of the Funds’ management fees and breakpoints to those of relevant peer groups and category universes; an expense analysis which compared each Fund’s overall net and gross expenses to a peer group and a category universe; and a five-year history (or, in the case of Funds that commenced investment operations within a shorter period, since the year in which it commenced operations) comparing each Fund’s net expenses to the peer and category medians. The analyses also compared each Fund’s transfer agency, custody, and distribution fees, other expenses and fee waivers/reimbursements to those of the peer group and category medians. The Trustees concluded that the comparisons provided by the Outside Data Provider were useful in evaluating the reasonableness of the management fees and total expenses paid by the Funds.
In addition, the Trustees considered the Investment Adviser’s undertakings to waive a portion of the management fees payable by the Funds (with the exception of the Enhanced Income Fund) and to limit certain expenses of the Funds that exceed specified levels, as well as the undertakings of Goldman, Sachs & Co. (“Goldman Sachs”), the Funds’ distributor and transfer agent, to waive a portion of the distribution and service fees paid by the Short Duration Government and Short Duration Income Funds’ Class C Shares. The Trustees also noted that certain changes were being made to existing fee waiver or expense limitation arrangements of the Inflation Protected Securities Fund that would have the effect of increasing total Fund expenses, with such changes taking effect in connection with the Fund’s next annual registration statement update. They also considered, to the extent that the Investment Adviser manages institutional accounts or collective investment vehicles having investment objectives and policies similar to those of the Funds, comparative fee information for services provided by the Investment Adviser to those accounts, and information that indicated that services provided to the Funds differed in various significant respects from the services provided to institutional accounts, which generally operated under less stringent legal and regulatory structures, required fewer services from the Investment Adviser to a smaller number of client contact points, were less time-intensive and paid lower fees.
144
GOLDMAN SACHS SHORT DURATION AND GOVERNMENT FIXED INCOME FUNDS
Statement Regarding Basis for Approval of Management Agreements (Unaudited) (continued)
In addition, the Trustees noted that shareholders are able to redeem their Fund shares at any time if shareholders believe that the Fund fees and expenses are too high or if they are dissatisfied with the performance of the Fund.
Profitability
The Trustees reviewed the Investment Adviser’s revenues and pre-tax profit margins with respect to the Trust and each of the Funds. In this regard the Trustees noted that they had received, among other things, profitability analyses and summaries, revenue and expense schedules by Fund and by function (i.e., investment management, transfer agency and distribution and service) and information on the Investment Adviser’s expense allocation methodology. They observed that the profitability and expense figures are substantially similar to those used by the Investment Adviser for many internal purposes, including compensation decisions among various business groups, and are thus subject to a vigorous internal debate about how certain revenue and expenses should be allocated. The Trustees also noted that the internal audit group within the Goldman Sachs organization had audited the expense allocation methodology and was satisfied with the reasonableness, consistency, and accuracy of the Investment Adviser’s expense allocation methodology and profitability analysis calculations. Profitability data for the Trust and each Fund were provided for 2013 and 2012, and the Trustees considered this information in relation to the Investment Adviser’s overall profitability. The Trustees considered the Investment Adviser’s revenues and pre-tax profit margins both in absolute terms and in comparison to information on the reported pre-tax profit margins earned by certain other asset management firms.
Economies of Scale
The Trustees considered the information that had been provided regarding the Investment Adviser’s profitability. The Trustees also considered the breakpoints in the fee rate payable under the Management Agreements for each of the Funds at the following annual percentage rates of the average daily net assets of the Funds:
| Average Daily Net Assets | Enhanced Fund | Government Fund | High Quality Floating Rate Fund | Inflation Protected Securities Fund | Short Duration Government Fund | Short Fund | ||||||||||||||||||
| First $1 billion | 0.25 | % | 0.54 | % | 0.40 | % | 0.33 | % | 0.50 | % | 0.40 | % | ||||||||||||
| Next $1 billion | 0.23 | 0.49 | 0.36 | 0.30 | 0.45 | 0.36 | ||||||||||||||||||
| Next $3 billion | 0.22 | 0.47 | 0.34 | 0.28 | 0.43 | 0.34 | ||||||||||||||||||
| Next $3 billion | 0.22 | 0.46 | 0.33 | 0.27 | 0.42 | 0.33 | ||||||||||||||||||
| Over $8 billion | 0.22 | 0.45 | 0.32 | 0.26 | 0.41 | 0.32 | ||||||||||||||||||
The Trustees noted that the breakpoints were meant to share potential economies of scale, if any, with the Funds and their shareholders as assets under management reach those asset levels. The Trustees considered the amounts of assets in the Funds; the Funds’ recent share purchase and redemption activity; the information provided by the Investment Adviser relating to the costs of the services provided by the Investment Adviser and its affiliates and their realized profits; information comparing fee rates charged by the Investment Adviser with fee rates charged to other funds in the peer groups; and the Investment Adviser’s undertakings to waive a portion of the management fees payable by the Funds (with the exception of the Enhanced Income Fund) and to limit certain expenses of the Funds that exceed specified levels. Upon reviewing these matters at the Annual Meeting, the Trustees concluded that the fee breakpoints represented a means of assuring that benefits of scalability, if any, would be passed along to shareholders at the specified asset levels. They also noted that the Investment Adviser had passed along savings to shareholders of the Short Duration Government Fund, which had asset levels above at least the first breakpoint during the prior fiscal year.
Other Benefits to the Investment Adviser and Its Affiliates
The Trustees also considered the other benefits derived by the Investment Adviser and its affiliates from their relationships with the Funds as stated above, including: (a) transfer agency fees received by Goldman Sachs; (b) futures commissions earned by Goldman Sachs for executing futures transactions on behalf of the Funds; (c) trading efficiencies resulting from aggregation of orders of the Funds with those for other funds or accounts managed by the Investment Adviser; (d) the Investment Adviser’s ability to leverage the infrastructure designed to service the Funds on behalf of its other clients; (e) the Investment Adviser’s ability to cross-market other products and services to Fund shareholders; (f) Goldman Sachs’ retention of certain fees as Fund Distributor; (g) the Investment Adviser’s ability to negotiate better pricing with custodians on behalf of its other clients, as a result of the relationship with the Funds; and (h) the possibility that the working relationship between the Investment Adviser and the Funds’ third party service providers may cause those service providers to be more likely to do business with other areas of Goldman
145
GOLDMAN SACHS SHORT DURATION AND GOVERNMENT FIXED INCOME FUNDS
Statement Regarding Basis for Approval of Management Agreements (Unaudited) (continued)
Sachs. In the course of considering the foregoing, the Independent Trustees requested and received further information quantifying certain of these fall-out benefits.
Other Benefits to the Funds and Their Shareholders
The Trustees also noted that the Funds receive certain potential benefits as a result of their relationship with the Investment Adviser, including: (a) trading efficiencies resulting from aggregation of orders of the Funds with those of other funds or accounts managed by the Investment Adviser; (b) enhanced servicing from vendors because of the volume of business generated by the Investment Adviser and its affiliates; (c) enhanced servicing from broker-dealers because of the volume of business generated by the Investment Adviser and its affiliates; (d) the Investment Adviser’s ability to negotiate favorable terms with derivatives counterparties on behalf of the Funds as a result of the size and reputation of the Goldman Sachs organization; (e) the Investment Adviser’s knowledge and experience gained from managing other accounts and products; (f) the Investment Adviser’s ability to hire and retain qualified personnel to provide services to the Funds because of the reputation of the Goldman Sachs organization; (g) the Funds’ access, through the Investment Adviser, to certain firmwide resources (e.g., proprietary risk management systems and databases), subject to certain restrictions; and (h) the Funds’ access to certain affiliated distribution channels. In addition, the Trustees noted the competitive nature of the mutual fund marketplace, and considered that many of the Funds’ shareholders invested in the Funds in part because of the Funds’ relationship with the Investment Adviser and that those shareholders have a general expectation that the relationship will continue.
Conclusion
In connection with their consideration of the Management Agreements, the Trustees gave weight to each of the factors described above, but did not identify any particular factor as controlling their decision. After deliberation and consideration of all of the information provided, including the factors described above, the Trustees concluded, in the exercise of their business judgment, that the management fees paid by each of the Funds were reasonable in light of the services provided to it by the Investment Adviser, the Investment Adviser’s costs and each Fund’s current and reasonably foreseeable asset levels. The Trustees unanimously concluded that the Investment Adviser’s continued management likely would benefit each Fund and its shareholders and that the Management Agreements should be approved and continued with respect to each applicable Fund until June 30, 2015.
146
GOLDMAN SACHS SHORT DURATION AND GOVERNMENT FIXED INCOME FUNDS
Statement Regarding Basis for Approval of Management Agreement for Limited Maturity Obligations Fund (Unaudited)
Background
The Goldman Sachs Limited Maturity Obligations Fund (the “Fund”) is a newly-organized investment portfolio of Goldman Sachs Trust (the “Trust”) that commenced investment operations on February 28, 2014. At a meeting held on December 18-19, 2013 (the “Meeting”) in connection with the Fund’s organization, the Trustees, including all of the Trustees present who are not parties to the Fund’s investment management agreement (the “Management Agreement”) or “interested persons” (as defined in the Investment Company Act of 1940, as amended) of any party thereto (the “Independent Trustees”) approved the Management Agreement with Goldman Sachs Asset Management, L.P. (the “Investment Adviser”).
At the Meeting, the Trustees reviewed the Management Agreement, including information regarding the terms of the Management Agreement; the nature, extent and quality of the Investment Adviser’s anticipated services; the fees and expenses to be paid by the Fund; a comparison of the Fund’s proposed management fees and anticipated expenses with those paid by other similar mutual funds; the Investment Adviser’s proposals to waive a portion of its management fee and limit certain expenses of the Fund that exceed a specified level, and the proposal of Goldman, Sachs & Co. (“Goldman Sachs”), the Fund’s transfer agent, to waive a portion of its transfer agency fee; and potential benefits to be derived by the Investment Adviser and its affiliates from their relationships with the Fund. Various information was also provided at a prior meeting at which the Fund was discussed.
In connection with the Meeting, the Trustees received written materials and oral presentations on the topics covered, and were advised by their independent legal counsel regarding their responsibilities under applicable law. In evaluating the Management Agreement at the Meeting, the Trustees relied upon information included in a presentation made by the Investment Adviser at the Meeting and information received at prior Board meetings, as well as on their knowledge of the Investment Adviser resulting from their meetings and other interactions over time.
Nature, Extent and Quality of the Services Provided Under the Management Agreement
As part of their review, the Trustees considered the nature, extent and quality of the services to be provided by the Investment Adviser. In this regard, the Trustees considered both the investment advisory services and non-advisory services that would be provided to the Fund by the Investment Adviser and its affiliates. The Trustees also considered information about the Fund’s structure, investment objective, strategies and other characteristics. The Trustees noted the experience and capabilities of the portfolio management team. The Trustees concluded that the Investment Adviser would be able to commit substantial financial and other resources to the Fund. In this regard, the Trustees noted that, although the Fund was new (and therefore had no performance data to evaluate), the Investment Adviser had experience managing other short duration fixed income and money market funds that employed similar investment strategies. The Trustees concluded that the Investment Adviser’s management of the Fund likely would benefit the Fund and its shareholders.
Costs of Services to be Provided and Profitability
The Trustees considered the contractual terms of the Management Agreement and the fee rates payable by the Fund thereunder. In this regard, the Trustees considered information on the services to be rendered by the Investment Adviser to the Fund, which included both advisory and administrative services that were directed to the needs and operations of the Fund as a registered mutual fund.
In particular, the Trustees reviewed information on the proposed management fee and the Fund’s projected total operating expense ratios (both gross and net of the fee waiver and expense limitations), and those were compared to similar information for comparable mutual funds advised by other, unaffiliated investment management firms, as well as the peer group and category medians. The comparisons of the Fund’s fee rates and total operating expense ratios were prepared by a third-party provider of mutual fund data. The Trustees believed that this information was useful in evaluating the reasonableness of the management fees and total expenses expected to be paid by the Fund.
The Trustees considered the Investment Adviser’s undertakings to waive a portion of its management fee and limit certain expenses of the Fund that exceed a specified level, and Goldman Sachs’ undertaking to waive a portion of its transfer agency fee. In addition, the Trustees recognized that there was not yet profitability data to evaluate for the Fund, but considered the Investment Adviser’s representations that (i) such data would be provided after the Fund commenced operations, and (ii) the Fund was not expected to be profitable to the Investment Adviser and its affiliates initially.
The Trustees noted the competitive nature of the fund marketplace, and that many of the Fund’s shareholders would be investing in the Fund in part because of the Fund’s relationship with the Investment Adviser. They also noted that shareholders would be able to redeem their Fund shares if they believe that the Fund fees and expenses are too high or if they are dissatisfied with the performance of the Fund.
147
GOLDMAN SACHS SHORT DURATION AND GOVERNMENT FIXED INCOME FUNDS
Statement Regarding Basis for Approval of Management Agreement for Limited Maturity Obligations Fund (Unaudited) (continued)
Economies of Scale
The Trustees noted that the Fund does not have management fee breakpoints and that the Fund’s proposed management fee is comparable to that of other money market funds advised by the Investment Adviser. They considered the projected asset levels of the Fund; information comparing the contractual fee rates charged by the Investment Adviser with fee rates charged to other funds in the peer group; and the Investment Adviser’s undertakings to waive a portion of its management fee and limit certain expenses of the Fund that exceed a specified level, as well as Goldman Sachs’ undertaking to waive a portion of its transfer agency fee. The Trustees also considered the competitive nature of the fund business and the competitiveness of the fees charged to the Fund by the Investment Adviser.
Other Benefits to the Investment Adviser and Its Affiliates
The Trustees also considered the other benefits expected to be derived by the Investment Adviser and its affiliates from their relationship with the Fund, including: (a) transfer agency fees received by Goldman Sachs; (b) trading efficiencies resulting from aggregation of orders of the Fund with those for other funds or accounts managed by the Investment Adviser; (c) the Investment Adviser’s ability to leverage the infrastructure designed to service the Fund on behalf of its other clients; (d) the Investment Adviser’s ability to cross-market other products and services to Fund shareholders; (e) Goldman Sachs’ retention of certain fees as Fund Distributor; (f) the Investment Adviser’s ability to negotiate better pricing with custodians on behalf of its other clients, as a result of the relationship with the Fund; and (g) the possibility that the working relationship between the Investment Adviser and the Fund’s third party service providers may cause those service providers to be open to doing business with other areas of Goldman Sachs.
Conclusion
In connection with their consideration of the Management Agreement for the Fund at the Meeting, the Trustees gave weight to various factors, but did not identify any particular factor as controlling their decision. After deliberation and consideration of the information provided, including the factors described above, the Trustees concluded, in the exercise of their business judgment, that the management fee that would be payable by the Fund was reasonable in light of the services to be provided to it by the Investment Adviser, the Investment Adviser’s anticipated costs and the Fund’s reasonably anticipated asset levels. The Trustees unanimously concluded that the Investment Adviser’s management likely would benefit the Fund and its shareholders and that the Management Agreement should be approved with respect to the Fund.
148
FUNDS PROFILE
Goldman Sachs Funds

Goldman Sachs is a premier financial services firm, known since 1869 for creating thoughtful and customized investment solutions in complex global markets.
Today, the Investment Management Division of Goldman Sachs serves a diverse set of clients worldwide, including private institutions, public entities and individuals. With approximately $999.2 billion in assets under supervision as of September 30, 2014, Goldman Sachs Asset Management (“GSAM”) has portfolio management teams located around the world and our investment professionals bring firsthand knowledge of local markets to every investment decision. Assets under supervision includes assets under management and other client assets for which Goldman Sachs does not have full discretion. GSAM leverages the resources of Goldman, Sachs & Co. subject to legal, internal and regulatory restrictions.

Money Market1
Financial Square FundsSM
| n | Financial Square Tax-Exempt Funds |
| n | Financial Square Federal Fund |
| n | Financial Square Government Fund |
| n | Financial Square Money Market Fund |
| n | Financial Square Prime Obligations Fund |
| n | Financial Square Treasury Instruments Fund |
| n | Financial Square Treasury Obligations Fund |
Fixed Income
Short Duration and Government
| n | Enhanced Income Fund |
| n | High Quality Floating Rate Fund |
| n | Limited Maturity Obligations Fund |
| n | Short Duration Government Fund |
| n | Short Duration Income Fund |
| n | Government Income Fund |
| n | Inflation Protected Securities Fund |
Multi-Sector
| n | Core Fixed Income Fund |
| n | Bond Fund2 |
| n | Global Income Fund |
| n | Strategic Income Fund |
| n | World Bond Fund |
Municipal and Tax-Free
| n | High Yield Municipal Fund |
| n | Municipal Income Fund |
| n | Short Duration Tax-Free Fund |
Single Sector
| n | Investment Grade Credit Fund |
| n | U.S. Mortgages Fund |
| n | High Yield Fund |
| n | High Yield Floating Rate Fund |
| n | Emerging Markets Debt Fund |
| n | Local Emerging Markets Debt Fund |
| n | Dynamic Emerging Markets Debt Fund |
Fixed Income Alternatives
| n | Long Short Credit Strategies Fund3 |
| n | Fixed Income Macro Strategies Fund |
Fundamental Equity
| n | Growth and Income Fund |
| n | Small Cap Value Fund |
| n | Small/Mid Cap Value Fund |
| n | Mid Cap Value Fund |
| n | Large Cap Value Fund |
| n | Capital Growth Fund |
| n | Strategic Growth Fund |
| n | Focused Growth Fund |
| n | Small/Mid Cap Growth Fund |
| n | Flexible Cap Growth Fund |
| n | Concentrated Growth Fund |
| n | Technology Tollkeeper Fund |
| n | Growth Opportunities Fund |
| n | Rising Dividend Growth Fund |
| n | U.S. Equity Fund |
| n | Income Builder Fund |
Tax-Advantaged Equity
| n | U.S. Tax-Managed Equity Fund4 |
| n | International Tax-Managed Equity Fund4 |
| n | U.S. Equity Dividend and Premium Fund |
| n | International Equity Dividend and Premium Fund |
Equity Insights
| n | Small Cap Equity Insights Fund |
| n | U.S. Equity Insights Fund |
| n | Small Cap Growth Insights Fund |
| n | Large Cap Growth Insights Fund |
| n | Large Cap Value Insights Fund |
| n | Small Cap Value Insights Fund |
| n | International Small Cap Insights Fund |
| n | International Equity Insights Fund |
| n | Emerging Markets Equity Insights Fund |
Fundamental Equity International
| n | Strategic International Equity Fund |
| n | Focused International Equity Fund5 |
| n | International Small Cap Fund |
| n | Asia Equity Fund |
| n | Emerging Markets Equity Fund |
| n | BRIC Fund (Brazil, Russia, India, China) |
| n | N-11 Equity Fund |
Select Satellite6
| n | Real Estate Securities Fund |
| n | International Real Estate Securities Fund |
| n | Commodity Strategy Fund |
| n | Dynamic Commodity Strategy Fund |
| n | Dynamic Allocation Fund |
| n | Absolute Return Tracker Fund |
| n | Long Short Fund |
| n | Managed Futures Strategy Fund |
| n | MLP Energy Infrastructure Fund |
| n | Multi-Manager Alternatives Fund |
| n | Multi-Asset Real Return Fund |
| n | Retirement Portfolio Completion Fund |
| n | Tactical Tilt Implementation Fund |
Total Portfolio Solutions6
| n | Balanced Strategy Portfolio |
| n | Growth and Income Strategy Portfolio |
| n | Growth Strategy Portfolio |
| n | Equity Growth Strategy Portfolio |
| n | Satellite Strategies Portfolio |
| n | Enhanced Dividend Global Equity Portfolio |
| n | Tax Advantaged Global Equity Portfolio |
| 1 | An investment in a money market fund is neither insured nor guaranteed by the Federal Deposit Insurance Corporation (“FDIC”) or any other government agency. Although the Funds seek to preserve the value of your investment at $1.00 per share, it is possible to lose money by investing in the Funds. |
| 2 | Effective on October 1, 2014, the Goldman Sachs Core Plus Fixed Income Fund was renamed the Goldman Sachs Bond Fund. |
| 3 | Effective at the close of business on March 21, 2014, the Goldman Sachs Credit Strategies Fund was reorganized with and into the Goldman Sachs Long Short Credit Strategies Fund. |
| 4 | Effective on April 30, 2014, the Goldman Sachs Structured Tax-Managed Equity and Structured International Tax-Managed Equity Funds were renamed the Goldman Sachs U.S. Tax-Managed Equity and International Tax-Managed Equity Funds, respectively. |
| 5 | Effective at the close of business on February 28, 2014, the Goldman Sachs Concentrated International Equity Fund was renamed the Goldman Sachs Focused International Equity Fund. |
| 6 | Individual Funds within the Total Portfolio Solutions and Select Satellite categories will have various placement on the risk/return spectrum and may have greater or lesser risk than that indicated by the placement of the general Total Portfolio Solutions or Select Satellite category. |
Financial Square FundsSM is a registered service mark of Goldman, Sachs & Co.
| *This | list covers open-end funds only. Please visit our website at www.GSAMFUNDS.com to learn about our closed-end funds. |
TRUSTEES Ashok N. Bakhru, Chairman John P. Coblentz, Jr. Diana M. Daniels Joseph P. LoRusso Herbert J. Markley James A. McNamara Jessica Palmer Alan A. Shuch Richard P. Strubel Roy W. Templin | OFFICERS James A. McNamara, President Scott M. McHugh, Principal Financial Officer and Treasurer Caroline Kraus, Secretary | |
GOLDMAN, SACHS & CO. Distributor and Transfer Agent | GOLDMAN SACHS ASSET MANAGEMENT, L.P. Investment Adviser | |
Visit our website at www.GSAMFUNDS.com to obtain the most recent month-end returns.
Goldman Sachs Asset Management, L.P., 200 West Street, New York, New York 10282
The reports concerning the Funds included in this shareholder report may contain certain forward-looking statements about the factors that may affect the performance of the Funds in the future. These statements are based on Fund management’s predictions and expectations concerning certain future events and their expected impact on the Funds, such as performance of the economy as a whole and of specific industry sectors, changes in the levels of interest rates, the impact of developing world events, and other factors that may influence the future performance of the Funds. Management believes these forward-looking statements to be reasonable, although they are inherently uncertain and difficult to predict. Actual events may cause adjustments in portfolio management strategies from those currently expected to be employed.
A description of the policies and procedures that the Funds use to determine how to vote proxies relating to portfolio securities and information regarding how a Fund voted proxies relating to portfolio securities during the most recent 12-month period ended June 30 is available (i) without charge, upon request by calling 1-800-526-7384 (for Retail Shareholders) or 1-800-621-2550 (for Institutional Shareholders); and (ii) on the Securities and Exchange Commission web site at http://www.sec.gov.
The Funds file their complete schedule of portfolio holdings with the Securities and Exchange Commission (“SEC”) for the first and third quarters of each fiscal year on Form N-Q. The Funds’ Forms N-Q are available on the SEC’s web site at http://www.sec.gov within 60 days after the Funds’ first and third fiscal quarters. The Funds’ Forms N-Q may be reviewed and copied at the SEC’s Public Reference Room in Washington, D.C., and information on the operation of the Public Reference Room may also be obtained by calling 1-800-SEC-0330. Forms N-Q may be obtained upon request and without charge by calling 1-800-526-7384 (for Retail Shareholders) or 1-800-621-2550 (for Institutional Shareholders).
Fund holdings and allocations shown are as of September 30, 2014 and may not be representative of future investments. Fund holdings should not be relied on in making investment decisions and should not be construed as research or investment advice regarding particular securities. Current and future holdings are subject to risk.
The portfolio risk management process includes an effort to monitor and manage risk, but does not imply low risk.
Economic and market forecasts presented herein reflect our judgment as of the date of this presentation and are subject to change without notice. These forecasts do not take into account the specific investment objectives, restrictions, tax and financial situation or other needs of any specific client. Actual data will vary and may not be reflected here. These forecasts are subject to high levels of uncertainty that may affect actual performance. Accordingly, these forecasts should be viewed as merely representative of a broad range of possible outcomes. These forecasts are estimated, based on assumptions, and are subject to significant revision and may change materially as economic and market conditions change. Goldman Sachs has no obligation to provide updates or changes to these forecasts. Case studies and examples are for illustrative purposes only.
This material is not authorized for distribution to prospective investors unless preceded or accompanied by a current Prospectus or summary prospectus, if applicable. Investors should consider a Fund’s objective, risks, and charges and expenses, and read the summary prospectus, if available, and/or the Prospectus carefully before investing or sending money. The summary prospectus, if available, and the Prospectus contain this and other information about a Fund and may be obtained from your authorized dealer or from Goldman, Sachs & Co. by calling (retail – 1-800-526-7384) (institutional – 1-800-621-2550).
© 2014 Goldman Sachs. All rights reserved. 146231.MF.MED.TMPL/11/2014 SDFISAR-14/26K
| ITEM 2. | CODE OF ETHICS. |
The information required by this Item is only required in an annual report on this Form N-CSR.
| ITEM 3. | AUDIT COMMITTEE FINANCIAL EXPERT. |
The information required by this Item is only required in an annual report on this Form N-CSR.
| ITEM 4. | PRINCIPAL ACCOUNTANT FEES AND SERVICES. |
The information required by this Item is only required in an annual report on this Form N-CSR.
| ITEM 5. | AUDIT COMMITTEE OF LISTED REGISTRANTS. |
| Not applicable. |
| ITEM 6. | SCHEDULE OF INVESTMENTS. |
| Schedule of Investments is included as part of the Report to Stockholders filed under Item 1. |
| ITEM 7. | DISCLOSURE OF PROXY VOTING POLICIES AND PROCEDURES FOR CLOSED-END MANAGEMENT INVESTMENT COMPANIES. |
| Not applicable. |
| ITEM 8. | PORTFOLIO MANAGERS OF CLOSED-END MANAGEMENT INVESTMENT COMPANIES. |
| Not applicable. |
| ITEM 9. | PURCHASES OF EQUITY SECURITIES BY CLOSED-END MANAGEMENT INVESTMENT COMPANY AND AFFILIATED PURCHASERS. |
| Not applicable. |
| ITEM 10. | SUBMISSION OF MATTERS TO A VOTE OF SECURITY HOLDERS. |
| There have been no material changes to the procedures by which shareholders may recommend nominees to the registrant’s board of trustees. |
| ITEM 11. | CONTROLS AND PROCEDURES. |
| (a) | The registrant’s principal executive and principal financial officers, or persons performing similar functions have concluded that the registrant’s disclosure controls and procedures (as defined in Rule 30a-3(c) under the Investment Company Act of 1940, as amended (the “1940 Act”)) are effective as of a date within 90 days of the filing of this report that includes the disclosure required by this paragraph, based on the evaluation of these controls and procedures required by Rule 30a-3(b) under the 1940 Act and 15d-15(b) under the Securities Exchange Act of 1934, as amended. |
| (b) | There were no changes in the registrant’s internal control over financial reporting (as defined in Rule 30a-3(d) under the 1940 Act) that occurred during the registrant’s second fiscal quarter of the period covered by this report that have materially affected, or are reasonably likely to materially affect, the registrant’s internal control over financial reporting. |
| ITEM 12. | EXHIBITS. |
| (a)(1) | The information required by this Item is only required in connection with an annual report on this Form N-CSR. | |||
| (a)(2) | Exhibit 99.CERT | Certifications pursuant to Section 302 of the Sarbanes-Oxley Act of 2002 filed herewith. | ||
| (b) | Exhibit 99.906CERT | Certifications pursuant to Section 906 of the Sarbanes-Oxley Act of 2002 filed herewith. | ||
SIGNATURES
Pursuant to the requirements of the Securities Exchange Act of 1934 and the Investment Company Act of 1940, the registrant has duly caused this report to be signed on its behalf by the undersigned, thereunto duly authorized.
| Goldman Sachs Trust | ||
| By: | /s/ James A. McNamara | |
| ||
James A. McNamara | ||
| President/Principal Executive Officer | ||
| Goldman Sachs Trust | ||
| Date: | December 3, 2014 | |
Pursuant to the requirements of the Securities Exchange Act of 1934 and the Investment Company Act of 1940, this report has been signed below by the following persons on behalf of the registrant and in the capacities and on the dates indicated.
| By: | /s/ James A. McNamara | |
| ||
James A. McNamara | ||
| President/Principal Executive Officer | ||
| Goldman Sachs Trust | ||
| Date: | December 3, 2014 | |
| By: | /s/ Scott McHugh | |
| ||
Scott McHugh | ||
| Principal Financial Officer | ||
| Goldman Sachs Trust | ||
| Date: | December 3, 2014 | |