EX-99.(17)(c)
Goldman Sachs Funds

| Annual Report | October 31, 2014 | |||
Fundamental International Equity Funds | ||||
Focused International Equity* | ||||
International Small Cap | ||||
Strategic International Equity | ||||
*Effective at the close of business on February 28, 2014, the Goldman Sachs Concentrated International Equity Fund was renamed to the Goldman Sachs Focused International Equity Fund.

Goldman Sachs Fundamental International Equity Funds
| n | FOCUSED INTERNATIONAL EQUITY |
| n | INTERNATIONAL SMALL CAP |
| n | STRATEGIC INTERNATIONAL EQUITY |
TABLE OF CONTENTS | ||||
| 3 | ||||
| 4 | ||||
| 5 | ||||
| 7 | ||||
| 28 | ||||
| 36 | ||||
| 40 | ||||
| 46 | ||||
| 60 | ||||
| 61 | ||||
| NOT FDIC-INSURED | May Lose Value | No Bank Guarantee | ||
GOLDMAN SACHS FUNDAMENTAL INTERNATIONAL EQUITY FUNDS
Principal Investment Strategies and Risks
This is not a complete list of risks that may affect the Funds. For additional information concerning the risks applicable to the Funds, please see the Funds’ Prospectus.
The Goldman Sachs Focused International Equity Fund (formerly, Concentrated International Equity Fund) invests primarily in a diversified portfolio of equity investments in companies that are organized outside the United States or whose securities are principally traded outside the United States. The Fund is subject to market risk, which means that the value of the securities in which it invests may go up or down in response to the prospects of individual companies, particular sectors and/or general economic conditions. Foreign and emerging markets investments may be more volatile and less liquid than investments in U.S. securities and are subject to the risks of currency fluctuations and adverse economic or political developments. Because the Fund may invest in a relatively small number of issuers, the Fund is subject to greater risk of loss.
The Goldman Sachs International Small Cap Fund invests primarily in a diversified portfolio of equity investments in non-U.S. small-capitalization companies. The Fund is subject to market risk, which means that the value of the securities in which it invests may go up or down in response to the prospects of individual companies, particular sectors and/or general economic conditions. Foreign and emerging markets investments may be more volatile and less liquid than investments in U.S. securities and are subject to the risks of currency fluctuations and adverse economic or political developments. The securities of mid- and small-capitalization companies involve greater risks than those associated with larger, more established companies and may be subject to more abrupt or erratic price movements.
The Goldman Sachs Strategic International Equity Fund invests primarily in a diversified portfolio of equity investments in companies that are organized outside the United States or whose securities are principally traded outside the United States. The Fund’s equity investments are subject to market risk, which means that the value of the securities in which it invests may go up or down in response to the prospects of individual companies, particular sectors and/or general economic conditions. Foreign and emerging markets investments may be more volatile and less liquid than investments in U.S. securities and are subject to the risks of currency fluctuations and adverse economic or political developments.
3
GOLDMAN SACHS FUNDAMENTAL INTERNATIONAL EQUITY FUNDS
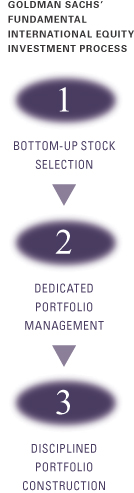
What Differentiates Goldman Sachs’ Fundamental International Equity Investment Process?
Goldman Sachs’ Fundamental International Equity investment process is based on the belief that strong, consistent results are best achieved through expert stock selection, performed by research teams working together on a global scale. Our deep, diverse and experienced team of research analysts and portfolio managers combines local insights with global, industry-specific expertise to identify its high conviction investment ideas.

| n | Fundamental research teams based in the United States, United Kingdom, Japan, China, Korea, Singapore, Brazil, and India and focusing on long-term business and management quality |
| n | Analysts collaborate regularly to leverage regional and industry-specific research and insights |
| n | Global perspective is informed by local market expertise |
| n | A common valuation framework, focusing on long-term earnings power, ensures consistency when valuing and comparing a company to its peers globally |

| n | Team of experienced Research Analysts is regionally aligned and has sector expertise |
| n | Team leverages the research of the approximately 80+ regional investment professionals |
| n | Decision-making process is informed by active participation in the global research process |

| n | Security selections are aligned with level of investment conviction |
| n | Risk monitoring considers whether investment and other risks to the Funds are intended and justified |
| n | Dedicated portfolio construction team assists in ongoing monitoring and adjustment of the Funds |

International equity portfolios that strive to offer:
| n | Access to markets across the world |
| n | Disciplined approach to stock selection |
| n | Optimal risk/return profiles |
4
MARKET REVIEW
Goldman Sachs Fundamental International Equity Funds
International equities declined modestly during the 12-month period ended October 31, 2014 (the “Reporting Period”). The Morgan Stanley Capital International (MSCI) Europe, Australasia, Far East (EAFE) Index (Net, USD, Unhedged) (the “MSCI EAFE Index”) posted an average annual total return of -0.60%.*
Stock markets in Japan and Europe reached new highs as late as December 2013. Japan’s Nikkei 225 Stock Average closed the calendar year at a six-year high, as the market reflected optimism about Prime Minister Shinzo Abe’s bold reforms and big stimulus. (The Nikkei 225 Stock Average is the leading and most respected index of Japanese stocks. It is a price-weighted index comprised of Japan’s top 225 blue chip companies on the Tokyo Stock Exchange.) Germany’s Xetra Dax also reached a new high in December 2013, as European equity markets continued to benefit from the European Central Bank’s (“ECB”) commitment to easy monetary policy and as economic growth returned to the region. (The Xetra Dax is a blue chip index in Germany that tracks the performance of the 30 most actively traded stocks on the Frankfurt Stock Exchange.)
International developed equity markets, however, stumbled in January 2014, as renewed concerns about a variety of issues in the growth and emerging markets weighed on performance, particularly in the Asia ex-Japan region. International developed equity markets rebounded in February 2014, but performance was relatively weak for the rest of the Reporting Period, as news from the developed markets was mixed.
The Eurozone economy grew at a stronger than expected 0.5% year-over-year rate for the fourth quarter of 2013, but growth then disappointed year to date through October 31, 2014. Purchasing Managers Index (“PMI”) data began to soften early in 2014; the Ifo survey of German business confidence began dropping; and Germany reduced its economic growth estimates. Further, deflation in the region remained a threat during the second half of the Reporting Period. Many corporate earnings reports and conservative guidance from management teams prompted downward revisions to estimates, even though in the end, most companies met or beat the revised estimates. The ECB cut its benchmark interest rate to 0.05%, reduced its bank deposit rate to -0.2% and announced it would begin to buy asset-backed securities. In contrast, economic data for the U.K. improved, particularly in terms of unemployment. In turn, markets began to anticipate the Bank of England might raise its interest rates by the end of 2014.
Similarly, Japanese equities got 2014 off to a weak start in anticipation of its consumption tax hike implemented in April 2014. Japanese equities then rallied back later in the Reporting Period as a number of economic indicators were more encouraging. Inflation in Japan continued to trend higher, and market sentiment improved as Prime Minister Abe revealed more details regarding corporate reform. Also, Japan’s manufacturing PMI rose to its highest level since March 2014, while the October 2014 Tankan survey of business sentiment was unexpectedly upbeat and revealed that large firms intend to increase spending. The Bank of Japan announced further monetary easing measures.
Performance of the Asia ex-Japan region generally improved through the second half of the Reporting Period. Indeed, the region posted the best performance within the MSCI EAFE Index for the full Reporting Period, largely due to the particularly strong performance of Hong Kong equities.
| *All | index returns are expressed in U.S. dollar terms. |
5
MARKET REVIEW
Looking Ahead
As we look toward the final quarter of 2014, it appears to us that the overall global economy continues to improve, though with growing regional variations. We expect a stronger macroeconomic environment to drive revenue and earnings growth. As equities appear to reach new heights in many markets, we believe the pace of their ascent is likely to slow, but we continue to believe that equity returns may look attractive versus other asset classes given what we consider to be their still above-average equity risk premium and reasonable valuations in light of growth prospects.
We see several main drivers of equity markets, including growth spending and structural reforms. In addition, we believe global consumption has the potential to be a significant driver of economies and equity markets both in the near and longer term. We believe a number of factors that have depressed consumer sentiment and spending in many regions could be reversing soon. We also believe the growth of the middle class and consumption in Asia and the emerging markets will likely be an important secular theme for several years. In our view, consumer behavior is likely to not only affect the consumer sectors but will also likely have a strong impact on the health care and information technology sectors, among others. Similarly, we believe increasing consumer spending in Asia and the emerging markets could have a significant impact on U.S., European and Japanese companies as well as on domestic companies.
At the end of the Reporting Period, we were watching for signs of market excess, such as ballooning market capitalizations, the number and quality of initial public offerings (“IPOs”), and valuations that may no longer be connected to fundamentals. We also believe that while many central banks still have a bias toward easing, the U.S. Federal Reserve (the “Fed”) is moving in the opposite direction. Lastly, in our view, currency is increasingly becoming an issue for companies, economies and equity markets. We believe a strengthening U.S. dollar could be a headwind for the U.S. economy and companies with foreign sales, such as many information technology companies. In contrast, in our opinion, Europe and Japan could benefit significantly from currency weakness.
As regions, countries, equity markets and companies differentiate themselves with revenue and earnings growth, we believe fundamental active managers have an excellent opportunity to similarly differentiate their portfolios and performance. As always, we maintain our focus on seeking companies that we believe will generate long-term growth in today’s ever-changing market conditions.
6
PORTFOLIO RESULTS
Goldman Sachs Focused International Equity Fund
Investment Objective
The Fund seeks long-term capital appreciation.
Portfolio Management Discussion and Analysis
Effective at the close of business on February 28, 2014, the Goldman Sachs Concentrated International Equity Fund was renamed the Goldman Sachs Focused International Equity Fund (the “Fund”). Below, the Goldman Sachs Global Equity Team discusses the Fund’s performance and positioning for the 12-month period ended October 31, 2014 (the “Reporting Period”).
| Q | How did the Fund perform during Reporting Period? |
| A | During the Reporting Period, the Fund’s Class A, B, C, Institutional, Service and IR Shares generated average annual total returns, without sales charges, of -7.16%, -7.82%, -7.83%, -6.79%, -7.28% and -6.90%, respectively. These returns compare to the -0.60% average annual total return of the Fund’s benchmark, the Morgan Stanley Capital International (MSCI) Europe, Australasia, Far East (EAFE) Index (Net, USD, Unhedged) (the “MSCI EAFE Index”), during the same period. |
| Q | What key factors were responsible for the Fund’s performance during the Reporting Period? |
| A | The Fund’s underperformance in comparison of the MSCI EAFE Index during the Reporting Period can be primarily attributed to individual stock selection. |
| Q | Which stocks detracted significantly from the Fund’s performance during the Reporting Period? |
| A | The biggest detractors from Fund performance relative to the MSCI EAFE Index during the Reporting Period were Adidas, Rexel and Tullow Oil. |
| Adidas, a sports footwear, apparel and equipment manufacturer, detracted most from the Fund’s relative returns during the Reporting Period. The company cut its net income target for 2014, indicating that conditions in Russia and challenges in the U.S. golf market were creating potential risks. Adidas announced it would curtail its planned store rollout in Russia given the challenges continuing sanctions may have on the country. We believe these announcements discredited our original investment thesis that Adidas’ margins were set to see improvement, and thus we decided to sell out of the Fund’s position in the company. |
| Electrical equipment company Rexel was a top detractor from the Fund’s relative results during the Reporting Period. Its poor performance can be attributed to disappointing second calendar quarter results following market concerns about economic growth in Europe, which accounts for a significant portion of the company’s profits. Based on its second calendar quarter results, the company lowered its full year 2014 growth guidance. However, at the end of the Reporting Period, we continued to believe Rexel is a well-run business with strong cost controls and ongoing focus on increasing shareholder value, and thus maintained the Fund’s position in its stock. |
| Oil and gas exploration and production company Tullow Oil detracted from the Fund’s relative performance. Its shares declined due to falling oil prices. However, at the end of the Reporting Period, we remained positive on Tullow Oil, as we believe it possesses a good reputation for gas exploration and looks, in our view, to be a possible takeover candidate in the future. |
| Q | What were some of the Fund’s best-performing individual stocks? |
| A | The greatest contributors to Fund performance relative to the MSCI EAFE Index during the Reporting Period were Shire, Novo-Nordisk and Bayer. |
U.K.-based biopharmaceuticals company Shire was the top positive contributor to the Fund’s relative results during the Reporting Period. Its shares rose after the company announced better than expected third quarter 2013 results and raised its 2013 guidance. At the end of the Reporting Period, we believed Shire had a strong product pipeline that should |
7
PORTFOLIO RESULTS
continue to provide attractive long-term growth opportunities and was trading at an attractive valuation relative to its peers. |
| Denmark-based pharmaceutical company Novo-Nordisk was a strong contributor during the Reporting Period. The company delivered a good set of fiscal year 2013 results in February 2014, and a number of concerns that had impacted its performance during 2013 began to diminish. Namely, one of its key competitors was not able to show superiority to Novo-Nordisk’s Type 2 diabetes drug. Further, the impact of losing a supply contract with Express Script seemed to be less severe than initially anticipated, as a number of patients already on Novo-Nordisk’s drugs were grandfathered in and allowed to continue usage. Lastly, Novo-Nordisk’s pipeline was starting to attract attention, as its oral insulin drug completed Phase 1 trials and progressed into Phase 2. The company has a dominant presence in the U.S. and Europe and was growing its revenues in the emerging markets. At the end of the Reporting Period, we believed the company was well positioned to perform well over the longer term given the sustainability of growth in its diabetes franchise and its innovative product pipeline. |
| While our views ahead on both Shire and Novo-Nordisk remained positive at the end of the Reporting Period, we sold the Fund’s positions in each in an effort to reduce exposure to European names. We decided to take profits in each and invest in other high conviction ideas. |
| German-based chemical and pharmaceutical conglomerate Bayer performed well during the Reporting Period on the back of strong results. Its stock performed particularly well in September 2014 when the company announced it was going to spin off its materials science, or plastics, division, which is a low margin cyclical business. The market responded favorably to the company’s statement that it was making this structural change in order to refocus on its life sciences business, which is a higher margin area and, according to many, has better growth prospects. |
| Q | Which equity market sectors most significantly affected Fund performance during the Reporting Period? |
| A | The sectors that detracted most from the Fund’s relative results during the Reporting Period were financials, consumer discretionary and energy, where stock selection in each weighed most negatively on performance. |
| The only sector to contribute positively to the Fund’s performance relative to the MSCI EAFE Index during the Reporting Period was health care, due primarily to effective stock selection. |
| Q | Which countries most affected the Fund’s performance during the Reporting Period? |
| A | Typically, the Fund’s individual stock holdings will significantly influence the Fund’s performance within a particular country or region relative to the MSCI EAFE Index. This effect may be even more pronounced in a concentrated portfolio or in countries that represent only a modest proportion of the MSCI EAFE Index. |
| That said, the countries that detracted most from the Fund’s performance during the Reporting Period were Japan, the U.K. and Switzerland, where stock selection in each hampered results. Effective stock selection in Denmark, Australia and the Netherlands boosted the Fund’s relative returns most. Having an underweighted allocation to the Netherlands also helped, as its equity market lagged the MSCI EAFE Index during the Reporting Period. |
| Q | How did the Fund use derivatives and similar instruments during the Reporting Period? |
| A | During the Reporting Period, we did not use derivatives to hedge positions or as part of an active management strategy, but we used index futures on an opportunistic basis to ensure the Fund remained almost fully exposed to equities following cash inflows or stock sales. |
| Q | Did the Fund make any significant purchases or sales during the Reporting Period? |
| A | We established new Fund positions during the Reporting Period in the Netherlands’ independent oil and gas company Royal Dutch Shell, Italian bank Intesa Sanpaolo and Japanese banking company Mitsubishi UFJ Financial Group. |
| We initiated a Fund position in Royal Dutch Shell because, in our view, the company was trading at an attractive valuation moving into a key phase of its investment cycle. We believe Royal Dutch Shell is well positioned to drive potential earnings growth through improved operational performance, cost reduction and improved capital allocation. Furthermore, its management appears to us to be committed to returning cash to shareholders through dividends and buybacks, which should reinforce positive shareholder sentiment, in our view. |
We established a Fund position in Intesa Sanpaolo, widely recognized as the leading bank in Italy. Since the recent asset quality review/stress test on European banks implemented by the European Central Bank, the holding contributed positively to the Fund’s results. At the time of purchase, the |
8
PORTFOLIO RESULTS
bank had a 10 billion euro buffer while still being able to generate enough return on equity to pay a high dividend. In our view, Intesa Sanpaolo offered an attractive risk/reward profile at its price at the time of purchase, with upside potential should the Eurozone continue its economic recovery and reduced downside risk given the current high profitability of the bank. |
| We purchased a Fund position in Mitsubishi UFJ Financial Group during the Reporting Period. In our view, what we considered to be the company’s earnings momentum and attractive valuation provided an opportunistic entry point. Furthermore, we believe the company is well positioned to protect its net profit better than its competitors, as it is supported by overseas companies linked on its balance sheet, such as Morgan Stanley and Bank of Ayudhya. |
| In addition to those sales already mentioned, we sold out of the Fund’s positions in Telecity Group, Air Liquide and BP during the Reporting Period. |
| We exited the Fund’s position in Telecity, a U.K.-based operator of European data centers, as we lost conviction that our investment thesis — that Telecity’s operating profits and cash flow would grow quickly as new capacity matured — would play out. The company continued to reduce pricing and margin progression expectations, suggesting increased competition and excess capacity. Given diminished conviction in our investment thesis, we concluded that we would reallocate the capital to what we considered to be more attractive investment opportunities. |
| We sold the Fund’s position in French multinational industrial gases company Air Liquide. We believe the stock’s price/earnings discount to the market had narrowed along with marginal disappointment around its base growth. These factors contributed to a notable sell-off in the stock during the Reporting Period. |
| We eliminated the Fund’s position in U.K.-based oil and gas company BP. The stock had performed well, and we decided to sell and take profits. |
| Q | Were there any notable changes in the Fund’s weightings during the Reporting Period? |
| A | In this Fund, both sector weightings and country allocations are largely the result of our bottom-up stock selection process rather than any top-down macroeconomic views or regional, country, sector or industry bets. We seek to outpace the MSCI EAFE Index by overweighting stocks that we expect to outperform and underweighting those we think may lag. Consequently, changes in its sector or country weightings are generally the direct result of individual stock selection or of stock appreciation or depreciation. That said, during the Reporting Period, the Fund’s exposure to industrials, energy, financials, utilities and telecommunication services increased relative to the MSCI EAFE Index during the Reporting Period, while its relative exposure to information technology, materials, health care, consumer staples and consumer discretionary decreased. From a country perspective, the Fund’s exposure to Switzerland, Italy, Sweden, South Korea and Belgium increased relative to the MSCI EAFE Index during the Reporting Period, while its relative exposure to the U.K., France, Germany and Australia decreased. |
| Q | Were there any changes to the Fund’s portfolio management team during the Reporting Period? |
| A | During the Reporting Period, Edward Perkin, managing director and chief investment officer (“CIO”) of International and Emerging Markets Equity and a lead portfolio manager of the Fund, left the firm. Suneil Mahindru, current lead portfolio manager for the firm’s Global Equity Partners strategy, became the CIO of International Equity and was named a lead portfolio manager on the Fund with Alexis Deladerriere. |
| Q | How was the Fund positioned relative to the MSCI EAFE Index at the end of the Reporting Period? |
| A | At the end of the Reporting Period, the Fund had more exposure to South Korea, Switzerland, Italy, Ireland, Taiwan, Sweden and Spain and less exposure to Japan, France, Germany and Australia relative to the MSCI EAFE Index. At the end of the Reporting Period, the Fund held neutral positions relative to the MSCI EAFE Index in several countries and had no position at all in several other countries, most notably Singapore, the Netherlands, Israel, Finland and Hong Kong. |
| From a sector allocation perspective, the Fund had overweight positions relative to the MSCI EAFE Index in industrials, information technology, energy and financials at the end of the Reporting Period. On the same date, the Fund had underweighted positions compared to the MSCI EAFE Index in consumer discretionary, consumer staples, health care, telecommunication services and materials and was rather neutrally weighted compared to the MSCI EAFE Index in utilities. |
| As always, we remained focused on individual stock selection, with sector and country positioning being a secondary, closely-monitored effect. |
9
FUND BASICS
Focused International Equity Fund
as of October 31, 2014
| PERFORMANCE REVIEW | ||||||||||
| November 1, 2013–October 31, 2014 | Fund Total Return (based on NAV)1 | MSCI EAFE Index (Net, USD, Unhedged)2 | ||||||||
| Class A | -7.16 | % | -0.60 | % | ||||||
| Class B | -7.82 | -0.60 | ||||||||
| Class C | -7.83 | -0.60 | ||||||||
| Institutional | -6.79 | -0.60 | ||||||||
| Service | -7.28 | -0.60 | ||||||||
| Class IR | -6.90 | -0.60 | ||||||||
| 1 | The net asset value (“NAV”) represents the net assets of the class of the Fund (ex-dividend) divided by the total number of shares of the class outstanding. The Fund’s performance assumes the reinvestment of dividends and other distributions. The Fund’s performance does not reflect the deduction of any applicable sales charges. |
| 2 | The MSCI® EAFE Index (Net, USD, Unhedged) is a market capitalization-weighted composite of securities in 22 developed markets. The Index approximates the minimum possible dividend reinvestment. The dividend is reinvested after deduction for withholding tax, applying the rate to non-resident individuals who do not benefit from double taxation treaties. MSCI Barra uses withholding tax rates applicable to Luxembourg holding companies, as Luxembourg applies the highest rates. The Index is unmanaged and the figures for the Index do not include any deduction for fees or expenses. It is not possible to invest directly in an index. |
| STANDARDIZED TOTAL RETURNS3 | ||||||||||||||||||||
| For the period ended 9/30/14 | One Year | Five Years | Ten Years | Since Inception | Inception Date | |||||||||||||||
| Class A | -6.90 | % | 5.05 | % | 3.91 | % | 4.65 | % | 12/01/92 | |||||||||||
| Class B | -7.13 | 5.13 | 3.87 | 3.29 | 5/01/96 | |||||||||||||||
| Class C | -3.24 | 5.46 | 3.73 | 1.96 | 8/15/97 | |||||||||||||||
| Institutional | -1.10 | 6.68 | 4.92 | 4.46 | 2/07/96 | |||||||||||||||
| Service | -1.59 | 6.13 | 4.39 | 3.85 | 3/06/96 | |||||||||||||||
| Class IR | -1.20 | N/A | N/A | 8.86 | 8/31/10 | |||||||||||||||
| 3 | The Standardized Total Returns are average annual total returns as of the most recent calendar quarter-end. They assume reinvestment of all distributions at NAV. These returns reflect a maximum initial sales charge of 5.5% for Class A Shares, the assumed contingent deferred sales charge for Class B Shares (5% maximum declining to 0% after six years) and the assumed contingent deferred sales charge for Class C Shares (1% if redeemed within 12 months of purchase). Class B Shares convert automatically to Class A Shares on or about the fifteenth day of the last month of the calendar quarter that is eight years after purchase. Returns for Class B Shares for the period after conversion reflect the performance of Class A Shares. Because Institutional, Service and Class IR Shares do not involve a sales charge, such a charge is not applied to their Standardized Total Returns. The Fund’s Class B Shares are no longer available for purchase by new or existing shareholders. |
The returns set forth in the tables above represent past performance. Past performance does not guarantee future results. The Fund’s investment return and principal value will fluctuate so that an investor’s shares, when redeemed, may be worth more or less than their original cost. Current performance may be lower or higher than the performance quoted above. Please visit our web site at www.GSAMFUNDS.com to obtain the most recent month-end returns. Performance reflects applicable fee waivers and/or expense limitations in effect during the periods shown. In their absence, performance would be reduced. Returns do not reflect the deduction of taxes that a shareholder would pay on Fund distributions or the redemption of Fund shares.
10
FUND BASICS
| EXPENSE RATIOS4 | ||||||||||
| Net Expense Ratio (Current) | Gross Expense Ratio (Before Waivers) | |||||||||
| Class A | 1.32 | % | 1.69 | % | ||||||
| Class B | 2.07 | 2.43 | ||||||||
| Class C | 2.06 | 2.44 | ||||||||
| Institutional | 0.92 | 1.29 | ||||||||
| Service | 1.42 | 1.79 | ||||||||
| Class IR | 1.06 | 1.44 | ||||||||
| 4 | The expense ratios of the Fund, both current (net of applicable fee waivers and/or expense limitations) and before waivers (gross of applicable fee waivers and/or expense limitations) are as set forth above according to the most recent publicly available Prospectus for the Fund and may differ from the expense ratios disclosed in the Financial Highlights in this report. Pursuant to a contractual arrangement, the Fund’s waivers and/or expense limitations will remain in place through at least February 28, 2015, and prior to such date the Investment Adviser may not terminate the arrangements without the approval of the Fund’s Board of Trustees. If these arrangements are discontinued in the future, the expense ratios may change without shareholder approval. |
| TOP TEN HOLDINGS AS OF 10/31/145 | ||||||||||
| Holding | % of Net Assets | Line of Business | Country | |||||||
| Royal Dutch Shell PLC Class A | 4.9 | % | Energy | Netherlands | ||||||
| Intesa Sanpaolo SpA | 4.0 | Banks | Italy | |||||||
| Mitsubishi UFJ Financial Group, Inc. | 3.3 | Banks | Japan | |||||||
| Bayer AG (Registered) | 3.1 | Pharmaceuticals, Biotechnology & Life Sciences | Germany | |||||||
| Credit Suisse Group AG (Registered) | 3.1 | Diversified Financials | Switzerland | |||||||
| Reckitt Benckiser Group PLC | 3.1 | Household & Personal Products | United Kingdom | |||||||
| Vodafone Group PLC | 3.1 | Telecommunication Services | United Kingdom | |||||||
| Safran SA | 3.1 | Capital Goods | France | |||||||
| MediaTek, Inc. | 3.0 | Semiconductors & Semiconductor Equipment | Taiwan | |||||||
| Volvo AB Class B | 3.0 | Capital Goods | Sweden | |||||||
| 5 | The top 10 holdings may not be representative of the Fund’s future investments. |
11
FUND BASICS
| FUND VS. BENCHMARK SECTOR ALLOCATIONS6 | ||
| As of October 31, 2014 | ||
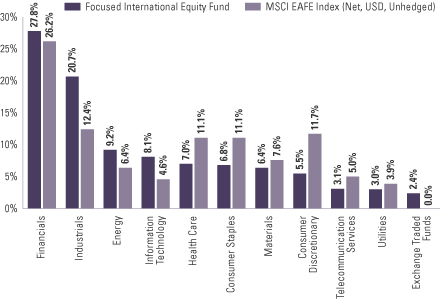
| 6 | The Fund is actively managed and, as such, its composition may differ over time. Consequently, the Fund’s overall sector allocations may differ from percentages contained in the graph above. The graph categorizes investments using Global Industry Classification Standard (“GICS”), however, the sector classifications used by the portfolio management team may differ from GICS. Underlying sector allocations of exchange traded funds held by the Fund are not reflected in the graph above. The percentage shown for each investment category reflects the value of investments in that category as a percentage of market value. The graph depicts the Fund’s investments but may not represent the Fund’s market exposure due to the exclusion of certain derivatives, if any, as listed in the Additional Investment Information section of the Schedule of Investments. |
12
GOLDMAN SACHS FOCUSED INTERNATIONAL EQUITY FUND
Performance Summary
October 31, 2014
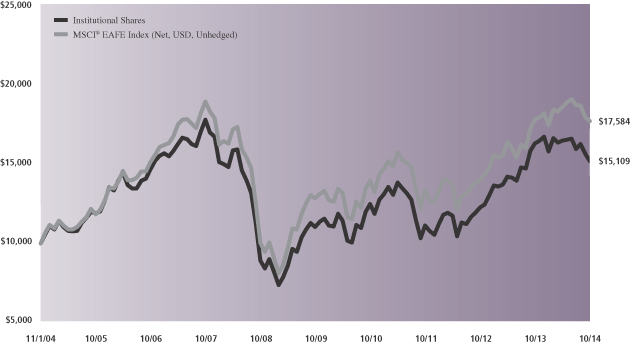
The following graph shows the value, as of October 31, 2014, of a $10,000 investment made on November 1, 2004 in Institutional Shares at NAV. For comparative purposes, the performance of the Fund’s benchmark, the MSCI® EAFE Index (Net, USD, Unhedged) is shown. This performance data represents past performance and should not be considered indicative of future performance, which will fluctuate with changes in market conditions. These performance fluctuations will cause an investor’s shares, when redeemed, to be worth more or less than their original cost. Performance reflects applicable fee waivers and/or expense limitations in effect during the periods shown and in their absence, performance would be reduced. Returns do not reflect the deduction of taxes that a shareholder would pay on Fund distributions or the redemption of Fund shares. Performance of Class A, Class B, Class C, Service and Class IR Shares will vary from Institutional Shares due to differences in class specific fees and any applicable sales charges. In addition to the Investment Adviser’s decisions regarding issuer/industry/country investment selection and allocation, other factors may affect Fund performance. These factors include, but are not limited to, Fund operating fees and expenses, portfolio turnover, and subscription and redemption cash flows affecting the Fund.
| Focused International Equity Fund’s 10 Year Performance |
Performance of a $10,000 Investment, with distributions reinvested, from November 1, 2004 through October 31, 2014.
| Average Annual Total Return through October 31, 2014 | One Year | Five Years | Ten Years | Since Inception | ||||||||||
Class A (Commenced December 1, 1992) | ||||||||||||||
Excluding sales charges | -7.16% | 6.07% | 3.80% | 4.75% | ||||||||||
Including sales charges | -12.25% | 4.88% | 3.21% | 4.48% | ||||||||||
| ||||||||||||||
Class B (Commenced May 1, 1996)* | ||||||||||||||
Excluding contingent deferred sales charges | -7.82% | 5.33% | 3.17% | 3.10% | ||||||||||
Including contingent deferred sales charges | -12.43% | 4.98% | 3.17% | 3.10% | ||||||||||
| ||||||||||||||
Class C (Commenced August 15, 1997) | ||||||||||||||
Excluding contingent deferred sales charges | -7.83% | 5.31% | 3.03% | 1.76% | ||||||||||
Including contingent deferred sales charges | -8.75% | 5.31% | 3.03% | 1.76% | ||||||||||
| ||||||||||||||
Institutional (Commenced February 7, 1996) | -6.79% | 6.51% | 4.21% | 4.26% | ||||||||||
| ||||||||||||||
Service (Commenced March 6, 1996) | -7.28% | 5.98% | 3.69% | 3.66% | ||||||||||
| ||||||||||||||
Class IR (Commenced August 31, 2010) | -6.90% | N/A | N/A | 7.87% | ||||||||||
| ||||||||||||||
| * | Effective at the close of business on November 14, 2014, Class B Shares of the Fund have converted to Class A Shares of the Fund. In addition, effective October 15, 2014, all redemptions of Class B Shares have not been subject to a contingent deferred sales charge. Average annual total returns for Class B Shares through October 31, 2014 have not been adjusted to reflect this change. |
13
PORTFOLIO RESULTS
Goldman Sachs International Small Cap Fund
Investment Objective
The Fund seeks long-term capital appreciation.
Portfolio Management Discussion and Analysis
Below, the Goldman Sachs Global Equity Team discusses the Goldman Sachs International Small Cap Fund’s (the “Fund”) performance and positioning for the 12-month period ended October 31, 2014 (the “Reporting Period”).
| Q | How did the Fund perform during the Reporting Period? |
| A | During the Reporting Period, the Fund’s Class A, B, C, Institutional, Service and IR Shares generated average annual total returns, without sales charges, of -0.48%, -1.18%, -1.19%, -0.06%, -0.57% and -0.23%, respectively. These returns compare to the -0.79% average annual total return of the Fund’s benchmark, the Standard and Poor’s (S&P) Developed Ex-U.S. Small Cap Index (Net, USD, Unhedged) (the “S&P Index”), during the same period. |
| Q | What key factors were responsible for the Fund’s performance during the Reporting Period? |
| A | The Fund generated disappointing absolute returns but most of its share classes outperformed the S&P Index on a relative basis during the Reporting Period, attributable primarily to individual stock selection. Country allocation contributed positively as well, albeit more modestly. Sector allocation overall detracted slightly. |
| Q | What were some of the Fund’s best-performing individual stocks? |
| A | The greatest contributors to Fund performance relative to the S&P Index during the Reporting Period were Ashtead Group, Ingenico and Sierra Wireless. |
| Ashtead Group was the greatest positive contributor to the Fund’s relative performance during the Reporting Period. A new purchase for the Fund during the Reporting Period, Ashtead Group is a British construction equipment rental business focused on the non-residential sector but generates approximately 90% of its profits in the U.S. Ashtead Group used the industry downturn to refresh its equipment fleet, improve its balance sheet and build out detailed expansion plans. With early indications that the U.S. non-residential cycle may have turned, its business benefited from its earlier efforts. Indeed, the company’s recent results show encouraging progress both on the top and bottom lines. Already number two in the U.S. market, we believe the business’ top line benefited from three trends. First, a strong recovery in U.S. construction spending. Second, contractors increasingly choosing to rent rather than buy equipment. Third, the company successfully executing on its ambition to double its market share. Combined with strict cost controls, its top line growth also drove substantial improvements in absolute profits, margins and returns on capital. |
| French-based Ingenico was also a strong contributor to the Fund’s relative results. The company is a member of the duopoly that dominates the point-of-sale terminal market (i.e. terminals that take card payments in physical stores). We believe its hardware business is positioned favorably, as it has barriers beyond pure technology leadership and is raising barriers further by investing in associated areas. Its stock performed well, as the company continued to eliminate concerns about new mobile payments entrants and continued to invest in the faster growing online payments space. |
| Sierra Wireless is the world’s largest provider of communications modules that allow devices to communicate over wireless networks. We believe Sierra Wireless is well positioned to benefit from the increasing momentum behind the Internet of Things and should be able, in our view, to defend its strong market position. Following a span of underperformance, the stock rebounded strongly. (The Internet of Things is the interconnection of unique identifiable embedded computing devices within the existing Internet infrastructure.) |
| Q | Which stocks detracted significantly from the Fund’s performance during the Reporting Period? |
| A | The biggest detractors from Fund performance relative to the S&P Index during the Reporting Period were GFK, Nokian Renkaat and Cairn Energy. |
14
PORTFOLIO RESULTS
| Headquartered in Germany, GFK is the world’s fourth largest market research company, albeit with a revenue base biased toward Europe. Improved strategic positioning and efforts to streamline its business by implementing what it calls its “One GFK” strategy were hindered during the Reporting Period by a challenging macro environment and a requirement to continue to invest in global digital product offerings. This resulted in downgraded earnings expectations, which, in turn, weighed on GFK’s share price during the Reporting Period. |
| Nokian Renkaat also detracted from the Fund’s relative performance during the Reporting Period, as the market reacted negatively to the Finnish tire manufacturer’s exposure to Russia given recent geopolitical tensions in the area. Approximately 35% of Nokian Renkaat’s sales can be attributed to Russia and approximately 80% of its production. The company also performed poorly in the final quarter of 2013 and the first quarter of 2014, attributable largely to paying an additional tax charge relating to 2007 earnings and to a weak Russian car market. Given the significant exposure the company has to the region, we sold out of the Fund’s position in Nokian Renkaat based primarily on escalating sanctions imposed on Russia. |
| Cairn Energy is a U.K.-based oil and gas exploration and development company. Cairn Energy has what we consider to be an interesting series of exploration wells to be drilled in 2014 as well as interest in two North Sea production facilities expected to come on stream in the next two years. The company also holds an approximately 10% stake in Cairn India that was worth approximately $1 billion at market price at the end of the Reporting Period. However, the Indian Income Tax Department instructed Cairn Energy not to sell this stake in Cairn India, as it is investigating to see if Cairn Energy is liable for any retrospective capital gains tax on transfer of assets in 2006-2007. The company stated it intends to respond to the notice and refute the claim, but the announcement of the notice nevertheless materially impacted its share price during the Reporting Period. |
| Q | Which equity market sectors most significantly affected Fund performance during the Reporting Period? |
| A | The sectors that contributed most to the Fund’s performance relative to the S&P Index were information technology, financials and health care, due primarily to effective stock selection in each. Having an overweighted allocation to health care, which outpaced the S&P Index during the Reporting Period, added value as well. |
| The biggest detractors from the Fund’s results during the Reporting Period were telecommunication services, utilities and materials, where stock selection overall hurt relative performance. |
| Q | Which countries most affected the Fund’s performance during the Reporting Period? |
| A | Typically, the Fund’s individual stock holdings will significantly influence the Fund’s performance within a particular country or region relative to the S&P Index. This effect may be even more pronounced in countries that represent only a modest proportion of the S&P Index. |
| That said, the Fund’s stock selection in the U.K., Australia and China contributed most positively to the Fund’s performance during the Reporting Period. Conversely, the countries that detracted most from the Fund’s performance during the Reporting Period were Germany, South Korea and Switzerland, where stock selection in each proved disappointing. |
| Q | How did the Fund use derivatives and similar instruments during the Reporting Period? |
| A | During the Reporting Period, we did not use derivatives to hedge positions or as part of an active management strategy, but we used index futures on an opportunistic basis to ensure the portfolio remained almost fully exposed to equities following cash inflows or stock sales. |
| Q | Did the Fund make any significant purchases or sales during the Reporting Period? |
| A | In addition to the purchase of Ashtead Group, already mentioned, we established Fund positions in Klepierre and Hays during the Reporting Period. |
| We initiated a Fund position in Klepierre, a continental Europe shopping center owner. At the end of 2013, it announced a transformational deal, wherein it disposed of more than 120 small shopping galleries to a joint venture led by Carrefour. This deal closed at the end of the first quarter of 2014. In our view, this deal was a major step in a planned strategic portfolio shift that Klepierre had started in 2012 toward fewer and larger centers. However, the stock price reaction was fairly muted, which we think is attributable to a strong price performance leading up to the third quarter of 2013. The company reported strong results in the first quarter of 2014, and the market acknowledged the magnitude of change in its portfolio because of the Carrefour deal. This, coupled with lower interest rates in continental Europe with the prospect of the central bank monetary easing, led to strong performance in the second quarter of 2014. We |
15
PORTFOLIO RESULTS
believe further upside could be supported by the likelihood of a low interest rate environment and continued internal improvements at the company. |
| We established a Fund position in U.K.-listed Hays, a global staffing company, during the Reporting Period. We believe the company has a favorable set of end-markets in the U.K., where growth has been strong; in Europe, where structural penetration should help the company grow for several years; and in Australia, which could see a recovery in the next 24 to 36 months from currently low activity levels. We believe Hays also has a market-leading information technology advantage. For example, it pairs with LinkedIn to identify candidates whose online behavior suggests they may be looking to move jobs. |
| In addition to the sale of Nokian Renkaat, mentioned earlier, we eliminated the Fund’s positions in Derwent London and Flughafen Zurich during the Reporting Period. |
| We eliminated the Fund’s position in Derwent London, a company that owns, operates and develops offices in central London. In our view, Derwent London is a high quality company with a strong track record. However, in our view, its valuation was getting stretched, with the stock trading at a premium. While rents in London rose rapidly during the Reporting Period, we believe we may be getting close to the top of the cycle, as rents at the end of the Reporting Period were in range of the previous cycle peak. |
| We sold the Fund’s position in Flughafen Zurich, the largest international airport in Switzerland, as a result of our concerns around Swiss Airways’ capacity plans, which are not expected to grow at the Zurich airport for the next 12 months or so. Furthermore, we had increasing doubts about the company’s plans to grow retail spending per passenger or to move forward on a real estate project called The Circle. |
| Q | Were there any notable changes in the Fund’s weightings during the Reporting Period? |
| A | In this Fund, both sector weightings and country allocations are largely the result of our bottom-up stock selection process rather than any top-down macroeconomic views or industry bets. We seek to outpace the S&P Index by overweighting stocks that we expect to outperform and underweighting those we think may lag. Consequently, changes in its sector or country weightings are generally the direct result of individual stock selection or of stock appreciation or depreciation. That said, during the Reporting Period, the Fund’s exposure to materials and health care increased relative to the S&P Index during the Reporting Period, while its relative exposure to information technology, consumer discretionary and industrials decreased. From a country perspective, the Fund’s exposure to Italy, Belgium and Sweden increased relative to the S&P Index during the Reporting Period, while its relative exposure to the U.K., Germany and the Netherlands decreased. |
| Q | How was the Fund positioned relative to the S&P Index at the end of the Reporting Period? |
| A | At the end of the Reporting Period, the Fund had more exposure to the U.K., China, Belgium and Italy and less exposure to Switzerland, Germany, Spain, the Netherlands and Hong Kong relative to the S&P Index. At the end of the Reporting Period, the Fund held neutral positions relative to the S&P Index in several countries, most notably Canada, and had no position at all in several other countries, most notably Thailand and Finland. |
| From a sector allocation perspective, the Fund had overweighted positions relative to the S&P Index in materials, health care and information technology at the end of the Reporting Period. On the same date, the Fund had underweighted positions compared to the S&P Index in financials, industrials, consumer discretionary and consumer staples and was rather neutrally weighted relative to the S&P Index in energy, utilities and telecommunication services. |
| As always, we remained focused on individual stock selection, with sector and country positioning being a secondary, closely-monitored effect. |
16
FUND BASICS
International Small Cap Fund
as of October 31, 2014
| PERFORMANCE REVIEW | ||||||||||
| November 1, 2013–October 31, 2014 | Fund Total Return (based on NAV)1 | S&P Developed Ex-U.S. Small Cap Index (Net, USD, Unhedged)2 | ||||||||
| Class A | -0.48 | % | -0.79 | % | ||||||
| Class B | -1.18 | -0.79 | ||||||||
| Class C | -1.19 | -0.79 | ||||||||
| Institutional | -0.06 | -0.79 | ||||||||
| Service | -0.57 | -0.79 | ||||||||
| Class IR | -0.23 | -0.79 | ||||||||
| 1 | The net asset value (“NAV”) represents the net assets of the class of the Fund (ex-dividend) divided by the total number of shares of the class outstanding. The Fund’s performance assumes the reinvestment of dividends and other distributions. The Fund’s performance does not reflect the deduction of any applicable sales charges. |
| 2 | The S&P Developed Ex-U.S. Small Cap Index (Net, USD, Unhedged) is the small capitalization stock component of the S&P Developed Broad Market Index (BMI). The BMI is a float-weighted index that spans 32 countries (inclusive of the US) and includes the listed shares of all companies with an available market capitalization (float) of at least $100 million at the annual rebalance. The Small Cap Ex-U.S. is defined as those stocks falling in the bottom 15% of the cumulative available capital in each country. MSCI Barra reflects returns net of withholding taxes applied to foreign investors, calculated daily based on tax rates that would be applied to a Luxembourg-based investor. The Index is unmanaged and the figures for the Index do not include any deduction for fees or expenses. It is not possible to invest directly in an index. |
| STANDARDIZED TOTAL RETURNS3 | ||||||||||||||||||||
| For the period ended 9/30/14 | One Year | Five Years | Ten Years | Since Inception | Inception Date | |||||||||||||||
| Class A | -2.57 | % | 9.26 | % | 5.95 | % | 5.65 | % | 5/01/98 | |||||||||||
| Class B | -2.65 | 9.42 | 5.93 | 5.73 | 5/01/98 | |||||||||||||||
| Class C | 1.32 | 9.71 | 5.77 | 5.33 | 5/01/98 | |||||||||||||||
| Institutional | 3.59 | 11.00 | 7.02 | 6.55 | 5/01/98 | |||||||||||||||
| Service | 2.99 | 10.41 | 6.46 | 6.00 | 5/01/98 | |||||||||||||||
| Class IR | 3.37 | N/A | N/A | 12.68 | 8/31/10 | |||||||||||||||
| 3 | The Standardized Total Returns are average annual total returns as of the most recent calendar quarter-end. They assume reinvestment of all distributions at NAV. These returns reflect a maximum initial sales charge of 5.5% for Class A Shares, the assumed contingent deferred sales charge for Class B Shares (5% maximum declining to 0% after six years) and the assumed contingent deferred sales charge for Class C Shares (1% if redeemed within 12 months of purchase). Class B Shares convert automatically to Class A Shares on or about the fifteenth day of the last month of the calendar quarter that is eight years after purchase. Returns for Class B Shares for the period after conversion reflect the performance of Class A Shares. Because Institutional, Service and Class IR Shares do not involve a sales charge, such a charge is not applied to their Standardized Total Returns. The Fund’s Class B Shares are no longer available for purchase by new or existing shareholders. |
The returns set forth in the tables above represent past performance. Past performance does not guarantee future results. The Fund’s investment return and principal value will fluctuate so that an investor’s shares, when redeemed, may be worth more or less than their original cost. Current performance may be lower or higher than the performance quoted above. Please visit our web site at www.GSAMFUNDS.com to obtain the most recent month-end returns. Performance reflects applicable fee waivers and/or expense limitations in effect during the periods shown. In their absence, performance would be reduced. Returns do not reflect the deduction of taxes that a shareholder would pay on Fund distributions or the redemption of Fund shares.
17
FUND BASICS
| EXPENSE RATIOS4 | ||||||||||
| Net Expense Ratio (Current) | Gross Expense Ratio (Before Waivers) | |||||||||
| Class A | 1.38 | % | 1.88 | % | ||||||
| Class B | 2.13 | 2.63 | ||||||||
| Class C | 2.13 | 2.63 | ||||||||
| Institutional | 0.98 | 1.46 | ||||||||
| Service | 1.48 | 1.98 | ||||||||
| Class IR | 1.13 | 1.62 | ||||||||
| 4 | The expense ratios of the Fund, both current (net of applicable fee waivers and/or expense limitations) and before waivers (gross of applicable fee waivers and/or expense limitations) are as set forth above according to the most recent publicly available Prospectus for the Fund and may differ from the expense ratios disclosed in the Financial Highlights in this report. Pursuant to a contractual arrangement, the Fund’s waivers and/or expense limitations will remain in place through at least June 30, 2015, and prior to such date the Investment Adviser may not terminate the arrangements without the approval of the Fund’s Board of Trustees. If these arrangements are discontinued in the future, the expense ratios may change without shareholder approval. |
| TOP TEN HOLDINGS AS OF 10/31/145 | ||||||||||
| Holding | % of Net Assets | Line of Business | Country | |||||||
| Klepierre | 1.4 | % | Real Estate | France | ||||||
| Ingenico | 1.4 | Technology Hardware & Equipment | France | |||||||
| Inchcape PLC | 1.2 | Retailing | United Kingdom | |||||||
| St. James’s Place PLC | 1.2 | Insurance | United Kingdom | |||||||
| Ashtead Group PLC | 1.1 | Capital Goods | United Kingdom | |||||||
| Hays PLC | 1.1 | Commercial & Professional Services | United Kingdom | |||||||
| Cie d’Entreprises CFE | 1.1 | Capital Goods | Belgium | |||||||
| Melrose Industries PLC | 1.1 | Capital Goods | United Kingdom | |||||||
| Persimmon PLC | 1.1 | Consumer Durables & Apparel | United Kingdom | |||||||
| MARR SpA | 1.1 | Food & Staples Retailing | Italy | |||||||
| 5 | The top 10 holdings may not be representative of the Fund’s future investments. |
18
FUND BASICS
| FUND VS. BENCHMARK SECTOR ALLOCATIONS6 | ||
| As of October 31, 2014 | ||
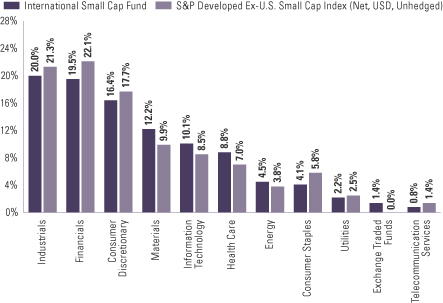
| 6 | The Fund is actively managed and, as such, its composition may differ over time. Consequently, the Fund’s overall sector allocations may differ from percentages contained in the graph above. The graph categorizes investments using Global Industry Classification Standard (“GICS”), however, the sector classifications used by the portfolio management team may differ from GICS. Underlying sector allocations of exchange traded funds held by the Fund are not reflected in the graph above. The percentage shown for each investment category reflects the value of investments in that category as a percentage of market value. The graph depicts the Fund’s investments but may not represent the Fund’s market exposure due to the exclusion of certain derivatives, if any, as listed in the Additional Investment Information section of the Schedule of Investments. |
19
GOLDMAN SACHS INTERNATIONAL SMALL CAP FUND
Performance Summary
October 31, 2014
The following graph shows the value, as of October 31, 2014, of a $10,000 investment made on November 1, 2004 in Institutional Shares at NAV. For comparative purposes, the performance of the Fund’s benchmark, the S&P Developed Ex-U.S. Small Cap Index (Net, USD, Unhedged) is shown. This performance data represents past performance and should not be considered indicative of future performance, which will fluctuate with changes in market conditions. These performance fluctuations will cause an investor’s shares, when redeemed, to be worth more or less than their original cost. Performance reflects applicable fee waivers and/or expense limitations in effect during the periods shown and in their absence, performance would be reduced. Returns do not reflect the deduction of taxes that a shareholder would pay on Fund distributions or the redemption of Fund shares. Performance of Class A, Class B, Class C, Service and Class IR Shares will vary from Institutional Shares due to differences in class specific fees and any applicable sales charges. In addition to the Investment Adviser’s decisions regarding issuer/industry/country investment selection and allocation, other factors may affect Fund performance. These factors include, but are not limited to, Fund operating fees and expenses, portfolio turnover, and subscription and redemption cash flows affecting the Fund.
| International Small Cap Fund’s 10 Year Performance |
Performance of a $10,000 Investment, with distributions reinvested, from November 1, 2004 through October 31, 2014.

| Average Annual Total Return through October 31, 2014 | One Year | Five Years | Ten Years | Since Inception | ||||||||||
Class A (Commenced May 1, 1998) | ||||||||||||||
Excluding sales charges | -0.48% | 11.03% | 6.32% | 5.93% | ||||||||||
Including sales charges | -5.95% | 9.79% | 5.72% | 5.57% | ||||||||||
|
|
|
|
|
|
|
| |||||||
Class B (Commenced May 1, 1998)* | ||||||||||||||
Excluding contingent deferred sales charges | -1.18% | 10.23% | 5.69% | 5.65% | ||||||||||
Including contingent deferred sales charges | -6.12% | 9.94% | 5.69% | 5.65% | ||||||||||
|
|
|
|
|
|
|
| |||||||
Class C (Commenced May 1, 1998) | ||||||||||||||
Excluding contingent deferred sales charges | -1.19% | 10.21% | 5.54% | 5.25% | ||||||||||
Including contingent deferred sales charges | -2.18% | 10.21% | 5.54% | 5.25% | ||||||||||
|
|
|
|
|
|
|
| |||||||
Institutional (Commenced May 1, 1998) | -0.06% | 11.52% | 6.78% | 6.46% | ||||||||||
|
|
|
|
|
|
|
| |||||||
Service (Commenced May 1, 1998) | -0.57% | 10.91% | 6.23% | 5.92% | ||||||||||
|
|
|
|
|
|
|
| |||||||
Class IR (Commenced August 31, 2010) | -0.23% | N/A | N/A | 12.20% | ||||||||||
|
|
|
|
|
|
|
|
| * | Effective at the close of business on November 14, 2014, Class B Shares of the Fund have converted to Class A Shares of the Fund. In addition, effective October 15, 2014, all redemptions of Class B Shares have not been subject to a contingent deferred sales charge. Average annual total returns for Class B Shares through October 31, 2014 have not been adjusted to reflect this change. |
20
PORTFOLIO RESULTS
Goldman Sachs Strategic International Equity Fund
Investment Objective
The Fund seeks long-term growth of capital.
Portfolio Management Discussion and Analysis
Below, the Goldman Sachs Global Equity Team discusses the Goldman Sachs Strategic International Equity Fund’s (the “Fund”) performance and positioning for the 12-month period ended October 31, 2014 (the “Reporting Period”).
| Q | How did the Fund perform during the Reporting Period? |
| A | During the Reporting Period, the Fund’s Class A, B, C, Institutional, IR and R Shares generated average annual total returns, without sales charges, of -1.41%, -2.15%, -2.10%, -1.05%, -1.14% and -1.58%, respectively. These returns compare to the -0.60% average annual total return of the Fund’s benchmark, the Morgan Stanley Capital International (MSCI) Europe, Australasia, Far East (EAFE) Index (Net, USD, Unhedged) (the “MSCI EAFE Index”), during the same period. |
| Q | What key factors were responsible for the Fund’s performance during the Reporting Period? |
| A | The Fund’s underperformance relative to the MSCI EAFE Index during the Reporting Period can be primarily attributed to individual stock selection. |
| Q | Which stocks detracted significantly from the Fund’s performance during the Reporting Period? |
| A | Among the biggest detractors from Fund performance relative to the MSCI EAFE Index during the Reporting Period were Adidas, Nomura Real Estate and Tullow Oil. |
| Adidas, a sports footwear, apparel and equipment manufacturer, detracted most from the Fund’s relative returns during the Reporting Period. The company cut its net income target for 2014, indicating that conditions in Russia and challenges in the U.S. golf market were creating potential risks. Adidas announced it would curtail its planned store rollout in Russia given the challenges continuing sanctions may have on the country. We believe these announcements discredited our original investment thesis that Adidas’ margins were set to see improvement, and thus we decided to sell out of the Fund’s position in the company. |
| Nomura Real Estate, a Japanese real estate holding company, detracted from the Fund’s relative returns during the Reporting Period. The company underperformed the MSCI EAFE Index in spite of better than consensus fiscal second quarter 2014 results and upward revision of its fiscal year forecasts. Nomura Real Estate had benefited from a spike in demand of condo contracts before Japan’s consumption tax increase took effect. However, its shares declined after investors began to have concerns about a possible decline in demand for condos after the consumption tax hike. We decided to exit the Fund’s position in Nomura Real Estate in favor of higher conviction opportunities. |
| Oil and gas exploration and production company Tullow Oil detracted from the Fund’s relative performance. Its shares declined due to falling oil prices. However, at the end of the Reporting Period, we remained positive on Tullow Oil, as we believe it possesses a good reputation for gas exploration and looks, in our view, to be a possible takeover candidate in the future. |
| Q | What were some of the Fund’s best-performing individual stocks? |
| A | The greatest contributors to Fund performance relative to the MSCI EAFE Index during the Reporting Period were Shire, Scania and Novo-Nordisk. |
| U.K.-based biopharmaceuticals company Shire was the top positive contributor to the Fund’s relative results during the Reporting Period. Its shares rose after the company announced better than expected third quarter 2013 results and raised its 2013 guidance. At the end of the Reporting Period, we believed Shire had a strong product pipeline that should continue to provide attractive long-term growth opportunities and was trading at an attractive valuation relative to its peers. While our view ahead on Shire remained positive at the end of the Reporting Period, we sold the Fund’s position in an effort to reduce exposure to European names. We decided to take profits and invest in other high conviction ideas. |
21
PORTFOLIO RESULTS
Sweden-based truck manufacturer Scania was another top contributor to the Fund’s relative results during the Reporting Period. Its shares rose after Volkswagen announced it would make an offer for the remaining outstanding shares of Scania that it does not already own. We decided to sell out of the Fund’s position in Scania in favor of higher conviction opportunities. |
| Denmark-based pharmaceutical company Novo-Nordisk was a strong contributor during the Reporting Period. The company delivered a good set of fiscal year 2013 results in February 2014, and a number of concerns that had impacted its performance during 2013 began to diminish. Namely, one of its key competitors was not able to show superiority to Novo-Nordisk’s Type 2 diabetes drug. Further, the impact of losing a supply contract with Express Script seemed to be less severe than initially anticipated, as a number of patients already on Novo-Nordisk’s drugs were grandfathered in and allowed to continue usage. Lastly, Novo-Nordisk’s pipeline was starting to attract attention, as its oral insulin drug completed Phase 1 trials and progressed into Phase 2. The company has a dominant presence in the U.S. and Europe and was growing its revenues in the emerging markets. At the end of the Reporting Period, we believed the company was well positioned to perform well over the longer term given the sustainability of growth in its diabetes franchise and its innovative product pipeline. |
| Q | Which equity market sectors most significantly affected Fund performance during the Reporting Period? |
| A | The biggest detractors from the Fund’s results during the Reporting Period were financials, utilities and energy, where weak stock selection in each hurt most. |
| The sectors that contributed most to the Fund’s performance relative to the MSCI EAFE Index were health care, industrials and consumer discretionary. Stock selection in all three sectors proved effective during the Reporting Period. |
| Q | Which countries most affected the Fund’s performance during the Reporting Period? |
| A | Typically, the Fund’s individual stock holdings will significantly influence the Fund’s performance within a particular country or region relative to the MSCI EAFE Index. This effect may be even more pronounced in countries that represent only a modest proportion of the MSCI EAFE Index. |
| That said, the countries that detracted most from the Fund’s relative performance were the U.K., Finland and Switzerland, wherein stock selection overall in each proved disappointing. Conversely, effective individual stock selection in France and Denmark contributed most positively to the Fund’s results relative to the MSCI EAFE Index. Having exposure to India, which is not a component of the MSCI EAFE Index and which significantly outperformed the MSCI EAFE Index, also boosted the Fund’s relative results. |
| Q | How did the Fund use derivatives and similar instruments during the Reporting Period? |
| A | During the Reporting Period, we did not use derivatives to hedge positions or as part of an active management strategy, but we used index futures on an opportunistic basis to ensure the portfolio remained almost fully exposed to equities following cash inflows or stock sales. |
| Q | Did the Fund make any significant purchases or sales during the Reporting Period? |
| A | During the Reporting Period, we purchased Fund positions in Italian bank Intesa Sanpaolo, Japanese banking company Mitsubishi UFJ Financial Group and the Netherlands’ independent oil and gas company Royal Dutch Shell. |
| We established a Fund position in Intesa Sanpaolo, widely recognized as the leading bank in Italy. Since the recent asset quality review/stress test on European banks implemented by the European Central Bank, the holding contributed positively to the Fund’s results. At the time of purchase, the bank had a 10 billion euro buffer while still being able to generate enough return on equity to pay a high dividend. In our view, Intesa Sanpaolo offered an attractive risk/reward profile at its price at the time of purchase, with upside potential should the Eurozone continue its economic recovery and reduced downside risk given the current high profitability of the bank. |
| We purchased a Fund position in Mitsubishi UFJ Financial Group during the Reporting Period. In our view, what we considered to be the company’s earnings momentum and attractive valuation provided an opportunistic entry point. Furthermore, we believe the company is well positioned to protect its net profit better than its competitors, as it is supported by overseas companies linked on its balance sheet, such as Morgan Stanley and Bank of Ayudhya. |
We initiated a Fund position in Royal Dutch Shell because, in our view, the company was trading at an attractive valuation moving into a key phase of its investment cycle. We believe Royal Dutch Shell is well positioned to drive potential earnings growth through improved operational performance, cost reduction and improved capital allocation. Furthermore, |
22
PORTFOLIO RESULTS
its management appears to us to be committed to returning cash to shareholders through dividends and buybacks, which should reinforce positive shareholder sentiment, in our view. |
| In addition to the sales already mentioned, we sold out of the Fund’s positions in HSBC, BNP Paribas and Sumitomo Mitsui Financial Group during the Reporting Period. We sold the Fund’s position in U.K.-based HSBC, as regulatory pressures were a drag on the bank’s capital. After meeting with the chief financial officer and head of commercial banking of HSBC, who highlighted the increasing regulatory burden banks are currently facing, we believed such pressures would result in HSBC having to retain more capital, making it difficult for the bank to generate an attractive return on equity. |
| We eliminated the Fund’s position in BNP Paribas when it was announced that the French bank was under investigation by U.S. authorities for dealings with countries under U.S. sanctions. The $9 billion settlement as well as the dollar- clearing suspension represented, in our view, significant setbacks for BNP Paribas in the build-up of its capital position and the normalization of its business. |
| Japanese bank group Sumitomo Mitsui Financial Group detracted from the Fund’s relative performance during the Reporting Period. Its stock underperformed the MSCI EAFE Index after it announced its quarterly net income, which declined substantially compared to last fiscal year due to lower bond trading gains. The loan-deposit spread in its banking unit also narrowed. We decided to sell the Fund’s position in Sumitomo Mitsui Financial Group. |
| Q | Were there any notable changes in the Fund’s weightings during the Reporting Period? |
| A | In this Fund, both sector weightings and country allocations are largely the result of our bottom-up stock selection process rather than any top-down macroeconomic views or regional, country, sector or industry bets. We seek to outpace the MSCI EAFE Index by overweighting stocks that we expect to outperform and underweighting those we think may lag. Consequently, changes in its sector or country weightings are generally the direct result of individual stock selection or of stock appreciation or depreciation. That said, during the Reporting Period, the Fund’s exposure to consumer staples, utilities and industrials increased relative to the MSCI EAFE Index during the Reporting Period, while its relative exposure to materials, telecommunication services, health care and consumer discretionary decreased. From a country perspective, the Fund’s exposure to Japan, Switzerland, Sweden, Spain, Italy and Ireland increased relative to the MSCI EAFE Index during the Reporting Period, while its relative exposure to the U.K., France and Russia decreased. |
| Q | Were there any changes to the Fund’s portfolio management team during the Reporting Period? |
| A | During the Reporting Period, Edward Perkin, managing director and chief investment officer (“CIO”) of International and Emerging Markets Equity and a lead portfolio manager of the Fund, left the firm. Suneil Mahindru, current lead portfolio manager for the firm’s Global Equity Partners strategy, became the CIO of International Equity and was named a lead portfolio manager on the Fund with Alexis Deladerriere. |
| Q | How was the Fund positioned relative to the MSCI EAFE Index at the end of the Reporting Period? |
| A | At the end of the Reporting Period, the Fund had more exposure to Belgium, South Korea, Ireland, Switzerland, Sweden, Taiwan and Russia relative to the MSCI EAFE Index and less exposure to the U.K., Australia, Germany and the Netherlands relative to the MSCI EAFE Index. At the end of the Reporting Period, the Fund held neutral positions relative to the MSCI EAFE Index in several countries and had no position at all in several other countries, most notably Hong Kong, Finland and Norway. |
| From a sector allocation perspective, the Fund had overweight positions relative to the MSCI EAFE Index in consumer staples and information technology at the end of the Reporting Period. On the same date, the Fund had underweighted positions compared to the MSCI EAFE Index in consumer discretionary, financials, industrials, health care, telecommunication services and utilities and rather neutral positions relative to the MSCI EAFE Index in energy and materials. |
| As always, we remained focused on individual stock selection, with sector and country positioning being a secondary, closely-monitored effect. |
23
FUND BASICS
Strategic International Equity Fund
as of October 31, 2014
| PERFORMANCE REVIEW | ||||||||||
| November 1, 2013–October 31, 2014 | Fund Total Return (based on NAV)1 | MSCI EAFE Index (Net, USD, Unhedged)2 | ||||||||
| Class A | -1.41 | % | -0.60 | % | ||||||
| Class B | -2.15 | -0.60 | ||||||||
| Class C | -2.10 | -0.60 | ||||||||
| Institutional | -1.05 | -0.60 | ||||||||
| Class IR | -1.14 | -0.60 | ||||||||
| Class R | -1.58 | -0.60 | ||||||||
| 1 | The net asset value (“NAV”) represents the net assets of the class of the Fund (ex-dividend) divided by the total number of shares of the class outstanding. The Fund’s performance assumes the reinvestment of dividends and other distributions. The Fund’s performance does not reflect the deduction of any applicable sales charges. |
| 2 | The MSCI® EAFE Index (Net, USD, Unhedged) is a market capitalization-weighted composite of securities in 22 developed markets. The Index approximates the minimum possible dividend reinvestment. The dividend is reinvested after deduction for withholding tax, applying the rate to non-resident individuals who do not benefit from double taxation treaties. MSCI Barra uses withholding tax rates applicable to Luxembourg holding companies, as Luxembourg applies the highest rates. The Index is unmanaged and the figures for the Index do not include any deduction for fees or expenses. It is not possible to invest directly in an index. |
| STANDARDIZED TOTAL RETURNS3 | ||||||||||||||||
| For the period ended 9/30/14 | One Year | Five Years | Since Inception | Inception Date | ||||||||||||
| Class A | -2.57 | % | 5.36 | % | -1.16 | % | 6/25/07 | |||||||||
| Class B | -2.69 | 5.40 | -1.16 | 6/25/07 | ||||||||||||
| Class C | 1.31 | 5.76 | -1.14 | 6/25/07 | ||||||||||||
| Institutional | 3.51 | 6.96 | -0.01 | 6/25/07 | ||||||||||||
| Class IR | 3.39 | 6.91 | -1.18 | 11/30/07 | ||||||||||||
| Class R | 2.84 | 6.29 | -1.74 | 11/30/07 | ||||||||||||
| 3 | The Standardized Total Returns are average annual total returns as of the most recent calendar quarter-end. They assume reinvestment of all distributions at NAV. These returns reflect a maximum initial sales charge of 5.5% for Class A Shares, the assumed contingent deferred sales charge for Class B Shares (5% maximum declining to 0% after six years) and the assumed contingent deferred sales charge for Class C Shares (1% if redeemed within 12 months of purchase). Class B Shares convert automatically to Class A Shares on or about the fifteenth day of the last month of the calendar quarter that is eight years after purchase. Returns for Class B Shares for the period after conversion reflect the performance of Class A Shares. Because Institutional, Class R and Class IR Shares do not involve a sales charge, such a charge is not applied to their Standardized Total Returns. The Fund’s Class B Shares are no longer available for purchase by new or existing shareholders. |
The returns set forth in the tables above represent past performance. Past performance does not guarantee future results. The Fund’s investment return and principal value will fluctuate so that an investor’s shares, when redeemed, may be worth more or less than their original cost. Current performance may be lower or higher than the performance quoted above. Please visit our web site at www.GSAMFUNDS.com to obtain the most recent month-end returns. Performance reflects applicable fee waivers and/or expense limitations in effect during the periods shown. In their absence, performance would be reduced. Returns do not reflect the deduction of taxes that a shareholder would pay on Fund distributions or the redemption of Fund shares.
24
FUND BASICS
| EXPENSE RATIOS4 | ||||||||||
| Net Expense Ratio (Current) | Gross Expense Ratio (Before Waivers) | |||||||||
| Class A | 1.33 | % | 1.88 | % | ||||||
| Class B | 2.08 | 2.63 | ||||||||
| Class C | 2.08 | 2.63 | ||||||||
| Institutional | 0.93 | 1.48 | ||||||||
| Class IR | 1.08 | 1.63 | ||||||||
| Class R | 1.58 | 2.12 | ||||||||
| 4 | The expense ratios of the Fund, both current (net of applicable fee waivers and/or expense limitations) and before waivers (gross of applicable fee waivers and/or expense limitations) are as set forth above according to the most recent publicly available Prospectus for the Fund and may differ from the expense ratios disclosed in the Financial Highlights in this report. Pursuant to a contractual arrangement, the Fund’s waivers and/or expense limitations will remain in place through at least February 28, 2015, and prior to such date the Investment Adviser may not terminate the arrangements without the approval of the Fund’s Board of Trustees. If these arrangements are discontinued in the future, the expense ratios may change without shareholder approval. |
| TOP TEN HOLDINGS AS OF 10/31/145 | ||||||||||
| Holding | % of Net Assets | Line of Business | Country | |||||||
| iShares MSCI Japan Fund | 6.0 | % | Exchange Traded Fund | United States | ||||||
| Novartis AG (Registered) | 3.9 | Pharmaceuticals, Biotechnology & Life Sciences | Switzerland | |||||||
| Vodafone Group PLC | 2.7 | Telecommunication Services | United Kingdom | |||||||
| Anheuser-Busch InBev NV | 2.5 | Food, Beverage & Tobacco | Belgium | |||||||
| Mitsubishi UFJ Financial Group, Inc. | 2.4 | Banks | Japan | |||||||
| Intesa Sanpaolo SpA | 2.4 | Banks | Italy | |||||||
| Bayer AG (Registered) | 2.4 | Pharmaceuticals, Biotechnology & Life Sciences | Germany | |||||||
| Total SA | 2.4 | Energy | France | |||||||
| Novo Nordisk A/S Class B | 2.3 | Pharmaceuticals, Biotechnology & Life Sciences | Denmark | |||||||
| Credit Suisse Group AG (Registered) | 2.2 | Diversified Financials | Switzerland | |||||||
| 5 | The top 10 holdings may not be representative of the Fund’s future investments. |
25
FUND BASICS
| FUND VS. BENCHMARK SECTOR ALLOCATIONS6 |
| As of October 31, 2014 |
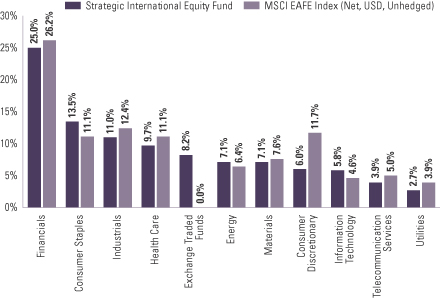
| 6 | The Fund is actively managed and, as such, its composition may differ over time. Consequently, the Fund’s overall sector allocations may differ from percentages contained in the graph above. The graph categorizes investments using Global Industry Classification Standard (“GICS”), however, the sector classifications used by the portfolio management team may differ from GICS. Underlying sector allocations of exchange traded funds held by the Fund are not reflected in the graph above. The percentage shown for each investment category reflects the value of investments in that category as a percentage of market value. The graph depicts the Fund’s investments but may not represent the Fund’s market exposure due to the exclusion of certain derivatives, if any, as listed in the Additional Investment Information section of the Schedule of Investments. |
26
GOLDMAN SACHS STRATEGIC INTERNATIONAL EQUITY FUND
Performance Summary
October 31, 2014
The following graph shows the value, as of October 31, 2014, of a $10,000 investment made on June 25, 2007 (commencement of operations) in Institutional Shares at NAV. For comparative purposes, the performance of the Fund’s benchmark, the MSCI® EAFE Index (Net, USD, Unhedged) is shown. This performance data represents past performance and should not be considered indicative of future performance, which will fluctuate with changes in market conditions. These performance fluctuations will cause an investor’s shares, when redeemed, to be worth more or less than their original cost. Performance reflects applicable fee waivers and/or expense limitations in effect during the periods shown and in their absence, performance would be reduced. Returns do not reflect the deduction of taxes that a shareholder would pay on Fund distributions or the redemption of Fund shares. Performance of Class A, Class B, Class C, Class IR and Class R Shares will vary from Institutional Shares due to differences in class specific fees and any applicable sales charges. In addition to the Investment Adviser’s decisions regarding issuer/industry/country investment selection and allocation, other factors may affect Fund performance. These factors include, but are not limited to, Fund operating fees and expenses, portfolio turnover, and subscription and redemption cash flows affecting the Fund.
| Strategic International Equity Fund’s Lifetime Performance |
Performance of a $10,000 Investment, with distributions reinvested, from June 25, 2007 through October 31, 2014.
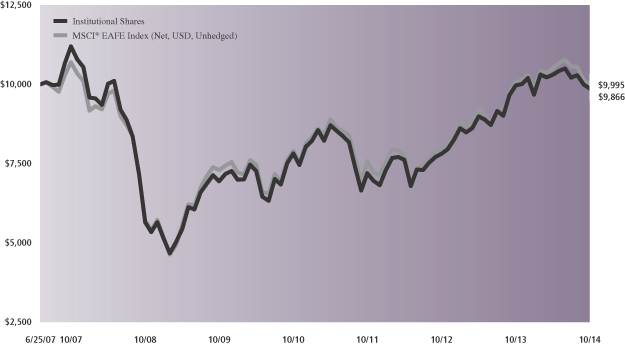
| Average Annual Total Return through October 31, 2014 | One Year | Five Years | Since Inception | |||||||
Class A (Commenced June 25, 2007) | ||||||||||
Excluding sales charges | -1.41% | 6.88% | -0.56% | |||||||
Including sales charges | -6.81% | 5.69% | -1.32% | |||||||
|
|
|
|
|
| |||||
Class B (Commenced June 25, 2007)* | ||||||||||
Excluding contingent deferred charges | -2.15% | 6.08% | -1.32% | |||||||
Including contingent deferred charges | -7.04% | 5.75% | -1.32% | |||||||
|
|
|
|
|
| |||||
Class C (Commenced June 25, 2007) | ||||||||||
Excluding contingent deferred charges | -2.10% | 6.09% | -1.30% | |||||||
Including contingent deferred charges | -3.08% | 6.09% | -1.30% | |||||||
|
|
|
|
|
| |||||
Institutional (Commenced June 25, 2007) | -1.05% | 7.28% | -0.18% | |||||||
|
|
|
|
|
| |||||
Class IR (Commenced November 30, 2007) | -1.14% | 7.24% | -1.34% | |||||||
|
|
|
|
|
| |||||
Class R (Commenced November 30, 2007) | -1.58% | 6.62% | -1.89% | |||||||
|
|
|
|
|
|
| * | Effective at the close of business on November 14, 2014, Class B Shares of the Fund have converted to Class A Shares of the Fund. In addition, effective October 15, 2014, all redemptions of Class B Shares have not been subject to a contingent deferred sales charge. Average annual total returns for Class B Shares through October 31, 2014 have not been adjusted to reflect this change. |
27
GOLDMAN SACHS FOCUSED INTERNATIONAL EQUITY FUND
October 31, 2014
Shares | Description | Value | ||||||
| Common Stocks – 96.8% | ||||||||
| Australia – 5.0% | ||||||||
| 1,765,614 | Aurizon Holdings Ltd. (Transportation) | $ | 7,323,264 | |||||
| 482,616 | Computershare Ltd. (Software & Services) | 5,237,672 | ||||||
|
| |||||||
| 12,560,936 | ||||||||
|
| |||||||
| Belgium – 1.9% | ||||||||
| 34,923 | Solvay SA (Materials) | 4,767,680 | ||||||
|
| |||||||
| France – 6.6% | ||||||||
| 278,694 | Rexel SA (Capital Goods) | 4,684,579 | ||||||
| 120,620 | Safran SA (Capital Goods) | 7,639,291 | ||||||
| 46,725 | Sanofi (Pharmaceuticals, Biotechnology & Life Sciences) | 4,239,831 | ||||||
|
| |||||||
| 16,563,701 | ||||||||
|
| |||||||
| Germany – 5.2% | ||||||||
| 55,073 | Bayer AG (Registered) (Pharmaceuticals, Biotechnology & Life Sciences) | 7,876,638 | ||||||
| 61,862 | Beiersdorf AG (Household & Personal Products) | 5,015,700 | ||||||
|
| |||||||
| 12,892,338 | ||||||||
|
| |||||||
| Ireland – 3.6% | ||||||||
| 12,727,690 | Bank of Ireland (Banks)* | 5,032,148 | ||||||
| 918,022 | C&C Group PLC (Food, Beverage & Tobacco) | 4,088,590 | ||||||
|
| |||||||
| 9,120,738 | ||||||||
|
| |||||||
| Italy – 6.1% | ||||||||
| 348,436 | Banco Popolare SC (Banks)* | 5,061,460 | ||||||
| 3,432,473 | Intesa Sanpaolo SpA (Banks) | 10,090,645 | ||||||
|
| |||||||
| 15,152,105 | ||||||||
|
| |||||||
| Japan – 16.6% | ||||||||
| 264,700 | Credit Saison Co. Ltd. (Diversified Financials) | 5,587,911 | ||||||
| 555,600 | Isuzu Motors Ltd. (Automobiles & Components) | 7,249,125 | ||||||
| 380,000 | Kubota Corp. (Capital Goods) | 6,048,845 | ||||||
| 1,438,400 | Mitsubishi UFJ Financial Group, Inc. (Banks) | 8,384,743 | ||||||
| 78,100 | Nidec Corp. (Capital Goods) | 5,160,273 | ||||||
| 1,297,000 | Sumitomo Osaka Cement Co. Ltd. (Materials) | 4,054,438 | ||||||
| 707,700 | Tokyu Fudosan Holdings Corp. (Real Estate) | 5,029,845 | ||||||
|
| |||||||
| 41,515,180 | ||||||||
|
| |||||||
| Netherlands – 4.9% | ||||||||
| 344,097 | Royal Dutch Shell PLC Class A (Energy) | 12,291,748 | ||||||
|
| |||||||
| Common Stocks – (continued) | ||||||||
| South Korea – 4.4% | ||||||||
| 130,639 | Hana Financial Group, Inc. (Banks) | $ | 4,524,010 | |||||
| 132,503 | Kia Motors Corp. (Automobiles & Components) | 6,435,995 | ||||||
|
| |||||||
| 10,960,005 | ||||||||
|
| |||||||
| Spain – 5.0% | ||||||||
| 856,384 | Banco Popular Espanol SA (Banks) | 4,919,250 | ||||||
| 1,059,545 | Iberdrola SA (Utilities) | 7,500,430 | ||||||
|
| |||||||
| 12,419,680 | ||||||||
|
| |||||||
| Sweden – 5.9% | ||||||||
| 605,328 | Telefonaktiebolaget LM Ericsson Class B (Technology Hardware & Equipment) | 7,152,799 | ||||||
| 655,796 | Volvo AB Class B (Capital Goods) | 7,568,174 | ||||||
|
| |||||||
| 14,720,973 | ||||||||
|
| |||||||
| Switzerland – 16.1% | ||||||||
| 292,816 | Credit Suisse Group AG (Registered) (Diversified Financials)* | 7,801,732 | ||||||
| 116,070 | Julius Baer Group Ltd. (Diversified Financials)* | 5,088,245 | ||||||
| 56,398 | Novartis AG (Registered) (Pharmaceuticals, Biotechnology & Life Sciences) | 5,233,896 | ||||||
| 23,145 | Syngenta AG (Registered) (Materials) | 7,157,767 | ||||||
| 433,214 | UBS AG (Registered) (Diversified Financials)* | 7,532,787 | ||||||
| 141,377 | Wolseley PLC (Capital Goods) | 7,518,425 | ||||||
|
| |||||||
| 40,332,852 | ||||||||
|
| |||||||
| Taiwan – 3.0% | ||||||||
| 533,000 | MediaTek, Inc. (Semiconductors & Semiconductor Equipment) | 7,612,817 | ||||||
|
| |||||||
| United Kingdom – 12.5% | ||||||||
| 398,116 | BG Group PLC (Energy) | 6,635,014 | ||||||
| 1,310,386 | Melrose Industries PLC (Capital Goods) | 5,385,796 | ||||||
| 92,263 | Reckitt Benckiser Group PLC (Household & Personal Products) | 7,770,714 | ||||||
| 489,697 | Tullow Oil PLC (Energy) | 3,821,587 | ||||||
| 2,318,136 | Vodafone Group PLC (Telecommunication Services) | 7,708,860 | ||||||
|
| |||||||
| 31,321,971 | ||||||||
|
| |||||||
| TOTAL COMMON STOCKS | ||||||||
| (Cost $266,298,764) | $ | 242,232,724 | ||||||
|
| |||||||
| 28 | The accompanying notes are an integral part of these financial statements. |
GOLDMAN SACHS FOCUSED INTERNATIONAL EQUITY FUND
Shares | Description | Value | ||||||
| Exchange Traded Fund – 2.3% | ||||||||
| United States – 2.3% | ||||||||
| 483,733 | iShares MSCI Japan Fund | $ | 5,833,820 | |||||
| (Cost $5,889,219) | ||||||||
|
| |||||||
| TOTAL INVESTMENTS – 99.1% | ||||||||
| (Cost $272,187,983) | $ | 248,066,544 | ||||||
|
| |||||||
| | OTHER ASSETS IN EXCESS OF LIABILITIES – 0.9% | 2,353,973 | ||||||
|
| |||||||
| NET ASSETS – 100.0% | $ | 250,420,517 | ||||||
|
| |||||||
| The percentage shown for each investment category reflects the value of investments in that category as a percentage of net assets. | ||
* | Non-income producing security. | |
| The accompanying notes are an integral part of these financial statements. | 29 |
GOLDMAN SACHS INTERNATIONAL SMALL CAP FUND
Schedule of Investments
October 31, 2014
| Shares | Description | Value | ||||||
| Common Stocks – 94.4% | ||||||||
| Australia – 5.9% | ||||||||
| 420,233 | Aveo Group (Real Estate) | $ | 765,989 | |||||
| 97,356 | Bank of Queensland Ltd. (Banks) | 1,082,287 | ||||||
| 143,872 | Boral Ltd. (Materials) | 631,910 | ||||||
| 44,421 | Caltex Australia Ltd. (Energy) | 1,223,495 | ||||||
| 173,243 | Computershare Ltd. (Software & Services) | 1,880,149 | ||||||
| 419,591 | Echo Entertainment Group Ltd. (Consumer Services) | 1,408,861 | ||||||
| 96,130 | GrainCorp Ltd. Class A (Food, Beverage & Tobacco) | 743,518 | ||||||
| 286,791 | Macquarie Atlas Roads Group (Transportation) | 767,531 | ||||||
| 156,491 | Navitas Ltd. (Consumer Services) | 731,320 | ||||||
| 34,105 | Seek Ltd. (Commercial & Professional Services) | 500,487 | ||||||
| 22,201 | Sirtex Medical Ltd. (Pharmaceuticals, Biotechnology & Life Sciences) | 509,802 | ||||||
| 140,173 | Super Retail Group Ltd. (Retailing) | 909,557 | ||||||
| 192,280 | Veda Group Ltd. (Commercial & Professional Services) | 387,805 | ||||||
|
| |||||||
| 11,542,711 | ||||||||
|
| |||||||
| Belgium – 2.2% | ||||||||
| 23,309 | Arseus NV (Health Care Equipment & Services) | 929,852 | ||||||
| 55,363 | bpost SA (Transportation) | 1,370,565 | ||||||
| 19,511 | Cie d’Entreprises CFE (Capital Goods) | 2,110,017 | ||||||
|
| |||||||
| 4,410,434 | ||||||||
|
| |||||||
| Canada – 8.3% | ||||||||
| 39,600 | Aimia, Inc. (Media) | 570,959 | ||||||
| 119,300 | Alamos Gold, Inc. (Materials) | 890,212 | ||||||
| 20,000 | Algonquin Power & Utilities Corp. (Utilities) | 163,258 | ||||||
| 11,100 | Amaya Gaming Group, Inc. (Consumer Services)* | 337,319 | ||||||
| 278,100 | B2Gold Corp. (Materials)* | 463,891 | ||||||
| 3,300 | Boardwalk Real Estate Investment Trust (REIT) | 209,059 | ||||||
| 19,300 | Bonterra Energy Corp. (Energy) | 867,691 | ||||||
| 19,696 | Canadian Solar, Inc. (Semiconductors & Semiconductor Equipment)* | 628,302 | ||||||
| 24,100 | Canadian Western Bank (Banks) | 807,218 | ||||||
| 6,000 | CCL Industries, Inc. Class B (Materials) | 606,575 | ||||||
| 76,500 | Celestica, Inc. (Technology Hardware & Equipment)* | 840,309 | ||||||
| 8,600 | Cogeco Cable, Inc. (Media) | 468,973 | ||||||
| 52,300 | Element Financial Corp. (Diversified Financials)* | 607,897 | ||||||
| 63,200 | Enerflex Ltd. (Energy) | 902,817 | ||||||
| 10,300 | FirstService Corp. (Real Estate) | 544,313 | ||||||
| 14,100 | Home Capital Group, Inc. (Banks) | 675,819 | ||||||
| 11,000 | Laurentian Bank of Canada (Banks) | 483,900 | ||||||
| 3,989 | MacDonald Dettwiler & Associates Ltd. (Capital Goods) | 304,170 | ||||||
|
| |||||||
| Common Stocks – (continued) | ||||||||
| Canada – (continued) | ||||||||
| 11,600 | Maple Leaf Foods, Inc. (Food, Beverage & Tobacco) | $ | 200,701 | |||||
| 11,500 | Methanex Corp. (Materials) | 683,439 | ||||||
| 42,100 | Mullen Group Ltd. (Energy) | 818,056 | ||||||
| 29,700 | Northland Power, Inc. (Utilities) | 441,923 | ||||||
| 12,600 | Parkland Fuel Corp. (Energy) | 246,511 | ||||||
| 14,700 | Progressive Waste Solutions Ltd. (Commercial & Professional Services) | 429,372 | ||||||
| 10,800 | ShawCor Ltd. (Energy) | 475,773 | ||||||
| 13,300 | Stantec, Inc. (Commercial & Professional Services) | 842,689 | ||||||
| 107,500 | Surge Energy, Inc. (Energy) | 596,136 | ||||||
| 40,500 | Veresen, Inc. (Energy) | 635,682 | ||||||
| 18,500 | WestJet Airlines Ltd. (Transportation) | 524,280 | �� | |||||
|
| |||||||
| 16,267,244 | ||||||||
|
| |||||||
| China – 2.4% | ||||||||
| 9,374 | Ctrip.com International Ltd. ADR (Retailing)* | 546,504 | ||||||
| 1,339,000 | FIH Mobile Ltd. (Technology Hardware & Equipment)* | 713,355 | ||||||
| 25,158 | Hollysys Automation Technologies Ltd. (Technology Hardware & Equipment)* | 617,126 | ||||||
| 1,945,000 | PW Medtech Group Ltd. (Health Care Equipment & Services)* | 1,228,060 | ||||||
| 216,500 | Shanghai Fosun Pharmaceutical Group Co. Ltd. Class H (Pharmaceuticals, Biotechnology & Life Sciences) | 779,463 | ||||||
| 28,392 | TAL Education Group ADR (Consumer Services)* | 901,730 | ||||||
|
| |||||||
| 4,786,238 | ||||||||
|
| |||||||
| Denmark – 0.3% | ||||||||
| 24,935 | GN Store Nord A/S (Health Care Equipment & Services) | 580,174 | ||||||
|
| |||||||
| France – 7.5% | ||||||||
| 23,192 | Cap Gemini SA (Software & Services) | 1,525,944 | ||||||
| 109,868 | Coface SA (Diversified Financials)* | 1,369,978 | ||||||
| 14,578 | Eramet (Materials)* | 1,354,470 | ||||||
| 27,056 | Ingenico (Technology Hardware & Equipment) | 2,695,409 | ||||||
| 22,061 | Ipsen SA (Pharmaceuticals, Biotechnology & Life Sciences) | 1,084,398 | ||||||
| 45,491 | JCDecaux SA (Media) | 1,509,884 | ||||||
| 64,081 | Klepierre (REIT) | 2,773,548 | ||||||
| 45,833 | Nexity SA (Real Estate) | 1,645,500 | ||||||
| 42,202 | UBISOFT Entertainment (Software & Services)* | 764,083 | ||||||
|
| |||||||
| 14,723,214 | ||||||||
|
| |||||||
| Germany – 4.7% | ||||||||
| 42,021 | Brenntag AG (Capital Goods) | 2,038,926 | ||||||
| 12,778 | GEA Group AG (Capital Goods) | 589,419 | ||||||
| 39,588 | Gerry Weber International AG (Consumer Durables & Apparel) | 1,592,311 | ||||||
|
| |||||||
| 30 | The accompanying notes are an integral part of these financial statements. |
GOLDMAN SACHS INTERNATIONAL SMALL CAP FUND
| Shares | Description | Value | ||||||
| Common Stocks – (continued) | ||||||||
| Germany – (continued) | ||||||||
| 31,223 | GfK SE (Media) | $ | 1,292,671 | |||||
| 77,270 | Infineon Technologies AG (Semiconductors & Semiconductor Equipment) | 752,820 | ||||||
| 20,785 | Leoni AG (Automobiles & Components) | 1,193,962 | ||||||
| 37,626 | Salzgitter AG (Materials) | 1,136,264 | ||||||
| 12,147 | Symrise AG (Materials) | 684,840 | ||||||
|
| |||||||
| 9,281,213 | ||||||||
|
| |||||||
| Ireland – 1.0% | ||||||||
| 484,900 | Beazley PLC (Insurance) | 2,036,684 | ||||||
|
| |||||||
| Italy – 3.2% | ||||||||
| 70,226 | Buzzi Unicem SpA (Materials) | 950,225 | ||||||
| 16,234 | Ei Towers SpA (Technology Hardware & Equipment)* | 813,746 | ||||||
| 129,539 | MARR SpA (Food & Staples Retailing) | 2,065,731 | ||||||
| 40,433 | Moncler SpA (Consumer Durables & Apparel) | 561,180 | ||||||
| 250,920 | Unione di Banche Italiane SCpA (Banks) | 1,970,599 | ||||||
|
| |||||||
| 6,361,481 | ||||||||
|
| |||||||
| Japan – 19.6% | ||||||||
| 31,700 | Asahi Intecc Co. Ltd. (Health Care Equipment & Services) | 1,452,779 | ||||||
| 86,700 | Asics Corp. (Consumer Durables & Apparel) | 2,030,249 | ||||||
| 100,000 | Broccoli Co. Ltd. (Media) | 1,299,753 | ||||||
| 171,800 | Daibiru Corp. (Real Estate) | 1,935,241 | ||||||
| 161,000 | Daicel Corp. (Materials) | 1,855,922 | ||||||
| 19,400 | Disco Corp. (Semiconductors & Semiconductor Equipment) | 1,324,230 | ||||||
| 70,400 | Eiken Chemical Co. Ltd. (Health Care Equipment & Services) | 1,228,673 | ||||||
| 106,300 | en-japan, Inc. (Commercial & Professional Services) | 1,874,024 | ||||||
| 41,700 | FP Corp. (Materials) | 1,201,831 | ||||||
| 41,800 | Fuji Seal International, Inc. (Materials) | 1,260,003 | ||||||
| 52,000 | HIS Co. Ltd. (Consumer Services) | 1,350,854 | ||||||
| 98,600 | J. Front Retailing Co. Ltd. (Retailing) | 1,312,351 | ||||||
| 121,700 | M3, Inc. (Health Care Equipment & Services) | 2,030,987 | ||||||
| 63,200 | Maeda Kosen Co. Ltd. (Capital Goods) | 768,862 | ||||||
| 23,500 | Message Co. Ltd. (Health Care Equipment & Services) | 738,561 | ||||||
| 25,500 | Mitsuba Corp. (Automobiles & Components) | 405,870 | ||||||
| 346,000 | Mitsui Chemicals, Inc. (Materials) | 1,002,257 | ||||||
| 350,000 | Mitsui Mining & Smelting Co. Ltd. (Materials) | 928,402 | ||||||
| 78,000 | Nachi-Fujikoshi Corp. (Capital Goods) | 484,715 | ||||||
| 11,100 | Obic Co. Ltd. (Software & Services) | 396,259 | ||||||
| 56,200 | Oyo Corp. (Commercial & Professional Services) | 996,329 | ||||||
|
| |||||||
| Common Stocks – (continued) | ||||||||
| Japan – (continued) | ||||||||
| 166,100 | Pocket Card Co. Ltd. (Diversified Financials) | $ | 1,013,402 | |||||
| 276,000 | Sankyu, Inc. (Transportation) | 1,276,021 | ||||||
| 218,000 | SCREEN Holdings Co. Ltd. (Semiconductors & Semiconductor Equipment) | 1,188,208 | ||||||
| 397,000 | Seiko Holdings Corp. (Consumer Durables & Apparel) | 1,978,464 | ||||||
| 34,400 | Ship Healthcare Holdings, Inc. (Health Care Equipment & Services) | 805,173 | ||||||
| 242,000 | Takuma Co. Ltd. (Capital Goods) | 1,545,072 | ||||||
| 143,000 | The 77 Bank Ltd. (Banks) | 798,341 | ||||||
| 531,000 | The Nishi-Nippon City Bank Ltd. (Banks) | 1,455,588 | ||||||
| 124,600 | Tosei Corp. (Real Estate) | 839,778 | ||||||
| 41,600 | Tv Tokyo Holdings Corp. (Media) | 838,725 | ||||||
| 95,000 | Zeon Corp. (Materials) | 879,350 | ||||||
|
| |||||||
| 38,496,274 | ||||||||
|
| |||||||
| Luxembourg – 0.9% | ||||||||
| 526,454 | Regus PLC (Commercial & Professional Services) | 1,667,828 | ||||||
|
| |||||||
| Netherlands – 0.8% | ||||||||
| 70,901 | Delta Lloyd NV (Insurance) | 1,616,065 | ||||||
|
| |||||||
| New Zealand – 0.5% | ||||||||
| 143,031 | Fletcher Building Ltd. (Materials) | 970,888 | ||||||
|
| |||||||
| Portugal – 0.6% | ||||||||
| 134,739 | CTT-Correios de Portugal SA (Transportation) | 1,248,795 | ||||||
|
| |||||||
| Singapore – 0.8% | ||||||||
| 11,635,000 | SIIC Environment Holdings Ltd. (Utilities)* | 1,532,375 | ||||||
|
| |||||||
| South Africa – 0.4% | ||||||||
| 40,468 | Mondi PLC (Materials) | 683,928 | ||||||
|
| |||||||
| South Korea – 3.0% | ||||||||
| 2,541 | CJ CheilJedang Corp. (Food, Beverage & Tobacco) | 927,787 | ||||||
| 15,597 | Grand Korea Leisure Co. Ltd. (Consumer Services) | 558,518 | ||||||
| 54,341 | Hanjin Kal Corp. (Transportation)* | 1,346,980 | ||||||
| 11,924 | Kolon Industries, Inc. (Materials) | 608,066 | ||||||
| 19,355 | KONA I Co. Ltd. (Technology Hardware & Equipment) | 790,181 | ||||||
| 26,878 | KT Skylife Co. Ltd. (Media) | 488,732 | ||||||
| 53,541 | LiHOM-CUCHEN Co. Ltd. (Consumer Durables & Apparel)* | 581,452 | ||||||
| 13,469 | OCI Materials Co. Ltd. (Materials) | 641,252 | ||||||
|
| |||||||
| 5,942,968 | ||||||||
|
| |||||||
| Spain – 1.5% | ||||||||
| 33,413 | Enagas SA (Utilities) | 1,121,332 | ||||||
| 38,054 | Tecnicas Reunidas SA (Energy) | 1,874,663 | ||||||
|
| |||||||
| 2,995,995 | ||||||||
|
| |||||||
| The accompanying notes are an integral part of these financial statements. | 31 |
GOLDMAN SACHS INTERNATIONAL SMALL CAP FUND
Schedule of Investments (continued)
October 31, 2014
| Shares | Description | Value | ||||||
| Common Stocks – (continued) | ||||||||
| Sweden – 2.1% | ||||||||
| 68,400 | Boliden AB (Materials) | $ | 1,130,471 | |||||
| 207,677 | Com Hem Holding AB (Telecommunication Services)* | 1,544,046 | ||||||
| 35,954 | Indutrade AB (Capital Goods) | 1,451,879 | ||||||
|
| |||||||
| 4,126,396 | ||||||||
|
| |||||||
| Switzerland – 5.7% | ||||||||
| 10,307 | Actelion Ltd. (Registered) (Pharmaceuticals, Biotechnology & Life Sciences)* | 1,227,514 | ||||||
| 22,468 | Aryzta AG (Food, Beverage & Tobacco)* | 1,916,557 | ||||||
| 376 | Chocoladefabriken Lindt & Sprungli AG (Food, Beverage & Tobacco) | 1,887,134 | ||||||
| 82,002 | Gategroup Holding AG (Commercial & Professional Services)* | 1,847,786 | ||||||
| 2,834 | Geberit AG (Registered) (Capital Goods) | 967,345 | ||||||
| 26,638 | Implenia AG (Registered) (Capital Goods)* | 1,436,197 | ||||||
| 44,444 | Julius Baer Group Ltd. (Diversified Financials)* | 1,948,324 | ||||||
|
| |||||||
| 11,230,857 | ||||||||
|
| |||||||
| Taiwan – 0.9% | ||||||||
| 590,000 | Chipbond Technology Corp. (Semiconductors & Semiconductor Equipment) | 1,087,892 | ||||||
| 60,120 | Eclat Textile Co. Ltd. (Consumer Durables & Apparel) | 573,496 | ||||||
|
| |||||||
| 1,661,388 | ||||||||
|
| |||||||
| United Kingdom – 21.7% | ||||||||
| 188,556 | Alent PLC (Materials) | 1,019,519 | ||||||
| 182,016 | Ashmore Group PLC (Diversified Financials) | 929,448 | ||||||
| 131,479 | Ashtead Group PLC (Capital Goods) | 2,202,831 | ||||||
| 42,297 | Bellway PLC (Consumer Durables & Apparel) | 1,186,478 | ||||||
| 213,374 | Big Yellow Group PLC (REIT) | 1,865,101 | ||||||
| 165,808 | Bodycote PLC (Capital Goods) | 1,659,521 | ||||||
| 155,842 | BTG PLC (Pharmaceuticals, Biotechnology & Life Sciences)* | 1,883,782 | ||||||
| 367,311 | Cairn Energy PLC (Energy)* | 858,992 | ||||||
| 58,740 | Close Brothers Group PLC (Diversified Financials) | 1,378,457 | ||||||
| 91,998 | Drax Group PLC (Utilities) | 875,361 | ||||||
| 156,084 | Greene King PLC (Consumer Services) | 2,006,687 | ||||||
| 172,749 | Halma PLC (Technology Hardware & Equipment) | 1,723,677 | ||||||
| 1,110,247 | Hays PLC (Commercial & Professional Services) | 2,192,742 | ||||||
| 214,748 | Inchcape PLC (Retailing) | 2,392,360 | ||||||
| 360,055 | Jupiter Fund Management PLC (Diversified Financials) | 2,064,837 | ||||||
|
| |||||||
| Common Stocks – (continued) | ||||||||
| United Kingdom – (continued) | ||||||||
| 812,702 | Londonmetric Property PLC (REIT) | $ | 1,916,317 | |||||
| 510,770 | Melrose Industries PLC (Capital Goods) | 2,099,307 | ||||||
| 88,997 | Persimmon PLC (Consumer Durables & Apparel)* | 2,090,111 | ||||||
| 166,547 | Rexam PLC (Materials) | 1,269,400 | ||||||
| 420,446 | SIG PLC (Capital Goods) | 985,762 | ||||||
| 233,231 | Smart Metering Systems PLC (Technology Hardware & Equipment) | 1,316,575 | ||||||
| 41,516 | Spirax-Sarco Engineering PLC (Capital Goods) | 1,897,013 | ||||||
| 234,626 | Spire Healthcare Group PLC (Health Care Equipment & Services)*(a) | 1,050,927 | ||||||
| 191,195 | St. James’s Place PLC (Insurance) | 2,286,175 | ||||||
| 292,510 | The Unite Group PLC (Real Estate) | 1,999,978 | ||||||
| 52,059 | Victrex PLC (Materials) | 1,414,123 | ||||||
|
| |||||||
| 42,565,481 | ||||||||
|
| |||||||
| United States – 0.4% | ||||||||
| 44,800 | Tahoe Resources, Inc. (Materials)* | 776,313 | ||||||
|
| |||||||
| TOTAL COMMON STOCKS | ||||||||
| (Cost $186,252,727) | $ | 185,504,944 | ||||||
|
| |||||||
| Preferred Stock – 0.6% | ||||||||
| Germany – 0.6% | ||||||||
| 11,019 | Sartorius AG (Health Care Equipment & Services) | $ | 1,202,543 | |||||
| (Cost $1,244,605) | ||||||||
|
| |||||||
| Exchange Traded Funds – 1.4% | ||||||||
| United States – 1.4% | ||||||||
| 20,913 | iShares MSCI Israel Capped Fund | $ | 1,022,437 | |||||
| 28,723 | iShares MSCI South Korea Capped Fund | 1,684,029 | ||||||
|
| |||||||
| TOTAL EXCHANGE TRADED FUNDS | ||||||||
| (Cost $2,822,259) | $ | 2,706,466 | ||||||
|
| |||||||
| TOTAL INVESTMENTS – 96.4% | ||||||||
| (Cost $190,319,591) | $ | 189,413,953 | ||||||
|
| |||||||
| | OTHER ASSETS IN EXCESS OF LIABILITIES – 3.6% | 7,141,935 | ||||||
|
| |||||||
| NET ASSETS – 100.0% | $ | 196,555,888 | ||||||
|
| |||||||
| The percentage shown for each investment category reflects the value of investments in that category as a percentage of net assets. | ||
* | Non-income producing security. | |
(a) | Exempt from registration under Rule 144A of the Securities Act of 1933. Under procedures approved by the Board of Trustees, such securities have been determined to be liquid by the Investment Adviser and may be resold, normally to qualified institutional buyers in transactions exempt from registration. Total market value of Rule 144A securities amounts to $1,050,927, which represents approximately 0.5% of net assets as of October 31, 2014. | |
| 32 | The accompanying notes are an integral part of these financial statements. |
GOLDMAN SACHS INTERNATIONAL SMALL CAP FUND
| ||
Investment Abbreviations: | ||
ADR | —American Depositary Receipt | |
REIT | —Real Estate Investment Trust | |
Currency Abbreviations: | ||
CHF | —Swiss Franc | |
GBP | —British Pound | |
USD | —United States Dollar | |
| ||
| ADDITIONAL INVESTMENT INFORMATION |
FUTURES CONTRACTS — At October 31, 2014, the Fund had the following futures contracts:
| Type | Number of Contracts Long (Short) | Expiration Date | Current Value | Unrealized Gain (Loss) | ||||||||||
MSCI Singapore Index | 8 | November 2014 | $ | 460,185 | $ | 8,675 | ||||||||
FORWARD FOREIGN CURRENCY EXCHANGE CONTRACTS — At October 31, 2014, the Fund had the following forward foreign currency exchange contracts:
FORWARD FOREIGN CURRENCY EXCHANGE CONTRACT WITH UNREALIZED GAIN
| Counterparty | Contracts to Buy/Sell | Settlement Date | Current Value | Unrealized Gain | ||||||||
Westpac Banking Corp. | USD/GBP | 12/22/14 | $ | 12,246,572 | $ | 253,428 | ||||||
FORWARD FOREIGN CURRENCY EXCHANGE CONTRACTS WITH UNREALIZED LOSS
| Counterparty | Contracts to Buy/Sell | Settlement Date | Current Value | Unrealized Loss | ||||||||
UBS AG | GBP/USD | 12/22/14 | $ | 12,246,572 | $ | (350,959 | ) | |||||
Westpac Banking Corp. | CHF/USD | 11/06/14 | 171,710 | (3,062 | ) | |||||||
| TOTAL | $ | (354,021 | ) | |||||||||
| The accompanying notes are an integral part of these financial statements. | 33 |
GOLDMAN SACHS STRATEGIC INTERNATIONAL EQUITY FUND
Schedule of Investments
October 31, 2014
| Shares | Description | Value | ||||||
| Common Stocks – 89.3% | ||||||||
| Australia – 4.9% | ||||||||
| 286,176 | Aurizon Holdings Ltd. (Transportation) | $ | 1,186,977 | |||||
| 42,498 | Australia & New Zealand Banking Group Ltd. (Banks) | 1,257,540 | ||||||
| 109,006 | Computershare Ltd. (Software & Services) | 1,183,006 | ||||||
|
| |||||||
| 3,627,523 | ||||||||
|
| |||||||
| Belgium – 3.5% | ||||||||
| 16,662 | Anheuser-Busch InBev NV (Food, Beverage & Tobacco) | 1,847,722 | ||||||
| 5,325 | Solvay SA (Materials) | 726,968 | ||||||
|
| |||||||
| 2,574,690 | ||||||||
|
| |||||||
| China – 0.7% | ||||||||
| 116,000 | China Mengniu Dairy Co. Ltd. (Food, Beverage & Tobacco) | 512,396 | ||||||
|
| |||||||
| Denmark – 2.3% | ||||||||
| 37,828 | Novo Nordisk A/S Class B (Pharmaceuticals, Biotechnology & Life Sciences) | 1,709,929 | ||||||
|
| |||||||
| France – 8.6% | ||||||||
| 9,889 | Air Liquide SA (Materials) | 1,193,759 | ||||||
| 4,153 | Air Liquide SA-Prime De Fidelite (Materials)* | 501,333 | ||||||
| 25,879 | Klepierre (REIT) | 1,120,092 | ||||||
| 17,879 | Safran SA (Capital Goods) | 1,132,340 | ||||||
| 7,081 | Sanofi (Pharmaceuticals, Biotechnology & Life Sciences) | 642,531 | ||||||
| 29,401 | Total SA (Energy) | 1,755,337 | ||||||
|
| |||||||
| 6,345,392 | ||||||||
|
| |||||||
| Germany – 7.1% | ||||||||
| 7,966 | Adidas AG (Consumer Durables & Apparel) | 580,451 | ||||||
| 12,300 | Bayer AG (Registered) (Pharmaceuticals, Biotechnology & Life Sciences) | 1,759,168 | ||||||
| 15,297 | Beiersdorf AG (Household & Personal Products) | 1,240,263 | ||||||
| 15,996 | GEA Group AG (Capital Goods) | 737,858 | ||||||
| 10,030 | Leoni AG (Automobiles & Components) | 576,158 | ||||||
| 7,202 | Rocket Internet AG (Software & Services)*(a) | 383,570 | ||||||
|
| |||||||
| 5,277,468 | ||||||||
|
| |||||||
| India – 0.9% | ||||||||
| 46,398 | Thermax Ltd. (Capital Goods) | 675,491 | ||||||
|
| |||||||
| Ireland – 2.7% | ||||||||
| 2,491,250 | Bank of Ireland (Banks)* | 984,966 | ||||||
| 14,301 | Kerry Group PLC Class A (Food, Beverage & Tobacco) | 971,155 | ||||||
|
| |||||||
| 1,956,121 | ||||||||
|
| |||||||
| Common Stocks – (continued) | ||||||||
| Italy – 3.3% | ||||||||
| 47,665 | Banco Popolare SC (Banks)* | $ | 692,392 | |||||
| 603,435 | Intesa Sanpaolo SpA (Banks) | 1,773,954 | ||||||
|
| |||||||
| 2,466,346 | ||||||||
|
| |||||||
| Japan – 15.3% | ||||||||
| 38,500 | Credit Saison Co. Ltd. (Diversified Financials) | 812,749 | ||||||
| 8,200 | Disco Corp. (Semiconductors & Semiconductor Equipment) | 559,726 | ||||||
| 36,000 | Japan Tobacco, Inc. (Food, Beverage & Tobacco) | 1,228,286 | ||||||
| 12,000 | KDDI Corp. (Telecommunication Services) | 788,033 | ||||||
| 53,000 | Kubota Corp. (Capital Goods) | 843,655 | ||||||
| 305,100 | Mitsubishi UFJ Financial Group, Inc. (Banks) | 1,778,493 | ||||||
| 23,200 | Nidec Corp. (Capital Goods) | 1,532,885 | ||||||
| 25,400 | Pola Orbis Holdings, Inc. (Household & Personal Products) | 1,043,118 | ||||||
| 143,000 | Sumitomo Osaka Cement Co. Ltd. (Materials) | 447,020 | ||||||
| 136,800 | Tokyu Fudosan Holdings Corp. (Real Estate) | 972,280 | ||||||
| 55,500 | Unicharm Corp. (Household & Personal Products) | 1,290,567 | ||||||
|
| |||||||
| 11,296,812 | ||||||||
|
| |||||||
| Luxembourg – 0.8% | ||||||||
| 16,212 | SES SA FDR (Media) | 559,665 | ||||||
|
| |||||||
| Netherlands – 3.2% | ||||||||
| 101,500 | Aegon NV (Insurance) | 827,271 | ||||||
| 43,416 | Royal Dutch Shell PLC Class A (Energy) | 1,550,895 | ||||||
|
| |||||||
| 2,378,166 | ||||||||
|
| |||||||
| Russia – 1.2% | ||||||||
| 3,264 | OJSC Magnit (Food & Staples Retailing)* | 902,909 | ||||||
|
| |||||||
| Singapore – 1.2% | ||||||||
| 61,105 | DBS Group Holdings Ltd. (Banks) | 879,021 | ||||||
|
| |||||||
| South Korea – 2.3% | ||||||||
| 20,380 | Hana Financial Group, Inc. (Banks) | 705,757 | ||||||
| 21,076 | Kia Motors Corp. (Automobiles & Components) | 1,023,713 | ||||||
|
| |||||||
| 1,729,470 | ||||||||
|
| |||||||
| Spain – 4.5% | ||||||||
| 99,402 | Banco Bilbao Vizcaya Argentaria SA (Banks) | 1,111,801 | ||||||
| 172,606 | Banco Popular Espanol SA (Banks) | 991,485 | ||||||
| 169,610 | Iberdrola SA (Utilities) | 1,200,655 | ||||||
|
| |||||||
| 3,303,941 | ||||||||
|
| |||||||
| 34 | The accompanying notes are an integral part of these financial statements. |
GOLDMAN SACHS STRATEGIC INTERNATIONAL EQUITY FUND
| Shares | Description | Value | ||||||
| Common Stocks – (continued) | ||||||||
| Sweden – 4.7% | ||||||||
| 24,187 | Hennes & Mauritz AB Class B (Retailing) | $ | 965,049 | |||||
| 30,947 | Svenska Cellulosa AB SCA Class B (Household & Personal Products) | 693,414 | ||||||
| 94,058 | Telefonaktiebolaget LM Ericsson Class B (Technology Hardware & Equipment) | 1,111,427 | ||||||
| 58,386 | Volvo AB Class B (Capital Goods) | 673,800 | ||||||
|
| |||||||
| 3,443,690 | ||||||||
|
| |||||||
| Switzerland – 12.4% | ||||||||
| 60,113 | Credit Suisse Group AG (Registered) (Diversified Financials)* | 1,601,639 | ||||||
| 20,938 | Julius Baer Group Ltd. (Diversified Financials)* | 917,874 | ||||||
| 30,904 | Novartis AG (Registered) (Pharmaceuticals, Biotechnology & Life Sciences) | 2,867,980 | ||||||
| 3,651 | Syngenta AG (Registered) (Materials) | 1,129,100 | ||||||
| 88,820 | UBS AG (Registered) (Diversified Financials)* | 1,544,415 | ||||||
| 21,277 | Wolseley PLC (Capital Goods) | 1,131,510 | ||||||
|
| |||||||
| 9,192,518 | ||||||||
|
| |||||||
| Taiwan – 1.3% | ||||||||
| 65,000 | MediaTek, Inc. (Semiconductors & Semiconductor Equipment) | 928,392 | ||||||
|
| |||||||
| United Kingdom – 8.4% | ||||||||
| 75,808 | BG Group PLC (Energy) | 1,263,419 | ||||||
| 77,841 | Drax Group PLC (Utilities) | 740,657 | ||||||
| 177,696 | ITV PLC (Media) | 577,278 | ||||||
| 22,637 | Rio Tinto PLC (Materials) | 1,077,101 | ||||||
| 67,360 | Tullow Oil PLC (Energy) | 525,676 | ||||||
| 595,521 | Vodafone Group PLC (Telecommunication Services) | 1,980,379 | ||||||
|
| |||||||
| 6,164,510 | ||||||||
|
| |||||||
| TOTAL COMMON STOCKS | ||||||||
| (Cost $65,317,787) | $ | 65,924,450 | ||||||
|
| |||||||
| Exchange Traded Funds – 8.0% | ||||||||
| United States – 8.0% | ||||||||
| 22,764 | iShares MSCI EAFE Fund | $ | 1,455,758 | |||||
| 369,601 | iShares MSCI Japan Fund | 4,457,388 | ||||||
|
| |||||||
| TOTAL EXCHANGE TRADED FUNDS | ||||||||
| (Cost $5,823,242) | $ | 5,913,146 | ||||||
|
| |||||||
| TOTAL INVESTMENTS – 97.3% | ||||||||
| (Cost $71,141,029) | $ | 71,837,596 | ||||||
|
| |||||||
|
| OTHER ASSETS IN EXCESS OF LIABILITIES – 2.7% | 2,029,404 | ||||||
|
| |||||||
| NET ASSETS – 100.0% | $ | 73,867,000 | ||||||
|
| |||||||
| The percentage shown for each investment category reflects the value of investments in that category as a percentage of net assets. | ||
* | Non-income producing security. | |
(a) | Exempt from registration under Rule 144A of the Securities Act of 1933. Under procedures approved by the Board of Trustees, such securities have been determined to be liquid by the Investment Adviser and may be resold, normally to qualified institutional buyers in transactions exempt from registration. Total market value of Rule 144A securities amounts to $383,570, which represents approximately 0.5% of net assets as of October 31, 2014. | |
| ||
Investment Abbreviations: | ||
FDR | —Fiduciary Depositary Receipt | |
REIT | —Real Estate Investment Trust | |
| ||
| The accompanying notes are an integral part of these financial statements. | 35 |
GOLDMAN SACHS FUNDAMENTAL INTERNATIONAL EQUITY FUNDS
Statements of Assets and Liabilities
October 31, 2014
| Focused International Equity Fund | International Small Cap Fund | Strategic International Equity Fund | ||||||||||||
| Assets: | ||||||||||||||
Investments, at value (cost $272,187,983, $190,319,591 and $71,141,029) | $ | 248,066,544 | $ | 189,413,953 | $ | 71,837,596 | ||||||||
Cash | 2,051,170 | 2,977,909 | 760,015 | |||||||||||
Foreign currencies, at value (cost $437,797, $85,947 and $102,518) | 435,258 | 84,631 | 100,298 | |||||||||||
Receivables: | ||||||||||||||
Dividends | 385,134 | 263,158 | 97,394 | |||||||||||
Foreign tax reclaims | 324,567 | 162,676 | 160,879 | |||||||||||
Reimbursement from investment adviser | 57,998 | 56,380 | 34,260 | |||||||||||
Fund shares sold | 57,613 | 3,725,397 | 7,381 | |||||||||||
Investments sold | — | 495,563 | 1,059,330 | |||||||||||
Unrealized gain on forward foreign currency exchange contracts | — | 253,428 | — | |||||||||||
Collateral on certain derivative contracts(a) | — | 10,954 | — | |||||||||||
Variation margin on certain derivative contracts | — | 9,114 | — | |||||||||||
Other assets | 71,604 | 5,096 | 569 | |||||||||||
| Total assets | 251,449,888 | 197,458,259 | 74,057,722 | |||||||||||
| Liabilities: | ||||||||||||||
Payables: | ||||||||||||||
Fund shares redeemed | 694,922 | 267,113 | 20,436 | |||||||||||
Management fees | 179,793 | 144,208 | 52,359 | |||||||||||
Distribution and Service fees and Transfer Agent fees | 46,600 | 15,386 | 15,915 | |||||||||||
Foreign capital gains taxes | — | — | 24,434 | |||||||||||
Unrealized loss on forward foreign currency exchange contracts | — | 354,021 | — | |||||||||||
Accrued expenses | 108,056 | 121,643 | 77,578 | |||||||||||
| Total liabilities | 1,029,371 | 902,371 | 190,722 | |||||||||||
| Net Assets: | ||||||||||||||
Paid-in capital | 471,730,788 | 203,570,629 | 114,600,153 | |||||||||||
Undistributed net investment income | 7,702,882 | 2,844,932 | 2,299,943 | |||||||||||
Accumulated net realized loss | (204,863,789 | ) | (8,841,165 | ) | (43,707,295 | ) | ||||||||
Net unrealized gain (loss) | (24,149,364 | ) | (1,018,508 | ) | 674,199 | |||||||||
| NET ASSETS | $ | 250,420,517 | $ | 196,555,888 | $ | 73,867,000 | ||||||||
Net Assets: | ||||||||||||||
Class A | $ | 58,367,686 | $ | 14,188,827 | $ | 22,383,703 | ||||||||
Class B | 266,348 | 230,333 | 1,347,876 | |||||||||||
Class C | 18,246,641 | 3,183,134 | 4,873,098 | |||||||||||
Institutional | 170,954,154 | 173,215,072 | 45,117,517 | |||||||||||
Service | 332,340 | 1,052,149 | — | |||||||||||
Class IR | 2,253,348 | 4,686,373 | 128,146 | |||||||||||
Class R | — | — | 16,660 | |||||||||||
Total Net Assets | $ | 250,420,517 | $ | 196,555,888 | $ | 73,867,000 | ||||||||
Shares outstanding $0.001 par value (unlimited shares authorized): | ||||||||||||||
Class A | 3,156,165 | 753,046 | 1,655,866 | |||||||||||
Class B | 14,676 | 12,472 | 112,039 | |||||||||||
Class C | 1,062,117 | 176,013 | 400,412 | |||||||||||
Institutional | 9,062,944 | 8,920,329 | 3,192,029 | |||||||||||
Service | 17,895 | 56,590 | — | |||||||||||
Class IR | 120,136 | 242,051 | 9,457 | |||||||||||
Class R | — | — | 1,228 | |||||||||||
Net asset value, offering and redemption price per share:(b) | ||||||||||||||
Class A | $18 .49 | $18 .84 | $13 .52 | |||||||||||
Class B | 18 .15 | 18 .47 | 12 .03 | |||||||||||
Class C | 17 .18 | 18 .08 | 12 .17 | |||||||||||
Institutional | 18 .86 | 19 .42 | 14 .13 | |||||||||||
Service | 18 .57 | 18 .59 | — | |||||||||||
Class IR | 18 .76 | 19 .36 | 13 .55 | |||||||||||
Class R | — | — | 13 .57 | |||||||||||
| (a) | Represents segregated cash for the International Small Cap Fund relating to collateral on futures transactions. |
| (b) | Maximum public offering price per share for Class A Shares of the Focused International Equity, International Small Cap and Strategic International Equity Funds is $19.57, $19.94 and $14.31, respectively. At redemption, Class B and Class C Shares may be subject to a contingent deferred sales charge assessed on the amount equal to the lesser of the current NAV or the original purchase price of the shares. |
| 36 | The accompanying notes are an integral part of these financial statements. |
GOLDMAN SACHS FUNDAMENTAL INTERNATIONAL EQUITY FUNDS
Statements of Operations
For the Fiscal Year Ended October 31, 2014
| Focused International Equity Fund | International Small Cap Fund | Strategic International Equity Fund | ||||||||||||
| Investment income: | ||||||||||||||
Dividends (net of foreign taxes withheld of $761,529, $384,318 and $193,889) | $ | 10,602,874 | $ | 4,978,684 | $ | 3,440,504 | ||||||||
| Expenses: | ||||||||||||||
Management fees | 2,584,295 | 2,249,102 | 649,800 | |||||||||||
Distribution and Service fees(a) | 361,696 | 72,871 | 134,444 | |||||||||||
Transfer Agent fees(a) | 235,097 | 114,588 | 77,906 | |||||||||||
Custody, accounting and administrative services | 185,405 | 195,002 | 111,899 | |||||||||||
Professional fees | 94,553 | 93,315 | 91,188 | |||||||||||
Registration fees | 79,752 | 82,640 | 77,597 | |||||||||||
Printing and mailing costs | 64,973 | 37,628 | 47,401 | |||||||||||
Trustee fees | 23,168 | 23,463 | 22,616 | |||||||||||
Service share fees — Service Plan | 893 | 2,651 | — | |||||||||||
Service share fees — Shareholder Administration Plan | 893 | 2,651 | — | |||||||||||
Other | 33,947 | 28,358 | 14,527 | |||||||||||
| Total expenses | 3,664,672 | 2,902,269 | 1,227,378 | |||||||||||
Less — expense reductions | (772,946 | ) | (554,632 | ) | (337,937 | ) | ||||||||
| Net expenses | 2,891,726 | 2,347,637 | 889,441 | |||||||||||
| NET INVESTMENT INCOME | 7,711,148 | 2,631,047 | 2,551,063 | |||||||||||
| Realized and unrealized gain (loss): | ||||||||||||||
Net realized gain (loss) from: | ||||||||||||||
Investments | 9,963,453 | 18,686,760 | 6,127,776 | |||||||||||
Futures contracts | (523 | ) | (138,499 | ) | — | |||||||||
Foreign currency transactions | (7,890 | ) | (41,678 | ) | (22,293 | ) | ||||||||
Net change in unrealized gain (loss) on: | ||||||||||||||
Investments (including the effects of the net change in the foreign capital gains tax liability of $12,969 for the Strategic International Equity Fund) | (37,372,097 | ) | (21,165,573 | ) | (9,620,656 | ) | ||||||||
Futures contracts | — | 7,836 | — | |||||||||||
Forward foreign currency exchange contracts | — | (100,593 | ) | — | ||||||||||
Foreign currency translation | (50,027 | ) | (18,672 | ) | (19,232 | ) | ||||||||
| Net realized and unrealized loss | (27,467,084 | ) | (2,770,419 | ) | (3,534,405 | ) | ||||||||
| NET DECREASE IN NET ASSETS RESULTING FROM OPERATIONS | $ | (19,755,936 | ) | $ | (139,372 | ) | $ | (983,342 | ) | |||||
| (a) | Class specific Distribution and Service, and Transfer Agent fees were as follows: |
| Distribution and Service Fees | Transfer Agent Fees | |||||||||||||||||||||||||||||||||||||||||||
Fund | Class A | Class B | Class C | Class R | Class A | Class B | Class C | Institutional | Service | Class IR | Class R | |||||||||||||||||||||||||||||||||
Focused International Equity | $ | 161,423 | $ | 4,371 | $ | 195,902 | $ | — | $ | 122,682 | $ | 830 | $ | 37,222 | $ | 68,103 | $ | 143 | $ | 6,117 | $ | — | ||||||||||||||||||||||
International Small Cap | 39,079 | 3,390 | 30,402 | — | 29,700 | 644 | 5,777 | 72,615 | 424 | 5,428 | — | |||||||||||||||||||||||||||||||||
Strategic International Equity | 60,053 | 19,674 | 54,631 | 86 | 45,641 | 3,738 | 10,380 | 17,959 | — | 155 | 33 | |||||||||||||||||||||||||||||||||
| The accompanying notes are an integral part of these financial statements. | 37 |
GOLDMAN SACHS FUNDAMENTAL INTERNATIONAL EQUITY FUNDS
Statements of Changes in Net Assets
| Focused International Equity Fund | ||||||||||
| For the Fiscal Year Ended October 31, 2014 | For the Fiscal Year Ended October 31, 2013 | |||||||||
| From operations: | ||||||||||
Net investment income | $ | 7,711,148 | $ | 1,504,045 | ||||||
Net realized gain | 9,955,040 | 27,455,110 | ||||||||
Net change in unrealized gain (loss) | (37,422,124 | ) | 12,676,809 | |||||||
| Net increase (decrease) in net assets resulting from operations | (19,755,936 | ) | 41,635,964 | |||||||
| Distributions to shareholders: | ||||||||||
From net investment income | ||||||||||
Class A Shares | (228,497 | ) | (1,458,280 | ) | ||||||
Class B Shares | — | (17,987 | ) | |||||||
Class C Shares | — | (358,173 | ) | |||||||
Institutional Shares | (930,005 | ) | (2,144,339 | ) | ||||||
Service Shares | (940 | ) | (8,887 | ) | ||||||
Class IR Shares | (14,137 | ) | (12,406 | ) | ||||||
Class R Shares | — | — | ||||||||
| Total distributions to shareholders | (1,173,579 | ) | (4,000,072 | ) | ||||||
| From share transactions: | ||||||||||
Proceeds from sales of shares | 132,262,656 | 50,132,344 | ||||||||
Reinvestment of distributions | 1,140,136 | 3,889,489 | ||||||||
Cost of shares redeemed | (56,445,399 | ) | (26,886,640 | ) | ||||||
| Net increase in net assets resulting from share transactions | 76,957,393 | 27,135,193 | ||||||||
| TOTAL INCREASE | 56,027,878 | 64,771,085 | ||||||||
| Net assets: | ||||||||||
Beginning of year | 194,392,639 | 129,621,554 | ||||||||
End of year | $ | 250,420,517 | $ | 194,392,639 | ||||||
| Undistributed net investment income | $ | 7,702,882 | $ | 1,173,203 | ||||||
| 38 | The accompanying notes are an integral part of these financial statements. |
GOLDMAN SACHS FUNDAMENTAL INTERNATIONAL EQUITY FUNDS
| International Small Cap Fund | Strategic International Equity Fund | |||||||||||||||||||||
| For the Fiscal Year Ended October 31, 2014 | For the Fiscal Year Ended October 31, 2013 | For the Fiscal Year Ended October 31, 2014 | For the Fiscal Year Ended October 31, 2013 | |||||||||||||||||||
| $ | 2,631,047 | $ | 1,674,890 | $ | 2,551,063 | $ | 746,999 | |||||||||||||||
| 18,506,583 | 13,974,773 | 6,105,483 | 8,048,712 | |||||||||||||||||||
| (21,277,002 | ) | 16,727,035 | (9,639,888 | ) | 5,964,099 | |||||||||||||||||
| (139,372 | ) | 32,376,698 | (983,342 | ) | 14,759,810 | |||||||||||||||||
| (252,522 | ) | (82,903 | ) | (181,701 | ) | (373,449 | ) | |||||||||||||||
| (3,621 | ) | (1,373 | ) | (1,078 | ) | (41,315 | ) | |||||||||||||||
| (29,832 | ) | (5,492 | ) | (8,305 | ) | (70,264 | ) | |||||||||||||||
| (3,353,326 | ) | (1,022,695 | ) | (464,488 | ) | (545,277 | ) | |||||||||||||||
| (16,362 | ) | (9,020 | ) | — | — | |||||||||||||||||
| (18,633 | ) | (5,265 | ) | (623 | ) | (1,935 | ) | |||||||||||||||
| — | — | (111 | ) | (121 | ) | |||||||||||||||||
| (3,674,296 | ) | (1,126,748 | ) | (656,306 | ) | (1,032,361 | ) | |||||||||||||||
| 63,131,042 | 100,581,076 | 14,098,789 | 17,704,507 | |||||||||||||||||||
| 3,530,834 | 1,108,249 | 650,708 | 1,014,248 | |||||||||||||||||||
| (56,636,871 | ) | (24,175,346 | ) | (12,450,865 | ) | (13,212,250 | ) | |||||||||||||||
| 10,025,005 | 77,513,979 | 2,298,632 | 5,506,505 | |||||||||||||||||||
| 6,211,337 | 108,763,929 | 658,984 | 19,233,954 | |||||||||||||||||||
| 190,344,551 | 81,580,622 | 73,208,016 | 53,974,062 | |||||||||||||||||||
| $ | 196,555,888 | $ | 190,344,551 | $ | 73,867,000 | $ | 73,208,016 | |||||||||||||||
| $ | 2,844,932 | $ | 2,093,070 | $ | 2,299,943 | $ | 441,369 | |||||||||||||||
| The accompanying notes are an integral part of these financial statements. | 39 |
GOLDMAN SACHS FOCUSED INTERNATIONAL EQUITY FUND
Selected Data for a Share Outstanding Throughout Each Year
| Income (loss) from investment operations | ||||||||||||||||||||||||||
| Year - Share Class | Net asset value, beginning of year | Net investment income (loss)(a) | Net realized and unrealized gain (loss) | Total from investment operations | Distributions to shareholders from net investment income | Increase from regulatory settlements | ||||||||||||||||||||
| FOR THE FISCAL YEARS ENDED OCTOBER 31, | ||||||||||||||||||||||||||
2014 - A | $ | 20.00 | $ | 0.55 | (d) | $ | (1.99 | ) | $ | (1.44 | ) | $ | (0.07 | ) | $ | — | ||||||||||
2014 - B | 19.70 | 0.42 | (d) | (1.97 | ) | (1.55 | ) | — | — | |||||||||||||||||
2014 - C | 18.65 | 0.36 | (d) | (1.83 | ) | (1.47 | ) | — | — | |||||||||||||||||
2014 - Institutional | 20.39 | 0.64 | (d) | (2.02 | ) | (1.38 | ) | (0.15 | ) | — | ||||||||||||||||
2014 - Service | 20.08 | 0.52 | (d) | (1.98 | ) | (1.46 | ) | (0.05 | ) | — | ||||||||||||||||
2014 - IR | 20.29 | 0.75 | (d) | (2.14 | ) | (1.39 | ) | (0.14 | ) | — | ||||||||||||||||
2013 - A | 15.58 | 0.15 | 4.71 | 4.86 | (0.44 | ) | — | |||||||||||||||||||
2013 - B | 15.37 | 0.01 | 4.66 | 4.67 | (0.34 | ) | — | |||||||||||||||||||
2013 - C | 14.60 | 0.02 | 4.41 | 4.43 | (0.38 | ) | — | |||||||||||||||||||
2013 - Institutional | 15.92 | 0.23 | 4.79 | 5.02 | (0.55 | ) | — | |||||||||||||||||||
2013 - Service | 15.69 | 0.14 | 4.72 | 4.86 | (0.47 | ) | — | |||||||||||||||||||
2013 - IR | 15.87 | 0.16 | 4.82 | 4.98 | (0.56 | ) | — | |||||||||||||||||||
2012 - A | 14.74 | 0.28 | 0.93 | 1.21 | (0.47 | ) | 0.10 | |||||||||||||||||||
2012 - B | 14.48 | 0.16 | 0.94 | 1.10 | (0.31 | ) | 0.10 | |||||||||||||||||||
2012 - C | 13.82 | 0.16 | 0.87 | 1.03 | (0.35 | ) | 0.10 | |||||||||||||||||||
2012 - Institutional | 15.07 | 0.32 | 0.97 | 1.29 | (0.54 | ) | 0.10 | |||||||||||||||||||
2012 - Service | 14.85 | 0.26 | 0.94 | 1.20 | (0.46 | ) | 0.10 | |||||||||||||||||||
2012 - IR | 15.06 | 0.28 | 0.98 | 1.26 | (0.55 | ) | 0.10 | |||||||||||||||||||
2011 - A | 16.81 | 0.42 | (f) | (2.22 | ) | (1.80 | ) | (0.27 | ) | — | ||||||||||||||||
2011 - B | 16.46 | 0.28 | (f) | (2.15 | ) | (1.87 | ) | (0.11 | ) | — | ||||||||||||||||
2011 - C | 15.79 | 0.29 | (f) | (2.09 | ) | (1.80 | ) | (0.17 | ) | — | ||||||||||||||||
2011 - Institutional | 17.18 | 0.50 | (f) | (2.27 | ) | (1.77 | ) | (0.34 | ) | — | ||||||||||||||||
2011 - Service | 16.92 | 0.42 | (f) | (2.24 | ) | (1.82 | ) | (0.25 | ) | — | ||||||||||||||||
2011 - IR | 17.22 | 0.63 | (f) | (2.45 | ) | (1.82 | ) | (0.34 | ) | — | ||||||||||||||||
2010 - A | 15.22 | 0.10 | 1.79 | 1.89 | (0.30 | ) | — | |||||||||||||||||||
2010 - B | 14.90 | (0.01 | ) | 1.74 | 1.73 | (0.17 | ) | — | ||||||||||||||||||
2010 - C | 14.35 | (0.02 | ) | 1.69 | 1.67 | (0.23 | ) | — | ||||||||||||||||||
2010 - Institutional | 15.55 | 0.16 | 1.82 | 1.98 | (0.35 | ) | — | |||||||||||||||||||
2010 - Service | 15.32 | 0.08 | 1.80 | 1.88 | (0.28 | ) | — | |||||||||||||||||||
2010 - IR (Commenced August 31, 2010) | 15.13 | 0.02 | 2.07 | 2.09 | — | — | ||||||||||||||||||||
| (a) | Calculated based on the average shares outstanding methodology. |
| (b) | Assumes investment at the net asset value at the beginning of the year, reinvestment of all distributions, a complete redemption of the investment at the net asset value at the end of the year and no sales or redemption charges. Total returns would be reduced if a sales or redemption charge was taken into account. Returns do not reflect the deduction of taxes that a shareholder would pay on Fund distributions or the redemption of Fund shares. Total returns for periods less than one full year are not annualized. |
| (c) | The Fund’s portfolio turnover rate is calculated in accordance with regulatory requirements, without regard to transactions involving short term investments and certain derivatives. If such transactions were included, the Fund’s portfolio turnover rate may be higher. |
| (d) | Reflects income recognized from a corporate action which amounted to $0.35 per share and 1.76% of average net assets. |
| (e) | Total returns reflect the impact of payments for regulatory settlements entitled to be received during the year and recorded as an increase to capital by the Fund. Excluding such payments, the total return would have been: |
| Class A | Class B | Class C | Institutional | Service | Class IR | |||||||||||||||||||
For the Fiscal Year Ended October 31, 2012 | 8.66 | % | 7.91 | % | 7.81 | % | 9.15 | % | 8.57 | % | 8.92 | % | ||||||||||||
| (f) | Reflects income recognized from a corporate action which amounted to $0.26 per share and 1.55% of average net assets. |
| (g) | Annualized. |
| 40 | The accompanying notes are an integral part of these financial statements. |
GOLDMAN SACHS FOCUSED INTERNATIONAL EQUITY FUND
| Net asset value, end of year | Total return(b) | Net assets, end of year (in 000s) | Ratio of net expenses to average net assets | Ratio of total expenses to average net assets | Ratio of net investment income (loss) to average net assets | Portfolio turnover rate(c) | ||||||||||||||||||||||||||||||||||
| $ | 18.49 | (7.16 | )% | $ | 58,368 | 1.33 | % | 1.63 | % | 2.78 | %(d) | 121 | % | |||||||||||||||||||||||||||
| 18.15 | (7.82 | ) | 266 | 2.09 | 2.37 | 2.15 | (d) | 121 | ||||||||||||||||||||||||||||||||
| 17.18 | (7.83 | ) | 18,247 | 2.08 | 2.38 | 1.97 | (d) | 121 | ||||||||||||||||||||||||||||||||
| 18.86 | (6.79 | ) | 170,954 | 0.93 | 1.23 | 3.17 | (d) | 121 | ||||||||||||||||||||||||||||||||
| 18.57 | (7.28 | ) | 332 | 1.43 | 1.73 | 2.62 | (d) | 121 | ||||||||||||||||||||||||||||||||
| 18.76 | (6.90 | ) | 2,253 | 1.07 | 1.38 | 3.73 | (d) | 121 | ||||||||||||||||||||||||||||||||
| 20.00 | 31.94 | 61,224 | 1.46 | 1.69 | 0.89 | 189 | ||||||||||||||||||||||||||||||||||
| 19.70 | 30.93 | 578 | 2.21 | 2.43 | 0.07 | 189 | ||||||||||||||||||||||||||||||||||
| 18.65 | 30.97 | 17,910 | 2.20 | 2.44 | 0.15 | 189 | ||||||||||||||||||||||||||||||||||
| 20.39 | 32.50 | 112,707 | 1.06 | 1.29 | 1.29 | 189 | ||||||||||||||||||||||||||||||||||
| 20.08 | 31.86 | 364 | 1.56 | 1.79 | 0.80 | 189 | ||||||||||||||||||||||||||||||||||
| 20.29 | 32.36 | 1,609 | 1.20 | 1.44 | 0.89 | 189 | ||||||||||||||||||||||||||||||||||
| 15.58 | 9.36 | (e) | 52,564 | 1.48 | 1.72 | 1.95 | 144 | |||||||||||||||||||||||||||||||||
| 15.37 | 8.61 | (e) | 815 | 2.23 | 2.47 | 1.13 | 144 | |||||||||||||||||||||||||||||||||
| 14.60 | 8.55 | (e) | 14,039 | 2.23 | 2.47 | 1.14 | 144 | |||||||||||||||||||||||||||||||||
| 15.92 | 9.84 | (e) | 61,874 | 1.08 | 1.31 | 2.11 | 144 | |||||||||||||||||||||||||||||||||
| 15.69 | 9.26 | (e) | 299 | 1.58 | 1.82 | 1.77 | 144 | |||||||||||||||||||||||||||||||||
| 15.87 | 9.61 | (e) | 30 | 1.23 | 1.46 | 1.87 | 144 | |||||||||||||||||||||||||||||||||
| 14.74 | (10.89 | ) | 118,977 | 1.53 | 1.67 | 2.55 | (f) | 135 | ||||||||||||||||||||||||||||||||
| 14.48 | (11.46 | ) | 1,225 | 2.28 | 2.42 | 1.70 | (f) | 135 | ||||||||||||||||||||||||||||||||
| 13.82 | (11.55 | ) | 15,883 | 2.28 | 2.42 | 1.86 | (f) | 135 | ||||||||||||||||||||||||||||||||
| 15.07 | (10.53 | ) | 28,105 | 1.13 | 1.27 | 2.94 | (f) | 135 | ||||||||||||||||||||||||||||||||
| 14.85 | (10.96 | ) | 300 | 1.63 | 1.77 | 2.51 | (f) | 135 | ||||||||||||||||||||||||||||||||
| 15.06 | (10.80 | ) | 3 | 1.28 | 1.42 | 3.87 | (f) | 135 | ||||||||||||||||||||||||||||||||
| 16.81 | 12.48 | 162,231 | 1.54 | 1.61 | 0.66 | 182 | ||||||||||||||||||||||||||||||||||
| 16.46 | 11.69 | 1,944 | 2.29 | 2.36 | (0.07 | ) | 182 | |||||||||||||||||||||||||||||||||
| 15.79 | 11.72 | 20,031 | 2.29 | 2.36 | (0.11 | ) | 182 | |||||||||||||||||||||||||||||||||
| 17.18 | 12.95 | 36,693 | 1.14 | 1.21 | 1.05 | 182 | ||||||||||||||||||||||||||||||||||
| 16.92 | 12.37 | 354 | 1.64 | 1.71 | 0.54 | 182 | ||||||||||||||||||||||||||||||||||
| 17.22 | 13.81 | 1 | 1.29 | (g) | 1.36 | (g) | 0.08 | (g) | 182 | |||||||||||||||||||||||||||||||
| The accompanying notes are an integral part of these financial statements. | 41 |
GOLDMAN SACHS INTERNATIONAL SMALL CAP FUND
Financial Highlights
Selected Data for a Share Outstanding Throughout Each Year
| Income (loss) from investment operations | ||||||||||||||||||||||
| Year - Share Class | Net asset value, beginning of year | Net investment income (loss)(a) | Net realized and unrealized gain (loss) | Total from investment operations | Distributions to shareholders from net investment income | |||||||||||||||||
| FOR THE FISCAL YEARS ENDED OCTOBER 31, | ||||||||||||||||||||||
2014 - A | $ | 19.26 | $ | 0.19 | $ | (0.28 | ) | $ | (0.09 | ) | $ | (0.33 | ) | |||||||||
2014 - B | 18.85 | 0.03 | (0.25 | ) | (0.22 | ) | (0.16 | ) | ||||||||||||||
2014 - C | 18.52 | 0.03 | (0.25 | ) | (0.22 | ) | (0.22 | ) | ||||||||||||||
2014 - Institutional | 19.82 | 0.27 | (0.29 | ) | (0.02 | ) | (0.38 | ) | ||||||||||||||
2014 - Service | 19.00 | 0.16 | (0.27 | ) | (0.11 | ) | (0.30 | ) | ||||||||||||||
2014 - IR | 19.77 | 0.23 | (0.28 | ) | (0.05 | ) | (0.36 | ) | ||||||||||||||
2013 - A | 15.18 | 0.16 | (d) | 4.04 | 4.20 | (0.12 | ) | |||||||||||||||
2013 - B | 14.90 | 0.03 | (d) | 3.97 | 4.00 | (0.05 | ) | |||||||||||||||
2013 - C | 14.65 | 0.04 | (d) | 3.88 | 3.92 | (0.05 | ) | |||||||||||||||
2013 - Institutional | 15.67 | 0.25 | (d) | 4.14 | 4.39 | (0.24 | ) | |||||||||||||||
2013 - Service | 15.04 | 0.14 | (d) | 3.99 | 4.13 | (0.17 | ) | |||||||||||||||
2013 - IR | 15.65 | 0.25 | (d) | 4.10 | 4.35 | (0.23 | ) | |||||||||||||||
2012 - A | 14.06 | 0.11 | 1.26 | 1.37 | (0.25 | ) | ||||||||||||||||
2012 - B | 13.74 | (0.01 | ) | 1.27 | 1.26 | (0.10 | ) | |||||||||||||||
2012 - C | 13.54 | — | (e) | 1.24 | 1.24 | (0.13 | ) | |||||||||||||||
2012 - Institutional | 14.53 | 0.17 | 1.29 | 1.46 | (0.32 | ) | ||||||||||||||||
2012 - Service | 13.98 | 0.09 | 1.25 | 1.34 | (0.28 | ) | ||||||||||||||||
2012 - IR | 14.50 | 0.14 | 1.30 | 1.44 | (0.29 | ) | ||||||||||||||||
2011 - A | 14.62 | 0.08 | (f) | (0.39 | ) | (0.31 | ) | (0.25 | ) | |||||||||||||
2011 - B | 14.29 | (0.04 | )(f) | (0.38 | ) | (0.42 | ) | (0.13 | ) | |||||||||||||
2011 - C | 14.10 | (0.03 | )(f) | (0.38 | ) | (0.41 | ) | (0.15 | ) | |||||||||||||
2011 - Institutional | 15.06 | 0.15 | (f) | (0.38 | ) | (0.23 | ) | (0.30 | ) | |||||||||||||
2011 - Service | 14.53 | 0.06 | (f) | (0.38 | ) | (0.32 | ) | (0.23 | ) | |||||||||||||
2011 - IR | 15.09 | 0.18 | (f) | (0.47 | ) | (0.29 | ) | (0.30 | ) | |||||||||||||
2010 - A | 12.27 | 0.04 | (g) | 2.74 | 2.78 | (0.43 | ) | |||||||||||||||
2010 - B | 12.01 | (0.06 | )(g) | 2.69 | 2.63 | (0.35 | ) | |||||||||||||||
2010 - C | 11.85 | (0.05 | )(g) | 2.64 | 2.59 | (0.34 | ) | |||||||||||||||
2010 - Institutional | 12.62 | 0.10 | (g) | 2.81 | 2.91 | (0.47 | ) | |||||||||||||||
2010 - Service | 12.20 | 0.03 | (g) | 2.72 | 2.75 | (0.42 | ) | |||||||||||||||
2010 - IR (Commenced August 31, 2010) | 12.90 | 0.02 | (g) | 2.17 | 2.19 | — | ||||||||||||||||
| (a) | Calculated based on the average shares outstanding methodology. |
| (b) | Assumes investment at the net asset value at the beginning of the year, reinvestment of all distributions, a complete redemption of the investment at the net asset value at the end of the year and no sales or redemption charges. Total returns would be reduced if a sales or redemption charge was taken into account. Returns do not reflect the deduction of taxes that a shareholder would pay on Fund distributions or the redemption of Fund shares. Total returns for periods less than one full year are not annualized. |
| (c) | The Fund’s portfolio turnover rate is calculated in accordance with regulatory requirements, without regard to transactions involving short term investments and certain derivatives. If such transactions were included, the Fund’s portfolio turnover rate may be higher. |
| (d) | Reflects income recognized from special dividends which amounted to $0.06 per share and 0.31% of average net assets. |
| (e) | Amount is less than $0.005 per share. |
| (f) | Reflects income recognized from special dividends which amounted to $0.03 per share and 0.16% of average net assets. |
| (g) | Reflects income recognized from special dividends which amounted to $0.01 per share and 0.10% of average net assets. |
| (h) | Annualized. |
| 42 | The accompanying notes are an integral part of these financial statements. |
GOLDMAN SACHS INTERNATIONAL SMALL CAP FUND
| Net asset value, end of year | Total return(b) | Net assets, end of year (in 000s) | Ratio of net expenses to average net assets | Ratio of total expenses to average net assets | Ratio of net investment income (loss) to average net assets | Portfolio turnover rate(c) | ||||||||||||||||||||||||||||||||||
| $ | 18.84 | (0.48 | )% | $ | 14,189 | 1.50 | % | 1.77 | % | 0.97 | % | 100 | % | |||||||||||||||||||||||||||
| 18.47 | (1.18 | ) | 230 | 2.26 | 2.51 | 0.17 | 100 | |||||||||||||||||||||||||||||||||
| 18.08 | (1.19 | ) | 3,183 | 2.24 | 2.52 | 0.17 | 100 | |||||||||||||||||||||||||||||||||
| 19.42 | (0.06 | ) | 173,215 | 1.09 | 1.37 | 1.34 | 100 | |||||||||||||||||||||||||||||||||
| 18.59 | (0.57 | ) | 1,052 | 1.59 | 1.86 | 0.82 | 100 | |||||||||||||||||||||||||||||||||
| 19.36 | (0.23 | ) | 4,686 | 1.21 | 1.52 | 1.16 | 100 | |||||||||||||||||||||||||||||||||
| 19.26 | 27.90 | 14,029 | 1.56 | 1.88 | 0.94 | (d) | 89 | |||||||||||||||||||||||||||||||||
| 18.85 | 26.90 | 450 | 2.31 | 2.63 | 0.17 | (d) | 89 | |||||||||||||||||||||||||||||||||
| 18.52 | 26.81 | 2,389 | 2.31 | 2.63 | 0.22 | (d) | 89 | |||||||||||||||||||||||||||||||||
| 19.82 | 28.43 | 171,473 | 1.16 | 1.46 | 1.39 | (d) | 89 | |||||||||||||||||||||||||||||||||
| 19.00 | 27.75 | 1,035 | 1.66 | 1.98 | 0.87 | (d) | 89 | |||||||||||||||||||||||||||||||||
| 19.77 | 28.20 | 968 | 1.31 | 1.62 | 1.44 | (d) | 89 | |||||||||||||||||||||||||||||||||
| 15.18 | 9.84 | 10,551 | 1.58 | 2.18 | 0.80 | 85 | ||||||||||||||||||||||||||||||||||
| 14.90 | 9.10 | 452 | 2.33 | 2.92 | (0.05 | ) | 85 | |||||||||||||||||||||||||||||||||
| 14.65 | 9.14 | 1,796 | 2.33 | 2.92 | (0.01 | ) | 85 | |||||||||||||||||||||||||||||||||
| 15.67 | 10.49 | 67,614 | 1.18 | 1.73 | 1.14 | 85 | ||||||||||||||||||||||||||||||||||
| 15.04 | 9.77 | 805 | 1.68 | 2.25 | 0.65 | 85 | ||||||||||||||||||||||||||||||||||
| 15.65 | 10.13 | 362 | 1.33 | 1.84 | 0.93 | 85 | ||||||||||||||||||||||||||||||||||
| 14.06 | (1.97 | ) | 22,537 | 1.60 | 1.94 | 0.54 | (f) | 117 | ||||||||||||||||||||||||||||||||
| 13.74 | (2.71 | ) | 622 | 2.35 | 2.69 | (0.25 | )(f) | 117 | ||||||||||||||||||||||||||||||||
| 13.54 | (2.68 | ) | 2,177 | 2.35 | 2.69 | (0.23 | )(f) | 117 | ||||||||||||||||||||||||||||||||
| 14.53 | (1.59 | ) | 36,067 | 1.20 | 1.54 | 0.95 | (f) | 117 | ||||||||||||||||||||||||||||||||
| 13.98 | (2.05 | ) | 730 | 1.70 | 2.04 | 0.41 | (f) | 117 | ||||||||||||||||||||||||||||||||
| 14.50 | (1.72 | ) | 24 | 1.35 | 1.69 | 1.12 | (f) | 117 | ||||||||||||||||||||||||||||||||
| 14.62 | 23.11 | 23,503 | 1.60 | 1.86 | 0.31 | (g) | 155 | |||||||||||||||||||||||||||||||||
| 14.29 | 22.24 | 919 | 2.35 | 2.61 | (0.45 | )(g) | 155 | |||||||||||||||||||||||||||||||||
| 14.10 | 22.18 | 2,120 | 2.35 | 2.61 | (0.43 | )(g) | 155 | |||||||||||||||||||||||||||||||||
| 15.06 | 23.61 | 89,035 | 1.20 | 1.46 | 0.78 | (g) | 155 | |||||||||||||||||||||||||||||||||
| 14.53 | 22.91 | 490 | 1.70 | 1.96 | 0.23 | (g) | 155 | |||||||||||||||||||||||||||||||||
| 15.09 | 16.74 | 1 | 1.35 | (h) | 1.61 | (h) | 0.73 | (g)(h) | 155 | |||||||||||||||||||||||||||||||
| The accompanying notes are an integral part of these financial statements. | 43 |
GOLDMAN SACHS STRATEGIC INTERNATIONAL EQUITY FUND
Financial Highlights
Selected Data for a Share Outstanding Throughout Each Year
| Income (loss) from investment operations | ||||||||||||||||||||||
| Year - Share Class | Net asset value, beginning of year | Net investment income(a) | Net realized and unrealized gain (loss) | Total from investment operations | Distributions to shareholders from net investment income | |||||||||||||||||
| FOR THE FISCAL YEARS ENDED OCTOBER 31, | ||||||||||||||||||||||
2014 - A | $ | 13.81 | $ | 0.45 | (d) | $ | (0.63 | ) | $ | (0.18 | ) | $ | (0.11 | ) | ||||||||
2014 - B | 12.30 | 0.33 | (d) | (0.59 | ) | (0.26 | ) | (0.01 | ) | |||||||||||||
2014 - C | 12.45 | 0.31 | (d) | (0.57 | ) | (0.26 | ) | (0.02 | ) | |||||||||||||
2014 - Institutional | 14.44 | 0.52 | (d) | (0.67 | ) | (0.15 | ) | (0.16 | ) | |||||||||||||
2014 - IR | 13.84 | 0.40 | (d) | (0.56 | ) | (0.16 | ) | (0.13 | ) | |||||||||||||
2014 - R | 13.88 | 0.41 | (d) | (0.63 | ) | (0.22 | ) | (0.09 | ) | |||||||||||||
2013 - A | 11.06 | 0.14 | 2.80 | 2.94 | (0.19 | ) | ||||||||||||||||
2013 - B | 9.88 | 0.05 | 2.50 | 2.55 | (0.13 | ) | ||||||||||||||||
2013 - C | 10.01 | 0.04 | 2.54 | 2.58 | (0.14 | ) | ||||||||||||||||
2013 - Institutional | 11.58 | 0.19 | 2.93 | 3.12 | (0.26 | ) | ||||||||||||||||
2013 - IR | 11.11 | 0.18 | 2.80 | 2.98 | (0.25 | ) | ||||||||||||||||
2013 - R | 11.14 | 0.08 | 2.85 | 2.93 | (0.19 | ) | ||||||||||||||||
2012 - A | 10.62 | 0.20 | 0.61 | 0.81 | (0.37 | ) | ||||||||||||||||
2012 - B | 9.51 | 0.09 | 0.57 | 0.66 | (0.29 | ) | ||||||||||||||||
2012 - C | 9.64 | 0.10 | 0.57 | 0.67 | (0.30 | ) | ||||||||||||||||
2012 - Institutional | 11.11 | 0.19 | 0.71 | 0.90 | (0.43 | ) | ||||||||||||||||
2012 - IR | 10.70 | 0.21 | 0.63 | 0.84 | (0.43 | ) | ||||||||||||||||
2012 - R | 10.57 | 0.16 | 0.64 | 0.80 | (0.23 | ) | ||||||||||||||||
2011 - A | 11.71 | 0.28 | (e) | (1.25 | ) | (0.97 | ) | (0.12 | ) | |||||||||||||
2011 - B | 10.49 | 0.17 | (e) | (1.12 | ) | (0.95 | ) | (0.03 | ) | |||||||||||||
2011 - C | 10.63 | 0.17 | (e) | (1.12 | ) | (0.95 | ) | (0.04 | ) | |||||||||||||
2011 - Institutional | 12.24 | 0.25 | (e) | (1.22 | ) | (0.97 | ) | (0.16 | ) | |||||||||||||
2011 - IR | 11.70 | 0.17 | (e) | (1.06 | ) | (0.89 | ) | (0.11 | ) | |||||||||||||
2011 - R | 11.64 | 0.27 | (e) | (1.26 | ) | (0.99 | ) | (0.08 | ) | |||||||||||||
2010 - A | 10.55 | 0.10 | 1.19 | 1.29 | (0.13 | ) | ||||||||||||||||
2010 - B | 9.46 | 0.01 | 1.07 | 1.08 | (0.05 | ) | ||||||||||||||||
2010 - C | 9.59 | 0.01 | 1.09 | 1.10 | (0.06 | ) | ||||||||||||||||
2010 - Institutional | 11.02 | 0.10 | 1.28 | 1.38 | (0.16 | ) | ||||||||||||||||
2010 - IR | 10.54 | 0.12 | 1.19 | 1.31 | (0.15 | ) | ||||||||||||||||
2010 - R | 10.52 | 0.07 | 1.19 | 1.26 | (0.14 | ) | ||||||||||||||||
| (a) | Calculated based on the average shares outstanding methodology. |
| (b) | Assumes investment at the net asset value at the beginning of the year, reinvestment of all distributions, a complete redemption of the investment at the net asset value at the end of the year and no sales or redemption charges. Total returns would be reduced if a sales or redemption charge was taken into account. Returns do not reflect the deduction of taxes that a shareholder would pay on Fund distributions or the redemption of Fund shares. |
| (c) | The Fund’s portfolio turnover rate is calculated in accordance with regulatory requirements, without regard to transactions involving short term investments and certain derivatives. If such transactions were included, the Fund’s portfolio turnover rate may be higher. |
| (d) | Reflects income recognized from a corporate action which amounted to $0.33 per share and 2.32% of average net assets. |
| (e) | Reflects income recognized from a corporate action which amounted to $0.14 per share and 1.22% of average net assets. |
| 44 | The accompanying notes are an integral part of these financial statements. |
GOLDMAN SACHS STRATEGIC INTERNATIONAL EQUITY FUND
| Net asset value, end of year | Total return(b) | Net assets, end of year (in 000s) | Ratio of net expenses to average net assets | Ratio of to average | Ratio of net investment income to average net assets | Portfolio turnover rate(c) | ||||||||||||||||||||||||||||||||||
| $ | 13.52 | (1.41 | )% | $ | 22,384 | 1.33 | % | 1.77 | % | 3.21 | %(d) | 89 | % | |||||||||||||||||||||||||||
| 12.03 | (2.15 | ) | 1,348 | 2.08 | 2.51 | 2.65 | (d) | 89 | ||||||||||||||||||||||||||||||||
| 12.17 | (2.10 | ) | 4,873 | 2.08 | 2.52 | 2.44 | (d) | 89 | ||||||||||||||||||||||||||||||||
| 14.13 | (1.05 | ) | 45,118 | 0.93 | 1.37 | 3.55 | (d) | 89 | ||||||||||||||||||||||||||||||||
| 13.55 | (1.14 | ) | 128 | 1.07 | 1.52 | 2.86 | (d) | 89 | ||||||||||||||||||||||||||||||||
| 13.57 | (1.58 | ) | 17 | 1.58 | 2.02 | 2.92 | (d) | 89 | ||||||||||||||||||||||||||||||||
| 13.81 | 27.11 | 23,850 | 1.47 | 1.87 | 1.16 | 102 | ||||||||||||||||||||||||||||||||||
| 12.30 | 26.15 | 2,518 | 2.22 | 2.62 | 0.41 | 102 | ||||||||||||||||||||||||||||||||||
| 12.45 | 26.06 | 5,700 | 2.22 | 2.62 | 0.37 | 102 | ||||||||||||||||||||||||||||||||||
| 14.44 | 27.63 | 41,058 | 1.07 | 1.47 | 1.51 | 102 | ||||||||||||||||||||||||||||||||||
| 13.84 | 27.37 | 65 | 1.22 | 1.62 | 1.49 | 102 | ||||||||||||||||||||||||||||||||||
| 13.88 | 26.72 | 17 | 1.72 | 2.11 | 0.61 | 102 | ||||||||||||||||||||||||||||||||||
| 11.06 | 8.17 | 21,854 | 1.45 | 1.95 | 1.91 | 119 | ||||||||||||||||||||||||||||||||||
| 9.88 | 7.41 | 3,203 | 2.20 | 2.70 | 1.00 | 119 | ||||||||||||||||||||||||||||||||||
| 10.01 | 7.35 | 5,147 | 2.20 | 2.70 | 1.01 | 119 | ||||||||||||||||||||||||||||||||||
| 11.58 | 8.58 | 23,684 | 1.05 | 1.51 | 1.68 | 119 | ||||||||||||||||||||||||||||||||||
| 11.11 | 8.42 | 79 | 1.20 | 1.68 | 2.01 | 119 | ||||||||||||||||||||||||||||||||||
| 11.14 | 7.87 | 7 | 1.70 | 2.19 | 1.49 | 119 | ||||||||||||||||||||||||||||||||||
| 10.62 | (8.40 | ) | 41,862 | 1.45 | 1.78 | 2.36 | (e) | 139 | ||||||||||||||||||||||||||||||||
| 9.51 | (9.08 | ) | 4,344 | 2.20 | 2.53 | 1.57 | (e) | 139 | ||||||||||||||||||||||||||||||||
| 9.64 | (9.00 | ) | 6,643 | 2.20 | 2.53 | 1.63 | (e) | 139 | ||||||||||||||||||||||||||||||||
| 11.11 | (8.04 | ) | 6,416 | 1.05 | 1.38 | 2.02 | (e) | 139 | ||||||||||||||||||||||||||||||||
| 10.70 | (7.69 | ) | 56 | 1.20 | 1.53 | 1.56 | (e) | 139 | ||||||||||||||||||||||||||||||||
| 10.57 | (8.61 | ) | 7 | 1.70 | 2.03 | 2.30 | (e) | 139 | ||||||||||||||||||||||||||||||||
| 11.71 | 12.34 | 60,561 | 1.45 | 1.71 | 0.89 | 121 | ||||||||||||||||||||||||||||||||||
| 10.49 | 11.44 | 6,814 | 2.20 | 2.46 | 0.12 | 121 | ||||||||||||||||||||||||||||||||||
| 10.63 | 11.48 | 8,845 | 2.20 | 2.46 | 0.13 | 121 | ||||||||||||||||||||||||||||||||||
| 12.24 | 12.69 | 21,434 | 1.05 | 1.31 | 0.90 | 121 | ||||||||||||||||||||||||||||||||||
| 11.70 | 12.55 | 7 | 1.20 | 1.46 | 1.13 | 121 | ||||||||||||||||||||||||||||||||||
| 11.64 | 12.06 | 28 | 1.70 | 1.96 | 0.67 | 121 | ||||||||||||||||||||||||||||||||||
| The accompanying notes are an integral part of these financial statements. | 45 |
GOLDMAN SACHS FUNDAMENTAL INTERNATIONAL EQUITY FUNDS
October 31, 2014
| 1. ORGANIZATION |
Goldman Sachs Trust (the “Trust”) is a Delaware statutory trust registered under the Investment Company Act of 1940, as amended (the “Act”), as an open-end management investment company. The following table lists those series of the Trust that are included in this report (collectively, the “Funds” or individually a “Fund”), along with their corresponding share classes and respective diversification status under the Act:
| Fund | Share Classes Offered | Diversified/ Non-diversified | ||
Focused International Equity+ and International Small Cap | A, B, C, Institutional, Service and IR | Diversified | ||
Strategic International Equity | A, B, C, Institutional, IR and R | Diversified |
| + | Formerly, Goldman Sachs Concentrated International Equity Fund. Effective at the close of business on February 28, 2014, the Fund changed its name to the Goldman Sachs Focused International Equity Fund. |
Class A Shares are sold with a front-end sales charge of up to 5.50%. Class B Shares were sold with a contingent deferred sales charge (“CDSC”) that declines from 5.00% to zero, depending upon the period of time the shares are held. Class C Shares are sold with a CDSC of 1.00%, which is imposed on redemptions made within 12 months of purchase. Institutional, Service, Class IR and Class R Shares are not subject to a sales charge.
At a meeting held on August 13-14, 2014, the Board of Trustees of the Trust approved the early conversion of each Fund’s Class B Shares into Class A Shares.
Accordingly, effective at the close of business on November 14, 2014 (the “Conversion Date”), Class B Shares of each Fund have converted to Class A Shares of the Fund, including Class B Shares that were scheduled to convert at a later date. No CDSCs were assessed in connection with this early conversion. In addition, effective October 15, 2014, redemptions of a Fund’s Class B Shares before the Conversion Date were not subject to a CDSC.
Goldman Sachs Asset Management International (“GSAMI”), an affiliate of Goldman, Sachs & Co. (“Goldman Sachs”), serves as investment adviser to the Funds pursuant to a management agreement (the “Agreement”) with the Trust.
| 2. SIGNIFICANT ACCOUNTING POLICIES |
The financial statements have been prepared in accordance with accounting principles generally accepted in the United States of America (“GAAP”) and require management to make estimates and assumptions that may affect the reported amounts and disclosures. Actual results may differ from those estimates and assumptions.
A. Investment Valuation — The Funds’ valuation policy is to value investments at fair value.
B. Investment Income and Investments — Investment income includes interest income and dividend income, net of any foreign withholding taxes, less any amounts reclaimable. Interest income is accrued daily and adjusted for amortization of premiums and accretion of discounts. Dividend income is recognized on ex-dividend date or, for certain foreign securities, as soon as such information is obtained subsequent to the ex-dividend date. Investment transactions are reflected on trade date. Realized gains and losses are calculated using identified cost. Investment transactions are recorded on the following business day for daily net asset value (“NAV”) calculations. Any foreign capital gains tax is accrued daily based upon net unrealized gains, and is payable upon sale of such investments. Distributions received from the Funds’ investments in United States (“U.S.”) real estate investment trusts (“REITs”) may be characterized as ordinary income, net capital gain or a return of capital. A return of capital is recorded by the Funds as a reduction to the cost basis of the REIT.
For derivative contracts, realized gains and losses are recorded upon settlement of the contract.
C. Class Allocations and Expenses — Investment income, realized and unrealized gain (loss), and non-class specific expenses of each Fund are allocated daily based upon the proportion of net assets of each class. Class specific expenses, where applicable, are borne by the respective share classes and include Distribution and Service, Transfer Agent and Service and Shareholder Administration fees. Non-class specific expenses directly incurred by a Fund are charged to that Fund, while such expenses incurred by the Trust are allocated across the respective Funds on a straight-line and/or pro-rata basis depending upon the nature of the expenses.
46
GOLDMAN SACHS FUNDAMENTAL INTERNATIONAL EQUITY FUNDS
| 2. SIGNIFICANT ACCOUNTING POLICIES (continued) |
D. Federal Taxes and Distributions to Shareholders — It is each Fund’s policy to comply with the requirements of the Internal Revenue Code of 1986, as amended (the “Code”), applicable to regulated investment companies (mutual funds) and to distribute each year substantially all of its investment company taxable income and capital gains to its shareholders. Accordingly, the Funds are not required to make any provisions for the payment of federal income tax. Distributions to shareholders are recorded on the ex-dividend date. Income and capital gains distributions, if any, are declared and paid annually.
Net capital losses are carried forward to future fiscal years and may be used to the extent allowed by the Code to offset any future capital gains. Utilization of capital loss carryforwards will reduce the requirement of future capital gains distributions.
Under the Regulated Investment Company Modernization Act of 2010, the Funds are permitted to carry forward capital losses incurred in taxable years beginning after December 22, 2010 for an unlimited period. However, any losses incurred during those future taxable years will be required to be utilized prior to the losses incurred in pre-enactment taxable years. As a result of this ordering rule, pre-enactment capital loss carryforwards may be more likely to expire unused. Additionally, post-enactment capital losses that are carried forward will retain their character as either short-term or long-term capital losses rather than being considered all short-term as under previous law.
The characterization of distributions to shareholders for financial reporting purposes is determined in accordance with federal income tax rules, which may differ from GAAP. The source of each Fund’s distributions may be shown in the accompanying financial statements as either from net investment income, net realized gain or capital. Certain components of the Funds’ net assets on the Statements of Assets and Liabilities reflect permanent GAAP/tax differences based on the appropriate tax character.
E. Foreign Currency Translation — The accounting records and reporting currency of the Funds are maintained in U.S. dollars. Assets and liabilities denominated in foreign currencies are translated into U.S. dollars using the current exchange rates at the close of each business day. The effect of changes in foreign currency exchange rates on investments is included within net realized and unrealized gain (loss) on investments. Changes in the value of other assets and liabilities as a result of fluctuations in foreign exchange rates are included in the Statements of Operations within net change in unrealized gain (loss) on foreign currency transactions. Transactions denominated in foreign currencies are translated into U.S. dollars on the date the transaction occurred, the effects of which are included within net realized gain (loss) on foreign currency transactions.
| 3. INVESTMENTS AND FAIR VALUE MEASUREMENTS |
The fair value of a financial instrument is the amount that would be received to sell an asset or paid to transfer a liability in an orderly transaction between market participants at the measurement date (i.e., the exit price). GAAP establishes a fair value hierarchy that prioritizes the inputs to valuation techniques used to measure fair value. The hierarchy gives the highest priority to unadjusted quoted prices in active markets for identical assets or liabilities (Level 1 measurements) and the lowest priority to unobservable inputs (Level 3 measurements). The levels used for classifying investments are not necessarily an indication of the risk associated with investing in these investments. The three levels of the fair value hierarchy are described below:
Level 1 — Unadjusted quoted prices in active markets that are accessible at the measurement date for identical, unrestricted assets or liabilities;
Level 2 — Quoted prices in markets that are not active or financial instruments for which significant inputs are observable (including, but not limited to, quoted prices for similar investments, interest rates, foreign exchange rates, volatility and credit spreads), either directly or indirectly;
Level 3 — Prices or valuations that require significant unobservable inputs (including GSAMI’s assumptions in determining fair value measurement).
The Trustees have adopted Valuation Procedures that govern the valuation of the portfolio investments held by the Funds, including investments for which market quotations are not readily available. The Trustees have delegated to GSAMI day-to-day responsibility for implementing and maintaining internal controls and procedures related to the valuation of the Funds’ portfolio investments. To assess the continuing appropriateness of pricing sources and methodologies, GSAMI regularly performs price verification procedures and issues challenges as necessary to third party pricing vendors or brokers, and any differences are reviewed in accordance with the Valuation Procedures.
47
GOLDMAN SACHS FUNDAMENTAL INTERNATIONAL EQUITY FUNDS
Notes to Financial Statements (continued)
October 31, 2014
| 3. INVESTMENTS AND FAIR VALUE MEASUREMENTS (continued) |
A. Level 1 and Level 2 Fair Value Investments — The valuation techniques and significant inputs used in determining the fair values for investments classified as Level 1 and Level 2 are as follows:
Equity Securities — Equity securities and investment companies traded on a U.S. securities exchange or the NASDAQ system, or those located on certain foreign exchanges, including but not limited to the Americas, are valued daily at their last sale price or official closing price on the principal exchange or system on which they are traded. If no sale occurs, equity securities and exchange traded investment companies are valued at the last bid price for long positions and at the last ask price for short positions. Investments in investment companies (other than those that are exchange traded) are valued at the NAV on the valuation date. To the extent these investments are actively traded, they are classified as Level 1 of the fair value hierarchy, otherwise they are generally classified as Level 2.
Unlisted equity securities for which market quotations are available are valued at the last sale price on the valuation date, or if no sale occurs, at the last bid price. Securities traded on certain foreign securities exchanges are valued daily at fair value determined by an independent fair value service (if available) under Valuation Procedures approved by the Trustees and consistent with applicable regulatory guidance. The independent fair value service takes into account multiple factors including, but not limited to, movements in the securities markets, certain depositary receipts, futures contracts and foreign currency exchange rates that have occurred subsequent to the close of the foreign securities exchange. These investments are generally classified as Level 2 of the fair value hierarchy.
Derivative Contracts — A derivative is an instrument whose value is derived from underlying assets, indices, reference rates or a combination of these factors.
Exchange-traded derivatives, including futures contracts, typically fall within Level 1 of the fair value hierarchy. Over-the-counter (“OTC”) and centrally cleared derivatives are valued using market transactions and other market evidence, including market-based inputs to models, calibration to market-clearing transactions, broker or dealer quotations, or other alternative pricing sources. Where models are used, the selection of a particular model to value OTC and centrally cleared derivatives depends upon the contractual terms of, and specific risks inherent in, the instrument, as well as the availability of pricing information in the market. Valuation models require a variety of inputs, including contractual terms, market prices, yield curves, credit curves, measures of volatility, voluntary and involuntary prepayment rates, loss severity rates and correlations of such inputs. For OTC and centrally cleared derivatives that trade in liquid markets, model inputs can generally be verified and model selection does not involve significant management judgment. OTC and centrally cleared derivatives are classified within Level 2 of the fair value hierarchy when significant inputs are corroborated by market evidence.
i. Forward Contracts — A forward contract is a contract between two parties to buy or sell an asset at a specified price on a future date. A forward contract settlement can occur on a cash or delivery basis. Forward contracts are marked-to-market daily using counterparty prices, and the change in value, if any, is recorded as an unrealized gain or loss.
A forward foreign currency contract is a forward contract in which a Fund agrees to receive or deliver a fixed quantity of one currency for another, at a pre-determined price at a future date. All forward foreign currency exchange contracts are marked-to-market daily at the applicable forward rate. Non-deliverable forward foreign currency exchange contracts are settled with the counterparty in cash without the delivery of foreign currency.
ii. Futures Contracts — Futures contracts are contracts to buy or sell a standardized quantity of a specified commodity or security and are valued based on exchanged settlement prices or independent market quotes. Futures contracts are valued at the last settlement price, or in the absence of a sale, the last bid price for long positions and at the last ask price for short positions, at the end of each day on the board of trade or exchange upon which they are traded. Upon entering into a futures contract, a Fund deposits cash or securities in an account on behalf of the broker in an amount sufficient to meet the initial margin requirement. Subsequent payments are made or received by a Fund equal to the daily change in the contract value and are recorded as variation margin receivable or payable with a corresponding offset to unrealized gains or losses.
48
GOLDMAN SACHS FUNDAMENTAL INTERNATIONAL EQUITY FUNDS
| 3. INVESTMENTS AND FAIR VALUE MEASUREMENTS (continued) |
B. Level 3 Fair Value Investments — To the extent that the aforementioned significant inputs are unobservable, or if quotations are not readily available, or if GSAMI believes that such quotations do not accurately reflect fair value, the fair value of the Funds’ investments may be determined under Valuation Procedures approved by the Trustees. GSAMI, consistent with its procedures and applicable regulatory guidance, may make an adjustment to the most recent valuation prices of either domestic or foreign securities in light of significant events to reflect what it believes to be the fair value of the securities at the time of determining a Fund’s NAV. Significant events which could affect a large number of securities in a particular market may include, but are not limited to: significant fluctuations in U.S. or foreign markets; market dislocations; market disruptions; or unscheduled market closings. Significant events which could also affect a single issuer may include, but are not limited to: corporate actions such as reorganizations, mergers and buy-outs; ratings downgrades; and bankruptcies.
C. Fair Value Hierarchy — The following is a summary of the Funds’ investments and derivatives classified in the fair value hierarchy as of October 31, 2014:
| FOCUSED INTERNATIONAL EQUITY | ||||||||||||
| Investment Type | Level 1 | Level 2 | Level 3 | |||||||||
| Assets | ||||||||||||
Common Stock and/or Other Equity Investments(a) | ||||||||||||
Asia | $ | — | $ | 60,088,002 | $ | — | ||||||
Australia and Oceania | — | 12,560,936 | — | |||||||||
Europe | — | 169,583,786 | — | |||||||||
North America | 5,833,820 | — | — | |||||||||
| Total | $ | 5,833,820 | $ | 242,232,724 | $ | — | ||||||
| INTERNATIONAL SMALL CAP | ||||||||||||
| Investment Type | Level 1 | Level 2 | Level 3 | |||||||||
| Assets | ||||||||||||
Common Stock and/or Other Equity Investments(a) | ||||||||||||
Africa | $ | — | $ | 683,928 | $ | — | ||||||
Asia | 2,065,360 | 50,353,883 | — | |||||||||
Australia and Oceania | — | 12,513,599 | — | |||||||||
Europe | — | 104,047,160 | — | |||||||||
North America | 19,750,023 | — | — | |||||||||
| Total | $ | 21,815,383 | $ | 167,598,570 | $ | — | ||||||
| Derivative Type | ||||||||||||
| Assets(b) | ||||||||||||
Forward Foreign Currency Exchange Contracts | $ | — | $ | 253,428 | $ | — | ||||||
Futures Contracts | 8,675 | — | — | |||||||||
| Liabilities(b) | ||||||||||||
Forward Foreign Currency Exchange Contracts | $ | — | $ | (354,021 | ) | $ | — | |||||
49
GOLDMAN SACHS FUNDAMENTAL INTERNATIONAL EQUITY FUNDS
Notes to Financial Statements (continued)
October 31, 2014
| 3. INVESTMENTS AND FAIR VALUE MEASUREMENTS (continued) |
| STRATEGIC INTERNATIONAL EQUITY | ||||||||||||
| Investment Type | Level 1 | Level 2 | Level 3 | |||||||||
| Assets | ||||||||||||
Common Stock and/or Other Equity Investments(a) | ||||||||||||
Asia | $ | — | $ | 16,924,491 | $ | — | ||||||
Australia and Oceania | — | 3,627,523 | — | |||||||||
Europe | — | 45,372,436 | — | |||||||||
North America | 5,913,146 | — | — | |||||||||
| Total | $ | 5,913,146 | $ | 65,924,450 | $ | — | ||||||
| (a) | Amounts are disclosed by continent to highlight the impact of time zone differences between local market close and the calculation of net asset value. Security valuations are based on the principal exchange or system on which they are traded, which may differ from country of domicile. The Funds utilize fair value model prices provided by an independent fair value service for international equities, resulting in a Level 2 classification. |
| (b) | Amount shown represents unrealized gain/(loss) at fiscal year end. |
For further information regarding security characteristics, see the Schedules of Investments.
| 4. INVESTMENTS IN DERIVATIVES |
The following table sets forth, by certain risk types, the gross value of derivative contracts as of October 31, 2014. These instruments were used to meet the Fund’s investment objectives and to obtain and/or manage exposure related to the risks below. The values in the table below exclude the effects of cash collateral received or posted pursuant to these derivative contracts, and therefore are not representative of the Fund’s net exposure:
| INTERNATIONAL SMALL CAP | ||||||||||||
| Risk | Statement of Assets and Liabilities | Assets | Statement of Assets and Liabilities | Liabilities | ||||||||
Currency | Receivable for unrealized gain on forward foreign currency exchange contracts | $ | 253,428 | Payable for unrealized loss on forward foreign currency exchange contracts | $ | (354,021) | ||||||
Equity | Variation margin on certain derivative contracts | 8,675 | (a) | — | — | |||||||
| Total | $ | 262,103 | $ | (354,021) | ||||||||
| (a) | Includes unrealized gain (loss) on futures contracts and centrally cleared swap contracts described in the Additional Investment Information sections of the Schedules of Investments. Only current day’s variation margin is reported within the Statements of Assets and Liabilities. |
50
GOLDMAN SACHS FUNDAMENTAL INTERNATIONAL EQUITY FUNDS
| 4. INVESTMENTS IN DERIVATIVES (continued) |
The following tables set forth, by certain risk types, the Funds’ gains (losses) related to these derivatives and their indicative volumes for the fiscal year ended October 31, 2014. These gains (losses) should be considered in the context that these derivative contracts may have been executed to create investment opportunities and/or economically hedge certain investments, and accordingly, certain gains (losses) on such derivative contracts may offset certain (losses) gains attributable to investments. These gains (losses) are included in “Net realized gain (loss)” or “Net change in unrealized gain (loss)” on the Statements of Operations:
| FOCUSED INTERNATIONAL EQUITY | ||||||||||||
| Risk | Statements of Operations | Net Realized Gain (Loss) | Net Change in Unrealized Gain (Loss) | Average Number of Contracts(a) | ||||||||
| Equity | Net realized gain (loss) from futures contracts/Net change in unrealized gain (loss) on futures contracts | $ (523) | $ | — | 1 | |||||||
| INTERNATIONAL SMALL CAP | ||||||||||||||
| Risk | Statement of Operations | Net Realized Gain (Loss) | Net Change in Unrealized Gain (Loss) | Average Number of Contracts(a) | ||||||||||
Currency | Net realized gain (loss) from forward foreign currency exchange contracts/Net change in unrealized gain (loss) on forward foreign currency exchange contracts | $ | — | $ | (100,593 | ) | 1 | |||||||
Equity | Net realized gain (loss) from contracts/Net change in unrealized gain (loss) on futures contracts | (138,499 | ) | 7,836 | 72 | |||||||||
| Total | $ | (138,499 | ) | $ | (92,757 | ) | 73 | |||||||
| (a) | Average number of contracts is based on the average of month end balances for the year ended December 31, 2014. |
| 5. AGREEMENTS AND AFFILIATED TRANSACTIONS | ||
A. Management Agreement — Under the Agreement, GSAMI manages the Funds, subject to the general supervision of the Trustees.
As compensation for the services rendered pursuant to the Agreement, the assumption of the expenses related thereto and administration of the Funds’ business affairs, including providing facilities, GSAMI is entitled to a management fee, accrued daily and paid monthly, equal to an annual percentage rate of each Fund’s average daily net assets.
For the fiscal year ended October 31, 2014, contractual and effective net management fees with GSAMI were at the following rates:
| Contractual Management Fee Rate | ||||||||||||||||||||||||||||||
| Fund | First $1 billion | Next $1 billion | Next $3 billion | Next $3 billion | Over $8 billion | Effective Rate | Effective Net Management Fee Rate | |||||||||||||||||||||||
Focused International Equity | 1.00 | % | 0.90 | % | 0.86 | % | 0.84 | % | 0.82 | % | 1.00 | % | 0.86 | %* | ||||||||||||||||
International Small Cap | 1.10 | 1.10 | 0.99 | 0.94 | 0.92 | 1.10 | 1.02 | * | ||||||||||||||||||||||
Strategic International Equity | 0.85 | 0.77 | 0.73 | 0.72 | 0.71 | 0.85 | 0.85 | |||||||||||||||||||||||
| * | GSAMI agreed to waive a portion of its management fee in order to achieve effective net management fee rates of 0.85% and 0.90% for the Focused International Equity and International Small Cap Funds, respectively, through at least February 28, 2015 and June 30, 2015, respectively. Prior to such date GSAMI may not terminate the arrangement without the approval of the Trustees. Prior to January 1, 2014, the effective net management fee rate for the Focused International Equity Fund was 0.94%. Prior to July 1, 2014, the effective net management fee rate for the International Small Cap Fund was 1.08%. |
51
GOLDMAN SACHS FUNDAMENTAL INTERNATIONAL EQUITY FUNDS
Notes to Financial Statements (continued)
October 31, 2014
| 5. AGREEMENTS AND AFFILIATED TRANSACTIONS (continued) |
B. Distribution and Service Plans — The Trust, on behalf of each Fund, has adopted Distribution and Service Plans (the “Plans”). Under the Plans, Goldman Sachs, which serves as distributor (the “Distributor”), is entitled to a fee accrued daily and paid monthly, for distribution services and personal and account maintenance services, which may then be paid by Goldman Sachs to authorized dealers, at the following annual rates calculated on a Fund’s average daily net assets of each respective share class:
| Distribution and Service Plan Rates | ||||||||||||||||
| Class A* | Class B | Class C | Class R* | |||||||||||||
Distribution Plan | 0.25 | % | 0.75 | % | 0.75 | % | 0.50 | % | ||||||||
Service Plan | — | 0.25 | 0.25 | — | ||||||||||||
| * | With respect to Class A and Class R Shares, the Distributor at its discretion may use compensation for distribution services paid under the Distribution Plan to compensate service organizations for personal and account maintenance services and expenses as long as such total compensation does not exceed the maximum cap on “service fees” imposed by the Financial Industry Regulatory Authority. |
C. Distribution Agreement — Goldman Sachs, as Distributor of the shares of the Funds pursuant to a Distribution Agreement, may retain a portion of the Class A front end sales charge and Class B and Class C Shares’ CDSC. During the fiscal year ended October 31, 2014, Goldman Sachs advised that it retained the following amounts:
| Front End Sales Charge | Contingent Deferred Sales Charge* | |||||||||
| Fund | Class A | Class C | ||||||||
Focused International Equity | $ | 9,597 | $ | 532 | ||||||
International Small Cap | 3,218 | — | ||||||||
Strategic International Equity | 2,638 | — | ||||||||
| * | Goldman Sachs did not retain any contingent deferred sales charges for Class B Shares. |
D. Service Plan and Shareholder Administration Plan — The Trust, on behalf of each Fund that offers Service Shares, has adopted a Service Plan and a Shareholder Administration Plan. These plans allow for service organizations to provide varying levels of personal and account maintenance and shareholder administration services to their customers who are beneficial owners of such shares. The Service Plan and Shareholder Administration Plan each provide for compensation to the service organizations which is accrued daily and paid monthly at an annual rate of 0.25% (0.50% in aggregate) of the average daily net assets of the Service Shares.
E. Transfer Agency Agreement — Goldman Sachs also serves as the transfer agent of the Funds for a fee pursuant to the Transfer Agency Agreement. The fees charged for such transfer agency services are accrued daily and paid monthly at annual rates as follows: 0.19% of the average daily net assets of Class A, Class B, Class C, Class IR and Class R Shares; and 0.04% of the average daily net assets of Institutional and Service Shares.
F. Other Expense Agreements and Affiliated Transactions — GSAMI has agreed to limit certain “Other Expenses” of the Funds (excluding transfer agency fees and expenses, service fees and shareholder administration fees (as applicable), taxes, interest, brokerage fees, shareholder meetings, litigation, indemnification and extraordinary expenses) to the extent such expenses exceed, on an annual basis, a percentage rate of the average daily net assets of each Fund. Such Other Expense reimbursements, if any, are accrued daily and paid monthly. In addition, the Funds are not obligated to reimburse GSAMI for prior fiscal year expense reimbursements, if any. The Other Expense limitations as an annual percentage rate of average daily net assets for the Focused International Equity, International Small Cap and Strategic International Equity Funds are 0.014%, 0.034% and 0.014%, respectively. Prior to January 1, 2014, the Other Expense limitation was 0.064% and 0.164% for the Focused International Equity and Strategic International Equity Funds, respectively. These Other Expense limitations will remain in place through at least February 28, 2015, and prior to such date GSAMI may not terminate the arrangements without the approval of the Trustees. The
52
GOLDMAN SACHS FUNDAMENTAL INTERNATIONAL EQUITY FUNDS
| 5. AGREEMENTS AND AFFILIATED TRANSACTIONS (continued) |
Funds bear their respective share of costs related to proxy and shareholder meetings, and GSAMI has agreed to reimburse each Fund to the extent such expenses exceed a specified percentage of the Fund’s net assets. In addition, the Funds have entered into certain offset arrangements with the custodian and the transfer agent, which may result in a reduction of the Funds’ expenses and are received irrespective of the application of the “Other Expense” limitations described above.
For the fiscal year ended October 31, 2014, these expense reductions, including any fee waivers and Other Expense reimbursements, were as follows:
| Fund | Management Fee Waiver | Custody Fee Credits | Other Expense Reimbursement | Total Expense Reductions | ||||||||||||||
Focused International Equity | $ | 356,180 | $ | 3,679 | $ | 413,087 | $ | 772,946 | ||||||||||
International Small Cap | 164,353 | 5,689 | 384,590 | 554,632 | ||||||||||||||
Strategic International Equity | — | 765 | 337,172 | 337,937 | ||||||||||||||
G. Line of Credit Facility — As of October 31, 2014, the Funds participated in a $1,080,000,000 committed, unsecured revolving line of credit facility (the “facility”) together with other funds of the Trust and registered investment companies having management agreements with GSAMI or its affiliates (“Other Borrowers”). Pursuant to the terms of the facility, the Funds and Other Borrowers could increase the credit amount by an additional $120,000,000, for a total of up to $1,200,000,000. This facility is to be used solely for temporary or emergency purposes, which may include the funding of redemptions. The interest rate on borrowings is based on the federal funds rate. The facility also requires a fee to be paid by the Funds based on the amount of the commitment that has not been utilized. For the fiscal year ended October 31, 2014, the Funds did not have any borrowings under the facility.
H. Other Transactions with Affiliates — For the fiscal year ended October 31, 2014. Goldman Sachs earned $958 and $272 in brokerage commissions from portfolio transactions, including futures transactions executed with Goldman Sachs as the Futures Commission Merchant, on behalf of the Focused International Equity and International Small Cap Funds, respectively.
As of October 31, 2014, the Goldman Sachs Satellite Strategies Portfolio was the beneficial owner of 36% or more of the total outstanding shares of the International Small Cap Fund.
As of October 31, 2014, the Goldman Sachs Group, Inc. was the beneficial owner of approximately 7% and 53% of the Class IR and Class R Shares of the Strategic International Equity Fund, respectively.
| 6. PORTFOLIO SECURITIES TRANSACTIONS |
The cost of purchases and proceeds from sales and maturities of long-term securities for the fiscal year ended October 31, 2014, were as follows:
| Fund | Purchases | Sales and Maturities | ||||||||
Focused International Equity | $ | 391,376,347 | $ | 304,966,117 | ||||||
International Small Cap | 205,503,576 | 199,524,095 | ||||||||
Strategic International Equity | 69,751,900 | 66,728,055 | ||||||||
53
GOLDMAN SACHS FUNDAMENTAL INTERNATIONAL EQUITY FUNDS
Notes to Financial Statements (continued)
October 31, 2014
| 7. TAX INFORMATION |
The tax character of distributions paid during the fiscal year ended October 31, 2014 was as follows:
| Focused International Equity | International Small Cap | Strategic International Equity | ||||||||||||
Distributions paid from: | ||||||||||||||
Ordinary income | $ | 1,173,579 | $ | 3,674,296 | $ | 656,306 | ||||||||
The tax character of distributions paid during the fiscal year ended October 31, 2013 was as follows:
| Focused International Equity | International Small Cap | Strategic International Equity | ||||||||||||
Distributions paid from: | ||||||||||||||
Ordinary income | $ | 4,000,072 | $ | 1,126,748 | $ | 1,032,361 | ||||||||
As of October 31, 2014, the components of accumulated earnings (losses) on a tax-basis were as follows:
| Focused International Equity | International Small Cap | Strategic International Equity | ||||||||||||
Undistributed ordinary income — net | $ | 7,702,882 | $ | 3,291,670 | $ | 2,305,498 | ||||||||
Capital loss carryforwards: | ||||||||||||||
Expiring 2016(1) | $ | (89,358,426 | ) | $ | — | $ | (15,319,008 | ) | ||||||
Expiring 2017(1) | (106,107,378 | ) | (8,401,592 | ) | (28,233,535 | ) | ||||||||
Expiring 2019(1) | (9,250,431 | ) | — | — | ||||||||||
Perpetual Long-term | — | — | — | |||||||||||
Perpetual Short-term | — | — | — | |||||||||||
Total capital loss carryforwards | $ | (204,716,235 | ) | $ | (8,401,592 | ) | $ | (43,552,543 | ) | |||||
Unrealized gains (losses) — net | (24,296,918 | ) | (1,904,819 | ) | 513,892 | |||||||||
Total accumulated losses — net | $ | (221,310,271 | ) | $ | (7,014,741 | ) | $ | (40,733,153 | ) | |||||
| (1) | Expiration occurs on October 31 of the year indicated. The Focused International Equity, International Small Cap and Strategic International Equity Funds utilized $9,967,545, $17,073,283 and $5,967,340, respectively, of capital losses in the current fiscal year. |
As of October 31, 2014, the Funds’ aggregate security unrealized gains and losses based on cost for U.S. federal income tax purposes were as follows:
| Focused International Equity | International Small Cap | Strategic International Equity | ||||||||||||
Tax cost | $ | 272,335,537 | $ | 191,306,495 | $ | 71,295,781 | ||||||||
Gross unrealized gain | 4,200,757 | 11,037,608 | 5,547,390 | |||||||||||
Gross unrealized loss | (28,469,750 | ) | (12,930,150 | ) | (5,005,575 | ) | ||||||||
Net unrealized security gain (loss) | $ | (24,268,993 | ) | $ | (1,892,542 | ) | $ | 541,815 | ||||||
Net unrealized loss on other investments | (27,925 | ) | (12,277 | ) | (27,923 | ) | ||||||||
Net unrealized gain (loss) | $ | (24,296,918 | ) | $ | (1,904,819 | ) | $ | 513,892 | ||||||
The difference between GAAP-basis and tax-basis unrealized gains (losses) is attributable primarily to wash sales and differences related to the tax treatment of passive foreign investment company investments.
54
GOLDMAN SACHS FUNDAMENTAL INTERNATIONAL EQUITY FUNDS
| 7. TAX INFORMATION (continued) |
In order to present certain components of the Funds’ capital accounts on a tax-basis, certain reclassifications have been recorded to the Funds’ accounts. These reclassifications have no impact on the net asset value of the Fund’s and result primarily from differences in the tax treatment of foreign currency transactions, passive foreign investment company investments and underlying fund investments.
| Fund | Accumulated Net Realized Gain (Loss) | Undistributed Net Investment Income (Loss) | ||||||||
Focused International Equity | $ | 7,890 | $ | (7,890 | ) | |||||
International Small Cap | (1,795,111 | ) | 1,795,111 | |||||||
Strategic International Equity | 36,183 | (36,183 | ) | |||||||
GSAMI has reviewed the Funds’ tax positions for all open tax years (the current and prior three years, as applicable) and has concluded that no provision for income tax is required in the Funds’ financial statements. Such open tax years remain subject to examination and adjustment by tax authorities.
| 8. OTHER RISKS |
The Funds’ risks include, but are not limited to, the following:
Foreign Custody Risk — A Fund that invests in foreign securities may hold such securities and foreign currency with foreign banks, agents, and securities depositories appointed by the Fund’s custodian (each a “Foreign Custodian”). Some foreign custodians may be recently organized or new to the foreign custody business. In some countries, Foreign Custodians may be subject to little or no regulatory oversight or independent evaluation of their operations. Further, the laws of certain countries may place limitations on a Fund’s ability to recover its assets if a Foreign Custodian enters bankruptcy. Investments in emerging markets may be subject to greater custody risks than investments in more developed markets. Custody services in emerging market countries are very often undeveloped and may be considerably less well regulated than in more developed countries, and thus may not afford the same level of investor protection as would apply in developed countries.
Investments in Other Investment Companies — As a shareholder of another investment company, including an exchange traded fund (“ETF”), a Fund will directly bear its proportionate share of any management fees and other expenses paid by such other investment companies, in addition to the fees and expenses regularly borne by the Fund. ETFs are subject to risks that do not apply to conventional mutual funds, including but not limited to the following: (i) the market price of the ETF’s shares may trade at a premium or a discount to their NAV; and (ii) an active trading market for an ETF’s shares may not develop or be maintained.
Issuer Concentration Risk — The Focused International Equity Fund intends to invest in a relatively small number of issuers. As a result, it may be subject to greater risks than a fund that invests in a greater number of issuers. A change in the value of any single investment held by the Fund may affect the overall value of the Fund more than it would affect a mutual fund that holds more investments. In particular, the Fund may be more susceptible to adverse developments affecting any single issuer in the Fund and may be susceptible to greater losses because of these developments.
Large Shareholder Transactions Risk — A Fund may experience adverse effects when certain large shareholders, such as other funds, institutional investors (including those trading by use of non-discretionary mathematical formulas), financial intermediaries (who may make investment decisions on behalf of underlying clients and/or include a Fund in their investment model), individuals, accounts and Goldman Sachs affiliates, purchase or redeem large amounts of shares of a Fund. Such large shareholder redemptions may cause the Fund to sell portfolio securities at times when it would not otherwise do so, which may negatively impact a Fund’s NAV and liquidity. Similarly, large Fund share purchases may adversely affect a Fund’s performance to the extent that a Fund is delayed in investing new cash and is required to maintain a larger cash position than it ordinarily would.
55
GOLDMAN SACHS FUNDAMENTAL INTERNATIONAL EQUITY FUNDS
Notes to Financial Statements (continued)
October 31, 2014
| 8. OTHER RISKS (continued) |
These transactions may also accelerate the realization of taxable income to shareholders if such sales of investments resulted in gains, and may also increase transaction costs. In addition, a large redemption could result in a Fund’s current expenses being allocated over a smaller asset base, leading to an increase in the Fund’s expense ratio.
Liquidity Risk — The Funds may make investments that are illiquid or that may become less liquid in response to market developments or adverse investor perceptions. Illiquid investments may be more difficult to value. Liquidity risk may also refer to the risk that a Fund will not be able to pay redemption proceeds within the allowable time period because of unusual market conditions, an unusually high volume of redemption requests, or other reasons. To meet redemption requests, a Fund may be forced to sell investments at an unfavorable time and/or under unfavorable conditions.
Market and Credit Risks — In the normal course of business, the Funds trade financial instruments and enter into financial transactions where risk of potential loss exists due to changes in the market (market risk). Additionally, the Funds may also be exposed to credit risk in the event that an issuer or guarantor fails to perform or that an institution or entity with which the Funds have unsettled or open transactions defaults.
Investing in foreign markets may involve special risks and considerations not typically associated with investing in the U.S. Foreign securities may be subject to risk of loss because of more or less foreign government regulation, less public information and less economic, political and social stability in the countries in which the Fund invests. Loss may also result from the imposition of exchange controls, confiscations and other government restrictions by the U.S. or other governments, or from problems in registration, settlement or custody. Foreign risk also involves the risk of negative foreign currency rate fluctuations, which may cause the value of securities denominated in such foreign currency (or other instruments through which the Fund has exposure to foreign currencies) to decline in value. Currency exchange rates may fluctuate significantly over short periods of time. To the extent that the Fund also invests in securities of issuers located in emerging markets, these risks may be more pronounced.
| 9. INDEMNIFICATIONS |
Under the Trust’s organizational documents, its Trustees, officers, employees and agents are indemnified, to the extent permitted by the Act and state law, against certain liabilities that may arise out of performance of their duties to the Funds. Additionally, in the course of business, the Funds enter into contracts that contain a variety of indemnification clauses. The Funds’ maximum exposure under these arrangements is unknown, as this would involve future claims that may be made against the Funds that have not yet occurred. However, GSAMI believes the risk of loss under these arrangements to be remote.
| 10. SUBSEQUENT EVENTS |
With the exception of the conversion of Class B Shares, subsequent events after the Statement of Assets and Liabilities date have been evaluated through the date the financial statements were issued. GSAMI has concluded that there is no impact requiring adjustment or disclosure in the financial statements.
56
GOLDMAN SACHS FUNDAMENTAL INTERNATIONAL EQUITY FUNDS
| 11. SUMMARY OF SHARE TRANSACTIONS |
Share activity is as follows:
| Focused International Equity Fund | ||||||||||||||||
|
| |||||||||||||||
| For the Fiscal Year Ended October 31, 2014 | For the Fiscal Year Ended October 31, 2013 | |||||||||||||||
|
| |||||||||||||||
| Shares | Dollars | Shares | Dollars | |||||||||||||
|
| |||||||||||||||
| Class A Shares | ||||||||||||||||
Shares sold | 810,545 | $ | 16,129,234 | 378,015 | $ | 6,966,587 | ||||||||||
Shares converted from Class B | 1,752 | 34,678 | 2,956 | 51,654 | ||||||||||||
Reinvestment of distributions | 11,140 | 220,455 | 91,194 | 1,418,987 | ||||||||||||
Shares redeemed | (729,100 | ) | (14,367,121 | ) | (784,048 | ) | (13,442,524 | ) | ||||||||
| 94,337 | 2,017,246 | (311,883 | ) | (5,005,296 | ) | |||||||||||
| Class B Shares | ||||||||||||||||
Shares sold | 1,969 | 37,951 | 1,571 | 27,933 | ||||||||||||
Shares converted to Class A | (1,778 | ) | (34,678 | ) | (2,989 | ) | (51,654 | ) | ||||||||
Reinvestment of distributions | — | — | 1,140 | 17,595 | ||||||||||||
Shares redeemed | (14,882 | ) | (290,077 | ) | (23,376 | ) | (402,111 | ) | ||||||||
| (14,691 | ) | (286,804 | ) | (23,654 | ) | (408,237 | ) | |||||||||
| Class C Shares | ||||||||||||||||
Shares sold | 302,550 | 5,604,612 | 190,565 | 3,154,648 | ||||||||||||
Reinvestment of distributions | — | — | 23,511 | 343,499 | ||||||||||||
Shares redeemed | (200,946 | ) | (3,633,294 | ) | (215,028 | ) | (3,495,722 | ) | ||||||||
| 101,604 | 1,971,318 | (952 | ) | 2,425 | ||||||||||||
| Institutional Shares | ||||||||||||||||
Shares sold | 5,268,434 | 106,829,174 | 2,022,023 | 37,999,300 | ||||||||||||
Reinvestment of distributions | 45,024 | 905,437 | 132,560 | 2,095,772 | ||||||||||||
Shares redeemed | (1,779,054 | ) | (35,339,890 | ) | (511,677 | ) | (8,898,836 | ) | ||||||||
| 3,534,404 | 72,394,721 | 1,642,906 | 31,196,236 | |||||||||||||
| Service Shares | ||||||||||||||||
Shares sold | 1,479 | 29,637 | 493 | 7,740 | ||||||||||||
Reinvestment of distributions | 6 | 107 | 79 | 1,230 | ||||||||||||
Shares redeemed | (1,715 | ) | (33,946 | ) | (1,504 | ) | (25,605 | ) | ||||||||
| (230 | ) | (4,202 | ) | (932 | ) | (16,635 | ) | |||||||||
| Class IR Shares | ||||||||||||||||
Shares sold | 179,185 | 3,632,048 | 108,795 | 1,976,136 | ||||||||||||
Reinvestment of distributions | 706 | 14,137 | 788 | 12,406 | ||||||||||||
Shares redeemed | (139,046 | ) | (2,781,071 | ) | (32,209 | ) | (621,842 | ) | ||||||||
| 40,845 | 865,114 | 77,374 | 1,366,700 | |||||||||||||
NET INCREASE | 3,756,269 | $ | 76,957,393 | 1,382,859 | $ | 27,135,193 | ||||||||||
57
GOLDMAN SACHS FUNDAMENTAL INTERNATIONAL EQUITY FUNDS
Notes to Financial Statements (continued)
October 31, 2014
| 11. SUMMARY OF SHARE TRANSACTIONS (continued) |
Share activity is as follows:
| International Small Cap Fund | ||||||||||||||||
|
| |||||||||||||||
| For the Fiscal Year Ended October 31, 2014 | For the Fiscal Year Ended October 31, 2013 | |||||||||||||||
|
| |||||||||||||||
| Shares | Dollars | Shares | Dollars | |||||||||||||
|
| |||||||||||||||
| Class A Shares | ||||||||||||||||
Shares sold | 323,285 | $ | 6,313,379 | 268,667 | $ | 4,694,053 | ||||||||||
Shares converted from Class B | 788 | 15,330 | 1,869 | 32,142 | ||||||||||||
Reinvestment of distributions | 11,580 | 217,128 | 5,193 | 78,988 | ||||||||||||
Shares redeemed | (311,187 | ) | (6,123,835 | ) | (242,021 | ) | (4,047,413 | ) | ||||||||
| 24,466 | 422,002 | 33,708 | 757,770 | |||||||||||||
| Class B Shares | ||||||||||||||||
Shares sold | 447 | 8,625 | 336 | 5,477 | ||||||||||||
Shares converted to Class A | (801 | ) | (15,330 | ) | (1,903 | ) | (32,142 | ) | ||||||||
Reinvestment of distributions | 164 | 3,040 | 82 | 1,223 | ||||||||||||
Shares redeemed | (11,188 | ) | (215,433 | ) | (4,987 | ) | (81,934 | ) | ||||||||
| (11,378 | ) | (219,098 | ) | (6,472 | ) | (107,376 | ) | |||||||||
| Class C Shares | ||||||||||||||||
Shares sold | 90,302 | 1,723,658 | 25,108 | 434,622 | ||||||||||||
Reinvestment of distributions | 1,298 | 23,503 | 300 | 4,425 | ||||||||||||
Shares redeemed | (44,567 | ) | (832,733 | ) | (19,062 | ) | (303,130 | ) | ||||||||
| 47,033 | 914,428 | 6,346 | 135,917 | |||||||||||||
| Institutional Shares | ||||||||||||||||
Shares sold | 2,553,932 | 50,907,382 | 5,412,841 | 94,847,665 | ||||||||||||
Reinvestment of distributions | 168,944 | 3,252,168 | 64,742 | 1,009,328 | ||||||||||||
Shares redeemed | (2,456,065 | ) | (49,189,267 | ) | (1,137,755 | ) | (19,574,533 | ) | ||||||||
| 266,811 | 4,970,283 | 4,339,828 | 76,282,460 | |||||||||||||
| Service Shares | ||||||||||||||||
Shares sold | 1,583 | 28,818 | 375 | 6,040 | ||||||||||||
Reinvestment of distributions | 884 | 16,362 | 601 | 9,020 | ||||||||||||
Shares redeemed | (382 | ) | (7,173 | ) | — | — | ||||||||||
| 2,085 | 38,007 | 976 | 15,060 | |||||||||||||
| Class IR Shares | ||||||||||||||||
Shares sold | 205,667 | 4,149,180 | 35,017 | 593,219 | ||||||||||||
Reinvestment of distributions | 969 | 18,633 | 338 | 5,265 | ||||||||||||
Shares redeemed | (13,552 | ) | (268,430 | ) | (9,503 | ) | (168,336 | ) | ||||||||
| 193,084 | 3,899,383 | 25,852 | 430,148 | |||||||||||||
NET INCREASE | 522,101 | $ | 10,025,005 | 4,400,238 | $ | 77,513,979 | ||||||||||
58
GOLDMAN SACHS FUNDAMENTAL INTERNATIONAL EQUITY FUNDS
| 11. SUMMARY OF SHARE TRANSACTIONS (continued) |
Share activity is as follows:
| Strategic International Equity Fund | ||||||||||||||||
|
| |||||||||||||||
| For the Fiscal Year Ended October 31, 2014 | For the Fiscal Year Ended October 31, 2013 | |||||||||||||||
|
| |||||||||||||||
| Shares | Dollars | Shares | Dollars | |||||||||||||
|
| |||||||||||||||
| Class A Shares | ||||||||||||||||
Shares sold | 198,704 | $ | 2,763,446 | 154,622 | $ | 1,873,207 | ||||||||||
Shares converted from Class B | 32,994 | 459,442 | 42,523 | 518,619 | ||||||||||||
Reinvestment of distributions | 13,124 | 178,224 | 32,705 | 366,299 | ||||||||||||
Shares redeemed | (315,548 | ) | (4,390,132 | ) | (478,751 | ) | (5,774,966 | ) | ||||||||
| (70,726 | ) | (989,020 | ) | (248,901 | ) | (3,016,841 | ) | |||||||||
| Class B Shares | ||||||||||||||||
Shares sold | 2,579 | 32,762 | 7,600 | 81,587 | ||||||||||||
Shares converted to Class A | (36,933 | ) | (459,442 | ) | (47,564 | ) | (518,619 | ) | ||||||||
Reinvestment of distributions | 87 | 1,060 | 4,050 | 40,625 | ||||||||||||
Shares redeemed | (58,436 | ) | (727,361 | ) | (83,416 | ) | (899,467 | ) | ||||||||
| (92,703 | ) | (1,152,981 | ) | (119,330 | ) | (1,295,874 | ) | |||||||||
| Class C Shares | ||||||||||||||||
Shares sold | 82,020 | 1,031,878 | 92,764 | 1,014,981 | ||||||||||||
Reinvestment of distributions | 605 | 7,442 | 6,073 | 61,707 | ||||||||||||
Shares redeemed | (139,914 | ) | (1,749,533 | ) | (155,235 | ) | (1,697,502 | ) | ||||||||
| (57,289 | ) | (710,213 | ) | (56,398 | ) | (620,814 | ) | |||||||||
| Institutional Shares | ||||||||||||||||
Shares sold | 701,638 | 10,194,170 | 1,125,983 | 14,712,297 | ||||||||||||
Reinvestment of distributions | 32,742 | 463,301 | 46,618 | 543,561 | ||||||||||||
Shares redeemed | (386,526 | ) | (5,573,406 | ) | (374,284 | ) | (4,792,796 | ) | ||||||||
| 347,854 | 5,084,065 | 798,317 | 10,463,062 | |||||||||||||
| Class IR Shares | ||||||||||||||||
Shares sold | 5,492 | 76,480 | 1,327 | 14,860 | ||||||||||||
Reinvestment of distributions | 46 | 623 | 173 | 1,935 | ||||||||||||
Shares redeemed | (773 | ) | (10,433 | ) | (3,908 | ) | (47,428 | ) | ||||||||
| 4,765 | 66,670 | (2,408 | ) | (30,633 | ) | |||||||||||
| Class R Shares | ||||||||||||||||
Shares sold | 4 | 53 | 584 | 7,575 | ||||||||||||
Reinvestment of distributions | 4 | 58 | 11 | 121 | ||||||||||||
Shares redeemed | — | — | (7 | ) | (91 | ) | ||||||||||
| 8 | 111 | 588 | 7,605 | |||||||||||||
NET INCREASE | 131,909 | $ | 2,298,632 | 371,868 | $ | 5,506,505 | ||||||||||
59
Report of Independent Registered Public
Accounting Firm
To the Board of Trustees and Shareholders of
Goldman Sachs Trust — Goldman Sachs Fundamental International Equity Funds:
In our opinion, the accompanying statements of assets and liabilities, including the schedules of investments, and the related statements of operations and of changes in net assets and the financial highlights present fairly, in all material respects, the financial position of Goldman Sachs Focused International Equity Fund, Goldman Sachs International Small Cap Fund and Goldman Sachs Strategic International Equity Fund (collectively the “Fundamental International Equity Funds”), funds of Goldman Sachs Trust, at October 31, 2014 and the results of each of their operations, the changes in each of their net assets and the financial highlights for each of the periods indicated, in conformity with accounting principles generally accepted in the United States of America. These financial statements and financial highlights (hereafter referred to as “financial statements”) are the responsibility of the Fundamental International Equity Funds’ management. Our responsibility is to express an opinion on these financial statements based on our audits. We conducted our audits of these financial statements in accordance with the standards of the Public Company Accounting Oversight Board (United States). Those standards require that we plan and perform the audit to obtain reasonable assurance about whether the financial statements are free of material misstatement. An audit includes examining, on a test basis, evidence supporting the amounts and disclosures in the financial statements, assessing the accounting principles used and significant estimates made by management, and evaluating the overall financial statement presentation. We believe that our audits, which included confirmation of securities at October 31, 2014 by correspondence with the custodian, brokers, and the application of alternative auditing procedures where securities purchased had not been received, provide a reasonable basis for our opinion.
PricewaterhouseCoopers LLP
Boston, Massachusetts
December 23, 2014
60
GOLDMAN SACHS FUNDAMENTAL INTERNATIONAL EQUITY FUNDS
Fund Expenses — Six Month Period Ended October 31, 2014 (Unaudited)
As a shareholder of Class A, Class B, Class C, Institutional, Service, Class IR or Class R Shares of a Fund you incur two types of costs: (1) transaction costs, including sales charges on purchase payments (with respect to Class A Shares) and contingent deferred sales charges on redemptions (with respect to Class B and Class C Shares); and (2) ongoing costs, including management fees; distribution and service (12b-1) fees (with respect to Class A, Class B, Class C and Class R Shares); and other Fund expenses. This example is intended to help you understand your ongoing costs (in dollars) of investing in Class A, Class B, Class C, Institutional, Service, Class IR and Class R Shares of the Funds and to compare these costs with the ongoing costs of investing in other mutual funds.
The example is based on an investment of $1,000 invested at the beginning of the period and held for the entire period from May 1, 2014 through October 31, 2014.
Actual Expenses — The first line under each share class in the table below provides information about actual account values and actual expenses. You may use the information in this line, together with the amount you invested, to estimate the expenses that you paid over the period. Simply divide your account value by $1,000 (for example, an $8,600 account value divided by $1,000=8.6), then multiply the result by the number in the first line under the heading entitled “Expenses Paid” to estimate the expenses you paid on your account during this period.
Hypothetical Example for Comparison Purposes — The second line under each share class in the table below provides information about hypothetical account values and hypothetical expenses based on the Funds’ actual net expense ratio and an assumed rate of return of 5% per year before expenses, which is not the Funds’ actual return. The hypothetical account values and expenses may not be used to estimate the actual ending account balance or expenses you paid for the period. You may use this information to compare the ongoing costs of investing in the Funds and other funds. To do so, compare this 5% hypothetical example with the 5% hypothetical examples that appear in the shareholder reports of the other funds.
Please note that the expenses shown in the table are meant to highlight your ongoing costs only and do not reflect any transactional costs, such as sales charges, redemption fee or exchange fees. Therefore, the second line of the table is useful in comparing ongoing costs only, and will not help you determine the relative total costs of owning different funds. In addition, if these transactional costs were included, your costs would have been higher.
| Focused International Equity Fund | International Small Cap Fund | Strategic International Equity Fund | ||||||||||||||||||||||||||||||||||
| Share Class | Beginning Account Value 05/01/14 | Ending Account Value 10/31/14 | Expenses Paid for the 6 Months Ended 10/31/14* | Beginning Account Value 05/01/14 | Ending Account Value 10/31/14 | Expenses Paid for the 6 Months Ended 10/31/14* | Beginning Account Value 05/01/14 | Ending Account Value 10/31/14 | Expenses Paid for the 6 Months Ended 10/31/14* | |||||||||||||||||||||||||||
| Class A | ||||||||||||||||||||||||||||||||||||
Actual | $ | 1,000 | $ | 920.40 | $ | 6.34 | $ | 1,000 | $ | 949.60 | $ | 7.08 | $ | 1,000 | $ | 956.80 | $ | 6.46 | ||||||||||||||||||
Hypothetical 5% return | 1,000 | 1,018.60 | + | 6.67 | 1,000 | 1,017.95 | + | 7.32 | 1,000 | 1,018.60 | + | 6.67 | ||||||||||||||||||||||||
| Class B | ||||||||||||||||||||||||||||||||||||
Actual | 1,000 | 917.10 | 9.95 | 1,000 | 946.20 | 10.74 | 1,000 | 952.50 | 10.14 | |||||||||||||||||||||||||||
Hypothetical 5% return | 1,000 | 1,014.82 | + | 10.46 | 1,000 | 1,014.17 | + | 11.12 | 1,000 | 1,014.82 | + | 10.46 | ||||||||||||||||||||||||
| Class C | ||||||||||||||||||||||||||||||||||||
Actual | 1,000 | 917.20 | 9.95 | 1,000 | 946.10 | 10.69 | 1,000 | 953.00 | 10.14 | |||||||||||||||||||||||||||
Hypothetical 5% return | 1,000 | 1,014.82 | + | 10.46 | 1,000 | 1,014.22 | + | 11.07 | 1,000 | 1,014.82 | + | 10.46 | ||||||||||||||||||||||||
| Institutional | ||||||||||||||||||||||||||||||||||||
Actual | 1,000 | 922.20 | 4.41 | 1,000 | 952.00 | 5.07 | 1,000 | 958.00 | 4.49 | |||||||||||||||||||||||||||
Hypothetical 5% return | 1,000 | 1,020.62 | + | 4.63 | 1,000 | 1,020.01 | + | 5.24 | 1,000 | 1,020.62 | + | 4.63 | ||||||||||||||||||||||||
| Service | ||||||||||||||||||||||||||||||||||||
Actual | 1,000 | 919.80 | 6.82 | 1,000 | 949.40 | 7.52 | N/A | N/A | N/A | |||||||||||||||||||||||||||
Hypothetical 5% return | 1,000 | 1,018.10 | + | 7.17 | 1,000 | 1,017.49 | + | 7.78 | N/A | N/A | N/A | |||||||||||||||||||||||||
| Class IR | ||||||||||||||||||||||||||||||||||||
Actual | 1,000 | 921.90 | 5.13 | 1,000 | 950.90 | 5.80 | 1,000 | 957.60 | 5.23 | |||||||||||||||||||||||||||
Hypothetical 5% return | 1,000 | 1,019.86 | + | 5.40 | 1,000 | 1,019.26 | + | 6.01 | 1,000 | 1,019.86 | + | 5.40 | ||||||||||||||||||||||||
| Class R | ||||||||||||||||||||||||||||||||||||
Actual | N/A | N/A | N/A | N/A | N/A | N/A | 1,000 | 955.60 | 7.69 | |||||||||||||||||||||||||||
Hypothetical 5% return | N/A | N/A | N/A | N/A | N/A | N/A | 1,000 | 1,017.34 | 7.93 | |||||||||||||||||||||||||||
| * | Expenses are calculated using each Fund’s annualized net expense ratio for each class, which represents the ongoing expenses as a percentage of net assets for the six months ended October 31, 2014. Expenses are calculated by multiplying the annualized net expense ratio by the average account value for the period; then multiplying the result by the number of days in the most recent fiscal half year; and then dividing that result by the number of days in the fiscal year. The annualized net expense ratios for the period were as follows: |
| Fund | Class A | Class B | Class C | Institutional | Service | Class IR | Class R | |||||||||||||||||||||
Focused International Equity | 1.31 | % | 2.06 | % | 2.06 | % | 0.91 | % | 1.41 | % | 1.06 | % | N/A | |||||||||||||||
International Small Cap | 1.44 | 2.19 | 2.18 | 1.03 | 1.53 | 1.18 | N/A | |||||||||||||||||||||
Strategic International Equity | 1.31 | 2.06 | 2.06 | 0.91 | N/A | 1.06 | 1.56 | % | ||||||||||||||||||||
| + | Hypothetical expenses are based on each Fund’s actual annualized net expense ratios and an assumed rate of return of 5% per year before expenses. |
61
GOLDMAN SACHS FUNDAMENTAL INTERNATIONAL EQUITY FUNDS
Statement Regarding Basis for Approval of Management Agreement (Unaudited)
Background
The Goldman Sachs Focused International Equity Fund, Goldman Sachs International Small Cap Fund, and Goldman Sachs Strategic International Equity Fund (the “Funds”) are investment portfolios of Goldman Sachs Trust (the “Trust”). The Board of Trustees oversees the management of the Trust and reviews the investment performance and expenses of the Funds at regularly scheduled meetings held during the year. In addition, the Board of Trustees determines annually whether to approve the continuance of the Trust’s investment management agreement (the “Management Agreement”) with Goldman Sachs Asset Management International (the “Investment Adviser”) on behalf of the Funds.
The Management Agreement was most recently approved for continuation until June 30, 2015 by the Board of Trustees, including those Trustees who are not parties to the Management Agreement or “interested persons” (as defined in the Investment Company Act of 1940, as amended) of any party thereto (the “Independent Trustees”), at a meeting held on June 11-12, 2014 (the “Annual Meeting”).
The review process undertaken by the Trustees spans the course of the year and culminates with the Annual Meeting. To assist the Trustees in their deliberations, the Trustees have established a Contract Review Committee (the “Committee”), comprised of the Independent Trustees. The Committee held four meetings over the course of the year since the Management Agreement was last approved. At those Committee meetings, regularly scheduled Board or other committee meetings and/or the Annual Meeting, the Board, or the Independent Trustees, as applicable, considered matters relating to the Management Agreement, including:
| (a) | the nature and quality of the advisory, administrative and other services provided to the Funds by the Investment Adviser and its affiliates, including information about: |
| (i) | the structure, staff and capabilities of the Investment Adviser and its portfolio management teams; |
| (ii) | the groups within the Investment Adviser and its affiliates that support the portfolio management teams or provide other types of necessary services, including fund services groups (e.g., accounting and financial reporting, tax, shareholder services and operations), controls and risk management groups (e.g., legal, compliance, valuation oversight, credit risk management, internal audit, compliance testing, market risk analysis, finance and strategy and central funding), sales and distribution support groups and others (e.g., information technology and training); |
| (iii) | trends in headcount; |
| (iv) | the Investment Adviser’s financial resources and ability to hire and retain talented personnel and strengthen its operations; and |
| (v) | the parent company’s support of the Investment Adviser and its mutual fund business, as expressed by the firm’s senior management; |
| (b) | information on the investment performance of each Fund, including comparisons to the performance of similar mutual funds, as provided by a third party mutual fund data provider engaged as part of the contract review process (the “Outside Data Provider”), and benchmark performance indices, and general investment outlooks in the markets in which the Funds invest; |
| (c) | the terms of the Management Agreement and agreements with affiliated service providers entered into by the Trust on behalf of the Funds; |
| (d) | expense information for the Funds, including: |
| (i) | the relative management fee and expense levels of each Fund as compared to those of comparable funds managed by other advisers, as provided by the Outside Data Provider; and |
| (ii) | each Fund’s expense trends over time; |
| (e) | with respect to the extensive investment performance and expense comparison data provided by the Outside Data Provider, its processes in producing that data for the Funds; |
| (f) | the undertakings of the Investment Adviser to waive certain fees (with respect to the Focused International Equity and International Small Cap Funds) and to limit certain expenses of each Fund that exceed specified levels, and a summary of contractual fee reductions made by the Investment Adviser and/or its affiliates over the past several years with respect to the Funds; |
| (g) | information relating to the profitability of the Management Agreement and the transfer agency and distribution and service arrangements of each Fund and the Trust as a whole to the Investment Adviser and its affiliates; |
| (h) | whether each Fund’s existing management fee schedule adequately addressed any economies of scale; |
| (i) | a summary of the “fall-out” benefits derived by the Investment Adviser and its affiliates from their relationships with the Funds, including the fees received by the Investment Adviser’s affiliates from the Funds for transfer agency, portfolio trading, distribution and other services; |
| (j) | a summary of potential benefits derived by the Funds as a result of their relationship with the Investment Adviser; |
62
GOLDMAN SACHS FUNDAMENTAL INTERNATIONAL EQUITY FUNDS
Statement Regarding Basis for Approval of Management Agreement (Unaudited) (continued)
| (k) | information regarding commissions paid by the Funds and broker oversight, an update on the Investment Adviser’s soft dollars practices, other information regarding portfolio trading and how the Investment Adviser carries out its duty to seek best execution; |
| (l) | portfolio manager ownership of Fund shares; the manner in which portfolio manager compensation is determined; and the number and types of accounts managed by the portfolio managers; |
| (m) | the nature and quality of the services provided to the Funds by their unaffiliated service providers, and the Investment Adviser’s general oversight and evaluation (including reports on due diligence) of those service providers as part of the administration services provided under the Management Agreement; and |
| (n) | the Investment Adviser’s processes and policies addressing various types of potential conflicts of interest; its approach to risk management; the annual review of the effectiveness of the Funds’ compliance program; and periodic compliance reports. |
The Trustees also received an overview of the Funds’ distribution arrangements. They received information regarding the Funds’ assets, share purchase and redemption activity and the payment of Rule 12b-1 distribution and service fees by the Funds and the payment of non-Rule 12b-1 shareholder service and/or administration fees with respect to the Focused International Equity and International Small Cap Funds’ Service Shares. Information was also provided to the Trustees relating to revenue sharing payments made by and services provided by the Investment Adviser and its affiliates to intermediaries that promote the sale, distribution and/or servicing of Fund shares.
The presentations made at the Board and Committee meetings and at the Annual Meeting encompassed the Funds and other mutual fund portfolios for which the Board of Trustees has responsibility. In evaluating the Management Agreement at the Annual Meeting, the Trustees relied upon their knowledge, resulting from their meetings and other interactions throughout the year, of the Investment Adviser, its affiliates, their services and the Funds. In conjunction with these meetings, the Trustees received written materials and oral presentations on the topics covered, and were advised by their independent legal counsel regarding their responsibilities and other regulatory requirements related to the approval and continuation of mutual fund investment management agreements under applicable law. In addition, the Investment Adviser and its affiliates provided the Independent Trustees with a written response to a formal request for information sent on behalf of the Independent Trustees by their independent legal counsel. During the course of their deliberations, the Independent Trustees met in executive sessions with their independent legal counsel, without representatives of the Investment Adviser or its affiliates present. The Independent Trustees also discussed the broad range of other investment choices that are available to Fund investors, including the availability of comparable funds managed by other advisers.
Nature, Extent and Quality of the Services Provided Under the Management Agreement
As part of their review, the Trustees considered the nature, extent and quality of the services provided by the Investment Adviser. In this regard, the Trustees considered both the investment advisory services and non-advisory services that are provided to the Funds by the Investment Adviser and its affiliates. The Trustees noted the transition in the leadership and changes in personnel of various of the Investment Adviser’s portfolio management teams that had occurred in recent periods, and the ongoing recruitment efforts aimed at bringing high quality investment talent to the Investment Adviser. They also noted the Investment Adviser’s commitment to maintaining high quality systems. The Trustees concluded that the Investment Adviser continued to commit substantial financial and operational resources to the Funds and expressed confidence that the Investment Adviser would continue to do so in the future. The Trustees also recognized that the Investment Adviser had made significant commitments to address regulatory compliance requirements applicable to the Funds and the Investment Adviser.
Investment Performance
The Trustees also considered the investment performance of the Funds. In this regard, they compared the investment performance of each Fund to its peers using rankings and ratings compiled by the Outside Data Provider as of December 31, 2013, and updated performance information prepared by the Investment Adviser using the peer groups identified by the Outside Data Provider as of March 31, 2014. The information on each Fund’s investment performance was provided for the one-, three-, five- and ten-year periods ending on the applicable dates, to the extent that each Fund had been in existence for those periods. The Trustees also reviewed each Fund’s investment performance over time (including on a year-by-year basis) relative to its performance benchmark. As part of this review, they considered the investment performance trends of the Funds over time, and reviewed the investment performance of each Fund in light of its investment objective and policies and market conditions.
63
GOLDMAN SACHS FUNDAMENTAL INTERNATIONAL EQUITY FUNDS
Statement Regarding Basis for Approval of Management Agreement (Unaudited) (continued)
In addition, the Trustees considered materials prepared and presentations made by the Investment Adviser’s senior management and portfolio management personnel, in which Fund performance was assessed. The Trustees also considered the Investment Adviser’s periodic reports with respect to the Funds’ risk profiles, and how the Investment Adviser’s approach to risk monitoring and management influences portfolio management.
They observed that the Focused International Equity Fund’s Class A Shares had placed in the first quartile of the Fund’s peer group for the one- and three-year periods, in the third quartile for the five-year period, and in the fourth quartile for the ten-year period, and had outperformed the Fund’s benchmark index for the one-year period and underperformed for the three-, five-, and ten-year periods ended March 31, 2014. The Trustees observed that the International Small Cap Fund’s Class A Shares had placed in the second quartile of the Fund’s peer group for the three-year period, in the third quartile for the one- and five-year periods, and in the fourth quartile for the ten-year period, and had outperformed the Fund’s benchmark index for the three- and five-year periods, performed in-line with the Fund’s benchmark index for the one-year period, and underperformed for the ten-year period ended March 31, 2014. They observed that the Strategic International Equity Fund’s Class A Shares had placed in the top half of the Fund’s peer group for the one- and three-year periods and in the third quartile for the five-year period, and had outperformed the Fund’s benchmark index for the one-year period and underperformed for the three- and five-year periods ended March 31, 2014.
Costs of Services Provided and Competitive Information
The Trustees considered the contractual terms of the Management Agreement and the fee rates payable by each Fund thereunder. In this regard, the Trustees considered information on the services rendered by the Investment Adviser to the Funds, which included both advisory and administrative services that were directed to the needs and operations of the Funds as registered mutual funds.
In particular, the Trustees reviewed analyses prepared by the Outside Data Provider regarding the expense rankings of the Funds. The analyses provided a comparison of the Funds’ management fees and breakpoints to those of relevant peer groups and category universes; an expense analysis which compared each Fund’s overall net and gross expenses to a peer group and a category universe; and a five-year history comparing each Fund’s net expenses to the peer and category medians. The analyses also compared each Fund’s transfer agency, custody, and distribution fees, other expenses and fee waivers/reimbursements to those of the peer group and category medians. The Trustees concluded that the comparisons provided by the Outside Data Provider were useful in evaluating the reasonableness of the management fees and total expenses paid by the Funds.
In addition, the Trustees considered the Investment Adviser’s undertakings to waive a portion of the management fees payable by the Focused International Equity and International Small Cap Funds and to limit certain expenses of the Funds that exceed specified levels. They also noted that the Investment Adviser did not manage institutional accounts or collective investment vehicles having investment objectives and policies similar to those of the Funds, and therefore this type of fee comparison was not possible.
In addition, the Trustees noted that shareholders are able to redeem their Fund shares at any time if shareholders believe that the Fund fees and expenses are too high or if they are dissatisfied with the performance of the Fund.
Profitability
The Trustees reviewed the Investment Adviser’s revenues and pre-tax profit margins with respect to the Trust and each of the Funds. In this regard the Trustees noted that they had received, among other things, profitability analyses and summaries, revenue and expense schedules by Fund and by function (i.e., investment management, transfer agency and distribution and service) and information on the Investment Adviser’s expense allocation methodology. They observed that the profitability and expense figures are substantially similar to those used by the Investment Adviser for many internal purposes, including compensation decisions among various business groups, and are thus subject to a vigorous internal debate about how certain revenue and expenses should be allocated. The Trustees also noted that the internal audit group within the Goldman Sachs organization had audited the expense allocation methodology and was satisfied with the reasonableness, consistency, and accuracy of the Investment Adviser’s expense allocation methodology and profitability analysis calculations. Profitability data for the Trust and each Fund were provided for 2013 and 2012, and the Trustees considered this information in relation to the Investment Adviser’s overall profitability. The Trustees considered the Investment Adviser’s revenues and pre-tax profit margins both in absolute terms and in comparison to information on the reported pre-tax profit margins earned by certain other asset management firms.
64
GOLDMAN SACHS FUNDAMENTAL INTERNATIONAL EQUITY FUNDS
Statement Regarding Basis for Approval of Management Agreement (Unaudited) (continued)
Economies of Scale
The Trustees considered the information that had been provided regarding the Investment Adviser’s profitability. The Trustees also considered the breakpoints in the fee rate payable under the Management Agreement for each of the Funds at the following annual percentage rates of the average daily net assets of the Funds:
| Average Daily Net Assets | Focused International Equity Fund | International Small Cap Fund | Strategic International Equity Fund | |||||||||
| First $1 billion | 1.00 | % | 1.10 | % | 0.85 | % | ||||||
| Next $1 billion | 0.90 | 1.10 | 0.77 | |||||||||
| Next $3 billion | 0.86 | 0.99 | 0.73 | |||||||||
| Next $3 billion | 0.84 | 0.94 | 0.72 | |||||||||
| Over $8 billion | 0.82 | 0.92 | 0.71 | |||||||||
The Trustees noted that the breakpoints were meant to share potential economies of scale, if any, with the Funds and their shareholders as assets under management reach those asset levels. The Trustees considered the amounts of assets in the Funds; the Funds’ recent share purchase and redemption activity; the information provided by the Investment Adviser relating to the costs of the services provided by the Investment Adviser and its affiliates and their realized profits; information comparing fee rates charged by the Investment Adviser with fee rates charged to other funds in the peer groups; and the Investment Adviser’s undertakings to waive a portion of the management fees payable by the Focused International Equity and International Small Cap Funds and to limit certain expenses of the Funds that exceed specified levels. Upon reviewing these matters at the Annual Meeting, the Trustees concluded that the fee breakpoints represented a means of assuring that benefits of scalability, if any, would be passed along to shareholders at the specified asset levels.
Other Benefits to the Investment Adviser and Its Affiliates
The Trustees also considered the other benefits derived by the Investment Adviser and its affiliates from their relationships with the Funds as stated above, including: (a) transfer agency fees received by Goldman, Sachs & Co. (“Goldman Sachs”); (b) brokerage and futures commissions earned by Goldman Sachs for executing securities and futures transactions on behalf of the Funds; (c) research received by the Investment Adviser from broker-dealers in exchange for executing certain transactions on behalf of the Funds; (d) trading efficiencies resulting from aggregation of orders of the Funds with those for other funds or accounts managed by the Investment Adviser; (e) the Investment Adviser’s ability to leverage the infrastructure designed to service the Funds on behalf of its other clients; (f) the Investment Adviser’s ability to cross-market other products and services to Fund shareholders; (g) Goldman Sachs’ retention of certain fees as Fund Distributor; (h) the Investment Adviser’s ability to negotiate better pricing with custodians on behalf of its other clients, as a result of the relationship with the Funds; and (i) the possibility that the working relationship between the Investment Adviser and the Funds’ third party service providers may cause those service providers to be more likely to do business with other areas of Goldman Sachs. In the course of considering the foregoing, the Independent Trustees requested and received further information quantifying certain of these fall-out benefits.
Other Benefits to the Funds and Their Shareholders
The Trustees also noted that the Funds receive certain potential benefits as a result of their relationship with the Investment Adviser, including: (a) trading efficiencies resulting from aggregation of orders of the Funds with those of other funds or accounts managed by the Investment Adviser; (b) enhanced servicing from vendors because of the volume of business generated by the Investment Adviser and its affiliates; (c) enhanced servicing from broker-dealers because of the volume of business generated by the Investment Adviser and its affiliates; (d) the Investment Adviser’s ability to negotiate favorable terms with derivatives counterparties on behalf of the Funds as a result of the size and reputation of the Goldman Sachs organization; (e) the Investment Adviser’s knowledge and experience gained from managing other accounts and products; (f) the Investment Adviser’s ability to hire and retain qualified personnel to provide services to the Funds because of the reputation of the Goldman Sachs organization; (g) the Funds’ access, through the Investment Adviser, to certain firmwide resources (e.g., proprietary risk management systems and databases), subject to certain restrictions; and (h) the Funds’ access to certain affiliated distribution channels. In addition, the Trustees noted the competitive nature of the mutual fund marketplace, and considered that many of the Funds’ shareholders invested in the Funds in part because of the Funds’ relationship with the Investment Adviser and that those shareholders have a general expectation that the relationship will continue.
65
GOLDMAN SACHS FUNDAMENTAL INTERNATIONAL EQUITY FUNDS
Statement Regarding Basis for Approval of Management Agreement (Unaudited) (continued)
Conclusion
In connection with their consideration of the Management Agreement, the Trustees gave weight to each of the factors described above, but did not identify any particular factor as controlling their decision. After deliberation and consideration of all of the information provided, including the factors described above, the Trustees concluded, in the exercise of their business judgment, that the management fees paid by each of the Funds were reasonable in light of the services provided to it by the Investment Adviser, the Investment Adviser’s costs and each Fund’s current and reasonably foreseeable asset levels. The Trustees concluded that the Investment Adviser’s continued management likely would benefit each Fund and its shareholders and that the Management Agreement should be approved and continued with respect to each Fund until June 30, 2015.
66
GOLDMAN SACHS FUNDAMENTAL INTERNATIONAL EQUITY FUNDS
Trustees and Officers (Unaudited)
Independent Trustees
Name, | Position(s) Held with the Trust | Term of Office and | Principal Occupation(s) During Past 5 Years | Number of Portfolios in Fund Complex Overseen by Trustee3 | Other Directorships Held by Trustee4 | |||||
Ashok N. Bakhru Age: 72 | Chairman of the Board of Trustees | Since 1996 (Trustee since 1991) | Mr. Bakhru is retired. He was formerly Director, Apollo Investment Corporation (a business development company) (2008-2013); President, ABN Associates (a management and financial consulting firm) (1994-1996 and 1998-2012); Trustee, Scholarship America (1998-2005); Trustee, Institute for Higher Education Policy (2003-2008); Director, Private Equity Investors — III and IV (1998-2007), and Equity-Linked Investors II (April 2002-2007).
Chairman of the Board of Trustees — Goldman Sachs Fund Complex. | 112 | None | |||||
John P. Coblentz, Jr. Age: 73 | Trustee | Since 2003 | Mr. Coblentz is retired. Formerly, he was Partner, Deloitte & Touche LLP (1975-2003); Director, Emerging Markets Group, Ltd. (2004-2006); and Director, Elderhostel, Inc. (2006-2012).
Trustee — Goldman Sachs Fund Complex. | 112 | None | |||||
Diana M. Daniels Age: 65 | Trustee | Since 2007 | Ms. Daniels is retired. Formerly, she was Vice President, General Counsel and Secretary, The Washington Post Company (1991-2006). Ms. Daniels serves as a Presidential Councillor of Cornell University (2013-Present); Member, Advisory Board, Psychology Without Borders (international humanitarian aid organization) (2007-Present), and former Member of the Legal Advisory Board, New York Stock Exchange (2003-2006) and of the Corporate Advisory Board, Standish Mellon Management Advisors (2006-2007).
Trustee — Goldman Sachs Fund Complex. | 108 | None | |||||
Joseph P. LoRusso Age: 57 | Trustee | Since 2010 | Mr. LoRusso is retired. Formerly, he was President, Fidelity Investments Institutional Services Co. (“FIIS”) (2002-2008); Director, FIIS (2002-2008); Director, Fidelity Investments Institutional Operations Company (2003-2007); Executive Officer, Fidelity Distributors Corporation (2007-2008).
Trustee — Goldman Sachs Fund Complex. | 108 | None | |||||
Herbert J. Markley Age: 64 | Trustee | Since 2013 | Mr. Markley is retired. Formerly, he was Executive Vice President, Deere & Company (an agricultural and construction equipment manufacturer) (2007-2009), and President, Agricultural Division, Deere & Company (2001-2007).
Trustee — Goldman Sachs Fund Complex. | 108 | None | |||||
Jessica Palmer Age: 65 | Trustee | Since 2007 | Ms. Palmer is retired. She is Director, Emerson Center for the Arts and Culture (2011-Present); and was formerly a Consultant, Citigroup Human Resources Department (2007-2008); Managing Director, Citigroup Corporate and Investment Banking (previously, Salomon Smith Barney/Salomon Brothers) (1984-2006). Ms. Palmer was a Member of the Board of Trustees of Indian Mountain School (private elementary and secondary school) (2004-2009).
Trustee — Goldman Sachs Fund Complex. | 108 | None | |||||
Richard P. Strubel Age: 75 | Trustee | Since 1987 | Mr. Strubel is retired. Formerly, he was Director, Cardean Learning Group (provider of educational services via the internet) (2003-2008); and Director, Gildan Activewear Inc. (a clothing marketing and manufacturing company) (2000-2014). He serves as Trustee, Emeritus, The University of Chicago (1987-Present).
Trustee — Goldman Sachs Fund Complex. | 112 | The Northern Trust Mutual Fund Complex (56 Portfolios) (Chairman of the Board of Trustees) | |||||
Roy W. Templin Age: 54 | Trustee | Since 2013 | Mr. Templin is retired. He is Chairman of the Board of Directors, Con-Way Incorporated (2012-Present); and was formerly Executive Vice President and Chief Financial Officer, Whirlpool Corporation (an appliance manufacturer and marketer) (2004-2012).
Trustee — Goldman Sachs Fund Complex | 108 | Con-Way Incorporated (a transportation, supply-chain management and logistics services company) | |||||
67
GOLDMAN SACHS FUNDAMENTAL INTERNATIONAL EQUITY FUNDS
Trustees and Officers (Unaudited) (continued)
Interested Trustees*
Name, | Position(s) Held with the Trust | Term of Office and | Principal Occupation(s) During Past 5 Years | Number of Portfolios in Fund Complex Overseen by Trustee3 | Other Directorships Held by Trustee4 | |||||
James A. McNamara Age: 52 | President and Trustee | Since 2007 | Managing Director, Goldman Sachs (December 1998-Present); Director of Institutional Fund Sales, GSAM (April 1998-December 2000); and Senior Vice President and Manager, Dreyfus Institutional Service Corporation (January 1993- April 1998).
President — Goldman Sachs Fund Complex (November 2007-Present); Senior Vice President — Goldman Sachs Fund Complex (May 2007-November 2007); and Vice President — Goldman Sachs Fund Complex (2001-2007).
Trustee — Goldman Sachs Fund Complex (November 2007-Present and December 2002-May 2004). | 111 | None | |||||
Alan A. Shuch Age: 64 | Trustee | Since 1990 | Advisory Director — GSAM (May 1999-Present); Consultant to GSAM (December 1994-May 1999); and Limited Partner, Goldman Sachs (December 1994-May 1999).
Trustee — Goldman Sachs Fund Complex. | 108 | None | |||||
| * | These persons are considered to be “Interested Trustees” because they hold positions with Goldman Sachs and own securities issued by The Goldman Sachs Group, Inc. Each Interested Trustee holds comparable positions with certain other companies of which Goldman Sachs, GSAM or an affiliate thereof is the investment adviser, administrator and/or distributor. |
| 1 | Each Trustee may be contacted by writing to the Trustee, c/o Goldman Sachs, 200 West Street, New York, New York, 10282, Attn: Caroline Kraus. Information is provided as of October 31, 2014. |
| 2 | Each Trustee holds office for an indefinite term until the earliest of: (a) the election of his or her successor; (b) the date the Trustee resigns or is removed by the Board of Trustees or shareholders, in accordance with the Trust’s Declaration of Trust; (c) the conclusion of the first Board meeting held subsequent to the day the Trustee attains the age of 74 years, subject to a waiver by a majority of the Trustees (in accordance with the current resolutions of the Board of Trustees, which may be changed by the Trustees without shareholder vote); or (d) the termination of the Trust. By resolution of the Board of Trustees determining that an extension of service would be beneficial to the Trust, the retirement age has been extended with respect to Richard P. Strubel. |
| 3 | The Goldman Sachs Fund Complex consists of the Trust and Goldman Sachs Variable Insurance Trust (“GSVIT”). As of October 31, 2014, the Trust consisted of 94 portfolios (88 of which offered shares to the public) and GSVIT consisted of 14 portfolios. The Goldman Sachs Fund Complex also includes, with respect to Messrs. Bakhru, Coblentz and Strubel, Goldman Sachs Trust II (“GST II”), Goldman Sachs BDC. Inc. (“GSBDC”), Goldman Sachs MLP Income Opportunities Fund (“GSMLP”) and Goldman Sachs MLP and Energy Renaissance Fund (“GSMER”) and with respect to Mr. McNamara, GSTII, GSMLP and GSMER. GSTII, GSBDC, GSMLP and GSMER each consisted of one portfolio. As of October 31, 2014, GSBDC had not offered shares to the public. |
| 4 | This column includes only directorships of companies required to report to the Securities and Exchange Commission under the Securities Exchange Act of 1934 (i.e., “public companies”) or other investment companies registered under the Act. |
Additional information about the Trustees is available in the Portfolios’ Statement of Additional Information, which can be obtained from Goldman Sachs free of charge by calling this toll-free number (in the United States of America): 1-800-292-4726.
68
GOLDMAN SACHS FUNDAMENTAL INTERNATIONAL EQUITY FUNDS
Trustees and Officers (Unaudited) (continued)
Officers of the Trust*
Name, Address and Age1 | Position(s) Held With the Trust | Term of Office and | Principal Occupation(s) During Past 5 Years | |||
James A. McNamara 200 West Street New York, NY 10282 Age: 52 | President and Trustee | Since 2007 | Managing Director, Goldman Sachs (December 1998-Present); Director of Institutional Fund Sales, GSAM (April 1998-December 2000); and Senior Vice President and Manager, Dreyfus Institutional Service Corporation (January 1993-April 1998).
President — Goldman Sachs Fund Complex (November 2007-Present); Senior Vice President — Goldman Sachs Fund Complex (May 2007-November 2007); and Vice President — Goldman Sachs Fund Complex (2001-2007).
Trustee — Goldman Sachs Fund Complex (November 2007-Present and December 2002-May 2004). | |||
Caroline Kraus 200 West Street New York, NY 10282 Age: 37 | Secretary | Since 2012 | Vice President, Goldman Sachs (August 2006-Present); Associate General Counsel, Goldman Sachs (2012-Present); Assistant General Counsel, Goldman Sachs (August 2006-December 2011) and Associate, Weil, Gotshal & Manges, LLP (2002-2006).
Secretary — Goldman Sachs Fund Complex (August 2012-Present); and Assistant Secretary — Goldman Sachs Fund Complex (June 2012-August 2012). | |||
Scott M. McHugh 200 West Street New York, NY 10282 Age: 43 | Principal Financial Officer, Senior Vice President and Treasurer | Since 2009 (Principal Financial Officer since 2013) | Vice President, Goldman Sachs (February 2007-Present); Assistant Treasurer of certain mutual funds administered by DWS Scudder (2005-2007); and Director (2005-2007), Vice President (2000-2005) and Assistant Vice President (1998-2000), Deutsche Asset Management or its predecessor (1998-2007).
Principal Financial Officer — Goldman Sachs Fund Complex (November 2013-Present); Treasurer — Goldman Sachs Fund Complex (October 2009-Present); Senior Vice President — Goldman Sachs Fund Complex (November 2009-Present); and Assistant Treasurer — Goldman Sachs Fund Complex (May 2007-October 2009). | |||
| * | Represents a partial list of officers of the Trust. Additional information about all the officers is available in the Portfolios’ Statement of Additional Information, which can be obtained from Goldman Sachs free of charge by calling this toll-free number (in the United States): 1-800-292-4726. |
| 1 | Information is provided as of October 31, 2014. |
| 2 | Officers hold office at the pleasure of the Board of Trustees or until their successors are duly elected and qualified. Each officer holds comparable positions with certain other companies of which Goldman Sachs, GSAM or an affiliate thereof is the investment adviser, administrator and/or distributor. |
69
GOLDMAN SACHS FUNDAMENTAL INTERNATIONAL EQUITY FUNDS
Goldman Sachs Trust — Fundamental International Equity Funds — Tax Information (Unaudited)
From distributions paid during the year ended October 31, 2014, the total amount of income received by the Focused International Equity, International Small Cap, and Strategic International Equity Funds from sources within foreign countries and possessions of the United States was $0.1863, $0.2522, and $0.1662 per share, respectively, all of which is attributable to qualified passive income. The percentage of net investment income dividends paid from foreign sources by the Focused International Equity, International Small Cap, and Strategic International Equity Funds were 89.57%, 63.03%, and 95.35%, respectively. The total amount of taxes paid by the Focused International Equity, International Small Cap, and Strategic International Equity Funds was $0.0253, $0.0234, and $0.0193 per share, respectively.
For the year ended October 31, 2014, 100%, 71.41%, and 100% of the dividends paid from net investment company taxable income by the Focused International Equity, International Small Cap, and Strategic International Equity Funds qualify for the reduced tax rate under the Jobs and Growth Tax Relief and Reconciliation Act of 2003.
70
FUNDS PROFILE
Goldman Sachs Funds

Goldman Sachs is a premier financial services firm, known since 1869 for creating thoughtful and customized investment solutions in complex global markets.
Today, the Investment Management Division of Goldman Sachs serves a diverse set of clients worldwide, including private institutions, public entities and individuals. With approximately $999.2 billion in assets under supervision as of September 30, 2014, Goldman Sachs Asset Management (“GSAM”) has portfolio management teams located around the world and our investment professionals bring firsthand knowledge of local markets to every investment decision. Assets under supervision includes assets under management and other client assets for which Goldman Sachs does not have full discretion. GSAM leverages the resources of Goldman, Sachs & Co. subject to legal, internal and regulatory restrictions.

Money Market1
Financial Square FundsSM
| n | Financial Square Tax-Exempt Funds |
| n | Financial Square Federal Fund |
| n | Financial Square Government Fund |
| n | Financial Square Money Market Fund |
| n | Financial Square Prime Obligations Fund |
| n | Financial Square Treasury Instruments Fund |
| n | Financial Square Treasury Obligations Fund |
Fixed Income
Short Duration and Government
| n | Enhanced Income Fund |
| n | High Quality Floating Rate Fund |
| n | Limited Maturity Obligations Fund |
| n | Short Duration Government Fund |
| n | Short Duration Income Fund |
| n | Government Income Fund |
| n | Inflation Protected Securities Fund |
Multi-Sector
| n | Core Fixed Income Fund |
| n | Bond Fund2 |
| n | Global Income Fund |
| n | Strategic Income Fund |
| n | World Bond Fund |
Municipal and Tax-Free
| n | High Yield Municipal Fund |
| n | Municipal Income Fund |
| n | Short Duration Tax-Free Fund |
Single Sector
| n | Investment Grade Credit Fund |
| n | U.S. Mortgages Fund |
| n | High Yield Fund |
| n | High Yield Floating Rate Fund |
| n | Emerging Markets Debt Fund |
| n | Local Emerging Markets Debt Fund |
| n | Dynamic Emerging Markets Debt Fund |
Fixed Income Alternatives
| n | Long Short Credit Strategies Fund3 |
| n | Fixed Income Macro Strategies Fund |
Fundamental Equity
| n | Growth and Income Fund |
| n | Small Cap Value Fund |
| n | Small/Mid Cap Value Fund |
| n | Mid Cap Value Fund |
| n | Large Cap Value Fund |
| n | Capital Growth Fund |
| n | Strategic Growth Fund |
| n | Focused Growth Fund |
| n | Small/Mid Cap Growth Fund |
| n | Flexible Cap Growth Fund |
| n | Concentrated Growth Fund |
| n | Technology Tollkeeper Fund |
| n | Growth Opportunities Fund |
| n | Rising Dividend Growth Fund |
| n | U.S. Equity Fund |
| n | Income Builder Fund |
Tax-Advantaged Equity
| n | U.S. Tax-Managed Equity Fund4 |
| n | International Tax-Managed Equity Fund4 |
| n | U.S. Equity Dividend and Premium Fund |
| n | International Equity Dividend and Premium Fund |
Equity Insights
| n | Small Cap Equity Insights Fund |
| n | U.S. Equity Insights Fund |
| n | Small Cap Growth Insights Fund |
| n | Large Cap Growth Insights Fund |
| n | Large Cap Value Insights Fund |
| n | Small Cap Value Insights Fund |
| n | International Small Cap Insights Fund |
| n | International Equity Insights Fund |
| n | Emerging Markets Equity Insights Fund |
Fundamental Equity International
| n | Strategic International Equity Fund |
| n | Focused International Equity Fund5 |
| n | International Small Cap Fund |
| n | Asia Equity Fund |
| n | Emerging Markets Equity Fund |
| n | BRIC Fund (Brazil, Russia, India, China) |
| n | N-11 Equity Fund |
Select Satellite6
| n | Real Estate Securities Fund |
| n | International Real Estate Securities Fund |
| n | Commodity Strategy Fund |
| n | Dynamic Commodity Strategy Fund |
| n | Dynamic Allocation Fund |
| n | Absolute Return Tracker Fund |
| n | Long Short Fund |
| n | Managed Futures Strategy Fund |
| n | MLP Energy Infrastructure Fund |
| n | Multi-Manager Alternatives Fund |
| n | Multi-Asset Real Return Fund |
| n | Retirement Portfolio Completion Fund |
| n | Tactical Tilt Implementation Fund |
Total Portfolio Solutions6
| n | Balanced Strategy Portfolio |
| n | Growth and Income Strategy Portfolio |
| n | Growth Strategy Portfolio |
| n | Equity Growth Strategy Portfolio |
| n | Satellite Strategies Portfolio |
| n | Enhanced Dividend Global Equity Portfolio |
| n | Tax Advantaged Global Equity Portfolio |
| 1 | An investment in a money market fund is neither insured nor guaranteed by the Federal Deposit Insurance Corporation (“FDIC”) or any other government agency. Although the Funds seek to preserve the value of your investment at $1.00 per share, it is possible to lose money by investing in the Funds. |
| 2 | Effective on October 1, 2014, the Goldman Sachs Core Plus Fixed Income Fund was renamed the Goldman Sachs Bond Fund. |
| 3 | Effective at the close of business on March 21, 2014, the Goldman Sachs Credit Strategies Fund was reorganized with and into the Goldman Sachs Long Short Credit Strategies Fund. |
| 4 | Effective on April 30, 2014, the Goldman Sachs Structured Tax-Managed Equity and Structured International Tax-Managed Equity Funds were renamed the Goldman Sachs U.S. Tax-Managed Equity and International Tax-Managed Equity Funds, respectively. |
| 5 | Effective at the close of business on February 28, 2014, the Goldman Sachs Concentrated International Equity Fund was renamed the Goldman Sachs Focused International Equity Fund. |
| 6 | Individual Funds within the Total Portfolio Solutions and Select Satellite categories will have various placement on the risk/return spectrum and may have greater or lesser risk than that indicated by the placement of the general Total Portfolio Solutions or Select Satellite category. Financial Square FundsSM is a registered service mark of Goldman, Sachs & Co. |
| * | This list covers open-end funds only. Please visit our website at www.GSAMFUNDS.com to learn about our closed-end funds. |
TRUSTEES Ashok N. Bakhru, Chairman John P. Coblentz, Jr. Diana M. Daniels Joseph P. LoRusso Herbert J. Markley James A. McNamara Jessica Palmer Alan A. Shuch Richard P. Strubel Roy W. Templin | OFFICERS James A. McNamara, President Scott M. McHugh, Principal Financial Officer and Treasurer Caroline L. Kraus, Secretary | |
GOLDMAN, SACHS & CO. Distributor and Transfer Agent | GOLDMAN SACHS ASSET MANAGEMENT INTERNATIONAL Investment Adviser | |
Visit our website at www.GSAMFUNDS.com to obtain the most recent month-end returns.
Goldman Sachs Asset Management, L.P., 200 West Street, New York, New York 10282
The reports concerning the Funds included in this shareholder report may contain certain forward-looking statements about the factors that may affect the performance of the Funds in the future. These statements are based on Fund management’s predictions and expectations concerning certain future events and their expected impact on the Funds, such as performance of the economy as a whole and of specific industry sectors, changes in the levels of interest rates, the impact of developing world events, and other factors that may influence the future performance of the Funds. Management believes these forward-looking statements to be reasonable, although they are inherently uncertain and difficult to predict. Actual events may cause adjustments in portfolio management strategies from those currently expected to be employed.
A description of the policies and procedures that the Funds use to determine how to vote proxies relating to portfolio securities and information regarding how a Fund voted proxies relating to portfolio securities during the most recent 12-month period ended June 30 is available (i) without charge, upon request by calling 1-800-526-7384 (for Retail Shareholders) or 1-800-621-2550 (for Institutional Shareholders); and (ii) on the Securities and Exchange Commission (“SEC”) web site at http://www.sec.gov.
The Funds file their complete schedule of portfolio holdings with the SEC for the first and third quarters of each fiscal year on Form N-Q. The Funds’ Forms N-Q are available on the SEC’s web site at http://www.sec.gov within 60 days after the Funds’ first and third fiscal quarters. The Funds’ Forms N-Q may be reviewed and copied at the SEC’s Public Reference Room in Washington, D.C., and information on the operation of the Public Reference Room may also be obtained by calling 1-800-SEC-0330. Forms N-Q may be obtained upon request and without charge by calling 1-800-526-7384 (for Retail Shareholders) or 1-800-621-2550 (for Institutional Shareholders).
Fund holdings and allocations shown are as of October 31, 2014 and may not be representative of future investments. Fund holdings should not be relied on in making investment decisions and should not be construed as research or investment advice regarding particular securities. Current and future holdings are subject to risk.
The Global Industry Classification Standard (GICS) was developed by and is the exclusive property and a service mark of Morgan Stanley Capital International Inc. (MSCI) and Standard & Poor’s, a division of The McGraw-Hill Companies, Inc. (S&P) and is licensed for use by Goldman Sachs. Neither MSCI, S&P nor any other party involved in making or compiling the GICS or any GICS classifications makes any express or implied warranties or representations with respect to such standard or classification (or the results to be obtained by the use thereof), and all such parties hereby expressly disclaim all warranties of originality, accuracy, completeness, merchantability or fitness for a particular purpose with respect to any of such standard or classification. Without limiting any of the foregoing, in no event shall MSCI, S&P, any of their affiliates or any third party involved in making or compiling the GICS or any GICS classifications have any liability for any direct, indirect, special, punitive, consequential or any other damages (including lost profits) even if notified of the possibility of such damages.
The portfolio risk management process includes an effort to monitor and manage risk, but does not imply low risk.
This material is not authorized for distribution to prospective investors unless preceded or accompanied by a current Prospectus or summary prospectus, if applicable. Investors should consider a Fund’s objective, risks, and charges and expenses, and read the summary prospectus, if available, and/or the Prospectus carefully before investing or sending money. The summary prospectus, if available, and the Prospectus contain this and other information about a Fund and may be obtained from your authorized dealer or from Goldman, Sachs & Co. by calling (retail – 1-800-526-7384) (institutional – 1-800-621-2550).
© 2014 Goldman Sachs. All rights reserved. 148785.MF.MED.TMPL/12/2014 / EQINTAR-14 / 20K
Goldman Sachs Funds

| Annual Report | October 31, 2014 | |||
International Equity Insights Funds | ||||
Emerging Markets Equity Insights | ||||
International Equity Insights | ||||
International Small Cap Insights | ||||
Goldman Sachs International Equity Insights Funds
| n | EMERGING MARKETS EQUITY INSIGHTS |
| n | INTERNATIONAL EQUITY INSIGHTS |
| n | INTERNATIONAL SMALL CAP INSIGHTS |
| 3 | ||||
| 4 | ||||
| 6 | ||||
| 9 | ||||
| 28 | ||||
| 50 | ||||
| 54 | ||||
| 60 | ||||
| 76 | ||||
| 77 | ||||
| NOT FDIC-INSURED | May Lose Value | No Bank Guarantee | ||
GOLDMAN SACHS INTERNATIONAL EQUITY INSIGHTS FUNDS
Principal Investment Strategies and Risks
This is not a complete list of risks that may affect the Funds. For additional information concerning the risks applicable to the Funds, please see the Funds’ Prospectus.
The Goldman Sachs Emerging Markets Equity Insights Fund invests primarily in a diversified portfolio of equity investments in emerging country issuers. The Fund’s investments are subject to market risk, which means that the value of the securities in which it invests may go up or down in response to the prospects of individual companies, particular sectors and/or general economic conditions. Foreign and emerging markets investments may be more volatile and less liquid than investments in U.S. securities and are subject to the risks of currency fluctuations and adverse economic and political developments. The securities markets of emerging countries have less government regulation and are subject to less extensive accounting and financial reporting requirements than the markets of more developed countries. At times, the Fund may be unable to sell certain of its illiquid investments without a substantial drop in price, if at all. The Investment Adviser’s use of quantitative models to execute the Fund’s investment strategy may fail to produce the intended result. Different investment styles (e.g., “quantitative”) tend to shift in and out of favor, and at times the Fund may underperform other funds that invest in similar asset classes. The Fund may have a high rate of portfolio turnover, which involves correspondingly greater expenses which must be borne by the Fund, and is also likely to result in short-term capital gains taxable to shareholders.
The Goldman Sachs International Equity Insights Fund invests primarily in a broadly diversified portfolio of equity investments in companies that are organized outside the United States or whose securities are principally traded outside the United States. The Fund’s investments are subject to market risk, which means that the value of the securities in which it invests may go up or down in response to the prospects of individual companies, particular sectors and/or general economic conditions. Foreign and emerging markets investments may be more volatile and less liquid than investments in U.S. securities and are subject to the risks of currency fluctuations and adverse economic or political developments. The Investment Adviser’s use of quantitative models to execute the Fund’s investment strategy may fail to produce the intended result. Different investment styles (e.g., “quantitative”) tend to shift in and out of favor, and at times the Fund may underperform other funds that invest in similar asset classes. The Fund may have a high rate of portfolio turnover, which involves correspondingly greater expenses which must be borne by the Fund, and is also likely to result in short-term capital gains taxable to shareholders.
The Goldman Sachs International Small Cap Insights Fund invests primarily in a broadly diversified portfolio of equity investments in small capitalization non-U.S. issuers. The Fund’s investments are subject to market risk, which means that the value of the securities in which it invests may go up or down in response to the prospects of individual companies, particular sectors and/or general economic conditions. Foreign and emerging markets investments may be more volatile and less liquid than investments in U.S. securities and are subject to the risks of currency fluctuations and adverse economic or political developments. The securities of mid- and small-capitalization companies involve greater risks than those associated with larger, more established companies and may be subject to more abrupt or erratic price movements. The Investment Adviser’s use of quantitative models to execute the Fund’s investment strategy may fail to produce the intended result. Different investment styles (e.g., “quantitative”) tend to shift in and out of favor, and at times the Fund may underperform other funds that invest in similar asset classes. The Fund may have a high rate of portfolio turnover, which involves correspondingly greater expenses which must be borne by the Fund, and is also likely to result in short-term capital gains taxable to shareholders.
3
GOLDMAN SACHS INTERNATIONAL EQUITY INSIGHTS FUNDS
Goldman Sachs’ International Equity Insights Investment Process
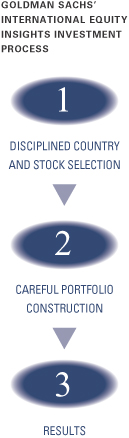

| n | Comprehensive — We forecast returns on over 10,000 stocks and several equity markets on a daily basis. |
| n | Rigorous — We evaluate stocks, countries and currencies based on fundamental investment criteria that have outperformed historically. |
| n | Objective — Our stock and equity market selection process is free from emotion that may lead to biased investment decisions. |

| n | Our computer optimization process allocates risk to our high conviction investment ideas and constructs funds that strive to neutralize systematic risks and deliver better returns. |
| n | We use proprietary risk models that are designed to be more precise, more focused and faster to respond because they seek to identify, track and manage risk specific to our process, using daily data. |

Fully invested, well-diversified international portfolio that seeks to:
| n | Blend top-down market views with bottom-up stock selection. |
| n | Maintain style, sector, risk and capitalization characteristics similar to the benchmark. |
| n | Achieve excess returns by taking many small diversified stock positions. Additionally, in the Goldman Sachs Emerging Markets Equity Insights Fund and the Goldman Sachs International Equity Insights Fund we take intentional country bets. |
4
GOLDMAN SACHS INTERNATIONAL EQUITY INSIGHTS FUNDS
Enhancements Made to Proprietary Quantitative Model During the 12-Month Period Ended October 31, 2014
We continuously look for ways to improve our investment process. Accordingly, we introduced a number of enhancements to our proprietary quantitative model during the 12-month period ended October 31, 2014.
In the fourth quarter of 2013, we implemented an enhancement to our Profitability theme to incorporate cash returns on cash invested metrics. We believe this additional metric will further help us to select the stocks of companies that efficiently reinvest and grow earnings. In addition, we extended an enhancement to our Sentiment theme for the U.K. and Japan regions, seeking to identify investment trends through natural language processing. We use natural language processing to analyze hundreds of research reports from professional stock analysts. Rather than relying on broad stock recommendations, we read through the body of the text to gain a more nuanced understanding of the reports. Analysts’ evolving views are generally reflected in the body of their research reports before changes are made in their official recommendations. By reading the full text of the reports, we gain insight into the direction of future ratings changes.
We made no enhancements to our proprietary quantitative model within the international or emerging markets regions during the first quarter of 2014.
In the second quarter of 2014, we extended to the Europe and emerging markets regions the enhancement to our Sentiment theme in which we use natural language processing to analyze earnings call transcripts and research analyst reports every quarter. Also, within the international and emerging markets regions, we enhanced our ability to identify groups of related companies within our global linkages theme. We read through hundreds of research analyst reports on a daily basis to identify groups of companies related to commonly trending investment topics in the market.
We made no enhancements to our proprietary quantitative model within the international or emerging markets regions during the third quarter of 2014.
5
MARKET REVIEW
Goldman Sachs International Equity Insights Funds
During the 12-month period ended October 31, 2014 (the “Reporting Period”), emerging markets equities generated a gain, while developed international equities posted a decline.
Emerging Markets Equities
Emerging markets equities advanced, albeit only modestly, during the Reporting Period, as concerns about slowing economic growth, high inflation and election uncertainty, among others, weighed on many of the growth and emerging markets. Notably, however, equity market returns varied dramatically by region and by country.
Early in the Reporting Period, the U.S. Federal Reserve (the “Fed”) announced it would begin tapering its asset purchases in January 2014. The announcement ended seven months of speculation about the beginning of the end of ultra-loose monetary policy that had fueled many emerging market economies in recent years. News of Argentina’s currency devaluation in January 2014 also rippled through emerging market currency and equity markets, forcing many central banks to hike interest rates, which further pressured equity markets.
From a regional perspective, Asia was the best performing region during the Reporting Period as a whole, as India’s equity market soared. India elected a new government by a large majority, raising hopes for bold reforms. Chinese equities struggled early in the Reporting Period amidst renewed concerns about China’s shadow banking system, credit quality and decelerating growth. However, Chinese equities rebounded during the second half of the Reporting Period to outperform the MSCI® Emerging Markets Standard Index (unhedged, with dividends reinvested, net of dividend withholding taxes) (the “MSCI® EM Index”). Central and Eastern Europe was the worst performing region, as the Russian equity market plunged during the Reporting Period due to the rapidly escalating geopolitical situation in Ukraine, economic sanctions from the West and a sharp decline in the price of oil. Weakness in Latin American equity markets persisted into early 2014, though the region began to rebound toward the middle of the Reporting Period, only to experience weakness again during the second half of the Reporting Period due in part to declines in the energy and materials sectors. Brazilian equities also reflected slowing economic growth and a heated presidential election in Brazil.
For the Reporting Period overall, the MSCI® EM Index returned 0.64%.* Ten of the 23** countries in the MSCI® EM Index were up for the Reporting Period, with Egypt (+39.32%) and India (+27.68%) recording the largest gains. India was also the largest positive contributor on the basis of impact, which takes both weightings and total returns into account.
Seven of the 10 sectors in the MSCI® EM Index were up for the Reporting Period, with health care (+25.45%) and information technology (+12.64%) generating the strongest returns. The information technology sector was the largest positive contributor to MSCI® EM Index returns on the basis of impact.
International Equities
Developed international equities declined modestly during the Reporting Period. Stock markets in Japan and Europe made fresh highs as late as December 2013. Japan’s Nikkei 225 Stock Average closed the calendar year at a six-year high, as the market reflected optimism about Prime Minister Shinzo Abe’s bold reforms and big stimulus. Germany’s Xetra Dax also reached a new high in December 2013, as European equity markets continued to benefit from the European Central Bank’s (“ECB”) commitment to easy monetary policy and as economic
6
MARKET REVIEW
growth returned to the region. (The Nikkei 225 Stock Average is the leading and most respected index of Japanese stocks. It is a price-weighted index comprised of Japan’s top 225 blue chip companies on the Tokyo Stock Exchange. The Xetra Dax is a blue chip index in Germany that tracks the performance of the 30 most actively traded stocks on the Frankfurt Stock Exchange.)
International developed equity markets, however, stumbled in January 2014, as renewed concerns about a variety of issues in the growth and emerging markets weighed on performance, particularly in the Asia ex-Japan region. International developed equity markets snapped back in February 2014, but performance was relatively weak for the rest of the Reporting Period, as news from the developed markets was mixed.
The Eurozone economy grew at a stronger than expected 0.5% year-over-year rate for the fourth quarter of 2013, but growth then disappointed year to date through October 31, 2014. Purchasing Managers Index (“PMI”) data began to soften early in 2014; the Ifo survey of German business confidence began dropping; and Germany reduced its economic growth estimates. Further, deflation in the region remained a threat during the second half of the Reporting Period. Many corporate earnings reports and conservative guidance from management teams prompted downward revisions to estimates, even though in the end, most companies met or beat the revised estimates. The ECB cut its benchmark interest rate to 0.05%, reduced its bank deposit rate to -0.2% and announced it would begin to buy asset-backed securities. In contrast, economic data for the U.K. improved, particularly in terms of unemployment. In turn, markets began to anticipate the Bank of England might raise its interest rates by the end of 2014.
Similarly, Japanese equities got 2014 off to a weak start in anticipation of its consumption tax hike implemented in April 2014. Japanese equities then rallied back later in the Reporting Period as a number of economic indicators were more encouraging. Inflation in Japan continued to trend higher, and market sentiment improved as Prime Minister Abe revealed more details regarding corporate reform. Also, Japan’s manufacturing PMI rose to its highest level since March 2014, while the October 2014 Tankan survey of business sentiment was unexpectedly upbeat and revealed that large firms intend to increase spending. The Bank of Japan announced further monetary easing measures.
Performance of the Asia ex-Japan region generally improved through the second half of the Reporting Period. Indeed, the region posted the best performance within the MSCI® EAFE Standard Index (unhedged,with dividends reinvested, net of dividend withholding taxes) (the “MSCI® EAFE Index”) for the full Reporting Period, largely due to the particularly strong performance of Hong Kong equities.
For the Reporting Period overall, the MSCI® EAFE Index declined -0.60%.* Fourteen of the 21 countries in the MSCI® EAFE Index were down for the Reporting Period, with Austria (-24.48%) and Portugal (-23.96%) recording the largest losses. France (-6.74%) was the largest detractor on the basis of impact, which takes both weightings and total returns into account.
7
MARKET REVIEW
Six of the 10 sectors in the MSCI® EAFE Index recorded negative returns for the Reporting Period, with materials (-6.62%) and consumer discretionary (-5.62%) declining the most. The consumer discretionary sector was also the largest detractor from MSCI® EAFE Index returns on the basis of impact.
In the international small cap arena, the MSCI® EAFE Small Cap Index (unhedged, with dividends reinvested, net of dividend withholding taxes) (“MSCI® EAFE Small Cap Index”) declined -2.02%* during the Reporting Period. Sixteen of the 22 countries*** in the MSCI® EAFE Small Cap Index were down for the Reporting Period, with the Netherlands (-22.92%) and Norway (-13.27%) posting the largest losses. Japan (-1.76%) was the largest detractor on the basis of impact, which takes both weightings and total returns into account.
Four of the 10 sectors in the MSCI® EAFE Small Cap Index recorded negative returns for the Reporting Period, with energy (-29.58%) and materials (-7.69%) declining the most. The energy sector was the largest detractor to MSCI® EAFE Small Cap Index returns on the basis of impact.
Looking Ahead
At the end of the Reporting Period, we continue to believe that less expensive stocks should outpace more expensive stocks. In addition, we expect stocks with good momentum to outperform those with poor momentum. We plan to focus on seeking companies about which fundamental research analysts are becoming more positive as well as profitable companies with sustainable earnings and a track record of using their capital to enhance shareholder value. As such, we anticipate remaining fully invested, with long-term performance likely to be the result of stock selection rather than sector or capitalization allocations.
We stand behind our investment philosophy that sound economic investment principles, coupled with a disciplined quantitative approach, can provide strong, uncorrelated returns over the long term. Our research agenda is robust, and we continue to enhance our existing models, add new proprietary forecasting signals and improve our trading execution as we seek to provide the most value to our shareholders.
| *All | index returns are expressed in U.S. dollar terms. |
| **Greece, | Qatar and United Arab Emirates were added to the MSCI® Emerging Markets Index during the Reporting Period. Morocco was removed. |
| ***Greece | was removed from the MSCI® EAFE Small Cap Index during the Reporting Period and added to the MSCI® Emerging Markets Index. |
8
PORTFOLIO RESULTS
Goldman Sachs Emerging Markets Equity Insights Fund
Investment Objective
The Fund seeks long-term growth of capital.
Portfolio Management Discussion and Analysis
Below, the Goldman Sachs Quantitative Investment Strategies Team discusses the Goldman Sachs Emerging Markets Equity Insights Fund’s (the “Fund”) performance and positioning for the 12-month period ended October 31, 2014 (the “Reporting Period”).
| Q | How did the Fund perform during the Reporting Period? |
| A | During the Reporting Period, the Fund’s Class A, C, Institutional and IR Shares generated average annual total returns, without sales charges, of 1.38%, 0.66%, 1.65% and 1.70%, respectively. These returns compare to the 0.64% average annual total return of the Fund’s benchmark, the MSCI® Emerging Markets Standard Index (unhedged, with dividends reinvested, net of dividend withholding taxes) (the “MSCI® EM Index” or the “Index”), during the same period. During the period since their inception on February 28, 2014 through October 31, 2014, the Fund’s Class R Shares generated a cumulative total return, without sales charges, of 8.23% compared to the 7.28% cumulative total return of the Index. |
| Q | What key factors were most responsible for the Fund’s performance during the Reporting Period? |
| A | We use two distinct strategies — a bottom-up stock selection strategy and a top-down country/currency selection strategy — to manage the Fund. These strategies are uncorrelated, that is, they tend to perform independently of each other over time, which enables us to greater diversify the portfolio. During the Reporting Period, our stock selection strategy, which uses fundamental research and stock selection models based on six investment themes, added to the Fund’s relative performance. Our country/ currency selection strategy dampened relative results. |
| Q | Which investment themes helped and which hurt within the Team’s stock selection strategy? |
| A | Our bottom-up stock selection strategy enhanced the Fund’s relative returns during the Reporting Period. We use a quantitative model and six investment themes to take a long-term view of market patterns and look for inefficiencies, selecting stocks for the Fund and overweighting or underweighting those stocks chosen by the model. Over time and by design, the performance of any one of our model’s investment themes tends to have a low correlation with the model’s other themes, demonstrating the diversification benefit of our theme-driven quantitative model. The variance in performance supports our research indicating that the diversification provided by our different investment themes is a significant investment advantage over the long term, even though the Fund may experience underperformance in the short term. Of course, diversification does not protect an investor from market risk nor does it ensure a profit. |
| During the Reporting Period, five of our six investment themes added to the Fund’s relative results. Momentum was our best performing theme. The Momentum theme seeks to predict drifts in stock prices caused by delayed investor reaction to company-specific information and information about related companies. Our Sentiment and Valuation themes also contributed positively, while our Profitability and Quality themes added more modestly to relative returns. The Sentiment theme reflects selected investment views and decisions of individuals and financial intermediaries. The Valuation theme attempts to capture potential mispricings of securities, typically by comparing a measure of the company’s intrinsic value to its market value. The Profitability theme assesses whether a company is earning more than its cost of capital. The Quality theme seeks to assess both firm and management quality. |
| Our Management theme, which assesses the characteristics, policies and strategic decisions of company management, detracted from relative returns during the Reporting Period. |
| Q | How did the Fund’s sector and industry allocations affect relative results? |
| A | In constructing the portfolio, we focus on picking stocks rather than on making sector or industry bets. Consequently, |
9
PORTFOLIO RESULTS
the Fund is similar to the Index in terms of its sector and industry allocations and its style. Changes in its sector or industry weights generally do not have a meaningful impact on relative returns. |
| Q | Did stock selection help or hurt Fund performance during the Reporting Period? |
| A | We seek to outpace the Index by overweighting stocks we expect to outperform and underweighting those we think may lag. At the same time, we strive to maintain a risk profile similar to the Index. The Fund’s investments are selected using fundamental research and a variety of quantitative techniques based on our investment themes. For example, the Fund aims to hold a basket of stocks with better Momentum characteristics than the benchmark. |
| During the Reporting Period, our security selection contributed positively to the Fund’s relative performance. Stock picks in the energy, materials and health care sectors added to relative returns. Holdings in two sectors — consumer discretionary and utilities — detracted from results. |
| Q | Which stock positions contributed most to the Fund’s relative returns during the Reporting Period? |
| A | The Fund benefited from overweight positions in Eregli Demir ve Celik Fabrikalari, a Turkey-based steel producer; HCL Technologies, an India-based IT services company; and Sihuan Pharmaceutical Holdings Group, a China-based drugmaker. We adopted the overweight in Eregli Demir ve Celik Fabrikalari because of our positive views on Valuation and Sentiment. The Fund was overweight HCL Technologies due to our positive views on Valuation and Momentum, while the overweight in Sihuan Pharmaceuticals Holdings Group was the result of our positive views on Momentum and Profitability. |
| Q | Which Fund positions detracted most from results during the Reporting Period? |
| A | The Fund was hampered by its underweight positions in Tencent Holdings and Naspers and by an overweight position in Banco do Brasil. Our negative views on Valuation and Management led us to underweight China-based social media and mobile communications provider Tencent Holdings and South Africa-based e-commerce company Naspers. The Fund was overweight Banco do Brasil because of our positive views on Valuation and Momentum. |
| Q | What impact did the Team’s country/currency selection strategy have on the Fund’s relative performance during the Reporting Period? |
| A | Our country/currency strategy dampened relative performance during the Reporting Period, with overweight positions in Hungary, Russia and Turkey detracting from returns. Fund performance was enhanced by underweight positions in Brazil, Chile and South Korea. |
| We made our picks using our proprietary models, which, during the Reporting Period, were based on three investment themes specific to our country/currency strategy — Valuation, Risk Premium and Macro. Valuation favors equity and currency markets that appear cheap relative to accounting measures of value and purchasing power. Risk Premium evaluates whether a country is overcompensating investors for various types of risk. Macro assesses a market’s macroeconomic environment and growth prospects. |
| Q | How did the Fund use derivatives and similar instruments during the Reporting Period? |
| A | The Fund did not use any derivatives during the Reporting Period. |
| Q | What changes did you make to the Fund’s country weightings during the Reporting Period? |
| A | During the Reporting Period, we moved the Fund from underweight positions relative to the Index in Taiwan, South Korea and Poland to overweight positions. We shifted the Fund from overweight positions in India and South Africa to underweight positions. We also decreased the Fund’s overweight in Turkey. |
| Q | Were there any changes to the Fund’s portfolio management team during the Reporting Period? |
| A | Effective October 2014, Steve Jeneste no longer serves as a portfolio manager for the Fund and James Park will serve as a portfolio manager for the Fund. By design, all investment decisions for the Fund are performed within a co-lead or team structure, with multiple subject matter experts. This strategic decision making has been the cornerstone of our approach and ensures continuity in the Fund. Alongside Ron Hua and William Fallon, the lead portfolio managers for the Fund, are Len Ioffe, Dennis Walsh and James Park. |
10
PORTFOLIO RESULTS
| Q | What were the Fund’s sector and country weightings at the end of the Reporting Period? |
| A | At the end of the Reporting Period, the Fund was overweight relative to the Index in the health care, utilities, information technology and telecommunication services sectors relative to the Index. Compared to the Index, the Fund was underweight the energy, materials, consumer discretionary, industrials and consumer staples sectors. The Fund was relatively neutral compared to the Index in the financials sector at the end of the Reporting Period. |
| In terms of countries, the Fund was overweight Brazil, China, Poland, South Korea and Thailand relative to the Index at the end of the Reporting Period. Compared to the Index, the Fund was underweight in Malaysia, South Africa, Chile, Mexico and the Philippines. The Fund was relatively neutral compared to the Index in Peru, Russia, Taiwan, Hungary, Turkey, the Czech Republic, Egypt, Greece, Qatar, the United Arab Emirates, Indonesia, Colombia and India at the end of the Reporting Period. |
11
FUND BASICS
Emerging Markets Equity Insights Fund
as of October 31, 2014
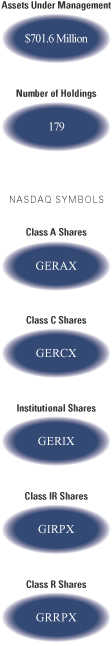
| PERFORMANCE REVIEW | ||||||||||
| November 1, 2013–October 31, 2014 | Fund Total Return (based on NAV)1 | MSCI® EM Index2 | ||||||||
| Class A | 1.38 | % | 0.64 | % | ||||||
| Class C | 0.66 | 0.64 | ||||||||
| Institutional | 1.65 | 0.64 | ||||||||
| Class IR | 1.70 | 0.64 | ||||||||
| February 28, 2014–October 31, 2014 | MSCI® EM Index2 | |||||||||
| Class R | 8.23 | % | 7.28 | % | ||||||
| 1 | The net asset value (NAV) represents the net assets of the class of the Fund (ex-dividend) divided by the total number of shares of the class outstanding. The Fund’s performance assumes the reinvestment of dividends and other distributions. The Fund’s performance does not reflect the deduction of any applicable sales charges. |
| 2 | The MSCI® EM Index is a free float-adjusted market capitalization index that is designed to measure equity market performance of emerging markets. As of June 2, 2014, the MSCI® EM Index consists of the following 23 emerging market country indices: Brazil, Chile, China, Colombia, Czech Republic, Egypt, Greece, Hungary, India, Indonesia, Korea, Malaysia, Mexico, Peru, Philippines, Poland, Qatar, Russia, South Africa, Taiwan, Thailand, Turkey and United Arab Emirates. Index figures do not reflect any deduction for fees, expenses or taxes. It is not possible to invest directly in an index. |
| STANDARDIZED TOTAL RETURNS3 | ||||||||||||||||||
| For the period ended 9/30/14 | One Year | Five Years | Since Inception | Inception Date | ||||||||||||||
| Class A | -2.83 | % | 3.74 | % | -1.65 | % | 10/5/07 | |||||||||||
| Class C | 1.06 | 4.11 | -1.52 | 10/5/07 | ||||||||||||||
| Institutional | 3.18 | 5.30 | -0.46 | 10/5/07 | ||||||||||||||
| Class IR | 3.12 | N/A | 4.85 | 8/31/10 | ||||||||||||||
| Class R | N/A | N/A | 5.81 | 2/28/14 | ||||||||||||||
| 3 | The Standardized Total Returns are average annual total returns as of the most recent calendar quarter-end. They assume reinvestment of all distributions at NAV. These returns reflect a maximum initial sales charge of 5.5% for Class A Shares and the assumed contingent deferred sales charge for Class C Shares (1% if redeemed within 12 months of purchase). Because Institutional and Class IR Shares do not involve a sales charge, such a charge is not applied to their Standardized Total Returns. |
The returns set forth in the tables above represent past performance. Past performance does not guarantee future results. The Fund’s investment return and principal value will fluctuate so that an investor’s shares, when redeemed, may be worth more or less than their original cost. Current performance may be lower or higher than the performance quoted above. Please visit our web site at www.GSAMFUNDS.com to obtain the most recent month-end returns. Performance reflects applicable fee waivers and/or expense limitations in effect during the periods shown. In their absence, performance would be reduced. Returns do not reflect the deduction of taxes that a shareholder would pay on Fund distributions or the redemption of Fund shares.
12
FUND BASICS
| EXPENSE RATIOS4 | ||||||||||
| Net Expense Ratio (Current) | Gross Expense Ratio (Before Waivers) | |||||||||
| Class A | 1.58 | % | 1.65 | % | ||||||
| Class C | 2.33 | 2.48 | ||||||||
| Institutional | 1.18 | 1.27 | ||||||||
| Class IR | 1.33 | 1.50 | ||||||||
| Class R | 1.83 | 1.92 | ||||||||
| 4 | The expense ratios of the Fund, both current (net of applicable fee waivers and/or expense limitations) and before waivers (gross of applicable fee waivers and/or expense limitations) are as set forth above according to the most recent publicly available Prospectus for the Fund and may differ from the expense ratios disclosed in the Financial Highlights in this report. Pursuant to a contractual arrangement, the Fund’s waivers and/or expense limitations will remain in place through at least February 28, 2015, and prior to such date the Investment Adviser may not terminate the arrangements without the approval of the Fund’s Board of Trustees. If these arrangements are discontinued in the future, the expense ratios may change without shareholder approval. |
| TOP TEN HOLDINGS AS OF 10/31/145 | ||||||||||
| Holding | % of Total Net Assets | Line of Business | Country | |||||||
| China Construction Bank Corp. Class H | 2.8 | % | Banks | China | ||||||
| Vanguard FTSE Emerging Markets Fund | 2.6 | Exchange Trades Fund | United States | |||||||
| Itau Unibanco Holding SA ADR | 2.6 | Banks | Brazil | |||||||
| MTN Group Ltd. | 2.1 | Telecommunication Services | South Africa | |||||||
| Bank of China Ltd. Class H | 2.1 | Banks | China | |||||||
| Samsung Electronics Co. Ltd. | 1.9 | Technology Hardware & Equipment | South Korea | |||||||
Taiwan Semiconductor Manufacturing Co. Ltd. ADR | 1.9 | Semiconductors & Semiconductor Equipment | Taiwan | |||||||
| PetroChina Co. Ltd. Class H | 1.9 | Energy | China | |||||||
| Banco do Brasil SA | 1.8 | Banks | Brazil | |||||||
Hon Hai Precision Industry Co. Ltd. | 1.8 | Technology Hardware & Equipment | Taiwan | |||||||
| 5 | The top 10 holdings may not be representative of the Fund’s future investments. |
13
FUND BASICS
| FUND VS. BENCHMARK SECTOR ALLOCATIONS6 |
| As of October 31, 2014 |
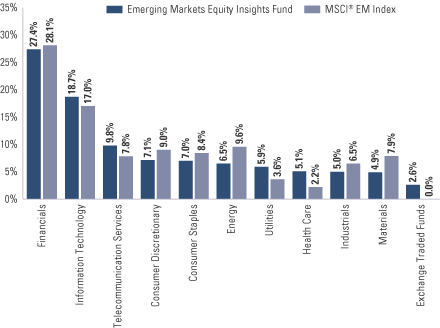
| 6 | The Fund is actively managed and, as such, its composition may differ over time. Consequently, the Fund’s overall industry sector allocations may differ from percentages contained in the graph above. The graph categorizes investments using Global Industry Classification Standard (“GICS”), however, the sector classifications used by the portfolio management team may differ from GICS. Underlying sector allocations of exchange traded funds held by the Fund are not reflected in the graph above. The percentage shown for each investment category reflects the value of investments in that category as a percentage of market value (excluding investments in the securities lending reinvestment vehicle, if any). Investments in the securities lending reinvestment vehicle represented 1.5% of the Fund’s net assets at October 31, 2014. The graph depicts the Fund’s investments but may not represent the Fund’s market exposure due to the exclusion of certain derivatives, if any, as listed in the Additional Investment Information section of the Schedule of Investments |
14
GOLDMAN SACHS EMERGING MARKETS EQUITY INSIGHTS FUND
Performance Summary
October 31, 2014
The following graph shows the value, as of October 31, 2014, of a $10,000 investment made on October 5, 2007 (commencement of operations) in Institutional Shares at NAV. For comparative purposes, the performance of the Fund’s benchmark, the MSCI® EM Index, is shown. This performance data represents past performance and should not be considered indicative of future performance, which will fluctuate with changes in market conditions. These performance fluctuations will cause an investor’s shares, when redeemed, to be worth more or less than their original cost. Performance reflects applicable fee waivers and/or expense limitations in effect during the periods shown and in their absence, performance would be reduced. Returns do not reflect the deduction of taxes that a shareholder would pay on Fund distributions or the redemption of Fund shares. Performance of Class A, Class C, Class IR and Class R Shares will vary from Institutional Shares due to differences in class specific fees and any applicable sales charges. In addition to the Investment Adviser’s decisions regarding issuer/industry/country investment selection and allocation, other factors may affect Fund performance. These factors include, but are not limited to, Fund operating fees and expenses, portfolio turnover, and subscription and redemption cash flows affecting the Fund.
| Emerging Markets Equity Insights Fund’s Lifetime Performance |
Performance of a $10,000 Investment, with distributions reinvested, from October 5, 2007 through October 31, 2014.
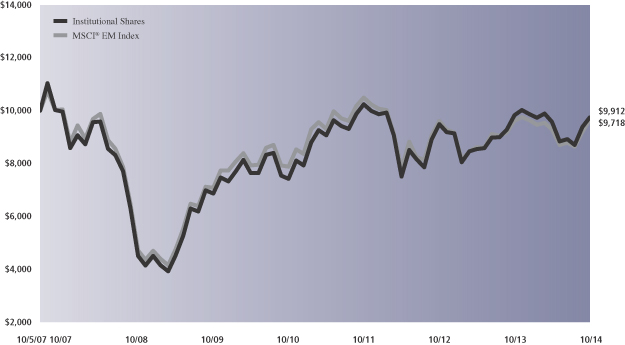
| Average Annual Total Return through October 31, 2014 | One Year | Five Years | Since Inception | |||||||
Class A (Commenced October 5, 2007) | ||||||||||
Excluding sales charges | 1.38% | 5.82% | -0.51% | |||||||
Including sales charges | -4.19% | 4.61% | -1.30% | |||||||
| ||||||||||
Class C (Commenced October 5, 2007) | ||||||||||
Excluding contingent deferred sales charges | 0.66% | 5.03% | -1.19% | |||||||
Including contingent deferred sales charges | -0.34% | 5.03% | -1.19% | |||||||
| ||||||||||
Institutional (Commenced October 5, 2007) | 1.65% | 6.23% | -0.12% | |||||||
| ||||||||||
Class IR (Commenced August 31, 2010) | 1.70% | N/A | 5.34% | |||||||
| ||||||||||
Class R (Commenced February 28, 2014) | N/A | N/A | 8.23% | |||||||
| ||||||||||
15
PORTFOLIO RESULTS
Goldman Sachs International Equity Insights Fund
Investment Objective
The Fund seeks long-term growth of capital.
Portfolio Management Discussion and Analysis
Below, the Goldman Sachs Quantitative Investment Strategies Team discusses the Goldman Sachs International Equity Insights Fund’s (the “Fund”) performance and positioning for the 12-month period ended October 31, 2014 (the “Reporting Period”).
| Q | How did the Fund perform during the Reporting Period? |
| A | During the Reporting Period, the Fund’s Class A, B, C, Institutional, Service, IR and R Shares generated average annual total returns, without sales charges, of -0.14%, -0.88%, -0.85%, 0.22%, -0.17%, 0.12% and -0.33%, respectively. These returns compare to the -0.60% average annual total return of the Fund’s benchmark, the MSCI® EAFE Standard Index (unhedged, with dividends reinvested, net of dividend withholding taxes) (the “MSCI® EAFE (Net) Index” or the “Index”), during the same period. |
| Q | What key factors were most responsible for the Fund’s performance during the Reporting Period? |
| A | We use two distinct strategies — a bottom-up stock selection strategy and a top-down country/currency selection strategy — to manage the Fund. These strategies are uncorrelated, that is, they tend to perform independently of each other over time, which enables us to greater diversify the portfolio. Our bottom-up stock selection strategy, which uses fundamental research and stock selection models based on six investment themes, contributed positively during the Reporting Period. Our country/currency selection strategy detracted from the Fund’s relative performance. |
| Q | Which investment themes helped and which hurt within the Team’s stock selection strategy? |
| A | Our bottom-up stock selection strategy added to relative returns during the Reporting Period. We use a quantitative model and six investment themes to take a long-term view of market patterns and look for inefficiencies, selecting stocks for the Fund and overweighting or underweighting those stocks chosen by the model. Over time and by design, the performance of any one of our model’s investment themes tends to have a low correlation with the model’s other themes, demonstrating the diversification benefit of our theme-driven quantitative model. The variance in performance supports our research indicating that the diversification provided by our different investment themes is a significant investment advantage over the long term, even though the Fund may experience underperformance in the short term. Of course, diversification does not protect an investor from market risk nor does it ensure a profit. |
| During the Reporting Period, five of our six investment themes added to the Fund’s relative returns. Our best performing theme was Momentum. The Momentum theme seeks to predict drifts in stock prices caused by delayed investor reaction to company-specific information and information about related companies. Sentiment, Valuation, Profitability and Quality also contributed positively. The Sentiment theme reflects selected investment views and decisions of individuals and financial intermediaries. The Valuation theme attempts to capture potential mispricings of securities, typically by comparing a measure of the company’s intrinsic value to its market value. The Profitability theme assesses whether a company is earning more than its cost of capital. The Quality theme seeks to assess both firm and management quality. |
| The Management theme, which assesses the characteristics, policies and strategic decisions of company management, detracted from relative performance during the Reporting Period. |
| Q | How did the Fund’s sector and industry allocations affect relative results? |
| A | In constructing the portfolio, we focus on picking stocks rather than on making sector or industry bets. Consequently, the Fund is similar to the Index in terms of its sector and industry allocations and its style. Changes in its sector or industry weights generally do not have a meaningful impact on relative returns. |
| Q | Did stock selection help or hurt Fund performance during the Reporting Period? |
| A | We seek to outpace the Index by overweighting stocks we expect to outperform and underweighting those we think may lag. At the same time, we strive to maintain a risk profile |
16
PORTFOLIO RESULTS
similar to the Index. The Fund’s investments are selected using fundamental research and a variety of quantitative techniques based on our investment themes. For example, the Fund aims to hold a basket of stocks with better Momentum characteristics than the benchmark. |
| During the Reporting Period, our security selection contributed positively to Fund performance. Holdings in the health care, industrials and telecommunication services sectors enhanced relative returns. Investments in the materials, consumer discretionary and utilities sectors detracted from results. |
| Q | Which stock positions contributed most to the Fund’s relative returns during the Reporting Period? |
| A | The Fund benefited from overweight positions in Actelion, a Switzerland-based biopharmaceutical company; Vestas Wind Systems, a Danish manufacturer of wind turbines; and AstraZeneca, a British-Swedish pharmaceutical and biologic company. We chose to overweight Actelion because of our positive views on Valuation and Momentum. The Fund was overweight Vestas Wind Systems given our positive views on Momentum and Sentiment. The overweight in AstraZeneca was due to our positive views on Valuation and Management. |
| Q | Which Fund positions detracted most from results during the Reporting Period? |
| A | An overweight position in Arrium, an Australia-based materials and mining company, detracted from the Fund’s relative performance. The Fund was also hampered by its underweight positions in Swiss pharmaceutical company Novartis and Japanese automaker Toyota Motor. We assumed the overweight in Arrium due to our positive views on Momentum and Sentiment. Our negative views on Momentum and Profitability led us to underweight Novartis, while our negative views on Quality and Profitability resulted in the Fund’s underweight in Toyota Motor. |
| Q | What impact did the Team’s country/currency selection strategy have on the Fund’s relative performance during the Reporting Period? |
| A | Our country/currency selection strategy hurt Fund returns during the Reporting Period. The Fund was hindered by its underweight position in Australia and its overweight positions in Japan and Norway. It benefited from an underweight position in Germany and from overweight positions in Switzerland and the U.K. |
| We made our picks using our proprietary models, which, during the Reporting Period, were based on five investment factors specific to our country/currency strategy — Valuation, Momentum, Risk Premium, Fund Flows and Macro. Valuation favors equity and currency markets that appear cheap relative to accounting measures of value and purchasing power. The Momentum factor favors countries and currencies that have had strong recent outperformance. Risk Premium evaluates whether a country is overcompensating investors for various types of risk, while Fund Flows evaluates the strength of capital market inflows. Finally, Macro assesses a market’s macroeconomic environment and growth prospects. |
| Q | How did the Fund use derivatives and similar instruments during the Reporting Period? |
| A | During the Reporting Period, we used financial futures contracts to equitize the Fund’s cash holdings. In other words, we put the Fund’s cash holdings to work by using them as collateral for the purchase of financial futures contracts. |
| Q | What changes did you make to the Fund’s country weightings during the Reporting Period? |
| A | During the Reporting Period, we shifted the Fund from underweight positions in Finland and Denmark to overweight positions. We increased the Fund’s overweight in Norway. In addition, we moved the Fund from overweight positions in France, the U.K. and Belgium to underweight positions. |
| Q | Were there any changes to the Fund’s portfolio management team during the Reporting Period? |
| A | There were no changes to the Fund’s portfolio management team during the Reporting Period. |
| Q | What were the Fund’s sector and country weightings at the end of the Reporting Period? |
| A | At the end of the Reporting Period, the Fund was overweight the health care and information technology sectors relative to the Index. Compared to the Index, the Fund was underweight the consumer discretionary, and materials sectors. The Fund was relatively neutral compared to the Index in the industrials, utilities, consumer staples, financials , telecommunication services and energy sectors at the end of the Reporting Period. |
| In terms of countries, the Fund was overweight relative to the Index in Norway, Finland, Japan, Switzerland and the Netherlands. Compared to the Index, the Fund was underweight in the U.K., Spain, France, Germany, Australia and Belgium. The Fund was relatively neutral compared to the Index in Denmark, Singapore, New Zealand, Portugal, Austria, Ireland, Italy, Hong Kong¸ Israel and Sweden at the end of the Reporting Period. |
17
FUND BASICS
International Equity Insights Fund
as of October 31, 2014
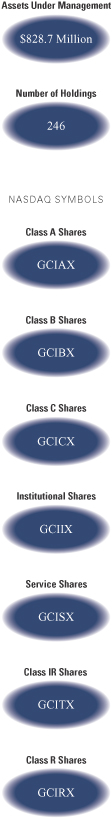
| PERFORMANCE REVIEW | ||||||||||
| November 1, 2013–October 31, 2014 | Fund Total Return (based on NAV)1 | MSCI® EAFE (Net) Index2 | ||||||||
| Class A | -0.14 | % | -0.60 | % | ||||||
| Class B | -0.88 | -0.60 | ||||||||
| Class C | -0.85 | -0.60 | ||||||||
| Institutional | 0.22 | -0.60 | ||||||||
| Service | -0.17 | -0.60 | ||||||||
| Class IR | 0.12 | -0.60 | ||||||||
| Class R | -0.33 | -0.60 | ||||||||
| 1 | The net asset value (NAV) represents the net assets of the class of the Fund (ex-dividend) divided by the total number of shares of the class outstanding. The Fund’s performance assumes the reinvestment of dividends and other distributions. The Fund’s performance does not reflect the deduction of any applicable sales charges. |
| 2 | The unmanaged MSCI® EAFE (Net) Index is a market capitalization-weighted composite of securities in 21 developed markets (as of November 27, 2013). The Index figures do not reflect any deduction for fees, expenses or taxes. It is not possible to invest directly in an index. |
| STANDARDIZED TOTAL RETURNS3 | ||||||||||||||||||||
| For the period ended 9/30/14 | One Year | Five Years | Ten Years | Since Inception | Inception Date | |||||||||||||||
| Class A | -1.27 | % | 3.74 | % | 4.80 | % | 3.19% | 8/15/97 | ||||||||||||
| Class B | -1.31 | 3.75 | 4.76 | 3.28 | 8/15/97 | |||||||||||||||
| Class C | 2.81 | 4.14 | 4.62 | 2.88 | 8/15/97 | |||||||||||||||
| Institutional | 4.95 | 5.33 | 5.82 | 4.05 | 8/15/97 | |||||||||||||||
| Service | 4.44 | 4.83 | 5.30 | 3.54 | 8/15/97 | |||||||||||||||
| Class IR | 4.74 | 5.17 | N/A | -1.28 | 11/30/07 | |||||||||||||||
| Class R | 4.27 | 4.70 | N/A | -1.73 | 11/30/07 | |||||||||||||||
| 3 | The Standardized Total Returns are average annual total returns as of the most recent calendar quarter-end. They assume reinvestment of all distributions at NAV. These returns reflect a maximum initial sales charge of 5.5% for Class A Shares, the assumed contingent deferred sales charge for Class B Shares (5% maximum declining to 0% after six years) and the assumed contingent deferred sales charge for Class C Shares (1% if redeemed within 12 months of purchase). Class B Shares convert automatically to Class A Shares on or about the fifteenth day of the last month of the calendar quarter that is eight years after purchase. Returns for Class B Shares for the period after conversion reflect the performance of Class A Shares. Because Institutional, Service, Class IR and Class R Shares do not involve a sales charge, such a charge is not applied to their Standardized Total Returns. The Fund’s Class B Shares are no longer available for purchase by new or existing shareholders. |
The returns set forth in the tables above represent past performance. Past performance does not guarantee future results. The Fund’s investment return and principal value will fluctuate so that an investor’s shares, when redeemed, may be worth more or less than their original cost. Current performance may be lower or higher than the performance quoted above. Please visit our web site at www.GSAMFUNDS.com to obtain the most recent month-end returns. Performance reflects applicable fee waivers and/or expense limitations in effect during the periods shown. In their absence, performance would be reduced. Returns do not reflect the deduction of taxes that a shareholder would pay on Fund distributions or the redemption of Fund shares.
18
FUND BASICS
| EXPENSE RATIOS4 | ||||||||||
| Net Expense Ratio (Current) | Gross Expense Ratio (Before Waivers) | |||||||||
| Class A | 1.29 | % | 1.37 | % | ||||||
| Class B | 2.04 | 2.11 | ||||||||
| Class C | 2.04 | 2.11 | ||||||||
| Institutional | 0.89 | 0.96 | ||||||||
| Service | 1.39 | 1.46 | ||||||||
| Class IR | 1.04 | 1.11 | ||||||||
| Class R | 1.54 | 1.61 | ||||||||
| 4 | The expense ratios of the Fund, both current (net of applicable fee waivers and/or expense limitations) and before waivers (gross of applicable fee waivers and/or expense limitations) are as set forth above according to the most recent publicly available Prospectus for the Fund and may differ from the expense ratios disclosed in the Financial Highlights in this report. The Fund’s waivers and/or expense limitations will remain in place through at least February 28, 2015, and prior to such date the Investment Adviser may not terminate the arrangements without the approval of the Fund’s Board of Trustees. If these arrangements are discontinued in the future, the expense ratios may change without shareholder approval. |
| TOP TEN HOLDINGS AS OF 10/31/145 | ||||||||||
| Holding | % of Total Net Assets | Line of Business | Country | |||||||
| HSBC Holdings PLC | 3.1 | % | Banks | United Kingdom | ||||||
| Roche Holding AG | 2.9 | Pharmaceuticals, Biotechnology & Life Sciences | Switzerland | |||||||
British American Tobacco PLC | 2.2 | Food, Beverage & Tobacco | United Kingdom | |||||||
| Commonwealth Bank of Australia | 1.9 | Banks | Australia | |||||||
| Total SA | 1.8 | Energy | France | |||||||
Actelion Ltd. (Registered) | 1.6 | Pharmaceuticals, Biotechnology & Life Sciences | Switzerland | |||||||
| Statoil ASA | 1.5 | Energy | Norway | |||||||
| ABB Ltd. (Registered) | 1.4 | Capital Goods | Switzerland | |||||||
| BHP Billiton PLC | 1.4 | Materials | Australia | |||||||
| Astellas Pharma, Inc. | 1.2 | Pharmaceuticals, Biotechnology & Life Sciences | Japan | |||||||
| 5 | The top 10 holdings may not be representative of the Fund’s future investments. |
19
FUND BASICS
| FUND VS. BENCHMARK SECTOR ALLOCATIONS6 |
| As of October 31, 2014 |
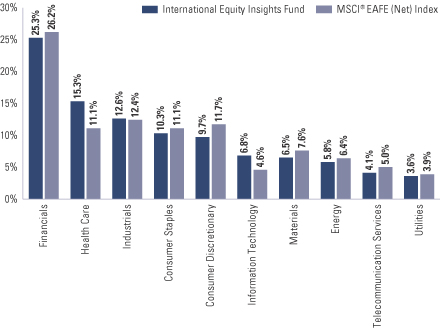
| 6 | The Fund is actively managed and, as such, its composition may differ over time. Consequently, the Fund’s overall industry sector allocations may differ from percentages contained in the graph above. The graph categorizes investments using Global Industry Classification Standard (“GICS”), however, the sector classifications used by the portfolio management team may differ from GICS. The percentage shown for each investment category reflects the value of investments in that category as a percentage of market value (excluding investments in the securities lending reinvestment vehicle, if any). Investments in the securities lending reinvestment vehicle represented 1.3% of the Fund’s net assets at October 31, 2014. The graph depicts the Fund’s investments but may not represent the Fund’s market exposure due to the exclusion of certain derivatives, if any, as listed in the Additional Investment Information section of the Schedule of Investments. |
20
GOLDMAN SACHS INTERNATIONAL EQUITY INSIGHTS FUND
Performance Summary
October 31, 2014
The following graph shows the value, as of October 31, 2014, of a $10,000 investment made on November 1, 2004 in Institutional Shares at NAV. For comparative purposes, the performance of the Fund’s benchmark, the MSCI® EAFE (Net) Index, is shown. This performance data represents past performance and should not be considered indicative of future performance, which will fluctuate with changes in market conditions. These performance fluctuations will cause an investor’s shares, when redeemed, to be worth more or less than their original cost. Performance reflects applicable fee waivers and/or expense limitations in effect during the periods shown and in their absence, performance would be reduced. Returns do not reflect the deduction of taxes that a shareholder would pay on Fund distributions or the redemption of Fund shares. Performance of Class A, Class B, Class C, Service, Class IR and Class R Shares will vary from Institutional Shares due to differences in class specific fees and any applicable sales charges. In addition to the Investment Adviser’s decisions regarding issuer/industry/country investment selection and allocation, other factors may affect Fund performance. These factors include, but are not limited to, Fund operating fees and expenses, portfolio turnover, and subscription and redemption cash flows affecting the Fund.
| International Equity Insights Fund’s 10 Year Performance |
Performance of a $10,000 Investment, with distributions reinvested, from November 1, 2004 through October 31, 2014.
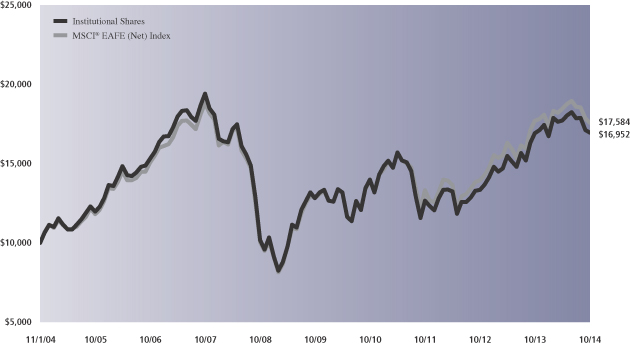
| Average Annual Total Return through October 31, 2014 | One Year | Five Years | Ten Years | Since Inception | ||||||||||
Class A (Commenced August 15, 1997) | ||||||||||||||
Excluding sales charges | -0.14% | 5.31% | 5.00% | 3.45% | ||||||||||
Including sales charges | -5.63% | 4.13% | 4.41% | 3.11% | ||||||||||
| ||||||||||||||
Class B (Commenced August 15, 1997)* | ||||||||||||||
Excluding contingent deferred sales charges | -0.88% | 4.53% | 4.37% | 3.20% | ||||||||||
Including contingent deferred sales charges | -5.83% | 4.15% | 4.37% | 3.20% | ||||||||||
| ||||||||||||||
Class C (Commenced August 15, 1997) | ||||||||||||||
Excluding contingent deferred sales charges | -0.85% | 4.53% | 4.23% | 2.80% | ||||||||||
Including contingent deferred sales charges | -1.84% | 4.53% | 4.23% | 2.80% | ||||||||||
| ||||||||||||||
Institutional (Commenced August 15, 1997) | 0.22% | 5.73% | 5.42% | 3.97% | ||||||||||
| ||||||||||||||
Service (Commenced August 15, 1997) | -0.17% | 5.21% | 4.90% | 3.47% | ||||||||||
| ||||||||||||||
Class IR (Commenced November 30, 2007) | 0.12% | 5.56% | N/A | -1.40% | ||||||||||
| ||||||||||||||
Class R (Commenced November 30, 2007) | -0.33% | 5.09% | N/A | -1.84% | ||||||||||
| ||||||||||||||
| *Effective | at the close of business on November 14, 2014, Class B Shares of the Fund have converted to Class A Shares of the Fund. In addition, effective October 15, 2014, all redemptions of Class B Shares have not been subject to a contingent deferred sales charge. Average annual total returns for Class B Shares through October 31, 2014 have not been adjusted to reflect this change. |
21
PORTFOLIO RESULTS
Goldman Sachs International Small Cap Insights Fund
Investment Objective
The Fund seeks long-term growth of capital.
Portfolio Management Discussion and Analysis
Below, the Goldman Sachs Quantitative Investment Strategies Team discusses the Goldman Sachs International Small Cap Insights Fund’s (the “Fund”) performance and positioning for the 12-month period ended October 31, 2014 (the “Reporting Period”).
| Q | How did the Fund perform during the Reporting Period? |
| A | During the Reporting Period, the Fund’s Class A, C, Institutional and IR Shares generated average annual total returns, without sales charges, of -1.94%, -2.71%, -1.54% and -1.68%, respectively. These returns compare to the -2.02% average annual total return of the Fund’s benchmark, the MSCI® EAFE Small Cap Index (unhedged, with dividends reinvested, net of dividend withholding taxes) (the “MSCI® EAFE Small Cap (net) Index” or the “Index”), during the same period. |
| Q | What key factors were most responsible for the Fund’s performance during the Reporting Period? |
| A | The Fund’s quantitative model and all six of its investment themes added to relative performance during the Reporting Period. Stock selection also contributed positively. |
| Q | What impact did the Fund’s investment themes have on performance during the Reporting Period? |
| A | As expected, and in keeping with our investment approach, our quantitative model and six investment themes had the greatest impact on relative performance. We use these themes to take a long-term view of market patterns and look for inefficiencies, selecting stocks for the Fund and overweighting or underweighting those stocks chosen by the model. Over time and by design, the performance of any one of our model’s investment themes tends to have a low correlation with the model’s other themes, demonstrating the diversification benefit of our theme-driven quantitative model. The variance in performance supports our research indicating that the diversification provided by our different investment themes is a significant investment advantage over the long term, even though the Fund may experience underperformance in the short term. Of course, diversification does not protect an investor from market risk nor does it ensure a profit. |
| During the Reporting Period, all six of our investment themes added to the Fund’s relative returns. Momentum was the Fund’s best performing theme. The Momentum theme seeks to predict drifts in stock prices caused by delayed investor reaction to company-specific information and information about related companies. Sentiment and Valuation also enhanced results. The Sentiment theme reflects selected investment views and decisions of individuals and financial intermediaries. The Valuation theme attempts to capture potential mispricings of securities, typically by comparing a measure of the company’s intrinsic value to its market value. In addition, Quality, Profitability and Management added value, though to a lesser extent. The Quality theme seeks to assess both firm and management quality. The Profitability theme assesses whether a company is earning more than its cost of capital. The Management theme assesses the characteristics, policies and strategic decisions of company management. |
| Q | How did the Fund’s sector and industry allocations affect relative results? |
| A | In constructing the portfolio, we focus on picking stocks rather than on making sector or industry bets. Consequently, the Fund is similar to the Index in terms of its sector and industry allocations and its style. Changes in its sector or industry weights generally do not have a meaningful impact on relative returns. |
| Q | Did stock selection help or hurt Fund performance during the Reporting Period? |
| A | We seek to outpace the Index by overweighting stocks we believe will to outperform and underweighting those we think may lag. At the same time, we strive to maintain a risk profile similar to the Index. The Fund’s investments are |
22
PORTFOLIO RESULTS
selected using fundamental research and a variety of quantitative techniques based on our investment themes. For example, the Fund aims to hold a basket of stocks with better Momentum characteristics than the benchmark. |
| During the Reporting Period, our security selection added to relative performance. Stock picks in the industrials, information technology and consumer staples sectors contributed positively. Holdings in the health care, materials and energy sectors dampened results. |
| Q | Which stock positions contributed most to the Fund’s relative returns during the Reporting Period? |
| A | An underweight in Royal Imtech, a Netherlands-based electrical solutions provider, enhanced Fund performance versus the Index. The Fund also benefited from overweight positions in Logitech International, a Switzerland-based provider of personal computer and tablet accessories, and Aperam, a Luxembourg-headquartered producer of stainless and specialty steel. We chose to underweight Royal Imtech because of our negative views on Momentum and Valuation. The Fund’s overweight in Logitech International was the result of our positive views on Sentiment and Quality. The overweight position in Aperam was due to our positive views on Valuation and Sentiment. |
| Q | Which Fund positions detracted most from results during the Reporting Period? |
| A | Detracting from relative returns were the Fund’s overweight positions in Arrium, an Australia-based materials and mining company; Takara Bio, a Japanese biomedical business; and Tella, a Japanese company that engages in the research and development of regenerative and cell medicines. The Fund was overweight Arrium due to our positive views on Valuation and Quality. The overweight in Takara Bio was established because of our positive views on Profitability and Sentiment. We adopted the overweight in Tella as a result of our positive views on Momentum and Quality. |
| Q | What impact did country selection have on the Fund’s relative performance during the Reporting Period? |
| A | To construct the portfolio, we focus on security selection rather than on making country bets. As a result, the Fund is similar to the Index in terms of its country allocation; changes in its country weightings are generally the result of our stock picking. That said, the Fund benefited during the Reporting Period from its overweights relative to the Index in the Netherlands and Germany and from an underweight position in the U.K. Compared to the Index, the Fund was hurt by its overweighted positions in Japan, Spain and Australia. Security selection in all six countries added to returns. |
| Q | How did the Fund use derivatives and similar instruments during the Reporting Period? |
| A | During the Reporting Period, we used financial futures contracts to equitize the Fund’s cash holdings. In other words, we put the Fund’s cash holdings to work by using them as collateral for the purchase of financial futures contracts. |
| Q | What changes did you make to the Fund’s country weightings during the Reporting Period? |
| A | During the Reporting Period, we shifted the Fund from an overweight position relative to the Index in Demark to an underweight position. We reduced the size of the Fund’s overweight positions in Germany and Spain. In addition, we moved the Fund from an underweight in Norway to an overweight position. We decreased the Fund’s underweight in Hong Kong and increased its overweight in Japan. |
| Q | Were there any changes to the Fund’s portfolio management team during the Reporting Period? |
| A | There were no changes to the Fund’s portfolio management team during the Reporting Period. |
| Q | What were the Fund’s sector and country weightings at the end of the Reporting Period? |
| A | At the end of the Reporting Period, the Fund was overweight the information technology, health care, telecommunication services and utilities sectors relative to the Index. Compared to the Index, the Fund was underweight the consumer discretionary, materials, industrials, and energy sectors. The Fund was relatively neutral compared to the Index in the financials and consumer staples sectors at the end of the Reporting Period. |
| In terms of countries, the Fund was overweight the Netherlands, Switzerland, Japan and Italy relative to the Index. Compared to the Index, the Fund was underweight the U.K., Singapore and Denmark. The Fund was relatively neutral compared to the Index in Germany, Norway, Spain, France, Australia, Sweden, Portugal, Austria, Hong Kong, Belgium, New Zealand, Ireland and Finland at the end of the Reporting Period. |
23
FUND BASICS
International Small Cap Insights Fund
as of October 31, 2014
| PERFORMANCE REVIEW | ||||||||||
| November 1, 2013–October 31, 2014 | Fund Total Return (based on NAV)1 | MSCI® EAFE Small Cap (Net) Index2 | ||||||||
| Class A | -1.94 | % | -2.02 | % | ||||||
| Class C | -2.71 | -2.02 | ||||||||
| Institutional | -1.54 | -2.02 | ||||||||
| Class IR | -1.68 | -2.02 | ||||||||
| 1 | The net asset value (NAV) represents the net assets of the class of the Fund (ex-dividend) divided by the total number of shares of the class outstanding. The Fund’s performance assumes the reinvestment of dividends and other distributions. The Fund’s performance does not reflect the deduction of any applicable sales charge. |
| 2 | The MSCI® EAFE Small Cap (Net) Index is a free float-adjusted market capitalization index that is designed to measure developed market equity performance, excluding the US and Canada. MSCI selects the most liquid securities across developed markets relative to their market capitalization, and targets for index inclusion 40% of the full market capitalization of the eligible small cap universe within each industry group, within each country. Its returns include net reinvested dividends but, unlike Fund returns, do not reflect the payment of sales commissions or other expenses incurred in the purchase or sale of the securities included in the Index. It is not possible to invest directly in an index. |
| STANDARDIZED TOTAL RETURNS3 | ||||||||||||||||
| For the period ended 9/30/14 | One Year | Five Years | Since Inception | Inception Date | ||||||||||||
| Class A | -2.97 | % | 9.25 | % | 2.33 | % | 9/28/07 | |||||||||
| Class C | 0.99 | 9.70 | 2.43 | 9/28/07 | ||||||||||||
| Institutional | 3.13 | 10.92 | 3.57 | 9/28/07 | ||||||||||||
| Class IR | 3.00 | N/A | 13.58 | 8/31/10 | ||||||||||||
| 3 | The Standardized Total Returns are average annual total returns as of the most recent calendar quarter-end. They assume reinvestment of all distributions at NAV. These returns reflect a maximum initial sales charge of 5.5% for Class A Shares and the assumed contingent deferred sales charge for Class C Shares (1% if redeemed within 12 months of purchase). Because Institutional and Class IR Shares do not involve a sales charge, such a charge is not applied to their Standardized Total Returns. |
The returns set forth in the tables above represent past performance. Past performance does not guarantee future results. The Fund’s investment return and principal value will fluctuate so that an investor’s shares, when redeemed, may be worth more or less than their original cost. Current performance may be lower or higher than the performance quoted above. Please visit our web site at www.GSAMFUNDS.com to obtain the most recent month-end returns. Performance reflects applicable fee waivers and/or expense limitations in effect during the periods shown. In their absence, performance would be reduced. Returns do not reflect the deduction of taxes that a shareholder would pay on Fund distributions or the redemption of Fund shares.
24
FUND BASICS
| EXPENSE RATIOS4 | ||||||||||
| Net Expense Ratio (Current) | Gross Expense Ratio (Before Waivers) | |||||||||
| Class A | 1.30 | % | 1.48 | % | ||||||
| Class C | 2.05 | 2.24 | ||||||||
| Institutional | 0.90 | 1.07 | ||||||||
| Class IR | 1.05 | 1.26 | ||||||||
| 4 | The expense ratios of the Fund, both current (net of applicable fee waivers and/or expense limitations) and before waivers (gross of applicable fee waivers and/or expense limitations) are as set forth above according to the most recent publicly available Prospectus for the Fund and may differ from the expense ratios disclosed in the Financial Highlights in this report. The Fund’s waivers and/or expense limitations will remain in place through at least February 28, 2015, and prior to such date the Investment Adviser may not terminate the arrangements without the approval of the Fund’s Board of Trustees. If these arrangements are discontinued in the future, the expense ratios may change without shareholder approval. |
| TOP TEN HOLDINGS AS OF 10/31/145 | ||||||||||
| Holding | % of Total Net Assets | Line of Business | Country | |||||||
| Symrise AG | 1.1 | % | Materials | Germany | ||||||
Hikma Pharmaceuticals PLC | 1.0 | Pharmaceuticals, Biotechnology & Life Sciences | United Kingdom | |||||||
Dialog Semiconductor PLC | 0.9 | Semiconductors & Semiconductor Equipment | Germany | |||||||
| Minebea Co. Ltd. | 0.9 | Capital Goods | Japan | |||||||
| Pennon Group PLC | 0.9 | Utilities | United Kingdom | |||||||
| Marine Harvest ASA | 0.9 | Food, Beverage & Tobacco | Norway | |||||||
| DS Smith PLC | 0.9 | Materials | United Kingdom | |||||||
| ams AG | 0.9 | Semiconductors & Semiconductor Equipment | Austria | |||||||
Logitech International SA (Registered) | 0.8 | Technology Hardware & Equipment | Switzerland | |||||||
| Catlin Group Ltd. | 0.8 | Insurance | Bermuda | |||||||
| 5 | The top 10 holdings may not be representative of the Fund’s future investments. |
25
FUND BASICS
| FUND VS. BENCHMARK SECTOR ALLOCATIONS6 |
| As of October 31, 2014 |
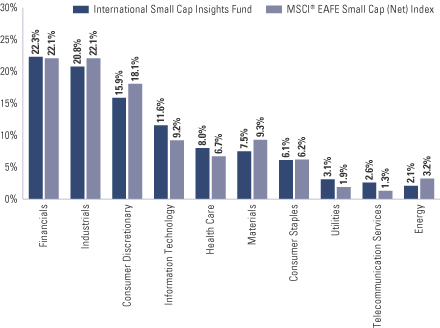
| 6 | The Fund is actively managed and, as such, its composition may differ over time. Consequently, the Fund’s overall sector allocations may differ from percentages contained in the graph above. The graph categorizes investments using Global Industry Classification Standard (“GICS”), however, the sector classifications used by the portfolio management team may differ from GICS. The percentage shown for each investment category reflects the value of investments in that category as a percentage of market value (excluding investments in the securities lending reinvestment vehicle, if any). Investment in the securities lending reinvestment vehicle represented 6.2% of the Fund’s net assets at October 31, 2014. The graph depicts the Fund’s investments but may not represent the Fund’s market exposure due to the exclusion of certain derivatives, if any, as listed in the Additional Investment Information section of the Schedule of Investments. |
26
GOLDMAN SACHS INTERNATIONAL SMALL CAP INSIGHTS FUND
Performance Summary
October 31, 2014
The following graph shows the value, as of October 31, 2014, of a $10,000 investment made on September 28, 2007 (commencement of operations) in Institutional Shares at NAV. For comparative purposes, the performance of the Fund’s benchmark, the MSCI® EAFE Small Cap (Net) Index, is shown. This performance data represents past performance and should not be considered indicative of future performance, which will fluctuate with changes in market conditions. These performance fluctuations will cause an investor’s shares, when redeemed, to be worth more or less than their original cost. Performance reflects applicable fee waivers and/or expense limitations in effect during the periods shown and in their absence, performance would be reduced. Returns do not reflect the deduction of taxes that a shareholder would pay on Fund distributions or the redemption of Fund shares. Performance of Class A, Class C and Class IR Shares will vary from Institutional Shares due to differences in class specific fees and any applicable sales charges. In addition to the Investment Adviser’s decisions regarding issuer/industry/country investments election and allocation, other factors may affect Fund performance. These factors include, but are not limited to, Fund operating fees and expenses, portfolio turnover, and subscription and redemption cash flows affecting the Fund.
| International Small Cap Insights Fund’s Lifetime Performance |
Performance of a $10,000 Investment, with distributions reinvested, from September 28, 2007 through October 31, 2014.
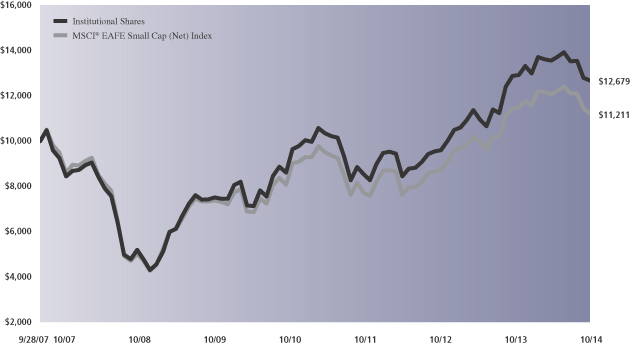
| Average Annual Total Return through October 31, 2014 | One Year | Five Years | Since Inception | |||||||
Class A (Commenced September 28, 2007) | ||||||||||
Excluding sales charges | -1.94% | 10.89% | 2.97% | |||||||
Including sales charges | -7.35% | 9.64% | 2.16% | |||||||
| ||||||||||
Class C (Commenced September 28, 2007) | ||||||||||
Excluding contingent deferred charges | -2.71% | 10.07% | 2.24% | |||||||
Including contingent deferred charges | -3.69% | 10.07% | 2.24% | |||||||
| ||||||||||
Institutional (Commenced September 28, 2007) | -1.54% | 11.34% | 3.40% | |||||||
| ||||||||||
Class IR (Commenced August 31, 2010) | -1.68% | N/A | 13.02% | |||||||
| ||||||||||
27
GOLDMAN SACHS EMERGING MARKETS EQUITY INSIGHTS FUND
October 31, 2014
| Shares | Description | Value | ||||||
| Common Stocks – 90.7% | ||||||||
| Brazil – 6.0% | ||||||||
| 168,200 | Banco Bradesco SA (Banks) | $ | 2,477,518 | |||||
| 350,600 | Banco Bradesco SA ADR (Banks) | 5,251,988 | ||||||
| 1,122,100 | Banco do Brasil SA (Banks) | 12,557,340 | ||||||
| 512,900 | Banco Santander Brasil SA ADR (Banks)(a) | 2,810,692 | ||||||
| 335,900 | BRF SA (Food, Beverage & Tobacco) | 8,749,679 | ||||||
| 43,000 | Grupo BTG Pactual (Diversified Financials) | 544,029 | ||||||
| 80,300 | JBS SA (Food, Beverage & Tobacco) | 357,903 | ||||||
| 126,400 | Magazine Luiza SA (Retailing) | 420,840 | ||||||
| 313,200 | Porto Seguro SA (Insurance) | 3,754,002 | ||||||
| 226,500 | Telefonica Brasil SA ADR (Telecommunication Services)(a) | 4,629,660 | ||||||
| 31,200 | Tim Participacoes SA ADR (Telecommunication Services) | 858,624 | ||||||
|
| |||||||
| 42,412,275 | ||||||||
|
| |||||||
| China – 18.4% | ||||||||
| 24,468,000 | Agricultural Bank of China Ltd. Class H (Banks) | 11,370,115 | ||||||
| 30,964,000 | Bank of China Ltd. Class H (Banks) | 14,820,960 | ||||||
| 17,802,000 | China CITIC Bank Corp. Ltd. Class H (Banks) | 11,597,103 | ||||||
| 26,497,000 | China Construction Bank Corp. Class H (Banks) | 19,769,393 | ||||||
| 1,551,500 | China Hongqiao Group Ltd. (Materials) | 1,195,878 | ||||||
| 512,000 | China Medical System Holdings Ltd. (Pharmaceuticals, Biotechnology & Life Sciences) | 943,973 | ||||||
| 19,174,000 | China Telecom Corp. Ltd. Class H (Telecommunication Services) | 12,222,572 | ||||||
| 901,000 | Chongqing Rural Commercial Bank Co. Ltd. Class H (Banks) | 433,617 | ||||||
| 2,000,000 | Dongfeng Motor Group Co. Ltd. Class H (Automobiles & Components) | 3,092,915 | ||||||
| 14,670,000 | GOME Electrical Appliances Holding Ltd. (Retailing) | 2,311,194 | ||||||
| 232,000 | Jiangsu Expressway Co. Ltd. Class H (Transportation) | 259,152 | ||||||
| 5,580,000 | Lenovo Group Ltd. (Technology Hardware & Equipment) | 8,224,948 | ||||||
| 44,700 | NetEase, Inc. ADR (Software & Services) | 4,233,984 | ||||||
| 494,700 | New China Life Insurance Co. Ltd. Class H (Insurance) | 1,851,255 | ||||||
| 10,490,000 | PetroChina Co. Ltd. Class H (Energy) | 13,132,896 | ||||||
| 366,000 | Ping An Insurance Group Co. of China Ltd. Class H (Insurance) | 2,991,953 | ||||||
| 96,500 | Shanghai Fosun Pharmaceutical Group Co. Ltd. Class H (Pharmaceuticals, Biotechnology & Life Sciences) | 347,428 | ||||||
|
| |||||||
| Common Stocks – (continued) | ||||||||
| China – (continued) | ||||||||
| 340,000 | Shenzhen Expressway Co. Ltd. Class H (Transportation) | $ | 217,524 | |||||
| 13,856,000 | Sihuan Pharmaceutical Holdings Group Ltd. (Pharmaceuticals, Biotechnology & Life Sciences) | 11,064,024 | ||||||
| 568,200 | Tencent Holdings Ltd. (Software & Services) | 9,132,266 | ||||||
|
| |||||||
| 129,213,150 | ||||||||
|
| |||||||
| Czech Republic – 0.2% | ||||||||
| 54,568 | CEZ AS (Utilities) | 1,509,470 | ||||||
|
| |||||||
| Greece – 0.3% | ||||||||
| 8,309 | FF Group (Retailing)* | 271,940 | ||||||
| 103,346 | Hellenic Telecommunications Organization SA (Telecommunication Services)* | 1,167,249 | ||||||
| 27,155 | OPAP SA (Consumer Services) | 328,981 | ||||||
|
| |||||||
| 1,768,170 | ||||||||
|
| |||||||
| Hong Kong – 3.2% | ||||||||
| 814,000 | China Mobile Ltd. (Telecommunication Services) | 10,128,210 | ||||||
| 1,530,000 | China Resources Power Holdings Co. Ltd. (Utilities) | 4,453,287 | ||||||
| 798,000 | China Unicom Hong Kong Ltd. (Telecommunication Services) | 1,199,006 | ||||||
| 582,000 | Guangdong Investment Ltd. (Utilities) | 765,576 | ||||||
| 732,000 | Hua Han Bio-Pharmaceutical Holdings Ltd. Class H (Pharmaceuticals, Biotechnology & Life Sciences) | 261,591 | ||||||
| 5,608,000 | Sino Biopharmaceutical Ltd. (Pharmaceuticals, Biotechnology & Life Sciences) | 5,646,069 | ||||||
|
| |||||||
| 22,453,739 | ||||||||
|
| |||||||
| Hungary – 0.4% | ||||||||
| 192,914 | Richter Gedeon Nyrt (Pharmaceuticals, Biotechnology & Life Sciences) | 2,942,854 | ||||||
|
| |||||||
| India – 6.1% | ||||||||
| 58,196 | Bajaj Holdings & Investment Ltd. (Diversified Financials) | 1,314,197 | ||||||
| 267,311 | Bank of Baroda (Banks) | 4,092,126 | ||||||
| 224,200 | Bharti Infratel Ltd. (Telecommunication Services) | 1,074,552 | ||||||
| 991,753 | Cairn India Ltd. (Energy) | 4,594,501 | ||||||
| 676,075 | IFCI Ltd. (Diversified Financials) | 404,433 | ||||||
| 50,669 | Indian Oil Corp. Ltd. (Energy) | 297,824 | ||||||
| 57,166 | Infosys Ltd. ADR (Software & Services)(a) | 3,822,119 | ||||||
| 99,917 | Lupin Ltd. (Pharmaceuticals, Biotechnology & Life Sciences) | 2,311,290 | ||||||
|
| |||||||
| 28 | The accompanying notes are an integral part of these financial statements. |
GOLDMAN SACHS EMERGING MARKETS EQUITY INSIGHTS FUND
| Shares | Description | Value | ||||||
| Common Stocks – (continued) | ||||||||
| India – (continued) | ||||||||
| 490,697 | Power Finance Corp. Ltd. (Diversified Financials) | $ | 2,256,154 | |||||
| 65,151 | Punjab National Bank (Banks) | 996,498 | ||||||
| 187,389 | Reliance Infrastructure Ltd. (Utilities) | 1,943,373 | ||||||
| 1,096,147 | Rural Electrification Corp. Ltd. (Diversified Financials) | 5,384,906 | ||||||
| 225,606 | Sun Pharmaceutical Industries Ltd. (Pharmaceuticals, Biotechnology & Life Sciences) | 3,105,006 | ||||||
| 729,996 | Tata Motors Ltd. (Automobiles & Components) | 6,378,224 | ||||||
| 776,681 | Tata Motors Ltd. Class A (Automobiles & Components) | 4,237,277 | ||||||
| 278,100 | The Jammu & Kashmir Bank Ltd. (Banks) | 630,073 | ||||||
|
| |||||||
| 42,842,553 | ||||||||
|
| |||||||
| Indonesia – 2.0% | ||||||||
| 731,800 | PT Astra Agro Lestari Tbk (Food, Beverage & Tobacco) | 1,423,324 | ||||||
| 12,146,100 | PT Astra International Tbk (Automobiles & Components) | 6,810,456 | ||||||
| 4,782,800 | PT Bank Negara Indonesia (Persero) Tbk (Banks) | 2,357,276 | ||||||
| 11,916,100 | PT Telekomunikasi Indonesia (Persero) Tbk (Telecommunication Services) | 2,713,863 | ||||||
| 659,600 | PT United Tractors Tbk (Capital Goods) | 1,001,927 | ||||||
|
| |||||||
| 14,306,846 | ||||||||
|
| |||||||
| Malaysia – 2.1% | ||||||||
| 59,900 | British American Tobacco Malaysia Bhd (Food, Beverage & Tobacco) | 1,266,514 | ||||||
| 3,718,800 | DiGi.Com Bhd (Telecommunication Services) | 7,000,403 | ||||||
| 1,795,200 | Genting Malaysia Bhd (Consumer Services) | 2,347,681 | ||||||
| 308,800 | MISC Bhd (Transportation) | 644,249 | ||||||
| 171,400 | Press Metal Bhd (Materials) | 344,746 | ||||||
| 398,600 | Telekom Malaysia Bhd (Telecommunication Services) | 872,730 | ||||||
| 531,600 | Tenaga Nasional Bhd (Utilities) | 2,159,765 | ||||||
|
| |||||||
| 14,636,088 | ||||||||
|
| |||||||
| Mexico – 4.2% | ||||||||
| 341,200 | Arca Continental SAB de CV (Food, Beverage & Tobacco) | 2,197,261 | ||||||
| 963,800 | Gruma SAB de CV Class B (Food, Beverage & Tobacco)* | 10,613,341 | ||||||
| 58,910 | Grupo Aeroportuario del Pacifico SAB de CV ADR (Transportation) | 4,014,716 | ||||||
| 73,840 | Grupo Aeroportuario del Sureste SAB de CV ADR (Transportation) | 9,944,771 | ||||||
|
| |||||||
| Common Stocks – (continued) | ||||||||
| Mexico – (continued) | ||||||||
| 764,800 | Grupo Mexico SAB de CVSeries B (Materials) | $ | 2,627,851 | |||||
|
| |||||||
| 29,397,940 | ||||||||
|
| |||||||
| Peru – 1.3% | ||||||||
| 54,291 | Credicorp Ltd. (Banks) | 8,740,851 | ||||||
|
| |||||||
| Philippines – 0.2% | ||||||||
| 776,900 | DMCI Holdings, Inc. (Capital Goods) | 280,667 | ||||||
| 26,095 | Globe Telecom, Inc. (Telecommunication Services) | 979,799 | ||||||
|
| |||||||
| 1,260,466 | ||||||||
|
| |||||||
| Poland – 3.1% | ||||||||
| 117,330 | KGHM Polska Miedz SA (Materials) | 4,525,224 | ||||||
| 676,847 | Orange Polska SA (Telecommunication Services) | 2,028,126 | ||||||
| 1,365,346 | PGE SA (Utilities) | 8,958,109 | ||||||
| 39,934 | Powszechny Zaklad Ubezpieczen SA (Insurance)(a) | 5,991,697 | ||||||
|
| |||||||
| 21,503,156 | ||||||||
|
| |||||||
| Qatar – 0.1% | ||||||||
| 19,304 | The Commercial Bank of Qatar (Banks) | 395,479 | ||||||
|
| |||||||
| Russia – 4.9% | ||||||||
| 3,633 | OAO Bashneft (Energy) | 112,211 | ||||||
| 1,421,965 | OAO Gazprom ADR (Energy) | 9,421,676 | ||||||
| 904,560 | OAO Rosneft GDR (Energy) | 5,034,429 | ||||||
| 665,590 | OJSC MMC Norilsk Nickel ADR (Materials) | 12,419,365 | ||||||
| 660,320 | OJSC Rosneft GDR (Energy) | 3,675,084 | ||||||
| 1,937,450 | Sberbank of Russia (Banks)* | 3,433,853 | ||||||
|
| |||||||
| 34,096,618 | ||||||||
|
| |||||||
| South Africa – 6.1% | ||||||||
| 64,855 | Clicks Group Ltd. (Food & Staples Retailing) | 441,589 | ||||||
| 238,613 | Investec Ltd. (Diversified Financials) | 2,177,254 | ||||||
| 332,878 | Liberty Holdings Ltd. (Insurance) | 3,852,083 | ||||||
| 1,443,019 | Life Healthcare Group Holdings Ltd. (Health Care Equipment & Services) | 5,456,923 | ||||||
| 52,327 | Mediclinic International Ltd. (Health Care Equipment & Services) | 467,798 | ||||||
| 269,014 | Mondi Ltd. (Materials) | 4,504,964 | ||||||
| 677,675 | MTN Group Ltd. (Telecommunication Services) | 15,005,799 | ||||||
| 89,100 | Netcare Ltd. (Health Care Equipment & Services) | 269,562 | ||||||
| 129,872 | Pick n Pay Stores Ltd. (Food & Staples Retailing) | 628,124 | ||||||
| 1,450,831 | Sibanye Gold Ltd. (Materials) | 2,733,630 | ||||||
|
| |||||||
| The accompanying notes are an integral part of these financial statements. | 29 |
GOLDMAN SACHS EMERGING MARKETS EQUITY INSIGHTS FUND
Schedule of Investments (continued)
October 31, 2014
| Shares | Description | Value | ||||||
| Common Stocks – (continued) | ||||||||
| South Africa – (continued) | ||||||||
| 1,141,341 | Steinhoff International Holdings Ltd. (Consumer Durables & Apparel) | $ | 5,839,115 | |||||
| 568,608 | Super Group Ltd. (Retailing)* | 1,628,170 | ||||||
|
| |||||||
| 43,005,011 | ||||||||
|
| |||||||
| South Korea – 14.7% | ||||||||
| 3,064 | Amorepacific Corp. (Household & Personal Products) | 6,579,145 | ||||||
| 1,446 | AMOREPACIFIC Group (Household & Personal Products) | 1,599,866 | ||||||
| 15,625 | Bukwang Pharmaceutical Co. Ltd (Pharmaceuticals, Biotechnology & Life Sciences) | 290,938 | ||||||
| 6,464 | CJ CheilJedang Corp. (Food, Beverage & Tobacco) | 2,360,180 | ||||||
| 57,866 | Daesang Corp. (Food, Beverage & Tobacco) | 2,247,749 | ||||||
| 29,961 | Daewoo Securities Co. Ltd. (Diversified Financials)* | 314,456 | ||||||
| 9,162 | Dongbu Insurance Co. Ltd. (Insurance) | 512,210 | ||||||
| 18,920 | Dongsuh Co., Inc. (Food & Staples Retailing) | 369,514 | ||||||
| 763 | Dongwon F&B Co. Ltd. (Food, Beverage & Tobacco) | 250,233 | ||||||
| 43,612 | Hancom, Inc. (Software & Services) | 943,353 | ||||||
| 2,695 | Hyundai Glovis Co. Ltd. (Transportation) | 670,333 | ||||||
| 654,607 | Industrial Bank of Korea (Banks) | 9,572,529 | ||||||
| 225,957 | Korea Electric Power Corp. (Utilities) | 9,918,565 | ||||||
| 51,743 | Korea Investment Holdings Co. Ltd. (Diversified Financials) | 2,616,484 | ||||||
| 82,055 | KT&G Corp. (Food, Beverage & Tobacco) | 7,265,378 | ||||||
| 179,719 | LG Electronics, Inc. (Consumer Durables & Apparel) | 10,975,737 | ||||||
| 11,444 | Medy-Tox, Inc. (Pharmaceuticals, Biotechnology & Life Sciences) | 2,666,245 | ||||||
| 71,509 | Samsung C&T Corp. (Capital Goods) | 4,837,366 | ||||||
| 11,548 | Samsung Electronics Co. Ltd. (Technology Hardware & Equipment) | 13,466,613 | ||||||
| 14,855 | Samyang Holdings Corp. (Food, Beverage & Tobacco) | 1,236,062 | ||||||
| 150,021 | Shinhan Financial Group Co. Ltd. (Banks) | 7,060,861 | ||||||
| 234,914 | SK Hynix, Inc. (Semiconductors & Semiconductor Equipment)* | 10,475,824 | ||||||
| 18,820 | SK Telecom Co. Ltd. (Telecommunication Services) | 4,716,273 | ||||||
| 12,749 | SL Corp. (Automobiles & Components) | 234,775 | ||||||
| 48,636 | Sungwoo Hitech Co. Ltd. (Automobiles & Components) | 701,090 | ||||||
|
| |||||||
| Common Stocks – (continued) | ||||||||
| South Korea – (continued) | ||||||||
| 127,675 | Woori Finance Holdings Co. Ltd. (Banks)* | $ | 1,421,624 | |||||
|
| |||||||
| 103,303,403 | ||||||||
|
| |||||||
| Taiwan – 12.4% | ||||||||
| 2,532,000 | Advanced Semiconductor Engineering, Inc. (Semiconductors & Semiconductor Equipment) | 3,054,489 | ||||||
| 1,172,000 | AmTRAN Technology Co. Ltd. (Consumer Durables & Apparel) | 674,305 | ||||||
| 1,179,000 | Asustek Computer, Inc. (Technology Hardware & Equipment) | 12,037,812 | ||||||
| 619,000 | Catcher Technology Co. Ltd. (Technology Hardware & Equipment) | 5,225,439 | ||||||
| 514,000 | Cathay Financial Holding Co. Ltd. (Insurance) | 847,260 | ||||||
| 111,000 | Chailease Holding Co. Ltd. (Diversified Financials)* | 274,124 | ||||||
| 229,000 | Chunghwa Telecom Co. Ltd. (Telecommunication Services) | 698,686 | ||||||
| 412,000 | Elite Material Co. Ltd. (Technology Hardware & Equipment) | 485,449 | ||||||
| 821,039 | Elitegroup Computer Systems Co. Ltd. (Technology Hardware & Equipment) | 692,457 | ||||||
| 397,000 | Grape King Bio Ltd. (Household & Personal Products) | 1,659,474 | ||||||
| 3,925,120 | Hon Hai Precision Industry Co. Ltd. (Technology Hardware & Equipment) | 12,423,004 | ||||||
| 729,000 | Huang Hsiang Construction Corp. (Real Estate) | 946,030 | ||||||
| 921,000 | King’s Town Bank Co. Ltd. (Banks) | 1,007,286 | ||||||
| 239,000 | Lotes Co. Ltd. (Technology Hardware & Equipment) | 992,809 | ||||||
| 552,000 | Nien Hsing Textile Co. Ltd. (Consumer Durables & Apparel) | 456,429 | ||||||
| 5,956,000 | Pegatron Corp. (Technology Hardware & Equipment) | 10,854,781 | ||||||
| 106,000 | Realtek Semiconductor Corp. (Semiconductors & Semiconductor Equipment) | 351,359 | ||||||
| 7,037,000 | Siliconware Precision Industries Co. (Semiconductors & Semiconductor Equipment) | 10,038,390 | ||||||
| 741,000 | Simplo Technology Co. Ltd. (Technology Hardware & Equipment) | 3,605,009 | ||||||
| 1,453,000 | Taiwan Cement Corp. (Materials) | 2,222,710 | ||||||
| 602,200 | Taiwan Semiconductor Manufacturing Co. Ltd. ADR (Semiconductors & Semiconductor Equipment) | 13,260,444 | ||||||
| 160,000 | Test Research, Inc. (Technology Hardware & Equipment) | 261,243 | ||||||
|
| |||||||
| 30 | The accompanying notes are an integral part of these financial statements. |
GOLDMAN SACHS EMERGING MARKETS EQUITY INSIGHTS FUND
| Shares | Description | Value | ||||||
| Common Stocks – (continued) | ||||||||
| Taiwan – (continued) | ||||||||
| 2,106,000 | TXC Corp. (Technology Hardware & Equipment) | $ | 2,610,278 | |||||
| 515,000 | United Integrated Services Co. Ltd. (Capital Goods) | 489,555 | ||||||
| 488,000 | Wan Hai Lines Ltd. (Transportation) | 360,923 | ||||||
| 877,000 | Wistron Corp. (Technology Hardware & Equipment) | 921,390 | ||||||
| 1,713,000 | Yuanta Financial Holding Co. Ltd. (Diversified Financials) | 862,883 | ||||||
|
| |||||||
| 87,314,018 | ||||||||
|
| |||||||
| Thailand – 3.2% | ||||||||
| 1,428,700 | Airports of Thailand PCL (Transportation) | 10,616,081 | ||||||
| 2,670,100 | BTS Group Holdings PCL (Transportation) | 845,071 | ||||||
| 245,800 | Delta Electronics Thailand PCL (Technology Hardware & Equipment) | 488,014 | ||||||
| 15,273,500 | Jasmine International PCL (Telecommunication Services) | 3,487,284 | ||||||
| 744,800 | PTT Exploration & Production PCL (Energy) | 3,348,546 | ||||||
| 348,500 | PTT PCL (Energy) | 3,944,050 | ||||||
|
| |||||||
| 22,729,046 | ||||||||
|
| |||||||
| Turkey – 1.8% | ||||||||
| 119,354 | Akbank TAS (Banks) | 430,981 | ||||||
| 162,991 | Aksa Akrilik Kimya Sanayii AS (Consumer Durables & Apparel) | 535,963 | ||||||
| 1,881,967 | Eregli Demir ve Celik Fabrikalari TAS (Materials) | 3,922,477 | ||||||
| 67,271 | TAV Havalimanlari Holding AS (Transportation) | 564,340 | ||||||
| 359,612 | Tofas Turk Otomobil Fabrikasi AS (Automobiles & Components) | 2,256,308 | ||||||
| 559,947 | Turkiye Garanti Bankasi AS (Banks) | 2,185,413 | ||||||
| 1,097,789 | Turkiye Is Bankasi Class C (Banks) | 2,744,915 | ||||||
|
| |||||||
| 12,640,397 | ||||||||
|
| |||||||
| TOTAL COMMON STOCKS | ||||||||
| (Cost $605,038,079) | $ | 636,471,530 | ||||||
|
| |||||||
| Preferred Stocks – 6.8% | ||||||||
| Brazil – 6.1% | ||||||||
| 124,800 | Centrais Eletricas Brasileiras SA Class B (Utilities) | $ | 472,426 | |||||
| 1,391,300 | Companhia Energetica de Minas Gerais (Utilities) | 7,987,648 | ||||||
| 365,500 | Companhia Energetica de Sao Paulo Class B (Utilities) | 3,603,521 | ||||||
| 1,228,620 | Itau Unibanco Holding SA ADR (Banks) | 18,134,431 | ||||||
|
| |||||||
| Preferred Stocks – (continued) | ||||||||
| 2,881,300 | Itausa – Investimentos Itau SA (Banks) | $ | 11,500,084 | |||||
| 155,600 | Petroleo Brasileiro SA (Energy) | 959,509 | ||||||
|
| |||||||
| 42,657,619 | ||||||||
|
| |||||||
| Russia – 0.2% | ||||||||
| 1,605,784 | OAO Surgutneftegas (Energy)* | 1,100,288 | ||||||
|
| |||||||
| South Korea – 0.5% | ||||||||
| 3,314 | Hyundai Motor Co. (Automobiles & Components) | 396,412 | ||||||
| 3,781 | Samsung Electronics Co. Ltd. (Technology Hardware & Equipment) | 3,490,103 | ||||||
|
| |||||||
| 3,886,515 | ||||||||
|
| |||||||
| TOTAL PREFERRED STOCKS | ||||||||
| (Cost $44,472,516) | $ | 47,644,422 | ||||||
|
| |||||||
| Exchange Traded Fund – 2.6% | ||||||||
| United States – 2.6% | ||||||||
| 429,024 | Vanguard FTSE Emerging Markets Fund | $ | 18,293,583 | |||||
| (Cost $18,093,186) | ||||||||
|
| |||||||
| Units | Description | Expiration Month | Value | |||||||||
| Warrant – 0.0% | ||||||||||||
| Thailand – 0.0% | ||||||||||||
| 1,567,600 | BTS Group Holdings PCL (Transportation)* | 01/18 | $ | 48,130 | ||||||||
| (Cost $0) | ||||||||||||
|
| |||||||||||
| | TOTAL INVESTMENTS BEFORE SECURITIES LENDING REINVESTMENT VEHICLE | | ||||||||||
| (Cost $667,603,781) | $ | 702,457,665 | ||||||||||
|
| |||||||||||
| Shares | Distribution Rate | Value | ||||||
| Securities Lending Reinvestment Vehicle(b)(c) – 1.5% | ||||||||
Goldman Sachs Financial Square Money Market Fund — FST Shares |
| |||||||
| 10,631,042 | 0.063 | % | $ | 10,631,042 | ||||
| (Cost $10,631,042) | ||||||||
| ||||||||
| TOTAL INVESTMENTS – 101.6% | ||||||||
| (Cost $678,234,823) | $ | 713,088,707 | ||||||
| ||||||||
| LIABILITIES IN EXCESS OF OTHER ASSETS – (1.6)% | (11,445,054 | ) | ||||||
| ||||||||
| NET ASSETS – 100.0% | $ | 701,643,653 | ||||||
| ||||||||
| The accompanying notes are an integral part of these financial statements. | 31 |
GOLDMAN SACHS EMERGING MARKETS EQUITY INSIGHTS FUND
Schedule of Investments (continued)
October 31, 2014
| The percentage shown for each investment category reflects the value of investments in that category as a percentage of net assets. | ||
* | Non-income producing security. | |
(a) | All or a portion of security is on loan. | |
(b) | Variable rate security. Interest rate or distribution rate disclosed is that which is in effect at October 31, 2014. | |
(c) | Represents an affiliated issuer. | |
| ||||
Investment Abbreviations: | ||||
ADR | —American Depositary Receipt | |||
GDR | —Global Depositary Receipt | |||
| ||||
| 32 | The accompanying notes are an integral part of these financial statements. |
GOLDMAN SACHS INTERNATIONAL EQUITY INSIGHTS FUND
Schedule of Investments
October 31, 2014
| Shares | Description | Value | ||||||
| Common Stocks – 96.7% | ||||||||
| Australia – 7.9% | ||||||||
| 222,478 | Australia & New Zealand Banking Group Ltd. (Banks) | $ | 6,583,253 | |||||
| 311,629 | Beach Energy Ltd. (Energy) | 322,349 | ||||||
| 221,513 | BHP Billiton Ltd. (Materials) | 6,626,972 | ||||||
| 437,917 | BHP Billiton PLC (Materials) | 11,314,289 | ||||||
| 495,739 | Challenger Ltd. (Diversified Financials) | 3,049,124 | ||||||
| 223,266 | Commonwealth Bank of Australia (Banks) | 15,876,333 | ||||||
| 14,946 | Domino’s Pizza Enterprises Ltd. (Consumer Services) | 356,234 | ||||||
| 199,164 | Downer EDI Ltd. (Commercial & Professional Services) | 841,038 | ||||||
| 387,100 | Federation Centres Ltd. (REIT) | 929,581 | ||||||
| 149,710 | Fortescue Metals Group Ltd. (Materials) | 462,056 | ||||||
| 58,794 | Harvey Norman Holdings Ltd. (Retailing) | 197,711 | ||||||
| 373,470 | Independence Group NL (Materials) | 1,495,566 | ||||||
| 44,676 | M2 Group Ltd. (Telecommunication Services) | 309,993 | ||||||
| 127,890 | Macquarie Group Ltd. (Diversified Financials) | 6,911,689 | ||||||
| 2,080,095 | Mount Gibson Iron Ltd. (Materials) | 826,529 | ||||||
| 64,714 | Ramsay Health Care Ltd. (Health Care Equipment & Services) | 2,991,623 | ||||||
| 35,677 | Slater & Gordon Ltd. (Consumer Services) | 192,762 | ||||||
| 183,209 | Suncorp Group Ltd. (Insurance) | 2,383,959 | ||||||
| 489,000 | Telstra Corp. Ltd. (Telecommunication Services) | 2,433,340 | ||||||
| 39,311 | Westpac Banking Corp. (Banks) | 1,206,622 | ||||||
|
| |||||||
| 65,311,023 | ||||||||
|
| |||||||
| Austria ��� 0.4% | ||||||||
| 73,858 | ams AG (Semiconductors & Semiconductor Equipment) | 2,648,475 | ||||||
| 6,883 | CA Immobilien Anlagen AG (Real Estate)* | 132,020 | ||||||
| 29,431 | CAT Oil AG (Energy) | 560,604 | ||||||
|
| |||||||
| 3,341,099 | ||||||||
|
| |||||||
| Belgium – 0.2% | ||||||||
| 2,973 | Anheuser-Busch InBev NV (Food, Beverage & Tobacco) | 329,689 | ||||||
| 10,998 | Ion Beam Applications (Health Care Equipment & Services)* | 192,127 | ||||||
| 21,186 | Telenet Group Holding NV (Media)* | 1,198,034 | ||||||
|
| |||||||
| 1,719,850 | ||||||||
|
| |||||||
| Denmark – 2.3% | ||||||||
| 165 | A.P. Moller – Maersk A/S Class A (Transportation) | 375,367 | ||||||
| 3,090 | A.P. Moller – Maersk A/S Class B (Transportation) | 7,210,751 | ||||||
|
| |||||||
| Common Stocks – (continued) | ||||||||
| Denmark – (continued) | ||||||||
| 39,820 | H Lundbeck A/S (Pharmaceuticals, Biotechnology & Life Sciences)(a) | $ | 844,397 | |||||
| 188,480 | Novo Nordisk A/S Class B (Pharmaceuticals, Biotechnology & Life Sciences) | 8,519,809 | ||||||
| 56,927 | TDC A/S (Telecommunication Services) | 434,755 | ||||||
| 42,826 | Vestas Wind Systems A/S (Capital Goods)* | 1,429,317 | ||||||
|
| |||||||
| 18,814,396 | ||||||||
|
| |||||||
| Finland – 4.0% | ||||||||
| 115,713 | Elisa OYJ (Telecommunication Services) | 3,178,673 | ||||||
| 268,367 | Fortum OYJ (Utilities) | 6,223,910 | ||||||
| 1,135,757 | Nokia OYJ (Technology Hardware & Equipment) | 9,490,269 | ||||||
| 151,705 | Orion OYJ Class B (Pharmaceuticals, Biotechnology & Life Sciences) | 5,159,731 | ||||||
| 54,123 | Sampo OYJ Class A (Insurance) | 2,593,435 | ||||||
| 396,481 | UPM-Kymmene OYJ (Materials) | 6,289,186 | ||||||
| 5,589 | Wartsila OYJ Abp (Capital Goods) | 259,150 | ||||||
|
| |||||||
| 33,194,354 | ||||||||
|
| |||||||
| France – 6.9% | ||||||||
| 17,835 | Belvedere SA (Food, Beverage & Tobacco)* | 248,971 | ||||||
| 22,864 | CNP Assurances (Insurance) | 427,446 | ||||||
| 331,818 | Credit Agricole SA (Banks) | 4,910,333 | ||||||
| 78,839 | Electricite de France SA (Utilities) | 2,327,990 | ||||||
| 34,467 | Fonciere Des Regions (REIT) | 3,168,742 | ||||||
| 18,816 | Mercialys SA (REIT) | 415,585 | ||||||
| 1,240,483 | Natixis SA (Banks) | 8,538,840 | ||||||
| 514,735 | Orange SA (Telecommunication Services) | 8,194,773 | ||||||
| 9,037 | Orpea (Health Care Equipment & Services) | 551,368 | ||||||
| 5,277 | Sanofi (Pharmaceuticals, Biotechnology & Life Sciences) | 478,836 | ||||||
| 49,132 | SCOR SE (Insurance) | 1,505,524 | ||||||
| 328,229 | Suez Environnement Co. (Utilities) | 5,529,765 | ||||||
| 104,364 | Technicolor SA (Registered) (Media)* | 616,167 | ||||||
| 8,295 | Technip SA (Energy) | 599,317 | ||||||
| 251,318 | Total SA (Energy) | 15,004,515 | ||||||
| 34,338 | Valeo SA (Automobiles & Components) | 3,850,343 | ||||||
| 33,369 | Valneva SE (Pharmaceuticals, Biotechnology & Life Sciences)*(a) | 184,060 | ||||||
| 14,319 | Vinci SA (Capital Goods) | 817,304 | ||||||
|
| |||||||
| 57,369,879 | ||||||||
|
| |||||||
| Germany – 5.8% | ||||||||
| 18,404 | Allianz SE (Registered) (Insurance) | 2,926,644 | ||||||
| 17,280 | Axel Springer SE (Media) | 950,583 | ||||||
| 30,849 | Continental AG (Automobiles & Components) | 6,076,200 | ||||||
|
| |||||||
| The accompanying notes are an integral part of these financial statements. | 33 |
GOLDMAN SACHS INTERNATIONAL EQUITY INSIGHTS FUND
Schedule of Investments (continued)
October 31, 2014
| Shares | Description | Value | ||||||
| Common Stocks – (continued) | ||||||||
| Germany – (continued) | ||||||||
| 198,800 | Deutsche Post AG (Registered) (Transportation) | $ | 6,260,174 | |||||
| 182,833 | Dialog Semiconductor PLC (Semiconductors & Semiconductor Equipment)* | 6,313,555 | ||||||
| 41,403 | Duerr AG (Capital Goods) | 2,908,320 | ||||||
| 35,188 | Fresenius SE & Co. KGaA (Health Care Equipment & Services) | 1,810,635 | ||||||
| 64,391 | Hannover Rueck SE (Insurance) | 5,374,547 | ||||||
| 16,792 | Hochtief AG (Capital Goods) | 1,242,587 | ||||||
| 39,928 | K+S AG (Registered) (Materials) | 1,118,972 | ||||||
| 20,246 | MorphoSys AG (Pharmaceuticals, Biotechnology & Life Sciences)* | 1,917,743 | ||||||
| 33,982 | Muenchener Rueckversicherungs-Gesellschaft AG (Registered) (Insurance) | 6,690,646 | ||||||
| 64,640 | Rhoen Klinikum AG (Health Care Equipment & Services) | 1,924,653 | ||||||
| 24,462 | Siemens AG (Registered) (Capital Goods) | 2,759,153 | ||||||
| 5,484 | Symrise AG (Materials) | 309,184 | ||||||
|
| |||||||
| 48,583,596 | ||||||||
|
| |||||||
| Hong Kong – 3.2% | ||||||||
| 4,510,000 | China Travel International Investment Hong Kong Ltd. (Consumer Services) | 1,385,311 | ||||||
| 568,000 | Hongkong Land Holdings Ltd. (Real Estate) | 3,961,187 | ||||||
| 554,000 | Hutchison Whampoa Ltd. (Capital Goods) | 7,025,031 | ||||||
| 594,500 | MTR Corp. Ltd. (Transportation) | 2,424,063 | ||||||
| 447,000 | Sun Hung Kai Properties Ltd. (Real Estate) | 6,669,734 | ||||||
| 986,000 | The United Laboratories International Holdings Ltd. (Pharmaceuticals, Biotechnology & Life Sciences)* | 756,400 | ||||||
| 298,000 | Wheelock & Co. Ltd. (Real Estate) | 1,436,396 | ||||||
| 851,000 | Yue Yuen Industrial Holdings Ltd. (Consumer Durables & Apparel) | 2,856,795 | ||||||
|
| |||||||
| 26,514,917 | ||||||||
|
| |||||||
| Ireland – 0.6% | ||||||||
| 489,992 | Beazley PLC (Insurance) | 2,058,072 | ||||||
| 40,301 | Shire PLC (Pharmaceuticals, Biotechnology & Life Sciences) | 2,704,073 | ||||||
|
| |||||||
| 4,762,145 | ||||||||
|
| |||||||
| Italy – 2.1% | ||||||||
| 40,251 | ACEA SpA (Utilities) | 492,463 | ||||||
| 2,339 | Cosmo Pharmaceuticals SpA (Pharmaceuticals, Biotechnology & Life Sciences) | 367,646 | ||||||
| 43,094 | Credito Emiliano SpA (Banks) | 332,066 | ||||||
| 110,568 | Eni SpA (Energy) | 2,355,641 | ||||||
| 74,894 | ERG SpA (Energy) | 858,289 | ||||||
| 1,787,158 | Intesa Sanpaolo SpA (Banks) | 5,253,815 | ||||||
|
| |||||||
| Common Stocks – (continued) | ||||||||
| Italy – (continued) | ||||||||
| 4,322,112 | Telecom Italia SpA (Telecommunication Services)* | $ | 4,898,174 | |||||
| 356,707 | UniCredit SpA (Banks) | 2,583,531 | ||||||
|
| |||||||
| 17,141,625 | ||||||||
|
| |||||||
| Japan – 23.4% | ||||||||
| 6,000 | ABC-Mart, Inc. (Retailing) | 345,964 | ||||||
| 45,700 | Alpine Electronics, Inc. (Consumer Durables & Apparel) | 780,075 | ||||||
| 239,200 | Amada Co. Ltd. (Capital Goods) | 2,089,060 | ||||||
| 631,600 | Astellas Pharma, Inc. (Pharmaceuticals, Biotechnology & Life Sciences) | 9,802,746 | ||||||
| 36,700 | Avex Group Holdings, Inc. (Media) | 545,124 | ||||||
| 120,100 | Bandai Namco Holdings, Inc. (Consumer Durables & Apparel) | 2,980,613 | ||||||
| 4,500 | Benesse Holdings, Inc. (Consumer Services) | 141,994 | ||||||
| 315,700 | Brother Industries Ltd. (Technology Hardware & Equipment) | 5,620,899 | ||||||
| 12,500 | Central Japan Railway Co. (Transportation) | 1,864,363 | ||||||
| 17,700 | Century Tokyo Leasing Corp. (Diversified Financials) | 463,509 | ||||||
| 85,800 | Chubu Electric Power Co., Inc. (Utilities)* | 1,029,564 | ||||||
| 199,000 | Chugai Pharmaceutical Co. Ltd. (Pharmaceuticals, Biotechnology & Life Sciences) | 6,221,284 | ||||||
| 1,031,000 | Clarion Co. Ltd. (Consumer Durables & Apparel)*(a) | 3,392,884 | ||||||
| 406,800 | Daiichi Sankyo Co. Ltd. (Pharmaceuticals, Biotechnology & Life Sciences) | 6,119,018 | ||||||
| 14,100 | Daikin Industries Ltd. (Capital Goods) | 881,364 | ||||||
| 320,200 | Daiwa House Industry Co. Ltd. (Real Estate) | 6,058,053 | ||||||
| 782,000 | Daiwa Securities Group, Inc. (Diversified Financials) | 6,180,116 | ||||||
| 11,500 | Doutor Nichires Holdings Co. Ltd. (Consumer Services) | 171,319 | ||||||
| 4,200 | Dydo Drinco, Inc. (Food, Beverage & Tobacco) | 179,980 | ||||||
| 5,200 | Eizo Corp. (Technology Hardware & Equipment) | 95,071 | ||||||
| 35,200 | FANUC Corp. (Capital Goods) | 6,203,499 | ||||||
| 129,000 | Fuji Electric Co. Ltd. (Capital Goods) | 566,758 | ||||||
| 119,700 | FUJIFILM Holdings Corp. (Technology Hardware & Equipment) | 4,018,160 | ||||||
| 184,000 | Fujitsu General Ltd. (Consumer Durables & Apparel) | 2,303,389 | ||||||
| 923,000 | Fujitsu Ltd. (Software & Services) | 5,611,345 | ||||||
| 94,600 | Gree, Inc. (Software & Services)(a) | 677,488 | ||||||
| 59,200 | Haseko Corp. (Consumer Durables & Apparel) | 433,932 | ||||||
|
| |||||||
| 34 | The accompanying notes are an integral part of these financial statements. |
GOLDMAN SACHS INTERNATIONAL EQUITY INSIGHTS FUND
| Shares | Description | Value | ||||||
| Common Stocks – (continued) | ||||||||
| Japan – (continued) | ||||||||
| 32,300 | Hitachi Transport System Ltd. (Transportation) | $ | 427,445 | |||||
| 49,900 | Honda Motor Co. Ltd. (Automobiles & Components) | 1,595,265 | ||||||
| 47,100 | Iida Group Holdings Co. Ltd. (Consumer Durables & Apparel) | 523,383 | ||||||
| 631,700 | ITOCHU Corp. (Capital Goods) | 7,636,333 | ||||||
| 9,000 | Jafco Co. Ltd. (Diversified Financials) | 350,372 | ||||||
| 71,600 | JVC Kenwood Corp. (Consumer Durables & Apparel)* | 136,888 | ||||||
| 52,000 | Kaken Pharmaceutical Co. Ltd. (Pharmaceuticals, Biotechnology & Life Sciences) | 1,302,809 | ||||||
| 8,900 | KDDI Corp. (Telecommunication Services) | 584,458 | ||||||
| 180,900 | Konica Minolta, Inc. (Technology Hardware & Equipment) | 2,021,330 | ||||||
| 22,100 | KYORIN Holdings, Inc. (Pharmaceuticals, Biotechnology & Life Sciences) | 465,597 | ||||||
| 78,000 | Kyowa Hakko Kirin Co. Ltd. (Pharmaceuticals, Biotechnology & Life Sciences) | 909,742 | ||||||
| 53,600 | Kyushu Electric Power Co., Inc. (Utilities) | 581,542 | ||||||
| 425,000 | Minebea Co. Ltd. (Capital Goods) | 5,823,538 | ||||||
| 502,000 | Mitsubishi Electric Corp. (Capital Goods) | 6,472,687 | ||||||
| 85,600 | Mitsubishi Tanabe Pharma Corp. (Pharmaceuticals, Biotechnology & Life Sciences) | 1,301,735 | ||||||
| 1,260,600 | Mitsubishi UFJ Financial Group, Inc. (Banks) | 7,348,308 | ||||||
| 460,900 | Mitsui & Co. Ltd. (Capital Goods) | 6,959,158 | ||||||
| 35,000 | Nachi-Fujikoshi Corp. (Capital Goods) | 217,500 | ||||||
| 16,600 | NEC Networks & System Integration Corp. (Software & Services) | 360,679 | ||||||
| 165,600 | Nikon Corp. (Consumer Durables & Apparel) | 2,268,995 | ||||||
| 1,051,000 | Nippon Electric Glass Co. Ltd. (Technology Hardware & Equipment) | 4,887,201 | ||||||
| 180,000 | Nippon Express Co. Ltd. (Transportation) | 791,813 | ||||||
| 45,100 | Nippon Telegraph & Telephone Corp. (Telecommunication Services) | 2,806,071 | ||||||
| 302,900 | Nissan Motor Co. Ltd. (Automobiles & Components) | 2,762,965 | ||||||
| 7,800 | Noevir Holdings Co. Ltd. (Household & Personal Products) | 141,110 | ||||||
| 281,000 | Nomura Holdings, Inc. (Diversified Financials) | 1,755,235 | ||||||
| 83,000 | NSK Ltd. (Capital Goods) | 1,087,141 | ||||||
| 371,000 | NTN Corp. (Capital Goods) | 1,604,119 | ||||||
| 528,500 | ORIX Corp. (Diversified Financials) | 7,335,709 | ||||||
|
| |||||||
| Common Stocks – (continued) | ||||||||
| Japan – (continued) | ||||||||
| 87,700 | Otsuka Holdings Co. Ltd. (Pharmaceuticals, Biotechnology & Life Sciences) | $ | 3,076,346 | |||||
| 600,100 | Panasonic Corp. (Consumer Durables & Apparel) | 7,219,956 | ||||||
| 43,100 | Rohto Pharmaceutical Co. Ltd. (Pharmaceuticals, Biotechnology & Life Sciences) | 625,196 | ||||||
| 15,100 | Santen Pharmaceutical Co. Ltd. (Pharmaceuticals, Biotechnology & Life Sciences) | 901,267 | ||||||
| 92,000 | Sapporo Holdings Ltd. (Food, Beverage & Tobacco) | 398,159 | ||||||
| 57,000 | Sekisui Chemical Co. Ltd. (Consumer Durables & Apparel) | 710,412 | ||||||
| 170,100 | Seven & I Holdings Co. Ltd. (Food & Staples Retailing) | 6,643,447 | ||||||
| 82,000 | Shiseido Co. Ltd. (Household & Personal Products) | 1,360,721 | ||||||
| 100,300 | SoftBank Corp. (Telecommunication Services) | 7,301,782 | ||||||
| 2,800 | St. Marc Holdings Co. Ltd. (Consumer Services) | 146,388 | ||||||
| 14,200 | Star Micronics Co. Ltd. (Capital Goods) | 215,935 | ||||||
| 35,300 | Start Today Co. Ltd. (Retailing) | 763,792 | ||||||
| 163,500 | Sumitomo Dainippon Pharma Co. Ltd. (Pharmaceuticals, Biotechnology & Life Sciences) | 1,928,636 | ||||||
| 42,200 | Suzuki Motor Corp. (Automobiles & Components) | 1,414,481 | ||||||
| 10,400 | Taisho Pharmaceutical Holdings Co. Ltd. (Pharmaceuticals, Biotechnology & Life Sciences) | 729,962 | ||||||
| 108,300 | Takeda Pharmaceutical Co. Ltd. (Pharmaceuticals, Biotechnology & Life Sciences) | 4,694,626 | ||||||
| 55,200 | The Chugoku Electric Power Co., Inc. (Utilities) | 727,968 | ||||||
| 183,100 | The Dai-ichi Life Insurance Co. Ltd. (Insurance) | 2,770,981 | ||||||
| 402,000 | Toko, Inc. (Technology Hardware & Equipment)(a) | 1,070,674 | ||||||
| 33,100 | Wacom Co. Ltd. (Technology Hardware & Equipment)(a) | 126,998 | ||||||
| 1,026,900 | Yamada Denki Co. Ltd. (Retailing)(a) | 3,291,857 | ||||||
| 121,400 | Yamaha Motor Co. Ltd. (Automobiles & Components) | 2,296,613 | ||||||
| 26,800 | Yoshinoya Holdings Co. Ltd. (Consumer Services)(a) | 307,040 | ||||||
|
| |||||||
| 193,959,936 | ||||||||
|
| |||||||
| Netherlands – 5.0% | ||||||||
| 25,532 | Boskalis Westminster NV (Capital Goods) | 1,362,142 | ||||||
| 77,144 | Corio NV (REIT) | 3,754,959 | ||||||
|
| |||||||
| The accompanying notes are an integral part of these financial statements. | 35 |
GOLDMAN SACHS INTERNATIONAL EQUITY INSIGHTS FUND
Schedule of Investments (continued)
October 31, 2014
| Shares | Description | Value | ||||||
| Common Stocks – (continued) | ||||||||
| Netherlands – (continued) | ||||||||
| 37,269 | Eurocommercial Properties NV CVA (Real Estate) | $ | 1,701,372 | |||||
| 80,651 | Heineken Holding NV (Food, Beverage & Tobacco) | 5,227,524 | ||||||
| 1,194,861 | PostNL NV (Transportation)* | 5,078,576 | ||||||
| 205,679 | Royal Dutch Shell PLC Class A (Energy) | 7,353,542 | ||||||
| 107,583 | Royal Dutch Shell PLC Class B (Energy) | 3,974,699 | ||||||
| 458,644 | TomTom NV (Consumer Durables & Apparel)* | 3,331,718 | ||||||
| 15,537 | Vastned Retail NV (REIT) | 709,524 | ||||||
| 62,257 | Wereldhave NV (REIT) | 5,104,000 | ||||||
| 135,287 | Wolters Kluwer NV (Media) | 3,611,986 | ||||||
|
| |||||||
| 41,210,042 | ||||||||
|
| |||||||
| New Zealand – 0.1% | ||||||||
| 109,352 | Auckland International Airport Ltd. (Transportation) | 330,592 | ||||||
| 111,104 | Spark New Zealand Ltd. (Telecommunication Services) | 273,400 | ||||||
|
| |||||||
| 603,992 | ||||||||
|
| |||||||
| Norway – 4.2% | ||||||||
| 39,396 | Aker Solutions ASA (Energy)* | 255,243 | ||||||
| 320,263 | Marine Harvest ASA (Food, Beverage & Tobacco) | 4,535,721 | ||||||
| 1,448,632 | Norsk Hydro ASA (Materials) | 8,110,772 | ||||||
| 113,809 | Orkla ASA (Food, Beverage & Tobacco) | 870,188 | ||||||
| 531,929 | Statoil ASA (Energy) | 12,173,426 | ||||||
| 415,457 | Storebrand ASA (Insurance)* | 2,130,216 | ||||||
| 151,346 | Yara International ASA (Materials) | 6,950,015 | ||||||
|
| |||||||
| 35,025,581 | ||||||||
|
| |||||||
| Singapore – 1.5% | ||||||||
| 10,668,000 | Golden Agri-Resources Ltd. (Food, Beverage & Tobacco) | 4,323,226 | ||||||
| 74,000 | Jardine Cycle & Carriage Ltd. (Retailing) | 2,300,249 | ||||||
| 201,000 | OUE Ltd. (Consumer Services) | 330,450 | ||||||
| 18,456 | REC Solar ASA (Semiconductors & Semiconductor Equipment)* | 246,782 | ||||||
| 2,087,000 | Wilmar International Ltd. (Food, Beverage & Tobacco) | 5,202,244 | ||||||
|
| |||||||
| 12,402,951 | ||||||||
|
| |||||||
| South Africa – 0.7% | ||||||||
| 336,188 | Mondi PLC (Materials) | 5,681,733 | ||||||
|
| |||||||
| Spain – 1.2% | ||||||||
| 213,644 | Enagas SA (Utilities) | 7,169,841 | ||||||
| 142,787 | Endesa SA (Utilities)(a) | 2,785,472 | ||||||
|
| |||||||
| 9,955,313 | ||||||||
|
| |||||||
| Common Stocks – (continued) | ||||||||
| Sweden – 2.4% | ||||||||
| 12,053 | Clas Ohlson AB Class B (Retailing) | $ | 208,116 | |||||
| 26,534 | Fabege AB (Real Estate) | 340,608 | ||||||
| 203,832 | Husqvarna AB Class B (Consumer Durables & Apparel) | 1,521,839 | ||||||
| 36,190 | JM AB (Consumer Durables & Apparel) | 1,169,743 | ||||||
| 63,994 | Meda AB Class A (Pharmaceuticals, Biotechnology & Life Sciences)(a) | 838,071 | ||||||
| 482,403 | Nordea Bank AB (Banks) | 6,204,550 | ||||||
| 412,239 | Skandinaviska Enskilda Banken AB Class A (Banks) | 5,294,909 | ||||||
| 29,383 | Swedbank AB Class A (Banks) | 778,669 | ||||||
| 107,062 | Swedish Match AB (Food, Beverage & Tobacco) | 3,481,340 | ||||||
|
| |||||||
| 19,837,845 | ||||||||
|
| |||||||
| Switzerland – 10.6% | ||||||||
| 542,009 | ABB Ltd. (Registered) (Capital Goods)* | 11,890,961 | ||||||
| 113,226 | Actelion Ltd. (Registered) (Pharmaceuticals, Biotechnology & Life Sciences)* | 13,484,675 | ||||||
| 51,191 | Ascom Holding AG (Registered) (Technology Hardware & Equipment) | 751,402 | ||||||
| 48,071 | Baloise Holding AG (Registered) (Insurance) | 6,051,409 | ||||||
| 34 | Chocoladefabriken Lindt & Sprungli AG (Food, Beverage & Tobacco) | 170,645 | ||||||
| 9,139 | EMS-Chemie Holding AG (Registered) (Materials) | 3,291,235 | ||||||
| 2,264 | Galenica AG (Registered) (Pharmaceuticals, Biotechnology & Life Sciences) | 1,937,374 | ||||||
| 413,129 | Logitech International SA (Registered) (Technology Hardware & Equipment)* | 5,848,985 | ||||||
| 80,145 | Lonza Group AG (Registered) (Pharmaceuticals, Biotechnology & Life Sciences)* | 8,830,904 | ||||||
| 82,528 | Roche Holding AG (Pharmaceuticals, Biotechnology & Life Sciences) | 24,256,475 | ||||||
| 15,623 | Schweizerische National-Versicherungs-Gesellschaft (Registered) (Insurance) | 1,302,827 | ||||||
| 11,782 | Swiss Life Holding AG (Registered) (Insurance)* | 2,703,273 | ||||||
| 97,483 | Swiss Re AG (Insurance)* | 7,882,560 | ||||||
|
| |||||||
| 88,402,725 | ||||||||
|
| |||||||
| United Kingdom – 14.2% | ||||||||
| 370,369 | ARM Holdings PLC (Semiconductors & Semiconductor Equipment) | 5,243,450 | ||||||
| 101,062 | AstraZeneca PLC (Pharmaceuticals, Biotechnology & Life Sciences) | 7,382,416 | ||||||
|
| |||||||
| 36 | The accompanying notes are an integral part of these financial statements. |
GOLDMAN SACHS INTERNATIONAL EQUITY INSIGHTS FUND
| Shares | Description | Value | ||||||
| Common Stocks – (continued) | ||||||||
| United Kingdom – (continued) | ||||||||
| 67,211 | Berendsen PLC (Commercial & Professional Services) | $ | 1,088,352 | |||||
| 78,089 | Berkeley Group Holdings PLC (Consumer Durables & Apparel) | 2,855,814 | ||||||
| 17,170 | BP PLC (Energy) | 123,537 | ||||||
| 78,789 | BP PLC ADR (Energy)(b) | 3,424,170 | ||||||
| 315,082 | British American Tobacco PLC (Food, Beverage & Tobacco) | 17,858,089 | ||||||
| 509,414 | BT Group PLC (Telecommunication Services) | 3,003,163 | ||||||
| 294,560 | Dixons Carphone PLC (Retailing) | 1,870,391 | ||||||
| 2,481,441 | HSBC Holdings PLC (Banks) | 25,299,192 | ||||||
| 181,205 | Imperial Tobacco Group PLC (Food, Beverage & Tobacco) | 7,871,880 | ||||||
| 1,709,658 | ITV PLC (Media) | 5,554,141 | ||||||
| 92,255 | Persimmon PLC (Consumer Durables & Apparel)* | 2,166,625 | ||||||
| 102,714 | Reckitt Benckiser Group PLC (Household & Personal Products) | 8,650,934 | ||||||
| 411,808 | Rolls-Royce Holdings PLC (Capital Goods)* | 5,577,723 | ||||||
| 75,092 | SABMiller PLC (Food, Beverage & Tobacco) | 4,247,427 | ||||||
| 19,876 | Severn Trent PLC (Utilities) | 635,307 | ||||||
| 436,016 | Standard Chartered PLC (Banks) | 6,563,201 | ||||||
| 49,492 | Unilever NV CVA (Food, Beverage & Tobacco) | 1,918,234 | ||||||
| 100,609 | Unilever PLC (Food, Beverage & Tobacco) | 4,047,047 | ||||||
| 91,506 | United Utilities Group PLC (Utilities) | 1,254,388 | ||||||
| 53,999 | WH Smith PLC (Retailing) | 974,940 | ||||||
|
| |||||||
| 117,610,421 | ||||||||
|
| |||||||
| TOTAL COMMON STOCKS | ||||||||
| (Cost $804,094,948) | $ | 801,443,423 | ||||||
|
| |||||||
| Preferred Stocks – 0.7% | ||||||||
| Germany – 0.7% | ||||||||
| 56,000 | Henkel AG & Co. KGaA (Household & Personal Products) | $ | 5,542,211 | |||||
|
| |||||||
| United Kingdom – 0.0% | ||||||||
| 37,062,720 | Rolls-Royce Holdings PLC Class C (Capital Goods)* | 59,289 | ||||||
|
| |||||||
| TOTAL PREFERRED STOCKS | ||||||||
| (Cost $5,361,795) | $ | 5,601,500 | ||||||
|
| |||||||
| | TOTAL INVESTMENTS BEFORE SECURITIES LENDING REINVESTMENT VEHICLE | | ||||||
| (Cost $809,456,743) | $ | 807,044,923 | ||||||
|
| |||||||
| Shares | Distribution Rate | Value | ||||||
| Securities Lending Reinvestment Vehicle(c)(d) – 1.3% | ||||||||
Goldman Sachs Financial Square Money Market Fund – FST Shares |
| |||||||
| 10,729,897 | 0.063 | % | $ | 10,729,897 | ||||
| (Cost $10,729,897) | ||||||||
| ||||||||
| TOTAL INVESTMENTS – 98.7% | ||||||||
| (Cost $820,186,640) | $ | 817,774,820 | ||||||
| ||||||||
OTHER ASSETS IN EXCESS OF LIABILITIES – 1.3% |
| 10,930,938 | ||||||
| ||||||||
| NET ASSETS – 100.0% | $ | 828,705,758 | ||||||
| ||||||||
| The percentage shown for each investment category reflects the value of investments in that category as a percentage of net assets. | ||
* | Non-income producing security. | |
(a) | All or a portion of security is on loan. | |
(b) | All or a portion of security is segregated as collateral for initial margin requirements on futures transactions. | |
(c) | Variable rate security. Interest rate or distribution rate disclosed is that which is in effect at October 31, 2014. | |
(d) | Represents an affiliated issuer. | |
| ||
Investment Abbreviations: | ||
ADR | —American Depositary Receipt | |
CVA | —Dutch Certification | |
REIT | —Real Estate Investment Trust | |
| ||
| The accompanying notes are an integral part of these financial statements. | 37 |
GOLDMAN SACHS INTERNATIONAL EQUITY INSIGHTS FUND
Schedule of Investments (continued)
October 31, 2014
| ADDITIONAL INVESTMENT INFORMATION |
FUTURES CONTRACTS — At October 31, 2014, the Fund had the following futures contracts:
| Type | Number of Contracts Long (Short) | Expiration Date | Current Value | Unrealized Gain (Loss) | ||||||||||
EURO STOXX 50 Index | 196 | December 2014 | $ | 7,616,596 | $ | (63,849 | ) | |||||||
FTSE 100 Index | 35 | December 2014 | 3,642,397 | 9,599 | ||||||||||
Hang Seng Index | 2 | November 2014 | 308,737 | 8,581 | ||||||||||
MSCI Singapore Index | 4 | November 2014 | 230,093 | 4,649 | ||||||||||
SPI 200 Index | 12 | December 2014 | 1,456,752 | 57,792 | ||||||||||
TSE TOPIX Index | 29 | December 2014 | 3,451,858 | 147,819 | ||||||||||
| TOTAL | $ | 164,591 | ||||||||||||
| 38 | The accompanying notes are an integral part of these financial statements. |
GOLDMAN SACHS INTERNATIONAL SMALL CAP INSIGHTS FUND
Schedule of Investments
October 31, 2014
| Shares | Description | Value | ||||||
| Common Stocks – 100.7% | ||||||||
| Australia – 7.1% | ||||||||
| 109,091 | Abacus Property Group (REIT) | $ | 259,762 | |||||
| 197,460 | AWE Ltd. (Energy)* | 306,096 | ||||||
| 3,831,052 | Beach Energy Ltd. (Energy) | 3,962,838 | ||||||
| 102,963 | BT Investment Management Ltd. (Diversified Financials) | 567,225 | ||||||
| 359,904 | Cabcharge Australia Ltd. (Commercial & Professional Services)(a) | 1,569,525 | ||||||
| 689,370 | Challenger Ltd. (Diversified Financials) | 4,240,083 | ||||||
| 472,241 | Charter Hall Group (REIT) | 1,817,899 | ||||||
| 570,629 | Cover-More Group Ltd. (Insurance) | 1,114,370 | ||||||
| 1,808,418 | CSR Ltd. (Materials) | 5,534,900 | ||||||
| 122,093 | Domino’s Pizza Enterprises Ltd. (Consumer Services) | 2,910,058 | ||||||
| 1,497,518 | Downer EDI Ltd. (Commercial & Professional Services) | 6,323,782 | ||||||
| 137,530 | GUD Holdings Ltd. (Consumer Durables & Apparel) | 870,531 | ||||||
| 807,101 | iiNET Ltd. (Telecommunication Services) | 5,695,568 | ||||||
| 291,115 | Independence Group NL (Materials) | 1,165,774 | ||||||
| 1,684,531 | Investa Office Fund (REIT) | 5,314,871 | ||||||
| 26,549 | Invocare Ltd. (Consumer Services) | 283,283 | ||||||
| 655,233 | M2 Group Ltd. (Telecommunication Services)(a) | 4,546,461 | ||||||
| 130,164 | Monadelphous Group Ltd. (Capital Goods)(a) | 1,443,731 | ||||||
| 3,682,702 | Mount Gibson Iron Ltd. (Materials) | 1,463,328 | ||||||
| 349,690 | Northern Star Resources Ltd. (Materials) | 337,252 | ||||||
| 722,324 | NRW Holdings Ltd. (Capital Goods) | 483,498 | ||||||
| 88,798 | OZ Minerals Ltd. (Materials) | 305,139 | ||||||
| 72,735 | Premier Investments Ltd. (Retailing) | 690,120 | ||||||
| 203,021 | RCR Tomlinson Ltd. (Capital Goods) | 487,714 | ||||||
| 116,860 | SAI Global Ltd. (Commercial & Professional Services) | 422,999 | ||||||
| 200,862 | Sandfire Resources NL (Materials) | 996,716 | ||||||
| 890,303 | Shopping Centres Australasia Property Group (REIT) | 1,421,058 | ||||||
| 1,145,910 | Sigma Pharmaceuticals Ltd. (Health Care Equipment & Services) | 780,729 | ||||||
| 424,177 | Slater & Gordon Ltd. (Consumer Services) | 2,291,816 | ||||||
| 1,180,704 | Spark Infrastructure Group (Utilities) | 1,984,746 | ||||||
| 49,019 | Tassal Group Ltd. (Food, Beverage & Tobacco) | 159,227 | ||||||
| 80,069 | Village Roadshow Ltd. (Media) | 495,974 | ||||||
|
| |||||||
| 60,247,073 | ||||||||
|
| |||||||
| Austria – 1.7% | ||||||||
| 202,212 | ams AG (Semiconductors & Semiconductor Equipment) | 7,251,122 | ||||||
| 184,063 | CA Immobilien Anlagen AG (Real Estate)* | 3,530,431 | ||||||
| 16,408 | Flughafen Wien AG (Transportation) | 1,505,938 | ||||||
|
| |||||||
| Common Stocks – (continued) | ||||||||
| Austria – (continued) | ||||||||
| 43,573 | Oesterreichische Post AG (Transportation) | $ | 2,125,441 | |||||
|
| |||||||
| 14,412,932 | ||||||||
|
| |||||||
| Belgium – 1.0% | ||||||||
| 5,915 | Befimmo SA (REIT) | 455,861 | ||||||
| 139,153 | bpost SA (Transportation) | 3,444,869 | ||||||
| 16,636 | Compagnie Maritime Belge SA (Transportation) | 325,819 | ||||||
| 69,390 | Exmar NV (Energy) | 969,989 | ||||||
| 13,240 | Ion Beam Applications (Health Care Equipment & Services)* | 231,293 | ||||||
| 28,120 | Kinepolis Group NV (Media) | 1,125,873 | ||||||
| 37,876 | Melexis NV (Semiconductors & Semiconductor Equipment) | 1,727,463 | ||||||
|
| |||||||
| 8,281,167 | ||||||||
|
| |||||||
| Bermuda – 1.2% | ||||||||
| 831,300 | Catlin Group Ltd. (Insurance) | 7,141,525 | ||||||
| 256,760 | Hiscox Ltd. (Insurance) | 2,800,420 | ||||||
| 30,035 | Hoegh LNG Holdings Ltd. (Energy)* | 387,416 | ||||||
|
| |||||||
| 10,329,361 | ||||||||
|
| |||||||
| Canada – 0.1% | ||||||||
| 222,184 | Entertainment One Ltd. (Media) | 1,115,085 | ||||||
|
| |||||||
| China – 0.4% | ||||||||
| 6,013,000 | FIH Mobile Ltd. (Technology Hardware & Equipment)* | 3,203,440 | ||||||
|
| |||||||
| Denmark – 0.6% | ||||||||
| 122,958 | Bakkafrost P/F (Food, Beverage & Tobacco) | 3,006,454 | ||||||
| 3,363 | Royal Unibrew A/S (Food, Beverage & Tobacco)* | 549,728 | ||||||
| 24,541 | Schouw & Co. A/S (Food, Beverage & Tobacco) | 1,087,305 | ||||||
| 18,973 | Zealand Pharma A/S (Pharmaceuticals, Biotechnology & Life Sciences)* | 217,299 | ||||||
|
| |||||||
| 4,860,786 | ||||||||
|
| |||||||
| Finland – 0.4% | ||||||||
| 23,539 | Cramo OYJ (Capital Goods) | 343,298 | ||||||
| 67,646 | Huhtamaki OYJ (Materials) | 1,716,528 | ||||||
| 33,660 | Ramirent OYJ (Capital Goods) | 268,646 | ||||||
| 128,444 | Sponda OYJ (Real Estate) | 588,088 | ||||||
| 8,514 | Tieto OYJ (Software & Services) | 215,865 | ||||||
|
| |||||||
| 3,132,425 | ||||||||
|
| |||||||
| France – 4.4% | ||||||||
| 32,526 | ABC Arbitrage (Diversified Financials) | 196,055 | ||||||
| 260,970 | Air France-KLM (Transportation)*(a) | 2,204,704 | ||||||
| 35,278 | Altamir (Diversified Financials) | 442,086 | ||||||
|
| |||||||
| The accompanying notes are an integral part of these financial statements. | 39 |
GOLDMAN SACHS INTERNATIONAL SMALL CAP INSIGHTS FUND
Schedule of Investments (continued)
October 31, 2014
| Shares | Description | Value | ||||||
| Common Stocks – (continued) | ||||||||
| France – (continued) | ||||||||
| 39,576 | Assystem (Commercial & Professional Services) | $ | 799,150 | |||||
| 89,106 | Belvedere SA (Food, Beverage & Tobacco)* | 1,243,891 | ||||||
| 21,396 | Boiron SA (Pharmaceuticals, Biotechnology & Life Sciences) | 1,904,779 | ||||||
| 6,900 | Bourbon SA (Energy) | 179,025 | ||||||
| 20,806 | Cegid Group (Software & Services) | 765,765 | ||||||
| 18,574 | Etablissements Maurel et Prom (Energy)* | 221,999 | ||||||
| 14,640 | Euler Hermes Group (Insurance) | 1,434,124 | ||||||
| 25,921 | Innate Pharma SA (Pharmaceuticals, Biotechnology & Life Sciences)* | 238,838 | ||||||
| 86,368 | Ipsen SA (Pharmaceuticals, Biotechnology & Life Sciences) | 4,245,379 | ||||||
| 13,112 | Korian-Medica (Health Care Equipment & Services) | 474,372 | ||||||
| 160,871 | Mercialys SA (REIT) | 3,553,121 | ||||||
| 88,233 | Neopost SA (Technology Hardware & Equipment) | 6,123,358 | ||||||
| 63,197 | Orpea (Health Care Equipment & Services) | 3,855,797 | ||||||
| 49,915 | Saft Groupe SA (Capital Goods) | 1,484,760 | ||||||
| 9,966 | Societe de la Tour Eiffel (REIT)* | 560,713 | ||||||
| 959,394 | Technicolor SA (Registered) (Media)* | 5,664,278 | ||||||
| 92,368 | Valneva SE (Pharmaceuticals, Biotechnology & Life Sciences)*(a) | 509,491 | ||||||
| 16,246 | Vicat (Materials) | 1,111,049 | ||||||
|
| |||||||
| 37,212,734 | ||||||||
|
| |||||||
| Georgia – 0.5% | ||||||||
| 107,162 | Bank of Georgia Holdings PLC (Banks) | 4,394,994 | ||||||
|
| |||||||
| Germany – 6.8% | ||||||||
| 24,054 | alstria office REIT-AG (REIT)* | 298,631 | ||||||
| 45,726 | Aurelius AG (Diversified Financials) | 1,593,648 | ||||||
| 227,696 | Balda AG (Health Care Equipment & Services)(a) | 781,824 | ||||||
| 305,824 | Borussia Dortmund GmbH & Co. KGaA (Media) | 1,619,630 | ||||||
| 37,608 | CENTROTEC Sustainable AG (Capital Goods) | 609,108 | ||||||
| 14,444 | Comdirect Bank AG (Banks) | 146,137 | ||||||
| 54,432 | CTS Eventim AG & Co. KGaA (Media) | 1,438,290 | ||||||
| 23,034 | Deutsche Beteiligungs AG (Diversified Financials) | 631,412 | ||||||
| 110,968 | Deutsche Euroshop AG (Real Estate) | 4,964,773 | ||||||
| 233,748 | Dialog Semiconductor PLC (Semiconductors & Semiconductor Equipment)* | 8,071,743 | ||||||
| 81,793 | Duerr AG (Capital Goods) | 5,745,483 | ||||||
| 66,471 | Gerresheimer AG (Pharmaceuticals, Biotechnology & Life Sciences) | 3,698,575 | ||||||
|
| |||||||
| Common Stocks – (continued) | ||||||||
| Germany – (continued) | ||||||||
| 13,021 | Hamborner REIT AG (REIT) | $ | 133,906 | |||||
| 21,807 | Homag Group AG (Capital Goods) | 768,419 | ||||||
| 30,544 | KUKA AG (Capital Goods)(a) | 1,924,999 | ||||||
| 38,100 | MorphoSys AG (Pharmaceuticals, Biotechnology & Life Sciences)*(a) | 3,608,911 | ||||||
| 3,764 | Nemetschek AG (Software & Services) | 375,168 | ||||||
| 5,749 | R Stahl AG (Capital Goods)(a) | 284,932 | ||||||
| 229,363 | Rhoen Klinikum AG (Health Care Equipment & Services) | 6,829,273 | ||||||
| 37,368 | Sixt SE (Transportation) | 1,208,868 | ||||||
| 2,027 | STRATEC Biomedical AG (Health Care Equipment & Services) | 107,435 | ||||||
| 107,063 | Suedzucker AG (Food, Beverage & Tobacco)(a) | 1,490,747 | ||||||
| 167,989 | Symrise AG (Materials) | 9,471,105 | ||||||
| 50,780 | Takkt AG (Retailing) | 791,974 | ||||||
| 4,456 | Wacker Chemie AG (Materials) | 539,974 | ||||||
| 15,929 | Wacker Neuson SE (Capital Goods) | 309,958 | ||||||
| 17,663 | Wincor Nixdorf AG (Technology Hardware & Equipment) | 812,326 | ||||||
|
| |||||||
| 58,257,249 | ||||||||
|
| |||||||
| Hong Kong – 2.3% | ||||||||
| 2,708,000 | Brightoil Petroleum Holdings Ltd. (Energy)*(a) | 865,689 | ||||||
| 113,000 | Chow Sang Sang Holdings International Ltd. (Retailing) | 279,361 | ||||||
| 122,800 | Dah Sing Banking Group Ltd. (Banks) | 223,119 | ||||||
| 386,400 | Dah Sing Financial Holdings Ltd. (Banks) | 2,406,005 | ||||||
| 493,926 | Dickson Concepts International Ltd. (Retailing) | 258,873 | ||||||
| 890,000 | Emperor Entertainment Hotel Ltd. (Consumer Services) | 267,402 | ||||||
| 1,418,000 | Emperor International Holdings (Real Estate) | 309,186 | ||||||
| 1,182,100 | Esprit Holdings Ltd. (Retailing) | 1,480,785 | ||||||
| 1,508,000 | Global Brands Group Holding Ltd. (Consumer Durables & Apparel)* | 334,456 | ||||||
| 154,240 | Great Eagle Holdings Ltd. (Real Estate) | 519,187 | ||||||
| 817,000 | Guotai Junan International Holdings Ltd. (Diversified Financials) | 570,692 | ||||||
| 810,000 | Haitong International Securities Group Ltd. (Diversified Financials) | 481,352 | ||||||
| 5,125 | Hopewell Highway Infrastructure Ltd. (Transportation) | 2,472 | ||||||
| 102,500 | Hopewell Holdings Ltd. (Capital Goods) | 363,752 | ||||||
| 662,000 | Hutchison Telecommunications Hong Kong Holdings Ltd. (Telecommunication Services) | 263,857 | ||||||
| 213,000 | Luk Fook Holdings International Ltd. (Retailing) | 635,100 | ||||||
|
| |||||||
| 40 | The accompanying notes are an integral part of these financial statements. |
GOLDMAN SACHS INTERNATIONAL SMALL CAP INSIGHTS FUND
| Shares | Description | Value | ||||||
| Common Stocks – (continued) | ||||||||
| Hong Kong – (continued) | ||||||||
| 2,886,000 | Newocean Energy Holdings Ltd. (Energy)(a) | $ | 1,359,535 | |||||
| 106,000 | Orient Overseas International Ltd. (Transportation) | 603,910 | ||||||
| 210,000 | Regal Hotels International Holdings Ltd. (Consumer Services) | 128,071 | ||||||
| 1,453,000 | Samson Holding Ltd. (Consumer Durables & Apparel) | 189,233 | ||||||
| 3,506,000 | Shun Tak Holdings Ltd. (Capital Goods) | 1,786,246 | ||||||
| 271,500 | SmarTone Telecommunications Holdings Ltd. (Telecommunication Services) | 349,178 | ||||||
| 109,138 | SOCAM Development Ltd. (Capital Goods)* | 90,772 | ||||||
| 607,000 | Sunlight Real Estate Investment Trust (REIT) | 263,811 | ||||||
| 288,000 | Texwinca Holdings Ltd. (Consumer Durables & Apparel) | 252,754 | ||||||
| 2,004,000 | The United Laboratories International Holdings Ltd. (Pharmaceuticals, Biotechnology & Life Sciences)* | 1,537,349 | ||||||
| 100,000 | Tian An China Investments Co. Ltd. (Real Estate) | 67,078 | ||||||
| 3,804,000 | Truly International Holdings Ltd. (Technology Hardware & Equipment) | 1,933,557 | ||||||
| 657,600 | VST Holdings Ltd. (Technology Hardware & Equipment) | 227,251 | ||||||
| 91,500 | VTech Holdings Ltd. (Technology Hardware & Equipment) | 1,145,645 | ||||||
| 524,000 | Xinyi Glass Holdings Ltd. (Automobiles & Components) | 309,603 | ||||||
|
| |||||||
| 19,505,281 | ||||||||
|
| |||||||
| India – 0.6% | ||||||||
| 376,602 | Vedanta Resources PLC (Materials) | 4,969,698 | ||||||
|
| |||||||
| Ireland – 0.4% | ||||||||
| 409,532 | Beazley PLC (Insurance) | 1,720,123 | ||||||
| 101,706 | Grafton Group PLC (Capital Goods) | 1,032,454 | ||||||
| 56,959 | Greencore Group PLC (Food, Beverage & Tobacco) | 239,000 | ||||||
| 129,410 | Irish Continental Group PLC (Transportation)(a) | 452,455 | ||||||
|
| |||||||
| 3,444,032 | ||||||||
|
| |||||||
| Israel – 0.1% | ||||||||
| 4,869 | Osem Investments Ltd. (Food, Beverage & Tobacco) | 93,658 | ||||||
| 79,423 | Plus500 Ltd. (Diversified Financials) | 650,329 | ||||||
|
| |||||||
| 743,987 | ||||||||
|
| |||||||
| Italy – 4.5% | ||||||||
| 830,536 | A2A SpA (Utilities) | 832,802 | ||||||
|
| |||||||
| Common Stocks – (continued) | ||||||||
| Italy – (continued) | ||||||||
| 68,085 | ACEA SpA (Utilities) | $ | 833,007 | |||||
| 179,826 | Ascopiave SpA (Utilities) | 421,402 | ||||||
| 134,855 | ASTM SpA (Transportation) | 1,622,144 | ||||||
| 331,436 | Autogrill SpA (Consumer Services)* | 2,246,293 | ||||||
| 132,048 | Banca IFIS SpA (Diversified Financials) | 2,325,638 | ||||||
| 635,883 | Banca Popolare di Milano Scarl (Banks)* | 479,281 | ||||||
| 2,377,919 | Beni Stabili SpA (REIT) | 1,639,627 | ||||||
| 23,424 | Brembo SpA (Automobiles & Components) | 776,773 | ||||||
| 26,597 | Cairo Communication SpA (Media) | 178,782 | ||||||
| 273,322 | Cementir Holding SpA (Materials) | 1,642,271 | ||||||
| 15,729 | Cosmo Pharmaceuticals SpA (Pharmaceuticals, Biotechnology & Life Sciences)(a) | 2,472,295 | ||||||
| 187,748 | Credito Emiliano SpA (Banks) | 1,446,717 | ||||||
| 37,952 | De’Longhi (Consumer Durables & Apparel) | 742,751 | ||||||
| 272,839 | ERG SpA (Energy) | 3,126,750 | ||||||
| 1,635,759 | Hera SpA (Utilities) | 4,307,748 | ||||||
| 159,079 | Immobiliare Grande Distribuzione (REIT) | 132,857 | ||||||
| 259,751 | Indesit Co. SpA (Consumer Durables & Apparel)* | 3,572,788 | ||||||
| 44,604 | Industria Macchine Automatiche SpA (Capital Goods) | 1,748,796 | ||||||
| 1,742,965 | Iren SpA (Utilities) | 2,107,654 | ||||||
| 233,563 | Recordati SpA (Pharmaceuticals, Biotechnology & Life Sciences) | 4,041,271 | ||||||
| 9,441 | Reply SpA (Software & Services) | 696,666 | ||||||
| 41,252 | Societa Cattolica di Assicurazioni SCRL (Insurance)(a) | 638,908 | ||||||
| 68,462 | Societa Iniziative Autostradali e Servizi SpA (Transportation) | 685,971 | ||||||
|
| |||||||
| 38,719,192 | ||||||||
|
| |||||||
| Japan – 30.6% | ||||||||
| 350,200 | Alpine Electronics, Inc. (Consumer Durables & Apparel) | 5,977,726 | ||||||
| 59,700 | AOKI Holdings, Inc. (Retailing) | 669,613 | ||||||
| 112,300 | Aoyama Trading Co. Ltd. (Retailing) | 2,671,054 | ||||||
| 3,800 | As One Corp. (Health Care Equipment & Services) | 108,592 | ||||||
| 91,800 | Asahi Diamond Industrial Co. Ltd. (Capital Goods) | 1,113,948 | ||||||
| 32,300 | ASKA Pharmaceutical Co. Ltd. (Pharmaceuticals, Biotechnology & Life Sciences) | 356,433 | ||||||
| 379,600 | Avex Group Holdings, Inc. (Media) | 5,638,399 | ||||||
| 10,600 | C. Uyemura & Co. Ltd. (Materials) | 504,155 | ||||||
| 90,600 | Canon Marketing Japan, Inc. (Retailing) | 1,852,247 | ||||||
| 108,100 | Century Tokyo Leasing Corp. (Diversified Financials) | 2,830,810 | ||||||
|
| |||||||
| The accompanying notes are an integral part of these financial statements. | 41 |
GOLDMAN SACHS INTERNATIONAL SMALL CAP INSIGHTS FUND
Schedule of Investments (continued)
October 31, 2014
| Shares | Description | Value | ||||||
| Common Stocks – (continued) | ||||||||
| Japan – (continued) | ||||||||
| 50,900 | Chiyoda Integre Co. Ltd. (Capital Goods) | $ | 877,550 | |||||
| 198,000 | Chugoku Marine Paints Ltd. (Materials) | 1,564,743 | ||||||
| 225,100 | CKD Corp. (Capital Goods) | 1,974,764 | ||||||
| 1,367,000 | Clarion Co. Ltd. (Consumer Durables & Apparel)*(a) | 4,498,615 | ||||||
| 18,600 | Cleanup Corp. (Consumer Durables & Apparel) | 163,367 | ||||||
| 32,300 | Colowide Co. Ltd. (Consumer Services) | 387,038 | ||||||
| 93,300 | COMSYS Holdings Corp. (Capital Goods) | 1,665,646 | ||||||
| 113,000 | Daido Metal Co. Ltd. (Automobiles & Components) | 1,327,712 | ||||||
| 515,000 | Daihen Corp. (Capital Goods) | 1,823,388 | ||||||
| 88,600 | Daiichikosho Co. Ltd. (Media) | 2,235,951 | ||||||
| 31,000 | Daiwa Industries Ltd. (Capital Goods) | 236,378 | ||||||
| 47,900 | DCM Holdings Co. Ltd. (Retailing) | 320,898 | ||||||
| 28,000 | Denki Kogyo Co. Ltd. (Technology Hardware & Equipment) | 146,424 | ||||||
| 1,305,000 | DIC Corp. (Materials) | 2,674,585 | ||||||
| 20,400 | Doshisha Co. Ltd. (Retailing) | 337,356 | ||||||
| 125,000 | Doutor Nichires Holdings Co. Ltd. (Consumer Services) | 1,862,165 | ||||||
| 7,400 | Dr. Ci:Labo Co. Ltd. (Household & Personal Products) | 235,055 | ||||||
| 3,000 | Dydo Drinco, Inc. (Food, Beverage & Tobacco) | 128,557 | ||||||
| 107,200 | Eagle Industry Co. Ltd. (Automobiles & Components) | 2,056,167 | ||||||
| 505,900 | EDION Corp. (Retailing)(a) | 3,609,464 | ||||||
| 82,700 | Eizo Corp. (Technology Hardware & Equipment) | 1,512,000 | ||||||
| 54,000 | en-japan, Inc. (Commercial & Professional Services)(a) | 951,997 | ||||||
| 81,000 | Ezaki Glico Co. Ltd. (Food, Beverage & Tobacco) | 2,622,082 | ||||||
| 183,700 | Fancl Corp. (Household & Personal Products) | 2,519,907 | ||||||
| 140,100 | Foster Electric Co. Ltd. (Consumer Durables & Apparel) | 2,219,564 | ||||||
| 248 | Frontier Real Estate Investment Corp. (REIT) | 1,142,293 | ||||||
| 230,400 | Fuji Machine Manufacturing Co. Ltd. (Capital Goods) | 2,217,824 | ||||||
| 129,600 | Fuji Oil Co. Ltd. (Food, Beverage & Tobacco) | 2,058,157 | ||||||
| 47,200 | Fuji Soft, Inc. (Software & Services) | 1,168,479 | ||||||
| 305,000 | Fujitsu General Ltd. (Consumer Durables & Apparel) | 3,818,118 | ||||||
| 79,800 | Funai Electric Co. Ltd. (Consumer Durables & Apparel) | 715,658 | ||||||
| 38,000 | Fuyo General Lease Co. Ltd. (Diversified Financials) | 1,500,293 | ||||||
|
| |||||||
| Common Stocks – (continued) | ||||||||
| Japan – (continued) | ||||||||
| 1,105 | Global One Real Estate Investment Corp. (REIT) | $ | 3,423,813 | |||||
| 85,200 | G-Tekt Corp. (Automobiles & Components) | 849,815 | ||||||
| 466 | Hankyu REIT, Inc. (REIT) | 2,662,287 | ||||||
| 132,000 | Hanwa Co. Ltd. (Capital Goods) | 475,945 | ||||||
| 10,700 | Heiwado Co. Ltd. (Food & Staples Retailing) | 199,190 | ||||||
| 256,400 | Hitachi Capital Corp. (Diversified Financials) | 6,337,595 | ||||||
| 38,600 | Hitachi Koki Co. Ltd. (Capital Goods) | 331,890 | ||||||
| 285,400 | Hitachi Transport System Ltd. (Transportation) | 3,776,866 | ||||||
| 35,300 | Hokkaido Electric Power Co., Inc. (Utilities)* | 296,356 | ||||||
| 67,600 | Hokuetsu Kishu Paper Co. Ltd. (Materials) | 281,329 | ||||||
| 9,700 | Honeys Co. Ltd. (Retailing) | 90,688 | ||||||
| 163 | Hulic Reit, Inc. (REIT)(a) | 247,678 | ||||||
| 66,900 | IBJ Leasing Co. Ltd. (Diversified Financials) | 1,585,167 | ||||||
| 172 | Ichigo Real Estate Investment Corp. (REIT) | 129,402 | ||||||
| 8,000 | Iriso Electronics Co. Ltd. (Technology Hardware & Equipment) | 545,112 | ||||||
| 1,245,000 | Ishihara Sangyo Kaisha Ltd. (Materials)* | 1,023,245 | ||||||
| 356,300 | IT Holdings Corp. (Software & Services) | 5,821,720 | ||||||
| 329,000 | Jaccs Co. Ltd. (Diversified Financials) | 1,966,067 | ||||||
| 157,900 | Jafco Co. Ltd. (Diversified Financials) | 6,147,084 | ||||||
| 276,000 | Japan Aviation Electronics Industry Ltd. (Technology Hardware & Equipment) | 5,468,340 | ||||||
| 23,100 | Japan Digital Laboratory Co. Ltd. (Technology Hardware & Equipment) | 411,435 | ||||||
| 2,870 | Japan Rental Housing Investments, Inc. (REIT) | 1,988,169 | ||||||
| 58,100 | Japan Securities Finance Co. Ltd. (Diversified Financials) | 332,939 | ||||||
| 145,000 | Japan Vilene Co. Ltd. (Consumer Durables & Apparel) | 805,208 | ||||||
| 79,000 | J-Oil Mills, Inc. (Food, Beverage & Tobacco) | 256,645 | ||||||
| 1,111,000 | JVC Kenwood Corp. (Consumer Durables & Apparel)* | 2,124,054 | ||||||
| 11,000 | Kaken Pharmaceutical Co. Ltd. (Pharmaceuticals, Biotechnology & Life Sciences) | 275,594 | ||||||
| 320,000 | Kato Works Co. Ltd. (Capital Goods) | 2,355,973 | ||||||
|
| |||||||
| 42 | The accompanying notes are an integral part of these financial statements. |
GOLDMAN SACHS INTERNATIONAL SMALL CAP INSIGHTS FUND
| Shares | Description | Value | ||||||
| Common Stocks – (continued) | ||||||||
| Japan – (continued) | ||||||||
| 40,900 | Keihin Corp. (Automobiles & Components) | $ | 516,731 | |||||
| 102 | Kenedix Office Investment Corp. (REIT) | 545,435 | ||||||
| 137,000 | Kissei Pharmaceutical Co. Ltd. (Pharmaceuticals, Biotechnology & Life Sciences) | 3,581,209 | ||||||
| 443,400 | Kitz Corp. (Capital Goods) | 2,031,954 | ||||||
| 183,900 | Koei Tecmo Holdings Co. Ltd. (Software & Services) | 3,054,454 | ||||||
| 81,200 | Kohnan Shoji Co. Ltd. (Retailing) | 931,740 | ||||||
| 59,400 | Komori Corp. (Capital Goods) | 584,203 | ||||||
| 27,800 | Konoike Transport Co. Ltd. (Transportation) | 544,178 | ||||||
| 18,100 | Kose Corp. (Household & Personal Products) | 739,698 | ||||||
| 210,000 | Kurabo Industries Ltd. (Consumer Durables & Apparel) | 349,175 | ||||||
| 55,000 | Kureha Corp. (Materials) | 272,780 | ||||||
| 130,400 | Kuroda Electric Co. Ltd. (Capital Goods) | 1,833,518 | ||||||
| 11,900 | KYORIN Holdings, Inc. (Pharmaceuticals, Biotechnology & Life Sciences) | 250,706 | ||||||
| 56,200 | Kyoritsu Maintenance Co. Ltd. (Consumer Services)(a) | 2,261,653 | ||||||
| 25,400 | Macnica, Inc. (Technology Hardware & Equipment)(a) | 736,204 | ||||||
| 294,000 | Maeda Road Construction Co. Ltd. (Capital Goods) | 4,531,845 | ||||||
| 376,000 | Makino Milling Machine Co. Ltd. (Capital Goods) | 2,563,160 | ||||||
| 5,800 | Mandom Corp. (Household & Personal Products) | 194,572 | ||||||
| 57,000 | Marudai Food Co. Ltd. (Food, Beverage & Tobacco) | 211,110 | ||||||
| 59,000 | Matsumotokiyoshi Holdings Co. Ltd. (Food & Staples Retailing) | 1,715,842 | ||||||
| 92,200 | Melco Holdings, Inc. (Technology Hardware & Equipment)(a) | 1,321,232 | ||||||
| 84,700 | Micronics Japan Co. Ltd. (Semiconductors & Semiconductor Equipment)(a) | 4,311,370 | ||||||
| 482 | MID REIT, Inc. (REIT) | 1,205,978 | ||||||
| 588,000 | Minebea Co. Ltd. (Capital Goods) | 8,057,036 | ||||||
| 87,100 | Mirait Holdings Corp. (Capital Goods) | 974,984 | ||||||
| 7,500 | MISUMI Group, Inc. (Capital Goods) | 236,654 | ||||||
| 200,000 | Mito Securities Co. Ltd. (Diversified Financials) | 751,962 | ||||||
| 84,500 | Mitsui High-Tec, Inc. (Semiconductors & Semiconductor Equipment) | 506,441 | ||||||
| 170,000 | Mitsui-Soko Holdings Co. Ltd. (Transportation) | 646,304 | ||||||
|
| |||||||
| Common Stocks – (continued) | ||||||||
| Japan – (continued) | ||||||||
| 74,000 | Mizuno Corp. (Consumer Durables & Apparel) | $ | 370,755 | |||||
| 503,000 | Morinaga Milk Industry Co. Ltd. (Food, Beverage & Tobacco) | 1,681,831 | ||||||
| 317,000 | Nachi-Fujikoshi Corp. (Capital Goods) | 1,969,931 | ||||||
| 100,200 | NEC Networks & System Integration Corp. (Software & Services) | 2,177,111 | ||||||
| 13,300 | NIFTY Corp. (Software & Services) | 160,030 | ||||||
| 32,400 | Nihon M&A Center, Inc. (Commercial & Professional Services) | 931,153 | ||||||
| 176,000 | Nippon Flour Mills Co. Ltd. (Food, Beverage & Tobacco) | 883,400 | ||||||
| 1,768,000 | Nippon Light Metal Holdings Co. Ltd. (Materials) | 2,611,156 | ||||||
| 506,500 | Nippon Suisan Kaisha Ltd. (Food, Beverage & Tobacco)* | 1,497,264 | ||||||
| 160,000 | Nippon Thompson Co. Ltd. (Capital Goods) | 670,592 | ||||||
| 13,600 | Nipro Corp. (Health Care Equipment & Services)(a) | 112,050 | ||||||
| 73,000 | Nisshinbo Holdings, Inc. (Capital Goods) | 602,867 | ||||||
| 285,000 | Nissin Electric Co. Ltd. (Capital Goods) | 1,542,250 | ||||||
| 94,300 | Nissin Kogyo Co. Ltd. (Automobiles & Components) | 1,457,441 | ||||||
| 469 | Nomura Real Estate Office Fund, Inc. (REIT) | 2,078,458 | ||||||
| 265 | Nomura Real Estate Residential Fund, Inc. (REIT) | 1,396,716 | ||||||
| 366,000 | NS United Kaiun Kaisha Ltd. (Transportation) | 913,452 | ||||||
| 1,529,000 | NTN Corp. (Capital Goods) | 6,611,046 | ||||||
| 4,100 | Ohsho Food Service Corp. (Consumer Services) | 148,098 | ||||||
| 15,200 | Okamura Corp. (Commercial & Professional Services) | 110,913 | ||||||
| 149,000 | OKUMA Corp. (Capital Goods) | 1,069,834 | ||||||
| 175 | Orix JREIT, Inc. (REIT) | 233,321 | ||||||
| 44,000 | Pacific Metals Co. Ltd. (Materials)* | 139,199 | ||||||
| 5,800 | Pal Co. Ltd. (Retailing) | 174,431 | ||||||
| 43,900 | Paltac Corp. (Retailing) | 534,936 | ||||||
| 8,500 | Paramount Bed Holdings Co. Ltd. (Health Care Equipment & Services) | 241,759 | ||||||
| 19,100 | Pilot Corp. (Commercial & Professional Services) | 1,072,395 | ||||||
| 71,600 | Pola Orbis Holdings, Inc. (Household & Personal Products) | 2,940,443 | ||||||
| 9,900 | Ringer Hut Co. Ltd. (Consumer Services) | 152,936 | ||||||
| 38,300 | Riso Kagaku Corp. (Technology Hardware & Equipment) | 1,158,167 | ||||||
|
| |||||||
| The accompanying notes are an integral part of these financial statements. | 43 |
GOLDMAN SACHS INTERNATIONAL SMALL CAP INSIGHTS FUND
Schedule of Investments (continued)
October 31, 2014
| Shares | Description | Value | ||||||
| Common Stocks – (continued) | ||||||||
| Japan – (continued) | ||||||||
| 330,800 | Rohto Pharmaceutical Co. Ltd. (Pharmaceuticals, Biotechnology & Life Sciences) | $ | 4,798,490 | |||||
| 70,400 | Roland DG Corp. (Technology Hardware & Equipment) | 2,971,597 | ||||||
| 163,600 | Round One Corp. (Consumer Services) | 986,992 | ||||||
| 146,000 | Ryobi Ltd. (Capital Goods) | 398,491 | ||||||
| 33,000 | Sakata Seed Corp. (Food, Beverage & Tobacco) | 489,411 | ||||||
| 27,100 | San-A Co. Ltd. (Food & Staples Retailing) | 913,510 | ||||||
| 854,000 | Sankyu, Inc. (Transportation) | 3,948,268 | ||||||
| 315,000 | Sanwa Holdings Corp. (Capital Goods) | 2,184,215 | ||||||
| 339,000 | Sanyo Special Steel Co. Ltd. (Materials) | 1,163,485 | ||||||
| 1,043,000 | Sapporo Holdings Ltd. (Food, Beverage & Tobacco) | 4,513,913 | ||||||
| 8,600 | Sato Holdings Corp. (Commercial & Professional Services) | 226,511 | ||||||
| 68,000 | Seino Holdings Co. Ltd. (Transportation) | 533,175 | ||||||
| 2,906 | Sekisui House SI Residential Investment Corp. (REIT)(a) | 2,838,787 | ||||||
| 682,000 | Senko Co. Ltd. (Transportation)(a) | 2,900,811 | ||||||
| 17,800 | Shin-Etsu Polymer Co. Ltd. (Materials) | 83,289 | ||||||
| 1,283,000 | Showa Denko KK (Materials) | 1,697,838 | ||||||
| 240,000 | SMK Corp. (Technology Hardware & Equipment) | 964,252 | ||||||
| 108,900 | Sohgo Security Services Co. Ltd. (Commercial & Professional Services) | 2,546,687 | ||||||
| 23,100 | St. Marc Holdings Co. Ltd. (Consumer Services) | 1,207,703 | ||||||
| 30,700 | Star Micronics Co. Ltd. (Capital Goods) | 466,845 | ||||||
| 99,000 | Sumitomo Bakelite Co. Ltd. (Materials) | 389,607 | ||||||
| 34,200 | Sumitomo Densetsu Co. Ltd. (Capital Goods) | 422,887 | ||||||
| 17,200 | Sumitomo Riko Co. Ltd. (Automobiles & Components) | 147,824 | ||||||
| 65,000 | Sumitomo Seika Chemicals Co. Ltd. (Materials) | 398,752 | ||||||
| 29,400 | Tachi-S Co. Ltd. (Automobiles & Components) | 372,787 | ||||||
| 49,000 | Taihei Dengyo Kaisha Ltd. (Capital Goods) | 400,021 | ||||||
| 91,700 | Taikisha Ltd. (Capital Goods) | 2,037,803 | ||||||
| 70,300 | Tamron Co. Ltd. (Consumer Durables & Apparel) | 1,391,577 | ||||||
| 12,200 | The Kiyo Bank Ltd. (Banks) | 175,411 | ||||||
| 107,000 | The Nippon Road Co. Ltd. (Capital Goods) | 594,894 | ||||||
|
| |||||||
| Common Stocks – (continued) | ||||||||
| Japan – (continued) | ||||||||
| 69,000 | The Nippon Synthetic Chemical Industry Co. Ltd. (Materials) | $ | 421,289 | |||||
| 240,000 | The Nisshin Oillio Group Ltd. (Food, Beverage & Tobacco) | 860,114 | ||||||
| 10,600 | The Okinawa Electric Power Co., Inc. (Utilities) | 323,266 | ||||||
| 103,000 | The Towa Bank Ltd. (Banks) | 92,154 | ||||||
| 15,100 | Tocalo Co. Ltd. (Capital Goods) | 284,844 | ||||||
| 39,000 | Toei Co. Ltd. (Media) | 205,785 | ||||||
| 19,900 | Tohokushinsha Film Corp. (Media) | 148,308 | ||||||
| 54,100 | Tokai Tokyo Financial Holdings, Inc. (Diversified Financials) | 366,999 | ||||||
| 68,000 | Toko, Inc. (Technology Hardware & Equipment)(a) | 181,109 | ||||||
| 84,000 | Tokuyama Corp. (Materials) | 245,541 | ||||||
| 18,100 | Tokyo Ohka Kogyo Co. Ltd. (Materials) | 510,484 | ||||||
| 83,900 | Tokyo Seimitsu Co. Ltd. (Semiconductors & Semiconductor Equipment) | 1,365,263 | ||||||
| 949 | Tokyu REIT, Inc. (REIT) | 1,318,346 | ||||||
| 336 | Top REIT, Inc. (REIT) | 1,386,865 | ||||||
| 23,000 | Topre Corp. (Automobiles & Components) | 325,688 | ||||||
| 12,100 | Torii Pharmaceutical Co. Ltd. (Pharmaceuticals, Biotechnology & Life Sciences) | 347,222 | ||||||
| 45,600 | Towa Pharmaceutical Co. Ltd. (Pharmaceuticals, Biotechnology & Life Sciences) | 2,013,261 | ||||||
| 4,100 | TPR Co. Ltd. (Automobiles & Components) | 97,194 | ||||||
| 2,100 | Trancom Co. Ltd. (Transportation) | 87,758 | ||||||
| 52,700 | Ulvac, Inc. (Semiconductors & Semiconductor Equipment)* | 656,248 | ||||||
| 40,000 | Unipres Corp. (Automobiles & Components) | 795,994 | ||||||
| 24,030 | Usen Corp. (Media)* | 75,520 | ||||||
| 86,600 | Wacom Co. Ltd. (Technology Hardware & Equipment)(a) | 332,266 | ||||||
| 139,100 | Wakita & Co. Ltd. (Capital Goods) | 1,389,965 | ||||||
| 22,900 | Warabeya Nichiyo Co. Ltd. (Food, Beverage & Tobacco) | 401,562 | ||||||
| 15,000 | Yahagi Construction Co. Ltd. (Capital Goods) | 113,560 | ||||||
| 32,900 | Yokogawa Bridge Holdings Corp. (Capital Goods) | 422,971 | ||||||
| 38,200 | Yoshinoya Holdings Co. Ltd. (Consumer Services)(a) | 437,646 | ||||||
|
| |||||||
| 260,983,896 | ||||||||
|
| |||||||
| Jersey – 0.1% | ||||||||
| 167,038 | Petra Diamonds Ltd. (Materials)* | 443,570 | ||||||
|
| |||||||
| 44 | The accompanying notes are an integral part of these financial statements. |
GOLDMAN SACHS INTERNATIONAL SMALL CAP INSIGHTS FUND
| Shares | Description | Value | ||||||
| Common Stocks – (continued) | ||||||||
| Netherlands – 3.9% | ||||||||
| 81,965 | Aalberts Industries NV (Capital Goods) | $ | 2,184,841 | |||||
| 42,577 | ASM International NV (Semiconductors & Semiconductor Equipment) | 1,706,176 | ||||||
| 165,198 | BE Semiconductor Industries NV (Semiconductors & Semiconductor Equipment) | 3,146,575 | ||||||
| 243,694 | BinckBank NV (Diversified Financials) | 2,415,172 | ||||||
| 25,393 | Eurocommercial Properties NV CVA (Real Estate) | 1,159,219 | ||||||
| 68,818 | Nutreco NV (Food, Beverage & Tobacco) | 3,446,915 | ||||||
| 1,518,501 | PostNL NV (Transportation)* | 6,454,159 | ||||||
| 349,050 | SNS REAAL NV (Diversified Financials)*(a) | — | ||||||
| 713,259 | TomTom NV (Consumer Durables & Apparel)* | 5,181,313 | ||||||
| 30,002 | Vastned Retail NV (REIT) | 1,370,094 | ||||||
| 77,406 | Wereldhave NV (REIT)(a) | 6,345,957 | ||||||
|
| |||||||
| 33,410,421 | ||||||||
|
| |||||||
| New Zealand – 0.7% | ||||||||
| 2,868,023 | Air New Zealand Ltd. (Transportation) | 4,540,321 | ||||||
| 31,150 | Freightways Ltd. (Transportation) | 139,109 | ||||||
| 83,573 | Infratil Ltd. (Utilities) | 186,641 | ||||||
| 256,644 | New Zealand Oil & Gas Ltd. (Energy) | 147,951 | ||||||
| 120,587 | SKY Network Television Ltd. (Media) | 598,754 | ||||||
| 190,667 | Summerset Group Holdings Ltd. (Health Care Equipment & Services) | 406,510 | ||||||
|
| |||||||
| 6,019,286 | ||||||||
|
| |||||||
| Norway – 2.2% | ||||||||
| 142,552 | Austevoll Seafood ASA (Food, Beverage & Tobacco) | 926,999 | ||||||
| 98,920 | Borregaard ASA (Materials) | 687,416 | ||||||
| 92,202 | Cermaq ASA (Food, Beverage & Tobacco)(a) | 1,308,882 | ||||||
| 45,115 | Leroey Seafood Group ASA (Food, Beverage & Tobacco) | 1,706,676 | ||||||
| 560,194 | Marine Harvest ASA (Food, Beverage & Tobacco) | 7,933,741 | ||||||
| 31,875 | Nordic Semiconductor ASA (Semiconductors & Semiconductor Equipment)* | 179,570 | ||||||
| 160,062 | Salmar ASA (Food, Beverage & Tobacco) | 2,883,764 | ||||||
| 119,910 | SpareBanken 1 SMN (Banks) | 1,066,269 | ||||||
| 394,397 | Storebrand ASA (Insurance)* | 2,022,233 | ||||||
|
| |||||||
| 18,715,550 | ||||||||
|
| |||||||
| Common Stocks – (continued) | ||||||||
| Portugal – 0.6% | ||||||||
| 355,205 | Portucel SA (Materials) | $ | 1,322,010 | |||||
| 1,711,090 | Portugal Telecom SGPS SA (Registered) (Telecommunication Services)(a) | 2,802,613 | ||||||
| 206,273 | REN – Redes Energeticas Nacionais SGPS SA (Utilities) | 639,381 | ||||||
|
| |||||||
| 4,764,004 | ||||||||
|
| |||||||
| Singapore – 0.9% | ||||||||
| 130,546 | BW LPG Ltd. (Energy)(b) | 1,237,352 | ||||||
| 29,411 | Cape PLC (Commercial & Professional Services) | 127,233 | ||||||
| 490,000 | Chip Eng Seng Corp. Ltd. (Capital Goods) | 335,527 | ||||||
| 101,000 | CWT Ltd. (Transportation) | 127,039 | ||||||
| 2,988,000 | Ezra Holdings Ltd. (Energy) | 1,898,633 | ||||||
| 216,000 | Ho Bee Land Ltd. (Real Estate) | 335,146 | ||||||
| 785,000 | Indofood Agri Resources Ltd. (Food, Beverage & Tobacco) | 510,751 | ||||||
| 1,411,000 | Mapletree Logistics Trust (REIT) | 1,291,811 | ||||||
| 1,687,000 | Midas Holdings Ltd. (Materials) | 427,035 | ||||||
| 59,000 | OUE Ltd. (Consumer Services) | 96,998 | ||||||
| 30,221 | REC Solar ASA (Semiconductors & Semiconductor Equipment)* | 404,096 | ||||||
| 254,000 | Stamford Land Corp. Ltd. (Consumer Services) | 109,768 | ||||||
| 102,000 | United Engineers Ltd. (Capital Goods) | 227,975 | ||||||
| 561,000 | Wing Tai Holdings Ltd. (Real Estate) | 781,663 | ||||||
|
| |||||||
| 7,911,027 | ||||||||
|
| |||||||
| South Africa – 0.5% | ||||||||
| 251,742 | Mondi PLC (Materials) | 4,254,557 | ||||||
|
| |||||||
| Spain – 2.2% | ||||||||
| 172,242 | Abengoa SA (Capital Goods)(a) | 763,404 | ||||||
| 91,776 | Acciona SA (Utilities)*(a) | 6,414,089 | ||||||
| 741,952 | Bankinter SA (Banks) | 6,137,809 | ||||||
| 74,120 | Bolsas y Mercados Espanoles SA (Diversified Financials) | 2,820,004 | ||||||
| 30,191 | Let’s GOWEX SA (Telecommunication Services)*(a) | — | ||||||
| 2,486,010 | Liberbank SA (Banks)* | 2,123,736 | ||||||
| 30,425 | Papeles y Cartones de Europa SA (Materials) | 158,913 | ||||||
| 44,600 | Prosegur Cia de Seguridad SA (Commercial & Professional Services) | 261,968 | ||||||
|
| |||||||
| 18,679,923 | ||||||||
|
| |||||||
| Sweden – 4.3% | ||||||||
| 20,291 | B&B Tools AB Class B (Capital Goods) | 380,400 | ||||||
| 44,906 | Betsson AB (Consumer Services)* | 1,586,635 | ||||||
| 86,571 | Bilia AB Class A (Retailing) | 2,457,458 | ||||||
|
| |||||||
| The accompanying notes are an integral part of these financial statements. | 45 |
GOLDMAN SACHS INTERNATIONAL SMALL CAP INSIGHTS FUND
Schedule of Investments (continued)
October 31, 2014
| Shares | Description | Value | ||||||
| Common Stocks – (continued) | ||||||||
| Sweden – (continued) | ||||||||
| 25,966 | BioGaia AB Class B (Pharmaceuticals, Biotechnology & Life Sciences) | $ | 661,093 | |||||
| 51,785 | Castellum AB (Real Estate) | 794,130 | ||||||
| 34,872 | Clas Ohlson AB Class B (Retailing) | 602,125 | ||||||
| 247,968 | Fabege AB (Real Estate) | 3,183,084 | ||||||
| 121,178 | Fastighets AB Balder Class B (Real Estate)* | 1,578,879 | ||||||
| 53,589 | Haldex AB (Capital Goods) | 657,694 | ||||||
| 10,567 | Hexpol AB (Materials) | 936,208 | ||||||
| 45,778 | Industrial & Financial Systems AB Class B (Software & Services) | 1,425,884 | ||||||
| 11,953 | Intrum Justitia AB (Commercial & Professional Services) | 355,981 | ||||||
| 205,957 | JM AB (Consumer Durables & Apparel) | 6,656,995 | ||||||
| 116,139 | Klovern AB (Real Estate) | 591,276 | ||||||
| 63,624 | Loomis AB Class B (Commercial & Professional Services) | 1,752,781 | ||||||
| 335,139 | Meda AB Class A (Pharmaceuticals, Biotechnology & Life Sciences)(a) | 4,389,009 | ||||||
| 117,940 | NCC AB Class B (Capital Goods)(a) | 3,469,214 | ||||||
| 23,182 | Net Entertainment NE AB Class B (Software & Services)* | 716,344 | ||||||
| 148,952 | Nobia AB (Consumer Durables & Apparel)(a) | 1,210,311 | ||||||
| 85,789 | Nolato AB Class B (Capital Goods) | 1,983,754 | ||||||
| 21,428 | Peab AB (Capital Goods)(a) | 145,476 | ||||||
| 216,907 | SAS AB (Transportation)*(a) | 333,829 | ||||||
| 40,754 | Wihlborgs Fastigheter AB (Real Estate) | 714,757 | ||||||
|
| |||||||
| 36,583,317 | ||||||||
|
| |||||||
| Switzerland – 5.2% | ||||||||
| 61,909 | Ascom Holding AG (Registered) (Technology Hardware & Equipment) | 908,725 | ||||||
| 18,980 | Autoneum Holding AG (Automobiles & Components)* | 3,162,743 | ||||||
| 5,596 | Bossard Holding AG (Registered) Class A (Capital Goods)* | 567,200 | ||||||
| 3,288 | Flughafen Zuerich AG (Registered) (Transportation) | 2,095,173 | ||||||
| 505 | Forbo Holding AG (Registered) (Consumer Durables & Apparel)* | 524,079 | ||||||
| 14,239 | Helvetia Holding AG (Registered) (Insurance) | 6,770,872 | ||||||
| 7,673 | Inficon Holding AG (Registered) (Technology Hardware & Equipment)* | 2,392,454 | ||||||
| 428 | Intershop Holdings AG (Real Estate) | 157,917 | ||||||
| 3,151 | Kaba Holding AG (Registered) Class B (Commercial & Professional Services)* | 1,502,307 | ||||||
| 10,897 | Komax Holding AG (Registered) (Capital Goods)* | 1,605,633 | ||||||
|
| |||||||
| Common Stocks – (continued) | ||||||||
| Switzerland – (continued) | ||||||||
| 84,257 | Kudelski SA (Technology Hardware & Equipment) | $ | 1,074,588 | |||||
| 505,083 | Logitech International SA (Registered) (Technology Hardware & Equipment)* | 7,150,848 | ||||||
| 56,844 | Nobel Biocare Holding AG (Registered) (Health Care Equipment & Services)* | 1,006,762 | ||||||
| 45,507 | PSP Swiss Property AG (Registered) (Real Estate)* | 3,905,717 | ||||||
| 40,975 | Schweizerische National-Versicherungs-Gesellschaft (Registered) (Insurance)(a) | 3,416,972 | ||||||
| 4,103 | Siegfried Holding AG (Registered) (Pharmaceuticals, Biotechnology & Life Sciences)* | 630,654 | ||||||
| 14,624 | Straumann Holding AG (Registered) (Health Care Equipment & Services) | 3,600,506 | ||||||
| 22,938 | U-Blox AG (Semiconductors & Semiconductor Equipment)* | 3,100,857 | ||||||
| 22,660 | Zehnder Group AG (Capital Goods) | 890,869 | ||||||
|
| |||||||
| 44,464,876 | ||||||||
|
| |||||||
| United Kingdom – 17.4% | ||||||||
| 57,056 | Abcam PLC (Pharmaceuticals, Biotechnology & Life Sciences) | 364,862 | ||||||
| 57,439 | Advanced Medical Solutions Group PLC (Health Care Equipment & Services) | 108,424 | ||||||
| 22,126 | Alent PLC (Materials) | 119,636 | ||||||
| 926,028 | Amlin PLC (Insurance) | 6,758,641 | ||||||
| 55,694 | Bellway PLC (Consumer Durables & Apparel) | 1,562,279 | ||||||
| 195,548 | Berendsen PLC (Commercial & Professional Services) | 3,166,521 | ||||||
| 109,427 | Berkeley Group Holdings PLC (Consumer Durables & Apparel) | 4,001,885 | ||||||
| 83,736 | Betfair Group PLC (Consumer Services) | 1,620,825 | ||||||
| 194,837 | Big Yellow Group PLC (REIT) | 1,703,069 | ||||||
| 138,134 | Bodycote PLC (Capital Goods) | 1,382,540 | ||||||
| 53,200 | Booker Group PLC (Food & Staples Retailing) | 119,559 | ||||||
| 72,111 | Britvic PLC (Food, Beverage & Tobacco) | 786,227 | ||||||
| 1,888,973 | Cable & Wireless Communications PLC (Telecommunication Services) | 1,459,745 | ||||||
| 133,052 | Carillion PLC (Capital Goods) | 708,851 | ||||||
| 149,209 | Chesnara PLC (Insurance) | 822,286 | ||||||
| 75,043 | Computacenter PLC (Software & Services) | 742,156 | ||||||
| 68,740 | Concentric AB (Capital Goods)(a) | 841,100 | ||||||
| 12,068 | CSR PLC (Semiconductors & Semiconductor Equipment) | 162,185 | ||||||
| 7,717 | Daily Mail & General Trust PLC Class A (Media) | 97,647 | ||||||
|
| |||||||
| 46 | The accompanying notes are an integral part of these financial statements. |
GOLDMAN SACHS INTERNATIONAL SMALL CAP INSIGHTS FUND
| Shares | Description | Value | ||||||
| Common Stocks – (continued) | ||||||||
| United Kingdom – (continued) | ||||||||
| 46,845 | Dart Group PLC (Transportation) | $ | 195,856 | |||||
| 202,883 | Diploma PLC (Capital Goods) | 2,257,259 | ||||||
| 1,787,751 | DS Smith PLC (Materials) | 7,593,037 | ||||||
| 603,482 | Elementis PLC (Materials) | 2,555,835 | ||||||
| 29,968 | esure Group PLC (Insurance) | 116,834 | ||||||
| 338,364 | Fenner PLC (Capital Goods) | 1,667,145 | ||||||
| 193,044 | Galliford Try PLC (Capital Goods) | 3,778,165 | ||||||
| 1,383,678 | Globo PLC (Software & Services)*(a) | 951,792 | ||||||
| 69,413 | Go-Ahead Group PLC (Transportation) | 2,732,981 | ||||||
| 51,902 | Grainger PLC (Real Estate) | 157,283 | ||||||
| 95,170 | Great Portland Estates PLC (REIT) | 1,047,446 | ||||||
| 32,204 | Greggs PLC (Food & Staples Retailing) | 312,372 | ||||||
| 603,891 | Halfords Group PLC (Retailing) | 4,793,851 | ||||||
| 1,308,094 | Hansteen Holdings PLC (REIT) | 2,213,328 | ||||||
| 1,006,620 | Henderson Group PLC (Diversified Financials) | 3,389,979 | ||||||
| 278,200 | Hikma Pharmaceuticals PLC (Pharmaceuticals, Biotechnology & Life Sciences) | 8,437,942 | ||||||
| 1,922,932 | Home Retail Group PLC (Retailing) | 5,642,922 | ||||||
| 100,056 | Homeserve PLC (Commercial & Professional Services) | 552,827 | ||||||
| 72,304 | Hunting PLC (Energy) | 851,674 | ||||||
| 490,426 | IG Group Holdings PLC (Diversified Financials) | 4,726,458 | ||||||
| 29,445 | Inchcape PLC (Retailing) | 328,027 | ||||||
| 642,574 | Intermediate Capital Group PLC (Diversified Financials) | 4,224,084 | ||||||
| 268,276 | Interserve PLC (Capital Goods) | 2,723,730 | ||||||
| 427,078 | Jazztel PLC (Telecommunication Services)* | 6,827,945 | ||||||
| 52,735 | JD Wetherspoon PLC (Consumer Services) | 712,979 | ||||||
| 127,353 | Keller Group PLC (Capital Goods) | 1,701,644 | ||||||
| 354,177 | Lancashire Holdings Ltd. (Insurance) | 3,796,358 | ||||||
| 334,136 | Londonmetric Property PLC (REIT) | 787,879 | ||||||
| 145,804 | Lookers PLC (Retailing) | 323,624 | ||||||
| 2,485,373 | Man Group PLC (Diversified Financials) | 4,927,936 | ||||||
| 249,866 | Marston’s PLC (Consumer Services) | 602,764 | ||||||
| 228,434 | Micro Focus International PLC (Software & Services) | 3,639,237 | ||||||
| 38,675 | Mitchells & Butlers PLC (Consumer Services)* | 235,406 | ||||||
| 22,787 | Mitie Group PLC (Commercial & Professional Services) | 109,942 | ||||||
| 475,053 | Moneysupermarket.com Group PLC (Software & Services) | 1,526,096 | ||||||
| 13,785 | Morgan Sindall Group PLC (Capital Goods) | 151,736 | ||||||
| 140,098 | Northgate PLC (Transportation) | 1,099,001 | ||||||
| 368,361 | Pace PLC (Technology Hardware & Equipment) | 2,047,880 | ||||||
| 597,512 | Pennon Group PLC (Utilities) | 7,973,390 | ||||||
|
| |||||||
| Common Stocks – (continued) | ||||||||
| United Kingdom – (continued) | ||||||||
| 361,378 | Premier Oil PLC (Energy) | $ | 1,492,234 | |||||
| 1,048,764 | QinetiQ Group PLC (Capital Goods) | 3,399,148 | ||||||
| 817,672 | Redefine International PLC (REIT) | 677,559 | ||||||
| 25,274 | RPC Group PLC (Materials) | 220,748 | ||||||
| 133,315 | Safestore Holdings PLC (REIT) | 443,589 | ||||||
| 28,661 | Savills PLC (Real Estate) | 295,268 | ||||||
| 61,541 | Shanks Group PLC (Commercial & Professional Services) | 95,853 | ||||||
| 209,501 | Soco International PLC (Energy)* | 1,103,378 | ||||||
| 768,414 | Speedy Hire PLC (Capital Goods) | 762,124 | ||||||
| 349,160 | Spirit Pub Co. PLC (Consumer Services) | 593,461 | ||||||
| 50,422 | Stagecoach Group PLC (Transportation) | 312,535 | ||||||
| 184,266 | Stobart Group Ltd. (Transportation) | 292,560 | ||||||
| 54,941 | SVG Capital PLC (Diversified Financials)* | 375,286 | ||||||
| 6,683 | Synergy Health PLC (Health Care Equipment & Services) | 199,896 | ||||||
| 73,643 | The Paragon Group of Cos. PLC (Banks) | 426,572 | ||||||
| 39,703 | The Restaurant Group PLC (Consumer Services) | 430,161 | ||||||
| 146,626 | Trinity Mirror PLC (Media)* | 384,674 | ||||||
| 309,732 | TT electronics PLC (Technology Hardware & Equipment) | 830,495 | ||||||
| 13,698 | Vesuvius PLC (Capital Goods) | 93,522 | ||||||
| 105,891 | Victrex PLC (Materials) | 2,876,408 | ||||||
| 288,444 | WH Smith PLC (Retailing) | 5,207,793 | ||||||
| 49,682 | Workspace Group PLC (REIT) | 523,043 | ||||||
| 123,626 | WS Atkins PLC (Commercial & Professional Services) | 2,687,760 | ||||||
| 97,989 | Xchanging PLC (Software & Services) | 297,105 | ||||||
|
| |||||||
| 148,264,254 | ||||||||
|
| |||||||
| TOTAL COMMON STOCKS | ||||||||
| (Cost $835,565,788) | $ | 857,324,117 | ||||||
|
| |||||||
| Preferred Stocks – 0.3% | ||||||||
| Germany – 0.2% | ||||||||
| 10,210 | Biotest AG (Pharmaceuticals, Biotechnology & Life Sciences) | $ | 1,032,785 | |||||
| 23,846 | Sixt SE (Transportation) | 666,630 | ||||||
|
| |||||||
| 1,699,415 | ||||||||
|
| |||||||
| Italy – 0.1% | ||||||||
| 223,745 | Unipol Gruppo Finanziario SpA (Insurance) | 996,962 | ||||||
|
| |||||||
| TOTAL PREFERRED STOCKS | ||||||||
| (Cost $2,670,323) | $ | 2,696,377 | ||||||
|
| |||||||
| The accompanying notes are an integral part of these financial statements. | 47 |
GOLDMAN SACHS INTERNATIONAL SMALL CAP INSIGHTS FUND
Schedule of Investments (continued)
October 31, 2014
| Units | Description | Expiration Month | Value | |||||||
| Right – 0.0% | ||||||||||
| Portugal – 0.0% | ||||||||||
| 193,770 | Mota-Engil SGPS SA (Capital Goods)* | 11/14 | $ | — | ||||||
| (Cost $0) | ||||||||||
| ||||||||||
| TOTAL INVESTMENTS BEFORE SECURITIES LENDING REINVESTMENT VEHICLE | ||||||||||
| (Cost $838,236,111) | $ | 860,020,494 | ||||||||
| ||||||||||
| Shares | Distribution Rate | Value | ||||||
| Securities Lending Reinvestment Vehicle(c)(d) – 6.2% | ||||||||
Goldman Sachs Financial Square Money Market Fund – FST Shares |
| |||||||
| 52,882,281 | 0.063 | % | $ | 52,882,281 | ||||
| (Cost $52,882,281) | ||||||||
| ||||||||
| TOTAL INVESTMENTS – 107.2% | ||||||||
| (Cost $891,118,392) | $ | 912,902,775 | ||||||
| ||||||||
| LIABILITIES IN EXCESS OF OTHER ASSETS – (7.2)% | (61,305,796 | ) | ||||||
| ||||||||
| NET ASSETS – 100.0% | $ | 851,596,979 | ||||||
| ||||||||
| The percentage shown for each investment category reflects the value of investments in that category as a percentage of net assets. | ||
* | Non-income producing security. | |
(a) | All or a portion of security is on loan. | |
(b) | Exempt from registration under Rule 144A of the Securities Act of 1933. Under procedures approved by the Board of Trustees, such securities have been determined to be liquid by the Investment Adviser and may be resold, normally to qualified institutional buyers in transactions exempt from registration. Total market value of Rule 144A securities amounts to $1,237,352, which represents approximately 0.1% of net assets as of October 31, 2014. | |
(c) | Variable rate security. Interest rate or distribution rate disclosed is that which is in effect at October 31, 2014. | |
(d) | Represents an affiliated issuer. | |
| ||
Investment Abbreviations: | ||
CVA | —Dutch Certification | |
REIT | —Real Estate Investment Trust | |
| ||
| 48 | The accompanying notes are an integral part of these financial statements. |
GOLDMAN SACHS INTERNATIONAL SMALL CAP INSIGHTS FUND
| ADDITIONAL INVESTMENT INFORMATION |
FUTURES CONTRACTS — At October 31, 2014, the Fund had the following futures contracts:
| Type | Number of Contracts Long (Short) | Expiration Date | Current Value | Unrealized Gain (Loss) | ||||||||||
EURO STOXX 50 Index | (40 | ) | December 2014 | $ | (1,554,407 | ) | $ | (34,660 | ) | |||||
FTSE 100 Index | (8 | ) | December 2014 | (832,548 | ) | (6,288 | ) | |||||||
Hang Seng Index | (1 | ) | November 2014 | (154,368 | ) | (745 | ) | |||||||
MSCI Singapore Index | (2 | ) | November 2014 | (115,046 | ) | (2,065 | ) | |||||||
SPI 200 Index | (3 | ) | December 2014 | (364,188 | ) | (4,299 | ) | |||||||
TSE TOPIX Index | (8 | ) | December 2014 | (952,237 | ) | (40,979 | ) | |||||||
| TOTAL | $ | (89,036 | ) | |||||||||||
| The accompanying notes are an integral part of these financial statements. | 49 |
GOLDMAN SACHS INTERNATIONAL EQUITY INSIGHTS FUNDS
Statements of Assets and Liabilities
October 31, 2014
Emerging Markets Fund | International Equity Insights Fund | International Small Cap Insights | ||||||||||||
| Assets: | ||||||||||||||
Investments in unaffiliated issuers, at value (cost $667,603,781, $809,456,743 and $838,236,111)(a) | $ | 702,457,665 | $ | 807,044,923 | $ | 860,020,494 | ||||||||
Investments in affiliated securities lending reinvestment vehicle, at value which equals cost | 10,631,042 | 10,729,897 | 52,882,281 | |||||||||||
Cash | — | 8,296,496 | 1,052,598 | |||||||||||
Foreign currencies, at value (cost $849,069, $11,440,465 and $368,461) | 849,178 | 11,332,948 | 340,501 | |||||||||||
Receivables: | ||||||||||||||
Investments sold | 31,948,371 | 53,471 | 15,071,452 | |||||||||||
Fund shares sold | 2,078,308 | 49,988 | 6,983,620 | |||||||||||
Dividends | 511,467 | 1,913,681 | 2,339,284 | |||||||||||
Reimbursement from investment adviser | 347,013 | 93,906 | 211,138 | |||||||||||
Foreign tax reclaims | 924 | 813,742 | 193,528 | |||||||||||
Securities lending income | 859 | 122,183 | 78,147 | |||||||||||
Variation margin on certain derivative contracts | — | 383,083 | — | |||||||||||
Collateral on certain derivative contracts(b) | — | — | 219,397 | |||||||||||
Due from custodian | — | — | 491,640 | |||||||||||
Other assets | 3,986 | 60,081 | 3,821 | |||||||||||
| Total assets | 748,828,813 | 840,894,399 | 939,887,901 | |||||||||||
| Liabilities: | ||||||||||||||
Due to custodian | 2,281,952 | — | 1,329,418 | |||||||||||
Payables: | ||||||||||||||
Investments purchased | 23,883,358 | — | 20,890,195 | |||||||||||
Payable upon return of securities loaned | 10,631,042 | 10,729,897 | 52,882,281 | |||||||||||
Fund shares redeemed | 8,738,027 | 652,732 | 12,165,916 | |||||||||||
Management fees | 624,395 | 585,704 | 624,046 | |||||||||||
Foreign capital gains taxes | 574,567 | — | — | |||||||||||
Distribution and Service fees and Transfer Agent fees | 38,402 | 60,874 | 97,474 | |||||||||||
Variation margin on certain derivative contracts | — | — | 103,463 | |||||||||||
Accrued expenses | 413,417 | 159,434 | 198,129 | |||||||||||
| Total liabilities | 47,185,160 | 12,188,641 | 88,290,922 | |||||||||||
| Net Assets: | ||||||||||||||
Paid-in capital | 658,614,368 | 2,143,964,524 | 814,183,013 | |||||||||||
Undistributed net investment income | 8,882,360 | 26,253,164 | 9,249,798 | |||||||||||
Accumulated net realized gain (loss) | (92,227 | ) | (1,338,990,960 | ) | 6,433,476 | |||||||||
Net unrealized gain (loss) | 34,239,152 | (2,520,970 | ) | 21,730,692 | ||||||||||
| NET ASSETS | $ | 701,643,653 | $ | 828,705,758 | $ | 851,596,979 | ||||||||
Net Assets: | ||||||||||||||
Class A | $ | 37,904,691 | $ | 79,213,685 | $ | 144,558,248 | ||||||||
Class B | — | 1,204,821 | — | |||||||||||
Class C | 943,690 | 3,053,806 | 19,158,137 | |||||||||||
Institutional | 660,921,908 | 742,015,720 | 668,746,385 | |||||||||||
Service | — | 2,779,231 | — | |||||||||||
Class IR | 875,018 | 277,795 | 19,134,209 | |||||||||||
Class R | 998,346 | (c) | 160,700 | — | ||||||||||
Total Net Assets | $ | 701,643,653 | $ | 828,705,758 | $ | 851,596,979 | ||||||||
Shares outstanding $0.001 par value (unlimited shares authorized): | ||||||||||||||
Class A | 4,218,192 | 7,408,998 | 14,410,354 | |||||||||||
Class B | — | 113,962 | — | |||||||||||
Class C | 106,306 | 290,602 | 1,962,618 | |||||||||||
Institutional | 73,587,648 | 67,617,675 | 66,564,941 | |||||||||||
Service | — | 258,379 | — | |||||||||||
Class IR | 97,599 | 26,372 | 1,911,364 | |||||||||||
Class R | 111,624 | (c) | 15,281 | — | ||||||||||
Net asset value, offering and redemption price per share:(d) | ||||||||||||||
Class A | $8.99 | $10.69 | $10.03 | |||||||||||
Class B | — | 10.57 | — | |||||||||||
Class C | 8.88 | 10.51 | 9.76 | |||||||||||
Institutional | 8.98 | 10.97 | 10.05 | |||||||||||
Service | — | 10.76 | — | |||||||||||
Class IR | 8.97 | 10.53 | 10.01 | |||||||||||
Class R | 8.94 | 10.52 | — | |||||||||||
| (a) | Includes loaned securities having a market value of $10,414,528, $10,211,415 and $50,495,645 for the Emerging Markets Equity Insights, International Equity Insights and International Small Cap Insights Funds, respectively. |
| (b) | Segregated for initial margin on futures transactions for the International Small Cap Insights Fund. |
| (c) | Commenced operations on February 28, 2014. |
| (d) | Maximum public offering price per share for Class A shares of the Emerging Markets Equity Insights, International Equity Insights and International Small Cap Insights Funds is $9.51, $11.31 and $10.61, respectively. At redemption, Class B and Class C Shares may be subject to a contingent deferred sales charge assessed on the amount equal to the lesser of the current NAV or the original purchase price of the shares. |
| 50 | The accompanying notes are an integral part of these financial statements. |
GOLDMAN SACHS INTERNATIONAL EQUITY INSIGHTS FUNDS
Statements of Operations
For the Fiscal Year Ended October 31, 2014
| Emerging Markets Equity Insights Fund | International Equity Insights Fund | International Small Cap Insights | ||||||||||||
| Investment income: | ||||||||||||||
Dividends (net of foreign taxes withheld of $2,353,138, $2,771,414 and $1,767,930) | $ | 20,585,374 | $ | 42,961,748 | $ | 19,050,716 | ||||||||
Securities lending income — affiliated issuer | 229,521 | 982,508 | 821,375 | |||||||||||
| Total investment income | 20,814,895 | 43,944,256 | 19,872,091 | |||||||||||
| Expenses: | ||||||||||||||
Management fees | 6,646,145 | 8,063,145 | 6,577,416 | |||||||||||
Custody, accounting and administrative services | 1,171,201 | 314,212 | 415,722 | |||||||||||
Transfer Agent fees(a) | 316,920 | 518,889 | 537,171 | |||||||||||
Professional fees | 148,463 | 137,078 | 126,616 | |||||||||||
Distribution and Service fees(a) | 89,832 | 268,345 | 429,006 | |||||||||||
Registration fees | 49,185 | 51,802 | 85,941 | |||||||||||
Printing and mailing costs | 36,090 | 60,360 | 96,322 | |||||||||||
Trustee fees | 25,148 | 26,163 | 25,546 | |||||||||||
Service share fees — Service Plan | — | 10,748 | — | |||||||||||
Service share fees — Shareholder Administration Plan | — | 10,748 | — | |||||||||||
Other | 61,721 | 34,551 | 34,206 | |||||||||||
| Total expenses | 8,544,705 | 9,496,041 | 8,327,946 | |||||||||||
Less — expense reductions | (529,585 | ) | (579,445 | ) | (672,110 | ) | ||||||||
| Net expenses | 8,015,120 | 8,916,596 | 7,655,836 | |||||||||||
| NET INVESTMENT INCOME | 12,799,775 | 35,027,660 | 12,216,255 | |||||||||||
| Realized and unrealized gain (loss): | ||||||||||||||
Net realized gain (loss) from: | ||||||||||||||
Investments | 22,096,598 | 80,767,163 | 12,520,065 | |||||||||||
Futures contracts | — | 4,384,742 | (3,306 | ) | ||||||||||
Foreign currency transactions | (1,573,637 | ) | (1,982,441 | ) | (1,501,608 | ) | ||||||||
Net change in unrealized gain (loss) on: | ||||||||||||||
Investments (including the effects of the net change in the foreign capital gains tax liability of $630,973, $0 and $0) | (21,084,048 | ) | (109,755,212 | ) | (56,473,191 | ) | ||||||||
Futures contracts | — | (857,833 | ) | (499,939 | ) | |||||||||
Foreign currency translation | 295,725 | (180,881 | ) | (52,336 | ) | |||||||||
| Net realized and unrealized loss | (265,362 | ) | (27,624,462 | ) | (46,010,315 | ) | ||||||||
| NET INCREASE (DECREASE) IN NET ASSETS RESULTING FROM OPERATIONS | $ | 12,534,413 | $ | 7,403,198 | $ | (33,794,060 | ) | |||||||
| (a) | Class specific Distribution and Service, and Transfer Agent fees were as follows: |
| Distribution and Service Fees | Transfer Agent Fees | |||||||||||||||||||||||||||||||||||||||||||
Fund | Class A | Class B | Class C | Class R | Class A | Class B | Class C | Institutional | Service | Class IR | Class R | |||||||||||||||||||||||||||||||||
Emerging Markets Equity Insights | $ | 79,367 | $ | — | $ | 9,532 | $ | 933 | (b) | $ | 60,320 | $ | — | $ | 1,811 | $ | 252,228 | $ | — | $ | 2,207 | $ | 354 | (b) | ||||||||||||||||||||
International Equity Insights | 218,908 | 15,926 | 32,475 | 1,036 | 166,371 | 3,026 | 6,170 | 340,802 | 1,720 | 800 | — | |||||||||||||||||||||||||||||||||
International Small Cap Insights | 309,591 | — | 119,415 | — | 235,290 | — | 22,689 | 248,822 | — | 30,370 | — | |||||||||||||||||||||||||||||||||
| (b) | Commenced operations on February 28, 2014. |
| The accompanying notes are an integral part of these financial statements. | 51 |
GOLDMAN SACHS INTERNATIONAL EQUITY INSIGHTS FUNDS
Statements of Changes in Net Assets
| Emerging Markets Equity Insights Fund | International Equity Insights Fund | |||||||||||||||||
| For the Fiscal Year Ended October 31, 2014 | For the Fiscal Year Ended October 31, 2013 | For the Fiscal Year Ended October 31, 2014 | For the Fiscal Year Ended October 31, 2013 | |||||||||||||||
| From operations: | ||||||||||||||||||
Net investment income | $ | 12,799,775 | $ | 10,674,666 | $ | 35,027,660 | $ | 27,398,632 | ||||||||||
Net realized gain | 20,522,961 | 7,093,221 | 83,169,464 | 127,734,924 | ||||||||||||||
Net change in unrealized gain (loss) | (20,788,323 | ) | 18,827,037 | (110,793,926 | ) | 70,192,523 | ||||||||||||
| Net increase (decrease) in net assets resulting from operations | 12,534,413 | 36,594,924 | 7,403,198 | 225,326,079 | ||||||||||||||
| Distributions to shareholders: | ||||||||||||||||||
From net investment income | ||||||||||||||||||
Class A Shares | (223,899 | ) | (646,730 | ) | (2,365,617 | ) | (6,802,694 | ) | ||||||||||
Class B Shares | — | — | (33,551 | ) | (64,323 | ) | ||||||||||||
Class C Shares | (9,186 | ) | (1,269 | ) | (69,048 | ) | (73,960 | ) | ||||||||||
Institutional Shares | (7,745,349 | ) | (7,459,492 | ) | (28,809,684 | ) | (21,631,288 | ) | ||||||||||
Service Shares | — | — | (158,000 | ) | (268,276 | ) | ||||||||||||
Class IR Shares | (21,586 | ) | (1,842 | ) | (12,760 | ) | (4,577 | ) | ||||||||||
Class R | — | (a) | — | (3,366 | ) | (2,185 | ) | |||||||||||
From net realized gains | ||||||||||||||||||
Class A Shares | — | — | — | — | ||||||||||||||
Class B Shares | — | — | — | — | ||||||||||||||
Class C Shares | — | — | — | — | ||||||||||||||
Institutional Shares | — | — | — | — | ||||||||||||||
Service Shares | — | — | — | — | ||||||||||||||
Class IR Shares | — | — | — | — | ||||||||||||||
Class R Shares | — | (a) | — | — | — | |||||||||||||
| Total distributions to shareholders | (8,000,020 | ) | (8,109,333 | ) | (31,452,026 | ) | (28,847,303 | ) | ||||||||||
| From share transactions: | ||||||||||||||||||
Proceeds from sales of shares | 294,676,544 | 368,051,067 | 130,617,325 | 379,701,366 | ||||||||||||||
Reinvestment of distributions | 7,753,915 | 8,086,923 | 31,175,399 | 28,534,242 | ||||||||||||||
Cost of shares redeemed | (189,151,733 | ) | (336,079,347 | ) | (359,418,669 | ) | (375,686,850 | ) | ||||||||||
| Net increase (decrease) in net assets resulting from share transactions | 113,278,726 | 40,058,643 | (197,625,945 | ) | 32,548,758 | |||||||||||||
| TOTAL INCREASE (DECREASE) | 117,813,119 | 68,544,234 | (221,674,773 | ) | 229,027,534 | |||||||||||||
| Net assets: | ||||||||||||||||||
Beginning of year | 583,830,534 | 515,286,300 | 1,050,380,531 | 821,352,997 | ||||||||||||||
End of year | $ | 701,643,653 | $ | 583,830,534 | $ | 828,705,758 | $ | 1,050,380,531 | ||||||||||
| Undistributed net investment income | $ | 8,882,360 | $ | 5,388,814 | $ | 26,253,164 | $ | 21,983,346 | ||||||||||
| (a) | Commenced operations on February 28, 2014. |
| 52 | The accompanying notes are an integral part of these financial statements. |
GOLDMAN SACHS INTERNATIONAL EQUITY INSIGHTS FUNDS
| International Small Cap Insights Fund | ||||||||||
| For the Fiscal Year Ended October 31, 2014 | For the Fiscal Year Ended October 31, 2013 | |||||||||
| From operations: | ||||||||||
Net investment income | $ | 12,216,255 | $ | 9,321,525 | ||||||
Net realized gain | 11,015,151 | 40,015,452 | ||||||||
Net change in unrealized gain (loss) | (57,025,466 | ) | 55,173,555 | |||||||
| Net increase (decrease) in net assets resulting from operations | (33,794,060 | ) | 104,510,532 | |||||||
| Distributions to shareholders: | ||||||||||
From net investment income | ||||||||||
Class A Shares | (1,904,636 | ) | (812,215 | ) | ||||||
Class B Shares | — | — | ||||||||
Class C Shares | (136,885 | ) | (34,519 | ) | ||||||
Institutional Shares | (14,879,493 | ) | (10,634,235 | ) | ||||||
Service Shares | — | — | ||||||||
Class IR Shares | (148,164 | ) | (17,900 | ) | ||||||
Class R Shares | — | — | ||||||||
From net realized gains | ||||||||||
Class A Shares | (413,382 | ) | — | |||||||
Class B Shares | — | — | ||||||||
Class C Shares | (32,138 | ) | — | |||||||
Institutional Shares | (3,027,072 | ) | — | |||||||
Service Shares | — | — | ||||||||
Class IR Shares | (30,480 | ) | — | |||||||
Class R Shares | — | — | ||||||||
| Total distributions to shareholders | (20,572,250 | ) | (11,498,869 | ) | ||||||
| From share transactions: | ||||||||||
Proceeds from sales of shares | 653,580,757 | 247,421,409 | ||||||||
Reinvestment of distributions | 18,076,085 | 10,415,151 | ||||||||
Cost of shares redeemed | (268,341,118 | ) | (112,490,991 | ) | ||||||
| Net increase in net assets resulting from share transactions | 403,315,724 | 145,345,569 | ||||||||
| TOTAL INCREASE | 348,949,414 | 238,357,232 | ||||||||
| Net assets: | ||||||||||
Beginning of year | 502,647,565 | 264,290,333 | ||||||||
End of year | $ | 851,596,979 | $ | 502,647,565 | ||||||
| Undistributed (distributions in excess of) net investment income | $ | 9,249,798 | $ | 10,407,412 | ||||||
| The accompanying notes are an integral part of these financial statements. | 53 |
GOLDMAN SACHS EMERGING MARKETS EQUITY INSIGHTS FUND
Selected Data for a Share Outstanding Throughout Each Year
| Income (loss) from investment operations | ||||||||||||||||||||||
| Year - Share Class | Net asset value, beginning of year | Net investment income(a) | Net realized and unrealized gain (loss) | Total from investment operations | Distributions to shareholders from net | |||||||||||||||||
| FOR THE FISCAL YEARS ENDED OCTOBER 31, | ||||||||||||||||||||||
2014 - A | $ | 8.95 | $ | 0.14 | $ | (0.02 | ) | $ | 0.12 | $ | (0.08 | ) | ||||||||||
2014 - C | 8.90 | 0.07 | (0.01 | ) | 0.06 | (0.08 | ) | |||||||||||||||
2014 - Institutional | 8.95 | 0.17 | (0.02 | ) | 0.15 | (0.12 | ) | |||||||||||||||
2014 - IR | 8.94 | 0.13 | 0.02 | 0.15 | (0.12 | ) | ||||||||||||||||
2014 - R (Commenced February 28, 2014) | 8.26 | 0.02 | 0.66 | 0.68 | — | |||||||||||||||||
2013 - A | 8.40 | 0.07 | 0.60 | 0.67 | (0.12 | ) | ||||||||||||||||
2013 - C | 8.36 | 0.04 | 0.55 | 0.59 | (0.05 | ) | ||||||||||||||||
2013 - Institutional | 8.40 | 0.16 | 0.53 | 0.69 | (0.14 | ) | ||||||||||||||||
2013 - IR | 8.39 | 0.14 | 0.54 | 0.68 | (0.13 | ) | ||||||||||||||||
2012 - A | 8.08 | 0.13 | 0.28 | 0.41 | (0.09 | ) | ||||||||||||||||
2012 - C | 8.00 | 0.08 | 0.28 | 0.36 | — | |||||||||||||||||
2012 - Institutional | 8.12 | 0.16 | 0.28 | 0.44 | (0.16 | ) | ||||||||||||||||
2012 - IR | 8.11 | 0.25 | 0.18 | 0.43 | (0.15 | ) | ||||||||||||||||
2011 - A | 8.91 | 0.11 | (0.87 | ) | (0.76 | ) | (0.07 | ) | ||||||||||||||
2011 - C | 8.82 | — | (e) | (0.81 | ) | (0.81 | ) | (0.01 | ) | |||||||||||||
2011 - Institutional | 8.96 | 0.16 | (0.88 | ) | (0.72 | ) | (0.12 | ) | ||||||||||||||
2011 - IR | 8.98 | 0.15 | (0.90 | ) | (0.75 | ) | (0.12 | ) | ||||||||||||||
2010 - A | 7.14 | 0.08 | 1.76 | 1.84 | (0.07 | ) | ||||||||||||||||
2010 - C | 7.11 | — | (e) | 1.77 | 1.77 | (0.06 | ) | |||||||||||||||
2010 - Institutional | 7.17 | 0.10 | 1.79 | 1.89 | (0.10 | ) | ||||||||||||||||
2010 - IR (Commenced August 31, 2010) | 7.67 | 0.01 | 1.30 | 1.31 | — | |||||||||||||||||
| (a) | Calculated based on the average shares outstanding methodology. |
| (b) | Assumes investment at the net asset value at the beginning of the year, reinvestment of all distributions, a complete redemption of the investment at the net asset value at the end of the year and no sales or redemption charges. Total returns would be reduced if a sales or redemption charge was taken into account. Returns do not reflect the deduction of taxes that a shareholder would pay on Fund distributions or the redemption of Fund shares. Total returns for periods less than one full year are not annualized. |
| (c) | The Fund's portfolio turnover rate is calculated in accordance with regulatory requirements, without regard to transactions involving short term investments and certain derivatives. If such transactions were included, the Fund's portfolio turnover rate may be higher. |
| (d) | Annualized. |
| (e) | Amount is less than $0.005 per share. |
| 54 | The accompanying notes are an integral part of these financial statements. |
GOLDMAN SACHS EMERGING MARKETS EQUITY INSIGHTS FUND
| Net asset value, end of year | Total return(b) | Net assets, year (in 000s) | Ratio of net expenses to average net assets | Ratio of total expenses to average net assets | Ratio of net assets | Portfolio turnover rate(c) | ||||||||||||||||||||||||||||||||||
| $ | 8.99 | 1.38 | % | $ | 37,905 | 1.58 | % | 1.66 | % | 1.59 | % | 180 | % | |||||||||||||||||||||||||||
| 8.88 | 0.66 | 944 | 2.33 | 2.41 | 0.80 | 180 | ||||||||||||||||||||||||||||||||||
| 8.98 | 1.65 | 660,922 | 1.18 | 1.26 | 1.95 | 180 | ||||||||||||||||||||||||||||||||||
| 8.97 | 1.70 | 875 | 1.34 | 1.39 | 1.47 | 180 | ||||||||||||||||||||||||||||||||||
| 8.94 | 8.23 | 998 | 1.82 | (d) | 2.07 | (d) | 0.31 | (d) | 180 | |||||||||||||||||||||||||||||||
| 8.95 | 8.00 | 24,758 | 1.52 | 1.65 | 0.82 | 249 | ||||||||||||||||||||||||||||||||||
| 8.90 | 7.02 | 989 | 2.31 | 2.48 | 0.51 | 249 | ||||||||||||||||||||||||||||||||||
| 8.95 | 8.41 | 556,434 | 1.14 | 1.27 | 1.87 | 249 | ||||||||||||||||||||||||||||||||||
| 8.94 | 8.16 | 1,649 | 1.32 | 1.50 | 1.59 | 249 | ||||||||||||||||||||||||||||||||||
| 8.40 | 5.26 | 50,760 | 1.45 | 1.69 | 1.58 | 180 | ||||||||||||||||||||||||||||||||||
| 8.36 | 4.49 | 228 | 2.20 | 2.46 | 0.97 | 180 | ||||||||||||||||||||||||||||||||||
| 8.40 | 5.68 | 464,180 | 1.05 | 1.30 | 1.98 | 180 | ||||||||||||||||||||||||||||||||||
| 8.39 | 5.48 | 118 | 1.20 | 1.41 | 3.06 | 180 | ||||||||||||||||||||||||||||||||||
| 8.08 | (8.58 | ) | 17,089 | 1.45 | 1.71 | 1.17 | 200 | |||||||||||||||||||||||||||||||||
| 8.00 | (9.23 | ) | 207 | 2.20 | 2.46 | 0.01 | 200 | |||||||||||||||||||||||||||||||||
| 8.12 | (8.19 | ) | 273,027 | 1.05 | 1.31 | 1.75 | 200 | |||||||||||||||||||||||||||||||||
| 8.11 | (8.54 | ) | 1 | 1.20 | 1.46 | 1.67 | 200 | |||||||||||||||||||||||||||||||||
| 8.91 | 25.91 | 52,030 | 1.45 | 1.70 | 0.99 | 214 | ||||||||||||||||||||||||||||||||||
| 8.82 | 25.07 | 1,282 | 2.20 | 2.45 | 0.04 | 214 | ||||||||||||||||||||||||||||||||||
| 8.96 | 26.56 | 364,053 | 1.05 | 1.30 | 1.25 | 214 | ||||||||||||||||||||||||||||||||||
| 8.98 | 17.08 | 1 | 1.20 | (d) | 1.45 | (d) | 0.51 | (d) | 214 | |||||||||||||||||||||||||||||||
| The accompanying notes are an integral part of these financial statements. | 55 |
GOLDMAN SACHS INTERNATIONAL EQUITY INSIGHTS FUND
Financial Highlights
Selected Data for a Share Outstanding Throughout Each Year
| Income (loss) from investment operations | ||||||||||||||||||||||
| Year - Share Class | Net asset value, beginning of year | Net investment income(a) | Net realized and unrealized gain (loss) | Total from investment operations | Distributions to shareholders from net | |||||||||||||||||
| FOR THE FISCAL YEARS ENDED OCTOBER 31, | ||||||||||||||||||||||
2014 - A | $ | 10.99 | $ | 0.37 | (d) | $ | (0.39 | ) | $ | (0.02 | ) | $ | (0.28 | ) | ||||||||
2014 - B | 10.86 | 0.28 | (d) | (0.37 | ) | (0.09 | ) | (0.20 | ) | |||||||||||||
2014 - C | 10.83 | 0.28 | (d) | (0.37 | ) | (0.09 | ) | (0.23 | ) | |||||||||||||
2014 - Institutional | 11.29 | 0.42 | (d) | (0.40 | ) | 0.02 | (0.34 | ) | ||||||||||||||
2014 - Service | 11.06 | 0.35 | (d) | (0.37 | ) | (0.02 | ) | (0.28 | ) | |||||||||||||
2014 - IR | 10.86 | 0.38 | (d) | (0.38 | ) | — | (e) | (0.33 | ) | |||||||||||||
2014 - R | 10.85 | 0.34 | (d) | (0.38 | ) | (0.04 | ) | (0.29 | ) | |||||||||||||
2013 - A | 9.00 | 0.19 | 2.11 | 2.30 | (0.31 | ) | ||||||||||||||||
2013 - B | 8.89 | 0.16 | 2.04 | 2.20 | (0.23 | ) | ||||||||||||||||
2013 - C | 8.87 | 0.16 | 2.04 | 2.20 | (0.24 | ) | ||||||||||||||||
2013 - Institutional | 9.25 | 0.30 | 2.09 | 2.39 | (0.35 | ) | ||||||||||||||||
2013 - Service | 9.06 | 0.22 | 2.08 | 2.30 | (0.30 | ) | ||||||||||||||||
2013 - IR | 8.91 | 0.22 | 2.08 | 2.30 | (0.35 | ) | ||||||||||||||||
2013 - R | 8.88 | 0.21 | 2.04 | 2.25 | (0.28 | ) | ||||||||||||||||
2012 - A | 9.02 | 0.19 | 0.21 | 0.40 | (0.42 | ) | ||||||||||||||||
2012 - B | 8.89 | 0.13 | 0.20 | 0.33 | (0.33 | ) | ||||||||||||||||
2012 - C | 8.89 | 0.13 | 0.20 | 0.33 | (0.35 | ) | ||||||||||||||||
2012 - Institutional | 9.27 | 0.24 | 0.21 | 0.45 | (0.47 | ) | ||||||||||||||||
2012 - Service | 9.08 | 0.18 | 0.21 | 0.39 | (0.41 | ) | ||||||||||||||||
2012 - IR | 8.97 | 0.20 | 0.21 | 0.41 | (0.47 | ) | ||||||||||||||||
2012 - R | 8.93 | 0.17 | 0.20 | 0.37 | (0.42 | ) | ||||||||||||||||
2011 - A | 10.21 | 0.28 | (1.26 | ) | (0.98 | ) | (0.21 | ) | ||||||||||||||
2011 - B | 10.06 | 0.19 | (1.23 | ) | (1.04 | ) | (0.13 | ) | ||||||||||||||
2011 - C | 10.06 | 0.19 | (1.23 | ) | (1.04 | ) | (0.13 | ) | ||||||||||||||
2011 - Institutional | 10.49 | 0.33 | (1.30 | ) | (0.97 | ) | (0.25 | ) | ||||||||||||||
2011 - Service | 10.27 | 0.27 | (1.27 | ) | (1.00 | ) | (0.19 | ) | ||||||||||||||
2011 - IR | 10.15 | 0.23 | (1.18 | ) | (0.95 | ) | (0.23 | ) | ||||||||||||||
2011 - R | 10.12 | 0.19 | (1.18 | ) | (0.99 | ) | (0.20 | ) | ||||||||||||||
2010 - A | 9.61 | 0.18 | 0.63 | 0.81 | (0.21 | ) | ||||||||||||||||
2010 - B | 9.47 | 0.11 | 0.62 | 0.73 | (0.14 | ) | ||||||||||||||||
2010 - C | 9.47 | 0.10 | 0.63 | 0.73 | (0.14 | ) | ||||||||||||||||
2010 - Institutional | 9.86 | 0.22 | 0.66 | 0.88 | (0.25 | ) | ||||||||||||||||
2010 - Service | 9.67 | 0.16 | 0.65 | 0.81 | (0.21 | ) | ||||||||||||||||
2010 - IR | 9.56 | 0.20 | 0.63 | 0.83 | (0.24 | ) | ||||||||||||||||
2010 - R | 9.55 | 0.15 | 0.63 | 0.78 | (0.21 | ) | ||||||||||||||||
| (a) | Calculated based on the average shares outstanding methodology. |
| (b) | Assumes investment at the net asset value at the beginning of the year, reinvestment of all distributions, a complete redemption of the investment at the net asset value at the end of the year and no sales or redemption charges. Total returns would be reduced if a sales or redemption charge was taken into account. Returns do not reflect the deduction of taxes that a shareholder would pay on Fund distributions or the redemption of Fund shares. |
| (c) | The Fund's portfolio turnover rate is calculated in accordance with regulatory requirements, without regard to transactions involving short term investments and certain derivatives. If such transactions were included, the Fund's portfolio turnover rate may be higher. |
| (d) | Reflects income recognized from a corporate action which amounted to $0.13 per share and 1.18% of average net assets. |
| (e) | Amount is less than $0.005 per share. |
| 56 | The accompanying notes are an integral part of these financial statements. |
GOLDMAN SACHS INTERNATIONAL EQUITY INSIGHTS FUND
| Net asset value, end of year | Total return(b) | Net assets, year (in 000s) | Ratio of net expenses to average net assets | Ratio of total expenses to average net assets | Ratio of net investment income to average net assets | Portfolio turnover rate(c) | ||||||||||||||||||||||||||||||||||
| $ | 10.69 | (0.14 | )% | $ | 79,214 | 1.29 | % | 1.36 | % | 3.31 | (d)% | 142 | % | |||||||||||||||||||||||||||
| 10.57 | (0.88 | ) | 1,205 | 2.04 | 2.10 | 2.57 | (d) | 142 | ||||||||||||||||||||||||||||||||
| 10.51 | (0.85 | ) | 3,054 | 2.04 | 2.11 | 2.61 | (d) | 142 | ||||||||||||||||||||||||||||||||
| 10.97 | 0.22 | 742,016 | 0.89 | 0.96 | 3.74 | (d) | 142 | |||||||||||||||||||||||||||||||||
| 10.76 | (0.17 | ) | 2,779 | 1.39 | 1.45 | 3.17 | (d) | 142 | ||||||||||||||||||||||||||||||||
| 10.53 | 0.12 | 278 | 1.04 | 1.10 | 3.52 | (d) | 142 | |||||||||||||||||||||||||||||||||
| 10.52 | (0.33 | ) | 161 | 1.54 | 1.61 | 3.09 | (d) | 142 | ||||||||||||||||||||||||||||||||
| 10.99 | 26.31 | 92,919 | 1.29 | 1.37 | 1.98 | 189 | ||||||||||||||||||||||||||||||||||
| 10.86 | 25.31 | 1,950 | 2.04 | 2.11 | 1.67 | 189 | ||||||||||||||||||||||||||||||||||
| 10.83 | 25.33 | 3,166 | 2.04 | 2.11 | 1.61 | 189 | ||||||||||||||||||||||||||||||||||
| 11.29 | 26.71 | 945,546 | 0.89 | 0.96 | 2.99 | 189 | ||||||||||||||||||||||||||||||||||
| 11.06 | 26.13 | 6,237 | 1.39 | 1.46 | 2.25 | 189 | ||||||||||||||||||||||||||||||||||
| 10.86 | 26.55 | 468 | 1.04 | 1.11 | 2.22 | 189 | ||||||||||||||||||||||||||||||||||
| 10.85 | 25.99 | 95 | 1.54 | 1.61 | 2.14 | 189 | ||||||||||||||||||||||||||||||||||
| 9.00 | 4.94 | 210,612 | 1.28 | 1.37 | 2.21 | 203 | ||||||||||||||||||||||||||||||||||
| 8.89 | 4.13 | 2,587 | 2.04 | 2.12 | 1.47 | 203 | ||||||||||||||||||||||||||||||||||
| 8.87 | 4.10 | 3,087 | 2.04 | 2.12 | 1.48 | 203 | ||||||||||||||||||||||||||||||||||
| 9.25 | 5.47 | 596,986 | 0.88 | 0.97 | 2.69 | 203 | ||||||||||||||||||||||||||||||||||
| 9.06 | 4.77 | 7,945 | 1.38 | 1.47 | 2.09 | 203 | ||||||||||||||||||||||||||||||||||
| 8.91 | 5.16 | 65 | 1.04 | 1.11 | 2.33 | 203 | ||||||||||||||||||||||||||||||||||
| 8.88 | 4.69 | 71 | 1.53 | 1.62 | 1.98 | 203 | ||||||||||||||||||||||||||||||||||
| 9.02 | (9.87 | ) | 314,225 | 1.25 | 1.31 | 2.74 | 101 | |||||||||||||||||||||||||||||||||
| 8.89 | (10.52 | ) | 3,916 | 2.00 | 2.06 | 1.93 | 101 | |||||||||||||||||||||||||||||||||
| 8.89 | (10.50 | ) | 3,660 | 2.00 | 2.06 | 1.94 | 101 | |||||||||||||||||||||||||||||||||
| 9.27 | (9.52 | ) | 1,013,458 | 0.85 | 0.91 | 3.18 | 101 | |||||||||||||||||||||||||||||||||
| 9.08 | (9.91 | ) | 12,982 | 1.35 | 1.41 | 2.60 | 101 | |||||||||||||||||||||||||||||||||
| 8.97 | (9.58 | ) | 45 | 1.00 | 1.06 | 2.53 | 101 | |||||||||||||||||||||||||||||||||
| 8.93 | (9.99 | ) | 116 | 1.50 | 1.56 | 1.87 | 101 | |||||||||||||||||||||||||||||||||
| 10.21 | 8.59 | 530,086 | 1.25 | 1.29 | 1.89 | 111 | ||||||||||||||||||||||||||||||||||
| 10.06 | 7.83 | 6,563 | 2.00 | 2.04 | 1.13 | 111 | ||||||||||||||||||||||||||||||||||
| 10.06 | 7.78 | 5,023 | 2.00 | 2.04 | 1.12 | 111 | ||||||||||||||||||||||||||||||||||
| 10.49 | 9.05 | 1,819,375 | 0.85 | 0.89 | 2.24 | 111 | ||||||||||||||||||||||||||||||||||
| 10.27 | 8.49 | 23,267 | 1.35 | 1.39 | 1.68 | 111 | ||||||||||||||||||||||||||||||||||
| 10.15 | 8.77 | 8 | 1.00 | 1.04 | 2.13 | 111 | ||||||||||||||||||||||||||||||||||
| 10.12 | 8.30 | 192 | 1.50 | 1.54 | 1.59 | 111 | ||||||||||||||||||||||||||||||||||
| The accompanying notes are an integral part of these financial statements. | 57 |
GOLDMAN SACHS INTERNATIONAL SMALL CAP INSIGHTS FUND
Financial Highlights
Selected Data for a Share Outstanding Throughout Each Year
| Income (loss) from investment operations | Distributions to shareholders | |||||||||||||||||||||||||||||
| Year - Share Class | Net asset value, beginning of year | Net investment income(a) | Net realized and unrealized gain (loss) | Total from investment operations | From net investment income | From net realized gains | Total distributions | |||||||||||||||||||||||
| FOR THE FISCAL YEARS ENDED OCTOBER 31, | ||||||||||||||||||||||||||||||
2014 - A | $ | 10.62 | $ | 0.14 | $ | (0.34 | ) | $ | (0.20 | ) | $ | (0.32 | ) | $ | (0.07 | ) | $ | (0.39 | ) | |||||||||||
2014 - C | 10.40 | 0.06 | (0.33 | ) | (0.27 | ) | (0.30 | ) | (0.07 | ) | (0.37 | ) | ||||||||||||||||||
2014 - Institutional | 10.62 | 0.17 | (0.33 | ) | (0.16 | ) | (0.34 | ) | (0.07 | ) | (0.41 | ) | ||||||||||||||||||
2014 - IR | 10.59 | 0.18 | (0.35 | ) | (0.17 | ) | (0.34 | ) | (0.07 | ) | (0.41 | ) | ||||||||||||||||||
2013 - A | 8.29 | 0.23 | 2.49 | 2.72 | (0.39 | ) | — | (0.39 | ) | |||||||||||||||||||||
2013 - C | 8.13 | 0.14 | 2.47 | 2.61 | (0.34 | ) | — | (0.34 | ) | |||||||||||||||||||||
2013 - Institutional | 8.30 | 0.26 | 2.50 | 2.76 | (0.44 | ) | — | (0.44 | ) | |||||||||||||||||||||
2013 - IR | 8.28 | 0.22 | 2.52 | 2.74 | (0.43 | ) | — | (0.43 | ) | |||||||||||||||||||||
2012 - A | 7.92 | 0.17 | 0.38 | 0.55 | (0.18 | ) | — | (0.18 | ) | |||||||||||||||||||||
2012 - C | 7.79 | 0.11 | 0.38 | 0.49 | (0.15 | ) | — | (0.15 | ) | |||||||||||||||||||||
2012 - Institutional | 7.94 | 0.20 | 0.38 | 0.58 | (0.22 | ) | — | (0.22 | ) | |||||||||||||||||||||
2012 - IR | 7.93 | 0.16 | 0.40 | 0.56 | (0.21 | ) | — | (0.21 | ) | |||||||||||||||||||||
2011 - A | 8.20 | 0.17 | (0.21 | ) | (0.04 | ) | (0.24 | ) | — | (0.24 | ) | |||||||||||||||||||
2011 - C | 8.08 | 0.13 | (0.23 | ) | (0.10 | ) | (0.19 | ) | — | (0.19 | ) | |||||||||||||||||||
2011 - Institutional | 8.21 | 0.20 | (0.20 | ) | — | (0.27 | ) | — | (0.27 | ) | ||||||||||||||||||||
2011 - IR | 8.21 | 0.20 | (0.21 | ) | (0.01 | ) | (0.27 | ) | — | (0.27 | ) | |||||||||||||||||||
2010 - A | 7.03 | 0.12 | (d) | 1.21 | 1.33 | (0.16 | ) | — | (0.16 | ) | ||||||||||||||||||||
2010 - C | 6.95 | 0.09 | (d) | 1.17 | 1.26 | (0.13 | ) | — | (0.13 | ) | ||||||||||||||||||||
2010 - Institutional | 7.04 | 0.16 | (d) | 1.19 | 1.35 | (0.18 | ) | — | (0.18 | ) | ||||||||||||||||||||
2010 - IR (Commenced August 31, 2010) | 7.00 | 0.03 | (d) | 1.18 | 1.21 | — | — | — | ||||||||||||||||||||||
| (a) | Calculated based on the average shares outstanding methodology. |
| (b) | Assumes investment at the net asset value at the beginning of the year, reinvestment of all distributions, a complete redemption of the investment at the net asset value at the end of the year and no sales or redemption charges. Total returns would be reduced if a sales or redemption charge was taken into account. Returns do not reflect the deduction of taxes that a shareholder would pay on Fund distributions or the redemption of Fund shares. Total returns for periods less than one full year are not annualized. |
| (c) | The Fund's portfolio turnover rate is calculated in accordance with regulatory requirements, without regard to transactions involving short term investments and certain derivatives. If such transactions were included, the Fund's portfolio turnover rate may be higher. |
| (d) | Reflects income recognized from special dividends which amounted to $0.01 per share and 0.19% of average net assets. |
| (e) | Annualized. |
| 58 | The accompanying notes are an integral part of these financial statements. |
GOLDMAN SACHS INTERNATIONAL SMALL CAP INSIGHTS FUND
| Net asset value, end of year | Total return(b) | Net assets, year (in 000s) | Ratio of net expenses to average net assets | Ratio of total expenses to average net assets | Ratio of to average net assets | Portfolio turnover rate(c) | ||||||||||||||||||||||||||||||||||
| $ | 10.03 | (1.94 | )% | $ | 144,558 | 1.30 | % | 1.39 | % | 1.33 | % | 129 | % | |||||||||||||||||||||||||||
| 9.76 | (2.71 | ) | 19,158 | 2.05 | 2.15 | 0.57 | 129 | |||||||||||||||||||||||||||||||||
| 10.05 | (1.54 | ) | 668,746 | 0.90 | 0.99 | 1.65 | 129 | |||||||||||||||||||||||||||||||||
| 10.01 | (1.68 | ) | 19,134 | 1.05 | 1.14 | 1.66 | 129 | |||||||||||||||||||||||||||||||||
| 10.62 | 34.41 | 53,564 | 1.30 | 1.48 | 2.52 | 166 | ||||||||||||||||||||||||||||||||||
| 10.40 | 33.40 | 3,514 | 2.05 | 2.24 | 1.53 | 166 | ||||||||||||||||||||||||||||||||||
| 10.62 | 34.96 | 441,964 | 0.90 | 1.07 | 2.85 | 166 | ||||||||||||||||||||||||||||||||||
| 10.59 | 34.77 | 3,605 | 1.05 | 1.26 | 2.28 | 166 | ||||||||||||||||||||||||||||||||||
| 8.29 | 7.32 | 18,914 | 1.30 | 1.51 | 2.13 | 150 | ||||||||||||||||||||||||||||||||||
| 8.13 | 6.56 | 896 | 2.05 | 2.26 | 1.44 | 150 | ||||||||||||||||||||||||||||||||||
| 8.30 | 7.80 | 244,135 | 0.90 | 1.11 | 2.59 | 150 | ||||||||||||||||||||||||||||||||||
| 8.28 | 7.54 | 345 | 1.05 | 1.26 | 2.06 | 150 | ||||||||||||||||||||||||||||||||||
| 7.92 | (0.68 | ) | 29,729 | 1.30 | 1.47 | 1.95 | 79 | |||||||||||||||||||||||||||||||||
| 7.79 | (1.39 | ) | 856 | 2.05 | 2.22 | 1.56 | 79 | |||||||||||||||||||||||||||||||||
| 7.94 | (0.16 | ) | 249,545 | 0.90 | 1.07 | 2.30 | 79 | |||||||||||||||||||||||||||||||||
| 7.93 | (0.33 | ) | 1,368 | 1.05 | 1.22 | 2.39 | 79 | |||||||||||||||||||||||||||||||||
| 8.20 | 19.36 | 34,154 | 1.30 | 1.50 | 1.71 | (d) | 113 | |||||||||||||||||||||||||||||||||
| 8.08 | 18.50 | 213 | 2.05 | 2.25 | 1.24 | (d) | 113 | |||||||||||||||||||||||||||||||||
| 8.21 | 19.67 | 236,265 | 0.90 | 1.10 | 2.18 | (d) | 113 | |||||||||||||||||||||||||||||||||
| 8.21 | 17.29 | 1 | 1.05 | (e) | 1.25 | (e) | 2.49 | (d)(e) | 113 | |||||||||||||||||||||||||||||||
| The accompanying notes are an integral part of these financial statements. | 59 |
GOLDMAN SACHS INTERNATIONAL EQUITY INSIGHTS FUNDS
October 31, 2014
| 1. ORGANIZATION |
Goldman Sachs Trust (the “Trust”) is a Delaware statutory trust registered under the Investment Company Act of 1940, as amended (the “Act”), as an open-end management investment company. The following table lists those series of the Trust that are included in this report (collectively, the “Funds” or individually a “Fund”), along with their corresponding share classes and respective diversification status under the Act:
| Fund | Share Classes Offered | Diversified/ Non-diversified | ||
Emerging Markets Equity Insights | A, C, Institutional, IR and R | Diversified | ||
International Equity Insights | A, B, C, Institutional, Service, IR and R | Diversified | ||
International Small Cap Insights | A, C, Institutional and IR | Diversified |
Class A Shares are sold with a front-end sales charge of up to 5.50%. Class B Shares were sold with a contingent deferred sales charge (“CDSC”) that declines from 5.00% to zero, depending upon the period of time the shares are held. Class C Shares are sold with a CDSC of 1.00%, which is imposed on redemptions made within 12 months of purchase. Institutional, Service, Class IR and Class R Shares are not subject to a sales charge.
At a meeting held on August 13-14, 2014, the Board of Trustees of the Trust approved the early conversion of each Fund’s Class B Shares into Class A Shares.
Accordingly, effective at the close of business on November 14, 2014 (the “Conversion Date”), Class B Shares of each Fund have converted to Class A Shares of the Fund, including Class B Shares that were scheduled to convert at a later date. No CDSCs were assessed in connection with this early conversion. In addition, effective October 15, 2014, redemptions of a Fund’s Class B Shares before the Conversion Date were not subject to a CDSC.
Goldman Sachs Asset Management, L.P. (“GSAM”), an affiliate of Goldman, Sachs & Co. (“Goldman Sachs”), serves as investment adviser to the Funds pursuant to a management agreement (the “Agreement”) with the Trust.
| 2. SIGNIFICANT ACCOUNTING POLICIES |
The financial statements have been prepared in accordance with accounting principles generally accepted in the United States of America (“GAAP”) and require management to make estimates and assumptions that may affect the reported amounts and disclosures. Actual results may differ from those estimates and assumptions.
A. Investment Valuation — The Funds’ valuation policy is to value investments at fair value.
B. Investment Income and Investments — Investment income includes interest income and dividend income, net of any foreign withholding taxes, less any amounts reclaimable. Interest income is accrued daily and adjusted for amortization of premiums and accretion of discounts. Dividend income is recognized on ex-dividend date or, for certain foreign securities, as soon as such information is obtained subsequent to the ex-dividend date. Investment transactions are reflected on trade date. Realized gains and losses are calculated using identified cost. Investment transactions are recorded on the following business day for daily net asset value (“NAV”) calculations. Any foreign capital gains tax is accrued daily based upon net unrealized gains, and is payable upon sale of such investments. Distributions received from the Funds’ investments in U.S. real estate investment trusts (“REITs”) may be characterized as ordinary income, net capital gain or a return of capital. A return of capital is recorded by the Funds as a reduction to the cost basis of the REIT.
For derivative contracts, realized gains and losses are recorded upon settlement of the contract.
C. Class Allocations and Expenses — Investment income, realized and unrealized gain (loss), and non-class specific expenses of each Fund are allocated daily based upon the proportion of net assets of each class. Class specific expenses, where applicable, are borne by the respective share classes and include Distribution and Service, Transfer Agent and Service and Shareholder Administration fees. Non-class specific expenses directly incurred by a Fund are charged to that Fund, while such expenses
60
GOLDMAN SACHS INTERNATIONAL EQUITY INSIGHTS FUNDS
| 2. SIGNIFICANT ACCOUNTING POLICIES (continued) |
incurred by the Trust are allocated across the respective Funds on a straight-line and/or pro-rata basis depending upon the nature of the expenses.
D. Federal Taxes and Distributions to Shareholders — It is each Fund’s policy to comply with the requirements of the Internal Revenue Code of 1986, as amended (the “Code”), applicable to regulated investment companies (mutual funds) and to distribute each year substantially all of its investment company taxable income and capital gains to its shareholders. Accordingly, the Funds are not required to make any provisions for the payment of federal income tax. Distributions to shareholders are recorded on the ex-dividend date. Income and capital gains distributions, if any, are declared and paid annually.
Net capital losses are carried forward to future fiscal years and may be used to the extent allowed by the Code to offset any future capital gains. Utilization of capital loss carryforwards will reduce the requirement of future capital gains distributions.
Under the Regulated Investment Company Modernization Act of 2010, the Funds are permitted to carry forward capital losses incurred in taxable years beginning after December 22, 2010 for an unlimited period. However, any losses incurred during those future taxable years will be required to be utilized prior to the losses incurred in pre-enactment taxable years. As a result of this ordering rule, pre-enactment capital loss carryforwards may be more likely to expire unused. Additionally, post-enactment capital losses that are carried forward will retain their character as either short-term or long term capital losses rather than being considered all short-term as under previous law.
The characterization of distributions to shareholders for financial reporting purposes is determined in accordance with federal income tax rules, which may differ from GAAP. The source of each Fund’s distributions may be shown in the accompanying financial statements as either from net investment income, net realized gain or capital. Certain components of the Funds’ net assets on the Statements of Assets and Liabilities reflect permanent GAAP/tax differences based on the appropriate tax character.
E. Foreign Currency Translation — The accounting records and reporting currency of the Funds are maintained in United States (“U.S.”) dollars. Assets and liabilities denominated in foreign currencies are translated into U.S. dollars using the current exchange rates at the close of each business day. The effect of changes in foreign currency exchange rates on investments is included within net realized and unrealized gain (loss) on investments. Changes in the value of other assets and liabilities as a result of fluctuations in foreign exchange rates are included in the Statements of Operations within net change in unrealized gain (loss) on foreign currency transactions. Transactions denominated in foreign currencies are translated into U.S. dollars on the date the transaction occurred, the effects of which are included within net realized gain (loss) on foreign currency transactions.
| 3. INVESTMENTS AND FAIR VALUE MEASUREMENTS |
The fair value of a financial instrument is the amount that would be received to sell an asset or paid to transfer a liability in an orderly transaction between market participants at the measurement date (i.e., the exit price). GAAP establishes a fair value hierarchy that prioritizes the inputs to valuation techniques used to measure fair value. The hierarchy gives the highest priority to unadjusted quoted prices in active markets for identical assets or liabilities (Level 1 measurements) and the lowest priority to unobservable inputs (Level 3 measurements). The levels used for classifying investments are not necessarily an indication of the risk associated with investing in these investments. The three levels of the fair value hierarchy are described below:
Level 1 — Unadjusted quoted prices in active markets that are accessible at the measurement date for identical, unrestricted assets or liabilities;
Level 2 — Quoted prices in markets that are not active or financial instruments for which significant inputs are observable (including, but not limited to, quoted prices for similar investments, interest rates, foreign exchange rates, volatility and credit spreads), either directly or indirectly;
Level 3 — Prices or valuations that require significant unobservable inputs (including GSAM’s assumptions in determining fair value measurement).
The Trustees have adopted Valuation Procedures that govern the valuation of the portfolio investments held by the Funds, including investments for which market quotations are not readily available. The Trustees have delegated to GSAM day-to-day
61
GOLDMAN SACHS INTERNATIONAL EQUITY INSIGHTS FUNDS
Notes to Financial Statements (continued)
October 31, 2014
| 3. INVESTMENTS AND FAIR VALUE MEASUREMENTS (continued) |
responsibility for implementing and maintaining internal controls and procedures related to the valuation of the Funds’ portfolio investments. To assess the continuing appropriateness of pricing sources and methodologies, GSAM regularly performs price verification procedures and issues challenges as necessary to third party pricing vendors or brokers, and any differences are reviewed in accordance with the Valuation Procedures.
A. Level 1 and Level 2 Fair Value Investments — The valuation techniques and significant inputs used in determining the fair values for investments classified as Level 1 and Level 2 are as follows:
Equity Securities — Equity securities and investment companies traded on a U.S. securities exchange or the NASDAQ system, or those located on certain foreign exchanges, including but not limited to the Americas, are valued daily at their last sale price or official closing price on the principal exchange or system on which they are traded. If no sale occurs, equity securities and exchange traded investment companies are valued at the last bid price for long positions and at the last ask price for short positions. Investments in investment companies (other than those that are exchange traded) are valued at the NAV on the valuation date. To the extent these investments are actively traded, they are classified as Level 1 of the fair value hierarchy, otherwise they are generally classified as Level 2.
Unlisted equity securities for which market quotations are available are valued at the last sale price on the valuation date, or if no sale occurs, at the last bid price. Securities traded on certain foreign securities exchanges are valued daily at fair value determined by an independent fair value service (if available) under Valuation Procedures approved by the Trustees and consistent with applicable regulatory guidance. The independent fair value service takes into account multiple factors including, but not limited to, movements in the securities markets, certain depositary receipts, futures contracts and foreign currency exchange rates that have occurred subsequent to the close of the foreign securities exchange. These investments are generally classified as Level 2 of the fair value hierarchy.
Derivative Contracts — A derivative is an instrument whose value is derived from underlying assets, indices, reference rates or a combination of these factors.
Exchange-traded derivatives, including futures contracts, typically fall within Level 1 of the fair value hierarchy. Over-the-counter (“OTC”) and centrally cleared derivatives are valued using market transactions and other market evidence, including market-based inputs to models, calibration to market-clearing transactions, broker or dealer quotations, or other alternative pricing sources. Where models are used, the selection of a particular model to value OTC and centrally cleared derivatives depends upon the contractual terms of, and specific risks inherent in, the instrument, as well as the availability of pricing information in the market. Valuation models require a variety of inputs, including contractual terms, market prices, yield curves, credit curves, measures of volatility, voluntary and involuntary prepayment rates, loss severity rates and correlations of such inputs. For OTC and centrally cleared derivatives that trade in liquid markets, model inputs can generally be verified and model selection does not involve significant management judgment. OTC and centrally cleared derivatives are classified within Level 2 of the fair value hierarchy when significant inputs are corroborated by market evidence.
i. Forward Contracts — A forward contract is a contract between two parties to buy or sell an asset at a specified price on a future date. A forward contract settlement can occur on a cash or delivery basis. Forward contracts are marked-to-market daily using counterparty prices, and the change in value, if any, is recorded as an unrealized gain or loss.
A forward foreign currency contract is a forward contract in which a Fund agrees to receive or deliver a fixed quantity of one currency for another, at a pre-determined price at a future date. All forward foreign currency exchange contracts are marked-to-market daily at the applicable forward rate. Non-deliverable forward foreign currency exchange contracts are settled with the counterparty in cash without the delivery of foreign currency.
ii. Futures Contracts — Futures contracts are contracts to buy or sell a standardized quantity of a specified commodity or security and are valued based on exchanged settlement prices or independent market quotes. Futures contracts are valued at the last settlement price, or in the absence of a sale, the last bid price for long positions and at the last ask price for short positions, at the end of each day on the board of trade or exchange upon which they are traded. Upon entering into a futures contract, a Fund deposits cash or securities in an account on behalf of the broker in an amount sufficient to meet the initial
62
GOLDMAN SACHS INTERNATIONAL EQUITY INSIGHTS FUNDS
| 3. INVESTMENTS AND FAIR VALUE MEASUREMENTS (continued) |
margin requirement. Subsequent payments are made or received by a Fund equal to the daily change in the contract value and are recorded as variation margin receivable or payable with a corresponding offset to unrealized gains or losses.
B. Level 3 Fair Value Investments — To the extent that the aforementioned significant inputs are unobservable, or if quotations are not readily available, or if GSAM believes that such quotations do not accurately reflect fair value, the fair value of the Funds’ investments may be determined under Valuation Procedures approved by the Trustees. GSAM, consistent with its procedures and applicable regulatory guidance, may make an adjustment to the most recent valuation prices of either domestic or foreign securities in light of significant events to reflect what it believes to be the fair value of the securities at the time of determining a Fund’s NAV. Significant events which could affect a large number of securities in a particular market may include, but are not limited to: significant fluctuations in U.S. or foreign markets; market dislocations; market disruptions; or unscheduled market closings. Significant events which could also affect a single issuer may include, but are not limited to: corporate actions such as reorganizations, mergers and buy-outs; ratings downgrades; and bankruptcies.
C. Fair Value Hierarchy — The following is a summary of the Funds’ investments and derivatives classified in the fair value hierarchy as of October 31, 2014:
| EMERGING MARKETS EQUITY INSIGHTS FUND | ||||||||||||
| Investment Type | Level 1 | Level 2 | Level 3 | |||||||||
| Assets | ||||||||||||
Common Stock and/or Other Equity Investments(a) | ||||||||||||
Africa | $ | — | $ | 43,005,011 | $ | — | ||||||
Asia | 21,316,547 | 468,910,189 | — | |||||||||
Europe | — | 27,723,650 | — | |||||||||
North America | 47,691,523 | — | — | |||||||||
South America | 40,426,246 | (b) | 53,384,499 | — | ||||||||
Securities Lending Reinvestment Vehicle | 10,631,042 | — | — | |||||||||
| Total | $ | 120,065,358 | $ | 593,023,349 | $ | — | ||||||
| INTERNATIONAL EQUITY INSIGHTS FUND | ||||||||||||
| Investment Type | Level 1 | Level 2 | Level 3 | |||||||||
| Assets | ||||||||||||
Common Stock and/or Other Equity Investments(a) | ||||||||||||
Africa | $ | — | $ | 5,681,733 | $ | — | ||||||
Asia | — | 232,877,804 | — | |||||||||
Australia and Oceania | 65,915,015 | — | ||||||||||
Europe | 3,424,170 | 499,146,201 | — | |||||||||
Securities Lending Reinvestment Vehicle | 10,729,897 | — | — | |||||||||
| Total | $ | 14,154,067 | $ | 803,620,753 | $ | — | ||||||
| Derivative Type | ||||||||||||
| Assets(c) | ||||||||||||
Futures Contracts | $ | 228,440 | $ | — | $ | — | ||||||
| Liabilities(c) | ||||||||||||
Futures Contracts | $ | (63,849 | ) | $ | — | $ | — | |||||
63
GOLDMAN SACHS INTERNATIONAL EQUITY INSIGHTS FUNDS
Notes to Financial Statements (continued)
October 31, 2014
| 3. INVESTMENTS AND FAIR VALUE MEASUREMENTS (continued) |
| INTERNATIONAL SMALL CAP INSIGHTS FUND | ||||||||||||
| Investment Type | Level 1 | Level 2 | Level 3 | |||||||||
| Assets | ||||||||||||
Common Stock and/or Other Equity Investments(a) | ||||||||||||
Africa | $ | — | $ | 4,254,557 | $ | — | ||||||
Asia | — | 297,317,329 | — | |||||||||
Australia and Oceania | — | 66,266,359 | — | |||||||||
Europe | — | 480,737,803 | — | |||||||||
North America | — | 11,444,446 | — | |||||||||
Securities Lending Reinvestment Vehicle | 52,882,281 | — | — | |||||||||
| Total | $ | 52,882,281 | $ | 860,020,494 | $ | — | ||||||
| Derivative Type | ||||||||||||
| Liabilities(c) | ||||||||||||
Futures Contracts | $ | (89,036 | ) | $ | — | $ | — | |||||
| (a) | Amounts are disclosed by continent to highlight the impact of time zone differences between local market close and the calculation of net asset value. Security valuations are based on the principal exchange or system on which they are traded, which may differ from country of domicile. The Funds utilize fair value model prices provided by an independent fair value service for international equities, resulting in a Level 2 classification. |
| (b) | For the reporting period $8,749,679 was transferred from Level 2 to Level 1 due to time zone changes whereby certain securities aligned with the timing of the net asset value calculation and therefore fair value model pricing was not applicable at the reporting period. |
| (c) | Amount shown represents unrealized gain (loss) at fiscal year end. |
For further information regarding security characteristics, see the Schedules of Investments.
| 4. INVESTMENTS IN DERIVATIVES |
The following table sets forth, by certain risk types, the gross value of derivative contracts as of October 31, 2014. These instruments were used to meet the Funds’ investment objectives and to obtain and/or manage exposure related to the risks below. The values in the table below exclude the effects of cash collateral received or posted pursuant to these derivative contracts, and therefore are not representative of the Funds’ net exposure:
| Fund | Risk | Statements of Assets and Liabilities | Assets(a) | Statements of Assets and Liabilities | Liabilities(a) | |||||||
International Equity Insights | Equity | Receivable for unrealized gain on futures variation margin | $228,440 | Payable for unrealized loss on futures variation margin | $(63,849) | |||||||
International Small Cap Insights | Equity | Receivable for unrealized gain on futures variation margin | — | Payable for unrealized loss on futures variation margin | (89,036) | |||||||
| (a) | Includes unrealized gain (loss) on futures contracts described in the Additional Investment Information sections of the Schedules of Investments. Only current day’s variation margin is reported within the Statements of Assets and Liabilities. |
64
GOLDMAN SACHS INTERNATIONAL EQUITY INSIGHTS FUNDS
| 4. INVESTMENTS IN DERIVATIVES (continued) |
The following tables set forth, by certain risk types, the Funds’ gains (losses) related to these derivatives and their indicative volumes for the fiscal year ended October 31, 2014. These gains (losses) should be considered in the context that these derivative contracts may have been executed to create investment opportunities and/or economically hedge certain investments, and accordingly, certain gains (losses) on such derivative contracts may offset certain (losses) gains attributable to investments. These gains (losses) are included in “Net realized gain (loss)” or “Net change in unrealized gain (loss)” on the Statements of Operations:
| Fund | Risk | Statements of Operations | Net Realized Gain (Loss) | Net Change in Unrealized Gain (Loss) | Average Number of Contracts(a) | |||||||||||
International Equity Insights | Equity | Net realized gain (loss) from futures contracts/Net change in unrealized gain (loss) on futures contracts | $4,384,742 | $(857,833) | 266 | |||||||||||
International Small Cap Insights | Equity | Net realized gain (loss) from futures contracts/Net change in unrealized gain (loss) on futures contracts | (3,306 | ) | (499,939 | ) | 296 | |||||||||
| (a) | Average number of contracts is based on the average of month end balances for the fiscal year ended October 31, 2014. |
| 5. AGREEMENTS AND AFFILIATED TRANSACTIONS |
A. Management Agreement — Under the Agreement, GSAM manages the Funds, subject to the general supervision of the Trustees.
As compensation for the services rendered pursuant to the Agreement, the assumption of the expenses related thereto and administration of the Funds’ business affairs, including providing facilities, GSAM is entitled to a management fee, accrued daily and paid monthly, equal to an annual percentage rate of each Fund’s average daily net assets.
For the fiscal year ended October 31, 2014, contractual and effective net management fees with GSAM were at the following rates:
| Contractual Management Fee Rate | ||||||||||||||||||||||||||
| Fund | First $1 billion | Next $1 billion | Next $3 billion | Next $3 billion | Over $8 billion | Effective Fee Rate | ||||||||||||||||||||
Emerging Markets Equity Insights | 1.00 | % | 1.00 | % | 0.90 | % | 0.86 | % | 0.84 | % | 1.00 | % | ||||||||||||||
International Equity Insights | 0.85 | 0.77 | 0.73 | 0.72 | 0.71 | 0.85 | ||||||||||||||||||||
International Small Cap Insights | 0.85 | 0.85 | 0.77 | 0.73 | 0.72 | 0.85 | ||||||||||||||||||||
B. Distribution and Service Plans — The Trust, on behalf of each Fund, has adopted Distribution and Service Plans (the “Plans”). Under the Plans, Goldman Sachs, which serves as distributor (the “Distributor”), is entitled to a fee accrued daily and paid monthly, for distribution services and personal and account maintenance services, which may then be paid by Goldman Sachs to authorized dealers, at the following annual rates calculated on a Fund’s average daily net assets of each respective share class:
| Distribution and Service Plan Rates | ||||||||||||||||
| Class A* | Class B | Class C | Class R* | |||||||||||||
Distribution Plan | 0.25 | % | 0.75 | % | 0.75 | % | 0.50 | % | ||||||||
Service Plan | — | 0.25 | 0.25 | — | ||||||||||||
| * | With respect to Class A and Class R Shares, the Distributor at its discretion may use compensation for distribution services paid under the Distribution Plan to compensate service organizations for personal and account maintenance services and expenses as long as such total compensation does not exceed the maximum cap on “service fees” imposed by the Financial Industry Regulatory Authority. |
65
GOLDMAN SACHS INTERNATIONAL EQUITY INSIGHTS FUNDS
Notes to Financial Statements (continued)
October 31, 2014
| 5. AGREEMENTS AND AFFILIATED TRANSACTIONS (continued) |
C. Distribution Agreement — Goldman Sachs, as Distributor of the shares of the Funds pursuant to a Distribution Agreement, may retain a portion of the Class A front end sales charge and Class B and Class C Shares’ CDSC. During the fiscal year ended October 31, 2014, Goldman Sachs advised that it retained the following amounts:
| Front End Sales Charge | Contingent Deferred Sales Charge* | |||||||||
| Fund | Class A | Class C | ||||||||
Emerging Markets Equity Insights | $ | 1,913 | $ | — | ||||||
International Equity Insights | 6,058 | — | ||||||||
International Small Cap Insights | 52,113 | 38 | ||||||||
| * | Goldman Sachs did not retain any contingent deferred sales charges for Class B Shares. |
D. Service Plan and Shareholder Administration Plan — The Trust, on behalf of each Fund that offers Service Shares, has adopted a Service Plan and a Shareholder Administration Plan. These plans allow for service organizations to provide varying levels of personal and account maintenance and shareholder administration services to their customers who are beneficial owners of such shares. The Service Plan and Shareholder Administration Plan each provide for compensation to the service organizations which is accrued daily and paid monthly at an annual rate of 0.25% (0.50% in aggregate) of the average daily net assets of the Service Shares.
E. Transfer Agency Agreement — Goldman Sachs also serves as the transfer agent of the Funds for a fee pursuant to the Transfer Agency Agreement. The fees charged for such transfer agency services are accrued daily and paid monthly at annual rates as follows: 0.19% of the average daily net assets of Class A, Class B, Class C, Class IR and Class R Shares and 0.04% of the average daily net assets of Institutional and Service Shares.
F. Other Expense Agreements and Affiliated Transactions — GSAM has agreed to limit certain “Other Expenses” of the Funds (excluding transfer agency fees and expenses, service fees and shareholder administration fees (as applicable), taxes, interest, brokerage fees, shareholder meetings, litigation, indemnification and extraordinary expenses) to the extent such expenses exceed, on an annual basis, a percentage rate of the average daily net assets of each Fund. Such Other Expense reimbursements, if any, are accrued daily and paid monthly. In addition, the Funds are not obligated to reimburse GSAM for prior fiscal year expense reimbursements, if any. The Other Expense limitations as an annual percentage rate of average daily net assets for Emerging Markets Equity Insights, International Equity Insights and International Small Cap Insights Funds are 0.144%, 0.004% and 0.014%, respectively. These Other Expense limitations will remain in place through at least February 28, 2015, and prior to such date GSAM may not terminate the arrangements without the approval of the Trustees. The Funds bear their respective share of costs related to proxy and shareholder meetings, and GSAM has agreed to reimburse each Fund to the extent such expenses exceed a specified percentage of the Fund’s net assets. In addition, the Funds have entered into certain offset arrangements with the custodian and the transfer agent, which may result in a reduction of the Funds’ expenses and are received irrespective of the application of the “Other Expense” limitations described above.
For the fiscal year ended October 31, 2014, these expense reductions, including any fee waivers and Other Expense reimbursements, were as follows:
| Fund | Custody Fee Credits | Other Expense | Total Expense | |||||||||||
Emerging Markets Equity Insights | $ | 4,145 | $ | 525,440 | $ | 529,585 | ||||||||
International Equity Insights | 6,129 | 573,316 | 579,445 | |||||||||||
International Small Cap Insights | 11,671 | 660,439 | 672,110 | |||||||||||
66
GOLDMAN SACHS INTERNATIONAL EQUITY INSIGHTS FUNDS
| 5. AGREEMENTS AND AFFILIATED TRANSACTIONS (continued) |
G. Line of Credit Facility — As of October 31, 2014, the Funds participated in a $1,080,000,000 committed, unsecured revolving line of credit facility (the “facility”) together with other funds of the Trust and registered investment companies having management agreements with GSAM or its affiliates (“Other Borrowers”). Pursuant to the terms of the facility, the Funds and Other Borrowers could increase the credit amount by an additional $120,000,000, for a total of up to $1,200,000,000. This facility is to be used solely for temporary or emergency purposes, which may include the funding of redemptions. The interest rate on borrowings is based on the federal funds rate. The facility also requires a fee to be paid by the Funds based on the amount of the commitment that has not been utilized. For the fiscal year ended October 31, 2014, the Funds did not have any borrowings under the facility.
H. Other Transactions with Affiliates — For the fiscal year ended October 31, 2014, Goldman Sachs earned $16,845 in brokerage commissions from portfolio transactions, including futures transactions executed with Goldman Sachs as the Futures Commission Merchant, on behalf of the International Equity Insights Fund.
As of October 31, 2014, the following Goldman Sachs Fund of Funds Portfolios were the beneficial owners of 5% or more of total outstanding shares of the following Funds:
| Fund | Goldman Sachs Balanced Strategy Portfolio | Goldman Sachs Equity Growth | Goldman Sachs Growth Strategy Portfolio | Goldman Sachs Growth and Income Strategy Portfolio | Goldman Sachs Satellite Strategies | Goldman Sachs Tax-Advantaged Global Equity | ||||||||||||||||||||
Emerging Markets Equity Insights | — | % | 7 | % | 12 | % | 11 | % | 12 | % | 14 | % | ||||||||||||||
International Equity Insights | — | 23 | 15 | 17 | — | — | ||||||||||||||||||||
International Small Cap Insights | — | — | — | — | 12 | — | ||||||||||||||||||||
As of October 31, 2014, the Goldman Sachs Group, Inc. was the beneficial owner of approximately 5% of the Class R Shares of the International Equity Insights Fund.
| 6. PORTFOLIO SECURITIES TRANSACTIONS |
The cost of purchases and proceeds from sales and maturities of long-term securities for the fiscal year ended October 31, 2014, were as follows:
| Fund | Purchases | Sales and Maturities | ||||||||
Emerging Markets Equity Insights | $ | 1,299,129,464 | $ | 1,178,899,345 | ||||||
International Equity Insights | 1,303,620,973 | 1,477,691,235 | ||||||||
International Small Cap Insights | 1,383,245,491 | 961,309,246 | ||||||||
67
GOLDMAN SACHS INTERNATIONAL EQUITY INSIGHTS FUNDS
Notes to Financial Statements (continued)
October 31, 2014
| 7. SECURITIES LENDING |
Pursuant to exemptive relief granted by the Securities and Exchange Commission (“SEC”) and the terms and conditions contained therein, the Funds may lend their securities through a securities lending agent, Goldman Sachs Agency Lending (“GSAL”), a wholly-owned subsidiary of Goldman Sachs, to certain qualified borrowers including Goldman Sachs and affiliates. In accordance with the Funds’ securities lending procedures, the Funds receive cash collateral at least equal to the market value of the securities on loan. The market value of the loaned securities is determined at the close of business of the Funds, at their last sale price or official closing price on the principal exchange or system on which they are traded, and any additional required collateral is delivered to the Funds on the next business day. As with other extensions of credit, the Funds may experience delay in the recovery of their securities or incur a loss should the borrower of the securities breach its agreement with the Funds or become insolvent at a time when the collateral is insufficient to cover the cost of repurchasing securities on loan. Dividend income received from securities on loan may not be subject to withholding taxes and therefore withholding taxes paid may differ from the amounts listed in the Statement of Operations.
The Funds invest the cash collateral received in connection with securities lending transactions in the Goldman Sachs Financial Square Money Market Fund (“Money Market Fund”), an affiliated series of the Trust. The Money Market Fund is registered under the Act as an open end investment company, is subject to Rule 2a-7 under the Act, and is managed by GSAM, for which GSAM may receive an investment advisory fee of up to 0.205% on an annualized basis of the average daily net assets of the Money Market Fund.
In the event of a default by a borrower with respect to any loan, GSAL will exercise any and all remedies provided under the applicable borrower agreement to make the Funds whole. These remedies include purchasing replacement securities by applying the collateral held from the defaulting broker against the purchase cost of the replacement securities. If, despite such efforts by GSAL to exercise these remedies, the Funds sustain losses as a result of a borrower’s default, GSAL indemnifies the Funds by purchasing replacement securities at its expense, or paying the Funds an amount equal to the market value of the replacement securities, subject to an exclusion for any shortfalls resulting from a loss of value in the cash collateral pool due to reinvestment risk and a requirement that the Funds agree to assign rights to the collateral to GSAL for purpose of using the collateral to cover purchase of replacement securities as more fully described in the Securities Lending Agency Agreement. The value of loaned securities and cash collateral at period end are disclosed in the Fund’s Statement of Assets and Liabilities.
Both the Funds and GSAL received compensation relating to the lending of the Funds’ securities. The amounts earned by the Funds for the fiscal year ended October 31, 2014, are reported under Investment Income on the Statements of Operations.
The table below details securities lending activity with affiliates of Goldman Sachs:
| For the Fiscal year ended October 31, 2014 | Amounts Payable to Goldman Sachs Upon Return of Securities Loaned as of October 31, 2014 | |||||||||||||
| Fund | Earnings of GSAL Relating to Securities Loaned | Amounts Received by the Funds from Lending to Goldman Sachs | ||||||||||||
Emerging Markets Equity Insights | $ | 25,483 | $ | 4,595 | $ | 2,500,000 | ||||||||
International Equity Insights | 107,289 | 183,920 | 599,250 | |||||||||||
International Small Cap Insights | 91,448 | 121,295 | 5,539,860 | |||||||||||
68
GOLDMAN SACHS INTERNATIONAL EQUITY INSIGHTS FUNDS
| 7. SECURITIES LENDING (continued) |
The following table provides information about the Funds’ investment in the Money Market Fund for the fiscal year ended October 31, 2014:
| Fund | Number of Shares Held | Shares Bought | Shares Sold | Number of Shares Held End of Year | Value at End of Year | |||||||||||||||||
Emerging Markets Equity Insights | 13,500,753 | 288,959,376 | (291,829,087 | ) | 10,631,042 | $ | 10,631,042 | |||||||||||||||
International Equity Insights | 5,863,207 | 377,276,626 | (372,409,936 | ) | 10,729,897 | 10,729,897 | ||||||||||||||||
International Small Cap Insights | 32,970,675 | 248,557,186 | (228,645,580 | ) | 52,882,281 | 52,882,281 | ||||||||||||||||
| 8. TAX INFORMATION |
The tax character of distributions paid during the fiscal year ended October 31, 2014 was as follows:
| Emerging Markets Equity Insights | International Equity Insights | International Small Cap Insights | ||||||||||
Distributions paid from: | ||||||||||||
Ordinary income | $ | 8,000,020 | $ | 31,452,026 | $ | 16,590,825 | ||||||
Net Long-Term Capital Gains | — | — | 3,981,425 | |||||||||
Total | $ | 8,000,020 | $ | 31,452,026 | $ | 20,572,250 | ||||||
The tax character of distributions paid during the fiscal year ended October 31, 2013 was as follows:
| Emerging Markets Equity Insights | International Equity Insights | International Small Cap Insights | ||||||||||
Distributions paid from: | ||||||||||||
Ordinary income | $ | 8,109,333 | $ | 28,847,303 | $ | 11,498,869 | ||||||
As of October 31, 2014, the components of accumulated earnings (losses) on a tax-basis were as follows:
| Emerging Markets Equity Insights | International Equity Insights | International Small Cap Insights | ||||||||||
Undistributed ordinary income — net | $ | 9,225,040 | $ | 26,611,551 | $ | 14,306,590 | ||||||
Undistributed long-term capital gains | 5,431,413 | — | 8,198,308 | |||||||||
Total undistributed earnings | $ | 14,656,453 | $ | 26,611,551 | $ | 22,504,898 | ||||||
Capital loss carryforwards: | ||||||||||||
Expiring 2016(1) | $ | — | $ | (392,336,296 | ) | $ | — | |||||
Expiring 2017(1) | — | (940,883,655 | ) | — | ||||||||
Expiring 2019(1) | — | (2,867,280 | ) | — | ||||||||
Total capital loss carryforwards | $ | — | $ | (1,336,087,231 | ) | $ | — | |||||
Unrealized gains (losses) — net | 28,372,832 | (5,783,086 | ) | 14,909,068 | ||||||||
Total accumulated gains (losses) — net | $ | 43,029,285 | $ | (1,315,258,766 | ) | $ | 37,413,966 | |||||
| (1) | Expiration occurs on October 31 of the year indicated. The Emerging Markets Equity Insights and International Equity Insights Funds utilized $16,617,299 and $81,063,632, respectively, of capital losses in the current fiscal year. |
69
GOLDMAN SACHS INTERNATIONAL EQUITY INSIGHTS FUNDS
Notes to Financial Statements (continued)
October 31, 2014
| 8. TAX INFORMATION (continued) |
As of October 31, 2014, the Funds’ aggregate security unrealized gains and losses based on cost for U.S. federal income tax purposes were as follows:
| Emerging Markets Equity Insights | International Equity Insights | International Small Cap Insights | ||||||||||
Tax cost | $ | 684,101,143 | $ | 823,503,006 | $ | 897,968,900 | ||||||
Gross unrealized gain | 58,959,292 | 43,116,865 | 67,885,878 | |||||||||
Gross unrealized loss | (29,971,728 | ) | (48,845,051 | ) | (52,952,003 | ) | ||||||
Net unrealized security gain (loss) | $ | 28,987,564 | $ | (5,728,186 | ) | $ | 14,933,875 | |||||
Net unrealized loss on other investments | (614,732 | ) | (54,900 | ) | (24,807 | ) | ||||||
Net unrealized gain (loss) | $ | 28,372,832 | $ | (5,783,086 | ) | $ | 14,909,068 | |||||
The difference between GAAP-basis and tax-basis unrealized gains (losses) is attributable primarily to wash sales, net mark to market gains (losses) on regulated futures and foreign currency contracts and differences in the tax treatment of passive foreign investment company investments.
In order to present certain components of the Funds’ capital accounts on a tax-basis, certain reclassifications have been recorded to the Funds’ accounts. These reclassifications have no impact on the net asset value of the Funds and result primarily from dividend redesignations and differences in the tax treatment of foreign currency transactions and passive foreign investment company investments.
| Fund | Paid-in Capital | Accumulated Net Realized Gain (Loss) | Undistributed Net Investment Income (Loss) | |||||||||||
Emerging Markets Equity Insights | $ | — | $ | 1,306,209 | $ | (1,306,209 | ) | |||||||
International Equity Insights | (155,410 | ) | (538,774 | ) | 694,184 | |||||||||
International Small Cap Insights | — | (3,695,309 | ) | 3,695,309 | ||||||||||
GSAM has reviewed the Funds’ tax positions for all open tax years (the current and prior three years, as applicable) and has concluded that no provision for income tax is required in the Funds’ financial statements. Such open tax years remain subject to examination and adjustment by tax authorities.
| 9. OTHER RISKS |
The Funds’ risks include, but are not limited to, the following:
Foreign Custody Risk — A Fund that invests in foreign securities may hold such securities and foreign currency with foreign banks, agents, and securities depositories appointed by the Fund’s custodian (each a “Foreign Custodian”). Some foreign custodians may be recently organized or new to the foreign custody business. In some countries, Foreign Custodians may be subject to little or no regulatory oversight or independent evaluation of their operations. Further, the laws of certain countries may place limitations on a Fund’s ability to recover its assets if a Foreign Custodian enters bankruptcy. Investments in emerging markets may be subject to greater custody risks than investments in more developed markets. Custody services in emerging market countries are very often undeveloped and may be considerably less well regulated than in more developed countries, and thus may not afford the same level of investor protection as would apply in developed countries.
Investments in Other Investment Companies — As a shareholder of another investment company, including an exchange traded fund (“ETF”), a Fund will directly bear its proportionate share of any management fees and other expenses paid by such
70
GOLDMAN SACHS INTERNATIONAL EQUITY INSIGHTS FUNDS
| 9. OTHER RISKS (continued) |
other investment companies, in addition to the fees and expenses regularly borne by the Fund. ETFs are subject to risks that do not apply to conventional mutual funds, including but not limited to the following: (i) the market price of the ETF’s shares may trade at a premium or a discount to their NAV; and (ii) an active trading market for an ETF’s shares may not develop or be maintained.
Large Shareholder Transactions Risk — A Fund may experience adverse effects when certain large shareholders, such as other funds, institutional investors (including those trading by use of non-discretionary mathematical formulas), financial intermediaries (who may make investment decisions on behalf of underlying clients and/or include a Fund in their investment model), individuals, accounts and Goldman Sachs affiliates, purchase or redeem large amounts of shares of a Fund. Such large shareholder redemptions may cause the Fund to sell portfolio securities at times when it would not otherwise do so, which may negatively impact a Fund’s NAV and liquidity. Similarly, large Fund share purchases may adversely affect a Fund’s performance to the extent that a Fund is delayed in investing new cash and is required to maintain a larger cash position than it ordinarily would. These transactions may also accelerate the realization of taxable income to shareholders if such sales of investments resulted in gains, and may also increase transaction costs. In addition, a large redemption could result in a Fund’s current expenses being allocated over a smaller asset base, leading to an increase in the Fund’s expense ratio.
Liquidity Risk — The Funds may make investments that are illiquid or that may become less liquid in response to market developments or adverse investor perceptions. Illiquid investments may be more difficult to value. Liquidity risk may also refer to the risk that a Fund will not be able to pay redemption proceeds within the allowable time period because of unusual market conditions, an unusually high volume of redemption requests, or other reasons. To meet redemption requests, a Fund may be forced to sell investments at an unfavorable time and/or under unfavorable conditions.
Market and Credit Risks — In the normal course of business, the Funds trade financial instruments and enter into financial transactions where risk of potential loss exists due to changes in the market (market risk). Additionally, the Funds may also be exposed to credit risk in the event that an issuer or guarantor fails to perform or that an institution or entity with which the Funds have unsettled or open transactions defaults.
Investing in foreign markets may involve special risks and considerations not typically associated with investing in the U.S. Foreign securities may be subject to risk of loss because of more or less foreign government regulation, less public information and less economic, political and social stability in the countries in which the Fund invests. Loss may also result from the imposition of exchange controls, confiscations and other government restrictions by the U.S. or other governments, or from problems in registration, settlement or custody. Foreign risk also involves the risk of negative foreign currency rate fluctuations, which may cause the value of securities denominated in such foreign currency (or other instruments through which the Fund has exposure to foreign currencies) to decline in value. Currency exchange rates may fluctuate significantly over short periods of time. To the extent that the Fund also invests in securities of issuers located in emerging markets, these risks may be more pronounced.
71
GOLDMAN SACHS INTERNATIONAL EQUITY INSIGHTS FUNDS
Notes to Financial Statements (continued)
October 31, 2014
| 10. INDEMNIFICATIONS |
Under the Trust’s organizational documents, its Trustees, officers, employees and agents are indemnified, to the extent permitted by the Act and state law, against certain liabilities that may arise out of performance of their duties to the Funds. Additionally, in the course of business, the Funds enter into contracts that contain a variety of indemnification clauses. The Funds’ maximum exposure under these arrangements is unknown, as this would involve future claims that may be made against the Funds that have not yet occurred. However, GSAM believes the risk of loss under these arrangements to be remote.
| 11. SUBSEQUENT EVENTS |
With the exception of the conversion of Class B Shares, subsequent events after the Statement of Assets and Liabilities date have been evaluated through the date the financial statements were issued. GSAM has concluded that there is no impact requiring adjustment or disclosure in the financial statements.
72
GOLDMAN SACHS INTERNATIONAL EQUITY INSIGHTS FUNDS
| 12. SUMMARY OF SHARE TRANSACTIONS |
Share activity is as follows:
| Emerging Markets Equity Insights Fund | ||||||||||||||||
|
| |||||||||||||||
| For the Fiscal Year Ended October 31, 2014 | For the Fiscal Year Ended October 31, 2013 | |||||||||||||||
|
| |||||||||||||||
| Shares | Dollars | Shares | Dollars | |||||||||||||
|
| |||||||||||||||
| Class A Shares | ||||||||||||||||
Shares sold | 3,106,867 | $ | 27,111,536 | 2,322,240 | $ | 20,618,692 | ||||||||||
Reinvestment of distributions | 24,616 | 213,173 | 73,688 | 645,508 | ||||||||||||
Shares redeemed | (1,679,618 | ) | (14,419,969 | ) | (5,669,845 | ) | (50,290,832 | ) | ||||||||
| 1,451,865 | 12,904,740 | (3,273,917 | ) | (29,026,632 | ) | |||||||||||
| Class C Shares | ||||||||||||||||
Shares sold | 59,922 | 513,470 | 101,643 | 859,533 | ||||||||||||
Reinvestment of distributions | 921 | 7,932 | 127 | 1,115 | ||||||||||||
Shares redeemed | (65,655 | ) | (556,076 | ) | (17,990 | ) | (158,348 | ) | ||||||||
| (4,812 | ) | (34,674 | ) | 83,780 | 702,300 | |||||||||||
| Institutional Shares | ||||||||||||||||
Shares sold | 30,442,332 | 265,225,820 | 39,610,954 | 344,944,264 | ||||||||||||
Reinvestment of distributions | 871,372 | 7,511,224 | 852,057 | 7,438,458 | ||||||||||||
Shares redeemed | (19,875,721 | ) | (172,622,441 | ) | (33,585,825 | ) | (285,409,911 | ) | ||||||||
| 11,437,983 | 100,114,603 | 6,877,186 | 66,972,811 | |||||||||||||
| Class IR Shares | ||||||||||||||||
Shares sold | 89,237 | 748,653 | 196,365 | 1,628,578 | ||||||||||||
Reinvestment of distributions | 2,504 | 21,586 | 211 | 1,842 | ||||||||||||
Shares redeemed | (178,606 | ) | (1,494,845 | ) | (26,122 | ) | (220,256 | ) | ||||||||
| (86,865 | ) | (724,606 | ) | 170,454 | 1,410,164 | |||||||||||
| Class R(a) | ||||||||||||||||
Shares sold | 118,145 | 1,077,065 | — | — | ||||||||||||
Shares redeemed | (6,521 | ) | (58,402 | ) | — | — | ||||||||||
| 111,624 | 1,018,663 | — | — | |||||||||||||
NET INCREASE | 12,909,795 | $ | 113,278,726 | 3,857,503 | $ | 40,058,643 | ||||||||||
| (a) | Commenced operations on February 28, 2014. |
73
GOLDMAN SACHS INTERNATIONAL EQUITY INSIGHTS FUNDS
Notes to Financial Statements (continued)
October 31, 2014
| 12. SUMMARY OF SHARE TRANSACTIONS (continued) |
Share activity is as follows:
| International Equity Insights Fund | ||||||||||||||||
|
| |||||||||||||||
| For the Fiscal Year Ended October 31, 2014 | For the Fiscal Year Ended October 31, 2013 | |||||||||||||||
|
| |||||||||||||||
| Shares | Dollars | Shares | Dollars | |||||||||||||
|
| |||||||||||||||
| Class A Shares | ||||||||||||||||
Shares sold | 994,006 | $ | 10,922,575 | 2,943,527 | $ | 27,769,199 | ||||||||||
Shares converted from Class B | 8,834 | 97,775 | 10,576 | 103,931 | ||||||||||||
Reinvestment of distributions | 213,135 | 2,272,021 | 751,842 | 6,751,544 | ||||||||||||
Shares redeemed | (2,260,250 | ) | (24,974,383 | ) | (18,647,168 | ) | (178,420,646 | ) | ||||||||
| (1,044,275 | ) | (11,682,012 | ) | (14,941,223 | ) | (143,795,972 | ) | |||||||||
| Class B Shares | ||||||||||||||||
Shares sold | 6,157 | 68,430 | 4,432 | 43,113 | ||||||||||||
Shares converted to Class A | (8,903 | ) | (97,775 | ) | (10,664 | ) | (103,931 | ) | ||||||||
Reinvestment of distributions | 3,037 | 32,250 | 6,687 | 59,782 | ||||||||||||
Shares redeemed | (65,819 | ) | (723,014 | ) | (111,982 | ) | (1,085,097 | ) | ||||||||
| (65,528 | ) | (720,109 | ) | (111,527 | ) | (1,086,133 | ) | |||||||||
| Class C Shares | ||||||||||||||||
Shares sold | 44,285 | 480,131 | 33,474 | 326,046 | ||||||||||||
Reinvestment of distributions | 5,864 | 61,859 | 7,377 | 65,731 | ||||||||||||
Shares redeemed | (51,788 | ) | (558,069 | ) | (96,554 | ) | (910,697 | ) | ||||||||
| (1,639 | ) | (16,079 | ) | (55,703 | ) | (518,920 | ) | |||||||||
| Institutional Shares | ||||||||||||||||
Shares sold | 10,491,344 | 118,751,786 | 35,951,844 | 349,612,138 | ||||||||||||
Reinvestment of distributions | 2,634,973 | 28,747,556 | 2,346,076 | 21,583,896 | ||||||||||||
Shares redeemed | (29,263,086 | ) | (329,167,069 | ) | (19,117,164 | ) | (190,484,919 | ) | ||||||||
| (16,136,769 | ) | (181,667,727 | ) | 19,180,756 | 180,711,115 | |||||||||||
| Service Shares | ||||||||||||||||
Shares sold | 24,284 | 268,840 | 157,165 | 1,507,427 | ||||||||||||
Reinvestment of distributions | 4,316 | 46,355 | 7,351 | 66,527 | ||||||||||||
Shares redeemed | (333,898 | ) | (3,752,225 | ) | (477,512 | ) | (4,689,651 | ) | ||||||||
| (305,298 | ) | (3,437,030 | ) | (312,996 | ) | (3,115,697 | ) | |||||||||
| Class IR Shares | ||||||||||||||||
Shares sold | 3,519 | 38,821 | 44,468 | 435,067 | ||||||||||||
Reinvestment of distributions | 1,216 | 12,760 | 517 | 4,577 | ||||||||||||
Shares redeemed | (21,446 | ) | (224,962 | ) | (9,205 | ) | (92,933 | ) | ||||||||
| (16,711 | ) | (173,381 | ) | 35,780 | 346,711 | |||||||||||
| Class R Shares | ||||||||||||||||
Shares sold | 8,023 | 86,742 | 867 | 8,376 | ||||||||||||
Reinvestment of distributions | 247 | 2,598 | 246 | 2,185 | ||||||||||||
Shares redeemed | (1,736 | ) | (18,947 | ) | (320 | ) | (2,907 | ) | ||||||||
| 6,534 | 70,393 | 793 | 7,654 | |||||||||||||
NET INCREASE (DECREASE) | (17,563,686 | ) | $ | (197,625,945 | ) | 3,795,880 | $ | 32,548,758 | ||||||||
74
GOLDMAN SACHS INTERNATIONAL EQUITY INSIGHTS FUNDS
| 12. SUMMARY OF SHARE TRANSACTIONS (continued) |
Share activity is as follows:
| International Small Cap Insights Fund | ||||||||||||||||
|
| |||||||||||||||
| For the Fiscal Year Ended October 31, 2014 | For the Fiscal Year Ended October 31, 2013 | |||||||||||||||
|
| |||||||||||||||
| Shares | Dollars | Shares | Dollars | |||||||||||||
|
| |||||||||||||||
| Class A Shares | ||||||||||||||||
Shares sold | 14,255,876 | $ | 150,928,252 | 4,782,870 | $ | 45,566,381 | ||||||||||
Reinvestment of distributions | 218,400 | 2,232,053 | 100,341 | 802,726 | ||||||||||||
Shares redeemed | (5,106,460 | ) | (54,190,286 | ) | (2,122,156 | ) | (18,869,127 | ) | ||||||||
| 9,367,816 | 98,970,019 | 2,761,055 | 27,499,980 | |||||||||||||
| Class C Shares | ||||||||||||||||
Shares sold | 1,790,510 | 18,547,023 | 256,792 | 2,479,909 | ||||||||||||
Reinvestment of distributions | 14,055 | 140,693 | 4,103 | 32,332 | ||||||||||||
Shares redeemed | (179,887 | ) | (1,805,896 | ) | (33,257 | ) | (292,641 | ) | ||||||||
| 1,624,678 | 16,881,820 | 227,638 | 2,219,600 | |||||||||||||
| Institutional Shares | ||||||||||||||||
Shares sold | 42,785,209 | 453,931,646 | 21,486,763 | 195,958,498 | ||||||||||||
Reinvestment of distributions | 1,522,029 | 15,524,695 | 1,199,773 | 9,562,193 | ||||||||||||
Shares redeemed | (19,364,419 | ) | (199,413,158 | ) | (10,479,262 | ) | (92,855,065 | ) | ||||||||
| 24,942,819 | 270,043,183 | 12,207,274 | 112,665,626 | |||||||||||||
| Class IR Shares | ||||||||||||||||
Shares sold | 2,844,465 | 30,173,836 | 348,331 | 3,416,621 | ||||||||||||
Reinvestment of distributions | 17,549 | 178,644 | 2,249 | 17,900 | ||||||||||||
Shares redeemed | (1,290,996 | ) | (12,931,778 | ) | (51,893 | ) | (474,158 | ) | ||||||||
| 1,571,018 | 17,420,702 | 298,687 | 2,960,363 | |||||||||||||
NET INCREASE | 37,506,331 | $ | 403,315,724 | 15,494,654 | $ | 145,345,569 | ||||||||||
75
Report of Independent Registered Public Accounting Firm
To the Board of Trustees and Shareholders of
Goldman Sachs Trust — Goldman Sachs International Equity Insights Funds:
In our opinion, the accompanying statements of assets and liabilities, including the schedules of investments, and the related statements of operations and of changes in net assets and the financial highlights present fairly, in all material respects, the financial position of Goldman Sachs Emerging Markets Equity Insights Fund, Goldman Sachs International Equity Insights Fund and Goldman Sachs International Small Cap Insights Fund, funds of Goldman Sachs Trust, at October 31, 2014, and the results of each of their operations, the changes in each of their net assets and the financial highlights for each of the periods indicated, in conformity with accounting principles generally accepted in the United States of America. These financial statements and financial highlights (hereafter referred to as “financial statements”) are the responsibility of the International Equity Insights Funds’ management. Our responsibility is to express an opinion on these financial statements based on our audits. We conducted our audits of these financial statements in accordance with the standards of the Public Company Accounting Oversight Board (United States). Those standards require that we plan and perform the audit to obtain reasonable assurance about whether the financial statements are free of material misstatement. An audit includes examining, on a test basis, evidence supporting the amounts and disclosures in the financial statements, assessing the accounting principles used and significant estimates made by management, and evaluating the overall financial statement presentation. We believe that our audits, which included confirmation of securities at October 31, 2014 by correspondence with the custodian, transfer agent of investment companies, brokers, and the application of alternative auditing procedures where securities purchased confirmations had not been received, provide a reasonable basis for our opinion.
PricewaterhouseCoopers LLP
Boston, Massachusetts
December 23, 2014
76
GOLDMAN SACHS INTERNATIONAL EQUITY INSIGHTS FUNDS
Fund Expenses — Six Month Period Ended October 31, 2014 (Unaudited)
As a shareholder of Class A, Class B, Class C, Institutional, Service, Class IR or Class R Shares of a Fund you incur two types of costs: (1) transaction costs, including sales charges on purchase payments (with respect to Class A Shares) and contingent deferred sales charges on redemptions (with respect to Class B and Class C Shares); and (2) ongoing costs, including management fees; distribution and service (12b-1) fees (with respect to Class A, Class B, Class C and Class R Shares); and other Fund expenses. This example is intended to help you understand your ongoing costs (in dollars) of investing in Class A, Class B, Class C, Institutional, Service, Class IR and Class R Shares of the Funds and to compare these costs with the ongoing costs of investing in other mutual funds.
The example is based on an investment of $1,000 invested at the beginning of the period and held for the entire period from May 1, 2014 through October 31, 2014.
Actual Expenses — The first line under each share class in the table below provides information about actual account values and actual expenses. You may use the information in this line, together with the amount you invested, to estimate the expenses that you paid over the period. Simply divide your account value by $1,000 (for example, an $8,600 account value divided by $1,000=8.6), then multiply the result by the number in the first line under the heading entitled “Expenses Paid” to estimate the expenses you paid on your account during this period.
Hypothetical Example for Comparison Purposes — The second line under each share class in the table below provides information about hypothetical account values and hypothetical expenses based on the Funds’ actual net expense ratio and an assumed rate of return of 5% per year before expenses, which is not the Funds’ actual return. The hypothetical account values and expenses may not be used to estimate the actual ending account balance or expenses you paid for the period. You may use this information to compare the ongoing costs of investing in the Funds and other funds. To do so, compare this 5% hypothetical example with the 5% hypothetical examples that appear in the shareholder reports of the other funds.
Please note that the expenses shown in the table are meant to highlight your ongoing costs only and do not reflect any transactional costs, such as sales charges, redemption fees or exchange fees. Therefore, the second line of the table is useful in comparing ongoing costs only, and will not help you determine the relative total costs of owning different funds. In addition, if these transactional costs were included, your costs would have been higher.
| Emerging Markets Equity Insights Fund | International Equity Insights Fund | International Small Cap Insights Fund | ||||||||||||||||||||||||||||||||||
| Share Class | Beginning Account Value 05/01/14 | Ending Account Value 10/31/14 | Expenses Paid for the 6 Months Ended 10/31/14* | Beginning Account Value 05/01/14 | Ending Account Value 10/31/14 | Expenses Paid for the 6 Months Ended 10/31/14* | Beginning Account Value 05/01/14 | Ending Account Value 10/31/14 | Expenses Paid for the 6 Months Ended 10/31/14* | |||||||||||||||||||||||||||
| Class A | ||||||||||||||||||||||||||||||||||||
Actual | $ | 1,000 | $ | 1,055.20 | $ | 8.18 | $ | 1,000 | $ | 954.50 | $ | 6.36 | $ | 1,000 | $ | 933.90 | $ | 6.34 | ||||||||||||||||||
Hypothetical 5% return | 1,000 | 1,017.24 | + | 8.03 | 1,000 | 1,018.70 | + | 6.56 | 1,000 | 1,018.65 | + | 6.61 | ||||||||||||||||||||||||
| Class B | ||||||||||||||||||||||||||||||||||||
Actual | N/A | N/A | N/A | 1,000 | 950.50 | 10.03 | N/A | N/A | N/A | |||||||||||||||||||||||||||
Hypothetical 5% return | N/A | N/A | N/A | 1,000 | 1,014.92 | + | 10.36 | N/A | N/A | N/A | ||||||||||||||||||||||||||
| Class C | ||||||||||||||||||||||||||||||||||||
Actual | 1,000 | 1,050.90 | 12.04 | 1,000 | 951.10 | 10.03 | 1,000 | 930.40 | 9.97 | |||||||||||||||||||||||||||
Hypothetical 5% return | 1,000 | 1,013.46 | + | 11.82 | 1,000 | 1,014.92 | + | 10.36 | 1,000 | 1,014.87 | + | 10.41 | ||||||||||||||||||||||||
| Institutional | ||||||||||||||||||||||||||||||||||||
Actual | 1,000 | 1,056.50 | 6.12 | 1,000 | 956.40 | 4.39 | 1,000 | 935.80 | 4.39 | |||||||||||||||||||||||||||
Hypothetical 5% return | 1,000 | 1,019.26 | + | 6.01 | 1,000 | 1,020.72 | + | 4.53 | 1,000 | 1,020.67 | + | 4.58 | ||||||||||||||||||||||||
| Service | ||||||||||||||||||||||||||||||||||||
Actual | N/A | N/A | N/A | 1,000 | 953.90 | 6.85 | N/A | N/A | N/A | |||||||||||||||||||||||||||
Hypothetical 5% return | N/A | N/A | N/A | 1,000 | 1,018.20 | + | 7.07 | N/A | N/A | N/A | ||||||||||||||||||||||||||
| Class IR | ||||||||||||||||||||||||||||||||||||
Actual | 1,000 | 1,056.50 | 6.89 | 1,000 | 955.50 | 5.13 | 1,000 | 934.60 | 5.12 | |||||||||||||||||||||||||||
Hypothetical 5% return | 1,000 | 1,018.50 | + | 6.77 | 1,000 | 1,019.96 | + | 5.30 | 1,000 | 1,019.91 | + | 5.35 | ||||||||||||||||||||||||
| Class R(a) | ||||||||||||||||||||||||||||||||||||
Actual | 1,000 | 1,053.00 | 9.47 | 1,000 | 953.80 | 7.58 | N/A | N/A | N/A | |||||||||||||||||||||||||||
Hypothetical 5% return | 1,000 | 1,015.98 | + | 9.30 | 1,000 | 1,017.44 | + | 7.83 | N/A | N/A | N/A | |||||||||||||||||||||||||
| (a) | Commenced operations on February 28, 2014 for the Emerging Markets Equity Insights Fund. |
| * | Expenses are calculated using each Fund’s annualized net expense ratio for each class, which represents the ongoing expenses as a percentage of net assets for the six months ended October 31, 2014. Expenses are calculated by multiplying the annualized net expense ratio by the average account value for the period; then multiplying the result by the number of days in the most recent fiscal half year; and then dividing that result by the number of days in the fiscal year. The annualized net expense ratios for the period were as follows: |
| Fund | Class A | Class B | Class C | Institutional | Service | Class IR | Class R | |||||||||||||||||||||
Emerging Markets Equity Insights | 1.58 | % | N/A | 2.33 | % | 1.18 | % | N/A | 1.33 | % | 1.83 | % | ||||||||||||||||
International Equity Insights | 1.29 | 2.04 | 2.04 | 0.89 | 1.39 | 1.04 | 1.54 | |||||||||||||||||||||
International Small Cap Insights | 1.30 | N/A | 2.05 | 0.90 | N/A | 1.05 | N/A | |||||||||||||||||||||
| + | Hypothetical expenses are based on each Fund's actual annualized net expense ratios and an assumed rate of return of 5% per year before expenses. |
77
GOLDMAN SACHS INTERNATIONAL EQUITY INSIGHTS FUNDS
Statement Regarding Basis for Approval of Management Agreement (Unaudited)
Background
The Goldman Sachs Emerging Markets Equity Insights Fund, Goldman Sachs International Equity Insights Fund, and Goldman Sachs International Small Cap Insights Funds (the “Funds”) are investment portfolios of Goldman Sachs Trust (the “Trust”). The Board of Trustees oversees the management of the Trust and reviews the investment performance and expenses of the Funds at regularly scheduled meetings held during the year. In addition, the Board of Trustees determines annually whether to approve the continuance of the Trust’s investment management agreement (the “Management Agreement”) with Goldman Sachs Asset Management, L.P. (the “Investment Adviser”) on behalf of the Funds.
The Management Agreement was most recently approved for continuation until June 30, 2015 by the Board of Trustees, including those Trustees who are not parties to the Management Agreement or “interested persons” (as defined in the Investment Company Act of 1940, as amended) of any party thereto (the “Independent Trustees”), at a meeting held on June 11-12, 2014 (the “Annual Meeting”).
The review process undertaken by the Trustees spans the course of the year and culminates with the Annual Meeting. To assist the Trustees in their deliberations, the Trustees have established a Contract Review Committee (the “Committee”), comprised of the Independent Trustees. The Committee held four meetings over the course of the year since the Management Agreement was last approved. At those Committee meetings, regularly scheduled Board or other committee meetings and/or the Annual Meeting, the Board, or the Independent Trustees, as applicable, considered matters relating to the Management Agreement, including:
| (a) | the nature and quality of the advisory, administrative and other services provided to the Funds by the Investment Adviser and its affiliates, including information about: |
| (i) | the structure, staff and capabilities of the Investment Adviser and its portfolio management teams; |
| (ii) | the groups within the Investment Adviser and its affiliates that support the portfolio management teams or provide other types of necessary services, including fund services groups (e.g., accounting and financial reporting, tax, shareholder services and operations), controls and risk management groups (e.g., legal, compliance, valuation oversight, credit risk management, internal audit, compliance testing, market risk analysis, finance and strategy and central funding), sales and distribution support groups and others (e.g., information technology and training); |
| (iii) | trends in headcount; |
| (iv) | the Investment Adviser’s financial resources and ability to hire and retain talented personnel and strengthen its operations; and |
| (v) | the parent company’s support of the Investment Adviser and its mutual fund business, as expressed by the firm’s senior management; |
| (b) | information on the investment performance of each Fund, including comparisons to the performance of similar mutual funds, as provided by a third party mutual fund data provider engaged as part of the contract review process (the “Outside Data Provider”), and benchmark performance indices, and general investment outlooks in the markets in which the Funds invest; |
| (c) | the terms of the Management Agreement and agreements with affiliated service providers entered into by the Trust on behalf of the Funds; |
| (d) | expense information for the Funds, including: |
| (i) | the relative management fee and expense levels of each Fund as compared to those of comparable funds managed by other advisers, as provided by the Outside Data Provider; |
| (ii) | each Fund’s expense trends over time; and |
| (iii) | to the extent the Investment Adviser manages institutional accounts or collective investment vehicles having investment objectives and policies similar to those of the Funds, comparative information on the advisory fees charged and services provided to those accounts by the Investment Adviser; |
| (e) | with respect to the extensive investment performance and expense comparison data provided by the Outside Data Provider, its processes in producing that data for the Funds; |
| (f) | the undertakings of the Investment Adviser to limit certain expenses of each Fund that exceed specified levels, and a summary of contractual fee reductions made by the Investment Adviser and/or its affiliates over the past several years with respect to the Funds; |
| (g) | information relating to the profitability of the Management Agreement and the transfer agency and distribution and service arrangements of each Fund and the Trust as a whole to the Investment Adviser and its affiliates; |
| (h) | whether each Fund’s existing management fee schedule adequately addressed any economies of scale; |
78
GOLDMAN SACHS INTERNATIONAL EQUITY INSIGHTS FUNDS
Statement Regarding Basis for Approval of Management Agreement (Unaudited) (continued)
| (i) | a summary of the “fall-out” benefits derived by the Investment Adviser and its affiliates from their relationships with the Funds, including the fees received by the Investment Adviser’s affiliates from the Funds for transfer agency, securities lending, portfolio trading, distribution and other services; |
| (j) | a summary of potential benefits derived by the Funds as a result of their relationship with the Investment Adviser; |
| (k) | information regarding commissions paid by the Funds and broker oversight, other information regarding portfolio trading and how the Investment Adviser carries out its duty to seek best execution; |
| (l) | portfolio manager ownership of Fund shares; the manner in which portfolio manager compensation is determined; and the number and types of accounts managed by the portfolio managers; |
| (m) | the nature and quality of the services provided to the Funds by their unaffiliated service providers, and the Investment Adviser’s general oversight and evaluation (including reports on due diligence) of those service providers as part of the administration services provided under the Management Agreement; and |
| (n) | the Investment Adviser’s processes and policies addressing various types of potential conflicts of interest; its approach to risk management; the annual review of the effectiveness of the Funds’ compliance program; and periodic compliance reports. |
The Trustees also received an overview of the Funds’ distribution arrangements. They received information regarding the Funds’ assets, share purchase and redemption activity and the payment of Rule 12b-1 distribution and service fees by the Funds and the payment of non-Rule 12b-1 shareholder service and/or administration fees with respect to the International Equity Insights Fund’s Service Shares. Information was also provided to the Trustees relating to revenue sharing payments made by and services provided by the Investment Adviser and its affiliates to intermediaries that promote the sale, distribution and/or servicing of Fund shares.
The presentations made at the Board and Committee meetings and at the Annual Meeting encompassed the Funds and other mutual fund portfolios for which the Board of Trustees has responsibility. In evaluating the Management Agreement at the Annual Meeting, the Trustees relied upon their knowledge, resulting from their meetings and other interactions throughout the year, of the Investment Adviser, its affiliates, their services and the Funds. In conjunction with these meetings, the Trustees received written materials and oral presentations on the topics covered, and were advised by their independent legal counsel regarding their responsibilities and other regulatory requirements related to the approval and continuation of mutual fund investment management agreements under applicable law. In addition, the Investment Adviser and its affiliates provided the Independent Trustees with a written response to a formal request for information sent on behalf of the Independent Trustees by their independent legal counsel. During the course of their deliberations, the Independent Trustees met in executive sessions with their independent legal counsel, without representatives of the Investment Adviser or its affiliates present. The Independent Trustees also discussed the broad range of other investment choices that are available to Fund investors, including the availability of comparable funds managed by other advisers.
Nature, Extent and Quality of the Services Provided Under the Management Agreement
As part of their review, the Trustees considered the nature, extent and quality of the services provided by the Investment Adviser. In this regard, the Trustees considered both the investment advisory services and non-advisory services that are provided to the Funds by the Investment Adviser and its affiliates. The Trustees noted the transition in the leadership and changes in personnel of various of the Investment Adviser’s portfolio management teams that had occurred in recent periods, and the ongoing recruitment efforts aimed at bringing high quality investment talent to the Investment Adviser. They also noted the Investment Adviser’s commitment to maintaining high quality systems. The Trustees concluded that the Investment Adviser continued to commit substantial financial and operational resources to the Funds and expressed confidence that the Investment Adviser would continue to do so in the future. The Trustees also recognized that the Investment Adviser had made significant commitments to address regulatory compliance requirements applicable to the Funds and the Investment Adviser.
Investment Performance
The Trustees also considered the investment performance of the Funds. In this regard, they compared the investment performance of each Fund to its peers using rankings and ratings compiled by the Outside Data Provider as of December 31, 2013, and updated performance information prepared by the Investment Adviser using the peer groups identified by the Outside Data Provider as of March 31, 2014. The information on each Fund’s investment performance was provided for the one-, three-, five- and ten-year periods ending on the applicable dates, to the extent that each Fund had been in existence for those periods. The Trustees also reviewed each Fund’s investment performance over time (including on a year-by-year basis) relative to its performance benchmark. As part of this review, they considered the investment performance trends of the Funds over time, and reviewed the investment performance of each Fund in light of its investment objective and policies and market conditions.
79
GOLDMAN SACHS INTERNATIONAL EQUITY INSIGHTS FUNDS
Statement Regarding Basis for Approval of Management Agreement (Unaudited) (continued)
In addition, the Trustees considered materials prepared and presentations made by the Investment Adviser’s senior management and portfolio management personnel, in which Fund performance was assessed. The Trustees also considered the Investment Adviser’s periodic reports with respect to the Funds’ risk profiles, and how the Investment Adviser’s approach to risk monitoring and management influences portfolio management. They noted the efforts of the Funds’ portfolio management team to enhance the investment models used in managing the Funds.
The Trustees observed that the Emerging Markets Equity Insights Fund’s Class A Shares had placed in the second quartile of the Fund’s peer group for the three- and five-year periods and in the fourth quartile for the one-year period, and had outperformed its benchmark index for the three- and five-year periods and underperformed for the one-year period ended March 31, 2014. They noted that the International Equity Insights Fund’s Class A Shares had placed in the second quartile of the Fund’s peer group for the one-year period and in the third quartile for the three-, five-, and ten-year periods, and had outperformed the Fund’s benchmark index for the one-year period and underperformed for the three-, five-, and ten-year periods ended March 31, 2014. They noted that the International Small Cap Insights Fund’s Class A Shares had placed in the top half of the Fund’s peer group and had outperformed the Fund’s benchmark index for the one-, three-, and five-year periods ended March 31, 2014.
Costs of Services Provided and Competitive Information
The Trustees considered the contractual terms of the Management Agreement and the fee rates payable by each Fund thereunder. In this regard, the Trustees considered information on the services rendered by the Investment Adviser to the Funds, which included both advisory and administrative services that were directed to the needs and operations of the Funds as registered mutual funds.
In particular, the Trustees reviewed analyses prepared by the Outside Data Provider regarding the expense rankings of the Funds. The analyses provided a comparison of the Funds’ management fees and breakpoints to those of relevant peer groups and category universes; an expense analysis which compared each Fund’s overall net and gross expenses to a peer group and a category universe; and a five-year history comparing each Fund’s net expenses to the peer and category medians. The analyses also compared each Fund’s transfer agency, custody, and distribution fees, other expenses and fee waivers/reimbursements to those of the peer group and category medians. The Trustees concluded that the comparisons provided by the Outside Data Provider were useful in evaluating the reasonableness of the management fees and total expenses paid by the Funds.
In addition, the Trustees considered the Investment Adviser’s undertakings to limit certain expenses of the Funds that exceed specified levels. The Trustees also noted that certain changes were being made to existing fee waiver or expense limitation arrangements of the International Equity Insights Fund that would have the effect of lowering total Fund expenses, with such changes taking effect in connection with the Fund’s next annual registration statement update. They also considered, to the extent that the Investment Adviser manages institutional accounts or collective investment vehicles having investment objectives and policies similar to those of the Funds, comparative fee information for services provided by the Investment Adviser to those accounts, and information that indicated that services provided to the Funds differed in various significant respects from the services provided to institutional accounts, which generally operated under less stringent legal and regulatory structures, required fewer services from the Investment Adviser to a smaller number of client contact points, were less time-intensive and paid lower fees.
In addition, the Trustees noted that shareholders are able to redeem their Fund shares at any time if shareholders believe that the Fund fees and expenses are too high or if they are dissatisfied with the performance of the Fund.
Profitability
The Trustees reviewed the Investment Adviser’s revenues and pre-tax profit margins with respect to the Trust and each of the Funds. In this regard the Trustees noted that they had received, among other things, profitability analyses and summaries, revenue and expense schedules by Fund and by function (i.e., investment management, transfer agency and distribution and service) and information on the Investment Adviser’s expense allocation methodology. They observed that the profitability and expense figures are substantially similar to those used by the Investment Adviser for many internal purposes, including compensation decisions among various business groups, and are thus subject to a vigorous internal debate about how certain revenue and expenses should be allocated. The Trustees also noted that the internal audit group within the Goldman Sachs organization had audited the expense allocation methodology and was satisfied with the reasonableness, consistency, and accuracy of the Investment Adviser’s expense allocation methodology and profitability analysis calculations. Profitability data for the Trust and each Fund were provided for 2013 and 2012, and the Trustees considered this information in relation to the Investment Adviser’s overall profitability. The Trustees considered the Investment Adviser’s revenues and pre-tax profit margins both in absolute terms and in comparison to information on the reported pre-tax profit margins earned by certain other asset management firms.
80
GOLDMAN SACHS INTERNATIONAL EQUITY INSIGHTS FUNDS
Statement Regarding Basis for Approval of Management Agreement (Unaudited) (continued)
Economies of Scale
The Trustees considered the information that had been provided regarding the Investment Adviser’s profitability. The Trustees also considered the breakpoints in the fee rate payable under the Management Agreement for each of the Funds at the following annual percentage rates of the average daily net assets of the Funds:
| Emerging Markets Equity Insights Fund | International Equity Insights Fund | International Small Cap Equity Insights Fund | ||||||||||
| First $1 billion | 1.00 | % | 0.85 | % | 0.85 | % | ||||||
| Next $1 billion | 1.00 | 0.77 | 0.85 | |||||||||
| Next $3 billion | 0.90 | 0.73 | 0.77 | |||||||||
| Next $3 billion | 0.86 | 0.72 | 0.73 | |||||||||
| Over $8 billion | 0.84 | 0.71 | 0.72 | |||||||||
The Trustees noted that the breakpoints were meant to share potential economies of scale, if any, with the Funds and their shareholders as assets under management reach those asset levels. The Trustees considered the amounts of assets in the Funds; the Funds’ recent share purchase and redemption activity; the information provided by the Investment Adviser relating to the costs of the services provided by the Investment Adviser and its affiliates and their realized profits; information comparing fee rates charged by the Investment Adviser with fee rates charged to other funds in the peer groups; and the Investment Adviser’s undertakings to limit certain expenses of the Funds that exceed specified levels. Upon reviewing these matters at the Annual Meeting, the Trustees concluded that the fee breakpoints represented a means of assuring that benefits of scalability, if any, would be passed along to shareholders at the specified asset levels.
Other Benefits to the Investment Adviser and Its Affiliates
The Trustees also considered the other benefits derived by the Investment Adviser and its affiliates from their relationships with the Funds as stated above, including: (a) transfer agency fees received by Goldman, Sachs & Co. (“Goldman Sachs”); (b) brokerage and futures commissions earned by Goldman Sachs for executing securities and futures transactions on behalf of the Funds; (c) trading efficiencies resulting from aggregation of orders of the Funds with those for other funds or accounts managed by the Investment Adviser; (d) fees earned by Goldman Sachs Agency Lending (“GSAL”), an affiliate of the Investment Adviser, as securities lending agent (and fees earned by the Investment Adviser for managing the fund in which the Funds’ cash collateral is invested); (e) the Investment Adviser’s ability to leverage the infrastructure designed to service the Funds on behalf of its other clients; (f) the Investment Adviser’s ability to cross-market other products and services to Fund shareholders; (g) Goldman Sachs’ retention of certain fees as Fund Distributor; (h) the Investment Adviser’s ability to negotiate better pricing with custodians on behalf of its other clients, as a result of the relationship with the Funds; and (i) the possibility that the working relationship between the Investment Adviser and the Funds’ third party service providers may cause those service providers to be more likely to do business with other areas of Goldman Sachs. In the course of considering the foregoing, the Independent Trustees requested and received further information quantifying certain of these fall-out benefits.
They also considered the benefits to GSAL and the Investment Adviser from the Funds’ ability to participate in the securities lending program and observed that, although the benefits to GSAL and the Investment Adviser were meaningful, the benefits to the Funds from their participation in the program were greater, as measured by the revenue they received by those Funds in connection with the program.
Other Benefits to the Funds and Their Shareholders
The Trustees also noted that the Funds receive certain potential benefits as a result of their relationship with the Investment Adviser, including: (a) trading efficiencies resulting from aggregation of orders of the Funds with those of other funds or accounts managed by the Investment Adviser; (b) enhanced servicing from vendors because of the volume of business generated by the Investment Adviser and its affiliates; (c) enhanced servicing from broker-dealers because of the volume of business generated by the Investment Adviser and its affiliates; (d) the Investment Adviser’s ability to negotiate favorable terms with derivatives counterparties on behalf of the Funds as a result of the size and reputation of the Goldman Sachs organization; (e) the Investment Adviser’s knowledge and experience gained from managing other accounts and products; (f) the Investment Adviser’s ability to hire and retain qualified personnel to provide services to the Funds because of the reputation of the Goldman Sachs organization; (g) the Funds’ access, through the Investment Adviser, to certain firmwide resources (e.g., proprietary risk management systems and databases), subject to certain restrictions; and (h) the Funds’ access to certain affiliated distribution channels. In addition, the
81
GOLDMAN SACHS INTERNATIONAL EQUITY INSIGHTS FUNDS
Statement Regarding Basis for Approval of Management Agreement (Unaudited) (continued)
Trustees noted the competitive nature of the mutual fund marketplace, and considered that many of the Funds’ shareholders invested in the Funds in part because of the Funds’ relationship with the Investment Adviser and that those shareholders have a general expectation that the relationship will continue.
Conclusion
In connection with their consideration of the Management Agreement, the Trustees gave weight to each of the factors described above, but did not identify any particular factor as controlling their decision. After deliberation and consideration of all of the information provided, including the factors described above, the Trustees concluded, in the exercise of their business judgment, that the management fees paid by each of the Funds were reasonable in light of the services provided to it by the Investment Adviser, the Investment Adviser’s costs and each Fund’s current and reasonably foreseeable asset levels. The Trustees concluded that the Investment Adviser’s continued management likely would benefit each Fund and its shareholders and that the Management Agreement should be approved and continued with respect to each Fund until June 30, 2015.
82
GOLDMAN SACHS INTERNATIONAL EQUITY INSIGHTS FUNDS
Trustees and Officers (Unaudited)
Independent Trustees
Name, | Position(s) Held with the Trust | Term of Office and | Principal Occupation(s) During Past 5 Years | Number of Portfolios in Fund Complex Overseen by Trustee3 | Other Directorships Held by Trustee4 | |||||
Ashok N. Bakhru Age: 72 | Chairman of the Board of Trustees | Since 1996 (Trustee since 1991) | Mr. Bakhru is retired. He was formerly Director, Apollo Investment Corporation (a business development company) (2008-2013); President, ABN Associates (a management and financial consulting firm) (1994-1996 and 1998-2012); Trustee, Scholarship America (1998-2005); Trustee, Institute for Higher Education Policy (2003-2008); Director, Private Equity Investors — III and IV (1998-2007), and Equity-Linked Investors II (April 2002-2007).
Chairman of the Board of Trustees — Goldman Sachs Fund Complex. | 112 | None | |||||
John P. Coblentz, Jr. Age: 73 | Trustee | Since 2003 | Mr. Coblentz is retired. Formerly, he was Partner, Deloitte & Touche LLP (1975-2003); Director, Emerging Markets Group, Ltd. (2004-2006); and Director, Elderhostel, Inc. (2006-2012).
Trustee — Goldman Sachs Fund Complex. | 112 | None | |||||
Diana M. Daniels Age: 65 | Trustee | Since 2007 | Ms. Daniels is retired. Formerly, she was Vice President, General Counsel and Secretary, The Washington Post Company (1991-2006). Ms. Daniels serves as a Presidential Councillor of Cornell University (2013-Present); Member, Advisory Board, Psychology Without Borders (international humanitarian aid organization) (2007-Present), and former Member of the Legal Advisory Board, New York Stock Exchange (2003-2006) and of the Corporate Advisory Board, Standish Mellon Management Advisors (2006-2007).
Trustee — Goldman Sachs Fund Complex. | 108 | None | |||||
Joseph P. LoRusso Age: 57 | Trustee | Since 2010 | Mr. LoRusso is retired. Formerly, he was President, Fidelity Investments Institutional Services Co. (“FIIS”) (2002-2008); Director, FIIS (2002-2008); Director, Fidelity Investments Institutional Operations Company (2003-2007); Executive Officer, Fidelity Distributors Corporation (2007-2008).
Trustee — Goldman Sachs Fund Complex. | 108 | None | |||||
Herbert J. Markley Age: 64 | Trustee | Since 2013 | Mr. Markley is retired. Formerly, he was Executive Vice President, Deere & Company (an agricultural and construction equipment manufacturer) (2007-2009), and President, Agricultural Division, Deere & Company (2001-2007).
Trustee — Goldman Sachs Fund Complex. | 108 | None | |||||
Jessica Palmer Age: 65 | Trustee | Since 2007 | Ms. Palmer is retired. She is Director, Emerson Center for the Arts and Culture (2011-Present); and was formerly a Consultant, Citigroup Human Resources Department (2007-2008); Managing Director, Citigroup Corporate and Investment Banking (previously, Salomon Smith Barney/Salomon Brothers) (1984-2006). Ms. Palmer was a Member of the Board of Trustees of Indian Mountain School (private elementary and secondary school) (2004-2009).
Trustee — Goldman Sachs Fund Complex. | 108 | None | |||||
Richard P. Strubel Age: 75 | Trustee | Since 1987 | Mr. Strubel is retired. Formerly, he was Director, Cardean Learning Group (provider of educational services via the internet) (2003-2008); and Director, Gildan Activewear Inc. (a clothing marketing and manufacturing company) (2000-2014). He serves as Trustee, Emeritus, The University of Chicago (1987-Present).
Trustee — Goldman Sachs Fund Complex. | 112 | The Northern Trust Mutual Fund Complex (56 Portfolios) (Chairman of the Board of Trustees) | |||||
Roy W. Templin Age: 54 | Trustee | Since 2013 | Mr. Templin is retired. He is Chairman of the Board of Directors, Con-Way Incorporated (2012-Present); and was formerly Executive Vice President and Chief Financial Officer, Whirlpool Corporation (an appliance manufacturer and marketer) (2004-2012).
Trustee — Goldman Sachs Fund Complex | 108 | Con-Way Incorporated (a transportation, supply-chain management and logistics services company) | |||||
83
GOLDMAN SACHS INTERNATIONAL EQUITY INSIGHTS FUNDS
Trustees and Officers (Unaudited) (continued)
Interested Trustees*
Name, | Position(s) Held with the Trust | Term of Office and | Principal Occupation(s) During Past 5 Years | Number of Portfolios in Fund Complex Overseen by Trustee3 | Other Directorships Held by Trustee4 | |||||
James A. McNamara Age: 52 | President and Trustee | Since 2007 | Managing Director, Goldman Sachs (December 1998-Present); Director of Institutional Fund Sales, GSAM (April 1998-December 2000); and Senior Vice President and Manager, Dreyfus Institutional Service Corporation (January 1993- April 1998).
President — Goldman Sachs Fund Complex (November 2007-Present); Senior Vice President — Goldman Sachs Fund Complex (May 2007-November 2007); and Vice President — Goldman Sachs Fund Complex (2001-2007).
Trustee — Goldman Sachs Fund Complex (November 2007-Present and December 2002-May 2004). | 111 | None | |||||
Alan A. Shuch Age: 64 | Trustee | Since 1990 | Advisory Director — GSAM (May 1999-Present); Consultant to GSAM (December 1994-May 1999); and Limited Partner, Goldman Sachs (December 1994-May 1999).
Trustee — Goldman Sachs Fund Complex. | 108 | None | |||||
| * | These persons are considered to be “Interested Trustees” because they hold positions with Goldman Sachs and own securities issued by The Goldman Sachs Group, Inc. Each Interested Trustee holds comparable positions with certain other companies of which Goldman Sachs, GSAM or an affiliate thereof is the investment adviser, administrator and/or distributor. |
| 1 | Each Trustee may be contacted by writing to the Trustee, c/o Goldman Sachs, 200 West Street, New York, New York, 10282, Attn: Caroline Kraus. Information is provided as of October 31, 2014. |
| 2 | Each Trustee holds office for an indefinite term until the earliest of: (a) the election of his or her successor; (b) the date the Trustee resigns or is removed by the Board of Trustees or shareholders, in accordance with the Trust’s Declaration of Trust; (c) the conclusion of the first Board meeting held subsequent to the day the Trustee attains the age of 74 years, subject to a waiver by a majority of the Trustees (in accordance with the current resolutions of the Board of Trustees, which may be changed by the Trustees without shareholder vote); or (d) the termination of the Trust. By resolution of the Board of Trustees determining that an extension of service would be beneficial to the Trust, the retirement age has been extended with respect to Richard P. Strubel. |
| 3 | The Goldman Sachs Fund Complex consists of the Trust and Goldman Sachs Variable Insurance Trust (“GSVIT”). As of October 31, 2014, the Trust consisted of 94 portfolios (88 of which offered shares to the public) and GSVIT consisted of 14 portfolios. The Goldman Sachs Fund Complex also includes, with respect to Messrs. Bakhru, Coblentz and Strubel, Goldman Sachs Trust II (“GST II”), Goldman Sachs BDC. Inc. (“GSBDC”), Goldman Sachs MLP Income Opportunities Fund (“GSMLP”) and Goldman Sachs MLP and Energy Renaissance Fund (“GSMER”), and with respect to Mr. McNamara, GSTII, GSMLP and GSMER. GSTII, GSBDC, GSMLP and GSMER each consisted of one portfolio. As of October 31, 2014, GSBDC had not offered shares to the public. |
| 4 | This column includes only directorships of companies required to report to the Securities and Exchange Commission under the Securities Exchange Act of 1934 (i.e., “public companies”) or other investment companies registered under the Act. |
Additional information about the Trustees is available in the Funds’ Statement of Additional Information, which can be obtained from Goldman Sachs free of charge by calling this toll-free number (in the United States of America): 1-800-292-4726.
84
GOLDMAN SACHS INTERNATIONAL EQUITY INSIGHTS FUNDS
Trustees and Officers (Unaudited) (continued)
Officers of the Trust*
Name, Address and Age1 | Position(s) Held With the Trust | Term of Office and | Principal Occupation(s) During Past 5 Years | |||
James A. McNamara 200 West Street New York, NY 10282 Age: 52 | President and Trustee | Since 2007 | Managing Director, Goldman Sachs (December 1998-Present); Director of Institutional Fund Sales, GSAM (April 1998-December 2000); and Senior Vice President and Manager, Dreyfus Institutional Service Corporation (January 1993-April 1998).
President — Goldman Sachs Fund Complex (November 2007-Present); Senior Vice President — Goldman Sachs Fund Complex (May 2007-November 2007); and Vice President — Goldman Sachs Fund Complex (2001-2007).
Trustee — Goldman Sachs Fund Complex (November 2007-Present and December 2002-May 2004). | |||
Caroline Kraus 200 West Street New York, NY 10282 Age: 37 | Secretary | Since 2012 | Vice President, Goldman Sachs (August 2006-Present); Associate General Counsel, Goldman Sachs (2012-Present); Assistant General Counsel, Goldman Sachs (August 2006-December 2011) and Associate, Weil, Gotshal & Manges-LLP; (2002-2006).
Secretary — Goldman Sachs Fund Complex (August 2012-Present) and Assistant Secretary — Goldman Sachs Fund Complex (June 2012-August 2012). | |||
Scott M. McHugh 200 West Street New York, NY 10282 Age: 43 | Principal Financial Officer, Senior Vice President and Treasurer | Since 2009 (Principal Financial Officer since 2013) | Vice President, Goldman Sachs (February 2007-Present); Assistant Treasurer of certain mutual funds administered by DWS Scudder (2005-2007); and Director (2005-2007), Vice President (2000-2005) and Assistant Vice President (1998-2000), Deutsche Asset Management or its predecessor (1998-2007).
Principal Financial Officer — Goldman Sachs Fund Complex (November 2013-Present); Treasurer — Goldman Sachs Fund Complex (October 2009-Present); Senior Vice President — Goldman Sachs Fund Complex (November 2009-Present); and Assistant Treasurer — Goldman Sachs Fund Complex (May 2007-October 2009). | |||
| * | Represents a partial list of officers of the Trust. Additional information about all the officers is available in the Funds’ Statement of Additional Information, which can be obtained from Goldman Sachs free of charge by calling this toll-free number (in the United States): 1-800-292-4726. |
| 1 | Information is provided as of October 31, 2014. |
| 2 | Officers hold office at the pleasure of the Board of Trustees or until their successors are duly elected and qualified. Each officer holds comparable positions with certain other companies of which Goldman Sachs, GSAM or an affiliate thereof is the investment adviser, administrator and/or distributor. |
85
GOLDMAN SACHS INTERNATIONAL EQUITY INSIGHTS FUNDS
Goldman Sachs Trust — International Equity Insights Funds — Tax Information (Unaudited)
From distributions paid during the year ended October 31, 2014, the total amount of income received by the Emerging Markets Equity Insights, International Equity Insights, and International Small Cap Insights Funds from sources within foreign countries and possessions of the United States was $0.1733, $0.2515, and $0.1812 per share, respectively, all of which is attributable to qualified passive income. The percentage of net investment income dividends paid from foreign sources by the Emerging Markets Equity Insights, International Equity Insights, and International Small Cap Insights Funds were 95.12%, 72.06%, and 50.83%, respectively. The total amount of taxes paid by the Emerging Markets Equity Insights, International Equity Insights and International Small Cap Insights Funds to such countries was $0.0406, $0.0127, and $0.0093 per share, respectively.
For the year ended October 31, 2014, 100%, 67.82%, and 30.10% of the dividends paid from net investment company taxable income by the Emerging Markets Equity Insights, International Equity Insights, and International Small Cap Insights Funds, respectively, qualify for the reduced tax rate under the Jobs and Growth Tax Relief and Reconciliation Act of 2003.
Pursuant to Section 852 of the Internal Revenue Code, the International Small Cap Insights Fund designates $3,981,425 or if different, the maximum amount allowable, as capital gain dividends paid during the fiscal year ended October 31, 2014.
86
FUNDS PROFILE
Goldman Sachs Funds

Goldman Sachs is a premier financial services firm, known since 1869 for creating thoughtful and customized investment solutions in complex global markets.
Today, the Investment Management Division of Goldman Sachs serves a diverse set of clients worldwide, including private institutions, public entities and individuals. With approximately $999.2 billion in assets under supervision as of September 30, 2014, Goldman Sachs Asset Management (“GSAM”) has portfolio management teams located around the world and our investment professionals bring firsthand knowledge of local markets to every investment decision. Assets under supervision includes assets under management and other client assets for which Goldman Sachs does not have full discretion. GSAM leverages the resources of Goldman, Sachs & Co. subject to legal, internal and regulatory restrictions.

Money Market1
Financial Square FundsSM
| n | Financial Square Tax-Exempt Funds |
| n | Financial Square Federal Fund |
| n | Financial Square Government Fund |
| n | Financial Square Money Market Fund |
| n | Financial Square Prime Obligations Fund |
| n | Financial Square Treasury Instruments Fund |
| n | Financial Square Treasury Obligations Fund |
Fixed Income
Short Duration and Government
| n | Enhanced Income Fund |
| n | High Quality Floating Rate Fund |
| n | Limited Maturity Obligations Fund |
| n | Short Duration Government Fund |
| n | Short Duration Income Fund |
| n | Government Income Fund |
| n | Inflation Protected Securities Fund |
Multi-Sector
| n | Core Fixed Income Fund |
| n | Bond Fund2 |
| n | Global Income Fund |
| n | Strategic Income Fund |
| n | World Bond Fund |
Municipal and Tax-Free
| n | High Yield Municipal Fund |
| n | Municipal Income Fund |
| n | Short Duration Tax-Free Fund |
Single Sector
| n | Investment Grade Credit Fund |
| n | U.S. Mortgages Fund |
| n | High Yield Fund |
| n | High Yield Floating Rate Fund |
| n | Emerging Markets Debt Fund |
| n | Local Emerging Markets Debt Fund |
| n | Dynamic Emerging Markets Debt Fund |
Fixed Income Alternatives
| n | Long Short Credit Strategies Fund3 |
| n | Fixed Income Macro Strategies Fund |
Fundamental Equity
| n | Growth and Income Fund |
| n | Small Cap Value Fund |
| n | Small/Mid Cap Value Fund |
| n | Mid Cap Value Fund |
| n | Large Cap Value Fund |
| n | Capital Growth Fund |
| n | Strategic Growth Fund |
| n | Focused Growth Fund |
| n | Small/Mid Cap Growth Fund |
| n | Flexible Cap Growth Fund |
| n | Concentrated Growth Fund |
| n | Technology Tollkeeper Fund |
| n | Growth Opportunities Fund |
| n | Rising Dividend Growth Fund |
| n | U.S. Equity Fund |
| n | Income Builder Fund |
Tax-Advantaged Equity
| n | U.S. Tax-Managed Equity Fund4 |
| n | International Tax-Managed Equity Fund4 |
| n | U.S. Equity Dividend and Premium Fund |
| n | International Equity Dividend and Premium Fund |
Equity Insights
| n | Small Cap Equity Insights Fund |
| n | U.S. Equity Insights Fund |
| n | Small Cap Growth Insights Fund |
| n | Large Cap Growth Insights Fund |
| n | Large Cap Value Insights Fund |
| n | Small Cap Value Insights Fund |
| n | International Small Cap Insights Fund |
| n | International Equity Insights Fund |
| n | Emerging Markets Equity Insights Fund |
Fundamental Equity International
| n | Strategic International Equity Fund |
| n | Focused International Equity Fund5 |
| n | International Small Cap Fund |
| n | Asia Equity Fund |
| n | Emerging Markets Equity Fund |
| n | BRIC Fund (Brazil, Russia, India, China) |
| n | N-11 Equity Fund |
Select Satellite6
| n | Real Estate Securities Fund |
| n | International Real Estate Securities Fund |
| n | Commodity Strategy Fund |
| n | Dynamic Commodity Strategy Fund |
| n | Dynamic Allocation Fund |
| n | Absolute Return Tracker Fund |
| n | Long Short Fund |
| n | Managed Futures Strategy Fund |
| n | MLP Energy Infrastructure Fund |
| n | Multi-Manager Alternatives Fund |
| n | Multi-Asset Real Return Fund |
| n | Retirement Portfolio Completion Fund |
| n | Tactical Tilt Implementation Fund |
Total Portfolio Solutions6
| n | Balanced Strategy Portfolio |
| n | Growth and Income Strategy Portfolio |
| n | Growth Strategy Portfolio |
| n | Equity Growth Strategy Portfolio |
| n | Satellite Strategies Portfolio |
| n | Enhanced Dividend Global Equity Portfolio |
| n | Tax Advantaged Global Equity Portfolio |
| 1 | An investment in a money market fund is neither insured nor guaranteed by the Federal Deposit Insurance Corporation (“FDIC”) or any other government agency. Although the Funds seek to preserve the value of your investment at $1.00 per share, it is possible to lose money by investing in the Funds. |
| 2 | Effective on October 1, 2014, the Goldman Sachs Core Plus Fixed Income Fund was renamed the Goldman Sachs Bond Fund. |
| 3 | Effective at the close of business on March 21, 2014, the Goldman Sachs Credit Strategies Fund was reorganized with and into the Goldman Sachs Long Short Credit Strategies Fund. |
| 4 | Effective on April 30, 2014, the Goldman Sachs Structured Tax-Managed Equity and Structured International Tax-Managed Equity Funds were renamed the Goldman Sachs U.S. Tax-Managed Equity and International Tax-Managed Equity Funds, respectively. |
| 5 | Effective at the close of business on February 28, 2014, the Goldman Sachs Concentrated International Equity Fund was renamed the Goldman Sachs Focused International Equity Fund. |
| 6 | �� | Individual Funds within the Total Portfolio Solutions and Select Satellite categories will have various placement on the risk/return spectrum and may have greater or lesser risk than that indicated by the placement of the general Total Portfolio Solutions or Select Satellite category. |
Financial Square FundsSM is a registered service mark of Goldman, Sachs & Co.
| *This | list covers open-end funds only. Please visit our website at www.GSAMFUNDS.com to learn about our closed-end funds. |
TRUSTEES Ashok N. Bakhru, Chairman John P. Coblentz, Jr. Diana M. Daniels Joseph P. LoRusso Herbert J. Markley James A. McNamara Jessica Palmer Alan A. Shuch Richard P. Strubel Roy W. Templin | OFFICERS James A. McNamara, President Scott M. McHugh, Principal Financial Officer and Treasurer Caroline L. Kraus, Secretary | |
GOLDMAN, SACHS & CO. Distributor and Transfer Agent | GOLDMAN SACHS ASSET MANAGEMENT, L.P. Investment Adviser | |
Visit our Website at www.GSAMFUNDS.com to obtain the most recent month-end returns.
Goldman Sachs Asset Management, L.P., 200 West Street, New York, New York 10282
The reports concerning the Funds included in this shareholder report may contain certain forward-looking statements about the factors that may affect the performance of the Funds in the future. These statements are based on Fund management’s predictions and expectations concerning certain future events and their expected impact on the Funds, such as performance of the economy as a whole and of specific industry sectors, changes in the levels of interest rates, the impact of developing world events, and other factors that may influence the future performance of the Funds. Management believes these forward-looking statements to be reasonable, although they are inherently uncertain and difficult to predict. Actual events may cause adjustments in portfolio management strategies from those currently expected to be employed.
A description of the policies and procedures that the Funds use to determine how to vote proxies relating to portfolio securities and information regarding how a Fund voted proxies relating to portfolio securities during the most recent 12-month period ended June 30 is available (i) without charge, upon request by calling 1-800-526-7384 (for Retail Shareholders) or 1-800-621-2550 (for Institutional Shareholders); and (ii) on the Securities and Exchange Commission (“SEC”) web site at http://www.sec.gov.
Economic and market forecasts presented herein reflect a series of assumptions and judgments as of the date of this presentation and are subject to change without notice. These forecasts do not take into account the specific investment objectives, restrictions, tax and financial situation or other needs of any specific client. Actual data will vary and may not be reflected here. These forecasts are subject to high levels of uncertainty that may affect actual performance. Accordingly, these forecasts should be viewed as merely representative of a broad range of possible outcomes. These forecasts are estimated, based on assumptions, and are subject to significant revision and may change materially as economic and market conditions change. Goldman Sachs has no obligation to provide updates or changes to these forecasts. Case studies and examples are for illustrative purposes only.
The Funds file their complete schedule of portfolio holdings with the SEC for the first and third quarters of each fiscal year on Form N-Q. The Funds’ Forms N-Q are available on the SEC’s web site at http://www.sec.gov within 60 days after the Funds’ first and third fiscal quarters. The Funds’ Forms N-Q may be reviewed and copied at the SEC’s Public Reference Room in Washington, D.C., and information on the operation of the Public Reference Room may also be obtained by calling 1-800-SEC-0330. Forms N-Q may be obtained upon request and without charge by calling 1-800-526-7384 (for Retail Shareholders) or 1-800-621-2550 (for Institutional Shareholders).
Fund holdings and allocations shown are as of October 31, 2014 and may not be representative of future investments. Fund holdings should not be relied on in making investment decisions and should not be construed as research or investment advice regarding particular securities. Current and future holdings are subject to risk.
The Global Industry Classification Standard (GICS) was developed by and is the exclusive property and a service mark of Morgan Stanley Capital International Inc. (MSCI) and Standard & Poor’s, a division of The McGraw-Hill Companies, Inc. (S&P) and is licensed for use by Goldman Sachs. Neither MSCI, S&P nor any other party involved in making or compiling the GICS or any GICS classifications makes any express or implied warranties or representations with respect to such standard or classification (or the results to be obtained by the use thereof), and all such parties hereby expressly disclaim all warranties of originality, accuracy, completeness, merchantability or fitness for a particular purpose with respect to any of such standard or classification. Without limiting any of the foregoing, in no event shall MSCI, S&P, any of their affiliates or any third party involved in making or compiling the GICS or any GICS classifications have any liability for any direct, indirect, special, punitive, consequential or any other damages (including lost profits) even if notified of the possibility of such damages.
The portfolio risk management process includes an effort to monitor and manage risk, but does not imply low risk. Diversification does not protect an investor from market risk and does not ensure a profit.
This material is not authorized for distribution to prospective investors unless preceded or accompanied by a current Prospectus or summary prospectus, if applicable. Investors should consider a Fund’s objective, risks, and charges and expenses, and read the summary prospectus, if available, and/or the Prospectus carefully before investing or sending money. The summary prospectus, if available, and the Prospectus contain this and other information about a Fund and may be obtained from your authorized dealer or from Goldman, Sachs & Co. by calling (retail – 1-800-526-7384) (institutional – 1-800-621-2550).
© 2014 Goldman Sachs. All rights reserved. 148783.MF.MED.TMPL / 12 / 2014 INTINSAR-14 / 19.5K