Exhibit 17(b)
Goldman Sachs Funds

| Annual Report | August 31, 2016 | |||
Fundamental Equity Growth Funds | ||||
Capital Growth | ||||
Concentrated Growth | ||||
Dynamic U.S. Equity | ||||
Flexible Cap Growth | ||||
Focused Growth | ||||
Growth Opportunities | ||||
Small/Mid Cap Growth | ||||
Strategic Growth | ||||
Technology Opportunities | ||||

Goldman Sachs Fundamental Equity Growth Funds
| ∎ | CAPITAL GROWTH |
| ∎ | CONCENTRATED GROWTH |
| ∎ | DYNAMIC U.S. EQUITY |
| ∎ | FLEXIBLE CAP GROWTH |
| ∎ | FOCUSED GROWTH |
| ∎ | GROWTH OPPORTUNITIES |
| ∎ | SMALL/MID CAP GROWTH |
| ∎ | STRATEGIC GROWTH |
| ∎ | TECHNOLOGY OPPORTUNITIES |
TABLE OF CONTENTS |
| |||
| 3 | ||||
| 4 | ||||
| 6 | ||||
| 69 | ||||
| 86 | ||||
| 96 | ||||
| 114 | ||||
| 134 | ||||
| 135 | ||||
| NOT FDIC-INSURED | May Lose Value | No Bank Guarantee | ||
GOLDMAN SACHS FUNDAMENTAL EQUITY GROWTH FUNDS
What Differentiates the Goldman Sachs Growth Team’s Investment Process?
For over 30 years, the Goldman Sachs Growth Team has consistently applied a three-step investment process based on our belief that wealth is created through the long-term ownership of growing businesses.


| ∎ | Make decisions as long-term business owners rather than as stock traders |
| ∎ | Perform in-depth, fundamental research |
| ∎ | Focus on long-term structural and competitive advantages |
Result
Performance driven by the compounding growth of businesses over time — not short-term market movements
Long-term participation in growing businesses — less reliance on macroeconomic predictions, market timing, sector rotation or momentum

Identify high quality growth businesses. Some required investment criteria include:
| ∎ | Established brand names |
| ∎ | Dominant market shares |
| ∎ | Pricing power |
| ∎ | Recurring revenue streams |
| ∎ | Free cash flow |
| ∎ | Long product life cycles |
| ∎ | Favorable long-term growth prospects |
| ∎ | Excellent management |
Result
Investments in businesses that we believe are strategically positioned for consistent, sustainable long-term growth

| ∎ | Perform rigorous valuation analysis of every potential investment |
| ∎ | Use valuation tools and analytics to ensure that the high-quality business franchises we have identified also represent sound investments |
Result
Good investment decisions based on solid understanding of what each business is worth
Attractive buying opportunities as the stock prices of quality growth businesses fluctuate over time
3
MARKET REVIEW
Goldman Sachs Fundamental Equity Growth Funds
Overall, U.S. equities rallied during the 12 months ended August 31, 2016 (the “Reporting Period”), even amidst persistent volatility. The Standard & Poor’s 500® Index (the “S&P 500 Index”) ended the Reporting Period with a gain of 12.55%. The Russell 3000® Index generated a return of 11.44%.
Following a volatile summer, U.S. equities tumbled further in September 2015, alongside other global equity markets, before rebounding strongly in October 2015 and then finishing November 2015 roughly flat. In December 2015, the Federal Reserve (the “Fed”) finally delivered, as largely expected by markets, and voted unanimously for a 25 basis point hike in the targeted federal funds rate, its first rate hike since 2006. (A basis point is 1/100th of a percentage point.) The fairly dovish language in the Fed’s announcement, which reemphasized “gradual” adjustments to policy going forward, helped to somewhat assuage the markets (Dovish language or action tends to suggest lower interest rates (opposite of hawkish)).
Early in 2016, however, U.S. equities were embroiled in what was a global rout, triggered by investor concerns of an intensifying economic slowdown in China and exacerbated by a plunge in oil prices to less than $30 per barrel, the lowest level since 2003. The Fed’s statement in January 2016 acknowledged the risks from international markets and tightening financial conditions on the U.S. economy. U.S. equities stabilized somewhat in February 2016, as market sentiment appeared to improve on the more dovish tone set by global central banks. U.S. equities were also supported during the month by strong U.S. economic data, rallying as fourth quarter 2015 Gross Domestic Product (“GDP”) came in above market expectations. In March 2016, the Fed kept interest rates on hold and surprised on the dovish side, reducing its forecast to two interest rate increases in 2016, down from four. Along with receding global economic concerns, this helped drive a recovery in U.S. equities.
Following the rebound in March 2016, market sentiment remained sanguine in April 2016, as oil prices rose and Chinese economic growth concerns abated. U.S. equities fell near the end of the month, as investors were disappointed by a lack of additional stimulus from the Bank of Japan and by a weaker than consensus expected first quarter 2016 U.S. GDP growth of 0.5%. In May 2016, weaker payroll data drove expectations for a Fed hike in June 2016 temporarily lower, but subsequent hawkish Fed minutes revived market expectations (Hawkish language or action tends to suggest higher interest rates (opposite of dovish)). The Fed ultimately held interest rates steady in June 2016 and signaled a slower pace of hikes, acknowledging the slowdown in the labor market. Equity markets were otherwise dominated in June 2016 by the U.K. referendum on whether to leave the European Union, popularly known as Brexit. U.S. equities sold off in the global risk-off sentiment that dominated toward the end of June 2016 in the days following the surprise “leave” result. However, global equity markets rather quickly rebounded owing to a combination of improving risk sentiment as markets digested the outcome and on dovish remarks from the Bank of England’s Governor Carney.
U.S. equities were further buoyed by strong economic data and corporate earnings in July 2016, despite increased uncertainty post-Brexit. Growth in U.S. non-farm payrolls reached an eight-month high in June 2016, suggesting that the especially weak May 2016 reading had been an outlier in an otherwise strong job market. Such market sentiment was substantiated in August 2016, as payrolls data, released for July 2016, surprised to the upside for a second consecutive month. In her Jackson Hole speech toward the end of August, Fed Chair Janet Yellen acknowledged that the case for an interest rate hike had strengthened in recent months. Along with strong labor data and other recent hawkish comments from the Fed, this
4
MARKET REVIEW
significantly increased the market-implied probability of an interest rate hike by year-end 2016, causing U.S. equities to sell off and finish the month of August roughly flat.
For the Reporting Period overall, all market capitalizations posted solid positive returns, but large-cap companies performed best, followed by mid-cap companies and then small-cap companies. Value stocks significantly outpaced growth stocks across the capitalization spectrum of the U.S. equity market. (All as measured by Russell Investments indices.)
Looking Ahead
At the end of the Reporting Period, low economic growth, interest rates and visibility (or the extent to which a future situation is predictable) reinforced our expectations of lower than average U.S. equity returns. Brexit led to downward revisions to economic growth forecasts for the U.K. and Europe, and the risk of a U.K. recession increased, in our view. As a result, we expect central bank policy around the world to remain accommodative, keeping interest rates lower for longer.
That said, we believe U.S. equities can still post positive returns for calendar year 2016, driven by earnings growth. In our view, equities remain attractive in this environment, as other asset classes are likely to offer lower returns. Cash is likely to yield almost nothing for the foreseeable future, and government bond yields are likely to be at low or negative levels in major markets, in our view. The lack of yield in fixed income markets suggests to us that stocks with sustainable dividends and real estate investment trusts (“REITs”) may well continue to command a premium.
We believe economic and corporate fundamentals are still strongest in the U.S. Unemployment remains below 5%; job growth rebounded in the summer months; and home prices continued to rise. At the end of the Reporting Period, credit trends were benign (benign credit trends tend to suggest low risk of rising default rates), and oil prices seemingly stabilized. We believe stronger fundamentals and less uncertainty relative to other regions are likely to attract asset flows and buoy near-term U.S. equity performance. Still, we are on alert for anything that calls this view into question. In the intermediate term, a confluence of factors may be creating a more challenging environment for absolute returns. More specifically, at the end of the Reporting Period, the valuation of the S&P 500 Index remained high; the index level itself was near fresh highs; and some earnings headwinds persisted.
Regardless of market direction, our fundamental, bottom-up stock selection continues to drive our process, rather than headlines or sentiment. We maintain high conviction in the companies the Funds own and believe they have the potential to outperform relative to the broader market regardless of economic growth conditions. As always, we maintain our focus on seeking companies that we believe will generate long-term growth in today’s ever-changing market conditions.
5
PORTFOLIO RESULTS
Goldman Sachs Capital Growth Fund
Portfolio Composition
The Fund invests primarily in U.S. equity investments. Since the Fund’s inception, the Goldman Sachs Growth Equity Investment Team has focused on several key investment criteria that it believes can drive a company’s growth over the long term. These characteristics are: dominant market share, established brand name, pricing power, recurring revenue stream, free cash flow, high returns on invested capital, predictable growth, sustainable growth, long product life cycle, enduring competitive advantage, favorable demographic trends and excellent management. The Team strives to purchase these companies at reasonable valuations in order to capture the full benefits of their growth.
Portfolio Management Discussion and Analysis
Below, the Goldman Sachs Growth Equity Investment Team discusses the Goldman Sachs Capital Growth Fund’s (the “Fund”) performance and positioning for the 12-month period ended August 31, 2016 (the “Reporting Period”).
| Q | How did the Fund perform during the Reporting Period? |
| A | During the Reporting Period, the Fund’s Class A, C, Institutional, Service, IR, R and R6 Shares generated average annual total returns, without sales charges, of 5.79%, 4.98%, 6.19%, 5.66%, 6.05%, 5.51% and 6.19%, respectively. These returns compare to the 10.51% average annual total return of the Fund’s benchmark, the Russell 1000® Growth Index (with dividends reinvested) (the “Russell Index”), during the same period. |
| Q | What key factors were responsible for the Fund’s performance during the Reporting Period? |
| A | The Fund posted solid absolute gains, but stock selection overall detracted from the Fund’s performance relative to the Russell Index during the Reporting Period. Sector allocation as a whole also detracted, albeit much more modestly. |
| Q | Which equity market sectors most significantly affected Fund performance? |
| A | Detracting from the Fund’s relative results most was weak stock selection in the health care, consumer staples and information technology sectors. The sectors that contributed most positively to the Fund’s relative performance during the Reporting Period were financials, materials and energy, wherein effective stock selection drove results. |
| Q | Which stocks detracted significantly from the Fund’s performance during the Reporting Period? |
| A | Among those stocks detracting most from the Fund’s results relative to the Russell Index were positions in global apparel company PVH, biotechnology firm Vertex Pharmaceuticals and global pharmaceutical company Allergan. |
| PVH was the top detractor from the Fund’s results during the Reporting Period. Weakness in the U.S. retail environment, high promotions in the industry, and currency headwinds added pressure to what we believe is otherwise a high quality company. While we continue to monitor the situation closely, at the end of the Reporting Period, we believed PVH remains a leading franchise with dominant market share, strong pricing power and solid fundamentals. We remained optimistic on what we see as the company’s significant free cash flow generation ability, quality of management and return potential. |
Vertex Pharmaceuticals was a top detractor from the Fund’s performance during the Reporting Period. Early in 2016, its shares came under pressure following a disappointing fiscal fourth quarter that fell short of consensus expectations. Additionally, lowered expectations surrounding the launch of Vertex Pharmaceuticals’ new cystic fibrosis treatment, orkambi, caused shares to decline. Despite this weakness, at the end of the Reporting Period, we believed Vertex Pharmaceuticals had strong underlying fundamentals, a promising product pipeline with significant short-term and long-term catalysts and an attractive valuation. We further believed the company, led by what we consider to be a capable management team, could continue to see growth given its dominant market share in its space and given |
6
PORTFOLIO RESULTS
geographic expansionary efforts that have contributed to meaningful profitability. |
| Allergan was among the Fund’s biggest detractors during the Reporting Period. Volatility related to mergers and acquisitions the company has been involved in as well as market concerns around drug pricing pressures weighed on Allergan’s stock during the Reporting Period. Despite the near-term volatility and underperformance, we continued to believe at the end of the Reporting Period that Allergan was a high quality growth business, trading at an attractive valuation with meaningful financial flexibility going forward. |
| Q | What were some of the Fund’s best-performing individual stocks? |
| A | Among those stocks the Fund benefited most from relative to the Russell Index were positions in specialty retailers Ulta Salon, Cosmetics & Fragrance, data center real estate investment trust (“REIT”) Equinix and water technology company Xylem. |
| After a challenging start to 2016 for Ulta Salon, Cosmetics & Fragrance, momentum started picking up for the company in the beginning of April 2016 after strong first quarter 2016 earnings and the company being added to the S&P 500 Index. Its strong results were driven by margins, revenues and e-commerce growth that were ahead of market expectations. In our view, the company is a strong brand that continues to gain recognition. We believe Ulta Salon, Cosmetics & Fragrance has an opportunity to grow market share through higher brand awareness, increasing loyalty to existing stores, expansion of new stores and e-commerce. |
| Equinix was a strong contributor to the Fund’s performance during the Reporting Period. The company reported solid quarterly results, positively beating market expectations for its organic revenue growth and earnings growth. The company also benefited from a move down in U.S. Treasury yields, which generally favors REITs given their attractive yield and growth potential relative to bonds. At the end of the Reporting Period, we thought that Equinix continued to have substantial pipeline opportunities, particularly with enterprise customers willing to pay a higher price. Continued integration with the company’s Telecity acquisition and a strategic partnership with Datang Telecom could further increase Equinix’s global presence and strengthen its competitive advantage, in our view. Further, we believe Equinix remains an asset with robust upside to its revenues and free cash flows, as it balances organic growth, low leverage and a sound capital structure. |
| During the Reporting Period, Xylem reported strong quarterly results, and toward the end of the Reporting Period, announced the purchase of Sensus, a smart water meter company, for approximately $1.7 billion in cash. The acquisition was viewed positively by investors, as it further bolsters Xylem’s product offering and technological advantage. At the end of the Reporting Period, we remained optimistic on Xylem’s margin expansion prospects and believed its management team has done well to position the company for sustainable long-term growth. |
| Q | How did the Fund use derivatives and similar instruments during the Reporting Period? |
| A | During the Reporting Period, we did not use derivatives as part of an active management strategy. |
| Q | Did the Fund make any significant purchases or sales during the Reporting Period? |
| A | We initiated a Fund position in fast-food retail giant McDonald’s. We believe improving sales and reductions in costs should lead to earnings upside and margin expansion. We further think that McDonald’s reduction in capital expenditures and further refranchising could lead to improving return on invested capital and free up additional capital to repurchase stock. In our view, McDonald’s is a high quality franchise with a proficient management team and what we consider to be attractive opportunities to drive top-line growth and earnings. |
| We established a Fund position in off-price retailer Ross Stores. Off-price retailers, such as Ross Stores, seek to take advantage of excess inventory from full-price retailers by purchasing goods at a significant discount to their original prices. We believe Ross Stores is well positioned within its industry and attractively valued for a high quality company. We are encouraged by Ross Stores’ consistent sales and earnings growth over time, strong free cash flows, and demonstrated track record of returning capital to shareholders. |
Conversely, we sold the Fund’s position in consumer products company Colgate-Palmolive. While we believe Colgate-Palmolive to be a quality business, we think there are better opportunities with more encouraging catalysts elsewhere in the industry. Additionally, we believe it is possible that Colgate-Palmolive could see an earnings |
7
PORTFOLIO RESULTS
decrease in the near term, as foreign currency pressures continue to impact the company. As a result, we decided to exit the position and pursue higher conviction ideas. |
| We sold the Fund’s position in Biogen, a biotechnology company. Like most companies within the health care sector, Biogen faced headwinds from increased U.S. regulation and felt increasing pressure after announcing a divestiture of its hemophilia business. At the beginning of June 2016, Biogen saw a notable decline in its share price after opicinumab, a drug for multiple sclerosis, missed an essential endpoint of its Phase II clinical trial. We sold the Fund’s position in Biogen, as we believe the stock is in deceleration mode. |
| Q | Were there any notable changes in the Fund’s weightings during the Reporting Period? |
| A | In constructing the Fund’s portfolio, we focus on picking stocks rather than on making industry or sector bets. We seek to outpace the benchmark index by overweighting stocks that we expect to outperform and underweighting those that we think may lag. Consequently, changes in its sector weights are generally the direct result of individual stock selection or of stock appreciation or depreciation. That said, during the Reporting Period, the Fund’s exposure to consumer staples and information technology increased and its allocations to consumer discretionary and financials decreased relative to the Russell Index. |
| Q | How was the Fund positioned relative to its benchmark index at the end of August 2016? |
| A | At the end of August 2016, the Fund had an overweighted position relative to the Russell Index in the consumer discretionary sector. On the same date, the Fund had an underweighted position compared to the Russell Index in health care. The Fund was rather neutrally weighted to the Russell Index in consumer staples, energy, financials, industrials, information technology, real estate and materials and had no position at all in utilities or telecommunication services at the end of the Reporting Period. |
8
FUND BASICS
Capital Growth Fund
as of August 31, 2016
| PERFORMANCE REVIEW | ||||||||||
| September 1, 2015–August 31, 2016 | Fund Total Return (based on NAV)1 | Russell 1000® Growth Index2 | ||||||||
| Class A | 5.79 | % | 10.51 | % | ||||||
| Class C | 4.98 | 10.51 | ||||||||
| Institutional | 6.19 | 10.51 | ||||||||
| Service | 5.66 | 10.51 | ||||||||
| Class IR | 6.05 | 10.51 | ||||||||
| Class R | 5.51 | 10.51 | ||||||||
| Class R6 | 6.19 | 10.51 | ||||||||
| 1 | The net asset value (“NAV”) represents the net assets of the class of the Fund (ex-dividend) divided by the total number of shares of the class outstanding. The Fund’s performance reflects the reinvestment of dividends and other distributions. The Fund’s performance does not reflect the deduction of any applicable sales charges. |
| 2 | The Russell 1000® Growth Index is an unmanaged index that measures the performance of those Russell 1000® companies with higher price-to-book ratios and higher forecasted growth values. The Index figures do not reflect any deduction for fees, expenses or taxes. It is not possible to invest directly in an index. |
| STANDARDIZED TOTAL RETURNS3 | ||||||||||||||||||||
| For the period ended 6/30/16 | One Year | Five Years | Ten Years | Since Inception | Inception Date | |||||||||||||||
| Class A | -8.00 | % | 9.69 | % | 6.41 | % | 8.81 | % | 4/20/90 | |||||||||||
| Class C | -4.33 | 10.11 | 6.21 | 4.97 | 8/15/97 | |||||||||||||||
| Institutional | -2.23 | 11.38 | 7.44 | 6.17 | 8/15/97 | |||||||||||||||
| Service | -2.69 | 10.83 | 6.91 | 5.65 | 8/15/97 | |||||||||||||||
| Class IR | -2.40 | 11.22 | N/A | 6.35 | 11/30/07 | |||||||||||||||
| Class R | -2.85 | 10.67 | N/A | 5.83 | 11/30/07 | |||||||||||||||
| Class R6 | N/A | N/A | N/A | -5.08 | 7/31/15 | |||||||||||||||
| 3 | The Standardized Total Returns are average annual total returns or cumulative total returns (only if the performance period is one year or less) as of the most recent calendar quarter-end. They assume reinvestment of all distributions at NAV. These returns reflect a maximum initial sales charge of 5.5% for Class A Shares and the assumed contingent deferred sales charge for Class C Shares (1% if redeemed within 12 months of purchase). Because Institutional, Service, Class IR, Class R, and Class R6 Shares do not involve a sales charge, such a charge is not applied to their Standardized Total Returns. |
The returns set forth in the tables above represent past performance. Past performance does not guarantee future results. The Fund’s investment return and principal value will fluctuate so that an investor’s shares, when redeemed, may be worth more or less than their original cost. Current performance may be lower or higher than the performance quoted above. Please visit our web site at www.GSAMFUNDS.com to obtain the most recent month-end returns. Performance reflects applicable fee waivers and/or expense limitations in effect during the periods shown. In their absence, performance would be reduced. Returns do not reflect the deduction of taxes that a shareholder would pay on Fund distributions or the redemption of Fund shares.
9
FUND BASICS
| EXPENSE RATIOS4 | ||||||||||
| Net Expense Ratio (Current) | Gross Expense Ratio (Before Waivers) | |||||||||
| Class A | 1.15 | % | 1.49 | % | ||||||
| Class C | 1.90 | 2.25 | ||||||||
| Institutional | 0.75 | 1.09 | ||||||||
| Service | 1.25 | 1.60 | ||||||||
| Class IR | 0.90 | 1.24 | ||||||||
| Class R | 1.40 | 1.74 | ||||||||
| Class R6 | 0.73 | 1.07 | ||||||||
| 4 | The expense ratios of the Fund, both current (net of applicable fee waivers and/or expense limitations) and before waivers (gross of applicable fee waivers and/or expense limitations) are as set forth above according to the most recent publicly available Prospectus for the Fund and may differ from the expense ratios disclosed in the Financial Highlights in this report. Pursuant to a contractual arrangement, the Fund’s waivers and/or expense limitations will remain in place through at least December 29, 2016, and prior to such date the Investment Adviser may not terminate the arrangements without the approval of the Fund’s Board of Trustees. If these arrangements are discontinued in the future, the expense ratios may change without shareholder approval. |
| TOP TEN HOLDINGS AS OF 8/31/165 | ||||||||
| Holding | % of Net Assets | Line of Business | ||||||
| Apple, Inc. | 6.1 | % | Technology Hardware, Storage & Peripherals | |||||
| Microsoft Corp. | 3.0 | Software | ||||||
| Facebook, Inc. Class A | 2.9 | Internet Software & Services | ||||||
| Amazon.com, Inc. | 2.8 | Internet & Direct Marketing Retail | ||||||
| MasterCard, Inc. Class A | 2.8 | IT Services | ||||||
| Comcast Corp. Class A | 2.3 | Media | ||||||
| Alphabet, Inc. Class A | 2.2 | Internet Software & Services | ||||||
| Alphabet, Inc. Class C | 2.2 | Internet Software & Services | ||||||
| Honeywell International, Inc. | 2.1 | Industrial Conglomerates | ||||||
| The Walt Disney Co. | 2.1 | Media | ||||||
| 5 | The top 10 holdings may not be representative of the Fund’s future investments. |
10
FUND BASICS
| FUND VS. BENCHMARK SECTOR ALLOCATION6 |
| As of August 31, 2016 |

| 6 | The Fund is actively managed and, as such, its composition may differ over time. Consequently, the Fund’s overall sector allocations may differ from the percentages contained in the graph above. The graph categorizes investments using the Global Industry Classification Standard (“GICS”), however, the sector classifications used by the portfolio management team may differ from GICS. The percentage shown for each investment category reflects the value of investments in that category as a percentage of market value. The graph depicts the Fund’s investments but may not represent the Fund’s market exposure due to the exclusion of certain derivatives, if any, as listed in the Additional Investment Information section of the Schedule of Investments. |
11
GOLDMAN SACHS CAPITAL GROWTH FUND
Performance Summary
August 31, 2016
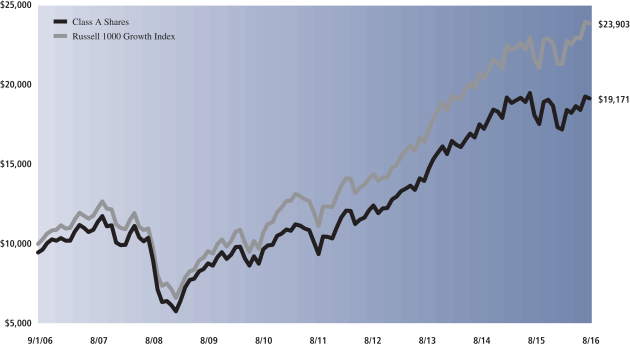
The following graph shows the value, as of August 31, 2016, of a $10,000 investment made on September 1, 2006 in Class A Shares (with the maximum sales charge of 5.5%). For comparative purposes, the performance of the Fund’s benchmark, the Russell 1000 Growth Index (with dividends reinvested), is shown. This performance data represents past performance and should not be considered indicative of future performance, which will fluctuate with changes in market conditions. These performance fluctuations may cause an investor’s shares, when redeemed, to be worth more or less than their original cost. Performance reflects applicable fee waivers and/or expense limitations in effect during the periods shown and in their absence, performance would be reduced. Returns do not reflect the deduction of taxes that a shareholder would pay on Fund distributions or the redemption of Fund shares. Performance of Class C, Institutional, Service, Class IR, Class R and Class R6 Shares will vary from Class A Shares due to differences in class specific fees and any applicable sales charges. In addition to the Investment Adviser’s decisions regarding issuer/industry investment selection and allocation, other factors may affect Fund performance. These factors include, but are not limited to, Fund operating fees and expenses, portfolio turnover and subscription and redemption cash flows affecting the Fund.
| Capital Growth Fund’s 10 Year Performance |
Performance of a $10,000 Investment, including any applicable sales charges, with distributions reinvested, from September 1, 2006 through August 31, 2016.
| Average Annual Total Return through August 31, 2016 | One Year | Five Years | Ten Years | Since Inception | ||||||||||
Class A (Commenced April 20, 1990) | ||||||||||||||
Excluding sales charges | 5.79% | 13.55% | 7.32% | 9.14% | ||||||||||
Including sales charges | 0.00% | 12.28% | 6.72% | 8.91% | ||||||||||
| ||||||||||||||
Class C (Commenced August 15, 1997) | ||||||||||||||
Excluding contingent deferred sales charges | 4.98% | 12.71% | 6.52% | 5.13% | ||||||||||
Including contingent deferred sales charges | 3.93% | 12.71% | 6.52% | 5.13% | ||||||||||
| ||||||||||||||
Institutional Class (Commenced August 15, 1997) | 6.19% | 14.00% | 7.75% | 6.34% | ||||||||||
| ||||||||||||||
Service Class (Commenced August 15, 1997) | 5.66% | 13.43% | 7.21% | 9.06% | ||||||||||
| ||||||||||||||
Class IR (Commenced November 30, 2007) | 6.05% | 13.83% | N/A | 6.70% | ||||||||||
| ||||||||||||||
Class R (Commenced November 30, 2007) | 5.51% | 13.26% | N/A | 6.17% | ||||||||||
| ||||||||||||||
Class R6 (Commenced July 31, 2015) | 6.19% | N/A | N/A | -1.19% | ||||||||||
| ||||||||||||||
12
PORTFOLIO RESULTS
Goldman Sachs Concentrated Growth Fund
Portfolio Composition
The Fund invests primarily in U.S. equity investments. The Fund typically holds 30-40 high quality growth companies and tends to be more concentrated in individual holdings, industries and sectors than the typical broadly diversified large-cap growth fund. Since the Fund’s inception, the Goldman Sachs Growth Equity Investment Team has focused on several key investment criteria that it believes can drive a company’s growth over the long term. These characteristics are: dominant market share, established brand name, pricing power, recurring revenue stream, free cash flow, high returns on invested capital, predictable growth, sustainable growth, long product life cycle, enduring competitive advantage, favorable demographic trends and excellent management. The Team strives to purchase these companies at reasonable valuations in order to capture the full benefits of their growth.
Portfolio Management Discussion and Analysis
Below, the Goldman Sachs Growth Equity Investment Team discusses the Goldman Sachs Concentrated Growth Fund’s (the “Fund”) performance and positioning for the 12-month period ended August 31, 2016 (the “Reporting Period”).
| Q | How did the Fund perform during the Reporting Period? |
| A | During the Reporting Period, the Fund’s Class A, C, Institutional, IR, R and R6 Shares generated average annual total returns, without sales charges, of 5.10%, 4.27%, 5.47%, 5.31%, 4.81% and 5.56%, respectively. These returns compare to the 10.51% average annual total return of the Fund’s benchmark, the Russell 1000® Growth Index (with dividends reinvested) (the “Russell Index”), during the same period. |
| Q | What key factors were responsible for the Fund’s performance during the Reporting Period? |
| A | The Fund generated solid positive absolute returns, but stock selection overall detracted from the Fund’s performance relative to the Russell Index during the Reporting Period. Sector allocation as a whole also detracted, albeit much more modestly. |
| Q | Which equity market sectors most significantly affected Fund performance? |
| A | Challenging stock selection in the information technology, health care and consumer staples sectors detracted from the Fund’s relative results most during the Reporting Period. The only two sectors to contribute positively to the Fund’s relative performance during the Reporting Period were financials and industrials, wherein effective stock selection drove results. |
| Q | Which stocks detracted significantly from the Fund’s performance during the Reporting Period? |
| A | Among those stocks detracting most from the Fund’s results relative to its benchmark index were positions in global pharmaceutical company Allergan, global apparel company PVH and biotechnology firm Vertex Pharmaceuticals. |
| Allergan was the Fund’s biggest individual detractor during the Reporting Period. Volatility related to mergers and acquisitions the company has been involved in as well as market concerns around drug pricing pressures weighed on Allergan’s stock during the Reporting Period. Despite the near-term volatility and underperformance, we continued to believe at the end of the Reporting Period that Allergan was a high quality growth business, trading at an attractive valuation with meaningful financial flexibility going forward. |
| PVH was a top detractor from the Fund’s results during the Reporting Period. Weakness in the U.S. retail environment, high promotions in the industry, and currency headwinds added pressure to what we believe is otherwise a high quality company. While we continue to like the company and believe PVH remains a leading franchise with dominant market share, strong pricing power and solid fundamentals, near-term uncertainty led us to consolidate the Fund’s exposure into other consumer positions where we find the risk/reward opportunity more compelling. |
13
PORTFOLIO RESULTS
| Vertex Pharmaceuticals was a top detractor from the Fund’s performance during the Reporting Period. Early in 2016, its shares came under pressure following a disappointing fiscal fourth quarter that fell short of consensus expectations. Additionally, lowered expectations surrounding the launch of Vertex Pharmaceuticals’ new cystic fibrosis treatment, orkambi, caused shares to decline. Despite this weakness, at the end of the Reporting Period, we believed Vertex Pharmaceuticals had strong underlying fundamentals, a promising product pipeline with significant short-term and long-term catalysts and an attractive valuation. We further believed the company, led by what we consider to be a capable management team, could continue to see growth given its dominant market share in its space and given geographic expansionary efforts that have contributed to meaningful profitability. |
| Q | What were some of the Fund’s best-performing individual stocks? |
| A | The Fund benefited most relative to the Russell Index from positions in data center real estate investment trust (“REIT”) Equinix, online social media platform Facebook and e-commerce retailer Amazon.com. |
| Equinix was the strongest contributor to the Fund’s performance during the Reporting Period. The company reported solid quarterly results, positively beating market expectations for its organic revenue growth and earnings growth. The company also benefited from a move down in U.S. Treasury yields, which generally favors REITs given their attractive yield and growth potential relative to bonds. At the end of the Reporting Period, we thought that Equinix continued to have substantial pipeline opportunities, particularly with enterprise customers willing to pay a higher price. Continued integration with the company’s Telecity acquisition and a strategic partnership with Datang Telecom could further increase Equinix’s global presence and strengthen its competitive advantage, in our view. Further, we believe Equinix remains an asset with robust upside to its revenues and free cash flows, as it balances organic growth, low leverage and a sound capital structure. |
| Facebook was a top positive contributor to the Fund’s relative results during the Reporting Period. The company reported strong quarterly results during the Reporting Period, underpinned by advertisement revenue growth well above market expectations. Demand from advertisers was robust across most segments and geographies, and the company benefited from its three key levers — user growth, time spent and ad load. At the end of the Reporting Period, we remained positive on Facebook’s high operating expenditures, at what we consider to be manageable levels, which should allow the company to invest aggressively in substantial growth opportunities and simultaneously increase earnings. We think additional tailwinds in the form of lower and decreasing tax rates — and video-driven growth — may further benefit the company in coming years. In our view, Facebook’s strong fundamentals, high barriers to entry and robust contribution from Instagram warrant a constructive outlook on its long- term growth prospects. |
| Amazon.com reported strong third quarter 2015 results and solid first quarter 2016 results, with revenues and earnings well ahead of market expectations. Fundamentals were robust, and its management’s guidance implied continued strength. At the end of the Reporting Period, we believed the business remained strong in retail and Amazon Web Services (“AWS”) and that Amazon Prime’s membership growth could potentially position Amazon.com as a long-term outperformer in the retail industry. We continued to view Amazon.com’s business favorably and believed the company could well be the beneficiary of its scale and competitive advantages over the long term. |
| Q | How did the Fund use derivatives and similar instruments during the Reporting Period? |
| A | During the Reporting Period, we did not use derivatives as part of an active management strategy. |
| Q | Did the Fund make any significant purchases or sales during the Reporting Period? |
| A | We initiated a Fund position in Comcast, a broadband cable and media company. We believe Comcast is a best-in-class name that provides on-demand content, innovates well on channel mediums, and, despite cord cutting trends and satellite expansion, outperforms in cable. (Cord cutting refers to the practice of stopping a cable or satellite television service or getting rid of a landline phone in favor of less expensive options.) We like Comcast’s diversification across content and distribution as well as its diversification across content businesses. Given what we perceive to be the company’s positive near-term outlook and strong underlying fundamentals, we are optimistic on Comcast’s long-term return and thus established a position in the Fund. |
We established a Fund position in Microsoft. Share price weakness on the back of challenging quarterly results had created an opportunity, in our view, to initiate a position, and we believe the company presents good risk/reward potential. We are optimistic on what we believe are some solid growth |
14
PORTFOLIO RESULTS
and improved profitability focus areas, including Azure, Office 365 and Xbox. We believe Microsoft is attractively valued with a strong balance sheet, high free cash flow yield and a management that we believe is moving the company in the right direction. |
| Conversely, in addition to those sales already mentioned, we eliminated the Fund’s position in information storage company EMC. We believed that any complications with respect to its acquisition by Dell could add negative pressure to its stock, thus making the risk/reward profile less compelling, in our view. The stock had performed relatively well in the recent downturn, and so we took the opportunity to exit the Fund’s position to allocate the proceeds to other ideas with what we considered to have more compelling upside. |
| Q | Were there any notable changes in the Fund’s weightings during the Reporting Period? |
| A | In constructing the Fund’s portfolio, we focus on picking stocks rather than on making industry or sector bets. We seek to outpace the benchmark index by overweighting stocks that we expect to outperform and underweighting those that we think may lag. Consequently, changes in its sector weights are generally the direct result of individual stock selection or of stock appreciation or depreciation. That said, during the Reporting Period, the Fund’s exposure to industrials increased as did its position in cash, while its allocations to consumer discretionary, consumer staples, energy and financials decreased relative to the Russell Index. |
| Q | How was the Fund positioned relative to its benchmark index at the end of August 2016? |
| A | At the end of August 2016, the Fund had overweighted positions relative to the Russell Index in the real estate and information technology sectors. On the same date, the Fund had underweighted positions compared to the Russell Index in consumer discretionary, industrials and materials. The Fund was rather neutrally weighted relative to the Russell Index in consumer staples, financials and health care and had no position at all in the utilities and telecommunication services sectors at the end of the Reporting Period. |
15
FUND BASICS
Concentrated Growth Fund
as of August 31, 2016
| PERFORMANCE REVIEW | ||||||||||
| September 1, 2015–August 31, 2016 | Fund Total Return (based on NAV)1 | Russell 1000® Growth Index2 | ||||||||
| Class A | 5.10 | % | 10.51 | % | ||||||
| Class C | 4.27 | 10.51 | ||||||||
| Institutional | 5.47 | 10.51 | ||||||||
| Class IR | 5.31 | 10.51 | ||||||||
| Class R | 4.81 | 10.51 | ||||||||
| Class R6 | 5.56 | 10.51 | ||||||||
| 1 | The net asset value (“NAV”) represents the net assets of the class of the Fund (ex-dividend) divided by the total number of shares of the class outstanding. The Fund’s performance reflects the reinvestment of dividends and other distributions. The Fund’s performance does not reflect the deduction of any applicable sales charges. |
| 2 | The Russell 1000® Growth Index is an unmanaged index that measures the performance of those Russell 1000® companies with higher price-to-book ratios and higher forecasted growth values. The Index figures do not reflect any deduction for fees, expenses or taxes. It is not possible to invest directly in an index. |
| STANDARDIZED TOTAL RETURNS3 | ||||||||||||||||||||
| For the period ended 6/30/16 | One Year | Five Years | Ten Years | Since Inception | Inception Date | |||||||||||||||
| Class A | -8.61 | % | 8.52 | % | 6.01 | % | 6.48 | % | 9/03/02 | |||||||||||
| Class C | -5.02 | 8.93 | 5.80 | 6.11 | 9/03/02 | |||||||||||||||
| Institutional | -2.88 | 10.21 | 7.03 | 7.35 | 9/03/02 | |||||||||||||||
| Class IR | -3.04 | 10.04 | N/A | 5.25 | 11/30/07 | |||||||||||||||
| Class R | -3.55 | 9.48 | N/A | 4.74 | 11/30/07 | |||||||||||||||
| Class R6 | N/A | N/A | N/A | -5.24 | 7/31/15 | |||||||||||||||
| 3 | The Standardized Total Returns are average annual total returns or cumulative total returns (only if the performance period is one year or less) as of the most recent calendar quarter-end. They assume reinvestment of all distributions at NAV. These returns reflect a maximum initial sales charge of 5.5% for Class A Shares and the assumed contingent deferred sales charge for Class C Shares (1% if redeemed within 12 months of purchase). Because Institutional, Class IR, Class R and Class R6 Shares do not involve a sales charge, such a charge is not applied to their Standardized Total Returns. |
The returns set forth in the tables above represent past performance. Past performance does not guarantee future results. The Fund’s investment return and principal value will fluctuate so that an investor’s shares, when redeemed, may be worth more or less than their original cost. Current performance may be lower or higher than the performance quoted above. Please visit our web site at www.GSAMFUNDS.com to obtain the most recent month-end returns. Performance reflects applicable fee waivers and/or expense limitations in effect during the periods shown. In their absence, performance would be reduced. Returns do not reflect the deduction of taxes that a shareholder would pay on Fund distributions or the redemption of Fund shares.
16
FUND BASICS
| EXPENSE RATIOS4 | ||||||||||
| Net Expense Ratio (Current) | Gross Expense Ratio (Before Waivers) | |||||||||
| Class A | 1.22 | % | 1.60 | % | ||||||
| Class C | 1.97 | 2.35 | ||||||||
| Institutional | 0.82 | 1.20 | ||||||||
| Class IR | 0.97 | 1.35 | ||||||||
| Class R | 1.47 | 1.87 | ||||||||
| Class R6 | 0.80 | 1.18 | ||||||||
| 4 | The expense ratios of the Fund, both current (net of applicable fee waivers and/or expense limitations) and before waivers (gross of applicable fee waivers and/or expense limitations) are as set forth above according to the most recent publicly available Prospectus for the Fund and may differ from the expense ratios disclosed in the Financial Highlights in this report. Pursuant to a contractual arrangement, the Fund’s waivers and/or expense limitations will remain in place through at least December 29, 2016, and prior to such date the Investment Adviser may not terminate the arrangements without the approval of the Fund’s Board of Trustees. If these arrangements are discontinued in the future, the expense ratios may change without shareholder approval. |
| TOP TEN HOLDINGS AS OF 8/31/165 | ||||||||
| Holding | % of Net Assets | Line of Business | ||||||
| Apple, Inc. | 7.5 | % | Technology Hardware, Storage & Peripherals | |||||
| Facebook, Inc. Class A | 4.8 | Internet Software & Services | ||||||
| Amazon.com, Inc. | 4.1 | Internet & Direct Marketing Retail | ||||||
| Alphabet, Inc. Class A | 4.1 | Internet Software & Services | ||||||
| American Tower Corp. | 4.0 | Equity Real Estate Investment Trusts (REITs) | ||||||
| Costco Wholesale Corp. | 3.8 | Food & Staples Retailing | ||||||
| MasterCard, Inc. Class A | 2.9 | IT Services | ||||||
| Comcast Corp. Class A | 2.9 | Media | ||||||
| Honeywell International, Inc. | 2.9 | Industrial Conglomerates | ||||||
| Microsoft Corp. | 2.7 | Software | ||||||
| 5 | The top 10 holdings may not be representative of the Fund’s future investments. |
17
FUND BASICS
| FUND VS. BENCHMARK SECTOR ALLOCATION6 |
| As of August 31, 2016 |
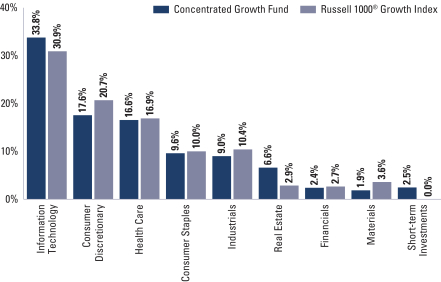
| 6 | The Fund is actively managed and, as such, its composition may differ over time. Consequently, the Fund’s overall sector allocations may differ from the percentages contained in the graph above. The graph categorizes investments using the Global Industry Classification Standard (“GICS”), however, the sector classifications used by the portfolio management team may differ from GICS. The percentage shown for each investment category reflects the value of investments in that category as a percentage of market value. Short-term investments represent repurchase agreements. The graph depicts the Fund’s investments but may not represent the Fund’s market exposure due to the exclusion of certain derivatives, if any, as listed in the Additional Investment Information section of the Schedule of Investments. |
18
GOLDMAN SACHS CONCENTRATED GROWTH FUND
Performance Summary
August 31, 2016
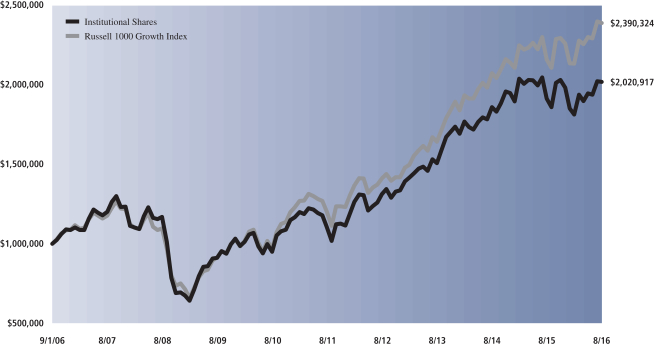
The following graph shows the value, as of August 31, 2016, of a $1,000,000 investment made on September 1, 2006 in Institutional Shares at NAV. For comparative purposes, the performance of the Fund’s benchmark, the Russell 1000 Growth Index (with dividends reinvested), is shown. This performance data represents past performance and should not be considered indicative of future performance which will fluctuate with changes in market conditions. These performance fluctuations may cause an investor’s shares, when redeemed, to be worth more or less than their original cost. Performance reflects applicable fee waivers and/or expense limitations in effect during the periods shown and in their absence, performance would be reduced. Returns do not reflect the deduction of taxes that a shareholder would pay on Fund distributions or the redemption of Fund shares. Performance of Class A, Class C, Class IR, Class R, and Class R6 Shares will vary from Institutional Shares due to differences in class specific fees and any applicable sales charges. In addition to the Investment Adviser’s decisions regarding issuer/industry investment selection and allocation, other factors may affect Fund performance. These factors include, but are not limited to, Fund operating fees and expenses, portfolio turnover and subscription and redemption cash flows affecting the Fund.
| Concentrated Growth Fund’s 10 Year Performance |
Performance of a $1,000,000 Investment, including any applicable sales charges, with distributions reinvested, from September 1, 2006 through August 31, 2016.
| Average Annual Total Return through August 31, 2016 | One Year | Five Years | Ten Years | Since Inception | ||||||||||
Class A (Commenced September 3, 2002) | ||||||||||||||
Excluding sales charges | 5.10% | 12.38% | 6.86% | 7.14% | ||||||||||
Including sales charges | -0.63% | 11.11% | 6.25% | 6.71% | ||||||||||
| ||||||||||||||
Class C (Commenced September 3, 2002) | ||||||||||||||
Excluding contingent deferred sales charges | 4.27% | 11.55% | 6.06% | 6.33% | ||||||||||
Including contingent deferred sales charges | 3.23% | 11.55% | 6.06% | 6.33% | ||||||||||
| ||||||||||||||
Institutional Class (Commenced September 3, 2002) | 5.47% | 12.83% | 7.28% | 7.57% | ||||||||||
| ||||||||||||||
Class IR (Commenced November 30, 2007) | 5.31% | 12.66% | N/A | 5.63% | ||||||||||
| ||||||||||||||
Class R (Commenced November 30, 2007) | 4.81% | 12.11% | N/A | 5.13% | ||||||||||
| ||||||||||||||
Class R6 (Commenced July 31, 2015) | 5.56% | N/A | N/A | -1.12% | ||||||||||
| ||||||||||||||
19
PORTFOLIO RESULTS
Goldman Sachs Dynamic U.S. Equity Fund
Portfolio Composition
The Fund invests primarily in U.S. equity investments. Since the Fund’s inception, the Goldman Sachs Growth Equity Investment Team and the Goldman Sachs Fundamental Equity Value Investment Team have focused on several key investment criteria that they believe can drive a company’s growth over the long term. These characteristics are: dominant market share, established brand name, pricing power, recurring revenue stream, free cash flow, high returns on invested capital, predictable growth, sustainable growth, long product life cycle, enduring competitive advantage, favorable demographic trends and excellent management. The Teams strive to purchase these companies at reasonable valuations in order to capture the full benefits of their growth.
Portfolio Management Discussion and Analysis
Below, the Goldman Sachs Growth Equity Investment Team and the Goldman Sachs Value Equity Investment Team discuss the Goldman Sachs Dynamic U.S. Equity Fund’s (the “Fund”) performance and positioning for the 12-month period ended August 31, 2016 (the “Reporting Period”).
| Q | How did the Fund perform during the Reporting Period? |
| A | During the Reporting Period, the Fund’s Class A, C, Institutional, IR, R and R6 Shares generated average annual total returns, without sales charges, of 4.39%, 3.66%, 4.84%, 4.67%, 4.18% and 4.86%, respectively. These returns compare to the 12.52% average annual total return of the Fund’s benchmark, the Standard & Poor’s 500® Index (the “S&P 500 Index”), during the same period. |
| Q | What key factors were responsible for the Fund’s performance during the Reporting Period? |
| A | The Fund posted positive absolute returns, but stock selection overall detracted from the Fund’s performance relative to the S&P 500 Index during the Reporting Period. Sector allocation as a whole also detracted, albeit more modestly. |
| Q | Which equity market sectors most significantly affected Fund performance? |
| A | Challenging stock selection in information technology, health care and consumer staples detracted from the Fund’s relative results most. Having an underweighted allocation to information technology, which outpaced the S&P 500 Index during the Reporting Period, also hurt. The only sector to contribute positively to the Fund’s relative performance during the Reporting Period was financials, wherein effective stock selection more than offset the detracting effect of having an overweight in the comparatively weakly performing sector. |
| Q | Which stocks detracted significantly from the Fund’s performance during the Reporting Period? |
| A | Detracting most from the Fund’s results relative to its benchmark index were positions in global apparel retailer Gap, global pharmaceutical company Allergan and online professional network provider LinkedIn. |
| Gap reported several quarters of disappointing earnings results driven by weaker than consensus expected sales and foreign exchange headwinds from a stronger U.S. dollar. Product design initiatives had been unable to turn around same-store sales trends, and a challenging macroeconomic environment for apparel retailers remained a headwind for the company. Additionally, news of Old Navy’s president leaving in 2015 was a slight negative for the company. As a result, we believe the risk/reward profile for Gap is less compelling over the near term, and so we exited the Fund’s position by the end of the Reporting Period. |
| Allergan was among the Fund’s biggest detractors during the Reporting Period. Volatility related to mergers and acquisitions the company has been involved in as well as market concerns around drug pricing pressures weighed on Allergan’s stock during the Reporting Period. Despite the near-term volatility and underperformance, we continued to believe at the end of the Reporting Period that Allergan was a high quality growth business, trading at an attractive valuation with meaningful financial flexibility going forward. |
| LinkedIn reported solid fourth quarter 2015 results, with revenues and earnings ahead of market estimates, and |
20
PORTFOLIO RESULTS
| healthy user engagement. Of note, however, was top and bottom line guidance below market expectations, which led to a stock price decline. Specifically, its management attributed the slowdown to macroeconomic pressures in the Europe, Middle East and Africa (“EMEA”) and Asia-Pacific (“APAC”) regions, and it indicated its plans to shut down its acquired Bizo asset. We believe these factors have led investors to question the company’s growth outlook, which is additionally affected by foreign exchange headwinds. We were optimistic on the company’s competitive positioning and unique offering, but our concerns around its long-term business model — as well as its lower guidance — led us to exit the Fund’s position and invest in higher conviction ideas. |
| Q | What were some of the Fund’s best-performing individual stocks? |
| A | The Fund benefited most relative to the S&P 500 Index from positions in e-commerce retailers Amazon.com and eBay and industrial conglomerate General Electric. |
| Amazon.com reported strong third quarter 2015 results and solid first quarter 2016 results, with revenues and earnings well ahead of market expectations. Fundamentals were robust, and its management’s guidance implied continued strength. At the end of the Reporting Period, we believed the business remained strong in retail and Amazon Web Services (“AWS”) and that Amazon Prime’s membership growth could potentially position Amazon.com as a long-term outperformer in the retail industry. We continued to view Amazon.com’s business favorably and believed the company could well be the beneficiary of its scale and competitive advantages over the long term. |
| Shares of eBay gained through July 2016 following strong second quarter 2016 earnings results that were well ahead of market expectations. The company raised its third quarter 2016 outlook for earnings and revenues. eBay also announced an additional $1 billion stock repurchase. At the end of the Reporting Period, we believed eBay’s management team was taking the right steps to ensure the company continues to grow and improve its offerings to customers. In our view, eBay has a strong balance sheet and good cash flow generation, which is a reason for us to have strong conviction in the company and its financial flexibility to invest in its business for future growth. |
| Throughout the Reporting Period, General Electric reported earnings results that exceeded consensus expectations, driven by strong organic revenue growth and operating margin improvement. Additionally, investors reacted positively to General Electric’s long-awaited announcement to spin off its majority stake in Synchrony Financial to existing shareholders. At the end of the Reporting Period, we remained optimistic on General Electric’s growth prospects, as a strong backlog of orders and what we believe to be accretive synergies from recent transactions could be supportive to its earnings in a potentially slow global economic growth environment. |
| Q | How did the Fund use derivatives and similar instruments during the Reporting Period? |
| A | During the Reporting Period, we did not use derivatives as part of an active management strategy. |
| Q | Did the Fund make any significant purchases or sales during the Reporting Period? |
| A | We initiated a Fund position in online social media platform Facebook during the Reporting Period. Over time, Facebook has established an important position as a consumer utility and has captured a significant portion of today’s mobile application mindshare. In our view, demand for Facebook’s business remains strong, and along with its Instagram franchise and online video features, the company is well positioned to capitalize on significant advertising growth. |
| We established a Fund position in MasterCard. MasterCard is a leading global payments and technology company that connects consumers, financial institutions, merchants, governments and businesses worldwide, enabling them to use electronic forms of payment instead of cash and checks. The company offers a wide range of payment solutions that enable the development and implementation of credit, debit, prepaid, commercial and related payment programs and solutions for consumers and merchants. In our view, the company performed well during the fourth quarter of 2015, exceeding its own estimates of gross revenues and billings, although an ongoing rebate and incentive program dragged a bit on net revenue growth. We are positive on the current macroeconomic trends, especially consumer spending, which we believe should benefit the company. We also believe MasterCard has a high quality management team, an investment grade balance sheet and strong free cash flow and operating margins. |
| Conversely, we sold the Fund’s position in financial services company American International Group (“AIG”). We believe any complications with respect to its newly announced strategic plan could add negative pressure to the stock, as major changes within such a complex organization take time |
21
PORTFOLIO RESULTS
| to harmonize, in our view. We took the opportunity to exit the Fund’s position in AIG to pursue higher conviction ideas. |
| We eliminated the Fund’s position in information storage company EMC. We believed that any complications with respect to its acquisition by Dell could add negative pressure to its stock, thus making the risk/reward profile less compelling, in our view. The stock had performed relatively well in the recent downturn, and so we took the opportunity to exit the Fund’s position to allocate the proceeds to other ideas with what we considered to have more compelling upside. |
| Q | Were there any notable changes in the Fund’s weightings during the Reporting Period? |
| A | In constructing the Fund’s portfolio, we focus on picking stocks rather than on making industry or sector bets. We seek to outpace the benchmark index by overweighting stocks that we expect to outperform and underweighting those that we think may lag. Consequently, changes in its sector weights are generally the direct result of individual stock selection or of stock appreciation or depreciation. That said, during the Reporting Period, the Fund’s exposure to consumer discretionary, energy, health care, information technology and materials increased and its allocations to consumer staples, financials and industrials decreased compared to the S&P 500 Index. The Fund’s position in cash also declined during the Reporting Period. |
| Q | How was the Fund positioned relative to its benchmark index at the end of August 2016? |
| A | At the end of August 2016, the Fund had overweighted positions relative to the S&P 500 Index in consumer discretionary, materials, real estate and consumer staples. On the same date, the Fund had underweighted positions compared to the S&P 500 Index in information technology, industrials, utilities and health care and was rather neutrally weighted to the S&P 500 Index in energy and financials. |
| The Fund had no position at all in telecommunication services at the end of the Reporting Period. |
22
FUND BASICS
Dynamic U.S. Equity Fund
as of August 31, 2016
| PERFORMANCE REVIEW | ||||||||||
| September 1, 2015–August 31, 2016 | Fund Total Return (based on NAV)1 | S&P 500® Index2 | ||||||||
| Class A | 4.39 | % | 12.52 | % | ||||||
| Class C | 3.66 | 12.52 | ||||||||
| Institutional | 4.84 | 12.52 | ||||||||
| Class IR | 4.67 | 12.52 | ||||||||
| Class R | 4.18 | 12.52 | ||||||||
| Class R6 | 4.86 | 12.52 | ||||||||
| 1 | The net asset value (“NAV”) represents the net assets of the class of the Fund (ex-dividend) divided by the total number of shares of the class outstanding. The Fund’s performance reflects the reinvestment of dividends and other distributions. The Fund’s performance does not reflect the deduction of any applicable sales charges. |
| 2 | The S&P 500® Index is the Standard & Poor’s 500 Composite Index of 500 stocks, an unmanaged index of common stock prices. The Index figures do not reflect any deduction for fees, expenses or taxes. It is not possible to invest directly in an index. |
| STANDARDIZED TOTAL RETURNS3 | ||||||||||||||||
| For the period ended 6/30/16 | One Year | Five Years | Since Inception | Inception Date | ||||||||||||
| Class A | -11.74 | % | 7.64 | % | 8.80 | % | 11/30/09 | |||||||||
| Class C | -8.20 | 8.07 | 8.91 | 11/30/09 | ||||||||||||
| Institutional | -6.24 | 9.31 | 10.18 | 11/30/09 | ||||||||||||
| Class IR | -6.46 | 9.13 | 10.00 | 11/30/09 | ||||||||||||
| Class R | -6.82 | 8.62 | 9.47 | 11/30/09 | ||||||||||||
| Class R6 | N/A | N/A | -6.98 | 7/31/15 | ||||||||||||
| 3 | The Standardized Total Returns are average annual total returns or cumulative total returns (only if the performance period is one year or less) as of the most recent calendar quarter-end. They assume reinvestment of all distributions at NAV. These returns reflect a maximum initial sales charge of 5.5% for Class A Shares and the assumed contingent deferred sales charge for Class C Shares (1% if redeemed within 12 months of purchase). Because Institutional, Class IR, Class R and Class R6 Shares do not involve a sales charge, such a charge is not applied to their Standardized Total Returns. |
The returns set forth in the tables above represent past performance. Past performance does not guarantee future results. The Fund’s investment return and principal value will fluctuate so that an investor’s shares, when redeemed, may be worth more or less than their original cost. Current performance may be lower or higher than the performance quoted above. Please visit our web site at www.GSAMFUNDS.com to obtain the most recent month-end returns. Performance reflects applicable fee waivers and/or expense limitations in effect during the periods shown. In their absence, performance would be reduced. Returns do not reflect the deduction of taxes that a shareholder would pay on Fund distributions or the redemption of Fund shares.
23
FUND BASICS
| EXPENSE RATIOS4 | ||||||||||
| Net Expense Ratio (Current) | Gross Expense Ratio (Before Waivers) | |||||||||
| Class A | 1.22 | % | 2.81 | % | ||||||
| Class C | 1.97 | 3.56 | ||||||||
| Institutional | 0.82 | 2.42 | ||||||||
| Class IR | 0.97 | 2.63 | ||||||||
| Class R | 1.47 | 3.10 | ||||||||
| Class R6 | 0.80 | 2.40 | ||||||||
| 4 | The expense ratios of the Fund, both current (net of applicable fee waivers and/or expense limitations) and before waivers (gross of applicable fee waivers and/or expense limitations) are as set forth above according to the most recent publicly available Prospectus for the Fund and may differ from the expense ratios disclosed in the Financial Highlights in this report. Pursuant to a contractual arrangement, the Fund’s waivers and/or expense limitations will remain in place through at least December 29, 2016, and prior to such date the Investment Adviser may not terminate the arrangements without the approval of the Fund’s Board of Trustees. If these arrangements are discontinued in the future, the expense ratios may change without shareholder approval. |
| TOP TEN HOLDINGS AS OF 8/31/165 | ||||||||
| Holding | % of Net Assets | Line of Business | ||||||
| Bank of America Corp. | 5.2 | % | Banks | |||||
| Amazon.com, Inc. | 5.1 | Internet & Direct Marketing Retail | ||||||
| Pfizer, Inc. | 4.2 | Pharmaceuticals | ||||||
| Apple, Inc. | 3.9 | Technology Hardware, Storage & Peripherals | ||||||
| Facebook, Inc. Class A | 3.8 | Internet Software & Services | ||||||
| MasterCard, Inc. Class A | 3.5 | IT Services | ||||||
| JPMorgan Chase & Co. | 3.4 | Banks | ||||||
| McKesson Corp. | 3.2 | Health Care Providers & Services | ||||||
| General Electric Co. | 3.1 | Industrial Conglomerates | ||||||
| Abbott Laboratories | 3.1 | Health Care Equipment & Supplies | ||||||
| 5 | The top 10 holdings may not be representative of the Fund’s future investments. |
24
FUND BASICS
| FUND VS. BENCHMARK SECTOR ALLOCATION6 |
| As of August 31, 2016 |
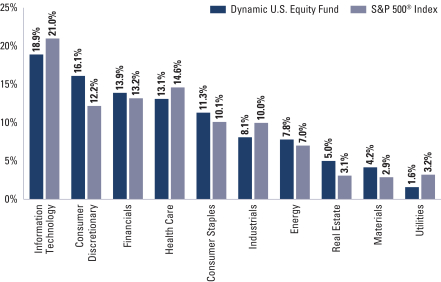
| 6 | The Fund is actively managed and, as such, its composition may differ over time. Consequently, the Fund’s overall sector allocations may differ from the percentages contained in the graph above. The graph categorizes investments using the Global Industry Classification Standard (“GICS”), however, the sector classifications used by the portfolio management team may differ from GICS. The percentage shown for each investment category reflects the value of investments in that category as a percentage of market value. The graph depicts the Fund’s investments but may not represent the Fund’s market exposure due to the exclusion of certain derivatives, if any, as listed in the Additional Investment Information section of the Schedule of Investments. |
25
GOLDMAN SACHS DYNAMIC U.S. EQUITY FUND
Performance Summary
August 31, 2016
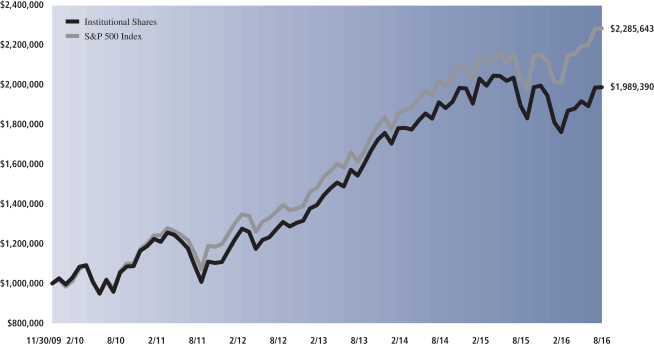
The following graph shows the value, as of August 31, 2016, of a $1,000,000 investment made on November 30, 2009 (commencement of operations) in Institutional Shares at NAV. For comparative purposes, the performance of the Fund’s benchmark, the S&P 500 Index (with dividends reinvested), is shown. Through April 30, 2015, the Fund had been known as the Goldman Sachs U.S. Equity Fund and certain of its strategies differed. This performance data represents past performance and should not be considered indicative of future performance, which will fluctuate with changes in market conditions. These performance fluctuations may cause an investor’s shares, when redeemed, to be worth more or less than their original cost. Performance reflects applicable fee waivers and/or expense limitations in effect during the periods shown and in their absence, performance would be reduced. Returns do not reflect the deduction of taxes that a shareholder would pay on Fund distributions or the redemption of Fund shares. Performance of Class A, Class C, Class IR, Class R and Class R6 Shares will vary from Institutional Shares due to differences in class specific fees and any applicable sales charges. In addition to the Investment Adviser’s decisions regarding issuer/industry investment selection and allocation, other factors may affect Fund performance. These factors include, but are not limited to, Fund operating fees and expenses, portfolio turnover and subscription and redemption cash flows affecting the Fund.
| Dynamic U.S. Equity Fund’s Lifetime Performance |
Performance of a $1,000,000 Investment, including any applicable sales charges, with distributions reinvested, from November 30, 2009 through August 31, 2016.
| Average Annual Total Return through August 31, 2016 | One Year | Five Years | Since Inception | |||||||
Class A (Commenced November 30, 2009) | ||||||||||
Excluding sales charges | 4.39% | 12.38% | 10.27% | |||||||
Including sales charges | -1.34% | 11.12% | 9.35% | |||||||
| ||||||||||
Class C (Commenced November 30, 2009) | ||||||||||
Excluding contingent deferred sales charges | 3.66% | 11.54% | 9.43% | |||||||
Including contingent deferred sales charges | 2.62% | 11.54% | 9.43% | |||||||
| ||||||||||
Institutional Class (Commenced November 30, 2009) | 4.84% | 12.82% | 10.71% | |||||||
| ||||||||||
Class IR (Commenced November 30, 2009) | 4.67% | 12.64% | 10.53% | |||||||
| ||||||||||
Class R (Commenced November 30, 2009) | 4.18% | 12.10% | 9.99% | |||||||
| ||||||||||
Class R6 (Commenced July 31, 2015) | 4.86% | N/A | -2.12% | |||||||
| ||||||||||
26
PORTFOLIO RESULTS
Goldman Sachs Flexible Cap Growth Fund
Portfolio Composition
The Fund invests primarily in U.S. equity investments in small-, mid- and large-capitalization issuers. Since the Fund’s inception, the Goldman Sachs Growth Equity Investment Team has focused on several key investment criteria that it believes can drive a company’s growth over the long term. These characteristics are: dominant market share, established brand name, pricing power, recurring revenue stream, free cash flow, high returns on invested capital, predictable growth, sustainable growth, long product life cycle, enduring competitive advantage, favorable demographic trends and excellent management. The Team strives to purchase these companies at reasonable valuations in order to capture the full benefits of their growth.
Portfolio Management Discussion and Analysis
Below, the Goldman Sachs Growth Equity Investment Team discusses the Goldman Sachs Flexible Cap Growth Fund’s (the “Fund”) performance and positioning for the 12-month period ended August 31, 2016 (the “Reporting Period”).
| Q | How did the Fund perform during the Reporting Period? |
| A | During the Reporting Period, the Fund’s Class A, C, Institutional, IR, R and R6 Shares generated average annual total returns, without sales charges, of 4.93%, 4.12%, 5.29%, 5.20%, 4.61% and 5.29%, respectively. These returns compare to the 9.96% average annual total return of the Fund’s benchmark, the Russell 3000® Growth Index (with dividends reinvested) (the “Russell Index”), during the same period. |
| Q | What key factors were responsible for the Fund’s performance during the Reporting Period? |
| A | The Fund generated solid positive absolute returns, but stock selection overall detracted from the Fund’s performance relative to the Russell Index during the Reporting Period. Sector allocation as a whole also detracted, albeit much more modestly. |
| Q | Which equity market sectors most significantly affected Fund performance? |
| A | The sectors that detracted most from the Fund’s relative results during the Reporting Period were information technology, consumer staples and health care, wherein stock selection proved challenging. The sectors that contributed positively to the Fund’s relative performance during the Reporting Period were financials, energy and consumer discretionary, wherein effective stock selection drove results. |
| Q | Which stocks detracted significantly from the Fund’s performance during the Reporting Period? |
| A | Detracting most from the Fund’s results relative to the Russell Index were positions in luxury household furnishing company Restoration Hardware Holdings, online professional network provider LinkedIn and software giant Microsoft. |
| During the Reporting Period, Restoration Hardware Holdings experienced headwinds of an increasingly challenging retail industry, especially around the high-end consumer. Given the lower and volatile demand, we exited the Fund’s position to invest in what we considered to be more compelling ideas. |
| LinkedIn reported solid fourth quarter 2015 results, with revenues and earnings ahead of market estimates, and healthy user engagement. Of note, however, was top and bottom line guidance below market expectations, which led to a stock price decline. Specifically, its management attributed the slowdown to macroeconomic pressures in the Europe, Middle East and Africa (“EMEA”) and Asia-Pacific (“APAC”) regions, and it indicated its plans to shut down its acquired Bizo asset. We believe these factors have led investors to question the company’s growth outlook, which is additionally affected by foreign exchange headwinds. We were optimistic on the company’s competitive positioning and unique offering, but our concerns around its long-term business model — as well as its lower guidance — led us to exit the Fund’s position and invest in higher conviction ideas. |
27
PORTFOLIO RESULTS
| Microsoft was a new purchase for the Fund during the Reporting Period. Share price weakness on the back of challenging quarterly results had created an opportunity, in our view, to initiate a position, and we believe the company presents good risk/reward potential. During the Reporting Period, Microsoft’s stock performed strongly in absolute returns, but an underweight in the Fund compared to the Russell Index led to it being a detractor from relative returns. Microsoft reported fiscal fourth quarter results that meaningfully exceeded market expectations, with solid revenue trends. Its management also guided down for the following quarter, although the downward revision was more muted than what we have seen in some other quarters. At the end of the Reporting Period, we were optimistic on what we believe are some solid growth and improved profitability focus areas, including Azure, Office 365 and Xbox. We also believed Microsoft was attractively valued with a strong balance sheet, high free cash flow yield and a management that we believe is moving the company in the right direction. |
| Q | What were some of the Fund’s best-performing individual stocks? |
| A | Among those stocks the Fund benefited most from relative to the Russell Index were positions in data center real estate investment trust (“REIT”) Equinix, specialty retailer Ulta Salon, Cosmetics & Fragrance and water technology company Xylem. |
| Equinix was the strongest contributor to the Fund’s performance during the Reporting Period. The company reported solid quarterly results, positively beating market expectations for its organic revenue growth and earnings growth. The company also benefited from a move down in U.S. Treasury yields, which generally favors REITs given their attractive yield and growth potential relative to bonds. At the end of the Reporting Period, we thought that Equinix continued to have substantial pipeline opportunities, particularly with enterprise customers willing to pay a higher price. Continued integration with the company’s Telecity acquisition and a strategic partnership with Datang Telecom could further increase Equinix’s global presence and strengthen its competitive advantage, in our view. Further, we believe Equinix remains an asset with robust upside to its revenues and free cash flows, as it balances organic growth, low leverage and a sound capital structure. |
| After a challenging start to 2016 for Ulta Salon, Cosmetics & Fragrance, momentum started picking up for the company in the beginning of April 2016 after strong first quarter 2016 earnings and the company being added to the S&P 500 Index. Its strong results were driven by margins, revenues and e-commerce growth that were ahead of market expectations. In our view, the company is a strong brand that continues to gain recognition. We believe Ulta Salon, Cosmetics & Fragrance has an opportunity to grow market share through higher brand awareness, increasing loyalty to existing stores, expansion of new stores and e-commerce. |
| During the Reporting Period, Xylem reported strong quarterly results, and toward the end of the Reporting Period, announced the purchase of Sensus, a smart water meter company, for approximately $1.7 billion in cash. The acquisition was viewed positively by investors, as it further bolsters Xylem’s product offering and technological advantage. At the end of the Reporting Period, we remained optimistic on Xylem’s margin expansion prospects and believed its management team has done well to position the company for sustainable long-term growth. |
| Q | How did the Fund use derivatives and similar instruments during the Reporting Period? |
| A | During the Reporting Period, we did not use derivatives as part of an active management strategy. |
| Q | Did the Fund make any significant purchases or sales during the Reporting Period? |
| A | In addition to the purchases already mentioned, we established a Fund position in beverage company Coca-Cola. We view Coca-Cola as a high quality, large-cap consumer staples franchise, with iconic brands and a structurally advantaged global supply chain. However, the stock has been pressured in recent years by international macro headwinds and widespread health concerns about soft drinks. We see meaningful positive incremental change occurring at Coca- Cola, with core category pricing improving sustainably, more aggressive cost cutting, productivity driving higher marketing reinvestment, and structural improvements from bottler refranchising. We expect the turnaround at the company to be increasingly appreciated by the market over time. We also see room for multiple expansion relative to other high quality consumer staples peers. These factors, combined with a stabilizing global macro and currency backdrop, could lead to faster growth and higher returns, in our view. |
| Conversely, we exited the Fund’s position in coffee retailer Starbucks. During the Reporting Period, Starbucks reported disappointing comparable same-store sales growth, which dampened investor sentiment, as it could be an indicator that the rate of its growth is slowing more than widely expected. |
28
PORTFOLIO RESULTS
| Though we continue to like the company and the strength of its franchise, we believed there were other names with more compelling risk/reward profiles, and so we sold the position. |
| We eliminated the Fund’s position in quick-service restaurant owner and franchiser YUM! Brands. While we believe YUM! Brands is a fundamentally strong company with a promising outlook, upcoming initiatives and resilience during difficult environments, we decided to sell out of the name and fund other ideas presenting, in our view, better risk/reward opportunities. |
| Q | Were there any notable changes in the Fund’s weightings during the Reporting Period? |
| A | In constructing the Fund’s portfolio, we focus on picking stocks rather than on making industry or sector bets. We seek to outpace the benchmark index by overweighting stocks that we expect to outperform and underweighting those that we think may lag. Consequently, changes in its sector weights are generally the direct result of individual stock selection or of stock appreciation or depreciation. That said, during the Reporting Period, the Fund’s exposure to consumer staples and industrials increased and its allocations to consumer discretionary, energy and financials decreased relative to the Russell Index. |
| Q | How was the Fund positioned relative to its benchmark index at the end of August 2016? |
| A | At the end of August 2016, the Fund had overweighted positions relative to the Russell Index in the financials sector. On the same date, the Fund had underweighted positions compared to the Russell Index in health care, consumer discretionary and materials and was rather neutrally weighted to the Russell Index in consumer staples, energy, industrials, information technology, real estate and telecommunication services. The Fund had no position at all in the utilities sector at the end of the Reporting Period. |
29
FUND BASICS
Flexible Cap Growth Fund
as of August 31, 2016
| PERFORMANCE REVIEW | ||||||||||
| September 1, 2015–August 31, 2016 | Fund Total Return (based on NAV)1 | Russell 3000® Growth Index2 | ||||||||
| Class A | 4.93 | % | 9.96 | % | ||||||
| Class C | 4.12 | 9.96 | ||||||||
| Institutional | 5.29 | 9.96 | ||||||||
| Class IR | 5.20 | 9.96 | ||||||||
| Class R | 4.61 | 9.96 | ||||||||
| Class R6 | 5.29 | 9.96 | ||||||||
| 1 | The net asset value (“NAV”) represents the net assets of the class of the Fund (ex-dividend) divided by the total number of shares of the class outstanding. The Fund’s performance reflects the reinvestment of dividends and other distributions. The Fund’s performance does not reflect the deduction of any applicable sales charges. |
| 2 | The unmanaged Russell 3000® Growth Index measures the performance of the 3,000 largest U.S. companies based on total market capitalization. The Index figures do not reflect any deduction for fees, expenses or taxes. It is not possible to invest directly in an index. |
| STANDARDIZED TOTAL RETURNS3 | ||||||||||||||||||
| For the period ended 6/30/16 | One Year | Five Year | Since Inception | Inception Date | ||||||||||||||
| Class A | -8.73 | % | 9.54 | % | 7.92 | % | 1/31/08 | |||||||||||
| Class C | -5.15 | 9.95 | 7.86 | 1/31/08 | ||||||||||||||
| Institutional | -3.07 | 11.23 | 9.10 | 1/31/08 | ||||||||||||||
| Class IR | -3.11 | 11.07 | 8.94 | 1/31/08 | ||||||||||||||
| Class R | -3.71 | 10.51 | 8.40 | 1/31/08 | ||||||||||||||
| Class R6 | N/A | N/A | -5.98 | 7/31/15 | ||||||||||||||
| 3 | The Standardized Total Returns are average annual total returns or cumulative total returns (only if the performance period is one year or less) as of the most recent calendar quarter-end. They assume reinvestment of all distributions at NAV. These returns reflect a maximum initial sales charge of 5.5% for Class A Shares and the assumed contingent deferred sales charge for Class C Shares (1% if redeemed within 12 months of purchase). Because Institutional, Class IR, Class R and Class R6 Shares do not involve a sales charge, such a charge is not applied to their Standardized Total Returns. |
The returns set forth in the tables above represent past performance. Past performance does not guarantee future results. The Fund’s investment return and principal value will fluctuate so that an investor’s shares, when redeemed, may be worth more or less than their original cost. Current performance may be lower or higher than the performance quoted above. Please visit our web site at www.GSAMFUNDS.com to obtain the most recent month-end returns. Performance reflects applicable fee waivers and/or expense limitations in effect during the periods shown. In their absence, performance would be reduced. Returns do not reflect the deduction of taxes that a shareholder would pay on Fund distributions or the redemption of Fund shares.
30
FUND BASICS
| EXPENSE RATIOS4 | ||||||||||
| Net Expense Ratio (Current) | Gross Expense Ratio (Before Waivers) | |||||||||
| Class A | 1.22 | % | 2.97 | % | ||||||
| Class C | 1.97 | 3.71 | ||||||||
| Institutional | 0.82 | 2.57 | ||||||||
| Class IR | 0.97 | 2.66 | ||||||||
| Class R | 1.47 | 3.24 | ||||||||
| Class R6 | 0.80 | 4.34 | ||||||||
| 4 | The expense ratios of the Fund, both current (net of applicable fee waivers and/or expense limitations) and before waivers (gross of applicable fee waivers and/or expense limitations) are as set forth above according to the most recent publicly available Prospectus for the Fund and may differ from the expense ratios disclosed in the Financial Highlights in this report. Pursuant to a contractual arrangement, the Fund’s waivers and/or expense limitations will remain in place through at least December 29, 2016, and prior to such date the Investment Adviser may not terminate the arrangements without the approval of the Fund’s Board of Trustees. If these arrangements are discontinued in the future, the expense ratios may change without shareholder approval. |
| TOP TEN HOLDINGS AS OF 8/31/165 | ||||||||
| Holding | % of Net Assets | Line of Business | ||||||
| Apple, Inc. | 5.8 | % | Technology Hardware, Storage & Peripherals | |||||
| Facebook, Inc. Class A | 3.9 | Internet Software & Services | ||||||
| Amazon.com, Inc. | 3.6 | Internet & Direct Marketing Retail | ||||||
| Alphabet, Inc. Class A | 2.8 | Internet Software & Services | ||||||
| Microsoft Corp. | 2.7 | Software | ||||||
| Alphabet, Inc. Class C | 2.4 | Internet Software & Services | ||||||
| Honeywell International, Inc. | 2.2 | Industrial Conglomerates | ||||||
| MasterCard, Inc. Class A | 2.1 | IT Services | ||||||
| Comcast Corp. Class A | 1.9 | Media | ||||||
| Costco Wholesale Corp. | 1.9 | Food & Staples Retailing | ||||||
| 5 | The top 10 holdings may not be representative of the Fund’s future investments. |
31
FUND BASICS
| FUND VS. BENCHMARK SECTOR ALLOCATION6 |
| As of August 31, 2016 |
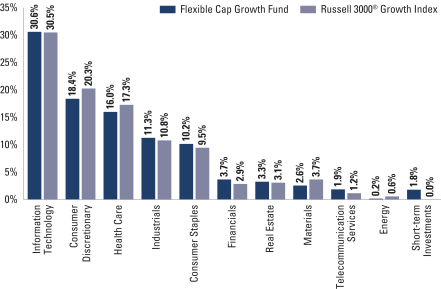
| 6 | The Fund is actively managed and, as such, its composition may differ over time. Consequently, the Fund’s overall sector allocations may differ from the percentages contained in the graph above. The graph categorizes investments using the Global Industry Classification Standard (“GICS”), however, the sector classifications used by the portfolio management team may differ from GICS. The percentage shown for each investment category reflects the value of investments in that category as a percentage of market value. Short-term investments represent repurchase agreements. The graph depicts the Fund’s investments but may not represent the Fund’s market exposure due to the exclusion of certain derivatives, if any, as listed in the Additional Investment Information section of the Schedule of Investments. |
32
GOLDMAN SACHS FLEXIBLE CAP GROWTH FUND
Performance Summary
August 31, 2016
The following graph shows the value, as of August 31, 2016, of a $1,000,000 investment made on January 31, 2008 (commencement of operations) in Institutional Shares at NAV. For comparative purposes, the performance of the Fund’s benchmark, the Russell 3000 Growth Index (with dividends reinvested), is shown. This performance data represents past performance and should not be considered indicative of future performance, which will fluctuate with changes in market conditions. These performance fluctuations may cause an investor’s shares, when redeemed, to be worth more or less than their original cost. Performance reflects applicable fee waivers and/or expense limitations in effect during the periods shown and in their absence, performance would be reduced. Returns do not reflect the deduction of taxes that a shareholder would pay on Fund distributions or the redemption of Fund shares. Performance of Class A, Class C, Class IR, Class R and Class R6 Shares will vary from Institutional Shares due to differences in class specific fees and any applicable sales charges. In addition to the Investment Adviser’s decisions regarding issuer/industry investment selection and allocation, other factors may affect Fund performance. These factors include, but are not limited to, Fund operating fees and expenses, portfolio turnover and subscription and redemption cash flows affecting the Fund.
| Flexible Cap Growth Fund’s Lifetime Performance |
Performance of a $1,000,000 Investment, including any applicable sales charges, with distributions reinvested, from January 31, 2008 through August 31, 2016.
![]()
| Average Annual Total Return through August 31, 2016 | One Year | Five Years | Since Inception | |||||||
Class A (Commenced January 31, 2008) | ||||||||||
Excluding sales charges | 4.93% | 13.70% | 8.97% | |||||||
Including sales charges | -0.81% | 12.43% | 8.26% | |||||||
| ||||||||||
Class C (Commenced January 31, 2008) | ||||||||||
Excluding contingent deferred sales charges | 4.12% | 12.86% | 8.19% | |||||||
Including contingent deferred sales charges | 3.08% | 12.86% | 8.19% | |||||||
| ||||||||||
Institutional Class (Commenced January 31, 2008) | 5.29% | 14.16% | 9.42% | |||||||
| ||||||||||
Class IR (Commenced January 31, 2008) | 5.20% | 14.00% | 9.27% | |||||||
| ||||||||||
Class R (Commenced January 31, 2008) | 4.61% | 13.44% | 8.73% | |||||||
| ||||||||||
Class R6 (Commenced July 31, 2015) | 5.29% | N/A | -1.92% | |||||||
| ||||||||||
33
PORTFOLIO RESULTS
Goldman Sachs Focused Growth Fund
Portfolio Composition
The Fund invests primarily in U.S. equity investments. Since the Fund’s inception, the Goldman Sachs Growth Equity Investment Team has focused on several key investment criteria that it believes can drive a company’s growth over the long term. These characteristics are: dominant market share, established brand name, pricing power, recurring revenue stream, free cash flow, high returns on invested capital, predictable growth, sustainable growth, long product life cycle, enduring competitive advantage, favorable demographic trends and excellent management. The Team strives to purchase these companies at reasonable valuations in order to capture the full benefits of their growth.
Portfolio Management Discussion and Analysis
Below, the Goldman Sachs Growth Equity Investment Team discusses the Goldman Sachs Focused Growth Fund’s (the “Fund”) performance and positioning for the 12-month period ended August 31, 2016 (the “Reporting Period”).
| Q | How did the Fund perform during the Reporting Period? |
| A | During the Reporting Period, the Fund’s Class A, C, Institutional, IR, R and R6 Shares generated average annual total returns, without sales charges, of 3.36%, 2.56%, 3.75%, 3.65%, 3.07% and 3.77%, respectively. These returns compare to the 10.51% average annual total return of the Fund’s benchmark, the Russell 1000® Growth Index (with dividends reinvested) (the “Russell Index”), during the same period. |
| Q | What key factors were responsible for the Fund’s performance during the Reporting Period? |
| A | The Fund posted positive absolute returns, but stock selection overall detracted from the Fund’s performance relative to the Russell Index during the Reporting Period. Sector allocation as a whole contributed positively, albeit modestly, during the Reporting Period. |
| Q | Which equity market sectors most significantly affected Fund performance? |
| A | Challenging stock selection in health care, consumer discretionary and consumer staples detracted from the Fund’s relative results most. Effective stock selection in the financials sector and having an underweight to the energy sector, which was by far the weakest performer in the Russell Index during the Reporting Period, helped the Fund’s performance most relative to the Russell Index. |
| Q | Which stocks detracted significantly from the Fund’s performance during the Reporting Period? |
| A | Detracting most from the Fund’s results relative to the Russell Index were positions in global apparel company PVH, global pharmaceutical company Allergan and biotechnology firm Vertex Pharmaceuticals. |
| PVH was the top detractor from the Fund’s results during the Reporting Period. Weakness in the U.S. retail environment, high promotions in the industry, and currency headwinds added pressure to what we believe is otherwise a high quality company. While we continue to like the company and believe PVH remains a leading franchise with dominant market share, strong pricing power and solid fundamentals, near- term uncertainty led us to consolidate the Fund’s exposure into other consumer positions where we find the risk/reward opportunity more compelling. |
| Allergan was among the Fund’s biggest detractors during the Reporting Period. Volatility related to mergers and acquisitions the company has been involved in as well as market concerns around drug pricing pressures weighed on Allergan’s stock during the Reporting Period. Despite the near-term volatility and underperformance, we continued to believe at the end of the Reporting Period that Allergan was a high quality growth business, trading at an attractive valuation with meaningful financial flexibility going forward. |
34
PORTFOLIO RESULTS
| Vertex Pharmaceuticals was a top detractor from the Fund’s performance during the Reporting Period. Early in 2016, its shares came under pressure following a disappointing fiscal fourth quarter that fell short of consensus expectations. Additionally, lowered expectations surrounding the launch of Vertex Pharmaceuticals’ new cystic fibrosis treatment, orkambi, caused shares to decline. Despite this weakness, at the end of the Reporting Period, we believed Vertex Pharmaceuticals had strong underlying fundamentals, a promising product pipeline with significant short-term and long-term catalysts and an attractive valuation. We further believed the company, led by what we consider to be a capable management team, could continue to see growth given its dominant market share in its space and given geographic expansionary efforts that have contributed to meaningful profitability. |
| Q | What were some of the Fund’s best-performing individual stocks? |
| A | Among those stocks the Fund benefited from relative to the Russell Index were positions in data center real estate investment trust (“REIT”) Equinix, online social media platform Facebook and e-commerce retailer Amazon.com. |
| Equinix was the strongest contributor to the Fund’s performance during the Reporting Period. The company reported solid quarterly results, positively beating market expectations for its organic revenue growth and earnings growth. The company also benefited from a move down in U.S. Treasury yields, which generally favors REITs given their attractive yield and growth potential relative to bonds. At the end of the Reporting Period, we thought that Equinix continued to have substantial pipeline opportunities, particularly with enterprise customers willing to pay a higher price. Continued integration with the company’s Telecity acquisition and a strategic partnership with Datang Telecom could further increase Equinix’s global presence and strengthen its competitive advantage, in our view. Further, we believe Equinix remains an asset with robust upside to its revenues and free cash flows, as it balances organic growth, low leverage and a sound capital structure. |
| Facebook, a new purchase for the Fund during the Reporting Period, was a top positive contributor to the Fund’s relative results during the Reporting Period. Over time, Facebook has established an important position as a consumer utility and has captured a significant portion of today’s mobile application mindshare. In our view, demand for Facebook’s business remains strong, and along with its Instagram franchise and online video features, the company is well positioned to capitalize on significant advertising growth. During the Reporting Period, the company reported strong quarterly results, underpinned by advertisement revenue growth well above market expectations. Demand from advertisers was robust across most segments and geographies, and the company benefited from its three key levers — user growth, time spent and ad load. At the end of the Reporting Period, we remained positive on Facebook’s high operating expenditures, at what we consider to be manageable levels, which should allow the company to invest aggressively in substantial growth opportunities and simultaneously increase earnings. We think additional tailwinds in the form of lower and decreasing tax rates — and video-driven growth — may further benefit the company in coming years. In our view, Facebook’s strong fundamentals, high barriers to entry and robust contribution from Instagram warrant a constructive outlook on its long-term growth prospects. |
| Amazon.com reported strong third quarter 2015 results and solid first quarter 2016 results, with revenues and earnings well ahead of market expectations. Fundamentals were robust, and its management’s guidance implied continued strength. At the end of the Reporting Period, we believed the business remained strong in retail and Amazon Web Services (“AWS”) and that Amazon Prime’s membership growth could potentially position Amazon.com as a long-term outperformer in the retail industry. We continued to view Amazon.com’s business favorably and believed the company could well be the beneficiary of its scale and competitive advantages over the long term. |
| Q | How did the Fund use derivatives and similar instruments during the Reporting Period? |
| A | During the Reporting Period, we did not use derivatives as part of an active management strategy. |
| Q | Did the Fund make any significant purchases or sales during the Reporting Period? |
| A | In addition to the purchase of Facebook, already mentioned, we initiated a Fund position in Honeywell International. Honeywell International is a diversified technology and manufacturing company, which offers aerospace products, |
35
PORTFOLIO RESULTS
| power generation systems, specialty chemicals and electronic materials. We are encouraged by positive trends in aerospace, U.S. defense, China and process management, which we believe position the company well for long-term growth. We also see opportunities for improved free cash flow margins should capital expenditures decline in the next few years as we anticipate. Given our positive near-term outlook and what we see as the company’s prospects for organic acceleration, we are optimistic on Honeywell International’s long-term returns. |
| Conversely, in addition to the sales already mentioned, we exited the Fund’s position in online travel company Priceline Group. While we believe Priceline Group is a quality business, our confidence in the company was tested by persistent consensus concerns about continued lodging and an unfavorable outlook for the travel industry. As a result, we decided to sell the position and pursue higher conviction ideas. |
| Q | Were there any notable changes in the Fund’s weightings during the Reporting Period? |
| A | In constructing the Fund’s portfolio, we focus on picking stocks rather than on making industry or sector bets. We seek to outpace the benchmark index by overweighting stocks that we expect to outperform and underweighting those that we think may lag. Consequently, changes in its sector weights are generally the direct result of individual stock selection or of stock appreciation or depreciation. That said, during the Reporting Period, the Fund’s exposure to health care, industrials and materials increased and its allocations to consumer discretionary, financials and information technology decreased relative to the Russell Index. The Fund’s allocation to cash decreased during the Reporting Period as well. |
| Q | How was the Fund positioned relative to its benchmark index at the end of August 2016? |
| A | At the end of August 2016, the Fund had overweighted positions relative to the Russell Index in the financials, real estate and consumer staples sectors. On the same date, the Fund had underweighted positions compared to the Russell Index in consumer discretionary, health care and information technology. The Fund was rather neutrally weighted to the Russell Index in industrials and materials and had no positions at all in the energy, utilities or telecommunication services sectors at the end of the Reporting Period. |
36
FUND BASICS
Focused Growth Fund
as of August 31, 2016
| PERFORMANCE REVIEW | ||||||||||
| September 1, 2015–August 31, 2016 | Fund Total Return (based on NAV)1 | Russell 1000® Growth Index2 | ||||||||
| Class A | 3.36 | % | 10.51 | % | ||||||
| Class C | 2.56 | 10.51 | ||||||||
| Institutional | 3.75 | 10.51 | ||||||||
| Class IR | 3.65 | 10.51 | ||||||||
| Class R | 3.07 | 10.51 | ||||||||
| Class R6 | 3.77 | 10.51 | ||||||||
| 1 | The net asset value (“NAV”) represents the net assets of the class of the Fund (ex-dividend) divided by the total number of shares of the class outstanding. The Fund’s performance reflects the reinvestment of dividends and other distributions. The Fund’s performance does not reflect the deduction of any applicable sales charges. |
| 2 | The Russell 1000® Growth Index is an unmanaged market capitalization weighted index of the 1000 largest U.S. companies with higher price-to-book ratios and higher forecasted growth values. The Index figures do not include any deduction for fees, expenses or taxes. It is not possible to invest directly in an unmanaged index. |
| STANDARDIZED TOTAL RETURNS3 | ||||||||||||
| For the period ended 6/30/16 | One Year | Since Inception | Inception Date | |||||||||
| Class A | -7.46 | % | 10.62 | % | 1/31/12 | |||||||
| Class C | -3.84 | 11.22 | 1/31/12 | |||||||||
| Institutional | -1.75 | 12.51 | 1/31/12 | |||||||||
| Class IR | -1.92 | 12.34 | 1/31/12 | |||||||||
| Class R | -2.42 | 11.77 | 1/31/12 | |||||||||
| Class R6 | N/A | -4.63 | 7/31/15 | |||||||||
| 3 | The Standardized Total Returns are average annual total returns or cumulative total returns (only if the performance period is one year or less) as of the most recent calendar quarter-end. They assume reinvestment of all distributions at NAV. These returns reflect a maximum initial sales charge of 5.5% for Class A Shares and the assumed contingent deferred sales charge for Class C Shares (1% if redeemed within 12 months of purchase). Because Institutional, Class IR, Class R and Class R6 Shares do not involve a sales charge, such a charge is not applied to their Standardized Total Returns. |
The returns set forth in the tables above represent past performance. Past performance does not guarantee future results. The Fund’s investment return and principal value will fluctuate so that an investor’s shares, when redeemed, may be worth more or less than their original cost. Current performance may be lower or higher than the performance quoted above. Please visit our web site at www.GSAMFUNDS.com to obtain the most recent month-end returns. Performance reflects applicable fee waivers and/or expense limitations in effect during the periods shown. In their absence, performance would be reduced. Returns do not reflect the deduction of taxes that a shareholder would pay on Fund distributions or the redemption of Fund shares.
37
FUND BASICS
| EXPENSE RATIOS4 | ||||||||||
| Net Expense Ratio (Current) | Gross Expense Ratio (Before Waivers) | |||||||||
| Class A | 1.20 | % | 2.22 | % | ||||||
| Class C | 1.95 | 3.00 | ||||||||
| Institutional | 0.80 | 1.85 | ||||||||
| Class IR | 0.97 | 2.02 | ||||||||
| Class R | 1.45 | 2.50 | ||||||||
| Class R6 | 0.78 | 1.83 | ||||||||
| 4 | The expense ratios of the Fund, both current (net of applicable fee waivers and/or expense limitations) and before waivers (gross of applicable fee waivers and/or expense limitations) are as set forth above according to the most recent publicly available Prospectus for the Fund and may differ from the expense ratios disclosed in the Financial Highlights in this report. Pursuant to a contractual arrangement, the Fund’s waivers and/or expense limitations will remain in place through at least December 29, 2016, and prior to such date the Investment Adviser may not terminate the arrangements without the approval of the Fund’s Board of Trustees. If these arrangements are discontinued in the future, the expense ratios may change without shareholder approval. |
| TOP TEN HOLDINGS AS OF 8/31/165 | ||||||||
| Holding | % of Net Assets | Line of Business | ||||||
| Apple, Inc. | 10.2 | % | Technology Hardware, Storage & Peripherals | |||||
| American Tower Corp. | 6.1 | Equity Real Estate Investment Trusts (REITs) | ||||||
| Costco Wholesale Corp. | 6.1 | Food & Staples Retailing | ||||||
| Facebook, Inc. Class A | 5.8 | Internet Software & Services | ||||||
| Alphabet, Inc. Class A | 5.4 | Internet Software & Services | ||||||
| MasterCard, Inc. Class A | 5.4 | IT Services | ||||||
| Amazon.com, Inc. | 4.9 | Internet & Direct Marketing Retail | ||||||
| Honeywell International, Inc. | 4.9 | Industrial Conglomerates | ||||||
| Abbott Laboratories | 4.7 | Health Care Equipment & Supplies | ||||||
| Intercontinental Exchange, Inc. | 4.5 | Capital Markets | ||||||
| 5 | The top 10 holdings may not be representative of the Fund’s future investments. |
38
FUND BASICS
| FUND VS. BENCHMARK SECTOR ALLOCATION6 |
| As of August 31, 2016 |
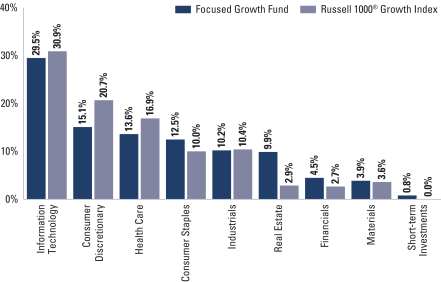
| 6 | The Fund is actively managed and, as such, its composition may differ over time. Consequently, the Fund’s overall sector allocations may differ from the percentages contained in the graph above. The graph categorizes investments using the Global Industry Classification Standard (“GICS”), however, the sector classifications used by the portfolio management team may differ from GICS. The percentage shown for each investment category reflects the value of investments in that category as a percentage of market value. Short-term investments represent repurchase agreements. The graph depicts the Fund’s investments but may not represent the Fund’s market exposure due to the exclusion of certain derivatives, if any, as listed in the Additional Investment Information section of the Schedule of Investments. |
39
GOLDMAN SACHS FOCUSED GROWTH FUND
Performance Summary
August 31, 2016
The following graph shows the value, as of August 31, 2016, of a $1,000,000 investment made on January 31, 2012 (commencement of operations) in Institutional Shares at NAV. For comparative purposes, the performance of the Fund’s benchmark, the Russell 1000 Growth Index (with dividends reinvested), is shown. This performance data represents past performance and should not be considered indicative of future performance, which will fluctuate with changes in market conditions. These performance fluctuations may cause an investor’s shares, when redeemed, to be worth more or less than their original cost. Performance reflects applicable fee waivers and/or expense limitations in effect during the periods shown and in their absence, performance would be reduced. Returns do not reflect the deduction of taxes that a shareholder would pay on Fund distributions or the redemption of Fund shares. Performance of Class A, Class C, Class IR, Class R and Class R6 Shares will vary from Institutional Shares due to differences in class specific fees and any applicable sales charges. In addition to the Investment Adviser’s decisions regarding issuer/industry investment selection and allocation, other factors may affect Fund performance. These factors include, but are not limited to, Fund operating fees and expenses, portfolio turnover and subscription and redemption cash flows affecting the Fund.
| Focused Growth Fund’s Lifetime Performance |
Performance of a $1,000,000 Investment, including any applicable sales charges, with distributions reinvested, from January 31, 2012 through August 31, 2016.
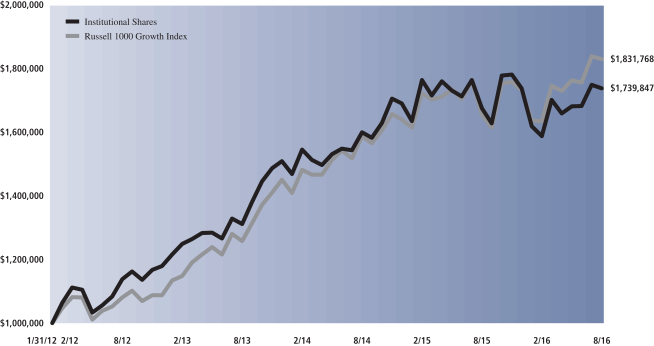
| Average Annual Total Return through August 31, 2016 | One Year | Since Inception | ||||||
Class A (Commenced January 31, 2012) | ||||||||
Excluding sales charges | 3.36% | 12.37% | ||||||
Including sales charges | -2.34% | 10.99% | ||||||
| ||||||||
Class C (Commenced January 31, 2012) | ||||||||
Excluding contingent deferred sales charges | 2.56% | 11.54% | ||||||
Including contingent deferred sales charges | 1.54% | 11.54% | ||||||
| ||||||||
Institutional Class (Commenced January 31, 2012) | 3.75% | 12.83% | ||||||
| ||||||||
Class IR (Commenced January 31, 2012) | 3.65% | 12.66% | ||||||
| ||||||||
Class R (Commenced January 31, 2012) | 3.07% | 12.09% | ||||||
| ||||||||
Class R6 (Commenced July 31, 2015) | 3.77% | -1.33% | ||||||
| ||||||||
40
PORTFOLIO RESULTS
Goldman Sachs Growth Opportunities Fund
Portfolio Composition
The Fund invests primarily in medium-sized growth companies with a market capitalization between $1 and $10 billion. Since the Fund’s inception, the Goldman Sachs Growth Equity Investment Team has focused on several key investment criteria that it believes can drive a company’s growth over the long term. These characteristics are: dominant market share, established brand name, pricing power, recurring revenue stream, free cash flow, high returns on invested capital, predictable growth, sustainable growth, long product life cycle, enduring competitive advantage, favorable demographic trends and excellent management. The Team strives to purchase these companies at reasonable valuations in order to capture the full benefits of their growth.
Portfolio Management Discussion and Analysis
Below, the Goldman Sachs Growth Equity Investment Team discusses the Goldman Sachs Growth Opportunities Fund’s (the “Fund”) performance and positioning for the 12-month period ended August 31, 2016 (the “Reporting Period”).
| Q | How did the Fund perform during the Reporting Period? |
| A | During the Reporting Period, the Fund’s Class A, C, Institutional, Service, IR, R and R6 Shares generated average annual total returns, without sales charges, of 3.39%, 2.66%, 3.76%, 3.27%, 3.64%, 3.12% and 3.81%, respectively. These returns compare to the 6.98% average annual total return of the Fund’s benchmark, the Russell Midcap® Growth Index (with dividends reinvested) (the “Russell Index”), during the same period. |
| Q | What key factors were responsible for the Fund’s performance during the Reporting Period? |
| A | The Fund generated positive absolute returns, but stock selection overall detracted from the Fund’s performance relative to the Russell Index during the Reporting Period. Sector allocation as a whole also detracted, albeit more modestly. |
| Q | Which equity market sectors most significantly affected Fund performance? |
| A | Detracting most from the Fund’s relative results was challenging stock selection in the consumer discretionary, health care and information technology sectors. The only two sectors to contribute positively to the Fund’s relative performance during the Reporting Period were financials and industrials, wherein effective stock selection drove results. |
| Q | Which stocks detracted significantly from the Fund’s performance during the Reporting Period? |
| A | Detracting most from the Fund’s results relative to its benchmark index were positions in luxury household furnishing company Restoration Hardware Holdings, hospital and medical services provider holding company Adeptus Health and molecular diagnostics company Cepheid. |
| During the Reporting Period, Restoration Hardware Holdings experienced headwinds of an increasingly challenging retail industry, especially around the high-end consumer. Given the lower and volatile demand, we exited the Fund’s position to invest in what we considered to be more compelling ideas. |
Toward the beginning of the Reporting Period, despite strong third quarter 2015 results, Adeptus Health’s shares traded lower, partly due to sympathies toward other health services companies that performed below market expectations. Additionally, the company’s results reflected some seasonal slowdown from the prior quarter, which may have impacted investor sentiment. At the end of the Reporting Period, we believed Adeptus Health remained one of the fastest growing players in the health care services industry with good visibility on new facility openings during the next few years. In our view, the company’s growth story has also been driven by its joint venture strategy that focuses on partnering with not-for-profit health care systems. Adeptus Health maintains a dominant position in a rapidly expanding industry, and we believe it presents significant upside |
41
PORTFOLIO RESULTS
potential should it continue to expand both organically and through its joint venture strategy. |
| Much of Cepheid’s share price decline came following its fiscal third quarter 2015 earnings report. While the company was in line with the market’s revenue expectations, it reduced its revenue outlook in the fourth quarter of 2015. Despite the weakness, at the end of the Reporting Period, we maintained confidence in the actions its management is taking to accelerate the company’s growth profile. In our view, Cepheid remains the dominant molecular diagnostics platform. |
| Q | What were some of the Fund’s best-performing individual stocks? |
| A | The Fund benefited most relative to the Russell Index from positions in specialty retailers Ulta Salon, Cosmetics & Fragrance, data center real estate investment trust (“REIT”) Equinix and water technology company Xylem. |
| After a challenging start to 2016 for Ulta Salon, Cosmetics & Fragrance, momentum started picking up for the company in the beginning of April 2016 after strong first quarter 2016 earnings and the company being added to the S&P 500 Index. Its strong results were driven by margins, revenues and e-commerce growth that were ahead of market expectations. In our view, the company is a strong brand that continues to gain recognition. We believe Ulta Salon, Cosmetics & Fragrance has an opportunity to grow market share through higher brand awareness, increasing loyalty to existing stores, expansion of new stores and e-commerce. |
| Equinix was a strong contributor to the Fund’s performance during the Reporting Period. The company reported solid quarterly results, positively beating market expectations for its organic revenue growth and earnings growth. The company also benefited from a move down in U.S. Treasury yields, which generally favors REITs given their attractive yield and growth potential relative to bonds. At the end of the Reporting Period, we thought that Equinix continued to have substantial pipeline opportunities, particularly with enterprise customers willing to pay a higher price. Continued integration with the company’s Telecity acquisition and a strategic partnership with Datang Telecom could further increase Equinix’s global presence and strengthen its competitive advantage, in our view. Further, we believe Equinix remains an asset with robust upside to its revenues and free cash flows, as it balances organic growth, low leverage and a sound capital structure. |
| During the Reporting Period, Xylem reported strong quarterly results, and toward the end of the Reporting Period, announced the purchase of Sensus, a smart water meter company, for approximately $1.7 billion in cash. The acquisition was viewed positively by investors, as it further bolsters Xylem’s product offering and technological advantage. Xylem was a new purchase for the Fund during the Reporting Period. In our view, Xylem is poised to benefit from secular growth and the cyclical recovery of water utility spending. The company’s exposure to oil is minimal, and we believe there are merger and acquisition opportunities to move up the water technology curve if needed. At the end of the Reporting Period, we remained optimistic on Xylem’s margin expansion prospects and believed its management team has done well to position the company for sustainable long-term growth. |
| Q | How did the Fund use derivatives and similar instruments during the Reporting Period? |
| A | During the Reporting Period, we did not use derivatives as part of an active management strategy. |
| Q | Did the Fund make any significant purchases or sales during the Reporting Period? |
| A | In addition to those purchases already mentioned, we initiated a Fund position in off-price retailer Ross Stores. Off-price retailers, such as Ross Stores, seek to take advantage of excess inventory from full-price retailers by purchasing goods at a significant discount to their original prices. We believe Ross Stores is well positioned within its industry and attractively valued for a high quality company. We are encouraged by Ross Stores’ consistent sales and earnings growth over time, strong free cash flows, and demonstrated track record of returning capital to shareholders. |
| Conversely, in addition to those sales mentioned earlier, we exited the Fund’s position in W.W. Grainger, a distributor of repair and operating supplies. Toward the end of July 2016, the company reported weak second quarter 2016 results, which missed market estimates, and its management cut its guidance. This weakness was driven primarily by pricing below market expectations, particularly in the U.S. and Canada. The company was also losing market share with mid-sized customers. Overall, we believe the business continues to face secular challenges, and so we sold out of the Fund position to invest in higher conviction ideas. |
| We sold the Fund’s position in LinkedIn, the online professional network provider. Late in the Reporting Period, its shares sharply gained following the announcement that |
42
PORTFOLIO RESULTS
| Microsoft had reached an agreement to acquire LinkedIn at a significant premium. After this development, we decided to exit the Fund’s position and allocate proceeds to other ideas. |
| Q | Were there any notable changes in the Fund’s weightings during the Reporting Period? |
| A | In constructing the Fund’s portfolio, we focus on picking stocks rather than on making industry or sector bets. We seek to outpace the benchmark index by overweighting stocks that we expect to outperform and underweighting those that we think may lag. Consequently, changes in its sector weights are generally the direct result of individual stock selection or of stock appreciation or depreciation. That said, during the Reporting Period, the Fund’s exposure to consumer staples, industrials, materials and telecommunication services increased as did its position in cash and its allocations to consumer discretionary, health care and information technology decreased relative to the Russell Index. |
| Q | How was the Fund positioned relative to its benchmark index at the end of August 2016? |
| A | At the end of August 2016, the Fund had overweighted positions relative to the Russell Index in the telecommunication services, consumer staples, financials and materials sectors. On the same date, the Fund had underweighted positions compared to the Russell Index in information technology, consumer discretionary and real estate. The Fund was rather neutrally weighted to the Index in energy, health care and industrials and had no position at all in utilities at the end of the Reporting Period. |
43
FUND BASICS
Growth Opportunities Fund
as of August 31, 2016
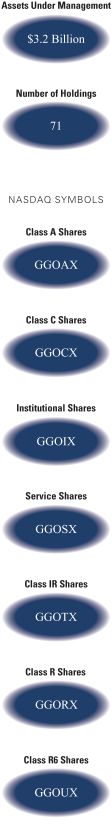
| PERFORMANCE REVIEW | ||||||||||
| September 1, 2015–August 31, 2016 | Fund Total Return (based on NAV)1 | Russell Midcap® Growth Index2 | ||||||||
| Class A | 3.39 | % | 6.98 | % | ||||||
| Class C | 2.66 | 6.98 | ||||||||
| Institutional | 3.76 | 6.98 | ||||||||
| Service | 3.27 | 6.98 | ||||||||
| Class IR | 3.64 | 6.98 | ||||||||
| Class R | 3.12 | 6.98 | ||||||||
| Class R6 | 3.81 | 6.98 | ||||||||
| 1 | The net asset value (“NAV”) represents the net assets of the class of the Fund (ex-dividend) divided by the total number of shares of the class outstanding. The Fund’s performance reflects the reinvestment of dividends and other distributions. The Fund’s performance does not reflect the deduction of any applicable sales charges. |
| 2 | The Russell Midcap® Growth Index is an unmanaged market capitalization weighted index that measures the performance of those Russell Midcap companies with higher price-to-book ratios and higher forecasted growth values. The Index figures do not reflect any deduction for fees, expenses or taxes. It is not possible to invest directly in an index. |
| STANDARDIZED TOTAL RETURNS3 | ||||||||||||||||||||
| For the period ended 6/30/16 | One Year | Five Years | Ten Years | Since Inception | Inception Date | |||||||||||||||
| Class A | -10.53 | % | 7.86 | % | 8.05 | % | 10.01 | % | 5/24/99 | |||||||||||
| Class C | -7.01 | 8.26 | 7.85 | 9.55 | 5/24/99 | |||||||||||||||
| Institutional | -4.99 | 9.51 | 9.10 | 10.81 | 5/24/99 | |||||||||||||||
| Service | -5.47 | 8.97 | 8.56 | 10.25 | 5/24/99 | |||||||||||||||
| Class IR | -5.10 | 9.36 | N/A | 7.57 | 11/30/07 | |||||||||||||||
| Class R | -5.62 | 8.80 | N/A | 7.04 | 11/30/07 | |||||||||||||||
| Class R6 | N/A | N/A | N/A | -5.77 | 7/31/15 | |||||||||||||||
| 3 | The Standardized Total Returns are average annual total returns or cumulative total returns (only if the performance period is one year or less) as of the most recent calendar quarter-end. They assume reinvestment of all distributions at NAV. These returns reflect a maximum initial sales charge of 5.5% for Class A Shares and the assumed contingent deferred sales charge for Class C Shares (1% if redeemed within 12 months of purchase). Because Institutional, Service, Class IR, Class R and Class R6 Shares do not involve a sales charge, such a charge is not applied to their Standardized Total Returns. |
The returns set forth in the tables above represent past performance. Past performance does not guarantee future results. The Fund’s investment return and principal value will fluctuate so that an investor’s shares, when redeemed, may be worth more or less than their original cost. Current performance may be lower or higher than the performance quoted above. Please visit our web site at www.GSAMFUNDS.com to obtain the most recent month-end returns. Performance reflects applicable fee waivers and/or expense limitations in effect during the periods shown. In their absence, performance would be reduced. Returns do not reflect the deduction of taxes that a shareholder would pay on Fund distributions or the redemption of Fund shares.
44
FUND BASICS
| EXPENSE RATIOS4 | ||||||||||
| Net Expense Ratio (Current) | Gross Expense Ratio (Before Waivers) | |||||||||
| Class A | 1.30 | % | 1.40 | % | ||||||
| Class C | 2.05 | 2.15 | ||||||||
| Institutional | 0.95 | 1.00 | ||||||||
| Service | 1.45 | 1.50 | ||||||||
| Class IR | 1.05 | 1.15 | ||||||||
| Class R | 1.55 | 1.65 | ||||||||
| Class R6 | 0.93 | 0.98 | ||||||||
| 4 | The expense ratios of the Fund, both current (net of applicable fee waivers and/or expense limitations) and before waivers (gross of applicable fee waivers and/or expense limitations) are as set forth above according to the most recent publicly available Prospectus for the Fund and may differ from the expense ratios disclosed in the Financial Highlights in this report. Pursuant to a contractual arrangement, the Fund’s waivers and/or expense limitations will remain in place through at least December 29, 2016, and prior to such date the Investment Adviser may not terminate the arrangements without the approval of the Fund’s Board of Trustees. If these arrangements are discontinued in the future, the expense ratios may change without shareholder approval. |
| TOP TEN HOLDINGS AS OF 8/31/165 | ||||||||
| Holding | % of Net Assets | Line of Business | ||||||
| Amphenol Corp. Class A | 2.8 | % | Electronic Equipment, Instruments & Components | |||||
| Ross Stores, Inc. | 2.6 | Specialty Retail | ||||||
| Fidelity National Information Services, Inc. | 2.6 | IT Services | ||||||
| SBA Communications Corp. Class A | 2.6 | Diversified Telecommunication Services | ||||||
| Panera Bread Co. Class A | 2.4 | Hotels, Restaurants & Leisure | ||||||
| The Middleby Corp. | 2.4 | Machinery | ||||||
| Equinix, Inc. | 2.3 | Equity Real Estate Investment Trusts (REITs) | ||||||
| Ulta Salon, Cosmetics & Fragrance, Inc. | 2.3 | Specialty Retail | ||||||
| Intuit, Inc. | 2.2 | Software | ||||||
| Xylem, Inc. | 2.2 | Machinery | ||||||
| 5 | The top 10 holdings may not be representative of the Fund’s future investments. |
45
FUND BASICS
| FUND VS. BENCHMARK SECTOR ALLOCATION6 |
| As of August 31, 2016 |
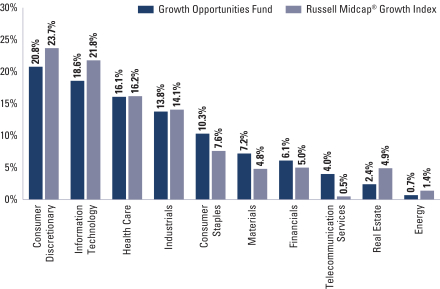
| 6 | The Fund is actively managed and, as such, its composition may differ over time. Consequently, the Fund’s overall sector allocations may differ from the percentages contained in the graph above. The graph categorizes investments using the Global Industry Classification Standard (“GICS”), however, the sector classifications used by the portfolio management team may differ from GICS. The percentage shown for each investment category reflects the value of investments in that category as a percentage of market value. The graph depicts the Fund’s investments but may not represent the Fund’s market exposure due to the exclusion of certain derivatives, if any, as listed in the Additional Investment Information section of the Schedule of Investments. |
46
GOLDMAN SACHS GROWTH OPPORTUNITIES FUND
Performance Summary
August 31, 2016
The following graph shows the value, as of August 31, 2016, of a $1,000,000 investment made on September 1, 2006 in Institutional Shares at NAV. For comparative purposes, the performance of the Fund’s benchmark the Russell Midcap Growth Index (with dividends reinvested), is shown. This performance data represents past performance and should not be considered indicative of future performance, which will fluctuate with changes in market conditions. These performance fluctuations may cause an investor’s shares, when redeemed, to be worth more or less than their original cost. Performance reflects applicable fee waivers and/or expense limitations in effect during the periods shown and in their absence, performance would be reduced. Returns do not reflect the deduction of taxes that a shareholder would pay on Fund distributions or the redemption of Fund shares. Performance of Class A, Class C, Service, Class IR, Class R and Class R6 Shares will vary from Institutional Shares due to differences in class specific fees and any applicable sales charges. In addition to the Investment Adviser’s decisions regarding issuer/industry investment selection and allocation, other factors may affect Fund performance. These factors include, but are not limited to, Fund operating fees and expenses, portfolio turnover and subscription and redemption cash flows affecting the Fund.
| Growth Opportunities Fund’s 10 Year Performance |
Performance of a $1,000,000 Investment, including any applicable sales charges, with distributions reinvested, from September 1, 2006 through August 31, 2016.
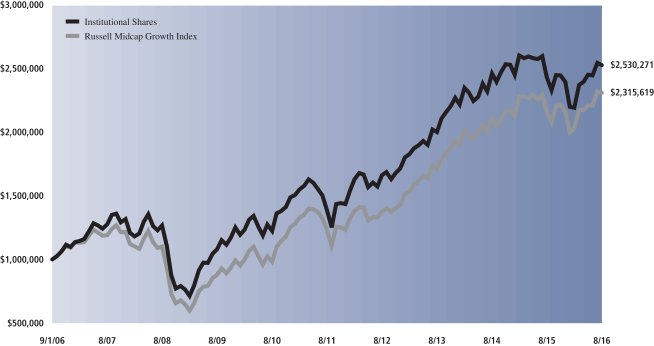
| Average Annual Total Return through August 31, 2016 | One Year | Five Years | Ten Years | Since Inception | ||||||||||
Class A (Commenced May 24, 1999) | ||||||||||||||
Excluding sales charges | 3.39% | 12.26% | 9.29% | 10.46% | ||||||||||
Including sales charges | -2.29% | 11.00% | 8.68% | 10.10% | ||||||||||
| ||||||||||||||
Class C (Commenced May 24, 1999) | ||||||||||||||
Excluding contingent deferred sales charges | 2.66% | 11.42% | 8.48% | 9.65% | ||||||||||
Including contingent deferred sales charges | 1.64% | 11.42% | 8.48% | 9.65% | ||||||||||
| ||||||||||||||
Institutional Class (Commenced May 24, 1999) | 3.76% | 12.70% | 9.72% | 10.90% | ||||||||||
| ||||||||||||||
Service Class (Commenced May 24, 1999) | 3.27% | 12.14% | 9.18% | 10.35% | ||||||||||
| ||||||||||||||
Class IR (Commenced November 30, 2007) | 3.64% | 12.54% | N/A | 7.81% | ||||||||||
| ||||||||||||||
Class R (Commenced November 30, 2007) | 3.12% | 11.98% | N/A | 7.28% | ||||||||||
| ||||||||||||||
Class R6 (Commenced July 31, 2015) | 3.81% | N/A | N/A | -2.45% | ||||||||||
| ||||||||||||||
47
PORTFOLIO RESULTS
Goldman Sachs Small/Mid Cap Growth Fund
Portfolio Composition
The Fund invests primarily in small and medium-sized growth companies with a market capitalization between $38 million and $32.6 billion. Since the Fund’s inception, the Goldman Sachs Growth Equity Investment Team has focused on several key investment criteria that it believes can drive a company’s growth over the long term. These characteristics are: dominant market share, established brand name, pricing power, recurring revenue stream, free cash flow, high returns on invested capital, predictable growth, sustainable growth, long product life cycle, enduring competitive advantage, favorable demographic trends and excellent management. The Team strives to purchase these companies at reasonable valuations in order to capture the full benefits of their growth.
Portfolio Management Discussion and Analysis
Below, the Goldman Sachs Growth Equity Investment Team discusses the Goldman Sachs Small/Mid Cap Growth Fund’s (the “Fund”) performance and positioning for the 12-month period ended August 31, 2016 (the “Reporting Period”).
| Q | How did the Fund perform during the Reporting Period? |
| A | During the Reporting Period, the Fund’s Class A, C, Institutional, Service, IR, R and R6 Shares generated average annual total returns, without sales charges, of -0.56%, -1.34%, -0.21%, -0.67%, -0.31%, -0.83% and -0.21%, respectively. These returns compare to the 4.64% average annual total return of the Fund’s benchmark, the Russell 2500® Growth Index (with dividends reinvested) (the “Russell Index”), during the same period. |
| Q | What key factors were responsible for the Fund’s performance during the Reporting Period? |
| A | Stock selection overall detracted from the Fund’s performance relative to the Russell Index during the Reporting Period. Sector allocation as a whole also detracted, albeit much more modestly, during the Reporting Period. |
| Q | Which equity market sectors most significantly affected Fund performance? |
| A | Detracting from relative results most during the Reporting Period were information technology, health care and industrials, wherein stock selection was challenging. Effective stock selection in the consumer discretionary, financials and energy sectors helped the Fund’s performance most relative to the Russell Index. |
| Q | Which stocks detracted significantly from the Fund’s performance during the Reporting Period? |
| A | Among those stocks detracting most from the Fund’s results relative to its benchmark index were positions in luxury household furnishing company Restoration Hardware Holdings, hospital and medical services provider holding company Adeptus Health and molecular diagnostics company Cepheid. |
| During the Reporting Period, Restoration Hardware Holdings experienced headwinds of an increasingly challenging retail industry, especially around the high-end consumer. Given the lower and volatile demand, we exited the Fund’s position to invest in what we considered to be more compelling ideas. |
| Toward the beginning of the Reporting Period, despite strong third quarter 2015 results, Adeptus Health’s shares traded lower, partly due to sympathies toward other health services companies that performed below market expectations. Additionally, the company’s results reflected some seasonal slowdown from the prior quarter, which may have impacted investor sentiment. At the end of the Reporting Period, we believed Adeptus Health remained one of the fastest growing players in the health care services industry with good visibility on new facility openings during the next few years. In our view, the company’s growth story has also been driven by its joint venture strategy that focuses on partnering with not-for-profit health care systems. Adeptus Health maintains a dominant position in a rapidly expanding industry, and we believe it presents significant upside potential should it continue to expand both organically and through its joint venture strategy. |
48
PORTFOLIO RESULTS
| Much of Cepheid’s share price decline came following its fiscal third quarter 2015 earnings report. While the company was in line with the market’s revenue expectations, it reduced its revenue outlook in the fourth quarter of 2015. Despite the weakness, at the end of the Reporting Period, we maintained confidence in the actions its management is taking to accelerate the company’s growth profile. In our view, Cepheid remains the dominant molecular diagnostics platform. |
| Q | What were some of the Fund’s best-performing individual stocks? |
| A | Among those stocks the Fund benefited most from relative to the Russell Index were positions in specialty retailers Ulta Salon, Cosmetics & Fragrance, data center real estate investment trust (“REIT”) Equinix and water technology company Xylem. |
| After a challenging start to 2016 for Ulta Salon, Cosmetics & Fragrance, momentum started picking up for the company in the beginning of April 2016 after strong first quarter 2016 earnings and the company being added to the S&P 500 Index. Its strong results were driven by margins, revenues and e-commerce growth that were ahead of market expectations. In our view, the company is a strong brand that continues to gain recognition. We believe Ulta Salon, Cosmetics & Fragrance has an opportunity to grow market share through higher brand awareness, increasing loyalty to existing stores, expansion of new stores and e-commerce. |
| Equinix was a strong contributor to the Fund’s performance during the Reporting Period. The company reported solid quarterly results, positively beating market expectations for its organic revenue growth and earnings growth. The company also benefited from a move down in U.S. Treasury yields, which generally favors REITs given their attractive yield and growth potential relative to bonds. At the end of the Reporting Period, we thought that Equinix continued to have substantial pipeline opportunities, particularly with enterprise customers willing to pay a higher price. Continued integration with the company’s Telecity acquisition and a strategic partnership with Datang Telecom could further increase Equinix’s global presence and strengthen its competitive advantage, in our view. Further, we believe Equinix remains an asset with robust upside to its revenues and free cash flows, as it balances organic growth, low leverage and a sound capital structure. That said, as Equinix increased in size, we decided to sell the position, taking profits, and invest in what we considered to be relatively higher growth and more appropriately-sized companies for the Fund’s portfolio. |
| During the Reporting Period, Xylem reported strong quarterly results, and toward the end of the Reporting Period, announced the purchase of Sensus, a smart water meter company, for approximately $1.7 billion in cash. The acquisition was viewed positively by investors, as it further bolsters Xylem’s product offering and technological advantage. Xylem was a new purchase for the Fund during the Reporting Period. In our view, Xylem is poised to benefit from secular growth and the cyclical recovery of water utility spending. The company’s exposure to oil is minimal, and we believe there are merger and acquisition opportunities to move up the water technology curve if needed. At the end of the Reporting Period, we remained optimistic on Xylem’s margin expansion prospects and believed its management team has done well to position the company for sustainable long-term growth. |
| Q | How did the Fund use derivatives and similar instruments during the Reporting Period? |
| A | During the Reporting Period, we did not use derivatives as part of an active management strategy. |
| Q | Did the Fund make any significant purchases or sales during the Reporting Period? |
| A | In addition to those purchases already mentioned, we initiated a Fund position in VCA, an animal health care company that operates in the U.S. and Canada. We believe there is positive momentum in the U.S. veterinary market, as VCA’s numbers have strengthened since last year and its same-store revenue growth has continued. Overall, we believe VCA is a company that makes strategic, high value acquisitions in an accelerating market. We also believe VCA was at an attractive valuation at the time of purchase, and we are optimistic on its long-term growth potential. |
| Conversely, in addition to those sales already mentioned, we exited the Fund’s position in automotive wholesaler LKQ. The stock had performed well since its lows in early 2016, and we decided to allocate the capital to other ideas where we saw a more compelling risk/reward profile. |
| Q | Were there any notable changes in the Fund’s weightings during the Reporting Period? |
| A | In constructing the Fund’s portfolio, we focus on picking stocks rather than on making industry or sector bets. We seek to outpace the benchmark index by overweighting stocks that we expect to outperform and underweighting those that we think may lag. Consequently, changes in its sector weights are generally the direct result of individual stock selection or of stock appreciation or depreciation. That said, during the |
49
PORTFOLIO RESULTS
Reporting Period, the Fund’s exposure to consumer staples, health care, materials and telecommunication services increased and its allocations to financials, industrials and information technology decreased relative to the Russell Index. The Fund’s position in cash also decreased during the Reporting Period. |
| Q | How was the Fund positioned relative to its benchmark index at the end of August 2016? |
| A | At the end of August 2016, the Fund had overweighted positions relative to the Russell Index in the consumer staples, telecommunication services, health care and materials sectors. On the same date, the Fund had underweighted positions compared to the Russell Index in industrials, information technology and real estate. The Fund was rather neutrally weighted to the Index in consumer discretionary, financials and energy and had no position at all in utilities at the end of the Reporting Period. |
50
FUND BASICS
Small/Mid Cap Growth Fund
as of August 31, 2016
| PERFORMANCE REVIEW | ||||||||||
| September 1, 2015–August 31, 2016 | Fund Total Return (based on NAV)1 | Russell 2500® Growth Index2 | ||||||||
| Class A | -0.56 | % | 4.64 | % | ||||||
| Class C | -1.34 | 4.64 | ||||||||
| Institutional | -0.21 | 4.64 | ||||||||
| Service | -0.67 | 4.64 | ||||||||
| Class IR | -0.31 | 4.64 | ||||||||
| Class R | -0.83 | 4.64 | ||||||||
| Class R6 | -0.21 | 4.64 | ||||||||
| 1 | The net asset value (“NAV”) represents the net assets of the class of the Fund (ex-dividend) divided by the total number of shares of the class outstanding. The Fund’s performance reflects the reinvestment of dividends and other distributions. The Fund’s performance does not reflect the deduction of any applicable sales charges. |
| 2 | The Russell 2500® Growth Index is an unmanaged index that measures the performance of the small- to mid-cap growth segment of the US equity universe. The Russell 2500® Growth Index is constructed to provide a comprehensive and unbiased barometer of the small- to mid-cap growth market. Based on ongoing empirical research of investment manager behavior, the methodology used to determine growth probability approximates the aggregate small- to mid-cap growth manager’s opportunity set. The Index figures do not reflect any deduction for fees, expenses or taxes. It is not possible to invest directly in an index. |
| STANDARDIZED TOTAL RETURNS3 | ||||||||||||||||||||
| For the period ended 6/30/16 | One Year | Five Years | Ten Years | Since Inception | Inception Date | |||||||||||||||
| Class A | -15.13 | % | 8.97 | % | 9.14 | % | 9.07 | % | 6/30/05 | |||||||||||
| Class C | -11.75 | 9.38 | 8.93 | 8.77 | 6/30/05 | |||||||||||||||
| Institutional | -9.82 | 10.65 | 10.18 | 10.03 | 6/30/05 | |||||||||||||||
| Service | -10.28 | 10.09 | 9.63 | 9.48 | 6/30/05 | |||||||||||||||
| Class IR | -9.96 | 10.48 | N/A | 8.51 | 11/30/07 | |||||||||||||||
| Class R | -10.38 | 9.93 | N/A | 7.98 | 11/30/07 | |||||||||||||||
| Class R6 | N/A | N/A | N/A | -11.26 | 7/31/15 | |||||||||||||||
| 3 | The Standardized Total Returns are average annual total returns or cumulative total returns (only if the performance period is one year or less) as of the most recent calendar quarter-end. They assume reinvestment of all distributions at NAV. These returns reflect a maximum initial sales charge of 5.5% for Class A Shares and the assumed contingent deferred sales charge for Class C Shares (1% if redeemed within 12 months of purchase). Because Institutional, Service, Class IR, Class R, and Class R6 Shares do not involve a sales charge, such a charge is not applied to their Standardized Total Returns. |
The returns set forth in the tables above represent past performance. Past performance does not guarantee future results. The Fund’s investment return and principal value will fluctuate so that an investor’s shares, when redeemed, may be worth more or less than their original cost. Current performance may be lower or higher than the performance quoted above. Please visit our web site at www.GSAMFUNDS.com to obtain the most recent month-end returns. Performance reflects applicable fee waivers and/or expense limitations in effect during the periods shown. In their absence, performance would be reduced. Returns do not reflect the deduction of taxes that a shareholder would pay on Fund distributions or the redemption of Fund shares.
51
FUND BASICS
| EXPENSE RATIOS4 | ||||||||||
| Net Expense Ratio (Current) | Gross Expense Ratio (Before Waivers) | |||||||||
| Class A | 1.30 | % | 1.45 | % | ||||||
| Class C | 2.05 | 2.20 | ||||||||
| Institutional | 0.93 | 1.05 | ||||||||
| Service | 1.42 | 1.55 | ||||||||
| Class IR | 1.05 | 1.20 | ||||||||
| Class R | 1.55 | 1.70 | ||||||||
| Class R6 | 0.91 | 1.03 | ||||||||
| 4 | The expense ratios of the Fund, both current (net of applicable fee waivers and/or expense limitations) and before waivers (gross of applicable fee waivers and/or expense limitations) are as set forth above according to the most recent publicly available Prospectus for the Fund and may differ from the expense ratios disclosed in the Financial Highlights in this report. Pursuant to a contractual arrangement, the Fund’s waivers and/or expense limitations will remain in place through at least December 29, 2016, and prior to such date the Investment Adviser may not terminate the arrangements without the approval of the Fund’s Board of Trustees. If these arrangements are discontinued in the future, the expense ratios may change without shareholder approval. |
| TOP TEN HOLDINGS AS OF 8/31/165 | ||||||||
| Holding | % of Net Assets | Line of Business | ||||||
| The Middleby Corp. | 2.8 | % | Machinery | |||||
| Eagle Bancorp, Inc. | 2.5 | Banks | ||||||
| Xylem, Inc. | 2.5 | Machinery | ||||||
| Avery Dennison Corp. | 2.4 | Containers & Packaging | ||||||
| Panera Bread Co. Class A | 2.3 | Hotels, Restaurants & Leisure | ||||||
| RPM International, Inc. | 2.3 | Chemicals | ||||||
| VCA, Inc. | 2.3 | Health Care Providers & Services | ||||||
| Electronics for Imaging, Inc. | 2.3 | Technology Hardware, Storage & Peripherals | ||||||
| TreeHouse Foods, Inc. | 2.1 | Food Products | ||||||
| SBA Communications Corp. Class A | 2.0 | Diversified Telecommunication Services | ||||||
| 5 | The top 10 holdings may not be representative of the Fund’s future investments. |
52
FUND BASICS
| FUND VS. BENCHMARK SECTOR ALLOCATION6 |
| As of August 31, 2016 |
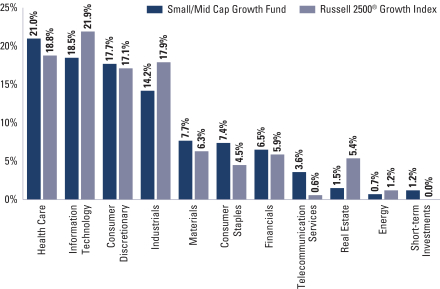
| 6 | The Fund is actively managed and, as such, its composition may differ over time. Consequently, the Fund’s overall sector allocations may differ from the percentages contained in the graph above. The graph categorizes investments using the Global Industry Classification Standard (“GICS”), however, the sector classifications used by the portfolio management team may differ from GICS. The percentage shown for each investment category reflects the value of investments in that category as a percentage of market value. Short-term investments represent repurchase agreements. The graph depicts the Fund’s investments but may not represent the Fund’s market exposure due to the exclusion of certain derivatives, if any, as listed in the Additional Investment Information section of the Schedule of Investments. |
53
GOLDMAN SACHS SMALL/MID CAP GROWTH FUND
Performance Summary
August 31, 2016
The following graph shows the value, as of August 31, 2016, of a $1,000,000 investment made on September 1, 2006 in Institutional Shares at NAV. For comparative purposes, the performance of the Fund’s benchmark, the Russell 2500 Growth Index (with dividends reinvested), is shown. This performance data represents past performance and should not be considered indicative of future performance, which will fluctuate with changes in market conditions. These performance fluctuations may cause an investor’s shares, when redeemed, to be worth more or less than their original cost. Performance reflects applicable fee waivers and/or expense limitations in effect during the periods shown and in their absence, performance would be reduced. Returns do not reflect the deduction of taxes that a shareholder would pay on Fund distributions or the redemption of Fund shares. Performance of Class A, Class C, Service, Class IR, Class R and Class R6 Shares will vary from Institutional Shares due to differences in class specific fees and any applicable sales charges. In addition to the Investment Adviser’s decisions regarding issuer/industry investment selection and allocation, other factors may affect Fund performance. These factors include, but are not limited to, Fund operating fees and expenses, portfolio turnover and subscription and redemption cash flows affecting the Fund.
| Small/Mid Cap Growth Fund’s 10 Year Performance |
Performance of a $1,000,000 Investment, including any applicable sales charges, with distributions reinvested, from September 1, 2006 through August 31, 2016.
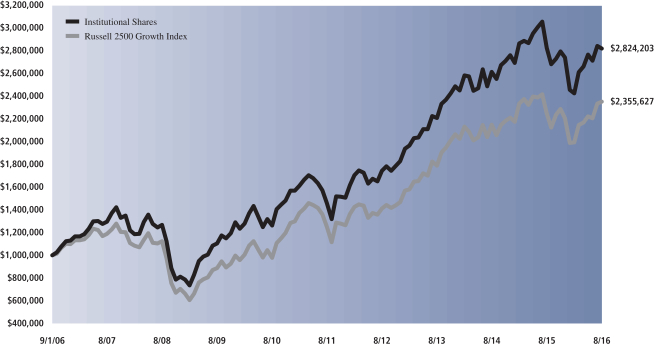
| Average Annual Total Return through August 31, 2016 | One Year | Five Years | Ten Years | Since Inception | ||||||||||
Class A (Commenced June 30, 2005) | ||||||||||||||
Excluding sales charges | -0.56% | 13.64% | 10.50% | 9.85% | ||||||||||
Including sales charges | -6.04% | 12.36% | 9.87% | 9.30% | ||||||||||
| ||||||||||||||
Class C (Commenced June 30, 2005) | ||||||||||||||
Excluding contingent deferred sales charges | -1.34% | 12.77% | 9.66% | 8.99% | ||||||||||
Including contingent deferred sales charges | -2.32% | 12.77% | 9.66% | 8.99% | ||||||||||
| ||||||||||||||
Institutional Class (Commenced June 30, 2005) | -0.21% | 14.09% | 10.93% | 10.26% | ||||||||||
| ||||||||||||||
Service Class (Commenced June 30, 2005) | -0.67% | 13.52% | 10.38% | 9.70% | ||||||||||
| ||||||||||||||
Class IR (Commenced November 30, 2007) | -0.31% | 13.92% | N/A | 8.83% | ||||||||||
| ||||||||||||||
Class R (Commenced November 30, 2007) | -0.83% | 13.36% | N/A | 8.29% | ||||||||||
| ||||||||||||||
Class R6 (Commenced July 31, 2015) | -0.21% | N/A | N/A | -7.16% | ||||||||||
| ||||||||||||||
54
PORTFOLIO RESULTS
Goldman Sachs Strategic Growth Fund
Portfolio Composition
The Fund invests primarily in U.S. equity investments. The Fund is more selective and focused than many mutual funds and there are typically 50 to 70 holdings in the portfolio. Since the Fund’s inception, the Goldman Sachs Growth Equity Investment Team has focused on several key investment criteria that it believes can drive a company’s growth over the long term. These characteristics are: dominant market share, established brand name, pricing power, recurring revenue stream, free cash flow, high returns on invested capital, predictable growth, sustainable growth, long product life cycle, enduring competitive advantage, favorable demographic trends and excellent management. The Team strives to purchase these companies at reasonable valuations in order to capture the full benefits of their growth.
Portfolio Management Discussion and Analysis
Below, the Goldman Sachs Growth Equity Investment Team discusses the Goldman Sachs Strategic Growth Fund’s (the “Fund”) performance and positioning for the 12-month period ended August 31, 2016 (the “Reporting Period”).
| Q | How did the Fund perform during the Reporting Period? |
| A | During the Reporting Period, the Fund’s Class A, C, Institutional, Service, IR, R and R6 Shares generated average annual total returns, without sales charges, of 6.48%, 5.70%, 6.89%, 6.40%, 6.69%, 6.18% and 6.83%, respectively. These returns compare to the 10.51% average annual total return of the Fund’s benchmark, the Russell 1000® Growth Index (with dividends reinvested) (the “Russell Index”), during the same period. |
| Q | What key factors were responsible for the Fund’s performance during the Reporting Period? |
| A | The Fund posted solid absolute gains, but stock selection overall detracted from the Fund’s performance relative to the Russell Index during the Reporting Period. Sector allocation as a whole also detracted, albeit more modestly. |
| Q | Which equity market sectors most significantly affected Fund performance? |
| A | Challenging stock selection in health care, consumer staples and information technology detracted from the Fund’s relative results most during the Reporting Period. The only two sectors to contribute positively to the Fund’s relative performance during the Reporting Period were financials and industrials, wherein effective stock selection drove results. |
| Q | Which stocks detracted significantly from the Fund’s performance during the Reporting Period? |
| A | Detracting most from the Fund’s results relative to the Russell Index were positions in online professional network provider LinkedIn, global pharmaceutical company Allergan and biotechnology firm Vertex Pharmaceuticals. |
| LinkedIn reported solid fourth quarter 2015 results, with revenues and earnings ahead of market estimates, and healthy user engagement. Of note, however, was top and bottom line guidance below market expectations, which led to a stock price decline. Specifically, its management attributed the slowdown to macroeconomic pressures in the Europe, Middle East and Africa (“EMEA”) and Asia-Pacific (“APAC”) regions, and it indicated its plans to shut down its acquired Bizo asset. We believe these factors have led investors to question the company’s growth outlook, which is additionally affected by foreign exchange headwinds. We were optimistic on the company’s competitive positioning and unique offering, but our concerns around its long-term business model — as well as its lower guidance — led us to exit the Fund’s position and invest in higher conviction ideas. |
Allergan was among the Fund’s biggest detractors during the Reporting Period. Volatility related to mergers and acquisitions the company has been involved in as well as market concerns around drug pricing pressures weighed on Allergan’s stock during the Reporting Period. Despite the near-term volatility and underperformance, we continued to believe at the end of the Reporting Period that Allergan was |
55
PORTFOLIO RESULTS
a high quality growth business, trading at an attractive valuation with meaningful financial flexibility going forward. |
| Vertex Pharmaceuticals was a top detractor from the Fund’s performance during the Reporting Period. Early in 2016, its shares came under pressure following a disappointing fiscal fourth quarter that fell short of consensus expectations. Additionally, lowered expectations surrounding the launch of Vertex Pharmaceuticals’ new cystic fibrosis treatment, orkambi, caused shares to decline. Despite this weakness, at the end of the Reporting Period, we believed Vertex Pharmaceuticals had strong underlying fundamentals, a promising product pipeline with significant short-term and long-term catalysts and an attractive valuation. We further believed the company, led by what we consider to be a capable management team, could continue to see growth given its dominant market share in its space and given geographic expansionary efforts that have contributed to meaningful profitability. |
| Q | What were some of the Fund’s best-performing individual stocks? |
| A | The Fund benefited most relative to the Russell Index from positions in data center real estate investment trust (“REIT”) Equinix, online social media platform Facebook and e-commerce retailer Amazon.com. |
| Equinix was the strongest contributor to the Fund’s performance during the Reporting Period. The company reported solid quarterly results, positively beating market expectations for its organic revenue growth and earnings growth. The company also benefited from a move down in U.S. Treasury yields, which generally favors REITs given their attractive yield and growth potential relative to bonds. At the end of the Reporting Period, we thought that Equinix continued to have substantial pipeline opportunities, particularly with enterprise customers willing to pay a higher price. Continued integration with the company’s Telecity acquisition and a strategic partnership with Datang Telecom could further increase Equinix’s global presence and strengthen its competitive advantage, in our view. Further, we believe Equinix remains an asset with robust upside to its revenues and free cash flows, as it balances organic growth, low leverage and a sound capital structure. |
| Facebook was a top positive contributor to the Fund’s relative results during the Reporting Period. The company reported strong quarterly results during the Reporting Period, underpinned by advertisement revenue growth well above market expectations. Demand from advertisers was robust across most segments and geographies, and the company benefited from its three key levers — user growth, time spent and ad load. At the end of the Reporting Period, we remained positive on Facebook’s high operating expenditures, at what we consider to be manageable levels, which should allow the company to invest aggressively in substantial growth opportunities and simultaneously increase earnings. We think additional tailwinds in the form of lower and decreasing tax rates — and video-driven growth — may further benefit the company in coming years. In our view, Facebook’s strong fundamentals, high barriers to entry and robust contribution from Instagram warrant a constructive outlook on its long- term growth prospects. |
| Amazon.com reported strong third quarter 2015 results and solid first quarter 2016 results, with revenues and earnings well ahead of market expectations. Fundamentals were robust, and its management’s guidance implied continued strength. At the end of the Reporting Period, we believed the business remained strong in retail and Amazon Web Services (“AWS”) and that Amazon Prime’s membership growth could potentially position Amazon.com as a long-term outperformer in the retail industry. We continued to view Amazon.com’s business favorably and believed the company could well be the beneficiary of its scale and competitive advantages over the long term. |
| Q | How did the Fund use derivatives and similar instruments during the Reporting Period? |
| A | During the Reporting Period, we did not use derivatives as part of an active management strategy. |
| Q | Did the Fund make any significant purchases or sales during the Reporting Period? |
| A | We initiated a Fund position in fast-food retail giant McDonald’s. We believe improving sales and reductions in costs should lead to earnings upside and margin expansion. We further think that McDonald’s reduction in capital expenditures and further refranchising could lead to improving return on invested capital and free up additional capital to repurchase stock. In our view, McDonald’s is a high quality franchise with a proficient management team and what we consider to be attractive opportunities to drive top-line growth and earnings. |
We established a Fund position in Eli Lilly, a leading pharmaceutical company with a history of innovation and a strong drug pipeline. The company appears to be aiming to |
56
PORTFOLIO RESULTS
improve its financial profile through a combination of cost savings and revenue growth by reducing its research and development and marketing costs over time. Shares of the company had been weak in early 2016, and we took the opportunity to initiate a position in what we believe to be a high quality company, with a leading franchise, strong growth prospects and a strong and improving financial profile. |
| Conversely, in addition to those sales already mentioned, we sold the Fund’s position in biotechnology company Biogen. Like most companies within the health care sector, Biogen faced headwinds from increased U.S. regulation and felt increasing pressure after announcing a divestiture of its hemophilia business. At the beginning of June 2016, Biogen saw a notable decline in its share price after opicinumab, a drug for multiple sclerosis, missed an essential endpoint of its Phase II clinical trial. We sold the Fund’s position in Biogen, as we believe the stock is in deceleration mode. |
| We eliminated the Fund’s position in information storage company EMC. We believed that any complications with respect to its acquisition by Dell could add negative pressure to its stock, thus making the risk/reward profile less compelling, in our view. The stock had performed relatively well in the recent downturn, and so we took the opportunity to exit the Fund’s position to allocate the proceeds to other ideas with what we considered to have more compelling upside. |
| Q | Were there any notable changes in the Fund’s weightings during the Reporting Period? |
| A | In constructing the Fund’s portfolio, we focus on picking stocks rather than on making industry or sector bets. We seek to outpace the benchmark index by overweighting stocks that we expect to outperform and underweighting those that we think may lag. Consequently, changes in its sector weights are generally the direct result of individual stock selection or of stock appreciation or depreciation. That said, during the Reporting Period, the Fund’s exposure to health care and industrials increased and its allocations to consumer discretionary, energy, financials and materials decreased relative to the Russell Index. |
| Q | How was the Fund positioned relative to its benchmark index at the end of August 2016? |
| A | At the end of August 2016, the Fund had an overweighted position relative to the Russell Index in the real estate sector. On the same date, the Fund had underweighted positions compared to the Russell Index in materials and consumer discretionary. The Fund was rather neutrally weighted to the Russell Index in financials, consumer staples, energy, health care, industrials and information technology and had no positions at all in utilities and telecommunication services at the end of the Reporting Period. |
57
FUND BASICS
Strategic Growth Fund
as of August 31, 2016
| PERFORMANCE REVIEW | ||||||||||
| September 1, 2015–August 31, 2016 | Fund Total Return (based on NAV)1 | Russell 1000® Growth Index2 | ||||||||
| Class A | 6.48 | % | 10.51 | % | ||||||
| Class C | 5.70 | 10.51 | ||||||||
| Institutional | 6.89 | 10.51 | ||||||||
| Service | 6.40 | 10.51 | ||||||||
| Class IR | 6.69 | 10.51 | ||||||||
| Class R | 6.18 | 10.51 | ||||||||
| Class R6 | 6.83 | 10.51 | ||||||||
| 1 | The net asset value (“NAV”) represents the net assets of the class of the Fund (ex-dividend) divided by the total number of shares of the class outstanding. The Fund’s performance reflects the reinvestment of dividends and other distributions. The Fund’s performance does not reflect the deduction of any applicable sales charges. |
| 2 | The Russell 1000® Growth Index is an unmanaged market capitalization weighted index that measures the performance of those Russell 1000® companies with higher price-to-book ratios and higher forecasted growth values. The Index figures do not reflect any deduction for fees, expenses or taxes. It is not possible to invest directly in an index. |
| STANDARDIZED TOTAL RETURNS3 | ||||||||||||||||||||||
| For the period ended 6/30/16 | One Year | Five Years | Ten Years | Since Inception | Inception Date | |||||||||||||||||
| Class A | -6.31 | % | 9.93 | % | 6.69 | % | 3.13 | % | 5/24/99 | |||||||||||||
| Class C | -2.59 | 10.37 | 6.49 | 2.71 | 5/24/99 | |||||||||||||||||
| Institutional | -0.50 | 11.62 | 7.72 | 3.89 | 5/24/99 | |||||||||||||||||
| Service | -1.00 | 11.09 | 7.23 | 3.46 | 5/24/99 | |||||||||||||||||
| Class IR | -0.61 | 11.44 | N/A | 14.02 | 1/06/09 | |||||||||||||||||
| Class R | -1.07 | 10.97 | N/A | 13.52 | 1/06/09 | |||||||||||||||||
| Class R6 | N/A | N/A | N/A | -3.83 | 7/31/15 | |||||||||||||||||
| 3 | The Standardized Total Returns are average annual total returns or cumulative total returns (only if the performance period is one year or less) as of the most recent calendar quarter-end. They assume reinvestment of all distributions at NAV. These returns reflect a maximum initial sales charge of 5.5% for Class A Shares and the assumed contingent deferred sales charge for Class C Shares (1% if redeemed within 12 months of purchase). Because Institutional, Service, Class IR, Class R and Class R6 Shares do not involve a sales charge, such a charge is not applied to their Standardized Total Returns. |
The returns set forth in the tables above represent past performance. Past performance does not guarantee future results. The Fund’s investment return and principal value will fluctuate so that an investor’s shares, when redeemed, may be worth more or less than their original cost. Current performance may be lower or higher than the performance quoted above. Please visit our web site at www.GSAMFUNDS.com to obtain the most recent month-end returns. Performance reflects applicable fee waivers and/or expense limitations in effect during the periods shown. In their absence, performance would be reduced. Returns do not reflect the deduction of taxes that a shareholder would pay on Fund distributions or the redemption of Fund shares.
58
FUND BASICS
| EXPENSE RATIOS4 | ||||||||||
| Net Expense Ratio (Current) | Gross Expense Ratio (Before Waivers) | |||||||||
| Class A | 1.15 | % | 1.52 | % | ||||||
| Class C | 1.90 | 2.27 | ||||||||
| Institutional | 0.75 | 1.12 | ||||||||
| Service | 1.25 | 1.62 | ||||||||
| Class IR | 0.90 | 1.27 | ||||||||
| Class R | 1.40 | 1.76 | ||||||||
| Class R6 | 0.73 | 1.10 | ||||||||
| 4 | The expense ratios of the Fund, both current (net of applicable fee waivers and/or expense limitations) and before waivers (gross of applicable fee waivers and/or expense limitations) are as set forth above according to the most recent publicly available Prospectus for the Fund and may differ from the expense ratios disclosed in the Financial Highlights in this report. Pursuant to a contractual arrangement, the Fund’s waivers and/or expense limitations will remain in place through at least December 29, 2016, and prior to such date the Investment Adviser may not terminate the arrangements without the approval of the Fund’s Board of Trustees. If these arrangements are discontinued in the future, the expense ratios may change without shareholder approval. |
| TOP TEN HOLDINGS AS OF 8/31/165 | ||||||||
| Holding | % of Net Assets | Line of Business | ||||||
| Apple, Inc. | 6.8 | % | Technology Hardware, Storage & Peripherals | |||||
| Facebook, Inc. Class A | 3.8 | Internet Software & Services | ||||||
| Amazon.com, Inc. | 3.7 | Internet & Direct Marketing Retail | ||||||
| Microsoft Corp. | 3.2 | Software | ||||||
| Alphabet, Inc. Class A | 3.1 | Internet Software & Services | ||||||
| Costco Wholesale Corp. | 2.6 | Food & Staples Retailing | ||||||
| American Tower Corp. | 2.6 | Equity Real Estate Investment Trusts (REITs) | ||||||
| Comcast Corp. Class A | 2.4 | Media | ||||||
| Alphabet, Inc. Class C | 2.3 | Internet Software & Services | ||||||
| 3M Co. | 2.3 | Industrial Conglomerates | ||||||
| 5 | The top 10 holdings may not be representative of the Fund’s future investments. |
59
FUND BASICS
| FUND VS. BENCHMARK SECTOR ALLOCATION6 |
| As of August 31, 2016 |
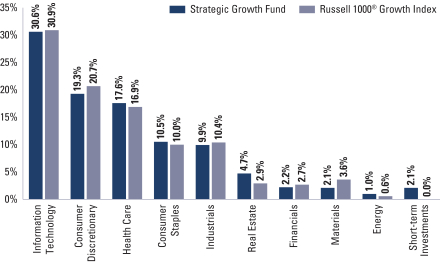
| 6 | The Fund is actively managed and, as such, its composition may differ over time. Consequently, the Fund’s overall sector allocations may differ from the percentages contained in the graph above. The graph categorizes investments using the Global Industry Classification Standard (“GICS”), however, the sector classifications used by the portfolio management team may differ from GICS. The percentage shown for each investment category reflects the value of investments in that category as a percentage of market value. Short-term investments represent repurchase agreements. The graph depicts the Fund’s investments but may not represent the Fund’s market exposure due to the exclusion of certain derivatives, if any, as listed in the Additional Investment Information section of the Schedule of Investments. |
60
GOLDMAN SACHS STRATEGIC GROWTH FUND
Performance Summary
August 31, 2016
The following graph shows the value, as of August 31, 2016, of a $1,000,000 investment made on September 1, 2006 in Institutional Shares at NAV. For comparative purposes, the performance of the Fund’s benchmark, the Russell 1000 Growth Index (with dividends reinvested), is shown. This performance data represents past performance and should not be considered indicative of future performance which will fluctuate with changes in market conditions. These performance fluctuations may cause an investor’s shares, when redeemed, to be worth more or less than their original cost. Performance reflects applicable fee waivers and/or expense limitations in effect during the periods shown and in their absence, performance would be reduced. Returns do not reflect the deduction of taxes that a shareholder would pay on Fund distributions or the redemption of Fund shares. Performance of Class A, Class C, Service, Class IR, Class R and Class R6 Shares will vary from Institutional Shares due to differences in class specific fees and any applicable sales charges. In addition to the Investment Adviser’s decisions regarding issuer/industry investment selection and allocation, other factors may affect Fund performance. These factors include, but are not limited to, Fund operating fees and expenses, portfolio turnover, and subscription and redemption cash flows affecting the Fund.
| Strategic Growth Fund’s 10 Year Performance |
Performance of a $1,000,000 Investment, including any applicable sales charges, with distributions reinvested, from September 1, 2006 through August 31, 2016.
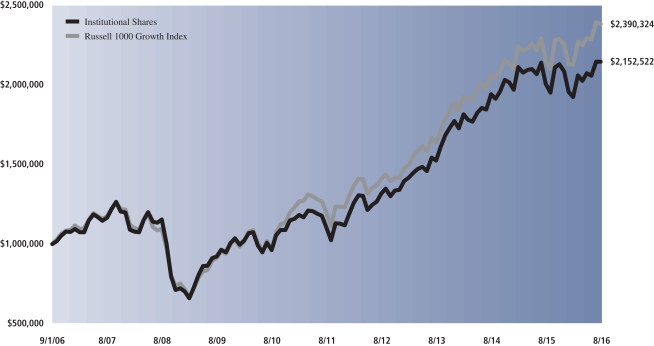
| Average Annual Total Return through August 31, 2016 | One Year | Five Years | Ten Years | Since Inception | ||||||||||||
Class A (Commenced May 24, 1999) | ||||||||||||||||
Excluding sales charges | 6.48% | 13.74% | 7.53% | 3.69% | ||||||||||||
Including sales charges | 0.64% | 12.46% | 6.92% | 3.35% | ||||||||||||
| ||||||||||||||||
Class C (Commenced May 24, 1999) | ||||||||||||||||
Excluding contingent deferred sales charges | 5.70% | 12.91% | 6.72% | 2.92% | ||||||||||||
Including contingent deferred sales charges | 4.65% | 12.91% | 6.72% | 2.92% | ||||||||||||
| ||||||||||||||||
Institutional Class (Commenced May 24, 1999) | 6.89% | 14.20% | 7.96% | 4.10% | ||||||||||||
| ||||||||||||||||
Service Class (Commenced May 24, 1999) | 6.40% | 13.65% | 7.47% | 3.67% | ||||||||||||
| ||||||||||||||||
Class IR (Commenced January 6, 2009) | 6.69% | 14.02% | N/A | 14.30% | ||||||||||||
| ||||||||||||||||
Class R (Commenced January 6, 2009) | 6.18% | 13.51% | N/A | 13.80% | ||||||||||||
| ||||||||||||||||
Class R6 (Commenced July 31, 2015) | 6.83% | N/A | N/A | 0.20% | ||||||||||||
| ||||||||||||||||
61
PORTFOLIO RESULTS
Goldman Sachs Technology Opportunities Fund
Portfolio Composition
The Fund invests, under normal circumstances, at least 80% of its net assets plus any borrowing for investment purposes (measured at time of purchase) in equity investments in technology companies. The Fund seeks to achieve its investment objective by investing, under normal circumstances, in approximately 30-40 companies that are considered by the Investment Adviser to benefit from the proliferation of technology. Although the Fund invests primarily in publicly traded U.S. securities, it may invest up to 25% of its total assets measured at the time of purchase in foreign securities, including securities of issuers in countries with emerging markets or economies and securities quoted in foreign currencies. The Fund may also invest in privately held companies and companies that only recently began to trade publicly.
Portfolio Management Discussion and Analysis
Below, the Goldman Sachs Growth Equity Investment Team discusses the Goldman Sachs Technology Opportunities Fund’s (the “Fund”) performance and positioning for the 12-month period ended August 31, 2016 (the “Reporting Period”).
| Q | How did the Fund perform during the Reporting Period? |
| A | During the Reporting Period, the Fund’s Class A, C, Institutional, Service and IR Shares generated average annual total returns, without sales charges, of 13.71%, 12.87%, 14.22%, 13.61% and 14.00%, respectively. These returns compare to the 20.11% average annual total return of the Fund’s benchmark, the S&P North American Technology Sector Index (the “S&P Technology Index”), during the same period. |
| Q | What key factors were responsible for the Fund’s performance during the Reporting Period? |
| A | While the Fund posted robust absolute gains, stock selection overall detracted from the Fund’s performance relative to the S&P Technology Index during the Reporting Period. Sector allocation as a whole did not have a material effect on Fund results during the Reporting Period. |
| Q | Which equity market sectors most significantly affected Fund performance? |
| A | As both the Fund and the S&P Technology Index have the majority of their respective assets allocated to the information technology sector, broad equity market sector performance generally does not have a meaningful impact on relative performance. That said, detracting most from the Fund’s relative results was weak stock selection in information technology and having exposure to the telecommunication services sector, which is not a component of the S&P Technology Index but which lagged the S&P Technology Index during the Reporting Period. Having exposure to the financials sector, which is not a component of the S&P Technology Index but which outperformed the S&P Technology Index during the Reporting Period, buoyed the Fund’s relative results most. Effective stock selection in the consumer discretionary sector also added value. |
| Q | Which stocks detracted significantly from the Fund’s performance during the Reporting Period? |
| A | Detracting most from the Fund’s results relative to its benchmark index were positions in software giant Microsoft, cloud-based digital commerce solutions provider Demandware and data software provider Splunk. |
| Microsoft was a new purchase for the Fund during the Reporting Period. Share price weakness on the back of challenging quarterly results had created an opportunity, in our view, to initiate a position, and we believe the company presents good risk/reward potential. During the Reporting Period, Microsoft’s stock performed strongly in absolute returns, but an underweight in the Fund compared to the Russell Index led to it being a detractor from relative returns. Microsoft reported fiscal fourth quarter results that meaningfully exceeded market expectations, with solid revenue trends. Its management also guided down for the following quarter, although the downward revision was more muted that what we have seen in some other quarters. At the end of the Reporting Period, we were optimistic on what we believe are some solid growth and improved profitability focus areas, including Azure, Office 365 and Xbox. We also believed Microsoft was attractively valued with a strong balance sheet, high free cash flow yield and a management that we believe is moving the company in the right direction. |
62
PORTFOLIO RESULTS
| Demandware reported earnings results with higher revenues, margins and free cash flow, than the company has expected, but guidance for bookings widened to account for large deal risk, macroeconomic concerns and exposure to consumers through its vertical. (The term “vertical” in business refers to a vertical market. Basically, a vertical market is one where businesses and marketers cater to the needs of a specific group of people within an industry. This concept is in contrast to a horizontal market, where the focus is diverted to a large amount of people regardless of industry.) Going into 2016, we were optimistic on the company given what we considered to be its attractive valuation and top-line growth. However, the broader technology sector pullback during the Reporting Period led us to reassess our position in Demandware, and we believed its continued pace of investment may weigh on its near-term visibility. As a result, we exited the Fund’s position to invest in what we viewed as better risk/reward ideas. |
| Splunk was a top detractor from the Fund’s relative returns during the Reporting Period. Broader market and secular volatility, alongside competition concerns, which we think are near term, led to a stock price decline despite the company’s accelerating growth during the Reporting Period. In August 2016, the company reported solid fiscal second quarter 2016 results with top- and bottom-line metrics ahead of market expectations. Splunk also offered conservative but slightly higher guidance for fiscal year 2017. Despite beating market expectations, market concerns about slower license revenue growth, relative to historic levels, impacted Splunk’s stock price. Looking at historical data, we believe price volatility is common with Splunk following earnings announcements. Ultimately, we think market concerns are short-term, and, at the end of the Reporting Period, we remained optimistic on Splunk as one of the best secular platforms in technology. Our view is driven by what we see as the strength of Splunk’s partnerships with Amazon Web Services (“AWS”) and a growing global presence with service integrators like Accenture. Further, at the end of the Reporting Period, we believed Splunk was well positioned to benefit from growing demand in web analytics and cybersecurity. |
| Q | What were some of the Fund’s best-performing individual stocks? |
| A | The Fund benefited most relative to the S&P Technology Index from positions in data center real estate investment trust (“REIT”) Equinix and semiconductor companies Applied Materials and Cavium. |
| Equinix was the strongest contributor to the Fund’s performance during the Reporting Period. The company reported solid quarterly results, positively beating market expectations for its organic revenue growth and earnings growth. The company also benefited from a move down in U.S. Treasury yields, which generally favors REITs given their attractive yield and growth potential relative to bonds. At the end of the Reporting Period, we thought that Equinix continued to have substantial pipeline opportunities, particularly with enterprise customers willing to pay a higher price. Continued integration with the company’s Telecity acquisition and a strategic partnership with Datang Telecom could further increase Equinix’s global presence and strengthen its competitive advantage, in our view. Further, we believe Equinix remains an asset with robust upside to its revenues and free cash flows, as it balances organic growth, low leverage and a sound capital structure. |
| Applied Materials reported strong fiscal third quarter 2015 results, with orders well above market estimates. The company continued to gain share in its respective markets, and its management issued a better than expected outlook, which was well received. In our view, Applied Materials is one of the largest and most dominant semiconductor companies in its space. At the end of the Reporting Period, we saw significant revenue opportunities in the form of its organic light-emitting diode (“OLED”) expansion, robust investments in NAND technology and demand from China. We were also positive on the company’s proficient management team, which has aggressively returned capital. We believed Applied Materials continued to trade at a reasonable valuation, and we remained optimistic on its longer-term growth potential. |
| Cavium is a designer, developer and marketer of semiconductor processors for secure networks in the U.S. and abroad. Cavium’s share price fell toward the end of the Reporting Period, as it announced acquisition plans for QLogic, a provider of computer data communication products. We took advantage of the price drop to initiate a position in what we believed was a high quality company. Cavium’s stock price subsequently recovered, as the market grew more comfortable with the deal. The company also reported solid second quarter 2016 results, with broad growth across new product categories. In our view, Cavium had an attractive valuation at the end of the Reporting Period and a solid core growth opportunity, benefitting from a product cycle ramp. |
63
PORTFOLIO RESULTS
| Q | How did the Fund use derivatives and similar instruments during the Reporting Period? |
| A | During the Reporting Period, we did not use derivatives as part of an active management strategy. |
| Q | Did the Fund make any significant purchases or sales during the Reporting Period? |
| A | In addition to those purchases already mentioned, we initiated a Fund position in MasterCard. We believe current macroeconomic trends are supportive of financial services and that MasterCard could be a key beneficiary. In particular, the company has deep exposure to emerging markets, where consumer card spending has seen recovery and is supported by promotional government efforts. Given what we consider to be a favorable industry backdrop, a high quality business franchise and an attractive valuation of MasterCard, we sought to take advantage of what we view as a favorable risk/ reward opportunity. |
| Conversely, in addition to those sales already mentioned, we exited the Fund’s position in information storage company EMC. We believed that any complications with respect to its acquisition by Dell could add negative pressure to its stock, thus making the risk/reward profile less compelling, in our view. The stock had performed relatively well in the recent downturn, and so we took the opportunity to exit the Fund’s position to allocate the proceeds to other ideas with what we considered to have more compelling upside. |
| We eliminated the Fund’s position in Sabre, a technology solutions provider to the travel and tourism industry. While we continue to like the company, we believed the fundamentals of Sabre were weakening and less strong macroeconomic conditions made it more difficult for the company to perform well. |
| Q | Were there any notable changes in the Fund’s weightings during the Reporting Period? |
| A | In constructing the Fund’s portfolio, we focus on picking stocks rather than on making industry or sector bets. We seek to outpace the benchmark index by overweighting stocks that we expect to outperform and underweighting those that we think may lag. Consequently, changes in its sector weights are generally the direct result of individual stock selection or of stock appreciation or depreciation. That said, during the Reporting Period, the Fund’s exposure to consumer discretionary increased and its exposure to information technology decreased relative to the S&P Technology Index. The Fund’s position in cash also increased during the Reporting Period, and its exposure to financials decreased. |
| Q | How was the Fund positioned relative to its benchmark index at the end of August 2016? |
| A | At the end of August 2016, the Fund’s was underweighted relative to the S&P Technology Index in the information technology sector and was rather neutrally weighted to the S&P Technology Index in the consumer discretionary sector, the only other component of the S&P Technology Index. On the same date, the Fund had exposure to the financials, real estate and telecommunication services sectors. |
64
FUND BASICS
Technology Opportunities Fund
as of August 31, 2016
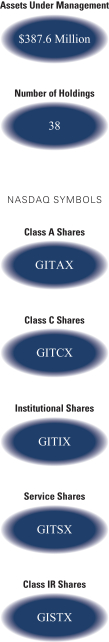
| PERFORMANCE REVIEW | ||||||||||
| September 1, 2015–August 31, 2016 | Fund Total Return (based on NAV)1 | S&P North American Technology Sector Index2 | ||||||||
| Class A | 13.71 | % | 20.11 | % | ||||||
| Class C | 12.87 | 20.11 | ||||||||
| Institutional | 14.22 | 20.11 | ||||||||
| Service | 13.61 | 20.11 | ||||||||
| Class IR | 14.00 | 20.11 | ||||||||
| 1 | The net asset value (“NAV”) represents the net assets of the class of the Fund (ex-dividend) divided by the total number of shares of the class outstanding. The Fund’s performance reflects the reinvestment of dividends and other distributions. The Fund’s performance does not reflect the deduction of any applicable sales charges. |
| 2 | The S&P North American Technology Sector Index provides investors with a benchmark that represents U.S. securities classified under the Global Industry Classification Standard (“GICS”)® technology sector and Internet retail sub-industry |
| STANDARDIZED TOTAL RETURNS3 | ||||||||||||||||||||||
| For the period ended 6/30/16 | One Year | Five Years | Ten Years | Since Inception | Inception Date | |||||||||||||||||
| Class A | -2.56 | % | 8.29 | % | 9.55 | % | 4.22 | % | 10/1/99 | |||||||||||||
| Class C | 1.29 | 8.71 | 9.35 | 3.78 | 10/1/99 | |||||||||||||||||
| Institutional | 3.51 | 9.96 | 10.62 | 4.99 | 10/1/99 | |||||||||||||||||
| Service | 2.96 | 9.42 | 10.08 | 4.49 | 10/1/99 | |||||||||||||||||
| Class IR | 3.32 | 9.79 | N/A | 10.71 | 9/30/10 | |||||||||||||||||
| 3 | The Standardized Total Returns are average annual total returns or cumulative total returns (only if the performance period is one year or less) as of the most recent calendar quarter-end. They assume reinvestment of all distributions at NAV. These returns reflect a maximum initial sales charge of 5.5% for Class A Shares and the assumed contingent deferred sales charge for Class C Shares (1% if redeemed within 12 months of purchase). Because Institutional, Service and Class IR do not involve a sales charge, such a charge is not applied to their Standardized Total Returns. |
The returns set forth in the tables above represent past performance. Past performance does not guarantee future results. The Fund’s investment return and principal value will fluctuate so that an investor’s shares, when redeemed, may be worth more or less than their original cost. Current performance may be lower or higher than the performance quoted above. Please visit our web site at www.GSAMFUNDS.com to obtain the most recent month-end returns. Performance reflects applicable fee waivers and/or expense limitations in effect during the periods shown. In their absence, performance would be reduced. Returns do not reflect the deduction of taxes that a shareholder would pay on Fund distributions or the redemption of Fund shares.
65
FUND BASICS
| EXPENSE RATIOS4 | ||||||||||
| Net Expense Ratio (Current) | Gross Expense Ratio (Before Waivers) | |||||||||
| Class A | 1.47 | % | 1.54 | % | ||||||
| Class C | 2.22 | 2.29 | ||||||||
| Institutional | 1.07 | 1.14 | ||||||||
| Service | 1.57 | 1.64 | ||||||||
| Class IR | 1.22 | 1.29 | ||||||||
| 4 | The expense ratios of the Fund, both current (net of applicable fee waivers and/or expense limitations) and before waivers (gross of applicable fee waivers and/or expense limitations) are as set forth above according to the most recent publicly available Prospectus for the Fund and may differ from the expense ratios disclosed in the Financial Highlights in this report. Pursuant to a contractual arrangement, the Fund’s waivers and/or expense limitations will remain in place through at least December 29, 2016, and prior to such date the Investment Adviser may not terminate the arrangements without the approval of the Fund’s Board of Trustees. If these arrangements are discontinued in the future, the expense ratios may change without shareholder approval. |
| TOP TEN HOLDINGS AS OF 8/31/165 | ||||||||
| Holding | % of Net Assets | Line of Business | ||||||
| Apple, Inc. | 7.4 | % | Technology Hardware, Storage & Peripherals | |||||
| Amazon.com, Inc. | 5.7 | Internet & Direct Marketing Retail | ||||||
| Facebook, Inc. Class A | 5.7 | Internet Software & Services | ||||||
| Alphabet, Inc. Class A | 4.4 | Internet Software & Services | ||||||
| NXP Semiconductors NV | 4.1 | Semiconductors & Semiconductor Equipment | ||||||
| Alphabet, Inc. Class C | 4.0 | Internet Software & Services | ||||||
| Oracle Corp. | 4.0 | Software | ||||||
| American Tower Corp. | 3.4 | Equity Real Estate Investment Trusts (REITs) | ||||||
| Amphenol Corp. Class A | 3.4 | Electronic Equipment, Instruments & Components | ||||||
| SBA Communications Corp. Class A | 3.1 | Diversified Telecommunication Services | ||||||
| 5 | The top 10 holdings may not be representative of the Fund’s future investments. |
66
FUND BASICS
| FUND VS. BENCHMARK SECTOR ALLOCATION6 |
| As of August 31, 2016 |
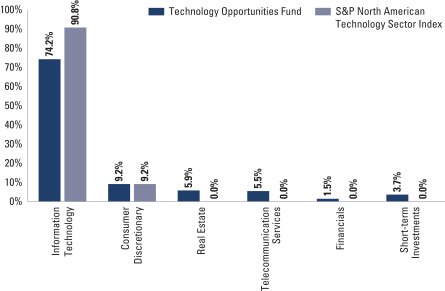
| 6 | The Fund is actively managed and, as such, its composition may differ over time. Consequently, the Fund’s overall sector allocations may differ from the percentages contained in the graph above. The graph categorizes investments using the Global Industry Classification Standard (“GICS”), however, the sector classifications used by the portfolio management team may differ from GICS. The percentage shown for each investment category reflects the value of investments in that category as a percentage of market value. Short-term investments represent repurchase agreements. The graph depicts the Fund’s investments but may not represent the Fund’s market exposure due to the exclusion of certain derivatives, if any, as listed in the Additional Investment Information section of the Schedule of Investments. |
67
GOLDMAN SACHS TECHNOLOGY OPPORTUNITIES FUND
Performance Summary
August 31, 2016
The following graph shows the value as of August 31, 2016, of a $10,000 investment made on September 1, 2006 in Class A Shares (with the maximum sales charge of 5.5%). For comparative purposes, the performance of the Fund’s benchmark, the S&P North American Technology Sector Index, is shown. This performance data represents past performance and should not be considered indicative of future performance, which will fluctuate with changes in market conditions. These performance fluctuations may cause an investor’s shares, when redeemed, to be worth more or less than their original cost. Performance reflects applicable fee waivers and/or expense limitations in effect during the periods shown and in their absence, performance would be reduced. Returns do not reflect the deduction of taxes that a shareholder would pay on Fund distributions or the redemption of Fund shares. Performance of Class C, Institutional, Service and IR Shares will vary from Class A Shares due to differences in class specific fees and any applicable sales charges. In addition to the Investment Adviser’s decisions regarding issuer/industry investment selection and allocation, other factors may affect Fund performance. These factors include, but are not limited to, Fund operating fees and expenses, portfolio turnover and subscription and redemption cash flows affecting the Fund.
| Technology Opportunities Fund’s 10 Year Performance |
Performance of a $10,000 Investment, including any applicable sales charges, with distributions reinvested, from September 1, 2006 through August 31, 2016.
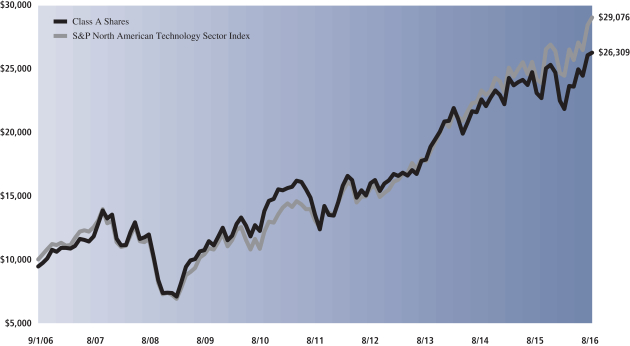
| Average Annual Total Return through August 31, 2016 | One Year | Five Years | Ten Years | Since Inception | ||||||||||||
Class A (Commenced October 1, 1999) | ||||||||||||||||
Excluding sales charges | 13.71% | 14.21% | 10.77% | 4.97% | ||||||||||||
Including sales charges | 7.49% | 12.93% | 10.15% | 4.62% | ||||||||||||
| ||||||||||||||||
Class C (Commenced October 1, 1999) | ||||||||||||||||
Excluding contingent deferred sales charges | 12.87% | 13.36% | 9.93% | 4.18% | ||||||||||||
Including contingent deferred sales charges | 11.77% | 13.36% | 9.93% | 4.18% | ||||||||||||
| ||||||||||||||||
Institutional Class (Commenced October 1, 1999) | 14.22% | 14.67% | 11.20% | 5.39% | ||||||||||||
| ||||||||||||||||
Service Class (Commenced October 1, 1999) | 13.61% | 14.11% | 10.67% | 4.89% | ||||||||||||
| ||||||||||||||||
Class IR (Commenced September 30, 2010) | 14.00% | 14.49% | N/A | 11.74% | ||||||||||||
| ||||||||||||||||
68
GOLDMAN SACHS CAPITAL GROWTH FUND
August 31, 2016
| Shares | Description | Value | ||||||
| Common Stocks – 98.8% | ||||||||
| Aerospace & Defense – 2.5% | ||||||||
| 24,327 | Lockheed Martin Corp. | $ | 5,910,731 | |||||
| 15,388 | Northrop Grumman Corp. | 3,263,333 | ||||||
| 92,627 | The Boeing Co. | 11,990,565 | ||||||
|
| |||||||
| 21,164,629 | ||||||||
|
| |||||||
| Air Freight & Logistics – 0.6% | ||||||||
| 29,252 | FedEx Corp. | 4,824,532 | ||||||
|
| |||||||
| Auto Components – 0.3% | ||||||||
| 87,768 | BorgWarner, Inc. | 3,018,341 | ||||||
|
| |||||||
| Banks – 0.3% | ||||||||
| 32,256 | First Republic Bank | 2,482,422 | ||||||
|
| |||||||
| Beverages – 3.8% | ||||||||
| 153,279 | Brown-Forman Corp. Class B | 7,441,695 | ||||||
| 56,806 | Molson Coors Brewing Co. Class B | 5,812,390 | ||||||
| 17,494 | Monster Beverage Corp.* | 2,692,152 | ||||||
| 371,455 | The Coca-Cola Co. | 16,132,291 | ||||||
|
| |||||||
| 32,078,528 | ||||||||
|
| |||||||
| Biotechnology – 3.6% | ||||||||
| 44,772 | Alexion Pharmaceuticals, Inc.* | 5,635,004 | ||||||
| 30,216 | Alkermes PLC* | 1,322,554 | ||||||
| 72,220 | Celgene Corp.* | 7,708,763 | ||||||
| 42,676 | Cepheid, Inc.* | 1,464,640 | ||||||
| 106,228 | Gilead Sciences, Inc. | 8,326,151 | ||||||
| 66,460 | Vertex Pharmaceuticals, Inc.* | 6,281,135 | ||||||
|
| |||||||
| 30,738,247 | ||||||||
|
| |||||||
| Building Products – 1.0% | ||||||||
| 128,593 | Fortune Brands Home & Security, Inc. | 8,173,371 | ||||||
|
| |||||||
| Capital Markets – 3.2% | ||||||||
| 54,952 | Affiliated Managers Group, Inc.* | 7,805,932 | ||||||
| 43,776 | Intercontinental Exchange, Inc. | 12,345,707 | ||||||
| 39,444 | Lazard Ltd. Class A | 1,460,611 | ||||||
| 48,661 | S&P Global, Inc. | 6,011,580 | ||||||
|
| |||||||
| 27,623,830 | ||||||||
|
| |||||||
| Chemicals – 3.3% | ||||||||
| 64,879 | Ashland, Inc. | 7,596,033 | ||||||
| 123,720 | Axalta Coating Systems Ltd.* | 3,540,866 | ||||||
| 93,109 | RPM International, Inc. | 5,077,234 | ||||||
| 41,352 | The Sherwin-Williams Co. | 11,731,976 | ||||||
|
| |||||||
| 27,946,109 | ||||||||
|
| |||||||
| Containers & Packaging – 0.5% | ||||||||
| 56,624 | Avery Dennison Corp. | 4,384,963 | ||||||
|
| |||||||
| Distributors* – 0.3% | ||||||||
| 71,232 | LKQ Corp. | 2,570,763 | ||||||
|
| |||||||
| Electrical Equipment* – 0.5% | ||||||||
| 113,264 | Sensata Technologies Holding NV | 4,313,093 | ||||||
|
| |||||||
| Electronic Equipment, Instruments & Components – 0.7% | ||||||||
| 91,235 | Amphenol Corp. Class A | 5,684,853 | ||||||
|
| |||||||
| Common Stocks – (continued) | ||||||||
| Energy Equipment & Services – 0.2% | ||||||||
| 24,872 | Schlumberger Ltd. | $ | 1,964,888 | |||||
|
| |||||||
| Equity Real Estate Investment Trusts (REITs) – 2.1% | ||||||||
| 89,581 | American Tower Corp. | 10,156,694 | ||||||
| 19,929 | Equinix, Inc. | 7,346,826 | ||||||
|
| |||||||
| 17,503,520 | ||||||||
|
| |||||||
| Food & Staples Retailing – 2.6% | ||||||||
| 81,771 | Costco Wholesale Corp. | 13,254,261 | ||||||
| 93,152 | Walgreens Boots Alliance, Inc. | 7,518,298 | ||||||
| 37,700 | Whole Foods Market, Inc. | 1,145,326 | ||||||
|
| |||||||
| 21,917,885 | ||||||||
|
| |||||||
| Food Products – 2.1% | ||||||||
| 59,556 | Blue Buffalo Pet Products, Inc.* | 1,535,354 | ||||||
| 79,004 | McCormick & Co., Inc. | 8,055,248 | ||||||
| 40,924 | Mead Johnson Nutrition Co. | 3,481,405 | ||||||
| 28,816 | The Hain Celestial Group, Inc.* | 1,058,988 | ||||||
| 40,932 | TreeHouse Foods, Inc.* | 3,877,488 | ||||||
|
| |||||||
| 18,008,483 | ||||||||
|
| |||||||
| Health Care Equipment & Supplies – 4.4% | ||||||||
| 149,632 | Abbott Laboratories | 6,287,537 | ||||||
| 384,108 | Boston Scientific Corp.* | 9,149,453 | ||||||
| 29,416 | C.R. Bard, Inc. | 6,496,229 | ||||||
| 50,250 | Danaher Corp. | 4,090,852 | ||||||
| 5,781 | Intuitive Surgical, Inc.* | 3,968,194 | ||||||
| 66,812 | Stryker Corp. | 7,727,476 | ||||||
|
| |||||||
| 37,719,741 | ||||||||
|
| |||||||
| Health Care Providers & Services – 2.2% | ||||||||
| 32,768 | Aetna, Inc. | 3,837,788 | ||||||
| 40,313 | Cardinal Health, Inc. | 3,211,737 | ||||||
| 18,249 | Henry Schein, Inc.* | 2,989,004 | ||||||
| 32,336 | McKesson Corp. | 5,969,872 | ||||||
| 21,340 | UnitedHealth Group, Inc. | 2,903,307 | ||||||
|
| |||||||
| 18,911,708 | ||||||||
|
| |||||||
| Health Care Technology* – 0.4% | ||||||||
| 52,228 | Cerner Corp. | 3,370,795 | ||||||
|
| |||||||
| Hotels, Restaurants & Leisure – 3.5% | ||||||||
| 10,824 | Chipotle Mexican Grill, Inc.* | 4,478,214 | ||||||
| 66,597 | Hilton Worldwide Holdings, Inc. | 1,589,670 | ||||||
| 140,481 | McDonald’s Corp. | 16,248,033 | ||||||
| 13,579 | Panera Bread Co. Class A* | 2,948,680 | ||||||
| 78,806 | Starbucks Corp. | 4,431,261 | ||||||
|
| |||||||
| 29,695,858 | ||||||||
|
| |||||||
| Household Durables – 0.7% | ||||||||
| 116,564 | Newell Brands, Inc. | 6,187,217 | ||||||
|
| |||||||
| Industrial Conglomerates – 2.8% | ||||||||
| 14,904 | 3M Co. | 2,671,393 | ||||||
| 154,419 | Honeywell International, Inc. | 18,022,242 | ||||||
| 15,428 | Roper Technologies, Inc. | 2,739,241 | ||||||
|
| |||||||
| 23,432,876 | ||||||||
|
| |||||||
| The accompanying notes are an integral part of these financial statements. | 69 |
GOLDMAN SACHS CAPITAL GROWTH FUND
Schedule of Investments (continued)
August 31, 2016
| Shares | Description | Value | ||||||
| Common Stocks – (continued) | ||||||||
| Internet & Direct Marketing Retail – 4.8% | ||||||||
| 31,433 | Amazon.com, Inc.* | $ | 24,177,006 | |||||
| 16,528 | Expedia, Inc. | 1,803,535 | ||||||
| 66,652 | Netflix, Inc.* | 6,495,237 | ||||||
| 5,865 | The Priceline Group, Inc.* | 8,309,122 | ||||||
|
| |||||||
| 40,784,900 | ||||||||
|
| |||||||
| Internet Software & Services* – 7.8% | ||||||||
| 23,521 | Alphabet, Inc. Class A | 18,578,062 | ||||||
| 24,062 | Alphabet, Inc. Class C | 18,456,757 | ||||||
| 85,244 | eBay, Inc. | 2,741,447 | ||||||
| 194,990 | Facebook, Inc. Class A | 24,592,139 | ||||||
| 10,676 | LinkedIn Corp. Class A | 2,057,799 | ||||||
|
| |||||||
| 66,426,204 | ||||||||
|
| |||||||
| IT Services – 7.3% | ||||||||
| 51,550 | Accenture PLC Class A | 5,928,250 | ||||||
| 8,220 | Alliance Data Systems Corp.* | 1,681,647 | ||||||
| 146,916 | Black Knight Financial Services, Inc. Class A* | 5,732,662 | ||||||
| 23,920 | Cognizant Technology Solutions Corp. Class A* | 1,373,965 | ||||||
| 39,028 | Fidelity National Information Services, Inc. | 3,096,091 | ||||||
| 30,790 | Fiserv, Inc.* | 3,172,909 | ||||||
| 19,644 | FleetCor Technologies, Inc.* | 3,225,545 | ||||||
| 23,985 | Global Payments, Inc. | 1,821,661 | ||||||
| 50,086 | International Business Machines Corp. | 7,957,664 | ||||||
| 245,803 | MasterCard, Inc. Class A | 23,751,944 | ||||||
| 98,705 | PayPal Holdings, Inc.* | 3,666,891 | ||||||
| 25,784 | Sabre Corp. | 725,820 | ||||||
|
| |||||||
| 62,135,049 | ||||||||
|
| |||||||
| Life Sciences Tools & Services – 0.9% | ||||||||
| 82,855 | Agilent Technologies, Inc. | 3,892,528 | ||||||
| 20,268 | Illumina, Inc.* | 3,411,915 | ||||||
|
| |||||||
| 7,304,443 | ||||||||
|
| |||||||
| Machinery – 1.6% | ||||||||
| 25,161 | Fortive Corp. | 1,325,230 | ||||||
| 43,218 | The Middleby Corp.* | 5,538,387 | ||||||
| 139,164 | Xylem, Inc. | 7,077,881 | ||||||
|
| |||||||
| 13,941,498 | ||||||||
|
| |||||||
| Media – 4.4% | ||||||||
| 304,946 | Comcast Corp. Class A | 19,900,776 | ||||||
| 184,524 | The Walt Disney Co. | 17,430,137 | ||||||
|
| |||||||
| 37,330,913 | ||||||||
|
| |||||||
| Oil, Gas & Consumable Fuels* – 0.2% | ||||||||
| 15,252 | Concho Resources, Inc. | 1,970,558 | ||||||
|
| |||||||
| Pharmaceuticals – 3.9% | ||||||||
| 33,960 | Allergan PLC* | 7,964,979 | ||||||
| 72,584 | Bristol-Myers Squibb Co. | 4,165,596 | ||||||
| 184,892 | Eli Lilly & Co. | 14,375,353 | ||||||
| 127,024 | Zoetis, Inc. | 6,490,926 | ||||||
|
| |||||||
| 32,996,854 | ||||||||
|
| |||||||
| Common Stocks – (continued) | ||||||||
| Real Estate Management & Development – 0.1% | ||||||||
| 26,876 | HFF, Inc. Class A | 720,546 | ||||||
|
| |||||||
| Road & Rail – 0.6% | ||||||||
| 50,748 | Kansas City Southern | 4,908,347 | ||||||
|
| |||||||
| Semiconductors & Semiconductor Equipment – 1.7% | ||||||||
| 99,762 | Applied Materials, Inc. | 2,976,898 | ||||||
| 81,874 | NXP Semiconductors NV* | 7,206,549 | ||||||
| 35,316 | Qorvo, Inc.* | 2,028,198 | ||||||
| 33,420 | Texas Instruments, Inc. | 2,324,027 | ||||||
|
| |||||||
| 14,535,672 | ||||||||
|
| |||||||
| Software – 8.0% | ||||||||
| 42,348 | Electronic Arts, Inc.* | 3,439,928 | ||||||
| 49,131 | Intuit, Inc. | 5,475,650 | ||||||
| 436,592 | Microsoft Corp. | 25,086,576 | ||||||
| 61,080 | Mobileye NV* | 2,986,201 | ||||||
| 324,629 | Oracle Corp. | 13,381,208 | ||||||
| 59,200 | salesforce.com, Inc.* | 4,701,664 | ||||||
| 73,580 | ServiceNow, Inc.* | 5,347,059 | ||||||
| 89,680 | Splunk, Inc.* | 5,222,963 | ||||||
| 41,476 | Tableau Software, Inc. Class A* | 2,406,852 | ||||||
|
| |||||||
| 68,048,101 | ||||||||
|
| |||||||
| Specialty Retail – 5.8% | ||||||||
| 7,975 | Advance Auto Parts, Inc. | 1,255,105 | ||||||
| 24,964 | O’Reilly Automotive, Inc.* | 6,988,672 | ||||||
| 141,441 | Ross Stores, Inc. | 8,803,288 | ||||||
| 123,492 | The Home Depot, Inc. | 16,562,747 | ||||||
| 81,468 | Tractor Supply Co. | 6,839,239 | ||||||
| 34,664 | Ulta Salon, Cosmetics & Fragrance, Inc.* | 8,569,287 | ||||||
|
| |||||||
| 49,018,338 | ||||||||
|
| |||||||
| Technology Hardware, Storage & Peripherals – 6.1% | ||||||||
| 486,122 | Apple, Inc. | 51,577,544 | ||||||
|
| |||||||
| Textiles, Apparel & Luxury Goods – 1.9% | ||||||||
| 269,296 | Kate Spade & Co.* | 5,025,063 | ||||||
| 153,301 | NIKE, Inc. Class B | 8,836,270 | ||||||
| 23,936 | PVH Corp. | 2,579,343 | ||||||
|
| |||||||
| 16,440,676 | ||||||||
|
| |||||||
| Tobacco – 2.1% | ||||||||
| 66,316 | Altria Group, Inc. | 4,382,825 | ||||||
| 45,740 | Philip Morris International, Inc. | 4,570,798 | ||||||
| 172,355 | Reynolds American, Inc. | 8,543,637 | ||||||
|
| |||||||
| 17,497,260 | ||||||||
|
| |||||||
| TOTAL COMMON STOCKS | ||||||||
| (Cost $611,255,339) | $ | 839,353,555 | ||||||
|
| |||||||
| 70 | The accompanying notes are an integral part of these financial statements. |
GOLDMAN SACHS CAPITAL GROWTH FUND
| Shares | Distribution Rate | Value | ||||||
| Investment Company(a)(b) – 0.9% | ||||||||
Goldman Sachs Financial Square Government Fund – Institutional Shares |
| |||||||
| 7,550,880 | 0.270 | % | $ | 7,550,880 | ||||
| (Cost $7,550,880) | ||||||||
| ||||||||
| TOTAL INVESTMENTS – 99.7% | ||||||||
| (Cost $618,806,219) | $ | 846,904,435 | ||||||
| ||||||||
OTHER ASSETS IN EXCESS OF LIABILITIES – 0.3% |
| 2,906,497 | ||||||
| ||||||||
| NET ASSETS – 100.0% | $ | 849,810,932 | ||||||
| ||||||||
| The percentage shown for each investment category reflects the value of investments in that category as a percentage of net assets. | ||
* | Non-income producing security. | |
(a) | Represents an Affiliated fund. | |
(b) | Variable rate security. Interest rate or distribution rate disclosed is that which is in effect on August 31, 2016. | |
| ||
Investment Abbreviations: | ||
PLC | —Public Limited Company | |
| ||
| The accompanying notes are an integral part of these financial statements. | 71 |
GOLDMAN SACHS CONCENTRATED GROWTH FUND
Schedule of Investments
August 31, 2016
| Shares | Description | Value | ||||||
| Common Stocks – 98.5% | ||||||||
| Biotechnology* – 3.0% | ||||||||
| 19,549 | Alexion Pharmaceuticals, Inc. | $ | 2,460,437 | |||||
| 19,421 | Vertex Pharmaceuticals, Inc. | 1,835,479 | ||||||
|
| |||||||
| 4,295,916 | ||||||||
|
| |||||||
| Capital Markets – 2.4% | ||||||||
| 12,192 | Intercontinental Exchange, Inc. | 3,438,388 | ||||||
|
| |||||||
| Chemicals – 1.9% | ||||||||
| 9,583 | The Sherwin-Williams Co. | 2,718,793 | ||||||
|
| |||||||
| Equity Real Estate Investment Trusts (REITs) – 6.7% | ||||||||
| 50,554 | American Tower Corp. | 5,731,813 | ||||||
| 10,554 | Equinix, Inc. | 3,890,732 | ||||||
|
| |||||||
| 9,622,545 | ||||||||
|
| |||||||
| Food & Staples Retailing – 5.9% | ||||||||
| 33,564 | Costco Wholesale Corp. | 5,440,389 | ||||||
| 37,220 | Walgreens Boots Alliance, Inc. | 3,004,026 | ||||||
|
| |||||||
| 8,444,415 | ||||||||
|
| |||||||
| Food Products – 1.9% | ||||||||
| 26,923 | McCormick & Co., Inc. | 2,745,069 | ||||||
|
| |||||||
| Health Care Equipment & Supplies – 6.7% | ||||||||
| 58,533 | Abbott Laboratories | 2,459,557 | ||||||
| 97,128 | Boston Scientific Corp.* | 2,313,589 | ||||||
| 30,418 | Danaher Corp. | 2,476,329 | ||||||
| 21,270 | Stryker Corp. | 2,460,088 | ||||||
|
| |||||||
| 9,709,563 | ||||||||
|
| |||||||
| Health Care Providers & Services – 1.7% | ||||||||
| 13,214 | McKesson Corp. | 2,439,569 | ||||||
|
| |||||||
| Health Care Technology* – 1.2% | ||||||||
| 26,079 | Cerner Corp. | 1,683,139 | ||||||
|
| |||||||
| Hotels, Restaurants & Leisure – 3.8% | ||||||||
| 4,408 | Chipotle Mexican Grill, Inc.* | 1,823,722 | ||||||
| 31,824 | McDonald’s Corp. | 3,680,764 | ||||||
|
| |||||||
| 5,504,486 | ||||||||
|
| |||||||
| Industrial Conglomerates – 6.5% | ||||||||
| 21,457 | 3M Co. | 3,845,953 | ||||||
| 35,959 | Honeywell International, Inc. | 4,196,775 | ||||||
| 7,843 | Roper Technologies, Inc. | 1,392,524 | ||||||
|
| |||||||
| 9,435,252 | ||||||||
|
| |||||||
| Internet & Direct Marketing Retail* – 5.7% | ||||||||
| 7,733 | Amazon.com, Inc. | 5,947,914 | ||||||
| 1,561 | The Priceline Group, Inc. | 2,211,516 | ||||||
|
| |||||||
| 8,159,430 | ||||||||
|
| |||||||
| Internet Software & Services* – 10.7% | ||||||||
| 7,417 | Alphabet, Inc. Class A | 5,858,317 | ||||||
| 3,504 | Alphabet, Inc. Class C | 2,687,743 | ||||||
| 54,671 | Facebook, Inc. Class A | 6,895,107 | ||||||
|
| |||||||
| 15,441,167 | ||||||||
|
| |||||||
| Common Stocks – (continued) | ||||||||
| IT Services – 4.6% | ||||||||
| 30,588 | Fidelity National Information Services, Inc. | 2,426,546 | ||||||
| 44,024 | MasterCard, Inc. Class A | 4,254,039 | ||||||
|
| |||||||
| 6,680,585 | ||||||||
|
| |||||||
| Machinery – 1.4% | ||||||||
| 37,331 | Fortive Corp. | 1,966,224 | ||||||
|
| |||||||
| Media – 2.9% | ||||||||
| 64,783 | Comcast Corp. Class A | 4,227,738 | ||||||
|
| |||||||
| Pharmaceuticals – 4.2% | ||||||||
| 14,193 | Allergan PLC* | 3,328,826 | ||||||
| 34,476 | Eli Lilly & Co. | 2,680,509 | ||||||
|
| |||||||
| 6,009,335 | ||||||||
|
| |||||||
| Road & Rail – 1.1% | ||||||||
| 17,102 | Kansas City Southern | 1,654,105 | ||||||
|
| |||||||
| Semiconductors & Semiconductor Equipment* – 1.8% | ||||||||
| 30,316 | NXP Semiconductors NV | 2,668,414 | ||||||
|
| |||||||
| Software – 9.5% | ||||||||
| 29,471 | Electronic Arts, Inc.* | 2,393,929 | ||||||
| 20,546 | Intuit, Inc. | 2,289,852 | ||||||
| 68,351 | Microsoft Corp. | 3,927,448 | ||||||
| 70,331 | Oracle Corp. | 2,899,044 | ||||||
| 27,085 | salesforce.com, Inc.* | 2,151,091 | ||||||
|
| |||||||
| 13,661,364 | ||||||||
|
| |||||||
| Specialty Retail – 2.1% | ||||||||
| 48,295 | Ross Stores, Inc. | 3,005,881 | ||||||
|
| |||||||
| Technology Hardware, Storage & Peripherals – 7.5% | ||||||||
| 101,729 | Apple, Inc. | 10,793,447 | ||||||
|
| |||||||
| Textiles, Apparel & Luxury Goods – 3.3% | ||||||||
| 61,284 | Kate Spade & Co.* | 1,143,559 | ||||||
| 62,028 | NIKE, Inc. Class B | 3,575,294 | ||||||
|
| |||||||
| 4,718,853 | ||||||||
|
| |||||||
| Tobacco – 2.0% | ||||||||
| 57,289 | Reynolds American, Inc. | 2,839,816 | ||||||
|
| |||||||
| TOTAL COMMON STOCKS | ||||||||
| (Cost $104,981,794) | $ | 141,863,494 | ||||||
|
| |||||||
| 72 | The accompanying notes are an integral part of these financial statements. |
GOLDMAN SACHS CONCENTRATED GROWTH FUND
| Principal Amount | Interest Rate | Maturity Date | Value | |||||||
| Short-term Investment(a) – 2.5% | ||||||||||
| Repurchase Agreements – 2.5% | ||||||||||
Joint Repurchase Agreement Account II |
| |||||||||
| $3,700,000 | 0.334% | 09/01/16 | $ | 3,700,000 | ||||||
| (Cost $3,700,000) | ||||||||||
| ||||||||||
| TOTAL INVESTMENTS – 101.0% | ||||||||||
| (Cost $108,681,794) | $ | 145,563,494 | ||||||||
| ||||||||||
LIABILITIES IN EXCESS OF OTHER ASSETS – (1.0)% |
| (1,497,377 | ) | |||||||
| ||||||||||
| NET ASSETS – 100.0% | $ | 144,066,117 | ||||||||
| ||||||||||
| The percentage shown for each investment category reflects the value of investments in that category as a percentage of net assets. | ||
* | Non-income producing security. | |
(a) | Joint repurchase agreement was entered into on August 31, 2016. Additional information appears on pages 84-85. | |
| ||
Investment Abbreviations: | ||
PLC | —Public Limited Company | |
| ||
| The accompanying notes are an integral part of these financial statements. | 73 |
GOLDMAN SACHS DYNAMIC U.S. EQUITY FUND
Schedule of Investments
August 31, 2016
| Shares | Description | Value | ||||||
| Common Stocks – 99.9% | ||||||||
| Banks – 8.6% | ||||||||
| 23,371 | Bank of America Corp. | $ | 377,208 | |||||
| 3,667 | JPMorgan Chase & Co. | 247,522 | ||||||
|
| |||||||
| 624,730 | ||||||||
|
| |||||||
| Capital Markets – 4.0% | ||||||||
| 679 | Intercontinental Exchange, Inc. | 191,492 | ||||||
| 3,151 | Morgan Stanley | 101,021 | ||||||
|
| |||||||
| 292,513 | ||||||||
|
| |||||||
| Chemicals – 4.2% | ||||||||
| 2,302 | E.I. du Pont de Nemours & Co. | 160,219 | ||||||
| 512 | The Sherwin-Williams Co. | 145,260 | ||||||
|
| |||||||
| 305,479 | ||||||||
|
| |||||||
| Consumer Finance – 1.3% | ||||||||
| 1,396 | American Express Co. | 91,550 | ||||||
|
| |||||||
| Electric Utilities – 1.6% | ||||||||
| 3,496 | FirstEnergy Corp. | 114,424 | ||||||
|
| |||||||
| Energy Equipment & Services – 1.1% | ||||||||
| 1,658 | Baker Hughes, Inc. | 81,458 | ||||||
|
| |||||||
| Equity Real Estate Investment Trusts (REITs) – 5.0% | ||||||||
| 1,802 | American Tower Corp. | 204,311 | ||||||
| 417 | Equinix, Inc. | 153,727 | ||||||
|
| |||||||
| 358,038 | ||||||||
|
| |||||||
| Food & Staples Retailing – 7.8% | ||||||||
| 1,162 | Costco Wholesale Corp. | 188,348 | ||||||
| 2,129 | Walgreens Boots Alliance, Inc. | 171,832 | ||||||
| 6,716 | Whole Foods Market, Inc. | 204,032 | ||||||
|
| |||||||
| 564,212 | ||||||||
|
| |||||||
| Health Care Equipment & Supplies – 3.1% | ||||||||
| 5,321 | Abbott Laboratories | 223,588 | ||||||
|
| |||||||
| Health Care Providers & Services – 3.2% | ||||||||
| 1,265 | McKesson Corp. | 233,544 | ||||||
|
| |||||||
| Hotels, Restaurants & Leisure – 2.3% | ||||||||
| 1,460 | McDonald’s Corp. | 168,864 | ||||||
|
| |||||||
| Household Products – 2.0% | ||||||||
| 1,681 | The Procter & Gamble Co. | 146,768 | ||||||
|
| |||||||
| Industrial Conglomerates – 6.9% | ||||||||
| 895 | 3M Co. | 160,420 | ||||||
| 7,168 | General Electric Co. | 223,928 | ||||||
| 1,005 | Honeywell International, Inc. | 117,294 | ||||||
|
| |||||||
| 501,642 | ||||||||
|
| |||||||
| Internet & Direct Marketing Retail* – 7.2% | ||||||||
| 478 | Amazon.com, Inc. | 367,658 | ||||||
| 108 | The Priceline Group, Inc. | 153,007 | ||||||
|
| |||||||
| 520,665 | ||||||||
|
| |||||||
| Internet Software & Services* – 11.5% | ||||||||
| 262 | Alphabet, Inc. Class A | 206,941 | ||||||
| 185 | Alphabet, Inc. Class C | 141,904 | ||||||
|
| |||||||
| Common Stocks – (continued) | ||||||||
| Internet Software & Services* – (continued) | ||||||||
| 6,399 | eBay, Inc. | $ | 205,792 | |||||
| 2,207 | Facebook, Inc. Class A | 278,347 | ||||||
|
| |||||||
| 832,984 | ||||||||
|
| |||||||
| IT Services – 3.5% | ||||||||
| 2,636 | MasterCard, Inc. Class A | 254,717 | ||||||
|
| |||||||
| Media – 2.3% | ||||||||
| 4,108 | Viacom, Inc. Class B | 165,717 | ||||||
|
| |||||||
| Oil, Gas & Consumable Fuels – 6.7% | ||||||||
| 1,859 | Chevron Corp. | 186,978 | ||||||
| 1,817 | Exxon Mobil Corp. | 158,333 | ||||||
| 10,036 | Southwestern Energy Co.* | 139,601 | ||||||
|
| |||||||
| 484,912 | ||||||||
|
| |||||||
| Pharmaceuticals – 6.8% | ||||||||
| 796 | Allergan PLC* | 186,694 | ||||||
| 8,842 | Pfizer, Inc. | 307,701 | ||||||
|
| |||||||
| 494,395 | ||||||||
|
| |||||||
| Road & Rail – 1.2% | ||||||||
| 917 | Union Pacific Corp. | 87,601 | ||||||
|
| |||||||
| Specialty Retail – 1.6% | ||||||||
| 2,232 | Williams-Sonoma, Inc. | 117,492 | ||||||
|
| |||||||
| Technology Hardware, Storage & Peripherals – 3.9% | ||||||||
| 2,674 | Apple, Inc. | 283,711 | ||||||
|
| |||||||
| Textiles, Apparel & Luxury Goods – 2.6% | ||||||||
| 3,287 | NIKE, Inc. Class B | 189,463 | ||||||
|
| |||||||
| Tobacco – 1.5% | ||||||||
| 2,210 | Reynolds American, Inc. | 109,550 | ||||||
|
| |||||||
| TOTAL COMMON STOCKS | ||||||||
| (Cost $5,697,314) | $ | 7,248,017 | ||||||
|
| |||||||
| TOTAL INVESTMENTS – 99.9% | ||||||||
| (Cost $5,697,314) | $ | 7,248,017 | ||||||
|
| |||||||
| | OTHER ASSETS IN EXCESS OF LIABILITIES – 0.1% | 10,439 | ||||||
|
| |||||||
| NET ASSETS – 100.0% | $ | 7,258,456 | ||||||
|
| |||||||
| The percentage shown for each investment category reflects the value of investments in that category as a percentage of net assets. | ||
| * | Non-income producing security. | |
| ||||
| Investment Abbreviations: | ||||
PLC | —Public Limited Company | |||
| ||||
| 74 | The accompanying notes are an integral part of these financial statements. |
GOLDMAN SACHS FLEXIBLE CAP GROWTH FUND
Schedule of Investments
August 31, 2016
| Shares | Description | Value | ||||||
| Common Stocks – 98.1% | ||||||||
| Auto Components – 0.9% | ||||||||
| 4,360 | BorgWarner, Inc. | $ | 149,940 | |||||
|
| |||||||
| Banks – 1.5% | ||||||||
| 2,697 | Eagle Bancorp, Inc.* | 139,597 | ||||||
| 1,444 | First Republic Bank | 111,130 | ||||||
|
| |||||||
| 250,727 | ||||||||
|
| |||||||
| Beverages – 1.8% | ||||||||
| 7,003 | The Coca-Cola Co. | 304,140 | ||||||
|
| |||||||
| Biotechnology – 3.6% | ||||||||
| 1,478 | ACADIA Pharmaceuticals, Inc.* | 47,488 | ||||||
| 732 | Alexion Pharmaceuticals, Inc.* | 92,130 | ||||||
| 1,469 | Alkermes PLC* | 64,298 | ||||||
| 1,216 | Celgene Corp.* | 129,796 | ||||||
| 1,888 | Cepheid, Inc.* | 64,796 | ||||||
| 1,595 | Gilead Sciences, Inc. | 125,016 | ||||||
| 982 | Vertex Pharmaceuticals, Inc.* | 92,809 | ||||||
|
| |||||||
| 616,333 | ||||||||
|
| |||||||
| Building Products – 0.5% | ||||||||
| 1,478 | Fortune Brands Home & Security, Inc. | 93,942 | ||||||
|
| |||||||
| Capital Markets – 2.2% | ||||||||
| 661 | Affiliated Managers Group, Inc.* | 93,895 | ||||||
| 969 | Intercontinental Exchange, Inc. | 273,277 | ||||||
|
| |||||||
| 367,172 | ||||||||
|
| |||||||
| Chemicals – 2.6% | ||||||||
| 1,486 | Ashland, Inc. | 173,981 | ||||||
| 1,373 | RPM International, Inc. | 74,869 | ||||||
| 687 | The Sherwin-Williams Co. | 194,909 | ||||||
|
| |||||||
| 443,759 | ||||||||
|
| |||||||
| Commercial Services & Supplies – 1.0% | ||||||||
| 4,094 | Healthcare Services Group, Inc. | 165,275 | ||||||
|
| |||||||
| Diversified Telecommunication Services* – 1.9% | ||||||||
| 2,520 | Level 3 Communications, Inc. | 125,068 | ||||||
| 1,696 | SBA Communications Corp. Class A | 193,598 | ||||||
|
| |||||||
| 318,666 | ||||||||
|
| |||||||
| Electrical Equipment – 2.0% | ||||||||
| 2,297 | AMETEK, Inc. | 111,979 | ||||||
| 5,951 | Sensata Technologies Holding NV* | 226,614 | ||||||
|
| |||||||
| 338,593 | ||||||||
|
| |||||||
| Electronic Equipment, Instruments & Components – 1.2% | ||||||||
| 3,351 | Amphenol Corp. Class A | 208,801 | ||||||
|
| |||||||
| Equity Real Estate Investment Trusts (REITs) – 3.3% | ||||||||
| 2,536 | American Tower Corp. | 287,532 | ||||||
| 744 | Equinix, Inc. | 274,275 | ||||||
|
| |||||||
| 561,807 | ||||||||
|
| |||||||
| Food & Staples Retailing – 4.4% | ||||||||
| 1,986 | Costco Wholesale Corp. | 321,911 | ||||||
| 3,241 | Walgreens Boots Alliance, Inc. | 261,581 | ||||||
|
| |||||||
| Common Stocks – (continued) | ||||||||
| Food & Staples Retailing – (continued) | ||||||||
| 5,567 | Whole Foods Market, Inc. | $ | 169,125 | |||||
|
| |||||||
| 752,617 | ||||||||
|
| |||||||
| Food Products – 3.2% | ||||||||
| 3,330 | Blue Buffalo Pet Products, Inc.* | 85,847 | ||||||
| 1,645 | McCormick & Co., Inc. | 167,724 | ||||||
| 1,149 | Mead Johnson Nutrition Co. | 97,746 | ||||||
| 2,119 | TreeHouse Foods, Inc.* | 200,733 | ||||||
|
| |||||||
| 552,050 | ||||||||
|
| |||||||
| Health Care Equipment & Supplies – 5.6% | ||||||||
| 5,289 | Abbott Laboratories | 222,244 | ||||||
| 5,387 | Boston Scientific Corp.* | 128,318 | ||||||
| 989 | C.R. Bard, Inc. | 218,410 | ||||||
| 1,846 | Danaher Corp. | 150,283 | ||||||
| 1,183 | Stryker Corp. | 136,826 | ||||||
| 521 | Teleflex, Inc. | 95,390 | ||||||
|
| |||||||
| 951,471 | ||||||||
|
| |||||||
| Health Care Providers & Services – 2.7% | ||||||||
| 1,287 | Acadia Healthcare Co., Inc.* | 65,882 | ||||||
| 557 | Adeptus Health, Inc. Class A* | 23,706 | ||||||
| 838 | Aetna, Inc. | 98,147 | ||||||
| 790 | Henry Schein, Inc.* | 129,394 | ||||||
| 775 | McKesson Corp. | 143,080 | ||||||
|
| |||||||
| 460,209 | ||||||||
|
| |||||||
| Health Care Technology* – 0.5% | ||||||||
| 1,362 | Cerner Corp. | 87,903 | ||||||
|
| |||||||
| Hotels, Restaurants & Leisure – 3.6% | ||||||||
| 318 | Chipotle Mexican Grill, Inc.* | 131,566 | ||||||
| 2,150 | McDonald’s Corp. | 248,669 | ||||||
| 1,029 | Panera Bread Co. Class A* | 223,447 | ||||||
|
| |||||||
| 603,682 | ||||||||
|
| |||||||
| Household Durables – 0.6% | ||||||||
| 1,907 | Newell Brands, Inc. | 101,224 | ||||||
|
| |||||||
| Industrial Conglomerates – 4.1% | ||||||||
| 1,210 | 3M Co. | 216,881 | ||||||
| 3,216 | Honeywell International, Inc. | 375,339 | ||||||
| 616 | Roper Technologies, Inc. | 109,371 | ||||||
|
| |||||||
| 701,591 | ||||||||
|
| |||||||
| Internet & Direct Marketing Retail* – 4.5% | ||||||||
| 795 | Amazon.com, Inc. | 611,482 | ||||||
| 109 | The Priceline Group, Inc. | 154,424 | ||||||
|
| |||||||
| 765,906 | ||||||||
|
| |||||||
| Internet Software & Services* – 9.1% | ||||||||
| 605 | Alphabet, Inc. Class A | 477,859 | ||||||
| 541 | Alphabet, Inc. Class C | 414,974 | ||||||
| 5,191 | Facebook, Inc. Class A | 654,689 | ||||||
|
| |||||||
| 1,547,522 | ||||||||
|
| |||||||
| The accompanying notes are an integral part of these financial statements. | 75 |
GOLDMAN SACHS FLEXIBLE CAP GROWTH FUND
Schedule of Investments (continued)
August 31, 2016
| Shares | Description | Value | ||||||
| Common Stocks – (continued) | ||||||||
| IT Services – 5.1% | ||||||||
| 3,729 | Black Knight Financial Services, Inc. Class A* | $ | 145,506 | |||||
| 1,944 | Fidelity National Information Services, Inc. | 154,217 | ||||||
| 727 | FleetCor Technologies, Inc.* | 119,373 | ||||||
| 1,026 | Global Payments, Inc. | 77,925 | ||||||
| 3,768 | MasterCard, Inc. Class A | 364,102 | ||||||
|
| |||||||
| 861,123 | ||||||||
|
| |||||||
| Life Sciences Tools & Services – 1.3% | ||||||||
| 2,598 | Agilent Technologies, Inc. | 122,054 | ||||||
| 266 | Mettler-Toledo International, Inc.* | 107,217 | ||||||
|
| |||||||
| 229,271 | ||||||||
|
| |||||||
| Machinery – 2.8% | ||||||||
| 1,345 | Fortive Corp. | 70,841 | ||||||
| 688 | Graco, Inc. | 50,685 | ||||||
| 1,270 | The Middleby Corp.* | 162,751 | ||||||
| 3,650 | Xylem, Inc. | 185,639 | ||||||
|
| |||||||
| 469,916 | ||||||||
|
| |||||||
| Media – 1.9% | ||||||||
| 5,026 | Comcast Corp. Class A | 327,997 | ||||||
|
| |||||||
| Oil, Gas & Consumable Fuels* – 0.2% | ||||||||
| 235 | Concho Resources, Inc. | 30,362 | ||||||
|
| |||||||
| Pharmaceuticals – 2.2% | ||||||||
| 1,009 | Allergan PLC* | 236,651 | ||||||
| 2,688 | Zoetis, Inc. | 137,357 | ||||||
|
| |||||||
| 374,008 | ||||||||
|
| |||||||
| Road & Rail – 0.5% | ||||||||
| 888 | Kansas City Southern | 85,887 | ||||||
|
| |||||||
| Semiconductors & Semiconductor Equipment* – 0.7% | ||||||||
| 772 | NXP Semiconductors NV | 67,951 | ||||||
| 841 | Qorvo, Inc. | 48,299 | ||||||
|
| |||||||
| 116,250 | ||||||||
|
| |||||||
| Software – 8.7% | ||||||||
| 1,762 | Electronic Arts, Inc.* | 143,127 | ||||||
| 1,423 | Intuit, Inc. | 158,593 | ||||||
| 8,039 | Microsoft Corp. | 461,921 | ||||||
| 1,793 | Mobileye NV* | 87,660 | ||||||
| 7,757 | Oracle Corp. | 319,744 | ||||||
| 1,189 | Red Hat, Inc.* | 86,773 | ||||||
| 2,014 | salesforce.com, Inc.* | 159,952 | ||||||
| 958 | Splunk, Inc.* | 55,794 | ||||||
|
| |||||||
| 1,473,564 | ||||||||
|
| |||||||
| Specialty Retail – 4.8% | ||||||||
| 305 | Advance Auto Parts, Inc. | 48,001 | ||||||
| 696 | Burlington Stores, Inc.* | 56,529 | ||||||
| 3,427 | Ross Stores, Inc. | 213,297 | ||||||
| 1,368 | The Home Depot, Inc. | 183,476 | ||||||
| 1,753 | Tractor Supply Co. | 147,164 | ||||||
| 643 | Ulta Salon, Cosmetics & Fragrance, Inc.* | 158,956 | ||||||
|
| |||||||
| 807,423 | ||||||||
|
| |||||||
| Common Stocks – (continued) | ||||||||
| Technology Hardware, Storage & Peripherals – 5.8% | ||||||||
| 9,319 | Apple, Inc. | $ | 988,746 | |||||
|
| |||||||
| Textiles, Apparel & Luxury Goods – 2.2% | ||||||||
| 4,086 | Kate Spade & Co.* | 76,245 | ||||||
| 5,053 | NIKE, Inc. Class B | 291,255 | ||||||
|
| |||||||
| 367,500 | ||||||||
|
| |||||||
| Tobacco – 0.7% | ||||||||
| 2,535 | Reynolds American, Inc. | 125,660 | ||||||
|
| |||||||
| Trading Companies & Distributors – 0.4% | ||||||||
| 269 | W.W. Grainger, Inc. | 62,047 | ||||||
|
| |||||||
| TOTAL COMMON STOCKS | ||||||||
| (Cost $12,163,097) | $ | 16,663,084 | ||||||
|
| |||||||
| Principal Amount | Interest Rate | Maturity Date | Value | |||||||
| Short-term Investment(a) – 1.8% | ||||||||||
| Repurchase Agreements – 1.8% | ||||||||||
Joint Repurchase Agreement Account II |
| |||||||||
| $300,000 | 0.334% | 09/01/16 | $ | 300,000 | ||||||
| (Cost $300,000) | ||||||||||
| ||||||||||
| TOTAL INVESTMENTS – 99.9% | ||||||||||
| (Cost $12,463,097) | $ | 16,963,084 | ||||||||
| ||||||||||
OTHER ASSETS IN EXCESS OF LIABILITIES – 0.1% |
�� | 12,804 | ||||||||
| ||||||||||
| NET ASSETS – 100.0% | $ | 16,975,888 | ||||||||
| ||||||||||
| The percentage shown for each investment category reflects the value of investments in that category as a percentage of net assets. | ||
* | Non-income producing security. | |
(a) | Joint repurchase agreement was entered into on August 31, 2016. Additional information appears on pages 84-85. | |
| ||
Investment Abbreviations: | ||
PLC | —Public Limited Company | |
| ||
| 76 | The accompanying notes are an integral part of these financial statements. |
GOLDMAN SACHS FOCUSED GROWTH FUND
Schedule of Investments
August 31, 2016
| Shares | Description | Value | ||||||
| Common Stocks – 99.3% | ||||||||
| Biotechnology* – 2.2% | ||||||||
| 4,345 | Alexion Pharmaceuticals, Inc. | $ | 546,862 | |||||
|
| |||||||
| Capital Markets – 4.5% | ||||||||
| 3,945 | Intercontinental Exchange, Inc. | 1,112,569 | ||||||
|
| |||||||
| Chemicals – 3.9% | ||||||||
| 3,373 | The Sherwin-Williams Co. | 956,954 | ||||||
|
| |||||||
| Equity Real Estate Investment Trusts (REITs) – 9.9% | ||||||||
| 13,230 | American Tower Corp. | 1,500,017 | ||||||
| 2,563 | Equinix, Inc. | 944,850 | ||||||
|
| |||||||
| 2,444,867 | ||||||||
|
| |||||||
| Food & Staples Retailing – 9.5% | ||||||||
| 9,222 | Costco Wholesale Corp. | 1,494,794 | ||||||
| 10,515 | Walgreens Boots Alliance, Inc. | 848,666 | ||||||
|
| |||||||
| 2,343,460 | ||||||||
|
| |||||||
| Health Care Equipment & Supplies – 7.8% | ||||||||
| 27,347 | Abbott Laboratories | 1,149,121 | ||||||
| 6,731 | Stryker Corp. | 778,507 | ||||||
|
| |||||||
| 1,927,628 | ||||||||
|
| |||||||
| Hotels, Restaurants & Leisure – 3.9% | ||||||||
| 8,191 | McDonald’s Corp. | 947,371 | ||||||
|
| |||||||
| Industrial Conglomerates – 7.9% | ||||||||
| 4,118 | 3M Co. | 738,110 | ||||||
| 10,354 | Honeywell International, Inc. | 1,208,416 | ||||||
|
| |||||||
| 1,946,526 | ||||||||
|
| |||||||
| Internet & Direct Marketing Retail* – 4.9% | ||||||||
| 1,576 | Amazon.com, Inc. | 1,212,196 | ||||||
|
| |||||||
| Internet Software & Services* – 11.2% | ||||||||
| 1,696 | Alphabet, Inc. Class A | 1,339,586 | ||||||
| 11,241 | Facebook, Inc. Class A | 1,417,715 | ||||||
|
| |||||||
| 2,757,301 | ||||||||
|
| |||||||
| IT Services – 5.4% | ||||||||
| 13,718 | MasterCard, Inc. Class A | 1,325,570 | ||||||
|
| |||||||
| Pharmaceuticals* – 3.5% | ||||||||
| 3,667 | Allergan PLC | 860,058 | ||||||
|
| |||||||
| Road & Rail – 2.3% | ||||||||
| 5,909 | Kansas City Southern | 571,518 | ||||||
|
| |||||||
| Software – 2.7% | ||||||||
| 16,104 | Oracle Corp. | 663,807 | ||||||
|
| |||||||
| Specialty Retail – 2.9% | ||||||||
| 11,216 | Ross Stores, Inc. | 698,084 | ||||||
|
| |||||||
| Technology Hardware, Storage & Peripherals – 10.2% | ||||||||
| 23,633 | Apple, Inc. | 2,507,461 | ||||||
|
| |||||||
| Textiles, Apparel & Luxury Goods – 3.6% | ||||||||
| 15,110 | NIKE, Inc. Class B | 870,940 | ||||||
|
| |||||||
| Common Stocks – (continued) | ||||||||
| Tobacco – 3.0% | ||||||||
| 14,908 | Reynolds American, Inc. | $ | 738,990 | |||||
|
| |||||||
| TOTAL COMMON STOCKS | ||||||||
| (Cost $20,754,587) | $ | 24,432,162 | ||||||
|
| |||||||
| Principal Amount | Interest Rate | Maturity Date | Value | |||||||||
| Short-term Investment(a) – 0.8% | ||||||||||||
| Repurchase Agreements – 0.8% | ||||||||||||
Joint Repurchase Agreement Account II |
| |||||||||||
$200,000 | 0.334 | % | 09/01/16 | $ | 200,000 | |||||||
| (Cost $200,000) | ||||||||||||
| ||||||||||||
| TOTAL INVESTMENTS – 100.1% | ||||||||||||
| (Cost $20,954,587) | $ | 24,632,162 | ||||||||||
| ||||||||||||
LIABILITIES IN EXCESS OF OTHER ASSETS – (0.1)% |
| (19,941 | ) | |||||||||
| ||||||||||||
| NET ASSETS – 100.0% | $ | 24,612,221 | ||||||||||
| ||||||||||||
| The percentage shown for each investment category reflects the value of investments in that category as a percentage of net assets. | ||
* | Non-income producing security. | |
(a) | Joint repurchase agreement was entered into on August 31, 2016. Additional information appears on pages 84-85. | |
| ||
Investment Abbreviations: | ||
PLC | —Public Limited Company | |
| ||
| The accompanying notes are an integral part of these financial statements. | 77 |
GOLDMAN SACHS GROWTH OPPORTUNITIES FUND
Schedule of Investments
August 31, 2016
| Shares | Description | Value | ||||||
| Common Stocks – 98.6% | ||||||||
| Banks – 2.3% | ||||||||
| 748,691 | Eagle Bancorp, Inc.* | $ | 38,752,246 | |||||
| 456,004 | First Republic Bank | 35,094,068 | ||||||
|
| |||||||
| 73,846,314 | ||||||||
|
| |||||||
| Beverages – 2.2% | ||||||||
| 801,565 | Brown-Forman Corp. Class B | 38,915,981 | ||||||
| 207,306 | Monster Beverage Corp.* | 31,902,320 | ||||||
|
| |||||||
| 70,818,301 | ||||||||
|
| |||||||
| Biotechnology* – 2.3% | ||||||||
| 101,315 | Alexion Pharmaceuticals, Inc. | 12,751,506 | ||||||
| 551,257 | Alkermes PLC | 24,128,519 | ||||||
| 393,828 | Cepheid, Inc. | 13,516,177 | ||||||
| 260,995 | Vertex Pharmaceuticals, Inc. | 24,666,637 | ||||||
|
| |||||||
| 75,062,839 | ||||||||
|
| |||||||
| Building Products – 1.2% | ||||||||
| 612,046 | Fortune Brands Home & Security, Inc. | 38,901,644 | ||||||
|
| |||||||
| Capital Markets – 3.7% | ||||||||
| 374,432 | Affiliated Managers Group, Inc.* | 53,188,066 | ||||||
| 236,575 | Intercontinental Exchange, Inc. | 66,718,881 | ||||||
|
| |||||||
| 119,906,947 | ||||||||
|
| |||||||
| Chemicals – 5.8% | ||||||||
| 470,725 | Ashland, Inc. | 55,112,483 | ||||||
| 638,890 | Axalta Coating Systems Ltd.* | 18,285,032 | ||||||
| 874,251 | RPM International, Inc. | 47,672,907 | ||||||
| 230,513 | The Sherwin-Williams Co. | 65,398,843 | ||||||
|
| |||||||
| 186,469,265 | ||||||||
|
| |||||||
| Containers & Packaging – 1.3% | ||||||||
| 523,200 | Avery Dennison Corp. | 40,516,608 | ||||||
|
| |||||||
| Diversified Telecommunication Services* – 4.0% | ||||||||
| 931,576 | Level 3 Communications, Inc. | 46,234,117 | ||||||
| 716,998 | SBA Communications Corp. Class A | 81,845,321 | ||||||
|
| |||||||
| 128,079,438 | ||||||||
|
| |||||||
| Electrical Equipment – 3.9% | ||||||||
| 881,525 | AMETEK, Inc. | 42,974,344 | ||||||
| 263,419 | Hubbell, Inc. | 28,530,912 | ||||||
| 1,365,126 | Sensata Technologies Holding NV* | 51,983,998 | ||||||
|
| |||||||
| 123,489,254 | ||||||||
|
| |||||||
| Electronic Equipment, Instruments & Components – 2.8% | ||||||||
| 1,428,972 | Amphenol Corp. Class A | 89,039,245 | ||||||
|
| |||||||
| Energy Equipment & Services* – 0.4% | ||||||||
| 204,881 | Dril-Quip, Inc. | 11,385,237 | ||||||
|
| |||||||
| Equity Real Estate Investment Trusts (REITs) – 2.3% | ||||||||
| 203,669 | Equinix, Inc. | 75,082,577 | ||||||
|
| |||||||
| Food & Staples Retailing – 1.2% | ||||||||
| 1,237,599 | Whole Foods Market, Inc. | 37,598,258 | ||||||
|
| |||||||
| Common Stocks – (continued) | ||||||||
| Food Products – 6.8% | ||||||||
| 1,741,673 | Blue Buffalo Pet Products, Inc.* | $ | 44,900,330 | |||||
| 681,667 | McCormick & Co., Inc. | 69,502,767 | ||||||
| 508,478 | Mead Johnson Nutrition Co. | 43,256,224 | ||||||
| 625,555 | TreeHouse Foods, Inc.* | 59,258,825 | ||||||
|
| |||||||
| 216,918,146 | ||||||||
|
| |||||||
| Health Care Equipment & Supplies – 3.5% | ||||||||
| 290,479 | C.R. Bard, Inc. | 64,149,382 | ||||||
| 133,855 | Edwards Lifesciences Corp.* | 15,414,742 | ||||||
| 181,673 | Teleflex, Inc. | 33,262,510 | ||||||
|
| |||||||
| 112,826,634 | ||||||||
|
| |||||||
| Health Care Providers & Services – 3.3% | ||||||||
| 192,758 | Adeptus Health, Inc. Class A* | 8,203,781 | ||||||
| 403,813 | Cardinal Health, Inc. | 32,171,782 | ||||||
| 390,193 | Henry Schein, Inc.* | 63,909,711 | ||||||
|
| |||||||
| 104,285,274 | ||||||||
|
| |||||||
| Health Care Technology* – 1.5% | ||||||||
| 740,205 | Cerner Corp. | 47,772,831 | ||||||
|
| |||||||
| Hotels, Restaurants & Leisure* – 4.2% | ||||||||
| 135,433 | Chipotle Mexican Grill, Inc. | 56,032,695 | ||||||
| 354,862 | Panera Bread Co. Class A | 77,058,283 | ||||||
|
| |||||||
| 133,090,978 | ||||||||
|
| |||||||
| Household Durables – 2.1% | ||||||||
| 1,294,922 | Newell Brands, Inc. | 68,734,460 | ||||||
|
| |||||||
| Industrial Conglomerates – 2.1% | ||||||||
| 381,707 | Roper Technologies, Inc. | 67,772,078 | ||||||
|
| |||||||
| Internet & Direct Marketing Retail – 1.6% | ||||||||
| 485,273 | Expedia, Inc. | 52,952,990 | ||||||
|
| |||||||
| Internet Software & Services* – 0.4% | ||||||||
| 719,419 | Match Group, Inc. | 11,647,394 | ||||||
|
| |||||||
| IT Services – 7.2% | ||||||||
| 1,238,810 | Black Knight Financial Services, Inc. Class A* | 48,338,366 | ||||||
| 1,046,226 | Fidelity National Information Services, Inc. | 82,997,109 | ||||||
| 364,561 | FleetCor Technologies, Inc.* | 59,860,916 | ||||||
| 506,054 | Global Payments, Inc. | 38,434,801 | ||||||
|
| |||||||
| 229,631,192 | ||||||||
|
| |||||||
| Life Sciences Tools & Services – 3.3% | ||||||||
| 1,010,897 | Agilent Technologies, Inc. | 47,491,941 | ||||||
| 142,635 | Mettler-Toledo International, Inc.* | 57,491,889 | ||||||
|
| |||||||
| 104,983,830 | ||||||||
|
| |||||||
| Machinery – 5.7% | ||||||||
| 647,550 | Fortive Corp. | 34,106,458 | ||||||
| 597,497 | The Middleby Corp.* | 76,569,241 | ||||||
| 1,400,916 | Xylem, Inc. | 71,250,588 | ||||||
|
| |||||||
| 181,926,287 | ||||||||
|
| |||||||
| 78 | The accompanying notes are an integral part of these financial statements. |
GOLDMAN SACHS GROWTH OPPORTUNITIES FUND
| Shares | Description | Value | ||||||
| Common Stocks – (continued) | ||||||||
| Oil, Gas & Consumable Fuels* – 0.3% | ||||||||
| 86,595 | Concho Resources, Inc. | $ | 11,188,074 | |||||
|
| |||||||
| Pharmaceuticals – 2.0% | ||||||||
| 1,230,383 | Zoetis, Inc. | 62,872,571 | ||||||
|
| |||||||
| Road & Rail – 0.7% | ||||||||
| 238,999 | Kansas City Southern | 23,115,983 | ||||||
|
| |||||||
| Semiconductors & Semiconductor Equipment* – 0.7% | ||||||||
| 402,488 | Qorvo, Inc. | 23,114,886 | ||||||
|
| |||||||
| Software – 7.3% | ||||||||
| 762,026 | Electronic Arts, Inc.* | 61,899,372 | ||||||
| 641,314 | Intuit, Inc. | 71,474,445 | ||||||
| 421,886 | Mobileye NV* | 20,626,006 | ||||||
| 446,305 | Red Hat, Inc.* | 32,571,339 | ||||||
| 328,018 | ServiceNow, Inc.* | 23,837,068 | ||||||
| 381,707 | Splunk, Inc.* | 22,230,616 | ||||||
|
| |||||||
| 232,638,846 | ||||||||
|
| |||||||
| Specialty Retail – 9.9% | ||||||||
| 292,688 | Advance Auto Parts, Inc. | 46,063,237 | ||||||
| 497,568 | Five Below, Inc.* | 22,171,630 | ||||||
| 111,014 | O’Reilly Automotive, Inc.* | 31,078,369 | ||||||
| 1,359,522 | Ross Stores, Inc. | 84,616,649 | ||||||
| 688,171 | Tractor Supply Co. | 57,771,956 | ||||||
| 302,385 | Ulta Salon, Cosmetics & Fragrance, Inc.* | 74,752,596 | ||||||
|
| |||||||
| 316,454,437 | ||||||||
|
| |||||||
| Textiles, Apparel & Luxury Goods – 2.6% | ||||||||
| 2,130,036 | Kate Spade & Co.* | 39,746,472 | ||||||
| 174,400 | PVH Corp. | 18,793,344 | ||||||
| 662,097 | Under Armour, Inc. Class A* | 26,238,904 | ||||||
|
| |||||||
| 84,778,720 | ||||||||
|
| |||||||
| TOTAL COMMON STOCKS | ||||||||
| (Cost $2,488,640,137) | $ | 3,156,901,538 | ||||||
|
| |||||||
| Shares | Distribution Rate | Value | ||||||
| Investment Companies(a)(b) – 0.0% | ||||||||
| | Goldman Sachs Financial Square Government Fund – | | ||||||
| 651 | 0.270% | $ | 651 | |||||
| (Cost $651) | ||||||||
|
| |||||||
| TOTAL INVESTMENTS – 98.6% | ||||||||
| (Cost $2,488,640,788) | $ | 3,156,902,189 | ||||||
|
| |||||||
| | OTHER ASSETS IN EXCESS OF LIABILITIES – 1.4% | 44,984,825 | ||||||
|
| |||||||
| NET ASSETS – 100.0% | $ | 3,201,887,014 | ||||||
|
| |||||||
| The percentage shown for each investment category reflects the value of investments in that category as a percentage of net assets. | ||
* | Non-income producing security. | |
(a) | Represents an Affiliated fund. | |
(b) | Variable rate security. Interest rate or distribution rate disclosed is that which is in effect on August 31, 2016. | |
| ||
Investment Abbreviations: | ||
PLC | —Public Limited Company | |
| ||
| The accompanying notes are an integral part of these financial statements. | 79 |
GOLDMAN SACHS SMALL/MID CAP GROWTH FUND
Schedule of Investments
August 31, 2016
| Shares | Description | Value | ||||||
| Common Stocks – 98.7% | ||||||||
| Aerospace & Defense* – 0.9% | ||||||||
| 1,002,236 | Aerovironment, Inc. | $ | 24,795,319 | |||||
|
| |||||||
| Banks – 3.7% | ||||||||
| 1,278,161 | Eagle Bancorp, Inc.* | 66,157,613 | ||||||
| 398,855 | First Republic Bank | 30,695,881 | ||||||
|
| |||||||
| 96,853,494 | ||||||||
|
| |||||||
| Beverages – 0.9% | ||||||||
| 563,377 | MGP Ingredients, Inc. | 22,501,277 | ||||||
|
| |||||||
| Biotechnology* – 7.2% | ||||||||
| 463,065 | ACADIA Pharmaceuticals, Inc. | 14,878,278 | ||||||
| 348,610 | Acceleron Pharma, Inc. | 10,461,786 | ||||||
| 721,368 | Achillion Pharmaceuticals, Inc. | 5,958,500 | ||||||
| 523,663 | Alder Biopharmaceuticals, Inc. | 17,265,169 | ||||||
| 636,408 | Alkermes PLC | 27,855,578 | ||||||
| 238,018 | Aptevo Therapeutics, Inc. | 647,409 | ||||||
| 443,972 | Cepheid, Inc. | 15,237,119 | ||||||
| 328,545 | Dynavax Technologies Corp. | 5,145,015 | ||||||
| 476,037 | Emergent BioSolutions, Inc. | 12,686,386 | ||||||
| 949,498 | Exelixis, Inc. | 10,586,903 | ||||||
| 288,660 | Galapagos NV ADR | 15,674,238 | ||||||
| 138,436 | Intellia Therapeutics, Inc. | 2,692,580 | ||||||
| 250,811 | Ophthotech Corp. | 13,245,329 | ||||||
| 327,069 | Otonomy, Inc. | 5,380,285 | ||||||
| 1,235,056 | Rigel Pharmaceuticals, Inc. | 4,162,139 | ||||||
| 296,969 | Ultragenyx Pharmaceutical, Inc. | 19,576,197 | ||||||
| 572,420 | Voyager Therapeutics, Inc. | 6,966,351 | ||||||
|
| |||||||
| 188,419,262 | ||||||||
|
| |||||||
| Building Products – 1.1% | ||||||||
| 453,982 | Fortune Brands Home & Security, Inc. | 28,855,096 | ||||||
|
| |||||||
| Capital Markets – 2.2% | ||||||||
| 315,929 | Affiliated Managers Group, Inc.* | 44,877,714 | ||||||
| 371,561 | Lazard Ltd. Class A | 13,758,904 | ||||||
|
| |||||||
| 58,636,618 | ||||||||
|
| |||||||
| Chemicals – 5.3% | ||||||||
| 409,356 | Ashland, Inc. | 47,927,401 | ||||||
| 1,017,481 | Axalta Coating Systems Ltd.* | 29,120,306 | ||||||
| 1,119,672 | RPM International, Inc. | 61,055,714 | ||||||
|
| |||||||
| 138,103,421 | ||||||||
|
| |||||||
| Commercial Services & Supplies – 1.9% | ||||||||
| 1,221,158 | Healthcare Services Group, Inc. | 49,298,148 | ||||||
|
| |||||||
| Consumer Finance* – 0.5% | ||||||||
| 1,867,782 | SLM Corp. | 13,849,603 | ||||||
|
| |||||||
| Containers & Packaging – 2.4% | ||||||||
| 818,069 | Avery Dennison Corp. | 63,351,263 | ||||||
|
| |||||||
| Diversified Telecommunication Services* – 3.6% | ||||||||
| 852,724 | Level 3 Communications, Inc. | 42,320,692 | ||||||
| 455,175 | SBA Communications Corp. Class A | 51,958,226 | ||||||
|
| |||||||
| 94,278,918 | ||||||||
|
| |||||||
| Common Stocks – (continued) | ||||||||
| Electrical Equipment – 3.0% | ||||||||
| 455,001 | AMETEK, Inc. | 22,181,299 | ||||||
| 180,898 | Hubbell, Inc. | 19,593,062 | ||||||
| 950,120 | Sensata Technologies Holding NV* | 36,180,570 | ||||||
|
| |||||||
| 77,954,931 | ||||||||
|
| |||||||
| Electronic Equipment, Instruments & Components – 1.4% | ||||||||
| 567,885 | Amphenol Corp. Class A | 35,384,914 | ||||||
|
| |||||||
| Energy Equipment & Services* – 0.4% | ||||||||
| 177,315 | Dril-Quip, Inc. | 9,853,395 | ||||||
|
| |||||||
| Food & Staples Retailing – 0.9% | ||||||||
| 787,105 | Whole Foods Market, Inc. | 23,912,250 | ||||||
|
| |||||||
| Food Products – 5.6% | ||||||||
| 1,262,830 | Blue Buffalo Pet Products, Inc.* | 32,555,758 | ||||||
| 380,751 | McCormick & Co., Inc. | 38,821,372 | ||||||
| 531,863 | The Hain Celestial Group, Inc.* | 19,545,965 | ||||||
| 585,851 | TreeHouse Foods, Inc.* | 55,497,665 | ||||||
|
| |||||||
| 146,420,760 | ||||||||
|
| |||||||
| Health Care Equipment & Supplies – 3.6% | ||||||||
| 174,170 | ABIOMED, Inc.* | 20,541,610 | ||||||
| 185,327 | C.R. Bard, Inc. | 40,927,615 | ||||||
| 179,005 | Teleflex, Inc. | 32,774,025 | ||||||
|
| |||||||
| 94,243,250 | ||||||||
|
| |||||||
| Health Care Providers & Services* – 5.3% | ||||||||
| 477,813 | Acadia Healthcare Co., Inc. | 24,459,247 | ||||||
| 424,560 | Adeptus Health, Inc. Class A | 18,069,274 | ||||||
| 220,859 | Henry Schein, Inc. | 36,174,496 | ||||||
| 853,100 | VCA, Inc. | 60,408,011 | ||||||
|
| |||||||
| 139,111,028 | ||||||||
|
| |||||||
| Health Care Technology* – 0.4% | ||||||||
| 444,580 | Evolent Health, Inc. Class A | 11,056,705 | ||||||
|
| |||||||
| Hotels, Restaurants & Leisure – 6.5% | ||||||||
| 73,905 | Chipotle Mexican Grill, Inc.* | 30,576,716 | ||||||
| 392,367 | Jack in the Box, Inc. | 39,024,822 | ||||||
| 281,229 | Panera Bread Co. Class A* | 61,068,877 | ||||||
| 271,360 | Shake Shack, Inc. Class A* | 9,579,008 | ||||||
| 638,667 | Wingstop, Inc. | 19,345,223 | ||||||
| 387,077 | Zoe’s Kitchen, Inc.* | 10,540,107 | ||||||
|
| |||||||
| 170,134,753 | ||||||||
|
| |||||||
| Household Durables*(a) – 1.1% | ||||||||
| 1,249,108 | M/I Homes, Inc. | 28,904,359 | ||||||
|
| |||||||
| Internet Software & Services* – 1.9% | ||||||||
| 1,200,781 | GoDaddy, Inc. Class A | 38,881,289 | ||||||
| 585,029 | Match Group, Inc. | 9,471,619 | ||||||
|
| |||||||
| 48,352,908 | ||||||||
|
| |||||||
| IT Services – 6.0% | ||||||||
| 1,156,072 | Black Knight Financial Services, Inc. Class A* | 45,109,929 | ||||||
| 195,349 | FleetCor Technologies, Inc.* | 32,076,306 | ||||||
|
| |||||||
| 80 | The accompanying notes are an integral part of these financial statements. |
GOLDMAN SACHS SMALL/MID CAP GROWTH FUND
| Shares | Description | Value | ||||||
| Common Stocks – (continued) | ||||||||
| IT Services – (continued) | ||||||||
| 419,321 | Global Payments, Inc. | $ | 31,847,430 | |||||
| 1,275,325 | InterXion Holding NV* | 47,569,623 | ||||||
|
| |||||||
| 156,603,288 | ||||||||
|
| |||||||
| Life Sciences Tools & Services – 3.2% | ||||||||
| 116,598 | Mettler-Toledo International, Inc.* | 46,997,156 | ||||||
| 678,089 | PerkinElmer, Inc. | 36,108,239 | ||||||
|
| |||||||
| 83,105,395 | ||||||||
|
| |||||||
| Machinery – 6.8% | ||||||||
| 339,848 | John Bean Technologies Corp. | 23,340,761 | ||||||
| 1,358,559 | Kornit Digital Ltd.* | 15,324,545 | ||||||
| 565,876 | The Middleby Corp.* | 72,517,009 | ||||||
| 1,292,579 | Xylem, Inc. | 65,740,568 | ||||||
|
| |||||||
| 176,922,883 | ||||||||
|
| |||||||
| Media* – 1.2% | ||||||||
| 564,247 | AMC Networks, Inc. Class A | 30,661,182 | ||||||
|
| |||||||
| Oil, Gas & Consumable Fuels* – 0.3% | ||||||||
| 62,748 | Concho Resources, Inc. | 8,107,042 | ||||||
|
| |||||||
| Pharmaceuticals* – 1.2% | ||||||||
| 754,385 | Cempra, Inc. | 16,551,207 | ||||||
| 1,551,906 | Corium International, Inc.(a) | 9,218,322 | ||||||
| 390,235 | Revance Therapeutics, Inc. | 5,482,802 | ||||||
|
| |||||||
| 31,252,331 | ||||||||
|
| |||||||
| Real Estate Management & Development – 1.5% | ||||||||
| 1,434,786 | HFF, Inc. Class A | 38,466,613 | ||||||
|
| |||||||
| Road & Rail – 0.5% | ||||||||
| 137,815 | Kansas City Southern | 13,329,467 | ||||||
|
| |||||||
| Semiconductors & Semiconductor Equipment* – 1.7% | ||||||||
| 444,710 | Cavium, Inc. | 24,761,453 | ||||||
| 326,482 | Qorvo, Inc. | 18,749,860 | ||||||
|
| |||||||
| 43,511,313 | ||||||||
|
| |||||||
| Software* – 5.3% | ||||||||
| 356,324 | Guidewire Software, Inc. | 21,924,616 | ||||||
| 391,379 | Mobileye NV | 19,134,519 | ||||||
| 241,594 | Red Hat, Inc. | 17,631,530 | ||||||
| 272,323 | ServiceNow, Inc. | 19,789,712 | ||||||
| 215,299 | Splunk, Inc. | 12,539,014 | ||||||
| 349,920 | Tableau Software, Inc. Class A | 20,305,858 | ||||||
| 163,484 | Tyler Technologies, Inc. | 26,803,202 | ||||||
|
| |||||||
| 138,128,451 | ||||||||
|
| |||||||
| Specialty Retail – 6.4% | ||||||||
| 86,924 | Advance Auto Parts, Inc. | 13,680,099 | ||||||
| 584,076 | Burlington Stores, Inc.* | 47,438,653 | ||||||
| 610,015 | Five Below, Inc.* | 27,182,268 | ||||||
| 431,331 | Tractor Supply Co. | 36,210,237 | ||||||
| 169,098 | Ulta Salon, Cosmetics & Fragrance, Inc.* | 41,802,717 | ||||||
|
| |||||||
| 166,313,974 | ||||||||
|
| |||||||
| Common Stocks – (continued) | ||||||||
| Technology Hardware, Storage & Peripherals* – 2.3% | ||||||||
| 1,254,972 | Electronics for Imaging, Inc. | 59,084,082 | ||||||
|
| |||||||
| Textiles, Apparel & Luxury Goods – 2.5% | ||||||||
| 2,181,351 | Kate Spade & Co.* | 40,704,010 | ||||||
| 126,390 | PVH Corp. | 13,619,786 | ||||||
| 287,570 | Under Armour, Inc. Class A* | 11,396,399 | ||||||
|
| |||||||
| 65,720,195 | ||||||||
|
| |||||||
| TOTAL COMMON STOCKS | ||||||||
| (Cost $2,169,739,897) | $ | 2,575,477,888 | ||||||
|
| |||||||
| Principal Amount | Interest Rate | Maturity Date | Value | |||||||
| Short-term Investment(b) – 1.2% | ||||||||||
| Repurchase Agreements – 1.2% | ||||||||||
Joint Repurchase Agreement Account II |
| |||||||||
| $30,400,000 | 0.334% | 09/01/16 | $ | 30,400,000 | ||||||
| (Cost $30,400,000) | ||||||||||
| ||||||||||
| TOTAL INVESTMENTS – 99.9% | ||||||||||
| (Cost $2,200,139,897) | $ | 2,605,877,888 | ||||||||
| ||||||||||
OTHER ASSETS IN EXCESS OF LIABILITIES – 0.1% |
| 2,953,334 | ||||||||
| ||||||||||
| NET ASSETS – 100.0% | $ | 2,608,831,222 | ||||||||
| ||||||||||
| The percentage shown for each investment category reflects the value of investments in that category as a percentage of net assets. | ||
* | Non-income producing security. | |
(a) | Represents an affiliated issuer. | |
(b) | Joint repurchase agreement was entered into on August 31, 2016. Additional information appears on pages 84-85. | |
| ||
Investment Abbreviations: | ||
ADR | —American Depositary Receipt | |
PLC | —Public Limited Company | |
| ||
| The accompanying notes are an integral part of these financial statements. | 81 |
GOLDMAN SACHS STRATEGIC GROWTH FUND
Schedule of Investments
August 31, 2016
| Shares | Description | Value | ||||||
| Common Stocks – 97.3% | ||||||||
| Aerospace & Defense – 1.0% | ||||||||
| 8,062 | Northrop Grumman Corp. | $ | 1,709,708 | |||||
| 13,500 | The Boeing Co. | 1,747,575 | ||||||
|
| |||||||
| 3,457,283 | ||||||||
|
| |||||||
| Banks – 0.5% | ||||||||
| 25,054 | First Republic Bank | 1,928,156 | ||||||
|
| |||||||
| Beverages – 3.0% | ||||||||
| 34,350 | Molson Coors Brewing Co. Class B | 3,514,692 | ||||||
| 164,791 | The Coca-Cola Co. | 7,156,873 | ||||||
|
| |||||||
| 10,671,565 | ||||||||
|
| |||||||
| Biotechnology – 4.0% | ||||||||
| 35,340 | Alexion Pharmaceuticals, Inc.* | 4,447,892 | ||||||
| 33,253 | Celgene Corp.* | 3,549,425 | ||||||
| 32,283 | Gilead Sciences, Inc. | 2,530,342 | ||||||
| 36,484 | Vertex Pharmaceuticals, Inc.* | 3,448,103 | ||||||
|
| |||||||
| 13,975,762 | ||||||||
|
| |||||||
| Building Products – 0.9% | ||||||||
| 52,242 | Fortune Brands Home & Security, Inc. | 3,320,502 | ||||||
|
| |||||||
| Capital Markets – 1.6% | ||||||||
| 20,005 | Intercontinental Exchange, Inc. | 5,641,810 | ||||||
|
| |||||||
| Chemicals – 2.1% | ||||||||
| 20,267 | Ashland, Inc. | 2,372,860 | ||||||
| 17,381 | The Sherwin-Williams Co. | 4,931,164 | ||||||
|
| |||||||
| 7,304,024 | ||||||||
|
| |||||||
| Energy Equipment & Services – 1.0% | ||||||||
| 80,052 | Halliburton Co. | 3,443,036 | ||||||
|
| |||||||
| Equity Real Estate Investment Trusts (REITs) – 4.7% | ||||||||
| 79,620 | American Tower Corp. | 9,027,316 | ||||||
| 20,707 | Equinix, Inc. | 7,633,635 | ||||||
|
| |||||||
| 16,660,951 | ||||||||
|
| |||||||
| Food & Staples Retailing – 4.3% | ||||||||
| 57,562 | Costco Wholesale Corp. | 9,330,225 | ||||||
| 55,467 | Walgreens Boots Alliance, Inc. | 4,476,742 | ||||||
| 50,896 | Whole Foods Market, Inc. | 1,546,220 | ||||||
|
| |||||||
| 15,353,187 | ||||||||
|
| |||||||
| Food Products – 1.2% | ||||||||
| 41,641 | McCormick & Co., Inc. | 4,245,716 | ||||||
|
| |||||||
| Health Care Equipment & Supplies – 5.0% | ||||||||
| 137,029 | Abbott Laboratories | 5,757,959 | ||||||
| 145,154 | Boston Scientific Corp.* | 3,457,568 | ||||||
| 50,635 | Danaher Corp. | 4,122,195 | ||||||
| 37,437 | Stryker Corp. | 4,329,964 | ||||||
|
| |||||||
| 17,667,686 | ||||||||
|
| |||||||
| Health Care Providers & Services – 2.1% | ||||||||
| 21,928 | Aetna, Inc. | 2,568,208 | ||||||
| 25,457 | McKesson Corp. | 4,699,871 | ||||||
|
| |||||||
| 7,268,079 | ||||||||
|
| |||||||
| Common Stocks – (continued) | ||||||||
| Health Care Technology* – 1.3% | ||||||||
| 70,723 | Cerner Corp. | $ | 4,564,462 | |||||
|
| |||||||
| Hotels, Restaurants & Leisure – 4.4% | ||||||||
| 7,259 | Chipotle Mexican Grill, Inc.* | 3,003,266 | ||||||
| 67,572 | McDonald’s Corp. | 7,815,377 | ||||||
| 83,511 | Starbucks Corp. | 4,695,824 | ||||||
|
| |||||||
| 15,514,467 | ||||||||
|
| |||||||
| Industrial Conglomerates – 5.1% | ||||||||
| 44,383 | 3M Co. | 7,955,209 | ||||||
| 64,843 | Honeywell International, Inc. | 7,567,826 | ||||||
| 14,361 | Roper Technologies, Inc. | 2,549,796 | ||||||
|
| |||||||
| 18,072,831 | ||||||||
|
| |||||||
| Internet & Direct Marketing Retail* – 5.9% | ||||||||
| 17,087 | Amazon.com, Inc. | 13,142,637 | ||||||
| 34,681 | Netflix, Inc. | 3,379,663 | ||||||
| 3,113 | The Priceline Group, Inc. | 4,410,281 | ||||||
|
| |||||||
| 20,932,581 | ||||||||
|
| |||||||
| Internet Software & Services* – 9.2% | ||||||||
| 13,802 | Alphabet, Inc. Class A | 10,901,510 | ||||||
| 10,493 | Alphabet, Inc. Class C | 8,048,656 | ||||||
| 107,512 | Facebook, Inc. Class A | 13,559,413 | ||||||
|
| |||||||
| 32,509,579 | ||||||||
|
| |||||||
| IT Services – 4.4% | ||||||||
| 52,168 | Fidelity National Information Services, Inc. | 4,138,487 | ||||||
| 22,168 | FleetCor Technologies, Inc.* | 3,639,986 | ||||||
| 79,594 | MasterCard, Inc. Class A | 7,691,168 | ||||||
|
| |||||||
| 15,469,641 | ||||||||
|
| |||||||
| Life Sciences Tools & Services – 0.7% | ||||||||
| 51,122 | Agilent Technologies, Inc. | 2,401,712 | ||||||
|
| |||||||
| Machinery – 1.9% | ||||||||
| 41,868 | Fortive Corp. | 2,205,188 | ||||||
| 85,712 | Xylem, Inc. | 4,359,312 | ||||||
|
| |||||||
| 6,564,500 | ||||||||
|
| |||||||
| Media – 2.4% | ||||||||
| 131,725 | Comcast Corp. Class A | 8,596,373 | ||||||
|
| |||||||
| Pharmaceuticals – 4.5% | ||||||||
| 27,876 | Allergan PLC* | 6,538,037 | ||||||
| 80,938 | Eli Lilly & Co. | 6,292,930 | ||||||
| 61,610 | Zoetis, Inc. | 3,148,271 | ||||||
|
| |||||||
| 15,979,238 | ||||||||
|
| |||||||
| Road & Rail – 1.0% | ||||||||
| 35,944 | Kansas City Southern | 3,476,504 | ||||||
|
| |||||||
| Semiconductors & Semiconductor Equipment* – 1.1% | ||||||||
| 46,246 | NXP Semiconductors NV | 4,070,573 | ||||||
|
| |||||||
| Software – 8.9% | ||||||||
| 60,925 | Electronic Arts, Inc.* | 4,948,938 | ||||||
| 44,623 | Intuit, Inc. | 4,973,233 | ||||||
|
| |||||||
| 82 | The accompanying notes are an integral part of these financial statements. |
GOLDMAN SACHS STRATEGIC GROWTH FUND
Shares | Description | Value | ||||||
| Common Stocks – (continued) | ||||||||
| Software – (continued) | ||||||||
| 199,180 | Microsoft Corp. | $ | 11,444,883 | |||||
| 29,225 | Mobileye NV* | 1,428,810 | ||||||
| 125,014 | Oracle Corp. | 5,153,077 | ||||||
| 45,936 | salesforce.com, Inc.* | 3,648,237 | ||||||
|
| |||||||
| 31,597,178 | ||||||||
|
| |||||||
| Specialty Retail – 3.5% | ||||||||
| 92,446 | Ross Stores, Inc. | 5,753,839 | ||||||
| 41,910 | The Home Depot, Inc. | 5,620,969 | ||||||
| 12,560 | Tractor Supply Co. | 1,054,412 | ||||||
|
| |||||||
| 12,429,220 | ||||||||
|
| |||||||
| Technology Hardware, Storage & Peripherals – 6.8% | ||||||||
| 225,361 | Apple, Inc. | 23,910,802 | ||||||
|
| |||||||
| Textiles, Apparel & Luxury Goods – 2.9% | ||||||||
| 111,863 | Kate Spade & Co.* | 2,087,364 | ||||||
| 105,513 | NIKE, Inc. Class B | 6,081,769 | ||||||
| 18,350 | PVH Corp. | 1,977,396 | ||||||
|
| |||||||
| 10,146,529 | ||||||||
|
| |||||||
| Tobacco – 1.9% | ||||||||
| 20,113 | Philip Morris International, Inc. | 2,009,892 | ||||||
| 92,851 | Reynolds American, Inc. | 4,602,624 | ||||||
|
| |||||||
| 6,612,516 | ||||||||
|
| |||||||
| TOTAL COMMON STOCKS | ||||||||
| (Cost $238,600,576) | $ | 343,786,463 | ||||||
|
| |||||||
| Principal Amount | Interest Rate | Maturity Date | Value | |||||||||
| Short-term Investment(a) – 2.1% | ||||||||||||
| Repurchase Agreements – 2.1% | ||||||||||||
Joint Repurchase Agreement Account II |
| |||||||||||
| $7,400,000 | 0.334% | 09/01/16 | $ | 7,400,000 | ||||||||
| (Cost $7,400,000) | ||||||||||||
| ||||||||||||
| TOTAL INVESTMENTS – 99.4% | ||||||||||||
| (Cost $246,000,576) | $ | 351,186,463 | ||||||||||
| ||||||||||||
| OTHER ASSETS IN EXCESS OF LIABILITIES – 0.6% | 2,153,645 | |||||||||||
| ||||||||||||
| NET ASSETS – 100.0% | $ | 353,340,108 | ||||||||||
| ||||||||||||
| The percentage shown for each investment category reflects the value of investments in that category as a percentage of net assets. | ||
* | Non-income producing security. | |
(a) | Joint repurchase agreement was entered into on August 31, 2016. Additional information appears on pages 84-85. | |
| ||
Investment Abbreviations: | ||
PLC | —Public Limited Company | |
| ||
| The accompanying notes are an integral part of these financial statements. | 83 |
GOLDMAN SACHS TECHNOLOGY OPPORTUNITIES FUND
Schedule of Investments
August 31, 2016
| Shares | Description | Value | ||||||
| Common Stocks – 96.5% | ||||||||
| Capital Markets – 1.5% | ||||||||
| 21,294 | Intercontinental Exchange, Inc. | $ | 6,005,334 | |||||
|
| |||||||
| Diversified Telecommunication Services* – 5.5% | ||||||||
| 187,491 | Level 3 Communications, Inc. | 9,305,178 | ||||||
| 103,974 | SBA Communications Corp. Class A | 11,868,632 | ||||||
|
| |||||||
| 21,173,810 | ||||||||
|
| |||||||
| Electronic Equipment, Instruments & Components – 3.4% | ||||||||
| 212,348 | Amphenol Corp. Class A | 13,231,404 | ||||||
|
| |||||||
| Equity Real Estate Investment Trusts (REITs) – 5.9% | ||||||||
| 117,924 | American Tower Corp. | 13,370,223 | ||||||
| 26,181 | Equinix, Inc. | 9,651,626 | ||||||
|
| |||||||
| 23,021,849 | ||||||||
|
| |||||||
| Internet & Direct Marketing Retail – 9.2% | ||||||||
| 28,918 | Amazon.com, Inc.* | 22,242,569 | ||||||
| 52,233 | Expedia, Inc. | 5,699,665 | ||||||
| 5,473 | The Priceline Group, Inc.* | 7,753,763 | ||||||
|
| |||||||
| 35,695,997 | ||||||||
|
| |||||||
| Internet Software & Services* – 16.0% | ||||||||
| 21,476 | Alphabet, Inc. Class A | 16,962,819 | ||||||
| 20,401 | Alphabet, Inc. Class C | 15,648,587 | ||||||
| 175,477 | Facebook, Inc. Class A | 22,131,159 | ||||||
| 30,938 | LinkedIn Corp. Class A | 5,963,299 | ||||||
| 72,122 | Match Group, Inc. | 1,167,655 | ||||||
|
| |||||||
| 61,873,519 | ||||||||
|
| |||||||
| IT Services – 11.8% | ||||||||
| 17,587 | Alliance Data Systems Corp.* | 3,597,948 | ||||||
| 190,379 | Black Knight Financial Services, Inc. Class A* | 7,428,589 | ||||||
| 97,677 | Cognizant Technology Solutions Corp. Class A* | 5,610,567 | ||||||
| 134,047 | Fidelity National Information Services, Inc. | 10,633,948 | ||||||
| 40,474 | FleetCor Technologies, Inc.* | 6,645,831 | ||||||
| 121,581 | MasterCard, Inc. Class A | 11,748,372 | ||||||
|
| |||||||
| 45,665,255 | ||||||||
|
| |||||||
| Semiconductors & Semiconductor Equipment – 11.4% | ||||||||
| 311,439 | Applied Materials, Inc. | 9,293,340 | ||||||
| 92,671 | Cavium, Inc.* | 5,159,921 | ||||||
| 180,865 | NXP Semiconductors NV* | 15,919,737 | ||||||
| 101,262 | Qorvo, Inc.* | 5,815,477 | ||||||
| 113,070 | Texas Instruments, Inc. | 7,862,888 | ||||||
|
| |||||||
| 44,051,363 | ||||||||
|
| |||||||
| Software – 22.4% | ||||||||
| 20,095 | Adobe Systems, Inc.* | 2,055,919 | ||||||
| 116,917 | Electronic Arts, Inc.* | 9,497,168 | ||||||
| 86,458 | Intuit, Inc. | 9,635,744 | ||||||
| 179,503 | Microsoft Corp. | 10,314,242 | ||||||
| 375,489 | Oracle Corp. | 15,477,657 | ||||||
| 63,199 | Red Hat, Inc.* | 4,612,263 | ||||||
| 124,117 | Salesforce.com, Inc.* | 9,857,372 | ||||||
|
| |||||||
| Common Stocks – (continued) | ||||||||
| Software – (continued) | ||||||||
| 148,070 | ServiceNow, Inc.* | 10,760,247 | ||||||
| 165,646 | Splunk, Inc.* | 9,647,223 | ||||||
| 60,621 | Workday, Inc. Class A* | 5,140,055 | ||||||
|
| |||||||
| 86,997,890 | ||||||||
|
| |||||||
| Technology Hardware, Storage & Peripherals – 9.4% | ||||||||
| 270,955 | Apple, Inc. | 28,748,326 | ||||||
| 159,989 | Electronics for Imaging, Inc.* | 7,532,282 | ||||||
|
| |||||||
| 36,280,608 | ||||||||
|
| |||||||
| TOTAL COMMON STOCKS | ||||||||
| (Cost $227,619,544) | $ | 373,997,029 | ||||||
|
| |||||||
| Principal Amount | Interest Rate | Maturity Date | Value | |||||||
| Short-term Investment(a) – 3.7% | ||||||||||
| Repurchase Agreements – 3.7% | ||||||||||
Joint Repurchase Agreement Account II |
| |||||||||
| $14,500,000 | 0.334% | 09/01/16 | $ | 14,500,000 | ||||||
| (Cost $14,500,000) | ||||||||||
| ||||||||||
| TOTAL INVESTMENTS – 100.2% | ||||||||||
| (Cost $242,119,544) | $ | 388,497,029 | ||||||||
| ||||||||||
LIABILITIES IN EXCESS OF OTHER ASSETS – (0.2)% |
| (884,727 | ) | |||||||
| ||||||||||
| NET ASSETS – 100.0% | $ | 387,612,302 | ||||||||
| ||||||||||
| The percentage shown for each investment category reflects the value of investments in that category as a percentage of net assets. | ||
* | Non-income producing security. | |
(a) | Joint repurchase agreement was entered into on August 31, 2016. Additional information appears on pages 84-85. | |
| 84 | The accompanying notes are an integral part of these financial statements. |
GOLDMAN SACHS FUNDAMENTAL EQUITY GROWTH FUNDS
Schedule of Investments
August 31, 2016 (Unaudited)
| ADDITIONAL INVESTMENT INFORMATION |
JOINT REPURCHASE AGREEMENT ACCOUNT II — At August 31, 2016, certain Funds had undivided interests in the Joint Repurchase Agreement Account II, with a maturity date of September 1, 2016, as follows:
| Fund | Principal Amount | Maturity Value | Collateral Allocation Value | |||||||||
Concentrated Growth | $ | 3,700,000 | $ | 3,700,034 | $ | 3,774,000 | ||||||
Flexible Cap Growth | 300,000 | 300,003 | 306,000 | |||||||||
Focused Growth | 200,000 | 200,002 | 204,000 | |||||||||
Small/Mid Cap Growth | 30,400,000 | 30,400,282 | 31,008,004 | |||||||||
Strategic Growth | 7,400,000 | 7,400,069 | 7,548,001 | |||||||||
Technology Opportunities | 14,500,000 | 14,500,135 | 14,790,002 | |||||||||
REPURCHASE AGREEMENTS — At August 31, 2016, the Principal Amounts of certain Funds’ interest in the Joint Repurchase Agreement Account II were as follows:
| Counterparty | Interest Rate | Concentrated Growth | Flexible Cap Growth | Focused Growth | Small/Mid Cap Growth | Strategic Growth | Technology Opportunities | |||||||||||||||||||||
BNP Paribas Securities Co. | 0.330 | % | $ | 8,612 | $ | 698 | $ | 466 | $ | 70,760 | $ | 17,225 | $ | 33,751 | ||||||||||||||
Citigroup Global Markets, Inc. | 0.340 | 509,355 | 41,299 | 27,533 | 4,184,970 | 1,018,710 | 1,996,121 | |||||||||||||||||||||
Merrill Lynch & Co., Inc. | 0.340 | 2,141,587 | 173,643 | 115,761 | 17,595,744 | 4,283,174 | 8,392,706 | |||||||||||||||||||||
Merrill Lynch & Co., Inc. | 0.320 | 1,040,446 | 84,360 | 56,240 | 8,548,526 | 2,080,891 | 4,077,422 | |||||||||||||||||||||
| TOTAL | $ | 3,700,000 | $ | 300,000 | $ | 200,000 | $ | 30,400,000 | $ | 7,400,000 | $ | 14,500,000 | ||||||||||||||||
At August 31, 2016, the Joint Repurchase Agreement Account II was fully collateralized by:
| Issuer | Interest Rates | Maturity Dates | ||||||
Federal Home Loan Mortgage Corp. | 3.000% to 5.000 | % | 12/01/29 to 01/01/46 | |||||
Federal National Mortgage Association | 2.500 to 5.630 | 07/01/19 to 09/01/46 | ||||||
Government National Mortgage Association | 3.000 to 5.500 | 02/15/39 to 04/20/44 | ||||||
United States Treasury Bills | 0.000 | 09/08/16 to 03/02/17 | ||||||
United States Treasury Notes | 0.750 to 1.750 | 01/15/18 to 05/15/23 | ||||||
| The accompanying notes are an integral part of these financial statements. | 85 |
GOLDMAN SACHS FUNDAMENTAL EQUITY GROWTH FUNDS
Statements of Assets and Liabilities
August 31, 2016
| Capital Growth Fund | ||||||
| Assets: | ||||||
Investments of unaffiliated issuers, at value (cost $611,255,339, $108,681,794, $5,697,314, $12,463,097, $20,954,587, $2,488,640,137, $2,161,574,466, $246,000,576 and $242,119,544) | $ | 839,353,555 | ||||
Investments of affiliated issuers, at value (cost $7,550,880, $0, $0, $0, $0, $651, $38,565,431, $0 and $0) | 7,550,880 | |||||
Cash | 3,275,698 | |||||
Receivables: | ||||||
Investments sold | 1,392,725 | |||||
Dividends and interest | 1,116,734 | |||||
Reimbursement from investment adviser | 62,749 | |||||
Fund shares sold | 49,277 | |||||
Foreign tax reclaims | 44,457 | |||||
Prepaid Expenses | — | |||||
Other assets | 9,402 | |||||
| Total assets | 852,855,477 | |||||
| Liabilities: | ||||||
Due to custodian | — | |||||
Payables: | ||||||
Investments purchased | 1,341,071 | |||||
Fund shares redeemed | 644,597 | |||||
Management fees | 516,589 | |||||
Distribution and Service fees and Transfer Agency fees | 316,235 | |||||
Payable to investment advisor | — | |||||
Accrued expenses | 226,053 | |||||
| Total liabilities | 3,044,545 | |||||
| Net Assets: | ||||||
Paid-in capital | 612,524,260 | |||||
Undistributed (distributions in excess of) net investment income | 979,312 | |||||
Accumulated net realized gain (loss) | 8,209,144 | |||||
Net unrealized gain | 228,098,216 | |||||
| NET ASSETS | $ | 849,810,932 | ||||
Net Assets: | ||||||
Class A | $ | 630,090,754 | ||||
Class C | 68,959,604 | |||||
Institutional | 141,442,039 | |||||
Service | 1,561,313 | |||||
Class IR | 4,297,004 | |||||
Class R | 3,450,346 | |||||
Class R6 | 9,872 | |||||
Total Net Assets | $ | 849,810,932 | ||||
Shares Outstanding $0.001 par value (unlimited number of shares authorized): | ||||||
Class A | 26,093,835 | |||||
Class C | 3,691,584 | |||||
Institutional | 5,368,364 | |||||
Service | 66,725 | |||||
Class IR | 175,556 | |||||
Class R | 147,169 | |||||
Class R6 | 375 | |||||
Net asset value, offering and redemption price per share:(a) | ||||||
Class A | $24.15 | |||||
Class C | 18.68 | |||||
Institutional | 26.35 | |||||
Service | 23.40 | |||||
Class IR | 24.48 | |||||
Class R | 23.44 | |||||
Class R6 | 26.34 | (b) | ||||
| (a) | Maximum public offering price per share for Class A Shares of the Capital Growth, Concentrated Growth, Dynamic U.S. Equity, Flexible Cap Growth, Focused Growth, Growth Opportunities, Small/Mid Cap Growth, Strategic Growth and Technology Opportunities Funds is $25.56, $15.94, $13.84, $12.42, $14.89, $22.96, $21.01, $12.60 and $19.82, respectively. At redemption, Class C Shares may be subject to a contingent deferred sales charge, assessed on the amount equal to the lesser of the current net asset value (“NAV”) or the original purchase price of the shares. |
| (b) | Net asset value per share is calculated using unrounded outstanding shares. |
| 86 | The accompanying notes are an integral part of these financial statements. |
GOLDMAN SACHS FUNDAMENTAL EQUITY GROWTH FUNDS
| Concentrated Growth Fund | Dynamic U.S. Equity Fund | Flexible Cap Growth Fund | Focused Growth Fund | Growth Opportunities Fund | Small/Mid Cap Growth Fund | Strategic Growth Fund | Technology Opportunities Fund | |||||||||||||||||||||||||||||||||||||||||
$ | 145,563,494 |
| $ | 7,248,017 | $ | 16,963,084 | $ | 24,632,162 | $ | 3,156,901,538 | $ | 2,567,755,207 | $ | 351,186,463 | $ | 388,497,029 | ||||||||||||||||||||||||||||||||
| — | — | — | — | 651 | 38,122,681 | — | — | |||||||||||||||||||||||||||||||||||||||||
| 33,447 | 30,285 | 75,762 | 55,384 | — | 16,815 | 17,275 | 2,678 | |||||||||||||||||||||||||||||||||||||||||
| — | — | — | — | 82,375,704 | 11,258,409 | 22,463,145 | — | |||||||||||||||||||||||||||||||||||||||||
| 170,267 | 15,710 | 16,671 | 31,384 | 2,042,825 | 880,105 | 479,595 | 155,297 | |||||||||||||||||||||||||||||||||||||||||
| 32,700 | — | 26,645 | — | 15,986 | — | 56,148 | 29,205 | |||||||||||||||||||||||||||||||||||||||||
| 148,609 | — | 215 | 90,000 | 2,723,430 | 2,537,671 | 393,924 | 110,073 | |||||||||||||||||||||||||||||||||||||||||
| 2,361 | 233 | — | — | — | — | 31,343 | — | |||||||||||||||||||||||||||||||||||||||||
| — | 69,533 | — | — | — | — | — | — | |||||||||||||||||||||||||||||||||||||||||
| 791 | 3,218 | 3,505 | 2,919 | 7,321 | 5,996 | 876 | 869 | |||||||||||||||||||||||||||||||||||||||||
| 145,951,669 | 7,366,996 | 17,085,882 | 24,811,849 | 3,244,067,455 | 2,620,576,884 | 374,628,769 | 388,795,151 | |||||||||||||||||||||||||||||||||||||||||
| — | — | — | — | 225,486 | — | — | — | |||||||||||||||||||||||||||||||||||||||||
| 388,507 | — | — | 93,818 | 27,620,572 | 4,335,047 | 568,581 | — | |||||||||||||||||||||||||||||||||||||||||
| 1,282,283 | 4,148 | 5,878 | 8,803 | 10,935,530 | 4,555,375 | 20,328,851 | 541,852 | |||||||||||||||||||||||||||||||||||||||||
| 97,470 | 4,363 | 11,323 | 16,291 | 2,525,170 | 1,896,628 | 228,026 | 328,346 | |||||||||||||||||||||||||||||||||||||||||
| 9,469 | 1,218 | 4,175 | 1,126 | 807,936 | 908,809 | 39,919 | 144,818 | |||||||||||||||||||||||||||||||||||||||||
| — | 8,228 | — | — | — | — | — | — | |||||||||||||||||||||||||||||||||||||||||
| 107,823 | 90,583 | 88,618 | 79,590 | 65,747 | 49,803 | 123,284 | 167,833 | |||||||||||||||||||||||||||||||||||||||||
| 1,885,552 | 108,540 | 109,994 | 199,628 | 42,180,441 | 11,745,662 | 21,288,661 | 1,182,849 | |||||||||||||||||||||||||||||||||||||||||
| 109,100,950 | 6,071,860 | 12,567,116 | 22,379,420 | 2,504,201,198 | 2,162,413,824 | 246,772,242 | 226,798,265 | |||||||||||||||||||||||||||||||||||||||||
| 609,650 | 55,441 | (5,278 | ) | 162,001 | (7,887,321 | ) | (10,953,820 | ) | 2,008,192 | (1,944,623 | ) | |||||||||||||||||||||||||||||||||||||
| (2,526,183 | ) | (419,548 | ) | (85,937 | ) | (1,606,775 | ) | 37,311,736 | 51,633,227 | (626,213 | ) | 16,381,175 | ||||||||||||||||||||||||||||||||||||
| 36,881,700 | 1,550,703 | 4,499,987 | 3,677,575 | 668,261,401 | 405,737,991 | 105,185,887 | 146,377,485 | |||||||||||||||||||||||||||||||||||||||||
| $ | 144,066,117 | $ | 7,258,456 | $ | 16,975,888 | $ | 24,612,221 | $ | 3,201,887,014 | $ | 2,608,831,222 | $ | 353,340,108 | $ | 387,612,302 | |||||||||||||||||||||||||||||||||
| $ | 6,572,708 | $ | 2,124,227 | $ | 5,927,472 | $ | 243,058 | $ | 631,053,234 | $ | 736,220,654 | $ | 46,092,957 | $ | 233,096,763 | |||||||||||||||||||||||||||||||||
| 2,191,960 | 195,241 | 1,474,268 | 169,261 | 128,788,311 | 265,282,356 | 11,102,681 | 52,842,516 | |||||||||||||||||||||||||||||||||||||||||
| 134,817,537 | 4,754,382 | 9,329,741 | 24,115,560 | 2,160,713,725 | 1,235,282,198 | 294,952,120 | 83,745,917 | |||||||||||||||||||||||||||||||||||||||||
| — | — | — | — | 37,431,658 | 13,955,808 | 271,961 | 11,186,033 | |||||||||||||||||||||||||||||||||||||||||
| 451,584 | 155,801 | 197,454 | 57,600 | 135,929,951 | 313,812,480 | 829,037 | 6,741,073 | |||||||||||||||||||||||||||||||||||||||||
| 22,453 | 19,035 | 37,159 | 16,885 | 63,105,291 | 34,492,660 | 81,328 | — | |||||||||||||||||||||||||||||||||||||||||
| 9,875 | 9,770 | 9,794 | 9,857 | 44,864,844 | 9,785,066 | 10,024 | — | |||||||||||||||||||||||||||||||||||||||||
| $ | 144,066,117 | $ | 7,258,456 | $ | 16,975,888 | $ | 24,612,221 | $ | 3,201,887,014 | $ | 2,608,831,222 | $ | 353,340,108 | $ | 387,612,302 | |||||||||||||||||||||||||||||||||
| 436,501 | 162,410 | 504,881 | 17,280 | 29,080,532 | 37,093,950 | 3,871,619 | 12,444,901 | |||||||||||||||||||||||||||||||||||||||||
| 170,700 | 15,385 | 137,664 | 12,437 | 7,797,797 | 14,949,628 | 1,110,673 | 3,287,935 | |||||||||||||||||||||||||||||||||||||||||
| 8,456,328 | 361,032 | 755,217 | 1,691,348 | 87,252,201 | 59,139,007 | 23,336,767 | 4,128,218 | |||||||||||||||||||||||||||||||||||||||||
| — | — | — | — | 1,789,098 | 717,226 | 22,952 | 606,717 | |||||||||||||||||||||||||||||||||||||||||
| 29,550 | 11,843 | 16,236 | 4,048 | 6,050,848 | 15,393,619 | 65,637 | 335,727 | |||||||||||||||||||||||||||||||||||||||||
| 1,533 | 1,454 | 3,254 | 1,209 | 3,005,779 | 1,783,865 | 6,919 | — | |||||||||||||||||||||||||||||||||||||||||
| 619 | 742 | 793 | 691 | 1,811,428 | 468,334 | 793 | — | |||||||||||||||||||||||||||||||||||||||||
| $15.06 | $13.08 | $11.74 | $14.07 | $21.70 | $19.85 | $11.91 | $18.73 | |||||||||||||||||||||||||||||||||||||||||
| 12.84 | 12.69 | 10.71 | 13.61 | 16.52 | 17.75 | 10.00 | 16.07 | |||||||||||||||||||||||||||||||||||||||||
| 15.94 | 13.17 | 12.35 | 14.26 | 24.76 | 20.89 | 12.64 | 20.29 | |||||||||||||||||||||||||||||||||||||||||
| — | — | — | — | 20.92 | 19.46 | 11.85 | 18.44 | |||||||||||||||||||||||||||||||||||||||||
| 15.28 | 13.16 | 12.16 | 14.23 | 22.46 | 20.39 | 12.63 | 20.08 | |||||||||||||||||||||||||||||||||||||||||
| 14.65 | 13.09 | 11.42 | 13.97 | 20.99 | 19.34 | 11.75 | — | |||||||||||||||||||||||||||||||||||||||||
| 15.95 | 13.17 | 12.35 | 14.26 | 24.77 | 20.89 | 12.63 | (b) | — | ||||||||||||||||||||||||||||||||||||||||
| The accompanying notes are an integral part of these financial statements. | 87 |
GOLDMAN SACHS FUNDAMENTAL EQUITY GROWTH FUNDS
Statements of Operations
For the Fiscal Year Ended August 31, 2016
| Capital Growth Fund | ||||||
| Investment income: | ||||||
Dividends — unaffiliated issuers (net of foreign withholding taxes of $0, $0, $0, $0, $0, $0, $9,043, $0 and $0) | $ | 11,000,185 | ||||
Dividends — affiliated issuers | 2,704 | |||||
Interest | 13,644 | |||||
| Total investment income | 11,016,533 | |||||
| Expenses: | ||||||
Management fees | 8,743,651 | |||||
Distribution and Service fees(a) | 2,334,201 | |||||
Transfer Agency fees(a) | 1,431,105 | |||||
Printing and mailing costs | 204,553 | |||||
Registration fees | 124,266 | |||||
Custody, accounting and administrative services | 103,868 | |||||
Professional fees | 96,949 | |||||
Trustee fees | 25,671 | |||||
Service Share fees — Service Plan | 4,259 | |||||
Service Share fees — Shareholder Administration Plan | 4,259 | |||||
Other | 32,189 | |||||
| Total expenses | 13,104,971 | |||||
Less — expense reductions | (3,089,666 | ) | ||||
| Net expenses | 10,015,305 | |||||
| NET INVESTMENT INCOME (LOSS) | 1,001,228 | |||||
| Realized and unrealized gain (loss): | ||||||
Net realized gain from: | ||||||
Investments — unaffiliated issuers (including commission recapture of $24,192, $10,166, $112, $462, $1,379, $249,082, $1,714, $13,681 and $8,964) | 12,702,788 | |||||
Investments — affiliated issuers | — | |||||
Net change in unrealized gain on: | ||||||
Investments — unaffiliated issuers | 32,983,438 | |||||
Investments — affiliated issuers | — | |||||
| Net realized and unrealized gain (loss) | 45,686,226 | |||||
| NET INCREASE (DECREASE) IN NET ASSETS RESULTING FROM OPERATIONS | $ | 46,687,454 | ||||
| (a) | Class specific Distribution and Service and Transfer Agency fees were as follows: |
| Distribution and Service Fees | Transfer Agency Fees | |||||||||||||||||||||||||||||||||||||||
Fund | Class A | Class C | Class R | Class A | Class C | Institutional | Service | Class IR | Class R | Class R6 | ||||||||||||||||||||||||||||||
Capital Growth | $ | 1,604,636 | $ | 710,688 | $ | 18,877 | $ | 1,219,523 | $ | 135,031 | $ | 60,698 | $ | 682 | $ | 7,995 | $ | 7,173 | $ | 3 | ||||||||||||||||||||
Concentrated Growth | 17,420 | 27,695 | 148 | 13,239 | 5,262 | 58,140 | — | 649 | 57 | 3 | ||||||||||||||||||||||||||||||
Dynamic U.S. Equity | 6,799 | 3,143 | 318 | 5,167 | 597 | 2,981 | — | 843 | 121 | 3 | ||||||||||||||||||||||||||||||
Flexible Cap Growth | 16,860 | 17,127 | 190 | 12,814 | 3,254 | 3,463 | — | 300 | 72 | 3 | ||||||||||||||||||||||||||||||
Focused Growth | 627 | 1,824 | 82 | 477 | 347 | 11,575 | — | 48 | 31 | 3 | ||||||||||||||||||||||||||||||
Growth Opportunities | 1,839,002 | 1,420,837 | 345,943 | 1,397,641 | 269,959 | 1,028,486 | 16,595 | 286,533 | 131,458 | 3,615 | ||||||||||||||||||||||||||||||
Small/Mid Cap Growth | 2,104,138 | 2,621,808 | 169,643 | 1,599,145 | 498,144 | 509,892 | 5,129 | 524,086 | 64,464 | 692 | ||||||||||||||||||||||||||||||
Strategic Growth | 114,651 | 112,334 | 368 | 87,135 | 21,343 | 136,327 | 95 | 1,551 | 140 | 3 | ||||||||||||||||||||||||||||||
Technology Opportunities | 594,121 | 520,635 | — | 451,532 | 98,921 | 34,051 | 4,367 | 11,749 | — | — | ||||||||||||||||||||||||||||||
| 88 | The accompanying notes are an integral part of these financial statements. |
GOLDMAN SACHS FUNDAMENTAL EQUITY GROWTH FUNDS
| Concentrated Growth Fund | Dynamic U.S. Equity Fund | Flexible Cap Growth Fund | Focused Growth Fund | Growth Opportunities Fund | Small/Mid Cap Growth Fund | Strategic Growth Fund | Technology Opportunities Fund | |||||||||||||||||||||||||||||||||||||||||
| $ | 1,934,864 | $ | 209,888 | $ | 176,168 | $ | 403,304 | $ | 31,456,983 | $ | 15,450,411 | $ | 5,336,599 | $ | 3,117,201 | |||||||||||||||||||||||||||||||||
| — | — | — | — | 74,156 | — | — | — | |||||||||||||||||||||||||||||||||||||||||
| 7,430 | 720 | 601 | 2,110 | — | 151,170 | 28,247 | 10,409 | |||||||||||||||||||||||||||||||||||||||||
| 1,942,294 | 210,608 | 176,769 | 405,414 | 31,531,139 | 15,601,581 | 5,364,846 | 3,127,610 | |||||||||||||||||||||||||||||||||||||||||
| 1,554,684 | 77,022 | 173,197 | 294,220 | 35,556,108 | 26,341,537 | 3,990,481 | 3,919,399 | |||||||||||||||||||||||||||||||||||||||||
| 45,263 | 10,260 | 34,177 | 2,533 | 3,605,782 | 4,895,589 | 227,353 | 1,114,756 | |||||||||||||||||||||||||||||||||||||||||
| 77,350 | 9,712 | 19,906 | 12,481 | 3,134,287 | 3,201,552 | 246,594 | 600,620 | |||||||||||||||||||||||||||||||||||||||||
| 44,034 | 35,032 | 34,634 | 29,697 | 436,564 | 373,366 | 66,888 | 160,563 | |||||||||||||||||||||||||||||||||||||||||
| 91,421 | 60,005 | 76,110 | 72,042 | 191,083 | 268,551 | 121,736 | 88,453 | |||||||||||||||||||||||||||||||||||||||||
| 42,017 | 36,037 | 52,186 | 43,889 | 223,213 | 203,052 | 71,947 | 66,067 | |||||||||||||||||||||||||||||||||||||||||
| 82,913 | 107,603 | 89,663 | 84,116 | 88,651 | 41,074 | 104,834 | 81,702 | |||||||||||||||||||||||||||||||||||||||||
| 22,797 | 23,080 | 23,081 | 23,165 | 34,475 | 30,992 | 24,253 | 24,267 | |||||||||||||||||||||||||||||||||||||||||
| — | — | — | — | 103,718 | 32,055 | 592 | 27,292 | |||||||||||||||||||||||||||||||||||||||||
| — | — | — | — | 103,718 | 32,055 | 592 | 27,292 | |||||||||||||||||||||||||||||||||||||||||
| 10,396 | 6,294 | 6,916 | 3,853 | 103,737 | 130,855 | 15,262 | 13,302 | |||||||||||||||||||||||||||||||||||||||||
| 1,970,875 | 365,045 | 509,870 | 565,996 | 43,581,336 | 35,550,678 | 4,870,532 | 6,123,713 | |||||||||||||||||||||||||||||||||||||||||
| (629,389 | ) | (258,810 | ) | (320,002 | ) | (321,714 | ) | (2,954,658 | ) | (3,631,882 | ) | (1,546,198 | ) | (301,094 | ) | |||||||||||||||||||||||||||||||||
| 1,341,486 | 106,235 | 189,868 | 244,282 | 40,626,678 | 31,918,796 | 3,324,334 | 5,822,619 | |||||||||||||||||||||||||||||||||||||||||
| 600,808 | 104,373 | (13,099 | ) | 161,132 | (9,095,539 | ) | (16,317,215 | ) | 2,040,512 | (2,695,009 | ) | |||||||||||||||||||||||||||||||||||||
| | (2,449,540 | ) | (63,632 | ) | 193,770 | (1,517,766 | ) | 143,274,021 | 53,483,445 | 1,548,451 | 18,604,630 | |||||||||||||||||||||||||||||||||||||
| — | — | — | — | — | (1,228,406 | ) | — | — | ||||||||||||||||||||||||||||||||||||||||
| 9,687,706 | 332,852 | 596,395 | 2,432,571 | (51,072,627 | ) | (67,135,629 | ) | 21,597,125 | 31,771,257 | |||||||||||||||||||||||||||||||||||||||
| — | — | — | — | — | (4,499,189 | ) | — | — | ||||||||||||||||||||||||||||||||||||||||
| 7,238,166 | 269,220 | 790,165 | 914,805 | 92,201,394 | (19,379,779 | ) | 23,145,576 | 50,375,887 | ||||||||||||||||||||||||||||||||||||||||
| $ | 7,838,974 | $ | 373,593 | $ | 777,066 | $ | 1,075,937 | $ | 83,105,855 | $ | (35,696,994 | ) | $ | 25,186,088 | $ | 47,680,878 | ||||||||||||||||||||||||||||||||
| The accompanying notes are an integral part of these financial statements. | 89 |
GOLDMAN SACHS FUNDAMENTAL EQUITY GROWTH FUNDS
Statements of Changes in Net Assets
| Capital Growth Fund | ||||||||||
| For the Fiscal Year Ended August 31, 2016 | For the Fiscal Year Ended August 31, 2015 | |||||||||
| From operations: | ||||||||||
Net investment income (loss) | $ | 1,001,228 | $ | 424,086 | ||||||
Net realized gain (loss) | 12,702,788 | 106,908,367 | ||||||||
Net change in unrealized gain (loss) | 32,983,438 | (73,811,938 | ) | |||||||
| Net increase (decrease) in net assets resulting from operations | 46,687,454 | 33,520,515 | ||||||||
| Distributions to shareholders: | ||||||||||
From net investment income | ||||||||||
Class A Shares | — | — | ||||||||
Class C Shares | — | — | ||||||||
Institutional Shares | (262,248 | ) | — | |||||||
Service Shares | — | — | ||||||||
Class IR Shares | (3,425 | ) | — | |||||||
Class R Shares | — | — | ||||||||
Class R6 Shares(a) | (18 | ) | — | |||||||
From net realized gains | ||||||||||
Class A Shares | (53,960,173 | ) | (109,107,619 | ) | ||||||
Class C Shares | (7,608,296 | ) | (14,781,808 | ) | ||||||
Institutional Shares | (13,105,149 | ) | (22,936,412 | ) | ||||||
Service Shares | (152,819 | ) | (181,082 | ) | ||||||
Class IR Shares | (374,339 | ) | (451,620 | ) | ||||||
Class R Shares | (304,242 | ) | (557,137 | ) | ||||||
Class R6 Shares(a) | (712 | ) | — | |||||||
| Total distributions to shareholders | (75,771,421 | ) | (148,015,678 | ) | ||||||
| From share transactions: | ||||||||||
Proceeds from sales of shares | 34,992,956 | 82,471,266 | ||||||||
Reinvestment of distributions | 71,646,769 | 140,089,222 | ||||||||
Cost of shares redeemed | (155,817,837 | ) | (134,901,119 | ) | ||||||
| Net increase (decrease) in net assets resulting from share transactions | (49,178,112 | ) | 87,659,369 | |||||||
| TOTAL INCREASE (DECREASE) | (78,262,079 | ) | (26,835,794 | ) | ||||||
| Net assets: | ||||||||||
Beginning of year | 928,073,011 | 954,908,805 | ||||||||
End of year | $ | 849,810,932 | $ | 928,073,011 | ||||||
| Undistributed net investment income | $ | 979,312 | $ | 285,471 | ||||||
| (a) | Commenced operations on July 31, 2015. |
| 90 | The accompanying notes are an integral part of these financial statements. |
GOLDMAN SACHS FUNDAMENTAL EQUITY GROWTH FUNDS
| Concentrated Growth Fund | Dynamic U.S. Equity Fund | |||||||||||||||||||||
| For the Fiscal Year Ended August 31, 2016 | For the Fiscal Year Ended August 31, 2015 | For the Fiscal Year Ended August 31, 2016 | For the Fiscal Year Ended August 31, 2015 | |||||||||||||||||||
| $ | 600,808 | $ | 686,366 | $ | 104,373 | $ | 109,603 | |||||||||||||||
| (2,449,540 | ) | 20,209,855 | (63,632 | ) | 1,495,944 | |||||||||||||||||
| 9,687,706 | (14,930,145 | ) | 332,852 | (1,792,239 | ) | |||||||||||||||||
| 7,838,974 | 5,966,076 | 373,593 | (186,692 | ) | ||||||||||||||||||
| — | — | (17,622 | ) | (22,274 | ) | |||||||||||||||||
| — | — | — | — | |||||||||||||||||||
| (373,404 | ) | (366,604 | ) | (103,664 | ) | (71,169 | ) | |||||||||||||||
| — | — | — | — | |||||||||||||||||||
| (483 | ) | (283 | ) | (2,981 | ) | (1,481 | ) | |||||||||||||||
| — | — | — | (255 | ) | ||||||||||||||||||
| (26 | ) | — | (102 | ) | — | |||||||||||||||||
| (842,410 | ) | (1,407,056 | ) | (290,672 | ) | (745,006 | ) | |||||||||||||||
| (395,561 | ) | (700,153 | ) | (33,918 | ) | (46,987 | ) | |||||||||||||||
| (16,282,694 | ) | (28,939,818 | ) | (976,319 | ) | (1,330,442 | ) | |||||||||||||||
| — | — | — | — | |||||||||||||||||||
| (36,485 | ) | (67,917 | ) | (40,105 | ) | (33,295 | ) | |||||||||||||||
| (3,308 | ) | (2,664 | ) | (5,478 | ) | (17,289 | ) | |||||||||||||||
| (1,002 | ) | — | (901 | ) | — | |||||||||||||||||
| (17,935,373 | ) | (31,484,495 | ) | (1,471,762 | ) | (2,268,198 | ) | |||||||||||||||
| 6,131,931 | 10,807,640 | 1,218,198 | 4,955,313 | |||||||||||||||||||
| 17,572,644 | 30,851,758 | 1,161,930 | 2,266,646 | |||||||||||||||||||
| (36,526,581 | ) | (30,269,597 | ) | (9,246,741 | ) | (3,643,418 | ) | |||||||||||||||
| (12,822,006 | ) | 11,389,801 | (6,866,613 | ) | 3,578,541 | |||||||||||||||||
| (22,918,405 | ) | (14,128,618 | ) | (7,964,782 | ) | 1,123,651 | ||||||||||||||||
| 166,984,522 | 181,113,140 | 15,223,238 | 14,099,587 | |||||||||||||||||||
| $ | 144,066,117 | $ | 166,984,522 | $ | 7,258,456 | $ | 15,223,238 | |||||||||||||||
| $ | 609,650 | $ | 379,267 | $ | 55,441 | $ | 75,674 | |||||||||||||||
| The accompanying notes are an integral part of these financial statements. | 91 |
GOLDMAN SACHS FUNDAMENTAL EQUITY GROWTH FUNDS
Statements of Changes in Net Assets (continued)
| Flexible Cap Growth Fund | ||||||||||
| For the Fiscal Year Ended August 31, 2016 | For the Fiscal Year Ended August 31, 2015 | |||||||||
| From operations: | ||||||||||
Net investment income (loss) | $ | (13,099 | ) | $ | (29,361 | ) | ||||
Net realized gain (loss) | 193,770 | 1,341,552 | ||||||||
Net change in unrealized gain (loss) | 596,395 | (561,111 | ) | |||||||
| Net increase (decrease) in net assets resulting from operations | 777,066 | 751,080 | ||||||||
| Distributions to shareholders: | ||||||||||
From net investment income | ||||||||||
Class A Shares | — | — | ||||||||
Class C Shares | — | — | ||||||||
Institutional Shares | — | — | ||||||||
Service Shares | — | — | ||||||||
Class IR Shares | — | — | ||||||||
Class R Shares | — | — | ||||||||
Class R6 Shares(a) | — | — | ||||||||
From net realized gains | ||||||||||
Class A Shares | (458,035 | ) | (897,010 | ) | ||||||
Class C Shares | (116,932 | ) | (182,809 | ) | ||||||
Institutional Shares | (497,675 | ) | (1,118,730 | ) | ||||||
Service Shares | — | — | ||||||||
Class IR Shares | (13,475 | ) | (32,793 | ) | ||||||
Class R Shares | (2,254 | ) | (8,089 | ) | ||||||
Class R6 Shares(a) | (544 | ) | — | |||||||
| Total distributions to shareholders | (1,088,915 | ) | (2,239,431 | ) | ||||||
| From share transactions: | ||||||||||
Proceeds from sales of shares | 3,195,796 | 5,135,583 | ||||||||
Reinvestment of distributions | 1,088,915 | 2,237,814 | ||||||||
Cost of shares redeemed | (4,728,552 | ) | (3,380,014 | ) | ||||||
| Net increase (decrease) in net assets resulting from share transactions | (443,841 | ) | 3,993,383 | |||||||
| TOTAL INCREASE (DECREASE) | (755,690 | ) | 2,505,032 | |||||||
| Net assets: | ||||||||||
Beginning of year | 17,731,578 | 15,226,546 | ||||||||
End of year | $ | 16,975,888 | $ | 17,731,578 | ||||||
| Undistributed (distributions in excess of) net investment income (loss) | $ | (5,278 | ) | $ | (16,820 | ) | ||||
| (a) | Commenced operations on July 31, 2015. |
| 92 | The accompanying notes are an integral part of these financial statements. |
GOLDMAN SACHS FUNDAMENTAL EQUITY GROWTH FUNDS
| Focused Growth Fund | Growth Opportunities Fund | |||||||||||||||||||||
| For the Fiscal Year Ended August 31, 2016 | For the Fiscal Year Ended August 31, 2015 | For the Fiscal Year Ended August 31, 2016 | For the Fiscal Year Ended August 31, 2015 | |||||||||||||||||||
| $ | 161,132 | $ | 136,615 | $ | (9,095,539 | ) | $ | (19,979,892 | ) | |||||||||||||
| (1,517,766 | ) | 1,794,517 | 143,274,021 | 540,219,024 | ||||||||||||||||||
| 2,432,571 | (809,233 | ) | (51,072,627 | ) | (555,005,131 | ) | ||||||||||||||||
| 1,075,937 | 1,121,899 | 83,105,855 | (34,765,999 | ) | ||||||||||||||||||
| (451 | ) | — | — | — | ||||||||||||||||||
| (262 | ) | — | — | — | ||||||||||||||||||
| (76,800 | ) | (76,654 | ) | — | — | |||||||||||||||||
| — | — | — | — | |||||||||||||||||||
| (21 | ) | (18 | ) | — | — | |||||||||||||||||
| — | — | — | — | |||||||||||||||||||
| (24 | ) | — | — | — | ||||||||||||||||||
| (14,231 | ) | (3,858 | ) | (97,819,695 | ) | (213,956,510 | ) | |||||||||||||||
| (14,215 | ) | (2,722 | ) | (23,532,032 | ) | (45,806,967 | ) | |||||||||||||||
| (1,744,722 | ) | (1,977,313 | ) | (309,058,207 | ) | (674,995,963 | ) | |||||||||||||||
| — | — | (5,746,888 | ) | (11,651,811 | ) | |||||||||||||||||
| (872 | ) | (1,099 | ) | (18,674,509 | ) | (30,389,606 | ) | |||||||||||||||
| (868 | ) | (1,094 | ) | (9,066,946 | ) | (17,292,249 | ) | |||||||||||||||
| (495 | ) | — | (1,081,229 | ) | — | |||||||||||||||||
| (1,852,961 | ) | (2,062,758 | ) | (464,979,506 | ) | (994,093,106 | ) | |||||||||||||||
| 2,465,625 | 12,758,032 | 664,433,721 | 1,354,546,446 | |||||||||||||||||||
| 1,852,961 | 2,062,758 | 390,089,513 | 802,333,312 | |||||||||||||||||||
| (12,507,765 | ) | (4,759,978 | ) | (2,055,513,321 | ) | (1,884,231,470 | ) | |||||||||||||||
| (8,189,179 | ) | 10,060,812 | (1,000,990,087 | ) | 272,648,288 | |||||||||||||||||
| (8,966,203 | ) | 9,119,953 | (1,382,863,738 | ) | (756,210,817 | ) | ||||||||||||||||
| 33,578,424 | 24,458,471 | 4,584,750,752 | 5,340,961,569 | |||||||||||||||||||
| $ | 24,612,221 | $ | 33,578,424 | $ | 3,201,887,014 | $ | 4,584,750,752 | |||||||||||||||
| $ | 162,001 | $ | 77,136 | $ | (7,887,321 | ) | $ | (16,360,233 | ) | |||||||||||||
| The accompanying notes are an integral part of these financial statements. | 93 |
GOLDMAN SACHS FUNDAMENTAL EQUITY GROWTH FUNDS
Statements of Changes in Net Assets (continued)
| Small/Mid Cap Growth Fund | ||||||||||
| For the Fiscal Year Ended August 31, 2016 | For the Fiscal Year Ended August 31, 2015 | |||||||||
| From operations: | ||||||||||
Net investment income (loss) | $ | (16,317,215 | ) | $ | (18,094,472 | ) | ||||
Net realized gain (loss) | 52,255,039 | 158,512,531 | ||||||||
Net change in unrealized gain (loss) | (71,634,818 | ) | 23,699,445 | |||||||
| Net increase (decrease) in net assets resulting from operations | (35,696,994 | ) | 164,117,504 | |||||||
| Distributions to shareholders: | ||||||||||
From net investment income | ||||||||||
Class A Shares | — | — | ||||||||
Class C Shares | — | — | ||||||||
Institutional Shares | — | — | ||||||||
Service Shares | — | — | ||||||||
Class IR Shares | — | — | ||||||||
Class R Shares | — | — | ||||||||
Class R6 Shares(a) | — | — | ||||||||
From net realized gains | ||||||||||
Class A Shares | (33,875,139 | ) | (59,422,373 | ) | ||||||
Class C Shares | (10,986,288 | ) | (19,729,913 | ) | ||||||
Institutional Shares | (47,806,278 | ) | (89,205,827 | ) | ||||||
Service Shares | (475,742 | ) | (662,911 | ) | ||||||
Class IR Shares | (10,051,807 | ) | (13,778,175 | ) | ||||||
Class R Shares | (1,254,158 | ) | (2,780,547 | ) | ||||||
Class R6 Shares(a) | (313 | ) | — | |||||||
| Total distributions to shareholders | (104,449,725 | ) | (185,579,746 | ) | ||||||
| From share transactions: | ||||||||||
Proceeds from sales of shares | 1,008,705,061 | 1,088,106,213 | ||||||||
Reinvestment of distributions | 93,324,637 | 164,354,586 | ||||||||
Cost of shares redeemed | (1,151,579,076 | ) | (691,041,765 | ) | ||||||
| Net increase (decrease) in net assets resulting from share transactions | (49,549,378 | ) | 561,419,034 | |||||||
| TOTAL INCREASE (DECREASE) | (189,696,097 | ) | 539,956,792 | |||||||
| Net assets: | ||||||||||
Beginning of year | 2,798,527,319 | 2,258,570,527 | ||||||||
End of year | $ | 2,608,831,222 | $ | 2,798,527,319 | ||||||
| Undistributed (distributions in excess of) net investment income (loss) | $ | (10,953,820 | ) | $ | 570,667 | |||||
| (a) | Commenced operations on July 31, 2015. |
| 94 | The accompanying notes are an integral part of these financial statements. |
GOLDMAN SACHS FUNDAMENTAL EQUITY GROWTH FUNDS
| Strategic Growth Fund | Technology Opportunities Fund | |||||||||||||||||||||
| For the Fiscal Year Ended August 31, 2016 | For the Fiscal August 31, 2015 | For the Fiscal Year Ended August 31, 2016 | For the Fiscal Year Ended August 31, 2015 | |||||||||||||||||||
| $ | 2,040,512 | $ | 1,796,891 | $ | (2,695,009 | ) | $ | (3,232,312 | ) | |||||||||||||
| 1,548,451 | 29,207,245 | 18,604,630 | 45,968,161 | |||||||||||||||||||
| 21,597,125 | (15,744,519 | ) | 31,771,257 | (33,789,050 | ) | |||||||||||||||||
| 25,186,088 | 15,259,617 | 47,680,878 | 8,946,799 | |||||||||||||||||||
| (72,760 | ) | — | — | — | ||||||||||||||||||
| — | — | — | — | |||||||||||||||||||
| (1,396,604 | ) | (991,937 | ) | — | — | |||||||||||||||||
| (299 | ) | — | — | — | ||||||||||||||||||
| (2,572 | ) | (1,531 | ) | — | — | |||||||||||||||||
| (106 | ) | — | — | — | ||||||||||||||||||
| (42 | ) | — | — | — | ||||||||||||||||||
| (2,662,084 | ) | (7,853,382 | ) | (21,931,579 | ) | (19,398,872 | ) | |||||||||||||||
| (747,201 | ) | (2,031,017 | ) | (5,298,231 | ) | (4,987,729 | ) | |||||||||||||||
| (18,504,227 | ) | (47,665,788 | ) | (6,969,643 | ) | (7,490,876 | ) | |||||||||||||||
| (12,976 | ) | (26,879 | ) | (975,553 | ) | (853,327 | ) | |||||||||||||||
| (47,249 | ) | (147,162 | ) | (511,029 | ) | (226,844 | ) | |||||||||||||||
| (4,036 | ) | (2,673 | ) | — | — | |||||||||||||||||
| (516 | ) | — | — | — | ||||||||||||||||||
| (23,450,672 | ) | (58,720,369 | ) | (35,686,035 | ) | (32,957,648 | ) | |||||||||||||||
| 110,866,442 | 85,773,465 | 64,248,588 | 106,814,338 | |||||||||||||||||||
| 22,818,629 | 56,900,752 | 32,420,710 | 29,561,009 | |||||||||||||||||||
| (166,077,206 | ) | (112,960,044 | ) | (133,609,474 | ) | (136,669,644 | ) | |||||||||||||||
| (32,392,135 | ) | 29,714,173 | (36,940,176 | ) | (294,297 | ) | ||||||||||||||||
| (30,656,719 | ) | (13,746,579 | ) | (24,945,333 | ) | (24,305,146 | ) | |||||||||||||||
| 383,996,827 | 397,743,406 | 412,557,635 | 436,862,781 | |||||||||||||||||||
| $ | 353,340,108 | $ | 383,996,827 | $ | 387,612,302 | $ | 412,557,635 | |||||||||||||||
| $ | 2,008,192 | $ | 1,482,021 | $ | (1,944,623 | ) | $ | (1,463,830 | ) | |||||||||||||
| The accompanying notes are an integral part of these financial statements. | 95 |
GOLDMAN SACHS CAPITAL GROWTH FUND
Selected Data for a Share Outstanding Throughout Each Year
| Income (loss) from investment operations | Distributions to shareholders | |||||||||||||||||||||||||||||
| Year - Share Class | Net asset | Net investment income (loss)(a) | Net realized and unrealized gain (loss) | Total from investment operations | From net investment income | From net realized gains | Total distributions | |||||||||||||||||||||||
| FOR THE FISCAL YEARS ENDED AUGUST 31, | ||||||||||||||||||||||||||||||
2016 - A | $ | 24.80 | $ | 0.03 | $ | 1.37 | $ | 1.40 | $ | — | $ | (2.05 | ) | $ | (2.05 | ) | ||||||||||||||
2016 - C | 19.77 | (0.12 | ) | 1.08 | 0.96 | — | (2.05 | ) | (2.05 | ) | ||||||||||||||||||||
2016 - Institutional | 26.82 | 0.13 | 1.49 | 1.62 | (0.04 | ) | (2.05 | ) | (2.09 | ) | ||||||||||||||||||||
2016 - Service | 24.12 | — | (d) | 1.33 | 1.33 | — | (2.05 | ) | (2.05 | ) | ||||||||||||||||||||
2016 - IR | 25.07 | 0.08 | 1.40 | 1.48 | (0.02 | ) | (2.05 | ) | (2.07 | ) | ||||||||||||||||||||
2016 - R | 24.19 | (0.03 | ) | 1.33 | 1.30 | — | (2.05 | ) | (2.05 | ) | ||||||||||||||||||||
2016 - R6 | 26.82 | 0.13 | 1.49 | 1.62 | (0.05 | ) | (2.05 | ) | (2.10 | ) | ||||||||||||||||||||
2015 - A | 28.16 | 0.01 | 1.00 | 1.01 | — | (4.37 | ) | (4.37 | ) | |||||||||||||||||||||
2015 - C | 23.45 | (0.15 | ) | 0.84 | 0.69 | — | (4.37 | ) | (4.37 | ) | ||||||||||||||||||||
2015 - Institutional | 30.01 | 0.12 | 1.06 | 1.18 | — | (4.37 | ) | (4.37 | ) | |||||||||||||||||||||
2015 - Service | 27.53 | (0.02 | ) | 0.98 | 0.96 | — | (4.37 | ) | (4.37 | ) | ||||||||||||||||||||
2015 - IR | 28.36 | 0.07 | 1.01 | 1.08 | — | (4.37 | ) | (4.37 | ) | |||||||||||||||||||||
2015 - R | 27.64 | (0.06 | ) | 0.98 | 0.92 | — | (4.37 | ) | (4.37 | ) | ||||||||||||||||||||
2015 - R6 (Commenced July 31, 2015) | 28.86 | 0.01 | (2.05 | ) | (2.04 | ) | — | — | — | |||||||||||||||||||||
2014 - A | 28.13 | (0.01 | ) | 6.41 | 6.40 | (0.08 | ) | (6.29 | ) | (6.37 | ) | |||||||||||||||||||
2014 - C | 24.46 | (0.18 | ) | 5.46 | 5.28 | — | (6.29 | ) | (6.29 | ) | ||||||||||||||||||||
2014 - Institutional | 29.57 | 0.10 | 6.79 | 6.89 | (0.16 | ) | (6.29 | ) | (6.45 | ) | ||||||||||||||||||||
2014 - Service | 27.62 | (0.04 | ) | 6.29 | 6.25 | (0.05 | ) | (6.29 | ) | (6.34 | ) | |||||||||||||||||||
2014 - IR | 28.28 | 0.06 | 6.44 | 6.50 | (0.13 | ) | (6.29 | ) | (6.42 | ) | ||||||||||||||||||||
2014 - R | 27.75 | (0.08 | ) | 6.31 | 6.23 | (0.05 | ) | (6.29 | ) | (6.34 | ) | |||||||||||||||||||
2013 - A | 24.40 | 0.10 | (f) | 3.66 | 3.76 | (0.03 | ) | — | (0.03 | ) | ||||||||||||||||||||
2013 - C | 21.35 | (0.08 | )(f) | 3.19 | 3.11 | — | — | — | ||||||||||||||||||||||
2013 - Institutional | 25.64 | 0.21 | (f) | 3.84 | 4.05 | (0.12 | ) | — | (0.12 | ) | ||||||||||||||||||||
2013 - Service | 23.96 | 0.07 | (f) | 3.60 | 3.67 | (0.01 | ) | — | (0.01 | ) | ||||||||||||||||||||
2013 - IR | 24.53 | 0.18 | (f) | 3.67 | 3.85 | (0.10 | ) | — | (0.10 | ) | ||||||||||||||||||||
2013 - R | 24.14 | 0.03 | (f) | 3.62 | 3.65 | (0.04 | ) | — | (0.04 | ) | ||||||||||||||||||||
2012 - A | 20.49 | 0.02 | 3.93 | 3.95 | (0.04 | ) | — | (0.04 | ) | |||||||||||||||||||||
2012 - C | 18.03 | (0.13 | ) | 3.45 | 3.32 | — | — | — | ||||||||||||||||||||||
2012 - Institutional | 21.54 | 0.10 | 4.12 | 4.22 | (0.12 | ) | — | (0.12 | ) | |||||||||||||||||||||
2012 - Service | 20.13 | — | (d) | 3.85 | 3.85 | (0.02 | ) | — | (0.02 | ) | ||||||||||||||||||||
2012 - IR | 20.66 | 0.08 | 3.93 | 4.01 | (0.14 | ) | — | (0.14 | ) | |||||||||||||||||||||
2012 - R | 20.31 | (0.03 | ) | 3.88 | 3.85 | (0.02 | ) | — | (0.02 | ) | ||||||||||||||||||||
| (a) | Calculated based on the average shares outstanding methodology. |
| (b) | Assumes investment at the NAV at the beginning of the year, reinvestment of all dividends and distributions, a complete redemption of the investment at the NAV at the end of the year and no sales or redemption charges. Total returns would be reduced if a sales or redemption charge was taken into account. Returns do not reflect the deduction of taxes that a shareholder would pay on Fund distributions or the redemption of Fund shares. Total returns for periods less than one full year are not annualized. |
| (c) | The Fund’s portfolio turnover rate is calculated in accordance with regulatory requirements, without regard to transactions involving short term investments. If such transactions were included, the Fund’s portfolio turnover rate may be higher. |
| (d) | Amount is less than $0.005 per share. |
| (e) | Annualized. |
| (f) | Reflects income recognized from special dividends which amounted to $0.06 per share and 0.21% of average net assets. |
| 96 | The accompanying notes are an integral part of these financial statements. |
GOLDMAN SACHS CAPITAL GROWTH FUND
| Net asset value, end of year | Total return(b) | Net assets, end of year (in 000s) | Ratio of net expenses to average net assets | Ratio of total expenses to average net assets | Ratio of net investment income (loss) to average net assets | Portfolio turnover rate(c) | ||||||||||||||||||||||||||||||||||
| $ | 24.15 | 5.79 | % | $ | 630,091 | 1.15 | % | 1.51 | % | 0.11 | % | 45 | % | |||||||||||||||||||||||||||
| 18.68 | 4.98 | 68,960 | 1.90 | 2.26 | (0.64 | ) | 45 | |||||||||||||||||||||||||||||||||
| 26.35 | 6.19 | 141,442 | 0.75 | 1.11 | 0.50 | 45 | ||||||||||||||||||||||||||||||||||
| 23.40 | 5.66 | 1,561 | 1.25 | 1.61 | 0.01 | 45 | ||||||||||||||||||||||||||||||||||
| 24.48 | 6.05 | 4,297 | 0.90 | 1.26 | 0.35 | 45 | ||||||||||||||||||||||||||||||||||
| 23.44 | 5.51 | 3,450 | 1.40 | 1.76 | (0.15 | ) | 45 | |||||||||||||||||||||||||||||||||
| 26.34 | 6.19 | 10 | 0.74 | 1.09 | 0.52 | 45 | ||||||||||||||||||||||||||||||||||
| 24.80 | 3.34 | 669,345 | 1.15 | 1.49 | 0.04 | 55 | ||||||||||||||||||||||||||||||||||
| 19.77 | 2.55 | 75,941 | 1.90 | 2.25 | (0.71 | ) | 55 | |||||||||||||||||||||||||||||||||
| 26.82 | 3.75 | 173,539 | 0.75 | 1.09 | 0.44 | 55 | ||||||||||||||||||||||||||||||||||
| 24.12 | 3.23 | 1,917 | 1.25 | 1.60 | (0.08 | ) | 55 | |||||||||||||||||||||||||||||||||
| 25.07 | 3.59 | 3,823 | 0.90 | 1.24 | 0.28 | 55 | ||||||||||||||||||||||||||||||||||
| 24.19 | 3.05 | 3,500 | 1.40 | 1.74 | (0.21 | ) | 55 | |||||||||||||||||||||||||||||||||
| 26.82 | (7.07 | ) | 9 | 0.76 | (e) | 1.11 | (e) | 0.54 | (e) | 55 | ||||||||||||||||||||||||||||||
| 28.16 | 25.50 | 702,534 | 1.16 | 1.51 | (0.05 | ) | 75 | |||||||||||||||||||||||||||||||||
| 23.45 | 24.57 | 81,954 | 1.91 | 2.26 | (0.80 | ) | 75 | |||||||||||||||||||||||||||||||||
| 30.01 | 26.03 | 147,642 | 0.76 | 1.11 | 0.35 | 75 | ||||||||||||||||||||||||||||||||||
| 27.53 | 25.39 | 1,135 | 1.26 | 1.61 | (0.15 | ) | 75 | |||||||||||||||||||||||||||||||||
| 28.36 | 25.80 | 2,951 | 0.91 | 1.26 | 0.20 | 75 | ||||||||||||||||||||||||||||||||||
| 27.64 | 25.18 | 3,571 | 1.41 | 1.76 | (0.30 | ) | 75 | |||||||||||||||||||||||||||||||||
| 28.13 | 15.41 | 630,495 | 1.14 | 1.50 | 0.38 | (f) | 52 | |||||||||||||||||||||||||||||||||
| 24.46 | 14.57 | 75,375 | 1.89 | 2.25 | (0.37 | )(f) | 52 | |||||||||||||||||||||||||||||||||
| 29.57 | 15.89 | 124,795 | 0.74 | 1.10 | 0.75 | (f) | 52 | |||||||||||||||||||||||||||||||||
| 27.62 | 15.32 | 980 | 1.24 | 1.60 | 0.27 | (f) | 52 | |||||||||||||||||||||||||||||||||
| 28.28 | 15.75 | 2,112 | 0.89 | 1.25 | 0.67 | (f) | 52 | |||||||||||||||||||||||||||||||||
| 27.75 | 15.15 | 2,480 | 1.39 | 1.75 | 0.13 | (f) | 52 | |||||||||||||||||||||||||||||||||
| 24.40 | 19.24 | 662,127 | 1.14 | 1.48 | 0.09 | 55 | ||||||||||||||||||||||||||||||||||
| 21.35 | 18.36 | 73,162 | 1.89 | 2.23 | (0.66 | ) | 55 | |||||||||||||||||||||||||||||||||
| 25.64 | 19.64 | 83,466 | 0.74 | 1.08 | 0.42 | 55 | ||||||||||||||||||||||||||||||||||
| 23.96 | 19.08 | 1,072 | 1.24 | 1.58 | (0.02 | ) | 55 | |||||||||||||||||||||||||||||||||
| 24.53 | 19.48 | 2,415 | 0.89 | 1.23 | 0.36 | 55 | ||||||||||||||||||||||||||||||||||
| 24.14 | 18.92 | 1,475 | 1.39 | 1.73 | (0.12 | ) | 55 | |||||||||||||||||||||||||||||||||
| The accompanying notes are an integral part of these financial statements. | 97 |
GOLDMAN SACHS CONCENTRATED GROWTH FUND
Financial Highlights
Selected Data for a Share Outstanding Throughout Each Year
| Income (loss) from investment operations | Distributions to shareholders | |||||||||||||||||||||||||||||
| Year - Share Class | Net asset value, beginning of year | Net investment income (loss)(a) | Net realized and unrealized gain (loss) | Total from investment operations | From net investment income | From net realized gains | Total distributions | |||||||||||||||||||||||
| FOR THE FISCAL YEARS ENDED AUGUST 31, | ||||||||||||||||||||||||||||||
2016 - A | $ | 16.06 | $ | — | (d) | $ | 0.81 | $ | 0.81 | $ | — | $ | (1.81 | ) | $ | (1.81 | ) | |||||||||||||
2016 - C | 14.05 | (0.09 | )(d) | 0.69 | 0.60 | — | (1.81 | ) | (1.81 | ) | ||||||||||||||||||||
2016 - Institutional | 16.88 | 0.07 | (d) | 0.84 | 0.91 | (0.04 | ) | (1.81 | ) | (1.85 | ) | |||||||||||||||||||
2016 - IR | 16.26 | 0.04 | (d) | 0.81 | 0.85 | (0.02 | ) | (1.81 | ) | (1.83 | ) | |||||||||||||||||||
2016 - R | 15.71 | (0.04 | )(d) | 0.79 | 0.75 | — | (1.81 | ) | (1.81 | ) | ||||||||||||||||||||
2016 - R6 | 16.88 | 0.07 | (d) | 0.85 | 0.92 | (0.04 | ) | (1.81 | ) | (1.85 | ) | |||||||||||||||||||
2015 - A | 18.94 | — | (e)(f) | 0.55 | 0.55 | — | (3.43 | ) | (3.43 | ) | ||||||||||||||||||||
2015 - C | 17.09 | (0.11 | )(e) | 0.50 | 0.39 | — | (3.43 | ) | (3.43 | ) | ||||||||||||||||||||
2015 - Institutional | 19.71 | 0.08 | (e) | 0.57 | 0.65 | (0.05 | ) | (3.43 | ) | (3.48 | ) | |||||||||||||||||||
2015 - IR | 19.10 | 0.05 | (e) | 0.56 | 0.61 | (0.02 | ) | (3.43 | ) | (3.45 | ) | |||||||||||||||||||
2015 - R | 18.64 | (0.05 | )(e) | 0.55 | 0.50 | — | (3.43 | ) | (3.43 | ) | ||||||||||||||||||||
2015 - R6 (Commenced July 31, 2015) | 18.04 | 0.01 | (e) | (1.17 | ) | (1.16 | ) | — | — | — | ||||||||||||||||||||
2014 - A | 17.05 | (0.06 | ) | 3.78 | 3.72 | — | (1.83 | ) | (1.83 | ) | ||||||||||||||||||||
2014 - C | 15.65 | (0.17 | ) | 3.44 | 3.27 | — | (1.83 | ) | (1.83 | ) | ||||||||||||||||||||
2014 - Institutional | 17.63 | 0.02 | 3.92 | 3.94 | (0.03 | ) | (1.83 | ) | (1.86 | ) | ||||||||||||||||||||
2014 - IR | 17.15 | (0.01 | ) | 3.81 | 3.80 | (0.02 | ) | (1.83 | ) | (1.85 | ) | |||||||||||||||||||
2014 - R | 16.84 | (0.10 | ) | 3.73 | 3.63 | — | (1.83 | ) | (1.83 | ) | ||||||||||||||||||||
2013 - A | 14.97 | 0.11 | (h) | 2.03 | 2.14 | (0.06 | ) | — | (0.06 | ) | ||||||||||||||||||||
2013 - C | 13.79 | (0.06 | )(h) | 1.93 | 1.87 | (0.01 | ) | — | (0.01 | ) | ||||||||||||||||||||
2013 - Institutional | 15.48 | 0.09 | (h) | 2.18 | 2.27 | (0.12 | ) | — | (0.12 | ) | ||||||||||||||||||||
2013 - IR | 15.07 | 0.12 | (h) | 2.07 | 2.19 | (0.11 | ) | — | (0.11 | ) | ||||||||||||||||||||
2013 - R | 14.80 | 0.01 | (h) | 2.06 | 2.07 | (0.03 | ) | — | (0.03 | ) | ||||||||||||||||||||
2012 - A | 12.64 | — | (f) | 2.33 | 2.33 | — | — | — | ||||||||||||||||||||||
2012 - C | 11.73 | (0.09 | ) | 2.15 | 2.06 | — | — | — | ||||||||||||||||||||||
2012 - Institutional | 13.07 | 0.05 | 2.41 | 2.46 | (0.05 | ) | — | (0.05 | ) | |||||||||||||||||||||
2012 - IR | 12.73 | 0.04 | 2.34 | 2.38 | (0.04 | ) | — | (0.04 | ) | |||||||||||||||||||||
2012 - R | 12.52 | (0.03 | ) | 2.31 | 2.28 | — | — | — | ||||||||||||||||||||||
| (a) | Calculated based on the average shares outstanding methodology. |
| (b) | Assumes investment at the NAV at the beginning of the year, reinvestment of all dividends and distributions, a complete redemption of the investment at the NAV at the end of the year and no sales or redemption charges. Total returns would be reduced if a sales or redemption charge was taken into account. Returns do not reflect the deduction of taxes that a shareholder would pay on Fund distributions or the redemption of Fund shares. Total returns for periods less than one full year are not annualized. |
| (c) | The Fund’s portfolio turnover rate is calculated in accordance with regulatory requirements, without regard to transactions involving short term investments. If such transactions were included, the Fund’s portfolio turnover rate may be higher. |
| (d) | Reflects income recognized from a special dividend which amounted to $0.03 per share and 0.19% of average net assets. |
| (e) | Reflects income recognized from a special dividend which amounted to $0.05 per share and 0.30% of average net assets. |
| (f) | Amount is less than $0.005 per share. |
| (g) | Annualized. |
| (h) | Reflects income recognized from a special dividend which amounted to $0.06 per share and 0.35% of average net assets. |
| 98 | The accompanying notes are an integral part of these financial statements. |
GOLDMAN SACHS CONCENTRATED GROWTH FUND
| Net asset value, end of year | Total return(b) | Net assets, end of year (in 000s) | Ratio of net expenses to average net assets | Ratio of total expenses to average net assets | Ratio of net investment income (loss) to average net assets | Portfolio turnover rate(c) | ||||||||||||||||||||||||||||||||||
| $ | 15.06 | 5.10 | % | $ | 6,573 | 1.22 | % | 1.63 | % | 0.03 | %(d) | 55 | % | |||||||||||||||||||||||||||
| 12.84 | 4.27 | 2,192 | 1.98 | 2.38 | (0.71 | )(d) | 55 | |||||||||||||||||||||||||||||||||
| 15.94 | 5.47 | 134,818 | 0.82 | 1.23 | 0.43 | (d) | 55 | |||||||||||||||||||||||||||||||||
| 15.28 | 5.31 | 452 | 0.97 | 1.38 | 0.27 | (d) | 55 | |||||||||||||||||||||||||||||||||
| 14.65 | 4.81 | 22 | 1.48 | 1.89 | (0.25 | )(d) | 55 | |||||||||||||||||||||||||||||||||
| 15.95 | 5.56 | 10 | 0.81 | 1.21 | 0.44 | (d) | 55 | |||||||||||||||||||||||||||||||||
| 16.06 | 2.54 | 7,350 | 1.24 | 1.60 | 0.02 | (e) | 47 | |||||||||||||||||||||||||||||||||
| 14.05 | 1.78 | 3,604 | 1.99 | 2.35 | (0.74 | )(e) | 47 | |||||||||||||||||||||||||||||||||
| 16.88 | 2.97 | 155,652 | 0.84 | 1.20 | 0.42 | (e) | 47 | |||||||||||||||||||||||||||||||||
| 16.26 | 2.84 | 342 | 0.99 | 1.35 | 0.29 | (e) | 47 | |||||||||||||||||||||||||||||||||
| 15.71 | 2.28 | 27 | 1.49 | 1.87 | (0.31 | )(e) | 47 | |||||||||||||||||||||||||||||||||
| 16.88 | (6.43 | ) | 9 | 0.77 | (g) | 1.48 | (g) | 0.46 | (e)(g) | 47 | ||||||||||||||||||||||||||||||
| 18.94 | 22.88 | 7,564 | 1.27 | 1.60 | (0.32 | ) | 60 | |||||||||||||||||||||||||||||||||
| 17.09 | 21.98 | 3,460 | 2.02 | 2.35 | (1.06 | ) | 60 | |||||||||||||||||||||||||||||||||
| 19.71 | 23.44 | 169,387 | 0.87 | 1.20 | 0.09 | 60 | ||||||||||||||||||||||||||||||||||
| 19.10 | 23.20 | 385 | 1.02 | 1.35 | (0.06 | ) | 60 | |||||||||||||||||||||||||||||||||
| 18.64 | 22.61 | 14 | 1.50 | 1.84 | (0.55 | ) | 60 | |||||||||||||||||||||||||||||||||
| 17.05 | 14.36 | 8,476 | 1.26 | 1.62 | 0.69 | (h) | 57 | |||||||||||||||||||||||||||||||||
| 15.65 | 13.57 | 2,561 | 2.01 | 2.37 | (0.39 | )(h) | 57 | |||||||||||||||||||||||||||||||||
| 17.63 | 14.81 | 146,183 | 0.86 | 1.23 | 0.56 | (h) | 57 | |||||||||||||||||||||||||||||||||
| 17.15 | 14.61 | 346 | 1.01 | 1.38 | 0.76 | (h) | 57 | |||||||||||||||||||||||||||||||||
| 16.84 | 14.13 | 12 | 1.51 | 1.87 | 0.09 | (h) | 57 | |||||||||||||||||||||||||||||||||
| 14.97 | 18.38 | 92,207 | 1.26 | 1.57 | 0.01 | 33 | ||||||||||||||||||||||||||||||||||
| 13.79 | 17.51 | 2,877 | 2.01 | 2.32 | (0.72 | ) | 33 | |||||||||||||||||||||||||||||||||
| 15.48 | 18.80 | 56,118 | 0.86 | 1.17 | 0.39 | 33 | ||||||||||||||||||||||||||||||||||
| 15.07 | 18.69 | 584 | 1.01 | 1.32 | 0.28 | 33 | ||||||||||||||||||||||||||||||||||
| 14.80 | 18.08 | 10 | 1.51 | 1.82 | (0.22 | ) | 33 | |||||||||||||||||||||||||||||||||
| The accompanying notes are an integral part of these financial statements. | 99 |
GOLDMAN SACHS DYNAMIC U.S. EQUITY FUND
Financial Highlights
Selected Data for a Share Outstanding Throughout Each Year
| Income (loss) from investment operations | Distributions to shareholders | |||||||||||||||||||||||||||||
| Year - Share Class | Net asset value, beginning of year | Net investment income (loss)(a) | Net realized and unrealized gain (loss) | Total from investment operations | From net investment income | From net realized gains | Total distributions | |||||||||||||||||||||||
| FOR THE FISCAL YEARS ENDED AUGUST 31, | ||||||||||||||||||||||||||||||
2016 - A | $ | 13.92 | $ | 0.09 | $ | 0.50 | $ | 0.59 | $ | (0.07 | ) | $ | (1.36 | ) | $ | (1.43 | ) | |||||||||||||
2016 - C | 13.56 | (0.01 | ) | 0.50 | 0.49 | — | (1.36 | ) | (1.36 | ) | ||||||||||||||||||||
2016 - Institutional | 14.01 | 0.14 | 0.51 | 0.65 | (0.13 | ) | (1.36 | ) | (1.49 | ) | ||||||||||||||||||||
2016 - IR | 13.98 | 0.13 | 0.50 | 0.63 | (0.09 | ) | (1.36 | ) | (1.45 | ) | ||||||||||||||||||||
2016 - R | 13.88 | 0.07 | 0.50 | 0.57 | — | (1.36 | ) | (1.36 | ) | |||||||||||||||||||||
2016 - R6 | 14.01 | 0.14 | 0.51 | 0.65 | (0.13 | ) | (1.36 | ) | (1.49 | ) | ||||||||||||||||||||
2015 - A | 16.66 | 0.09 | (0.17 | ) | (0.08 | ) | (0.07 | ) | (2.59 | ) | (2.66 | ) | ||||||||||||||||||
2015 - C | 16.33 | (0.03 | ) | (0.15 | ) | (0.18 | ) | — | (2.59 | ) | (2.59 | ) | ||||||||||||||||||
2015 - Institutional | 16.75 | 0.14 | (0.16 | ) | (0.02 | ) | (0.13 | ) | (2.59 | ) | (2.72 | ) | ||||||||||||||||||
2015 - IR | 16.72 | 0.11 | (0.15 | ) | (0.04 | ) | (0.11 | ) | (2.59 | ) | (2.70 | ) | ||||||||||||||||||
2015 - R | 16.62 | 0.04 | (0.16 | ) | (0.12 | ) | (0.03 | ) | (2.59 | ) | (2.62 | ) | ||||||||||||||||||
2015 - R6 (Commenced July 31, 2015) | 15.04 | 0.01 | (1.04 | ) | (1.03 | ) | — | — | — | |||||||||||||||||||||
2014 - A | 14.79 | 0.06 | 3.23 | 3.29 | (0.05 | ) | (1.37 | ) | (1.42 | ) | ||||||||||||||||||||
2014 - C | 14.58 | (0.06 | ) | 3.18 | 3.12 | — | (1.37 | ) | (1.37 | ) | ||||||||||||||||||||
2014 - Institutional | 14.85 | 0.12 | 3.25 | 3.37 | (0.10 | ) | (1.37 | ) | (1.47 | ) | ||||||||||||||||||||
2014 - IR | 14.83 | 0.10 | 3.24 | 3.34 | (0.08 | ) | (1.37 | ) | (1.45 | ) | ||||||||||||||||||||
2014 - R | 14.78 | 0.02 | 3.23 | 3.25 | (0.04 | ) | (1.37 | ) | (1.41 | ) | ||||||||||||||||||||
2013 - A | 12.30 | 0.09 | 2.48 | 2.57 | (0.08 | ) | — | (0.08 | ) | |||||||||||||||||||||
2013 - C | 12.13 | (0.01 | ) | 2.46 | 2.45 | — | — | — | ||||||||||||||||||||||
2013 - Institutional | 12.35 | 0.14 | 2.50 | 2.64 | (0.14 | ) | — | (0.14 | ) | |||||||||||||||||||||
2013 - IR | 12.34 | 0.12 | 2.50 | 2.62 | (0.13 | ) | — | (0.13 | ) | |||||||||||||||||||||
2013 - R | 12.29 | 0.04 | 2.51 | 2.55 | (0.06 | ) | — | (0.06 | ) | |||||||||||||||||||||
2012 - A | 10.71 | 0.08 | 1.66 | 1.74 | (0.04 | ) | (0.11 | ) | (0.15 | ) | ||||||||||||||||||||
2012 - C | 10.61 | (0.01 | ) | 1.64 | 1.63 | — | (0.11 | ) | (0.11 | ) | ||||||||||||||||||||
2012 - Institutional | 10.76 | 0.13 | 1.65 | 1.78 | (0.08 | ) | (0.11 | ) | (0.19 | ) | ||||||||||||||||||||
2012 - IR | 10.73 | 0.11 | 1.65 | 1.76 | (0.04 | ) | (0.11 | ) | (0.15 | ) | ||||||||||||||||||||
2012 - R | 10.70 | 0.05 | 1.65 | 1.70 | — | (e) | (0.11 | ) | (0.11 | ) | ||||||||||||||||||||
| (a) | Calculated based on the average shares outstanding methodology. |
| (b) | Assumes investment at the NAV at the beginning of the year, reinvestment of all dividends and distributions, a complete redemption of the investment at the NAV at the end of the year and no sales or redemption charges. Total returns would be reduced if a sales or redemption charge was taken into account. Returns do not reflect the deduction of taxes that a shareholder would pay on Fund distributions or the redemption of Fund shares. Total returns for periods less than one full year are not annualized. |
| (c) | The Fund’s portfolio turnover rate is calculated in accordance with regulatory requirements, without regard to transactions involving short term investments. If such transactions were included, the Fund’s portfolio turnover rate may be higher. |
| (d) | Annualized. |
| (e) | Amount is less than $0.005 per share. |
| 100 | The accompanying notes are an integral part of these financial statements. |
GOLDMAN SACHS DYNAMIC U.S. EQUITY FUND
| Net asset value, end of year | Total return(b) | Net assets, end of year (in 000s) | Ratio of net expenses to average net assets | Ratio of total expenses to average net assets | Ratio of net investment income (loss) to average net assets | Portfolio turnover rate(c) | ||||||||||||||||||||||||||||||||||
| $ | 13.08 | 4.39 | % | $ | 2,124 | 1.22 | % | 3.60 | % | 0.67 | % | 49 | % | |||||||||||||||||||||||||||
| 12.69 | 3.66 | 195 | 1.97 | 4.33 | (0.10 | ) | 49 | |||||||||||||||||||||||||||||||||
| 13.17 | 4.84 | 4,754 | 0.82 | 3.16 | 1.10 | 49 | ||||||||||||||||||||||||||||||||||
| 13.16 | 4.67 | 156 | 0.97 | 3.54 | 0.97 | 49 | ||||||||||||||||||||||||||||||||||
| 13.09 | 4.18 | 19 | 1.47 | 3.70 | 0.49 | 49 | ||||||||||||||||||||||||||||||||||
| 13.17 | 4.86 | 10 | 0.81 | 3.14 | 1.09 | 49 | ||||||||||||||||||||||||||||||||||
| 13.92 | (1.22 | ) | 3,086 | 1.21 | 2.81 | 0.57 | 67 | |||||||||||||||||||||||||||||||||
| 13.56 | (1.96 | ) | 355 | 1.97 | 3.56 | (0.21 | ) | 67 | ||||||||||||||||||||||||||||||||
| 14.01 | (0.82 | ) | 10,855 | 0.81 | 2.42 | 0.93 | 67 | |||||||||||||||||||||||||||||||||
| 13.98 | (0.98 | ) | 800 | 0.96 | 1.06 | 0.73 | 67 | |||||||||||||||||||||||||||||||||
| 13.88 | (1.48 | ) | 118 | 1.46 | 3.10 | 0.28 | 67 | |||||||||||||||||||||||||||||||||
| 14.01 | (6.85 | ) | 9 | 0.76 | (d) | 1.65 | (d) | 1.08 | (d) | 67 | ||||||||||||||||||||||||||||||
| 16.66 | 23.41 | 4,542 | 1.20 | 3.04 | 0.37 | 67 | ||||||||||||||||||||||||||||||||||
| 16.33 | 22.44 | 247 | 1.95 | 3.78 | (0.37 | ) | 67 | |||||||||||||||||||||||||||||||||
| 16.75 | 23.92 | 8,995 | 0.80 | 2.65 | 0.76 | 67 | ||||||||||||||||||||||||||||||||||
| 16.72 | 23.71 | 205 | 0.95 | 2.80 | 0.61 | 67 | ||||||||||||||||||||||||||||||||||
| 16.62 | 23.06 | 110 | 1.45 | 3.30 | 0.11 | 67 | ||||||||||||||||||||||||||||||||||
| 14.79 | 21.05 | 2,869 | 1.18 | 3.66 | 0.68 | 61 | ||||||||||||||||||||||||||||||||||
| 14.58 | 20.20 | 126 | 1.93 | 4.41 | (0.09 | ) | 61 | |||||||||||||||||||||||||||||||||
| 14.85 | 21.56 | 8,646 | 0.78 | 3.24 | 1.06 | 61 | ||||||||||||||||||||||||||||||||||
| 14.83 | 21.39 | 174 | 0.93 | 3.39 | 0.90 | 61 | ||||||||||||||||||||||||||||||||||
| 14.78 | 20.83 | 51 | 1.43 | 3.80 | 0.29 | 61 | ||||||||||||||||||||||||||||||||||
| 12.30 | 16.37 | 3,331 | 1.18 | 3.63 | 0.69 | 76 | ||||||||||||||||||||||||||||||||||
| 12.13 | 15.45 | 158 | 1.93 | 4.38 | (0.05 | ) | 76 | |||||||||||||||||||||||||||||||||
| 12.35 | 16.71 | 7,142 | 0.78 | 3.23 | 1.11 | 76 | ||||||||||||||||||||||||||||||||||
| 12.34 | 16.52 | 70 | 0.93 | 3.38 | 0.97 | 76 | ||||||||||||||||||||||||||||||||||
| 12.29 | 16.02 | 12 | 1.43 | 3.88 | 0.45 | 76 | ||||||||||||||||||||||||||||||||||
| The accompanying notes are an integral part of these financial statements. | 101 |
GOLDMAN SACHS FLEXIBLE CAP GROWTH FUND
Financial Highlights
Selected Data for a Share Outstanding Throughout Each Year
| Income (loss) from investment operations | Distributions to shareholders | |||||||||||||||||||||||||||||
| Year - Share Class | Net asset | Net investment income (loss)(a) | Net realized and unrealized gain (loss) | Total from investment operations | From net investment income | From net realized gains | Total distributions | |||||||||||||||||||||||
| FOR THE FISCAL YEARS ENDED AUGUST 31, | ||||||||||||||||||||||||||||||
2016 - A | $ | 11.90 | $ | (0.02 | ) | $ | 0.59 | $ | 0.57 | $ | — | $ | (0.73 | ) | $ | (0.73 | ) | |||||||||||||
2016 - C | 11.00 | (0.10 | ) | 0.54 | 0.44 | — | (0.73 | ) | (0.73 | ) | ||||||||||||||||||||
2016 - Institutional | 12.44 | 0.02 | 0.62 | 0.64 | — | (0.73 | ) | (0.73 | ) | |||||||||||||||||||||
2016 - IR | 12.27 | — | (d) | 0.62 | 0.62 | — | (0.73 | ) | (0.73 | ) | ||||||||||||||||||||
2016 - R | 11.63 | (0.05 | ) | 0.57 | 0.52 | — | (0.73 | ) | (0.73 | ) | ||||||||||||||||||||
2016 - R6 | 12.44 | 0.03 | 0.61 | 0.64 | — | (0.73 | ) | (0.73 | ) | |||||||||||||||||||||
2015 - A | 13.21 | (0.04 | )(e) | 0.63 | 0.59 | — | (1.90 | ) | (1.90 | ) | ||||||||||||||||||||
2015 - C | 12.43 | (0.12 | )(e) | 0.59 | 0.47 | — | (1.90 | ) | (1.90 | ) | ||||||||||||||||||||
2015 - Institutional | 13.68 | 0.01 | (e) | 0.65 | 0.66 | — | (1.90 | ) | (1.90 | ) | ||||||||||||||||||||
2015 - IR | 13.53 | — | (e)(d) | 0.64 | 0.64 | — | (1.90 | ) | (1.90 | ) | ||||||||||||||||||||
2015 - R | 12.97 | (0.07 | )(e) | 0.63 | 0.56 | — | (1.90 | ) | (1.90 | ) | ||||||||||||||||||||
2015 - R6 (Commenced July 31,2015) | 13.38 | — | (e)(d) | (0.94 | ) | (0.94 | ) | — | — | — | ||||||||||||||||||||
2014 - A | 11.83 | (0.05 | ) | 3.01 | 2.96 | — | (1.58 | ) | (1.58 | ) | ||||||||||||||||||||
2014 - C | 11.29 | (0.14 | ) | 2.86 | 2.72 | — | (1.58 | ) | (1.58 | ) | ||||||||||||||||||||
2014 - Institutional | 12.17 | — | (d) | 3.11 | 3.11 | (0.02 | ) | (1.58 | ) | (1.60 | ) | |||||||||||||||||||
2014 - IR | 12.05 | (0.02 | ) | 3.08 | 3.06 | — | (1.58 | ) | (1.58 | ) | ||||||||||||||||||||
2014 - R | 11.66 | (0.08 | ) | 2.97 | 2.89 | — | (1.58 | ) | (1.58 | ) | ||||||||||||||||||||
2013 - A | 11.48 | — | (d)(h) | 1.71 | 1.71 | — | (1.36 | ) | (1.36 | ) | ||||||||||||||||||||
2013 - C | 11.09 | (0.08 | )(h) | 1.64 | 1.56 | — | (1.36 | ) | (1.36 | ) | ||||||||||||||||||||
2013 - Institutional | 11.73 | 0.04 | (h) | 1.76 | 1.80 | — | (1.36 | ) | (1.36 | ) | ||||||||||||||||||||
2013 - IR | 11.64 | 0.03 | (h) | 1.74 | 1.77 | — | (1.36 | ) | (1.36 | ) | ||||||||||||||||||||
2013 - R | 11.36 | (0.02 | )(h) | 1.68 | 1.66 | — | (1.36 | ) | (1.36 | ) | ||||||||||||||||||||
2012 - A | 10.38 | (0.02 | ) | 1.71 | 1.69 | — | (0.59 | ) | (0.59 | ) | ||||||||||||||||||||
2012 - C | 10.12 | (0.10 | ) | 1.66 | 1.56 | — | (0.59 | ) | (0.59 | ) | ||||||||||||||||||||
2012 - Institutional | 10.55 | 0.02 | 1.75 | 1.77 | — | (0.59 | ) | (0.59 | ) | |||||||||||||||||||||
2012 - IR | 10.49 | 0.01 | 1.73 | 1.74 | — | (0.59 | ) | (0.59 | ) | |||||||||||||||||||||
2012 - R | 10.30 | (0.05 | ) | 1.70 | 1.65 | — | (0.59 | ) | (0.59 | ) | ||||||||||||||||||||
| (a) | Calculated based on the average shares outstanding methodology. |
| (b) | Assumes investment at the NAV at the beginning of the year, reinvestment of all dividends and distributions, a complete redemption of the investment at the NAV at the end of the year and no sales or redemption charges. Total returns would be reduced if a sales or redemption charge was taken into account. Returns do not reflect the deduction of taxes that a shareholder would pay on Fund distributions or the redemption of Fund shares. Total returns for periods less than one full year are not annualized. |
| (c) | The Fund’s portfolio turnover rate is calculated in accordance with regulatory requirements, without regard to transactions involving short term investments. If such transactions were included, the Fund’s portfolio turnover rate may be higher. |
| (d) | Amount is less than $0.005 per share. |
| (e) | Reflects income recognized from special dividends which amounted to $0.02 per share and 0.13% of average net assets. |
| (f) | Annualized. |
| (g) | Amount is less than 0.005% of average net assets. |
| (h) | Reflects income recognized from special dividends which amounted to $0.02 per share and 0.20% of average net assets. |
| 102 | The accompanying notes are an integral part of these financial statements. |
GOLDMAN SACHS FLEXIBLE CAP GROWTH FUND
| Net asset value, end of year | Total return(b) | Net assets, end of year (in 000s) | Ratio of net expenses to average net assets | Ratio of total expenses to average net assets | Ratio of net investment income (loss) to average net assets | Portfolio turnover rate(c) | ||||||||||||||||||||||||||||||||||
| $ | 11.74 | 4.93 | % | $ | 5,927 | 1.22 | % | 3.07 | % | (0.21 | )% | 46 | % | |||||||||||||||||||||||||||
| 10.71 | 4.12 | 1,474 | 1.97 | 3.82 | (0.96 | ) | 46 | |||||||||||||||||||||||||||||||||
| 12.35 | 5.29 | 9,330 | 0.82 | 2.68 | 0.20 | 46 | ||||||||||||||||||||||||||||||||||
| 12.16 | 5.20 | 197 | 0.97 | 2.76 | 0.03 | 46 | ||||||||||||||||||||||||||||||||||
| 11.42 | 4.61 | 37 | 1.47 | 3.33 | (0.45 | ) | 46 | |||||||||||||||||||||||||||||||||
| 12.35 | 5.29 | 10 | 0.81 | 2.66 | 0.22 | 46 | ||||||||||||||||||||||||||||||||||
| 11.90 | 4.59 | 7,048 | 1.24 | 2.97 | (0.30 | )(e) | 41 | |||||||||||||||||||||||||||||||||
| 11.00 | 3.83 | 1,802 | 1.98 | 3.71 | (1.04 | )(e) | 41 | |||||||||||||||||||||||||||||||||
| 12.44 | 4.99 | 8,586 | 0.84 | 2.57 | 0.09 | (e) | 41 | |||||||||||||||||||||||||||||||||
| 12.27 | 4.88 | 253 | 0.98 | 2.66 | (0.03 | )(e) | 41 | |||||||||||||||||||||||||||||||||
| 11.63 | 4.43 | 33 | 1.49 | 3.24 | (0.55 | )(e) | 41 | |||||||||||||||||||||||||||||||||
| 12.44 | (7.03 | ) | 9 | 0.84 | (f) | 4.34 | (f) | 0.24 | (e)(f) | 41 | ||||||||||||||||||||||||||||||
| 13.21 | 26.62 | 5,665 | 1.28 | 3.32 | (0.40 | ) | 56 | |||||||||||||||||||||||||||||||||
| 12.43 | 25.68 | 1,119 | 2.03 | 4.09 | (1.15 | ) | 56 | |||||||||||||||||||||||||||||||||
| 13.68 | 27.21 | 8,262 | 0.88 | 2.92 | — | (g) | 56 | |||||||||||||||||||||||||||||||||
| 13.53 | 26.98 | 126 | 1.03 | 3.04 | (0.17 | ) | 56 | |||||||||||||||||||||||||||||||||
| 12.97 | 26.38 | 55 | 1.53 | 3.56 | (0.65 | ) | 56 | |||||||||||||||||||||||||||||||||
| 11.83 | 16.78 | 4,584 | 1.26 | 3.62 | 0.03 | (h) | 40 | |||||||||||||||||||||||||||||||||
| 11.29 | 15.94 | 1,005 | 2.01 | 4.32 | (0.75 | )(h) | 40 | |||||||||||||||||||||||||||||||||
| 12.17 | 17.23 | 6,215 | 0.86 | 3.18 | 0.37 | (h) | 40 | |||||||||||||||||||||||||||||||||
| 12.05 | 17.08 | 167 | 1.01 | 3.35 | 0.26 | (h) | 40 | |||||||||||||||||||||||||||||||||
| 11.66 | 16.50 | 41 | 1.51 | 3.91 | (0.19 | )(h) | 40 | |||||||||||||||||||||||||||||||||
| 11.48 | 17.11 | 7,423 | 1.26 | 3.14 | (0.22 | ) | 32 | |||||||||||||||||||||||||||||||||
| 11.09 | 16.23 | 975 | 2.01 | 3.89 | (0.95 | ) | 32 | |||||||||||||||||||||||||||||||||
| 11.73 | 17.61 | 4,640 | 0.86 | 2.74 | 0.21 | 32 | ||||||||||||||||||||||||||||||||||
| 11.64 | 17.41 | 179 | 1.01 | 2.89 | 0.06 | 32 | ||||||||||||||||||||||||||||||||||
| 11.36 | 16.84 | 63 | 1.51 | 3.39 | (0.43 | ) | 32 | |||||||||||||||||||||||||||||||||
| The accompanying notes are an integral part of these financial statements. | 103 |
GOLDMAN SACHS FOCUSED GROWTH FUND
Financial Highlights
Selected Data for a Share Outstanding Throughout Each Year
| Income (loss) from investment operations | Distributions to shareholders | |||||||||||||||||||||||||||||
| Year - Share Class | Net asset value, beginning of year | Net investment income (loss)(a) | Net realized and unrealized gain (loss) | Total from investment operations | From net investment income | From net realized gains | Total distributions | |||||||||||||||||||||||
| FOR THE FISCAL YEARS ENDED AUGUST 31, | ||||||||||||||||||||||||||||||
2016 - A | $ | 14.36 | $ | 0.01 | (d) | $ | 0.48 | $ | 0.49 | $ | (0.02 | ) | $ | (0.76 | ) | $ | (0.78 | ) | ||||||||||||
2016 - C | 14.01 | (0.09 | )(d) | 0.46 | 0.37 | (0.01 | ) | (0.76 | ) | (0.77 | ) | |||||||||||||||||||
2016 - Institutional | 14.50 | 0.08 | (d) | 0.47 | 0.55 | (0.03 | ) | (0.76 | ) | (0.79 | ) | |||||||||||||||||||
2016 - IR | 14.47 | 0.06 | (d) | 0.47 | 0.53 | (0.01 | ) | (0.76 | ) | (0.77 | ) | |||||||||||||||||||
2016 - R | 14.28 | (0.01 | )(d) | 0.46 | 0.45 | — | (0.76 | ) | (0.76 | ) | ||||||||||||||||||||
2016 - R6 | 14.50 | 0.08 | (d) | 0.47 | 0.55 | (0.03 | ) | (0.76 | ) | (0.79 | ) | |||||||||||||||||||
2015 - A | 14.74 | (0.01 | )(e) | 0.65 | 0.64 | — | (1.02 | ) | (1.02 | ) | ||||||||||||||||||||
2015 - C | 14.51 | (0.10 | )(e) | 0.62 | 0.52 | — | (1.02 | ) | (1.02 | ) | ||||||||||||||||||||
2015 - Institutional | 14.85 | 0.07 | (e) | 0.64 | 0.71 | (0.04 | ) | (1.02 | ) | (1.06 | ) | |||||||||||||||||||
2015 - IR | 14.83 | 0.04 | (e) | 0.64 | 0.68 | (0.02 | ) | (1.02 | ) | (1.04 | ) | |||||||||||||||||||
2015 - R | 14.70 | (0.03 | )(e) | 0.63 | 0.60 | — | (1.02 | ) | (1.02 | ) | ||||||||||||||||||||
2015 - R6 (Commenced July 31, 2015) | 15.27 | — | (e)(f) | (0.77 | ) | (0.77 | ) | — | — | — | ||||||||||||||||||||
2014 - A | 12.95 | (0.05 | ) | 2.77 | 2.72 | — | (0.93 | ) | (0.93 | ) | ||||||||||||||||||||
2014 - C | 12.85 | (0.15 | ) | 2.74 | 2.59 | — | (0.93 | ) | (0.93 | ) | ||||||||||||||||||||
2014 - Institutional | 13.02 | 0.01 | 2.78 | 2.79 | (0.03 | ) | (0.93 | ) | (0.96 | ) | ||||||||||||||||||||
2014 - IR | 13.01 | (0.01 | ) | 2.77 | 2.76 | (0.01 | ) | (0.93 | ) | (0.94 | ) | |||||||||||||||||||
2014 - R | 12.95 | (0.08 | ) | 2.76 | 2.68 | — | (0.93 | ) | (0.93 | ) | ||||||||||||||||||||
2013 - A | 11.35 | 0.01 | (h) | 1.66 | 1.67 | (0.05 | ) | (0.02 | ) | (0.07 | ) | |||||||||||||||||||
2013 - C | 11.31 | (0.06 | )(h) | 1.63 | 1.57 | (0.01 | ) | (0.02 | ) | (0.03 | ) | |||||||||||||||||||
2013 - Institutional | 11.38 | 0.07 | (h) | 1.66 | 1.73 | (0.07 | ) | (0.02 | ) | (0.09 | ) | |||||||||||||||||||
2013 - IR | 11.38 | 0.06 | (h) | 1.65 | 1.71 | (0.06 | ) | (0.02 | ) | (0.08 | ) | |||||||||||||||||||
2013 - R | 11.34 | — | (f)(h) | 1.64 | 1.64 | (0.01 | ) | (0.02 | ) | (0.03 | ) | |||||||||||||||||||
| FOR THE PERIOD ENDED AUGUST 31, | ||||||||||||||||||||||||||||||
2012 - A (Commenced January 31, 2012) | 10.00 | — | (f) | 1.35 | 1.35 | — | — | — | ||||||||||||||||||||||
2012 - C (Commenced January 31, 2012) | 10.00 | (0.05 | ) | 1.36 | 1.31 | — | — | — | ||||||||||||||||||||||
2012 - Institutional (Commenced January 31, 2012) | 10.00 | 0.02 | 1.36 | 1.38 | — | — | — | |||||||||||||||||||||||
2012 - IR (Commenced January 31, 2012) | 10.00 | 0.01 | 1.37 | 1.38 | — | — | — | |||||||||||||||||||||||
2012 - R (Commenced January 31, 2012) | 10.00 | (0.02 | ) | 1.36 | 1.34 | — | — | — | ||||||||||||||||||||||
| (a) | Calculated based on the average shares outstanding methodology. |
| (b) | Assumes investment at NAV at the beginning of the year, reinvestment of all dividends and distributions, a complete redemption of the investment at the NAV at the end of the year and no sales or redemption charges. Total returns would be reduced if a sales or redemption charge was taken into account. Returns do not reflect the deduction of taxes that a shareholder would pay on Fund distributions or the redemption of Fund shares. Total returns for periods less than one full year are not annualized. |
| (c) | The Fund’s portfolio turnover rate is calculated in accordance with regulatory requirements, without regard to transactions involving short term investments. If such transactions were included, the Fund’s portfolio turnover rate may be higher. |
| (d) | Reflects income recognized from special dividends which amounted to $0.04 per share and 0.25% of average net assets. |
| (e) | Reflects income recognized from special dividends which amounted to $0.05 per share and 0.31% of average net assets. |
| (f) | Amount is less than $0.005 per share. |
| (g) | Annualized. |
| (h) | Reflects income recognized from special dividends which amounted to $0.02 per share and 0.18% of average net assets. |
| 104 | The accompanying notes are an integral part of these financial statements. |
GOLDMAN SACHS FOCUSED GROWTH FUND
| Net asset value, end of year | Total return(b) | Net assets, end of year (in 000s) | Ratio of net expenses to average net assets | Ratio of total expenses to average net assets | Ratio of net investment income (loss) to average net assets | Portfolio turnover rate(c) | ||||||||||||||||||||||||||||||||||
| $ | 14.07 | 3.36 | % | $ | 243 | 1.21 | % | 2.35 | % | 0.10 | %(d) | 55 | % | |||||||||||||||||||||||||||
| 13.61 | 2.56 | 169 | 1.96 | 3.14 | (0.69 | )(d) | 55 | |||||||||||||||||||||||||||||||||
| 14.26 | 3.75 | 24,116 | 0.82 | 1.91 | 0.56 | (d) | 55 | |||||||||||||||||||||||||||||||||
| 14.23 | 3.65 | 58 | 0.96 | 1.90 | 0.40 | (d) | 55 | |||||||||||||||||||||||||||||||||
| 13.97 | 3.07 | 17 | 1.47 | 2.56 | (0.10 | )(d) | 55 | |||||||||||||||||||||||||||||||||
| 14.26 | 3.77 | 10 | 0.78 | 1.87 | 0.59 | (d) | 55 | |||||||||||||||||||||||||||||||||
| 14.36 | 4.27 | 148 | 1.24 | 2.22 | (0.05 | )(e) | 67 | |||||||||||||||||||||||||||||||||
| 14.01 | 3.47 | 53 | 1.99 | 3.00 | (0.70 | )(e) | 67 | |||||||||||||||||||||||||||||||||
| 14.50 | 4.72 | 33,335 | 0.84 | 1.85 | 0.45 | (e) | 67 | |||||||||||||||||||||||||||||||||
| 14.47 | 4.50 | 17 | 1.01 | 2.02 | 0.30 | (e) | 67 | |||||||||||||||||||||||||||||||||
| 14.28 | 3.99 | 16 | 1.49 | 2.50 | (0.19 | )(e) | 67 | |||||||||||||||||||||||||||||||||
| 14.50 | (5.04 | ) | 9 | 0.81 | (g) | 2.05 | (g) | 0.24 | (e)(g) | 67 | ||||||||||||||||||||||||||||||
| 14.74 | 21.60 | 42 | 1.26 | 2.83 | (0.37 | ) | 97 | |||||||||||||||||||||||||||||||||
| 14.51 | 20.71 | 39 | 2.01 | 3.49 | (1.05 | ) | 97 | |||||||||||||||||||||||||||||||||
| 14.85 | 22.00 | 24,346 | 0.86 | 2.31 | 0.10 | 97 | ||||||||||||||||||||||||||||||||||
| 14.83 | 21.83 | 16 | 1.01 | 2.51 | (0.08 | ) | 97 | |||||||||||||||||||||||||||||||||
| 14.70 | 21.28 | 16 | 1.51 | 3.01 | (0.58 | ) | 97 | |||||||||||||||||||||||||||||||||
| 12.95 | 14.79 | 56 | 1.24 | 6.12 | 0.08 | (h) | 87 | |||||||||||||||||||||||||||||||||
| 12.85 | 13.94 | 23 | 1.99 | 6.91 | (0.52 | )(h) | 87 | |||||||||||||||||||||||||||||||||
| 13.02 | 15.33 | 12,838 | 0.84 | 4.59 | 0.53 | (h) | 87 | |||||||||||||||||||||||||||||||||
| 13.01 | 15.08 | 13 | 1.00 | 6.58 | 0.52 | (h) | 87 | |||||||||||||||||||||||||||||||||
| 12.95 | 14.53 | 13 | 1.49 | 7.08 | 0.02 | (h) | 87 | |||||||||||||||||||||||||||||||||
| 11.35 | 13.50 | 35 | 1.24 | (g) | 17.07 | (g) | 0.04 | (g) | 23 | |||||||||||||||||||||||||||||||
| 11.31 | 13.10 | 11 | 1.99 | (g) | 17.82 | (g) | (0.81 | )(g) | 23 | |||||||||||||||||||||||||||||||
| 11.38 | 13.80 | 3,417 | 0.84 | (g) | 16.67 | (g) | 0.36 | (g) | 23 | |||||||||||||||||||||||||||||||
| 11.38 | 13.80 | 11 | 0.99 | (g) | 16.82 | (g) | 0.22 | (g) | 23 | |||||||||||||||||||||||||||||||
| 11.34 | 13.40 | 11 | 1.49 | (g) | 17.32 | (g) | (0.30 | )(g) | 23 | |||||||||||||||||||||||||||||||
| The accompanying notes are an integral part of these financial statements. | 105 |
GOLDMAN SACHS GROWTH OPPORTUNITIES FUND
Financial Highlights
Selected Data for a Share Outstanding Throughout Each Year
| Income (loss) from investment operations | ||||||||||||||||||||||
| Year - Share Class | Net asset value, beginning of year | Net investment income (loss)(a) | Net realized and unrealized gain (loss) | Total from investment operations | Distribution to shareholders from net realized gains | |||||||||||||||||
| FOR THE FISCAL YEARS ENDED AUGUST 31, | ||||||||||||||||||||||
2016 - A | $ | 23.84 | $ | (0.10 | )(d) | $ | 0.77 | $ | 0.67 | $ | (2.81 | ) | ||||||||||
2016 - C | 18.95 | (0.20 | )(d) | 0.58 | 0.38 | (2.81 | ) | |||||||||||||||
2016 - Institutional | 26.71 | (0.03 | )(d) | 0.89 | 0.86 | (2.81 | ) | |||||||||||||||
2016 - Service | 23.11 | (0.13 | )(d) | 0.75 | 0.62 | (2.81 | ) | |||||||||||||||
2016 - IR | 24.52 | (0.05 | )(d) | 0.80 | 0.75 | (2.81 | ) | |||||||||||||||
2016 - R | 23.21 | (0.15 | )(d) | 0.74 | 0.59 | (2.81 | ) | |||||||||||||||
2016 - R6 | 26.71 | (0.04 | )(d) | 0.91 | 0.87 | (2.81 | ) | |||||||||||||||
2015 - A | 30.22 | (0.17 | )(e) | (0.05 | ) | (0.22 | ) | (6.16 | ) | |||||||||||||
2015 - C | 25.42 | (0.30 | )(e) | (0.01 | ) | (0.31 | ) | (6.16 | ) | |||||||||||||
2015 - Institutional | 33.02 | (0.07 | )(e) | (0.08 | ) | (0.15 | ) | (6.16 | ) | |||||||||||||
2015 - Service | 29.51 | (0.19 | )(e) | (0.05 | ) | (0.24 | ) | (6.16 | ) | |||||||||||||
2015 - IR | 30.85 | (0.11 | )(e) | (0.06 | ) | (0.17 | ) | (6.16 | ) | |||||||||||||
2015 - R | 29.65 | (0.23 | )(e) | (0.05 | ) | (0.28 | ) | (6.16 | ) | |||||||||||||
2015 - R6 (Commenced July 31, 2015) | 28.49 | (0.01 | )(e) | (1.77 | ) | (1.78 | ) | — | ||||||||||||||
2014 - A | 26.65 | (0.19 | ) | 5.95 | 5.76 | (2.19 | ) | |||||||||||||||
2014 - C | 22.89 | (0.34 | ) | 5.06 | 4.72 | (2.19 | ) | |||||||||||||||
2014 - Institutional | 28.83 | (0.08 | ) | 6.46 | 6.38 | (2.19 | ) | |||||||||||||||
2014 - Service | 26.10 | (0.21 | ) | 5.81 | 5.60 | (2.19 | ) | |||||||||||||||
2014 - IR | 27.10 | (0.12 | ) | 6.06 | 5.94 | (2.19 | ) | |||||||||||||||
2014 - R | 26.25 | (0.25 | ) | 5.84 | 5.59 | (2.19 | ) | |||||||||||||||
2013 - A | 23.88 | (0.11 | )(g) | 4.53 | 4.42 | (1.65 | ) | |||||||||||||||
2013 - C | 20.89 | (0.26 | )(g) | 3.91 | 3.65 | (1.65 | ) | |||||||||||||||
2013 - Institutional | 25.59 | (0.01 | )(g) | 4.90 | 4.89 | (1.65 | ) | |||||||||||||||
2013 - Service | 23.44 | (0.13 | )(g) | 4.44 | 4.31 | (1.65 | ) | |||||||||||||||
2013 - IR | 24.19 | (0.05 | )(g) | 4.61 | 4.56 | (1.65 | ) | |||||||||||||||
2013 - R | 23.59 | (0.17 | )(g) | 4.48 | 4.31 | (1.65 | ) | |||||||||||||||
2012 - A | 21.36 | (0.15 | ) | 4.06 | 3.91 | (1.39 | ) | |||||||||||||||
2012 - C | 18.99 | (0.28 | ) | 3.57 | 3.29 | (1.39 | ) | |||||||||||||||
2012 - Institutional | 22.71 | (0.06 | ) | 4.33 | 4.27 | (1.39 | ) | |||||||||||||||
2012 - Service | 21.01 | (0.17 | ) | 3.99 | 3.82 | (1.39 | ) | |||||||||||||||
2012 - IR | 21.57 | (0.09 | ) | 4.10 | 4.01 | (1.39 | ) | |||||||||||||||
2012 - R | 21.17 | (0.20 | ) | 4.01 | 3.81 | (1.39 | ) | |||||||||||||||
| (a) | Calculated based on the average shares outstanding methodology. |
| (b) | Assumes investment at the NAV at the beginning of the year, reinvestment of all dividends and distributions, a complete redemption of the investment at the NAV at the end of the year and no sales or redemption charges. Total returns would be reduced if a sales or redemption charge was taken into account. Returns do not reflect the deduction of taxes that a shareholder would pay on Fund distributions or the redemption of Fund shares. Total returns for periods less than one full year are not annualized. |
| (c) | The Fund’s portfolio turnover rate is calculated in accordance with regulatory requirements, without regard to transactions involving short term investments. If such transactions were included, the Fund’s portfolio turnover rate may be higher. |
| (d) | Reflects income recognized from special dividends which amounted to $0.04 per share and 0.16% of average net assets. |
| (e) | Reflects income recognized from special dividends which amounted to $0.03 per share and 0.10% of average net assets. |
| (f) | Annualized. |
| (g) | Reflects income recognized from special dividends which amounted to $0.04 per share and 0.17% of average net assets. |
| 106 | The accompanying notes are an integral part of these financial statements. |
GOLDMAN SACHS GROWTH OPPORTUNITIES FUND
| Net asset value, end of year | Total return(b) | Net assets, end of year (in 000s) | Ratio of net expenses to average net assets | Ratio of total expenses to average net assets | Ratio of net investment income (loss) to average net assets | Portfolio turnover rate(c) | ||||||||||||||||||||||||||||||||||
| $ | 21.70 | 3.39 | % | $ | 631,053 | 1.32 | % | 1.42 | % | (0.47 | )%(d) | 55 | % | |||||||||||||||||||||||||||
| 16.52 | 2.66 | 128,788 | 2.07 | 2.17 | (1.23 | )(d) | 55 | |||||||||||||||||||||||||||||||||
| 24.76 | 3.76 | 2,160,714 | 0.95 | 1.02 | (0.11 | )(d) | 55 | |||||||||||||||||||||||||||||||||
| 20.92 | 3.27 | 37,432 | 1.45 | 1.52 | (0.61 | )(d) | 55 | |||||||||||||||||||||||||||||||||
| 22.46 | 3.64 | 135,930 | 1.07 | 1.17 | (0.23 | )(d) | 55 | |||||||||||||||||||||||||||||||||
| 20.99 | 3.12 | 63,105 | 1.57 | 1.67 | (0.73 | )(d) | 55 | |||||||||||||||||||||||||||||||||
| 24.77 | 3.81 | 44,865 | 0.93 | 1.01 | (0.19 | )(d) | 55 | |||||||||||||||||||||||||||||||||
| 23.84 | (1.47 | ) | 946,463 | 1.35 | 1.40 | (0.65 | )(e) | 51 | ||||||||||||||||||||||||||||||||
| 18.95 | (2.23 | ) | 168,461 | 2.10 | 2.15 | (1.40 | )(e) | 51 | ||||||||||||||||||||||||||||||||
| 26.71 | (1.08 | ) | 3,171,058 | 0.95 | 1.00 | (0.24 | )(e) | 51 | ||||||||||||||||||||||||||||||||
| 23.11 | (1.59 | ) | 49,105 | 1.45 | 1.50 | (0.75 | )(e) | 51 | ||||||||||||||||||||||||||||||||
| 24.52 | (1.25 | ) | 171,980 | 1.10 | 1.15 | (0.41 | )(e) | 51 | ||||||||||||||||||||||||||||||||
| 23.21 | (1.74 | ) | 77,673 | 1.60 | 1.65 | (0.90 | )(e) | 51 | ||||||||||||||||||||||||||||||||
| 26.71 | (6.25 | ) | 9 | 0.97 | (f) | 1.02 | (f) | (0.32 | )(e)(f) | 51 | ||||||||||||||||||||||||||||||
| 30.22 | 22.57 | 1,110,320 | 1.36 | 1.40 | (0.66 | ) | 59 | |||||||||||||||||||||||||||||||||
| 25.42 | 21.67 | 191,125 | 2.11 | 2.15 | (1.41 | ) | 59 | |||||||||||||||||||||||||||||||||
| 33.02 | 23.04 | 3,750,790 | 0.96 | 1.00 | (0.26 | ) | 59 | |||||||||||||||||||||||||||||||||
| 29.51 | 22.42 | 57,643 | 1.46 | 1.50 | (0.76 | ) | 59 | |||||||||||||||||||||||||||||||||
| 30.85 | 22.87 | 143,249 | 1.11 | 1.15 | (0.41 | ) | 59 | |||||||||||||||||||||||||||||||||
| 29.65 | 22.25 | 80,542 | 1.61 | 1.65 | (0.91 | ) | 59 | |||||||||||||||||||||||||||||||||
| 26.65 | 19.84 | 1,130,449 | 1.35 | 1.41 | (0.44 | )(g) | 41 | |||||||||||||||||||||||||||||||||
| 22.89 | 18.94 | 172,010 | 2.10 | 2.16 | (1.19 | )(g) | 41 | |||||||||||||||||||||||||||||||||
| 28.83 | 20.38 | 3,207,925 | 0.95 | 1.01 | (0.05 | )(g) | 41 | |||||||||||||||||||||||||||||||||
| 26.10 | 19.74 | 60,977 | 1.45 | 1.51 | (0.54 | )(g) | 41 | |||||||||||||||||||||||||||||||||
| 27.10 | 20.18 | 91,093 | 1.10 | 1.16 | (0.21 | )(g) | 41 | |||||||||||||||||||||||||||||||||
| 26.25 | 19.61 | 71,263 | 1.60 | 1.66 | (0.71 | )(g) | 41 | |||||||||||||||||||||||||||||||||
| 23.88 | 19.15 | 1,068,187 | 1.35 | 1.41 | (0.67 | ) | 59 | |||||||||||||||||||||||||||||||||
| 20.89 | 18.24 | 157,901 | 2.10 | 2.16 | (1.42 | ) | 59 | |||||||||||||||||||||||||||||||||
| 25.59 | 19.61 | 2,710,810 | 0.95 | 1.01 | (0.27 | ) | 59 | |||||||||||||||||||||||||||||||||
| 23.44 | 19.03 | 59,834 | 1.45 | 1.51 | (0.77 | ) | 59 | |||||||||||||||||||||||||||||||||
| 24.19 | 19.43 | 75,702 | 1.10 | 1.16 | (0.42 | ) | 59 | |||||||||||||||||||||||||||||||||
| 23.59 | 18.83 | 54,071 | 1.60 | 1.66 | (0.91 | ) | 59 | |||||||||||||||||||||||||||||||||
| The accompanying notes are an integral part of these financial statements. | 107 |
GOLDMAN SACHS SMALL/MID CAP GROWTH FUND
Financial Highlights
Selected Data for a Share Outstanding Throughout Each Year
| Income (loss) from investment operations | ||||||||||||||||||||||
| Year - Share Class | Net asset value, beginning of year | Net investment income (loss)(a) | Net realized and unrealized gain (loss) | Total from investment operations | Distributions to shareholders from net realized gains | |||||||||||||||||
| FOR THE FISCAL YEARS ENDED AUGUST 31, | ||||||||||||||||||||||
2016 - A | $ | 20.72 | $ | (0.14 | )(d) | $ | — | $ | (0.14 | ) | $ | (0.73 | ) | |||||||||
2016 - C | 18.74 | (0.25 | )(d) | (0.01 | ) | (0.26 | ) | (0.73 | ) | |||||||||||||
2016 - Institutional | 21.69 | (0.07 | )(d) | — | (0.07 | ) | (0.73 | ) | ||||||||||||||
2016 - Service | 20.35 | (0.16 | )(d) | — | (0.16 | ) | (0.73 | ) | ||||||||||||||
2016 - IR | 21.21 | (0.09 | )(d) | — | (0.09 | ) | (0.73 | ) | ||||||||||||||
2016 - R | 20.26 | (0.18 | )(d) | (0.01 | ) | (0.19 | ) | (0.73 | ) | |||||||||||||
2016 - R6 | 21.69 | (0.06 | )(d) | (0.01 | ) | (0.07 | ) | (0.73 | ) | |||||||||||||
2015 - A | 20.90 | (0.18 | )(e) | 1.71 | 1.53 | (1.71 | ) | |||||||||||||||
2015 - C | 19.20 | (0.31 | )(e) | 1.56 | 1.25 | (1.71 | ) | |||||||||||||||
2015 - Institutional | 21.71 | (0.10 | )(e) | 1.79 | 1.69 | (1.71 | ) | |||||||||||||||
2015 - Service | 20.58 | (0.20 | )(e) | 1.68 | 1.48 | (1.71 | ) | |||||||||||||||
2015 - IR | 21.30 | (0.13 | )(e) | 1.75 | 1.62 | (1.71 | ) | |||||||||||||||
2015 - R | 20.51 | (0.23 | )(e) | 1.69 | 1.46 | (1.71 | ) | |||||||||||||||
2015 - R6 (Commenced July 31, 2015) | 23.47 | (0.01 | )(e) | (1.77 | ) | (1.78 | ) | — | ||||||||||||||
2014 - A | 18.63 | (0.16 | )(g) | 3.43 | 3.27 | (1.00 | ) | |||||||||||||||
2014 - C | 17.31 | (0.29 | )(g) | 3.18 | 2.89 | (1.00 | ) | |||||||||||||||
2014 - Institutional | 19.25 | (0.09 | )(g) | 3.55 | 3.46 | (1.00 | ) | |||||||||||||||
2014 - Service | 18.38 | (0.18 | )(g) | 3.38 | 3.20 | (1.00 | ) | |||||||||||||||
2014 - IR | 18.93 | (0.12 | )(g) | 3.49 | 3.37 | (1.00 | ) | |||||||||||||||
2014 - R | 18.35 | (0.21 | )(g) | 3.37 | 3.16 | (1.00 | ) | |||||||||||||||
2013 - A | 15.52 | (0.11 | )(h) | 3.99 | 3.88 | (0.77 | ) | |||||||||||||||
2013 - C | 14.58 | (0.23 | )(h) | 3.73 | 3.50 | (0.77 | ) | |||||||||||||||
2013 - Institutional | 15.95 | (0.06 | )(h) | 4.13 | 4.07 | (0.77 | ) | |||||||||||||||
2013 - Service | 15.34 | (0.13 | )(h) | 3.94 | 3.81 | (0.77 | ) | |||||||||||||||
2013 - IR | 15.72 | (0.08 | )(h) | 4.06 | 3.98 | (0.77 | ) | |||||||||||||||
2013 - R | 15.34 | (0.15 | )(h) | 3.93 | 3.78 | (0.77 | ) | |||||||||||||||
2012 - A | 13.67 | (0.12 | ) | 2.63 | 2.51 | (0.66 | ) | |||||||||||||||
2012 - C | 12.98 | (0.21 | ) | 2.47 | 2.26 | (0.66 | ) | |||||||||||||||
2012 - Institutional | 13.98 | (0.06 | ) | 2.69 | 2.63 | (0.66 | ) | |||||||||||||||
2012 - Service | 13.53 | (0.13 | ) | 2.60 | 2.47 | (0.66 | ) | |||||||||||||||
2012 - IR | 13.81 | (0.08 | ) | 2.65 | 2.57 | (0.66 | ) | |||||||||||||||
2012 - R | 13.55 | (0.15 | ) | 2.60 | 2.45 | (0.66 | ) | |||||||||||||||
| (a) | Calculated based on the average shares outstanding methodology. |
| (b) | Assumes investment at the NAV at the beginning of the year, reinvestment of all dividends and distributions, a complete redemption of the investment at the NAV at the end of the year and no sales or redemption charges. Total returns would be reduced if a sales or redemption charge was taken into account. Returns do not reflect the deduction of taxes that a shareholder would pay on Fund distributions or the redemption of Fund shares. Total returns for periods less than one full year are not annualized. |
| (c) | The Fund’s portfolio turnover rate is calculated in accordance with regulatory requirements, without regard to transactions involving short term investments. If such transactions were included, the Fund’s portfolio turnover rate may be higher. |
| (d) | Reflects income recognized from special dividends which amounted to $0.03 per share and 0.15% of average net assets. |
| (e) | Reflects income recognized from special dividends which amounted to $0.01 per share and 0.05% of average net assets. |
| (f) | Annualized. |
| (g) | Reflects income recognized from special dividends which amounted to $0.01 per share and 0.12% of average net assets. |
| (h) | Reflects income recognized from special dividends which amounted to $0.02 per share and 0.14% of average net assets. |
| 108 | The accompanying notes are an integral part of these financial statements. |
GOLDMAN SACHS SMALL/MID CAP GROWTH FUND
| Net asset value, end of year | Total return(b) | Net assets, end of year (in 000s) | Ratio of net expenses to average net assets | Ratio of total expenses to average net assets | Ratio of net investment income (loss) to average net assets | Portfolio turnover rate(c) | ||||||||||||||||||||||||||||||||||
| $ | 19.85 | (0.56 | )% | $ | 736,221 | 1.31 | % | 1.45 | % | (0.73 | )%(d) | 67 | % | |||||||||||||||||||||||||||
| 17.75 | (1.34 | ) | 265,282 | 2.06 | 2.20 | (1.48 | )(d) | 67 | ||||||||||||||||||||||||||||||||
| 20.89 | (0.21 | ) | 1,235,282 | 0.93 | 1.05 | (0.35 | )(d) | 67 | ||||||||||||||||||||||||||||||||
| 19.46 | (0.67 | ) | 13,956 | 1.43 | 1.55 | (0.85 | )(d) | 67 | ||||||||||||||||||||||||||||||||
| 20.39 | (0.31 | ) | 313,812 | 1.06 | 1.20 | (0.48 | )(d) | 67 | ||||||||||||||||||||||||||||||||
| 19.34 | (0.83 | ) | 34,493 | 1.56 | 1.70 | (0.98 | )(d) | 67 | ||||||||||||||||||||||||||||||||
| 20.89 | (0.21 | ) | 9,785 | 0.92 | 1.04 | (0.28 | )(d) | 67 | ||||||||||||||||||||||||||||||||
| 20.72 | 7.67 | 906,362 | 1.33 | 1.45 | (0.85 | )(e) | 47 | |||||||||||||||||||||||||||||||||
| 18.74 | 6.84 | 268,384 | 2.08 | 2.20 | (1.60 | )(e) | 47 | |||||||||||||||||||||||||||||||||
| 21.69 | 8.15 | 1,355,322 | 0.93 | 1.05 | (0.45 | )(e) | 47 | |||||||||||||||||||||||||||||||||
| 20.35 | 7.54 | 12,695 | 1.42 | 1.55 | (0.95 | )(e) | 47 | |||||||||||||||||||||||||||||||||
| 21.21 | 7.97 | 221,058 | 1.08 | 1.20 | (0.60 | )(e) | 47 | |||||||||||||||||||||||||||||||||
| 20.26 | 7.46 | 34,697 | 1.58 | 1.70 | (1.10 | )(e) | 47 | |||||||||||||||||||||||||||||||||
| 21.69 | (7.58 | ) | 9 | 0.92 | (f) | 1.05 | (f) | (0.34 | )(e)(f) | 47 | ||||||||||||||||||||||||||||||
| 20.90 | 17.97 | 741,254 | 1.33 | 1.48 | (0.82 | )(g) | 43 | |||||||||||||||||||||||||||||||||
| 19.20 | 17.11 | 221,451 | 2.08 | 2.23 | (1.57 | )(g) | 43 | |||||||||||||||||||||||||||||||||
| 21.71 | 18.39 | 1,077,769 | 0.93 | 1.08 | (0.42 | )(g) | 43 | |||||||||||||||||||||||||||||||||
| 20.58 | 17.83 | 8,692 | 1.43 | 1.58 | (0.92 | )(g) | 43 | |||||||||||||||||||||||||||||||||
| 21.30 | 18.22 | 171,779 | 1.08 | 1.23 | (0.57 | )(g) | 43 | |||||||||||||||||||||||||||||||||
| 20.51 | 17.63 | 34,118 | 1.58 | 1.73 | (1.07 | )(g) | 43 | |||||||||||||||||||||||||||||||||
| 18.63 | 26.18 | 592,798 | 1.34 | 1.49 | (0.68 | )(h) | 37 | |||||||||||||||||||||||||||||||||
| 17.31 | 25.23 | 150,744 | 2.09 | 2.24 | (1.44 | )(h) | 37 | |||||||||||||||||||||||||||||||||
| 19.25 | 26.68 | 725,662 | 0.94 | 1.09 | (0.32 | )(h) | 37 | |||||||||||||||||||||||||||||||||
| 18.38 | 26.02 | 8,495 | 1.44 | 1.59 | (0.77 | )(h) | 37 | |||||||||||||||||||||||||||||||||
| 18.93 | 26.49 | 93,255 | 1.09 | 1.24 | (0.45 | )(h) | 37 | |||||||||||||||||||||||||||||||||
| 18.35 | 25.82 | 24,420 | 1.59 | 1.74 | (0.93 | )(h) | 37 | |||||||||||||||||||||||||||||||||
| 15.52 | 18.97 | 393,284 | 1.35 | 1.50 | (0.83 | ) | 51 | |||||||||||||||||||||||||||||||||
| 14.58 | 18.03 | 87,185 | 2.10 | 2.25 | (1.58 | ) | 51 | |||||||||||||||||||||||||||||||||
| 15.95 | 19.42 | 291,636 | 0.95 | 1.10 | (0.43 | ) | 51 | |||||||||||||||||||||||||||||||||
| 15.34 | 18.87 | 6,774 | 1.45 | 1.60 | (0.92 | ) | 51 | |||||||||||||||||||||||||||||||||
| 15.72 | 19.22 | 46,777 | 1.10 | 1.25 | (0.57 | ) | 51 | |||||||||||||||||||||||||||||||||
| 15.34 | 18.69 | 19,156 | 1.60 | 1.75 | (1.07 | ) | 51 | |||||||||||||||||||||||||||||||||
| The accompanying notes are an integral part of these financial statements. | 109 |
GOLDMAN SACHS STRATEGIC GROWTH FUND
Financial Highlights
Selected Data for a Share Outstanding Throughout Each Year
| Income (loss) from investment operations | Distributions to shareholders | |||||||||||||||||||||||||||||
| Year - Share Class | Net asset value, beginning of year | Net investment income (loss)(a) | Net realized and unrealized gain (loss) | Total from investment operations | From net investment income | From net realized gains | Total distributions | |||||||||||||||||||||||
| FOR THE FISCAL YEARS ENDED AUGUST 31, | ||||||||||||||||||||||||||||||
2016 - A | $ | 11.86 | $ | 0.02 | $ | 0.74 | $ | 0.76 | $ | (0.02 | ) | $ | (0.69 | ) | $ | (0.71 | ) | |||||||||||||
2016 - C | 10.12 | (0.05 | ) | 0.62 | 0.57 | — | (0.69 | ) | (0.69 | ) | ||||||||||||||||||||
2016 - Institutional | 12.53 | 0.07 | 0.78 | 0.85 | (0.05 | ) | (0.69 | ) | (0.74 | ) | ||||||||||||||||||||
2016 - Service | 11.81 | 0.01 | 0.73 | 0.74 | (0.01 | ) | (0.69 | ) | (0.70 | ) | ||||||||||||||||||||
2016 - IR | 12.53 | 0.05 | 0.78 | 0.83 | (0.04 | ) | (0.69 | ) | (0.73 | ) | ||||||||||||||||||||
2016 - R | 11.74 | (0.01 | ) | 0.73 | 0.72 | (0.02 | ) | (0.69 | ) | (0.71 | ) | |||||||||||||||||||
2016 - R6 | 12.53 | 0.07 | 0.77 | 0.84 | (0.05 | ) | (0.69 | ) | (0.74 | ) | ||||||||||||||||||||
2015 - A | 13.50 | 0.02 | (d) | 0.42 | 0.44 | — | (2.08 | ) | (2.08 | ) | ||||||||||||||||||||
2015 - C | 11.90 | (0.07 | )(d) | 0.37 | 0.30 | — | (2.08 | ) | (2.08 | ) | ||||||||||||||||||||
2015 - Institutional | 14.15 | 0.07 | (d) | 0.43 | 0.50 | (0.04 | ) | (2.08 | ) | (2.12 | ) | |||||||||||||||||||
2015 - Service | 13.47 | — | (e)(d) | 0.42 | 0.42 | — | (2.08 | ) | (2.08 | ) | ||||||||||||||||||||
2015 - IR | 14.14 | 0.05 | (d) | 0.44 | 0.49 | (0.02 | ) | (2.08 | ) | (2.10 | ) | |||||||||||||||||||
2015 - R | 13.42 | (0.01 | )(d) | 0.41 | 0.40 | — | (2.08 | ) | (2.08 | ) | ||||||||||||||||||||
2015 - R6 (Commenced July 31, 2015) | 13.36 | 0.01 | (d) | (0.84 | ) | (0.83 | ) | — | — | — | ||||||||||||||||||||
2014 - A | 12.29 | (0.01 | ) | 3.06 | 3.05 | (0.01 | ) | (1.83 | ) | (1.84 | ) | |||||||||||||||||||
2014 - C | 11.09 | (0.10 | ) | 2.74 | 2.64 | — | (1.83 | ) | (1.83 | ) | ||||||||||||||||||||
2014 - Institutional | 12.79 | 0.04 | 3.21 | 3.25 | (0.06 | ) | (1.83 | ) | (1.89 | ) | ||||||||||||||||||||
2014 - Service | 12.28 | (0.02 | ) | 3.05 | 3.03 | (0.01 | ) | (1.83 | ) | (1.84 | ) | |||||||||||||||||||
2014 - IR | 12.80 | 0.02 | 3.20 | 3.22 | (0.05 | ) | (1.83 | ) | (1.88 | ) | ||||||||||||||||||||
2014 - R | 12.26 | (0.04 | ) | 3.05 | 3.01 | (0.02 | ) | (1.83 | ) | (1.85 | ) | |||||||||||||||||||
2013 - A | 11.57 | 0.06 | (g) | 1.58 | 1.64 | (0.05 | ) | (0.87 | ) | (0.92 | ) | |||||||||||||||||||
2013 - C | 10.54 | (0.04 | )(g) | 1.46 | 1.42 | — | (0.87 | ) | (0.87 | ) | ||||||||||||||||||||
2013 - Institutional | 12.00 | 0.10 | (g) | 1.66 | 1.76 | (0.10 | ) | (0.87 | ) | (0.97 | ) | |||||||||||||||||||
2013 - Service | 11.59 | 0.03 | (g) | 1.61 | 1.64 | (0.08 | ) | (0.87 | ) | (0.95 | ) | |||||||||||||||||||
2013 - IR | 12.01 | 0.07 | (g) | 1.68 | 1.75 | (0.09 | ) | (0.87 | ) | (0.96 | ) | |||||||||||||||||||
2013 - R | 11.53 | 0.03 | (g) | 1.60 | 1.63 | (0.03 | ) | (0.87 | ) | (0.90 | ) | |||||||||||||||||||
2012 - A | 9.77 | 0.01 | 1.81 | 1.82 | (0.02 | ) | — | (0.02 | ) | |||||||||||||||||||||
2012 - C | 8.95 | (0.06 | ) | 1.65 | 1.59 | — | — | — | ||||||||||||||||||||||
2012 - Institutional | 10.14 | 0.06 | 1.86 | 1.92 | (0.06 | ) | — | (0.06 | ) | |||||||||||||||||||||
2012 - Service | 9.80 | 0.02 | 1.79 | 1.81 | (0.02 | ) | — | (0.02 | ) | |||||||||||||||||||||
2012 - IR | 10.10 | 0.04 | 1.87 | 1.91 | — | — | — | |||||||||||||||||||||||
2012 - R | 9.74 | — | (e) | 1.79 | 1.79 | — | — | — | ||||||||||||||||||||||
| (a) | Calculated based on the average shares outstanding methodology. |
| (b) | Assumes investment at the NAV at the beginning of the year, reinvestment of all dividends and distributions, a complete redemption of the investment at the NAV at the end of the year and no sales or redemption charges. Total returns would be reduced if a sales or redemption charge was taken into account. Returns do not reflect the deduction of taxes that a shareholder would pay on Fund distributions or the redemption of Fund shares. Total returns for periods less than one full year are not annualized. |
| (c) | The Fund’s portfolio turnover rate is calculated in accordance with regulatory requirements, without regard to transactions involving short term investments. If such transactions were included, the Fund’s portfolio turnover rate may be higher. |
| (d) | Reflects income recognized from special dividends which amounted to $0.02 per share and 0.18% of average net assets. |
| (e) | Amount is less than $0.005 per share. |
| (f) | Annualized. |
| (g) | Reflects income recognized from special dividends which amounted to $0.03 per share and 0.29% of average net assets. |
| 110 | The accompanying notes are an integral part of these financial statements. |
GOLDMAN SACHS STRATEGIC GROWTH FUND
| Net asset value, end of year | Total return(b) | Net assets, end of year (in 000s) | Ratio of net expenses to average net assets | Ratio of total expenses to average net assets | Ratio of net investment income (loss) to average net assets | Portfolio turnover rate(c) | ||||||||||||||||||||||||||||||||||
| $ | 11.91 | 6.48 | % | $ | 46,093 | 1.15 | % | 1.54 | % | 0.19 | % | 56 | % | |||||||||||||||||||||||||||
| 10.00 | 5.70 | 11,103 | 1.90 | 2.29 | (0.56 | ) | 56 | |||||||||||||||||||||||||||||||||
| 12.64 | 6.89 | 294,952 | 0.75 | 1.14 | 0.59 | 56 | ||||||||||||||||||||||||||||||||||
| 11.85 | 6.40 | 272 | 1.25 | 1.64 | 0.11 | 56 | ||||||||||||||||||||||||||||||||||
| 12.63 | 6.69 | 829 | 0.90 | 1.29 | 0.44 | 56 | ||||||||||||||||||||||||||||||||||
| 11.75 | 6.18 | 81 | 1.40 | 1.79 | (0.05 | ) | 56 | |||||||||||||||||||||||||||||||||
| 12.63 | 6.83 | 10 | 0.76 | 1.15 | 0.59 | 56 | ||||||||||||||||||||||||||||||||||
| 11.86 | 3.09 | 45,046 | 1.15 | 1.52 | 0.13 | (d) | 52 | |||||||||||||||||||||||||||||||||
| 10.12 | 2.23 | 11,175 | 1.90 | 2.27 | (0.63 | )(d) | 52 | |||||||||||||||||||||||||||||||||
| 12.53 | 3.43 | 326,619 | 0.75 | 1.12 | 0.52 | (d) | 52 | |||||||||||||||||||||||||||||||||
| 11.81 | 2.93 | 254 | 1.25 | 1.62 | (0.01 | )(d) | 52 | |||||||||||||||||||||||||||||||||
| 12.53 | 3.34 | 817 | 0.90 | 1.27 | 0.37 | (d) | 52 | |||||||||||||||||||||||||||||||||
| 11.74 | 2.78 | 77 | 1.40 | 1.76 | (0.07 | )(d) | 52 | |||||||||||||||||||||||||||||||||
| 12.53 | (6.21 | ) | 9 | 0.73 | (f) | 1.06 | (f) | 0.68 | (d)(f) | 52 | ||||||||||||||||||||||||||||||
| 13.50 | 26.74 | 51,626 | 1.16 | 1.53 | (0.10 | ) | 64 | |||||||||||||||||||||||||||||||||
| 11.90 | 25.83 | 11,717 | 1.91 | 2.28 | (0.85 | ) | 64 | |||||||||||||||||||||||||||||||||
| 14.15 | 27.32 | 332,401 | 0.76 | 1.13 | 0.30 | 64 | ||||||||||||||||||||||||||||||||||
| 13.47 | 26.55 | 156 | 1.26 | 1.63 | (0.20 | ) | 64 | |||||||||||||||||||||||||||||||||
| 14.14 | 27.03 | 994 | 0.91 | 1.28 | 0.15 | 64 | ||||||||||||||||||||||||||||||||||
| 13.42 | 26.49 | 15 | 1.38 | 1.75 | (0.30 | ) | 64 | |||||||||||||||||||||||||||||||||
| 12.29 | 15.53 | 87,987 | 1.15 | 1.54 | 0.49 | (g) | 55 | |||||||||||||||||||||||||||||||||
| 11.09 | 14.68 | 9,314 | 1.90 | 2.29 | (0.35 | )(g) | 55 | |||||||||||||||||||||||||||||||||
| 12.79 | 15.98 | 242,865 | 0.75 | 1.14 | 0.81 | (g) | 55 | |||||||||||||||||||||||||||||||||
| 12.28 | 15.45 | 82 | 1.25 | 1.64 | 0.24 | (g) | 55 | |||||||||||||||||||||||||||||||||
| 12.80 | 15.80 | 884 | 0.90 | 1.29 | 0.57 | (g) | 55 | |||||||||||||||||||||||||||||||||
| 12.26 | 15.36 | 6 | 1.34 | 1.73 | 0.22 | (g) | 55 | |||||||||||||||||||||||||||||||||
| 11.57 | 18.45 | 181,257 | 1.15 | 1.51 | 0.14 | 54 | ||||||||||||||||||||||||||||||||||
| 10.54 | 17.71 | 8,279 | 1.90 | 2.26 | (0.61 | ) | 54 | |||||||||||||||||||||||||||||||||
| 12.00 | 18.97 | 256,389 | 0.75 | 1.11 | 0.54 | 54 | ||||||||||||||||||||||||||||||||||
| 11.59 | 18.50 | 52 | 1.25 | 1.61 | 0.18 | 54 | ||||||||||||||||||||||||||||||||||
| 12.01 | 18.85 | 321 | 0.90 | 1.26 | 0.38 | 54 | ||||||||||||||||||||||||||||||||||
| 11.53 | 18.32 | 4 | 1.40 | 1.76 | (0.05 | ) | 54 | |||||||||||||||||||||||||||||||||
| The accompanying notes are an integral part of these financial statements. | 111 |
GOLDMAN SACHS TECHNOLOGY OPPORTUNITIES FUND
Financial Highlights
Selected Data for a Share Outstanding Throughout Each Year
| Income (loss) from investment operations | ||||||||||||||||||||||
| Year - Share Class | Net asset value, beginning of year | Net investment income (loss)(a) | Net realized and unrealized gain | Total from investment operations | Distributions to shareholders from net realized gains | |||||||||||||||||
| FOR THE FISCAL YEARS ENDED AUGUST 31, | ||||||||||||||||||||||
2016 - A | $ | 17.93 | $ | (0.12 | )(d) | $ | 2.50 | $ | 2.38 | $ | (1.58 | ) | ||||||||||
2016 - C | 15.70 | (0.22 | )(d) | 2.17 | 1.95 | (1.58 | ) | |||||||||||||||
2016 - Institutional | 19.22 | (0.05 | )(d) | 2.70 | 2.65 | (1.58 | ) | |||||||||||||||
2016 - Service | 17.69 | (0.14 | )(d) | 2.47 | 2.33 | (1.58 | ) | |||||||||||||||
2016 - IR | 19.07 | (0.08 | )(d) | 2.67 | 2.59 | (1.58 | ) | |||||||||||||||
2015 - A | 18.97 | (0.14 | )(e) | 0.57 | 0.43 | (1.47 | ) | |||||||||||||||
2015 - C | 16.91 | (0.24 | )(e) | 0.50 | 0.26 | (1.47 | ) | |||||||||||||||
2015 - Institutional | 20.16 | (0.07 | )(e) | 0.60 | 0.53 | (1.47 | ) | |||||||||||||||
2015 - Service | 18.76 | (0.15 | )(e) | 0.55 | 0.40 | (1.47 | ) | |||||||||||||||
2015 - IR | 20.04 | (0.10 | )(e) | 0.60 | 0.50 | (1.47 | ) | |||||||||||||||
2014 - A | 15.20 | (0.15 | ) | 4.16 | 4.01 | (0.24 | ) | |||||||||||||||
2014 - C | 13.68 | (0.25 | ) | 3.72 | 3.47 | (0.24 | ) | |||||||||||||||
2014 - Institutional | 16.08 | (0.08 | ) | 4.40 | 4.32 | (0.24 | ) | |||||||||||||||
2014 - Service | 15.04 | (0.16 | ) | 4.12 | 3.96 | (0.24 | ) | |||||||||||||||
2014 - IR | 16.01 | (0.11 | ) | 4.38 | 4.27 | (0.24 | ) | |||||||||||||||
2013 - A | 13.62 | (0.12 | ) | 1.70 | 1.58 | — | ||||||||||||||||
2013 - C | 12.34 | (0.20 | ) | 1.54 | 1.34 | — | ||||||||||||||||
2013 - Institutional | 14.34 | (0.06 | ) | 1.80 | 1.74 | — | ||||||||||||||||
2013 - Service | 13.49 | (0.13 | ) | 1.68 | 1.55 | — | ||||||||||||||||
2013 - IR | 14.30 | (0.09 | ) | 1.80 | 1.71 | — | ||||||||||||||||
2012 - A | 11.51 | (0.13 | ) | 2.24 | 2.11 | — | ||||||||||||||||
2012 - C | 10.51 | (0.21 | ) | 2.04 | 1.83 | — | ||||||||||||||||
2012 - Institutional | 12.08 | (0.09 | ) | 2.35 | 2.26 | — | ||||||||||||||||
2012 - Service | 11.41 | (0.14 | ) | 2.22 | 2.08 | — | ||||||||||||||||
2012 - IR | 12.06 | (0.11 | ) | 2.35 | 2.24 | — | ||||||||||||||||
| (a) | Calculated based on the average shares outstanding methodology. |
| (b) | Assumes investment at the NAV at the beginning of the year, reinvestment of all dividends and distributions, a complete redemption of the investment at the NAV at the end of the year and no sales or redemption charges. Total returns would be reduced if a sales or redemption charge was taken into account. Returns do not reflect the deduction of taxes that a shareholder would pay on Fund distributions or the redemption of Fund shares. |
| (c) | The Fund’s portfolio turnover rate is calculated in accordance with regulatory requirements, without regard to transactions involving short term investments. If such transactions were included, the Fund’s portfolio turnover rate may be higher. |
| (d) | Reflects income recognized from special dividends which amounted to $0.02 per share and 0.13% of average net assets. |
| (e) | Reflects income recognized from special dividends which amounted to $0.02 per share and 0.10% of average net assets. |
| 112 | The accompanying notes are an integral part of these financial statements. |
GOLDMAN SACHS TECHNOLOGY OPPORTUNITIES FUND
| Net asset value, end of year | Total return(b) | Net assets, end of year (in 000s) | Ratio of net expenses to average net assets | Ratio of total expenses to average net assets | Ratio of net investment income (loss) to average net assets | Portfolio turnover rate(c) | ||||||||||||||||||||||||||||||||||
| $ | 18.73 | 13.71 | % | $ | 233,097 | 1.47 | % | 1.55 | % | (0.68 | )%(d) | 22 | % | |||||||||||||||||||||||||||
| 16.07 | 12.87 | 52,843 | 2.22 | 2.30 | (1.43 | )(d) | 22 | |||||||||||||||||||||||||||||||||
| 20.29 | 14.22 | 83,746 | 1.07 | 1.15 | (0.27 | )(d) | 22 | |||||||||||||||||||||||||||||||||
| 18.44 | 13.61 | 11,186 | 1.57 | 1.65 | (0.79 | )(d) | 22 | |||||||||||||||||||||||||||||||||
| 20.08 | 14.00 | 6,741 | 1.22 | 1.30 | (0.43 | )(d) | 22 | |||||||||||||||||||||||||||||||||
| 17.93 | 2.31 | 250,087 | 1.48 | 1.54 | (0.74 | )(e) | 41 | |||||||||||||||||||||||||||||||||
| 15.70 | 1.53 | 53,556 | 2.23 | 2.29 | (1.49 | )(e) | 41 | |||||||||||||||||||||||||||||||||
| 19.22 | 2.68 | 92,483 | 1.08 | 1.14 | (0.33 | )(e) | 41 | |||||||||||||||||||||||||||||||||
| 17.69 | 2.17 | 10,329 | 1.58 | 1.64 | (0.84 | )(e) | 41 | |||||||||||||||||||||||||||||||||
| 19.07 | 2.54 | 6,103 | 1.23 | 1.29 | (0.52 | )(e) | 41 | |||||||||||||||||||||||||||||||||
| 18.97 | 26.55 | 260,982 | 1.51 | 1.55 | (0.85 | ) | 39 | |||||||||||||||||||||||||||||||||
| 16.91 | 25.54 | 58,602 | 2.26 | 2.30 | (1.60 | ) | 39 | |||||||||||||||||||||||||||||||||
| 20.16 | 27.03 | 99,039 | 1.11 | 1.15 | (0.45 | ) | 39 | |||||||||||||||||||||||||||||||||
| 18.76 | 26.49 | 10,712 | 1.61 | 1.65 | (0.96 | ) | 39 | |||||||||||||||||||||||||||||||||
| 20.04 | 26.83 | 3,228 | 1.26 | 1.30 | (0.59 | ) | 39 | |||||||||||||||||||||||||||||||||
| 15.20 | 11.60 | 228,424 | 1.50 | 1.55 | (0.85 | ) | 33 | |||||||||||||||||||||||||||||||||
| 13.68 | 10.86 | 50,278 | 2.25 | 2.30 | (1.59 | ) | 33 | |||||||||||||||||||||||||||||||||
| 16.08 | 12.13 | 70,416 | 1.10 | 1.15 | (0.43 | ) | 33 | |||||||||||||||||||||||||||||||||
| 15.04 | 11.49 | 10,167 | 1.60 | 1.65 | (0.95 | ) | 33 | |||||||||||||||||||||||||||||||||
| 16.01 | 11.96 | 2,651 | 1.25 | 1.30 | (0.59 | ) | 33 | |||||||||||||||||||||||||||||||||
| 13.62 | 18.28 | 239,355 | 1.50 | 1.55 | (1.06 | ) | 43 | |||||||||||||||||||||||||||||||||
| 12.34 | 17.36 | 50,682 | 2.25 | 2.30 | (1.81 | ) | 43 | |||||||||||||||||||||||||||||||||
| 14.34 | 18.65 | 49,238 | 1.10 | 1.15 | (0.66 | ) | 43 | |||||||||||||||||||||||||||||||||
| 13.49 | 18.18 | 10,977 | 1.60 | 1.65 | (1.15 | ) | 43 | |||||||||||||||||||||||||||||||||
| 14.30 | 18.52 | 2,569 | 1.25 | 1.30 | (0.81 | ) | 43 | |||||||||||||||||||||||||||||||||
| The accompanying notes are an integral part of these financial statements. | 113 |
GOLDMAN SACHS FUNDAMENTAL EQUITY GROWTH FUNDS
August 31, 2016
| 1. ORGANIZATION |
Goldman Sachs Trust (the “Trust”) is a Delaware statutory trust registered under the Investment Company Act of 1940, as amended (the “Act”), as an open-end management investment company. The following table lists those series of the Trust that are included in this report (collectively, the “Funds” or individually a “Fund”), along with their corresponding share classes and respective diversification status under the Act:
| Fund | Share Classes Offered | Diversified/ Non-diversified | ||
Capital Growth, Growth Opportunities, Small/Mid Cap Growth and Strategic Growth | A, C, Institutional, Service, IR, R and R6 | Diversified | ||
Concentrated Growth and Focused Growth | A, C, Institutional, IR, R and R6 | Non-diversified | ||
Dynamic U.S. Equity and Flexible Cap Growth | A, C, Institutional, IR, R and R6 | Diversified | ||
Technology Opportunities | A, C, Institutional, Service and IR | Diversified |
Class A Shares are sold with a front-end sales charge of up to 5.50%. Class C Shares are sold with a contingent deferred sales charge (“CDSC”) of 1.00%, which is imposed on redemptions made within 12 months of purchase. Institutional, Service, Class IR, Class R and Class R6 Shares are not subject to a sales charge.
Goldman Sachs Asset Management, L.P. (“GSAM”), an affiliate of Goldman, Sachs & Co. (“Goldman Sachs”), serves as investment adviser to the Funds pursuant to a management agreement (the “Agreement”) with the Trust.
| 2. SIGNIFICANT ACCOUNTING POLICIES |
The financial statements have been prepared in accordance with accounting principles generally accepted in the United States of America (“GAAP”) and require management to make estimates and assumptions that may affect the reported amounts and disclosures. Actual results may differ from those estimates and assumptions.
A. Investment Valuation — The Funds’ valuation policy is to value investments at fair value.
B. Investment Income and Investments — Investment income includes interest income, dividend income, net of any foreign withholding taxes, less any amounts reclaimable, and securities lending income. Interest income is accrued daily and adjusted for amortization of premiums and accretion of discounts. Dividend income is recognized on ex-dividend date or, for certain foreign securities, as soon as such information is obtained subsequent to the ex-dividend date. Investment transactions are reflected on trade date. Realized gains and losses are calculated using identified cost. Investment transactions are recorded on the following business day for daily net asset value (“NAV”) calculations. Any foreign capital gains tax is accrued daily based upon net unrealized gains, and is payable upon sale of such investments. Distributions received from the Funds’ investments in U.S. real estate investment trusts (“REITs”) may be characterized as ordinary income, net capital gain or a return of capital. A return of capital is recorded by the Funds as a reduction to the cost basis of the REIT.
C. Class Allocations and Expenses — Investment income, realized and unrealized gain (loss), and non-class specific expenses of each Fund are allocated daily based upon the proportion of net assets of each class. Non-class specific expenses directly incurred by a Fund are charged to that Fund, while such expenses incurred by the Trust are allocated across the applicable Funds on a straight-line and/or pro-rata basis depending upon the nature of the expenses. Class specific expenses, where applicable, are borne by the respective share classes and include Distribution and Service, Transfer Agency and Service and Shareholder Administration fees.
114
GOLDMAN SACHS FUNDAMENTAL EQUITY GROWTH FUNDS
| 2. SIGNIFICANT ACCOUNTING POLICIES (continued) |
D. Federal Taxes and Distributions to Shareholders — It is each Fund’s policy to comply with the requirements of the Internal Revenue Code of 1986, as amended (the “Code”), applicable to regulated investment companies (mutual funds) and to distribute each year substantially all of its investment company taxable income and capital gains to its shareholders. Accordingly, the Funds are not required to make any provisions for the payment of federal income tax. Distributions to shareholders are recorded on the ex-dividend date. Income and capital gains distributions, if any, are declared and paid annually.
Net capital losses are carried forward to future fiscal years and may be used to the extent allowed by the Code to offset any future capital gains. Losses that are carried forward will retain their character as either short-term or long-term capital losses. Utilization of capital loss carryforwards will reduce the requirement of future capital gains distributions.
The characterization of distributions to shareholders for financial reporting purposes is determined in accordance with federal income tax rules, which may differ from GAAP. The source of each Fund’s distributions may be shown in the accompanying financial statements as either from net investment income, net realized gain or capital. Certain components of the Funds’ net assets on the Statements of Assets and Liabilities reflect permanent GAAP/tax differences based on the appropriate tax character.
E. Commission Recapture — GSAM, on behalf of certain Funds, may direct portfolio trades, subject to seeking best execution, to various brokers who have agreed to rebate a portion of the commissions generated. Such rebates are made directly to a Fund as cash payments and are included in net realized gain (loss) from investments on the Statements of Operations.
| 3. INVESTMENTS AND FAIR VALUE MEASUREMENTS |
The fair value of a financial instrument is the amount that would be received to sell an asset or paid to transfer a liability in an orderly transaction between market participants at the measurement date (i.e., the exit price). GAAP establishes a fair value hierarchy that prioritizes the inputs to valuation techniques used to measure fair value. The hierarchy gives the highest priority to unadjusted quoted prices in active markets for identical assets or liabilities (Level 1 measurements) and the lowest priority to unobservable inputs (Level 3 measurements). The levels used for classifying investments are not necessarily an indication of the risk associated with investing in these investments. The three levels of the fair value hierarchy are described below:
Level 1 — Unadjusted quoted prices in active markets that are accessible at the measurement date for identical, unrestricted assets or liabilities;
Level 2 — Quoted prices in markets that are not active or financial instruments for which significant inputs are observable (including, but not limited to, quoted prices for similar investments, interest rates, foreign exchange rates, volatility and credit spreads), either directly or indirectly;
Level 3 — Prices or valuations that require significant unobservable inputs (including GSAM’s assumptions in determining fair value measurement).
Changes in valuation techniques may result in transfers into or out of an assigned level within the hierarchy. In accordance with the Funds’ policy, transfers between different levels of the fair value hierarchy resulting from such changes are deemed to have occurred as of the beginning of the reporting period.
The Board of Trustees (“Trustees”) has approved Valuation Procedures that govern the valuation of the portfolio investments held by the Funds, including investments for which market quotations are not readily available. The Trustees have delegated to GSAM day-to-day responsibility for implementing and maintaining internal controls and procedures related to the valuation of the Funds’ portfolio investments. To assess the continuing appropriateness of pricing sources and methodologies, GSAM regularly performs price verification procedures and issues challenges as necessary to third party pricing vendors or brokers, and any differences are reviewed in accordance with the Valuation Procedures.
115
GOLDMAN SACHS FUNDAMENTAL EQUITY GROWTH FUNDS
Notes to Financial Statements (continued)
August 31, 2016
| 3. INVESTMENTS AND FAIR VALUE MEASUREMENTS (continued) |
A. Level 1 and Level 2 Fair Value Investments — The valuation techniques and significant inputs used in determining the fair values for investments classified as Level 1 and Level 2 are as follows:
Equity Securities — Equity securities traded on a United States (“U.S.”) securities exchange or the NASDAQ system, or those located on certain foreign exchanges, including but not limited to the Americas, are valued daily at their last sale price or official closing price on the principal exchange or system on which they are traded. If there is no sale or official closing price or such price is believed by GSAM to not represent fair value, equity securities are valued at the last bid price for long positions and at the last ask price for short positions. To the extent these investments are actively traded, they are classified as Level 1 of the fair value hierarchy, otherwise they are generally classified as Level 2.
Unlisted equity securities for which market quotations are available are valued at the last sale price on the valuation date, or if no sale occurs, at the last bid price. Securities traded on certain foreign securities exchanges are valued daily at fair value determined by an independent fair value service (if available) under Valuation Procedures approved by the Trustees and consistent with applicable regulatory guidance. The independent fair value service takes into account multiple factors including, but not limited to, movements in the securities markets, certain depositary receipts, futures contracts and foreign currency exchange rates that have occurred subsequent to the close of the foreign securities exchange. These investments are generally classified as Level 2 of the fair value hierarchy.
Money Market Funds — Investments in the Goldman Sachs Financial Square Government Fund (“Underlying Fund”) are valued at the NAV of the Institutional Share class on the day of valuation. These investments are generally classified as Level 1 of the fair value hierarchy. For information regarding an Underlying Fund’s accounting policies and investment holdings, please see the Underlying Fund’s shareholder report.
Short Term Investments — Short-term investments having a maturity of 60 days or less are generally valued at amortized cost which approximates fair market value. These investments are classified as Level 2 of the fair value hierarchy.
i. Repurchase Agreements — Repurchase agreements involve the purchase of securities subject to the seller’s agreement to repurchase the securities at a mutually agreed upon date and price, under the terms of a Master Repurchase Agreement (“MRA”). During the term of a repurchase agreement, the value of the underlying securities held as collateral on behalf of a Fund, including accrued interest, is required to exceed the value of the repurchase agreement, including accrued interest. The gross value of repurchase agreements is included in the Statements of Assets and Liabilities for financial reporting purposes. The underlying securities for all repurchase agreements are held at the Funds’ custodian or designated sub-custodians under tri-party repurchase agreements.
An MRA governs transactions between a Fund and select counterparties. An MRA contains provisions for, among other things, initiation of the transaction, income payments, events of default and maintenance of securities for repurchase agreements. An MRA also permits offsetting with collateral to create one single net payment in the event of default or similar events, including the bankruptcy or insolvency of a counterparty.
If the seller defaults, a Fund could suffer a loss to the extent that the proceeds from the sale of the underlying securities and other collateral held by the Fund are less than the repurchase price and the Fund’s costs associated with delay and enforcement of the repurchase agreement. In addition, in the event of default or insolvency of the seller, a court could determine that a Fund’s interest in the collateral is not enforceable, resulting in additional losses to the Fund.
Pursuant to exemptive relief granted by the Securities and Exchange Commission (“SEC”) and terms and conditions contained therein, the Funds, together with other funds of the Trust and registered investment companies having management agreements with GSAM or its affiliates, may transfer uninvested cash into joint accounts, the daily aggregate balance of which is invested in one or more repurchase agreements. Under these joint accounts, the Funds maintain pro-rata credit exposure to the underlying repurchase agreements’ counterparties. With the exception of certain transaction fees, the Funds are not subject to any expenses in relation to these investments.
116
GOLDMAN SACHS FUNDAMENTAL EQUITY GROWTH FUNDS
| 3. INVESTMENTS AND FAIR VALUE MEASUREMENTS (continued) |
B. Level 3 Fair Value Investments — To the extent that significant inputs to valuation models and other alternative pricing sources are unobservable, or if quotations are not readily available, or if GSAM believes that such quotations do not accurately reflect fair value, the fair value of the Funds’ investments may be determined under Valuation Procedures approved by the Trustees. GSAM, consistent with its procedures and applicable regulatory guidance, may make an adjustment to the most recent valuation prices of either domestic or foreign securities in light of significant events to reflect what it believes to be the fair value of the securities at the time of determining a Fund’s NAV. Significant events which could affect a large number of securities in a particular market may include, but are not limited to: significant fluctuations in U.S. or foreign markets; market dislocations; market disruptions; or unscheduled market closings. Significant events which could also affect a single issuer may include, but are not limited to: corporate actions such as reorganizations, mergers and buy-outs; ratings downgrades; and bankruptcies.
C. Fair Value Hierarchy — The following is a summary of the Funds’ investments classified in the fair value hierarchy as of August 31, 2016:
| CAPITAL GROWTH | ||||||||||||
| Investment Type | Level 1 | Level 2 | Level 3 | |||||||||
| Assets | ||||||||||||
Common Stock and/or Other Equity Investments(a) | ||||||||||||
Asia | $ | 2,986,201 | $ | — | $ | — | ||||||
Europe | 14,457,353 | — | — | |||||||||
North America | 821,910,001 | — | — | |||||||||
Investment Company | 7,550,880 | — | — | |||||||||
| Total | $ | 846,904,435 | $ | — | $ | — | ||||||
| CONCENTRATED GROWTH | ||||||||||||
| Investment Type | Level 1 | Level 2 | Level 3 | |||||||||
| Assets | ||||||||||||
Common Stock and/or Other Equity Investments(a) | ||||||||||||
Europe | $ | 2,668,414 | $ | — | $ | — | ||||||
North America | 139,195,080 | — | — | |||||||||
Short-term Investments | — | 3,700,000 | — | |||||||||
| Total | $ | 141,863,494 | $ | 3,700,000 | $ | — | ||||||
| DYNAMIC U.S. EQUITY | ||||||||||||
| Investment Type | Level 1 | Level 2 | Level 3 | |||||||||
| Assets | ||||||||||||
Common Stock and/or Other Equity Investments(a) | ||||||||||||
North America | $ | 7,248,017 | $ | — | $ | — | ||||||
117
GOLDMAN SACHS FUNDAMENTAL EQUITY GROWTH FUNDS
Notes to Financial Statements (continued)
August 31, 2016
| 3. INVESTMENTS AND FAIR VALUE MEASUREMENTS (continued) |
| FLEXIBLE CAP GROWTH | ||||||||||||
| Investment Type | Level 1 | Level 2 | Level 3 | |||||||||
| Assets | ||||||||||||
Common Stock and/or Other Equity Investments(a) | ||||||||||||
Asia | $ | 87,660 | $ | — | $ | — | ||||||
Europe | 132,249 | — | — | |||||||||
North America | 16,443,175 | — | — | |||||||||
Short-term Investments | — | 300,000 | — | |||||||||
| Total | $ | 16,663,084 | $ | 300,000 | $ | — | ||||||
| FOCUSED GROWTH | ||||||||||||
| Investment Type | Level 1 | Level 2 | Level 3 | |||||||||
| Assets | ||||||||||||
Common Stock and/or Other Equity Investments(a) | ||||||||||||
North America | $ | 24,432,162 | $ | — | $ | — | ||||||
Short-term Investments | — | 200,000 | — | |||||||||
| Total | $ | 24,432,162 | $ | 200,000 | $ | — | ||||||
| GROWTH OPPORTUNITIES | ||||||||||||
| Investment Type | Level 1 | Level 2 | Level 3 | |||||||||
| Assets | ||||||||||||
Common Stock and/or Other Equity Investments(a) | ||||||||||||
Asia | $ | 20,626,006 | $ | — | $ | — | ||||||
Europe | 24,128,519 | — | — | |||||||||
North America | 3,112,147,013 | — | — | |||||||||
Investment Company | 651 | — | — | |||||||||
| Total | $ | 3,156,902,189 | $ | — | $ | — | ||||||
| SMALL/MID CAP GROWTH | ||||||||||||
| Investment Type | Level 1 | Level 2 | Level 3 | |||||||||
| Assets | ||||||||||||
Common Stock and/or Other Equity Investments(a) | ||||||||||||
Asia | $ | 34,459,064 | $ | — | $ | — | ||||||
Europe | 91,099,439 | — | — | |||||||||
North America | 2,449,919,385 | — | — | |||||||||
Short-term Investments | — | 30,400,000 | — | |||||||||
| Total | $ | 2,575,477,888 | $ | 30,400,000 | $ | — | ||||||
118
GOLDMAN SACHS FUNDAMENTAL EQUITY GROWTH FUNDS
| 3. INVESTMENTS AND FAIR VALUE MEASUREMENTS (continued) |
| STRATEGIC GROWTH | ||||||||||||
| Investment Type | Level 1 | Level 2 | Level 3 | |||||||||
| Assets | ||||||||||||
Common Stock and/or Other Equity Investments(a) | ||||||||||||
Asia | $ | 1,428,810 | $ | — | $ | — | ||||||
Europe | 4,070,573 | — | — | |||||||||
North America | 338,287,080 | — | — | |||||||||
Short-term Investments | — | 7,400,000 | — | |||||||||
| Total | $ | 343,786,463 | $ | 7,400,000 | $ | — | ||||||
| TECHNOLOGY OPPORTUNITIES | ||||||||||||
| Investment Type | Level 1 | Level 2 | Level 3 | |||||||||
| Assets | ||||||||||||
Common Stock and/or Other Equity Investments(a) | ||||||||||||
Europe | $ | 15,919,737 | $ | — | $ | — | ||||||
North America | 358,077,292 | — | — | |||||||||
Short-term Investments | — | 14,500,000 | — | |||||||||
| Total | $ | 373,997,029 | $ | 14,500,000 | $ | — | ||||||
| (a) | Amounts are disclosed by continent to highlight the impact of time zone differences between local market close and the calculation of net asset value. Security valuations are based on the principle exchange or system on which they are traded, which may differ from country of domicile. The Funds utilize fair value model prices provided by an independent fair value service for certain international equity securities, resulting in a Level 2 classification. |
For further information regarding security characteristics, see the Schedules of Investments.
| 4. AGREEMENTS AND AFFILIATED TRANSACTIONS |
A. Management Agreement — Under the Agreement, GSAM manages the Funds, subject to the general supervision of the Trustees.
As compensation for the services rendered pursuant to the Agreement, the assumption of the expenses related thereto and administration of the Funds’ business affairs, including providing facilities, GSAM is entitled to a management fee, accrued daily and paid monthly, equal to an annual percentage rate of each Fund’s average daily net assets.
For the fiscal year ended August 31, 2016, contractual and effective net management fees with GSAM were at the following rates:
| Contractual Management Rate | ||||||||||||||||||||||||||||
| Fund | First $1 billion | Next $1 billion | Next $3 billion | Next $3 billion | Over $8 billion | Effective Rate | Effective Net Management Rate | |||||||||||||||||||||
Capital Growth | 1.00 | % | 0.90 | % | 0.80 | % | 0.80 | % | 0.80 | % | 1.00 | % | 0.71 | %# | ||||||||||||||
Concentrated Growth | 1.00 | 0.90 | 0.86 | 0.84 | 0.82 | 1.00 | 0.78 | # | ||||||||||||||||||||
Dynamic U.S. Equity | 0.70 | 0.63 | 0.60 | 0.59 | 0.58 | 0.70 | 0.70 | |||||||||||||||||||||
Flexible Cap Growth | 1.00 | 0.90 | 0.86 | 0.84 | 0.82 | 1.00 | 0.78 | # | ||||||||||||||||||||
119
GOLDMAN SACHS FUNDAMENTAL EQUITY GROWTH FUNDS
Notes to Financial Statements (continued)
August 31, 2016
| 4. AGREEMENTS AND AFFILIATED TRANSACTIONS (continued) |
| Contractual Management Rate | ||||||||||||||||||||||||||||
| Fund | First $1 billion | Next $1 billion | Next $3 billion | Next $3 billion | Over $8 billion | Effective Rate | Effective Net Management Rate | |||||||||||||||||||||
Focused Growth | 1.00 | % | 0.90 | % | 0.86 | % | 0.84 | % | 0.82 | % | 1.00 | % | 0.77 | %#^ | ||||||||||||||
Growth Opportunities | 1.00 | 1.00 | 0.90 | 0.86 | 0.84 | 0.95 | 0.90 | # | ||||||||||||||||||||
Small/Mid Cap Growth | 1.00 | 1.00 | 0.90 | 0.86 | 0.84 | 0.97 | 0.85 | # | ||||||||||||||||||||
Strategic Growth | 1.00 | 0.90 | 0.86 | 0.84 | 0.82 | 1.00 | 0.71 | # | ||||||||||||||||||||
Technology Opportunities | 1.00 | 0.90 | 0.86 | 0.84 | 0.82 | 1.00 | 1.00 | |||||||||||||||||||||
| # | GSAM agreed to waive a portion of its management fee rates, set forth in the Funds’ most recent prospectuses. In addition, the Effective Net Management Rate includes the impact of management fee waivers of affiliated underlying funds, if any. These waivers will be effective through at least December 29, 2016, and prior to such date GSAM may not terminate the arrangements without the approval of the Trustees. |
| ^ | Effective December 29, 2015, GSAM agreed to waive a portion of its management fee in order to achieve an Effective Net Management Rate of 0.76% for Focused Growth Fund. Prior to December 29, 2015, the Effective Net Management Rate was 0.79%. |
The Capital Growth and Growth Opportunities Funds invest in the Institutional Shares of the Goldman Sachs Financial Square Government Fund, which is an affiliated Underlying Fund. GSAM has agreed to waive a portion of its management fee payable by the Funds in an amount equal to the management fee it earns as an investment adviser to any of the affiliated Underlying Funds in which the Funds invest. For the fiscal year ended August 31, 2016, GSAM waived $1,486 and $59,418 of the Fund’s management fee for the Capital Growth and Growth Opportunities Funds, respectively.
B. Distribution and Service Plans — The Trust, on behalf of each Fund, has adopted Distribution and Service Plans (the “Plans”). Under the Plans, Goldman Sachs, which serves as distributor (the “Distributor”), is entitled to a fee accrued daily and paid monthly, for distribution services and personal and account maintenance services, which may then be paid by Goldman Sachs to authorized dealers, at the following annual rates calculated on a Fund’s average daily net assets of each respective share class:
| Distribution and Service Plan Rates | ||||||||||||
| Class A* | Class C | Class R* | ||||||||||
Distribution Plan | 0.25 | % | 0.75 | % | 0.50 | % | ||||||
Service Plan | — | 0.25 | — | |||||||||
| * | With respect to Class A and Class R Shares, the Distributor at its discretion may use compensation for distribution services paid under the Distribution Plan to compensate service organizations for personal and account maintenance services and expenses as long as such total compensation does not exceed the maximum cap on “service fees” imposed by the Financial Industry Regulatory Authority. |
C. Distribution Agreement — Goldman Sachs, as Distributor of the shares of the Funds pursuant to a Distribution Agreement, may retain a portion of the Class A Shares’ front end sales charge and Class C Shares’ CDSC. During the fiscal year ended August 31, 2016, Goldman Sachs advised that it retained the following amounts:
| Front End Sales Charge | Contingent Deferred Sales Charge | |||||||||
| Fund | Class A | Class C | ||||||||
Capital Growth | $ | 23,587 | $ | 746 | ||||||
Concentrated Growth | 1,219 | — | ||||||||
Dynamic U.S. Equity | 239 | — | ||||||||
Flexible Cap Growth | 1,069 | — | ||||||||
120
GOLDMAN SACHS FUNDAMENTAL EQUITY GROWTH FUNDS
| 4. AGREEMENTS AND AFFILIATED TRANSACTIONS (continued) |
| Front End Sales Charge | Contingent Deferred Sales Charge | |||||||||
| Fund | Class A | Class C | ||||||||
Focused Growth | 384 | — | ||||||||
Growth Opportunities | 22,680 | 936 | ||||||||
Small/Mid Cap Growth | 108,083 | 10 | ||||||||
Strategic Growth | 2,635 | 11 | ||||||||
Technology Opportunities | 10,824 | 743 | ||||||||
D. Service Plan and Shareholder Administration Plan — The Trust, on behalf of each Fund that offers Service Shares, has adopted a Service Plan and a Shareholder Administration Plan. These plans allow for service organizations to provide varying levels of personal and account maintenance and shareholder administration services to their customers who are beneficial owners of such shares. The Service Plan and Shareholder Administration Plan each provide for compensation to the service organizations which is accrued daily and paid monthly at an annual rate of 0.25% (0.50% in aggregate) of the average daily net assets of the Service Shares.
E. Transfer Agency Agreement — Goldman Sachs also serves as the transfer agent of the Funds for a fee pursuant to the Transfer Agency Agreement. The fees charged for such transfer agency services are accrued daily and paid monthly at annual rates as follows: 0.19% of the average daily net assets of Class A, Class C, Class IR and Class R Shares; 0.02% of the average daily net assets of Class R6 Shares; and 0.04% of the average daily net assets of Institutional and Service Shares.
Effective December 29, 2015, Goldman Sachs agreed to waive a portion of its transfer agency fee equal to 0.05% as an annual percentage rate of the average daily net assets attributable to Class A, Class C, Class IR, and Class R Shares of the Growth Opportunities Fund. As a result of this waiver, a net transfer agency fee equal to 0.14% as an annual percentage rate of the average daily net assets attributable to Class A, Class C, Class IR, and Class R Shares of the Growth Opportunities Fund is being charged to those share classes. This arrangement will remain in effect through at least December 29, 2016, and prior to such date, the Investment Adviser may not terminate the arrangements without the approval of the Board of Trustees.
Effective December 29, 2015, Goldman Sachs agreed to waive a portion of its transfer agency fee equal to 0.03% as an annual percentage rate of the average daily net assets attributable to Class A, Class C, Class IR, and Class R Shares of the Small/Mid Cap Growth Fund. As a result of this waiver, a net transfer agency fee equal to 0.16% as an annual percentage rate of the average daily net assets attributable to Class A, Class C, Class IR, and Class R Shares of the Small/Mid Cap Growth Fund is being charged to those share classes. This arrangement will remain in effect through at least December 29, 2016, and prior to such date, the Investment Adviser may not terminate the arrangements without the approval of the Board of Trustees.
F. Other Expense Agreements and Affiliated Transactions — GSAM has agreed to limit certain “Other Expenses” of the Funds (excluding acquired fund fees and expenses, transfer agency fees and expenses, service fees and shareholder administration fees (as applicable), taxes, interest, brokerage fees, shareholder meeting, litigation, indemnification and extraordinary expenses) to the extent such expenses exceed, on an annual basis, a percentage rate of the average daily net assets of each Fund. Such Other Expense reimbursements, if any, are accrued daily and paid monthly. In addition, the Funds are not obligated to reimburse GSAM for prior fiscal year expense reimbursements, if any. The Other Expense limitations as an annual percentage rate of average daily net assets for Capital Growth, Concentrated Growth, Dynamic U.S. Equity, Flexible Cap Growth, Focused Growth, Growth Opportunities, Small/Mid Cap Growth, Strategic Growth, and Technology Opportunities Funds are 0.004%, 0.004%, 0.084%, 0.004%, 0.004%, 0.014%, 0.064%, 0.004%, and 0.034% respectively. Prior to December 29, 2015, the Other Expense limitation for Focused Growth Fund was 0.014%. These Other Expense limitations will remain in place through at least December 29, 2016, and prior to such date GSAM may not terminate the arrangements without the approval of the Trustees. In addition, the Funds have entered into certain offset arrangements with the transfer agent, which may result in a reduction of the Funds’ expenses and are received irrespective of the application of the “Other Expense” limitations described above.
121
GOLDMAN SACHS FUNDAMENTAL EQUITY GROWTH FUNDS
Notes to Financial Statements (continued)
August 31, 2016
| 4. AGREEMENTS AND AFFILIATED TRANSACTIONS (continued) |
For the fiscal year ended August 31, 2016, these expense reductions, including any fee waivers and Other Expense reimbursements, were as follows:
| Fund | Management Fee Waiver | Transfer Agency Fee Waiver | Other Expense Reimbursements | Total Expense Reductions | ||||||||||||||
Capital Growth | $ | 2,537,144 | $ | — | $ | 552,522 | $ | 3,089,666 | ||||||||||
Concentrated Growth | 342,030 | — | 287,359 | 629,389 | ||||||||||||||
Dynamic U.S. Equity | — | — | 258,810 | 258,810 | ||||||||||||||
Flexible Cap Growth | 38,103 | — | 281,899 | 320,002 | ||||||||||||||
Focused Growth | 67,251 | — | 254,463 | 321,714 | ||||||||||||||
Growth Opportunities | 2,059,418 | 339,500 | 555,740 | 2,954,658 | ||||||||||||||
Small/Mid Cap Growth | 3,352,308 | 279,574 | — | 3,631,882 | ||||||||||||||
Strategic Growth | 1,157,240 | — | 388,958 | 1,546,198 | ||||||||||||||
Technology Opportunities | — | — | 301,094 | 301,094 | ||||||||||||||
G. Line of Credit Facility — As of August 31, 2016, the Funds participated in a $1,100,000,000 committed, unsecured revolving line of credit facility (the “facility”) together with other funds of the Trust and certain registered investment companies having management agreements with GSAM or its affiliates (“Other Borrowers”). This facility is to be used for temporary emergency purposes, or to allow for an orderly liquidation of securities to meet redemption requests. The interest rate on borrowings is based on the federal funds rate. The facility also requires a fee to be paid by the Funds based on the amount of the commitment that has not been utilized. For the fiscal year ended August 31, 2016, the Funds did not have any borrowings under the facility.
122
GOLDMAN SACHS FUNDAMENTAL EQUITY GROWTH FUNDS
| 4. AGREEMENTS AND AFFILIATED TRANSACTIONS (continued) |
H. Other Transactions with Affiliates — For the fiscal year ended August 31, 2016, Goldman Sachs did not earn any brokerage commissions from portfolio transactions, on behalf of the Funds.
An investment by a Fund representing greater than 5% of the voting securities of an issuer makes that issuer an affiliated person (as defined by the Act) of such Fund. The following table provides information about the investment by the Small/Mid Cap Growth Fund in shares of issuers of which the Fund is an affiliate for the fiscal year ended August 31, 2016:
| Fund | Name of Affiliated Issuer | Market Value 8/31/15 | Purchases at Cost | Proceeds from Sales | Net Realized Gain (Loss) | Net Change in Unrealized Gain (Loss) | Market Value 8/31/16 | Dividend Income | ||||||||||||||||||||||
Small/Mid Cap Growth | Corium International, Inc. | $ | 12,559,016 | $ | 1,784,683 | $ | (177,041 | ) | $ | (98,602 | ) | $ | (4,849,734 | ) | $ | 9,218,322 | $ | — | ||||||||||||
| M/I Homes, Inc. | 22,517,671 | 18,581,981 | (11,416,034 | ) | (1,129,804 | ) | 350,545 | 28,904,359 | — | |||||||||||||||||||||
The table below shows the transactions in and earnings from investments in an affiliated Fund for the fiscal year ended August 31, 2016:
| Fund | Underlying Fund | Market Value 8/31/15 | Purchases at Cost | Proceeds from Sales | Market Value 8/31/16 | Dividend Income | ||||||||||||||||
Capital Growth | Goldman Sachs Financial Square Government Fund | $ | — | $ | 20,932,054 | $ | (13,381,174 | ) | $ | 7,550,880 | $ | 2,704 | ||||||||||
Growth Opportunities | Goldman Sachs Financial Square Government Fund | 13,549,239 | 1,487,976,748 | (1,501,525,336 | ) | 651 | 74,156 | |||||||||||||||
As of August 31, 2016, The Goldman Sachs Group, Inc. was the beneficial owner of 5% or more of outstanding Class C, Institutional, Class IR, Class R and Class R6 Shares of the following funds:
| Fund | Class C | Institutional | Class IR | Class R | Class R6 | |||||||||||||||||
Capital Growth | — | % | — | % | — | % | — | % | 100 | % | ||||||||||||
Concentrated Growth | — | — | — | 69 | 100 | |||||||||||||||||
Dynamic US Equity | 9 | 23 | 13 | 100 | 100 | |||||||||||||||||
Flexible Cap Growth | — | — | 10 | 53 | 100 | |||||||||||||||||
Focused Growth | 10 | — | 30 | 100 | 100 | |||||||||||||||||
Strategic Growth | — | — | — | 8 | 100 | |||||||||||||||||
123
GOLDMAN SACHS FUNDAMENTAL EQUITY GROWTH FUNDS
Notes to Financial Statements (continued)
August 31, 2016
| 5. PORTFOLIO SECURITIES TRANSACTIONS |
The cost of purchases and proceeds from sales and maturities of long-term securities for the fiscal year ended August 31, 2016, were as follows:
| Fund | Purchases | Sales and Maturities | ||||||||
Capital Growth | $ | 395,334,036 | $ | 521,699,954 | ||||||
Concentrated Growth | 83,502,768 | 115,520,969 | ||||||||
Dynamic U.S. Equity | 5,324,345 | 12,978,931 | ||||||||
Flexible Cap Growth | 7,828,548 | 9,376,490 | ||||||||
Focused Growth | 15,707,193 | 24,799,035 | ||||||||
Growth Opportunities | 2,019,560,612 | 3,520,979,460 | ||||||||
Small/Mid Cap Growth | 1,788,202,746 | 1,912,088,606 | ||||||||
Strategic Growth | 214,831,344 | 270,120,548 | ||||||||
Technology Opportunities | 84,040,491 | 163,939,739 | ||||||||
| 6. TAX INFORMATION |
The tax character of distributions paid during the fiscal year ended August 31, 2016 was as follows:
| Capital Growth | Concentrated Growth | Dynamic U.S. Equity | Flexible Cap Growth | Focused Growth | Growth Opportunities | Small/Mid Cap Growth | Strategic Growth | Technology Opportunities | ||||||||||||||||||||||||||||
Distribution paid from: | ||||||||||||||||||||||||||||||||||||
Ordinary income | $ | 4,712,785 | $ | 3,626,144 | $ | 331,071 | $ | 183,465 | $ | 586,423 | $ | — | $ | 19,672,456 | $ | 4,324,429 | $ | — | ||||||||||||||||||
Net long-term capital gains | 71,058,636 | 14,309,229 | 1,140,691 | 905,450 | 1,266,538 | 464,979,506 | 84,777,269 | 19,126,243 | 35,686,035 | |||||||||||||||||||||||||||
Total taxable distributions | $ | 75,771,421 | $ | 17,935,373 | $ | 1,471,762 | $ | 1,088,915 | $ | 1,852,961 | $ | 464,979,506 | $ | 104,449,725 | $ | 23,450,672 | $ | 35,686,035 | ||||||||||||||||||
The tax character of distributions paid during the fiscal year ended August 31, 2015 was as follows:
| Capital Growth | Concentrated Growth | Dynamic U.S. Equity | Flexible Cap Growth | Focused Growth | Growth Opportunities | Small/Mid Cap Growth | Strategic Growth | Technology Opportunities | ||||||||||||||||||||||||||||
Distribution paid from: | ||||||||||||||||||||||||||||||||||||
Ordinary income | $ | 27,464,156 | $ | 6,969,376 | $ | 484,917 | $ | 278,075 | $ | 778,364 | $ | 87,115,344 | $ | 7,718,467 | $ | 15,005,986 | $ | 2,706,434 | ||||||||||||||||||
Net long-term capital gains | 120,551,522 | 24,515,119 | 1,783,281 | 1,961,356 | 1,284,394 | 906,977,762 | 177,861,279 | 43,714,383 | 30,251,214 | |||||||||||||||||||||||||||
Total taxable distributions | $ | 148,015,678 | $ | 31,484,495 | $ | 2,268,198 | $ | 2,239,431 | $ | 2,062,758 | $ | 994,093,106 | $ | 185,579,746 | $ | 58,720,369 | $ | 32,957,648 | ||||||||||||||||||
124
GOLDMAN SACHS FUNDAMENTAL EQUITY GROWTH FUNDS
| 6. TAX INFORMATION (continued) |
As of August 31, 2016, the components of accumulated earnings (losses) on a tax basis were as follows:
Capital Growth | Concentrated Growth | Dynamic U.S. Equity | Flexible Cap Growth | Focused Growth | Growth Opportunities | Small/Mid Cap Growth | Strategic Growth | Technology Opportunities | ||||||||||||||||||||||||||||
Undistributed ordinary income — net | $ | 940,138 | $ | 598,985 | $ | 55,077 | $ | — | $ | 159,821 | $ | — | $ | — | $ | 1,986,083 | $ | — | ||||||||||||||||||
Undistributed long-term capital gains | 10,469,079 | — | 1,151 | 1,483 | — | 71,898,785 | 65,894,887 | 176,065 | 16,707,540 | |||||||||||||||||||||||||||
Total undistributed earnings | $ | 11,409,217 | $ | 598,985 | $ | 56,228 | $ | 1,483 | $ | 159,821 | $ | 71,898,785 | $ | 65,894,887 | $ | 2,162,148 | $ | 16,707,540 | ||||||||||||||||||
Capital loss carryforwards: | ||||||||||||||||||||||||||||||||||||
Perpetual Short-Term | — | (1,011,477 | ) | — | — | (168,628 | ) | — | — | — | — | |||||||||||||||||||||||||
Total capital loss carryforwards | $ | — | $ | (1,011,477 | ) | $ | — | $ | — | $ | (168,628 | ) | $ | — | $ | — | $ | — | $ | — | ||||||||||||||||
Timing differences (Qualified Late Year Deferrals) | $ | — | $ | (1,015,284 | ) | $ | (379,906 | ) | $ | (34,516 | ) | $ | (1,254,463 | ) | $ | (8,092,308 | ) | $ | (11,095,012 | ) | $ | — | $ | (1,972,577 | ) | |||||||||||
Unrealized gains (losses) — net | 225,877,455 | 36,392,943 | 1,510,274 | 4,441,805 | 3,496,071 | 633,879,339 | 391,617,523 | 104,405,718 | 146,079,074 | |||||||||||||||||||||||||||
Total accumulated earnings (losses) net | $ | 237,286,672 | $ | 34,965,167 | $ | 1,186,596 | $ | 4,408,772 | $ | 2,232,801 | $ | 697,685,816 | $ | 446,417,398 | $ | 106,567,866 | $ | 160,814,037 | ||||||||||||||||||
As of August 31, 2016, the Funds’ aggregate security unrealized gains and losses based on cost for U.S. federal income tax purposes were as follows:
Capital Growth | Concentrated Growth | Dynamic U.S. Equity | Flexible Cap Growth | Focused Growth | Growth Opportunities | Small/Mid Cap Growth | Strategic Growth | Technology Opportunities | ||||||||||||||||||||||||||||
Tax Cost | $ | 621,026,980 | $ | 109,170,551 | $ | 5,737,743 | $ | 12,521,279 | $ | 21,136,091 | $ | 2,523,022,850 | $ | 2,214,260,365 | $ | 246,780,745 | $ | 242,417,955 | ||||||||||||||||||
Gross unrealized gain | 242,876,974 | 38,511,032 | 1,771,512 | 4,800,234 | 3,867,030 | 710,909,318 | 475,042,693 | 107,961,364 | 150,169,014 | |||||||||||||||||||||||||||
Gross unrealized loss | (16,999,519 | ) | (2,118,089 | ) | (261,238 | ) | (358,429 | ) | (370,959 | ) | (77,029,979 | ) | (83,425,170 | ) | (3,555,646 | ) | (4,089,940 | ) | ||||||||||||||||||
Net unrealized gains | $ | 225,877,455 | $ | 36,392,943 | $ | 1,510,274 | $ | 4,441,805 | $ | 3,496,071 | $ | 633,879,339 | $ | 391,617,523 | $ | 104,405,718 | $ | 146,079,074 | ||||||||||||||||||
The difference between GAAP-basis and tax-basis unrealized gains (losses) is attributable primarily to wash sales, and differences in tax treatment of underlying fund investments, and partnership investments.
In order to present certain components of the Funds’ capital accounts on a tax-basis, certain reclassifications have been recorded to the Funds’ accounts. These reclassifications have no impact on the net asset value of the Funds and result primarily from dividend redesignations, net operating losses, redemptions utilized as distributions, and differences in the treatment of underlying fund investments.
125
GOLDMAN SACHS FUNDAMENTAL EQUITY GROWTH FUNDS
Notes to Financial Statements (continued)
August 31, 2016
| 6. TAX INFORMATION (continued) |
| Fund | Paid-in Capital | Accumulated Net Realized Gain (Loss) | Accumulated Undistributed Net Investment Income (Loss) | |||||||||||
Capital Growth | $ | — | $ | 41,696 | $ | (41,696 | ) | |||||||
Concentrated Growth | — | (3,488 | ) | 3,488 | ||||||||||
Dynamic U.S. Equity | — | 237 | (237 | ) | ||||||||||
Flexible Cap Growth | (26,463 | ) | 1,822 | 24,641 | ||||||||||
Focused Growth | — | (1,291 | ) | 1,291 | ||||||||||
Growth Opportunities | (48,114,250 | ) | 30,545,799 | 17,568,451 | ||||||||||
Small/Mid Cap Growth | (19,544,492 | ) | 14,751,764 | 4,792,728 | ||||||||||
Strategic Growth | — | 41,958 | (41,958 | ) | ||||||||||
Technology Opportunities | (2,297,151 | ) | 82,935 | 2,214,216 | ||||||||||
GSAM has reviewed the Funds’ tax positions for all open tax years (the current and prior three years, as applicable) and has concluded that no provision for income tax is required in the Funds’ financial statements. Such open tax years remain subject to examination and adjustment by tax authorities.
| 7. OTHER RISKS |
The Funds’ risks include, but are not limited to, the following:
Investments in Other Investment Companies — As a shareholder of another investment company, including an exchange-traded fund (“ETF”), a Fund will indirectly bear its proportionate share of any net management fees and other expenses paid by such other investment companies, in addition to the fees and expenses regularly borne by the Fund. ETFs are subject to risks that do not apply to conventional mutual funds, including but not limited to the following: (i) the market price of the ETF’s shares may trade at a premium or a discount to their NAV; and (ii) an active trading market for an ETF’s shares may not develop or be maintained.
Large Shareholder Transactions Risk — A Fund may experience adverse effects when certain large shareholders, such as other funds, institutional investors (including those trading by use of non-discretionary mathematical formulas), financial intermediaries (who may make investment decisions on behalf of underlying clients and/or include a Fund in their investment model), individuals, accounts and Goldman Sachs affiliates, purchase or redeem large amounts of shares of a Fund. Such large shareholder redemptions may cause the Fund to sell portfolio securities at times when it would not otherwise do so, which may negatively impact a Fund’s NAV and liquidity. These transactions may also accelerate the realization of taxable income to shareholders if such sales of investments resulted in gains, and may also increase transaction costs. In addition, a large redemption could result in a Fund’s current expenses being allocated over a smaller asset base, leading to an increase in the Fund’s expense ratio. Similarly, large Fund share purchases may adversely affect a Fund’s performance to the extent that the Fund is delayed in investing new cash and is required to maintain a larger cash position than it ordinarily would.
126
GOLDMAN SACHS FUNDAMENTAL EQUITY GROWTH FUNDS
| 7. OTHER RISKS (continued) |
Liquidity Risk — The Funds may make investments that are illiquid or that may become less liquid in response to market developments or adverse investor perceptions. Illiquid investments may be more difficult to value. Liquidity risk may also refer to the risk that a Fund will not be able to pay redemption proceeds within the allowable time period because of unusual market conditions, an unusually high volume of redemption requests, or other reasons. To meet redemption requests, a Fund may be forced to sell investments at an unfavorable time and/or under unfavorable conditions.
Market and Credit Risks — In the normal course of business, the Funds trade financial instruments and enter into financial transactions where risk of potential loss exists due to changes in the market (market risk). Additionally, the Funds may also be exposed to credit risk in the event that an issuer or guarantor fails to perform or that an institution or entity with which the Funds have unsettled or open transactions defaults.
Non-Diversification Risk — The Concentrated Growth and Focused Growth Funds are non-diversified, meaning that they are permitted to invest a larger percentage of their assets in fewer issuers than diversified mutual funds. Thus, a Fund may be more susceptible to adverse developments affecting any single issuer held in its portfolio, and may be more susceptible to greater losses because of these developments.
Industry Concentration Risk — The Technology Opportunities Fund invests primarily in equity investments in high-quality technology, media, or service companies that adopt or use technology to improve their cost structure, revenue opportunities or competitive advantage. Because of its focus on technology, media and service companies, the Technology Opportunities Fund is subject to greater risk of loss as a result of adverse economic, business or other developments than if its investments were diversified across different industry sectors. The Technology Opportunities Fund may also invest in a relatively few number of issuers. Thus, the Technology Opportunities Fund may be more susceptible to adverse developments affecting any single issuer held in its portfolio and may be more susceptible to greater losses because of these developments.
| 8. INDEMNIFICATIONS |
Under the Trust’s organizational documents, its Trustees, officers, employees and agents are indemnified, to the extent permitted by the Act and state law, against certain liabilities that may arise out of performance of their duties to the Funds. Additionally, in the course of business, the Funds enter into contracts that contain a variety of indemnification clauses. The Funds’ maximum exposure under these arrangements is unknown, as this would involve future claims that may be made against the Funds that have not yet occurred. However, GSAM believes the risk of loss under these arrangements to be remote.
| 9. SUBSEQUENT EVENTS |
Subsequent events after the Statements of Assets and Liabilities date have been evaluated and GSAM has concluded that there is no impact requiring adjustment or disclosure in the financial statements.
127
GOLDMAN SACHS FUNDAMENTAL EQUITY GROWTH FUNDS
Notes to Financial Statements (continued)
August 31, 2016
| 10. SUMMARY OF SHARE TRANSACTIONS |
Share activity is as follows:
| Capital Growth Fund | ||||||||||||||||
|
| |||||||||||||||
| For the Fiscal Year Ended August 31, 2016 | For the Fiscal Year Ended August 31, 2015 | |||||||||||||||
|
| |||||||||||||||
| Shares | Dollars | Shares | Dollars | |||||||||||||
|
| |||||||||||||||
| Class A Shares | ||||||||||||||||
Shares sold | 664,254 | $ | 15,685,065 | 976,847 | $ | 25,917,436 | ||||||||||
Reinvestment of distributions | 2,165,893 | 51,418,306 | 4,123,424 | 103,869,050 | ||||||||||||
Shares converted from Class B(a) | — | — | 414,688 | 12,024,309 | ||||||||||||
Shares redeemed | (3,725,446 | ) | (88,186,013 | ) | (3,471,469 | ) | (91,144,434 | ) | ||||||||
| (895,299 | ) | (21,082,642 | ) | 2,043,490 | 50,666,361 | |||||||||||
| Class B Shares(a) | ||||||||||||||||
Shares sold | — | — | 46 | (927 | ) | |||||||||||
Shares converted to Class A | — | — | (498,183 | ) | (12,024,309 | ) | ||||||||||
Shares redeemed | — | — | (145,865 | ) | (3,508,408 | ) | ||||||||||
| — | — | (644,002 | ) | (15,533,644 | ) | |||||||||||
| Class C Shares | ||||||||||||||||
Shares sold | 249,049 | 4,603,944 | 341,161 | 7,154,847 | ||||||||||||
Reinvestment of distributions | 372,429 | 6,878,768 | 662,843 | 13,382,800 | ||||||||||||
Shares redeemed | (771,189 | ) | (14,309,764 | ) | (658,000 | ) | (14,020,677 | ) | ||||||||
| (149,711 | ) | (2,827,052 | ) | 346,004 | 6,516,970 | |||||||||||
| Institutional Shares | ||||||||||||||||
Shares sold | 435,916 | 11,486,482 | 1,585,630 | 45,287,101 | ||||||||||||
Reinvestment of distributions | 485,148 | 12,546,206 | 799,639 | 21,718,191 | ||||||||||||
Shares redeemed | (2,024,093 | ) | (49,724,048 | ) | (834,379 | ) | (23,663,917 | ) | ||||||||
| (1,103,029 | ) | (25,691,360 | ) | 1,550,890 | 43,341,375 | |||||||||||
| Service Shares | ||||||||||||||||
Shares sold | 6,962 | 162,356 | 62,182 | 1,605,801 | ||||||||||||
Reinvestment of distributions | 5,946 | 136,873 | 4,638 | 113,688 | ||||||||||||
Shares redeemed | (25,655 | ) | (593,276 | ) | (28,570 | ) | (723,854 | ) | ||||||||
| (12,747 | ) | (294,047 | ) | 38,250 | 995,635 | |||||||||||
| Class IR Shares | ||||||||||||||||
Shares sold | 53,124 | 1,326,280 | 53,066 | 1,401,921 | ||||||||||||
Reinvestment of distributions | 15,717 | 377,764 | 17,638 | 448,370 | ||||||||||||
Shares redeemed | (45,766 | ) | (1,054,398 | ) | (22,265 | ) | (590,653 | ) | ||||||||
| 23,075 | 649,646 | 48,439 | 1,259,638 | |||||||||||||
| Class R Shares | ||||||||||||||||
Shares sold | 73,489 | 1,728,829 | 42,000 | 1,095,082 | ||||||||||||
Reinvestment of distributions | 12,478 | 288,122 | 22,629 | 557,123 | ||||||||||||
Shares redeemed | (83,452 | ) | (1,950,338 | ) | (49,195 | ) | (1,249,171 | ) | ||||||||
| 2,515 | 66,613 | 15,434 | 403,034 | |||||||||||||
| Class R6 Shares(b) | ||||||||||||||||
Shares sold | — | — | 348 | 10,005 | ||||||||||||
Reinvestment of distributions | 28 | 730 | — | — | ||||||||||||
Shares redeemed | — | — | (1 | ) | (5 | ) | ||||||||||
| 28 | 730 | 347 | 10,000 | |||||||||||||
NET INCREASE (DECREASE) | (2,135,168 | ) | $ | (49,178,112 | ) | 3,398,852 | $ | 87,659,369 | ||||||||
| (a) Class | B Shares were converted into Class A Shares at the close of business on November 14, 2014. |
| (b) Commenced | operations on July 31, 2015. |
128
GOLDMAN SACHS FUNDAMENTAL EQUITY GROWTH FUNDS
| 10. SUMMARY OF SHARE TRANSACTIONS (continued) |
| Concentrated Growth Fund | Dynamic U.S. Equity Fund | |||||||||||||||||||||||||||||
| For the Fiscal Year Ended August 31, 2016 | For the Fiscal Year Ended August 31, 2015 | For the Fiscal Year Ended August 31, 2016 | For the Fiscal Year Ended August 31, 2015 | |||||||||||||||||||||||||||
| Shares | Dollars | Shares | Dollars | Shares | Dollars | Shares | Dollars | |||||||||||||||||||||||
| 52,192 | $ | 821,213 | 55,670 | $ | 978,969 | 12,607 | $ | 162,541 | 52,789 | $ | 820,752 | |||||||||||||||||||
| 45,827 | 684,660 | 71,053 | 1,165,979 | 23,802 | 308,204 | 52,411 | 765,728 | |||||||||||||||||||||||
| — | — | 7,520 | 147,183 | — | — | — | — | |||||||||||||||||||||||
| (119,056 | ) | (1,736,160 | ) | (76,057 | ) | (1,307,935 | ) | (95,770 | ) | (1,210,967 | ) | (156,061 | ) | (2,319,211 | ) | |||||||||||||||
| (21,037 | ) | (230,287 | ) | 58,186 | 984,196 | (59,361 | ) | (740,222 | ) | (50,861 | ) | (732,731 | ) | |||||||||||||||||
| — | — | 59 | 1,022 | — | — | — | — | |||||||||||||||||||||||
| — | — | (8,332 | ) | (147,183 | ) | — | — | — | — | |||||||||||||||||||||
| — | — | (9,429 | ) | (164,840 | ) | — | — | — | — | |||||||||||||||||||||
| — | — | (17,702 | ) | (311,001 | ) | — | — | — | — | |||||||||||||||||||||
| 31,025 | 409,544 | 58,437 | 871,637 | 4,026 | 49,591 | 18,945 | 278,664 | |||||||||||||||||||||||
| 20,916 | 267,936 | 27,141 | 391,651 | 2,696 | 33,918 | 3,284 | 46,987 | |||||||||||||||||||||||
| (137,702 | ) | (1,784,637 | ) | (31,628 | ) | (480,372 | ) | (17,511 | ) | (219,594 | ) | (11,203 | ) | (163,428 | ) | |||||||||||||||
| (85,761 | ) | (1,107,157 | ) | 53,950 | 782,916 | (10,789 | ) | (136,085 | ) | 11,026 | 162,223 | |||||||||||||||||||
| 296,640 | 4,728,852 | 503,027 | 8,885,577 | 48,423 | 656,390 | 215,701 | 3,227,428 | |||||||||||||||||||||||
| 1,049,110 | 16,578,987 | 1,700,015 | 29,223,264 | 59,033 | 770,241 | 95,608 | 1,401,610 | |||||||||||||||||||||||
| (2,109,806 | ) | (32,916,814 | ) | (1,576,937 | ) | (28,212,893 | ) | (521,192 | ) | (6,696,086 | ) | (73,412 | ) | (1,136,708 | ) | |||||||||||||||
| (764,056 | ) | (11,608,975 | ) | 626,105 | 9,895,948 | (413,736 | ) | (5,269,455 | ) | 237,897 | 3,492,330 | |||||||||||||||||||
| — | — | — | — | — | — | — | — | |||||||||||||||||||||||
| — | — | — | — | — | — | — | — | |||||||||||||||||||||||
| — | — | — | — | — | — | — | — | |||||||||||||||||||||||
| — | — | — | — | — | — | — | — | |||||||||||||||||||||||
| 11,110 | 165,677 | 2,776 | 47,194 | 28,181 | 344,243 | 44,085 | 607,385 | |||||||||||||||||||||||
| 2,439 | 36,968 | 4,113 | 68,200 | 3,311 | 43,086 | 2,374 | 34,777 | |||||||||||||||||||||||
| (5,059 | ) | (76,091 | ) | (5,981 | ) | (103,552 | ) | (76,845 | ) | (1,011,626 | ) | (1,546 | ) | (23,165 | ) | |||||||||||||||
| 8,490 | 126,554 | 908 | 11,842 | (45,353 | ) | (624,297 | ) | 44,913 | 618,997 | |||||||||||||||||||||
| 461 | 6,645 | 795 | 13,236 | 428 | 5,433 | 739 | 11,079 | |||||||||||||||||||||||
| 211 | 3,065 | 166 | 2,664 | 424 | 5,478 | 1,202 | 17,544 | |||||||||||||||||||||||
| (876 | ) | (12,879 | ) | — | — | (7,899 | ) | (108,468 | ) | (59 | ) | (901 | ) | |||||||||||||||||
| (204 | ) | (3,169 | ) | 961 | 15,900 | (7,047 | ) | (97,557 | ) | 1,882 | 27,722 | |||||||||||||||||||
| — | — | 555 | 10,005 | — | — | 666 | 10,005 | |||||||||||||||||||||||
| 65 | 1,028 | — | — | 77 | 1,003 | — | — | |||||||||||||||||||||||
| — | — | (1 | ) | (5 | ) | — | — | (1 | ) | (5 | ) | |||||||||||||||||||
| 65 | 1,028 | 554 | 10,000 | 77 | 1,003 | 665 | 10,000 | |||||||||||||||||||||||
| (862,503 | ) | $ | (12,822,006 | ) | 722,962 | $ | 11,389,801 | (536,209 | ) | $ | (6,866,613 | ) | 245,522 | $ | 3,578,541 | |||||||||||||||
129
GOLDMAN SACHS FUNDAMENTAL EQUITY GROWTH FUNDS
Notes to Financial Statements (continued)
August 31, 2016
| 10. SUMMARY OF SHARE TRANSACTIONS (continued) |
Share activity is as follows:
| Flexible Cap Growth Fund | ||||||||||||||||
|
| |||||||||||||||
| For the Fiscal Year Ended August 31, 2016 | For the Fiscal Year Ended August 31, 2015 | |||||||||||||||
|
| |||||||||||||||
| Shares | Dollars | Shares | Dollars | |||||||||||||
|
| |||||||||||||||
| Class A Shares | ||||||||||||||||
Shares sold | 136,627 | $ | 1,598,220 | 238,465 | $ | 2,970,412 | ||||||||||
Reinvestment of distributions | 40,108 | 458,035 | 75,889 | 897,010 | ||||||||||||
Shares converted from Class B(a) | — | — | — | — | ||||||||||||
Shares redeemed | (263,936 | ) | (2,915,077 | ) | (151,050 | ) | (1,870,489 | ) | ||||||||
| (87,201 | ) | (858,822 | ) | 163,304 | 1,996,933 | |||||||||||
| Class B Shares(a) | ||||||||||||||||
Shares sold | — | — | — | — | ||||||||||||
Shares converted to Class A | — | — | — | — | ||||||||||||
Shares redeemed | — | — | — | — | ||||||||||||
| — | — | — | — | |||||||||||||
| Class C Shares | ||||||||||||||||
Shares sold | 36,060 | 382,842 | 74,144 | 824,538 | ||||||||||||
Reinvestment of distributions | 11,168 | 116,932 | 16,649 | 182,809 | ||||||||||||
Shares redeemed | (73,393 | ) | (766,608 | ) | (16,985 | ) | (195,137 | ) | ||||||||
| (26,165 | ) | (266,834 | ) | 73,808 | 812,210 | |||||||||||
| Institutional Shares | ||||||||||||||||
Shares sold | 93,234 | 1,069,282 | 82,904 | 1,085,506 | ||||||||||||
Reinvestment of distributions | 41,542 | 497,675 | 90,749 | 1,117,114 | ||||||||||||
Shares redeemed | (69,689 | ) | (843,461 | ) | (87,600 | ) | (1,156,663 | ) | ||||||||
| 65,087 | 723,496 | 86,053 | 1,045,957 | |||||||||||||
| Service Shares | ||||||||||||||||
Shares sold | — | — | — | — | ||||||||||||
Reinvestment of distributions | — | — | — | — | ||||||||||||
Shares redeemed | — | — | — | — | ||||||||||||
| — | — | — | — | |||||||||||||
| Class IR Shares | ||||||||||||||||
Shares sold | 11,548 | 134,523 | 18,873 | 242,837 | ||||||||||||
Reinvestment of distributions | 1,142 | 13,475 | 2,697 | 32,792 | ||||||||||||
Shares redeemed | (17,043 | ) | (195,238 | ) | (10,280 | ) | (131,753 | ) | ||||||||
| (4,353 | ) | (47,240 | ) | 11,290 | 143,876 | |||||||||||
| Class R Shares | ||||||||||||||||
Shares sold | 973 | 10,929 | 187 | 2,285 | ||||||||||||
Reinvestment of distributions | 203 | 2,254 | 700 | 8,089 | ||||||||||||
Shares redeemed | (749 | ) | (8,168 | ) | (2,268 | ) | (25,967 | ) | ||||||||
| 427 | 5,015 | (1,381 | ) | (15,593 | ) | |||||||||||
| Class R6 Shares(b) | ||||||||||||||||
Shares sold | — | — | 748 | 10,005 | ||||||||||||
Reinvestment of distributions | 46 | 544 | — | — | ||||||||||||
Shares redeemed | — | — | (1 | ) | (5 | ) | ||||||||||
| 46 | 544 | 747 | 10,000 | |||||||||||||
NET INCREASE (DECREASE) | (52,159 | ) | $ | (443,841 | ) | 333,821 | $ | 3,993,383 | ||||||||
| (a) Class | B Shares were converted into Class A Shares at the close of business on November 14, 2014. |
| (b) Commenced | operations on July 31, 2015. |
130
GOLDMAN SACHS FUNDAMENTAL EQUITY GROWTH FUNDS
| 10. SUMMARY OF SHARE TRANSACTIONS (continued) |
| Focused Growth Fund | Growth Opportunities Fund | |||||||||||||||||||||||||||||
| For the Fiscal Year Ended August 31, 2016 | For the Fiscal Year Ended August 31, 2015 | For the Fiscal Year Ended August 31, 2016 | For the Fiscal Year Ended August 31, 2015 | |||||||||||||||||||||||||||
| Shares | Dollars | Shares | Dollars | Shares | Dollars | Shares | Dollars | |||||||||||||||||||||||
| 13,514 | $ | 196,056 | 9,436 | $ | 140,612 | 5,188,410 | $ | 109,990,949 | 10,162,774 | $ | 263,713,914 | |||||||||||||||||||
| 1,035 | 14,681 | 265 | 3,858 | 4,305,749 | 89,085,946 | 7,862,988 | 194,608,943 | |||||||||||||||||||||||
| — | — | — | — | — | — | 34,936 | 1,073,724 | |||||||||||||||||||||||
| (7,574 | ) | (101,683 | ) | (2,237 | ) | (33,745 | ) | (20,121,034 | ) | (429,709,764 | ) | (15,091,283 | ) | (398,553,720 | ) | |||||||||||||||
| 6,975 | 109,054 | 7,464 | 110,725 | (10,626,875 | ) | (230,632,869 | ) | 2,969,415 | 60,842,861 | |||||||||||||||||||||
| — | — | — | — | — | — | 331 | 9,731 | |||||||||||||||||||||||
| — | — | — | — | — | — | (41,101 | ) | (1,073,724 | ) | |||||||||||||||||||||
| — | — | — | — | — | — | (242,765 | ) | (6,335,557 | ) | |||||||||||||||||||||
| — | — | — | — | — | — | (283,535 | ) | (7,399,550 | ) | |||||||||||||||||||||
| 16,287 | 237,681 | 952 | 13,553 | 962,529 | 15,367,206 | 1,522,314 | 31,339,481 | |||||||||||||||||||||||
| 1,049 | 14,477 | 191 | 2,722 | 1,130,439 | 17,894,856 | 1,727,078 | 34,161,609 | |||||||||||||||||||||||
| (8,707 | ) | (113,983 | ) | — | — | (3,185,261 | ) | (51,807,187 | ) | (1,878,064 | ) | (39,006,240 | ) | |||||||||||||||||
| 8,629 | 138,175 | 1,143 | 16,275 | (1,092,293 | ) | (18,545,125 | ) | 1,371,328 | 26,494,850 | |||||||||||||||||||||
| 141,976 | 1,993,103 | 835,824 | 12,593,862 | 18,570,813 | 439,755,390 | 32,672,439 | 942,723,382 | |||||||||||||||||||||||
| 126,942 | 1,821,523 | 140,298 | 2,053,966 | 10,632,111 | 250,386,206 | 18,723,667 | 517,709,381 | |||||||||||||||||||||||
| (876,939 | ) | (12,292,099 | ) | (315,947 | ) | (4,726,228 | ) | (60,682,704 | ) | (1,450,641,387 | ) | (46,242,562 | ) | (1,348,789,303 | ) | |||||||||||||||
| (608,021 | ) | (8,477,473 | ) | 660,175 | 9,921,600 | (31,479,780 | ) | (760,499,791 | ) | 5,153,544 | 111,643,460 | |||||||||||||||||||
| — | — | — | — | 212,601 | 4,302,039 | 416,015 | 10,428,771 | |||||||||||||||||||||||
| — | — | — | — | 224,585 | 4,484,961 | 373,257 | 8,961,890 | |||||||||||||||||||||||
| — | — | — | — | (772,840 | ) | (15,380,698 | ) | (617,666 | ) | (15,639,616 | ) | |||||||||||||||||||
| — | — | — | — | (335,654 | ) | (6,593,698 | ) | 171,606 | 3,751,045 | |||||||||||||||||||||
| 2,834 | 38,785 | — | — | 1,654,412 | 36,014,147 | 3,125,965 | 83,299,492 | |||||||||||||||||||||||
| 62 | 893 | 76 | 1,117 | 873,457 | 18,674,509 | 1,195,970 | 30,389,605 | |||||||||||||||||||||||
| — | — | — | — | (3,491,281 | ) | (76,158,982 | ) | (1,951,082 | ) | (52,078,172 | ) | |||||||||||||||||||
| 2,896 | 39,678 | 76 | 1,117 | (963,412 | ) | (21,470,326 | ) | 2,370,853 | 61,610,925 | |||||||||||||||||||||
| — | — | — | — | 660,335 | 13,556,973 | 903,121 | 23,021,670 | |||||||||||||||||||||||
| 62 | 868 | 76 | 1,095 | 423,033 | 8,481,806 | 683,591 | 16,501,884 | |||||||||||||||||||||||
| — | — | — | — | (1,424,623 | ) | (29,193,359 | ) | (956,401 | ) | (23,828,857 | ) | |||||||||||||||||||
| 62 | 868 | 76 | 1,095 | (341,255 | ) | (7,154,580 | ) | 630,311 | 15,694,697 | |||||||||||||||||||||
| — | — | 656 | 10,005 | 1,874,647 | 45,447,017 | 352 | 10,005 | |||||||||||||||||||||||
| 36 | 519 | — | — | 45,912 | 1,081,229 | — | — | |||||||||||||||||||||||
| — | — | (1 | ) | (5 | ) | (109,482 | ) | (2,621,944 | ) | (1 | ) | (5 | ) | |||||||||||||||||
| 36 | 519 | 655 | 10,000 | 1,811,077 | 43,906,302 | 351 | 10,000 | |||||||||||||||||||||||
| (589,423 | ) | $ | (8,189,179 | ) | 669,589 | $ | 10,060,812 | (43,028,192 | ) | $ | (1,000,990,087 | ) | 12,383,873 | $ | 272,648,288 | |||||||||||||||
131
GOLDMAN SACHS FUNDAMENTAL EQUITY GROWTH FUNDS
Notes to Financial Statements (continued)
August 31, 2016
| 10. SUMMARY OF SHARE TRANSACTIONS (continued) |
Share activity is as follows:
| Small/Mid Cap Growth Fund | ||||||||||||||||
|
| |||||||||||||||
| For the Fiscal Year Ended August 31, 2016 | For the Fiscal Year Ended August 31, 2015 | |||||||||||||||
|
| |||||||||||||||
| Shares | Dollars | Shares | Dollars | |||||||||||||
|
| |||||||||||||||
| Class A Shares | ||||||||||||||||
Shares sold | 13,059,932 | $ | 248,962,765 | 16,565,512 | $ | 349,968,548 | ||||||||||
Reinvestment of distributions | 1,658,772 | 32,113,835 | 2,828,794 | 56,179,848 | ||||||||||||
Shares converted from Class B(a) | — | — | 16,583 | 355,101 | ||||||||||||
Shares redeemed | (21,364,280 | ) | (402,785,510 | ) | (11,141,305 | ) | (232,471,494 | ) | ||||||||
| (6,645,576 | ) | (121,708,910 | ) | 8,269,584 | 174,032,003 | |||||||||||
| Class B Shares(a) | ||||||||||||||||
Shares sold | — | — | 429 | 8,690 | ||||||||||||
Shares converted to Class A | — | — | (18,064 | ) | (355,101 | ) | ||||||||||
Shares redeemed | — | — | (165,032 | ) | (3,247,551 | ) | ||||||||||
| — | — | (182,667 | ) | (3,593,962 | ) | |||||||||||
| Class C Shares | ||||||||||||||||
Shares sold | 3,947,819 | 67,860,295 | 4,066,231 | 78,124,640 | ||||||||||||
Reinvestment of distributions | 552,467 | 9,612,934 | 939,595 | 16,969,081 | ||||||||||||
Shares redeemed | (3,869,475 | ) | (65,440,359 | ) | (2,223,521 | ) | (42,496,235 | ) | ||||||||
| 630,811 | 12,032,870 | 2,782,305 | 52,597,486 | |||||||||||||
| Institutional Shares | ||||||||||||||||
Shares sold | 23,356,509 | 467,210,062 | 25,380,718 | 558,001,282 | ||||||||||||
Reinvestment of distributions | 1,970,711 | 40,044,852 | 3,594,511 | 74,478,267 | ||||||||||||
Shares redeemed | (28,679,407 | ) | (559,510,889 | ) | (16,119,224 | ) | (349,393,249 | ) | ||||||||
| (3,352,187 | ) | (52,255,975 | ) | 12,856,005 | 283,086,300 | |||||||||||
| Service Shares | ||||||||||||||||
Shares sold | 281,592 | 5,278,687 | 419,139 | 8,644,070 | ||||||||||||
Reinvestment of distributions | 20,051 | 380,769 | 19,492 | 380,479 | ||||||||||||
Shares redeemed | (208,125 | ) | (3,881,601 | ) | (237,304 | ) | (4,886,182 | ) | ||||||||
| 93,518 | 1,777,855 | 201,327 | 4,138,367 | |||||||||||||
| Class IR Shares | ||||||||||||||||
Shares sold | 10,006,149 | 196,523,636 | 3,779,029 | 81,238,926 | ||||||||||||
Reinvestment of distributions | 506,347 | 10,050,989 | 679,062 | 13,778,175 | ||||||||||||
Shares redeemed | (5,540,314 | ) | (106,415,747 | ) | (2,100,230 | ) | (44,705,893 | ) | ||||||||
| 4,972,182 | 100,158,878 | 2,357,861 | 50,311,208 | |||||||||||||
| Class R Shares | ||||||||||||||||
Shares sold | 666,389 | 12,300,998 | 590,027 | 12,110,052 | ||||||||||||
Reinvestment of distributions | 59,341 | 1,120,945 | 132,069 | 2,568,736 | ||||||||||||
Shares redeemed | (654,691 | ) | (12,142,962 | ) | (672,345 | ) | (13,841,156 | ) | ||||||||
| 71,039 | 1,278,981 | 49,751 | 837,632 | |||||||||||||
| Class R6 Shares(b) | ||||||||||||||||
Shares sold | 537,717 | 10,568,618 | 427 | 10,005 | ||||||||||||
Reinvestment of distributions | 16 | 313 | — | — | ||||||||||||
Shares redeemed | (69,825 | ) | (1,402,008 | ) | (1 | ) | (5 | ) | ||||||||
| 467,908 | 9,166,923 | 426 | 10,000 | |||||||||||||
NET INCREASE (DECREASE) | (3,762,305 | ) | $ | (49,549,378 | ) | 26,334,592 | $ | 561,419,034 | ||||||||
| (a) Class | B Shares were converted into Class A Shares at the close of business on November 14, 2014. |
| (b) Commenced | operations on July 31, 2015. |
132
GOLDMAN SACHS FUNDAMENTAL EQUITY GROWTH FUNDS
| 10. SUMMARY OF SHARE TRANSACTIONS (continued) |
| Strategic Growth Fund | Technology Opportunities Fund | |||||||||||||||||||||||||||||
| For the Fiscal Year Ended August 31, 2016 | For the Fiscal Year Ended August 31, 2015 | For the Fiscal Year Ended August 31, 2016 | For the Fiscal Year Ended August 31, 2015 | |||||||||||||||||||||||||||
| Shares | Dollars | Shares | Dollars | Shares | Dollars | Shares | Dollars | |||||||||||||||||||||||
| 823,979 | $ | 9,618,983 | 931,649 | $ | 11,624,508 | 1,770,746 | $ | 31,374,570 | 3,707,771 | $ | 68,710,401 | |||||||||||||||||||
| 219,495 | 2,569,040 | 623,276 | 7,460,611 | 1,154,064 | 20,565,422 | 1,001,763 | 17,841,403 | |||||||||||||||||||||||
| — | — | 6,679 | 92,424 | — | — | 109,463 | 2,114,732 | |||||||||||||||||||||||
| (970,584 | ) | (11,223,910 | ) | (1,585,906 | ) | (19,961,088 | ) | (4,430,997 | ) | (75,088,065 | ) | (4,623,826 | ) | (84,541,383 | ) | |||||||||||||||
| 72,890 | 964,113 | (24,302 | ) | (783,545 | ) | (1,506,187 | ) | (23,148,073 | ) | 195,171 | 4,125,153 | |||||||||||||||||||
| — | — | — | — | — | — | 72 | 1,203 | |||||||||||||||||||||||
| — | — | (7,606 | ) | (92,424 | ) | — | — | (122,977 | ) | (2,114,732 | ) | |||||||||||||||||||
| — | �� | — | (62,687 | ) | (758,883 | ) | — | — | (131,293 | ) | (2,254,440 | ) | ||||||||||||||||||
| — | — | (70,293 | ) | (851,307 | ) | — | — | (254,198 | ) | (4,367,969 | ) | |||||||||||||||||||
| 162,871 | 1,581,949 | 155,852 | 1,661,932 | 311,683 | 4,754,165 | 361,936 | 5,854,871 | |||||||||||||||||||||||
| 55,139 | 544,217 | 143,499 | 1,473,731 | 282,440 | 4,341,104 | 254,225 | 3,986,258 | |||||||||||||||||||||||
| (211,544 | ) | (2,076,408 | ) | (180,100 | ) | (1,930,524 | ) | (717,473 | ) | (10,769,123 | ) | (669,583 | ) | (10,831,500 | ) | |||||||||||||||
| 6,466 | 49,758 | 119,251 | 1,205,139 | (123,350 | ) | (1,673,854 | ) | (53,422 | ) | (990,371 | ) | |||||||||||||||||||
| 8,220,144 | 99,417,986 | 5,625,401 | 72,107,285 | 1,051,764 | 19,886,091 | 1,165,921 | 22,754,302 | |||||||||||||||||||||||
| 1,582,533 | 19,641,430 | 3,789,883 | 47,790,420 | 318,400 | 6,126,021 | 354,531 | 6,750,272 | |||||||||||||||||||||||
| (12,531,831 | ) | (152,494,532 | ) | (6,845,084 | ) | (89,891,107 | ) | (2,053,226 | ) | (39,107,713 | ) | (1,621,145 | ) | (31,887,600 | ) | |||||||||||||||
| (2,729,154 | ) | (33,435,116 | ) | 2,570,200 | 30,006,598 | (683,062 | ) | (13,095,601 | ) | (100,693 | ) | (2,383,026 | ) | |||||||||||||||||
| 5,667 | 65,578 | 12,295 | 151,634 | 378,536 | 6,613,636 | 281,564 | 5,091,170 | |||||||||||||||||||||||
| 1,139 | 13,275 | 2,064 | 24,623 | 49,979 | 877,134 | 43,016 | 756,231 | |||||||||||||||||||||||
| (5,357 | ) | (64,372 | ) | (4,409 | ) | (53,271 | ) | (405,820 | ) | (6,930,197 | ) | (311,692 | ) | (5,657,682 | ) | |||||||||||||||
| 1,449 | 14,481 | 9,950 | 122,986 | 22,695 | 560,573 | 12,888 | 189,719 | |||||||||||||||||||||||
| 13,080 | 164,860 | 10,875 | 148,776 | 83,801 | 1,620,126 | 223,598 | 4,402,391 | |||||||||||||||||||||||
| 4,008 | 49,728 | 11,782 | 148,694 | 26,798 | 511,029 | 11,996 | 226,845 | |||||||||||||||||||||||
| (16,658 | ) | (204,493 | ) | (27,752 | ) | (358,927 | ) | (94,969 | ) | (1,714,376 | ) | (76,561 | ) | (1,497,039 | ) | |||||||||||||||
| 430 | 10,095 | (5,095 | ) | (61,457 | ) | 15,630 | 416,779 | 159,033 | 3,132,197 | |||||||||||||||||||||
| 1,497 | 17,086 | 5,711 | 69,325 | — | — | — | — | |||||||||||||||||||||||
| 33 | 381 | 225 | 2,673 | — | — | — | — | |||||||||||||||||||||||
| (1,162 | ) | (13,491 | ) | (516 | ) | (6,239 | ) | — | — | — | — | |||||||||||||||||||
| 368 | 3,976 | 5,420 | 65,759 | — | — | — | — | |||||||||||||||||||||||
| — | — | 750 | 10,005 | — | — | — | — | |||||||||||||||||||||||
| 44 | 558 | — | — | — | — | — | — | |||||||||||||||||||||||
| — | — | (1 | ) | (5 | ) | — | — | — | — | |||||||||||||||||||||
| 44 | 558 | 749 | 10,000 | — | — | — | — | |||||||||||||||||||||||
| (2,647,507 | ) | $ | (32,392,135 | ) | 2,605,880 | $ | 29,714,173 | (2,274,274 | ) | $ | (36,940,176 | ) | (41,221 | ) | $ | (294,297 | ) | |||||||||||||
133
Report of Independent Registered Public
Accounting Firm
To the Board of Trustees of Goldman Sachs Trust and Shareholders of the
Goldman Sachs Fundamental Equity Growth Funds:
In our opinion, the accompanying statements of assets and liabilities, including the schedules of investments, and the related statements of operations and of changes in net assets and the financial highlights present fairly, in all material respects, the financial position of the Goldman Sachs Capital Growth Fund, Goldman Sachs Concentrated Growth Fund, Goldman Sachs Dynamic U.S. Equity Fund, Goldman Sachs Flexible Cap Growth Fund, Goldman Sachs Focused Growth Fund, Goldman Sachs Growth Opportunities Fund, Goldman Sachs Small/Mid Cap Growth Fund, Goldman Sachs Strategic Growth Fund, and Goldman Sachs Technology Opportunities Fund (collectively the “Funds”), funds of the Goldman Sachs Trust, at August 31, 2016, and the results of each of their operations, the changes in each of their net assets and the financial highlights for each of the periods indicated, in conformity with accounting principles generally accepted in the United States of America. These financial statements and financial highlights (hereafter referred to as “financial statements”) are the responsibility of the Funds’ management. Our responsibility is to express an opinion on these financial statements based on our audits. We conducted our audits of these financial statements in accordance with the standards of the Public Company Accounting Oversight Board (United States). Those standards require that we plan and perform the audit to obtain reasonable assurance about whether the financial statements are free of material misstatement. An audit includes examining, on a test basis, evidence supporting the amounts and disclosures in the financial statements, assessing the accounting principles used and significant estimates made by management, and evaluating the overall financial statement presentation. We believe that our audits, which included confirmation of securities at August 31, 2016 by correspondence with the custodian, brokers, transfer agent of the underlying funds and the application of alternative auditing procedures where securities purchased confirmations had not been received, provide a reasonable basis for our opinion.
PricewaterhouseCoopers LLP
Boston, Massachusetts
October 21, 2016
134
GOLDMAN SACHS FUNDAMENTAL EQUITY GROWTH FUNDS
Fund Expenses — Six Month Period Ended August 31, 2016 (Unaudited)
As a shareholder of Class A, Class C, Institutional, Service, Class IR, Class R and Class R6 Shares of a Fund, you incur two types of costs: (1) transaction costs, including sales charges on purchase payments (with respect to Class A Shares), contingent deferred sales charges on redemptions (with respect to Class C Shares), and (2) ongoing costs, including management fees; distribution and/or service (12b-1) fees (with respect to Class A, Class C, Service and Class R Shares); and other Fund expenses. This Example is intended to help you understand your ongoing costs (in dollars) of investing in Class A, Class C, Institutional, Service, Class IR, Class R or Class R6 Shares of the Funds and to compare these costs with the ongoing costs of investing in other mutual funds.
The Example is based on an investment of $1,000 invested at the beginning of the period and held for the entire period from March 1, 2016 through August 31, 2016, which represents a period of 184 days in a 366-day year.
Actual Expenses — The first line under each share class in the table below provides information about actual account values and actual expenses. You may use the information in this line, together with the amount you invested, to estimate the expenses that you paid over the period. Simply divide your account value by $1,000 (for example, an $8,600 account value divided by $1,000=8.6), then multiply the result by the number in the first line under the heading entitled “Expenses Paid” to estimate the expenses you paid on your account during this period.
Hypothetical Example for Comparison Purposes — The second line under each share class in the table below provides information about hypothetical account values and hypothetical expenses based on the Funds’ actual net expense ratios and an assumed rate of return of 5% per year before expenses, which is not the Funds’ actual return. The hypothetical account values and expenses may not be used to estimate the actual ending account balance or expenses you paid for the period. You may use this information to compare the ongoing costs of investing in the Funds and other funds. To do so, compare this 5% hypothetical example with the 5% hypothetical examples that appear in the shareholder reports of the other funds.
Please note that the expenses shown in the table are meant to highlight your ongoing costs only and do not reflect any transactional costs, such as sales charges, redemption fees, or exchange fees. Therefore, the second line of the table is useful in comparing ongoing costs only, and will not help you determine the relative total costs of owning different funds. In addition, if these transactional costs were included, your costs would have been higher.
| Capital Growth Fund | Concentrated Growth Fund | Dynamic U.S. Equity Fund | Flexible Cap Growth Fund | Focused Growth Fund | ||||||||||||||||||||||||||||||||||||||||||||||||||||||||
| Share Class | Beginning Account Value 3/1/16 | Ending Account Value 8/31/16 | Expenses Paid for the 6 months ended 8/31/16* | Beginning Account Value 3/1/16 | Ending Account Value 8/31/16 | Expenses Paid for the 6 months ended 8/31/16* | Beginning Account Value 3/1/16 | Ending Account Value 8/31/16 | Expenses Paid for the 6 months ended 8/31/16* | Beginning Account Value 3/1/16 | Ending Account Value 8/31/16 | Expenses Paid for the 6 months ended 8/31/16* | Beginning Account Value 3/1/16 | Ending Account Value 8/31/16 | Expenses Paid for the 6 months ended 8/31/16* | |||||||||||||||||||||||||||||||||||||||||||||
| Class A | ||||||||||||||||||||||||||||||||||||||||||||||||||||||||||||
Actual | $ | 1,000.00 | $ | 1,113.40 | $ | 6.11 | $ | 1,000.00 | $ | 1,112.30 | $ | 6.48 | $ | 1,000.00 | $ | 1,126.60 | $ | 6.52 | $ | 1,000.00 | $ | 1,127.80 | $ | 6.53 | $ | 1,000.00 | $ | 1,093.20 | $ | 6.31 | ||||||||||||||||||||||||||||||
Hypothetical 5% return | 1,000.00 | 1,019.36 | + | 5.84 | 1,000.00 | 1,019.00 | + | 6.19 | 1,000.00 | 1,019.00 | + | 6.19 | 1,000.00 | 1,019.00 | + | 6.19 | 1,000.00 | 1,019.10 | + | 6.09 | ||||||||||||||||||||||||||||||||||||||||
| Class C | ||||||||||||||||||||||||||||||||||||||||||||||||||||||||||||
Actual | 1,000.00 | 1,109.30 | 10.07 | 1,000.00 | 1,107.90 | 10.44 | 1,000.00 | 1,122.00 | 10.51 | 1,000.00 | 1,123.80 | 10.52 | 1,000.00 | 1,089.70 | 10.24 | |||||||||||||||||||||||||||||||||||||||||||||
Hypothetical 5% return | 1,000.00 | 1,015.59 | + | 9.63 | 1,000.00 | 1,015.23 | + | 9.98 | 1,000.00 | 1,015.23 | + | 9.98 | 1,000.00 | 1,015.23 | + | 9.98 | 1,000.00 | 1,015.33 | + | 9.88 | ||||||||||||||||||||||||||||||||||||||||
| Institutional | ||||||||||||||||||||||||||||||||||||||||||||||||||||||||||||
Actual | 1,000.00 | 1,116.10 | 3.99 | 1,000.00 | 1,113.90 | 4.36 | 1,000.00 | 1,128.50 | 4.39 | 1,000.00 | 1,129.90 | 4.39 | 1,000.00 | 1,095.20 | 4.21 | |||||||||||||||||||||||||||||||||||||||||||||
Hypothetical 5% return | 1,000.00 | 1,021.37 | + | 3.81 | 1,000.00 | 1,021.01 | + | 4.17 | 1,000.00 | 1,021.01 | + | 4.17 | 1,000.00 | 1,021.01 | + | 4.17 | 1,000.00 | 1,021.12 | + | 4.06 | ||||||||||||||||||||||||||||||||||||||||
| Service | ||||||||||||||||||||||||||||||||||||||||||||||||||||||||||||
Actual | 1,000.00 | 1,112.70 | 6.64 | N/A | N/A | N/A | N/A | N/A | N/A | N/A | N/A | N/A | N/A | N/A | N/A | |||||||||||||||||||||||||||||||||||||||||||||
Hypothetical 5% return | 1,000.00 | 1,018.85 | + | 6.34 | N/A | N/A | N/A | N/A | N/A | N/A | N/A | N/A | N/A | N/A | N/A | N/A | ||||||||||||||||||||||||||||||||||||||||||||
| Class IR | ||||||||||||||||||||||||||||||||||||||||||||||||||||||||||||
Actual | 1,000.00 | 1,115.30 | 4.79 | 1,000.00 | 1,112.90 | 5.15 | 1,000.00 | 1,127.70 | 5.19 | 1,000.00 | 1,129.10 | 5.19 | 1,000.00 | 1,094.60 | 5.00 | |||||||||||||||||||||||||||||||||||||||||||||
Hypothetical 5% return | 1,000.00 | 1,020.61 | + | 4.57 | 1,000.00 | 1,020.26 | + | 4.93 | 1,000.00 | 1,020.26 | + | 4.93 | 1,000.00 | 1,020.26 | + | 4.93 | 1,000.00 | 1,020.36 | + | 4.82 | ||||||||||||||||||||||||||||||||||||||||
| Class R | ||||||||||||||||||||||||||||||||||||||||||||||||||||||||||||
Actual | 1,000.00 | 1,112.00 | 7.43 | 1,000.00 | 1,109.80 | 7.85 | 1,000.00 | 1,124.60 | 7.85 | 1,000.00 | 1,126.20 | 7.86 | 1,000.00 | 1,091.40 | 7.62 | |||||||||||||||||||||||||||||||||||||||||||||
Hypothetical 5% return | 1,000.00 | 1,018.10 | + | 7.10 | 1,000.00 | 1,017.70 | + | 7.51 | 1,000.00 | 1,017.75 | + | 7.46 | 1,000.00 | 1,017.75 | + | 7.46 | 1,000.00 | 1,017.85 | + | 7.35 | ||||||||||||||||||||||||||||||||||||||||
| Class R6 | ||||||||||||||||||||||||||||||||||||||||||||||||||||||||||||
Actual | 1,000.00 | 1,115.60 | 3.99 | 1,000.00 | 1,114.60 | 4.31 | 1,000.00 | 1,128.50 | 4.33 | 1,000.00 | 1,129.90 | 4.39 | 1,000.00 | 1,095.20 | 4.11 | |||||||||||||||||||||||||||||||||||||||||||||
Hypothetical 5% return | 1,000.00 | 1,021.37 | + | 3.81 | 1,000.00 | 1,021.06 | + | 4.12 | 1,000.00 | 1,021.06 | + | 4.12 | 1,000.00 | 1,021.01 | + | 4.17 | 1,000.00 | 1,021.22 | + | 3.96 | ||||||||||||||||||||||||||||||||||||||||
135
GOLDMAN SACHS FUNDAMENTAL EQUITY GROWTH FUNDS
| Growth Opportunities Fund | Small/Mid Cap Growth Fund | Strategic Growth Fund | Technology Opportunities Fund | |||||||||||||||||||||||||||||||||||||||||||||
| Share Class | Beginning Account Value 3/1/16 | Ending Account Value 8/31/16 | Expenses Paid for the 6 months ended 8/31/16* | Beginning Account Value 3/1/16 | Ending Account Value 8/31/16 | Expenses Paid for the 6 months ended 8/31/16* | Beginning Account Value 3/1/16 | Ending Account Value 8/31/16 | Expenses Paid for the 6 months ended 8/31/16* | Beginning Account Value 3/1/16 | Ending Account Value 8/31/16 | Expenses Paid for the 6 months ended 8/31/16* | ||||||||||||||||||||||||||||||||||||
| Class A | ||||||||||||||||||||||||||||||||||||||||||||||||
Actual | $ | 1,000.00 | $ | 1,150.00 | $ | 7.03 | $ | 1,000.00 | $ | 1,160.80 | $ | 7.06 | $ | 1,000.00 | $ | 1,114.10 | $ | 6.11 | $ | 1,000.00 | $ | 1,203.00 | $ | 8.14 | ||||||||||||||||||||||||
Hypothetical 5% return | 1,000.00 | 1,018.60 | + | 6.60 | 1,000.00 | 1,018.60 | + | 6.60 | 1,000.00 | 1,019.36 | + | 5.84 | 1,000.00 | 1,017.75 | + | 7.46 | ||||||||||||||||||||||||||||||||
| Class C | ||||||||||||||||||||||||||||||||||||||||||||||||
Actual | 1,000.00 | 1,145.60 | 11.06 | 1,000.00 | 1,156.50 | 11.11 | 1,000.00 | 1,109.90 | 10.08 | 1,000.00 | 1,198.40 | 12.27 | ||||||||||||||||||||||||||||||||||||
Hypothetical 5% return | 1,000.00 | 1,014.83 | + | 10.38 | 1,000.00 | 1,014.83 | + | 10.38 | 1,000.00 | 1,015.59 | + | 9.63 | 1,000.00 | 1,013.98 | + | 11.24 | ||||||||||||||||||||||||||||||||
| Institutional | ||||||||||||||||||||||||||||||||||||||||||||||||
Actual | 1,000.00 | 1,151.60 | 5.14 | 1,000.00 | 1,163.10 | 5.06 | 1,000.00 | 1,115.60 | 3.99 | 1,000.00 | 1,205.60 | 5.93 | ||||||||||||||||||||||||||||||||||||
Hypothetical 5% return | 1,000.00 | 1,020.36 | + | 4.82 | 1,000.00 | 1,020.46 | + | 4.72 | 1,000.00 | 1,021.37 | + | 3.81 | 1,000.00 | 1,019.76 | + | 5.43 | ||||||||||||||||||||||||||||||||
| Service | ||||||||||||||||||||||||||||||||||||||||||||||||
Actual | 1,000.00 | 1,148.80 | 7.83 | 1,000.00 | 1,160.40 | 7.77 | 1,000.00 | 1,113.70 | 6.64 | 1,000.00 | 1,202.90 | 8.69 | ||||||||||||||||||||||||||||||||||||
Hypothetical 5% return | 1,000.00 | 1,017.85 | + | 7.35 | 1,000.00 | 1,017.95 | + | 7.25 | 1,000.00 | 1,018.85 | + | 6.34 | 1,000.00 | 1,017.24 | + | 7.96 | ||||||||||||||||||||||||||||||||
| Class IR | ||||||||||||||||||||||||||||||||||||||||||||||||
Actual | 1,000.00 | 1,151.20 | 5.68 | 1,000.00 | 1,162.50 | 5.71 | 1,000.00 | 1,114.70 | 4.78 | 1,000.00 | 1,204.60 | 6.76 | ||||||||||||||||||||||||||||||||||||
Hypothetical 5% return | 1,000.00 | 1,019.86 | + | 5.33 | 1,000.00 | 1,019.86 | + | 5.33 | 1,000.00 | 1,020.61 | + | 4.57 | 1,000.00 | 1,019.00 | + | 6.19 | ||||||||||||||||||||||||||||||||
| Class R | ||||||||||||||||||||||||||||||||||||||||||||||||
Actual | 1,000.00 | 1,148.20 | 8.37 | 1,000.00 | 1,159.50 | 8.41 | 1,000.00 | 1,111.60 | 7.43 | N/A | N/A | N/A | ||||||||||||||||||||||||||||||||||||
Hypothetical 5% return | 1,000.00 | 1,017.34 | + | 7.86 | 1,000.00 | 1,017.34 | + | 7.86 | 1,000.00 | 1,018.10 | + | 7.10 | N/A | N/A | N/A | |||||||||||||||||||||||||||||||||
| Class R6 | ||||||||||||||||||||||||||||||||||||||||||||||||
Actual | 1,000.00 | 1,152.10 | 5.03 | 1,000.00 | 1,163.10 | 5.00 | 1,000.00 | 1,115.70 | 3.99 | N/A | N/A | N/A | ||||||||||||||||||||||||||||||||||||
Hypothetical 5% return | 1,000.00 | 1,020.46 | + | 4.72 | 1,000.00 | 1,020.51 | + | 4.67 | 1,000.00 | 1,021.37 | + | 3.81 | N/A | N/A | N/A | |||||||||||||||||||||||||||||||||
| * | Expenses for each share class are calculated using each Fund’s annualized net expense ratio for each class, which represents the ongoing expenses as a percentage of net assets for the six months ended August 31, 2016. Expenses are calculated by multiplying the annualized net expense ratio by the average account value for the period; then multiplying the result by the number of days in the most recent fiscal half year; and then dividing that result by the number of days in the fiscal year. The annualized net expense ratios for the period were as follows: |
| Fund | Class A | Class C | �� | Institutional | Service | Class IR | Class R | Class R6 | ||||||||||||||||||||
Capital Growth | 1.15 | % | 1.90 | % | 0.75 | % | 1.25 | % | 0.90 | % | 1.40 | % | 0.75 | % | ||||||||||||||
Concentrated Growth | 1.22 | 1.97 | 0.82 | N/A | 0.97 | 1.48 | 0.81 | |||||||||||||||||||||
Dynamic U.S. Equity | 1.22 | 1.97 | 0.82 | N/A | 0.97 | 1.47 | 0.81 | |||||||||||||||||||||
Flexible Cap Growth | 1.22 | 1.97 | 0.82 | N/A | 0.97 | 1.47 | 0.82 | |||||||||||||||||||||
Focused Growth | 1.20 | 1.95 | 0.80 | N/A | 0.95 | 1.45 | 0.78 | |||||||||||||||||||||
Growth Opportunities | 1.30 | 2.05 | 0.95 | 1.45 | 1.05 | 1.55 | 0.93 | |||||||||||||||||||||
Small/Mid Cap Growth | 1.30 | 2.05 | 0.93 | 1.43 | 1.05 | 1.55 | 0.92 | |||||||||||||||||||||
Strategic Growth | 1.15 | 1.90 | 0.75 | 1.25 | 0.90 | 1.40 | 0.75 | |||||||||||||||||||||
Technology Opportunities | 1.47 | 2.22 | 1.07 | 1.57 | 1.22 | N/A | N/A | |||||||||||||||||||||
| + | Hypothetical expenses are based on each Fund’s actual annualized net expense ratios and an assumed rate of return of 5% per year before expenses. |
136
GOLDMAN SACHS FUNDAMENTAL EQUITY GROWTH FUNDS
Statement Regarding Basis for Approval of Management Agreement (Unaudited)
Background
The Goldman Sachs Capital Growth Fund, Goldman Sachs Concentrated Growth Fund, Goldman Sachs Dynamic U.S. Equity Fund, Goldman Sachs Flexible Cap Growth Fund, Goldman Sachs Focused Growth Fund, Goldman Sachs Growth Opportunities Fund, Goldman Sachs Small/Mid Cap Growth Fund, Goldman Sachs Strategic Growth Fund, and Goldman Sachs Technology Opportunities Fund (the “Funds”) are investment portfolios of Goldman Sachs Trust (the “Trust”). The Board of Trustees oversees the management of the Trust and reviews the investment performance and expenses of the Funds at regularly scheduled meetings held throughout the year. In addition, the Board of Trustees determines annually whether to approve the continuance of the Trust’s investment management agreement (the “Management Agreement”) with Goldman Sachs Asset Management, L.P. (the “Investment Adviser”) on behalf of the Funds.
The Management Agreement was most recently approved for continuation until June 30, 2017 by the Board of Trustees, including those Trustees who are not parties to the Management Agreement or “interested persons” (as defined in the Investment Company Act of 1940, as amended) of any party thereto (the “Independent Trustees”), at a meeting held on June 15-16, 2016 (the “Annual Meeting”).
The review process undertaken by the Trustees spans the course of the year and culminates with the Annual Meeting. To assist the Trustees in their deliberations, the Trustees have established a Contract Review Committee (the “Committee”), comprised of the Independent Trustees. The Committee held three meetings over the course of the year since the Management Agreement was last approved. At those Committee meetings, regularly scheduled Board or other committee meetings, and/or the Annual Meeting, matters relevant to the renewal of the Management Agreement were considered by the Board, or the Independent Trustees, as applicable. With respect to each Fund, such matters included:
| (a) | the nature and quality of the advisory, administrative, and other services provided to the Fund by the Investment Adviser and its affiliates, including information about: |
| (i) | the structure, staff, and capabilities of the Investment Adviser and its portfolio management teams; |
| (ii) | the groups within the Investment Adviser and its affiliates that support the portfolio management teams or provide other types of necessary services, including fund services groups (e.g., accounting and financial reporting, tax, shareholder services, and operations); controls and risk management groups (e.g., legal, compliance, valuation oversight, credit risk management, internal audit, compliance testing, market risk analysis, finance, and central funding); sales and distribution support groups, and others (e.g., information technology and training); |
| (iii) | trends in employee headcount; |
| (iv) | the Investment Adviser’s financial resources and ability to hire and retain talented personnel and strengthen its operations; and |
| (v) | the parent company’s support of the Investment Adviser and its mutual fund business, as expressed by the firm’s senior management; |
| (b) | information on the investment performance of the Fund, including comparisons to the performance of similar mutual funds, as provided by a third-party mutual fund data provider engaged as part of the contract review process (the “Outside Data Provider”), a benchmark performance index, and a composite of accounts with comparable investment strategies managed by the Investment Adviser (in the case of the Concentrated Growth, Growth Opportunities, Small/Mid Cap Growth, and Strategic Growth Funds); and general investment outlooks in the markets in which the Fund invests; |
| (c) | information provided by the Investment Adviser indicating the Investment Adviser’s views on whether the Fund’s peer group and/or benchmark index had high, medium, or low relevance given the Fund’s particular investment strategy; |
| (d) | the terms of the Management Agreement and other agreements with affiliated service providers entered into by the Trust on behalf of the Fund; |
| (e) | fee and expense information for the Fund, including: |
| (i) | the relative management fee and expense level of the Fund as compared to those of comparable funds managed by other advisers, as provided by the Outside Data Provider; |
| (ii) | the Fund’s expense trends over time; and |
| (iii) | to the extent the Investment Adviser manages other types of accounts (such as bank collective trusts, private wealth management accounts, institutional separate accounts, sub-advised mutual funds, and non-U.S. funds) having investment objectives and policies similar to those of the Fund, comparative information on the advisory fees charged and services provided to those accounts by the Investment Adviser; |
| (f) | with respect to the extensive investment performance and expense comparison data provided by the Outside Data Provider, its processes in producing that data for the Fund; |
| (g) | the undertakings of the Investment Adviser and its affiliates to implement fee waivers and/or expense limitations; |
137
GOLDMAN SACHS FUNDAMENTAL EQUITY GROWTH FUNDS
Statement Regarding Basis for Approval of Management Agreement (Unaudited) (continued)
| (h) | information relating to the profitability of the Management Agreement and the transfer agency and distribution and service arrangements of the Fund and the Trust as a whole to the Investment Adviser and its affiliates; |
| (i) | whether the Fund’s existing management fee schedule adequately addressed any economies of scale; |
| (j) | a summary of the “fall-out” benefits derived by the Investment Adviser and its affiliates from their relationships with the Fund, including the fees received by the Investment Adviser’s affiliates from the Fund for transfer agency, portfolio trading, distribution and other services; |
| (k) | a summary of potential benefits derived by the Fund as a result of its relationship with the Investment Adviser; |
| (l) | information regarding commissions paid by the Fund and broker oversight, an update on the Investment Adviser’s soft dollars practices, other information regarding portfolio trading, and how the Investment Adviser carries out its duty to seek best execution; |
| (m) | portfolio manager ownership of Fund shares; the manner in which portfolio manager compensation is determined; and the number and types of accounts managed by the portfolio managers; |
| (n) | the nature and quality of the services provided to the Fund by its unaffiliated service providers, and the Investment Adviser’s general oversight and evaluation (including reports on due diligence) of those service providers as part of the administration services provided under the Management Agreement; and |
| (o) | the Investment Adviser’s processes and policies addressing various types of potential conflicts of interest; its approach to risk management; the annual review of the effectiveness of the Fund’s compliance program; and periodic compliance reports. |
The Trustees also received an overview of the Funds’ distribution arrangements. They received information regarding the Funds’ assets, share purchase and redemption activity, and payment of distribution, service, and shareholder administration fees, as applicable. Information was also provided to the Trustees relating to revenue sharing payments made by and services provided by the Investment Adviser and its affiliates to intermediaries that promote the sale, distribution, and/or servicing of Fund shares. The Independent Trustees also discussed the broad range of other investment choices that are available to Fund investors, including the availability of comparable funds managed by other advisers.
The presentations made at the Board and Committee meetings and at the Annual Meeting encompassed the Funds and other mutual funds for which the Board of Trustees has responsibility. In evaluating the Management Agreement at the Annual Meeting, the Trustees relied upon their knowledge, resulting from their meetings and other interactions throughout the year, of the Investment Adviser and its affiliates, their services, and the Funds. In conjunction with these meetings, the Trustees received written materials and oral presentations on the topics covered, and the Investment Adviser addressed the questions and concerns of the Trustees, including concerns regarding the investment performance of certain of the funds they oversee. The Independent Trustees were advised by their independent legal counsel regarding their responsibilities and other regulatory requirements related to the approval and continuation of mutual fund investment management agreements under applicable law. In addition, the Investment Adviser and its affiliates provided the Independent Trustees with a written response to a formal request for information sent on behalf of the Independent Trustees by their independent legal counsel. During the course of their deliberations, the Independent Trustees met in executive sessions with their independent legal counsel, without representatives of the Investment Adviser or its affiliates present.
Nature, Extent, and Quality of the Services Provided Under the Management Agreement
As part of their review, the Trustees considered the nature, extent, and quality of the services provided to the Funds by the Investment Adviser. In this regard, the Trustees considered both the investment advisory services and non-advisory services that are provided by the Investment Adviser and its affiliates. The Trustees noted the transition in the leadership and changes in personnel of various of the Investment Adviser’s portfolio management teams that had occurred in recent periods, and the ongoing recruitment efforts aimed at bringing high quality investment talent to the Investment Adviser. They also noted the Investment Adviser’s commitment to maintaining high quality systems and expending substantial resources to respond to ongoing changes to the regulatory and control environment in which the Funds and their service providers operate, as well as the efforts of the Investment Adviser and its affiliates to combat cyber security risks. The Trustees concluded that the Investment Adviser continued to commit substantial financial and operational resources to the Funds and expressed confidence that the Investment Adviser would continue to do so in the future. The Trustees also recognized that the Investment Adviser had made significant commitments to address regulatory compliance requirements applicable to the Funds and the Investment Adviser and its affiliates.
Investment Performance
The Trustees also considered the investment performance of the Funds. In this regard, they compared the investment performance of each Fund to its peers using rankings and ratings compiled by the Outside Data Provider as of December 31, 2015,
138
GOLDMAN SACHS FUNDAMENTAL EQUITY GROWTH FUNDS
Statement Regarding Basis for Approval of Management Agreement (Unaudited) (continued)
and updated performance information prepared by the Investment Adviser using the peer group identified by the Outside Data Provider as of March 31, 2016. The information on each Fund’s investment performance was provided for the one-, three-, five-, and ten-year periods ending on the applicable dates, to the extent that each Fund had been in existence for those periods. The Trustees also reviewed each Fund’s investment performance relative to its performance benchmark. As part of this review, they considered the investment performance trends of the Funds over time, and reviewed the investment performance of each Fund in light of its investment objective and policies and market conditions. The Trustees also received information comparing the Concentrated Growth, Dynamic U.S. Equity, Focused Growth, Growth Opportunities, Small/Mid Cap Growth, Strategic Growth, and Technology Opportunities Funds’ performance to that of composites of accounts with comparable investment strategies managed by the Investment Adviser.
In addition, the Trustees considered materials prepared and presentations made by the Investment Adviser’s senior management and portfolio management personnel in which Fund performance was assessed. The Trustees also considered the Investment Adviser’s periodic reports with respect to the Funds’ risk profiles, and how the Investment Adviser’s approach to risk monitoring and management influences portfolio management.
The Trustees noted that the Capital Growth Fund’s Institutional Shares had placed in the top half of the Fund’s peer group and had underperformed the Fund’s benchmark index for the one-, three-, five-, and ten-year periods ended March 31, 2016. They observed that the Concentrated Growth Fund’s Institutional Shares had placed in the top half of the Fund’s peer group for the five-year period and in the third quartile for the one-, three-, and ten-year periods and had underperformed the Fund’s benchmark index for the one-, three-, five-, and ten-year periods ended March 31, 2016. They observed that the Dynamic U.S. Equity Fund’s Institutional Shares had placed in the third quartile of the Fund’s peer group for the five-year period and in the fourth quartile for the one-and three-year periods and had underperformed the Fund’s benchmark index for the one-, three-, and five-year periods ended March 31, 2016. The Trustees noted that the Flexible Cap Growth Fund’s Institutional Shares had placed in the second quartile of the Fund’s peer group for the three- and five-year periods and in the third quartile for the one-year period and had underperformed the Fund’s benchmark index for the one-, three-, and five-year periods ended March 31, 2016. They observed that the Focused Growth Fund’s Institutional Shares had placed in the top half of the Fund’s peer group for the one-year period and in the third quartile for the three-year period and had underperformed the Fund’s benchmark index for the one- and three-year periods ended March 31, 2016. They noted that the Growth Opportunities Fund’s Institutional Shares had placed in the top half of the Fund’s peer group for the five- and ten-year periods and in the third quartile for the one- and three- year periods and had outperformed the Fund’s benchmark index for the ten-year period and underperformed for the one-, three-, and five-year periods ended March 31, 2016. The Trustees observed that the Small/Mid Cap Growth Fund’s Institutional Shares had placed in the top half of the Fund’s peer group for the three-, five-, and ten-year periods and placed in the third quartile for the one-year period and had outperformed the Fund’s benchmark index for the five- and ten-year periods performed in-line with the Fund’s benchmark for the one-year period, and underperformed the Fund’s benchmark for the three-year period ended March 31, 2016. They observed that the Strategic Growth Fund’s Institutional Shares had placed in the top half of the Fund’s peer group and had underperformed the Fund’s benchmark index for the one-, three-, five, and ten-year periods ended March 31, 2016. The Trustees noted that the Technology Opportunities Fund’s Institutional Shares had placed in the top half of the Fund’s peer group for the ten-year period and in the third quartile for the one-, three-, and five-year periods and had underperformed the Fund’s benchmark index for the one-, three-, five-, and ten-year periods ended March 31, 2016.
Costs of Services Provided and Competitive Information
The Trustees considered the contractual terms of the Management Agreement and the fee rates payable by each Fund thereunder. In this regard, the Trustees considered information on the services rendered by the Investment Adviser to the Funds, which included both advisory and administrative services that were directed to the needs and operations of the Funds as registered mutual funds.
In particular, the Trustees reviewed analyses prepared by the Outside Data Provider regarding the expense rankings of the Funds. The analyses provided a comparison of each Fund’s management fee and breakpoints to those of a relevant peer group and category universe; an expense analysis which compared each Fund’s overall net and gross expenses to a peer group and a category universe; and data comparing each Fund’s net expenses to the peer and category medians. The analyses also compared each Fund’s transfer agency, custody, and distribution fees, other expenses and fee waivers/reimbursements to those of the peer group and category medians. The Trustees concluded that the comparisons provided by the Outside Data Provider were useful in evaluating the reasonableness of the management fees and total expenses paid by the Funds.
In addition, the Trustees considered the Investment Adviser’s undertakings to implement fee waivers and/or expense limitations. The Trustees also noted that certain changes were being made to existing fee waiver or expense limitation arrangements of the Concentrated Growth, Dynamic U.S. Equity, Flexible Cap Growth, and Technology Opportunities Funds that
139
GOLDMAN SACHS FUNDAMENTAL EQUITY GROWTH FUNDS
Statement Regarding Basis for Approval of Management Agreement (Unaudited) (continued)
would have the effect of decreasing total Fund expenses, with such changes taking effect in connection with the Funds’ next annual registration statement update. They also considered, to the extent that the Investment Adviser manages other types of accounts having investment objectives and policies similar to those of the Funds, comparative fee information for services provided by the Investment Adviser to those accounts, and information that indicated that services provided to the Funds differed in various significant respects from the services provided to other types of accounts which, in many cases, operated under less stringent legal and regulatory structures, required fewer services from the Investment Adviser to a smaller number of client contact points, and were less time-intensive.
In addition, the Trustees noted that shareholders are able to redeem their Fund shares at any time if shareholders believe that the Fund fees and expenses are too high or if they are dissatisfied with the performance of the Fund.
Profitability
The Trustees reviewed the Investment Adviser’s revenues and pre-tax profit margins with respect to the Trust and each of the Funds. In this regard the Trustees noted that they had received, among other things, profitability analyses and summaries, revenue and expense schedules by Fund and by function (i.e., investment management, transfer agency and distribution and service), and information on the Investment Adviser’s expense allocation methodology. They observed that the profitability and expense figures are substantially similar to those used by the Investment Adviser for many internal purposes, including compensation decisions among various business groups, and are thus subject to a vigorous internal debate about how certain revenue and expenses should be allocated. The Trustees also noted that the internal audit group within the Goldman Sachs organization had audited the expense allocation methodology and was satisfied with the reasonableness, consistency, and accuracy of the Investment Adviser’s expense allocation methodology and profitability analysis calculations. Profitability data for the Trust and each Fund were provided for 2015 and 2014, and the Trustees considered this information in relation to the Investment Adviser’s overall profitability. The Trustees considered the Investment Adviser’s revenues and pre-tax profit margins both in absolute terms and in comparison to information on the reported pre-tax profit margins earned by certain other asset management firms.
Economies of Scale
The Trustees considered the information that had been provided regarding the Investment Adviser’s profitability. The Trustees also considered the breakpoints in the fee rate payable under the Management Agreement for each of the Funds at the following annual percentage rates of the average daily net assets of the Funds:
| Average Daily Net Assets | Capital Fund | Concentrated Fund | Dynamic U.S. Fund | Flexible Cap Fund | Focused Fund | |||||||||||||||
| First $1 billion | 1.00 | % | 1.00 | % | 0.70 | % | 1.00 | % | 1.00 | % | ||||||||||
| Next $1 billion | 0.90 | 0.90 | 0.63 | 0.90 | 0.90 | |||||||||||||||
| Next $3 billion | 0.80 | 0.86 | 0.60 | 0.86 | 0.86 | |||||||||||||||
| Next $3 billion | 0.80 | 0.84 | 0.59 | 0.84 | 0.84 | |||||||||||||||
| Over $8 billion | 0.80 | 0.82 | 0.58 | 0.82 | 0.82 | |||||||||||||||
| Average Daily Net Assets | Growth Opportunities Fund | Small/Mid Cap Fund | Strategic Growth Fund | Technology Opportunities Fund | ||||||||||||
| First $1 billion | 1.00 | % | 1.00 | % | 1.00 | % | 1.00 | % | ||||||||
| Next $1 billion | 1.00 | 1.00 | 0.90 | 0.90 | ||||||||||||
| Next $3 billion | 0.90 | 0.90 | 0.86 | 0.86 | ||||||||||||
| Next $3 billion | 0.86 | 0.86 | 0.84 | 0.84 | ||||||||||||
| Over $8 billion | 0.84 | 0.84 | 0.82 | 0.82 | ||||||||||||
The Trustees noted that the breakpoints were designed to share potential economies of scale, if any, with the Funds and their shareholders as assets under management reach those asset levels. The Trustees considered the amounts of assets in the Funds; the Funds’ recent share purchase and redemption activity; the information provided by the Investment Adviser relating to the costs of the services provided by the Investment Adviser and its affiliates and their realized profits; information comparing fee rates charged by the Investment Adviser with fee rates charged to other funds in the peer groups; and the Investment Adviser’s undertaking to waive a portion of its management fee (with respect to the Capital Growth, Concentrated Growth, Flexible Cap Growth, Focused Growth, Growth Opportunities, Small/Mid Cap Growth, and Strategic Growth Funds) and to limit certain expenses of the Funds that exceed specified levels. Upon reviewing these matters at the Annual Meeting, the Trustees concluded
140
GOLDMAN SACHS FUNDAMENTAL EQUITY GROWTH FUNDS
Statement Regarding Basis for Approval of Management Agreement (Unaudited) (continued)
that the fee breakpoints represented a means of assuring that benefits of scalability, if any, would be passed along to shareholders at the specified asset levels. They also noted that the Investment Adviser had passed along savings to shareholders of the Growth Opportunities and Small/Mid Cap Growth Funds, which had asset levels above at least the first breakpoint during the prior fiscal year.
Other Benefits to the Investment Adviser and Its Affiliates
The Trustees also considered the other benefits derived by the Investment Adviser and its affiliates from their relationships with the Funds as stated above, including: (a) transfer agency fees received by Goldman, Sachs & Co. (“Goldman Sachs”); (b) brokerage and futures commissions earned by Goldman Sachs for executing securities and futures transactions on behalf of the Funds; (c) research received by the Investment Adviser from broker-dealers in exchange for executing certain transactions on behalf of the Funds; (d) trading efficiencies resulting from aggregation of orders of the Funds with those for other funds or accounts managed by the Investment Adviser; (e) the Investment Adviser’s ability to leverage the infrastructure designed to service the Funds on behalf of its other clients; (f) the Investment Adviser’s ability to cross-market other products and services to Fund shareholders; (g) Goldman Sachs’ retention of certain fees as Fund Distributor; (h) the Investment Adviser’s ability to negotiate better pricing with custodians on behalf of its other clients, as a result of the relationship with the Funds; and (i) the possibility that the working relationship between the Investment Adviser and the Funds’ third-party service providers may cause those service providers to be more likely to do business with other areas of Goldman Sachs. In the course of considering the foregoing, the Independent Trustees requested and received further information quantifying certain of these fall-out benefits.
Other Benefits to the Funds and Their Shareholders
The Trustees also noted that the Funds receive certain potential benefits as a result of their relationship with the Investment Adviser, including: (a) trading efficiencies resulting from aggregation of orders of the Funds with those of other funds or accounts managed by the Investment Adviser; (b) enhanced servicing from vendors because of the volume of business generated by the Investment Adviser and its affiliates; (c) enhanced servicing from broker-dealers because of the volume of business generated by the Investment Adviser and its affiliates; (d) the Investment Adviser’s knowledge and experience gained from managing other accounts and products; (e) the Investment Adviser’s ability to hire and retain qualified personnel to provide services to the Funds because of the reputation of the Goldman Sachs organization; (f) the Funds’ access, through the Investment Adviser, to certain firmwide resources (e.g., proprietary risk management systems and databases), subject to certain restrictions; and (g) the Funds’ access to certain affiliated distribution channels. In addition, the Trustees noted the competitive nature of the mutual fund marketplace, and considered that many of the Funds’ shareholders invested in the Funds in part because of the Funds’ relationship with the Investment Adviser and that those shareholders have a general expectation that the relationship will continue.
Conclusion
In connection with their consideration of the Management Agreement, the Trustees gave weight to each of the factors described above, but did not identify any particular factor as controlling their decision. After deliberation and consideration of all of the information provided, including the factors described above, the Trustees concluded, in the exercise of their business judgment, that the management fees paid by each of the Funds were reasonable in light of the services provided to it by the Investment Adviser, the Investment Adviser’s costs and each Fund’s current and reasonably foreseeable asset levels. The Trustees unanimously concluded that the Investment Adviser’s continued management likely would benefit each Fund and its shareholders and that the Management Agreement should be approved and continued with respect to each Fund until June 30, 2017.
141
GOLDMAN SACHS FUNDAMENTAL EQUITY GROWTH FUNDS
Trustees and Officers (Unaudited)
Independent Trustees
Name, | Position(s) Held with the Trust | Term of Office and | Principal Occupation(s) During Past 5 Years | Number of Portfolios in Fund Complex Overseen by Trustee3 | Other Directorships Held by Trustee4 | |||||
Ashok N. Bakhru Age: 74 | Chairman of the Board of Trustees | Since 1996 (Trustee since 1991) | Mr. Bakhru is retired. He was formerly Director, Apollo Investment Corporation (a business development company) (2008-2013); President, ABN Associates (a management and financial consulting firm) (1994-1996 and 1998-2012); Trustee, Scholarship America (1998-2005); Trustee, Institute for Higher Education Policy (2003-2008); Director, Private Equity Investors — III and IV (1998-2007), and Equity-Linked Investors II (April 2002-2007).
Chairman of the Board of Trustees — Goldman Sachs Trust; Goldman Sachs Variable Insurance Trust; Goldman Sachs Trust II; Goldman Sachs BDC, Inc.; Goldman Sachs Private Middle Market Credit LLC; Goldman Sachs MLP Income Opportunities Fund; Goldman Sachs MLP and Energy Renaissance Fund; and Goldman Sachs ETF Trust. | 141 | None | |||||
Kathryn A. Cassidy Age: 62 | Trustee | Since 2015 | Ms. Cassidy is retired. Formerly, she was Advisor to the Chairman (May 2014-December 2014); and Senior Vice President and Treasurer (2008-2014), General Electric Company & General Electric Capital Corporation (technology and financial services companies).
Trustee — Goldman Sachs Trust and Goldman Sachs Variable Insurance Trust. | 106 | None | |||||
Diana M. Daniels Age: 67 | Trustee | Since 2007 | Ms. Daniels is retired. Formerly, she was Vice President, General Counsel and Secretary, The Washington Post Company (1991-2006). Ms. Daniels is a Trustee Emeritus and serves as a Presidential Councillor of Cornell University (2013-Present); former Member of the Legal Advisory Board, New York Stock Exchange (2003-2006) and of the Corporate Advisory Board, Standish Mellon Management Advisors (2006-2007).
Trustee — Goldman Sachs Trust and Goldman Sachs Variable Insurance Trust. | 106 | None | |||||
Herbert J. Markley Age: 66 | Trustee | Since 2013 | Mr. Markley is retired. Formerly, he was Executive Vice President, Deere & Company (an agricultural and construction equipment manufacturer) (2007-2009); and President, Agricultural Division, Deere & Company (2001-2007). Previously, Mr. Markley served as an Advisory Board Member of Goldman Sachs Trust and Goldman Sachs Variable Insurance Trust (June 2013-October 2013).
Trustee — Goldman Sachs Trust and Goldman Sachs Variable Insurance Trust. | 106 | None | |||||
Jessica Palmer Age: 67 | Trustee | Since 2007 | Ms. Palmer is retired. She is Director, Emerson Center for the Arts and Culture (2011-Present); and was formerly a Consultant, Citigroup Human Resources Department (2007-2008); Managing Director, Citigroup Corporate and Investment Banking (previously, Salomon Smith Barney/Salomon Brothers) (1984-2006). Ms. Palmer was a Member of the Board of Trustees of Indian Mountain School (private elementary and secondary school) (2004-2009).
Trustee — Goldman Sachs Trust and Goldman Sachs Variable Insurance Trust. | 106 | None | |||||
142
GOLDMAN SACHS FUNDAMENTAL EQUITY GROWTH FUNDS
Trustees and Officers (Unaudited) (continued)
Independent Trustees
Name, | Position(s) Held with the Trust | Term of Office and | Principal Occupation(s) During Past 5 Years | Number of Portfolios in Fund Complex Overseen by Trustee3 | Other Directorships Held by Trustee4 | |||||
Roy W. Templin Age: 56 | Trustee | Since 2013 | Mr. Templin is retired. He recently served as Chairman of the Board of Directors, Con-Way Incorporated (a transportation, logistics and supply chain management service company) (2014-2015); and was formerly Executive Vice President and Chief Financial Officer, Whirlpool Corporation (an appliance manufacturer and marketer) (2004-2012). Previously, Mr. Templin served as an Advisory Board Member of Goldman Sachs Trust and Goldman Sachs Variable Insurance Trust (June 2013-October 2013).
Trustee — Goldman Sachs Trust and Goldman Sachs Variable Insurance Trust. | 106 | None | |||||
Gregory G. Weaver Age: 64 | Trustee | Since 2015 | Mr. Weaver is retired. He is Director, Verizon Communications Inc. (2015-Present); and was formerly Chairman and Chief Executive Officer, Deloitte & Touche LLP (a professional services firm) (2001-2005 and 2012-2014); and Member of the Board of Directors, Deloitte & Touche LLP (2006-2012).
Trustee — Goldman Sachs Trust and Goldman Sachs Variable Insurance Trust. | 106 | Verizon Communications Inc. |
143
GOLDMAN SACHS FUNDAMENTAL EQUITY GROWTH FUNDS
Trustees and Officers (Unaudited) (continued)
Interested Trustees*
James A. McNamara Age: 53 | President and Trustee | Since 2007 | Managing Director, Goldman Sachs (December 1998-Present); Director of Institutional Fund Sales, GSAM (April 1998-December 2000); and Senior Vice President and Manager, Dreyfus Institutional Service Corporation (January 1993- April 1998).
President and Trustee — Goldman Sachs Trust; Goldman Sachs Variable Insurance Trust; Goldman Sachs Trust II; Goldman Sachs MLP Income Opportunities Fund; Goldman Sachs MLP and Energy Renaissance Fund; and Goldman Sachs ETF Trust. | 139 | None | |||||
Alan A. Shuch Age: 66 | Trustee | Since 1990 | Advisory Director — GSAM (May 1999-Present); Consultant to GSAM (December 1994-May 1999); and Limited Partner, Goldman Sachs (December 1994-May 1999).
Trustee — Goldman Sachs Trust and Goldman Sachs Variable Insurance Trust. | 106 | None | |||||
| * | These persons are considered to be “Interested Trustees” because they hold positions with Goldman Sachs and own securities issued by The Goldman Sachs Group, Inc. Each Interested Trustee holds comparable positions with certain other companies of which Goldman Sachs, GSAM or an affiliate thereof is the investment adviser, administrator and/or distributor. |
| 1 | Each Trustee may be contacted by writing to the Trustee, c/o Goldman Sachs, 200 West Street, New York, New York, 10282, Attn: Caroline Kraus. Information is provided as of August 31, 2016. |
| 2 | Each Trustee holds office for an indefinite term until the earliest of: (a) the election of his or her successor; (b) the date the Trustee resigns or is removed by the Board of Trustees or shareholders, in accordance with the Trust’s Declaration of Trust; (c) December 31st of the year in which the Trustee turns 74 years of age, subject to waiver by a majority of the Trustees (in accordance with the current resolutions of the Board of Trustees, which may be changed by the Trustees without shareholder vote); or (d) the termination of the Trust. |
| 3 | The Goldman Sachs Fund Complex includes certain other companies listed above for each respective Trustee. As of August 31, 2016, Goldman Sachs Trust consisted of 92 portfolios (91 of which offered shares to the public); Goldman Sachs Variable Insurance Trust consisted of 14 portfolios; Goldman Sachs Trust II consisted of 16 portfolios (15 of which offered shares to the public); Goldman Sachs BDC, Inc., Goldman Sachs Private Middle Market Credit LLC, Goldman Sachs MLP Income Opportunities Fund, and Goldman Sachs MLP and Energy Renaissance Fund each consisted of one portfolio; and Goldman Sachs ETF Trust consisted of 15 portfolios (seven of which offered shares to the public). Goldman Sachs Private Middle Market Credit LLC does not offer shares to the public. |
| 4 | This column includes only directorships of companies required to report to the Securities and Exchange Commission under the Securities Exchange Act of 1934 (i.e., “public companies”) or other investment companies registered under the Act. |
Additional information about the Trustees is available in the Funds’ Statement of Additional Information, which can be obtained from Goldman Sachs free of charge by calling this toll-free number (in the United States of America): 1-800-526-7384.
144
GOLDMAN SACHS FUNDAMENTAL EQUITY GROWTH FUNDS
Trustees and Officers (Unaudited) (continued)
Officers of the Trust*
Name, Address and Age1 | Position(s) Held with the Trust | Term of Office and | Principal Occupation(s) During Past 5 Years | |||
James A. McNamara 200 West Street New York, NY 10282 Age: 53 | Trustee and President | Since 2007 | Managing Director, Goldman Sachs (December 1998-Present); Director of Institutional Fund Sales, GSAM (April 1998-December 2000); and Senior Vice President and Manager, Dreyfus Institutional Service Corporation (January 1993-April 1998).
President and Trustee — Goldman Sachs Trust; Goldman Sachs Variable Insurance Trust; Goldman Sachs Trust II; Goldman Sachs MLP Income Opportunities Fund; Goldman Sachs MLP and Energy Renaissance Fund; and Goldman Sachs ETF Trust. | |||
Caroline L. Kraus 200 West Street New York, NY 10282 Age: 39 | Secretary | Since 2012 | Managing Director, Goldman Sachs (January 2016-Present); Vice President, Goldman Sachs (August 2006-December 2015); Associate General Counsel, Goldman Sachs (2012-Present); Assistant General Counsel, Goldman Sachs (August 2006-December 2011); and Associate, Weil, Gotshal & Manges, LLP (2002-2006).
Secretary — Goldman Sachs Trust (previously Assistant Secretary (2012)); Goldman Sachs Variable Insurance Trust (previously Assistant Secretary (2012)); Goldman Sachs Trust II; Goldman Sachs BDC, Inc.; Goldman Sachs Private Middle Market Credit LLC; Goldman Sachs Middle Market Lending LLC; Goldman Sachs MLP Income Opportunities Fund; Goldman Sachs MLP and Energy Renaissance Fund; and Goldman Sachs ETF Trust. | |||
Scott M. McHugh 200 West Street New York, NY 10282 Age: 44 | Treasurer, Senior Vice President and Principal Financial Officer | Since 2009 (Principal Financial Officer since 2013) | Managing Director, Goldman Sachs (January 2016-Present); Vice President, Goldman Sachs (February 2007-December 2015); Assistant Treasurer of certain mutual funds administered by DWS Scudder (2005-2007); and Director (2005-2007), Vice President (2000-2005), and Assistant Vice President (1998-2000), Deutsche Asset Management or its predecessor (1998-2007).
Treasurer, Senior Vice President and Principal Financial Officer — Goldman Sachs Trust; Goldman Sachs Variable Insurance Trust; Goldman Sachs Trust II; Goldman Sachs MLP Income Opportunities Fund; Goldman Sachs MLP and Energy Renaissance Fund; and Goldman Sachs ETF Trust. | |||
| * | Represents a partial list of officers of the Trust. Additional information about all the officers is available in the Funds’ Statement of Additional Information, which can be obtained from Goldman Sachs free of charge by calling this toll-free number (in the United States): 1-800-526-7384. |
| 1 | Information is provided as of August 31, 2016. |
| 2 | Officers hold office at the pleasure of the Board of Trustees or until their successors are duly elected and qualified. Each officer holds comparable positions with certain other companies of which Goldman Sachs, GSAM or an affiliate thereof is the investment adviser, administrator and/or distributor. |
143
GOLDMAN SACHS FUNDAMENTAL EQUITY GROWTH FUNDS
Goldman Sachs Trust — Fundamental Equity Growth Funds — Tax Information (Unaudited)
For the year ended August 31, 2016, 100%, 50.13%, 66.78%, 64.13%, 53.45%, 100%, and 94.26% of the dividends paid from net investment company taxable income by the Capital Growth, Concentrated Growth, Dynamic U.S. Equity, Flexible Cap Growth, Focused Growth, Small/Mid Cap Growth, and Strategic Growth, respectively, qualify for the dividends received deduction available to corporations.
Pursuant to Section 852 of the Internal Revenue Code, the Capital Growth, Concentrated Growth, Dynamic U.S. Equity, Flexible Cap Growth, Focused Growth, Growth Opportunities, Small/Mid Cap Growth, Strategic Growth, and Technology Opportunities Funds, designate $71,058,636, $14,309,229, $1,140,691, $905,450, $1,266,538, $464,979,506, $84,777,269, $19,126,243, and $35,686,035, respectively, or if different, the maximum amount allowable, as capital gain dividends paid during the year ended August 31, 2016.
For the year ended August 31, 2016, 100%, 36.67%, 71.54%, 84.14%, 39.49%, 54.99%, and 76.76%, of the dividends paid from net investment company taxable income by the Capital Growth, Concentrated Growth, Dynamic U.S. Equity, Flexible Cap Growth, Focused Growth, Small/Mid Cap Growth, and Strategic Growth, respectively, qualify for the reduced tax rate under the Jobs and Growth Tax Relief and Reconciliation Act of 2003.
During the year ended August 31, 2016, the Capital Growth, Concentrated Growth, Dynamic U.S. Equity, Flexible Cap Growth, Focused Growth, Small/Mid Cap Growth, and Strategic Growth designate $4,486,691, $3,267,166, $206,734, $183,465, $512,515, $19,672,456, and $2,852,335, respectively, as short-term capital gain dividends pursuant to Section 871(k) of the Internal Revenue Code.
146
FUNDS PROFILE
Goldman Sachs Funds

Goldman Sachs is a premier financial services firm, known since 1869 for creating thoughtful and customized investment solutions in complex global markets.
Today, the Investment Management Division of Goldman Sachs serves a diverse set of clients worldwide, including private institutions, public entities and individuals. With approximately $1.12 trillion in assets under supervision as of June 30, 2016, Goldman Sachs Asset Management (“GSAM”) has portfolio management teams located around the world and our investment professionals bring firsthand knowledge of local markets to every investment decision. Assets under supervision includes assets under management and other client assets for which Goldman Sachs does not have full discretion. GSAM leverages the resources of Goldman, Sachs & Co. subject to legal, internal and regulatory restrictions.
Money Market1
Financial Square FundsSM
| ∎ | Financial Square Treasury Solutions Fund |
| ∎ | Financial Square Government Fund |
| ∎ | Financial Square Money Market Fund |
| ∎ | Financial Square Prime Obligations Fund |
| ∎ | Financial Square Treasury Instruments Fund |
| ∎ | Financial Square Treasury Obligations Fund |
| ∎ | Financial Square Federal Instruments Fund |
| ∎ | Financial Square Tax-Exempt Money MarketFund |
Investor FundsSM
| ∎ | Investor Money Market Fund |
| ∎ | Investor Tax-Exempt Money Market Fund2 |
Fixed Income
Short Duration and Government
| ∎ | Enhanced Income Fund |
| ∎ | High Quality Floating Rate Fund |
| ∎ | Short-Term Conservative Income Fund3 |
| ∎ | Short Duration Government Fund |
| ∎ | Short Duration Income Fund |
| ∎ | Government Income Fund |
| ∎ | Inflation Protected Securities Fund |
Multi-Sector
| ∎ | Bond Fund |
| ∎ | Core Fixed Income Fund |
| ∎ | Global Income Fund |
| ∎ | Strategic Income Fund |
Municipal and Tax-Free
| ∎ | High Yield Municipal Fund |
| ∎ | Dynamic Municipal Income Fund |
| ∎ | Short Duration Tax-Free Fund |
Single Sector
| ∎ | Investment Grade Credit Fund |
| ∎ | U.S. Mortgages Fund |
| ∎ | High Yield Fund |
| ∎ | High Yield Floating Rate Fund |
| ∎ | Emerging Markets Debt Fund |
| ∎ | Local Emerging Markets Debt Fund |
| ∎ | Dynamic Emerging Markets Debt Fund |
Fixed Income Alternatives
| ∎ | Long Short Credit Strategies Fund |
| ∎ | Fixed Income Macro Strategies Fund |
Fundamental Equity
| ∎ | Growth and Income Fund |
| ∎ | Small Cap Value Fund |
| ∎ | Small/Mid Cap Value Fund |
| ∎ | Mid Cap Value Fund |
| ∎ | Large Cap Value Fund |
| ∎ | Focused Value Fund |
| ∎ | Capital Growth Fund |
| ∎ | Strategic Growth Fund |
| ∎ | Focused Growth Fund |
| ∎ | Small/Mid Cap Growth Fund |
| ∎ | Flexible Cap Growth Fund |
| ∎ | Concentrated Growth Fund |
| ∎ | Technology Opportunities Fund |
| ∎ | Growth Opportunities Fund |
| ∎ | Rising Dividend Growth Fund |
| ∎ | Dynamic U.S. Equity Fund |
| ∎ | Income Builder Fund |
Tax-Advantaged Equity
| ∎ | U.S. Tax-Managed Equity Fund |
| ∎ | International Tax-Managed Equity Fund |
| ∎ | U.S. Equity Dividend and Premium Fund |
| ∎ | International Equity Dividend and Premium Fund |
Equity Insights
| ∎ | Small Cap Equity Insights Fund |
| ∎ | U.S. Equity Insights Fund |
| ∎ | Small Cap Growth Insights Fund |
| ∎ | Large Cap Growth Insights Fund |
| ∎ | Large Cap Value Insights Fund |
| ∎ | Small Cap Value Insights Fund |
| ∎ | International Small Cap Insights Fund4 |
| ∎ | International Equity Insights Fund |
| ∎ | Emerging Markets Equity Insights Fund |
Fundamental Equity International
| ∎ | Strategic International Equity Fund |
| ∎ | Focused International Equity Fund |
| ∎ | Asia Equity Fund |
| ∎ | Emerging Markets Equity Fund |
| ∎ | N-11 Equity Fund |
Select Satellite
| ∎ | Real Estate Securities Fund |
| ∎ | International Real Estate Securities Fund |
| ∎ | Commodity Strategy Fund |
| ∎ | Global Real Estate Securities Fund |
| ∎ | Dynamic Commodity Strategy Fund |
| ∎ | Dynamic Allocation Fund |
| ∎ | Absolute Return Tracker Fund |
| ∎ | Long Short Fund |
| ∎ | Managed Futures Strategy Fund |
| ∎ | MLP Energy Infrastructure Fund |
| ∎ | Multi-Manager Alternatives Fund |
| ∎ | Multi-Asset Real Return Fund |
| ∎ | Absolute Return Multi-Asset Fund |
| ∎ | Global Infrastructure Fund |
Total Portfolio Solutions
| ∎ | Global Managed Beta Fund |
| ∎ | Multi-Manager Non-Core Fixed Income Fund |
| ∎ | Multi-Manager U.S. Dynamic Equity Fund |
| ∎ | Multi-Manager Global Equity Fund |
| ∎ | Multi-Manager International Equity Fund |
| ∎ | Tactical Tilt Overlay Fund5 |
| ∎ | Balanced Strategy Portfolio |
| ∎ | Multi-Manager U.S. Small Cap Equity Fund |
| ∎ | Multi-Manager Real Assets Strategy Fund |
| ∎ | Growth and Income Strategy Portfolio |
| ∎ | Growth Strategy Portfolio |
| ∎ | Equity Growth Strategy Portfolio |
| ∎ | Satellite Strategies Portfolio |
| ∎ | Enhanced Dividend Global Equity Portfolio |
| ∎ | Tax-Advantaged Global Equity Portfolio |
| ∎ | Strategic Factor Allocation Fund |
| ∎ | Target Date 2020 Portfolio |
| ∎ | Target Date 2025 Portfolio |
| ∎ | Target Date 2030 Portfolio |
| ∎ | Target Date 2035 Portfolio |
| ∎ | Target Date 2040 Portfolio |
| ∎ | Target Date 2045 Portfolio |
| ∎ | Target Date 2050 Portfolio |
| ∎ | Target Date 2055 Portfolio |
| 1 | You could lose money by investing in a money market fund. Because the share price of certain money market funds will fluctuate, when you sell your shares they may be worth more or less than what you originally paid for them. Although certain money market funds seek to preserve the value of your investment at $1.00 per share, they cannot guarantee they will do so. Certain money market funds may impose a fee upon the sale of your shares or may temporarily suspend your ability to sell shares if the fund’s liquidity falls below required minimums because of market conditions or other factors. An investment in a money market fund is not a bank deposit and is not insured or guaranteed by the Federal Deposit Insurance Corporation or any other government agency. The money market funds’ sponsor has no legal obligation to provide financial support to the fund, and you should not expect that the sponsor will provide financial support to the fund at any time. |
| 2 | Effective on March 31, 2016, the Goldman Sachs Financial Square Tax-Free Money Market Fund was renamed the Goldman Sachs Investor Tax-Exempt Money Market Fund. |
| 3 | Effective on July 29, 2016, the Goldman Sachs Limited Maturity Obligations Fund was renamed the Goldman Sachs Short-Term Conservative Income Fund. |
| 4 | Effective at the close of business on February 5, 2016, the Goldman Sachs International Small Cap Fund was reorganized with and into the Goldman Sachs International Small Cap Insights Fund. |
| 5 | Effective on June 1, 2016, the Goldman Sachs Tactical Tilt Implementation Fund was renamed the Goldman Sachs Tactical Tilt Overlay Fund. Financial Square FundsSM and Investor FundsSM are registered service marks of Goldman, Sachs & Co. |
*This list covers open-end funds only. Please visit our website at www.GSAMFUNDS.com to learn about our closed-end funds and exchange-traded funds.
TRUSTEES Ashok N. Bakhru, Chairman Kathryn A. Cassidy Diana M. Daniels Herbert J. Markley James A. McNamara Jessica Palmer Alan A. Shuch Roy W. Templin Gregory G. Weaver | OFFICERS James A. McNamara, President Scott M. McHugh, Principal Financial Officer, Senior Vice President and Treasurer Caroline L. Kraus, Secretary | |
GOLDMAN, SACHS & CO. Distributor and Transfer Agent | GOLDMAN SACHS ASSET MANAGEMENT, L.P. Investment Adviser | |
Visit our web site at www.GSAMFUNDS.com to obtain the most recent month-end returns.
Goldman Sachs Asset Management, L.P. 200 West Street, New York, New York 10282
The reports concerning the Funds included in this shareholder report may contain certain forward-looking statements about the factors that may affect the performance of the Funds in the future. These statements are based on Fund management’s predictions and expectations concerning certain future events and their expected impact on the Funds, such as performance of the economy as a whole and of specific industry sectors, changes in the levels of interest rates, the impact of developing world events, and other factors that may influence the future performance of the Funds. Management believes these forward-looking statements to be reasonable, although they are inherently uncertain and difficult to predict. Actual events may cause adjustments in portfolio management strategies from those currently expected to be employed.
A description of the policies and procedures that the Funds use to determine how to vote proxies relating to portfolio securities and information regarding how a Fund voted proxies relating to portfolio securities during the most recent 12-month period ended June 30 is available (i) without charge, upon request by calling 1-800-526-7384 (for Retail Shareholders) or 1-800-621-2550 (for Institutional Shareholders); and (ii) on the Securities and Exchange Commission (“SEC”) web site at http://www.sec.gov.
The Funds file their complete schedule of portfolio holdings with the SEC for the first and third quarters of each fiscal year on Form N-Q. The Funds’ Forms N-Q are available on the SEC’s web site at http://www.sec.gov within 60 days after the Funds’ first and third fiscal quarters. The Funds’ Forms N-Q may be reviewed and copied at the SEC’s Public Reference Room in Washington, D.C., and information on the operation of the Public Reference Room may also be obtained by calling 1-800-SEC-0330. Forms N-Q may be obtained upon request and without charge by calling 1-800-526-7384 (for Retail Shareholders) or 1-800-621-2550 (for Institutional Shareholders).
Goldman, Sachs & Co. (‘‘Goldman Sachs’’) does not provide legal, tax or accounting advice. Any statement contained in this communication (including any attachments) concerning U.S. tax matters was not intended or written to be used, and cannot be used, for the purpose of avoiding penalties under the Internal Revenue Code, and was written to support the promotion or marketing of the transaction(s) or matter(s) addressed. Clients of Goldman Sachs should obtain their own independent tax advice based on their particular circumstances.
Fund holdings and allocations shown are as of August 31, 2016 and may not be representative of future investments. Fund holdings should not be relied on in making investment decisions and should not be construed as research or investment advice regarding particular securities. Current and future holdings are subject to risk.
The Global Industry Classification Standard (GICS) was developed by and is the exclusive property and a service mark of Morgan Stanley Capital International Inc. (MSCI) and Standard & Poor’s, a division of The McGraw-Hill Companies, Inc. (S&P) and is licensed for use by Goldman Sachs. Neither MSCI, S&P nor any other party involved in making or compiling the GICS or any GICS classifications makes any express or implied warranties or representations with respect to such standard or classification (or the results to be obtained by the use thereof), and all such parties hereby expressly disclaim all warranties of originality, accuracy, completeness, merchantability or fitness for a particular purpose with respect to any of such standard or classification. Without limiting any of the foregoing, in no event shall MSCI, S&P, any of their affiliates or any third party involved in making or compiling the GICS or any GICS classifications have any liability for any direct, indirect, special, punitive, consequential or any other damages (including lost profits) even if notified of the possibility of such damages.
The portfolio risk management process includes an effort to monitor and manage risk, but does not imply low risk.
This material is not authorized for distribution to prospective investors unless preceded or accompanied by a current Prospectus or summary prospectus, if applicable. Investors should consider a Fund’s objective, risks, and charges and expenses, and read the summary prospectus, if available, and/or the Prospectus carefully before investing or sending money. The summary prospectus, if available, and the Prospectus contain this and other information about a Fund and may be obtained from your Authorized Institution or from Goldman, Sachs & Co. by calling (retail – 1-800-526-7384) (institutional – 1-800-621-2550).
© 2016 Goldman Sachs. All rights reserved. 66774-TMPL-10 / 2016 EQGRWAR-16 / 151k