UNITED STATES
SECURITIES AND EXCHANGE COMMISSION
Washington, D.C. 20549
FORM N-CSR
CERTIFIED SHAREHOLDER REPORT OF REGISTERED
MANAGEMENT INVESTMENT COMPANIES
Investment Company Act file number 811-05349
Goldman Sachs Trust
(Exact name of registrant as specified in charter)
71 South Wacker Drive, Chicago, Illinois 60606
(Address of principal executive offices) (Zip code)
| | |
| Caroline Kraus, Esq. | | Copies to: |
| Goldman Sachs & Co. LLC | | Geoffrey R.T. Kenyon, Esq. |
| 200 West Street | | Dechert LLP |
| New York, New York 10282 | | 100 Oliver Street |
| | 40th Floor |
| | Boston, MA 02110-2605 |
(Name and address of agents for service)
Registrant’s telephone number, including area code: (312) 655-4400
Date of fiscal year end: August 31
Date of reporting period: August 31, 2017
| ITEM 1. | REPORTS TO STOCKHOLDERS. |
| | The Annual Report to Shareholders is filed herewith. |
Goldman Sachs Funds

| | | | |
| | |
| Annual Report | | | | August 31, 2017 |
| | |
| | | | Financial Square FundsSM |
| | | | Federal Instruments |
| | | | Government |
| | | | Money Market |
| | | | Prime Obligations |
| | | | Tax-Exempt Money Market |
| | | | Treasury Instruments |
| | | | Treasury Obligations |
| | | | Treasury Solutions |

Goldman Sachs Financial Square Funds
| ∎ | | FEDERAL INSTRUMENTS FUND |
| ∎ | | TAX-EXEMPT MONEY MARKET FUND |
| ∎ | | TREASURY INSTRUMENTS FUND |
| ∎ | | TREASURY OBLIGATIONS FUND |
| ∎ | | TREASURY SOLUTIONS FUND |
| | | | |
| | | |
| NOT FDIC-INSURED | | May Lose Value | | No Bank Guarantee |
PORTFOLIO RESULTS
Goldman Sachs Financial Square Funds
Portfolio Management Discussion and Analysis
Below, the Goldman Sachs Money Market Portfolio Management Team discusses the Goldman Sachs Financial Square Funds’ (the “Funds”) performance and positioning for the 12-month period ended August 31, 2017 (the “Reporting Period”).
| Q | | What economic and market factors most influenced the money markets as a whole during the Reporting Period? |
| A | | During the Reporting Period, noteworthy events influencing the front, or short-term, end of the taxable and tax-exempt money market yield curves included Federal Reserve (“Fed”) interest rate hikes and discussion of balance sheet normalization, the possibility of the European Central Bank’s (“ECB”) tapering of its asset purchases, and geopolitical events. (Yield curve is a spectrum of maturities. Balance sheet normalization refers to the steps the Fed will take to reverse quantitative easing and remove the substantial monetary accommodation it has provided to the economy since the financial crisis began in 2007.) |
| | When the Reporting Period began in September 2016, credit spreads (the difference in yields between government and taxable bonds of comparable maturity) widened in advance of money market fund reform, with final implementation taking effect in October 2016. Meanwhile, the agency floater curve steepened, as LIBOR widened and interest in shorter floaters amongst market participants increased. (LIBOR, or the London Inter-Bank Offered Rate, is the interest rate that banks charge each other for short-term loans.) The BofA Merrill Lynch U.S. Dollar Three-Month LIBOR Constant Maturity Index spiked to its highest level since the 2008 financial crisis. However, unlike in 2008, funding costs for banks did not increase due to market stress. Instead, spreads widened because of declining demand, as prime money market funds had been a key source of short-term bank funding. (Prime money market funds primarily invest in corporate debt securities.) Most of the flows went into government money market funds that invest in agencies — and may offer higher yields benchmarked to LIBOR — which benefited government yields and reduced pressure on U.S. Treasury yields. During September and October 2016, prime money market funds lost approximately $440 billion in assets, while government money market funds gained $410 billion in assets.1 |
| | After money market fund reform was implemented on October 14, 2016, credit spreads gradually tightened to reach widths at the end of February 2017 that had been previously seen at the beginning of 2016. (On July 23, 2014 and September 16, 2015, the Securities and Exchange Commission (“SEC”) had approved changes to the rules governing U.S. money market funds, the most significant of which were scheduled to become effective in October 2016.) |
| | Money market fund reform also impacted tax-exempt money market funds, with investment outflows reducing demand for one-day to seven-day maturities. In tandem with the outflows, the Securities Industry and Financial Markets Association (“SIFMA”) Municipal Swap Index, representing seven-day tax-exempt variable rate demand obligations, rose. |
| | In November 2016, the unexpected results of the U.S. presidential elections were widely viewed as a potential regime change in monetary and fiscal policy. The U.S. Treasury yield curve steepened as the markets began pricing in higher inflation due to greater anticipated government fiscal spending. |
| | In December 2016, in a move widely expected by the markets, the Fed raised the targeted federal funds rate by 25 basis points, the second interest rate hike since the 2008 global financial crisis. (A basis point is 1/100th of a percentage point.) Fed policymakers also raised their interest rate projections on the back of continued improvement in the U.S. labor market, rising wages and the potential of fiscal policy initiatives by the incoming Administration. After the Fed’s December 2016 policy meeting, market expectations increased for additional Fed rate hikes in 2017, and money market yields generally moved higher. |
| | In March 2017, Fed policymakers raised the targeted federal funds rate another 25 basis points and also reiterated their interest rate projections, saying they intended to hike interest |
1
PORTFOLIO RESULTS
| | rates a total of three times during the calendar year. U.S. economic growth, which had surprised to the downside in early 2017, strengthened during the second calendar quarter, with the Gross Domestic Product (“GDP”) coming in at an annualized rate of 3.0%. In June 2017, the unemployment rate declined to 4.3%, below what the Fed considers the normal level of unemployment. Core personal consumption expenditures remained below the Fed’s 2% target at just 1.7% year-over-year in June 2017, marking the fourth consecutive month of weak inflation data. Nevertheless, in June 2017, Fed policymakers raised the federal funds rate yet another 25 basis points to a target range of between 1.00% and 1.25%, citing ongoing strength in the labor market and a pickup in household spending and business fixed investment. Also in June 2017, the Fed released a detailed addendum to its policy statement with specifics about its plan to taper reinvestment of its balance sheet. The plan is set to begin sometime in 2017 with a rundown of no greater than $10 billion a month, divided between mortgage-backed securities and U.S. Treasuries, with the total anticipated to rise steadily over the course of one year. |
| | In August 2017, at the Fed’s Jackson Hole Economic Policy Symposium, Fed Chair Janet Yellen said, “in light of the continued solid performance of the labor market and our outlook for economic activity and inflation, I believe the case for an increase in the federal funds rate has strengthened in recent months.” |
| | Also toward the end of the Reporting Period, expectations for a tapering announcement from the ECB shifted from possible to more than probable. ECB President Mario Draghi provided a rather optimistic outlook for inflation, stating “deflationary forces have been replaced by reflationary ones.” Mr. Draghi also made a cautious reference to a tapering of quantitative easing, saying an adjustment in the ECB’s “policy instruments” alongside the ongoing economic recovery would imply a constant rather than a tighter policy stance. The financial markets reacted to these comments in a hawkish manner, with the euro appreciating and German government bond yields rising. (Hawkish tends to suggest higher interest rates; opposite of dovish.) |
| Q | | What key factors were responsible for the performance of the Funds during the Reporting Period? |
| A | | The taxable and tax-exempt Funds’ yields rose during the Reporting Period, driven by the increase in money market yields, which occurred primarily because of the economic and market factors discussed above. The taxable and tax-exempt money market yield curves flattened, meaning differentials between yields on shorter-term maturities rose more than those on longer-term maturities. |
| Q | | How did you manage the taxable Funds during the Reporting Period? |
| A | | Collectively, the taxable Funds had investments in commercial paper, asset-backed commercial paper, U.S. Treasury securities, government agency securities, repurchase agreements (“repos”), government guaranteed paper, time deposits, certificates of deposit, variable rate demand notes (“VRDNs”), municipal securities and floating rate securities during the Reporting Period. |
| | In our taxable commercial paper strategies (i.e., the Goldman Sachs Financial Square Money Market Fund and the Goldman Sachs Financial Square Prime Obligations Fund), we maintained an especially short weighted average maturity of less than 10 days, along with high levels of liquidity, as the implementation of money market fund reform approached and amid uncertainty about investment flows from prime money market funds to government money market funds. Following the implementation of money market fund reform, investment flows into prime money market funds stabilized, and we gradually extended the weighted average maturity of our taxable commercial paper strategies. Toward the end of January 2017, as credit spreads normalized and we sought to add yield, we meaningfully extended the weighted average maturity of our taxable commercial paper strategies to a range of between 30 days and 40 days. |
| | Because we were skeptical about chances of a Fed interest rate hike in September 2016, we extended the weighted average maturity of our taxable government repo strategies (i.e., the Goldman Sachs Financial Square Government Fund, the Goldman Sachs Financial Square Treasury Obligations Fund and the Goldman Sachs Financial Square Treasury Solutions Fund) and our taxable government non-repo strategies (i.e., the Goldman Sachs Financial Square Federal Instruments Fund and the Goldman Sachs Financial Square Treasury Instruments Fund). We focused our purchases on LIBOR floaters. As already mentioned, LIBOR widened heading into U.S. money market fund reform, and interest in shorter floaters among market participants increased. During the period when the floater curve was steep, we focused on |
2
PORTFOLIO RESULTS
| | longer, i.e. 12- to 18-month final, three-month LIBOR floaters. As that curve began to flatten in the late summer of 2016, we adjusted and expressed this view via shorter, i.e. six-month final, three-month LIBOR floaters. In November 2016, we extended the weighted average maturity of our taxable government repo strategies and our taxable government non-repo strategies to take advantage of an increase in yields. We also added positions that we thought would perform well even if the Fed raised interest rates more aggressively than the market expected. Toward the end of February 2017, we reduced the weighted average maturity of our taxable government repo and non-repo strategies in anticipation of the March 2017 federal debt ceiling deadline. (Congress and the White House had agreed to suspend the federal debt limit until March 15, 2017. After that date, the government could not continue to borrow money to pay its obligations.) From March through June 2017, because of continued comments from the Fed about a potential June interest rate increase, we shortened the weighted average maturities of all our taxable strategies to a range of between 25 days and 37 days. |
| | During the first calendar quarter, we focused our purchases on floating rate securities and U.S. government agency securities, which would help us manage duration in the event of a more aggressive than expected Fed rate hike scenario. (Duration is a measure of a portfolio’s sensitivity to changes in interest rates.) In the second calendar quarter, we focused our purchases on floating rate securities, U.S. government agency securities and U.S. Treasuries when and where we found attractive opportunities. As the U.S. Treasury money market yield curve steepened ahead of the anticipated Fed rate hike, we also identified compelling opportunities at the longer end of the money market U.S. Treasury coupon curve. After the Fed raised interest rates at its June 2017 policy meeting, we allowed the weighted average maturities of our taxable government repo and non-repo strategies to extend to a range of between 40 days and 60 days. At the same time, we maintained shorter weighted average maturities in our taxable commercial paper strategies. |
| | During July 2017, we kept the weighted average maturities of our taxable government non-repo strategies in range of between 46 days and 52 days. We positioned the weighted average maturities of our taxable government repo strategies and our taxable commercial paper strategies in a range of between 25 days and 40 days. Yields did not, in our view, offer enough compensation to extend maturities. We focused our purchases on U.S. government agency debt, which offered what we considered attractive opportunities. |
| | In August 2017, as market expectations of a U.S. debt ceiling deal stayed strong, we maintained weighted average maturities in a range of between 25 days and 36 days in our taxable commercial paper strategies and our taxable government repo strategies. We maintained weighted average maturities in our taxable government non-repo strategies in a range of between 46 days and 54 days. In making purchases for our taxable commercial paper strategies, we focused on non-U.S. sovereign government bonds, maturing primarily in September 2017. In our taxable government repo and non-repo strategies, we selectively added exposure to U.S. Treasury notes maturing in October 2017. |
| Q | | How did you manage the tax-exempt Fund during the Reporting Period? |
| A | | During the Reporting Period, the tax-exempt Fund (i.e., the Goldman Sachs Financial Square Tax-Exempt Money Market Fund) had investments in VDRNs, tax-exempt commercial paper, short-term municipal securities and municipal put bonds. |
| | We maintained a particularly low weighted average maturity and a high level of liquidity in the tax-exempt Fund in response to money market fund reform, which reduced demand for short-term money market securities. Tax-exempt money market mutual funds lost approximately $151 billion in assets during August 2016, falling to less than $128 billion in the second week of October 2016, coinciding with final implementation of money market fund reform. The decline in assets during 2016 pushed the front end of the tax-exempt money market yield curve out of alignment with that of the taxable money market yield curve. Historically, taxable money market mutual funds would begin buying VRDNs if the SIFMA Municipal Swap Index rose above the yields available in the taxable money markets. However, the taxable money market was also experiencing asset losses at that time and therefore, taxable money market investors did not buy a significant number of VRDNs. Furthermore, three-month and one-month LIBOR were at 0.88% and 0.53%, respectively, on October 12, 2016. The ratio of the SIFMA Municipal Swap Index to LIBOR, which had averaged less than 71% since 1997, reached 155% in October 2016. As a result, a |
3
PORTFOLIO RESULTS
| | large number of non-traditional buyers, including separately managed accounts and short duration municipal bond mutual funds, entered the tax-exempt money market, helping to push it back into equilibrium with the taxable money market by early 2017. The tax-exempt money market then stabilized, with non-traditional buyers dominating the front end of the market through the end of the Reporting Period. |
| | Broadly speaking, tax-exempt money market mutual fund assets generally fluctuated between $132 billion and $128 billion between October 2016 and August 2017. At the end of the Reporting Period, tax-exempt money market mutual fund assets were approximately $129 billion. |
| | Between October 2016 and February 2017, we extended the weighted average maturity of the tax-exempt Fund to a range of between five days and 34 days. Ahead of the Fed’s June 2017 policy meeting, we shortened the tax-exempt Fund’s weighted average maturity to a range of between 14 days and 20 days. We maintained the tax-exempt Fund’s weighted average maturity, without significantly extending or shortening, through the end of the Reporting Period. During the Reporting Period overall, the weighted average maturity of the tax-exempt Fund ranged between 20 days and 34 days. |
| Q | | How did you manage the Funds’ weighted average life during the Reporting Period? |
| A | | During the Reporting Period, we managed the weighted average life of the taxable and tax-exempt Funds below 120 days. In each of the taxable Funds, we maintained a weighted average life in a range of between approximately 40 days and 115 days. In the tax-exempt Fund, we maintained a weighted average life in a range of between approximately 20 days and 40 days. The weighted average life of a money market fund is a measure of a money market fund’s price sensitivity to changes in liquidity and/or credit risk. |
| | Under amendments to SEC Rule 2a-7 that became effective in May 2010, the maximum allowable weighted average life of a money market fund is 120 days. While one of the goals of the SEC’s money market fund rule is to reinforce conservative investment practices across the money market fund industry, our security selection process has long emphasized conservative investment choices. |
| Q | | Did you make any changes to the Funds’ portfolios during the Reporting Period? |
| A | | During the Reporting Period, we made adjustments to the Funds’ weighted average maturities and their allocations to specific investments based on then-current market conditions, our near-term view and anticipated and actual Fed monetary policy statements. |
| Q | | What is the Funds’ tactical view and strategy for the months ahead? |
| A | | At the end of the Reporting Period, we expected ongoing improvements in the U.S. economy, particularly in the labor market, to warrant another Fed rate hike in 2017, providing financial conditions do not tighten materially and core inflation improves. More specifically, we expect an interest rate hike in December 2017 and for balance sheet normalization to begin during the fourth quarter of 2017. (In mid-September 2017, after the Reporting Period ended, the Fed announced it would initiate balance sheet normalization in October 2017.) |
| | Looking ahead, we expect the Fed to take the lead among developed markets in terms of interest rate hikes and balance sheet normalization, while we anticipate central banks in Europe and Japan to scale back quantitative easing due to scarcity of assets while maintaining low interest rates amid subdued inflation outlooks. We believe the ECB is likely to start to reduce its asset purchases in January 2018 and that it may keep its rates on hold through 2017 and 2018. In our view, there is an increased likelihood of a tapering announcement by the ECB in September 2017, which could lead to a rise in LIBOR that might, in turn, result in higher yields for many European sovereign government bonds. In the U.K., we expect the Bank of England to remain on hold, providing inflation expectations do not rise materially. We see little scope for a near-term rate hike in Canada given recent weakness in inflation data. |
4
PORTFOLIO RESULTS
| | Overall, the taxable and tax-exempt Funds continue to be flexibly guided by shifting market conditions, and we have positioned them to seek to take advantage of anticipated interest rate movements. At the end of the Reporting Period, we viewed floating rate securities as offering value, and we intend to adjust duration guided by the context of market pricing in relation to our expectations. As always, we intend to continue to use our actively managed approach to seek the best possible return within the framework of our Funds’ investment guidelines and objectives. In addition, we will continue to manage interest, liquidity and credit risk daily. We will also continue to closely monitor economic data, Fed policy and any shifts in the taxable and tax-exempt money market yield curves, as we strive to navigate the interest rate environment. |
5
PORTFOLIO RESULTS
GOVERNMENT MONEY MARKET FUNDS
| | ∎ | | Federal Instruments Fund |
| | ∎ | | Treasury Instruments Fund |
| | ∎ | | Treasury Obligations Fund |
| | ∎ | | Treasury Solutions Fund |
You could lose money by investing in the Fund. Although the Fund seeks to preserve the value of your investment at $1.00 per share, it cannot guarantee it will do so. An investment in the Fund is not a deposit of a bank and is not insured or guaranteed by the Federal Deposit Insurance Corporation or any other government agency. The Fund’s sponsor has no legal obligation to provide financial support to the Fund, and you should not expect that the sponsor will provide financial support to the Fund at any time.
INSTITUTIONAL MONEY MARKET FUNDS
You could lose money by investing in the Fund. Because the share price of the Fund will fluctuate, when you sell your shares they may be worth more or less than what you originally paid for them. The Fund may impose a fee upon sale of your shares or may temporarily suspend your ability to sell shares if the Fund’s liquidity falls below required minimums because of market conditions or other factors. An investment in the Fund is not a deposit of a bank and is not insured or guaranteed by the Federal Deposit Insurance Corporation or any other government agency. The Fund’s sponsor has no legal obligation to provide financial support to the Fund, and you should not expect that the sponsor will provide financial support to the Fund at any time.
RETAIL MONEY MARKET FUNDS
You could lose money by investing in the Fund. Although the Fund seeks to preserve the value of your investment at $1.00 per share, it cannot guarantee it will do so. The Fund may impose a fee upon sale of your shares or may temporarily suspend your ability to sell shares if the Fund’s liquidity falls below required minimums because of market conditions or other factors. An investment in the Fund is not a deposit of a bank and is not insured or guaranteed by the Federal Deposit Insurance Corporation or any other government agency. The Fund’s sponsor has no legal obligation to provide financial support to the Fund, and you should not expect that the sponsor will provide financial support to the Fund at any time.
6
FUND BASICS
Financial Square Funds
as of August 31, 2017
| | | | | | | | | | |
| | PERFORMANCE REVIEW1 | |
| | | September 1, 2016–August 31, 2017 | | Fund Total Return (based on NAV)2
Institutional Shares | | | IMoneyNet
Institutional Average3 | |
| | Federal Instruments | | | 0.52 | % | | | 0.38 | %4 |
| | Government | | | 0.55 | | | | 0.38 | 4 |
| | Money Market | | | 0.87 | | | | 0.67 | 5 |
| | Prime Obligations | | | 0.87 | | | | 0.67 | 5 |
| | Tax-Exempt Money Market | | | 0.54 | | | | 0.50 | 6 |
| | Treasury Instruments | | | 0.48 | | | | 0.34 | 7 |
| | Treasury Obligations | | | 0.50 | | | | 0.35 | 8 |
| | | Treasury Solutions | | | 0.49 | | | | 0.38 | 8 |
| | | The returns represent past performance. Past performance does not guarantee future results. The Funds’ investment returns will fluctuate. Current performance may be lower or higher than the performance quoted above. Please visit our Web site at www.GSAMFUNDS.com to obtain the most recent month-end returns. |
| | | Performance reflects applicable fee waivers and/or expense limitations in effect during the periods shown. In their absence, performance would be reduced. Returns do not reflect the deduction of taxes that a shareholder would pay on Fund distributions or the redemption of Fund shares. |
| 1 | | Each of the Prime Obligations, Treasury Obligations, Money Market, Treasury Instruments and Treasury Solutions Funds offers nine separate classes of shares (Institutional, Select, Preferred, Capital, Administration, Service, Cash Management, Premier and Resource), the Tax-Exempt Money Market Fund offers seven separate share classes (Institutional, Select, Preferred, Capital, Administration, Service and Resource), the Federal Instruments Fund offers eight separate classes of shares (Institutional, Select, Preferred, Capital, Administration, Service, Cash Management and Premier), and the Government Fund offers twelve separate classes of shares (Institutional, Select, Preferred, Capital, Administration, Service, Cash Management, Premier, Resource, Class R6, Class A and Class C), each of which is subject to different fees and expenses that affect performance and entitles shareholders to different services. The Institutional and Class R6 Shares do not have distribution and/or service (12b-1) or administration and/or service (non-12b-1) fees. The Select, Preferred, Capital, Administration, Service, Cash Management, Premier, Resource, Class A and Class C Shares offer financial institutions the opportunity to receive fees for providing certain distribution, administrative support and/or shareholder services (as applicable). As an annualized percentage of average daily net assets, these share classes pay combined distribution and/or service (12b-1) and administration and/or service (non-12b-1) fees (as applicable) at the following contractual rates: the Select Shares pay 0.03%, Preferred Shares pay 0.10%, Capital Shares pay 0.15%, Administration Shares pay 0.25%, Service Shares pay 0.50%, Cash Management Shares pay 0.80%, Premier Shares pay 0.35%, Resource Shares pay 0.65%, Class A Shares pay 0.25% and Class C Shares pay 1.00%. If these fees were reflected in the above performance, performance would have been reduced. In addition, the Fund’s performance does not reflect the deduction of any applicable sales charges. |
| 2 | | The net asset value (NAV) represents the net assets of the class of the Fund (ex-dividend) divided by the total number of shares of the class outstanding. A Fund’s total return reflects the reinvestment of dividends and other distributions. |
| 3 | | Source: iMoneyNet, Inc. August 2017 |
| 4 | | Government & Agencies Institutional – Category includes the most broadly based of the government institutional funds. These funds may generally invest in U.S. treasuries, U.S. agencies, repurchase agreements, or government-backed floating rate notes. |
| 5 | | First Tier Institutional – Category includes only non-government institutional funds that also are not holding any second tier securities. Portfolio holdings of First Tier funds include U.S. Treasury, U.S. other, repurchase agreements, time deposits, domestic bank obligations, foreign bank obligations, first tier commercial paper, floating rate notes, and asset-backed commercial paper. |
| 6 | | Tax-Free National – Category includes all retail and institutional national tax-free and municipal money funds. Portfolio holdings of tax-free funds include rated and unrated demand notes, rated and unrated general market notes, commercial paper, put bonds—6 months & less, put bonds—over 6 months, AMT paper, and other tax-free holdings. |
| 7 | | Treasury Institutional – Category includes only institutional government funds that hold 100 percent in U.S. Treasuries. |
| 8 | | Treasury & Repo Institutional – Category includes only institutional government funds that hold U.S. Treasuries and repurchase agreements backed by the U.S. Treasury. |
7
FUND BASICS
| | | | | | | | | | | | | | | | | | | | | | | | |
| | STANDARDIZED TOTAL RETURNS1,9 |
| | | For the period ended 6/30/17 | | SEC
7-Day
Current
Yield10 | | | One
Year | | | Five
Years | | | Ten
Years | | | Since
Inception | | | Inception
Date |
| | Federal Instruments | | | 0.82 | % | | | 0.42 | % | | | N/A | | | | N/A | | | | 0.32 | % | | 10/30/15 |
| | Government | | | 0.86 | | | | 0.45 | | | | 0.13 | % | | | 0.60 | % | | | 2.66 | | | 4/6/93 |
| | Money Market | | | 1.15 | | | | 0.72 | | | | 0.26 | | | | 0.73 | | | | 2.73 | | | 5/18/94 |
| | Prime Obligations | | | 1.17 | | | | 0.74 | | | | 0.22 | | | | 0.69 | | | | 3.07 | | | 3/8/90 |
| | Tax-Exempt Money Market | | | 0.66 | | | | 0.47 | | | | N/A | | | | N/A | | | | 0.41 | | | 3/31/16 |
| | Treasury Instruments | | | 0.81 | | | | 0.38 | | | | 0.10 | | | | 0.41 | | | | 2.01 | | | 3/3/97 |
| | Treasury Obligations | | | 0.84 | | | | 0.39 | | | | 0.10 | | | | 0.46 | | | | 2.87 | | | 4/25/90 |
| | | Treasury Solutions | | | 0.84 | | | | 0.38 | | | | 0.10 | | | | 0.57 | | | | 2.21 | | | 2/28/97 |
| | 9 | | The Standardized Total Returns are average annual total returns or cumulative total returns (only if the performance period is one year or less) of Institutional Shares as of the most recent calendar quarter-end. They assume reinvestment of all distributions at NAV. The SEC 7-Day Current Yield is not a Standardized Total Return. |
| | | | Because Institutional Shares do not involve a sales charge, such a charge is not applied to their Standardized Total Returns. |
| | | | The yields and returns represent past performance. Past performance does not guarantee future results. The Funds’ investment yields and returns will fluctuate as market conditions change. Current performance may be lower or higher than the performance quoted above. Please visit our Web site at www.GSAMFUNDS.com to obtain the most recent month-end yields and returns. Performance reflects applicable fee waivers and/or expense limitations in effect during the periods shown. In their absence, performance would be reduced. Returns do not reflect the deduction of taxes that a shareholder would pay on Fund distributions or the redemption of Fund shares. |
| 10 | | The SEC 7-Day Current Yield figures are as of June 30, 2017 and are calculated in accordance with securities industry regulations and do not include net capital gains. SEC 7-Day Current Yield may differ slightly from the actual distribution rate of a given Fund because of the exclusion of distributed capital gains, which are non-recurring. The SEC 7-Day Current Yield more closely reflects a Fund’s current earnings than do the Standardized Total Return figures. |
8
YIELD SUMMARY
| | | | | | | | | | | | | | | | | | | | | | |
| | SUMMARY OF THE INSTITUTIONAL SHARES1 AS OF 8/31/17 | |
| | | Funds | | 7-Day
Dist.
Yield12 | | | SEC 7-Day
Effective
Yield13 | | | 30-Day
Average
Yield14 | | | Weighted
Avg. Maturity
(days)15 | | | Weighted
Avg. Life
(days)16 | |
| | Federal Instruments | | | 0.84 | % | | | 0.85 | % | | | 0.84 | % | | | 58 | | | | 86 | |
| | Government | | | 0.90 | | | | 0.92 | | | | 0.90 | | | | 24 | | | | 57 | |
| | Money Market | | | 1.19 | | | | 1.19 | | | | 1.19 | | | | 31 | | | | 76 | |
| | Prime Obligations | | | 1.19 | | | | 1.19 | | | | 1.19 | | | | 34 | | | | 82 | |
| | Tax-Exempt Money Market | | | 0.64 | | | | 0.64 | | | | 0.61 | | | | 17 | | | | 28 | |
| | Treasury Instruments | | | 0.84 | | | | 0.85 | | | | 0.84 | | | | 51 | | | | 115 | |
| | Treasury Obligations | | | 0.87 | | | | 0.88 | | | | 0.87 | | | | 19 | | | | 83 | |
| | | Treasury Solutions | | | 0.84 | | | | 0.84 | | | | 0.84 | | | | 26 | | | | 58 | |
| | | The yields represent past performance. Past performance does not guarantee future results. Current performance may be lower or higher than the performance quoted above. |
| | | Yields reflect fee waivers and expense limitations in effect and will fluctuate as market conditions change. The yield quotations more closely reflect the current earnings of the Fund. Please visit our Web site at www.GSAMFUNDS.com to obtain the most recent month-end performance. |
| 12 | | The 7-Day Distribution Yield is an annualized measure of a Fund’s dividends per share, divided by the price per share. This yield can include capital gain/loss distribution, if any. This is not an SEC Yield. |
| 13 | | The SEC 7-Day Effective Yield of a Fund is calculated in accordance with securities industry regulations and do not include net capital gains. The SEC 7-Day Effective Yield assumes reinvestment of dividends for one year. |
| 14 | | The 30-Day Average Yield is a net annualized yield of 30 days back from the current date listed. This yield includes capital gain/loss distribution. |
| 15 | | A Fund’s weighted average maturity (WAM) is an average of the effective maturities of all securities held in the portfolio, weighted by each security’s percentage of net assets. This must not exceed 60 days as calculated under SEC Rule 2a-7. |
| 16 | | A Fund’s weighted average life (WAL) is an average of the final maturities of all securities held in the portfolio, weighted by each security’s percentage of net assets. This must not exceed 120 days as calculated under SEC Rule 2a-7. |
9
SECTOR ALLOCATIONS
| | | | | | | | | | | | | | | | | | | | | | | | | | | | | | |
| | TAXABLE FUNDS17 | |
| | | as of August 31, 2017 | | | | | | | | | | | | | | | | | | | |
| | | Security Type (Percentage of Net Assets) | | Federal
Instruments | | | Government | | | Money
Market | | | Prime
Obligations | | | Treasury
Instruments | | | Treasury
Obligations | | | Treasury
Solutions | |
| | Certificates of Deposit | | | — | | | | — | | | | 1.9 | % | | | 2.0 | % | | | — | | | | — | | | | — | |
| | Certificates of Deposit - Eurodollar | | | — | | | | — | | | | 2.3 | | | | — | | | | — | | | | — | | | | — | |
| | Certificates of Deposit - Yankeedollar | | | — | | | | — | | | | 9.8 | | | | 10.5 | | | | — | | | | — | | | | — | |
| | Commercial Paper & Corporate Obligations | | | — | | | | — | | | | 24.7 | | | | 22.9 | | | | — | | | | — | | | | — | |
| | Fixed Rate Municipal Debt Obligations | | | — | | | | — | | | | 2.5 | | | | 1.7 | | | | — | | | | — | | | | — | |
| | Repurchase Agreements | | | — | | | | 57.9 | % | | | 3.5 | | | | 1.7 | | | | — | | | | 63.0 | % | | | 64.1 | % |
| | Time Deposits | | | — | | | | — | | | | 14.6 | | | | 16.4 | | | | — | | | | — | | | | — | |
| | U.S. Government Agency Obligations | | | 34.6 | % | | | 26.2 | | | | — | | | | 0.6 | | | | — | | | | — | | | | — | |
| | U.S. Treasury Obligations | | | 62.9 | | | | 16.1 | | | | — | | | | — | | | | 101.1 | % | | | 37.1 | | | | 36.7 | |
| | Variable Rate Municipal Debt Obligations | | | — | | | | — | | | | 8.1 | | | | 9.6 | | | | — | | | | — | | | | — | |
| | | Variable Rate Obligations | | | — | | | | — | | | | 32.6 | | | | 34.6 | | | | — | | | | — | | | | — | |
| 17 | | Each Fund is actively managed and, as such, its portfolio composition may differ over time. The percentage shown for each investment category reflects the value of investments in that category as a percentage of net assets. Figures in the above table may not sum to 100% due to the exclusion of other assets and liabilities. |
10
SECTOR ALLOCATIONS
| | | | | | | | | | | | | | | | | | | | | | | | | | | | | | |
| | TAXABLE FUNDS17 | |
| | | as of August 31, 2016 | | | | | | | | | | | | | | | | | | | |
| | | Security Type (Percentage of Net Assets) | | Federal
Instruments | | | Government | | | Money
Market | | | Prime
Obligations | | | Treasury
Instruments | | | Treasury
Obligations | | | Treasury
Solutions | |
| | Certificates of Deposit - Yankeedollar | | | — | | | | — | | | | 7.4 | % | | | 7.5 | % | | | — | | | | — | | | | — | |
| | Commercial Paper & Corporate Obligations | | | — | | | | — | | | | 0.5 | | | | 1.0 | | | | — | | | | — | | | | — | |
| | Fixed Rate Municipal Debt Obligations | | | — | | | | — | | | | 0.9 | | | | 1.0 | | | | — | | | | — | | | | — | |
| | Repurchase Agreements | | | — | | | | 56.6 | % | | | 26.4 | | | | 22.3 | | | | — | | | | 64.6 | % | | | 51.3 | % |
| | Time Deposits | | | — | | | | — | | | | 40.3 | | | | 35.2 | | | | — | | | | — | | | | — | |
| | U.S. Government Agency Obligations | | | 68.4 | % | | | 42.9 | | | | 0.7 | | | | 4.2 | | | | — | | | | — | | | | — | |
| | U.S. Treasury Obligations | | | 31.5 | | | | 2.8 | | | | — | | | | — | | | | 101.2 | % | | | 32.3 | | | | 49.2 | |
| | | Variable Rate Municipal Debt Obligations | | | — | | | | — | | | | 23.9 | | | | 28.9 | | | | — | | | | — | | | | — | |
| 17 | | Each Fund is actively managed and, as such, its portfolio composition may differ over time. The percentage shown for each investment category reflects the value (based on amortized cost) of investments in that category as a percentage of net assets. Figures in the above table may not sum to 100% due to the exclusion of other assets and liabilities. |
11
SECTOR ALLOCATIONS
| | | | | | |
| | TAX-EXEMPT MONEY MARKET FUND18 | |
| | | as of August 31, 2017 | | | |
| | | Security Type | | Percentage of
Net Assets | |
| | Bond Anticipation Notes | | | 1.9 | % |
| | Commercial Paper | | | 23.1 | |
| | Tax and Revenue Anticipation Notes | | | 1.3 | |
| | | Variable Rate Obligations | | | 73.4 | |
| | | as of August 31, 2016 | | | |
| | | Security Type | | Percentage of
Net Assets | |
| | Commercial Paper | | | 6.9 | % |
| | | Variable Rate Obligations | | | 91.0 | |
| 18 | | The Fund is actively managed and, as such, its portfolio composition may differ over time. The percentage shown for each investment category reflects the value of investments in that category as a percentage of net assets. Figures in the above table may not sum to 100% due to the exclusion of other assets and liabilities. |
12
Index Definitions
The BofA Merrill Lynch U.S. Dollar Three-Month LIBOR Constant Maturity Index is based on the assumed purchase of a synthetic instrument having three months to maturity and with a coupon equal to the closing quote for three-month LIBOR. That issue is sold the following day (priced at a yield equal to the current day closing three-month LIBOR rate) and is rolled into a new three-month instrument. The index, therefore, will always have a constant maturity equal to exactly three months.
The Securities Industry and Financial Markets Association (“SIFMA”) Municipal Swap Index is a seven-day high-grade market index comprised of tax-exempt variable rate demand obligations with certain characteristics. The Index is calculated and published by Bloomberg. The Index is overseen by SIFMA’s municipal swap index committee.
13
FINANCIAL SQUARE FEDERAL INSTRUMENTS FUND
Schedule of Investments
August 31, 2017
| | | | | | | | | | | | | | |
Principal
Amount | | | Interest
Rate | | | Maturity
Date | | | Amortized
Cost | |
| | | | | | | | | | | | | | |
| U.S. Government Agency Obligations – 34.6% | |
| | Federal Farm Credit Bank (1 Mo. LIBOR + 0.04%) | |
| $ | 700,000 | | | | 1.267 | %(a) | | | 09/15/17 | | | $ | 699,999 | |
| | Federal Farm Credit Bank (3 Mo. U.S. T-Bill MMY + 0.09%) | |
| | 700,000 | | | | 1.113 | (a) | | | 02/19/19 | | | | 699,918 | |
| | Federal Farm Credit Bank (Prime Rate – 3.08%)(a) | |
| | 250,000 | | | | 1.170 | | | | 06/27/19 | | | | 249,977 | |
| | 1,600,000 | | | | 1.170 | | | | 07/17/19 | | | | 1,599,699 | |
| | Federal Farm Credit Bank (Prime Rate – 3.12%) | |
| | 1,000,000 | | | | 1.130 | (a) | | | 01/24/19 | | | | 999,846 | |
| | Federal Home Loan Bank (1 Mo. LIBOR – 0.09%) | |
| | 1,050,000 | | | | 1.139 | (a) | | | 01/14/19 | | | | 1,050,000 | |
| | Federal Home Loan Bank (1 Mo. LIBOR – 0.11%) | |
| | 1,600,000 | | | | 1.119 | (a) | | | 09/12/17 | | | | 1,600,000 | |
| | Federal Home Loan Bank (1 Mo. LIBOR – 0.14%) | |
| | 1,300,000 | | | | 1.088 | (a) | | | 05/18/18 | | | | 1,300,000 | |
| | Federal Home Loan Bank (1 Mo. LIBOR – 0.15%) | |
| | 1,900,000 | | | | 1.083 | (a) | | | 05/18/18 | | | | 1,900,000 | |
| | Federal Home Loan Bank (1 Mo. LIBOR – 0.16%)(a) | |
| | 20,000,000 | | | | 1.071 | | | | 12/05/17 | | | | 20,000,007 | |
| | 7,100,000 | | | | 1.068 | | | | 01/16/18 | | | | 7,100,000 | |
| | Federal Home Loan Bank (1 Mo. LIBOR – 0.17%)(a) | |
| | 5,200,000 | | | | 1.057 | | | | 11/15/17 | | | | 5,199,993 | |
| | 5,600,000 | | | | 1.058 | | | | 11/16/17 | | | | 5,600,000 | |
| | 8,000,000 | | | | 1.058 | | | | 11/17/17 | | | | 8,000,000 | |
| | 6,100,000 | | | | 1.066 | | | | 01/19/18 | | | | 6,100,000 | |
| | 7,600,000 | | | | 1.070 | | | | 01/22/18 | | | | 7,600,000 | |
| | 3,800,000 | | | | 1.071 | | | | 01/23/18 | | | | 3,800,000 | |
| | 2,000,000 | | | | 1.069 | | | | 01/25/18 | | | | 2,000,000 | |
| | 6,000,000 | | | | 1.069 | | | | 01/26/18 | | | | 6,000,000 | |
| | Federal Home Loan Bank (1 Mo. LIBOR + 0.01%)(a) | |
| | 4,800,000 | | | | 1.241 | | | | 06/19/18 | | | | 4,800,000 | |
| | 3,270,000 | | | | 1.244 | | | | 06/28/18 | | | | 3,270,000 | |
| | Federal Home Loan Bank (3 Mo. LIBOR – 0.02%) | |
| | 1,500,000 | | | | 1.182 | (a) | | | 09/01/17 | | | | 1,500,000 | |
| | Federal Home Loan Bank (3 Mo. LIBOR – 0.16%)(a) | |
| | 2,100,000 | | | | 1.039 | | | | 03/01/18 | | | | 2,100,537 | |
| | 7,000,000 | | | | 1.042 | | | | 06/01/18 | | | | 7,000,000 | |
| | Federal Home Loan Bank (3 Mo. LIBOR – 0.17%)(a) | |
| | 2,410,000 | | | | 1.076 | | | | 03/15/18 | | | | 2,410,000 | |
| | 2,410,000 | | | | 1.080 | | | | 03/16/18 | | | | 2,409,935 | |
| | Federal Home Loan Bank (3 Mo. LIBOR – 0.21%) | |
| | 2,500,000 | | | | 1.057 | (a) | | | 12/19/17 | | | | 2,500,000 | |
| | Federal Home Loan Bank (3 Mo. LIBOR – 0.22%)(a) | |
| | 2,300,000 | | | | 1.078 | | | | 12/27/17 | | | | 2,300,000 | |
| | 700,000 | | | | 1.084 | | | | 07/09/18 | | | | 699,969 | |
| | 1,100,000 | | | | 1.084 | | | | 07/12/18 | | | | 1,099,952 | |
| | Federal Home Loan Bank Discount Notes | |
| | 8,000,000 | | | | 1.030 | | | | 09/06/17 | | | | 7,998,879 | |
| | 2,450,000 | | | | 0.959 | | | | 09/18/17 | | | | 2,448,912 | |
| | 25,000,000 | | | | 1.040 | | | | 10/18/17 | | | | 24,966,708 | |
| | 7,000,000 | | | | 1.058 | | | | 11/15/17 | | | | 6,984,906 | |
| | 50,000,000 | | | | 1.072 | | | | 11/15/17 | | | | 49,890,625 | |
| | 7,900,000 | | | | 1.112 | | | | 12/06/17 | | | | 7,877,080 | |
| | 9,200,000 | | | | 1.160 | | | | 01/19/18 | | | | 9,159,428 | |
| | |
| TOTAL U.S. GOVERNMENT
AGENCY OBLIGATIONS |
| | $ | 220,916,370 | |
| | |
| | | | | | | | | | | | | | |
| U.S. Treasury Obligations – 62.9% | |
| | United States Cash Management Bills(b) | |
| $ | 600,000 | | | | 1.067 | % | | | 01/02/18 | | | $ | 597,858 | |
| | 500,000 | | | | 1.072 | | | | 01/02/18 | | | | 498,206 | |
| | United States Treasury Bills | |
| | 4,300,000 | | | | 1.000 | | | | 09/07/17 | | | | 4,299,298 | |
| | 99,100,000 | | | | 0.968 | | | | 09/14/17 | | | | 99,066,003 | |
| | 3,000,000 | | | | 0.993 | | | | 11/02/17 | | | | 2,994,975 | |
| | 600,000 | | | | 0.996 | | | | 11/02/17 | | | | 598,993 | |
| | 400,000 | | | | 1.001 | | | | 11/02/17 | | | | 399,325 | |
| | 625,000 | | | | 1.006 | | | | 11/02/17 | | | | 623,940 | |
| | 600,000 | | | | 1.011 | | | | 11/02/17 | | | | 598,977 | |
| | 400,000 | | | | 1.016 | | | | 11/02/17 | | | | 399,315 | |
| | 100,000 | | | | 1.022 | | | | 11/02/17 | | | | 99,828 | |
| | 3,900,000 | | | | 1.082 | | | | 11/02/17 | | | | 3,892,880 | |
| | 4,200,000 | | | | 1.087 | | | | 11/02/17 | | | | 4,192,297 | |
| | 1,000,000 | | | | 1.090 | | | | 11/02/17 | | | | 998,162 | |
| | 11,000,000 | | | | 1.092 | | | | 11/02/17 | | | | 10,979,729 | |
| | 6,400,000 | | | | 1.037 | | | | 11/09/17 | | | | 6,387,549 | |
| | 14,250,000 | | | | 1.061 | | | | 11/09/17 | | | | 14,221,595 | |
| | 1,600,000 | | | | 1.042 | | | | 11/16/17 | | | | 1,596,555 | |
| | 1,300,000 | | | | 1.056 | | | | 11/16/17 | | | | 1,297,160 | |
| | 1,400,000 | | | | 1.057 | | | | 11/16/17 | | | | 1,396,941 | |
| | 100,000 | | | | 1.063 | | | | 11/16/17 | | | | 99,780 | |
| | 200,000 | | | | 1.072 | | | | 11/16/17 | | | | 199,557 | |
| | 200,000 | | | | 1.078 | | | | 11/16/17 | | | | 199,555 | |
| | 700,000 | | | | 1.087 | | | | 11/16/17 | | | | 698,426 | |
| | 300,000 | | | | 1.093 | | | | 11/16/17 | | | | 299,322 | |
| | 400,000 | | | | 1.095 | | | | 11/16/17 | | | | 399,094 | |
| | 100,000 | | | | 1.098 | | | | 11/16/17 | | | | 99,773 | |
| | 75,000,000 | | | | 1.020 | | | | 11/24/17 | | | | 74,825,000 | |
| | 2,500,000 | | | | 1.031 | | | | 11/24/17 | | | | 2,494,108 | |
| | 400,000 | | | | 1.052 | | | | 11/24/17 | | | | 399,039 | |
| | 2,400,000 | | | | 1.057 | | | | 11/24/17 | | | | 2,394,204 | |
| | 500,000 | | | | 1.062 | | | | 11/24/17 | | | | 498,787 | |
| | 500,000 | | | | 1.067 | | | | 11/24/17 | | | | 498,781 | |
| | 2,000,000 | | | | 1.068 | | | | 11/24/17 | | | | 1,995,123 | |
| | 6,700,000 | | | | 1.071 | | | | 11/24/17 | | | | 6,683,624 | |
| | 4,900,000 | | | | 1.073 | | | | 11/24/17 | | | | 4,887,995 | |
| | 60,000,000 | | | | 1.008 | | | | 11/30/17 | | | | 59,851,875 | |
| | 1,300,000 | | | | 1.031 | | | | 11/30/17 | | | | 1,296,717 | |
| | 30,700,000 | | | | 1.083 | | | | 11/30/17 | | | | 30,618,645 | |
| | 8,900,000 | | | | 1.094 | | | | 12/07/17 | | | | 8,874,341 | |
| | 100,000 | | | | 1.114 | | | | 12/07/17 | | | | 99,706 | |
| | 10,800,000 | | | | 1.125 | | | | 12/14/17 | | | | 10,765,680 | |
| | 400,000 | | | | 1.130 | | | | 12/14/17 | | | | 398,723 | |
| | 300,000 | | | | 1.062 | | | | 01/04/18 | | | | 298,917 | |
| | 3,300,000 | | | | 1.130 | | | | 01/18/18 | | | | 3,285,920 | |
| | 200,000 | | | | 1.145 | | | | 02/01/18 | | | | 199,048 | |
| | 1,300,000 | | | | 1.150 | | | | 02/01/18 | | | | 1,293,784 | |
| | 14,500,000 | | | | 1.119 | | | | 02/08/18 | | | | 14,429,433 | |
| | 200,000 | | | | 1.130 | | | | 02/08/18 | | | | 199,018 | |
| | 2,000,000 | | | | 1.140 | | | | 02/08/18 | | | | 1,990,089 | |
| | 200,000 | | | | 1.114 | | | | 02/22/18 | | | | 198,946 | |
| United States Treasury Floating Rate Note (3 Mo. U.S. T-Bill
MMY + 0.17%) |
|
| | 200,000 | | | | 1.191 | (a) | | | 10/31/17 | | | | 200,043 | |
| | |
| | |
| 14 | | The accompanying notes are an integral part of these financial statements. |
FINANCIAL SQUARE FEDERAL INSTRUMENTS FUND
| | | | | | | | | | | | | | |
Principal
Amount | | | Interest
Rate | | | Maturity
Date | | | Amortized
Cost | |
| U.S. Treasury Obligations – (continued) | |
| United States Treasury Floating Rate Note (3 Mo. U.S. T-Bill
MMY + 0.27%) |
|
| $ | 6,400,000 | | | | 1.295 | %(a) | | | 01/31/18 | | | $ | 6,407,825 | |
| | United States Treasury Notes | |
| | 400,000 | | | | 0.750 | | | | 10/31/17 | | | | 399,769 | |
| | 5,200,000 | | | | 4.250 | | | | 11/15/17 | | | | 5,234,241 | |
| | 900,000 | | | | 2.250 | | | | 11/30/17 | | | | 902,623 | |
| | 3,300,000 | | | | 2.625 | | | | 01/31/18 | | | | 3,319,828 | |
| | |
| TOTAL U.S. TREASURY
OBLIGATIONS |
| | $ | 402,076,925 | |
| | |
| | TOTAL INVESTMENTS – 97.5% | | | $ | 622,993,295 | |
| | |
| OTHER ASSETS IN EXCESS OF
LIABILITIES – 2.5% |
| | | 15,705,625 | |
| | |
| | NET ASSETS – 100.0% | | | $ | 638,698,920 | |
| | |
| | |
| The percentage shown for each investment category reflects the value of investments in that category as a percentage of net assets. |
(a) | | Variable or floating rate security. Interest rate disclosed is that which is in effect at August 31, 2017. |
(b) | | All or a portion represents a forward commitment. |
|
| Interest rates represent either the stated coupon rate, annualized yield on date of purchase for discounted securities, or, for floating rate securities, the current reset rate, which is based upon current interest rate indices. |
|
| Maturity dates represent either the final legal maturity date on the security, the demand date for puttable securities, or the prerefunded date for those types of securities. |
| | |
|
Investment Abbreviations: |
LIBOR | | —London Interbank Offered Rate |
MMY | | — Money Market Yield |
Prime | | —Federal Reserve Bank Prime Loan Rate U.S. |
T-Bill | | —Treasury Bill |
|
| | |
| The accompanying notes are an integral part of these financial statements. | | 15 |
FINANCIAL SQUARE GOVERNMENT FUND
Schedule of Investments
August 31, 2017
| | | | | | | | | | | | | | |
Principal Amount | | | Interest
Rate | | | Maturity
Date | | | Amortized Cost | |
| U.S. Government Agency Obligations – 26.2% | |
| | Federal Farm Credit Bank (1 Mo. LIBOR + 0.04%) | |
| $ | 64,000,000 | | | | 1.267 | %(a) | | | 09/15/17 | | | $ | 63,999,876 | |
| | Federal Farm Credit Bank (3 Mo. U.S. T-Bill MMY + 0.09%) | |
| | 98,500,000 | | | | 1.113 | (a) | | | 02/19/19 | | | | 98,488,414 | |
| | Federal Farm Credit Bank (Prime Rate – 3.08%)(a) | |
| | 36,500,000 | | | | 1.170 | | | | 06/27/19 | | | | 36,496,620 | |
| | 216,800,000 | | | | 1.170 | | | | 07/17/19 | | | | 216,759,291 | |
| | Federal Farm Credit Bank (Prime Rate – 3.12%) | |
| | 123,000,000 | | | | 1.130 | (a) | | | 01/24/19 | | | | 122,981,021 | |
| | Federal Home Loan Bank (1 Mo. LIBOR – 0.02%) | |
| | 247,000,000 | | | | 1.219 | (a) | | | 12/26/17 | | | | 247,000,000 | |
| | Federal Home Loan Bank (1 Mo. LIBOR – 0.05%) | |
| | 497,200,000 | | | | 1.179 | (a) | | | 07/13/18 | | | | 497,200,000 | |
| | Federal Home Loan Bank (1 Mo. LIBOR – 0.09%) | |
| | 147,750,000 | | | | 1.139 | (a) | | | 01/14/19 | | | | 147,750,000 | |
| | Federal Home Loan Bank (1 Mo. LIBOR – 0.11%) | |
| | 247,050,000 | | | | 1.119 | (a) | | | 09/12/17 | | | | 247,050,000 | |
| | Federal Home Loan Bank (1 Mo. LIBOR – 0.14%) | |
| | 168,800,000 | | | | 1.088 | (a) | | | 05/18/18 | | | | 168,800,000 | |
| | Federal Home Loan Bank (1 Mo. LIBOR – 0.15%) | |
| | 241,300,000 | | | | 1.083 | (a) | | | 05/18/18 | | | | 241,300,000 | |
| | Federal Home Loan Bank (1 Mo. LIBOR – 0.16%)(a) | |
| | 475,000,000 | | | | 1.076 | | | | 11/30/17 | | | | 475,000,000 | |
| | 480,000,000 | | | | 1.071 | | | | 12/05/17 | | | | 480,000,160 | |
| | 967,000,000 | | | | 1.068 | | | | 01/16/18 | | | | 967,000,000 | |
| | Federal Home Loan Bank (1 Mo. LIBOR – 0.17%)(a) | |
| | 490,000,000 | | | | 1.066 | | | | 11/06/17 | | | | 490,000,000 | |
| | 250,000,000 | | | | 1.066 | | | | 11/07/17 | | | | 250,000,000 | |
| | 704,000,000 | | | | 1.057 | | | | 11/15/17 | | | | 703,999,112 | |
| | 693,500,000 | | | | 1.062 | | | | 11/15/17 | | | | 693,500,000 | |
| | 724,100,000 | | | | 1.058 | | | | 11/16/17 | | | | 724,100,000 | |
| | 984,000,000 | | | | 1.058 | | | | 11/17/17 | | | | 984,000,000 | |
| | 772,200,000 | | | | 1.066 | | | | 01/19/18 | | | | 772,200,000 | |
| | 965,500,000 | | | | 1.070 | | | | 01/22/18 | | | | 965,500,000 | |
| | 482,700,000 | | | | 1.071 | | | | 01/23/18 | | | | 482,700,000 | |
| | 246,000,000 | | | | 1.069 | | | | 01/25/18 | | | | 246,000,000 | |
| | 738,000,000 | | | | 1.069 | | | | 01/26/18 | | | | 738,000,000 | |
| | Federal Home Loan Bank (1 Mo. LIBOR + 0.01%)(a) | |
| | 741,200,000 | | | | 1.241 | | | | 06/19/18 | | | | 741,200,000 | |
| | 494,020,000 | | | | 1.244 | | | | 06/28/18 | | | | 494,020,000 | |
| | Federal Home Loan Bank (3 Mo. LIBOR – 0.11%) | |
| | 248,000,000 | | | | 1.207 | (a) | | | 02/05/18 | | | | 248,000,000 | |
| | Federal Home Loan Bank (3 Mo. LIBOR – 0.15%)(a) | |
| | 133,000,000 | | | | 1.165 | | | | 02/15/18 | | | | 133,000,000 | |
| | 497,000,000 | | | | 1.165 | | | | 02/22/18 | | | | 497,000,000 | |
| | Federal Home Loan Bank (3 Mo. LIBOR – 0.16%)(a) | |
| | 255,600,000 | | | | 1.039 | | | | 03/01/18 | | | | 255,665,390 | |
| | 993,000,000 | | | | 1.042 | | | | 06/01/18 | | | | 993,000,000 | |
| | Federal Home Loan Bank (3 Mo. LIBOR – 0.17%)(a) | |
| | 238,060,000 | | | | 1.076 | | | | 03/15/18 | | | | 238,060,000 | |
| | 238,060,000 | | | | 1.080 | | | | 03/16/18 | | | | 238,053,591 | |
| | Federal Home Loan Bank (3 Mo. LIBOR – 0.18%) | |
| | 148,500,000 | | | | 1.137 | (a) | | | 11/08/17 | | | | 148,500,000 | |
| | Federal Home Loan Bank (3 Mo. LIBOR – 0.21%) | |
| | 246,000,000 | | | | 1.057 | (a) | | | 12/19/17 | | | | 246,000,000 | |
| | Federal Home Loan Bank (3 Mo. LIBOR – 0.22%)(a) | |
| | 246,300,000 | | | | 1.078 | | | | 12/27/17 | | | | 246,300,000 | |
| | |
| U.S. Government Agency Obligations – (continued) | |
| | Federal Home Loan Bank (3 Mo. LIBOR – 0.22%) (continued) | |
| 496,000,000 | | | | 1.069 | % | | | 03/23/18 | | | | 496,000,000 | |
| | 98,700,000 | | | | 1.084 | | | | 07/09/18 | | | | 98,695,606 | |
| | 148,100,000 | | | | 1.084 | | | | 07/12/18 | | | | 148,093,580 | |
| | Federal Home Loan Bank (3 Mo. LIBOR – 0.24%) | |
| | 348,000,000 | | | | 0.983 | (a) | | | 09/06/17 | | | | 348,000,000 | |
| | Federal Home Loan Bank (3 Mo. LIBOR – 0.26%) | |
| | 497,000,000 | | | | 1.039 | (a) | | | 10/02/17 | | | | 497,000,000 | |
| | Federal Home Loan Bank (3 Mo. LIBOR – 0.27%) | |
| | 497,500,000 | | | | 1.029 | (a) | | | 10/02/17 | | | | 497,500,000 | |
| | Federal Home Loan Bank Discount Notes | |
| | 250,000,000 | | | | 1.019 | | | | 09/06/17 | | | | 249,965,271 | |
| | 200,000,000 | | | | 1.093 | | | | 10/04/17 | | | | 199,803,833 | |
| | 49,000,000 | | | | 1.061 | | | | 11/03/17 | | | | 48,910,819 | |
| | 70,000,000 | | | | 1.058 | | | | 11/15/17 | | | | 69,849,062 | |
| | 1,131,600,000 | | | | 1.160 | | | | 01/19/18 | | | | 1,126,609,644 | |
| | Federal Home Loan Mortgage Corporation (3 Mo. LIBOR – 0.03%)(a) | |
| | 997,000,000 | | | | 1.274 | | | | 01/08/18 | | | | 997,000,000 | |
| | 249,000,000 | | | | 1.274 | | | | 01/12/18 | | | | 249,000,000 | |
| | Federal Home Loan Mortgage Corporation (3 Mo. LIBOR – 0.08%) | |
| | 1,992,500,000 | | | | 1.194 | (a) | | | 12/20/17 | | | | 1,992,500,000 | |
| Overseas Private Investment Corp. (USA) (3 Mo. U.S.
T-Bill + 0.00%)(a) |
|
| | 106,100,000 | | | | 1.100 | | | | 09/20/17 | | | | 106,100,000 | |
| | 183,500,000 | | | | 1.110 | | | | 09/20/17 | | | | 183,500,000 | |
| Overseas Private Investment Corp. (USA) (3 Mo. U.S. T-Bill
Factor + 0.00%)(a) |
|
| | 237,767,164 | | | | 1.100 | | | | 09/20/17 | | | | 237,767,163 | |
| | 96,741,894 | | | | 1.110 | | | | 09/20/17 | | | | 96,741,894 | |
| | |
| TOTAL U.S. GOVERNMENT
AGENCY OBLIGATIONS |
| | $ | 23,181,660,347 | |
| | |
| | | | | | | | | | | | | | |
| U.S. Treasury Obligations – 16.1% | |
| | United States Cash Management Bills(b) | |
| $ | 73,700,000 | | | | 1.067 | % | | | 01/02/18 | | | $ | 73,436,861 | |
| | 55,300,000 | | | | 1.072 | | | | 01/02/18 | | | | 55,101,611 | |
| | United States Treasury Bills | |
| | 319,700,000 | | | | 1.082 | | | | 11/02/17 | | | | 319,116,370 | |
| | 374,500,000 | | | | 1.087 | | | | 11/02/17 | | | | 373,813,105 | |
| | 101,500,000 | | | | 1.090 | | | | 11/02/17 | | | | 101,313,395 | |
| | 1,631,900,000 | | | | 1.092 | | | | 11/02/17 | | | | 1,628,892,773 | |
| | 520,200,000 | | | | 1.037 | | | | 11/09/17 | | | | 519,187,994 | |
| | 1,818,750,000 | | | | 1.061 | | | | 11/09/17 | | | | 1,815,124,625 | |
| | 37,500,000 | | | | 1.082 | | | | 11/09/17 | | | | 37,423,812 | |
| | 28,300,000 | | | | 1.087 | | | | 11/09/17 | | | | 28,242,233 | |
| | 32,800,000 | | | | 1.051 | | | | 11/16/17 | | | | 32,728,678 | |
| | 146,200,000 | | | | 1.056 | | | | 11/16/17 | | | | 145,880,553 | |
| | 8,080,000 | | | | 1.063 | | | | 11/16/17 | | | | 8,062,260 | |
| | 39,500,000 | | | | 1.072 | | | | 11/16/17 | | | | 39,412,442 | |
| | 25,800,000 | | | | 1.078 | | | | 11/16/17 | | | | 25,742,538 | |
| | 8,700,000 | | | | 1.083 | | | | 11/16/17 | | | | 8,680,531 | |
| | 48,400,000 | | | | 1.087 | | | | 11/16/17 | | | | 48,291,181 | |
| | 21,100,000 | | | | 1.093 | | | | 11/16/17 | | | | 21,052,337 | |
| | 3,500,000 | | | | 1.098 | | | | 11/16/17 | | | | 3,492,057 | |
| | 241,200,000 | | | | 1.025 | | | | 11/24/17 | | | | 240,634,386 | |
| | 28,800,000 | | | | 1.033 | | | | 11/24/17 | | | | 28,731,960 | |
| | 31,500,000 | | | | 1.052 | | | | 11/24/17 | | | | 31,424,295 | |
| | |
| | |
| 16 | | The accompanying notes are an integral part of these financial statements. |
FINANCIAL SQUARE GOVERNMENT FUND
| | | | | | | | | | | | | | |
Principal Amount | | | Interest
Rate | | | Maturity
Date | | | Amortized Cost | |
| U.S. Treasury Obligations – (continued) | |
| | United States Treasury Bills – (continued) | |
| $ | 171,700,000 | | | | 1.057 | % | | | 11/24/17 | | | $ | 171,285,345 | |
| | 25,700,000 | | | | 1.067 | | | | 11/24/17 | | | | 25,637,335 | |
| | 328,300,000 | | | | 1.068 | | | | 11/24/17 | | | | 327,499,495 | |
| | 158,000,000 | | | | 1.071 | | | | 11/24/17 | | | | 157,613,822 | |
| | 201,800,000 | | | | 1.073 | | | | 11/24/17 | | | | 201,305,590 | |
| | 96,800,000 | | | | 1.031 | | | | 11/30/17 | | | | 96,555,580 | |
| | 1,315,100,000 | | | | 1.083 | | | | 11/30/17 | | | | 1,311,614,985 | |
| | 633,300,000 | | | | 1.094 | | | | 12/07/17 | | | | 631,474,162 | |
| | 20,900,000 | | | | 1.114 | | | | 12/07/17 | | | | 20,838,618 | |
| | 1,396,920,000 | | | | 1.125 | | | | 12/14/17 | | | | 1,392,480,899 | |
| | 25,400,000 | | | | 1.130 | | | | 12/14/17 | | | | 25,318,918 | |
| | 1,000,000 | | | | 1.150 | | | | 12/28/17 | | | | 996,312 | |
| | 31,900,000 | | | | 1.062 | | | | 01/04/18 | | | | 31,784,806 | |
| | 409,900,000 | | | | 1.130 | | | | 01/18/18 | | | | 408,151,150 | |
| | 973,050,000 | | | | 1.145 | | | | 01/25/18 | | | | 968,630,191 | |
| | 949,350,000 | | | | 1.150 | | | | 01/25/18 | | | | 945,018,591 | |
| | 14,900,000 | | | | 1.145 | | | | 02/01/18 | | | | 14,829,076 | |
| | 175,000,000 | | | | 1.150 | | | | 02/01/18 | | | | 174,163,281 | |
| | 31,200,000 | | | | 1.130 | | | | 02/08/18 | | | | 31,046,773 | |
| | 261,800,000 | | | | 1.140 | | | | 02/08/18 | | | | 260,502,636 | |
| | 18,300,000 | | | | 1.114 | | | | 02/22/18 | | | | 18,203,589 | |
| | United States Treasury Notes | |
| | 783,500,000 | | | | 4.250 | | | | 11/15/17 | | | | 788,795,336 | |
| | 252,200,000 | | | | 2.250 | | | | 11/30/17 | | | | 253,010,251 | |
| | 413,300,000 | | | | 2.625 | | | | 01/31/18 | | | | 415,783,235 | |
| | |
| TOTAL U.S. TREASURY
OBLIGATIONS |
| | $ | 14,258,325,973 | |
| | |
| TOTAL INVESTMENTS BEFORE
REPURCHASE AGREEMENTS |
| | $ | 37,439,986,320 | |
| | |
| | | | | | | | | | | | | | |
| Repurchase Agreements(c) – 57.9% | |
| | Bank of Montreal | |
| $ | 100,000,000 | | | | 1.050 | % | | | 09/01/17 | | | $ | 100,000,000 | |
| | Maturity Value: $100,002,917 | |
| Collateralized by a U.S. Treasury Bill, 0.000%, due 11/16/17, a
U.S. Treasury Inflation-Indexed Bond, 0.750%, due 02/15/45,
U.S. Treasury Inflation-Indexed Notes, 0.625% to 1.375%, due
01/15/20 to 07/15/21 and U.S. Treasury Notes, 0.625% to
3.625%, due 04/30/18 to 08/15/25. The aggregate market value
of the collateral, including accrued interest, was $102,000,031. |
|
| | 185,000,000 | | | | 1.050 | (d) | | | 09/07/17 | | | | 185,000,000 | |
| | Maturity Value: $185,329,146 | |
| | Settlement Date: 08/24/17 | |
| Collateralized by a U.S. Treasury Bond, 2.750%, due 11/15/42
and U.S. Treasury Notes, 1.500% to 3.625%, due 02/15/20 to
08/15/26. The aggregate market value of the collateral,
including accrued interest, was $188,700,068. |
|
| | |
| | Barclays Capital, Inc. | |
| | 400,000,000 | | | | 1.060 | | | | 09/01/17 | | | | 400,000,000 | |
| | Maturity Value: $400,011,778 | |
| Collateralized by a U.S. Treasury Bill, 0.000%, due 09/28/17, a
U.S. Treasury Bond, 7.250%, due 08/15/22 and U.S. Treasury
Notes, 0.625% to 4.250%, due 11/15/17 to 01/31/22. The
aggregate market value of the collateral, including accrued
interest, was $408,000,065. |
|
| | |
| Repurchase Agreements(c) – (continued) | |
| | BNP Paribas | |
| 285,000,000 | | | | 1.060 | | | | 09/01/17 | | | | 285,000,000 | |
| | Maturity Value: $285,008,392 | |
| Collateralized by a U.S. Treasury Bill, 0.000%, due 03/01/18,
U.S. Treasury Bonds, 2.250% to 3.000%, due 05/15/42 to
08/15/46, U.S. Treasury Inflation-Indexed Notes, 0.125%, due
04/15/18 to 04/15/19, U.S. Treasury Interest-Only Stripped
Securities, 0.000%, due 05/15/31 to 08/15/37 and U.S. Treasury
Notes, 0.750% to 1.875%, due 09/30/17 to 10/31/17. The
aggregate market value of the collateral, including accrued
interest, was $290,700,000. |
|
| | 218,200,000 | | | | 1.080 | | | | 09/01/17 | | | | 218,200,000 | |
| | Maturity Value: $218,206,546 | |
| Collateralized by Federal Home Loan Mortgage Corp., 2.500% to
7.500%, due 10/01/27 to 01/01/43, Federal Home Loan
Mortgage Corp. Stripped Security, 0.000%, due 03/15/31,
Federal National Mortgage Association, 2.500% to 7.500%,
due 12/01/23 to 11/01/44, Federal National Mortgage
Association Stripped Security, 0.000%, due 05/15/22,
Government National Mortgage Association, 3.000% to
6.500%, due 10/15/26 to 06/20/46, a U.S. Treasury Bill,
0.000%, due 09/14/17, U.S. Treasury Bonds, 3.125% to
4.250%, due 11/15/40 to 02/15/42, U.S. Treasury Inflation-
Indexed Bonds, 2.125% to 2.375%, due 01/15/27 to 02/15/40,
U.S. Treasury Inflation-Indexed Notes, 0.125% to 0.625%, due
04/15/21 to 01/15/26, U.S. Treasury Interest-Only Stripped
Securities, 0.000%, due 05/15/28 to 11/15/45, a U.S. Treasury
Note, 1.750%, due 12/31/20 and a U.S. Treasury Principal-
Only Stripped Security, 0.000%, due 08/15/39. The aggregate
market value of the collateral, including accrued interest, was
$224,001,084. |
|
| | 425,000,000 | | | | 1.050 | (d) | | | 09/07/17 | | | | 425,000,000 | |
| | Maturity Value: $425,384,271 | |
| | Settlement Date: 08/14/17 | |
| Collateralized by a U.S. Treasury Inflation-Indexed Bond,
1.375%, due 02/15/44 and U.S. Treasury Notes, 0.750% to
2.375%, due 06/30/18 to 08/15/25. The aggregate market value
of the collateral, including accrued interest, was $433,500,001. |
|
| | 500,000,000 | | | | 1.060 | (d) | | | 09/07/17 | | | | 500,000,000 | |
| | Maturity Value: $500,456,388 | |
| | Settlement Date: 08/14/17 | |
| Collateralized by Federal Home Loan Mortgage Corp., 2.500% to
6.000%, due 11/01/23 to 08/01/47, Federal National Mortgage
Association, 3.000% to 6.000%, due 02/01/20 to 07/01/47,
Government National Mortgage Association, 2.500% to
7.000%, due 12/15/26 to 09/20/46, a U.S. Treasury Bill,
0.000%, due 09/14/17, a U.S. Treasury Inflation-Indexed Note,
0.125%, due 07/15/22 and U.S. Treasury Notes, 0.875% to
2.125%, due 09/15/19 to 08/31/21. The aggregate market value
of the collateral, including accrued interest, was $514,097,712. |
|
| | |
| | |
| The accompanying notes are an integral part of these financial statements. | | 17 |
FINANCIAL SQUARE GOVERNMENT FUND
Schedule of Investments (continued)
August 31, 2017
| | | | | | | | | | | | | | |
Principal Amount | | | Interest
Rate | | | Maturity
Date | | | Amortized Cost | |
| Repurchase Agreements(c) – (continued) | |
| | BNP Paribas – (continued) | |
| $ | 2,000,000,000 | | | | 1.080 | %(d) | | | 09/07/17 | | | $ | 2,000,000,000 | |
| | Maturity Value: $2,003,960,000 | |
| | Settlement Date: 07/17/17 | |
| Collateralized by Federal Home Loan Mortgage Corp., 2.500% to
7.000%, due 01/01/28 to 07/01/47, Federal National Mortgage
Association, 2.500% to 7.500%, due 10/01/18 to 08/01/47,
Government National Mortgage Association, 2.500% to
10.000%, due 04/15/18 to 07/20/47, a U.S. Treasury Bill,
0.000%, due 09/14/17, a U.S. Treasury Bond, 8.000%, due
11/15/21 and U.S. Treasury Notes, 1.125% to 2.125%, due
07/15/20 to 05/31/23. The aggregate market value of the
collateral, including accrued interest, was $2,058,605,007. |
|
| | 500,000,000 | | | | 1.110 | (d) | | | 09/07/17 | | | | 500,000,000 | |
| | Maturity Value: $501,402,915 | |
| | Settlement Date: 08/28/17 | |
| Collateralized by U.S. Treasury Bills, 0.000%, due 12/21/17 to
08/16/18, U.S. Treasury Bonds, 2.500% to 7.875%, due
02/15/21 to 05/15/47 and U.S. Treasury Notes, 0.750% to
3.375%, due 11/15/17 to 08/15/27. The aggregate market value
of the collateral, including accrued interest, was $510,000,902. |
|
| | |
| | BNP Paribas (Overnight MBS + 0.02%) | |
| | 500,000,000 | | | | 1.100 | (a)(d) | | | 09/01/17 | | | | 500,000,000 | |
| | Maturity Value: $508,784,735 | |
| | Settlement Date: 02/23/16 | |
| Collateralized by Federal Home Loan Mortgage Corp., 2.500% to
7.000%, due 09/01/20 to 08/01/47, Federal National Mortgage
Association, 2.500% to 7.500%, due 01/01/26 to 08/01/46,
Government National Mortgage Association, 4.000% to
4.500%, due 08/20/47, U.S. Treasury Bills, 0.000%, due
09/14/17 to 01/11/18, a U.S. Treasury Bond, 8.750%, due
08/15/20, a U.S. Treasury Inflation-Indexed Note, 0.625%, due
01/15/26 and U.S. Treasury Notes, 0.875% to 1.875%, due
10/15/18 to 07/15/20. The aggregate market value of the
collateral, including accrued interest, was $513,653,178. |
|
| | 550,000,000 | | | | 1.100 | (a)(d) | | | 09/01/17 | | | | 550,000,000 | |
| | Maturity Value: $559,545,569 | |
| | Settlement Date: 02/23/16 | |
| Collateralized by Federal Home Loan Mortgage Corp., 5.500%,
due 06/01/37, Federal National Mortgage Association, 2.625%
to 3.500%, due 09/06/24 to 10/01/42, Federal National
Mortgage Association Stripped Security, 0.000%, due 11/15/30,
Government National Mortgage Association, 3.000% to
6.000%, due 03/20/28 to 08/20/47, a U.S. Treasury Bond,
2.500%, due 05/15/46, a U.S. Treasury Inflation-Indexed Note,
0.125%, due 07/15/26 and a U.S. Treasury Note, 1.125%, due
08/31/21. The aggregate market value of the collateral,
including accrued interest, was $565,497,521. |
|
| | |
| Repurchase Agreements(c) – (continued) | |
| | Citibank N.A. | |
| $ | 1,000,000,000 | | | | 1.050 | % | | | 09/06/17 | | | $ | 1,000,000,000 | |
| | Maturity Value: $1,000,204,167 | |
| | Settlement Date: 08/30/17 | |
| Collateralized by Federal Farm Credit Bank, 2.140%, due
08/10/26, Federal Home Loan Mortgage Corp., 1.000% to
7.500%, due 09/29/17 to 10/01/43, Federal Home Loan
Mortgage Corp. Stripped Security, 0.000%, due 09/15/29,
Federal National Mortgage Association, 1.300% to 9.500%,
due 11/01/17 to 03/01/47, Government National Mortgage
Association, 3.000% to 9.500%, due 10/15/19 to 01/15/47,
Tennessee Valley Authority, 3.500% to 7.125%, due 05/01/30
to 04/01/56, U.S. Treasury Bills, 0.000%, due 11/09/17 to
05/24/18, U.S. Treasury Bonds, 2.500% to 8.750%, due
05/15/20 to 08/15/47, a U.S. Treasury Floating Rate Note,
1.193%, due 10/31/18, U.S. Treasury Inflation-Indexed Bonds,
0.750% to 2.000%, due 01/15/26 to 02/15/45, U.S. Treasury
Inflation-Indexed Notes, 0.125% to 1.875%, due 07/15/19 to
01/15/23 and U.S. Treasury Notes, 0.750% to 3.750%, due
10/31/17 to 05/15/27. The aggregate market value of the
collateral, including accrued interest, was $1,020,000,004. |
|
| | |
| | Citigroup Global Markets, Inc. | |
| | 159,100,000 | | | | 1.080 | | | | 09/01/17 | | | | 159,100,000 | |
| | Maturity Value: $159,104,773 | |
| Collateralized by U.S. Treasury Notes, 0.750% to 3.625%, due
02/28/18 to 07/31/23. The aggregate market value of the
collateral, including accrued interest, was $162,282,053. |
|
| | |
| | Credit Agricole Corporate and Investment Bank | |
| | 300,000,000 | | | | 1.030 | | | | 09/01/17 | | | | 300,000,000 | |
| | Maturity Value: $300,060,083 | |
| | Settlement Date: 08/25/17 | |
| Collateralized by U.S. Treasury Notes, 0.750% to 2.250%, due
04/30/18 to 08/15/25 and a U.S. Treasury Principal-Only
Stripped Security, 0.000%, due 11/15/41. The aggregate market
value of the collateral, including accrued interest, was
$306,000,086. |
|
| | 750,000,000 | | | | 1.070 | | | | 09/01/17 | | | | 750,000,000 | |
| | Maturity Value: $750,022,292 | |
| Collateralized by Federal Farm Credit Bank, 1.125% to 4.875%,
due 09/22/17 to 07/11/24, Federal Home Loan Bank, 0.000% to
4.750%, due 09/08/17 to 12/11/26, Federal Home Loan
Mortgage Corp., 1.300% to 6.750%, due 11/27/19 to 09/01/47,
Federal National Mortgage Association, 0.875% to 7.500%,
due 09/20/17 to 09/01/47, Government National Mortgage
Association, 3.000% to 7.000%, due 07/20/27 to 08/20/47, U.S.
Treasury Bills, 0.000%, due 10/26/17 to 02/15/18, U.S.
Treasury Bonds, 2.250% to 8.125%, due 08/15/21 to 05/15/47,
U.S. Treasury Inflation-Indexed Bonds, 0.625% to 3.625%, due
01/15/25 to 02/15/47, U.S. Treasury Inflation-Indexed Notes,
0.125% to 1.875%, due 01/15/18 to 01/15/27 and U.S. Treasury
Notes, 0.625% to 3.625%, due 09/15/17 to 11/15/25. The
aggregate market value of the collateral, including accrued
interest, was $770,196,758. |
|
| | |
| | |
| 18 | | The accompanying notes are an integral part of these financial statements. |
FINANCIAL SQUARE GOVERNMENT FUND
| | | | | | | | | | | | | | |
Principal Amount | | | Interest
Rate | | | Maturity
Date | | | Amortized Cost | |
| Repurchase Agreements(c) – (continued) | |
| | Deutsche Bank Securities, Inc. | |
| $ | 100,000,000 | | | | 1.070 | % | | | 09/01/17 | | | $ | 100,000,000 | |
| | Maturity Value: $100,002,972 | |
| Collateralized by a U.S. Treasury Interest-Only Stripped Security,
0.000%, due 05/15/27. The market value of the collateral,
including accrued interest, was $102,000,000. |
|
| | 200,000,000 | | | | 1.070 | | | | 09/01/17 | | | | 200,000,000 | |
| | Maturity Value: $200,005,944 | |
| Collateralized by U.S. Treasury Interest-Only Stripped Securities,
0.000%, due 02/15/27 to 05/15/27. The aggregate market value
of the collateral, including accrued interest, was $204,000,000. |
|
| | 250,000,000 | | | | 1.080 | | | | 09/01/17 | | | | 250,000,000 | |
| | Maturity Value: $250,007,500 | |
| Collateralized by U.S. Treasury Notes, 1.625% to 2.000%, due
03/31/19 to 11/30/22. The aggregate market value of the
collateral, including accrued interest, was $255,000,029. |
|
| | |
| | Federal Reserve Bank of New York | |
| | 9,600,000,000 | | | | 1.000 | | | | 09/01/17 | | | | 9,600,000,000 | |
| | Maturity Value: $9,600,266,667 | |
| Collateralized by U.S. Treasury Bonds, 2.750% to 4.625%, due
02/15/40 to 08/15/42 and U.S. Treasury Notes, 1.625% to
2.500%, due 02/15/23 to 05/15/26. The aggregate market value
of the collateral, including accrued interest, was
$9,600,266,708. |
|
| | |
| | Fixed Income Clearing Corp. | |
| | 49,000,000 | | | | 1.100 | | | | 09/01/17 | | | | 49,000,000 | |
| | Maturity Value: $49,001,497 | |
| Collateralized by a U.S. Treasury Bond, 3.750%, due 11/15/43
and U.S. Treasury Notes, 1.500% to 1.875%, due 07/15/20 to
10/31/22. The aggregate market value of the collateral,
including accrued interest, was $49,980,084. |
|
| | 2,450,000,000 | | | | 1.100 | | | | 09/01/17 | | | | 2,450,000,000 | |
| | Maturity Value: $2,450,074,861 | |
| Collateralized by a U.S. Treasury Bill, 0.000%, due 08/16/18 and
U.S. Treasury Notes, 1.125% to 2.875%, due 03/31/18 to
06/30/24. The aggregate market value of the collateral,
including accrued interest, was $2,499,000,048. |
|
| | |
| | HSBC Securities (USA), Inc. | |
| | 800,000,000 | | | | 1.050 | | | | 09/01/17 | | | | 800,000,000 | |
| | Maturity Value: $800,023,333 | |
| Collateralized by a U.S. Treasury Inflation-Indexed Bond,
2.500%, due 01/15/29 and U.S. Treasury Inflation-Indexed
Notes, 0.125% to 2.125%, due 04/15/18 to 07/15/27. The
aggregate market value of the collateral, including accrued
interest, was $816,003,172. |
|
| | 1,500,000,000 | | | | 1.060 | | | | 09/01/17 | | | | 1,500,000,000 | |
| | Maturity Value: $1,500,044,167 | |
| Collateralized by Federal National Mortgage Association, 3.000%
to 6.000%, due 12/01/22 to 08/01/47. The aggregate market
value of the collateral, including accrued interest, was
$1,530,003,867. |
|
| | |
| Repurchase Agreements(c) – (continued) | |
| | ING Financial Markets LLC | |
| 200,000,000 | | | | 1.040 | | | | 09/01/17 | | | | 200,000,000 | |
| | Maturity Value: $200,040,444 | |
| | Settlement Date: 08/25/17 | |
| Collateralized by Federal National Mortgage Association, 3.500%
to 4.500%, due 03/01/21 to 08/01/47. The aggregate market
value of the collateral, including accrued interest, was
$204,000,547. |
|
| | 300,000,000 | | | | 1.040 | | | | 09/01/17 | | | | 300,000,000 | |
| | Maturity Value: $300,060,667 | |
| | Settlement Date: 08/25/17 | |
| Collateralized by Federal National Mortgage Association, 3.000%
to 5.000%, due 10/01/28 to 11/01/46. The aggregate market
value of the collateral, including accrued interest, was
$306,001,939. |
|
| | 200,000,000 | | | | 1.060 | | | | 09/01/17 | | | | 200,000,000 | |
| | Maturity Value: $200,005,889 | |
| Collateralized by Federal National Mortgage Association, 2.000%
to 4.500%, due 07/01/31 to 05/01/47. The aggregate market
value of the collateral, including accrued interest, was
$204,000,496. |
|
| | 300,000,000 | | | | 1.060 | | | | 09/01/17 | | | | 300,000,000 | |
| | Maturity Value: $300,008,833 | |
| Collateralized by Federal National Mortgage Association, 3.000%
to 6.000%, due 01/01/26 to 04/01/47. The aggregate market
value of the collateral, including accrued interest, was
$306,001,985. |
|
| | 250,000,000 | | | | 1.030 | | | | 09/06/17 | | | | 250,000,000 | |
| | Maturity Value: $250,050,069 | |
| | Settlement Date: 08/30/17 | |
| Collateralized by Federal National Mortgage Association, 3.500%
to 6.500%, due 08/01/30 to 07/01/47. The aggregate market
value of the collateral, including accrued interest, was
$255,001,388. |
|
| | |
| | ING Financial Markets LLC (1 Mo. LIBOR – 0.11%) | |
| | 100,000,000 | | | | 1.119 | (a)(e) | | | 10/06/17 | | | | 100,000,000 | |
| | Maturity Value: $102,626,285 | |
| | Settlement Date: 07/09/15 | |
| Collateralized by Federal National Mortgage Association, 3.000%
to 3.500%, due 05/01/28 to 11/01/43. The aggregate market
value of the collateral, including accrued interest, was
$102,003,025. |
|
| | 500,000,000 | | | | 1.125 | (a)(e) | | | 10/20/17 | | | | 500,000,000 | |
| | Maturity Value: $513,718,750 | |
| | Settlement Date: 05/26/15 | |
| Collateralized by Federal Home Loan Mortgage Corp., 7.000%,
due 03/17/31 and Federal National Mortgage Association,
2.500% to 5.000%, due 12/01/25 to 07/01/47. The aggregate
market value of the collateral, including accrued interest, was
$510,003,154. |
|
| | 100,000,000 | | | | 1.124 | (a)(e) | | | 10/24/17 | | | | 100,000,000 | |
| | Maturity Value: $102,333,210 | |
| | Settlement Date: 10/08/15 | |
| Collateralized by Federal National Mortgage Association,
3.500%, due 06/01/26 to 09/01/46. The aggregate market value
of the collateral, including accrued interest, was $102,002,415. |
|
| | |
| | |
| The accompanying notes are an integral part of these financial statements. | | 19 |
FINANCIAL SQUARE GOVERNMENT FUND
Schedule of Investments (continued)
August 31, 2017
| | | | | | | | | | | | | | |
Principal Amount | | | Interest
Rate | | | Maturity
Date | | | Amortized Cost | |
| Repurchase Agreements(c) – (continued) | |
| | Joint Repurchase Agreement Account I | |
| $ | 4,920,500,000 | | | | 1.060 | % | | | 09/01/17 | | | $ | 4,920,500,000 | |
| | Maturity Value: $4,920,644,881 | |
| | |
| | Joint Repurchase Agreement Account III | |
| | 7,618,700,000 | | | | 1.076 | | | | 09/01/17 | | | | 7,618,700,000 | |
| | Maturity Value: $7,618,927,655 | |
| | |
| | Merrill Lynch, Pierce, Fenner & Smith, Inc. | |
| | 122,400,000 | | | | 1.080 | | | | 09/01/17 | | | | 122,400,000 | |
| | Maturity Value: $122,403,672 | |
| Collateralized by Federal Home Loan Mortgage Corp., 3.000% to
4.000%, due 08/01/32 to 06/01/47. The aggregate market value
of the collateral, including accrued interest, was $126,072,000. |
|
| | 693,800,000 | | | | 1.080 | | | | 09/01/17 | | | | 693,800,000 | |
| | Maturity Value: $693,820,814 | |
| Collateralized by Government National Mortgage Association,
3.500% to 4.000%, due 08/20/46 to 06/20/47. The aggregate
market value of the collateral, including accrued interest, was
$714,614,001. |
|
| | |
| | Merrill Lynch, Pierce, Fenner & Smith, Inc. (OBFR + 0.01%) | |
| | 1,000,000,000 | | | | 1.170 | (a)(e) | | | 12/04/17 | | | | 1,000,000,000 | |
| | Maturity Value: $1,013,065,000 | |
| | Settlement Date: 11/04/16 | |
| Collateralized by Federal Home Loan Bank, 0.000%, due
02/28/18, Federal National Mortgage Association, 0.000%, due
01/02/18 and Government National Mortgage Association,
1.500% to 10.000%, due 12/15/17 to 08/20/47. The aggregate
market value of the collateral, including accrued interest, was
$1,028,031,478. |
|
| | |
| | Metropolitan Life Insurance Co. | |
| | 75,000,000 | | | | 1.100 | | | | 09/01/17 | | | | 75,000,000 | |
| | Maturity Value: $75,002,292 | |
| Collateralized by a U.S. Treasury Note, 2.250%, due 11/15/25.
The market value of the collateral, including accrued interest,
was $76,526,498. |
|
| | |
| | Mitsubishi UFJ Securities (USA), Inc. | |
| | 300,000,000 | | | | 1.050 | | | | 09/01/17 | | | | 300,000,000 | |
| | Maturity Value: $300,008,750 | |
| Collateralized by Federal Home Loan Mortgage Corp., 2.500% to
5.750%, due 04/01/25 to 07/01/47, Federal National Mortgage
Association, 2.000% to 6.000%, due 06/01/22 to 09/01/47 and
Government National Mortgage Association, 2.000% to
7.500%, due 06/15/18 to 08/20/47. The aggregate market value
of the collateral, including accrued interest, was $308,999,994. |
|
| | |
| | Mizuho Securities USA Inc. | |
| | 10,478,553 | | | | 1.080 | | | | 09/01/17 | | | | 10,478,553 | |
| | Maturity Value: $10,478,867 | |
| Collateralized by a U.S. Treasury Note, 1.750%, due 05/15/23.
The market value of the collateral, including accrued interest,
was $10,688,124. |
|
| | 490,134,192 | | | | 1.080 | | | | 09/01/17 | | | | 490,134,192 | |
| | Maturity Value: $490,148,896 | |
| Collateralized by a U.S. Treasury Note, 2.750%, due 02/15/24.
The market value of the collateral, including accrued interest,
was $499,936,876. |
|
| | |
| Repurchase Agreements(c) – (continued) | |
| | Mizuho Securities USA Inc. – (continued) | |
| 499,387,255 | | | | 1.080 | | | | 09/01/17 | | | | 499,387,255 | |
| | Maturity Value: $499,402,237 | |
| Collateralized by a U.S. Treasury Note, 2.125%, due 11/30/23.
The market value of the collateral, including accrued interest,
was $509,375,000. |
|
| | 500,000,000 | | | | 1.080 | | | | 09/01/17 | | | | 500,000,000 | |
| | Maturity Value: $500,015,000 | |
| Collateralized by U.S. Treasury Bills, 0.000%, due 04/26/18 to
08/16/18, U.S. Treasury Bonds, 2.250% to 2.500%, due
02/15/45 to 08/15/46, U.S. Treasury Interest-Only Stripped
Securities, 0.000%, due 11/15/17 to 11/15/44, U.S. Treasury
Notes, 0.750% to 1.625%, due 07/15/19 to 08/15/26 and U.S.
Treasury Principal-Only Stripped Securities, 0.000%, due
05/15/18 to 11/15/44. The aggregate market value of the
collateral, including accrued interest, was $510,000,078. |
|
| | 250,000,000 | | | | 1.090 | | | | 09/01/17 | | | | 250,000,000 | |
| | Maturity Value: $250,007,569 | |
| Collateralized by Federal Home Loan Mortgage Corp., 4.000%,
due 11/01/46 to 08/01/47, Federal National Mortgage
Association, 0.000% to 4.500%, due 10/09/19 to 08/01/47 and
Government National Mortgage Association, 3.500% to
4.000%, due 09/20/46 to 07/20/47. The aggregate market value
of the collateral, including accrued interest, was $257,422,451. |
|
| | |
| | Nomura Securities International, Inc. | |
| | 800,000,000 | | | | 1.070 | | | | 09/01/17 | | | | 800,000,000 | |
| | Maturity Value: $800,023,778 | |
| Collateralized by Federal Home Loan Mortgage Corp., 2.500% to
9.500%, due 10/01/17 to 07/01/47, Federal National Mortgage
Association, 2.500% to 9.500%, due 09/01/17 to 09/01/47,
Government National Mortgage Association, 2.500% to
9.000%, due 11/15/17 to 08/15/47, a U.S. Treasury Inflation-
Indexed Note, 0.375%, due 07/15/27 and U.S. Treasury
Interest-Only Stripped Securities, 0.000%, due 02/15/18 to
08/15/31. The aggregate market value of the collateral,
including accrued interest, was $823,999,781. |
|
| | 1,200,000,000 | | | | 1.080 | | | | 09/01/17 | | | | 1,200,000,000 | |
| | Maturity Value: $1,200,036,000 | |
| Collateralized by Federal Home Loan Mortgage Corp., 3.500% to
4.000%, due 08/01/44 to 09/01/47, Federal National Mortgage
Association, 3.000% to 6.000%, due 10/01/35 to 09/01/47,
Government National Mortgage Association, 3.000% to
4.500%, due 02/15/42 to 08/20/47, U.S. Treasury Bonds,
2.500% to 3.125%, due 05/15/42 to 05/15/46, U.S. Treasury
Inflation-Indexed Bonds, 0.625% to 3.875%, due 04/15/29 to
02/15/47, U.S. Treasury Inflation-Indexed Notes, 0.125% to
0.375%, due 07/15/26 to 07/15/27, U.S. Treasury Interest-Only
Stripped Securities, 0.000%, due 05/15/19 to 11/15/46 and U.S.
Treasury Principal-Only Stripped Securities, 0.000%, due
02/15/43 to 05/15/47. The aggregate market value of the
collateral, including accrued interest, was $1,233,492,161. |
|
| | |
| | |
| 20 | | The accompanying notes are an integral part of these financial statements. |
FINANCIAL SQUARE GOVERNMENT FUND
| | | | | | | | | | | | | | |
Principal Amount | | | Interest
Rate | | | Maturity
Date | | | Amortized Cost | |
| Repurchase Agreements(c) – (continued) | |
| | Nomura Securities International, Inc. – (continued) | |
| $ | 2,000,000,000 | | | | 1.050 | % | | | 09/06/17 | | | $ | 2,000,000,000 | |
| | Maturity Value: $2,000,408,333 | |
| | Settlement Date: 08/30/17 | |
| Collateralized by Federal Home Loan Mortgage Corp., 2.500% to
6.500%, due 08/01/27 to 06/01/47, Federal National Mortgage
Association, 4.000% to 6.000%, due 10/01/40 to 03/01/43,
Government National Mortgage Association, 3.000% to
6.500%, due 11/15/36 to 08/15/47, Tennessee Valley Authority,
2.875%, due 02/01/27, U.S. Treasury Bonds, 2.750% to
3.625%, due 11/15/41 to 05/15/47, U.S. Treasury Inflation-
Indexed Bonds, 1.750% to 3.625%, due 01/15/27 to 02/15/40,
U.S. Treasury Inflation-Indexed Notes, 0.125% to 1.375%, due
04/15/18 to 07/15/27, U.S. Treasury Interest-Only Stripped
Securities, 0.000%, due 02/15/23 to 11/15/45, U.S. Treasury
Notes, 0.750% to 3.625%, due 07/31/18 to 01/31/24 and U.S.
Treasury Principal-Only Stripped Securities, 0.000%, due
05/15/44 to 11/15/46. The aggregate market value of the
collateral, including accrued interest, was $2,047,406,754. |
|
| | |
| | Norinchukin Bank | |
| | 210,000,000 | | | | 1.150 | (e) | | | 10/23/17 | | | | 210,000,000 | |
| | Maturity Value: $210,415,917 | |
| | Settlement Date: 08/22/17 | |
| Collateralized by a U.S. Treasury Inflation-Indexed Note, 0.375%,
due 01/15/27. The market value of the collateral, including
accrued interest, was $214,200,092. |
|
| | 210,000,000 | | | | 1.150 | (e) | | | 10/31/17 | | | | 210,000,000 | |
| | Maturity Value: $210,462,875 | |
| | Settlement Date: 08/23/17 | |
| Collateralized by a U.S. Treasury Inflation-Indexed Note, 0.375%,
due 01/15/27. The market value of the collateral, including
accrued interest, was $214,200,092. |
|
| | |
| | Prudential Insurance Company of America (The) | |
| | 44,906,250 | | | | 1.100 | | | | 09/01/17 | | | | 44,906,250 | |
| | Maturity Value: $44,907,622 | |
| Collateralized by a U.S. Treasury Interest-Only Stripped Security,
0.000%, due 05/15/36. The market value of the collateral,
including accrued interest, was $45,804,375. |
|
| | 61,050,000 | | | | 1.100 | | | | 09/01/17 | | | | 61,050,000 | |
| | Maturity Value: $61,051,865 | |
| Collateralized by a U.S. Treasury Bond, 2.875%, due 05/15/43.
The market value of the collateral, including accrued interest,
was $62,271,000. |
|
| | 70,218,750 | | | | 1.100 | | | | 09/01/17 | | | | 70,218,750 | |
| | Maturity Value: $70,220,896 | |
| Collateralized by a U.S. Treasury Bond, 2.500%, due 02/15/45.
The market value of the collateral, including accrued interest,
was $71,623,125. |
|
| | 158,250,000 | | | | 1.100 | | | | 09/01/17 | | | | 158,250,000 | |
| | Maturity Value: $158,254,835 | |
| Collateralized by a U.S. Treasury Principal-Only Stripped
Security, 0.000%, due 08/15/27. The market value of the
collateral, including accrued interest, was $161,415,000. |
|
| | 201,500,000 | | | | 1.100 | | | | 09/01/17 | | | | 201,500,000 | |
| | Maturity Value: $201,506,157 | |
| Collateralized by a U.S. Treasury Bond, 2.875%, due 08/15/45.
The market value of the collateral, including accrued interest,
was $205,530,000. |
|
| | |
| Repurchase Agreements(c) – (continued) | |
| | RBC Capital Markets LLC | |
| 600,000,000 | | | | 1.050 | %(d) | | | 09/07/17 | | | | 600,000,000 | |
| | Maturity Value: $601,032,501 | |
| | Settlement Date: 07/17/17 | |
| Collateralized by Federal Home Loan Mortgage Corp., 3.500% to
4.000%, due 03/01/46 to 09/01/47, Federal National Mortgage
Association, 2.500% to 4.000%, due 09/01/32 to 09/01/47 and
Government National Mortgage Association, 3.500%, due
08/20/47. The aggregate market value of the collateral,
including accrued interest, was $612,000,000. |
|
| | |
| | Royal Bank of Canada-New York Branch | |
| | 150,000,000 | | | | 1.050 | | | | 09/01/17 | | | | 150,000,000 | |
| | Maturity Value: $150,004,375 | |
| Collateralized by Federal National Mortgage Association, 3.000%
to 5.000%, due 11/01/25 to 06/01/47 and Government National
Mortgage Association, 4.000% to 4.500%, due 09/15/39 to
10/20/45. The aggregate market value of the collateral,
including accrued interest, was $152,999,997. |
|
| | 200,000,000 | | | | 1.080 | (d) | | | 09/07/17 | | | | 200,000,000 | |
| | Maturity Value: $200,378,000 | |
| | Settlement Date: 08/16/17 | |
| Collateralized by Federal National Mortgage Association, 3.500%
to 5.000%, due 11/01/34 to 06/01/47 and Government National
Mortgage Association, 4.000%, due 10/15/41. The aggregate
market value of the collateral, including accrued interest, was
$203,999,999. |
|
| | 500,000,000 | | | | 1.080 | (d) | | | 09/07/17 | | | | 500,000,000 | |
| | Maturity Value: $500,945,000 | |
| | Settlement Date: 08/15/17 | |
| Collateralized by Federal Home Loan Mortgage Corp., 2.500% to
4.500%, due 01/01/26 to 04/01/47, Federal National Mortgage
Association, 2.500% to 5.000%, due 03/01/31 to 06/01/47 and
Government National Mortgage Association, 4.000%, due
10/20/45 to 06/20/47. The aggregate market value of the
collateral, including accrued interest, was $510,000,002. |
|
| | 250,000,000 | | | | 1.090 | (d) | | | 09/07/17 | | | | 250,000,000 | |
| | Maturity Value: $250,476,875 | |
| | Settlement Date: 08/14/17 | |
| Collateralized by Federal Home Loan Mortgage Corp., 3.500% to
4.500%, due 06/01/46 to 06/01/47, Federal National Mortgage
Association, 2.500% to 5.000%, due 04/01/31 to 01/01/47 and
Government National Mortgage Association, 4.500%, due
12/15/40. The aggregate market value of the collateral,
including accrued interest, was $255,000,000. |
|
| | 500,000,000 | | | | 1.090 | (d) | | | 09/07/17 | | | | 500,000,000 | |
| | Maturity Value: $500,968,890 | |
| | Settlement Date: 08/21/17 | |
| Collateralized by Federal Home Loan Mortgage Corp., 2.500% to
6.500%, due 11/01/25 to 09/01/46, Federal National Mortgage
Association, 2.500% to 5.000%, due 04/01/26 to 06/01/47 and
Government National Mortgage Association, 3.500% to
4.500%, due 02/20/40 to 07/20/47. The aggregate market value
of the collateral, including accrued interest, was $509,999,999. |
|
| | |
| | |
| The accompanying notes are an integral part of these financial statements. | | 21 |
FINANCIAL SQUARE GOVERNMENT FUND
Schedule of Investments (continued)
August 31, 2017
| | | | | | | | | | | | | | |
Principal Amount | | | Interest
Rate | | | Maturity
Date | | | Amortized Cost | |
| Repurchase Agreements(c) – (continued) | |
| | Royal Bank of Canada-New York Branch – (continued) | |
| $ | 500,000,000 | | | | 1.090 | %(d) | | | 09/07/17 | | | $ | 500,000,000 | |
| | Maturity Value: $500,953,751 | |
| | Settlement Date: 08/17/17 | |
| Collateralized by Federal Home Loan Mortgage Corp., 2.500% to
5.000%, due 11/01/27 to 05/01/47, Federal National Mortgage
Association, 2.500% to 5.000%, due 10/01/25 to 06/01/47 and
Government National Mortgage Association, 3.500% to
4.500%, due 12/15/40 to 07/20/47. The aggregate market value
of the collateral, including accrued interest, was $509,999,997. |
|
| | 500,000,000 | | | | 1.090 | (d) | | | 09/07/17 | | | | 500,000,000 | |
| | Maturity Value: $500,968,890 | |
| | Settlement Date: 08/17/17 | |
| Collateralized by Federal National Mortgage Association, 3.000%
to 4.000%, due 03/01/31 to 03/01/47 and Government National
Mortgage Association, 4.000%, due 10/20/45. The aggregate
market value of the collateral, including accrued interest, was
$510,000,000. |
|
| | 500,000,000 | | | | 1.090 | (d) | | | 09/07/17 | | | | 500,000,000 | |
| | Maturity Value: $500,953,751 | |
| | Settlement Date: 08/21/17 | |
| Collateralized by Government National Mortgage Association,
4.000%, due 10/20/45 to 06/20/47. The aggregate market value
of the collateral, including accrued interest, was $510,000,001. |
|
| | |
| | Societe Generale (OBFR – 0.09%) | |
| | 200,000,000 | | | | 1.070 | (a) | | | 09/07/17 | | | | 200,000,000 | |
| | Maturity Value: $200,790,611 | |
| | Settlement Date: 05/03/17 | |
| Collateralized by Government National Mortgage Association,
3.500%, due 04/20/46, U.S. Treasury Bonds, 2.500% to
3.625%, due 08/15/43 to 11/15/45 and a U.S. Treasury Note,
1.500%, due 08/15/20. The aggregate market value of the
collateral, including accrued interest, was $204,228,722. |
|
| | |
| | Societe Generale (OBFR – 0.10%) | |
| | 600,000,000 | | | | 1.060 | (a) | | | 09/07/17 | | | | 600,000,000 | |
| | Maturity Value: $605,847,658 | |
| | Settlement Date: 10/18/16 | |
| Collateralized by U.S. Treasury Bills, 0.000%, due 09/21/17 to
03/01/18, U.S. Treasury Bonds, 2.500% to 6.125%, due
08/15/29 to 05/15/47, U.S. Treasury Inflation-Indexed Bonds,
0.875% to 1.000%, due 02/15/46 to 02/15/47, U.S. Treasury
Inflation-Indexed Notes, 0.125% to 0.375%, due 04/15/18 to
07/15/27, U.S. Treasury Interest-Only Stripped Securities,
0.000%, due 05/15/23 to 05/15/37 and U.S. Treasury Notes,
0.750% to 3.500%, due 09/30/17 to 08/15/27. The aggregate
market value of the collateral, including accrued interest, was
$612,000,070. |
|
| | |
| Repurchase Agreements(c) – (continued) | |
| | Wells Fargo Securities LLC | |
| 500,000,000 | | | | 1.070 | % | | | 09/01/17 | | | | 500,000,000 | |
| | Maturity Value: $500,014,861 | |
| Collateralized by Federal Home Loan Mortgage Corp., 4.000%,
due 04/01/47 and Federal National Mortgage Association,
3.000% to 5.000%, due 08/01/32 to 05/01/47. The aggregate
market value of the collateral, including accrued interest, was
$515,000,001. |
|
| | |
| | TOTAL REPURCHASE AGREEMENTS | | | $ | 51,207,625,000 | |
| | |
| | TOTAL INVESTMENTS – 100.2% | | | $ | 88,647,611,320 | |
| | |
| LIABILITIES IN EXCESS OF OTHER
ASSETS – (0.2)% |
| | | (136,674,991 | ) |
| | |
| | NET ASSETS – 100.0% | | | $ | 88,510,936,329 | |
| | |
| | |
| The percentage shown for each investment category reflects the value of investments in that category as a percentage of net assets. |
(a) | | Variable or floating rate security. Interest rate disclosed is that which is in effect at August 31, 2017. |
(b) | | All or a portion represents a forward commitment. |
(c) | | Unless noted, all repurchase agreements were entered into on August 31, 2017. Additional information on Joint Repurchase Agreement Accounts I and III appear on pages 38 and 39. |
(d) | | The instrument is subject to a demand feature. |
(e) | | Security has been determined to be illiquid by the Investment Adviser. At August 31, 2017, these securities amounted to $2,120,000,000 or approximately 2.4% of net assets, and are unaudited. |
|
| Interest rates represent either the stated coupon rate, annualized yield on date of purchase for discounted securities, or, for floating rate securities, the current reset rate, which is based upon current interest rate indices. |
|
| Maturity dates represent either the final legal maturity date on the security, the demand date for puttable securities, or the prerefunded date for those types of securities. |
| | |
| | |
|
Investment Abbreviations: |
LIBOR | | —London Interbank Offered Rate |
MBS | | —Mortgage-Backed Securities |
MMY | | —Money Market Yield |
OBFR | | —Overnight Bank Funding Rate |
Prime | | —Federal Reserve Bank Prime Loan Rate U.S. |
T-Bill | | —Treasury Bill |
|
| | |
| 22 | | The accompanying notes are an integral part of these financial statements. |
FINANCIAL SQUARE MONEY MARKET FUND
Schedule of Investments
August 31, 2017
| | | | | | | | | | | | | | |
Principal Amount | | | Interest
Rate | | | Maturity
Date | | | Value | |
| | | | | | | | | | | | | | |
| Commercial Paper and Corporate Obligations – 24.7% | |
| | Albion Capital LLC | |
| $ | 35,000,000 | | | | 1.245 | % | | | 09/01/17 | | | $ | 34,998,860 | |
| | Alpine Securitization Ltd. | |
| | 10,000,000 | | | | 1.360 | | | | 11/07/17 | | | | 9,975,388 | |
| | Barton Capital S.A. | |
| | 26,900,000 | | | | 1.255 | | | | 09/06/17 | | | | 26,894,176 | |
| | 7,000,000 | | | | 1.350 | | | | 10/03/17 | | | | 6,991,524 | |
| | 7,000,000 | | | | 1.370 | | | | 10/03/17 | | | | 6,991,523 | |
| | CAFCO LLC | |
| | 50,000,000 | | | | 1.329 | | | | 09/21/17 | | | | 49,965,058 | |
| | CHARTA LLC | |
| | 50,000,000 | | | | 1.329 | | | | 09/21/17 | | | | 49,963,192 | |
| | CRC Funding LLC | |
| | 20,000,000 | | | | 1.350 | | | | 12/06/17 | | | | 19,927,951 | |
| | DBS Bank Ltd. | |
| | 10,000,000 | | | | 1.319 | | | | 09/19/17 | | | | 9,993,429 | |
| | 500,000 | | | | 1.287 | | | | 09/20/17 | | | | 499,654 | |
| | DNB Bank ASA | |
| | 40,000,000 | | | | 1.193 | | | | 09/05/17 | | | | 39,993,578 | |
| | First Abu Dhabi Bank | |
| | 60,000,000 | | | | 1.276 | | | | 09/06/17 | | | | 59,989,110 | |
| | Kells Funding LLC | |
| | 13,000,000 | | | | 1.329 | | | | 10/30/17 | | | | 12,972,700 | |
| | Liberty Street Funding LLC | |
| | 10,000,000 | | | | 1.268 | | | | 09/12/17 | | | | 9,995,913 | |
| | LMA-Americas LLC | |
| | 20,000,000 | | | | 1.392 | | | | 12/21/17 | | | | 19,914,320 | |
| | Matchpoint Finance PLC | |
| | 50,000,000 | | | | 1.204 | | | | 09/01/17 | | | | 49,998,205 | |
| | 15,000,000 | | | | 1.412 | | | | 11/21/17 | | | | 14,951,928 | |
| | Metlife Short Term Funding LLC | |
| | 20,000,000 | | | | 1.435 | | | | 03/01/18 | | | | 19,856,018 | |
| | N.V. Bank Nederlandse Gemeenten | |
| | 25,000,000 | | | | 1.214 | | | | 09/01/17 | | | | 24,999,158 | |
| | Nieuw Amsterdam Receivables Corp. | |
| | 15,000,000 | | | | 1.398 | | | | 01/17/18 | | | | 14,916,484 | |
| | Nordea Bank AB | |
| | 10,000,000 | | | | 1.223 | | | | 10/24/17 | | | | 9,981,910 | |
| | Northwestern Memorial Healthcare | |
| | 10,000,000 | | | | 1.297 | | | | 10/18/17 | | | | 9,980,373 | |
| | NRW Bank | |
| | 25,000,000 | | | | 1.329 | | | | 10/05/17 | | | | 24,969,545 | |
| | Salt River Project Agricultural Improvement and Power District | |
| | 15,000,000 | | | | 1.339 | | | | 11/14/17 | | | | 14,962,909 | |
| | SSM Health Care Corp. | |
| | 9,000,000 | | | | 1.350 | | | | 09/27/17 | | | | 8,989,949 | |
| | Svenska Handelsbanken AB | |
| | 7,500,000 | | | | 1.249 | | | | 10/25/17 | | | | 7,486,158 | |
| | 10,000,000 | | | | 1.436 | | | | 02/16/18 | | | | 9,935,264 | |
| | The State of the Netherlands | |
| | 25,000,000 | | | | 1.214 | | | | 09/01/17 | | | | 24,999,249 | |
| | Victory Receivables Corp. | |
| | 37,663,000 | | | | 1.349 | | | | 09/19/17 | | | | 37,638,451 | |
| | |
| TOTAL COMMERCIAL PAPER AND
CORPORATE OBLIGATIONS
(Cost $632,751,693) |
| | $ | 632,731,977 | |
| | |
| | | | | | | | | | | | | | |
| Certificate of Deposit – 1.9% | |
| | State Street Bank and Trust Co. | |
| $ | 50,000,000 | | | | 1.300 | % | | | 10/23/17 | | | $ | 49,998,653 | |
| | (Cost $50,000,000) | | | | | |
| | |
| | |
| Certificates of Deposit-Eurodollar – 2.3% | |
| | ABN Amro Bank N.V. | |
| $ | 50,000,000 | | | | 1.283 | % | | | 09/05/17 | | | $ | 49,991,599 | |
| | Sumitomo Mitsui Trust Bank Ltd. | |
| | 10,000,000 | | | | 1.480 | | | | 12/18/17 | | | | 10,003,016 | |
| | |
| TOTAL CERTIFICATES OF
DEPOSIT-EURODOLLAR
(Cost $59,993,179) |
| | $ | 59,994,615 | |
| | |
| | |
| Certificates of Deposit-Yankeedollar – 9.8% | |
| | Banco Del Estado De Chile | |
| $ | 20,000,000 | | | | 1.310 | % | | | 10/06/17 | | | $ | 20,001,134 | |
| | 13,000,000 | | | | 1.480 | | | | 01/19/18 | | | | 13,004,028 | |
| | Bank of Tokyo-Mitsubishi UFJ Ltd. (The) | |
| | 10,000,000 | | | | 1.410 | | | | 10/06/17 | | | | 10,001,867 | |
| | BNP Paribas | |
| | 13,000,000 | | | | 1.450 | | | | 02/01/18 | | | | 13,002,267 | |
| | DZ Bank AG | |
| | 3,000,000 | | | | 1.380 | | | | 10/20/17 | | | | 3,000,401 | |
| | 15,000,000 | | | | 1.330 | | | | 12/01/17 | | | | 15,000,938 | |
| | National Bank of Kuwait | |
| | 21,000,000 | | | | 1.500 | | | | 10/03/17 | | | | 21,003,461 | |
| | Natixis | |
| | 50,000,000 | | | | 1.170 | | | | 09/05/17 | | | | 49,999,930 | |
| | Oversea-Chinese Banking Corp., Ltd. | |
| | 40,000,000 | | | | 1.500 | | | | 04/19/18 | | | | 40,006,449 | |
| | Sumitomo Mitsui Trust Bank Ltd. | |
| | 40,000,000 | | | | 1.180 | | | | 09/05/17 | | | | 40,000,016 | |
| | Toronto-Dominion Bank (The) | |
| | 25,000,000 | | | | 1.600 | | | | 08/22/18 | | | | 25,006,170 | |
| | |
| TOTAL CERTIFICATES OF
DEPOSIT-YANKEEDOLLAR
(Cost $250,000,048) |
| | $ | 250,026,661 | |
| | |
| | |
| Fixed Rate Municipal Debt Obligations – 2.5% | |
| | Bank of America N.A. | |
| $ | 10,000,000 | | | | 1.650 | % | | | 03/26/18 | | | $ | 10,006,010 | |
| | Bank of Tokyo-Mitsubishi UFJ Ltd. (The) | |
| | 10,800,000 | | | | 1.450 | (a) | | | 09/08/17 | | | | 10,798,974 | |
| | Commonwealth Bank of Australia | |
| | 4,000,000 | | | | 1.400 | | | | 09/08/17 | | | | 4,000,021 | |
| | Cooperatieve Rabobank U.A. | |
| | 11,100,000 | | | | 1.700 | | | | 03/19/18 | | | | 11,116,213 | |
| | Credit Suisse AG | |
| | 6,000,000 | | | | 1.750 | | | | 01/29/18 | | | | 6,003,705 | |
| | Swedbank AB | |
| | 11,500,000 | | | | 2.125 | (a) | | | 09/29/17 | | | | 11,506,377 | |
| | |
| | |
| The accompanying notes are an integral part of these financial statements. | | 23 |
FINANCIAL SQUARE MONEY MARKET FUND
Schedule of Investments (continued)
August 31, 2017
| | | | | | | | | | | | | | |
Principal Amount | | | Interest
Rate | | | Maturity
Date | | | Value | |
| | | | | | | | | | | | | | |
| Fixed Rate Municipal Debt Obligations – (continued) | |
| | Wells Fargo Bank N.A. | |
| $ | 10,580,000 | | | | 1.650 | % | | | 01/22/18 | | | $ | 10,586,745 | |
| | |
| TOTAL FIXED RATE MUNICIPAL
DEBT OBLIGATIONS
(Cost $64,015,927) |
| | $ | 64,018,045 | |
| | |
| | |
| Time Deposits – 14.6% | |
| | Abbey National Treasury Services PLC | |
| $ | 60,000,000 | | | | 1.080 | % | | | 09/01/17 | | | $ | 60,001,068 | |
| | Australia & New Zealand Banking Group Ltd. | |
| | 35,000,000 | | | | 1.180 | | | | 09/06/17 | | | | 35,004,264 | |
| | Credit Industriel et Commercial | |
| | 50,000,000 | | | | 1.200 | | | | 09/06/17 | | | | 50,006,257 | |
| | National Bank of Kuwait | |
| | 70,000,000 | | | | 1.120 | | | | 09/01/17 | | | | 70,000,000 | |
| | Nordea Bank AB | |
| | 48,000,000 | | | | 1.080 | | | | 09/01/17 | | | | 48,000,000 | |
| | Skandinaviska Enskilda Banken AB | |
| | 50,000,000 | | | | 1.080 | | | | 09/01/17 | | | | 50,000,000 | |
| | Swedbank AB | |
| | 60,000,000 | | | | 1.170 | | | | 09/05/17 | | | | 60,006,008 | |
| | |
| TOTAL TIME DEPOSITS
(Cost $373,000,000) |
| | $ | 373,017,597 | |
| | |
| | | | | | | | | | | | | | |
| Variable Rate Municipal Debt Obligations(b) – 8.1% | |
| BlackRock Municipal Bond Trust VRDN RB Putters Series 2012-
T0014 (JPMorgan Chase Bank N.A., LIQ)(a) |
|
| $ | 66,500,000 | | | | 1.260 | % | | | 09/01/17 | | | $ | 66,500,000 | |
| BlackRock MuniVest Fund II, Inc. VRDN RB Putters
Series 2012-T0005 (JPMorgan Chase Bank N.A., LIQ)(a) |
|
| | 4,950,000 | | | | 1.260 | | | | 09/01/17 | | | | 4,950,000 | |
| BlackRock MuniVest Fund, Inc. VRDN RB Putters Series 2012-
T0007 (JPMorgan Chase Bank N.A., LIQ) |
|
| | 29,110,000 | | | | 1.260 | | | | 09/01/17 | | | | 29,110,000 | |
| City of Portland, Maine GO VRDN for Taxable Pension Bonds
Series 2001 RMKT (Sumitomo Mitsui Banking Corp., SPA) |
|
| | 65,400,000 | | | | 1.240 | | | | 09/07/17 | | | | 65,400,000 | |
| Los Angeles Department of Water & Power Waterworks VRDN
RB Refunding Series 2001 Subseries B-4 RMKT (Citibank
N.A., SPA) |
|
| | 150,000 | | | | 0.710 | | | | 09/07/17 | | | | 150,000 | |
| Montgomery County, Tennessee IDB VRDN RB for Hankook
Tire Manufacturing LP Project Series 2015 A (Kookmin Bank,
LOC) |
|
| | 40,000,000 | | | | 1.400 | | | | 09/07/17 | | | | 40,000,000 | |
| | Ohio State University VRDN RB Series 2001 | |
| | 180,000 | | | | 0.760 | | | | 09/07/17 | | | | 180,000 | |
| | |
| TOTAL VARIABLE RATE MUNICIPAL
DEBT OBLIGATIONS
(Cost $206,289,998) |
| | $ | 206,290,000 | |
| | |
| | | | | | | | | | | | | | |
| Variable Rate Obligations(c) – 32.6% | |
| | Abbey National Treasury Services PLC (1 Mo. LIBOR + 0.18%) | |
| $ | 10,000,000 | | | | 1.411 | % | | | 12/04/17 | | | $ | 10,003,257 | |
| | Abbey National Treasury Services PLC (1 Mo. LIBOR + 0.23%) | |
| | 7,000,000 | | | | 1.461 | | | | 09/19/17 | | | | 7,001,042 | |
| Australia & New Zealand Banking Group Ltd.
(1 Mo. LIBOR + 0.15%) |
|
| | 25,000,000 | | | | 1.381 | (a) | | | 07/19/18 | | | | 24,997,685 | |
| Australia & New Zealand Banking Group Ltd.
(1 Mo. LIBOR + 0.09%) |
|
| | 25,000,000 | | | | 1.318 | (a) | | | 01/18/18 | | | | 25,000,406 | |
| | Bank of Montreal (1 Mo. LIBOR + 0.54%) | |
| | 7,500,000 | | | | 1.769 | | | | 01/11/18 | | | | 7,511,833 | |
| | Bank of Montreal (1 Mo. LIBOR + 0.32%) | |
| | 10,000,000 | | | | 1.554 | | | | 03/27/18 | | | | 10,009,716 | |
| | Bank of Montreal (1 Mo. LIBOR + 0.22%) | |
| | 8,500,000 | | | | 1.449 | | | | 01/08/18 | | | | 8,503,414 | |
| | Bank of Nova Scotia (The) (1 Mo. LIBOR + 0.46%) | |
| | 35,000,000 | | | | 1.689 | (a) | | | 02/09/18 | | | | 35,050,759 | |
| | Bank of Nova Scotia (The) (3 Mo. LIBOR + 0.16%) | |
| | 8,000,000 | | | | 1.381 | | | | 03/09/18 | | | | 8,003,866 | |
| | Bank of Nova Scotia (The) (1 Mo. LIBOR + 0.23%) | |
| | 10,000,000 | | | | 1.458 | | | | 09/17/18 | | | | 9,990,090 | |
| | Bedford Row Funding Corp. (3 Mo. LIBOR + 0.19%) | |
| | 9,000,000 | | | | 1.440 | (a) | | | 03/16/18 | | | | 9,006,323 | |
| | Bedford Row Funding Corp. (3 Mo. LIBOR + 0.15%) | |
| | 14,000,000 | | | | 1.454 | (a) | | | 04/13/18 | | | | 14,006,936 | |
| | Bedford Row Funding Corp. (3 Mo. LIBOR + 0.41%) | |
| | 13,000,000 | | | | 1.714 | (a) | | | 10/12/17 | | | | 13,007,560 | |
| | BNZ International Funding Ltd. (1 Mo. LIBOR + 0.10%) | |
| | 15,000,000 | | | | 1.331 | (a) | | | 10/19/17 | | | | 15,002,204 | |
| | Canadian Imperial Bank of Commerce (1 Mo. LIBOR + 0.53%) | |
| | 6,400,000 | | | | 1.761 | (a) | | | 01/19/18 | | | | 6,411,281 | |
| | Canadian Imperial Bank of Commerce (1 Mo. LIBOR + 0.23%) | |
| | 27,000,000 | | | | 1.466 | | | | 09/21/18 | | | | 26,994,141 | |
| | Collateralized Commercial Paper Co., LLC (3 Mo. LIBOR + 0.20%) | |
| | 8,500,000 | | | | 1.428 | | | | 12/12/17 | | | | 8,504,897 | |
| | Collateralized Commercial Paper Co., LLC (1 Mo. LIBOR + 0.16%) | |
| | 8,000,000 | | | | 1.394 | | | | 10/26/17 | | | | 8,001,971 | |
| Collateralized Commercial Paper II Co., LLC
(1 Mo. LIBOR + 0.60%) |
|
| | 20,000,000 | | | | 1.836 | (a) | | | 01/24/18 | | | | 20,039,885 | |
| Collateralized Commercial Paper II Co., LLC
(3 Mo. LIBOR + 0.50%) |
|
| | 750,000 | | | | 1.804 | (a) | | | 10/13/17 | | | | 750,371 | |
| Collateralized Commercial Paper II Co., LLC
(3 Mo. LIBOR + 0.45%) |
|
| | 7,000,000 | | | | 1.764 | (a) | | | 10/25/17 | | | | 7,005,667 | |
| | Commonwealth Bank of Australia (1 Mo. LIBOR + 0.18%) | |
| | 22,000,000 | | | | 1.414 | (a) | | | 08/23/18 | | | | 21,998,917 | |
| | Commonwealth Bank of Australia (1 Mo. LIBOR + 0.23%) | |
| | 15,000,000 | | | | 1.462 | | | | 06/01/18 | | | | 14,988,746 | |
| | Commonwealth Bank of Australia (1 Mo. LIBOR + 0.37%) | |
| | 8,963,000 | | | | 1.606 | (a) | | | 02/23/18 | | | | 8,975,134 | |
| | Commonwealth Bank of Australia (1 Mo. LIBOR + 0.34%) | |
| | 3,000,000 | | | | 1.572 | (a) | | | 03/01/18 | | | | 3,003,734 | |
| | Dexia Credit Local (1 Mo. LIBOR + 0.37%) | |
| | 15,000,000 | | | | 1.601 | | | | 04/04/18 | | | | 15,018,508 | |
| | Dexia Credit Local (1 Mo. LIBOR + 0.48%) | |
| | 10,000,000 | | | | 1.714 | | | | 01/29/18 | | | | 10,015,555 | |
| | Dexia Credit Local (1 Mo. LIBOR + 0.38%) | |
| | 5,000,000 | | | | 1.611 | | | | 12/07/17 | | | | 5,004,271 | |
| | |
| | |
| 24 | | The accompanying notes are an integral part of these financial statements. |
FINANCIAL SQUARE MONEY MARKET FUND
| | | | | | | | | | | | | | |
Principal Amount | | | Interest
Rate | | | Maturity
Date | | | Value | |
| | | | | | | | | | | | | | |
| Variable Rate Obligations(c) – (continued) | |
| | Erste Abwicklungsanstalt (1 Mo. LIBOR + 0.06%) | |
| $ | 20,000,000 | | | | 1.294 | %(a) | | | 09/25/17 | | | $ | 20,001,489 | |
| | Erste Abwicklungsanstalt (1 Mo. LIBOR + 0.22%)(a) | |
| | 6,000,000 | | | | 1.451 | | | | 09/07/17 | | | | 6,000,338 | |
| | 9,000,000 | | | | 1.454 | | | | 10/27/17 | | | | 9,003,139 | |
| | Erste Abwicklungsanstalt (1 Mo. LIBOR + 0.19%) | |
| | 8,000,000 | | | | 1.418 | (a) | | | 09/18/17 | | | | 8,000,967 | |
| | HSBC Bank PLC (1 Mo. LIBOR + 0.46%) | |
| | 8,000,000 | | | | 1.692 | (a) | | | 11/01/17 | | | | 8,006,209 | |
| | HSBC Bank PLC (1 Mo. LIBOR + 0.41%) | |
| | 20,000,000 | | | | 1.641 | (a) | | | 11/10/17 | | | | 20,015,136 | |
| | Mitsubishi UFJ Trust and Banking Corp. (1 Mo. LIBOR + 0.30%) | |
| | 10,000,000 | | | | 1.531 | | | | 10/05/17 | | | | 10,003,199 | |
| | Mitsubishi UFJ Trust and Banking Corp. (1 Mo. LIBOR + 0.19%) | |
| | 15,000,000 | | | | 1.426 | | | | 03/01/18 | | | | 14,992,530 | |
| | Mizuho Bank Ltd. (1 Mo. LIBOR + 0.28%) | |
| | 8,000,000 | | | | 1.509 | | | | 10/12/17 | | | | 8,002,774 | |
| | Mizuho Bank Ltd. (1 Mo. LIBOR + 0.29%) | |
| | 14,000,000 | | | | 1.521 | | | | 10/10/17 | | | | 14,004,901 | |
| | National Australia Bank Ltd. (3 Mo. LIBOR + 0.34%) | |
| | 7,500,000 | | | | 1.563 | (a) | | | 12/06/17 | | | | 7,507,153 | |
| | National Australia Bank Ltd. (1 Mo. LIBOR + 0.30%) | |
| | 30,000,000 | | | | 1.536 | (a) | | | 03/23/18 | | | | 30,029,629 | |
| | Norinchukin Bank (The) (1 Mo. LIBOR + 0.23%) | |
| | 10,000,000 | | | | 1.464 | | | | 10/27/17 | | | | 10,003,645 | |
| | 9,324,000 | | | | 1.462 | | | | 11/02/17 | | | | 9,327,616 | |
| | Norinchukin Bank (The) (1 Mo. LIBOR + 0.18%) | |
| | 20,000,000 | | | | 1.409 | | | | 01/11/18 | | | | 20,003,202 | |
| | Oversea-Chinese Banking Corp., Ltd. (1 Mo. LIBOR + 0.14%) | |
| | 20,000,000 | | | | 1.371 | (a) | | | 11/06/17 | | | | 20,004,478 | |
| | Oversea-Chinese Banking Corp., Ltd. (3 Mo. LIBOR + 0.33%) | |
| | 9,500,000 | | | | 1.645 | (a) | | | 11/15/17 | | | | 9,507,608 | |
| | Royal Bank of Canada (1 Mo. LIBOR + 0.24%) | |
| | 15,000,000 | | | | 1.471 | | | | 04/19/18 | | | | 15,007,234 | |
| | Royal Bank of Canada (1 Mo. LIBOR + 0.21%) | |
| | 10,000,000 | | | | 1.439 | | | | 08/09/18 | | | | 9,999,865 | |
| | Standard Chartered Bank (1 Mo. LIBOR + 0.40%) | |
| | 25,000,000 | | | | 1.631 | | | | 01/19/18 | | | | 25,024,150 | |
| | Standard Chartered Bank (1 Mo. LIBOR + 0.65%) | |
| | 17,000,000 | | | | 1.884 | | | | 10/27/17 | | | | 17,017,406 | |
| | Sumitomo Mitsui Banking Corp. (1 Mo. LIBOR + 0.18%) | |
| | 27,000,000 | | | | 1.414 | | | | 03/02/18 | | | | 26,997,903 | |
| | Sumitomo Mitsui Banking Corp. (1 Mo. LIBOR + 0.33%) | |
| | 16,000,000 | | | | 1.557 | | | | 09/15/17 | | | | 16,002,239 | |
| | Sumitomo Mitsui Trust Bank Ltd. (1 Mo. LIBOR + 0.25%) | |
| | 10,000,000 | | | | 1.484 | | | | 10/27/17 | | | | 10,003,171 | |
| | Sumitomo Mitsui Trust Bank Ltd. (1 Mo. LIBOR + 0.18%) | |
| | 10,000,000 | | | | 1.408 | | | | 01/18/18 | | | | 10,001,396 | |
| | Sumitomo Mitsui Trust Bank Ltd. (1 Mo. LIBOR + 0.30%) | |
| | 15,000,000 | | | | 1.534 | | | | 09/25/17 | | | | 15,002,911 | |
| | Toronto-Dominion Bank (The) (3 Mo. LIBOR + 0.32%) | |
| | 8,000,000 | | | | 1.624 | | | | 01/17/18 | | | | 8,009,609 | |
| | Toronto-Dominion Bank (The) (1 Mo. LIBOR + 0.44%) | |
| | 15,000,000 | | | | 1.672 | | | | 11/02/17 | | | | 15,011,181 | |
| | Wells Fargo Bank N.A. (1 Mo. LIBOR + 0.23%) | |
| | 10,000,000 | | | | 1.461 | | | | 08/20/18 | | | | 10,001,617 | |
| | Wells Fargo Bank N.A. (3 Mo. LIBOR + 0.15%) | |
| | 10,000,000 | | | | 1.446 | | | | 04/03/18 | | | | 10,005,313 | |
| | |
| | | | | | | | | | | | | | |
| Variable Rate Obligations(c) – (continued) | |
| | Wells Fargo Bank N.A. (3 Mo. LIBOR + 0.32%) | |
| 14,500,000 | | | | 1.637 | | | | 01/26/18 | | | | 14,517,680 | |
| | Wells Fargo Bank N.A. (1 Mo. LIBOR + 0.19%) | |
| | 6,000,000 | | | | 1.421 | | | | 06/11/18 | | | | 6,000,499 | |
| | Westpac Banking Corp. (1 Mo. LIBOR + 0.19%) | |
| | 29,605,000 | | | | 1.424 | (a) | | | 08/20/18 | | | | 29,608,124 | |
| | Westpac Banking Corp. (1 Mo. LIBOR + 0.47%) | |
| | 11,000,000 | | | | 1.704 | (a) | | | 01/26/18 | | | | 11,016,362 | |
| | Westpac Securities NZ Ltd. (1 Mo. LIBOR + 0.39%) | |
| | 7,000,000 | | | | 1.622 | (a) | | | 11/02/17 | | | | 7,004,533 | |
| | |
| TOTAL VARIABLE RATE OBLIGATIONS
(Cost $834,047,038) |
| | $ | 834,453,375 | |
| | |
| TOTAL INVESTMENTS BEFORE
REPURCHASE AGREEMENTS
(Cost $2,470,097,883) |
| | $ | 2,470,530,923 | |
| | |
| | | | | | |
| Repurchase Agreements(d) – 3.5% | |
| | BNP Paribas (OBFR + 0.20%) | |
| $ | 50,000,000 | | | | 1.360 | %(c) | | | 09/07/17 | | | $ | 50,000,386 | |
| | Maturity Value: $50,328,667 | |
| | Settlement Date: 03/24/17 | |
| Collateralized by various asset-backed obligations, 1.270% to
3.010%, due 05/15/19 to 05/15/23, various corporate security
issuers, 2.950% to 12.000%, due 04/01/19 to perpetual
maturity, various mortgage-backed obligations, 3.834% to
6.034%, due 11/25/23 to 05/25/28, and various sovereign debt
security issuers, 6.250% to 10.125%, due 04/22/19 to 05/15/27.
The aggregate market value of the collateral, including accrued
interest, was $55,344,997. |
|
| | |
| | Credit Suisse Securities (USA) LLC (1 Mo. LIBOR + 0.50%) | |
| | 30,000,000 | | | | 1.739 | (c)(e) | | | 10/05/17 | | | | 29,999,250 | |
| | Maturity Value: $30,243,445 | |
| | Settlement Date: 04/27/17 | |
| Collateralized by various corporate security issuers, 6.375% to
9.875%, due 10/15/20 to 06/15/23. The aggregate market value
of the collateral, including accrued interest, was $33,003,448. |
|
| | |
| | Mizuho Securities USA Inc. (3 Mo. LIBOR + 0.95%) | |
| | 9,000,000 | | | | 2.262 | (c)(e) | | | 11/29/17 | | | | 9,000,331 | |
| | Maturity Value: $9,119,883 | |
| | Settlement Date: 05/08/17 | |
| Collateralized by various corporate security issuers, 1.407% to
12.000%, due 10/30/17 to 08/21/46. The aggregate market
value of the collateral, including accrued interest, was
$9,563,107. |
|
| | |
| TOTAL REPURCHASE AGREEMENTS
(Cost $89,000,000) |
| | $ | 88,999,967 | |
| | |
| TOTAL INVESTMENTS – 100.0%
(Cost $2,559,097,883) |
| | $ | 2,559,530,890 | |
| | |
| OTHER ASSETS IN EXCESS OF
LIABILITIES – 0.0% |
| | | 14,174 | |
| | |
| | NET ASSETS – 100.0% | | | $ | 2,559,545,064 | |
| | |
| | |
| The accompanying notes are an integral part of these financial statements. | | 25 |
FINANCIAL SQUARE MONEY MARKET FUND
Schedule of Investments (continued)
August 31, 2017
| | |
| The percentage shown for each investment category reflects the value of investments in that category as a percentage of net assets. |
(a) | | Security not registered under the Securities Act of 1933, as amended. Such securities have been determined to be liquid by the Investment Adviser. At August 31, 2017, these securities amounted to $483,717,378 or approximately 18.9% of net assets. |
(b) | | Rate shown is that which is in effect on August 31, 2017. Certain variable rate securities are not based on a published reference rate and spread but are determined by the issuer or agent and are based on current market conditions. |
(c) | | Variable or floating rate security. Interest rate disclosed is that which is in effect at August 31, 2017. |
(d) | | Unless noted, all repurchase agreements were entered into on August 31, 2017. |
(e) | | Security has been determined to be illiquid by the Investment Adviser. At August 31, 2017, these securities amounted to $38,999,581 or approximately 1.5% of net assets, and are unaudited. |
|
| Interest rates represent either the stated coupon rate, annualized yield on date of purchase for discounted securities, or, for floating rate securities, the current reset rate, which is based upon current interest rate indices. |
|
| Maturity dates represent either the final legal maturity date on the security, the demand date for puttable securities, or the prerefunded date for those types of securities. |
| | |
|
Investment Abbreviations: |
GO | | — General Obligation |
IDB | | — Industrial Development Board |
LIBOR | | — London Interbank Offered Rate |
LIQ | | — Liquidity Agreement |
LOC | | — Letter of Credit |
LP | | — Limited Partnership |
OBFR | | — Overnight Bank Funding Rate |
RB | | — Revenue Bond |
RMKT | | — Remarketed |
SPA | | — Stand-by Purchase Agreement |
VRDN | | — Variable Rate Demand Notes |
|
| | |
| 26 | | The accompanying notes are an integral part of these financial statements. |
FINANCIAL SQUARE PRIME OBLIGATIONS FUND
Schedule of Investments
August 31, 2017
| | | | | | | | | | | | | | |
Principal
Amount | | | Interest
Rate | | | Maturity
Date | | | Value | |
| Commercial Paper and Corporate Obligations – 22.9% | |
| | Albion Capital LLC | |
| $ | 20,000,000 | | | | 1.318 | % | | | 09/26/17 | | | $ | 19,982,594 | |
| | Alpine Securitization Ltd. | | | | | |
| | 10,000,000 | | | | 1.370 | | | | 10/25/17 | | | | 9,980,368 | |
| | 10,000,000 | | | | 1.381 | | | | 12/08/17 | | | | 9,962,738 | |
| | Bank of China (Hong Kong) | | | | | |
| | 5,000,000 | | | | 1.585 | | | | 09/19/17 | | | | 4,996,189 | |
| | Barton Capital S.A. | | | | | | | | | |
| | 7,000,000 | | | | 1.350 | | | | 10/03/17 | | | | 6,991,524 | |
| | 7,000,000 | | | | 1.370 | | | | 10/03/17 | | | | 6,991,523 | |
| | CRC Funding LLC | | | | | | | | | |
| | 10,000,000 | | | | 1.350 | | | | 12/06/17 | | | | 9,963,975 | |
| | 6,000,000 | | | | 1.466 | | | | 01/10/18 | | | | 5,969,728 | |
| | DNB Bank ASA | | | | | | | | | |
| | 20,000,000 | | | | 1.193 | | | | 09/05/17 | | | | 19,996,789 | |
| | First Abu Dhabi Bank | | | | | | | | | |
| | 30,000,000 | | | | 1.276 | | | | 09/06/17 | | | | 29,994,555 | |
| | Kells Funding LLC | | | | | | | | | |
| | 22,000,000 | | | | 1.345 | | | | 11/06/17 | | | | 21,947,919 | |
| | LMA-Americas LLC | | | | | | | | | |
| | 10,000,000 | | | | 1.392 | | | | 12/21/17 | | | | 9,957,160 | |
| | Matchpoint Finance PLC | | | | | | | | | |
| | 25,000,000 | | | | 1.204 | | | | 09/01/17 | | | | 24,999,103 | |
| | 10,000,000 | | | | 1.381 | | | | 10/02/17 | | | | 9,988,071 | |
| | 7,000,000 | | | | 1.412 | | | | 11/20/17 | | | | 6,977,871 | |
| | 10,000,000 | | | | 1.412 | | | | 11/21/17 | | | | 9,967,952 | |
| | Metlife Short Term Funding LLC | |
| | 15,000,000 | | | | 1.435 | | | | 03/01/18 | | | | 14,892,013 | |
| | N.V. Bank Nederlandse Gemeenten | |
| | 40,000,000 | | | | 1.214 | | | | 09/01/17 | | | | 39,998,652 | |
| | Nieuw Amsterdam Receivables Corp. | | | | | |
| | 11,000,000 | | | | 1.391 | | | | 11/10/17 | | | | 10,971,190 | |
| | 7,000,000 | | | | 1.398 | | | | 01/17/18 | | | | 6,961,026 | |
| | Old Line Funding Corp. | | | | | |
| | 7,000,000 | | | | 1.329 | | | | 10/30/17 | | | | 6,984,950 | |
| | Regency Markets No. 1 LLC | | | | | |
| | 16,000,000 | | | | 1.255 | | | | 09/26/17 | | | | 15,985,532 | |
| | Salt River Project Agricultural Improvement and Power District | |
| | 5,000,000 | | | | 1.339 | | | | 11/14/17 | | | | 4,987,636 | |
| | Societe Generale | |
| | 7,500,000 | | | | 1.475 | | | | 01/31/18 | | | | 7,454,993 | |
| | Svenska Handelsbanken AB | |
| | 5,000,000 | | | | 1.436 | | | | 02/16/18 | | | | 4,967,632 | |
| | The State of the Netherlands | |
| | 10,000,000 | | | | 1.214 | | | | 09/01/17 | | | | 9,999,699 | |
| | Victory Receivables Corp. | |
| | 10,000,000 | | | | 1.350 | | | | 10/03/17 | | | | 9,988,423 | |
| | |
| TOTAL COMMERCIAL PAPER AND
CORPORATE OBLIGATIONS |
| | | | |
| | (Cost $341,867,449) | | | $ | 341,859,805 | |
| | |
| | | | | | | | | | | | | | |
| Certificates of Deposit – 2.0% | |
| | State Street Bank and Trust Co. | |
| $ | 25,000,000 | | | | 1.300 | % | | | 10/23/17 | | | $ | 24,999,327 | |
| | Wells Fargo Bank N.A. | |
| | 4,500,000 | | | | 1.550 | | | | 01/18/18 | | | | 4,504,258 | |
| | |
| | TOTAL CERTIFICATES OF DEPOSIT | |
| | (Cost $29,500,000) | | | $ | 29,503,585 | |
| | |
| | | | | | | | | | | | | | |
| Certificates of Deposit-Yankeedollar – 10.5% | |
| | Banco Del Estado De Chile | |
| $ | 5,000,000 | | | | 1.310 | % | | | 10/06/17 | | | $ | 5,000,284 | |
| | Bank of Tokyo-Mitsubishi UFJ Ltd. (The) | |
| | 12,500,000 | | | | 1.520 | | | | 10/30/17 | | | | 12,505,643 | |
| | BNP Paribas | | | | | | | | | | | | | |
| | 10,000,000 | | | | 1.450 | | | | 02/01/18 | | | | 10,001,744 | |
| | Citibank N.A. | | | | | | | | | | | | | |
| | 10,000,000 | | | | 1.420 | | | | 12/14/17 | | | | 10,002,083 | |
| | DZ Bank AG | | | | | | | | | | | | | |
| | 4,600,000 | | | | 1.380 | | | | 10/20/17 | | | | 4,600,614 | |
| | 10,000,000 | | | | 1.400 | | | | 02/28/18 | | | | 9,999,443 | |
| | National Bank of Kuwait | |
| | 25,000,000 | | | | 1.500 | | | | 10/03/17 | | | | 25,004,120 | |
| | 5,000,000 | | | | 1.550 | | | | 11/22/17 | | | | 5,001,722 | |
| | Natixis | | | | | | | | | | | | | |
| | 25,000,000 | | | | 1.170 | | | | 09/05/17 | | | | 24,999,965 | |
| | Oversea-Chinese Banking Corp., Ltd. | |
| | 10,000,000 | | | | 1.500 | | | | 04/19/18 | | | | 10,001,612 | |
| | Sumitomo Mitsui Trust Bank Ltd. | |
| | 20,000,000 | | | | 1.180 | | | | 09/05/17 | | | | 20,000,008 | |
| | Toronto-Dominion Bank (The) | |
| | 7,300,000 | | | | 1.320 | | | | 12/04/17 | | | | 7,300,253 | |
| | 13,000,000 | | | | 1.600 | | | | 08/22/18 | | | | 13,003,208 | |
| | |
| TOTAL CERTIFICATES OF
DEPOSIT-YANKEEDOLLAR |
| | | | |
| | (Cost $157,402,719) | | | $ | 157,420,699 | |
| | |
| | | | | | | | | | | | | | |
| Fixed Rate Municipal Debt Obligations – 1.7% | |
| | Commonwealth Bank of Australia | |
| $ | 4,000,000 | | | | 1.400 | % | | | 09/08/17 | | | $ | 4,000,021 | |
| | Cooperatieve Rabobank U.A. | |
| | 7,000,000 | | | | 1.700 | | | | 03/19/18 | | | | 7,010,225 | |
| | Skandinaviska Enskilda Banken AB | |
| | 5,000,000 | | | | 1.750 | (a) | | | 03/19/18 | | | | 5,004,167 | |
| | Swedbank AB | | | | | | | | | | | | | |
| | 4,422,000 | | | | 1.750 | (a) | | | 03/12/18 | | | | 4,427,054 | |
| | Wells Fargo Bank N.A. | |
| | 4,500,000 | | | | 1.650 | | | | 01/22/18 | | | | 4,502,869 | |
| | |
| TOTAL FIXED RATE MUNICIPAL
DEBT OBLIGATIONS |
| | | | |
| | (Cost $24,937,556) | | | $ | 24,944,336 | |
| | |
| | |
| The accompanying notes are an integral part of these financial statements. | | 27 |
FINANCIAL SQUARE PRIME OBLIGATIONS FUND
Schedule of Investments (continued)
August 31, 2017
| | | | | | | | | | | | | | |
| Principal Amount | | | Interest
Rate | | | Maturity
Date | | | Value | |
| Time Deposits – 16.4% | |
| | Abbey National Treasury Services PLC | |
| $ | 40,000,000 | | | | 1.080 | % | | | 09/01/17 | | | $ | 40,000,712 | |
| | Australia & New Zealand Banking Group Ltd. | |
| | 15,000,000 | | | | 1.180 | | | | 09/06/17 | | | | 15,001,828 | |
| | DNB Bank ASA | | | | | | | | | | | | | |
| | 40,000,000 | | | | 1.080 | | | | 09/01/17 | | | | 40,000,000 | |
| | National Bank of Kuwait | |
| | 30,000,000 | | | | 1.120 | | | | 09/01/17 | | | | 30,000,000 | |
| | Nordea Bank AB | |
| | 39,900,000 | | | | 1.080 | | | | 09/01/17 | | | | 39,900,000 | |
| | Skandinaviska Enskilda Banken AB | |
| | 40,000,000 | | | | 1.080 | | | | 09/01/17 | | | | 40,000,000 | |
| | Swedbank AB | | | | | | | | | | | | | |
| | 40,000,000 | | | | 1.170 | | | | 09/05/17 | | | | 40,004,005 | |
| | |
| | TOTAL TIME DEPOSITS | | | | | |
| | (Cost $244,900,000) | | | $ | 244,906,545 | |
| | |
| | | | | | | | | | | | | | |
| U.S. Government Agency Obligations – 0.6% | |
| Overseas Private Investment Corp. (USA) (3 Mo. U.S. T-Bill
Factor + 0.00%) |
|
| $ | 8,802,228 | | | | 1.100 | %(b) | | | 09/20/17 | | | $ | 8,802,228 | |
| | (Cost $8,802,228) | | | | | |
| | |
| | | | | | | | | | | | | | |
| Variable Rate Municipal Debt Obligations(c) – 9.6% | |
| BlackRock Municipal Bond Trust VRDN RB Putters Series 2012-
T0014 (JPMorgan Chase Bank N.A., LIQ)(a) |
|
| $ | 7,000,000 | | | | 1.260 | % | | | 09/01/17 | | | $ | 7,000,000 | |
| BlackRock MuniVest Fund II, Inc. VRDN RB Putters
Series 2012-T0005 (JPMorgan Chase Bank N.A., LIQ)(a) |
|
| | 5,000,000 | | | | 1.260 | | | | 09/01/17 | | | | 5,000,000 | |
| BlackRock MuniVest Fund, Inc. VRDN RB Putters Series 2012-
T0007 (JPMorgan Chase Bank N.A., LIQ) |
|
| | 30,000,000 | | | | 1.260 | | | | 09/01/17 | | | | 30,000,000 | |
| City of Portland, Maine GO VRDN for Taxable Pension Bonds
Series 2001 RMKT (Sumitomo Mitsui Banking Corp., SPA) |
|
| | 19,300,000 | | | | 1.240 | | | | 09/07/17 | | | | 19,300,000 | |
| Montgomery County, Tennessee IDB VRDN RB for Hankook
Tire Manufacturing LP Project Series 2016 A (Kookmin Bank,
LOC)(a) |
|
| | 26,650,000 | | | | 1.400 | | | | 09/07/17 | | | | 26,650,000 | |
| Providence St. Joseph Health Obligated Group VRDN RB
Series 2012-E (U.S. Bank N.A., SBPA) |
|
| | 30,900,000 | | | | 1.230 | | | | 09/07/17 | | | | 30,900,000 | |
| Triborough Bridge & Tunnel Authority VRDN Refunding
Floating RB Series 2013 Subseries 2B RMKT (Bank of
America N.A., LOC) |
|
| | 24,695,000 | | | | 1.180 | | | | 09/07/17 | | | | 24,695,000 | |
| | |
| TOTAL VARIABLE RATE MUNICIPAL
DEBT OBLIGATIONS |
| | | | |
| | (Cost $143,545,000) | | | $ | 143,545,000 | |
| | |
| Variable Rate Obligations(b) – 34.6% | |
| | Abbey National Treasury Services PLC (1 Mo. LIBOR + 0.18%) | |
| $ | 4,500,000 | | | | 1.411 | % | | | 12/04/17 | | | $ | 4,501,466 | |
| Australia & New Zealand Banking Group Ltd.
(1 Mo. LIBOR + 0.15%) |
|
| | 10,000,000 | | | | 1.381 | (a) | | | 07/19/18 | | | | 9,999,074 | |
| Australia & New Zealand Banking Group Ltd.
(1 Mo. LIBOR + 0.09%) |
|
| | 10,000,000 | | | | 1.318 | (a) | | | 01/18/18 | | | | 10,000,162 | |
| | Banco Del Estado De Chile (1 Mo. LIBOR + 0.22%) | |
| | 11,000,000 | | | | 1.451 | | | | 10/20/17 | | | | 11,003,501 | |
| | Bank of Montreal (1 Mo. LIBOR + 0.54%) | |
| | 4,000,000 | | | | 1.769 | | | | 01/11/18 | | | | 4,006,311 | |
| | Bank of Montreal (1 Mo. LIBOR + 0.19%) | |
| | 20,000,000 | | | | 1.421 | | | | 05/04/18 | | | | 20,002,940 | |
| | Bank of Nova Scotia (The) (1 Mo. LIBOR + 0.23%) | |
| | 15,000,000 | | | | 1.458 | | | | 09/17/18 | | | | 14,985,134 | |
| | Bank of Nova Scotia (The) (3 Mo. LIBOR + 0.43%) | |
| | 4,000,000 | | | | 1.732 | | | | 10/06/17 | | | | 4,002,101 | |
| | Bank of Nova Scotia (The) (3 Mo. LIBOR + 0.16%) | |
| | 4,500,000 | | | | 1.381 | | | | 03/09/18 | | | | 4,502,175 | |
| | Bedford Row Funding Corp. (3 Mo. LIBOR + 0.15%) | |
| | 7,000,000 | | | | 1.454 | (a) | | | 04/13/18 | | | | 7,003,468 | |
| | Bedford Row Funding Corp. (1 Mo. LIBOR + 0.15%) | |
| | 8,000,000 | | | | 1.381 | (a) | | | 02/20/18 | | | | 8,000,363 | |
| | Bedford Row Funding Corp. (3 Mo. LIBOR + 0.41%) | |
| | 5,000,000 | | | | 1.714 | (a) | | | 10/12/17 | | | | 5,002,908 | |
| | Canadian Imperial Bank of Commerce (1 Mo. LIBOR + 0.53%) | |
| | 3,600,000 | | | | 1.761 | (a) | | | 01/19/18 | | | | 3,606,346 | |
| | Canadian Imperial Bank of Commerce (1 Mo. LIBOR + 0.23%) | |
| | 15,000,000 | | | | 1.466 | | | | 09/21/18 | | | | 14,996,745 | |
| | Collateralized Commercial Paper Co., LLC (1 Mo. LIBOR + 0.16%) | |
| | 4,000,000 | | | | 1.394 | | | | 10/26/17 | | | | 4,000,986 | |
| Collateralized Commercial Paper II Co., LLC
(3 Mo. LIBOR + 0.18%) |
|
| | 13,000,000 | | | | 1.483 | (a) | | | 07/06/18 | | | | 13,000,755 | |
| Collateralized Commercial Paper II Co., LLC
(3 Mo. LIBOR + 0.45%) |
|
| | 2,000,000 | | | | 1.764 | (a) | | | 10/25/17 | | | | 2,001,619 | |
| Collateralized Commercial Paper II Co., LLC
(1 Mo. LIBOR + 0.60%)(a) |
|
| | 4,500,000 | | | | 1.828 | | | | 01/17/18 | | | | 4,508,577 | |
| | 12,000,000 | | | | 1.836 | | | | 01/24/18 | | | | 12,023,931 | |
| | Commonwealth Bank of Australia (1 Mo. LIBOR + 0.18%) | |
| | 10,000,000 | | | | 1.414 | (a) | | | 08/23/18 | | | | 9,999,507 | |
| | Commonwealth Bank of Australia (3 Mo. LIBOR + 0.11%) | |
| | 13,000,000 | | | | 1.427 | (a) | | | 04/27/18 | | | | 13,006,775 | |
| | Commonwealth Bank of Australia (3 Mo. LIBOR + 0.12%) | |
| | 10,000,000 | | | | 1.433 | (a) | | | 04/23/18 | | | | 10,005,841 | |
| | Credit Suisse AG (1 Mo. LIBOR + 0.21%) | |
| | 10,000,000 | | | | 1.439 | | | | 01/08/18 | | | | 10,001,060 | |
| | Dexia Credit Local (1 Mo. LIBOR + 0.38%) | |
| | 3,000,000 | | | | 1.611 | | | | 12/07/17 | | | | 3,002,563 | |
| | Dexia Credit Local (1 Mo. LIBOR + 0.37%) | |
| | 5,000,000 | | | | 1.601 | | | | 04/04/18 | | | | 5,006,169 | |
| | Dexia Credit Local (1 Mo. LIBOR + 0.48%) | |
| | 6,000,000 | | | | 1.714 | | | | 01/29/18 | | | | 6,009,333 | |
| | |
| | |
| 28 | | The accompanying notes are an integral part of these financial statements. |
FINANCIAL SQUARE PRIME OBLIGATIONS FUND
| | | | | | | | | | | | | | |
Principal
Amount | | | Interest
Rate | | | Maturity
Date | | | Value | |
| Variable Rate Obligations(b) – (continued) | |
| | Dexia Credit Local (1 Mo. LIBOR + 0.41%) | |
| $ | 4,000,000 | | | | 1.645 | % | | | 11/22/17 | | | $ | 4,003,382 | |
| | Erste Abwicklungsanstalt (1 Mo. LIBOR + 0.06%) | |
| | 10,000,000 | | | | 1.294 | (a) | | | 09/25/17 | | | | 10,000,745 | |
| | Erste Abwicklungsanstalt (1 Mo. LIBOR + 0.19%) | |
| | 8,500,000 | | | | 1.418 | (a) | | | 09/18/17 | | | | 8,501,028 | |
| | Erste Abwicklungsanstalt (1 Mo. LIBOR + 0.22%)(a) | |
| | 3,000,000 | | | | 1.451 | | | | 09/07/17 | | | | 3,000,169 | |
| | 4,500,000 | | | | 1.454 | | | | 10/27/17 | | | | 4,501,569 | |
| | Fairway Finance Co., LLC (1 Mo. LIBOR + 0.15%) | |
| | 5,000,000 | | | | 1.379 | (a) | | | 10/11/17 | | | | 5,000,989 | |
| | HSBC Bank PLC (1 Mo. LIBOR + 0.41%) | |
| | 10,000,000 | | | | 1.641 | (a) | | | 11/10/17 | | | | 10,007,568 | |
| | HSBC Bank PLC (1 Mo. LIBOR + 0.46%) | |
| | 6,000,000 | | | | 1.692 | (a) | | | 11/01/17 | | | | 6,004,656 | |
| | Mitsubishi UFJ Trust and Banking Corp. (1 Mo. LIBOR + 0.19%) | |
| | 10,000,000 | | | | 1.426 | | | | 03/01/18 | | | | 9,995,020 | |
| | Mitsubishi UFJ Trust and Banking Corp. (1 Mo. LIBOR + 0.30%) | |
| | 4,000,000 | | | | 1.531 | | | | 10/05/17 | | | | 4,001,280 | |
| | Mizuho Bank Ltd. (1 Mo. LIBOR + 0.28%) | |
| | 7,000,000 | | | | 1.509 | | | | 10/12/17 | | | | 7,002,427 | |
| | Mizuho Bank Ltd. (1 Mo. LIBOR + 0.40%) | |
| | 4,000,000 | | | | 1.632 | | | | 09/01/17 | | | | 4,000,053 | |
| | National Australia Bank Ltd. (1 Mo. LIBOR + 0.30%) | |
| | 8,000,000 | | | | 1.532 | (a) | | | 04/03/18 | | | | 8,008,186 | |
| | National Australia Bank Ltd. (3 Mo. LIBOR + 0.34%) | |
| | 4,500,000 | | | | 1.563 | (a) | | | 12/06/17 | | | | 4,504,292 | |
| | Norinchukin Bank (The) (1 Mo. LIBOR + 0.18%) | |
| | 11,000,000 | | | | 1.409 | | | | 01/11/18 | | | | 11,001,761 | |
| | Norinchukin Bank (The) (1 Mo. LIBOR + 0.23%) | |
| | 8,000,000 | | | | 1.464 | | | | 10/27/17 | | | | 8,002,916 | |
| | Oversea-Chinese Banking Corp., Ltd. (3 Mo. LIBOR + 0.18%) | |
| | 6,000,000 | | | | 1.479 | (a) | | | 04/03/18 | | | | 6,003,546 | |
| | Oversea-Chinese Banking Corp., Ltd. (1 Mo. LIBOR + 0.14%) | |
| | 11,000,000 | | | | 1.371 | (a) | | | 11/06/17 | | | | 11,002,463 | |
| | Oversea-Chinese Banking Corp., Ltd. (3 Mo. LIBOR + 0.33%) | |
| | 4,000,000 | | | | 1.645 | (a) | | | 11/15/17 | | | | 4,003,203 | |
| | Oversea-Chinese Banking Corp., Ltd. (1 Mo. LIBOR + 0.20%) | |
| | 8,000,000 | | | | 1.429 | (a) | | | 09/11/17 | | | | 8,000,641 | |
| | Royal Bank of Canada (1 Mo. LIBOR + 0.21%) | |
| | 5,000,000 | | | | 1.439 | | | | 08/09/18 | | | | 4,999,932 | |
| | Royal Bank of Canada (1 Mo. LIBOR + 0.24%) | |
| | 8,000,000 | | | | 1.471 | | | | 04/19/18 | | | | 8,003,858 | |
| | Standard Chartered Bank (1 Mo. LIBOR + 0.40%) | |
| | 5,000,000 | | | | 1.629 | | | | 01/11/18 | | | | 5,004,647 | |
| | 10,000,000 | | | | 1.631 | | | | 01/19/18 | | | | 10,009,660 | |
| | Standard Chartered Bank (1 Mo. LIBOR + 0.65%) | |
| | 13,000,000 | | | | 1.884 | | | | 10/27/17 | | | | 13,013,311 | |
| | Sumitomo Mitsui Banking Corp. (1 Mo. LIBOR + 0.27%) | |
| | 6,000,000 | | | | 1.501 | | | | 10/06/17 | | | | 6,001,506 | |
| | Sumitomo Mitsui Banking Corp. (1 Mo. LIBOR + 0.18%) | |
| | 16,000,000 | | | | 1.414 | | | | 03/02/18 | | | | 15,998,757 | |
| | Sumitomo Mitsui Trust Bank Ltd. (1 Mo. LIBOR + 0.25%) | |
| | 5,000,000 | | | | 1.484 | | | | 10/27/17 | | | | 5,001,586 | |
| | Sumitomo Mitsui Trust Bank Ltd. (1 Mo. LIBOR + 0.14%) | |
| | 10,000,000 | | | | 1.369 | | | | 09/08/17 | | | | 10,000,347 | |
| | |
| Variable Rate Obligations(b) – (continued) | |
| | Sumitomo Mitsui Trust Bank Ltd. (1 Mo. LIBOR + 0.18%) | |
| $ | 5,000,000 | | | | 1.408 | % | �� | | 01/18/18 | | | $ | 5,000,698 | |
| | Sumitomo Mitsui Trust Bank Ltd. (1 Mo. LIBOR + 0.30%) | |
| | 4,500,000 | | | | 1.534 | | | | 09/25/17 | | | | 4,500,873 | |
| | Toronto-Dominion Bank (The) (1 Mo. LIBOR + 0.44%) | |
| | 7,000,000 | | | | 1.672 | | | | 11/02/17 | | | | 7,005,218 | |
| | Toronto-Dominion Bank (The) (3 Mo. LIBOR + 0.32%) | |
| | 5,000,000 | | | | 1.624 | | | | 01/17/18 | | | | 5,006,006 | |
| | Wells Fargo Bank N.A. (1 Mo. LIBOR + 0.23%) | |
| | 5,000,000 | | | | 1.461 | | | | 08/20/18 | | | | 5,000,809 | |
| | Wells Fargo Bank N.A. (3 Mo. LIBOR + 0.15%) | |
| | 6,000,000 | | | | 1.446 | | | | 04/03/18 | | | | 6,003,188 | |
| | Wells Fargo Bank N.A. (3 Mo. LIBOR + 0.32%) | |
| | 9,000,000 | | | | 1.637 | | | | 01/26/18 | | | | 9,010,973 | |
| | Westpac Banking Corp. (1 Mo. LIBOR + 0.47%) | |
| | 7,000,000 | | | | 1.704 | (a) | | | 01/26/18 | | | | 7,010,412 | |
| | Westpac Banking Corp. (1 Mo. LIBOR + 0.15%) | |
| | 10,000,000 | | | | 1.379 | (a) | | | 07/13/18 | | | | 9,997,343 | |
| | Westpac Securities NZ Ltd. (1 Mo. LIBOR + 0.15%) | |
| | 29,000,000 | | | | 1.381 | (a) | | | 02/20/18 | | | | 29,004,650 | |
| | |
| TOTAL VARIABLE RATE
OBLIGATIONS |
| | | | |
| | (Cost $516,100,550) | | | $ | 516,299,478 | |
| | |
| TOTAL INVESTMENTS BEFORE
REPURCHASE AGREEMENTS |
| | | | |
| | (Cost $1,467,055,502) | | | $ | 1,467,281,676 | |
| | |
| | | | | | | | | | | | | | |
| Repurchase Agreements(b)(d) – 1.7% | |
| | BNP Paribas (OBFR + 0.20%) | |
| $ | 20,000,000 | | | | 1.360 | % | | | 09/07/17 | | | $ | 20,000,154 | |
| | Maturity Value: $20,131,467 | |
| | Settlement Date: 03/24/17 | | | | | | | | | |
| Collateralized by various corporate security issuers, 0.000% to
8.125%, due 07/16/20 to 05/15/37 and a sovereign debt security
issuer, 10.125%, due 05/15/27. The aggregate market value of
the collateral, including accrued interest, was $21,952,547. |
|
| | |
| | Mizuho Securities USA Inc. (3 Mo. LIBOR + 0.95%) | |
| | 5,000,000 | | | | 2.262 | (e) | | | 11/29/17 | | | | 5,000,184 | |
| | Maturity Value: $5,066,602 | |
| | Settlement Date: 05/08/17 | |
| Collateralized by various corporate security issuers, 1.407% to
12.000%, due 05/03/18 to 05/15/46. The aggregate market
value of the collateral, including accrued interest, was
$5,305,255. |
|
| | |
| | TOTAL REPURCHASE AGREEMENTS | | | | | |
| | (Cost $25,000,000) | | | $ | 25,000,338 | |
| | |
| | TOTAL INVESTMENTS – 100.0% | | | | | |
| | (Cost $1,492,055,502) | | | $ | 1,492,282,014 | |
| | |
| LIABILITIES IN EXCESS OF
OTHER ASSETS – (0.0)% |
| | | (423,265 | ) |
| | |
| | NET ASSETS – 100.0% | | | $ | 1,491,858,749 | |
| | |
| | |
| The accompanying notes are an integral part of these financial statements. | | 29 |
FINANCIAL SQUARE PRIME OBLIGATIONS FUND
Schedule of Investments (continued)
August 31, 2017
| | |
| The percentage shown for each investment category reflects the value of investments in that category as a percentage of net assets. |
(a) | | Security not registered under the Securities Act of 1933, as amended. Such securities have been determined to be liquid by the Investment Adviser. At August 31, 2017, these securities amounted to $290,792,007 or approximately 19.5% of net assets. |
(b) | | Variable or floating rate security. Interest rate disclosed is that which is in effect at August 31, 2017. |
(c) | | Rate shown is that which is in effect on August 31, 2017. Certain variable rate securities are not based on a published reference rate and spread but are determined by the issuer or agent and are based on current market conditions. |
(d) | | Unless noted, all repurchase agreements were entered into on August 31, 2017. |
(e) | | Security has been determined to be illiquid by the Investment Adviser. At August 31, 2017, these securities amounted to $5,000,184 or approximately 0.3% of net assets, and are unaudited. |
Interest rates represent either the stated coupon rate, annualized yield on date of purchase for discounted securities, or, for floating rate securities, the current reset rate, which is based upon current interest rate indices.
Maturity dates represent either the final legal maturity date on the security, the demand date for puttable securities, or the prerefunded date for those types of securities.
| | |
|
Investment Abbreviations: |
GO | | —General Obligation |
IDB | | —Industrial Development Board |
LIBOR | | —London Interbank Offered Rate |
LIQ | | —Liquidity Agreement |
LOC | | —Letter of Credit |
LP | | —Limited Partnership |
OBFR | | —Overnight Bank Funding Rate |
RB | | —Revenue Bond |
RMKT | | —Remarketed |
SBPA | | —Standby Bond Purchase Agreement |
SPA | | —Stand-by Purchase Agreement |
T-Bill | | —Treasury Bill |
VRDN | | —Variable Rate Demand Notes |
|
| | |
| 30 | | The accompanying notes are an integral part of these financial statements. |
FINANCIAL SQUARE TAX-EXEMPT MONEY MARKET FUND
Schedule of Investments
August 31, 2017
| | | | | | | | | | | | | | |
Principal
Amount | | | Interest
Rate | | | Maturity
Date | | | Value | |
| Municipal Debt Obligations – 99.7% | |
| Alabama – 2.5% | |
| | Huntsville Health Care Authority CP Series 2017 | |
| $ | 200,000 | | | | 0.870 | % | | | 10/23/17 | | | $ | 200,003 | |
| | |
| California – 12.2% | |
| ABAG Finance Authority for Non-Profit Corporations VRDN RB
for Lakeside Village Apartments Series 2011 A (FHLMC, LIQ)
(FHLMC, LOC)(a) |
|
| | 140,000 | | | | 0.730 | | | | 09/07/17 | | | | 140,000 | |
| California Educational Facilities Authority VRDN RB Refunding
for Stanford University Series 1997 L-5(a) |
|
| | 100,000 | | | | 0.750 | | | | 09/07/17 | | | | 100,000 | |
| California Statewide Communities Development Authority CP for
Kaiser Permanente Series 2017 04-I |
|
| | 150,000 | | | | 0.940 | | | | 09/05/17 | | | | 150,005 | |
| | 150,000 | | | | 0.960 | | | | 10/18/17 | | | | 150,017 | |
| Los Angeles County Housing Authority MF Hsg VRDN RB
Refunding for Malibu Meadows II Project Series 1998 C
(FNMA) (FNMA, LIQ)(a) |
|
| | 200,000 | | | | 0.770 | | | | 09/07/17 | | | | 200,000 | |
| Metropolitan Water District of Southern California VRDN RB
Refunding Series 2016 B-1 (Landesbank Hessen-Thueringen
Girozentrale, SPA)(a) |
|
| | 135,000 | | | | 0.720 | | | | 09/01/17 | | | | 135,000 | |
| The Regents of the University of California VRDN RB Refunding
General Series 2013 AL-2(a) |
|
| | 100,000 | | | | 0.800 | | | | 09/07/17 | | | | 100,000 | |
| | | | | | | | | | | | | | |
| | | | | | | | | | | | | 975,022 | |
| | |
| Connecticut – 3.1% | |
| State of Connecticut GO VRDN Refunding SIFMA Index
Series 2015 D (SIFMA + 0.75%) |
|
| | 250,000 | | | | 1.540 | | | | 06/15/18 | | | | 250,964 | |
| | |
| District of Columbia – 2.5% | |
| District of Columbia Income Tax Secured VRDN RB Refunding
SIFMA Series 2014 B (SIFMA + 0.30%) |
|
| | 200,000 | | | | 1.090 | | | | 12/01/17 | | | | 200,044 | |
| | |
| Georgia – 3.1% | |
| Private Colleges & Universities Authority VRDN RB Refunding
for Emory University Series 2005 B-1(a) |
|
| | 250,000 | | | | 0.760 | | | | 09/07/17 | | | | 250,000 | |
| | |
| Illinois – 4.4% | |
| Illinois Development Finance Authority VRDN RB for Evanston
Northwestern Healthcare Corp. Series 2001 C Convertible
RMKT (Wells Fargo Bank N.A., SPA)(a) |
|
| | 150,000 | | | | 0.830 | | | | 09/01/17 | | | | 150,000 | |
| Illinois Finance Authority VRDN RB Refunding for Northwestern
Memorial Hospital Series 2007 A-3 RMKT (JPMorgan Chase
Bank N.A., SPA)(a) |
|
| | 100,000 | | | | 0.800 | | | | 09/07/17 | | | | 100,000 | |
| Illinois Finance Authority VRDN RB Refunding for Northwestern
Memorial Hospital Series 2007 A-4 (TD Bank N.A., SPA)(a) |
|
| | 100,000 | | | | 0.770 | | | | 09/07/17 | | | | 100,000 | |
| | | | | | | | | | | | | | |
| | | | | | | | | | | | | 350,000 | |
| | |
| Municipal Debt Obligations – (continued) | |
| Indiana – 3.9% | |
| Indiana Health Facilities Financing Authority VRDN RB
Refunding for Ascension Health Services Series 2003 E-6
RMKT(a) |
|
| 115,000 | | | | 0.780 | | | | 09/07/17 | | | | 115,000 | |
| Purdue University VRDN RB for Student Facilities System
Series 2004 A(a) |
|
| | 200,000 | | | | 0.720 | | | | 09/07/17 | | | | 200,000 | |
| | | | | | | | | | | | | | |
| | | | | | | | | | | | | 315,000 | |
| | |
| Maryland – 2.5% | |
| County of Montgomery CP BANS Series 2017 10-A
(PNC Bank N.A., LIQ) |
|
| | 200,000 | | | | 0.910 | | | | 10/03/17 | | | | 200,012 | |
| | |
| Massachusetts – 7.5% | |
| Massachusetts Department of Transportation Metropolitan
Highway System VRDN RB Refunding for Contract
Assistance Series 2010 A-3 RMKT (Landesbank Hessen-
Thueringen Gironzentrale, LOC)(a) |
|
| | 200,000 | | | | 0.780 | | | | 09/07/17 | | | | 200,000 | |
| Massachusetts Health & Educational Facilities Authority CP
Series 2017 H-1 |
|
| | 200,000 | | | | 0.920 | | | | 09/05/17 | | | | 200,004 | |
| Massachusetts Health & Educational Facilities Authority VRDN
RB for Harvard University Series 2000 Y(a) |
|
| | 100,000 | | | | 0.750 | | | | 09/07/17 | | | | 100,000 | |
| Massachusetts Health & Educational Facilities Authority VRDN
RB Refunding for Tufts University Series 2008 N-1 RMKT
(U.S. Bank N.A., SPA)(a) |
|
| | 100,000 | | | | 0.750 | | | | 09/01/17 | | | | 100,000 | |
| | | | | | | | | | | | | | |
| | | | | | | | | | | | | 600,004 | |
| | |
| Minnesota – 6.3% | |
| County of Hennepin GO VRDN Series 2017 B (U.S. Bank N.A.,
SPA)(a) |
|
| | 200,000 | | | | 0.770 | | | | 09/07/17 | | | | 200,000 | |
| | Rochester Health Care Facilities CP Series 2017 | |
| | 300,000 | | | | 0.870 | | | | 09/06/17 | | | | 300,006 | |
| | | | | | | | | | | | | | |
| | | | | | | | | | | | | 500,006 | |
| | |
| Mississippi – 3.1% | |
| Mississippi Business Finance Commission Gulf Opportunity Zone
VRDN RB for Chevron USA, Inc. Project Series 2011 G (GTY
AGMT – Chevron Corp.)(a) |
|
| | 250,000 | | | | 0.840 | | | | 09/01/17 | | | | 250,000 | |
| | |
| Missouri – 3.1% | |
| | Curators University of Missouri CP Series 2017 A | |
| | 250,000 | | | | 0.940 | | | | 10/04/17 | | | | 250,030 | |
| | |
| Multi-State – 3.1% | |
| Federal Home Loan Mortgage Corporation VRDN RB for Multi-
Family Variable Rate Certificates Series 2013-M027 Class A
(FHLMC, LIQ)(a) |
|
| | 250,000 | | | | 0.810 | | | | 09/07/17 | | | | 250,000 | |
| | |
| New Jersey – 1.9% | |
| | County of Bergen GO BANS Refunding Series 2016 B | |
| | 150,000 | | | | 2.000 | | | | 12/14/17 | | | | 150,458 | |
| | |
| | |
| The accompanying notes are an integral part of these financial statements. | | 31 |
FINANCIAL SQUARE TAX-EXEMPT MONEY MARKET FUND
Schedule of Investments (continued)
August 31, 2017
| | | | | | | | | | | | | | |
Principal
Amount | | | Interest
Rate | | | Maturity
Date | | | Value | |
| Municipal Debt Obligations – (continued) | |
| New York – 7.5% | |
| Metropolitan Transportation Authority VRDN RB Refunding
Series 2015 Subseries E-3 (Citibank N.A., LOC)(a) |
|
| $ | 100,000 | | | | 0.760 | % | | | 09/07/17 | | | $ | 100,000 | |
| New York State Housing Finance Agency VRDN RB Refunding
for Taconic Housing West 17th Street Series 2009 A
(FNMA, LIQ) (FNMA, LOC)(a) |
|
| | 300,000 | | | | 0.800 | | | | 09/07/17 | | | | 300,000 | |
| Triborough Bridge & Tunnel Authority VRDN RB Refunding
General Series 2002 F RMKT (Landesbank Hessen-Thueringen
Girozentrale, LOC)(a) |
|
| | 200,000 | | | | 0.860 | | | | 09/01/17 | | | | 200,000 | |
| | | | | | | | | | | | | | |
| | | | | | | | | | | | | 600,000 | |
| | |
| North Carolina – 8.7% | |
| North Carolina Capital Facilities Finance Agency Educational
Facilities VRDN RB Refunding for Wake Forest University
Series 2004 A(a) |
|
| | 300,000 | | | | 0.790 | | | | 09/07/17 | | | | 300,000 | |
| North Carolina Educational Facilities Finance Agency VRDN RB
for Duke University Project Series 1991 B(a) |
|
| | 140,000 | | | | 0.730 | | | | 09/07/17 | | | | 140,000 | |
| University of North Carolina at Chapel Hill VRDN RB Refunding
Series 2001 B(a) |
|
| | 255,000 | | | | 0.750 | | | | 09/07/17 | | | | 255,000 | |
| | | | | | | | | | | | | | |
| | | | | | | | | | | | | 695,000 | |
| | |
| Ohio – 5.6% | |
| City of Columbus GO VRDN for Sanitation Sewer System
Series 2006-1(a) |
|
| | 245,000 | | | | 0.750 | | | | 09/07/17 | | | | 245,000 | |
| | Ohio Higher Educational Facility Commission CP Series 2017 B-5 | |
| | 200,000 | | | | 0.900 | | | | 10/19/17 | | | | 200,019 | |
| | | | | | | | | | | | | | |
| | | | | | | | | | | | | 445,019 | |
| | |
| Oklahoma – 1.2% | |
| Oklahoma Turnpike Authority VRDN RB Refunding for Second
Senior Bonds Series 2006 B RMKT (Royal Bank of Canada,
SPA)(a) |
|
| | 100,000 | | | | 0.820 | | | | 09/01/17 | | | | 100,000 | |
| | |
| Texas – 13.2% | |
| City of San Antonio Electric & Gas Systems CP Series 2017 B
(State Street Bank & Trust Co. and Wells Fargo Bank N.A.,
LOC) |
|
| | 200,000 | | | | 0.890 | | | | 10/11/17 | | | | 200,004 | |
| Gulf Coast, Texas IDA VRDN RB for ExxonMobil Project
Series 2012(a) |
|
| | 300,000 | | | | 0.850 | | | | 09/01/17 | | | | 300,000 | |
| Harris County Cultural Education Facilities Finance Corp. VRDN
RB Refunding for Methodist Hospital System Series 2008
Subseries C-1 RMKT(a) |
|
| | 150,000 | | | | 0.880 | | | | 09/01/17 | | | | 150,000 | |
| State of Texas GO VRDN for Veterans Bonds Series 2016
(Landesbank Hessen-Thueringen Girozentrale, SPA)(a) |
|
| | 150,000 | | | | 0.800 | | | | 09/07/17 | | | | 150,000 | |
| | State of Texas TRANS Series 2017(b) | |
| | 100,000 | | | | 4.000 | | | | 08/30/18 | | | | 103,051 | |
| | |
| Municipal Debt Obligations – (continued) | |
| Texas – (continued) | |
| Tarrant County Cultural Education Facilities Finance Corp. VRDN
RB Refunding for Texas Health Resources Series 2008 B(a) |
|
| 150,000 | | | | 0.750 | | | | 09/07/17 | | | | 150,000 | |
| | | | | | | | | | | | | | |
| | | | | | | | | | | | | 1,053,055 | |
| | |
| Utah – 3.1% | |
| City of Murray Hospital VRDN RB for IHC Health Services, Inc.
Series 2003 D(a) |
|
| | 250,000 | | | | 0.840 | | | | 09/01/17 | | | | 250,000 | |
| | |
| Virginia – 1.2% | |
| Fairfax County IDA VRDN RB for Fairfax Hospital
Series 1988 A RMKT (Northern Trust Co., LOC)(a) |
|
| | 100,000 | | | | 0.820 | | | | 09/07/17 | | | | 100,000 | |
| | |
| | TOTAL INVESTMENTS – 99.7% | | | | | |
| | (Cost $7,984,466) | | | $ | 7,984,617 | |
| | |
| OTHER ASSETS IN EXCESS OF
LIABILITIES – 0.3% |
| | | 20,741 | |
| | |
| | NET ASSETS – 100.0% | | | $ | 8,005,358 | |
| | |
| | |
| The percentage shown for each investment category reflects the value of investments in that category as a percentage of net assets. |
(a) | | Rate shown is that which is in effect on August 31, 2017. Certain variable rate securities are not based on a published reference rate and spread but are determined by the issuer or agent and are based on current market conditions. |
(b) | | All or a portion represents a forward commitment. |
|
Interest rates represent either the stated coupon rate, or for floating rate securities, the current reset rate, which is based upon current interest rate indices. |
|
| Maturity dates represent either the final legal maturity date on the security, the demand date for puttable securities, or the prerefunded date for those types of securities. |
| | |
|
Investment Abbreviations: |
BANS | | —Bond Anticipation Notes |
CP | | —Commercial Paper |
FHLMC | | —Insured by Federal Home Loan Mortgage Corp. |
FNMA | | —Insured by Federal National Mortgage Association |
GO | | —General Obligation |
GTY AGMT | | —Guaranty Agreement |
IDA | | —Industrial Development Agency |
IHC | | —Intermountain Health Care |
LIQ | | —Liquidity Agreement |
LOC | | —Letter of Credit |
MF Hsg | | —Multi-Family Housing |
RB | | —Revenue Bond |
RMKT | | —Remarketed |
SIFMA | | —Securities Industry and Financial Markets Association |
SPA | | —Stand-by Purchase Agreement |
TRANS | | —Tax Revenue Anticipation Notes |
VRDN | | —Variable Rate Demand Notes |
|
| | |
| 32 | | The accompanying notes are an integral part of these financial statements. |
FINANCIAL SQUARE TREASURY INSTRUMENTS FUND
Schedule of Investments
August 31, 2017
| | | | | | | | | | | | | | |
Principal Amount | | | Interest
Rate | | | Maturity
Date | | | Amortized Cost | |
| U.S. Treasury Obligations – 101.1% | |
| | United States Cash Management Bills(a) | |
| $ | 500,000,000 | | | | 1.067 | % | | | 01/02/18 | | | $ | 498,214,792 | |
| | 1,500,000,000 | | | | 1.082 | | | | 01/02/18 | | | | 1,494,567,497 | |
| | United States Treasury Bills | |
| | 438,700,000 | | | | 1.010 | | | | 09/14/17 | | | | 438,543,165 | |
| | 75,000,000 | | | | 0.948 | | | | 09/21/17 | | | | 74,961,250 | |
| | 120,025,000 | | | | 1.061 | | | | 10/12/17 | | | | 119,882,837 | |
| | 247,500,000 | | | | 1.184 | | | | 10/12/17 | | | | 247,173,025 | |
| | 475,000,000 | | | | 1.189 | | | | 10/12/17 | | | | 474,369,767 | |
| | 340,950,000 | | | | 1.067 | | | | 10/19/17 | | | | 340,474,943 | |
| | 2,192,500,000 | | | | 1.072 | | | | 10/19/17 | | | | 2,189,430,496 | |
| | 189,000,000 | | | | 1.102 | | | | 10/19/17 | | | | 188,727,840 | |
| | 56,000,000 | | | | 1.103 | | | | 10/19/17 | | | | 55,919,360 | |
| | 300,500,000 | | | | 1.200 | | | | 10/26/17 | | | | 299,960,561 | |
| | 1,397,000,000 | | | | 1.205 | | | | 10/26/17 | | | | 1,394,481,518 | |
| | 89,700,000 | | | | 0.993 | | | | 11/02/17 | | | | 89,549,765 | |
| | 393,200,000 | | | | 0.996 | | | | 11/02/17 | | | | 392,539,751 | |
| | 36,700,000 | | | | 1.001 | | | | 11/02/17 | | | | 36,638,059 | |
| | 10,700,000 | | | | 1.006 | | | | 11/02/17 | | | | 10,681,849 | |
| | 156,875,000 | | | | 1.010 | | | | 11/02/17 | | | | 156,607,528 | |
| | 53,700,000 | | | | 1.011 | | | | 11/02/17 | | | | 53,608,441 | |
| | 34,500,000 | | | | 1.016 | | | | 11/02/17 | | | | 34,440,880 | |
| | 9,500,000 | | | | 1.022 | | | | 11/02/17 | | | | 9,483,639 | |
| | 303,500,000 | | | | 1.082 | | | | 11/02/17 | | | | 302,945,945 | |
| | 463,700,000 | | | | 1.087 | | | | 11/02/17 | | | | 462,849,498 | |
| | 127,700,000 | | | | 1.090 | | | | 11/02/17 | | | | 127,465,227 | |
| | 882,700,000 | | | | 1.092 | | | | 11/02/17 | | | | 881,073,381 | |
| | 495,600,000 | | | | 1.037 | | | | 11/09/17 | | | | 494,635,851 | |
| | 2,860,000,000 | | | | 1.061 | | | | 11/09/17 | | | | 2,854,299,067 | |
| | 5,135,500,000 | | | | 1.036 | | | | 11/16/17 | | | | 5,124,495,784 | |
| | 169,300,000 | | | | 1.042 | | | | 11/16/17 | | | | 168,935,441 | |
| | 84,200,000 | | | | 1.056 | | | | 11/16/17 | | | | 84,016,023 | |
| | 78,100,000 | | | | 1.057 | | | | 11/16/17 | | | | 77,929,352 | |
| | 9,900,000 | | | | 1.063 | | | | 11/16/17 | | | | 9,878,264 | |
| | 19,200,000 | | | | 1.072 | | | | 11/16/17 | | | | 19,157,440 | |
| | 12,600,000 | | | | 1.078 | | | | 11/16/17 | | | | 12,571,937 | |
| | 4,800,000 | | | | 1.083 | | | | 11/16/17 | | | | 4,789,259 | |
| | 13,300,000 | | | | 1.087 | | | | 11/16/17 | | | | 13,270,097 | |
| | 5,800,000 | | | | 1.093 | | | | 11/16/17 | | | | 5,786,898 | |
| | 2,100,000 | | | | 1.095 | | | | 11/16/17 | | | | 2,095,245 | |
| | 7,700,000 | | | | 1.098 | | | | 11/16/17 | | | | 7,682,525 | |
| | 5,457,500,000 | | | | 1.020 | | | | 11/24/17 | | | | 5,444,765,811 | |
| | 230,000,000 | | | | 1.031 | | | | 11/24/17 | | | | 229,457,967 | |
| | 8,700,000 | | | | 1.052 | | | | 11/24/17 | | | | 8,679,091 | |
| | 59,500,000 | | | | 1.057 | | | | 11/24/17 | | | | 59,356,308 | |
| | 9,000,000 | | | | 1.062 | | | | 11/24/17 | | | | 8,978,160 | |
| | 58,500,000 | | | | 1.067 | | | | 11/24/17 | | | | 58,357,358 | |
| | 249,100,000 | | | | 1.068 | | | | 11/24/17 | | | | 248,492,611 | |
| | 589,100,000 | | | | 1.071 | | | | 11/24/17 | | | | 587,660,141 | |
| | 414,600,000 | | | | 1.073 | | | | 11/24/17 | | | | 413,584,230 | |
| | 112,500,000 | | | | 1.015 | | | | 11/30/17 | | | | 112,220,156 | |
| | 503,600,000 | | | | 1.031 | | | | 11/30/17 | | | | 502,328,410 | |
| | 3,549,800,000 | | | | 1.083 | | | | 11/30/17 | | | | 3,540,393,030 | |
| | 168,000,000 | | | | 1.094 | | | | 12/07/17 | | | | 167,515,647 | |
| | 12,000,000 | | | | 1.114 | | | | 12/07/17 | | | | 11,964,757 | |
| | 5,900,000 | | | | 1.130 | | | | 12/14/17 | | | | 5,881,166 | |
| | 1,200,000 | | | | 1.150 | | | | 12/28/17 | | | | 1,195,575 | |
| | |
| U.S. Treasury Obligations – (continued) | |
| | United States Treasury Bills – (continued) | |
| 3,800,000 | | | | 1.140 | | | | 02/01/18 | | | | 3,781,993 | |
| | 18,500,000 | | | | 1.145 | | | | 02/01/18 | | | | 18,411,940 | |
| | 6,100,000 | | | | 1.150 | | | | 02/01/18 | | | | 6,070,834 | |
| | 87,100,000 | | | | 1.119 | | | | 02/08/18 | | | | 86,676,113 | |
| | 4,700,000 | | | | 1.130 | | | | 02/08/18 | | | | 4,676,918 | |
| | 60,800,000 | | | | 1.140 | | | | 02/08/18 | | | | 60,498,702 | |
| United States Treasury Floating Rate Notes (3 Mo. U.S. T-Bill
MMY + 0.14%) |
|
| | 165,850,000 | | | | 1.163 | (b) | | | 01/31/19 | | | | 165,866,483 | |
| United States Treasury Floating Rate Notes (3 Mo. U.S. T-Bill
MMY + 0.27%) |
|
| | 5,965,756,000 | | | | 1.295 | (b) | | | 01/31/18 | | | | 5,973,304,016 | |
| United States Treasury Floating Rate Notes (3 Mo. U.S. T-Bill
MMY + 0.19%) |
|
| | 4,304,100,000 | | | | 1.213 | (b) | | | 04/30/18 | | | | 4,309,975,496 | |
| United States Treasury Floating Rate Notes (3 Mo. U.S. T-Bill
MMY + 0.17%)(b) |
|
| | 4,604,526,000 | | | | 1.191 | | | | 10/31/17 | | | | 4,605,811,354 | |
| | 2,386,400,000 | | | | 1.197 | | | | 07/31/18 | | | | 2,389,374,384 | |
| | United States Treasury Notes | |
| | 51,300,000 | | | | 0.750 | | | | 10/31/17 | | | | 51,270,935 | |
| | 179,200,000 | | | | 1.875 | | | | 10/31/17 | | | | 179,422,712 | |
| | 153,000,000 | | | | 4.250 | | | | 11/15/17 | | | | 153,987,363 | |
| | 52,100,000 | | | | 2.250 | | | | 11/30/17 | | | | 52,249,578 | |
| | 240,300,000 | | | | 2.625 | | | | 01/31/18 | | | | 241,742,879 | |
| | |
| | TOTAL INVESTMENTS – 101.1% | | | $ | 48,958,086,315 | |
| | |
| LIABILITIES IN EXCESS OF
OTHER ASSETS – (1.1)% |
| | | (539,612,853 | ) |
| | |
| | NET ASSETS – 100.0% | | | $ | 48,418,473,462 | |
| | |
| | |
| The percentage shown for each investment category reflects the value of investments in that category as a percentage of net assets. |
(a) | | All or a portion represents a forward commitment. |
(b) | | Variable or floating rate security. Interest rate disclosed is that which is in effect at August 31, 2017. |
|
| Interest rates represent either the stated coupon rate, annualized yield on date of purchase for discounted securities, or, for floating rate securities, the current reset rate, which is based upon interest rate indices. |
|
| Maturity dates represent either the final legal maturity date on the security, the demand date for puttable securities, or the prerefunded date for those types of securities. |
| | |
|
Investment Abbreviations: |
MMY | | —Money Market Yield |
T-Bill | | —Treasury Bill |
|
| | |
| The accompanying notes are an integral part of these financial statements. | | 33 |
FINANCIAL SQUARE TREASURY OBLIGATIONS FUND
Schedule of Investments
August 31, 2017
| | | | | | | | | | | | | | |
Principal Amount | | | Interest
Rate | | | Maturity
Date | | | Amortized Cost | |
| U.S. Treasury Obligations – 37.1% | |
| | United States Cash Management Bills(a) | |
| $ | 13,000,000 | | | | 1.067 | % | | | 01/02/18 | | | $ | 12,953,585 | |
| | 9,700,000 | | | | 1.072 | | | | 01/02/18 | | | | 9,665,201 | |
| | United States Treasury Bills | |
| | 73,200,000 | | | | 1.082 | | | | 11/02/17 | | | | 73,066,369 | |
| | 81,300,000 | | | | 1.087 | | | | 11/02/17 | | | | 81,150,882 | |
| | 19,000,000 | | | | 1.090 | | | | 11/02/17 | | | | 18,965,069 | |
| | 306,000,000 | | | | 1.092 | | | | 11/02/17 | | | | 305,436,110 | |
| | 173,700,000 | | | | 1.037 | | | | 11/09/17 | | | | 173,362,081 | |
| | 361,500,000 | | | | 1.061 | | | | 11/09/17 | | | | 360,779,410 | |
| | 12,200,000 | | | | 1.082 | | | | 11/09/17 | | | | 12,175,214 | |
| | 9,200,000 | | | | 1.087 | | | | 11/09/17 | | | | 9,181,220 | |
| | 14,000,000 | | | | 1.051 | | | | 11/16/17 | | | | 13,969,558 | |
| | 51,100,000 | | | | 1.056 | | | | 11/16/17 | | | | 50,988,346 | |
| | 5,800,000 | | | | 1.072 | | | | 11/16/17 | | | | 5,787,143 | |
| | 8,300,000 | | | | 1.078 | | | | 11/16/17 | | | | 8,281,514 | |
| | 4,600,000 | | | | 1.083 | | | | 11/16/17 | | | | 4,589,706 | |
| | 13,800,000 | | | | 1.087 | | | | 11/16/17 | | | | 13,768,973 | |
| | 6,000,000 | | | | 1.093 | | | | 11/16/17 | | | | 5,986,447 | |
| | 12,200,000 | | | | 1.095 | | | | 11/16/17 | | | | 12,172,377 | |
| | 800,000 | | | | 1.098 | | | | 11/16/17 | | | | 798,184 | |
| | 53,100,000 | | | | 1.025 | | | | 11/24/17 | | | | 52,975,481 | |
| | 10,100,000 | | | | 1.033 | | | | 11/24/17 | | | | 10,076,139 | |
| | 9,100,000 | | | | 1.052 | | | | 11/24/17 | | | | 9,078,130 | |
| | 49,000,000 | | | | 1.057 | | | | 11/24/17 | | | | 48,881,665 | |
| | 106,300,000 | | | | 1.068 | | | | 11/24/17 | | | | 106,040,805 | |
| | 51,300,000 | | | | 1.071 | | | | 11/24/17 | | | | 51,174,614 | |
| | 94,200,000 | | | | 1.073 | | | | 11/24/17 | | | | 93,969,210 | |
| | 27,600,000 | | | | 1.031 | | | | 11/30/17 | | | | 27,530,310 | |
| | 289,000,000 | | | | 1.083 | | | | 11/30/17 | | | | 288,234,150 | |
| | 175,100,000 | | | | 1.094 | | | | 12/07/17 | | | | 174,595,177 | |
| | 11,700,000 | | | | 1.114 | | | | 12/07/17 | | | | 11,665,638 | |
| | 247,800,000 | | | | 1.125 | | | | 12/14/17 | | | | 247,012,547 | |
| | 7,300,000 | | | | 1.130 | | | | 12/14/17 | | | | 7,276,697 | |
| | 600,000 | | | | 1.150 | | | | 12/28/17 | | | | 597,787 | |
| | 5,600,000 | | | | 1.062 | | | | 01/04/18 | | | | 5,579,778 | |
| | 72,200,000 | | | | 1.130 | | | | 01/18/18 | | | | 71,891,957 | |
| | 172,300,000 | | | | 1.145 | | | | 01/25/18 | | | | 171,517,375 | |
| | 169,400,000 | | | | 1.150 | | | | 01/25/18 | | | | 168,627,113 | |
| | 3,800,000 | | | | 1.145 | | | | 02/01/18 | | | | 3,781,912 | |
| | 30,700,000 | | | | 1.150 | | | | 02/01/18 | | | | 30,553,216 | |
| | 5,700,000 | | | | 1.130 | | | | 02/08/18 | | | | 5,672,007 | |
| | 47,400,000 | | | | 1.140 | | | | 02/08/18 | | | | 47,165,107 | |
| | 3,300,000 | | | | 1.114 | | | | 02/22/18 | | | | 3,282,614 | |
| United States Treasury Floating Rate Note (3 Mo. U.S. T-Bill
MMY + 0.06%) |
|
| | 48,500,000 | | | | 1.083 | (b) | | | 07/31/19 | | | | 48,499,927 | |
| United States Treasury Floating Rate Note (3 Mo. U.S. T-Bill
MMY + 0.07%) |
|
| | 1,008,700,000 | | | | 1.093 | (b) | | | 04/30/19 | | | | 1,008,987,883 | |
| United States Treasury Floating Rate Note (3 Mo. U.S. T-Bill
MMY + 0.14%) |
|
| | 16,700,000 | | | | 1.163 | (b) | | | 01/31/19 | | | | 16,701,660 | |
| United States Treasury Floating Rate Notes (3 Mo. U.S. T-Bill
MMY + 0.17%)(b) |
|
| | 190,000,000 | | | | 1.191 | | | | 10/31/17 | | | | 189,980,815 | |
| | 401,700,000 | | | | 1.197 | | | | 07/31/18 | | | | 401,745,378 | |
| | |
| U.S. Treasury Obligations – (continued) | |
| United States Treasury Floating Rate Note (3 Mo. U.S. T-Bill
MMY + 0.19%) |
|
| $ | 722,500,000 | | | | 1.213 | %(b) | | | 04/30/18 | | | $ | 722,509,539 | |
| United States Treasury Floating Rate Note (3 Mo. U.S. T-Bill
MMY + 0.27%) |
|
| | 1,146,300,000 | | | | 1.295 | (b) | | | 01/31/18 | | | | 1,147,093,617 | |
| | United States Treasury Notes | |
| | 164,950,000 | | | | 4.250 | | | | 11/15/17 | | | | 166,050,359 | |
| | 25,000,000 | | | | 2.250 | | | | 11/30/17 | | | | 25,075,499 | |
| | 85,000,000 | | | | 2.625 | | | | 01/31/18 | | | | 85,510,707 | |
| | |
| TOTAL INVESTMENTS BEFORE
REPURCHASE AGREEMENTS |
| | $ | 6,622,412,202 | |
| | |
| | | | | | | | | | | | | | |
| Repurchase Agreements(c) – 63.0% | |
| | Bank of Montreal | | | | | | | | | | | | | |
| $ | 65,000,000 | | | | 1.050 | %(d) | | | 09/07/17 | | | $ | 65,000,000 | |
| | Maturity Value: $65,115,646 | |
| | Settlement Date: 08/24/17 | |
| Collateralized by a U.S. Treasury Bond, 2.250%, due 08/15/46
and U.S. Treasury Notes, 2.000% to 3.875%, due 05/15/18 to
11/15/26. The aggregate market value of the collateral,
including accrued interest, was $66,300,043. |
|
| | |
| | BNP Paribas | | | | | | | | | | | | | |
| | 100,000,000 | | | | 1.060 | | | | 09/01/17 | | | | 100,000,000 | |
| | Maturity Value: $100,002,944 | |
| Collateralized by U.S. Treasury Bonds, 3.125% to 3.625%, due
02/15/43 to 02/15/44, a U.S. Treasury Inflation-Indexed Note,
0.625%, due 01/15/24 and U.S. Treasury Notes, 2.000% to
2.375%, due 07/31/24 to 11/15/26. The aggregate market value
of the collateral, including accrued interest, was $102,000,026. |
|
| | 950,000,000 | | | | 1.050 | (d) | | | 09/07/17 | | | | 950,000,000 | |
| | Maturity Value: $950,858,959 | |
| | Settlement Date: 08/14/17 | |
| Collateralized by U.S. Treasury Bills, 0.000%, due 11/16/17 to
06/21/18, a U.S. Treasury Bond, 7.625%, due 11/15/22, U.S.
Treasury Inflation-Indexed Bonds, 2.000% to 2.375%, due
01/15/25 to 01/15/26, U.S. Treasury Interest-Only Stripped
Securities, 0.000%, due 11/15/28 to 05/15/45, U.S. Treasury
Notes, 0.750% to 2.750%, due 07/31/18 to 06/30/24 and U.S.
Treasury Principal-Only Stripped Securities, 0.000%, due
02/15/21 to 11/15/45. The aggregate market value of the
collateral, including accrued interest, was $969,000,003. |
|
| | 500,000,000 | | | | 1.070 | (d) | | | 09/07/17 | | | | 500,000,000 | |
| | Maturity Value: $500,980,833 | |
| | Settlement Date: 07/17/17 | |
| Collateralized by U.S. Treasury Bills, 0.000%, due 12/07/17 to
01/18/18, a U.S. Treasury Inflation-Indexed Bond, 2.000%, due
01/15/26, a U.S. Treasury Inflation-Indexed Note, 0.125%, due
04/15/20, U.S. Treasury Interest-Only Stripped Securities,
0.000%, due 05/15/22 to 05/15/29, U.S. Treasury Notes,
0.875% to 3.750%, due 10/15/17 to 08/31/24 and a U.S.
Treasury Principal-Only Stripped Security, 0.000%, due
11/15/45. The aggregate market value of the collateral,
including accrued interest, was $509,999,999. |
|
| | |
| | |
| 34 | | The accompanying notes are an integral part of these financial statements. |
FINANCIAL SQUARE TREASURY OBLIGATIONS FUND
| | | | | | | | | | | | | | |
Principal Amount | | | Interest
Rate | | | Maturity
Date | | | Amortized Cost | |
| Repurchase Agreements(c) – (continued) | |
| | BNP Paribas (Overnight Treasury + 0.02%) | |
| $ | 700,000,000 | | | | 1.080 | %(b)(d) | | | 09/01/17 | | | $ | 700,000,000 | |
| | Maturity Value: $712,096,000 | |
| | Settlement Date: 02/23/16 | |
| Collateralized by a U.S. Treasury Bill, 0.000%, due 02/08/18,
U.S. Treasury Inflation-Indexed Bonds, 0.750% to 2.125%, due
02/15/40 to 02/15/45, U.S. Treasury Inflation-Indexed Notes,
0.125% to 0.625%, due 04/15/21 to 01/15/24, a U.S. Treasury
Interest-Only Stripped Security, 0.000%, due 02/15/30 and U.S.
Treasury Notes, 0.875% to 2.750%, due 12/31/17 to 01/31/23.
The aggregate market value of the collateral, including accrued
interest, was $714,000,000. |
|
| | |
| | Citigroup Global Markets, Inc. | |
| | 150,000,000 | | | | 1.010 | | | | 09/01/17 | | | | 150,000,000 | |
| | Maturity Value: $150,004,208 | |
| Collateralized by U.S. Treasury Notes, 1.125% to 1.250%, due
01/31/19 to 03/31/19. The aggregate market value of the
collateral, including accrued interest, was $153,000,093. |
|
| | 41,200,000 | | | | 1.060 | | | | 09/01/17 | | | | 41,200,000 | |
| | Maturity Value: $41,201,213 | |
| Collateralized by a U.S. Treasury Note, 1.625%, due 06/30/19.
The market value of the collateral, including accrued interest,
was $42,024,062. |
|
| | |
| | Credit Agricole Corporate and Investment Bank | |
| | 200,000,000 | | | | 1.030 | | | | 09/01/17 | | | | 200,000,000 | |
| | Maturity Value: $200,040,056 | |
| | Settlement Date: 08/25/17 | |
| Collateralized by a U.S. Treasury Bond, 3.750%, due 11/15/43,
U.S. Treasury Notes, 0.750% to 2.125%, due 01/31/18 to
07/31/24 and a U.S. Treasury Principal-Only Stripped Security,
0.000%, due 08/15/44. The aggregate market value of the
collateral, including accrued interest, was $204,000,058. |
|
| | 500,000,000 | | | | 1.030 | | | | 09/06/17 | | | | 500,000,000 | |
| | Maturity Value: $500,100,139 | |
| | Settlement Date: 08/30/17 | |
| Collateralized by a U.S. Treasury Floating Rate Note, 1.191%,
due 10/31/17, a U.S. Treasury Inflation-Indexed Bond, 2.500%,
due 01/15/29 and U.S. Treasury Notes, 0.750% to 3.625%, due
03/31/18 to 07/31/22. The aggregate market value of the
collateral, including accrued interest, was $510,000,044. |
|
| | |
| | Deutsche Bank Securities, Inc. | |
| | 300,000,000 | | | | 1.070 | | | | 09/01/17 | | | | 300,000,000 | |
| | Maturity Value: $300,008,917 | |
| Collateralized by a U.S. Treasury Bond, 7.625%, due 02/15/25, a
U.S. Treasury Inflation-Indexed Note, 0.125%, due 07/15/24
and a U.S. Treasury Note, 2.750%, due 11/15/23. The
aggregate market value of the collateral, including accrued
interest, was $306,000,052. |
|
| | |
| | Federal Reserve Bank of New York | |
| | 1,400,000,000 | | | | 1.000 | | | | 09/01/17 | | | | 1,400,000,000 | |
| | Maturity Value: $1,400,038,889 | |
| Collateralized by U.S. Treasury Bonds, 2.750% to 4.625%, due
02/15/40 to 11/15/42 and U.S. Treasury Notes, 1.625% to
2.000%, due 08/15/22 to 02/15/23. The aggregate market value
of the collateral, including accrued interest, was
$1,400,038,958. |
|
| | |
| Repurchase Agreements(c) – (continued) | |
| | Fixed Income Clearing Corp. | |
| $ | 49,000,000 | | | | 1.100 | | | | 09/01/17 | | | | 49,000,000 | |
| | Maturity Value: $49,001,497 | |
| Collateralized by a U.S. Treasury Note, 1.750%, due 09/30/22.
The market value of the collateral, including accrued interest,
was $49,980,071. |
|
| | 2,450,000,000 | | | | 1.100 | | | | 09/01/17 | | | | 2,450,000,000 | |
| | Maturity Value: $2,450,074,861 | |
| Collateralized by a U.S. Treasury Bond, 3.000%, due 11/15/44
and U.S. Treasury Notes, 1.250% to 1.500%, due 08/31/19 to
08/15/26. The aggregate market value of the collateral,
including accrued interest, was $2,499,000,023. |
|
| | |
| | HSBC Securities (USA), Inc. | |
| | 400,000,000 | | | | 1.050 | | | | 09/01/17 | | | | 400,000,000 | |
| | Maturity Value: $400,011,667 | |
| Collateralized by a U.S. Treasury Bond, 2.750%, due 08/15/47
and a U.S. Treasury Note, 1.625%, due 08/31/22. The
aggregate market value of the collateral, including accrued
interest, was $408,000,215. |
|
| | |
| | ING Financial Markets LLC | |
| | 250,000,000 | | | | 1.050 | | | | 09/01/17 | | | | 250,000,000 | |
| | Maturity Value: $250,007,292 | |
| Collateralized by a U.S. Treasury Bond, 3.875%, due 08/15/40
and U.S. Treasury Notes, 1.000% to 3.500%, due 02/15/18 to
11/30/22. The aggregate market value of the collateral,
including accrued interest, was $255,000,362. |
|
| | |
| | J.P. Morgan Securities LLC | |
| | 2,700,000 | | | | 1.060 | | | | 09/01/17 | | | | 2,700,000 | |
| | Maturity Value: $2,700,080 | |
| Collateralized by a U.S. Treasury Note, 1.750%, due 11/30/21.
The market value of the collateral, including accrued interest,
was $2,757,506. |
|
| | 500,000,000 | | | | 1.030 | (d)(e) | | | 09/07/17 | | | | 500,000,000 | |
| | Maturity Value: $513,261,245 | |
| | Settlement Date: 03/02/15 | |
| Collateralized by U.S. Treasury Notes, 1.375% to 2.375%, due
07/15/20 to 08/15/24 and U.S. Treasury Principal-Only
Stripped Securities, 0.000%, due 02/15/24 to 11/15/44. The
aggregate market value of the collateral, including accrued
interest, was $510,004,037. |
|
| | |
| | Joint Repurchase Agreement Account I | | | | | |
| | 1,303,300,000 | | | | 1.060 | | | | 09/01/17 | | | | 1,303,300,000 | |
| | Maturity Value: $1,303,338,375 | |
| | |
| | Merrill Lynch, Pierce, Fenner & Smith, Inc. | |
| | 52,000,000 | | | | 1.060 | | | | 09/01/17 | | | | 52,000,000 | |
| | Maturity Value: $52,001,531 | |
| Collateralized by a U.S. Treasury Note, 2.250%, due 01/31/24.
The market value of the collateral, including accrued interest,
was $53,040,047. |
|
| | 100,000,000 | | | | 1.060 | | | | 09/01/17 | | | | 100,000,000 | |
| | Maturity Value: $100,002,944 | |
| Collateralized by a U.S. Treasury Note, 2.125%, due 05/15/25.
The market value of the collateral, including accrued interest,
was $102,000,066. |
|
| | |
| | |
| The accompanying notes are an integral part of these financial statements. | | 35 |
FINANCIAL SQUARE TREASURY OBLIGATIONS FUND
Schedule of Investments (continued)
August 31, 2017
| | | | | | | | | | | | | | |
Principal Amount | | | Interest
Rate | | | Maturity
Date | | | Amortized Cost | |
| Repurchase Agreements(c) – (continued) | |
| | Metropolitan Life Insurance Co. | |
| $ | 25,000,000 | | | | 1.100 | % | | | 09/01/17 | | | $ | 25,000,000 | |
| | Maturity Value: $25,000,764 | |
| Collateralized by a U.S. Treasury Note, 2.250%, due 11/15/25.
The market value of the collateral, including accrued interest,
was $25,508,833. |
|
| | |
| | Nomura Securities International, Inc. | |
| | 600,000,000 | | | | 1.070 | | | | 09/01/17 | | | | 600,000,000 | |
| | Maturity Value: $600,017,833 | |
| Collateralized by a U.S. Treasury Floating Rate Note, 1.163%,
due 01/31/19, U.S. Treasury Interest-Only Stripped Securities,
0.000%, due 01/31/18 to 05/15/21, U.S. Treasury Notes,
1.625% to 2.375%, due 07/31/19 to 08/15/24 and U.S. Treasury
Principal-Only Stripped Securities, 0.000%, due 05/15/20 to
08/15/40. The aggregate market value of the collateral,
including accrued interest, was $612,000,058. |
|
| | |
| | Norinchukin Bank | |
| | 40,000,000 | | | | 1.150 | (f) | | | 10/23/17 | | | | 40,000,000 | |
| | Maturity Value: $40,079,222 | |
| | Settlement Date: 08/22/17 | |
| Collateralized by a U.S. Treasury Inflation-Indexed Note, 0.375%,
due 01/15/27. The market value of the collateral, including
accrued interest, was $40,800,075. |
|
| | 40,000,000 | | | | 1.150 | (f) | | | 10/31/17 | | | | 40,000,000 | |
| | Maturity Value: $40,088,167 | |
| | Settlement Date: 08/23/17 | |
| Collateralized by a U.S. Treasury Inflation-Indexed Note, 0.375%,
due 01/15/27. The market value of the collateral, including
accrued interest, was $40,800,075. |
|
| | |
| | Societe Generale (OBFR – 0.10%) | |
| | 150,000,000 | | | | 1.060 | (b) | | | 09/07/17 | | | | 150,000,000 | |
| | Maturity Value: $151,461,914 | |
| | Settlement Date: 10/18/16 | |
| Collateralized by U.S. Treasury Notes, 1.625% to 2.250%, due
08/31/22 to 11/15/25. The aggregate market value of the
collateral, including accrued interest, was $153,000,081. |
|
| | |
| | Wells Fargo Securities LLC | |
| | 350,000,000 | | | | 1.060 | (f) | | | 09/29/17 | | | | 350,000,000 | |
| | Maturity Value: $350,309,167 | |
| | Settlement Date: 08/30/17 | |
| Collateralized by a U.S. Treasury Note, 2.000%, due 12/31/21.
The market value of the collateral, including accrued interest,
was $357,000,017. |
|
| | |
| | TOTAL REPURCHASE AGREEMENTS | | | $ | 11,218,200,000 | |
| | |
| | TOTAL INVESTMENTS – 100.1% | | | $ | 17,840,612,202 | |
| | |
| LIABILITIES IN EXCESS OF
OTHER ASSETS – (0.1)% |
| | | (25,815,692 | ) |
| | |
| | NET ASSETS – 100.0% | | | $ | 17,814,796,510 | |
| | |
| | |
| The percentage shown for each investment category reflects the value of investments in that category as a percentage of net assets. |
(a) | | All or a portion represents a forward commitment. |
(b) | | Variable or floating rate security. Interest rate disclosed is that which is in effect at August 31, 2017. |
(c) | | Unless noted, all repurchase agreements were entered into on August 31, 2017. Additional information on Joint Repurchase Agreement Account I appears on page 38. |
(d) | | The instrument is subject to a demand feature. |
(e) | | Variable or floating rate security. Rate shown is that which is in effect on August 31, 2017. Certain variable rate securities are not based on a published reference rate and spread but are determined by the issuer or agent and are based on current market conditions. |
(f) | | Security has been determined to be illiquid by the Investment Adviser. At August 31, 2017, these securities amounted to $430,000,000 or approximately 2.4% of net assets, and are unaudited. |
Interest rates represent either the stated coupon rate, annualized yield on date of purchase for discounted securities, or, for floating rate securities, the current reset rate, which is based upon current interest rate indices.
Maturity dates represent either the final legal maturity date on the security, the demand date for puttable securities, or the prerefunded date for those types of securities.
| | |
|
Investment Abbreviations: |
MMY | | —Money Market Yield |
OBFR | | —Overnight Bank Funding Rate |
T-Bill | | —Treasury Bill |
|
| | |
| 36 | | The accompanying notes are an integral part of these financial statements. |
FINANCIAL SQUARE TREASURY SOLUTIONS FUND
Schedule of Investments
August 31, 2017
| | | | | | | | | | | | | | |
Principal Amount | | | Interest
Rate | | | Maturity
Date | | | Amortized
Cost | |
| U.S. Treasury Obligations – 36.7% | |
| | United States Cash Management Bills(a) | |
| $ | 8,000,000 | | | | 1.067 | % | | | 01/02/18 | | | $ | 7,971,437 | |
| | 6,000,000 | | | | 1.072 | | | | 01/02/18 | | | | 5,978,475 | |
| | United States Treasury Bills | |
| | 59,400,000 | | | | 1.082 | | | | 11/02/17 | | | | 59,291,562 | |
| | 48,000,000 | | | | 1.087 | | | | 11/02/17 | | | | 47,911,960 | |
| | 11,700,000 | | | | 1.090 | | | | 11/02/17 | | | | 11,678,490 | |
| | 188,900,000 | | | | 1.092 | | | | 11/02/17 | | | | 188,551,900 | |
| | 69,400,000 | | | | 1.037 | | | | 11/09/17 | | | | 69,264,988 | |
| | 200,000,000 | | | | 1.061 | | | | 11/09/17 | | | | 199,601,333 | |
| | 5,000,000 | | | | 1.082 | | | | 11/09/17 | | | | 4,989,842 | |
| | 3,700,000 | | | | 1.087 | | | | 11/09/17 | | | | 3,692,447 | |
| | 576,700,000 | | | | 1.036 | | | | 11/16/17 | | | | 575,464,262 | |
| | 10,600,000 | | | | 1.051 | | | | 11/16/17 | | | | 10,576,951 | |
| | 27,300,000 | | | | 1.056 | | | | 11/16/17 | | | | 27,240,350 | |
| | 3,000,000 | | | | 1.078 | | | | 11/16/17 | | | | 2,993,318 | |
| | 1,900,000 | | | | 1.083 | | | | 11/16/17 | | | | 1,895,748 | |
| | 13,200,000 | | | | 1.087 | | | | 11/16/17 | | | | 13,170,322 | |
| | 5,800,000 | | | | 1.093 | | | | 11/16/17 | | | | 5,786,898 | |
| | 5,000,000 | | | | 1.095 | | | | 11/16/17 | | | | 4,988,679 | |
| | 800,000 | | | | 1.098 | | | | 11/16/17 | | | | 798,184 | |
| | 52,100,000 | | | | 1.025 | | | | 11/24/17 | | | | 51,977,826 | |
| | 61,800,000 | | | | 1.033 | | | | 11/24/17 | | | | 61,653,998 | |
| | 8,700,000 | | | | 1.052 | | | | 11/24/17 | | | | 8,679,091 | |
| | 46,900,000 | | | | 1.057 | | | | 11/24/17 | | | | 46,786,737 | |
| | 9,000,000 | | | | 1.062 | | | | 11/24/17 | | | | 8,978,160 | |
| | 5,600,000 | | | | 1.067 | | | | 11/24/17 | | | | 5,586,345 | |
| | 43,000,000 | | | | 1.068 | | | | 11/24/17 | | | | 42,895,152 | |
| | 20,800,000 | | | | 1.071 | | | | 11/24/17 | | | | 20,749,161 | |
| | 39,200,000 | | | | 1.073 | | | | 11/24/17 | | | | 39,103,960 | |
| | 26,400,000 | | | | 1.031 | | | | 11/30/17 | | | | 26,333,340 | |
| | 283,500,000 | | | | 1.083 | | | | 11/30/17 | | | | 282,748,725 | |
| | 173,700,000 | | | | 1.094 | | | | 12/07/17 | | | | 173,199,214 | |
| | 5,000,000 | | | | 1.114 | | | | 12/07/17 | | | | 4,985,315 | |
| | 122,800,000 | | | | 1.125 | | | | 12/14/17 | | | | 122,409,769 | |
| | 7,100,000 | | | | 1.130 | | | | 12/14/17 | | | | 7,077,335 | |
| | 300,000 | | | | 1.150 | | | | 12/28/17 | | | | 298,894 | |
| | 3,500,000 | | | | 1.062 | | | | 01/04/18 | | | | 3,487,361 | |
| | 44,400,000 | | | | 1.130 | | | | 01/18/18 | | | | 44,210,566 | |
| | 105,200,000 | | | | 1.145 | | | | 01/25/18 | | | | 104,722,158 | |
| | 103,500,000 | | | | 1.150 | | | | 01/25/18 | | | | 103,027,781 | |
| | 1,600,000 | | | | 1.145 | | | | 02/01/18 | | | | 1,592,384 | |
| | 18,800,000 | | | | 1.150 | | | | 02/01/18 | | | | 18,710,112 | |
| | 3,300,000 | | | | 1.130 | | | | 02/08/18 | | | | 3,283,793 | |
| | 27,700,000 | | | | 1.140 | | | | 02/08/18 | | | | 27,562,731 | |
| | 2,000,000 | | | | 1.114 | | | | 02/22/18 | | | | 1,989,463 | |
| United States Treasury Floating Rate Note (3 Mo. U.S. T-Bill
MMY + 0.14%) |
|
| | 26,600,000 | | | | 1.163 | (b) | | | 01/31/19 | | | | 26,602,644 | |
| United States Treasury Floating Rate Note (3 Mo. U.S. T-Bill
MMY + 0.07%) |
|
| | 329,200,000 | | | | 1.093 | (b) | | | 04/30/19 | | | | 329,334,618 | |
| United States Treasury Floating Rate Note (3 Mo. U.S. T-Bill
MMY + 0.27%) |
|
| | 394,800,000 | | | | 1.295 | (b) | | | 01/31/18 | | | | 395,171,476 | |
| | |
| U.S. Treasury Obligations – (continued) | |
| United States Treasury Floating Rate Note (3 Mo. U.S. T-Bill
MMY + 0.17%) |
|
| $ | 55,200,000 | | | | 1.197 | %(b) | | | 07/31/18 | | | $ | 55,292,613 | |
| United States Treasury Floating Rate Note (3 Mo. U.S. T-Bill
MMY + 0.06%) |
|
| | 11,500,000 | | | | 1.083 | (b) | | | 07/31/19 | | | | 11,499,983 | |
| | United States Treasury Notes | |
| | 81,200,000 | | | | 4.250 | | | | 11/15/17 | | | | 81,738,151 | |
| | 11,200,000 | | | | 2.250 | % | | | 11/30/17 | | | | 11,233,272 | |
| | 43,600,000 | | | | 2.625 | | | | 01/31/18 | | | | 43,861,962 | |
| | |
| TOTAL INVESTMENTS BEFORE
REPURCHASE AGREEMENTS |
| | $ | 3,408,631,236 | |
| | |
| | | | | | | | | | | | | | |
| Repurchase Agreements(c) – 64.1% | |
| | Federal Reserve Bank of New York | |
| $ | 5,950,000,000 | | | | 1.000 | % | | | 09/01/17 | | | $ | 5,950,000,000 | |
| | Maturity Value: $5,950,165,278 | |
| Collateralized by U.S. Treasury Bonds, 2.750% to 8.000%, due
11/15/21 to 02/15/43 and U.S. Treasury Notes, 1.625% to
2.000%, due 08/15/22 to 02/15/23. The aggregate market value
of the collateral, including accrued interest, was
$5,950,165,293. |
|
| | |
| | TOTAL INVESTMENTS – 100.8% | | | $ | 9,358,631,236 | |
| | |
| LIABILITIES IN EXCESS OF
OTHER ASSETS – (0.8)% |
| | | (70,371,431 | ) |
| | |
| | NET ASSETS – 100.0% | | | $ | 9,288,259,805 | |
| | |
| | |
| The percentage shown for each investment category reflects the value of investments in that category as a percentage of net assets. |
(a) | | All or a portion represents a forward commitment. |
(b) | | Variable or floating rate security. Interest rate disclosed is that which is in effect at August 31, 2017. |
(c) | | Unless noted, all repurchase agreements were entered into on August 31, 2017. |
Interest rates represent either the stated coupon rate, annualized yield on date of purchase for discounted securities, or, for floating rate securities, the current reset rate, which is based upon interest rate indices.
Maturity dates represent either the final legal maturity date on the security, the demand date for puttable securities, or the prerefunded date for those types of securities.
| | |
|
Investment Abbreviations: |
MMY | | —Money Market Yield |
T-Bill | | —Treasury Bill |
|
| | |
| The accompanying notes are an integral part of these financial statements. | | 37 |
GOLDMAN SACHS FUNDS — FINANCIAL SQUARE FUNDS
Schedule of Investments
August 31, 2017
|
| ADDITIONAL INVESTMENT INFORMATION |
JOINT REPURCHASE AGREEMENT ACCOUNT I — At August 31, 2017, certain Funds had undivided interests in the Joint Repurchase Agreement Account I with a maturity date of September 1, 2017, as follows:
| | | | | | | | | | | | |
| Fund | | Principal Amount | | | Maturity Value | | | Collateral Value
Allocation | |
Government | | $ | 4,920,500,000 | | | $ | 4,920,644,881 | | | $ | 5,018,933,935 | |
Treasury Obligations | | | 1,303,300,000 | | | | 1,303,338,375 | | | | 1,329,372,340 | |
REPURCHASE AGREEMENTS — At August 31, 2017, the Principal Amounts of certain Funds’ interest in the Joint Repurchase Agreement Account I were as follows:
| | | | | | | | | | | | |
Counterparty | | Interest Rate | | | Government | | | Treasury Obligations | |
Bank of Nova Scotia (The) | | | 1.060 | % | | $ | 790,594,171 | | | $ | 209,405,829 | |
BNP Paribas | | | 1.060 | | | | 1,869,755,214 | | | | 495,244,786 | |
Citigroup Global Markets, Inc. | | | 1.060 | | | | 362,724,605 | | | | 96,075,395 | |
Credit Agricole Corporate and Investment Bank | | | 1.060 | | | | 948,713,005 | | | | 251,286,995 | |
Merrill Lynch, Pierce, Fenner & Smith, Inc. | | | 1.060 | | | | 316,237,668 | | | | 83,762,332 | |
Wells Fargo Securities, LLC | | | 1.060 | | | | 632,475,337 | | | | 167,524,663 | |
| TOTAL | | | $ | 4,920,500,000 | | | $ | 1,303,300,000 | |
At August 31, 2017, the Joint Repurchase Agreement Account I was fully collateralized by:
| | | | | | | | |
| Issuer | | Interest Rates | | | Maturity Dates | |
U.S. Treasury Bills | | | 0.000 | % | | | 09/14/17 to 06/21/18 | |
U.S. Treasury Bonds | | | 2.500 to 9.125 | | | | 05/15/18 to 05/15/46 | |
U.S. Treasury Floating-Rate Note | | | 1.197 | | | | 07/31/18 | |
U.S. Treasury Inflation-Indexed Bonds | | | 0.750 to 3.875 | | | | 01/15/25 to 02/15/47 | |
U.S. Treasury Inflation-Indexed Notes | | | 0.125 to 1.875 | | | | 01/15/18 to 07/15/27 | |
U.S. Treasury Interest-Only Stripped Securities | | | 0.000 | | | | 08/15/18 to 11/15/45 | |
U.S. Treasury Notes | | | 0.625 to 4.000 | | | | 09/30/17 to 11/15/25 | |
U.S. Treasury Principal-Only Stripped Securities | | | 0.000 | | | | 11/15/18 to 11/15/45 | |
| | |
| 38 | | The accompanying notes are an integral part of these financial statements. |
GOLDMAN SACHS FUNDS — FINANCIAL SQUARE FUNDS
|
| ADDITIONAL INVESTMENT INFORMATION (continued) |
JOINT REPURCHASE AGREEMENT ACCOUNT III — At August 31, 2017, the Government Fund had undivided interests in the Joint Repurchase Agreement Account III with a maturity date of September 1, 2017, as follows:
| | | | |
| Principal Amount | | Maturity Value | | Collateral Value |
| $7,618,700,000 | | $7,618,927,655 | | $7,829,067,373 |
REPURCHASE AGREEMENTS — At August 31, 2017, the Principal Amounts of the Government Fund’s interest in the Joint Repurchase Agreement Account III were as follows:
| | | | | | | | |
Counterparty | | Interest Rate | | | Principal Amount | |
ABN Amro Bank N.V. | | | 1.070 | % | | $ | 661,755,801 | |
Bank of America, N.A. | | | 1.080 | | | | 472,682,715 | |
Bank of Nova Scotia (The) | | | 1.080 | | | | 2,079,803,946 | |
BNP Paribas | | | 1.080 | | | | 718,477,727 | |
Citigroup Global Markets, Inc. | | | 1.080 | | | | 613,542,164 | |
TD Securities (USA) LLC | | | 1.090 | | | | 236,341,357 | |
Wells Fargo Securities, LLC | | | 1.070 | | | | 2,836,096,290 | |
| TOTAL | | | $ | 7,618,700,000 | |
At August 31, 2017, the Joint Repurchase Agreement Account III was fully collateralized by:
| | | | | | | | |
| Issuer | | Interest Rates | | | Maturity Dates | |
Federal Farm Credit Bank | | | 1.550 to 3.330 | % | | | 04/13/20 to 02/01/33 | |
Federal Home Loan Bank | | | 0.625 to 1.560 | | | | 10/26/17 to 07/03/19 | |
Federal Home Loan Mortgage Corp. | | | 0.800 to 9.500 | | | | 12/28/17 to 09/01/47 | |
Federal Home Loan Mortgage Corp. Stripped Security | | | 0.000 | | | | 03/15/30 | |
Federal National Mortgage Association | | | 0.875 to 7.500 | | | | 11/24/17 to 09/01/47 | |
Federal National Mortgage Association Stripped Security | | | 0.000 | | | | 11/15/30 | |
Government National Mortgage Association | | | 2.2500 to 11.000 | | | | 09/15/17 to 08/20/47 | |
U.S. Treasury Bills | | | 0.000 | | | | 09/14/17 to 11/02/17 | |
U.S. Treasury Bonds | | | 2.250 to 7.625 | | | | 11/15/22 to 08/15/47 | |
U.S. Treasury Inflation-Indexed Bonds | | | 1.750 to 2.125 | | | | 01/15/28 to 02/15/40 | |
U.S. Treasury Inflation-Indexed Notes | | | 0.375 to 0.625 | | | | 01/15/24 to 07/15/27 | |
U.S. Treasury Interest-Only Stripped Securities | | | 0.000 | | | | 02/15/20 to 05/15/43 | |
U.S. Treasury Notes | | | 0.750 to 2.625 | | | | 08/31/18 to 08/15/25 | |
U.S. Treasury Principal-Only Stripped Securities | | | 0.000 | | | | 08/15/29 to 02/15/46 | |
| | |
| The accompanying notes are an integral part of these financial statements. | | 39 |
GOLDMAN SACHS FUNDS — FINANCIAL SQUARE FUNDS
Statements of Assets and Liabilities
August 31, 2017
| | | | | | |
| | | | | Federal
Instruments
Fund | |
| | Assets: | | | | |
| | Investments, at value (cost $622,993,295, $37,439,986,320, $2,470,097,883, $1,467,055,502, $7,984,466, $48,958,086,315, $6,622,412,202 and $3,408,631,236) | | $ | 622,993,295 | |
| | Repurchase agreements, at value (cost $0, $51,207,625,000, $89,000,000, $25,000,000, $0, $0, $11,218,200,000 and $5,950,000,000) | | | — | |
| | Cash | | | 7,746,005 | |
| | Receivables: | | | | |
| | Interest | | | 185,022 | |
| | Fund shares sold | | | — | |
| | Investments sold | | | 9,336,816 | |
| | Reimbursement from investment advisor | | | 5,787 | |
| | Other assets | | | 1,193 | |
| | Total assets | | | 640,268,118 | |
| | | | | | |
| | Liabilities: | | | | |
| | Payables: | | | | |
| | Investments purchased | | | 1,096,064 | |
| | Dividend distribution | | | 24,446 | |
| | Fund shares redeemed | | | — | |
| | Management fees | | | 99,691 | |
| | Distribution and Service fees and Transfer Agency fees | | | 5,552 | |
| | Offering cost | | | — | |
| | Accrued expenses | | | 343,445 | |
| | Total liabilities | | | 1,569,198 | |
| | | | | | |
| | Net Assets: | | | | |
| | Paid-in capital | | | 638,687,795 | |
| | Undistributed (distributions in excess of) net investment income | | | 4,923 | |
| | Accumulated net realized gain (loss) | | | 6,202 | |
| | Net unrealized gain | | | — | |
| | | NET ASSETS | | $ | 638,698,920 | |
| | | Net Assets: | | | | |
| | | Institutional Shares | | $ | 556,457,427 | |
| | | Select Shares | | | 47,299 | |
| | | Preferred Shares | | | 50,252 | |
| | | Capital Shares | | | 16,147,277 | |
| | | Administration Shares | | | 50,767,423 | |
| | | Premier Shares | | | 50,098 | |
| | | Service Shares | | | 15,129,134 | |
| | | Class A Shares | | | — | |
| | | Class C Shares | | | — | |
| | | Resource Shares | | | — | |
| | | Cash Management Shares | | | 50,010 | |
| | | Class R6 Shares | | | — | |
| | | Total Net Assets | | $ | 638,698,920 | |
| | | Shares outstanding $0.001 par value (unlimited number of shares authorized): | | | | |
| | | Institutional Shares | | | 556,452,024 | |
| | | Select Shares | | | 47,299 | |
| | | Preferred Shares | | | 50,252 | |
| | | Capital Shares | | | 16,147,120 | |
| | | Administration Shares | | | 50,766,930 | |
| | | Premier Shares | | | 50,097 | |
| | | Service Shares | | | 15,128,987 | |
| | | Class A Shares | | | — | |
| | | Class C Shares | | | — | |
| | | Resource Shares | | | — | |
| | | Cash Management Shares | | | 50,009 | |
| | | Class R6 Shares | | | — | |
| | | Net asset value, offering and redemption price per share: | | | | |
| | | Institutional Shares | | | $1.00 | |
| | | Select Shares | | | 1.00 | |
| | | Preferred Shares | | | 1.00 | |
| | | Capital Shares | | | 1.00 | |
| | | Administration Shares | | | 1.00 | |
| | | Premier Shares | | | 1.00 | |
| | | Service Shares | | | 1.00 | |
| | | Class A Shares | | | — | |
| | | Class C Shares | | | — | |
| | | Resource Shares | | | — | |
| | | Cash Management Shares | | | 1.00 | |
| | | Class R6 Shares | | | — | |
| | |
| 40 | | The accompanying notes are an integral part of these financial statements. |
GOLDMAN SACHS FUNDS — FINANCIAL SQUARE FUNDS
| | | | | | | | | | | | | | | | | | | | | | | | | | | | | | | | | | | | | | | | |
| | | Government
Fund | | | | | Money
Market
Fund | | | | | Prime
Obligations
Fund | | | | | Tax-Exempt
Money Market
Fund | | | | | Treasury
Instruments
Fund | | | | | Treasury
Obligations
Fund | | | | | Treasury
Solutions
Fund | |
| | | | | | | | | | | | | | | | | | | | | | | | | | | | | | | | | | | | | | | | |
| | $ | 37,439,986,320 | | | | | $ | 2,470,530,923 | | | | | $ | 1,467,281,676 | | | | | $ | 7,984,617 | | | | | $ | 48,958,086,315 | | | | | $ | 6,622,412,202 | | | | | $ | 3,408,631,236 | |
| | | 51,207,625,000 | | | | | | 88,999,967 | | | | | | 25,000,338 | | | | | | — | | | | | | — | | | | | | 11,218,200,000 | | | | | | 5,950,000,000 | |
| | | 127,259 | | | | | | 6,224 | | | | | | 33,725 | | | | | | 83,463 | | | | | | 76,282 | | | | | | 889,951 | | | | | | 23,712 | |
| | | | | | | | | | | | | | | | | | | | | | | | | | | | | | | | | | | | | | | | |
| | | 43,294,100 | | | | | | 1,824,917 | | | | | | 1,286,194 | | | | | | 8,612 | | | | | | 23,353,120 | | | | | | 8,223,199 | | | | | | 2,233,183 | |
| | | 16,290,581 | | | | | | — | | | | | | 83,040 | | | | | | — | | | | | | 1,528,858 | | | | | | 4,295 | | | | | | 1,188,200 | |
| | | — | | | | | | — | | | | | | — | | | | | | 150,000 | | | | | | 1,449,609,562 | | | | | | — | | | | | | — | |
| | | — | | | | | | — | | | | | | 4,072 | | | | | | — | | | | | | — | | | | | | — | | | | | | — | |
| | | 189,589 | | | | | | 17,140 | | | | | | 6,255 | | | | | | 28 | | | | | | 107,180 | | | | | | 45,095 | | | | | | 18,983 | |
| | | 88,707,512,849 | | | | | | 2,561,379,171 | | | | | | 1,493,695,300 | | | | | | 8,226,720 | | | | | | 50,432,761,317 | | | | | | 17,849,774,742 | | | | | | 9,362,095,314 | |
| | | | | | | | | | | | | | | | | | | | | | | | | | | | | | | | | | | | | | | | |
| | | | | | | | | | | | | | | | | | | | | | | | | | | | | | | | | | | | | | | | |
| | | | | | | | | | | | | | | | | | | | | | | | | | | | | | | | | | | | | | | | |
| | | 128,538,472 | | | | | | — | | | | | | — | | | | | | 103,045 | | | | | | 1,992,782,288 | | | | | | 22,618,786 | | | | | | 13,949,912 | |
| | | 32,839,039 | | | | | | 1,143,803 | | | | | | 724,962 | | | | | | 2,051 | | | | | | 12,182,462 | | | | | | 5,356,612 | | | | | | 2,228,574 | |
| | | 20,485,502 | | | | | | — | | | | | | 624,898 | | | | | | — | | | | | | 476,244 | | | | | | 3,347,467 | | | | | | 55,837,218 | |
| | | 12,073,430 | | | | | | 356,975 | | | | | | 198,503 | | | | | | 6,028 | | | | | | 7,369,819 | | | | | | 2,614,470 | | | | | | 1,431,129 | |
| | | 781,573 | | | | | | 21,949 | | | | | | 12,408 | | | | | | 78 | | | | | | 409,485 | | | | | | 145,302 | | | | | | 88,072 | |
| | | — | | | | | | — | | | | | | — | | | | | | 12,236 | | | | | | — | | | | | | — | | | | | | — | |
| | | 1,858,504 | | | | | | 311,380 | | | | | | 275,780 | | | | | | 97,924 | | | | | | 1,067,557 | | | | | | 895,595 | | | | | | 300,604 | |
| | | 196,576,520 | | | | | | 1,834,107 | | | | | | 1,836,551 | | | | | | 221,362 | | | | | | 2,014,287,855 | | | | | | 34,978,232 | | | | | | 73,835,509 | |
| | | | | | | | | | | | | | | | | | | | | | | | | | | | | | | | | | | | | | | | |
| | | | | | | | | | | | | | | | | | | | | | | | | | | | | | | | | | | | | | | | |
| | | 88,510,885,617 | | | | | | 2,559,114,503 | | | | | | 1,491,632,401 | | | | | | 8,005,041 | | | | | | 48,418,462,531 | | | | | | 17,814,380,544 | | | | | | 9,287,806,221 | |
| | | 4,130,232 | | | | | | (3,582 | ) | | | | | (380 | ) | | | | | 143 | | | | | | 1,495,626 | | | | | | 924,499 | | | | | | 83,593 | |
| | | (4,079,520 | ) | | | | | 1,136 | | | | | | 216 | | | | | | 23 | | | | | | (1,484,695 | ) | | | | | (508,533 | ) | | | | | 369,991 | |
| | | — | | | | | | 433,007 | | | | | | 226,512 | | | | | | 151 | | | | | | — | | | | | | — | | | | | | — | |
| | | $ | 88,510,936,329 | | | | | $ | 2,559,545,064 | | | | | $ | 1,491,858,749 | | | | | $ | 8,005,358 | | | | | $ | 48,418,473,462 | | | | | $ | 17,814,796,510 | | | | | $ | 9,288,259,805 | |
| | | | | | | | | | | | | | | | | | | | | | | | | | | | | | | | | | | | | | | | | |
| | | $ | 79,411,936,527 | | | | | $ | 2,542,693,405 | | | | | $ | 1,467,979,062 | | | | | $ | 7,945,166 | | | | | | $44,355,447,926 | | | | | $ | 15,091,527,052 | | | | | $ | 8,619,491,400 | |
| | | | 2,921,971,208 | | | | | | 9,847,044 | | | | | | 18,081,672 | | | | | | 10,059 | | | | | | 47,839,409 | | | | | | 67,864,644 | | | | | | 7,333,347 | |
| | | | 553,780,972 | | | | | | 1,418,238 | | | | | | 1,002,711 | | | | | | 10,048 | | | | | | 39,754,043 | | | | | | 123,436,477 | | | | | | 14,565,190 | |
| | | | 893,496,000 | | | | | | 1,007 | | | | | | 407,445 | | | | | | 10,042 | | | | | | 1,054,816,848 | | | | | | 269,416,887 | | | | | | 215,819,550 | |
| | | | 4,138,361,602 | | | | | | 5,515,559 | | | | | | 4,282,194 | | | | | | 10,031 | | | | | | 2,817,291,101 | | | | | | 1,307,550,386 | | | | | | 237,557,397 | |
| | | | 101,311,118 | | | | | | 1,005 | | | | | | 1,005 | | | | | | — | | | | | | 56,059,272 | | | | | | 1,002 | | | | | | 15,511,842 | |
| | | | 337,218,596 | | | | | | 66,801 | | | | | | 102,656 | | | | | | 10,009 | | | | | | 47,233,480 | | | | | | 954,845,556 | | | | | | 144,727,769 | |
| | | | 55,505,617 | | | | | | — | | | | | | — | | | | | | — | | | | | | — | | | | | | — | | | | | | — | |
| | | | 5,937,152 | | | | | | — | | | | | | — | | | | | | — | | | | | | — | | | | | | — | | | | | | — | |
| | | | 74,864,520 | | | | | | 1,003 | | | | | | 1,002 | | | | | | 10,003 | | | | | | 1,000 | | | | | | 1,001 | | | | | | 1,001 | |
| | | | 3,779,501 | | | | | | 1,002 | | | | | | 1,002 | | | | | | — | | | | | | 30,383 | | | | | | 153,505 | | | | | | 33,252,309 | |
| | | | 12,773,516 | | | | | | — | | | | | | — | | | | | | — | | | | | | — | | | | | | — | | | | | | — | |
| | | $ | 88,510,936,329 | | | | | $ | 2,559,545,064 | | | | | $ | 1,491,858,749 | | | | | $ | 8,005,358 | | | | | | $48,418,473,462 | | | | | $ | 17,814,796,510 | | | | | $ | 9,288,259,805 | |
| | | | | | | | | | | | | | | | | | | | | | | | | | | | | | | | | | | | | | | | | |
| | | | 79,411,886,131 | | | | | | 2,541,915,416 | | | | | | 1,467,488,400 | | | | | | 7,944,981 | | | | | | 44,355,440,229 | | | | | | 15,091,174,672 | | | | | | 8,619,070,289 | |
| | | | 2,921,969,354 | | | | | | 9,844,031 | | | | | | 18,076,887 | | | | | | 10,058 | | | | | | 47,839,401 | | | | | | 67,863,061 | | | | | | 7,332,991 | |
| | | | 553,780,620 | | | | | | 1,417,804 | | | | | | 1,002,406 | | | | | | 10,048 | | | | | | 39,754,036 | | | | | | 123,433,596 | | | | | | 14,564,482 | |
| | | | 893,495,433 | | | | | | 1,007 | | | | | | 407,314 | | | | | | 10,042 | | | | | | 1,054,816,665 | | | | | | 269,410,600 | | | | | | 215,809,074 | |
| | | | 4,138,358,970 | | | | | | 5,513,872 | | | | | | 4,280,823 | | | | | | 10,031 | | | | | | 2,817,290,612 | | | | | | 1,307,519,855 | | | | | | 237,545,863 | |
| | | | 101,311,053 | | | | | | 1,005 | | | | | | 1,005 | | | | | | — | | | | | | 56,059,261 | | | | | | 1,002 | | | | | | 15,511,088 | |
| | | | 337,218,382 | | | | | | 66,780 | | | | | | 102,627 | | | | | | 10,009 | | | | | | 47,233,471 | | | | | | 954,823,258 | | | | | | 144,720,740 | |
| | | | 55,505,582 | | | | | | — | | | | | | — | | | | | | — | | | | | | — | | | | | | — | | | | | | — | |
| | | | 5,937,148 | | | | | | — | | | | | | — | | | | | | — | | | | | | — | | | | | | — | | | | | | — | |
| | | | 74,864,473 | | | | | | 1,003 | | | | | | 1,002 | | | | | | 10,003 | | | | | | 1,000 | | | | | | 1,001 | | | | | | 1,000 | |
| | | | 3,779,499 | | | | | | 1,002 | | | | | | 1,002 | | | | | | — | | | | | | 30,383 | | | | | | 153,501 | | | | | | 33,250,694 | |
| | | | 12,773,508 | | | | | | — | | | | | | — | | | | | | — | | | | | | — | | | | | | — | | | | | | — | |
| | | | | | | | | | | | | | | | | | | | | | | | | | | | | | | | | | | | | | | | | |
| | | | $1.00 | | | | | | $1.0003 | | | | | | $1.0003 | | | | | | $1.0000 | | | | | | $1.00 | | | | | | $1.00 | | | | | | $1.00 | |
| | | | 1.00 | | | | | | 1.0003 | | | | | | 1.0003 | | | | | | 1.0001 | | | | | | 1.00 | | | | | | 1.00 | | | | | | 1.00 | |
| | | | 1.00 | | | | | | 1.0003 | | | | | | 1.0003 | | | | | | 1.0000 | | | | | | 1.00 | | | | | | 1.00 | | | | | | 1.00 | |
| | | | 1.00 | | | | | | 1.0003 | | | | | | 1.0003 | | | | | | 1.0000 | | | | | | 1.00 | | | | | | 1.00 | | | | | | 1.00 | |
| | | | 1.00 | | | | | | 1.0003 | | | | | | 1.0003 | | | | | | 1.0000 | | | | | | 1.00 | | | | | | 1.00 | | | | | | 1.00 | |
| | | | 1.00 | | | | | | 1.0003 | | | | | | 1.0003 | | | | | | — | | | | | | 1.00 | | | | | | 1.00 | | | | | | 1.00 | |
| | | | 1.00 | | | | | | 1.0003 | | | | | | 1.0003 | | | | | | 1.0000 | | | | | | 1.00 | | | | | | 1.00 | | | | | | 1.00 | |
| | | | 1.00 | | | | | | — | | | | | | — | | | | | | — | | | | | | — | | | | | | — | | | | | | — | |
| | | | 1.00 | | | | | | — | | | | | | — | | | | | | — | | | | | | — | | | | | | — | | | | | | — | |
| | | | 1.00 | | | | | | 1.0003 | | | | | | 1.0003 | | | | | | 1.0000 | | | | | | 1.00 | | | | | | 1.00 | | | | | | 1.00 | |
| | | | 1.00 | | | | | | 1.0003 | | | | | | 1.0003 | | | | | | — | | | | | | 1.00 | | | | | | 1.00 | | | | | | 1.00 | |
| | | | 1.00 | | | | | | — | | | | | | — | | | | | | — | | | | | | — | | | | | | — | | | | | | — | |
| | |
| The accompanying notes are an integral part of these financial statements. | | 41 |
GOLDMAN SACHS FUNDS — FINANCIAL SQUARE FUNDS
Statements of Operations
For the Fiscal Year Ended August 31, 2017
| | | | | | |
| | | | | Federal
Instruments
Fund | |
| | Investment income: | | | | |
| | Interest income — from unaffiliated issuers | | $ | 4,887,482 | |
| | Interest income — from affiliated issuers | | | — | |
| | Total investment income | | | 4,887,482 | |
| | | | | | |
| | Expenses: | | | | |
| | Fund-Level Expenses: | | | | |
| | Management fees | | | 1,405,782 | |
| | Transfer Agency fees | | | 68,575 | |
| | Custody, accounting and administrative services | | | 22,938 | |
| | Registration fees | | | 138,095 | |
| | Printing and mailing fees | | | 132,891 | |
| | Professional fees | | | 103,163 | |
| | Trustee fees | | | 15,876 | |
| | Amortization of offering costs | | | 10,667 | |
| | Other | | | 23,267 | |
| | Subtotal | | | 1,921,254 | |
| | Class Specific Expenses: | | | | |
| | Administration Share fees | | | 118,658 | |
| | Capital Share fees | | | 24,110 | |
| | Service Share fees | | | 72,582 | |
| | Select Share fees | | | 14 | |
| | Preferred Share fees | | | 50 | |
| | Resource Share fees | | | — | |
| | Premier Share fees | | | 175 | |
| | Distribution fees — Resource Shares | | | — | |
| | Distribution and Service fees — Class A Shares | | | — | |
| | Distribution fees — Class C Shares(a) | | | — | |
| | Cash Management Share fees | | | 250 | |
| | Distribution fees — Cash Management Shares | | | 150 | |
| | Class C Share fees(a) | | | — | |
| | Total expenses | | | 2,137,243 | |
| | Less — expense reductions | | | (533,526 | ) |
| | Net expenses | | | 1,603,717 | |
| | NET INVESTMENT INCOME | | $ | 3,283,765 | |
| | Net realized gain (loss) from investment transactions | | | 16,482 | |
| | Unrealized gain from investment transactions | | | — | |
| | Net realized and unrealized gain (loss) | | | 16,482 | |
| | NET INCREASE IN NET ASSETS RESULTING FROM OPERATIONS | | $ | 3,300,247 | |
| | (a) | | At the close of business on October 11, 2016, Class C Shares of the Prime Obligations Fund were liquidated. |
| | |
| 42 | | The accompanying notes are an integral part of these financial statements. |
GOLDMAN SACHS FUNDS — FINANCIAL SQUARE FUNDS
| | | | | | | | | | | | | | | | | | | | | | | | | | | | | | | | | | | | | | | | |
| | | Government
Fund | | | | | Money
Market
Fund | | | | | Prime
Obligations
Fund | | | | | Tax-Exempt
Money Market
Fund | | | | | Treasury
Instruments
Fund | | | | | Treasury
Obligations
Fund | | | | | Treasury
Solutions
Fund | |
| | | | | | | | | | | | | | | | | | | | | | | | | | | | | | | | | | | | | | | | |
| | $ | 670,526,085 | | | | | $ | 25,867,092 | | | | | $ | 13,612,815 | | | | | $ | 59,156 | | | | | $ | 337,877,699 | | | | | $ | 135,883,512 | | | | | $ | 65,278,977 | |
| | | 94,393 | | | | | | — | | | | | | — | | | | | | — | | | | | | — | | | | | | 15,653 | | | | | | — | |
| | | 670,620,478 | | | | | | 25,867,092 | | | | | | 13,612,815 | | | | | | 59,156 | | | | | | 337,877,699 | | | | | | 135,899,165 | | | | | | 65,278,977 | |
| | | | | | | | | | | | | | | | | | | | | | | | | | | | | | | | | | | | | | | | |
| | | | | | | | | | | | | | | | | | | | | | | | | | | | | | | | | | | | | | | | |
| | | | | | | | | | | | | | | | | | | | | | | | | | | | | | | | | | | | | | | | |
| | | 188,814,877 | | | | | | 5,995,249 | | | | | | 3,148,205 | | | | | | 16,638 | | | | | | 102,865,938 | | | | | | 41,673,547 | | | | | | 19,852,352 | |
| | | 9,210,482 | | | | | | 292,451 | | | | | | 153,571 | | | | | | 812 | | | | | | 5,017,851 | | | | | | 2,032,856 | | | | | | 968,407 | |
| | | 3,193,543 | | | | | | 306,723 | | | | | | 225,050 | | | | | | 192,234 | | | | | | 1,736,129 | | | | | | 722,291 | | | | | | 349,479 | |
| | | 1,012,431 | | | | | | 237,633 | | | | | | 250,901 | | | | | | 104,089 | | | | | | 578,749 | | | | | | 410,334 | | | | | | 165,399 | |
| | | 636,269 | | | | | | 126,940 | | | | | | 93,825 | | | | | | 41,824 | | | | | | 750,203 | | | | | | 114,754 | | | | | | 97,051 | |
| | | 263,935 | | | | | | 137,390 | | | | | | 108,557 | | | | | | 109,306 | | | | | | 224,872 | | | | | | 161,584 | | | | | | 151,570 | |
| | | 233,514 | | | | | | 19,600 | | | | | | 13,413 | | | | | | 10,963 | | | | | | 147,347 | | | | | | 41,704 | | | | | | 29,650 | |
| | | — | | | | | | — | | | | | | — | | | | | | 151,820 | | | | | | — | | | | | | — | | | | | | — | |
| | | 869,734 | | | | | | 224,266 | | | | | | 142,346 | | | | | | 67,267 | | | | | | 539,578 | | | | | | 263,373 | | | | | | 149,222 | |
| | | 204,234,785 | | | | | | 7,340,252 | | | | | | 4,135,868 | | | | | | 694,953 | | | | | | 111,860,667 | | | | | | 45,420,443 | | | | | | 21,763,130 | |
| | | | | | | | | | | | | | | | | | | | | | | | | | | | | | | | | | | | | | | | |
| | | 9,677,814 | | | | | | 68,349 | | | | | | 201,748 | | | | | | 25 | | | | | | 5,378,036 | | | | | | 3,288,294 | | | | | | 526,943 | |
| | | 1,997,522 | | | | | | 8,060 | | | | | | 14,238 | | | | | | 15 | | | | | | 972,693 | | | | | | 439,071 | | | | | | 373,942 | |
| | | 1,837,269 | | | | | | 9,433 | | | | | | 135,168 | | | | | | 50 | | | | | | 342,537 | | | | | | 4,671,412 | | | | | | 841,230 | |
| | | 828,799 | | | | | | 31,014 | | | | | | 3,758 | | | | | | 3 | | | | | | 18,017 | | | | | | 40,625 | | | | | | 2,908 | |
| | | 724,145 | | | | | | 7,235 | | | | | | 23,172 | | | | | | 10 | | | | | | 49,666 | | | | | | 117,100 | | | | | | 32,910 | |
| | | 387,831 | | | | | | 5 | | | | | | 19,908 | | | | | | 50 | | | | | | 5 | | | | | | 5 | | | | | | 5 | |
| | | 227,926 | | | | | | 3 | | | | | | 4 | | | | | | — | | | | | | 161,330 | | | | | | 3 | | | | | | 97,258 | |
| | | 116,349 | | | | | | 2 | | | | | | 5,972 | | | | | | 15 | | | | | | 2 | | | | | | 1 | | | | | | 1 | |
| | | 112,883 | | | | | | — | | | | | | — | | | | | | — | | | | | | — | | | | | | — | | | | | | — | |
| | | 73,174 | | | | | | — | | | | | | 12,745 | | | | | | — | | | | | | — | | | | | | — | | | | | | — | |
| | | 49,103 | | | | | | 905 | | | | | | 5 | | | | | | — | | | | | | 966 | | | | | | 98 | | | | | | 311,222 | |
| | | 29,462 | | | | | | 543 | | | | | | 3 | | | | | | — | | | | | | 579 | | | | | | 59 | | | | | | 186,733 | |
| | | 24,392 | | | | | | — | | | | | | 4,248 | | | | | | — | | | | | | — | | | | | | — | | | | | | — | |
| | | 220,321,454 | | | | | | 7,465,801 | | | | | | 4,556,837 | | | | | | 695,121 | | | | | | 118,784,498 | | | | | | 53,977,111 | | | | | | 24,136,282 | |
| | | (41,927,189 | ) | | | | | (1,960,968 | ) | | | | | (1,357,367 | ) | | | | | (680,036 | ) | | | | | (12,943,815 | ) | | | | | (6,282,246 | ) | | | | | (2,902,620 | ) |
| | | 178,394,265 | | | | | | 5,504,833 | | | | | | 3,199,470 | | | | | | 15,085 | | | | | | 105,840,683 | | | | | | 47,694,865 | | | | | | 21,233,662 | |
| | $ | 492,226,213 | | | | | $ | 20,362,259 | | | | | $ | 10,413,345 | | | | | $ | 44,071 | | | | | $ | 232,037,016 | | | | | $ | 88,204,300 | | | | | $ | 44,045,315 | |
| | | (4,078,164 | ) | | | | | 127,471 | | | | | | 68,191 | | | | | | 23 | | | | | | (538,106 | ) | | | | | (177,205 | ) | | | | | 676,500 | |
| | | — | | | | | | 433,007 | | | | | | 226,512 | | | | | | 151 | | | | | | — | | | | | | — | | | | | | — | |
| | | (4,078,164 | ) | | | | | 560,478 | | | | | | 294,703 | | | | | | 174 | | | | | | (538,106 | ) | | | | | (177,205 | ) | | | | | 676,500 | |
| | $ | 488,148,049 | | | | | $ | 20,922,737 | | | | | $ | 10,708,048 | | | | | $ | 44,245 | | | | | $ | 231,498,910 | | | | | $ | 88,027,095 | | | | | $ | 44,721,815 | |
| | |
| The accompanying notes are an integral part of these financial statements. | | 43 |
GOLDMAN SACHS FUNDS — FINANCIAL SQUARE FUNDS
Statements of Changes in Net Assets
| | | | | | | | | | |
| | | | | Federal Instruments Fund | |
| | | | | For the Fiscal
Year Ended
August 31, 2017 | | | For the
Period Ended
August 31, 2016* | |
| | From operations: | | | | |
| | Net investment income | | $ | 3,283,765 | | | $ | 802,111 | |
| | Net realized gain (loss) from investment transactions | | | 16,482 | | | | 125,180 | |
| | Unrealized gain from investment transactions | | | — | | | | — | |
| | Net increase in net assets resulting from operations | | | 3,300,247 | | | | 927,291 | |
| | | | | | | | | | |
| | Distributions to shareholders: | | | | |
| | From net investment income: | | | | | | | | |
| | Institutional Shares | | | (3,095,257 | ) | | | (804,850 | ) |
| | Select Shares | | | (228 | ) | | | (61 | ) |
| | Preferred Shares | | | (206 | ) | | | (34 | ) |
| | Capital Shares | | | (49,366 | ) | | | (18 | ) |
| | Administration Shares | | | (124,894 | ) | | | — | |
| | Premier Shares | | | (93 | ) | | | (1 | ) |
| | Service Shares | | | (13,716 | ) | | | — | |
| | Class A Shares(a) | | | — | | | | — | |
| | Class C Shares(a)(b) | | | — | | | | — | |
| | Resource Shares | | | — | | | | — | |
| | Cash Management Shares | | | (5 | ) | | | (1 | ) |
| | Class R6 Shares(c) | | | — | | | | — | |
| | From net realized gains: | | | | | | | | |
| | Institutional Shares | | | (41,633 | ) | | | (80,949 | ) |
| | Select Shares | | | (3 | ) | | | (7 | ) |
| | Preferred Shares | | | (4 | ) | | | (7 | ) |
| | Capital Shares | | | (1,209 | ) | | | (7 | ) |
| | Administration Shares | | | (3,111 | ) | | | (3,671 | ) |
| | Premier Shares | | | (3 | ) | | | (7 | ) |
| | Service Shares | | | (913 | ) | | | (1,072 | ) |
| | Class A Shares(a) | | | — | | | | — | |
| | Class C Shares(a)(b) | | | — | | | | — | |
| | Resource Shares | | | — | | | | — | |
| | Cash Management Shares | | | (3 | ) | | | (7 | ) |
| | Class R6 Shares(c) | | | — | | | | — | |
| | Total distributions to shareholders | | | (3,330,644 | ) | | | (890,692 | ) |
| | | | | | | | | | |
| | From share transactions: | | | | | | | | |
| | Proceeds from sales of shares | | | 1,339,201,171 | | | | 1,546,236,485 | |
| | Reinvestment of distributions | | | 3,202,941 | | | | 876,007 | |
| | Cost of shares redeemed | | | (1,340,103,614 | ) | | | (910,720,272 | ) |
| | Net increase (decrease) in net assets resulting from share transactions | | | 2,300,498 | | | | 636,392,220 | |
| | NET INCREASE (DECREASE) | | | 2,270,101 | | | | 636,428,819 | |
| | | | | | | | | | |
| | Net assets: | | | | | | | | |
| | Beginning of year or period | | | 636,428,819 | | | | — | |
| | End of year or period | | $ | 638,698,920 | | | $ | 636,428,819 | |
| | Undistributed (distributions in excess of) net investment income | | $ | 4,923 | | | $ | 37,930 | |
| | * | | Commenced operations on October 30, 2015. |
| | (a) | | Class A Shares and Class C Shares of the Government Fund commenced operations on February 29, 2016. |
| | (b) | | At the close of business on October 11, 2016, Class C Shares of the Prime Obligations Fund were liquidated. |
| | (c) | | Class R6 Shares of the Government Fund commenced operations on December 29, 2015. |
| | |
| 44 | | The accompanying notes are an integral part of these financial statements. |
GOLDMAN SACHS FUNDS — FINANCIAL SQUARE FUNDS
| | | | | | | | | | | | | | | | | | | | | | | | | | | | | | | | | | |
| | | Government Fund | | | | | Money Market Fund | | | | | Prime Obligations Fund | |
| | | For the Fiscal
Year Ended
August 31, 2017 | | | | | For the Fiscal
Year Ended
August 31, 2016 | | | | | For the Fiscal
Year Ended
August 31, 2017 | | | | | For the Fiscal
Year Ended
August 31, 2016 | | | | | For the Fiscal
Year Ended
August 31, 2017 | | | | | For the Fiscal
Year Ended
August 31, 2016 | |
| | | | | | | | | | | | | | | | | | | | | | |
| | $ | 492,226,213 | | | | | $ | 83,508,452 | | | | | $ | 20,362,259 | | | | | $ | 120,080,500 | | | | | $ | 10,413,345 | | | | | $ | 37,263,404 | |
| | | (4,078,164 | ) | | | | | 6,514,881 | | | | | | 127,471 | | | | | | 2,004,070 | | | | | | 68,191 | | | | | | 744,822 | |
| | | — | | | | | | — | | | | | | 433,007 | | | | | | — | | | | | | 226,512 | | | | | | — | |
| | | 488,148,049 | | | | | | 90,023,333 | | | | | | 20,922,737 | | | | | | 122,084,570 | | | | | | 10,708,048 | | | | | | 38,008,226 | |
| | | | | | | | | | | | | | | | | | | | | | | | | | | | | | | | | | |
| | | | | | | | | | | | | | | | | | | | | | |
| | | | | | | | | | | | | | | | | | | | | | | | | | | | | | | | | | |
| | | (453,699,961 | ) | | | | | (80,632,652 | ) | | | | | (19,843,402 | ) | | | | | (111,988,540 | ) | | | | | (10,045,264 | ) | | | | | (34,448,321 | ) |
| | | (14,324,690 | ) | | | | | (1,393,511 | ) | | | | | (417,452 | ) | | | | | (7,001,821 | ) | | | | | (121,442 | ) | | | | | (344,600 | ) |
| | | (3,111,773 | ) | | | | | (449,597 | ) | | | | | (23,247 | ) | | | | | (200,460 | ) | | | | | (69,013 | ) | | | | | (616,359 | ) |
| | | (4,882,786 | ) | | | | | (925,822 | ) | | | | | (10,738 | ) | | | | | (540,439 | ) | | | | | (22,889 | ) | | | | | (233,478 | ) |
| | | (12,024,785 | ) | | | | | (127,879 | ) | | | | | (65,350 | ) | | | | | (349,375 | ) | | | | | (123,177 | ) | | | | | (1,597,312 | ) |
| | | (178,746 | ) | | | | | (4 | ) | | | | | (7 | ) | | | | | (4 | ) | | | | | (7 | ) | | | | | (4 | ) |
| | | (396,722 | ) | | | | | — | | | | | | (2,041 | ) | | | | | — | | | | | | (9,330 | ) | | | | | (18,231 | ) |
| | | (153,078 | ) | | | | | (23 | ) | | | | | — | | | | | | — | | | | | | — | | | | | | — | |
| | | (597 | ) | | | | | (2 | ) | | | | | — | | | | | | — | | | | | | (236 | ) | | | | | (1,178 | ) |
| | | (41,796 | ) | | | | | — | | | | | | (7 | ) | | | | | (4 | ) | | | | | (614 | ) | | | | | (3,917 | ) |
| | | (1,165 | ) | | | | | (5 | ) | | | | | (19 | ) | | | | | (15 | ) | | | | | (5 | ) | | | | | (4 | ) |
| | | (69,903 | ) | | | | | (351 | ) | | | | | — | | | | | | — | | | | | | — | | | | | | — | |
| | | | | | | | | | | | | | | | | | | | | | | | | | | | | | | | | | |
| | | — | | | | | | (5,105,247 | ) | | | | | (119,964 | ) | | | | | (1,869,604 | ) | | | | | (64,066 | ) | | | | | (594,706 | ) |
| | | — | | | | | | (103,525 | ) | | | | | (1,177 | ) | | | | | (124,986 | ) | | | | | (918 | ) | | | | | (5,820 | ) |
| | | — | | | | | | (50,081 | ) | | | | | (23 | ) | | | | | (5,192 | ) | | | | | (171 | ) | | | | | (16,250 | ) |
| | | — | | | | | | (155,746 | ) | | | | | — | | | | | | (15,719 | ) | | | | | (67 | ) | | | | | (8,539 | ) |
| | | — | | | | | | (274,192 | ) | | | | | (577 | ) | | | | | (19,379 | ) | | | | | (725 | ) | | | | | (107,705 | ) |
| | | — | | | | | | — | | | | | | — | | | | | | — | | | | | | — | | | | | | — | |
| | | — | | | | | | (21,760 | ) | | | | | (57 | ) | | | | | (1,296 | ) | | | | | (368 | ) | | | | | (40,925 | ) |
| | | — | | | | | | (17 | ) | | | | | — | | | | | | — | | | | | | — | | | | | | — | |
| | | — | | | | | | (2 | ) | | | | | — | | | | | | — | | | | | | (12 | ) | | | | | (1,175 | ) |
| | | — | | | | | | (840 | ) | | | | | — | | | | | | — | | | | | | (3 | ) | | | | | (3,877 | ) |
| | | — | | | | | | — | | | | | | — | | | | | | (500 | ) | | | | | — | | | | | | — | |
| | | — | | | | | | (14 | ) | | | | | — | | | | | | — | | | | | | — | | | | | | — | |
| | | (488,886,002 | ) | | | | | (89,241,270 | ) | | | | | (20,484,061 | ) | | | | | (122,117,334 | ) | | | | | (10,458,307 | ) | | | | | (38,042,401 | ) |
| | | | | | | | | | | | | | | | | | | | | | | | | | | | | | | | | | |
| | | | | | | | | | | | | | | | | | | | | | | | | | | | | | | | | | |
| | | 724,720,812,323 | | | | | | 367,506,460,914 | | | | | | 20,323,331,010 | | | | | | 374,647,465,196 | | | | | | 9,837,824,307 | | | | | | 130,502,049,346 | |
| | | 249,258,134 | | | | | | 49,935,946 | | | | | | 10,300,366 | | | | | | 68,394,597 | | | | | | 4,935,078 | | | | | | 12,770,800 | |
| | | (707,727,119,123 | ) | | | | | (330,056,654,786 | ) | | | | | (34,703,003,813 | ) | | | | | (393,229,703,574 | ) | | | | | (17,674,336,143 | ) | | | | | (133,691,524,490 | ) |
| | | 17,242,951,334 | | | | | | 37,499,742,074 | | | | | | (14,369,372,437 | ) | | | | | (18,513,843,781 | ) | | | | | (7,831,576,758 | ) | | | | | (3,176,704,344 | ) |
| | | 17,242,213,381 | | | | | | 37,500,524,137 | | | | | | (14,368,933,761 | ) | | | | | (18,513,876,545 | ) | | | | | (7,831,327,017 | ) | | | | | (3,176,738,519 | ) |
| | | | | | | | | | | | | | | | | | | | | | | | | | | | | | | | | | |
| | | | | | | | | | | | | | | | | | | | | | | | | | | | | | | | | | |
| | | 71,268,722,948 | | | | | | 33,768,198,811 | | | | | | 16,928,478,825 | | | | | | 35,442,355,370 | | | | | | 9,323,185,766 | | | | | | 12,499,924,285 | |
| | $ | 88,510,936,329 | | | | | $ | 71,268,722,948 | | | | | $ | 2,559,545,064 | | | | | $ | 16,928,478,825 | | | | | $ | 1,491,858,749 | | | | | $ | 9,323,185,766 | |
| | $ | 4,130,232 | | | | | $ | (76,265 | ) | | | | $ | (3,582 | ) | | | | $ | (3,578 | ) | | | | $ | (380 | ) | | | | $ | (97,955 | ) |
| | |
| The accompanying notes are an integral part of these financial statements. | | 45 |
GOLDMAN SACHS FUNDS — FINANCIAL SQUARE FUNDS
Statements of Changes in Net Assets (continued)
| | | | | | | | | | |
| | | | | Tax-Exempt Money Market Fund | |
| | | | | For the Fiscal
Year Ended
August 31, 2017 | | | For the
Period Ended
August 31, 2016* | |
| | From operations: | | | | |
| | Net investment income | | $ | 44,071 | | | $ | 3,905 | |
| | Net realized gain (loss) from investment transactions | | | 23 | | | | — | |
| | Unrealized gain from investment transactions | | | 151 | | | | — | |
| | Net increase in net assets resulting from operations | | | 44,245 | | | | 3,905 | |
| | | | | | | | | | |
| | Distributions to shareholders: | | | | |
| | From net investment income: | | | | | | | | |
| | Institutional Shares | | | (43,899 | ) | | | (3,886 | ) |
| | Select Shares | | | (50 | ) | | | (7 | ) |
| | Preferred Shares | | | (43 | ) | | | (4 | ) |
| | Capital Shares | | | (39 | ) | | | (3 | ) |
| | Administration Shares | | | (28 | ) | | | (2 | ) |
| | Premier Shares | | | — | | | | — | |
| | Service Shares | | | (8 | ) | | | (1 | ) |
| | Resource Shares | | | (4 | ) | | | (2 | ) |
| | Cash Management Shares | | | — | | | | — | |
| | From net realized gains: | | | | | | | | |
| | Institutional Shares | | | — | | | | — | |
| | Select Shares | | | — | | | | — | |
| | Preferred Shares | | | — | | | | — | |
| | Capital Shares | | | — | | | | — | |
| | Administration Shares | | | — | | | | — | |
| | Premier Shares | | | — | | | | — | |
| | Service Shares | | | — | | | | — | |
| | Cash Management Shares | | | — | | | | — | |
| | Total distributions to shareholders | | | (44,071 | ) | | | (3,905 | ) |
| | | | | | | | | | |
| | From share transactions: | | | | | | | | |
| | Proceeds from sales of shares | | | 16,744,417 | | | | 15,055,338 | |
| | Reinvestment of distributions | | | 20,263 | | | | 2,664 | |
| | Cost of shares redeemed | | | (21,314,800 | ) | | | (2,502,698 | ) |
| | Net increase (decrease) in net assets resulting from share transactions | | | (4,550,120 | ) | | | 12,555,304 | |
| | NET INCREASE (DECREASE) | | | (4,549,946 | ) | | | 12,555,304 | |
| | | | | | | | | | |
| | Net assets: | | | | | | | | |
| | Beginning of year or period | | | 12,555,304 | | | | — | |
| | End of year or period | | $ | 8,005,358 | | | $ | 12,555,304 | |
| | Undistributed (distributions in excess of) net investment income | | $ | 143 | | | $ | 143 | |
| | * | | Commenced operations on March 31, 2016. |
| | |
| 46 | | The accompanying notes are an integral part of these financial statements. |
GOLDMAN SACHS FUNDS — FINANCIAL SQUARE FUNDS
| | | | | | | | | | | | | | | | | | | | | | | | | | | | | | | | | | |
| | | Treasury Instruments Fund | | | | | Treasury Obligations Fund | | | | | Treasury Solutions Fund | |
| | | For the Fiscal
Year Ended
August 31, 2017 | | | | | For the Fiscal
Year Ended
August 31, 2016 | | | | | For the Fiscal
Year Ended
August 31, 2017 | | | | | For the Fiscal
Year Ended
August 31, 2016 | | | | | For the Fiscal
Year Ended
August 31, 2017 | | | | | For the Fiscal
Year Ended
August 31, 2016 | |
| | | | | | | | | | | | | | | | | | | | | | |
| | $ | 232,037,016 | | | | | $ | 58,768,195 | | | | | $ | 88,204,300 | | | | | $ | 19,011,263 | | | | | $ | 44,045,315 | | | | | $ | 10,432,698 | |
| | | (538,106 | ) | | | | | 6,465,778 | | | | | | (177,205 | ) | | | | | 3,041,197 | | | | | | 676,500 | | | | | | 2,958,048 | |
| | | — | | | | | | — | | | | | | — | | | | | | — | | | | | | — | | | | | | — | |
| | | 231,498,910 | | | | | | 65,233,973 | | | | | | 88,027,095 | | | | | | 22,052,460 | | | | | | 44,721,815 | | | | | | 13,390,746 | |
| | | | | | | | | | | | | | | | | | | | | | | | | | | | | | | | | | |
| | | | | | | | | | | | | | | | | | | | | | |
| | | | | | | | | | | | | | | | | | | | | | | | | | | | | | | | | | |
| | | (223,399,441 | ) | | | | | (58,873,948 | ) | | | | | (81,872,454 | ) | | | | | (18,732,046 | ) | | | | | (42,396,917 | ) | | | | | (10,526,178 | ) |
| | | (260,304 | ) | | | | | (17,091 | ) | | | | | (641,961 | ) | | | | | (203,396 | ) | | | | | (41,095 | ) | | | | | (8,401 | ) |
| | | (171,143 | ) | | | | | (16,992 | ) | | | | | (467,902 | ) | | | | | (70,392 | ) | | | | | (83,940 | ) | | | | | (17,244 | ) |
| | | (2,449,171 | ) | | | | | (68,383 | ) | | | | | (993,944 | ) | | | | | (158,841 | ) | | | | | (748,595 | ) | | | | | (13,055 | ) |
| | | (5,622,274 | ) | | | | | — | | | | | | (3,230,250 | ) | | | | | — | | | | | | (594,926 | ) | | | | | — | |
| | | (91,234 | ) | | | | | — | | | | | | (4 | ) | | | | | (4 | ) | | | | | (37,332 | ) | | | | | (4 | ) |
| | | (37,368 | ) | | | | | — | | | | | | (992,673 | ) | | | | | — | | | | | | (141,952 | ) | | | | | — | |
| | | (4 | ) | | | | | (4 | ) | | | | | (4 | ) | | | | | (3 | ) | | | | | (4 | ) | | | | | (4 | ) |
| | | (2 | ) | | | | | (3 | ) | | | | | (17 | ) | | | | | (4 | ) | | | | | (554 | ) | | | | | — | |
| | | | | | | | | | | | | | | | | | | | | | | | | | | | | | | | | | |
| | | (295,736 | ) | | | | | (5,203,649 | ) | | | | | — | | | | | | (1,937,931 | ) | | | | | (445,992 | ) | | | | | (2,991,632 | ) |
| | | (683 | ) | | | | | (2,197 | ) | | | | | — | | | | | | (23,348 | ) | | | | | (595 | ) | | | | | (2,987 | ) |
| | | (384 | ) | | | | | (3,344 | ) | | | | | — | | | | | | (14,040 | ) | | | | | (4,053 | ) | | | | | (15,473 | ) |
| | | — | | | | | | (43,662 | ) | | | | | — | | | | | | (65,202 | ) | | | | | (16,207 | ) | | | | | (63,142 | ) |
| | | — | | | | | | (23,841 | ) | | | | | — | | | | | | (95,744 | ) | | | | | (4,192 | ) | | | | | (14,889 | ) |
| | | (364 | ) | | | | | (14 | ) | | | | | — | | | | | | — | | | | | | (1,969 | ) | | | | | — | |
| | | (2,293 | ) | | | | | (1,592 | ) | | | | | — | | | | | | (55,685 | ) | | | | | (8,940 | ) | | | | | (14,056 | ) |
| | | (5 | ) | | | | | (1 | ) | | | | | — | | | | | | — | | | | | | (5,938 | ) | | | | | (8,462 | ) |
| | | (232,330,406 | ) | | | | | (64,254,721 | ) | | | | | (88,199,209 | ) | | | | | (21,356,636 | ) | | | | | (44,533,201 | ) | | | | | (13,675,527 | ) |
| | | | | | | | | | | | | | | | | | | | | | | | | | | | | | | | | | |
| | | | | | | | | | | | | | | | | | | | | | | | | | | | | | | | | | |
| | | 196,395,495,378 | | | | | | 184,356,949,726 | | | | | | 175,343,750,193 | | | | | | 111,588,712,687 | | | | | | 31,404,934,079 | | | | | | 32,805,057,997 | |
| | | 154,325,084 | | | | | | 39,025,013 | | | | | | 49,408,674 | | | | | | 10,844,001 | | | | | | 29,403,630 | | | | | | 9,307,231 | |
| | | (201,552,970,536 | ) | | | | | (167,833,814,688 | ) | | | | | (180,852,029,873 | ) | | | | | (104,478,394,348 | ) | | | | | (32,779,331,348 | ) | | | | | (33,283,705,380 | ) |
| | | (5,003,150,074 | ) | | | | | 16,562,160,051 | | | | | | (5,458,871,006 | ) | | | | | 7,121,162,340 | | | | | | (1,344,993,639 | ) | | | | | (469,340,152 | ) |
| | | (5,003,981,570 | ) | | | | | 16,563,139,303 | | | | | | (5,459,043,120 | ) | | | | | 7,121,858,164 | | | | | | (1,344,805,025 | ) | | | | | (469,624,933 | ) |
| | | | | | | | | | | | | | | | | | | | | | | | | | | | | | | | | | |
| | | | | | | | | | | | | | | | | | | | | | | | | | | | | | | | | | |
| | | 53,422,455,032 | | | | | | 36,859,315,729 | | | | | | 23,273,839,630 | | | | | | 16,151,981,466 | | | | | | 10,633,064,830 | | | | | | 11,102,689,763 | |
| | $ | 48,418,473,462 | | | | | $ | 53,422,455,032 | | | | | $ | 17,814,796,510 | | | | | $ | 23,273,839,630 | | | | | $ | 9,288,259,805 | | | | | $ | 10,633,064,830 | |
| | $ | 1,495,626 | | | | | $ | (232,873 | ) | | | | $ | 924,499 | | | | | $ | (190,250 | ) | | | | $ | 83,593 | | | | | $ | (130,737 | ) |
| | |
| The accompanying notes are an integral part of these financial statements. | | 47 |
FINANCIAL SQUARE FEDERAL INSTRUMENTS FUND
Financial Highlights
Selected Data for a Share Outstanding Throughout Each Period
| | | | | | | | | | | | | | | | | | | | | | | | | | | | | | |
| | | | | | | | From
investment operations | | | Distributions
to shareholders | |
| | | Year - Share Class | | Net asset value, beginning of period | | | Net
investment
income(a) | | | Net realized
gain | | | Total from
investment
operations | | | From net
investment
income | | | From net
realized
gains | | | Total
distributions(b) | |
| | FOR THE FISCAL YEAR ENDED AUGUST 31, | | | | | | | | | | | | | |
| | 2017 - Institutional Shares | | $ | 1.00 | | | $ | 0.005 | | | $ | — | (d) | | $ | 0.005 | | | $ | (0.005 | ) | | $ | — | (d) | | $ | (0.005 | ) |
| | 2017 - Select Shares | | | 1.00 | | | | 0.005 | | | | — | (d) | | | 0.005 | | | | (0.005 | ) | | | — | (d) | | | (0.005 | ) |
| | 2017 - Preferred Shares | | | 1.00 | | | | 0.004 | | | | — | (d) | | | 0.004 | | | | (0.004 | ) | | | — | (d) | | | (0.004 | ) |
| | 2017 - Capital Shares | | | 1.00 | | | | 0.003 | | | | 0.001 | | | | 0.004 | | | | (0.004 | ) | | | — | (d) | | | (0.004 | ) |
| | 2017 - Administration Shares | | | 1.00 | | | | 0.003 | | | | — | (d) | | | 0.003 | | | | (0.003 | ) | | | — | (d) | | | (0.003 | ) |
| | 2017 - Premier Shares | | | 1.00 | | | | 0.002 | | | | — | (d) | | | 0.002 | | | | (0.002 | ) | | | — | (d) | | | (0.002 | ) |
| | 2017 - Service Shares | | | 1.00 | | | | 0.001 | | | | — | (d) | | | 0.001 | | | | (0.001 | ) | | | — | (d) | | | (0.001 | ) |
| | 2017 - Cash Management Shares | | | 1.00 | | | | — | (d) | | | — | (d) | | | — | (d) | | | — | (d) | | | — | (d) | | | — | (d) |
| | FOR THE PERIOD ENDED AUGUST 31,* | | | | | | | | | | | | | |
| | 2016 - Institutional Shares | | | 1.00 | | | | 0.002 | | | | — | (d) | | | 0.002 | | | | (0.002 | ) | | | — | (d) | | | (0.002 | ) |
| | 2016 - Select Shares | | | 1.00 | | | | 0.001 | | | | — | (d) | | | 0.001 | | | | (0.001 | ) | | | — | (d) | | | (0.001 | ) |
| | 2016 - Preferred Shares | | | 1.00 | | | | 0.001 | | | | — | (d) | | | 0.001 | | | | (0.001 | ) | | | — | (d) | | | (0.001 | ) |
| | 2016 - Capital Shares | | | 1.00 | | | | — | (d) | | | — | (d) | | | — | (d) | | | — | (d) | | | — | (d) | | | — | (d) |
| | 2016 - Administration Shares | | | 1.00 | | | | — | (d) | | | — | (d) | | | — | (d) | | | — | (d) | | | — | (d) | | | — | (d) |
| | 2016 - Premier Shares | | | 1.00 | | | | — | (d) | | | — | (d) | | | — | (d) | | | — | (d) | | | — | (d) | | | — | (d) |
| | 2016 - Service Shares | | | 1.00 | | | | — | (d) | | | — | (d) | | | — | (d) | | | — | (d) | | | — | (d) | | | — | (d) |
| | 2016 - Cash Management Shares | | | 1.00 | | | | — | (d) | | | — | (d) | | | — | (d) | | | — | (d) | | | — | (d) | | | — | (d) |
| | * | | Commenced operations on October 30, 2015. |
| | (a) | | Calculated based on the average shares outstanding methodology. |
| | (b) | | Distributions may not coincide with the current year net investment income or net realized gains as distributions may be paid from current or prior year earnings. |
| | (c) | | Assumes reinvestment of all distributions. Returns do not reflect the deduction of taxes that a shareholder would pay on Fund distributions. Total returns for periods less than one full year are not annualized. |
| | (d) | | Amount is less than $0.0005 per share. |
| | (f) | | Amount is less than 0.005% of average net assets. |
| | |
| 48 | | The accompanying notes are an integral part of these financial statements. |
FINANCIAL SQUARE FEDERAL INSTRUMENTS FUND
| | | | | | | | | | | | | | | | | | | | | | | | | | | | | | | | | | |
| | | | | | | | | | | |
| | | Net asset value, end of period | | | | | Total return(c) | | | | | Net assets end of period (in 000s) | | | | | Ratio of net expenses to average net assets | | | | | Ratio of total expenses to average net assets | | | | | Ratio of net investment income (loss) to average net assets | |
| | | | | | | | | | | | | | | | | | | | | | | | | | | | | | | | | | |
| | $ | 1.00 | | | | | | 0.52 | % | | | | $ | 556,458 | | | | | | 0.20 | % | | | | | 0.28 | % | | | | | 0.51 | % |
| | | 1.00 | | | | | | 0.49 | | | | | | 47 | | | | | | 0.23 | | | | | | 0.31 | | | | | | 0.48 | |
| | | 1.00 | | | | | | 0.42 | | | | | | 50 | | | | | | 0.30 | | | | | | 0.38 | | | | | | 0.41 | |
| | | 1.00 | | | | | | 0.37 | | | | | | 16,147 | | | | | | 0.35 | | | | | | 0.43 | | | | | | 0.31 | |
| | | 1.00 | | | | | | 0.27 | | | | | | 50,768 | | | | | | 0.45 | | | | | | 0.53 | | | | | | 0.26 | |
| | | 1.00 | | | | | | 0.19 | | | | | | 50 | | | | | | 0.53 | | | | | | 0.63 | | | | | | 0.19 | |
| | | 1.00 | | | | | | 0.10 | | | | | | 15,129 | | | | | | 0.62 | | | | | | 0.78 | | | | | | 0.09 | |
| | | 1.00 | | | | | | 0.01 | | | | | | 50 | | | | | | 0.71 | | | | | | 1.08 | | | | | | 0.01 | |
| | | | | | | | | | | | | | | | | | | | | | | | | | | | | | | | | | |
| | | 1.00 | | | | | | 0.16 | | | | | | 577,395 | | | | | | 0.20 | (e) | | | | | 0.39 | (e) | | | | | 0.19 | (e) |
| | | 1.00 | | | | | | 0.13 | | | | | | 50 | | | | | | 0.23 | (e) | | | | | 0.42 | (e) | | | | | 0.14 | (e) |
| | | 1.00 | | | | | | 0.08 | | | | | | 50 | | | | | | 0.29 | (e) | | | | | 0.49 | (e) | | | | | 0.08 | (e) |
| | | 1.00 | | | | | | 0.05 | | | | | | 50 | | | | | | 0.33 | (e) | | | | | 0.54 | (e) | | | | | 0.04 | (e) |
| | | 1.00 | | | | | | 0.01 | | | | | | 43,835 | | | | | | 0.39 | (e) | | | | | 0.64 | (e) | | | | | (0.01 | )(e) |
| | | 1.00 | | | | | | 0.01 | | | | | | 50 | | | | | | 0.38 | (e) | | | | | 0.74 | (e) | | | | | — | (e)(f) |
| | | 1.00 | | | | | | 0.01 | | | | | | 14,949 | | | | | | 0.39 | (e) | | | | | 0.89 | (e) | | | | | (0.01 | )(e) |
| | | 1.00 | | | | | | 0.01 | | | | | | 50 | | | | | | 0.38 | (e) | | | | | 1.19 | (e) | | | | | — | (e)(f) |
| | |
| The accompanying notes are an integral part of these financial statements. | | 49 |
FINANCIAL SQUARE GOVERNMENT FUND
Financial Highlights
Selected Data for a Share Outstanding Throughout Each Period
| | | | | | | | | | | | | | | | | | | | | | | | | | | | | | |
| | | | | | | | From
investment operations | | | Distributions
to shareholders | |
| | | Year - Share Class | | Net asset value, beginning of year | | | Net
investment
income(a) | | | Net realized
gain (loss) | | | Total from
investment
operations | | | From net
investment
income | | | From net
realized
gains | | | Total
distributions(b) | |
| | FOR THE FISCAL YEARS ENDED AUGUST 31, | | | | | | | | | | | | | | | | | |
| | 2017 - Institutional Shares | | $ | 1.00 | | | $ | 0.006 | | | $ | — | (d) | | $ | 0.006 | | | $ | (0.006 | ) | | $ | — | (d) | | $ | (0.006 | ) |
| | 2017 - Select Shares | | | 1.00 | | | | 0.005 | | | | — | (d) | | | 0.005 | | | | (0.005 | ) | | | — | (d) | | | (0.005 | ) |
| | 2017 - Preferred Shares | | | 1.00 | | | | 0.004 | | | | 0.001 | | | | 0.005 | | | | (0.005 | ) | | | — | (d) | | | (0.005 | ) |
| | 2017 - Capital Shares | | | 1.00 | | | | 0.004 | | | | — | (d) | | | 0.004 | | | | (0.004 | ) | | | — | (d) | | | (0.004 | ) |
| | 2017 - Administration Shares | | | 1.00 | | | | 0.003 | | | | — | (d) | | | 0.003 | | | | (0.003 | ) | | | — | (d) | | | (0.003 | ) |
| | 2017 - Premier Shares | | | 1.00 | | | | 0.003 | | | | (0.001 | ) | | | 0.002 | | | | (0.002 | ) | | | — | (d) | | | (0.002 | ) |
| | 2017 - Service Shares | | | 1.00 | | | | 0.001 | | | | — | (d) | | | 0.001 | | | | (0.001 | ) | | | — | (d) | | | (0.001 | ) |
| | 2017 - Class A Shares | | | 1.00 | | | | 0.003 | | | | — | (d) | | | 0.003 | | | | (0.003 | ) | | | — | (d) | | | (0.003 | ) |
| | 2017 - Class C Shares | | | 1.00 | | | | — | (d) | | | — | (d) | | | — | (d) | | | — | (d) | | | — | (d) | | | — | (d) |
| | 2017 - Resource Shares | | | 1.00 | | | | 0.001 | | | | — | (d) | | | 0.001 | | | | (0.001 | ) | | | — | (d) | | | (0.001 | ) |
| | 2017 - Cash Management Shares | | | 1.00 | | | | — | (d) | | | — | (d) | | | — | (d) | | | — | (d) | | | — | (d) | | | — | (d) |
| | 2017 - Class R6 Shares | | | 1.00 | | | | 0.006 | | | | — | (d) | | | 0.006 | | | | (0.006 | ) | | | — | (d) | | | (0.006 | ) |
| | 2016 - Institutional Shares | | | 1.00 | | | | 0.002 | | | | — | (d) | | | 0.002 | | | | (0.002 | ) | | | — | (d) | | | (0.002 | ) |
| | 2016 - Select Shares | | | 1.00 | | | | 0.002 | | | | — | (d) | | | 0.002 | | | | (0.002 | ) | | | — | (d) | | | (0.002 | ) |
| | 2016 - Preferred Shares | | | 1.00 | | | | 0.001 | | | | — | (d) | | | 0.001 | | | | (0.001 | ) | | | — | (d) | | | (0.001 | ) |
| | 2016 - Capital Shares | | | 1.00 | | | | 0.001 | | | | — | (d) | | | 0.001 | | | | (0.001 | ) | | | — | (d) | | | (0.001 | ) |
| | 2016 - Administration Shares | | | 1.00 | | | | — | (d) | | | — | (d) | | | — | (d) | | | — | (d) | | | — | (d) | | | — | (d) |
| | 2016 - Premier Shares | | | 1.00 | | | | — | (d) | | | — | (d) | | | — | (d) | | | — | (d) | | | — | (d) | | | — | (d) |
| | 2016 - Service Shares | | | 1.00 | | | | — | (d) | | | — | (d) | | | — | (d) | | | — | (d) | | | — | (d) | | | — | (d) |
| | 2016 - Class A Shares (Commenced operations on February 29, 2016) | | | 1.00 | | | | — | (d) | | | — | (d) | | | — | (d) | | | — | (d) | | | — | (d) | | | — | (d) |
| | 2016 - Class C Shares (Commenced operations on February 29, 2016) | | | 1.00 | | | | — | (d) | | | — | (d) | | | — | (d) | | | — | (d) | | | — | (d) | | | — | (d) |
| | 2016 - Resource Shares | | | 1.00 | | | | — | (d) | | | — | (d) | | | — | (d) | | | — | (d) | | | — | (d) | | | — | (d) |
| | 2016 - Cash Management Shares | | | 1.00 | | | | — | (d) | | | — | (d) | | | — | (d) | | | — | (d) | | | — | (d) | | | — | (d) |
| | 2016 - Class R6 Shares (Commenced operations on December 29, 2015) | | | 1.00 | | | | 0.002 | | | | — | (d) | | | 0.002 | | | | (0.002 | ) | | | — | (d) | | | (0.002 | ) |
| | 2015 - Institutional Shares | | | 1.00 | | | | — | (d) | | | — | (d) | | | — | (d) | | | — | (d) | | | — | (d) | | | — | (d) |
| | 2015 - Select Shares | | | 1.00 | | | | — | (d) | | | — | (d) | | | — | (d) | | | — | (d) | | | — | (d) | | | — | (d) |
| | 2015 - Preferred Shares | | | 1.00 | | | | — | (d) | | | — | (d) | | | — | (d) | | | — | (d) | | | — | (d) | | | — | (d) |
| | 2015 - Capital Shares | | | 1.00 | | | | — | (d) | | | — | (d) | | | — | (d) | | | — | (d) | | | — | (d) | | | — | (d) |
| | 2015 - Administration Shares | | | 1.00 | | | | — | (d) | | | — | (d) | | | — | (d) | | | — | (d) | | | — | (d) | | | — | (d) |
| | 2015 - Premier Shares | | | 1.00 | | | | — | (d) | | | — | (d) | | | — | (d) | | | — | (d) | | | — | (d) | | | — | (d) |
| | 2015 - Service Shares | | | 1.00 | | | | — | (d) | | | — | (d) | | | — | (d) | | | — | (d) | | | — | (d) | | | — | (d) |
| | 2015 - Resource Shares | | | 1.00 | | | | — | (d) | | | — | (d) | | | — | (d) | | | — | (d) | | | — | (d) | | | — | (d) |
| | 2015 - Cash Management Shares | | | 1.00 | | | | — | (d) | | | — | (d) | | | — | (d) | | | — | (d) | | | — | (d) | | | — | (d) |
| | 2014 - Institutional Shares | | | 1.00 | | | | — | (d) | | | — | (d) | | | — | (d) | | | — | (d) | | | — | (d) | | | — | (d) |
| | 2014 - Select Shares | | | 1.00 | | | | — | (d) | | | — | (d) | | | — | (d) | | | — | (d) | | | — | (d) | | | — | (d) |
| | 2014 - Preferred Shares | | | 1.00 | | | | — | (d) | | | — | (d) | | | — | (d) | | | — | (d) | | | — | (d) | | | — | (d) |
| | 2014 - Capital Shares | | | 1.00 | | | | — | (d) | | | — | (d) | | | — | (d) | | | — | (d) | | | — | (d) | | | — | (d) |
| | 2014 - Administration Shares | | | 1.00 | | | | — | (d) | | | — | (d) | | | — | (d) | | | — | (d) | | | — | (d) | | | — | (d) |
| | 2014 - Premier Shares | | | 1.00 | | | | — | (d) | | | — | (d) | | | — | (d) | | | — | (d) | | | — | (d) | | | — | (d) |
| | 2014 - Service Shares | | | 1.00 | | | | — | (d) | | | — | (d) | | | — | (d) | | | — | (d) | | | — | (d) | | | — | (d) |
| | 2014 - Resource Shares | | | 1.00 | | | | — | (d) | | | — | (d) | | | — | (d) | | | — | (d) | | | — | (d) | | | — | (d) |
| | 2014 - Cash Management Shares | | | 1.00 | | | | — | (d) | | | — | (d) | | | — | (d) | | | — | (d) | | | — | (d) | | | — | (d) |
| | 2013 - Institutional Shares | | | 1.00 | | | | — | (d) | | | — | (d) | | | — | (d) | | | — | (d) | | | — | (d) | | | — | (d) |
| | 2013 - Select Shares | | | 1.00 | | | | — | (d) | | | — | (d) | | | — | (d) | | | — | (d) | | | — | (d) | | | — | (d) |
| | 2013 - Preferred Shares | | | 1.00 | | | | — | (d) | | | — | (d) | | | — | (d) | | | — | (d) | | | — | (d) | | | — | (d) |
| | 2013 - Capital Shares | | | 1.00 | | | | — | (d) | | | — | (d) | | | — | (d) | | | — | (d) | | | — | (d) | | | — | (d) |
| | 2013 - Administration Shares | | | 1.00 | | | | — | (d) | | | — | (d) | | | — | (d) | | | — | (d) | | | — | (d) | | | — | (d) |
| | 2013 - Premier Shares | | | 1.00 | | | | — | (d) | | | — | (d) | | | — | (d) | | | — | (d) | | | — | (d) | | | — | (d) |
| | 2013 - Service Shares | | | 1.00 | | | | — | (d) | | | — | (d) | | | — | (d) | | | — | (d) | | | — | (d) | | | — | (d) |
| | 2013 - Resource Shares | | | 1.00 | | | | — | (d) | | | — | (d) | | | — | (d) | | | — | (d) | | | — | (d) | | | — | (d) |
| | 2013 - Cash Management Shares | | | 1.00 | | | | — | (d) | | | — | (d) | | | — | (d) | | | — | (d) | | | — | (d) | | | — | (d) |
| | (a) | | Calculated based on the average shares outstanding methodology. |
| | (b) | | Distributions may not coincide with the current year net investment income or net realized gains as distributions may be paid from current or prior year earnings. |
| | (c) | | Assumes reinvestment of all distributions. Returns do not reflect the deduction of taxes that a shareholder would pay on Fund distributions. Total returns for periods less than one full year are not annualized. |
| | (d) | | Amount is less than $0.0005 per share. |
| | (f) | | Amount is less than 0.005% of average net assets. |
| | |
| 50 | | The accompanying notes are an integral part of these financial statements. |
FINANCIAL SQUARE GOVERNMENT FUND
| | | | | | | | | | | | | | | | | | | | | | | | | | | | | | | | | | |
| | | | | | | | | | | |
| | | Net asset value, end of year | | | | | Total return(c) | | | | | Net assets end of year (in 000s) | | | | | Ratio of net expenses to average net assets | | | | | Ratio of total expenses to average net assets | | | | | Ratio of net investment income (loss) to average net assets | |
| | | | | | | | | | | | | | | | | | | | | | | | | | | | | | | | | | |
| | $ | 1.00 | | | | | | 0.55 | % | | | | $ | 79,411,937 | | | | | | 0.18 | % | | | | | 0.23 | % | | | | | 0.55 | % |
| | | 1.00 | | | | | | 0.52 | | | | | | 2,921,971 | | | | | | 0.21 | | | | | | 0.26 | | | | | | 0.52 | |
| | | 1.00 | | | | | | 0.45 | | | | | | 553,781 | | | | | | 0.28 | | | | | | 0.33 | | | | | | 0.43 | |
| | | 1.00 | | | | | | 0.40 | | | | | | 893,496 | | | | | | 0.33 | | | | | | 0.38 | | | | | | 0.37 | |
| | | 1.00 | | | | | | 0.30 | | | | | | 4,138,362 | | | | | | 0.43 | | | | | | 0.48 | | | | | | 0.32 | |
| | | 1.00 | | | | | | 0.22 | | | | | | 101,311 | | | | | | 0.52 | | | | | | 0.58 | | | | | | 0.28 | |
| | | 1.00 | | | | | | 0.12 | | | | | | 337,219 | | | | | | 0.60 | | | | | | 0.73 | | | | | | 0.11 | |
| | | 1.00 | | | | | | 0.30 | | | | | | 55,506 | | | | | | 0.43 | | | | | | 0.48 | | | | | | 0.34 | |
| | | 1.00 | | | | | | 0.01 | | | | | | 5,937 | | | | | | 0.70 | | | | | | 1.23 | | | | | | 0.01 | |
| | | 1.00 | | | | | | 0.05 | | | | | | 74,864 | | | | | | 0.69 | | | | | | 0.88 | | | | | | 0.06 | |
| | | 1.00 | | | | | | 0.02 | | | | | | 3,779 | | | | | | 0.62 | | | | | | 1.03 | | | | | | 0.01 | |
| | | 1.00 | | | | | | 0.55 | | | | | | 12,773 | | | | | | 0.18 | | | | | | 0.23 | | | | | | 0.56 | |
| | | 1.00 | | | | | | 0.20 | | | | | | 63,804,041 | | | | | | 0.18 | | | | | | 0.23 | | | | | | 0.21 | |
| | | 1.00 | | | | | | 0.17 | | | | | | 2,471,275 | | | | | | 0.21 | | | | | | 0.26 | | | | | | 0.21 | |
| | | 1.00 | | | | | | 0.12 | | | | | | 536,818 | | | | | | 0.27 | | | | | | 0.33 | | | | | | 0.13 | |
| | | 1.00 | | | | | | 0.08 | | | | | | 1,390,271 | | | | | | 0.30 | | | | | | 0.38 | | | | | | 0.07 | |
| | | 1.00 | | | | | | 0.02 | | | | | | 2,673,689 | | | | | | 0.36 | | | | | | 0.48 | | | | | | 0.01 | |
| | | 1.00 | | | | | | 0.02 | | | | | | 1 | | | | | | 0.20 | | | | | | 0.58 | | | | | | 0.40 | |
| | | 1.00 | | | | | | 0.01 | | | | | | 368,299 | | | | | | 0.36 | | | | | | 0.73 | | | | | | (0.01 | ) |
| | | 1.00 | | | | | | 0.01 | | | | | | 1,563 | | | | | | 0.43 | (e) | | | | | 0.48 | (e) | | | | | 0.02 | (e) |
| | | 1.00 | | | | | | 0.01 | | | | | | 413 | | | | | | 0.44 | (e) | | | | | 1.23 | (e) | | | | | 0.01 | (e) |
| | | 1.00 | | | | | | 0.01 | | | | | | 17,634 | | | | | | 0.43 | | | | | | 0.88 | | | | | | (0.01 | ) |
| | | 1.00 | | | | | | 0.02 | | | | | | 14 | | | | | | 0.35 | | | | | | 1.03 | | | | | | 0.06 | |
| | | 1.00 | | | | | | 0.18 | | | | | | 4,705 | | | | | | 0.18 | (e) | | | | | 0.23 | (e) | | | | | 0.26 | (e) |
| | | 1.00 | | | | | | 0.01 | | | | | | 29,753,210 | | | | | | 0.14 | | | | | | 0.23 | | | | | | 0.01 | |
| | | 1.00 | | | | | | 0.01 | | | | | �� | 203,098 | | | | | | 0.14 | | | | | | 0.26 | | | | | | 0.01 | |
| | | 1.00 | | | | | | 0.01 | | | | | | 249,542 | | | | | | 0.14 | | | | | | 0.33 | | | | | | 0.01 | |
| | | 1.00 | | | | | | 0.01 | | | | | | 1,174,099 | | | | | | 0.14 | | | | | | 0.38 | | | | | | 0.01 | |
| | | 1.00 | | | | | | 0.01 | | | | | | 1,920,203 | | | | | | 0.14 | | | | | | 0.48 | | | | | | 0.01 | |
| | | 1.00 | | | | | | 0.01 | | | | | | 1 | | | | | | 0.14 | | | | | | 0.58 | | | | | | 0.40 | |
| | | 1.00 | | | | | | 0.01 | | | | | | 468,041 | | | | | | 0.14 | | | | | | 0.73 | | | | | | 0.01 | |
| | | 1.00 | | | | | | 0.01 | | | | | | 1 | | | | | | 0.14 | | | | | | 0.88 | | | | | | 0.40 | |
| | | 1.00 | | | | | | 0.01 | | | | | | 4 | | | | | | 0.14 | | | | | | 1.03 | | | | | | 0.22 | |
| | | 1.00 | | | | | | 0.01 | | | | | | 22,069,515 | | | | | | 0.12 | | | | | | 0.23 | | | | | | — | (f) |
| | | 1.00 | | | | | | 0.01 | | | | | | 101,446 | | | | | | 0.12 | | | | | | 0.26 | | | | | | — | (f) |
| | | 1.00 | | | | | | 0.01 | | | | | | 266,881 | | | | | | 0.12 | | | | | | 0.33 | | | | | | — | (f) |
| | | 1.00 | | | | | | 0.01 | | | | | | 1,113,078 | | | | | | 0.12 | | | | | | 0.38 | | | | | | — | (f) |
| | | 1.00 | | | | | | 0.01 | | | | | | 1,939,309 | | | | | | 0.12 | | | | | | 0.48 | | | | | | — | (f) |
| | | 1.00 | | | | | | 0.01 | | | | | | 1 | | | | | | 0.12 | | | | | | 0.58 | | | | | | — | (f) |
| | | 1.00 | | | | | | 0.01 | | | | | | 376,094 | | | | | | 0.12 | | | | | | 0.73 | | | | | | — | (f) |
| | | 1.00 | | | | | | 0.01 | | | | | | 1 | | | | | | 0.12 | | | | | | 0.88 | | | | | | 0.40 | |
| | | 1.00 | | | | | | 0.01 | | | | | | 1 | | | | | | 0.12 | | | | | | 1.03 | | | | | | 0.40 | |
| | | 1.00 | | | | | | 0.03 | | | | | | 21,751,069 | | | | | | 0.18 | | | | | | 0.23 | | | | | | 0.03 | |
| | | 1.00 | | | | | | 0.01 | | | | | | 145,992 | | | | | | 0.20 | | | | | | 0.26 | | | | | | 0.02 | |
| | | 1.00 | | | | | | 0.01 | | | | | | 305,546 | | | | | | 0.21 | | | | | | 0.33 | | | | | | — | (f) |
| | | 1.00 | | | | | | 0.01 | | | | | | 411,426 | | | | | | 0.20 | | | | | | 0.38 | | | | | | — | (f) |
| | | 1.00 | | | | | | 0.01 | | | | | | 1,983,578 | | | | | | 0.20 | | | | | | 0.48 | | | | | | — | (f) |
| | | 1.00 | | | | | | 0.01 | | | | | | 5,416 | | | | | | 0.20 | | | | | | 0.58 | | | | | | — | (f) |
| | | 1.00 | | | | | | 0.01 | | | | | | 260,856 | | | | | | 0.20 | | | | | | 0.73 | | | | | | — | (f) |
| | | 1.00 | | | | | | 0.01 | | | | | | 1 | | | | | | 0.18 | | | | | | 0.88 | | | | | | 0.40 | |
| | | 1.00 | | | | | | 0.01 | | | | | | 1 | | | | | | 0.18 | | | | | | 1.03 | | | | | | 0.40 | |
| | |
| The accompanying notes are an integral part of these financial statements. | | 51 |
FINANCIAL SQUARE MONEY MARKET FUND
Financial Highlights
Selected Data for a Share Outstanding Throughout Each Period
| | | | | | | | | | | | | | | | | | | | | | | | | | | | | | |
| | | | | | | | From
investment operations | | | Distributions
to shareholders | |
| | | Year - Share Class | | Net asset value, beginning of year | | | Net
investment
income(a) | | | Net realized
and unrealized
gain (loss) | | | Total from
investment
operations | | | From net
investment
income | | | From net
realized
gains | | | Total
distributions(b) | |
| | FOR THE FISCAL YEARS ENDED AUGUST 31, | | | | | | | | | |
| | 2017 - Institutional Shares | | $ | 1.0000 | | | $ | 0.0071 | | | $ | 0.0015 | | | $ | 0.0086 | | | $ | (0.0082 | ) | | $ | (0.0001 | ) | | $ | (0.0083 | ) |
| | 2017 - Select Shares | | | 1.0000 | | | | 0.0040 | | | | 0.0043 | | | | 0.0083 | | | | (0.0079 | ) | | | (0.0001 | ) | | | (0.0080 | ) |
| | 2017 - Preferred Shares | | | 1.0000 | | | | 0.0032 | | | | 0.0044 | | | | 0.0076 | | | | (0.0072 | ) | | | (0.0001 | ) | | | (0.0073 | ) |
| | 2017 - Capital Shares | | | 1.0000 | | | | 0.0020 | | | | 0.0051 | | | | 0.0071 | | | | (0.0068 | ) | | | — | (d) | | | (0.0068 | ) |
| | 2017 - Administration Shares | | | 1.0000 | | | | 0.0024 | | | | 0.0037 | | | | 0.0061 | | | | (0.0057 | ) | | | (0.0001 | ) | | | (0.0058 | ) |
| | 2017 - Premier Shares | | | 1.0000 | | | | 0.0068 | | | | (0.0016 | ) | | | 0.0052 | | | | (0.0049 | ) | | | — | (d) | | | (0.0049 | ) |
| | 2017- Service Shares | | | 1.0000 | | | | 0.0011 | | | | 0.0027 | | | | 0.0038 | | | | (0.0034 | ) | | | (0.0001 | ) | | | (0.0035 | ) |
| | 2017 - Resource Shares | | | 1.0000 | | | | 0.0068 | | | | (0.0040 | ) | | | 0.0028 | | | | (0.0025 | ) | | | — | (d) | | | (0.0025 | ) |
| | 2017 - Cash Management Shares | | | 1.0000 | | | | 0.0001 | | | | 0.0017 | | | | 0.0018 | | | | (0.0015 | ) | | | — | (d) | | | (0.0015 | ) |
| | 2016 - Institutional Shares | | | 1.00 | | | | 0.003 | | | | — | (e) | | | 0.003 | | | | (0.003 | ) | | | — | (e) | | | (0.003 | ) |
| | 2016 - Select Shares | | | 1.00 | | | | 0.003 | | | | — | (e) | | | 0.003 | | | | (0.003 | ) | | | — | (e) | | | (0.003 | ) |
| | 2016 - Preferred Shares | | | 1.00 | | | | 0.002 | | | | — | (e) | | | 0.002 | | | | (0.002 | ) | | | — | (e) | | | (0.002 | ) |
| | 2016 - Capital Shares | | | 1.00 | | | | 0.002 | | | | — | (e) | | | 0.002 | | | | (0.002 | ) | | | — | (e) | | | (0.002 | ) |
| | 2016 - Administration Shares | | | 1.00 | | | | 0.001 | | | | — | (e) | | | 0.001 | | | | (0.001 | ) | | | — | (e) | | | (0.001 | ) |
| | 2016 - Premier Shares | | | 1.00 | | | | 0.001 | | | | — | (e) | | | 0.001 | | | | (0.001 | ) | | | — | (e) | | | (0.001 | ) |
| | 2016 - Service Shares | | | 1.00 | | | | — | (e) | | | — | (e) | | | — | (e) | | | — | (e) | | | — | (e) | | | — | (e) |
| | 2016 - Resource Shares | | | 1.00 | | | | 0.001 | | | | — | (e) | | | 0.001 | | | | (0.001 | ) | | | — | (e) | | | (0.001 | ) |
| | 2016 - Cash Management Shares | | | 1.00 | | | | — | (e) | | | — | (e) | | | — | (e) | | | — | (e) | | | — | (e) | | | — | (e) |
| | 2015 - Institutional Shares | | | 1.00 | | | | 0.001 | | | | — | (e) | | | 0.001 | | | | (0.001 | ) | | | — | (e) | | | (0.001 | ) |
| | 2015 - Select Shares | | | 1.00 | | | | 0.001 | | | | — | (e) | | | 0.001 | | | | (0.001 | ) | | | — | (e) | | | (0.001 | ) |
| | 2015 - Preferred Shares | | | 1.00 | | | | — | (e) | | | — | (e) | | | — | (e) | | | — | (e) | | | — | (e) | | | — | (e) |
| | 2015 - Capital Shares | | | 1.00 | | | | — | (e) | | | — | (e) | | | — | (e) | | | — | (e) | | | — | (e) | | | — | (e) |
| | 2015 - Administration Shares | | | 1.00 | | | | — | (e) | | | — | (e) | | | — | (e) | | | — | (e) | | | — | (e) | | | — | (e) |
| | 2015 - Premier Shares | | | 1.00 | | | | — | (e) | | | — | (e) | | | — | (e) | | | — | (e) | | | — | (e) | | | — | (e) |
| | 2015 - Service Shares | | | 1.00 | | | | — | (e) | | | — | (e) | | | — | (e) | | | — | (e) | | | — | (e) | | | — | (e) |
| | 2015 - Resource Shares | | | 1.00 | | | | — | (e) | | | — | (e) | | | — | (e) | | | — | (e) | | | — | (e) | | | — | (e) |
| | 2015 - Cash Management Shares | | | 1.00 | | | | — | (e) | | | — | (e) | | | — | (e) | | | — | (e) | | | — | (e) | | | — | (e) |
| | 2014 - Institutional Shares | | | 1.00 | | | | 0.001 | | | | — | (e) | | | 0.001 | | | | (0.001 | ) | | | — | (e) | | | (0.001 | ) |
| | 2014 - Select Shares | | | 1.00 | | | | — | (e) | | | — | (e) | | | — | (e) | | | — | (e) | | | — | (e) | | | — | (e) |
| | 2014 - Preferred Shares | | | 1.00 | | | | — | (e) | | | — | (e) | | | — | (e) | | | — | (e) | | | — | (e) | | | — | (e) |
| | 2014 - Capital Shares | | | 1.00 | | | | — | (e) | | | — | (e) | | | — | (e) | | | — | (e) | | | — | (e) | | | — | (e) |
| | 2014 - Administration Shares | | | 1.00 | | | | — | (e) | | | — | (e) | | | — | (e) | | | — | (e) | | | — | (e) | | | — | (e) |
| | 2014 - Premier Shares | | | 1.00 | | | | — | (e) | | | — | (e) | | | — | (e) | | | — | (e) | | | — | (e) | | | — | (e) |
| | 2014 - Service Shares | | | 1.00 | | | | — | (e) | | | — | (e) | | | — | (e) | | | — | (e) | | | — | (e) | | | — | (e) |
| | 2014 - Resource Shares | | | 1.00 | | | | — | (e) | | | — | (e) | | | — | (e) | | | — | (e) | | | — | (e) | | | — | (e) |
| | 2014 - Cash Management Shares | | | 1.00 | | | | — | (e) | | | — | (e) | | | — | (e) | | | — | (e) | | | — | (e) | | | — | (e) |
| | 2013 - Institutional Shares | | | 1.00 | | | | 0.001 | | | | — | (e) | | | 0.001 | | | | (0.001 | ) | | | — | (e) | | | (0.001 | ) |
| | 2013 - Select Shares | | | 1.00 | | | | 0.001 | | | | — | (e) | | | 0.001 | | | | (0.001 | ) | | | — | (e) | | | (0.001 | ) |
| | 2013 - Preferred Shares | | | 1.00 | | | | — | (e) | | | — | (e) | | | — | (e) | | | — | (e) | | | — | (e) | | | — | (e) |
| | 2013 - Capital Shares | | | 1.00 | | | | — | (e) | | | — | (e) | | | — | (e) | | | — | (e) | | | — | (e) | | | — | (e) |
| | 2013 - Administration Shares | | | 1.00 | | | | — | (e) | | | — | (e) | | | — | (e) | | | — | (e) | | | — | (e) | | | — | (e) |
| | 2013 - Premier Shares | | | 1.00 | | | | — | (e) | | | — | (e) | | | — | (e) | | | — | (e) | | | — | (e) | | | — | (e) |
| | 2013 - Service Shares | | | 1.00 | | | | — | (e) | | | — | (e) | | | — | (e) | | | — | (e) | | | — | (e) | | | — | (e) |
| | 2013 - Resource Shares | | | 1.00 | | | | — | (e) | | | — | (e) | | | — | (e) | | | — | (e) | | | — | (e) | | | — | (e) |
| | 2013 - Cash Management Shares | | | 1.00 | | | | — | (e) | | | — | (e) | | | — | (e) | | | — | (e) | | | — | (e) | | | — | (e) |
| | (a) | | Calculated based on the average shares outstanding methodology. |
| | (b) | | Distributions may not coincide with the current year net investment income or net realized gains as distributions may be paid from current or prior year earnings. |
| | (c) | | Assumes investment at the net asset value at the beginning of the year, reinvestment of all dividends and distributions, a complete redemption of the investment at the net asset value at the end of the year and no sales or redemption charges. Total returns would be reduced if a sales redemption charge was taken into account. Returns do not reflect the deduction of taxes that a shareholder would pay on Fund distributions or the redemption of Fund shares. |
| | (d) | | Amount is less than $0.00005 per share. |
| | (e) | | Amount is less than $0.0005 per share. |
| | (f) | | Amount is less than 0.005% of average net assets. |
| | |
| 52 | | The accompanying notes are an integral part of these financial statements. |
FINANCIAL SQUARE MONEY MARKET FUND
| | | | | | | | | | | | | | | | | | | | | | | | | | | | | | | | | | |
| | | | | | | | | | | |
| | | Net asset value, end of year | | | | | Total return(c) | | | | | Net assets end of year (in 000s) | | | | | Ratio of net expenses to average net assets | | | | | Ratio of total expenses to average net assets | | | | | Ratio of net investment income (loss) to average net assets | |
| | | | | | | | | | | | | | | | | | | | | | | | | | | | | | | | | | |
| | $ | 1.0003 | | | | | | 0.87 | % | | | | $ | 2,542,693 | | | | | | 0.18 | % | | | | | 0.25 | % | | | | | 0.71 | % |
| | | 1.0003 | | | | | | 0.84 | | | | | | 9,847 | | | | | | 0.21 | | | | | | 0.28 | | | | | | 0.40 | |
| | | 1.0003 | | | | | | 0.77 | | | | | | 1,418 | | | | | | 0.28 | | | | | | 0.35 | | | | | | 0.32 | |
| | | 1.0003 | | | | | | 0.72 | | | | | | 1 | | | | | | 0.33 | | | | | | 0.40 | | | | | | 0.20 | |
| | | 1.0003 | | | | | | 0.61 | | | | | | 5,516 | | | | | | 0.43 | | | | | | 0.50 | | | | | | 0.24 | |
| | | 1.0003 | | | | | | 0.52 | | | | | | 1 | | | | | | 0.53 | | | | | | 0.60 | | | | | | 0.69 | |
| | | 1.0003 | | | | | | 0.38 | | | | | | 67 | | | | | | 0.60 | | | | | | 0.75 | | | | | | 0.11 | |
| | | 1.0003 | | | | | | 0.28 | | | | | | 1 | | | | | | 0.53 | | | | | | 0.90 | | | | | | 0.68 | |
| | | 1.0003 | | | | | | 0.18 | | | | | | 1 | | | | | | 0.50 | | | | | | 1.05 | | | | | | 0.01 | |
| | | 1.00 | | | | | | 0.32 | | | | | | 15,336,774 | | | | | | 0.18 | | | | | | 0.23 | | | | | | 0.32 | |
| | | 1.00 | | | | | | 0.29 | | | | | | 1,080,075 | | | | | | 0.21 | | | | | | 0.26 | | | | | | 0.29 | |
| | | 1.00 | | | | | | 0.22 | | | | | | 59,053 | | | | | | 0.28 | | | | | | 0.33 | | | | | | 0.20 | |
| | | 1.00 | | | | | | 0.18 | | | | | | 108,671 | | | | | | 0.33 | | | | | | 0.38 | | | | | | 0.18 | |
| | | 1.00 | | | | | | 0.10 | | | | | | 316,162 | | | | | | 0.40 | | | | | | 0.48 | | | | | | 0.09 | |
| | | 1.00 | | | | | | 0.10 | | | | | | 1 | | | | | | 0.19 | | | | | | 0.58 | | | | | | 0.37 | |
| | | 1.00 | | | | | | 0.01 | | | | | | 17,000 | | | | | | 0.49 | | | | | | 0.73 | | | | | | — | (f) |
| | | 1.00 | | | | | | 0.10 | | | | | | 1 | | | | | | 0.19 | | | | | | 0.88 | | | | | | 0.37 | |
| | | 1.00 | | | | | | 0.01 | | | | | | 10,742 | | | | | | 0.51 | | | | | | 1.03 | | | | | | — | (f) |
| | | 1.00 | | | | | | 0.09 | | | | | | 32,746,797 | | | | | | 0.18 | | | | | | 0.23 | | | | | | 0.08 | |
| | | 1.00 | | | | | | 0.06 | | | | | | 1,917,216 | | | | | | 0.21 | | | | | | 0.26 | | | | | | 0.06 | |
| | | 1.00 | | | | | | 0.01 | | | | | | 116,846 | | | | | | 0.26 | | | | | | 0.33 | | | | | | 0.01 | |
| | | 1.00 | | | | | | 0.01 | | | | | | 201,440 | | | | | | 0.27 | | | | | | 0.38 | | | | | | — | (f) |
| | | 1.00 | | | | | | 0.01 | | | | | | 430,947 | | | | | | 0.26 | | | | | | 0.48 | | | | | | — | (f) |
| | | 1.00 | | | | | | 0.01 | | | | | | 1 | | | | | | 0.18 | | | | | | 0.58 | | | | | | 0.40 | |
| | | 1.00 | | | | | | 0.01 | | | | | | 21,066 | | | | | | 0.26 | | | | | | 0.73 | | | | | | — | (f) |
| | | 1.00 | | | | | | 0.01 | | | | | | 1 | | | | | | 0.18 | | | | | | 0.88 | | | | | | 0.40 | |
| | | 1.00 | | | | | | 0.01 | | | | | | 8,041 | | | | | | 0.28 | | | | | | 1.03 | | | | | | — | (f) |
| | | 1.00 | | | | | | 0.06 | | | | | | 26,529,130 | | | | | | 0.18 | | | | | | 0.23 | | | | | | 0.06 | |
| | | 1.00 | | | | | | 0.03 | | | | | | 527,470 | | | | | | 0.21 | | | | | | 0.26 | | | | | | 0.03 | |
| | | 1.00 | | | | | | 0.01 | | | | | | 66,193 | | | | | | 0.24 | | | | | | 0.33 | | | | | | 0.01 | |
| | | 1.00 | | | | | | 0.01 | | | | | | 36,709 | | | | | | 0.24 | | | | | | 0.38 | | | | | | 0.01 | |
| | | 1.00 | | | | | | 0.01 | | | | | | 277,404 | | | | | | 0.24 | | | | | | 0.48 | | | | | | 0.01 | |
| | | 1.00 | | | | | | 0.01 | | | | | | 1 | | | | | | 0.24 | | | | | | 0.58 | | | | | | 0.01 | |
| | | 1.00 | | | | | | 0.01 | | | | | | 20,963 | | | | | | 0.24 | | | | | | 0.73 | | | | | | 0.01 | |
| | | 1.00 | | | | | | 0.01 | | | | | | 1 | | | | | | 0.18 | | | | | | 0.88 | | | | | | 0.40 | |
| | | 1.00 | | | | | | 0.01 | | | | | | 1 | | | | | | 0.18 | | | | | | 1.03 | | | | | | 0.40 | |
| | | 1.00 | | | | | | 0.11 | | | | | | 25,047,026 | | | | | | 0.18 | | | | | | 0.23 | | | | | | 0.11 | |
| | | 1.00 | | | | | | 0.08 | | | | | | 178,080 | | | | | | 0.21 | | | | | | 0.26 | | | | | | 0.08 | |
| | | 1.00 | | | | | | 0.02 | | | | | | 44,177 | | | | | | 0.27 | | | | | | 0.33 | | | | | | 0.02 | |
| | | 1.00 | | | | | | 0.01 | | | | | | 44,542 | | | | | | 0.28 | | | | | | 0.38 | | | | | | — | (f) |
| | | 1.00 | | | | | | 0.01 | | | | | | 338,423 | | | | | | 0.29 | | | | | | 0.48 | | | | | | — | (f) |
| | | 1.00 | | | | | | 0.01 | | | | | | 30,335 | | | | | | 0.28 | | | | | | 0.58 | | | | | | — | (f) |
| | | 1.00 | | | | | | 0.01 | | | | | | 40,544 | | | | | | 0.28 | | | | | | 0.73 | | | | | | — | (f) |
| | | 1.00 | | | | | | 0.01 | | | | | | 1 | | | | | | 0.18 | | | | | | 0.88 | | | | | | 0.40 | |
| | | 1.00 | | | | | | 0.01 | | | | | | 1 | | | | | | 0.18 | | | | | | 1.03 | | | | | | 0.40 | |
| | |
| The accompanying notes are an integral part of these financial statements. | | 53 |
FINANCIAL SQUARE PRIME OBLIGATIONS FUND
Financial Highlights
Selected Data for a Share Outstanding Throughout Each Period
| | | | | | | | | | | | | | | | | | | | | | | | | | | | | | |
| | | | | | | | From
investment operations | | | Distributions
to shareholders | |
| | | Year - Share Class | | Net asset value, beginning of year | | | Net
investment
income(a) | | | Net realized
and unrealized
gain (loss) | | | Total from
investment
operations | | | From net
investment
income | | | From net
realized
gains | | | Total
distributions(b) | |
| | FOR THE FISCAL YEARS ENDED AUGUST 31, | | | | | | | | | |
| | 2017 - Institutional Shares | | $ | 1.0000 | | | $ | 0.0073 | | | $ | 0.0014 | | | $ | 0.0087 | | | $ | (0.0083 | ) | | $ | (0.0001 | ) | | $ | (0.0084 | ) |
| | 2017 - Select Shares | | | 1.0000 | | | | 0.0097 | | | | (0.0013 | ) | | | 0.0084 | | | | (0.0080 | ) | | | (0.0001 | ) | | | (0.0081 | ) |
| | 2017 - Preferred Shares | | | 1.0000 | | | | 0.0030 | | | | 0.0047 | | | | 0.0077 | | | | (0.0073 | ) | | | (0.0001 | ) | | | (0.0074 | ) |
| | 2017 - Capital Shares | | | 1.0000 | | | | 0.0024 | | | | 0.0048 | | | | 0.0072 | | | | (0.0068 | ) | | | (0.0001 | ) | | | (0.0069 | ) |
| | 2017 - Administration Shares | | | 1.0000 | | | | 0.0015 | | | | 0.0047 | | | | 0.0062 | | | | (0.0058 | ) | | | (0.0001 | ) | | | (0.0059 | ) |
| | 2017 - Premier Shares | | | 1.0000 | | | | 0.0071 | | | | (0.0018 | ) | | | 0.0053 | | | | (0.0050 | ) | | | — | (d) | | | (0.0050 | ) |
| | 2017 - Service Shares | | | 1.0000 | | | | 0.0003 | | | | 0.0035 | | | | 0.0038 | | | | (0.0034 | ) | | | (0.0001 | ) | | | (0.0035 | ) |
| | 2017 - Resource Shares | | | 1.0000 | | | | 0.0002 | | | | 0.0025 | | | | 0.0027 | | | | (0.0024 | ) | | | — | (d) | | | (0.0024 | ) |
| | 2017 - Cash Management Shares | | | 1.0000 | | | | 0.0051 | | | | (0.0033 | ) | | | 0.0018 | | | | (0.0015 | ) | | | — | (d) | | | (0.0015 | ) |
| | 2016 - Institutional Shares | | | 1.00 | | | | 0.003 | | | | — | (e) | | | 0.003 | | | | (0.003 | ) | | | — | (e) | | | (0.003 | ) |
| | 2016 - Select Shares | | | 1.00 | | | | 0.003 | | | | — | (e) | | | 0.003 | | | | (0.003 | ) | | | — | (e) | | | (0.003 | ) |
| | 2016 - Preferred Shares | | | 1.00 | | | | 0.002 | | | | — | (e) | | | 0.002 | | | | (0.002 | ) | | | — | (e) | | | (0.002 | ) |
| | 2016 - Capital Shares | | | 1.00 | | | | 0.002 | | | | — | (e) | | | 0.002 | | | | (0.002 | ) | | | — | (e) | | | (0.002 | ) |
| | 2016 - Administration Shares | | | 1.00 | | | | 0.001 | | | | — | (e) | | | 0.001 | | | | (0.001 | ) | | | — | (e) | | | (0.001 | ) |
| | 2016 - Premier Shares | | | 1.00 | | | | 0.001 | | | | — | (e) | | | 0.001 | | | | (0.001 | ) | | | — | (e) | | | (0.001 | ) |
| | 2016 - Service Shares | | | 1.00 | | | | — | (e) | | | — | (e) | | | — | (e) | | | — | (e) | | | — | (e) | | | — | (e) |
| | 2016 - Resource Shares | | | 1.00 | | | | — | (e) | | | — | (e) | | | — | (e) | | | — | (e) | | | — | (e) | | | — | (e) |
| | 2016 - Cash Management Shares | | | 1.00 | | | | 0.001 | | | | — | (e) | | | 0.001 | | | | (0.001 | ) | | | — | (e) | | | (0.001 | ) |
| | 2015 - Institutional Shares | | | 1.00 | | | | — | (e) | | | — | (e) | | | — | (e) | | | — | (e) | | | — | (e) | | | — | (e) |
| | 2015 - Select Shares | | | 1.00 | | | | — | (e) | | | — | (e) | | | — | (e) | | | — | (e) | | | — | (e) | | | — | (e) |
| | 2015 - Preferred Shares | | | 1.00 | | | | — | (e) | | | — | (e) | | | — | (e) | | | — | (e) | | | — | (e) | | | — | (e) |
| | 2015 - Capital Shares | | | 1.00 | | | | — | (e) | | | — | (e) | | | — | (e) | | | — | (e) | | | — | (e) | | | — | (e) |
| | 2015 - Administration Shares | | | 1.00 | | | | — | (e) | | | — | (e) | | | — | (e) | | | — | (e) | | | — | (e) | | | — | (e) |
| | 2015 - Premier Shares | | | 1.00 | | | | — | (e) | | | — | (e) | | | — | (e) | | | — | (e) | | | — | (e) | | | — | (e) |
| | 2015 - Service Shares | | | 1.00 | | | | — | (e) | | | — | (e) | | | — | (e) | | | — | (e) | | | — | (e) | | | — | (e) |
| | 2015 - Resource Shares | | | 1.00 | | | | — | (e) | | | — | (e) | | | — | (e) | | | — | (e) | | | — | (e) | | | — | (e) |
| | 2015 - Cash Management Shares | | | 1.00 | | | | — | (e) | | | — | (e) | | | — | (e) | | | — | (e) | | | — | (e) | | | — | (e) |
| | 2014 - Institutional Shares | | | 1.00 | | | | — | (e) | | | — | (e) | | | — | (e) | | | — | (e) | | | — | (e) | | | — | (e) |
| | 2014 - Select Shares | | | 1.00 | | | | — | (e) | | | — | (e) | | | — | (e) | | | — | (e) | | | — | (e) | | | — | (e) |
| | 2014 - Preferred Shares | | | 1.00 | | | | — | (e) | | | — | (e) | | | — | (e) | | | — | (e) | | | — | (e) | | | — | (e) |
| | 2014 - Capital Shares | | | 1.00 | | | | — | (e) | | | — | (e) | | | — | (e) | | | — | (e) | | | — | (e) | | | — | (e) |
| | 2014 - Administration Shares | | | 1.00 | | | | — | (e) | | | — | (e) | | | — | (e) | | | — | (e) | | | — | (e) | | | — | (e) |
| | 2014 - Premier Shares | | | 1.00 | | | | — | (e) | | | — | (e) | | | — | (e) | | | — | (e) | | | — | (e) | | | — | (e) |
| | 2014 - Service Shares | | | 1.00 | | | | — | (e) | | | — | (e) | | | — | (e) | | | — | (e) | | | — | (e) | | | — | (e) |
| | 2014 - Resource Shares | | | 1.00 | | | | — | (e) | | | — | (e) | | | — | (e) | | | — | (e) | | | — | (e) | | | — | (e) |
| | 2014 - Cash Management Shares | | | 1.00 | | | | — | (e) | | | — | (e) | | | — | (e) | | | — | (e) | | | — | (e) | | | — | (e) |
| | 2013 - Institutional Shares | | | 1.00 | | | | 0.001 | | | | — | (e) | | | 0.001 | | | | (0.001 | ) | | | — | (e) | | | (0.001 | ) |
| | 2013 - Select Shares | | | 1.00 | | | | — | (e) | | | — | (e) | | | — | (e) | | | — | (e) | | | — | (e) | | | — | (e) |
| | 2013 - Preferred Shares | | | 1.00 | | | | — | (e) | | | — | (e) | | | — | (e) | | | — | (e) | | | — | (e) | | | — | (e) |
| | 2013 - Capital Shares | | | 1.00 | | | | — | (e) | | | — | (e) | | | — | (e) | | | — | (e) | | | — | (e) | | | — | (e) |
| | 2013 - Administration Shares | | | 1.00 | | | | — | (e) | | | — | (e) | | | — | (e) | | | — | (e) | | | — | (e) | | | — | (e) |
| | 2013 - Premier Shares | | | 1.00 | | | | — | (e) | | | — | (e) | | | — | (e) | | | — | (e) | | | — | (e) | | | — | (e) |
| | 2013 - Service Shares | | | 1.00 | | | | — | (e) | | | — | (e) | | | — | (e) | | | — | (e) | | | — | (e) | | | — | (e) |
| | 2013 - Resource Shares | | | 1.00 | | | | — | (e) | | | — | (e) | | | — | (e) | | | — | (e) | | | — | (e) | | | — | (e) |
| | 2013 - Cash Management Shares | | | 1.00 | | | | — | (e) | | | — | (e) | | | — | (e) | | | — | (e) | | | — | (e) | | | — | (e) |
| | (a) | | Calculated based on the average shares outstanding methodology. |
| | (b) | | Distributions may not coincide with the current year net investment income or net realized gains as distributions may be paid from current or prior year earnings. |
| | (c) | | Assumes investment at the net asset value at the beginning of the year, reinvestment of all dividends and distributions, a complete redemption of the investment at the net asset value at the end of the year and no sales or redemption charges. Total returns would be reduced if a sales redemption charge was taken into account. Returns do not reflect the deduction of taxes that a shareholder would pay on Fund distributions or the redemption of Fund shares. |
| | (d) | | Amount is less than $0.00005 per share. |
| | (e) | | Amount is less than $0.0005 per share. |
| | (f) | | Amount is less than 0.005% of average net assets. |
| | |
| 54 | | The accompanying notes are an integral part of these financial statements. |
FINANCIAL SQUARE PRIME OBLIGATIONS FUND
| | | | | | | | | | | | | | | | | | | | | | | | | | | | | | | | | | |
| | | | | | | | | | | | | | | | | | | | | | | | | | | | | |
| | | Net asset value, end of year | | | | | Total return(c) | | | | | Net assets end of year (in 000s) | | | | | Ratio of net expenses to average net assets | | | | | Ratio of total expenses to average net assets | | | | | Ratio of net investment income (loss) to average net assets | |
| | | | | | | | | | | | | | | | | | | | | | | | | | | | | | | | | | |
| | $ | 1.0003 | | | | | | 0.87 | % | | | | $ | 1,467,979 | | | | | | 0.18 | % | | | | | 0.27 | % | | | | | 0.73 | % |
| | | 1.0003 | | | | | | 0.84 | | | | | | 18,082 | | | | | | 0.21 | | | | | | 0.30 | | | | | | 0.97 | |
| | | 1.0003 | | | | | | 0.77 | | | | | | 1,003 | | | | | | 0.28 | | | | | | 0.37 | | | | | | 0.30 | |
| | | 1.0003 | | | | | | 0.72 | | | | | | 407 | | | | | | 0.33 | | | | | | 0.42 | | | | | | 0.24 | |
| | | 1.0003 | | | | | | 0.62 | | | | | | 4,282 | | | | | | 0.43 | | | | | | 0.52 | | | | | | 0.15 | |
| | | 1.0003 | | | | | | 0.53 | | | | | | 1 | | | | | | 0.53 | | | | | | 0.62 | | | | | | 0.71 | |
| | | 1.0003 | | | | | | 0.38 | | | | | | 103 | | | | | | 0.59 | | | | | | 0.77 | | | | | | 0.03 | |
| | | 1.0003 | | | | | | 0.27 | | | | | | 1 | | | | | | 0.52 | | | | | | 0.92 | | | | | | 0.02 | |
| | | 1.0003 | | | | | | 0.18 | | | | | | 1 | | | | | | 0.73 | | | | | | 1.07 | | | | | | 0.51 | |
| | | 1.00 | | | | | | 0.29 | | | | | | 7,299,656 | | | | | | 0.18 | | | | | | 0.23 | | | | | | 0.31 | |
| | | 1.00 | | | | | | 0.26 | | | | | | 9,454 | | | | | | 0.21 | | | | | | 0.26 | | | | | | 0.29 | |
| | | 1.00 | | | | | | 0.20 | | | | | | 279,445 | | | | | | 0.28 | | | | | | 0.33 | | | | | | 0.19 | |
| | | 1.00 | | | | | | 0.16 | | | | | | 140,138 | | | | | | 0.31 | | | | | | 0.38 | | | | | | 0.16 | |
| | | 1.00 | | | | | | 0.09 | | | | | | 1,250,848 | | | | | | 0.38 | | | | | | 0.48 | | | | | | 0.09 | |
| | | 1.00 | | | | | | 0.09 | | | | | | 1 | | | | | | 0.18 | | | | | | 0.58 | | | | | | 0.36 | |
| | | 1.00 | | | | | | 0.01 | | | | | | 253,231 | | | | | | 0.42 | | | | | | 0.73 | | | | | | — | (f) |
| | | 1.00 | | | | | | 0.01 | | | | | | 71,804 | | | | | | 0.46 | | | | | | 0.88 | | | | | | 0.01 | |
| | | 1.00 | | | | | | 0.09 | | | | | | 1 | | | | | | 0.18 | | | | | | 1.03 | | | | | | 0.37 | |
| | | 1.00 | | | | | | 0.03 | | | | | | 9,211,383 | | | | | | 0.18 | | | | | | 0.23 | | | | | | 0.03 | |
| | | 1.00 | | | | | | 0.01 | | | | | | 88,996 | | | | | | 0.20 | | | | | | 0.26 | | | | | | 0.01 | |
| | | 1.00 | | | | | | 0.01 | | | | | | 332,798 | | | | | | 0.21 | | | | | | 0.33 | | | | | | 0.01 | |
| | | 1.00 | | | | | | 0.01 | | | | | | 103,978 | | | | | | 0.21 | | | | | | 0.38 | | | | | | 0.01 | |
| | | 1.00 | | | | | | 0.01 | | | | | | 1,893,461 | | | | | | 0.20 | | | | | | 0.48 | | | | | | 0.01 | |
| | | 1.00 | | | | | | 0.01 | | | | | | 1 | | | | | | 0.18 | | | | | | 0.58 | | | | | | 0.40 | |
| | | 1.00 | | | | | | 0.01 | | | | | | 777,357 | | | | | | 0.20 | | | | | | 0.73 | | | | | | 0.01 | |
| | | 1.00 | | | | | | 0.01 | | | | | | 72,031 | | | | | | 0.20 | | | | | | 0.88 | | | | | | 0.01 | |
| | | 1.00 | | | | | | 0.01 | | | | | | 1 | | | | | | 0.18 | | | | | | 1.03 | | | | | | 0.40 | |
| | | 1.00 | | | | | | 0.02 | | | | | | 10,934,044 | | | | | | 0.18 | | | | | | 0.23 | | | | | | 0.02 | |
| | | 1.00 | | | | | | 0.01 | | | | | | 118,994 | | | | | | 0.19 | | | | | | 0.26 | | | | | | 0.01 | |
| | | 1.00 | | | | | | 0.01 | | | | | | 108,264 | | | | | | 0.19 | | | | | | 0.33 | | | | | | 0.01 | |
| | | 1.00 | | | | | | 0.01 | | | | | | 72,327 | | | | | | 0.19 | | | | | | 0.38 | | | | | | 0.01 | |
| | | 1.00 | | | | | | 0.01 | | | | | | 1,644,425 | | | | | | 0.19 | | | | | | 0.48 | | | | | | 0.01 | |
| | | 1.00 | | | | | | 0.01 | | | | | | 1 | | | | | | 0.18 | | | | | | 0.58 | | | | | | 0.40 | |
| | | 1.00 | | | | | | 0.01 | | | | | | 938,791 | | | | | | 0.19 | | | | | | 0.73 | | | | | | 0.01 | |
| | | 1.00 | | | | | | 0.01 | | | | | | 78,532 | | | | | | 0.19 | | | | | | 0.88 | | | | | | 0.01 | |
| | | 1.00 | | | | | | 0.01 | | | | | | 1 | | | | | | 0.18 | | | | | | 1.03 | | | | | | 0.40 | |
| | | 1.00 | | | | | | 0.07 | | | | | | 13,339,031 | | | | | | 0.18 | | | | | | 0.23 | | | | | | 0.07 | |
| | | 1.00 | | | | | | 0.05 | | | | | | 212,468 | | | | | | 0.21 | | | | | | 0.26 | | | | | | 0.04 | |
| | | 1.00 | | | | | | 0.01 | | | | | | 227,037 | | | | | | 0.24 | | | | | | 0.33 | | | | | | — | (f) |
| | | 1.00 | | | | | | 0.01 | | | | | | 102,509 | | | | | | 0.26 | | | | | | 0.38 | | | | | | — | (f) |
| | | 1.00 | | | | | | 0.01 | | | | | | 2,579,850 | | | | | | 0.24 | | | | | | 0.48 | | | | | | — | (f) |
| | | 1.00 | | | | | | 0.01 | | | | | | 1 | | | | | | 0.18 | | | | | | 0.58 | | | | | | 0.40 | |
| | | 1.00 | | | | | | 0.01 | | | | | | 767,593 | | | | | | 0.24 | | | | | | 0.73 | | | | | | — | (f) |
| | | 1.00 | | | | | | 0.01 | | | | | | 91,805 | | | | | | 0.25 | | | | | | 0.88 | | | | | | — | (f) |
| | | 1.00 | | | | | | 0.01 | | | | | | 1 | | | | | | 0.18 | | | | | | 1.03 | | | | | | 0.40 | |
| | |
| The accompanying notes are an integral part of these financial statements. | | 55 |
FINANCIAL SQUARE TAX-EXEMPT MONEY MARKET FUND
Financial Highlights
Selected Data for a Share Outstanding Throughout Each Period
| | | | | | | | | | | | | | | | | | | | | | | | | | | | | | |
| | | | | | | | From
investment operations | | | Distributions
to shareholders | |
| | | Year - Share Class | | Net asset value, beginning of period | | | Net
investment
income(a) | | | Net realized
and unrealized
gain (loss) | | | Total from
investment
operations | | | From net
investment
income | | | From net
realized
gains | | | Total
distributions(b) | |
| | FOR THE FISCAL YEAR ENDED AUGUST 31, | |
| | 2017 - Institutional Shares | | $ | 1.0000 | | | $ | 0.0054 | | | $ | — | (d) | | $ | 0.0054 | | | $ | (0.0054 | ) | | $ | — | (d) | | $ | (0.0054 | ) |
| | 2017 - Select Shares | | | 1.0000 | | | | 0.0050 | | | | 0.0002 | | | | 0.0052 | | | | (0.0051 | ) | | | — | (d) | | | (0.0051 | ) |
| | 2017 - Preferred Shares | | | 1.0000 | | | | 0.0043 | | | | 0.0001 | | | | 0.0044 | | | | (0.0044 | ) | | | — | (d) | | | (0.0044 | ) |
| | 2017 - Capital Shares | | | 1.0000 | | | | 0.0039 | | | | — | (d) | | | 0.0039 | | | | (0.0039 | ) | | | — | (d) | | | (0.0039 | ) |
| | 2017 - Administration Shares | | | 1.0000 | | | | 0.0028 | | | | 0.0001 | | | | 0.0029 | | | | (0.0029 | ) | | | — | (d) | | | (0.0029 | ) |
| | 2017 - Service Shares | | | 1.0000 | | | | 0.0008 | | | | (0.0001 | ) | | | 0.0007 | | | | (0.0007 | ) | | | — | (d) | | | (0.0007 | ) |
| | 2017 - Resource Shares | | | 1.0000 | | | | 0.0004 | | | | (0.0003 | ) | | | 0.0001 | | | | (0.0001 | ) | | | — | (d) | | | (0.0001 | ) |
| | | | | | | | | | | | | | | | | | | | | | | | | | | | | | |
| | FOR THE PERIOD ENDED AUGUST 31,* | |
| | 2016 - Institutional Shares | | | 1.00 | | | | 0.001 | | | | — | (e) | | | 0.001 | | | | (0.001 | ) | | | — | (e) | | | (0.001 | ) |
| | 2016 - Select Shares | | | 1.00 | | | | 0.001 | | | | — | (e) | | | 0.001 | | | | (0.001 | ) | | | — | (e) | | | (0.001 | ) |
| | 2016 - Preferred Shares | | | 1.00 | | | | — | (e) | | | — | (e) | | | — | (e) | | | — | (e) | | | — | (e) | | | — | (e) |
| | 2016 - Capital Shares | | | 1.00 | | | | — | (e) | | | — | (e) | | | — | (e) | | | — | (e) | | | — | (e) | | | — | (e) |
| | 2016 - Administration Shares | | | 1.00 | | | | — | (e) | | | — | (e) | | | — | (e) | | | — | (e) | | | — | (e) | | | — | (e) |
| | 2016 - Service Shares | | | 1.00 | | | | — | (e) | | | — | (e) | | | — | (e) | | | — | (e) | | | — | (e) | | | — | (e) |
| | 2016 - Resource Shares | | | 1.00 | | | | — | (e) | | | — | (e) | | | — | (e) | | | — | (e) | | | — | (e) | | | — | (e) |
| | * | | Commenced operations on March 31, 2016. |
| | (a) | | Calculated based on the average shares outstanding methodology. |
| | (b) | | Distributions may not coincide with the current year net investment income or net realized gains as distributions may be paid from current or prior year earnings. |
| | (c) | | Assumes investment at the net asset value at the beginning of the year, reinvestment of all dividends and distributions, a complete redemption of the investment at the net asset value at the end of the year and no sales or redemption charges. Total returns would be reduced if a sales redemption charge was taken into account. Returns do not reflect the deduction of taxes that a shareholder would pay on Fund distributions or the redemption of Fund shares. Total returns for periods less than one full year are not annualized. |
| | (d) | | Amount is less than $0.00005 per share. |
| | (e) | | Amount is less than $0.0005 per share. |
| | |
| 56 | | The accompanying notes are an integral part of these financial statements. |
FINANCIAL SQUARE TAX-EXEMPT MONEY MARKET FUND
| | | | | | | | | | | | | | | | | | | | | | | | | | | | | | | | | | |
| | | | | | | | | | | | | | | | | | | | | | | | | | | | | |
| | | Net asset value, end of period | | | | | Total return(c) | | | | | Net assets end of period (in 000s) | | | | | Ratio of net expenses to average net assets | | | | | Ratio of total expenses to average net assets | | | | | Ratio of net investment income to average net assets | |
| | | | | | | | | | | | | | | | | | | | | | | | | | | | | | | | | | |
| | $ | 1.0000 | | | | | | 0.54 | % | | | | $ | 7,945 | | | | | | 0.18 | % | | | | | 8.56 | % | | | | | 0.54 | % |
| | | 1.0001 | | | | | | 0.52 | | | | | | 10 | | | | | | 0.22 | | | | | | 8.59 | | | | | | 0.50 | |
| | | 1.0000 | | | | | | 0.44 | | | | | | 10 | | | | | | 0.29 | | | | | | 8.66 | | | | | | 0.43 | |
| | | 1.0000 | | | | | | 0.39 | | | | | | 10 | | | | | | 0.33 | | | | | | 8.71 | | | | | | 0.39 | |
| | | 1.0000 | | | | | | 0.29 | | | | | | 10 | | | | | | 0.44 | | | | | | 8.81 | | | | | | 0.28 | |
| | | 1.0000 | | | | | | 0.07 | | | | | | 10 | | | | | | 0.64 | | | | | | 9.06 | | | | | | 0.08 | |
| | | 1.0000 | | | | | | 0.01 | | | | | | 10 | | | | | | 0.68 | | | | | | 9.21 | | | | | | 0.04 | |
| | | | | | | | | | | | | | | | | | | | | | | | | | | | | | | | | | |
| | | | | | | | | | | | | | | | | | | | | | | | | | | | | | | | | | |
| | | 1.00 | | | | | | 0.09 | | | | | | 12,495 | | | | | | 0.18 | (f) | | | | | 9.48 | (f) | | | | | 0.23 | (f) |
| | | 1.00 | | | | | | 0.07 | | | | | | 10 | | | | | | 0.22 | (f) | | | | | 9.51 | (f) | | | | | 0.17 | (f) |
| | | 1.00 | | | | | | 0.04 | | | | | | 10 | | | | | | 0.29 | (f) | | | | | 9.58 | (f) | | | | | 0.10 | (f) |
| | | 1.00 | | | | | | 0.03 | | | | | | 10 | | | | | | 0.32 | (f) | | | | | 9.63 | (f) | | | | | 0.07 | (f) |
| | | 1.00 | | | | | | 0.02 | | | | | | 10 | | | | | | 0.34 | (f) | | | | | 9.73 | (f) | | | | | 0.04 | (f) |
| | | 1.00 | | | | | | 0.02 | | | | | | 10 | | | | | | 0.35 | (f) | | | | | 9.98 | (f) | | | | | 0.04 | (f) |
| | | 1.00 | | | | | | 0.02 | | | | | | 10 | | | | | | 0.35 | (f) | | | | | 10.13 | (f) | | | | | 0.04 | (f) |
| | |
| The accompanying notes are an integral part of these financial statements. | | 57 |
FINANCIAL SQUARE TREASURY INSTRUMENTS FUND
Financial Highlights
Selected Data for a Share Outstanding Throughout Each Period
| | | | | | | | | | | | | | | | | | | | | | | | | | | | | | |
| | | | | | | | From
investment operations | | | Distributions
to shareholders | |
| | | Year - Share Class | | Net asset value, beginning of year | | | Net
investment
income(a) | | | Net realized
gain (loss) | | | Total from
investment
operations | | | From net
investment
income | | | From net
realized
gains | | | Total
distributions(b) | |
| | FOR THE FISCAL YEARS ENDED AUGUST 31, | |
| | 2017 - Institutional Shares | | $ | 1.00 | | | $ | 0.005 | | | $ | — | (d) | | $ | 0.005 | | | $ | (0.005 | ) | | $ | — | (d) | | $ | (0.005 | ) |
| | 2017 - Select Shares | | | 1.00 | | | | 0.004 | | | | 0.001 | | | | 0.005 | | | | (0.005 | ) | | | — | (d) | | | (0.005 | ) |
| | 2017 - Preferred Shares | | | 1.00 | | | | 0.003 | | | | 0.001 | | | | 0.004 | | | | (0.004 | ) | | | — | (d) | | | (0.004 | ) |
| | 2017 - Capital Shares | | | 1.00 | | | | 0.004 | | | | (0.001 | ) | | | 0.003 | | | | (0.003 | ) | | | — | (d) | | | (0.003 | ) |
| | 2017 - Administration Shares | | | 1.00 | | | | 0.003 | | | | (0.001 | ) | | | 0.002 | | | | (0.002 | ) | | | — | (d) | | | (0.002 | ) |
| | 2017 - Premier Shares | | | 1.00 | | | | 0.002 | | | | — | (d) | | | 0.002 | | | | (0.002 | ) | | | — | (d) | | | (0.002 | ) |
| | 2017 - Service Shares | | | 1.00 | | | | 0.001 | | | | — | (d) | | | 0.001 | | | | (0.001 | ) | | | — | (d) | | | (0.001 | ) |
| | 2017 - Resource Shares | | | 1.00 | | | | 0.004 | | | | (0.004 | ) | | | — | (d) | | | — | (d) | | | — | (d) | | | — | (d) |
| | 2017 - Cash Management Shares | | | 1.00 | | | | — | (d) | | | — | (d) | | | — | (d) | | | — | (d) | | | — | (d) | | | — | (d) |
| | 2016 - Institutional Shares | | | 1.00 | | | | 0.001 | | | | — | (d) | | | 0.001 | | | | (0.001 | ) | | | — | (d) | | | (0.001 | ) |
| | 2016 - Select Shares | | | 1.00 | | | | 0.001 | | | | — | (d) | | | 0.001 | | | | (0.001 | ) | | | — | (d) | | | (0.001 | ) |
| | 2016 - Preferred Shares | | | 1.00 | | | | 0.001 | | | | — | (d) | | | 0.001 | | | | (0.001 | ) | | | — | (d) | | | (0.001 | ) |
| | 2016 - Capital Shares | | | 1.00 | | | | — | (d) | | | — | (d) | | | — | (d) | | | — | (d) | | | — | (d) | | | — | (d) |
| | 2016 - Administration Shares | | | 1.00 | | | | — | (d) | | | — | (d) | | | — | (d) | | | — | (d) | | | — | (d) | | | — | (d) |
| | 2016 - Premier Shares | | | 1.00 | | | | — | (d) | | | — | (d) | | | — | (d) | | | — | (d) | | | — | (d) | | | — | (d) |
| | 2016 - Service Shares | | | 1.00 | | | | — | (d) | | | — | (d) | | | — | (d) | | | — | (d) | | | — | (d) | | | — | (d) |
| | 2016 - Resource Shares | | | 1.00 | | | | — | (d) | | | — | (d) | | | — | (d) | | | — | (d) | | | — | (d) | | | — | (d) |
| | 2016 - Cash Management Shares | | | 1.00 | | | | — | (d) | | | — | (d) | | | — | (d) | | | — | (d) | | | — | (d) | | | — | (d) |
| | 2015 - Institutional Shares | | | 1.00 | | | | — | (d) | | | — | (d) | | | — | (d) | | | — | (d) | | | — | (d) | | | — | (d) |
| | 2015 - Select Shares | | | 1.00 | | | | — | (d) | | | — | (d) | | | — | (d) | | | — | (d) | | | — | (d) | | | — | (d) |
| | 2015 - Preferred Shares | | | 1.00 | | | | — | (d) | | | — | (d) | | | — | (d) | | | — | (d) | | | — | (d) | | | — | (d) |
| | 2015 - Capital Shares | | | 1.00 | | | | — | (d) | | | — | (d) | | | — | (d) | | | — | (d) | | | — | (d) | | | — | (d) |
| | 2015 - Administration Shares | | | 1.00 | | | | — | (d) | | | — | (d) | | | — | (d) | | | — | (d) | | | — | (d) | | | — | (d) |
| | 2015 - Premier Shares | | | 1.00 | | | | — | (d) | | | — | (d) | | | — | (d) | | | — | (d) | | | — | (d) | | | — | (d) |
| | 2015 - Service Shares | | | 1.00 | | | | — | (d) | | | — | (d) | | | — | (d) | | | — | (d) | | | — | (d) | | | — | (d) |
| | 2015 - Resource Shares | | | 1.00 | | | | — | (d) | | | — | (d) | | | — | (d) | | | — | (d) | | | — | (d) | | | — | (d) |
| | 2015 - Cash Management Shares | | | 1.00 | | | | — | (d) | | | — | (d) | | | — | (d) | | | — | (d) | | | — | (d) | | | — | (d) |
| | 2014 - Institutional Shares | | | 1.00 | | | | — | (d) | | | — | (d) | | | — | (d) | | | — | (d) | | | — | (d) | | | — | (d) |
| | 2014 - Select Shares | | | 1.00 | | | | — | (d) | | | — | (d) | | | — | (d) | | | — | (d) | | | — | (d) | | | — | (d) |
| | 2014 - Preferred Shares | | | 1.00 | | | | — | (d) | | | — | (d) | | | — | (d) | | | — | (d) | | | — | (d) | | | — | (d) |
| | 2014 - Capital Shares | | | 1.00 | | | | — | (d) | | | — | (d) | | | — | (d) | | | — | (d) | | | — | (d) | | | — | (d) |
| | 2014 - Administration Shares | | | 1.00 | | | | — | (d) | | | — | (d) | | | — | (d) | | | — | (d) | | | — | (d) | | | — | (d) |
| | 2014 - Premier Shares | | | 1.00 | | | | — | (d) | | | — | (d) | | | — | (d) | | | — | (d) | | | — | (d) | | | — | (d) |
| | 2014 - Service Shares | | | 1.00 | | | | — | (d) | | | — | (d) | | | — | (d) | | | — | (d) | | | — | (d) | | | — | (d) |
| | 2014 - Resource Shares | | | 1.00 | | | | — | (d) | | | — | (d) | | | — | (d) | | | — | (d) | | | — | (d) | | | — | (d) |
| | 2014 - Cash Management Shares | | | 1.00 | | | | — | (d) | | | — | (d) | | | — | (d) | | | — | (d) | | | — | (d) | | | — | (d) |
| | 2013 - Institutional Shares | | | 1.00 | | | | — | (d) | | | — | (d) | | | — | (d) | | | — | (d) | | | — | (d) | | | — | (d) |
| | 2013 - Select Shares | | | 1.00 | | | | — | (d) | | | — | (d) | | | — | (d) | | | — | (d) | | | — | (d) | | | — | (d) |
| | 2013 - Preferred Shares | | | 1.00 | | | | — | (d) | | | — | (d) | | | — | (d) | | | — | (d) | | | — | (d) | | | — | (d) |
| | 2013 - Capital Shares | | | 1.00 | | | | — | (d) | | | — | (d) | | | — | (d) | | | — | (d) | | | — | (d) | | | — | (d) |
| | 2013 - Administration Shares | | | 1.00 | | | | — | (d) | | | — | (d) | | | — | (d) | | | — | (d) | | | — | (d) | | | — | (d) |
| | 2013 - Premier Shares | | | 1.00 | | | | — | (d) | | | — | (d) | | | — | (d) | | | — | (d) | | | — | (d) | | | — | (d) |
| | 2013 - Service Shares | | | 1.00 | | | | — | (d) | | | — | (d) | | | — | (d) | | | — | (d) | | | — | (d) | | | — | (d) |
| | 2013 - Resource Shares | | | 1.00 | | | | — | (d) | | | — | (d) | | | — | (d) | | | — | (d) | | | — | (d) | | | — | (d) |
| | 2013 - Cash Management Shares | | | 1.00 | | | | — | (d) | | | — | (d) | | | — | (d) | | | — | (d) | | | — | (d) | | | — | (d) |
| | (a) | | Calculated based on the average shares outstanding methodology. |
| | (b) | | Distributions may not coincide with the current year net investment income or net realized gains as distributions may be paid from current or prior year earnings. |
| | (c) | | Assumes reinvestment of all distributions. Returns do not reflect the deduction of taxes that a shareholder would pay on Fund distributions. |
| | (d) | | Amount is less than $0.0005 per share. |
| | (e) | | Amount is less than 0.005% of average net assets. |
| | (f) | | Amount is less than 0.005%. |
| | |
| 58 | | The accompanying notes are an integral part of these financial statements. |
FINANCIAL SQUARE TREASURY INSTRUMENTS FUND
| | | | | | | | | | | | | | | | | | | | | | | | | | | | | | | | | | |
| | | | | | | | | | | |
| | | Net asset value, end of year | | | | | Total return(c) | | | | | Net assets end of year (in 000s) | | | | | Ratio of net expenses to average net assets | | | | | Ratio of total expenses to average net assets | | | | | Ratio of net investment income (loss) to average net assets | |
| | | | | | | | | | | | | | | | | | | | | | | | | | | | | | | | | | |
| | $ | 1.00 | | | | | | 0.48 | % | | | | $ | 44,355,448 | | | | | | 0.20 | % | | | | | 0.23 | % | | | | | 0.47 | % |
| | | 1.00 | | | | | | 0.45 | | | | | | 47,839 | | | | | | 0.23 | | | | | | 0.26 | | | | | | 0.43 | |
| | | 1.00 | | | | | | 0.38 | | | | | | 39,754 | | | | | | 0.30 | | | | | | 0.33 | | | | | | 0.34 | |
| | | 1.00 | | | | | | 0.33 | | | | | | 1,054,817 | | | | | | 0.35 | | | | | | 0.38 | | | | | | 0.38 | |
| | | 1.00 | | | | | | 0.24 | | | | | | 2,817,291 | | | | | | 0.44 | | | | | | 0.48 | | | | | | 0.26 | |
| | | 1.00 | | | | | | 0.17 | | | | | | 56,059 | | | | | | 0.50 | | | | | | 0.58 | | | | | | 0.20 | |
| | | 1.00 | | | | | | 0.10 | | | | | | 47,234 | | | | | | 0.55 | | | | | | 0.73 | | | | | | 0.05 | |
| | | 1.00 | | | | | | 0.04 | | | | | | 1 | | | | | | 0.26 | | | | | | 0.88 | | | | | | 0.37 | |
| | | 1.00 | | | | | | 0.01 | | | | | | 30 | | | | | | 0.61 | | | | | | 1.03 | | | | | | — | (e) |
| | | 1.00 | | | | | | 0.13 | | | | | | 50,595,412 | | | | | | 0.19 | | | | | | 0.23 | | | | | | 0.14 | |
| | | 1.00 | | | | | | 0.11 | | | | | | 21,009 | | | | | | 0.21 | | | | | | 0.26 | | | | | | 0.07 | |
| | | 1.00 | | | | | | 0.06 | | | | | | 12,735 | | | | | | 0.26 | | | | | | 0.33 | | | | | | 0.05 | |
| | | 1.00 | | | | | | 0.03 | | | | | | 495,853 | | | | | | 0.30 | | | | | | 0.38 | | | | | | 0.02 | |
| | | 1.00 | | | | | | — | (f) | | | | | 2,186,426 | | | | | | 0.32 | | | | | | 0.48 | | | | | | (0.01 | ) |
| | | 1.00 | | | | | | — | (f) | | | | | 19,142 | | | | | | 0.38 | | | | | | 0.58 | | | | | | (0.02 | ) |
| | | 1.00 | | | | | | — | (f) | | | | | 91,598 | | | | | | 0.29 | | | | | | 0.73 | | | | | | (0.01 | ) |
| | | 1.00 | | | | | | — | (f) | | | | | 1 | | | | | | 0.19 | | | | | | 0.88 | | | | | | 0.37 | |
| | | 1.00 | | | | | | — | (f) | | | | | 279 | | | | | | 0.35 | | | | | | 1.03 | | | | | | 0.05 | |
| | | 1.00 | | | | | | — | (f) | | | | | 34,094,054 | | | | | | 0.06 | | | | | | 0.23 | | | | | | — | (e) |
| | | 1.00 | | | | | | — | (f) | | | | | 80,008 | | | | | | 0.06 | | | | | | 0.26 | | | | | | — | (e) |
| | | 1.00 | | | | | | — | (f) | | | | | 33,032 | | | | | | 0.06 | | | | | | 0.33 | | | | | | — | (e) |
| | | 1.00 | | | | | | — | (f) | | | | | 353,326 | | | | | | 0.06 | | | | | | 0.38 | | | | | | — | (e) |
| | | 1.00 | | | | | | — | (f) | | | | | 2,101,757 | | | | | | 0.06 | | | | | | 0.48 | | | | | | — | (e) |
| | | 1.00 | | | | | | — | (f) | | | | | 54 | | | | | | 0.06 | | | | | | 0.58 | | | | | | — | (e) |
| | | 1.00 | | | | | | — | (f) | | | | | 197,083 | | | | | | 0.06 | | | | | | 0.73 | | | | | | — | (e) |
| | | 1.00 | | | | | | — | (f) | | | | | 1 | | | | | | 0.06 | | | | | | 0.88 | | | | | | 0.40 | |
| | | 1.00 | | | | | | — | (f) | | | | | 1 | | | | | | 0.06 | | | | | | 1.03 | | | | | | 0.40 | |
| | | 1.00 | | | | | | — | (f) | | | | | 31,170,061 | | | | | | 0.07 | | | | | | 0.23 | | | | | | — | (e) |
| | | 1.00 | | | | | | — | (f) | | | | | 192,930 | | | | | | 0.07 | | | | | | 0.26 | | | | | | — | (e) |
| | | 1.00 | | | | | | — | (f) | | | | | 43,335 | | | | | | 0.07 | | | | | | 0.33 | | | | | | — | (e) |
| | | 1.00 | | | | | | — | (f) | | | | | 163,450 | | | | | | 0.07 | | | | | | 0.38 | | | | | | — | (e) |
| | | 1.00 | | | | | | — | (f) | | | | | 1,231,641 | | | | | | 0.07 | | | | | | 0.48 | | | | | | — | (e) |
| | | 1.00 | | | | | | — | (f) | | | | | 2,720 | | | | | | 0.07 | | | | | | 0.58 | | | | | | — | (e) |
| | | 1.00 | | | | | | — | (f) | | | | | 140,016 | | | | | | 0.07 | | | | | | 0.73 | | | | | | — | (e) |
| | | 1.00 | | | | | | — | (f) | | | | | 1 | | | | | | 0.07 | | | | | | 0.88 | | | | | | 0.40 | |
| | | 1.00 | | | | | | — | (f) | | | | | 1 | | | | | | 0.07 | | | | | | 1.03 | | | | | | 0.40 | |
| | | 1.00 | | | | | | — | (f) | | | | | 25,382,266 | | | | | | 0.10 | | | | | | 0.23 | | | | | | — | (e) |
| | | 1.00 | | | | | | — | (f) | | | | | 224,452 | | | | | | 0.10 | | | | | | 0.26 | | | | | | — | (e) |
| | | 1.00 | | | | | | — | (f) | | | | | 110,400 | | | | | | 0.10 | | | | | | 0.33 | | | | | | — | (e) |
| | | 1.00 | | | | | | — | (f) | | | | | 165,250 | | | | | | 0.10 | | | | | | 0.38 | | | | | | — | (e) |
| | | 1.00 | | | | | | — | (f) | | | | | 1,352,128 | | | | | | 0.10 | | | | | | 0.48 | | | | | | — | (e) |
| | | 1.00 | | | | | | — | (f) | | | | | 360,992 | | | | | | 0.10 | | | | | | 0.58 | | | | | | — | (e) |
| | | 1.00 | | | | | | — | (f) | | | | | 185,658 | | | | | | 0.10 | | | | | | 0.73 | | | | | | — | (e) |
| | | 1.00 | | | | | | — | (f) | | | | | 1 | | | | | | 0.10 | | | | | | 0.88 | | | | | | — | (e) |
| | | 1.00 | | | | | | — | (f) | | | | | 1 | | | | | | 0.10 | | | | | | 1.03 | | | | | | — | (e) |
| | |
| The accompanying notes are an integral part of these financial statements. | | 59 |
FINANCIAL SQUARE TREASURY OBLIGATIONS FUND
Financial Highlights
Selected Data for a Share Outstanding Throughout Each Period
| | | | | | | | | | | | | | | | | | | | | | | | | | | | | | |
| | | | | | | | From
investment operations | | | Distributions
to shareholders | |
| | | Year - Share Class | | Net asset value, beginning of year | | | Net
investment
income(a) | | | Net realized
gain (loss) | | | Total from
investment
operations | | | From net
investment
income | | | From net
realized
gains | | | Total
distributions(b) | |
| | FOR THE FISCAL YEARS ENDED AUGUST 31, | |
| | 2017 - Institutional Shares | | $ | 1.00 | | | $ | 0.005 | | | $ | — | (d) | | $ | 0.005 | | | $ | (0.005 | ) | | $ | — | (d) | | $ | (0.005 | ) |
| | 2017 - Select Shares | | | 1.00 | | | | 0.005 | | | | — | (d) | | | 0.005 | | | | (0.005 | ) | | | — | (d) | | | (0.005 | ) |
| | 2017 - Preferred Shares | | | 1.00 | | | | 0.004 | | | | — | (d) | | | 0.004 | | | | (0.004 | ) | | | — | (d) | | | (0.004 | ) |
| | 2017 - Capital Shares | | | 1.00 | | | | 0.003 | | | | — | (d) | | | 0.003 | | | | (0.003 | ) | | | — | (d) | | | (0.003 | ) |
| | 2017 - Administration Shares | | | 1.00 | | | | 0.002 | | | | 0.001 | | | | 0.003 | | | | (0.003 | ) | | | — | (d) | | | (0.003 | ) |
| | 2017 - Premier Shares | | | 1.00 | | | | 0.004 | | | | (0.002 | ) | | | 0.002 | | | | (0.002 | ) | | | — | (d) | | | (0.002 | ) |
| | 2017 - Service Shares | | | 1.00 | | | | 0.001 | | | | — | (d) | | | 0.001 | | | | (0.001 | ) | | | — | (d) | | | (0.001 | ) |
| | 2017 - Resource Shares | | | 1.00 | | | | 0.004 | | | | (0.004 | ) | | | — | (d) | | | — | (d) | | | — | (d) | | | — | (d) |
| | 2017 - Cash Management Shares | | | 1.00 | | | | 0.001 | | | | (0.001 | ) | | | — | (d) | | | — | (d) | | | — | (d) | | | — | (d) |
| | 2016 - Institutional Shares | | | 1.00 | | | | 0.002 | | | | — | (d) | | | 0.002 | | | | (0.002 | ) | | | — | (d) | | | (0.002 | ) |
| | 2016 - Select Shares | | | 1.00 | | | | 0.001 | | | | — | (d) | | | 0.001 | | | | (0.001 | ) | | | — | (d) | | | (0.001 | ) |
| | 2016 - Preferred Shares | | | 1.00 | | | | 0.001 | | | | — | (d) | | | 0.001 | | | | (0.001 | ) | | | — | (d) | | | (0.001 | ) |
| | 2016 - Capital Shares | | | 1.00 | | | | — | (d) | | | — | (d) | | | — | (d) | | | — | (d) | | | — | (d) | | | — | (d) |
| | 2016 - Administration Shares | | | 1.00 | | | | — | (d) | | | — | (d) | | | — | (d) | | | — | (d) | | | — | (d) | | | — | (d) |
| | 2016 - Premier Shares | | | 1.00 | | | | — | (d) | | | — | (d) | | | — | (d) | | | — | (d) | | | — | (d) | | | — | (d) |
| | 2016 - Service Shares | | | 1.00 | | | | — | (d) | | | — | (d) | | | — | (d) | | | — | (d) | | | — | (d) | | | — | (d) |
| | 2016 - Resource Shares | | | 1.00 | | | | — | (d) | | | — | (d) | | | — | (d) | | | — | (d) | | | — | (d) | | | — | (d) |
| | 2016 - Cash Management Shares | | | 1.00 | | | | — | (d) | | | — | (d) | | | — | (d) | | | — | (d) | | | — | (d) | | | — | (d) |
| | 2015 - Institutional Shares | | | 1.00 | | | | — | (d) | | | — | (d) | | | — | (d) | | | — | (d) | | | — | (d) | | | — | (d) |
| | 2015 - Select Shares | | | 1.00 | | | | — | (d) | | | — | (d) | | | — | (d) | | | — | (d) | | | — | (d) | | | — | (d) |
| | 2015 - Preferred Shares | | | 1.00 | | | | — | (d) | | | — | (d) | | | — | (d) | | | — | (d) | | | — | (d) | | | — | (d) |
| | 2015 - Capital Shares | | | 1.00 | | | | — | (d) | | | — | (d) | | | — | (d) | | | — | (d) | | | — | (d) | | | — | (d) |
| | 2015 - Administration Shares | | | 1.00 | | | | — | (d) | | | — | (d) | | | — | (d) | | | — | (d) | | | — | (d) | | | — | (d) |
| | 2015 - Premier Shares | | | 1.00 | | | | — | (d) | | | — | (d) | | | — | (d) | | | — | (d) | | | — | (d) | | | — | (d) |
| | 2015 - Service Shares | | | 1.00 | | | | — | (d) | | | — | (d) | | | — | (d) | | | — | (d) | | | — | (d) | | | — | (d) |
| | 2015 - Resource Shares | | | 1.00 | | | | — | (d) | | | — | (d) | | | — | (d) | | | — | (d) | | | — | (d) | | | — | (d) |
| | 2015 - Cash Management Shares | | | 1.00 | | | | — | (d) | | | — | (d) | | | — | (d) | | | — | (d) | | | — | (d) | | | — | (d) |
| | 2014 - Institutional Shares | | | 1.00 | | | | — | (d) | | | — | (d) | | | — | (d) | | | — | (d) | | | — | (d) | | | — | (d) |
| | 2014 - Select Shares | | | 1.00 | | | | — | (d) | | | — | (d) | | | — | (d) | | | — | (d) | | | — | (d) | | | — | (d) |
| | 2014 - Preferred Shares | | | 1.00 | | | | — | (d) | | | — | (d) | | | — | (d) | | | — | (d) | | | — | (d) | | | — | (d) |
| | 2014 - Capital Shares | | | 1.00 | | | | — | (d) | | | — | (d) | | | — | (d) | | | — | (d) | | | — | (d) | | | — | (d) |
| | 2014 - Administration Shares | | | 1.00 | | | | — | (d) | | | — | (d) | | | — | (d) | | | — | (d) | | | — | (d) | | | — | (d) |
| | 2014 - Premier Shares | | | 1.00 | | | | — | (d) | | | — | (d) | | | — | (d) | | | — | (d) | | | — | (d) | | | — | (d) |
| | 2014 - Service Shares | | | 1.00 | | | | — | (d) | | | — | (d) | | | — | (d) | | | — | (d) | | | — | (d) | | | — | (d) |
| | 2014 - Resource Shares | | | 1.00 | | | | — | (d) | | | — | (d) | | | — | (d) | | | — | (d) | | | — | (d) | | | — | (d) |
| | 2014 - Cash Management Shares | | | 1.00 | | | | — | (d) | | | — | (d) | | | — | (d) | | | — | (d) | | | — | (d) | | | — | (d) |
| | 2013 - Institutional Shares | | | 1.00 | | | | — | (d) | | | — | (d) | | | — | (d) | | | — | (d) | | | — | (d) | | | — | (d) |
| | 2013 - Select Shares | | | 1.00 | | | | — | (d) | | | — | (d) | | | — | (d) | | | — | (d) | | | — | (d) | | | — | (d) |
| | 2013 - Preferred Shares | | | 1.00 | | | | — | (d) | | | — | (d) | | | — | (d) | | | — | (d) | | | — | (d) | | | — | (d) |
| | 2013 - Capital Shares | | | 1.00 | | | | — | (d) | | | — | (d) | | | — | (d) | | | — | (d) | | | — | (d) | | | — | (d) |
| | 2013 - Administration Shares | | | 1.00 | | | | — | (d) | | | — | (d) | | | — | (d) | | | — | (d) | | | — | (d) | | | — | (d) |
| | 2013 - Premier Shares | | | 1.00 | | | | — | (d) | | | — | (d) | | | — | (d) | | | — | (d) | | | — | (d) | | | — | (d) |
| | 2013 - Service Shares | | | 1.00 | | | | — | (d) | | | — | (d) | | | — | (d) | | | — | (d) | | | — | (d) | | | — | (d) |
| | 2013 - Resource Shares | | | 1.00 | | | | — | (d) | | | — | (d) | | | — | (d) | | | — | (d) | | | — | (d) | | | — | (d) |
| | 2013 - Cash Management Shares | | | 1.00 | | | | — | (d) | | | — | (d) | | | — | (d) | | | — | (d) | | | — | (d) | | | — | (d) |
| | (a) | | Calculated based on the average shares outstanding methodology. |
| | (b) | | Distributions may not coincide with the current year net investment income or net realized gains as distributions may be paid from current or prior year earnings. |
| | (c) | | Assumes reinvestment of all distributions. Returns do not reflect the deduction of taxes that a shareholder would pay on Fund distributions. |
| | (d) | | Amount is less than $0.0005 per share. |
| | (e) | | Amount is less than 0.005% of average net assets. |
| | |
| 60 | | The accompanying notes are an integral part of these financial statements. |
FINANCIAL SQUARE TREASURY OBLIGATIONS FUND
| | | | | | | | | | | | | | | | | | | | | | | | | | | | | | | | | | |
| | | | | | | | | | | |
| | | Net asset value, end of year | | | | | Total return(c) | | | | | Net assets end of year (in 000s) | | | | | Ratio of net expenses to average net assets | | | | | Ratio of total expenses to average net assets | | | | | Ratio of net investment income (loss) to average net assets | |
| | | | | | | | | | | | | | | | | | | | | | | | | | | | | | | | | | |
| | $ | 1.00 | | | | | | 0.50 | % | | | | $ | 15,091,527 | | | | | | 0.20 | % | | | | | 0.23 | % | | | | | 0.47 | % |
| | | 1.00 | | | | | | 0.47 | | | | | | 67,865 | | | | | | 0.23 | | | | | | 0.26 | | | | | | 0.46 | |
| | | 1.00 | | | | | | 0.40 | | | | | | 123,436 | | | | | | 0.30 | | | | | | 0.33 | | | | | | 0.40 | |
| | | 1.00 | | | | | | 0.35 | | | | | | 269,417 | | | | | | 0.35 | | | | | | 0.38 | | | | | | 0.34 | |
| | | 1.00 | | | | | | 0.26 | | | | | | 1,307,550 | | | | | | 0.44 | | | | | | 0.48 | | | | | | 0.25 | |
| | | 1.00 | | | | | | 0.19 | | | | | | 1 | | | | | | 0.27 | | | | | | 0.58 | | | | | | 0.37 | |
| | | 1.00 | | | | | | 0.11 | | | | | | 954,846 | | | | | | 0.59 | | | | | | 0.73 | | | | | | 0.11 | |
| | | 1.00 | | | | | | 0.05 | | | | | | 1 | | | | | | 0.27 | | | | | | 0.88 | | | | | | 0.37 | |
| | | 1.00 | | | | | | 0.02 | | | | | | 154 | | | | | | 0.97 | | | | | | 1.03 | | | | | | 0.14 | |
| | | 1.00 | | | | | | 0.15 | | | | | | 19,950,969 | | | | | | 0.19 | | | | | | 0.23 | | | | | | 0.14 | |
| | | 1.00 | | | | | | 0.13 | | | | | | 505,162 | | | | | | 0.21 | | | | | | 0.26 | | | | | | 0.12 | |
| | | 1.00 | | | | | | 0.08 | | | | | | 81,542 | | | | | | 0.25 | | | | | | 0.33 | | | | | | 0.05 | |
| | | 1.00 | | | | | | 0.05 | | | | | | 404,533 | | | | | | 0.30 | | | | | | 0.38 | | | | | | 0.03 | |
| | | 1.00 | | | | | | 0.01 | | | | | | 1,543,863 | | | | | | 0.33 | | | | | | 0.48 | | | | | | (0.01 | ) |
| | | 1.00 | | | | | | 0.01 | | | | | | 1 | | | | | | 0.19 | | | | | | 0.58 | | | | | | 0.36 | |
| | | 1.00 | | | | | | 0.01 | | | | | | 787,768 | | | | | | 0.33 | | | | | | 0.73 | | | | | | (0.01 | ) |
| | | 1.00 | | | | | | 0.01 | | | | | | 1 | | | | | | 0.19 | | | | | | 0.88 | | | | | | 0.36 | |
| | | 1.00 | | | | | | 0.01 | | | | | | 1 | | | | | | 0.19 | | | | | | 1.03 | | | | | | 0.36 | |
| | | 1.00 | | | | | | 0.01 | | | | | | 12,758,713 | | | | | | 0.10 | | | | | | 0.23 | | | | | | — | (e) |
| | | 1.00 | | | | | | 0.01 | | | | | | 169,026 | | | | | | 0.10 | | | | | | 0.26 | | | | | | — | (e) |
| | | 1.00 | | | | | | 0.01 | | | | | | 220,426 | | | | | | 0.10 | | | | | | 0.33 | | | | | | — | (e) |
| | | 1.00 | | | | | | 0.01 | | | | | | 442,625 | | | | | | 0.10 | | | | | | 0.38 | | | | | | 0.01 | |
| | | 1.00 | | | | | | 0.01 | | | | | | 1,620,517 | | | | | | 0.10 | | | | | | 0.48 | | | | | | — | (e) |
| | | 1.00 | | | | | | 0.01 | | | | | | 1 | | | | | | 0.10 | | | | | | 0.58 | | | | | | (0.02 | ) |
| | | 1.00 | | | | | | 0.01 | | | | | | 940,671 | | | | | | 0.10 | | | | | | 0.73 | | | | | | — | (e) |
| | | 1.00 | | | | | | 0.01 | | | | | | 1 | | | | | | 0.10 | | | | | | 0.88 | | | | | | 0.40 | |
| | | 1.00 | | | | | | 0.01 | | | | | | 1 | | | | | | 0.10 | | | | | | 1.03 | | | | | | 0.40 | |
| | | 1.00 | | | | | | 0.01 | | | | | | 12,822,354 | | | | | | 0.08 | | | | | | 0.23 | | | | | | 0.01 | |
| | | 1.00 | | | | | | 0.01 | | | | | | 279,848 | | | | | | 0.08 | | | | | | 0.26 | | | | | | — | (e) |
| | | 1.00 | | | | | | 0.01 | | | | | | 205,386 | | | | | | 0.08 | | | | | | 0.33 | | | | | | — | (e) |
| | | 1.00 | | | | | | 0.01 | | | | | | 356,753 | | | | | | 0.08 | | | | | | 0.38 | | | | | | — | (e) |
| | | 1.00 | | | | | | 0.01 | | | | | | 2,144,601 | | | | | | 0.08 | | | | | | 0.48 | | | | | | — | (e) |
| | | 1.00 | | | | | | 0.01 | | | | | | 948 | | | | | | 0.08 | | | | | | 0.58 | | | | | | (0.01 | ) |
| | | 1.00 | | | | | | 0.01 | | | | | | 915,527 | | | | | | 0.08 | | | | | | 0.73 | | | | | | — | (e) |
| | | 1.00 | | | | | | 0.01 | | | | | | 1 | | | | | | 0.08 | | | | | | 0.88 | | | | | | 0.40 | |
| | | 1.00 | | | | | | 0.01 | | | | | | 1 | | | | | | 0.08 | | | | | | 1.03 | | | | | | 0.40 | |
| | | 1.00 | | | | | | 0.01 | | | | | | 6,998,695 | | | | | | 0.14 | | | | | | 0.23 | | | | | | 0.01 | |
| | | 1.00 | | | | | | 0.01 | | | | | | 189,482 | | | | | | 0.14 | | | | | | 0.26 | | | | | | 0.01 | |
| | | 1.00 | | | | | | 0.01 | | | | | | 146,636 | | | | | | 0.14 | | | | | | 0.33 | | | | | | 0.01 | |
| | | 1.00 | | | | | | 0.01 | | | | | | 317,742 | | | | | | 0.14 | | | | | | 0.38 | | | | | | 0.01 | |
| | | 1.00 | | | | | | 0.01 | | | | | | 1,577,830 | | | | | | 0.14 | | | | | | 0.48 | | | | | | 0.01 | |
| | | 1.00 | | | | | | 0.01 | | | | | | 97,655 | | | | | | 0.14 | | | | | | 0.58 | | | | | | — | (e) |
| | | 1.00 | | | | | | 0.01 | | | | | | 1,061,790 | | | | | | 0.14 | | | | | | 0.73 | | | | | | 0.01 | |
| | | 1.00 | | | | | | 0.01 | | | | | | 1 | | | | | | 0.14 | | | | | | 0.88 | | | | | | 0.40 | |
| | | 1.00 | | | | | | 0.01 | | | | | | 1 | | | | | | 0.14 | | | | | | 1.03 | | | | | | 0.40 | |
| | |
| The accompanying notes are an integral part of these financial statements. | | 61 |
FINANCIAL SQUARE TREASURY SOLUTIONS FUND
Financial Highlights
Selected Data for a Share Outstanding Throughout Each Period
| | | | | | | | | | | | | | | | | | | | | | | | | | | | | | |
| | | | | | | | From
investment operations | | | Distributions
to shareholders | |
| | | Year - Share Class | | Net asset value, beginning of year | | | Net
investment
income(a) | | | Net realized
gain (loss) | | | Total from
investment
operations | | | From net
investment
income | | | From net
realized
gains | | | Total
distributions(b) | |
| | FOR THE FISCAL YEARS ENDED AUGUST 31, | |
| | 2017 - Institutional Shares | | $ | 1.00 | | | $ | 0.005 | | | $ | — | (d) | | $ | 0.005 | | | $ | (0.005 | ) | | $ | — | (d) | | $ | (0.005 | ) |
| | 2017 - Select Shares | | | 1.00 | | | | 0.004 | | | | 0.001 | | | | 0.005 | | | | (0.005 | ) | | | — | (d) | | | (0.005 | ) |
| | 2017 - Preferred Shares | | | 1.00 | | | | 0.003 | | | | 0.001 | | | | 0.004 | | | | (0.004 | ) | | | — | (d) | | | (0.004 | ) |
| | 2017 - Capital Shares | | | 1.00 | | | | 0.003 | | | | — | (d) | | | 0.003 | | | | (0.003 | ) | | | — | (d) | | | (0.003 | ) |
| | 2017 - Administration Shares | | | 1.00 | | | | 0.003 | | | | — | (d) | | | 0.003 | | | | (0.003 | ) | | | — | (d) | | | (0.003 | ) |
| | 2017 - Premier Shares | | | 1.00 | | | | 0.001 | | | | 0.001 | | | | 0.002 | | | | (0.002 | ) | | | — | (d) | | | (0.002 | ) |
| | 2017 - Service Shares | | | 1.00 | | | | 0.001 | | | | — | (d) | | | 0.001 | | | | (0.001 | ) | | | — | (d) | | | (0.001 | ) |
| | 2017 - Resource Shares | | | 1.00 | | | | 0.004 | | | | (0.004 | ) | | | — | (d) | | | — | (d) | | | — | (d) | | | — | (d) |
| | 2017 - Cash Management Shares | | | 1.00 | | | | — | (d) | | | — | (d) | | | — | (d) | | | — | (d) | | | — | (d) | | | — | (d) |
| | 2016 - Institutional Shares | | | 1.00 | | | | 0.001 | | | | — | (d) | | | 0.001 | | | | (0.001 | ) | | | — | (d) | | | (0.001 | ) |
| | 2016 - Select Shares | | | 1.00 | | | | 0.001 | | | | — | (d) | | | 0.001 | | | | (0.001 | ) | | | — | (d) | | | (0.001 | ) |
| | 2016 - Preferred Shares | | | 1.00 | | | | 0.001 | | | | — | (d) | | | 0.001 | | | | (0.001 | ) | | | — | (d) | | | (0.001 | ) |
| | 2016 - Capital Shares | | | 1.00 | | | | — | (d) | | | — | (d) | | | — | (d) | | | — | (d) | | | — | (d) | | | — | (d) |
| | 2016 - Administration Shares | | | 1.00 | | | | — | (d) | | | — | (d) | | | — | (d) | | | — | (d) | | | — | (d) | | | — | (d) |
| | 2016 - Premier Shares | | | 1.00 | | | | — | (d) | | | — | (d) | | | — | (d) | | | — | (d) | | | — | (d) | | | — | (d) |
| | 2016 - Service Shares | | | 1.00 | | | | — | (d) | | | — | (d) | | | — | (d) | | | — | (d) | | | — | (d) | | | — | (d) |
| | 2016 - Resource Shares | | | 1.00 | | | | — | (d) | | | — | (d) | | | — | (d) | | | — | (d) | | | — | (d) | | | — | (d) |
| | 2016 - Cash Management Shares | | | 1.00 | | | | — | (d) | | | — | (d) | | | — | (d) | | | — | (d) | | | — | (d) | | | — | (d) |
| | 2015 - Institutional Shares | | | 1.00 | | | | — | (d) | | | — | (d) | | | — | (d) | | | — | (d) | | | — | (d) | | | — | (d) |
| | 2015 - Select Shares | | | 1.00 | | | | — | (d) | | | — | (d) | | | — | (d) | | | — | (d) | | | — | (d) | | | — | (d) |
| | 2015 - Preferred Shares | | | 1.00 | | | | — | (d) | | | — | (d) | | | — | (d) | | | — | (d) | | | — | (d) | | | — | (d) |
| | 2015 - Capital Shares | | | 1.00 | | | | — | (d) | | | — | (d) | | | — | (d) | | | — | (d) | | | — | (d) | | | — | (d) |
| | 2015 - Administration Shares | | | 1.00 | | | | — | (d) | | | — | (d) | | | — | (d) | | | — | (d) | | | — | (d) | | | — | (d) |
| | 2015 - Premier Shares | | | 1.00 | | | | — | (d) | | | — | (d) | | | — | (d) | | | — | (d) | | | — | (d) | | | — | (d) |
| | 2015 - Service Shares | | | 1.00 | | | | — | (d) | | | — | (d) | | | — | (d) | | | — | (d) | | | — | (d) | | | — | (d) |
| | 2015 - Resource Shares | | | 1.00 | | | | — | (d) | | | — | (d) | | | — | (d) | | | — | (d) | | | — | (d) | | | — | (d) |
| | 2015 - Cash Management Shares | | | 1.00 | | | | — | (d) | | | — | (d) | | | — | (d) | | | — | (d) | | | — | (d) | | | — | (d) |
| | 2014 - Institutional Shares | | | 1.00 | | | | — | (d) | | | — | (d) | | | — | (d) | | | — | (d) | | | — | (d) | | | — | (d) |
| | 2014 - Select Shares | | | 1.00 | | | | — | (d) | | | — | (d) | | | — | (d) | | | — | (d) | | | — | (d) | | | — | (d) |
| | 2014 - Preferred Shares | | | 1.00 | | | | — | (d) | | | — | (d) | | | — | (d) | | | — | (d) | | | — | (d) | | | — | (d) |
| | 2014 - Capital Shares | | | 1.00 | | | | — | (d) | | | — | (d) | | | — | (d) | | | — | (d) | | | — | (d) | | | — | (d) |
| | 2014 - Administration Shares | | | 1.00 | | | | — | (d) | | | — | (d) | | | — | (d) | | | — | (d) | | | — | (d) | | | — | (d) |
| | 2014 - Premier Shares | | | 1.00 | | | | — | (d) | | | — | (d) | | | — | (d) | | | — | (d) | | | — | (d) | | | — | (d) |
| | 2014 - Service Shares | | | 1.00 | | | | — | (d) | | | — | (d) | | | — | (d) | | | — | (d) | | | — | (d) | | | — | (d) |
| | 2014 - Resource Shares | | | 1.00 | | | | — | (d) | | | — | (d) | | | — | (d) | | | — | (d) | | | — | (d) | | | — | (d) |
| | 2014 - Cash Management Shares | | | 1.00 | | | | — | (d) | | | — | (d) | | | — | (d) | | | — | (d) | | | — | (d) | | | — | (d) |
| | 2013 - Institutional Shares | | | 1.00 | | | | — | (d) | | | — | (d) | | | — | (d) | | | — | (d) | | | — | (d) | | | — | (d) |
| | 2013 - Select Shares | | | 1.00 | | | | — | (d) | | | — | (d) | | | — | (d) | | | — | (d) | | | — | (d) | | | — | (d) |
| | 2013 - Preferred Shares | | | 1.00 | | | | — | (d) | | | — | (d) | | | — | (d) | | | — | (d) | | | — | (d) | | | — | (d) |
| | 2013 - Capital Shares | | | 1.00 | | | | — | (d) | | | — | (d) | | | — | (d) | | | — | (d) | | | — | (d) | | | — | (d) |
| | 2013 - Administration Shares | | | 1.00 | | | | — | (d) | | | — | (d) | | | — | (d) | | | — | (d) | | | — | (d) | | | — | (d) |
| | 2013 - Premier Shares | | | 1.00 | | | | — | (d) | | | — | (d) | | | — | (d) | | | — | (d) | | | — | (d) | | | — | (d) |
| | 2013 - Service Shares | | | 1.00 | | | | — | (d) | | | — | (d) | | | — | (d) | | | — | (d) | | | — | (d) | | | — | (d) |
| | 2013 - Resource Shares | | | 1.00 | | | | — | (d) | | | — | (d) | | | — | (d) | | | — | (d) | | | — | (d) | | | — | (d) |
| | 2013 - Cash Management Shares | | | 1.00 | | | | — | (d) | | | — | (d) | | | — | (d) | | | — | (d) | | | — | (d) | | | — | (d) |
| | (a) | | Calculated based on the average shares outstanding methodology. |
| | (b) | | Distributions may not coincide with the current year net investment income or net realized gains as distributions may be paid from current or prior year earnings. |
| | (c) | | Assumes reinvestment of all distributions. Returns do not reflect the deduction of taxes that a shareholder would pay on Fund distributions. |
| | (d) | | Amount is less than $0.0005 per share. |
| | (e) | | Amount is less than 0.005% of average net assets. |
| | |
| 62 | | The accompanying notes are an integral part of these financial statements. |
FINANCIAL SQUARE TREASURY SOLUTIONS FUND
| | | | | | | | | | | | | | | | | | | | | | | | | | | | | | | | | | |
| | | | | | | | | | | |
| | | Net asset value, end of year | | | | | Total return(c) | | | | | Net assets end of year (in 000s) | | | | | Ratio of net expenses to average net assets | | | | | Ratio of total expenses to average net assets | | | | | Ratio of net investment income (loss) to average net assets | |
| | | | | | | | | | | | | | | | | | | | | | | | | | | | | | | | | | |
| | $ | 1.00 | | | | | | 0.49 | % | | | | $ | 8,619,492 | | | | | | 0.20 | % | | | | | 0.23 | % | | | | | 0.48 | % |
| | | 1.00 | | | | | | 0.46 | | | | | | 7,333 | | | | | | 0.23 | | | | | | 0.26 | | | | | | 0.42 | |
| | | 1.00 | | | | | | 0.39 | | | | | | 14,565 | | | | | | 0.30 | | | | | | 0.33 | | | | | | 0.25 | |
| | | 1.00 | | | | | | 0.34 | | | | | | 215,820 | | | | | | 0.35 | | | | | | 0.38 | | | | | | 0.30 | |
| | | 1.00 | | | | | | 0.25 | | | | | | 237,557 | | | | | | 0.44 | | | | | | 0.48 | | | | | | 0.28 | |
| | | 1.00 | | | | | | 0.18 | | | | | | 15,512 | | | | | | 0.50 | | | | | | 0.58 | | | | | | 0.13 | |
| | | 1.00 | | | | | | 0.10 | | | | | | 144,728 | | | | | | 0.58 | | | | | | 0.73 | | | | | | 0.08 | |
| | | 1.00 | | | | | | 0.05 | | | | | | 1 | | | | | | 0.26 | | | | | | 0.88 | | | | | | 0.37 | |
| | | 1.00 | | | | | | 0.01 | | | | | | 33,252 | | | | | | 0.62 | | | | | | 1.03 | | | | | | — | (e) |
| | | 1.00 | | | | | | 0.14 | | | | | | 9,876,558 | | | | | | 0.19 | | | | | | 0.23 | | | | | | 0.11 | |
| | | 1.00 | | | | | | 0.12 | | | | | | 10,969 | | | | | | 0.21 | | | | | | 0.26 | | | | | | 0.09 | |
| | | 1.00 | | | | | | 0.07 | | | | | | 75,756 | | | | | | 0.26 | | | | | | 0.33 | | | | | | 0.03 | |
| | | 1.00 | | | | | | 0.03 | | | | | | 264,092 | | | | | | 0.32 | | | | | | 0.38 | | | | | | 0.01 | |
| | | 1.00 | | | | | | 0.01 | | | | | | 189,870 | | | | | | 0.30 | | | | | | 0.48 | | | | | | (0.02 | ) |
| | | 1.00 | | | | | | 0.01 | | | | | | 1 | | | | | | 0.19 | | | | | | 0.58 | | | | | | 0.36 | |
| | | 1.00 | | | | | | 0.01 | | | | | | 142,607 | | | | | | 0.29 | | | | | | 0.73 | | | | | | (0.02 | ) |
| | | 1.00 | | | | | | 0.01 | | | | | | 1 | | | | | | 0.19 | | | | | | 0.88 | | | | | | 0.37 | |
| | | 1.00 | | | | | | 0.01 | | | | | | 73,211 | | | | | | 0.31 | | | | | | 1.03 | | | | | | (0.02 | ) |
| | | 1.00 | | | | | | 0.01 | | | | | | 10,053,367 | | | | | | 0.10 | | | | | | 0.23 | | | | | | — | (e) |
| | | 1.00 | | | | | | 0.01 | | | | | | 12,266 | | | | | | 0.10 | | | | | | 0.26 | | | | | | — | (e) |
| | | 1.00 | | | | | | 0.01 | | | | | | 40,923 | | | | | | 0.10 | | | | | | 0.33 | | | | | | — | (e) |
| | | 1.00 | | | | | | 0.01 | | | | | | 103,108 | | | | | | 0.10 | | | | | | 0.38 | | | | | | — | (e) |
| | | 1.00 | | | | | | 0.01 | | | | | | 390,266 | | | | | | 0.10 | | | | | | 0.48 | | | | | | — | (e) |
| | | 1.00 | | | | | | 0.01 | | | | | | 1 | | | | | | 0.10 | | | | | | 0.58 | | | | | | 0.01 | |
| | | 1.00 | | | | | | 0.01 | | | | | | 355,272 | | | | | | 0.10 | | | | | | 0.73 | | | | | | — | (e) |
| | | 1.00 | | | | | | 0.01 | | | | | | 1 | | | | | | 0.10 | | | | | | 0.88 | | | | | | 0.40 | |
| | | 1.00 | | | | | | 0.01 | | | | | | 147,486 | | | | | | 0.10 | | | | | | 1.03 | | | | | | — | (e) |
| | | 1.00 | | | | | | 0.01 | | | | | | 9,153,246 | | | | | | 0.09 | | | | | | 0.23 | | | | | | 0.01 | |
| | | 1.00 | | | | | | 0.01 | | | | | | 38,054 | | | | | | 0.09 | | | | | | 0.26 | | | | | | 0.01 | |
| | | 1.00 | | | | | | 0.01 | | | | | | 52,417 | | | | | | 0.09 | | | | | | 0.33 | | | | | | 0.01 | |
| | | 1.00 | | | | | | 0.01 | | | | | | 55,729 | | | | | | 0.09 | | | | | | 0.38 | | | | | | 0.01 | |
| | | 1.00 | | | | | | 0.01 | | | | | | 403,438 | | | | | | 0.09 | | | | | | 0.48 | | | | | | 0.01 | |
| | | 1.00 | | | | | | 0.01 | | | | | | 17,834 | | | | | | 0.09 | | | | | | 0.58 | | | | | | 0.01 | |
| | | 1.00 | | | | | | 0.01 | | | | | | 435,856 | | | | | | 0.09 | | | | | | 0.73 | | | | | | 0.01 | |
| | | 1.00 | | | | | | 0.01 | | | | | | 1 | | | | | | 0.09 | | | | | | 0.88 | | | | | | 0.40 | |
| | | 1.00 | | | | | | 0.01 | | | | | | 90,568 | | | | | | 0.09 | | | | | | 1.03 | | | | | | 0.01 | |
| | | 1.00 | | | | | | 0.01 | | | | | | 8,211,951 | | | | | | 0.14 | | | | | | 0.23 | | | | | | — | (e) |
| | | 1.00 | | | | | | 0.01 | | | | | | 127,241 | | | | | | 0.14 | | | | | | 0.26 | | | | | | — | (e) |
| | | 1.00 | | | | | | 0.01 | | | | | | 53,020 | | | | | | 0.14 | | | | | | 0.33 | | | | | | — | (e) |
| | | 1.00 | | | | | | 0.01 | | | | | | 62,058 | | | | | | 0.14 | | | | | | 0.38 | | | | | | — | (e) |
| | | 1.00 | | | | | | 0.01 | | | | | | 418,901 | | | | | | 0.14 | | | | | | 0.48 | | | | | | — | (e) |
| | | 1.00 | | | | | | 0.01 | | | | | | 1,137,540 | | | | | | 0.14 | | | | | | 0.58 | | | | | | — | (e) |
| | | 1.00 | | | | | | 0.01 | | | | | | 508,699 | | | | | | 0.14 | | | | | | 0.73 | | | | | | — | (e) |
| | | 1.00 | | | | | | 0.01 | | | | | | 1 | | | | | | 0.14 | | | | | | 0.88 | | | | | | 0.40 | |
| | | 1.00 | | | | | | 0.01 | | | | | | 47,993 | | | | | | 0.14 | | | | | | 1.03 | | | | | | — | (e) |
| | |
| The accompanying notes are an integral part of these financial statements. | | 63 |
GOLDMAN SACHS FUNDS — FINANCIAL SQUARE FUNDS
Notes to Financial Statements
August 31, 2017
Goldman Sachs Trust (the “Trust”) is a Delaware statutory trust registered under the Investment Company Act of 1940, as amended (the “Act”), as an open-end management investment company. The following table lists those series of the Trust that are included in this report (collectively, the “Funds” or individually a “Fund”), along with their corresponding share classes and respective diversification status under the Act:
| | | | |
| Fund | | Share Classes Offered | | Diversified/
Non-Diversified |
Federal Instruments | | Institutional, Select, Preferred, Capital, Administration, Premier, Service, and Cash Management | | Diversified |
Government | | Institutional, Select, Preferred, Capital, Administration, Premier, Service, Class R6, Class A, Class C, Resource, and Cash Management | | Diversified |
Money Market, Prime Obligations, Treasury Instruments, Treasury Obligations and Treasury Solutions | | Institutional, Select, Preferred, Capital, Administration, Premier, Service, Resource, and Cash Management | | Diversified |
Tax-Exempt Money Market | | Institutional, Select, Preferred, Capital, Administration, Service, and Resource | | Diversified |
Class C Shares may typically be acquired only in an exchange for Class C Shares of another Goldman Sachs Fund. Class C Shares may be subject to a contingent deferred sales charge (“CDSC”) of 1.00% during the first 12 months, measured from the time the original shares subject to the CDSC were acquired. At the close of business on October 11, 2016, Class C Shares of the Financial Square (“FSQ”) Prime Obligations Fund were liquidated.
Goldman Sachs Asset Management, L.P. (“GSAM”), an affiliate of Goldman Sachs & Co. LLC (formerly, Goldman, Sachs & Co.) (“Goldman Sachs”), serves as investment adviser to the Funds pursuant to management agreements (the “Agreements”) with the Trust.
Effective on October 11, 2016, the following Funds were designated by the Board of Trustees (“Trustees”) as “institutional money market funds” under Rule 2a-7 under the Act: FSQ Money Market Fund, FSQ Prime Obligations Fund, and FSQ Tax-Exempt Money Market Fund (the “Institutional Money Market Funds”). Each of the Institutional Money Market Funds must price its shares at a net asset value (“NAV”) reflecting market-based values of its portfolio securities (i.e., at a “floating” NAV) rounded to the fourth decimal place (e.g., $1.0000).
|
| 2. SIGNIFICANT ACCOUNTING POLICIES |
The financial statements have been prepared in accordance with accounting principles generally accepted in the United States of America (“GAAP”) and require management to make estimates and assumptions that may affect the reported amounts and disclosures. Actual results may differ from those estimates and assumptions.
A. Investment Valuation — The investment valuation policy of the Funds, except for the Institutional Money Market Funds, is to use the amortized-cost method permitted by Rule 2a-7 under the Act for valuing portfolio securities. The amortized-cost method of valuation involves valuing a security at its cost and thereafter applying a constant accretion or amortization to maturity of any discount or premium. Normally, a security’s amortized cost will approximate its market value. Under procedures and tolerances approved by the Trustees, GSAM evaluates daily the difference between each Fund’s NAV per share using the amortized costs of its portfolio securities and the Fund’s NAV per share using market-based values of its portfolio securities. The Institutional Money Market Funds’ investment valuation policy is to value its portfolio securities only at market-based values. The market-based value of a portfolio security is determined, where readily available, on the basis of market quotations provided by pricing services or
64
GOLDMAN SACHS FUNDS — FINANCIAL SQUARE FUNDS
|
| 2. SIGNIFICANT ACCOUNTING POLICIES (continued) |
securities dealers, or, where accurate market quotations are not readily available, on the basis of the security’s fair value as determined in accordance with Valuation Procedures approved by the Trustees. The pricing services may use valuation models or matrix pricing, which may consider (among other things): (i) yield or price with respect to debt securities that are considered comparable in characteristics such as rating, interest rate and maturity date or (ii) quotations from securities dealers to determine current value.
B. Investment Income and Investments — Interest income is accrued daily and adjusted for amortization of premiums and accretion of discounts. Investment transactions are reflected on trade date. Realized gains and losses are calculated using identified cost.
C. Class Allocations and Expenses — Investment income, realized and unrealized gain (loss), if any, and non-class specific expenses of each Fund are allocated daily based upon the proportion of net assets of each class. Class specific expenses, where applicable, are borne by the respective share classes and include Distribution, Service, Distribution and Service, Administration, Service and Administration, and Shareholder Administration fees and Transfer Agency fees. Non-class specific expenses directly incurred by a Fund are charged to that Fund, while such expenses incurred by the Trust are allocated across the respective Funds on a straight-line and/or pro-rata basis depending upon the nature of the expenses.
D. Federal Taxes and Distributions to Shareholders — It is each Fund’s policy to comply with the requirements of the Internal Revenue Code of 1986, as amended (the “Code”), applicable to regulated investment companies (mutual funds) and to distribute each year substantially all of its investment company taxable and tax-exempt income and capital gains to its shareholders. Accordingly, the Funds are not required to make any provisions for the payment of federal income tax. Distributions to shareholders are declared and recorded daily and paid monthly by the Funds and may include short-term capital gains. Long-term capital gain distributions, if any, are declared and paid annually.
Net capital losses, if any, are carried forward to future fiscal years and may be used to the extent allowed by the Code to offset any future capital gains. Utilization of capital loss carryforwards will reduce the requirement of future capital gains distributions.
The characterization of distributions to shareholders for financial reporting purposes is determined in accordance with federal income tax rules, which may differ from GAAP. The source of each Fund’s distributions may be shown in the accompanying financial statements as either from net investment income, net realized gain or capital. Certain components of the Funds’ net assets on the Statements of Assets and Liabilities reflect permanent GAAP/tax differences based on the appropriate tax character.
E. Forward Commitments — A forward commitment involves entering into a contract to purchase or sell securities, typically on an extended settlement basis, for a fixed price at a future date. The purchase of securities on a forward commitment basis involves a risk of loss if the value of the security to be purchased declines before the settlement date. Conversely, the sale of securities on a forward commitment basis involves the risk that the value of the securities sold may increase before the settlement date. Although a Fund will generally purchase securities on a forward commitment basis with the intention of acquiring the securities for its portfolio, the Fund may dispose of forward commitments prior to settlement which may result in a realized gain or loss.
F. Offering Costs — Offering costs paid in connection with the offering of shares of the FSQ Federal Instruments Fund and the FSQ Tax-Exempt Money Market Fund were amortized on a straight-line basis over 12 months from the date of commencement of operations.
G. Repurchase Agreements — Repurchase agreements involve the purchase of securities subject to the seller’s agreement to repurchase the securities at a mutually agreed upon date and price, under the terms of a Master Repurchase Agreement (“MRA”). During the term of a repurchase agreement, the value of the underlying securities held as collateral on behalf of a Fund, including accrued interest, is required to exceed the value of the repurchase agreement, including accrued interest. The gross value of repurchase agreements is included in the Statements of Assets and Liabilities for financial reporting purposes. The underlying securities for all repurchase agreements are held at the Funds’ custodian or designated sub-custodians under tri-party repurchase agreements.
65
GOLDMAN SACHS FUNDS — FINANCIAL SQUARE FUNDS
Notes to Financial Statements (continued)
August 31, 2017
|
| 2. SIGNIFICANT ACCOUNTING POLICIES (continued) |
An MRA governs transactions between a Fund and select counterparties. An MRA contains provisions for, among other things, initiation of the transaction, income payments, events of default, and maintenance of securities for repurchase agreements. An MRA also permits offsetting with collateral to create one single net payment in the event of default or similar events, including the bankruptcy or insolvency of a counterparty.
If the seller defaults, a Fund could suffer a loss to the extent that the proceeds from the sale of the underlying securities and other collateral held by the Fund are less than the repurchase price and the Fund’s costs associated with delay and enforcement of the repurchase agreement. In addition, in the event of default or insolvency of the seller, a court could determine that a Fund’s interest in the collateral is not enforceable, resulting in additional losses to the Fund.
Pursuant to exemptive relief granted by the Securities and Exchange Commission (“SEC”) and terms and conditions contained therein, the Funds, together with other funds of the Trust and registered investment companies having management agreements with GSAM or its affiliates, may transfer uninvested cash into joint accounts, the daily aggregate balance of which is invested in one or more repurchase agreements. Under these joint accounts, the Funds maintain pro-rata credit exposure to the underlying repurchase agreements’ counterparties. With the exception of certain transaction fees, the Funds are not subject to any expenses in relation to these investments.
| | |
| 3. INVESTMENTS AND FAIR VALUE MEASUREMENTS | | |
U.S. GAAP defines the fair value of a financial instrument as the amount that would be received to sell an asset or paid to transfer a liability in an orderly transaction between market participants at the measurement date (i.e., the exit price); the Funds’ policy is to use the market approach. GAAP establishes a fair value hierarchy that prioritizes the inputs to valuation techniques used to measure fair value. The hierarchy gives the highest priority to unadjusted quoted prices in active markets for identical assets or liabilities (Level 1 measurements) and the lowest priority to unobservable inputs (Level 3 measurements). The levels used for classifying investments are not necessarily an indication of the risk associated with investing in these investments. The three levels of the fair value hierarchy are described below:
Level 1 — Unadjusted quoted prices in active markets that are accessible at the measurement date for identical, unrestricted assets or liabilities;
Level 2 — Quoted prices in markets that are not active or financial instruments for which significant inputs are observable (including, but not limited to, quoted prices for similar investments, interest rates, foreign exchange rates, volatility and credit spreads), either directly or indirectly;
Level 3 — Prices or valuations that require significant unobservable inputs (including GSAM’s assumptions in determining fair value measurement).
The Trustees have approved Valuation Procedures that govern the valuation of the portfolio investments held by the Funds, including investments for which market quotations are not readily available. The Trustees have delegated to GSAM day-to-day responsibility for implementing and maintaining internal controls and procedures related to the valuation (including both the amortized cost and market-based methods of valuation) of the Funds’ investments. To assess the continuing appropriateness of pricing sources and methodologies related to the market-based method of valuation, GSAM regularly performs price verification procedures and issues challenges as necessary to third party pricing vendors or brokers, and any differences are reviewed in accordance with the Valuation Procedures.
As of August 31, 2017, all investments, other than those held by the Institutional Money Market Funds, are classified as Level 2 of the fair value hierarchy. All investments for the Institutional Money Market Funds are classified as Level 2, with the exception of treasury securities of G8 countries which are generally classified as Level 1. Please refer to the Schedules of Investments for further detail.
66
GOLDMAN SACHS FUNDS — FINANCIAL SQUARE FUNDS
|
| 4. AGREEMENTS AND AFFILIATED TRANSACTIONS |
A. Management Agreements — Under the Agreements, GSAM manages the Funds, subject to the general supervision of the Trustees.
As compensation for the services rendered pursuant to the Agreements, the assumption of the expenses related thereto and administration of the Funds’ business affairs, including providing facilities, GSAM is entitled to a management fee, accrued daily and paid monthly, equal to an annual percentage rate of each Fund’s average daily net assets. GSAM has agreed to not impose a portion of the management fee equal annually to 0.025% of the FSQ Federal Instruments, FSQ Treasury Instruments, FSQ Treasury Obligations and FSQ Treasury Solutions Funds’ average daily net assets and 0.045% of the FSQ Government, FSQ Money Market, FSQ Prime Obligations and FSQ Tax-Exempt Money Market Funds’ average daily net assets. These arrangements will remain in effect through at least December 29, 2017, and prior to such date, GSAM may not terminate the arrangements without the approval of the Trustees.
B. Administration, Service and/or Shareholder Administration Plans — The Trust, on behalf of each applicable Fund, has adopted Administration, Service and/or Shareholder Administration Plans (the “Plans”) to allow Class C, Select, Preferred, Capital, Administration, Premier, Service, Resource and Cash Management Shares to compensate service organizations (including Goldman Sachs) for providing varying levels of account administration and/or personal and account maintenance services to their customers who are beneficial owners of such shares. The Plans provide for compensation to the service organizations equal to an annual percentage rate of the average daily net assets of such shares.
C. Distribution and/or Service (12b-1) Plans — The Trust, on behalf of Class A Shares of each applicable Fund, has adopted a Distribution and Service Plan subject to Rule 12b-1 under the Act. Under the Distribution and Service Plan, Goldman Sachs, which serves as distributor (the “Distributor”), is entitled to a fee accrued daily and paid monthly for distribution services and personal and account maintenance services, which may then be paid by Goldman Sachs to authorized dealers. These fees are equal to an annual percentage rate of the average daily net assets attributable to Class A Shares of the Funds, as set forth below.
The Trust, on behalf of Class C, Resource and Cash Management Shares of each applicable Fund, has adopted Distribution Plans subject to Rule 12b-1 under the Act. Under the Distribution Plans, Goldman Sachs as Distributor is entitled to a fee accrued daily and paid monthly for distribution services, which may then be paid by Goldman Sachs to authorized dealers. These fees are equal to an annual percentage rate of the average daily net assets attributable to Class C, Resource and Cash Management Shares of the Funds, as set forth below.
The Trust, on behalf of the Service Shares of each applicable Fund, has adopted a Service Plan subject to Rule 12b-1 under the Act to allow Service Shares to compensate service organizations (including Goldman Sachs) for providing personal and account maintenance services to their customers who are beneficial owners of such shares. The Service Plan provides for compensation to the service organizations equal to an annual percentage rate of the average daily net assets attributable to Service Shares of the Funds, as set forth below.
D. Distribution Agreement — Goldman Sachs, as Distributor of the shares of the Funds pursuant to a Distribution Agreement, may retain a portion of the Class C Shares’ CDSC. During the fiscal year ended August 31, 2017, Goldman Sachs has advised that it retained $1,257 and $171 in CDSCs with respect to Class C Shares of the FSQ Government and FSQ Prime Obligations Funds, respectively.
E. Transfer Agency Agreement — Goldman Sachs also serves as the transfer agent of the Funds for a fee pursuant to a Transfer Agency Agreement. The fee charged for such transfer agency services is accrued daily and paid monthly and is equal to an annual percentage rate of each Fund’s average daily net assets.
F. Other Agreements — GSAM has agreed to limit certain “Other Expenses” of the Funds (excluding transfer agency fees and expenses, administration fees (as applicable), service fees (as applicable), shareholder administration fees (as applicable), taxes, interest, brokerage fees, expenses of shareholder meetings, litigation and indemnification, and extraordinary expenses) to the extent such expenses exceed, on an annual basis, 0.014% of the average daily net assets of each Fund. Such Other Expense reimbursements, if any, are accrued daily and paid monthly. These Other Expense limitations will remain in place through at least December 29, 2017, and prior to such date GSAM may not terminate the arrangements without the approval of the Trustees.
67
GOLDMAN SACHS FUNDS — FINANCIAL SQUARE FUNDS
Notes to Financial Statements (continued)
August 31, 2017
|
| 4. AGREEMENTS AND AFFILIATED TRANSACTIONS (continued) |
In addition, the Funds have entered into certain offset arrangements with the custodian and the transfer agent, which may result in a reduction of the Funds’ expenses and are received irrespective of the application of the “Other Expense” limitations described above.
G. Total Fund Expenses
Fund Contractual Fees
The contractual annualized rates for each of the Funds are as follows:
| | | | | | | | | | | | | | | | | | | | | | | | | | | | | | | | | | | | | | | | | | | | | | | | |
| | | Institutional
Shares | | | Select
Shares | | | Preferred
Shares | | | Capital
Shares | | | Administration
Shares | | | Premier
Shares | | | Service
Shares | | | Resource
Shares | | | Cash
Management
Shares | | | Class R6
Shares(a) | | | Class A
Shares(a) | | | Class C
Shares(a) | |
Management Fee | | | 0.205 | % | | | 0.205 | % | | | 0.205 | % | | | 0.205 | % | | | 0.205 | % | | | 0.205 | % | | | 0.205 | % | | | 0.205 | % | | | 0.205 | % | | | 0.205 | % | | | 0.205 | % | | | 0.205 | % |
Administration, Service and/or Shareholder Administration Fees | | | N/A | | | | 0.03 | | | | 0.10 | | | | 0.15 | | | | 0.25 | | | | 0.35 | | | | 0.25 | | | | 0.50 | | | | 0.50 | | | | N/A | | | | N/A | | | | 0.25 | |
Distribution and/or Service (12b-1) Fees | | | N/A | | | | N/A | | | | N/A | | | | N/A | | | | N/A | | | | N/A | | | | 0.25 | (b) | | | 0.15 | (c) | | | 0.30 | (c) | | | N/A | | | | 0.25 | | | | 0.75 | (c) |
Transfer Agency Fee | | | 0.01 | | | | 0.01 | | | | 0.01 | | | | 0.01 | | | | 0.01 | | | | 0.01 | | | | 0.01 | | | | 0.01 | | | | 0.01 | | | | 0.01 | | | | 0.01 | | | | 0.01 | |
N/A — Fees not applicable to respective share class
| (a) | | Government Fund only. |
| (b) | | Service (12b-1) fee only. |
| (c) | | Distribution (12b-1) fee only. |
Fund Effective Net Expenses (After Waivers and Reimbursements)
In addition to the contractual fee waivers and expense limitations discussed above, during the fiscal year ended August 31, 2017, GSAM and Goldman Sachs (as applicable) voluntarily agreed to waive all or a portion of the management fees and respective class-specific fees described above attributable to the Funds. The Funds are not obligated to reimburse GSAM or Goldman Sachs for prior fiscal year fee waivers and/or expense reimbursements, if any.
For the fiscal year ended August 31, 2017, expense reductions including any fee waivers and Other Expense reimbursements were as follows (in thousands):
| | | | | | | | | | | | | | | | | | | | | | |
| Fund | | | | Management
Fee Waivers | | | Transfer
Agent Fee
Waivers | | | Distribution,
Administration,
Service and/or
Shareholder,
Administration
Plans Fee Waivers | | | Other Expense
Reimbursements | | | Total
Expense
Reductions | |
Federal Instruments | | | | $ | 172 | | | $ | — | | | $ | 11 | | | $ | 351 | | | $ | 534 | |
Government | | | | | 41,448 | | | | — | | | | 479 | | | | — | | | | 41,927 | |
Money Market | | | | | 1,316 | | | | — | | | | 2 | | | | 643 | | | | 1,961 | |
Prime Obligations | | | | | 691 | | | | — | | | | 47 | | | | 619 | | | | 1,357 | |
Tax-Exempt Money Market | | | | | 4 | | | | — | | | | — | * | | | 676 | | | | 680 | |
Treasury Instruments | | | | | 12,546 | | | | — | * | | | 398 | | | | — | | | | 12,944 | |
Treasury Obligations | | | | | 5,083 | | | | — | * | | | 1,199 | | | | — | | | | 6,282 | |
Treasury Solutions | | | | | 2,422 | | | | — | * | | | 481 | | | | — | | | | 2,903 | |
| * | | Amount less than one thousand. |
68
GOLDMAN SACHS FUNDS — FINANCIAL SQUARE FUNDS
|
| 4. AGREEMENTS AND AFFILIATED TRANSACTIONS (continued) |
H. Other Transactions with Affiliates — A Fund may purchase securities from, or sell securities to, an affiliated fund provided the affiliation is solely due to having a common investment adviser, common officers, or common Trustees.
For the fiscal year ended August 31, 2017, the purchase and sale transactions and related net realized gain (loss) for the Funds with affiliated funds in compliance with Rule 17a-7 under the Act were as follows:
| | | | | | | | | | | | | | |
| Fund | | | | Purchases | | | Sales | | | Net Realized
Gain (Loss) | |
Government | | | | $ | 8,650,314,757 | | | $ | 299,945,719 | | | $ | 56,445 | |
Money Market | | | | | 591,074,295 | | | | 274,603,003 | | | | — | |
Prime Obligations | | | | | 215,664,166 | | | | 542,983,343 | | | | — | |
Tax-Exempt Money Market | | | | | 5,352,016 | | | | 18,547,316 | | | | — | |
Treasury Instruments | | | | | 299,945,719 | | | | 22,163,975,711 | | | | (190,977 | ) |
Treasury Obligations | | | | | 1,473,684,336 | | | | — | | | | — | |
Treasury Solutions | | | | | 12,530,899,287 | | | | — | | | | — | |
As of August 31, 2017, the Goldman Sachs Group (“GSG”), Inc. was the beneficial owner of 5% or more of the outstanding share classes of the following funds:
| | | | | | | | | | | | | | | | | | | | | | | | | | | | | | | | | | | | | | |
| Fund | | | | Institutional
Shares | | | Select
Shares | | | Preferred
Shares | | | Capital
Shares | | | Administration
Shares | | | Premier
Shares | | | Service
Shares | | | Resource
Shares | | | Cash
Management
Shares | |
Federal Instruments | | | | | — | % | | | 100 | % | | | 100 | % | | | — | % | | | — | % | | | 100 | % | | | — | % | | | — | % | | | 100 | % |
Money Market | | | | | — | | | | — | | | | — | | | | 100 | | | | — | | | | 100 | | | | — | | | | 100 | | | | 100 | |
Prime Obligations | | | | | — | | | | — | | | | — | | | | — | | | | — | | | | 100 | | | | — | | | | 100 | | | | 100 | |
Tax-Exempt Money Market | | | | | 37 | | | | 100 | | | | 100 | | | | 100 | | | | 100 | | | | — | | | | 100 | | | | 100 | | | | — | |
Treasury Instruments | | | | | — | | | | — | | | | — | | | | — | | | | — | | | | — | | | | — | | | | 100 | | | | — | |
Treasury Obligations | | | | | — | | | | — | | | | — | | | | — | | | | — | | | | 100 | | | | — | | | | 100 | | | | — | |
Treasury Solutions | | | | | — | | | | — | | | | — | | | | — | | | | — | | | | — | | | | — | | | | 100 | | | | — | |
The following table provides information about the investment in the shares of issuers deemed to be affiliates of the Funds.
| | | | | | | | | | | | | | | | | | | | | | | | | | | | |
|
| FSQ Government Fund | |
| Name of Affiliated Issuer | | Value at 8/31/16 | | | Purchases at Cost | | | Proceeds from Sales/maturities | | | Net Realized
Gain (Loss) | | | Unrealized Gain
(Loss) | | | Value at 8/31/17 | | | Interest
Income | |
Goldman Sachs & Co. -Repurchase Agreement | | $ | — | | | $ | 2,659,000,000 | | | $ | (2,659,000,000 | ) | | $ | — | | | $ | — | | | $ | — | | | $ | 94,393 | |
|
| FSQ Treasury Obligations Fund | |
| Name of Affiliated Issuer | | Value at
8/31/16 | | | Purchases at Cost | | | Proceeds from
Sales | | | Net Realized
Gain (Loss) | | | Unrealized Gain
(Loss) | | | Value at
8/31/17 | | | Interest
Income | |
Goldman Sachs & Co. -Repurchase Agreement | | $ | — | | | $ | 569,000,000 | | | $ | (569,000,000 | ) | | $ | — | | | $ | — | | | $ | — | | | $ | 15,653 | |
69
GOLDMAN SACHS FUNDS — FINANCIAL SQUARE FUNDS
Notes to Financial Statements (continued)
August 31, 2017
|
| 4. AGREEMENTS AND AFFILIATED TRANSACTIONS (continued) |
I. Line of Credit Facility — As of August 31, 2017, the Funds participated in a $1,100,000,000 committed, unsecured revolving line of credit facility (the “facility”) together with other funds of the Trust and registered investment companies having management agreements with GSAM or its affiliates. This facility is to be used for temporary emergency purposes, or to allow for an orderly liquidation of securities to meet redemption requests. The interest rate on borrowings is based on the federal funds rate. The facility also requires a fee to be paid by the Funds based on the amount of the commitment that has not been utilized. For the fiscal year ended August 31, 2017, the Funds did not have any borrowings under the facility.
The tax character of distributions paid during the fiscal year ended August 31, 2017 was as follows:
| | | | | | | | | | | | | | | | | | | | | | | | | | | | | | | | |
| | | Federal
Instruments | | | Government | | | Money Market | | | Prime
Obligations | | | Tax-Exempt
Money
Market | | | Treasury
Instruments | | | Treasury
Obligations | | | Treasury
Solutions | |
Distribution paid from: | | | | | | | | | | | | | | | | | | | | | | | | | | | | | | | | |
Ordinary income | | $ | 3,330,644 | | | $ | 488,886,002 | | | $ | 20,484,061 | | | $ | 10,458,307 | | | $ | 17 | | | $ | 232,330,406 | | | $ | 88,199,209 | | | $ | 44,533,201 | |
Tax-Exempt income | | | — | | | | — | | | | — | | | | — | | | | 44,054 | | | | — | | | | — | | | | — | |
Total distributions | | $ | 3,330,644 | | | $ | 488,886,002 | | | $ | 20,484,061 | | | $ | 10,458,307 | | | $ | 44,071 | | | $ | 232,330,406 | | | $ | 88,199,209 | | | $ | 44,533,201 | |
The tax character of distributions paid during the fiscal year ended August 31, 2016 was as follows:
| | | | | | | | | | | | | | | | | | | | | | | | | | | | | | | | |
| | | Federal
Instruments(a) | | | Government | | | Money Market | | | Prime
Obligations | | | Tax-Exempt
Money
Market (b) | | | Treasury
Instruments | | | Treasury
Obligations | | | Treasury
Solutions | |
Distribution paid from: | | | | | | | | | | | | | | | | | | | | | | | | | | | | | | | | |
Ordinary income | | $ | 890,692 | | | $ | 89,223,799 | | | $ | 121,956,919 | | | $ | 38,042,401 | | | $ | — | | | $ | 64,254,721 | | | $ | 21,202,635 | | | $ | 13,675,527 | |
Net long-term capital gains | | | — | | | | 17,471 | | | | 160,415 | | | | — | | | | — | | | | — | | | | 154,001 | | | | — | |
Tax-Exempt income | | | — | | | | — | | | | — | | | | — | | | | 3,905 | | | | — | | | | — | | | | — | |
Total distributions | | $ | 890,692 | | | $ | 89,241,270 | | | $ | 122,117,334 | | | $ | 38,042,401 | | | $ | 3,905 | | | $ | 64,254,721 | | | $ | 21,356,636 | | | $ | 13,675,527 | |
| (a) | | Commenced operations on October 30, 2015. |
| (b) | | Commenced operations on March 31, 2016. |
As of August 31, 2017, the components of accumulated earnings (losses) on a tax basis were as follows:
| | | | | | | | | | | | | | | | | | | | | | | | | | | | | | | | |
| | | Federal
Instruments | | | Government | | | Money
Market | | | Prime
Obligations | | | Tax-Exempt
Money
Market | | | Treasury
Instruments | | | Treasury
Obligations | | | Treasury
Solutions | |
Undistributed ordinary income — net | | $ | 36,426 | | | $ | 37,844,681 | | | $ | 1,141,708 | | | $ | 725,149 | | | $ | 23 | | | $ | 14,065,135 | | | $ | 6,622,884 | | | $ | 2,601,133 | |
Undistributed Tax-Exempt income — net | | | — | | | | — | | | | — | | | | — | | | | 2,194 | | | | — | | | | — | | | | — | |
Undistributed long-term capital gains | | | — | | | | — | | | | — | | | | — | | | | — | | | | — | | | | — | | | | 87,587 | |
Total undistributed earnings | | $ | 36,426 | | | $ | 37,844,681 | | | $ | 1,141,708 | | | $ | 725,149 | | | $ | 2,217 | | | $ | 14,065,135 | | | $ | 6,622,884 | | | $ | 2,688,720 | |
Timing differences (Dividend Payable and Post-October Capital Loss Deferral) | | $ | (24,446 | ) | | $ | (37,707,067 | ) | | $ | (1,143,803 | ) | | $ | (724,962 | ) | | $ | (2,051 | ) | | $ | (13,354,206 | ) | | $ | (6,195,841 | ) | | $ | (2,228,574 | ) |
Unrealized gains (losses) — net | | $ | (855 | ) | | $ | (86,902 | ) | | $ | 432,656 | | | $ | 226,161 | | | $ | 151 | | | $ | (699,998 | ) | | $ | (11,077 | ) | | $ | (6,562 | ) |
Total accumulated earnings (losses) — net | | $ | 11,125 | | | $ | 50,712 | | | $ | 430,561 | | | $ | 226,348 | | | $ | 317 | | | $ | 10,931 | | | $ | 415,966 | | | $ | 453,584 | |
70
GOLDMAN SACHS FUNDS — FINANCIAL SQUARE FUNDS
|
| 5. TAX INFORMATION (continued) |
The aggregate cost for each Fund stated in the accompanying Statements of Assets and Liabilities also represents aggregate cost for U.S. federal income tax purposes.
In order to present certain components of the Funds’ capital accounts on a tax basis, certain reclassifications have been recorded to the Funds’ accounts. These reclassifications have no impact on the NAV of the Funds and result primarily from dividend redesignations, certain non-deductible expenses, taxable capital contribution received and redemptions utilized as distributions.
| | | | | | | | | | | | | | |
| Fund | | | | Accumulated
Net Realized
Gain (Loss) | | | Accumulated
Undistributed
Net Investment
Income (Loss) | | | Paid in
Capital | |
Federal Instruments | | | | $ | (2,854 | ) | | $ | (33,007 | ) | | $ | 35,861 | |
Government | | | | | (866,286 | ) | | | 866,286 | | | | — | |
Prime Obligations | | | | | — | | | | 76,207 | | | | (76,207 | ) |
Treasury Instruments | | | | | (1,722,424 | ) | | | 1,722,424 | | | | — | |
Treasury Obligations | | | | | (1,109,658 | ) | | | 1,109,658 | | | | — | |
Treasury Solutions | | | | | (214,330 | ) | | | 214,330 | | | | — | |
GSAM has reviewed the Funds’ tax positions for all open tax years (the current and prior three tax years, as applicable) and has concluded that no provision for income tax is required in the Funds’ financial statements. Such open tax years remain subject to examination and adjustment by tax authorities.
The Funds’ risks include, but are not limited to, the following:
Large Shareholder Transactions Risk — A Fund may experience adverse effects when certain large shareholders, such as other funds, institutional investors (including those trading by use of non-discretionary mathematical formulas), financial intermediaries (who may make investment decisions on behalf of underlying clients and/or include a Fund in their investment model), individuals, accounts and Goldman Sachs affiliates, purchase or redeem large amounts of shares of a Fund. Such large shareholder redemptions may cause a Fund to sell portfolio securities at times when it would not otherwise do so, which may negatively impact the Fund’s NAV and liquidity. Similarly, large Fund share purchases may adversely affect a Fund’s performance to the extent that the Fund is delayed in investing new cash and is required to maintain a larger cash position than it ordinarily would. These transactions may also accelerate the realization of taxable income to shareholders if such sales of investments resulted in gains, and may also increase transaction costs. In addition, a large redemption could result in a Fund’s current expenses being allocated over a smaller asset base, leading to an increase in the Fund’s expense ratio.
Interest Rate Risk — When interest rates increase, a Fund’s yield will tend to be lower than prevailing market rates, and the market value of its securities or instruments may also be adversely affected. A low interest rate environment poses additional risks to a Fund, because low yields on the Fund’s portfolio holdings may have an adverse impact on the Fund’s ability to provide a positive yield to its shareholders, pay expenses out of Fund assets, or, at times, maintain a stable $1.00 share price (or, for the Institutional Money Market Funds, minimize the volatility of the Fund’s NAV per share). The risks associated with increasing interest rates are heightened given that interest rates are near historic lows, but may be expected to increase in the future with unpredictable effects on the markets and a Fund’s investments. Fluctuations in interest rates may also affect the liquidity of fixed income securities and instruments held by the Funds.
71
GOLDMAN SACHS FUNDS — FINANCIAL SQUARE FUNDS
Notes to Financial Statements (continued)
August 31, 2017
|
| 6. OTHER RISKS (continued) |
Market and Credit Risks — In the normal course of business, the Funds trade financial instruments and enter into financial transactions where risk of potential loss exists due to changes in the market (market risk). Additionally, a Fund may also be exposed to credit risk in the event that an issuer or guarantor fails to perform or that an institution or entity with which a Fund has unsettled or open transactions defaults.
Geographic and Sector Risk — The FSQ Tax-Exempt Money Market Fund may invest a significant portion of its total assets in certain issuers within the same state, geographic region or economic sector, which may subject the value of the Fund’s investments to risks associated with an adverse economic, business, political or environmental development affecting that state, region or sector.
Under the Trust’s organizational documents, its Trustees, officers, employees and agents are indemnified, to the extent permitted by the Act and state law, against certain liabilities that may arise out of performance of their duties to the Funds. Additionally, in the course of business, the Funds enter into contracts that contain a variety of indemnification clauses. The Funds’ maximum exposure under these arrangements is unknown, as this would involve future claims that may be made against the Funds that have not yet occurred. However, GSAM believes the risk of loss under these arrangements to be remote.
Exemptive Orders — Pursuant to SEC exemptive orders, the Funds may enter into certain principal transactions, including repurchase agreements, with Goldman Sachs.
Subsequent events after the Statements of Assets and Liabilities date have been evaluated and GSAM has concluded that there is no impact requiring adjustment or disclosure in the financial statements.
72
GOLDMAN SACHS FUNDS — FINANCIAL SQUARE FUNDS
|
| 10. SUMMARY OF SHARE TRANSACTIONS |
Share activity is as follows:
| | | | | | | | |
| | | Federal Instruments Fund | |
| | | | |
| | | For the Fiscal Year Ended
August 31, 2017 | | | For the Period Ended
August 31, 2016* | |
| | | | |
| | | Shares** | | | Shares** | |
| | | | |
| Institutional Shares | | | | | | | | |
Shares sold | | | 1,074,848,953 | | | | 1,385,664,141 | |
Reinvestment of distributions | | | 3,133,196 | | | | 875,865 | |
Shares redeemed | | | (1,098,892,063 | ) | | | (809,178,068 | ) |
| | | | (20,909,914 | ) | | | 577,361,938 | |
| Select Shares | | | | | | | | |
Shares sold | | | — | | | | 50,000 | |
Reinvestment of distributions | | | 232 | | | | 67 | |
Shares redeemed | | | (3,000 | ) | | | — | |
| | | | (2,768 | ) | | | 50,067 | |
| Preferred Shares | | | | | | | | |
Shares sold | | | 10 | | | | 50,000 | |
Reinvestment of distributions | | | 210 | | | | 42 | |
Shares redeemed | | | (10 | ) | | | — | |
| | | | 210 | | | | 50,042 | |
| Capital Shares | | | | | | | | |
Shares sold | | | 95,325,208 | | | | 50,000 | |
Reinvestment of distributions | | | 50,539 | | | | 24 | |
Shares redeemed | | | (79,278,651 | ) | | | — | |
| | | | 16,097,096 | | | | 50,024 | |
| Administration Shares | | | | | | | | |
Shares sold | | | 154,235,286 | | | | 103,145,254 | |
Reinvestment of distributions | | | 18,664 | | | | 1 | |
Shares redeemed | | | (147,319,273 | ) | | | (59,313,002 | ) |
| | | | 6,934,677 | | | | 43,832,253 | |
| Premier Shares | | | | | | | | |
Shares sold | | | — | | | | 50,000 | |
Reinvestment of distributions | | | 93 | | | | 4 | |
Shares redeemed | | | — | | | | — | |
| | | | 93 | | | | 50,004 | |
| Service Shares | | | | | | | | |
Shares sold | | | 14,791,704 | | | | 57,177,090 | |
Reinvestment of distributions | | | 1 | | | | 1 | |
Shares redeemed | | | (14,610,607 | ) | | | (42,229,202 | ) |
| | | | 181,098 | | | | 14,947,889 | |
| Cash Management Shares | | | | | | | | |
Shares sold | | | 10 | | | | 50,000 | |
Reinvestment of distributions | | | 6 | | | | 3 | |
Shares redeemed | | | (10 | ) | | | — | |
| | | | 6 | | | | 50,003 | |
NET INCREASE IN SHARES | | | 2,300,498 | | | | 636,392,220 | |
| * | | Commenced operations on October 30, 2015. |
| ** | | Valued at $1.00 per share. |
73
GOLDMAN SACHS FUNDS — FINANCIAL SQUARE FUNDS
Notes to Financial Statements (continued)
August 31, 2017
|
| 10. SUMMARY OF SHARE TRANSACTIONS (continued) |
Share activity is as follows:
| | | | | | | | |
| | | Government Fund | |
| | | | |
| | | For the Fiscal Year Ended
August 31, 2017 | | | For the Fiscal Year Ended
August 31, 2016 | |
| | | | |
| | | Shares* | | | Shares* | |
| | | | |
| Institutional Shares | | | | | | | | |
Shares sold | | | 679,312,486,567 | | | | 341,664,419,857 | |
Reinvestment of distributions | | | 228,130,062 | | | | 47,502,955 | |
Shares redeemed | | | (663,932,060,403 | ) | | | (307,661,792,266 | ) |
| | | | 15,608,556,226 | | | | 34,050,130,546 | |
| Select Shares | | | | | | | | |
Shares sold | | | 8,502,641,228 | | | | 4,724,518,327 | |
Reinvestment of distributions | | | 13,611,144 | | | | 1,486,634 | |
Shares redeemed | | | (8,065,530,147 | ) | | | (2,457,856,271 | ) |
| | | | 450,722,225 | | | | 2,268,148,690 | |
| Preferred Shares | | | | | | | | |
Shares sold | | | 5,037,015,621 | | | | 4,436,751,899 | |
Reinvestment of distributions | | | 488,639 | | | | 22,074 | |
Shares redeemed | | | (5,020,535,505 | ) | | | (4,149,503,757 | ) |
| | | | 16,968,755 | | | | 287,270,216 | |
| Capital Shares | | | | | | | | |
Shares sold | | | 10,652,559,765 | | | | 6,278,638,378 | |
Reinvestment of distributions | | | 3,264,524 | | | | 872,480 | |
Shares redeemed | | | (11,152,584,172 | ) | | | (6,063,354,389 | ) |
| | | | (496,759,883 | ) | | | 216,156,469 | |
| Administration Shares | | | | | | | | |
Shares sold | | | 19,099,703,512 | | | | 9,147,766,081 | |
Reinvestment of distributions | | | 3,423,832 | | | | 46,616 | |
Shares redeemed | | | (17,638,427,152 | ) | | | (8,394,355,777 | ) |
| | | | 1,464,700,192 | | | | 753,456,920 | |
| Premier Shares | | | | | | | | |
Shares sold | | | 151,061,648 | | | | — | |
Reinvestment of distributions | | | 2 | | | | — | |
Shares redeemed | | | (49,751,597 | ) | | | — | |
| | | | 101,310,053 | | | | — | |
| Service Shares | | | | | | | | |
Shares sold | | | 1,586,419,647 | | | | 1,207,971,623 | |
Reinvestment of distributions | | | 77,645 | | | | 3,944 | |
Shares redeemed | | | (1,617,574,204 | ) | | | (1,307,720,818 | ) |
| | | | (31,076,912 | ) | | | (99,745,251 | ) |
| Class A Shares(a) | | | | | | | | |
Shares sold | | | 82,512,499 | | | | 2,627,049 | |
Reinvestment of distributions | | | 150,269 | | | | 32 | |
Shares redeemed | | | (28,719,988 | ) | | | (1,064,279 | ) |
| | | | 53,942,780 | | | | 1,562,802 | |
| Class C Shares(a) | | | | | | | | |
Shares sold | | | 16,050,266 | | | | 446,476 | |
Reinvestment of distributions | | | 518 | | | | 3 | |
Shares redeemed | | | (10,526,992 | ) | | | (33,123 | ) |
| | | | 5,523,792 | | | | 413,356 | |
| Resource Shares | | | | | | | | |
Shares sold | | | 173,703,236 | | | | 37,856,196 | |
Reinvestment of distributions | | | 40,846 | | | | 883 | |
Shares redeemed | | | (116,513,724 | ) | | | (20,223,965 | ) |
| | | | 57,230,358 | | | | 17,633,114 | |
| Cash Management Shares | | | | | | | | |
Shares sold | | | 90,322,721 | | | | 243,548 | |
Reinvestment of distributions | | | 1,093 | | | | — | |
Shares redeemed | | | (86,558,693 | ) | | | (233,217 | ) |
| | | | 3,765,121 | | | | 10,331 | |
| Class R6 Shares(b) | | | | | | | | |
Shares sold | | | 16,335,613 | | | | 5,221,480 | |
Reinvestment of distributions | | | 69,560 | | | | 325 | |
Shares redeemed | | | (8,336,546 | ) | | | (516,924 | ) |
| | | | 8,068,627 | | | | 4,704,881 | |
NET INCREASE IN SHARES | | | 17,242,951,334 | | | | 37,499,742,074 | |
| * | | Valued at $1.00 per share. |
| (a) | | Commenced operations on February 29, 2016. |
| (b) | | Commenced operations on December 29, 2015. |
74
GOLDMAN SACHS FUNDS — FINANCIAL SQUARE FUNDS
|
| 10. SUMMARY OF SHARE TRANSACTIONS (continued) |
Share activity is as follows:
| | | | | | | | | | | | |
| | | Money Market Fund | |
| | | | |
| | | For the Fiscal Year Ended
August 31, 2017 | | | For the Fiscal Year Ended
August 31, 2016 | |
| | | | |
| | | Shares | | | Dollars | | | Shares* | |
| | | | |
| Institutional Shares | | | | | | | | | | | | |
Shares sold | | | 19,049,765,992 | | | $ | 19,052,661,546 | | | | 359,975,501,741 | |
Reinvestment of distributions | | | 10,026,650 | | | | 10,028,865 | | | | 60,513,386 | |
Shares redeemed | | | (31,854,650,650 | ) | | | (31,857,198,837 | ) | | | (377,446,008,048 | ) |
| | | | (12,794,858,008 | ) | | | (12,794,508,426 | ) | | | (17,409,992,921 | ) |
| Select Shares | | | | | | | | | | | | |
Shares sold | | | 662,792,918 | | | | 662,807,572 | | | | 8,194,089,563 | |
Reinvestment of distributions | | | 207,572 | | | | 207,586 | | | | 6,865,222 | |
Shares redeemed | | | (1,733,231,016 | ) | | | (1,733,250,092 | ) | | | (9,038,094,344 | ) |
| | | | (1,070,230,526 | ) | | | (1,070,234,934 | ) | | | (837,139,559 | ) |
| Preferred Shares | | | | | | | | | | | | |
Shares sold | | | 546,750,177 | | | | 546,750,583 | | | | 2,790,204,684 | |
Reinvestment of distributions | | | 13,650 | | | | 13,650 | | | | 129,915 | |
Shares redeemed | | | (604,398,626 | ) | | | (604,398,627 | ) | | | (2,848,127,716 | ) |
| | | | (57,634,799 | ) | | | (57,634,394 | ) | | | (57,793,117 | ) |
| Capital Shares | | | | | | | | | | | | |
Shares sold | | | 5,238,387 | | | | 5,238,387 | | | | 1,757,607,292 | |
Reinvestment of distributions | | | 7 | | | | 7 | | | | 561,194 | |
Shares redeemed | | | (113,907,949 | ) | | | (113,907,949 | ) | | | (1,850,937,346 | ) |
| | | | (108,669,555 | ) | | | (108,669,555 | ) | | | (92,768,860 | ) |
| Administration Shares | | | | | | | | | | | | |
Shares sold | | | 47,454,813 | | | | 47,454,813 | | | | 1,697,152,174 | |
Reinvestment of distributions | | | 48,245 | | | | 48,256 | | | | 323,068 | |
Shares redeemed | | | (358,151,687 | ) | | | (358,153,090 | ) | | | (1,812,259,753 | ) |
| | | | (310,648,629 | ) | | | (310,650,021 | ) | | | (114,784,511 | ) |
| Premier Shares | | | | | | | | | | | | |
Shares sold | | | — | | | | — | | | | — | |
Reinvestment of distributions | | | 4 | | | | 4 | | | | 1 | |
Shares redeemed | | | — | | | | — | | | | — | |
| | | | 4 | | | | 4 | | | | 1 | |
| Service Shares | | | | | | | | | | | | |
Shares sold | | | 8,133,390 | | | | 8,134,574 | | | | 218,281,802 | |
Reinvestment of distributions | | | 1,994 | | | | 1,994 | | | | 1,164 | |
Shares redeemed | | | (25,068,703 | ) | | | (25,070,196 | ) | | | (222,349,097 | ) |
| | | | (16,933,319 | ) | | | (16,933,628 | ) | | | (4,066,131 | ) |
| Resource Shares | | | | | | | | | | | | |
Shares sold | | | — | | | | — | | | | — | |
Reinvestment of distributions | | | 2 | | | | 2 | | | | 1 | |
Shares redeemed | | | — | | | | — | | | | — | |
| | | | 2 | | | | 2 | | | | 1 | |
| Cash Management Shares | | | | | | | | | | | | |
Shares sold | | | 283,535 | | | | 283,535 | | | | 14,627,940 | |
Reinvestment of distributions | | | 2 | | | | 2 | | | | 646 | |
Shares redeemed | | | (11,025,022 | ) | | | (11,025,022 | ) | | | (11,927,270 | ) |
| | | | (10,741,485 | ) | | | (10,741,485 | ) | | | 2,701,316 | |
NET DECREASE | | | (14,369,716,315 | ) | | $ | (14,369,372,437 | ) | | | (18,513,843,781 | ) |
| * | | Valued at $1.00 per share. |
75
GOLDMAN SACHS FUNDS — FINANCIAL SQUARE FUNDS
Notes to Financial Statements (continued)
August 31, 2017
|
| 10. SUMMARY OF SHARE TRANSACTIONS (continued) |
Share activity is as follows:
| | | | | | | | | | | | |
| | | Prime Obligations Fund | |
| | | | |
| | | For the Fiscal Year Ended August 31, 2017 | | | For the Fiscal Year Ended
August 31, 2016 | |
| | | | |
| | | Shares | | | Dollars | | | Shares* | |
| | | | |
| Institutional Shares | | | | | | | | | | | | |
Shares sold | | | 8,522,574,597 | | | $ | 8,523,965,422 | | | | 103,785,116,510 | |
Reinvestment of distributions | | | 4,795,497 | | | | 4,796,957 | | | | 11,417,004 | |
Shares redeemed | | | (14,359,771,161 | ) | | | (14,360,674,542 | ) | | | (105,708,221,276 | ) |
| | | | (5,832,401,067 | ) | | | (5,831,912,163 | ) | | | (1,911,687,762 | ) |
| Select Shares | | | | | | | | | | | | |
Shares sold | | | 78,986,476 | | | | 79,005,310 | | | | 2,117,945,818 | |
Reinvestment of distributions | | | 119,300 | | | | 119,341 | | | | 270,446 | |
Shares redeemed | | | (70,482,960 | ) | | | (70,495,531 | ) | | | (2,197,760,584 | ) |
| | | | 8,622,816 | | | | 8,629,120 | | | | (79,544,320 | ) |
| Preferred Shares | | | | | | | | | | | | |
Shares sold | | | 456,637,334 | | | | 456,650,633 | | | | 5,446,341,434 | |
Reinvestment of distributions | | | 7,448 | | | | 7,449 | | | | 510,400 | |
Shares redeemed | | | (735,096,589 | ) | | | (735,097,096 | ) | | | (5,500,202,709 | ) |
| | | | (278,451,807 | ) | | | (278,439,014 | ) | | | (53,350,875 | ) |
| Capital Shares | | | | | | | | | | | | |
Shares sold | | | 39,980,109 | | | | 39,983,541 | | | | 602,761,250 | |
Reinvestment of distributions | | | 2,077 | | | | 2,078 | | | | 161,889 | |
Shares redeemed | | | (179,717,055 | ) | | | (179,717,056 | ) | | | (566,760,887 | ) |
| | | | (139,734,869 | ) | | | (139,731,437 | ) | | | 36,162,252 | |
| Administration Shares | | | | | | | | | | | | |
Shares sold | | | 512,837,052 | | | | 512,875,953 | | | | 13,601,562,982 | |
Reinvestment of distributions | | | 8,558 | | | | 8,558 | | | | 374,085 | |
Shares redeemed | | | (1,759,453,253 | ) | | | (1,759,467,587 | ) | | | (14,244,549,509 | ) |
| | | | (1,246,607,643 | ) | | | (1,246,583,076 | ) | | | (642,612,442 | ) |
| Premier Shares | | | | | | | | | | | | |
Shares sold | | | — | | | | — | | | | — | |
Reinvestment of distributions | | | 5 | | | | 5 | | | | — | |
Shares redeemed | | | — | | | | — | | | | (5 | ) |
| | | | 5 | | | | 5 | | | | (5 | ) |
| Service Shares | | | | | | | | | | | | |
Shares sold | | | 221,802,281 | | | | 221,831,871 | | | | 4,837,531,314 | |
Reinvestment of distributions | | | 545 | | | | 545 | | | | 28,135 | |
Shares redeemed | | | (474,938,880 | ) | | | (474,960,336 | ) | | | (5,361,694,359 | ) |
| | | | (253,136,054 | ) | | | (253,127,920 | ) | | | (524,134,910 | ) |
| Class C Shares(a) | | | | | | | | | | | | |
Shares sold | | | 192,576 | | | | 193,680 | | | | 9,508,979 | |
Reinvestment of distributions | | | 141 | | | | 141 | | | | 2,021 | |
Shares redeemed | | | (18,801,137 | ) | | | (18,801,137 | ) | | | (10,820,524 | ) |
| | | | (18,608,420 | ) | | | (18,607,316 | ) | | | (1,309,524 | ) |
| Resource Shares | | | | | | | | | | | | |
Shares sold | | | 3,317,891 | | | | 3,317,897 | | | | 101,281,054 | |
Reinvestment of distributions | | | 2 | | | | 2 | | | | 6,820 | |
Shares redeemed | | | (75,122,856 | ) | | | (75,122,858 | ) | | | (101,514,632 | ) |
| | | | (71,804,963 | ) | | | (71,804,959 | ) | | | (226,758 | ) |
| Cash Management Shares | | | | | | | | | | | | |
Shares sold | | | — | | | | — | | | | 5 | |
Reinvestment of distributions | | | 2 | | | | 2 | | | | — | |
Shares redeemed | | | — | | | | — | | | | (5 | ) |
| | | | 2 | | | | 2 | | | | — | |
NET DECREASE | | | (7,832,122,000 | ) | | $ | (7,831,576,758 | ) | | | (3,176,704,344 | ) |
| * | | Valued at $1.00 per share. |
| (a) | | At the close of business on October 11, 2016, Class C Shares were liquidated. |
76
GOLDMAN SACHS FUNDS — FINANCIAL SQUARE FUNDS
|
| 10. SUMMARY OF SHARE TRANSACTIONS (continued) |
Share activity is as follows:
| | | | | | | | | | | | |
| | | Tax-Exempt Money Market Fund | |
| | | | |
| | | For the Fiscal Year Ended
August 31, 2017 | | | For the Period Ended
August 31, 2016* | |
| | | | |
| | | Shares | | | Dollars | | | Shares** | |
| | | | |
| Institutional Shares | | | | | | | | | | | | |
Shares sold | | | 16,744,340 | | | $ | 16,744,417 | | | | 14,995,333 | |
Reinvestment of distributions | | | 20,091 | | | | 20,092 | | | | 2,644 | |
Shares redeemed | | | (21,314,734 | ) | | | (21,314,800 | ) | | | (2,502,693 | ) |
| | | | (4,550,303 | ) | | | (4,550,291 | ) | | | 12,495,284 | |
| Select Shares | | | | | | | | | | | | |
Shares sold | | | — | | | | — | | | | 10,000 | |
Reinvestment of distributions | | | 51 | | | | 51 | | | | 7 | |
Shares redeemed | | | — | | | | — | | | | — | |
| | | | 51 | | | | 51 | | | | 10,007 | |
| Preferred Shares | | | | | | | | | | | | |
Shares sold | | | — | | | | — | | | | 10,000 | |
Reinvestment of distributions | | | 44 | | | | 44 | | | | 4 | |
Shares redeemed | | | — | | | | — | | | | — | |
| | | | 44 | | | | 44 | | | | 10,004 | |
| Capital Shares | | | | | | | | | | | | |
Shares sold | | | — | | | | — | | | | 10,000 | |
Reinvestment of distributions | | | 39 | | | | 39 | | | | 3 | |
Shares redeemed | | | — | | | | — | | | | — | |
| | | | 39 | | | | 39 | | | | 10,003 | |
| Administration Shares | | | | | | | | | | | | |
Shares sold | | | — | | | | — | | | | 10,000 | |
Reinvestment of distributions | | | 29 | | | | 29 | | | | 2 | |
Shares redeemed | | | — | | | | — | | | | — | |
| | | | 29 | | | | 29 | | | | 10,002 | |
| Service Shares | | | | | | | | | | | | |
Shares sold | | | — | | | | — | | | | 10,000 | |
Reinvestment of distributions | | | 7 | | | | 7 | | | | 2 | |
Shares redeemed | | | — | | | | — | | | | — | |
| | | | 7 | | | | 7 | | | | 10,002 | |
| Resource Shares | | | | | | | | | | | | |
Shares sold | | | — | | | | — | | | | 10,005 | |
Reinvestment of distributions | | | 1 | | | | 1 | | | | 2 | |
Shares redeemed | | | — | | | | — | | | | (5 | ) |
| | | | 1 | | | | 1 | | | | 10,002 | |
NET INCREASE (DECREASE) | | | (4,550,132 | ) | | $ | (4,550,120 | ) | | | 12,555,304 | |
| * | | Commenced operations on March 31, 2016. |
| ** | | Valued at $1.00 per share. |
77
GOLDMAN SACHS FUNDS — FINANCIAL SQUARE FUNDS
Notes to Financial Statements (continued)
August 31, 2017
|
| 10. SUMMARY OF SHARE TRANSACTIONS (continued) |
Share activity is as follows:
| | | | | | | | |
| | | Treasury Instruments Fund | |
| | | | |
| | | For the Fiscal Year Ended
August 31, 2017 | | | For the Fiscal Year Ended
August 31, 2016 | |
| | | | |
| | | Shares* | | | Shares* | |
| | | | |
| Institutional Shares | | | | | | | | |
Shares sold | | | 181,910,842,104 | | | | 172,852,122,298 | |
Reinvestment of distributions | | | 148,012,472 | | | | 38,873,240 | |
Shares redeemed | | | (188,298,030,900 | ) | | | (156,390,561,598 | ) |
| | | | (6,239,176,324 | ) | | | 16,500,433,940 | |
| Select Shares | | | | | | | | |
Shares sold | | | 818,445,292 | | | | 49,612,983 | |
Reinvestment of distributions | | | 253,468 | | | | 19,119 | |
Shares redeemed | | | (791,868,551 | ) | | | (108,631,567 | ) |
| | | | 26,830,209 | | | | (58,999,465 | ) |
| Preferred Shares | | | | | | | | |
Shares sold | | | 371,116,238 | | | | 455,706,727 | |
Reinvestment of distributions | | | 121,167 | | | | 7,441 | |
Shares redeemed | | | (344,218,614 | ) | | | (476,011,362 | ) |
| | | | 27,018,791 | | | | (20,297,194 | ) |
| Capital Shares | | | | | | | | |
Shares sold | | | 4,508,313,068 | | | | 2,575,909,714 | |
Reinvestment of distributions | | | 2,440,191 | | | | 111,256 | |
Shares redeemed | | | (3,951,781,554 | ) | | | (2,433,503,089 | ) |
| | | | 558,971,705 | | | | 142,517,881 | |
| Administration Shares | | | | | | | | |
Shares sold | | | 8,536,538,379 | | | | 8,080,799,975 | |
Reinvestment of distributions | | | 3,475,761 | | | | 13,405 | |
Shares redeemed | | | (7,909,114,821 | ) | | | (7,996,187,327 | ) |
| | | | 630,899,319 | | | | 84,626,053 | |
| Premier Shares | | | | | | | | |
Shares sold | | | 116,968,089 | | | | 20,005,149 | |
Reinvestment of distributions | | | 45 | | | | — | |
Shares redeemed | | | (80,050,108 | ) | | | (917,314 | ) |
| | | | 36,918,026 | | | | 19,087,835 | |
| Service Shares | | | | | | | | |
Shares sold | | | 133,237,074 | | | | 322,514,582 | |
Reinvestment of distributions | | | 21,973 | | | | 552 | |
Shares redeemed | | | (177,621,932 | ) | | | (428,002,431 | ) |
| | | | (44,362,885 | ) | | | (105,487,297 | ) |
| Resource Shares | | | | | | | | |
Shares sold | | | — | | | | — | |
Reinvestment of distributions | | | — | | | | — | |
Shares redeemed | | | — | | | | — | |
| | | | — | | | | — | |
| Cash Management Shares | | | | | | | | |
Shares sold | | | 35,134 | | | | 278,298 | |
Reinvestment of distributions | | | 7 | | | | — | |
Shares redeemed | | | (284,056 | ) | | | — | |
| | | | (248,915 | ) | | | 278,298 | |
NET INCREASE (DECREASE) IN SHARES | | | (5,003,150,074 | ) | | | 16,562,160,051 | |
| * | | Valued at $1.00 per share. |
78
GOLDMAN SACHS FUNDS — FINANCIAL SQUARE FUNDS
|
| 10. SUMMARY OF SHARE TRANSACTIONS (continued) |
Share activity is as follows:
| | | | | | | | |
| | | Treasury Obligations Fund | |
| | | | |
| | | For the Fiscal Year Ended
August 31, 2017 | | | For the Fiscal Year Ended
August 31, 2016 | |
| | | | |
| | | Shares* | | | Shares* | |
| | | | |
| Institutional Shares | | | | | | | | |
Shares sold | | | 159,324,411,184 | | | | 97,363,853,064 | |
Reinvestment of distributions | | | 46,702,636 | | | | 10,384,855 | |
Shares redeemed | | | (164,230,405,292 | ) | | | (90,182,570,590 | ) |
| | | | (4,859,291,472 | ) | | | 7,191,667,329 | |
| Select Shares | | | | | | | | |
Shares sold | | | 4,082,606,806 | | | | 873,046,093 | |
Reinvestment of distributions | | | 378,814 | | | | 179,323 | |
Shares redeemed | | | (4,520,271,577 | ) | | | (537,103,323 | ) |
| | | | (437,285,957 | ) | | | 336,122,093 | |
| Preferred Shares | | | | | | | | |
Shares sold | | | 779,116,904 | | | | 1,141,034,269 | |
Reinvestment of distributions | | | 324,082 | | | | 55,229 | |
Shares redeemed | | | (737,547,145 | ) | | | (1,279,977,158 | ) |
| | | | 41,893,841 | | | | (138,887,660 | ) |
| Capital Shares | | | | | | | | |
Shares sold | | | 1,845,150,097 | | | | 2,978,985,083 | |
Reinvestment of distributions | | | 968,827 | | | | 186,951 | |
Shares redeemed | | | (1,981,230,822 | ) | | | (3,017,277,611 | ) |
| | | | (135,111,898 | ) | | | (38,105,577 | ) |
| Administration Shares | | | | | | | | |
Shares sold | | | 5,716,650,450 | | | | 6,933,045,331 | |
Reinvestment of distributions | | | 965,137 | | | | 28,279 | |
Shares redeemed | | | (5,953,918,651 | ) | | | (7,009,778,183 | ) |
| | | | (236,303,064 | ) | | | (76,704,573 | ) |
| Premier Shares | | | | | | | | |
Shares sold | | | — | | | | — | |
Reinvestment of distributions | | | 2 | | | | — | |
Shares redeemed | | | — | | | | — | |
| | | | 2 | | | | — | |
| Service Shares | | | | | | | | |
Shares sold | | | 3,595,043,595 | | | | 2,298,748,847 | |
Reinvestment of distributions | | | 69,164 | | | | 9,364 | |
Shares redeemed | | | (3,428,037,719 | ) | | | (2,451,687,483 | ) |
| | | | 167,075,040 | | | | (152,929,272 | ) |
| Resource Shares | | | | | | | | |
Shares sold | | | — | | | | — | |
Reinvestment of distributions | | | 1 | | | | — | |
Shares redeemed | | | — | | | | — | |
| | | | 1 | | | | — | |
| Cash Management Shares | | | | | | | | |
Shares sold | | | 771,157 | | | | — | |
Reinvestment of distributions | | | 11 | | | | — | |
Shares redeemed | | | (618,667 | ) | | | — | |
| | | | 152,501 | | | | — | |
NET INCREASE (DECREASE) IN SHARES | | | (5,458,871,006 | ) | | | 7,121,162,340 | |
| * | | Valued at $1.00 per share. |
79
GOLDMAN SACHS FUNDS — FINANCIAL SQUARE FUNDS
Notes to Financial Statements (continued)
August 31, 2017
|
| 10. SUMMARY OF SHARE TRANSACTIONS (continued) |
Share activity is as follows:
| | | | | | | | |
| | | Treasury Solutions Fund | |
| | | | |
| | | For the Fiscal Year Ended
August 31, 2017 | | | For the Fiscal Year Ended
August 31, 2016 | |
| | | | |
| | | Shares* | | | Shares* | |
| | | | |
| Institutional Shares | | | | | | | | |
Shares sold | | | 27,121,688,188 | | | | 28,752,349,005 | |
Reinvestment of distributions | | | 28,334,702 | | | | 9,208,383 | |
Shares redeemed | | | (28,407,264,596 | ) | | | (28,938,114,201 | ) |
| | | | (1,257,241,706 | ) | | | (176,556,813 | ) |
| Select Shares | | | | | | | | |
Shares sold | | | — | | | | 6,200,006 | |
Reinvestment of distributions | | | 41,687 | | | | 11,386 | |
Shares redeemed | | | (3,676,988 | ) | | | (7,508,363 | ) |
| | | | (3,635,301 | ) | | | (1,296,971 | ) |
| Preferred Shares | | | | | | | | |
Shares sold | | | 121,203,708 | | | | 697,520,894 | |
Reinvestment of distributions | | | 50,947 | | | | 24,437 | |
Shares redeemed | | | (182,444,254 | ) | | | (662,712,556 | ) |
| | | | (61,189,599 | ) | | | 34,832,775 | |
| Capital Shares | | | | | | | | |
Shares sold | | | 1,946,345,268 | | | | 1,336,137,651 | |
Reinvestment of distributions | | | 604,589 | | | | 49,784 | |
Shares redeemed | | | (1,995,225,910 | ) | | | (1,175,205,221 | ) |
| | | | (48,276,053 | ) | | | 160,982,214 | |
| Administration Shares | | | | | | | | |
Shares sold | | | 657,229,221 | | | | 439,259,245 | |
Reinvestment of distributions | | | 366,979 | | | | 8,175 | |
Shares redeemed | | | (609,915,851 | ) | | | (639,648,519 | ) |
| | | | 47,680,349 | | | | (200,381,099 | ) |
| Premier Shares | | | | | | | | |
Shares sold | | | 82,443,759 | | | | 9 | |
Reinvestment of distributions | | | 2 | | | | — | |
Shares redeemed | | | (66,933,677 | ) | | | (5 | ) |
| | | | 15,510,084 | | | | 4 | |
| Service Shares | | | | | | | | |
Shares sold | | | 779,359,271 | | | | 1,323,551,907 | |
Reinvestment of distributions | | | 4,724 | | | | 5,066 | |
Shares redeemed | | | (777,246,619 | ) | | | (1,536,207,787 | ) |
| | | | 2,117,376 | | | | (212,650,814 | ) |
| Resource Shares | | | | | | | | |
Shares sold | | | — | | | | 5 | |
Reinvestment of distributions | | | — | | | | — | |
Shares redeemed | | | — | | | | (5 | ) |
| | | | — | | | | — | |
| Cash Management Shares | | | | | | | | |
Shares sold | | | 696,664,664 | | | | 250,039,275 | |
Reinvestment of distributions | | | — | | | | — | |
Shares redeemed | | | (736,623,453 | ) | | | (324,308,723 | ) |
| | | | (39,958,789 | ) | | | (74,269,448 | ) |
NET DECREASE IN SHARES | | | (1,344,993,639 | ) | | | (469,340,152 | ) |
| * | | Valued at $1.00 per share. |
80
Report of Independent Registered Public
Accounting Firm
To the Board of Trustees of Goldman Sachs Trust and Shareholders of the Goldman Sachs Financial Square Federal Instruments Fund, Goldman Sachs Financial Square Government Fund, Goldman Sachs Financial Square Money Market Fund, Goldman Sachs Financial Square Prime Obligations Fund, Goldman Sachs Financial Square Tax-Exempt Money Market Fund, Goldman Sachs Financial Square Treasury Instruments Fund, Goldman Sachs Financial Square Treasury Obligations Fund, and Goldman Sachs Financial Square Treasury Solutions Fund:
In our opinion, the accompanying statements of assets and liabilities, including the schedules of investments, and the related statements of operations and of changes in net assets and the financial highlights present fairly, in all material respects, the financial position of the Goldman Sachs Financial Square Federal Instruments Fund, Goldman Sachs Financial Square Government Fund, Goldman Sachs Financial Square Money Market Fund, Goldman Sachs Financial Square Prime Obligations Fund, Goldman Sachs Financial Square Tax-Exempt Money Market Fund, Goldman Sachs Financial Square Treasury Instruments Fund, Goldman Sachs Financial Square Treasury Obligations Fund, and Goldman Sachs Financial Square Treasury Solutions Fund (collectively the “Funds”), funds of the Goldman Sachs Trust, as of August 31, 2017, and the results of each of their operations for the year then ended, the changes in each of their net assets for each of the two years in the period then ended (or for the Goldman Sachs Financial Square Tax-Exempt Money Market Fund, for the year then ended and for the period from March 31, 2016 (the commencement of operations) through August 31, 2016, and for the Goldman Sachs Financial Square Federal Instruments Fund, for the year then ended and for the period from October 30, 2015 (the commencement of operations) through August 31, 2016) and the financial highlights for each of the periods presented therein, in conformity with accounting principles generally accepted in the United States of America. These financial statements and financial highlights (hereafter referred to as “financial statements”) are the responsibility of the Fund’s management. Our responsibility is to express an opinion on these financial statements based on our audits. We conducted our audits of these financial statements in accordance with the standards of the Public Company Accounting Oversight Board (United States). Those standards require that we plan and perform the audit to obtain reasonable assurance about whether the financial statements are free of material misstatement. An audit includes examining, on a test basis, evidence supporting the amounts and disclosures in the financial statements, assessing the accounting principles used and significant estimates made by management, and evaluating the overall financial statement presentation. We believe that our audits, which included confirmation of securities as of August 31, 2017 by correspondence with the custodian, brokers, and the application of alternative auditing procedures where securities purchased confirmations had not been received, provide a reasonable basis for our opinion.
PricewaterhouseCoopers LLP
Boston, Massachusetts
October 24, 2017
81
GOLDMAN SACHS FUNDS — FINANCIAL SQUARE FUNDS
Fund Expenses — Six Month Period Ended August 31, 2017 (Unaudited)
As a shareholder of Institutional Shares, Select Shares, Preferred Shares, Capital Shares, Administration Shares, Premier Shares, Service Shares, Class A Shares, Class C Shares, Resource Shares, Cash Management Shares or Class R6 Shares of a Fund, you incur two types of costs: (1) transaction costs, including contingent deferred sales charges (with respect to Class C Shares); and (2) ongoing costs, including management fees and distribution, service, administration and/or shareholder administration fees (with respect to all share classes except Institutional Shares and Class R6 Shares) and other Fund expenses. This Example is intended to help you understand your ongoing costs (in dollars) of investing in Institutional Shares, Select Shares, Preferred Shares, Capital Shares, Administration Shares, Premier Shares, Service Shares, Class A Shares, Class C Shares, Resource Shares, Cash Management Shares or Class R6 Shares of the Funds and to compare these costs with the ongoing costs of investing in other mutual funds.
The Example is based on an investment of $1,000 invested at the beginning of the period and held for the entire period from March 1, 2017 through August 31, 2017, which represents a period of 184 days in a 365-day year.
Actual Expenses — The first line under each share class in the table below provides information about actual account values and actual expenses. You may use the information in this line, together with the amount you invested, to estimate the expenses that you paid over the period. Simply divide your account value by $1,000 (for example, an $8,600 account value divided by $1,000=8.6), then multiply the result by the number in the first line under the column heading entitled “Expenses Paid” to estimate the expenses you paid on your account during this period.
Hypothetical Example for Comparison Purposes — The second line under each share class in the table below provides information about hypothetical account values and hypothetical expenses based on the Funds’ actual net expense ratios and an assumed rate of return of 5% per year before expenses, which is not the Funds’ actual return. The hypothetical account values and expenses may not be used to estimate the actual ending account balance or expenses you paid for the period. You may use this information to compare the ongoing costs of investing in the Funds and other funds. To do so, compare this 5% hypothetical example with the 5% hypothetical examples that appear in the shareholder reports of the other funds.
Please note that the expenses shown in the table are meant to highlight your ongoing costs only and do not reflect any transactional costs, such as sales charges, redemption fees, or exchange fees. Therefore, the second line of the table is useful in comparing ongoing costs only, and will not help you determine the relative total costs of owning different funds. In addition, if these transactional costs were included, your costs would have been higher.
| | | | | | | | | | | | | | | | | | | | | | | | | | | | | | | | | | | | |
| | | Federal Instruments Fund | | | Government Fund | | | Money Market Fund | |
| Share Class | | Beginning
Account
Value 3/1/17 | | | Ending
Account
Value
8/31/17 | | | Expenses Paid for the 6 months ended
8/31/17* | | | Beginning
Account
Value 3/1/17 | | | Ending
Account
Value
8/31/17 | | | Expenses Paid for the 6 months ended
8/31/17* | | | Beginning
Account
Value 3/1/17 | | | Ending
Account
Value
8/31/17 | | | Expenses Paid for the 6 months ended
8/31/17* | |
| Institutional Shares | | | | | | | | | | | | | | | | | | | | | | | | | | | | | | | | | | | | |
Actual | | $ | 1,000.00 | | | $ | 1,003.50 | | | $ | 1.01 | | | $ | 1,000.00 | | | $ | 1,003.70 | | | $ | 0.91 | | | $ | 1,000.00 | | | $ | 1,005.50 | | | $ | 0.91 | |
Hypothetical (5% return before expenses) | | | 1,000.00 | | | | 1,024.20 | + | | | 1.02 | | | | 1,000.00 | | | | 1,024.30 | + | | | 0.92 | | | | 1,000.00 | | | | 1,024.30 | + | | | 0.92 | |
| Select Shares | | | | | | | | | | | | | | | | | | | | | | | | | | | | | | | | | | | | |
Actual | | | 1,000.00 | | | | 1,003.30 | | | | 1.16 | | | | 1,000.00 | | | | 1,003.50 | | | | 1.06 | | | | 1,000.00 | | | | 1,005.30 | | | | 1.06 | |
Hypothetical (5% return before expenses) | | | 1,000.00 | | | | 1,024.05 | + | | | 1.17 | | | | 1,000.00 | | | | 1,024.15 | + | | | 1.07 | | | | 1,000.00 | | | | 1,024.15 | + | | | 1.07 | |
| Preferred Shares | | | | | | | | | | | | | | | | | | | | | | | | | | | | | | | | | | | | |
Actual | | | 1,000.00 | | | | 1,003.00 | | | | 1.57 | | | | 1,000.00 | | | | 1,003.20 | | | | 1.41 | | | | 1,000.00 | | | | 1,004.90 | | | | 1.41 | |
Hypothetical (5% return before expenses) | | | 1,000.00 | | | | 1,023.64 | + | | | 1.58 | | | | 1,000.00 | | | | 1,023.79 | + | | | 1.43 | | | | 1,000.00 | | | | 1,023.79 | + | | | 1.43 | |
| Capital Shares | | | | | | | | | | | | | | | | | | | | | | | | | | | | | | | | | | | | |
Actual | | | 1,000.00 | | | | 1,002.70 | | | | 1.77 | | | | 1,000.00 | | | | 1,002.90 | | | | 1.67 | | | | 1,000.00 | | | | 1,004.70 | | | | 0.91 | |
Hypothetical (5% return before expenses) | | | 1,000.00 | | | | 1,023.44 | + | | | 1.79 | | | | 1,000.00 | | | | 1,023.54 | + | | | 1.68 | | | | 1,000.00 | | | | 1,024.30 | + | | | 0.92 | |
| Administration Shares | | | | | | | | | | | | | | | | | | | | | | | | | | | | | | | | | | | | |
Actual | | | 1,000.00 | | | | 1,002.20 | | | | 2.27 | | | | 1,000.00 | | | | 1,002.40 | | | | 2.17 | | | | 1,000.00 | | | | 1,004.10 | | | | 2.17 | |
Hypothetical (5% return before expenses) | | | 1,000.00 | | | | 1,022.94 | + | | | 2.29 | | | | 1,000.00 | | | | 1,023.04 | + | | | 2.19 | | | | 1,000.00 | | | | 1,023.04 | + | | | 2.19 | |
| Premier Shares | | | | | | | | | | | | | | | | | | | | | | | | | | | | | | | | | | | | |
Actual | | | 1,000.00 | | | | 1,001.70 | | | | 2.77 | | | | 1,000.00 | | | | 1,001.90 | | | | 2.62 | | | | 1,000.00 | | | | 1,003.70 | | | | 1.82 | |
Hypothetical (5% return before expenses) | | | 1,000.00 | | | | 1,022.43 | + | | | 2.80 | | | | 1,000.00 | | | | 1,022.58 | + | | | 2.65 | | | | 1,000.00 | | | | 1,023.39 | + | | | 1.84 | |
| Service Shares | | | | | | | | | | | | | | | | | | | | | | | | | | | | | | | | | | | | |
Actual | | | 1,000.00 | | | | 1,001.00 | | | | 3.53 | | | | 1,000.00 | | | | 1,001.20 | | | | 3.38 | | | | 1,000.00 | | | | 1,002.80 | | | | 3.43 | |
Hypothetical (5% return before expenses) | | | 1,000.00 | | | | 1,021.68 | + | | | 3.57 | | | | 1,000.00 | | | | 1,021.83 | + | | | 3.41 | | | | 1,000.00 | | | | 1,021.78 | + | | | 3.47 | |
| Class A Shares | | | | | | | | | | | | | | | | | | | | | | | | | | | | | | | | | | | | |
Actual | | | N/A | | | | N/A | | | | N/A | | | | 1,000.00 | | | | 1,002.40 | | | | 2.17 | | | | N/A | | | | N/A | | | | N/A | |
Hypothetical (5% return before expenses) | | | N/A | | | | N/A | | | | N/A | | | | 1,000.00 | | | | 1,023.04 | + | | | 2.19 | | | | N/A | | | | N/A | | | | N/A | |
| Class C Shares | | | | | | | | | | | | | | | | | | | | | | | | | | | | | | | | | | | | |
Actual | | | N/A | | | | N/A | | | | N/A | | | | 1,000.00 | | | | 1,000.00 | | | | 4.34 | | | | N/A | | | | N/A | | | | N/A | |
Hypothetical (5% return before expenses) | | | N/A | | | | N/A | | | | N/A | | | | 1,000.00 | | | | 1,020.87 | + | | | 4.38 | | | | N/A | | | | N/A | | | | N/A | |
| Resource Shares | | | | | | | | | | | | | | | | | | | | | | | | | | | | | | | | | | | | |
Actual | | | N/A | | | | N/A | | | | N/A | | | | 1,000.00 | | | | 1,000.50 | | | | 4.03 | | | | 1,000.00 | | | | 1,002.20 | | | | 1.82 | |
Hypothetical (5% return before expenses) | | | N/A | | | | N/A | | | | N/A | | | | 1,000.00 | | | | 1,021.17 | + | | | 4.08 | | | | 1,000.00 | | | | 1,023.39 | + | | | 1.84 | |
| Cash Management Shares | | | | | | | | | | | | | | | | | | | | | | | | | | | | | | | | | | | | |
Actual | | | 1,000.00 | | | | 1,000.10 | | | | 4.44 | | | | 1,000.00 | | | | 1,000.20 | | | | 4.29 | | | | 1,000.00 | | | | 1,001.40 | | | | 3.68 | |
Hypothetical (5% return before expenses) | | | 1,000.00 | | | | 1,020.77 | + | | | 4.48 | | | | 1,000.00 | | | | 1,020.92 | + | | | 4.33 | | | | 1,000.00 | | | | 1,021.53 | + | | | 3.72 | |
| Class R6 Shares | | | | | | | | | | | | | | | | | | | | | | | | | | | | | | | | | | | | |
Actual | | | N/A | | | | N/A | | | | N/A | | | | 1,000.00 | | | | 1,003.70 | | | | 0.91 | | | | N/A | | | | N/A | | | | N/A | |
Hypothetical (5% return before expenses) | | | N/A | | | | N/A | | | | N/A | | | | 1,000.00 | | | | 1,024.30 | + | | | 0.92 | | | | N/A | | | | N/A | | | | N/A | |
82
GOLDMAN SACHS FUNDS — FINANCIAL SQUARE FUNDS
Fund Expenses — Six Month Period Ended August 31, 2017 (Unaudited) (continued)
| | | | | | | | | | | | | | | | | | | | | | | | | | | | | | | | | | | | |
| | | Prime Obligations | | | Tax-Exempt Money Market | | | Treasury Instruments Fund | |
| Share Class | | Beginning
Account
Value 3/1/17 | | | Ending
Account Value 8/31/17 | | | Expenses Paid for the
6 months ended
8/31/17* | | | Beginning
Account
Value 3/1/17 | | | Ending
Account Value 8/31/17 | | | Expenses Paid for the
6 months ended
8/31/17* | | | Beginning
Account
Value 3/1/17 | | | Ending
Account Value 8/31/17 | | | Expenses Paid for the
6 months ended
8/31/17* | |
| Institutional Shares | | | | | | | | | | | | | | | | | | | | | | | | | | | | | | | | | | | | |
Actual | | $ | 1,000.00 | | | $ | 1,005.40 | | | $ | 0.91 | | | $ | 1,000.00 | | | $ | 1,003.00 | | | $ | 0.91 | | | $ | 1,000.00 | | | $ | 1,003.40 | | | $ | 1.01 | |
Hypothetical (5% return before expenses) | | | 1,000.00 | | | | 1,024.30 | + | | | 0.92 | | | | 1,000.00 | | | | 1,024.30 | + | | | 0.92 | | | | 1,000.00 | | | | 1,024.20 | + | | | 1.02 | |
| Select Shares | | | | | | | | | | | | | | | | | | | | | | | | | | | | | | | | | | | | |
Actual | | | 1,000.00 | | | | 1,005.20 | | | | 1.06 | | | | 1,000.00 | | | | 1,003.00 | | | | 1.11 | | | | 1,000.00 | | | | 1,003.30 | | | | 1.16 | |
Hypothetical (5% return before expenses) | | | 1,000.00 | | | | 1,024.15 | + | | | 1.07 | | | | 1,000.00 | | | | 1,024.10 | + | | | 1.12 | | | | 1,000.00 | | | | 1,024.05 | + | | | 1.17 | |
| Preferred Shares | | | | | | | | | | | | | | | | | | | | | | | | | | | | | | | | | | | | |
Actual | | | 1,000.00 | | | | 1,004.80 | | | | 1.41 | | | | 1,000.00 | | | | 1,002.50 | | | | 1.46 | | | | 1,000.00 | | | | 1,002.90 | | | | 1.51 | |
Hypothetical (5% return before expenses) | | | 1,000.00 | | | | 1,023.79 | + | | | 1.43 | | | | 1,000.00 | | | | 1,023.74 | + | | | 1.48 | | | | 1,000.00 | | | | 1,023.69 | + | | | 1.53 | |
| Capital Shares | | | | | | | | | | | | | | | | | | | | | | | | | | | | | | | | | | | | |
Actual | | | 1,000.00 | | | | 1,004.60 | | | | 1.67 | | | | 1,000.00 | | | | 1,002.30 | | | | 1.67 | | | | 1,000.00 | | | | 1,002.70 | | | | 1.77 | |
Hypothetical (5% return before expenses) | | | 1,000.00 | | | | 1,023.54 | + | | | 1.68 | | | | 1,000.00 | | | | 1,023.54 | + | | | 1.68 | | | | 1,000.00 | | | | 1,023.44 | + | | | 1.79 | |
| Administration Shares | | | | | | | | | | | | | | | | | | | | | | | | | | | | | | | | | | | | |
Actual | | | 1,000.00 | | | | 1,004.10 | | | | 2.17 | | | | 1,000.00 | | | | 1,001.70 | | | | 2.22 | | | | 1,000.00 | | | | 1,002.20 | | | | 2.27 | |
Hypothetical (5% return before expenses) | | | 1,000.00 | | | | 1,023.04 | + | | | 2.19 | | | | 1,000.00 | | | | 1,022.99 | + | | | 2.24 | | | | 1,000.00 | | | | 1,022.94 | + | | | 2.29 | |
| Premier Shares | | | | | | | | | | | | | | | | | | | | | | | | | | | | | | | | | | | | |
Actual | | | 1,000.00 | | | | 1,003.50 | | | | 1.82 | | | | N/A | | | | N/A | | | | N/A | | | | 1,000.00 | | | | 1,001.70 | | | | 2.77 | |
Hypothetical (5% return before expenses) | | | 1,000.00 | | | | 1,023.39 | + | | | 1.84 | | | | N/A | | | | N/A | | | | N/A | | | | 1,000.00 | | | | 1,022.43 | + | | | 2.80 | |
| Service Shares | | | | | | | | | | | | | | | | | | | | | | | | | | | | | | | | | | | | |
Actual | | | 1,000.00 | | | | 1,002.80 | | | | 3.43 | | | | 1,000.00 | | | | 1,000.50 | | | | 3.43 | | | | 1,000.00 | | | | 1,001.00 | | | | 3.48 | |
Hypothetical (5% return before expenses) | | | 1,000.00 | | | | 1,021.78 | + | | | 3.47 | | | | 1,000.00 | | | | 1,021.78 | + | | | 3.47 | | | | 1,000.00 | | | | 1,021.73 | + | | | 3.52 | |
| Resource Shares | | | | | | | | | | | | | | | | | | | | | | | | | | | | | | | | | | | | |
Actual | | | 1,000.00 | | | | 1,002.00 | | | | 1.82 | | | | 1,000.00 | | | | 1,000.10 | | | | 3.83 | | | | 1,000.00 | | | | 1,000.40 | | | | 2.47 | |
Hypothetical (5% return before expenses) | | | 1,000.00 | | | | 1,023.39 | + | | | 1.84 | | | | 1,000.00 | | | | 1,021.37 | + | | | 3.87 | | | | 1,000.00 | | | | 1,022.74 | + | | | 2.50 | |
| Cash Management Shares | | | | | | | | | | | | | | | | | | | | | | | | | | | | | | | | | | | | |
Actual | | | 1,000.00 | | | | 1,001.20 | | | | 3.63 | | | | N/A | | | | N/A | | | | N/A | | | | 1,000.00 | | | | 1,000.10 | | | | 4.08 | |
Hypothetical (5% return before expenses) | | | 1,000.00 | | | | 1,021.58 | + | | | 3.67 | | | | N/A | | | | N/A | | | | N/A | | | | 1,000.00 | | | | 1,021.12 | + | | | 4.13 | |
83
GOLDMAN SACHS FUNDS — FINANCIAL SQUARE FUNDS
Fund Expenses — Six Month Period Ended August 31, 2017 (Unaudited) (continued)
| | | | | | | | | | | | | | | | | | | | | | | | |
| | | Treasury Obligations Fund | | | Treasury Solutions Fund | |
| Share Class | | Beginning
Account
Value 3/1/17 | | | Ending
Account Value 8/31/17 | | | Expenses
Paid for the
6 months ended
8/31/17* | | | Beginning
Account Value 3/1/17 | | | Ending Account Value 8/31/17 | | | Expenses Paid for the
6 months ended
8/31/17* | |
| Institutional Shares | | | | | | | | | | | | | | | | | | | | | | | | |
Actual | | $ | 1,000.00 | | | $ | 1,003.50 | | | $ | 1.01 | | | $ | 1,000.00 | | | $ | 1,003.50 | | | $ | 1.01 | |
Hypothetical (5% return before expenses) | | | 1,000.00 | | | | 1,024.20 | + | | | 1.02 | | | | 1,000.00 | | | | 1,024.20 | + | | | 1.02 | |
| Select Shares | | | | | | | | | | | | | | | | | | | | | | | | |
Actual | | | 1,000.00 | | | | 1,003.40 | | | | 1.16 | | | | 1,000.00 | | | | 1,003.30 | | | | 1.16 | |
Hypothetical (5% return before expenses) | | | 1,000.00 | | | | 1,024.05 | + | | | 1.17 | | | | 1,000.00 | | | | 1,024.05 | + | | | 1.17 | |
| Preferred Shares | | | | | | | | | | | | | | | | | | | | | | | | |
Actual | | | 1,000.00 | | | | 1,003.00 | | | | 1.51 | | | | 1,000.00 | | | | 1,003.00 | | | | 1.51 | |
Hypothetical (5% return before expenses) | | | 1,000.00 | | | | 1,023.69 | + | | | 1.53 | | | | 1,000.00 | | | | 1,023.69 | + | | | 1.53 | |
| Capital Shares | | | | | | | | | | | | | | | | | | | | | | | | |
Actual | | | 1,000.00 | | | | 1,002.80 | | | | 1.77 | | | | 1,000.00 | | | | 1,002.70 | | | | 1.77 | |
Hypothetical (5% return before expenses) | | | 1,000.00 | | | | 1,023.44 | + | | | 1.79 | | | | 1,000.00 | | | | 1,023.44 | + | | | 1.79 | |
| Administration Shares | | | | | | | | | | | | | | | | | | | | | | | | |
Actual | | | 1,000.00 | | | | 1,002.30 | | | | 2.27 | | | | 1,000.00 | | | | 1,002.20 | | | | 2.27 | |
Hypothetical (5% return before expenses) | | | 1,000.00 | | | | 1,022.94 | + | | | 2.29 | | | | 1,000.00 | | | | 1,022.94 | + | | | 2.29 | |
| Premier Shares | | | | | | | | | | | | | | | | | | | | | | | | |
Actual | | | 1,000.00 | | | | 1,001.80 | | | | 2.57 | | | | 1,000.00 | | | | 1,001.70 | | | | 2.77 | |
Hypothetical (5% return before expenses) | | | 1,000.00 | | | | 1,022.63 | + | | | 2.60 | | | | 1,000.00 | | | | 1,022.43 | + | | | 2.80 | |
| Service Shares | | | | | | | | | | | | | | | | | | | | | | | | |
Actual | | | 1,000.00 | | | | 1,001.00 | | | | 3.48 | | | | 1,000.00 | | | | 1,001.00 | | | | 3.48 | |
Hypothetical (5% return before expenses) | | | 1,000.00 | | | | 1,021.73 | + | | | 3.52 | | | | 1,000.00 | | | | 1,021.73 | + | | | 3.52 | |
| Resource Shares | | | | | | | | | | | | | | | | | | | | | | | | |
Actual | | | 1,000.00 | | | | 1,000.50 | | | | 2.52 | | | | 1,000.00 | | | | 1,000.40 | | | | 2.47 | |
Hypothetical (5% return before expenses) | | | 1,000.00 | | | | 1,022.68 | + | | | 2.55 | | | | 1,000.00 | | | | 1,022.74 | + | | | 2.50 | |
| Cash Management Shares | | | | | | | | | | | | | | | | | | | | | | | | |
Actual | | | 1,000.00 | | | | 1,000.10 | | | | 4.99 | | | | 1,000.00 | | | | 1,000.10 | | | | 4.03 | |
Hypothetical (5% return before expenses) | | | 1,000.00 | | | | 1,020.21 | + | | | 5.04 | | | | 1,000.00 | | | | 1,021.17 | + | | | 4.08 | |
84
GOLDMAN SACHS FUNDS — FINANCIAL SQUARE FUNDS
Fund Expenses — Six Month Period Ended August 31, 2017 (Unaudited) (continued)
| * | | Expenses for each share class are calculated using each Fund’s annualized net expense ratio for each class, which represents the ongoing expenses as a percentage of net assets for the six months ended August 31, 2017. Expenses are calculated by multiplying the annualized net expense ratio by the average account value for the period; then multiplying the result by the number of days in the most recent fiscal half year; and then dividing that result by the number of days in the fiscal year. The annualized net expense ratios for the period were as follows: |
| | | | | | | | | | | | | | | | | | | | | | | | | | | | | | | | | | | | | | | | | | | | | | | | |
| Fund | | Institutional
Shares | | | Select
Shares | | | Preferred
Shares | | | Capital
Shares | | | Administration
Shares | | | Premier
Shares | | | Service
Shares | | | Class A
Shares | | | Class C
Shares | | | Resource
Shares | | | Cash
Management
Shares | | | Class R6
Shares | |
Federal Instruments | | | 0.20 | % | | | 0.23 | % | | | 0.31 | % | | | 0.35 | % | | | 0.45 | % | | | 0.55 | % | | | 0.70 | % | | | N/A | | | | N/A | | | | N/A | | | | 0.88 | % | | | N/A | |
Government | | | 0.18 | | | | 0.21 | | | | 0.28 | | | | 0.33 | | | | 0.43 | | | | 0.52 | | | | 0.67 | | | | 0.43 | % | | | 0.86 | % | | | 0.80 | % | | | 0.85 | | | | 0.18 | % |
Money Market | | | 0.18 | | | | 0.21 | | | | 0.28 | | | | 0.18 | | | | 0.43 | | | | 0.36 | | | | 0.68 | | | | N/A | | | | N/A | | | | 0.36 | | | | 0.73 | | | | N/A | |
Prime Obligations | | | 0.18 | | | | 0.21 | | | | 0.28 | | | | 0.33 | | | | 0.43 | | | | 0.36 | | | | 0.68 | | | | N/A | | | | N/A | | | | 0.36 | | | | 0.72 | | | | N/A | |
Tax-Exempt Money Market | | | 0.18 | | | | 0.22 | | | | 0.29 | | | | 0.33 | | | | 0.44 | | | | N/A | | | | 0.68 | | | | N/A | | | | N/A | | | | 0.76 | | | | N/A | | | | N/A | |
Treasury Instruments | | | 0.20 | | | | 0.23 | | | | 0.30 | | | | 0.35 | | | | 0.45 | | | | 0.55 | | | | 0.69 | | | | N/A | | | | N/A | | | | 0.49 | | | | 0.81 | | | | N/A | |
Treasury Obligations | | | 0.20 | | | | 0.23 | | | | 0.30 | | | | 0.35 | | | | 0.45 | | | | 0.51 | | | | 0.69 | | | | N/A | | | | N/A | | | | 0.50 | | | | 0.99 | | | | N/A | |
Treasury Solutions | | | 0.20 | | | | 0.23 | | | | 0.30 | | | | 0.35 | | | | 0.45 | | | | 0.55 | | | | 0.69 | | | | N/A | | | | N/A | | | | 0.49 | | | | 0.80 | | | | N/A | |
| + | | Hypothetical expenses are based on each Fund’s actual annualized net expense ratios and an assumed rate of return of 5% per year before expenses. |
85
GOLDMAN SACHS FUNDS — FINANCIAL SQUARE FUNDS
Statement Regarding Basis for Approval of Management Agreement (Unaudited)
Background
The Goldman Sachs Financial Square Federal Instruments Fund, Goldman Sachs Financial Square Government Fund, Goldman Sachs Financial Square Money Market Fund, Goldman Sachs Financial Square Prime Obligations Fund, Goldman Sachs Financial Square Tax-Exempt Money Market Fund, Goldman Sachs Financial Square Treasury Instruments Fund, Goldman Sachs Financial Square Treasury Obligations Fund, and Goldman Sachs Financial Square Treasury Solutions Fund (the “Funds”) are investment portfolios of Goldman Sachs Trust (the “Trust”). The Board of Trustees oversees the management of the Trust and reviews the investment performance and expenses of the Funds at regularly scheduled meetings held throughout the year. In addition, the Board of Trustees determines annually whether to approve the continuance of the Trust’s investment management agreement (the “Management Agreement”) with Goldman Sachs Asset Management, L.P. (the “Investment Adviser”) on behalf of the Funds.
The Management Agreement was most recently approved for continuation until June 30, 2018 by the Board of Trustees, including those Trustees who are not parties to the Management Agreement or “interested persons” (as defined in the Investment Company Act of 1940, as amended) of any party thereto (the “Independent Trustees”), at a meeting held on June 14-15, 2017 (the “Annual Meeting”).
The review process undertaken by the Trustees spans the course of the year and culminates with the Annual Meeting. To assist the Trustees in their deliberations, the Trustees have established a Contract Review Committee (the “Committee”), comprised of the Independent Trustees. The Committee held four meetings over the course of the year since the Management Agreement was last approved. At those Committee meetings, regularly scheduled Board or other committee meetings, and/or the Annual Meeting, matters relevant to the renewal of the Management Agreement were considered by the Board, or the Independent Trustees, as applicable. With respect to each Fund, such matters included:
| | (a) | | the nature and quality of the advisory, administrative, and other services provided to the Fund by the Investment Adviser and its affiliates, including information about: |
| | (i) | | the structure, staff, and capabilities of the Investment Adviser and its portfolio management teams; |
| | (ii) | | the groups within the Investment Adviser and its affiliates that support the portfolio management teams or provide other types of necessary services, including fund services groups (e.g., accounting and financial reporting, tax, shareholder services, and operations); controls and risk management groups (e.g., legal, compliance, valuation oversight, credit risk management, internal audit, compliance testing, market risk analysis, finance, and central funding); sales and distribution support groups, and others (e.g., information technology and training); |
| | (iii) | | trends in employee headcount; |
| | (iv) | | the Investment Adviser’s financial resources and ability to hire and retain talented personnel and strengthen its operations; and |
| | (v) | | the parent company’s support of the Investment Adviser and its mutual fund business, as expressed by the firm’s senior management; |
| | (b) | | information on the investment performance of the Fund, including comparisons to the performance of similar mutual funds, as provided by a third-party mutual fund data provider engaged as part of the contract review process (the “Outside Data Provider”); and information on general investment outlooks in the markets in which the Fund invests; |
86
GOLDMAN SACHS FUNDS — FINANCIAL SQUARE FUNDS
Statement Regarding Basis for Approval of Management Agreement (Unaudited) (continued)
| | (c) | | information provided by the Investment Adviser indicating the Investment Adviser’s views on whether the Fund’s peer group and/or benchmark index had high, medium, or low relevance given the Fund’s particular investment strategy; |
| | (d) | | the terms of the Management Agreement and other agreements with affiliated service providers entered into by the Trust on behalf of the Fund; |
| | (e) | | fee and expense information for the Fund, including: |
| | (i) | | the relative management fee and expense levels of the Fund as compared to those of comparable funds managed by other advisers, as provided by the Outside Data Provider; |
| | (ii) | | the Fund’s expense trends over time (except for the Financial Square Tax-Exempt Money Market Fund, which commenced operations on March 31, 2016); and |
| | (iii) | | to the extent the Investment Adviser manages other types of accounts (such as bank collective trusts, private wealth management accounts, institutional separate accounts, sub-advised mutual funds, and non-U.S. funds) having investment objectives and policies similar to those of the Fund, comparative information on the advisory fees charged and services provided to those accounts by the Investment Adviser; |
| | (f) | | with respect to the extensive investment performance and expense comparison data provided by the Outside Data Provider, its processes in producing that data for the Fund; |
| | (g) | | the undertakings of the Investment Adviser and its affiliates to implement fee waivers and/or expense limitations; |
| | (h) | | information relating to the profitability of the Management Agreement and the transfer agency and distribution and service arrangements of the Fund to the Investment Adviser and its affiliates; |
| | (i) | | whether the Fund’s existing management fee schedule adequately addressed any economies of scale; |
| | (j) | | a summary of the “fall-out” benefits derived by the Investment Adviser and its affiliates from their relationships with the Fund, including the fees received by the Investment Adviser’s affiliates from the Fund for transfer agency, distribution and other services; |
| | (k) | | a summary of potential benefits derived by the Fund as a result of its relationship with the Investment Adviser; |
| | (l) | | information regarding portfolio trading and how the Investment Adviser carries out its duty to seek best execution; |
| | (m) | | the nature and quality of the services provided to the Fund by its unaffiliated service providers, and the Investment Adviser’s general oversight and evaluation (including reports on due diligence) of those service providers as part of the administrative services provided under the Management Agreement; |
| | (n) | | the Investment Adviser’s processes and policies addressing various types of potential conflicts of interest; its approach to risk management; the annual review of the effectiveness of the Fund’s compliance program; and periodic compliance reports; and |
| | (o) | | the efforts of the Investment Adviser to respond to amendments to the regulatory framework for money market funds, including implementation of the final set of reforms as of October 11, 2016. |
87
GOLDMAN SACHS FUNDS — FINANCIAL SQUARE FUNDS
Statement Regarding Basis for Approval of Management Agreement (Unaudited) (continued)
The Trustees also received an overview of the Funds’ distribution arrangements. They received information regarding the Funds’ assets, share purchase and redemption activity, and payment of distribution, service, and shareholder administration fees, as applicable. Information was also provided to the Trustees relating to revenue sharing payments made by and services provided by the Investment Adviser and its affiliates to intermediaries that promote the sale, distribution, and/or servicing of Fund shares. The Independent Trustees also discussed the broad range of other investment choices that are available to Fund investors, including the availability of comparable funds managed by other advisers.
The presentations made at the Board and Committee meetings and at the Annual Meeting encompassed the Funds and other mutual funds for which the Board of Trustees has responsibility. In evaluating the Management Agreement at the Annual Meeting, the Trustees relied upon their knowledge, resulting from their meetings and other interactions throughout the year, of the Investment Adviser and its affiliates, their services, and the Funds. In conjunction with these meetings, the Trustees received written materials and oral presentations on the topics covered, and the Investment Adviser addressed the questions and concerns of the Trustees, including concerns regarding the investment performance of certain of the funds they oversee. The Independent Trustees were advised by their independent legal counsel regarding their responsibilities and other regulatory requirements related to the approval and continuation of mutual fund investment management agreements under applicable law. In addition, the Investment Adviser and its affiliates provided the Independent Trustees with a written response to a formal request for information sent on behalf of the Independent Trustees by their independent legal counsel. During the course of their deliberations, the Independent Trustees met in executive sessions with their independent legal counsel, without representatives of the Investment Adviser or its affiliates present.
Nature, Extent, and Quality of the Services Provided Under the Management Agreement
As part of their review, the Trustees considered the nature, extent, and quality of the services provided to the Funds by the Investment Adviser. In this regard, the Trustees considered both the investment advisory services and non-advisory services that are provided by the Investment Adviser and its affiliates. The Trustees noted the transition in the leadership and changes in personnel of various of the Investment Adviser’s portfolio management teams that had occurred in recent periods, and the ongoing recruitment efforts aimed at bringing high quality investment talent to the Investment Adviser. They also noted the Investment Adviser’s commitment to maintaining high quality systems and expending substantial resources to respond to ongoing changes to the regulatory and control environment in which the Funds and their service providers operate, as well as the efforts of the Investment Adviser and its affiliates to combat cyber security risks. The Trustees concluded that the Investment Adviser continued to commit substantial financial and operational resources to the Funds and expressed confidence that the Investment Adviser would continue to do so in the future. The Trustees also recognized that the Investment Adviser had made significant commitments to address regulatory compliance requirements applicable to the Funds and the Investment Adviser and its affiliates.
88
GOLDMAN SACHS FUNDS — FINANCIAL SQUARE FUNDS
Statement Regarding Basis for Approval of Management Agreement (Unaudited) (continued)
Investment Performance
The Trustees also considered the investment performance of the Funds. In this regard, they compared the investment performance of each Fund (except for the Financial Square Tax-Exempt Money Market Fund, which commenced operations on March 31, 2016) to its peers using rankings compiled by the Outside Data Provider as of December 31, 2016. The information on each Fund’s investment performance was provided for the one-, three-, five-, and ten-year periods ending on the applicable dates, to the extent that each Fund had been in existence for those periods.
In addition, the Trustees considered materials prepared and presentations made by the Investment Adviser’s senior management and portfolio management personnel in which Fund performance was assessed. The Trustees also considered the Investment Adviser’s periodic reports with respect to the Funds’ risk profiles, and how the Investment Adviser’s approach to risk monitoring and management influences portfolio management.
The Trustees considered the performance of the Funds in light of their respective investment policies and strategies. They considered that the Investment Adviser had expended substantial resources to respond to amendments to the regulatory framework for money market funds. They noted that the Funds had implemented the final set of reforms as of October 11, 2016, including the requirements relating to the use of liquidity fees and redemption gates, and the transition to a floating net asset value for each of the Financial Square Prime Obligations, Financial Square Money Market and Financial Square Tax-Exempt Money Market Funds (the “Floating NAV Money Market Funds”). They considered that the Funds had operated in a challenging yield environment since 2009 (although yields had begun to improve as a result of recent actions by the Federal Reserve), and that the Investment Adviser had been able to maintain a positive yield to meet the demand of the Funds’ investors, in many instances as the result of voluntary fee waivers and expense reimbursements. The Trustees also considered that each Fund had maintained a stable net asset value and, with respect to the Floating NAV Money Market Funds, experienced minimal principal volatility after transitioning to a floating net asset value. In light of these considerations, the Trustees believed that the Funds were providing investment performance within a competitive range for investors.
The Trustees noted that the Financial Square Tax-Exempt Money Market Fund had launched on March 31, 2016 and did not yet have a meaningful performance history.
Costs of Services Provided and Competitive Information
The Trustees considered the contractual terms of the Management Agreement and the fee rates payable by each Fund thereunder. In this regard, the Trustees considered information on the services rendered by the Investment Adviser to the Funds, which included both advisory and administrative services that were directed to the needs and operations of the Funds as registered mutual funds.
In particular, the Trustees reviewed analyses prepared by the Outside Data Provider regarding the expense rankings of the Funds. The analyses provided a comparison of each Fund’s management fee to those of a relevant peer group and category universe; an expense analysis which compared each Fund’s overall net and gross expenses to a peer group and a category universe; and data comparing each Fund’s net expenses to the peer and category medians. The analyses also compared each Fund’s transfer agency and custody fees, other expenses and fee waivers/reimbursements to those of the peer group and category medians. The Trustees concluded that the comparisons provided by the Outside Data Provider were useful in evaluating the reasonableness of the management fees and total expenses paid by the Funds.
89
GOLDMAN SACHS FUNDS — FINANCIAL SQUARE FUNDS
Statement Regarding Basis for Approval of Management Agreement (Unaudited) (continued)
In addition, the Trustees considered the Investment Adviser’s undertakings to implement fee waivers and/or expense limitations. They noted that the Investment Adviser and Goldman Sachs & Co. LLC (“Goldman Sachs”) had waived fees and reimbursed expenses for the Funds in order to maintain positive yields. They also observed that the Investment Adviser had expended substantial resources to respond to amendments to the regulatory framework for money market funds. They noted that the Funds had implemented the final set of reforms as of October 11, 2016, including the requirements relating to the use of liquidity fees and redemption gates, and the transition to a floating net asset value for each of the Floating NAV Money Market Funds. They also considered, to the extent that the Investment Adviser manages other types of accounts having investment objectives and policies similar to those of the Funds, comparative fee information for services provided by the Investment Adviser to those accounts, and information that indicated that services provided to the Funds differed in various significant respects from the services provided to other types of accounts which, in many cases, operated under less stringent legal and regulatory structures, required fewer services from the Investment Adviser to a smaller number of client contact points, and were less time-intensive.
In addition, the Trustees noted that shareholders are able to redeem their Fund shares at any time if shareholders believe that the Fund fees and expenses are too high or if they are dissatisfied with the performance of the Fund.
Profitability
The Trustees reviewed each Fund’s contribution to the Investment Adviser’s revenues and pre-tax profit margins. In this regard the Trustees noted that they had received, among other things, profitability analyses and summaries, revenue and expense schedules by Fund and by function (i.e., investment management, transfer agency and distribution and service), and information on the Investment Adviser’s expense allocation methodology. They observed that the profitability and expense figures are substantially similar to those used by the Investment Adviser for many internal purposes, including compensation decisions among various business groups, and are thus subject to a vigorous internal debate about how certain revenue and expenses should be allocated. The Trustees also noted that the internal audit group within the Goldman Sachs organization had audited the expense allocation methodology and that the internal audit group was satisfied with the reasonableness, consistency, and accuracy of the Investment Adviser’s expense allocation methodology and profitability analysis calculations. Profitability data for each Fund was provided for 2016 and 2015 (2016 only for the Financial Square Tax-Exempt Money Market Fund), and the Trustees considered this information in relation to the Investment Adviser’s overall profitability.
Economies of Scale
The Trustees considered the information that had been provided regarding the Investment Adviser’s profitability.
The Trustees noted that the Funds do not have management fee breakpoints. They considered the asset levels in the Funds; the Funds’ recent purchase and redemption activity; the information provided by the Investment Adviser relating to the costs of the services provided by the Investment Adviser and its affiliates and their realized profits; information comparing the contractual fee rates charged by the Investment Adviser with fee rates charged to other money market funds in the peer groups; the Investment Adviser’s undertaking to limit certain expenses of the Funds that exceed specified levels; and the willingness of the Investment Adviser and Goldman Sachs to waive certain fees on a temporary basis in order to maintain positive Fund yields. They considered a report prepared by the Outside Data Provider, which surveyed money market funds’ management fee arrangements and use of breakpoints. The Trustees also considered the competitive nature of the money market fund business and the competitiveness of the fees charged to the Funds by the Investment Adviser.
90
GOLDMAN SACHS FUNDS — FINANCIAL SQUARE FUNDS
Statement Regarding Basis for Approval of Management Agreement (Unaudited) (continued)
Other Benefits to the Investment Adviser and Its Affiliates
The Trustees also considered the other benefits derived by the Investment Adviser and its affiliates from their relationships with the Funds as stated above, including: (a) transfer agency fees received by Goldman Sachs; (b) trading efficiencies resulting from aggregation of orders of the Funds with those for other funds or accounts managed by the Investment Adviser; (c) the Investment Adviser’s ability to leverage the infrastructure designed to service the Funds on behalf of its other clients; (d) the Investment Adviser’s ability to cross-market other products and services to Fund shareholders; (e) Goldman Sachs’ retention of certain fees as Fund Distributor; (f) Goldman Sachs’ ability to engage in principal transactions with the Funds under exemptive orders from the U.S. Securities and Exchange Commission permitting such trades; (g) the Investment Adviser’s ability to negotiate better pricing with custodians on behalf of its other clients, as a result of the relationship with the Funds; and (h) the possibility that the working relationship between the Investment Adviser and the Funds’ third-party service providers may cause those service providers to be more likely to do business with other areas of Goldman Sachs. In the course of considering the foregoing, the Independent Trustees requested and received further information quantifying certain of these fall-out benefits.
Other Benefits to the Funds and Their Shareholders
The Trustees also noted that the Funds receive certain potential benefits as a result of their relationship with the Investment Adviser, including: (a) trading efficiencies resulting from aggregation of orders of the Funds with those of other funds or accounts managed by the Investment Adviser; (b) enhanced servicing from vendors because of the volume of business generated by the Investment Adviser and its affiliates; (c) enhanced servicing from broker-dealers because of the volume of business generated by the Investment Adviser and its affiliates; (d) the Investment Adviser’s knowledge and experience gained from managing other accounts and products; (e) the Investment Adviser’s ability to hire and retain qualified personnel to provide services to the Funds because of the reputation of the Goldman Sachs organization; (f) the Funds’ access, through the Investment Adviser, to certain firmwide resources (e.g., proprietary risk management systems and databases), subject to certain restrictions; and (g) the Funds’ access to certain affiliated distribution channels. In addition, the Trustees noted the competitive nature of the mutual fund marketplace, and considered that many of the Funds’ shareholders invested in the Funds in part because of the Funds’ relationship with the Investment Adviser and that those shareholders have a general expectation that the relationship will continue.
Conclusion
In connection with their consideration of the Management Agreement, the Trustees gave weight to each of the factors described above, but did not identify any particular factor as controlling their decision. After deliberation and consideration of all of the information provided, including the factors described above, the Trustees concluded, in the exercise of their business judgment, that the management fees paid by each of the Funds were reasonable in light of the services provided to it by the Investment Adviser, the Investment Adviser’s costs and each Fund’s current and reasonably foreseeable asset levels. The Trustees unanimously concluded that the Investment Adviser’s continued management likely would benefit each Fund and its shareholders and that the Management Agreement should be approved and continued with respect to each Fund until June 30, 2018.
91
GOLDMAN SACHS FUNDS — FINANCIAL SQUARE FUNDS
Trustees and Officers (Unaudited) Independent Trustees
| | | | | | | | | | |
Name, Address and Age1 | | Position(s) Held with the Trust | | Term of Office and Length of Time Served2 | | Principal Occupation(s) During Past 5 Years | | Number of Portfolios in Fund Complex Overseen by Trustee3 | | Other Directorships Held by Trustee4 |
Ashok N. Bakhru Age: 75 | | Chairman of the Board of Trustees | | Since 1996 (Trustee since 1991) | | Mr. Bakhru is retired. He was formerly Chairman of the Board of Trustees, Goldman Sachs Trust II (2012-2016), Goldman Sachs MLP Income Opportunities Fund (2013-2016), Goldman Sachs MLP and Energy Renaissance Fund (2014-2016), and Goldman Sachs ETF Trust (2014-2016); Director, Apollo Investment Corporation (a business development company) (2008-2013); President, ABN Associates (a management and financial consulting firm) (1994-1996 and 1998- 2012); Trustee, Scholarship America (1998-2005); Trustee, Institute for Higher Education Policy (2003-2008); Director, Private Equity Investors — III and IV (1998-2007), and Equity-Linked Investors II (April 2002-2007). Chairman of the Board of Trustees — Goldman Sachs Trust; Goldman Sachs Variable Insurance Trust; Goldman Sachs BDC, Inc.; and Goldman Sachs Private Middle Market Credit LLC. | | 106 | | None |
Kathryn A. Cassidy Age: 63 | | Trustee | | Since 2015 | | Ms. Cassidy is retired. Formerly, she was Advisor to the Chairman (May 2014-December 2014); and Senior Vice President and Treasurer (2008-2014), General Electric Company & General Electric Capital Corporation (technology and financial services companies). Trustee — Goldman Sachs Trust and Goldman Sachs Variable Insurance Trust. | | 104 | | None |
Diana M. Daniels Age: 68 | | Trustee | | Since 2007 | | Ms. Daniels is retired. Formerly, she was Vice President, General Counsel and Secretary, The Washington Post Company (1991-2006). Ms. Daniels is a Trustee Emeritus and serves as a Presidential Councillor of Cornell University (2013-Present); former Member of the Legal Advisory Board, New York Stock Exchange (2003- 2006) and of the Corporate Advisory Board, Standish Mellon Management Advisors (2006- 2007). Trustee — Goldman Sachs Trust and Goldman Sachs Variable Insurance Trust. | | 104 | | None |
Herbert J. Markley Age: 67 | | Trustee | | Since 2013 | | Mr. Markley is retired. Formerly, he was Executive Vice President, Deere & Company (an agricultural and construction equipment manufacturer) (2007- 2009); and President, Agricultural Division, Deere & Company (2001-2007). Previously, Mr. Markley served as an Advisory Board Member of Goldman Sachs Trust and Goldman Sachs Variable Insurance Trust (June 2013-October 2013). Trustee — Goldman Sachs Trust and Goldman Sachs Variable Insurance Trust. | | 104 | | None |
Jessica Palmer Age: 68 | | Trustee | | Since 2007 | | Ms. Palmer is retired. She is Director, Emerson Center for the Arts and Culture (2011-Present); and was formerly a Consultant, Citigroup Human Resources Department (2007-2008); Managing Director, Citigroup Corporate and Investment Banking (previously, Salomon Smith Barney/ Salomon Brothers) (1984-2006). Ms. Palmer was a Member of the Board of Trustees of Indian Mountain School (private elementary and secondary school) (2004-2009). Trustee — Goldman Sachs Trust and Goldman Sachs Variable Insurance Trust. | | 104 | | None |
| | | | | | | | | | |
92
GOLDMAN SACHS FUNDS — FINANCIAL SQUARE FUNDS
Trustees and Officers (Unaudited) (continued) Independent Trustees
| | | | | | | | | | |
Name, Address and Age1 | | Position(s) Held with the Trust | | Term of Office and Length of Time Served2 | | Principal Occupation(s) During Past 5 Years | | Number of Portfolios in Fund Complex Overseen by Trustee3 | | Other Directorships Held by Trustee4 |
Roy W. Templin Age: 57 | | Trustee | | Since 2013 | | Mr. Templin is retired. He is Director, Armstrong World Industries, Inc. (a designer and manufacturer of ceiling, wall and suspension system solutions) (2016-Present); and was formerly Chairman of the Board of Directors, Con-Way Incorporated (a transportation, logistics and supply chain management service company) (2014-2015); Executive Vice President and Chief Financial Officer, Whirlpool Corporation (an appliance manufacturer and marketer) (2004- 2012). Previously, Mr. Templin served as an Advisory Board Member of Goldman Sachs Trust and Goldman Sachs Variable Insurance Trust (June 2013-October 2013). Trustee — Goldman Sachs Trust and Goldman Sachs Variable Insurance Trust. | | 104 | | Armstrong World Industries, Inc. (a ceiling, wall and suspension system solutions manufacturer) |
Gregory G. Weaver Age: 65 | | Trustee | | Since 2015 | | Mr. Weaver is retired. He is Director, Verizon Communications Inc. (2015-Present); and was formerly Chairman and Chief Executive Officer, Deloitte & Touche LLP (a professional services firm) (2001-2005 and 2012-2014); and Member of the Board of Directors, Deloitte & Touche LLP (2006-2012). Trustee — Goldman Sachs Trust and Goldman Sachs Variable Insurance Trust. | | 104 | | Verizon Communications Inc. |
| | | | | | | | | | |
93
GOLDMAN SACHS FUNDS — FINANCIAL SQUARE FUNDS
Trustees and Officers (Unaudited) (continued) Interested Trustee*
| | | | | | | | | | |
Name, Address and Age1 | | Position(s) Held with the Trust | | Term of Office and Length of Time Served2 | | Principal Occupation(s) During Past 5 Years | | Number of Portfolios in Fund Complex Overseen by Trustee3 | | Other Directorships Held by Trustee4 |
| | | | | | | | | | |
James A. McNamara Age: 54 | | President and Trustee | | Since 2007 | | Managing Director, Goldman Sachs (December 1998-Present); Director of Institutional Fund Sales, GSAM (April 1998-December 2000); and Senior Vice President and Manager, Dreyfus Institutional Service Corporation (January 1993- April 1998). President and Trustee — Goldman Sachs Trust; Goldman Sachs Variable Insurance Trust; Goldman Sachs Trust II; Goldman Sachs MLP Income Opportunities Fund; Goldman Sachs MLP and Energy Renaissance Fund; and Goldman Sachs ETF Trust. | | 142 | | None |
| | | | | | | | | | |
| * | | Mr. McNamara is considered to be an “Interested Trustee” because he holds positions with Goldman Sachs and owns securities issued by The Goldman Sachs Group, Inc. Mr. McNamara holds comparable positions with certain other companies of which Goldman Sachs, GSAM or an affiliate thereof is the investment adviser, administrator and/or distributor. |
| 1 | | Each Trustee may be contacted by writing to the Trustee, c/o Goldman Sachs, 200 West Street, New York, New York, 10282, Attn: Caroline Kraus. Information is provided as of August 31, 2017. |
| 2 | | Subject to such policies as may be adopted by the Board from time-to-time, each Trustee holds office for an indefinite term, until the earliest of: (a) the election of his or her successor; (b) the date the Trustee resigns or is removed by the Board or shareholders, in accordance with the Trust’s Declaration of Trust; or (c) the termination of the Trust. The Board has adopted policies which provide that (a) no Trustee shall hold office for more than 15 years and (b) a Trustee shall retire as of December 31st of the calendar year in which he or she reaches his or her 74th birthday, unless a waiver of such requirement shall have been adopted by a majority of the other Trustees. These policies may be changed by the Trustees without shareholder vote. One Trustee has been granted a waiver from the foregoing policies which permits him to serve until December 31, 2017. |
| 3 | | The Goldman Sachs Fund Complex includes certain other companies listed above for each respective Trustee. As of August 31, 2017, Goldman Sachs Trust consisted of 90 portfolios (88 of which offered shares to the public); Goldman Sachs Variable Insurance Trust consisted of 14 portfolios; Goldman Sachs Trust II consisted of 17 portfolios (16 of which offered shares to the public); Goldman Sachs BDC, Inc., Goldman Sachs Private Middle Market Credit LLC, Goldman Sachs MLP Income Opportunities Fund, and Goldman Sachs MLP and Energy Renaissance Fund each consisted of one portfolio; and Goldman Sachs ETF Trust consisted of 19 portfolios (eight of which offered shares to the public). Goldman Sachs Private Middle Market Credit LLC does not offer shares to the public. |
| 4 | | This column includes only directorships of companies required to report to the Securities and Exchange Commission under the Securities Exchange Act of 1934 (i.e., “public companies”) or other investment companies registered under the Act. |
Additional information about the Trustees is available in the Funds’ Statement of Additional Information, which can be obtained from Goldman Sachs free of charge by calling this toll-free number (in the United States of America): 1-800-526-7384 (for shareholders of Class A Shares or Class C Shares) or 1-800-621-2550 (for shareholders of all other share classes of a Fund).
94
GOLDMAN SACHS FUNDS — FINANCIAL SQUARE FUNDS
Trustees and Officers (Unaudited) (continued)
Officers of the Trust*
| | | | | | |
Name, Address and Age1 | | Position(s) Held with the Trust | | Term of
Office and
Length of
Time Served2 | | Principal Occupation(s) During Past 5 Years |
James A. McNamara 200 West Street New York, NY 10282 Age: 54 | | Trustee and President | | Since 2007 | | Managing Director, Goldman Sachs (December 1998-Present); Director of Institutional Fund Sales, GSAM (April 1998-December 2000); and Senior Vice President and Manager, Dreyfus Institutional Service Corporation (January 1993-April 1998). President and Trustee — Goldman Sachs Trust; Goldman Sachs Variable Insurance Trust; Goldman Sachs Trust II; Goldman Sachs MLP Income Opportunities Fund; Goldman Sachs MLP and Energy Renaissance Fund; and Goldman Sachs ETF Trust. |
Caroline L. Kraus 200 West Street New York, NY 10282 Age: 40 | | Secretary | | Since 2012 | | Managing Director, Goldman Sachs (January 2016-Present); Vice President, Goldman Sachs (August 2006-December 2015); Associate General Counsel, Goldman Sachs (2012-Present); Assistant General Counsel, Goldman Sachs (August 2006-December 2011); and Associate, Weil, Gotshal & Manges, LLP (2002-2006). Secretary — Goldman Sachs Trust (previously Assistant Secretary (2012)); Goldman Sachs Variable Insurance Trust (previously Assistant Secretary (2012)); Goldman Sachs Trust II; Goldman Sachs BDC, Inc.; Goldman Sachs Private Middle Market Credit LLC; Goldman Sachs Middle Market Lending Corp.; Goldman Sachs MLP Income Opportunities Fund; Goldman Sachs MLP and Energy Renaissance Fund; and Goldman Sachs ETF Trust. |
Scott M. McHugh 200 West Street New York, NY 10282 Age: 45 | | Treasurer, Senior Vice President and Principal Financial Officer | | Since 2009 (Principal Financial Officer since 2013) | | Managing Director, Goldman Sachs (January 2016-Present); Vice President, Goldman Sachs (February 2007-December 2015); Assistant Treasurer of certain mutual funds administered by DWS Scudder (2005-2007); and Director (2005-2007), Vice President (2000-2005), and Assistant Vice President (1998-2000), Deutsche Asset Management or its predecessor (1998-2007). Treasurer, Senior Vice President and Principal Financial Officer — Goldman Sachs Trust; Goldman Sachs Variable Insurance Trust; Goldman Sachs Trust II; Goldman Sachs MLP Income Opportunities Fund; Goldman Sachs MLP and Energy Renaissance Fund; and Goldman Sachs ETF Trust. |
Joseph F. DiMaria 30 Hudson Street Jersey City, NJ 07302 Age: 49 | | Assistant Treasurer and Principal Accounting Officer | | Since 2016 (Principal Accounting Officer since 2017) | | Managing Director, Goldman Sachs (November 2015-Present) and Vice President — Mutual Fund Administration, Columbia Management Investment Advisers, LLC (May 2010-October 2015). Assistant Treasurer and Principal Accounting Officer — Goldman Sachs Trust; Goldman Sachs Variable Insurance Trust; Goldman Sachs Trust II; Goldman Sachs MLP Income Opportunities Fund; Goldman Sachs MLP and Energy Renaissance Fund; and Goldman Sachs ETF Trust. |
| | | | | | |
| * | | Represents a partial list of officers of the Trust. Additional information about all the officers is available in the Funds’ Statement of Additional Information, which can be obtained from Goldman Sachs free of charge by calling this toll-free number (in the United States): 1-800-526-7384. |
| 1 | | Information is provided as of August 31, 2017. |
| 2 | | Officers hold office at the pleasure of the Board of Trustees or until their successors are duly elected and qualified. Each officer holds comparable positions with certain other companies of which Goldman Sachs, GSAM or an affiliate thereof is the investment adviser, administrator and/or distributor. |
95
GOLDMAN SACHS FUNDS — FINANCIAL SQUARE FUNDS
Goldman Sachs Funds — Financial Square Funds — Tax Information (Unaudited)
During the year ended August 31, 2017, 99.96% of the distributions from net investment income paid by the Financial Square Tax-Exempt Money Market Fund were exempt-interest dividends and as such, are not subject to U.S. federal income tax.
During the year ended August 31, 2017, 100%, 100%, 58.83%, 100%, 100%, 100%, and 55.67% of the net investment company taxable income distributions paid by the Financial Square Federal Instruments, Financial Square Government, Financial Square Prime Obligations, Financial Square Treasury Instruments, Financial Square Treasury Obligations, Financial Square Treasury Solutions, and Financial Square Money Market Funds were designated as either interest-related dividends or short-term capital gain dividends pursuant to Section 871(k) of the Internal Revenue Code.
96
FUNDS PROFILE
Goldman Sachs Funds
Goldman Sachs is a premier financial services firm, known since 1869 for creating thoughtful and customized investment solutions in complex global markets.
Today, the Investment Management Division of Goldman Sachs serves a diverse set of clients worldwide, including private institutions, public entities and individuals. With approximately $1.21 trillion in assets under supervision as of June 30, 2017, Goldman Sachs Asset Management (“GSAM”) has portfolio management teams located around the world and our investment professionals bring firsthand knowledge of local markets to every investment decision. Assets under supervision includes assets under management and other client assets for which Goldman Sachs does not have full discretion. GSAM leverages the resources of Goldman Sachs & Co. LLC subject to legal, internal and regulatory restrictions.
Money Market
Financial Square FundsSM
| ∎ | | Financial Square Treasury Solutions Fund1 |
| ∎ | | Financial Square Government Fund1 |
| ∎ | | Financial Square Money Market Fund2 |
| ∎ | | Financial Square Prime Obligations Fund2 |
| ∎ | | Financial Square Treasury Instruments Fund1 |
| ∎ | | Financial Square Treasury Obligations Fund1 |
| ∎ | | Financial Square Federal Instruments Fund1 |
| ∎ | | Financial Square Tax-Exempt Money Market Fund2 |
Investor FundsSM
| ∎ | | Investor Money Market Fund3 |
| ∎ | | Investor Tax-Exempt Money Market Fund3 |
Fixed Income
Short Duration and Government
| ∎ | | High Quality Floating Rate Fund |
| ∎ | | Short-Term Conservative Income Fund |
| ∎ | | Short Duration Government Fund |
| ∎ | | Short Duration Income Fund |
| ∎ | | Inflation Protected Securities Fund |
Multi-Sector
Municipal and Tax-Free
| ∎ | | High Yield Municipal Fund |
| ∎ | | Dynamic Municipal Income Fund |
| ∎ | | Short Duration Tax-Free Fund |
Single Sector
| ∎ | | Investment Grade Credit Fund |
| ∎ | | High Yield Floating Rate Fund |
| ∎ | | Emerging Markets Debt Fund |
| ∎ | | Local Emerging Markets Debt Fund |
| ∎ | | Dynamic Emerging Markets Debt Fund |
Fixed Income Alternatives
| ∎ | | Long Short Credit Strategies Fund |
Fundamental Equity
| ∎ | | Small/Mid Cap Value Fund |
| ∎ | | Small/Mid Cap Growth Fund |
| ∎ | | Concentrated Growth Fund7 |
| ∎ | | Technology Opportunities Fund |
| ∎ | | Growth Opportunities Fund |
| ∎ | | Rising Dividend Growth Fund |
Tax-Advantaged Equity
| ∎ | | U.S. Tax-Managed Equity Fund |
| ∎ | | International Tax-Managed Equity Fund |
| ∎ | | U.S. Equity Dividend and Premium Fund |
| ∎ | | International Equity Dividend and Premium Fund |
Equity Insights
| ∎ | | Small Cap Equity Insights Fund |
| ∎ | | U.S. Equity Insights Fund |
| ∎ | | Small Cap Growth Insights Fund |
| ∎ | | Large Cap Growth Insights Fund |
| ∎ | | Large Cap Value Insights Fund |
| ∎ | | Small Cap Value Insights Fund |
| ∎ | | International Small Cap Insights Fund |
| ∎ | | International Equity Insights Fund |
| ∎ | | Emerging Markets Equity Insights Fund |
Fundamental Equity International
| ∎ | | Strategic International Equity Fund |
| ∎ | | Focused International Equity Fund |
| ∎ | | Emerging Markets Equity Fund |
Select Satellite
| ∎ | | Real Estate Securities Fund |
| ∎ | | International Real Estate Securities Fund |
| ∎ | | Commodity Strategy Fund |
| ∎ | | Global Real Estate Securities Fund |
| ∎ | | Alternative Premia Fund9 |
| ∎ | | Absolute Return Tracker Fund |
| ∎ | | Managed Futures Strategy Fund |
| ∎ | | MLP Energy Infrastructure Fund |
| ∎ | | Multi-Manager Alternatives Fund |
| ∎ | | Absolute Return Multi-Asset Fund |
| ∎ | | Global Infrastructure Fund |
Total Portfolio Solutions
| ∎ | | Global Managed Beta Fund |
| ∎ | | Multi-Manager Non-Core Fixed Income Fund |
| ∎ | | Multi-Manager U.S. Dynamic Equity Fund |
| ∎ | | Multi-Manager Global Equity Fund |
| ∎ | | Multi-Manager International Equity Fund |
| ∎ | | Tactical Tilt Overlay Fund |
| ∎ | | Balanced Strategy Portfolio |
| ∎ | | Multi-Manager U.S. Small Cap Equity Fund |
| ∎ | | Multi-Manager Real Assets Strategy Fund |
| ∎ | | Growth and Income Strategy Portfolio |
| ∎ | | Growth Strategy Portfolio |
| ∎ | | Equity Growth Strategy Portfolio |
| ∎ | | Satellite Strategies Portfolio |
| ∎ | | Enhanced Dividend Global Equity Portfolio |
| ∎ | | Tax-Advantaged Global Equity Portfolio |
| ∎ | | Strategic Factor Allocation Fund |
| ∎ | | Target Date 2020 Portfolio |
| ∎ | | Target Date 2025 Portfolio |
| ∎ | | Target Date 2030 Portfolio |
| ∎ | | Target Date 2035 Portfolio |
| ∎ | | Target Date 2040 Portfolio |
| ∎ | | Target Date 2045 Portfolio |
| ∎ | | Target Date 2050 Portfolio |
| ∎ | | Target Date 2055 Portfolio |
| ∎ | | GQG Partners International Opportunities Fund |
| 1 | | You could lose money by investing in the Fund. Although the Fund seeks to preserve the value of your investment at $1.00 per share, it cannot guarantee it will do so. An investment in the Fund is not a deposit of a bank and is not insured or guaranteed by the Federal Deposit Insurance Corporation or any other government agency. The Fund’s sponsor has no legal obligation to provide financial support to the Fund, and you should not expect that the sponsor will provide financial support to the Fund at any time. |
| 2 | | You could lose money by investing in the Fund. Because the share price of the Fund will fluctuate, when you sell your shares they may be worth more or less than what you originally paid for them. The Fund may impose a fee upon sale of your shares or may temporarily suspend your ability to sell shares if the Fund’s liquidity falls below required minimums because of market conditions or other factors. An investment in the Fund is not a deposit of a bank and is not insured or guaranteed by the Federal Deposit Insurance Corporation or any other government agency. The Fund’s sponsor has no legal obligation to provide financial support to the Fund, and you should not expect that the sponsor will provide financial support to the Fund at any time. |
| 3 | | You could lose money by investing in the Fund. Although the Fund seeks to preserve the value of your investment at $1.00 per share, it cannot guarantee it will do so. The Fund may impose a fee upon sale of your shares or may temporarily suspend your ability to sell shares if the Fund’s liquidity falls below required minimums because of market conditions or other factors. An investment in the Fund is not a deposit of a bank and is not insured or guaranteed by the Federal Deposit Insurance Corporation or any other government agency. The Fund’s sponsor has no legal obligation to provide financial support to the Fund, and you should not expect that the sponsor will provide financial support to the Fund at any time. |
| 4 | | Effective on June 20, 2017, the Goldman Sachs Fixed Income Macro Strategies Fund was renamed the Goldman Sachs Strategic Macro Fund. |
| 5 | | Effective on June 20, 2017, the Goldman Sachs Growth and Income Fund was renamed the Goldman Sachs Equity Income Fund. |
| 6 | | Effective after the close of business on August 31, 2017, the Goldman Sachs Flexible Cap Growth Fund was renamed the Goldman Sachs Flexible Cap Fund. |
| 7 | | Effective on July 28, 2017, the Goldman Sachs Focused Growth Fund was reorganized with and into the Goldman Sachs Concentrated Growth Fund. |
| 8 | | Effective after the close of business on October 31, 2017, the Goldman Sachs Dynamic U.S. Equity Fund was renamed the Goldman Sachs Blue Chip Fund. |
| 9 | | Effective after the close of business on October 30, 2017, the Goldman Sachs Dynamic Allocation Fund was renamed the Goldman Sachs Alternative Premia Fund. Financial Square FundsSM and Investor FundsSM are registered service marks of Goldman Sachs & Co. LLC. |
| * | | This list covers open-end funds only. Please visit our website at www.GSAMFUNDS.com to learn about our closed-end funds and exchange-traded funds. |
| | |
TRUSTEES Ashok N. Bakhru, Chairman Kathryn A. Cassidy Diana M. Daniels Herbert J. Markley James A. McNamara Jessica Palmer Roy W. Templin Gregory G. Weaver | | OFFICERS James A. McNamara, President Scott M. McHugh, Treasurer, Senior Vice President and Principal Financial Officer Joseph F. DiMaria, Assistant Treasurer and Principal Accounting Officer Caroline L. Kraus, Secretary |
| |
| |
| |
| |
| |
| |
| |
| |
| |
GOLDMAN SACHS & CO. LLC Distributor and Transfer Agent | | GOLDMAN SACHS ASSET MANAGEMENT, L.P. Investment Adviser |
Visit our web site at www.GSAMFUNDS.com to obtain the most recent month-end returns.
Goldman Sachs Asset Management, L.P., 200 West Street, New York, New York 10282
Economic and market forecasts presented herein reflect our judgment as of the date of this presentation and are subject to change without notice. These forecasts do not take into account the specific investment objectives, restrictions, tax and financial situation or other needs of any specific client. Actual data will vary and may not be reflected here. These forecasts are subject to high levels of uncertainty that may affect actual performance. Accordingly, these forecasts should be viewed as merely representative of a broad range of possible outcomes. These forecasts are estimated, based on assumptions, and are subject to significant revision and may change materially as economic and market conditions change. Goldman Sachs has no obligation to provide updates or changes to these forecasts. Case studies and examples are for illustrative purposes only.
The portfolio risk management process includes an effort to monitor and manage risk, but does not imply low risk The reports concerning the Funds included in this shareholder report may contain certain forward-looking statements about the factors that may affect the performance of the Funds in the future. These statements are based on Fund management’s predictions and expectations concerning certain future events and their expected impact on the Funds, such as performance of the economy as a whole and of specific industry sectors, changes in the levels of interest rates, the impact of developing world events, and other factors that may influence the future performance of the Funds. Management believes these forward-looking statements to be reasonable, although they are inherently uncertain and difficult to predict. Actual events may cause adjustments in portfolio management strategies from those currently expected to be employed.
A description of the policies and procedures that the Funds use to determine how to vote proxies relating to portfolio securities and information regarding how a Fund voted proxies relating to portfolio securities during the most recent 12-month period ended June 30 is available (i) without charge, upon request by calling 1-800-526-7384 (for shareholders of Class A Shares or Class C Shares) or 1-800-621-2550 (for shareholders of all other share classes of a Fund); and (ii) on the Securities and Exchange Commission (“SEC”) web site at http://www.sec.gov.
The Funds file their complete schedule of portfolio holdings with the SEC for the first and third quarters of each fiscal year on Form N-Qs. The Funds’ Form N-Qs are available on the SEC’s web site at http://www.sec.gov within 60 days after the Funds’ first and third fiscal quarters. The Funds’ Form N-Qs may be reviewed and copied at the SEC’s Public Reference Room in Washington, D.C. and information on the operation of the Public Reference Room may also be obtained by calling 1-800-SEC-0330. Form N-Qs may be obtained upon request and without charge by calling 1-800-526-7384 (for shareholders of Class A Shares or Class C Shares) or 1-800-621-2550 (for shareholders of all other share classes of a Fund).
Goldman Sachs & Co. LLC (‘‘Goldman Sachs’’) does not provide legal, tax or accounting advice. Any statement contained in this communication (including any attachments) concerning U.S. tax matters was not intended or written to be used, and cannot be used, for the purpose of avoiding penalties under the Internal Revenue Code, and was written to support the promotion or marketing of the transaction(s) or matter(s) addressed. Clients of Goldman Sachs should obtain their own independent tax advice based on their particular circumstances.
Fund holdings and allocations shown are as of August 31, 2017 and may not be representative of future investments. Fund holdings should not be relied on in making investment decisions and should not be construed as research or investment advice regarding particular securities. Current and future holdings are subject to risk.
Financial Square FundsSM is a registered service mark of Goldman Sachs & Co. LLC.
THIS MATERIAL IS FOR INFORMATIONAL PURPOSES ONLY AND IS PROVIDED SOLELY ON THE BASIS THAT IT WILL NOT CONSTITUTE INVESTMENT OR OTHER ADVICE OR A RECOMMENDATION RELATING TO ANY PERSON’S OR PLAN’S INVESTMENT OR OTHER DECISIONS, AND GOLDMAN SACHS IS NOT A FIDUCIARY OR ADVISOR WITH RESPECT TO ANY PERSON OR PLAN BY REASON OF PROVIDING THE MATERIAL OR CONTENT HEREIN INCLUDING UNDER THE EMPLOYEE RETIREMENT INCOME SECURITY ACT OF 1974 OR DEPARTMENT OF LABOR REGULATIONS. PLAN SPONSORS AND OTHER FIDUCIARIES SHOULD CONSIDER THEIR OWN CIRCUMSTANCES IN ASSESSING ANY POTENTIAL COURSE OF ACTION.
This material is not authorized for distribution to prospective investors unless preceded or accompanied by a current Prospectus or summary prospectus, if applicable. Investors should consider a Fund’s objective, risks, and charges and expenses, and read the summary prospectus, if available, and/or the Prospectus carefully before investing or sending money. The summary prospectus, if available, and the Prospectus contain this and other information about a Fund and may be obtained from your Intermediary or from Goldman Sachs by calling (Class A Shares or Class C Shares – 1-800-526-7384) (all other share classes – 1-800-621-2550).
© 2017 Goldman Sachs. All rights reserved. 107105-TMPL-10/2017-630987 FSQAR-17/78k
Goldman Sachs Funds

| | | | |
| | |
| Annual Report | | | | August 31, 2017 |
| | |
| | | | Fundamental Equity Growth Funds |
| | | | Capital Growth |
| | | | Concentrated Growth |
| | | | Dynamic U.S. Equity |
| | | | Flexible Cap* |
| | | | Growth Opportunities |
| | | | Small/Mid Cap Growth |
| | | | Strategic Growth |
| | | | Technology Opportunities |
*Effective after the close of business on August 31, 2017, the Goldman Sachs Flexible Cap Growth Fund was renamed the Goldman Sachs Flexible Cap Fund.

Goldman Sachs Fundamental Equity Growth Funds
| ∎ | | TECHNOLOGY OPPORTUNITIES |
| | | | |
| | | |
| NOT FDIC-INSURED | | May Lose Value | | No Bank Guarantee |
GOLDMAN SACHS FUNDAMENTAL EQUITY GROWTH FUNDS
What Differentiates the Goldman Sachs Growth Team’s Investment Process?
For over 30 years, the Goldman Sachs Growth Team has consistently applied a three-step investment process based on our belief that wealth is created through the long-term ownership of growing businesses.


| ∎ | | Make decisions as long-term business owners rather than as stock traders |
| ∎ | | Perform in-depth, fundamental research |
| ∎ | | Focus on long-term structural and competitive advantages |
Result
Performance driven by the compounding growth of businesses over time — not short-term market movements
Long-term participation in growing businesses — less reliance on macroeconomic predictions, market timing, sector rotation or momentum

Identify high quality growth businesses. Some required investment criteria include:
| ∎ | | Established brand names |
| ∎ | | Recurring revenue streams |
| ∎ | | Long product life cycles |
| ∎ | | Favorable long-term growth prospects |
Result
Investments in businesses that we believe are strategically positioned for consistent, sustainable long-term growth

| ∎ | | Perform rigorous valuation analysis of every potential investment |
| ∎ | | Use valuation tools and analytics to ensure that the high-quality business franchises we have identified also represent sound investments |
Result
Good investment decisions based on solid understanding of what each business is worth
Attractive buying opportunities as the stock prices of quality growth businesses fluctuate over time
1
MARKET REVIEW
Goldman Sachs Fundamental Equity Growth Funds
Market Review
Overall, U.S. equities rallied during the 12 months ended August 31, 2017 (the “Reporting Period”), despite unexpected political events both domestically and abroad and three Federal Reserve (“Fed”) interest rate hikes. The Standard & Poor’s 500® Index (the “S&P 500 Index”) ended the Reporting Period with a gain of 16.23%. The Russell 3000® Index generated a return of 16.06%.
As the Reporting Period began in early September 2016, U.S. and international equities alike fell as the European Central Bank disappointed markets with its lack of commitment to extend quantitative easing. However, there was a subsequent rebound following the Fed’s decision in September 2016 to leave interest rates unchanged. In October 2016, a combination of hawkish Fed commentary and mounting strong U.S. economic data led to increased market pricing for a December 2016 interest rate hike. (Hawkish commentary tends to suggest higher interest rates; opposite of dovish.) U.S. GDP increased by 3.5% on an annualized basis for the third quarter of 2016, above consensus expectations and the strongest growth rate in two years. Following the unexpected results of the November 2016 U.S. presidential elections, U.S. equities quickly reversed a short-lived sell-off and surged on anticipation of a pro-growth effect of the incoming Administration’s fiscal stimulus plan. The Fed raised rates 0.25% in December 2016, for the first time in a year but as had largely been anticipated, and set a more hawkish hike path for 2017, causing equities to decline, albeit modestly, following the announcement.
U.S. equities rallied significantly in the first two months of 2017 before declining in March. In January 2017, markets rallied to new highs on the prospect of deregulation following executive orders on oil pipelines and on optimism around infrastructure spending after a $1 trillion proposal from Senate Democrats. Despite political uncertainty and protectionism concerns, U.S. equities continued to rally in February 2017 driven by risk-on sentiment owing to potential U.S. tax reform and deregulation as well as by stronger economic data. (Risk-on sentiment refers to an investment setting in which price behavior responds to and is driven by changes in investor risk tolerance. During periods when risk is perceived as low, risk-on sentiment indicates investors tend to engage in higher-risk investments; when risk is perceived as high, investors have the tendency to gravitate toward lower-risk investments.) In March 2017, the Fed raised interest rates for the third time since the 2007-2009 global financial crisis and maintained projections for three additional interest rate increases before the end of 2017. However, a seemingly cautious stance on the future path of monetary tightening from Fed Chair Janet Yellen and the presence of a dissenter on the Fed committee led to a dovish market reaction. Political risks subsequently drove U.S. equities lower in the wake of House Republicans’ struggle to schedule a vote on health care.
U.S. equities declined in April 2017, as Fed minutes suggested stocks were overvalued, but then rebounded on strong first quarter 2017 earnings reports and receding European political risk following the French presidential election. Although the labor market remained strong, economic activity and inflation data appeared to be moderating during the second quarter of 2017. Core inflation softened to 1.7% year-over-year in May 2017, marking a third consecutive month of weakness, while core personal consumption expenditure (“PCE”) remained below the Fed’s 2% target at just 1.4% year over year. In addition, market expectations for pro-growth U.S. fiscal policy were dampened by domestic political developments. Nonetheless, the Fed proceeded to raise the federal funds rate by 0.25% in June 2017, citing ongoing strength in the labor market and a pickup in household spending and business fixed investment. (A basis point is 1/100th of a percentage point.) The results of the
2
MARKET REVIEW
Fed’s 2017 Comprehensive Capital Analysis and Review (“CCAR”) stress test for banks were encouraging, with improving payout ratios.
U.S. equities gained in July 2017. The Institute for Supply Management (“ISM”) manufacturing index rose in June 2017 to 57.8, the highest level in nearly three years. However, inflation dynamics remained weaker. The core consumer price index (“CPI”) was still soft in June 2017, rising 1.7% year over year and 0.1% month over month. Fed Chair Yellen’s assessment during her Congressional testimony that the federal funds rate was close to its neutral policy rate was interpreted dovishly by markets. The Fed kept its monetary policy unchanged in July 2017, as had been widely expected. The Fed’s statement included an upgrade to its assessment of job growth as well as an acknowledgment that inflation was “below” target. This compares with its prior view, which noted inflation was “somewhat below” its 2% target, a shift that resulted in a mildly dovish market reaction. The Fed also stated it expected its balance sheet normalization to begin “relatively soon.” (Balance sheet normalization refers to the steps the Fed will take to reverse quantitative easing and remove the substantial monetary accommodation it has provided to the economy since the financial crisis began in 2007.)
U.S. equities were roughly flat in August 2017. U.S. economic activity continued to be strong, with several surveys on consumer sentiment and manufacturing surprising positively. This remained in contrast to subdued inflation, which surprised to the downside for the fifth consecutive month in July 2017, albeit largely due to idiosyncratic factors. The Fed’s minutes suggested increased concerns on inflation, highlighting that “many participants” saw “some likelihood that inflation may remain below 2 percent for longer than expected.” Hurricane Harvey caused extensive flooding and damages in Texas and Louisiana and significantly impacted refinery operations, resulting in a surge in gasoline prices.
For the Reporting Period overall, information technology and financials were the best performing sectors in the S&P 500 Index by a wide margin. The weakest performing sectors in the S&P 500 Index were energy and telecommunication services, the only two to post a negative absolute return, followed by consumer staples and real estate, which were comparatively weak but generated positive returns during the Reporting Period.
Within the U.S. equity market, all capitalization segments posted positive returns, but large-cap stocks, as measured by the Russell 1000® Index, performed best, followed by small-cap stocks, as measured by the Russell 2000® Index, and then mid-cap stocks, as measured by the Russell Midcap® Index. From a style perspective, growth-oriented stocks significantly outpaced value-oriented stocks across the capitalization spectrum. (All as measured by the FTSE Russell indices.)
Looking Ahead
At the end of the Reporting Period, we maintained a positive view ahead for U.S. and global equities based on consensus economic and earnings growth expectations. Global economic growth and earnings forecasts were trending upward in all major regions for the first time since 2010. The U.S. economy offered the strongest growth amongst the developed countries, and there is significant investor and business optimism about potential pro-growth policies that we feel could support further economic and earnings growth. However, we believe this positive sentiment was already reflected in elevated equity valuations and U.S. equities reaching all-time highs toward the end of the Reporting Period.
3
MARKET REVIEW
Further, while we remained positive on U.S. equities at the end of the Reporting Period, we also recognized that legislative challenges could moderate the pace of policy change and economic growth. We believe optimism needs to convert to confidence to turn sentiment into action, potentially generating real business activity and maintaining investor enthusiasm. We think deregulation and tax reform would be critical components of this transition. Regulatory reform, we feel, is easier to enact because it can largely be accomplished with executive orders. Tax reform may be more challenging, but we think it is key to reviving confidence. Signs we will be watching to gauge whether the conversion to confidence is successful include rising corporate investment and earnings growth meeting or exceeding market expectations. We believe political uncertainty remains a risk to this transition process. We think the difficulties around passing health care reform have increased the risks around the current Administration’s ability to execute on other elements of its pro-growth agenda.
That said, regardless of market direction, our fundamental, bottom-up stock selection continues to drive our process, rather than headlines or sentiment. We maintain high conviction in the companies the Funds own and believe they have the potential to outperform relative to the broader market regardless of economic growth conditions. As always, we maintain our focus on seeking companies that we believe will generate long-term growth in today’s ever-changing market conditions.
4
MARKET REVIEW
|
| |
| Changes to the Funds’ Portfolio Management Team during the Reporting Period |
| |
In July 2017, Michael DeSantis was named co-lead portfolio manager on the Goldman Sachs Small/Mid Cap Growth Fund alongside Steve Barry and Dan Zimmerman. Michael is a Vice President on the Team and is being recognized for his meaningful contributions to our shareholders’ portfolios since he joined the Team in 2011. Michael will continue his research coverage within the technology sector and will also continue his co-lead portfolio manager role on the Goldman Sachs Technology Opportunities Fund. The Goldman Sachs Growth Equity Investment Team consists of 17 investment professionals, averaging 16 years of industry experience. The team continues to be led by Steve Barry, Chief Investment Officer and Head of Fundamental Equity. Steve has more than 30 years of investment experience and has been with the team since 1999. |
5
PORTFOLIO RESULTS
Goldman Sachs Capital Growth Fund
Portfolio Composition
The Fund invests primarily in U.S. equity investments. Since the Fund’s inception, the Goldman Sachs Growth Equity Investment Team has focused on several key investment criteria that it believes can drive a company’s growth over the long term. These characteristics are: dominant market share, established brand name, pricing power, recurring revenue stream, free cash flow, high returns on invested capital, predictable growth, sustainable growth, long product life cycle, enduring competitive advantage, favorable demographic trends and excellent management. The Team strives to purchase these companies at reasonable valuations in order to capture the full benefits of their growth.
Portfolio Management Discussion and Analysis
Below, the Goldman Sachs Growth Equity Investment Team discusses the Goldman Sachs Capital Growth Fund’s (the “Fund”) performance and positioning for the 12-month period ended August 31, 2017 (the “Reporting Period”).
| Q | | How did the Fund perform during the Reporting Period? |
| A | | During the Reporting Period, the Fund’s Class A, C, Institutional, Service, Investor, R and R6 Shares generated average annual total returns, without sales charges, of 21.47%, 20.59%, 21.96%, 21.36%, 21.77%, 21.19% and 21.99%, respectively. These returns compare to the 20.82% average annual total return of the Fund’s benchmark, the Russell 1000® Growth Index (with dividends reinvested) (the “Russell Index”), during the same period. |
| Q | | What key factors were responsible for the Fund’s performance during the Reporting Period? |
| A | | The Fund outperformed the Russell Index during the Reporting Period due primarily to effective stock selection. Sector allocation as a whole also contributed positively, albeit more modestly. |
| Q | | Which equity market sectors most significantly affected Fund performance? |
| A | | The sectors that contributed most positively to the Fund’s relative performance during the Reporting Period were industrials, real estate and consumer staples, wherein effective stock selection drove results. The only two sectors to detract from the Fund’s relative results during the Reporting Period were financials and materials, wherein stock selection was weak. |
| Q | | What were some of the Fund’s best-performing individual stocks? |
| A | | Among those stocks the Fund benefited most from relative to the Russell Index were positions in aerospace and defense company Boeing, payments company MasterCard and information technology giant Apple. |
| | In October 2016, Boeing reported earnings that beat market expectations on sales and earnings per share and also raised its full year guidance on earnings. Also, the company reiterated its expectation about increasing sales, margins, earnings per share and free cash flow through the end of the decade. Boeing’s stock price continued to rise after the company beat market earnings per share estimates and raised guidance in April 2017. Its stock price rallied further in late July 2017 after the company announced better than market expected earnings and free cash flow. At the end of the Reporting Period, we were optimistic about what we view as the company’s strong productivity track record, multi-year commercial aircraft backlog and improving prospects in its defense business. Overall, we believe in Boeing because, in our opinion, it has maintained a strong competitive position, robust free cash flow and focus on shareholders through buybacks and distributions. |
| | Much of the increase in MasterCard’s share price was not driven, we believe, by stock-specific factors but rather by strong performance in the information technology sector and among payment companies in general. MasterCard’s stock did react positively after the company announced first and second quarter 2017 earnings in which revenues and earnings outpaced market expectations. This strong performance was explained by the company to be caused by higher processed transactions and robust cross-border volume. At the end of |
6
PORTFOLIO RESULTS
| | the Reporting Period, we were optimistic on the company’s ability to grow its core payments business through new client wins as well as through further differentiation of the company by expanding to new growth areas such as consumer credit and peer-to-peer lending. We were also positive about operating trends and MasterCard’s ongoing focus on diversification and fee-based revenue stream, which we believe position the company well relative to competitors. |
| | Apple reported strong fiscal first quarter results at the beginning of February 2017 that beat market expectations on both revenue and earnings per share, driven by better than market expected iPhone sales. This report caused Apple’s stock price to jump. The company then announced results at the beginning of May 2017 that were broadly in line with market estimates on most metrics and guidance. In August 2017, the company reported solid earnings ahead of the highly anticipated release of its new iPhone. Apple’s positive performance was led by strong iPad and services revenue growth. At the end of the Reporting Period, we continued to see what we believe are a number of strong growth catalysts for Apple, including solid iPhone demand and ongoing product innovation and development. Apple also has continued to deliver strong services growth, which, in our view, is important as this decreases transactional volatility tied to product cycles. Further, we remained optimistic on Apple’s significant installed base, experienced management and established brand name. |
| Q | | Which stocks detracted significantly from the Fund’s performance during the Reporting Period? |
| A | | Among those stocks detracting most from the Fund’s results relative to the Russell Index were positions in automotive aftermarket parts retailer O’Reilly Automotive, beer producer and seller Molson Coors Brewing and consumer products retailer Newell Brands. |
| | Through most of the Reporting Period, O’Reilly Automotive’s stock price had been weak based largely on a combination of concerns about increased competition within the auto parts industry and weaker than market expected margins. In late April 2017, the company’s stock price declined when the company announced an earnings per share miss. In early July 2017, the company preannounced weak sales comparisons, missing both its guidance and analysts’ estimates, causing its share price to fall further. O’Reilly Automotive’s management explained the disappointing results as being caused by mild winter weather and weaker consumer demand. We decided to exit the Fund’s position to allocate capital in companies in which we had higher conviction. |
| | Molson Coors Brewing’s share price declined following the U.S. elections in November 2016 and in early 2017 due to widespread concerns around slowing beer industry volumes. In February 2017, the company reported better than market expected earnings, but softer scanner data through March 2017 continued to weigh on its shares. (Scanner data is retail purchase information (such as price, brand, product size, amount purchased) gathered at the point of purchase by an electronic device that reads a coded ticket on the product through the use of an electronic reader over which the product passes.) The company’s share price declined further in June 2017 following an investor meeting during which its management announced a downward revision to its margin guidance. At the end of the Reporting Period, we expected the recent Miller Lite deal to unlock greater cost and revenue synergy opportunities than the market originally expected, which could potentially drive significant margin expansion over time. (On October 11, 2016, SABMiller sold its stake in MillerCoors for around $12 billion after the company was acquired by Anheuser-Busch InBev, making Molson Coors the 100% owner of MillerCoors. In effect, MillerCoors became the U.S. business unit of Molson Coors. In Canada, Molson Coors regained the right (from SABMiller) to make and market Miller Genuine Draft and Miller Lite.) Additionally, we believed further consolidation within the industry could have potentially positive implications for Molson Coors Brewing. |
| | In late 2016, Newell Brands reported third quarter 2016 results that were below market expectations, causing its share price to decline. There was short-term concern that sales momentum may slow in the coming quarters due to ongoing integration work. During May 2017, the company’s stock rallied after it reported strong first quarter 2017 results led by better than market expected core sales growth. Newell Brands also reported earnings per share that exceeded market estimates while raising guidance. This was well received by investors as many of the company’s peers had reported disappointing earnings around the same time. The company’s share price, however, then sharply declined in early August 2017 following a disappointing earnings release in which organic sales were below consensus estimates. Investors reacted negatively to this, as the consumer sector has been |
7
PORTFOLIO RESULTS
| | challenged in 2017 year to date through the end of August. Despite its underperformance, we continued to like the business and believed, at the end of the Reporting Period, that Newell Brands potentially represents a multi-year, double-digit earnings growth story. In our view, the company’s acquisition of Jarden, a similar holding company of consumer durable goods, could potentially yield meaningful synergies and earnings flexibility. Overall, we believed at the end of the Reporting Period that Newell Brands has a strong management team with a demonstrated track record of delivering shareholder value through both organic growth and acquisitions. |
| Q | | How did the Fund use derivatives and similar instruments during the Reporting Period? |
| A | | During the Reporting Period, we did not use derivatives as part of an active management strategy. |
| Q | | Did the Fund make any significant purchases or sales during the Reporting Period? |
| A | | During the Reporting Period, we initiated a Fund position in Edwards Lifesciences. The company is a leading innovator in technologies that treat structural heart diseases, an area of largely unmet need. One of its key innovations is transcatheter aortic valve replacement (“TAVR”), which is a minimally invasive procedure to replace heart valves. We believe the TAVR market opportunity remains compelling at the company’s valuation at the time of purchase. We also believe TAVR is in the early stages in terms of penetration and adoption. In our view, the company has substantial upside potential should it take share away from open heart surgery and expand the market over the coming years as we anticipate. |
| | We established a Fund position in biopharmaceutical company Amgen during the Reporting Period. The company, which operates in the areas of oncology and bone, inflammatory and cardiovascular diseases, is one of the leaders in the biotechnology industry, and we are positive on its ability to continue to grow market share. We further believe that with its new product cycles and existing growth franchises, the company should be able to offset any potential declines in its legacy business while continuing to grow both revenue and earnings. In our view, Amgen has robust free cash flow, a strong balance sheet and, we believe, was trading at an attractive valuation relative to its peers at the end of the Reporting Period. |
| | Conversely, in addition to the sale of O’Reilly Automotive, mentioned earlier, we exited the Fund’s position in tobacco company Reynolds American during the Reporting Period. The company saw its stock price spike in October 2016 as news broke that British American Tobacco, which already owned 42% of Reynolds American, made a proposal to acquire the remaining 58% of the company at a premium. Following this development, we felt the risk/reward balance was less compelling and decided to sell the position. |
| | We eliminated the Fund’s position in McCormick & Company, a manufacturer of spices, seasoning mixes and condiments. Its stock had been a strong performer for the Fund in the first half of 2016. However, the company’s premium valuation and more conventional consumer staples characteristics left it vulnerable amidst a cyclical market rotation, in our view. Consequently, we decided to exit the position. |
| Q | | Were there any notable changes in the Fund’s weightings during the Reporting Period? |
| A | | In constructing the Fund’s portfolio, we focus on picking stocks rather than on making industry or sector bets. We seek to outpace the benchmark index by overweighting stocks that we expect to outperform and underweighting those that we think may lag. Consequently, changes in its sector weights are generally the direct result of individual stock selection or of stock appreciation or depreciation. That said, during the Reporting Period, relative to the Russell Index, the Fund’s allocation in health care increased modestly and its exposure to materials decreased modestly. |
| Q | | How was the Fund positioned relative to its benchmark index at the end of August 2017? |
| A | | At the end of August 2017, the Fund had an overweighted position relative to the Russell Index in the consumer staples sector. On the same date, the Fund was rather neutrally weighted to the Russell Index in consumer discretionary, financials, energy, health care, industrials, information technology, materials and real estate and had no positions in utilities or telecommunication services at the end of the Reporting Period. |
8
FUND BASICS
Capital Growth Fund
as of August 31, 2017
| | | | | | | | | | |
| | PERFORMANCE REVIEW | |
| | | September 1, 2016–August 31, 2017 | | Fund Total Return
(based on NAV)1 | | | Russell 1000®
Growth Index2 | |
| | Class A | | | 21.47 | % | | | 20.82 | % |
| | Class C | | | 20.59 | | | | 20.82 | |
| | Institutional | | | 21.96 | | | | 20.82 | |
| | Service | | | 21.36 | | | | 20.82 | |
| | Investor | | | 21.77 | | | | 20.82 | |
| | Class R | | | 21.19 | | | | 20.82 | |
| | | Class R6 | | | 21.99 | | | | 20.82 | |
| | 1 | | The net asset value (“NAV”) represents the net assets of the class of the Fund (ex-dividend) divided by the total number of shares of the class outstanding. The Fund’s performance reflects the reinvestment of dividends and other distributions. The Fund’s performance does not reflect the deduction of any applicable sales charges. |
| | 2 | | The Russell 1000® Growth Index is an unmanaged index that measures the performance of those Russell 1000® companies with higher price-to-book ratios and higher forecasted growth values. The Index figures do not reflect any deduction for fees, expenses or taxes. It is not possible to invest directly in an index. |
| | | | | | | | | | | | | | | | | | | | |
| | STANDARDIZED TOTAL RETURNS3 |
| | | For the period ended 6/30/17 | | One Year | | | Five Years | | | Ten Years | | | Since Inception | | | Inception Date |
| | Class A | | | 14.52 | % | | | 12.88% | | | | 6.73% | | | | 9.24% | | | 4/20/90 |
| | Class C | | | 19.27 | | | | 13.30 | | | | 6.54 | | | | 5.69 | | | 8/15/97 |
| | Institutional | | | 21.65 | | | | 14.61 | | | | 7.77 | | | | 6.90 | | | 8/15/97 |
| | Service | | | 21.01 | | | | 14.04 | | | | 7.23 | | | | 6.38 | | | 8/15/97 |
| | Investor | | | 21.44 | | | | 14.44 | | | | N/A | | | | 7.84 | | | 11/30/07 |
| | Class R | | | 20.83 | | | | 13.88 | | | | N/A | | | | 7.30 | | | 11/30/07 |
| | | Class R6 | | | 21.63 | | | | N/A | | | | N/A | | | | 7.77 | | | 7/31/15 |
| | 3 | | The Standardized Total Returns are average annual total returns or cumulative total returns (only if the performance period is one year or less) as of the most recent calendar quarter-end. They assume reinvestment of all distributions at NAV. These returns reflect a maximum initial sales charge of 5.5% for Class A Shares and the assumed contingent deferred sales charge for Class C Shares (1% if redeemed within 12 months of purchase). Because Institutional, Service, Investor, Class R, and Class R6 Shares do not involve a sales charge, such a charge is not applied to their Standardized Total Returns. |
The returns set forth in the tables above represent past performance. Past performance does not guarantee future results. The Fund’s investment return and principal value will fluctuate so that an investor’s shares, when redeemed, may be worth more or less than their original cost. Current performance may be lower or higher than the performance quoted above. Please visit our web site at www.GSAMFUNDS.com to obtain the most recent month-end returns. Performance reflects applicable fee waivers and/or expense limitations in effect during the periods shown. In their absence, performance would be reduced. Returns do not reflect the deduction of taxes that a shareholder would pay on Fund distributions or the redemption of Fund shares.
9
FUND BASICS
| | | | | | | | | | |
| | EXPENSE RATIOS4 | |
| | | | | Net Expense Ratio (Current) | | | Gross Expense Ratio (Before Waivers) | |
| | Class A | | | 1.15 | % | | | 1.51 | % |
| | Class C | | | 1.90 | | | | 2.26 | |
| | Institutional | | | 0.75 | | | | 1.11 | |
| | Service | | | 1.25 | | | | 1.61 | |
| | Investor | | | 0.90 | | | | 1.26 | |
| | Class R | | | 1.40 | | | | 1.76 | |
| | | Class R6 | | | 0.74 | | | | 1.09 | |
| | 4 | | The expense ratios of the Fund, both current (net of applicable fee waivers and/or expense limitations) and before waivers (gross of applicable fee waivers and/or expense limitations) are as set forth above according to the most recent publicly available Prospectus for the Fund and may differ from the expense ratios disclosed in the Financial Highlights in this report. Pursuant to a contractual arrangement, the Fund’s waivers and/or expense limitations will remain in place through at least April 28, 2018, and prior to such date the Investment Adviser may not terminate the arrangements without the approval of the Fund’s Board of Trustees. If these arrangements are discontinued in the future, the expense ratios may change without shareholder approval. |
| | | | | | | | |
| | TOP TEN HOLDINGS AS OF 8/31/175 |
| | | Holding | | % of Net Assets | | | Line of Business |
| | Apple, Inc. | | | 7.4 | % | | Technology Hardware, Storage &
Peripherals |
| | Microsoft Corp. | | | 3.9 | | | Software |
| | Facebook, Inc. Class A | | | 3.7 | | | Internet Software & Services |
| | Amazon.com, Inc. | | | 3.4 | | | Internet & Direct Marketing Retail |
| | MasterCard, Inc. Class A | | | 3.1 | | | IT Services |
| | Alphabet, Inc. Class C | | | 2.5 | | | Internet Software & Services |
| | Alphabet, Inc. Class A | | | 2.5 | | | Internet Software & Services |
| | Comcast Corp. Class A | | | 2.4 | | | Media |
| | Honeywell International, Inc. | | | 2.1 | | | Industrial Conglomerates |
| | | McDonald’s Corp. | | | 2.0 | | | Hotels, Restaurants & Leisure |
| | 5 | | The top 10 holdings may not be representative of the Fund’s future investments. |
10
FUND BASICS
|
| FUND VS. BENCHMARK SECTOR ALLOCATION6 |
| As of August 31, 2017 |
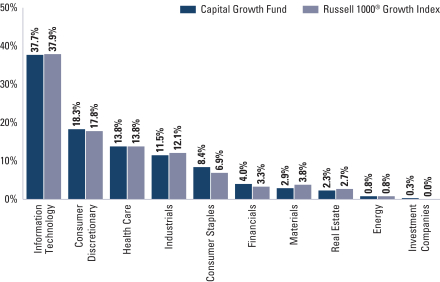
| | 6 | | The Fund is actively managed and, as such, its composition may differ over time. Consequently, the Fund’s overall sector allocations may differ from the percentages contained in the graph above. The graph categorizes investments using the Global Industry Classification Standard (“GICS”), however, the sector classifications used by the portfolio management team may differ from GICS. The percentage shown for each investment category reflects the value of investments in that category as a percentage of market value (excluding investments in the securities lending reinvestment vehicle, if any). Investments in the securities lending reinvestment vehicle represented less than 1% of the Fund’s net assets as of August 31, 2017. The graph depicts the Fund’s investments but may not represent the Fund’s market exposure due to the exclusion of certain derivatives, if any, as listed in the Additional Investment Information section of the Schedule of Investments. |
11
GOLDMAN SACHS CAPITAL GROWTH FUND
Performance Summary
August 31, 2017
The following graph shows the value, as of August 31, 2017, of a $1,000,000 investment made on September 1, 2007 in Institutional Shares at NAV. For comparative purposes, the performance of the Fund’s benchmark, the Russell 1000® Growth Index (with dividends reinvested), is shown. This performance data represents past performance and should not be considered indicative of future performance, which will fluctuate with changes in market conditions. These performance fluctuations may cause an investor’s shares, when redeemed, to be worth more or less than their original cost. Performance reflects applicable fee waivers and/or expense limitations in effect during the periods shown and in their absence, performance would be reduced. Returns do not reflect the deduction of taxes that a shareholder would pay on Fund distributions or the redemption of Fund shares. Performance of Class A, Class C, Service, Investor, Class R and Class R6 Shares will vary from Institutional Shares due to differences in class specific fees and any applicable sales charges. In addition to the Investment Adviser’s decisions regarding issuer/industry investment selection and allocation, other factors may affect Fund performance. These factors include, but are not limited to, Fund operating fees and expenses, portfolio turnover and subscription and redemption cash flows affecting the Fund.
|
| Capital Growth Fund’s 10 Year Performance |
Performance of a $1,000,000 Investment, including any applicable sales charges, with distributions reinvested, from September 1, 2007 through August 31, 2017.
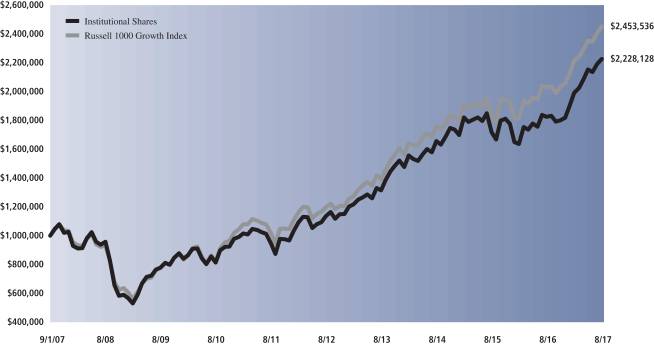
| | | | | | | | | | | | | | |
| Average Annual Total Return through August 31, 2017 | | | One Year | | | | Five Years | | | | Ten Years | | | Since Inception |
Class A (Commenced April 20, 1990) | | | | | | | | | | | | | | |
Excluding sales charges | | | 21.47% | | | | 13.97% | | | | 7.90% | | | 9.57% |
Including sales charges | | | 14.77% | | | | 12.69% | | | | 7.30% | | | 9.34% |
|
Class C (Commenced August 15, 1997) | | | | | | | | | | | | | | |
Excluding contingent deferred sales charges | | | 20.59% | | | | 13.12% | | | | 7.10% | | | 5.86% |
Including contingent deferred sales charges | | | 19.57% | | | | 13.12% | | | | 7.10% | | | 5.86% |
|
Institutional Class (Commenced August 15, 1997) | | | 21.96% | | | | 14.43% | | | | 8.33% | | | 7.06% |
|
Service Class (Commenced August 15, 1997) | | | 21.36% | | | | 13.86% | | | | 7.80% | | | 6.54% |
|
Investor (Commenced November 30, 2007) | | | 21.77% | | | | 14.26% | | | | N/A | | | 8.16% |
|
Class R (Commenced November 30, 2007) | | | 21.19% | | | | 13.68% | | | | N/A | | | 7.62% |
|
Class R6 (Commenced July 31, 2015) | | | 21.99% | | | | N/A | | | | N/A | | | 9.29% |
|
12
PORTFOLIO RESULTS
Goldman Sachs Concentrated Growth Fund
Portfolio Composition
The Fund invests primarily in U.S. equity investments. The Fund typically holds 30-40 high quality growth companies and tends to be more concentrated in individual holdings, industries and sectors than diversified mutual funds. Since the Fund’s inception, the Goldman Sachs Growth Equity Investment Team has focused on several key investment criteria that it believes can drive a company’s growth over the long term. These characteristics are: dominant market share, established brand name, pricing power, recurring revenue stream, free cash flow, high returns on invested capital, predictable growth, sustainable growth, long product life cycle, enduring competitive advantage, favorable demographic trends and excellent management. The Team strives to purchase these companies at what it believes to be reasonable valuations in order to capture the full benefits of their growth.
Portfolio Management Discussion and Analysis
Effective July 28, 2017, Goldman Sachs Focused Growth Fund merged with Goldman Sachs Concentrated Growth Fund. Below, the Goldman Sachs Growth Equity Investment Team discusses the Goldman Sachs Concentrated Growth Fund’s (the “Fund”) performance and positioning for the 12-month period ended August 31, 2017 (the “Reporting Period”).
| Q | | How did the Fund perform during the Reporting Period? |
| A | | During the Reporting Period, the Fund’s Class A, C, Institutional, Investor, R and R6 Shares generated average annual total returns, without sales charges, of 17.75%, 16.88%, 18.22%, 18.14%, 17.46% and 18.17%, respectively. These returns compare to the 20.82% average annual total return of the Fund’s benchmark, the Russell 1000® Growth Index (with dividends reinvested) (the “Russell Index”), during the same period. |
| Q | | What key factors were responsible for the Fund’s performance during the Reporting Period? |
| A | | The Fund generated solid double-digit positive absolute returns, but stock selection overall detracted from the Fund’s performance relative to the Russell Index during the Reporting Period. Sector allocation as a whole also detracted. |
| Q | | Which equity market sectors most significantly affected Fund performance? |
| A | | Challenging stock selection in the health care, consumer discretionary and financials sectors detracted from the Fund’s relative results most during the Reporting Period. The sectors that contributed most positively to the Fund’s relative performance during the Reporting Period were real estate, telecommunication services and consumer staples. Effective stock selection helped most in real estate and consumer staples. Having no exposure to telecommunication services, which was the second-weakest sector in the Russell Index during the Reporting Period, drove results in that sector. |
| Q | | Which stocks detracted significantly from the Fund’s performance during the Reporting Period? |
| A | | Among those stocks detracting most from the Fund’s results relative to the Russell Index were positions in oil well services company Schlumberger, athletic footwear and apparel company NIKE and beer producer and seller Molson Coors Brewing. |
| | During the Reporting Period, Schlumberger announced fourth quarter 2016 earnings that were ahead of consensus expectations. However, its shares were weak, as the company expressed a slower than market expected recovery in international activity. Like many companies in the energy sector, Schlumberger’s stock price also came under pressure amidst volatility in global oil prices. While we believe trends may stabilize and improve over the long term and believe Schlumberger is a high quality company, we decided to exit the position to pursue other opportunities. |
| | NIKE reported solid fiscal first quarter results during the Reporting Period, with revenue growth and earnings above market estimates. However, both its gross margin and future sales guidance came in below consensus expectations. NIKE’s shares quickly rebounded, with its stock price |
13
PORTFOLIO RESULTS
| | spiking on the last day of June 2017 when the company announced earnings that were better than market expectations on revenue and earnings per share, while also announcing in-line guidance. However, its shares then turned downward again following the footwear retailer Foot Locker’s announcement of significantly weaker than market expected earnings; this was viewed by many investors as a negative indicator for footwear sales broadly. At the end of the Reporting Period, we remained positive on the company’s focus on innovation and product development, which we believe is stronger than it has been in the recent past. One example of this is NIKE announcing a deal to sell its shoes through Amazon. In our view, NIKE has a resilient business model, with diverse product offerings, global channels, market share gains and meaningful share buybacks. We continued to believe at the end of the Reporting Period that the company is a best-in-class franchise in a structurally healthy and growing category, and we remained positive on its long-term growth potential. |
| | Molson Coors Brewing’s share price declined following the U.S. elections in November 2016 and in early 2017 due to widespread concerns around slowing beer industry volumes. In February 2017, the company reported better than market expected earnings, but softer scanner data through March 2017 continued to weigh on its shares. (Scanner data is retail purchase information (such as price, brand, product size, amount purchased) gathered at the point of purchase by an electronic device that reads a coded ticket on the product through the use of an electronic reader over which the product passes.) The company’s share price declined further in June 2017 following an investor meeting during which its management announced a downward revision to its margin guidance. While we think the company still has growth opportunities, especially given its recent merger and acquisition deals, we felt the risk/reward profile of the position was less compelling than it had been and decided to exit the position to pursue other opportunities. |
| Q | | What were some of the Fund’s best-performing individual stocks? |
| A | | The Fund benefited most relative to the Russell Index from positions in international freight transportation provider CSX, information technology giant Apple and pharmaceuticals company Vertex Pharmaceuticals. |
| | CSX, a new position for the Fund during the Reporting Period, provides rail, intermodal, domestic container shipping and contract logistics services around the world. Since being added to the Fund’s portfolio during the fourth quarter of 2016, the company saw its stock price spike in January 2017, as Canadian Pacific Chief Executive Officer (“CEO”), Hunter Harrison, resigned and was reportedly seeking a senior management position at CSX. The market viewed the potential move positively given Harrison’s strong reputation, and indeed Harrison was hired later in the quarter as CEO. Further, in April 2017, the company reported strong first calendar quarter results in which better pricing and impressive cost control led to better than market expected earnings per share and revenues. The company’s share price took a pause in July 2017, following an earnings miss due to poorer operating efficiencies than reported in the preceding quarters. Still, at the end of the Reporting Period, we continued to believe CSX was well positioned to benefit from a possible inflationary environment given its cyclical business model and also from potential tax reforms given its currently high tax rate. Overall, we were optimistic at the end of the Reporting Period about what we viewed as CSX’s growth outlook, operational improvement and strong free cash flow generation. |
| | Apple reported strong fiscal first quarter results at the beginning of February 2017 that beat market expectations on both revenue and earnings per share, driven by better than market expected iPhone sales. This report caused Apple’s stock price to jump. The company then announced results at the beginning of May 2017 that were broadly in line with market estimates on most metrics and guidance. In August 2017, the company reported solid earnings ahead of the highly anticipated release of its new iPhone. Apple’s positive performance was led by strong iPad and services revenue growth. At the end of the Reporting Period, we continued to see what we believe are a number of strong growth catalysts for Apple, including solid iPhone demand and ongoing product innovation and development. Apple also has continued to deliver strong services growth, which, in our view, is important as this decreases transactional volatility tied to product cycles. Further, we remained optimistic on Apple’s significant installed base, experienced management and established brand name. |
| | Vertex Pharmaceuticals announced earnings in January 2017 that were better than market estimates on earnings per share and total revenue. Most of the movement in the stock, however, occurred later in the first calendar quarter when its share price spiked as the company announced the successful clinical trial of one of its cystic fibrosis drugs. Again, in July 2017, positive data from studies for the drug caused the stock price to rise significantly. At the end of the Reporting Period, we were encouraged by the stock’s performance in 2017 year-to-date |
14
PORTFOLIO RESULTS
| | through August, especially following a challenging 2016 for the company. We think Vertex Pharmaceuticals has strong underlying fundamentals and a promising product pipeline with significant short- and long-term catalysts, at an attractive valuation. We believe the company, led by what we consider to be a capable management team, could continue to see growth given its dominant market share and geographic expansionary efforts that have contributed to meaningful profitability. |
| Q | | How did the Fund use derivatives and similar instruments during the Reporting Period? |
| A | | During the Reporting Period, we did not use derivatives as part of an active management strategy. |
| Q | | Did the Fund make any significant purchases or sales during the Reporting Period? |
| A | | During the Reporting Period, we initiated a Fund position in media and entertainment company Walt Disney & Co. As the outlook for U.S. economic growth improved for many following the 2016 U.S. elections, we are positive on the ability of the company to capitalize on potential opportunities, especially in its theme park revenue. We also felt that some of the perceived risks surrounding its ESPN business were overdone. In our view, Disney has a strong balance sheet and robust free cash flow and earnings growth and remains committed to buying back shares. At the time of purchase, we were positive on the company moving forward and on its potential for sustained growth. |
| | We established a Fund position in Northern Trust, an international financial services firm. Northern Trust is a company we had previously owned in our portfolios for its high quality fundamentals, including a solid balance sheet and cash position. We believe Northern Trust is well positioned to benefit from interest rate hikes and significant organic growth opportunities within the custody and fund administration business. We are additionally positive on the company’s wealth management segment given its mix of both active and passive strategies. The company’s management has stated it expects to reinvest its earnings into the business while targeting a meaningful return on equity, which could benefit shareholders. Northern Trust also has a high payout ratio and is well capitalized, in our view. Finally, we believe Northern Trust may further benefit from potentially lower corporate tax rates. With what we consider to be an experienced management team and a high quality franchise, we are optimistic on Northern Trust’s growth prospects. |
| | Conversely, in addition to those sales mentioned earlier, we eliminated the Fund’s position in multinational conglomerate 3M. In our view, 3M is undergoing a transition with revised earnings, particularly in its electronics business. We believe this is being driven by customers moving away from LED to OLED devices in televisions and smartphones. (LED stands for light-emitting diode. OLED stands for organic light-emitting diode.) We think this shift may add headwinds to the company’s earnings in the near term, and we exited the position to invest in what we considered to be relatively more attractive risk/reward ideas. |
| | We exited the Fund’s position in global pharmaceutical company Allergan. Volatility related to mergers and acquisitions in which the company has been involved as well as concerns about drug pricing pressures weighed on the company’s stock during the Reporting Period. Furthermore, disappointing quarterly results challenged the stock and further pushed out the timeline of our investment thesis. Though we remained positive at the end of the Reporting Period on the outlook for Allergan, we decided to sell the position in favor of more compelling ideas. |
| Q | | Were there any notable changes in the Fund’s weightings during the Reporting Period? |
| A | | In constructing the Fund’s portfolio, we focus on picking stocks rather than on making industry or sector bets. We seek to outpace the benchmark index by overweighting stocks that we expect to outperform and underweighting those that we think may lag. Consequently, changes in its sector weights are generally the direct result of individual stock selection or of stock appreciation or depreciation. That said, during the Reporting Period, the Fund’s exposure to consumer discretionary, consumer staples and financials increased and its allocations to real estate and information technology decreased relative to the Russell Index. The Fund’s allocation to cash also decreased during the Reporting Period. |
| Q | | How was the Fund positioned relative to its benchmark index at the end of August 2017? |
| A | | At the end of August 2017, the Fund had overweighted positions relative to the Russell Index in the financials, consumer staples, consumer discretionary and real estate sectors. On the same date, the Fund had underweighted positions compared to the Russell Index in information technology, materials and industrials. The Fund was rather neutrally weighted relative to the Russell Index in energy and health care and had no positions at all in the utilities and telecommunication services sectors at the end of the Reporting Period. |
15
FUND BASICS
Concentrated Growth Fund
as of August 31, 2017
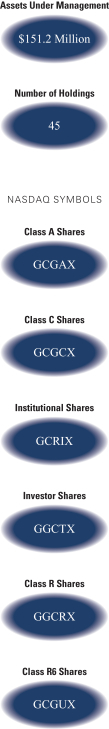
| | | | | | | | | | |
| | PERFORMANCE REVIEW | |
| | | September 1, 2016–August 31, 2017 | | Fund Total Return
(based on NAV)1 | | | Russell 1000®
Growth Index2 | |
| | Class A | | | 17.75 | % | | | 20.82 | % |
| | Class C | | | 16.88 | | | | 20.82 | |
| | Institutional | | | 18.22 | | | | 20.82 | |
| | Investor | | | 18.14 | | | | 20.82 | |
| | Class R | | | 17.46 | | | | 20.82 | |
| | | Class R6 | | | 18.17 | | | | 20.82 | |
| | 1 | | The net asset value (“NAV”) represents the net assets of the class of the Fund (ex-dividend) divided by the total number of shares of the class outstanding. The Fund’s performance reflects the reinvestment of dividends and other distributions. The Fund’s performance does not reflect the deduction of any applicable sales charges. |
| | 2 | | The Russell 1000® Growth Index is an unmanaged index that measures the performance of those Russell 1000® companies with higher price-to-book ratios and higher forecasted growth values. The Index figures do not reflect any deduction for fees, expenses or taxes. It is not possible to invest directly in an index. |
| | | | | | | | | | | | | | | | | | | | |
| | STANDARDIZED TOTAL RETURNS3 |
| | | For the period ended 6/30/17 | | One Year | | | Five Years | | | Ten Years | | | Since Inception | | | Inception Date |
| | Class A | | | 11.83 | % | | | 11.51% | | | | 5.76% | | | | 7.24% | | | 9/03/02 |
| | Class C | | | 16.54 | | | | 11.94 | | | | 5.57 | | | | 6.84 | | | 9/03/02 |
| | Institutional | | | 18.81 | | | | 13.22 | | | | 6.79 | | | | 8.08 | | | 9/03/02 |
| | Investor | | | 18.65 | | | | 13.06 | | | | N/A | | | | 6.57 | | | 11/30/07 |
| | Class R | | | 18.09 | | | | 12.48 | | | | N/A | | | | 6.06 | | | 11/30/07 |
| | | Class R6 | | | 18.83 | | | | N/A | | | | N/A | | | | 6.37 | | | 7/31/15 |
| | 3 | | The Standardized Total Returns are average annual total returns or cumulative total returns (only if the performance period is one year or less) as of the most recent calendar quarter-end. They assume reinvestment of all distributions at NAV. These returns reflect a maximum initial sales charge of 5.5% for Class A Shares and the assumed contingent deferred sales charge for Class C Shares (1% if redeemed within 12 months of purchase). Because Institutional, Investor, Class R and Class R6 Shares do not involve a sales charge, such a charge is not applied to their Standardized Total Returns. |
The returns set forth in the tables above represent past performance. Past performance does not guarantee future results. The Fund’s investment return and principal value will fluctuate so that an investor’s shares, when redeemed, may be worth more or less than their original cost. Current performance may be lower or higher than the performance quoted above. Please visit our web site at www.GSAMFUNDS.com to obtain the most recent month-end returns. Performance reflects applicable fee waivers and/or expense limitations in effect during the periods shown. In their absence, performance would be reduced. Returns do not reflect the deduction of taxes that a shareholder would pay on Fund distributions or the redemption of Fund shares.
16
FUND BASICS
| | | | | | | | | | |
| | EXPENSE RATIOS4 | |
| | | | | Net Expense Ratio (Current) | | | Gross Expense Ratio (Before Waivers) | |
| | Class A | | | 1.19 | % | | | 1.63 | % |
| | Class C | | | 1.95 | | | | 2.38 | |
| | Institutional | | | 0.82 | | | | 1.23 | |
| | Investor | | | 0.94 | | | | 1.38 | |
| | Class R | | | 1.45 | | | | 1.89 | |
| | | Class R6 | | | 0.81 | | | | 1.21 | |
| | 4 | | The expense ratios of the Fund, both current (net of applicable fee waivers and/or expense limitations) and before waivers (gross of applicable fee waivers and/or expense limitations) are as set forth above according to the most recent publicly available Prospectus for the Fund and may differ from the expense ratios disclosed in the Financial Highlights in this report. Pursuant to a contractual arrangement, the Fund’s waivers and/or expense limitations will remain in place through at least April 28, 2018, and prior to such date the Investment Adviser may not terminate the arrangements without the approval of the Fund’s Board of Trustees. If these arrangements are discontinued in the future, the expense ratios may change without shareholder approval. |
| | | | | | | | |
| | TOP TEN HOLDINGS AS OF 8/31/175 |
| | | Holding | | % of Net Assets | | | Line of Business |
| | Apple, Inc. | | | 7.0 | % | | Technology Hardware, Storage &
Peripherals |
| | Microsoft Corp. | | | 4.9 | | | Software |
| | Facebook, Inc. Class A | | | 4.5 | | | Internet Software & Services |
| | Alphabet, Inc. Class A | | | 4.1 | | | Internet Software & Services |
| | Amazon.com, Inc. | | | 4.0 | | | Internet & Direct Marketing Retail |
| | Comcast Corp. Class A | | | 3.4 | | | Media |
| | American Tower Corp. | | | 3.0 | | | Equity Real Estate Investment Trusts
(REITs) |
| | MasterCard, Inc. Class A | | | 2.8 | | | IT Services |
| | McDonald’s Corp. | | | 2.7 | | | Hotels, Restaurants & Leisure |
| | | The Walt Disney Co. | | | 2.7 | | | Media |
| | 5 | | The top 10 holdings may not be representative of the Fund’s future investments. |
17
FUND BASICS
|
| FUND VS. BENCHMARK SECTOR ALLOCATION6 |
| As of August 31, 2017 |
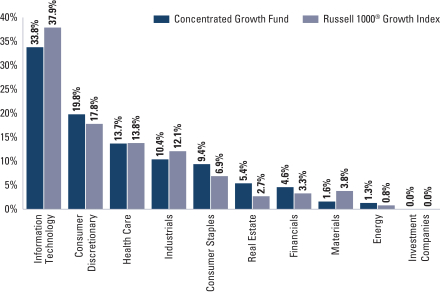
| | 6 | | The Fund is actively managed and, as such, its composition may differ over time. Consequently, the Fund’s overall sector allocations may differ from the percentages contained in the graph above. The graph categorizes investments using the Global Industry Classification Standard (“GICS”), however, the sector classifications used by the portfolio management team may differ from GICS. The percentage shown for each investment category reflects the value of investments in that category as a percentage of market value. The graph depicts the Fund’s investments but may not represent the Fund’s market exposure due to the exclusion of certain derivatives, if any, as listed in the Additional Investment Information section of the Schedule of Investments. |
18
GOLDMAN SACHS CONCENTRATED GROWTH FUND
Performance Summary
August 31, 2017
The following graph shows the value, as of August 31, 2017, of a $1,000,000 investment made on September 1, 2007 in Institutional Shares at NAV. For comparative purposes, the performance of the Fund’s benchmark, the Russell 1000® Growth Index (with dividends reinvested), is shown. This performance data represents past performance and should not be considered indicative of future performance which will fluctuate with changes in market conditions. These performance fluctuations may cause an investor’s shares, when redeemed, to be worth more or less than their original cost. Performance reflects applicable fee waivers and/or expense limitations in effect during the periods shown and in their absence, performance would be reduced. Returns do not reflect the deduction of taxes that a shareholder would pay on Fund distributions or the redemption of Fund shares. Performance of Class A, Class C, Investor, Class R, and Class R6 Shares will vary from Institutional Shares due to differences in class specific fees and any applicable sales charges. In addition to the Investment Adviser’s decisions regarding issuer/industry investment selection and allocation, other factors may affect Fund performance. These factors include, but are not limited to, Fund operating fees and expenses, portfolio turnover and subscription and redemption cash flows affecting the Fund.
|
| Concentrated Growth Fund’s 10 Year Performance |
Performance of a $1,000,000 Investment, including any applicable sales charges, with distributions reinvested, from September 1, 2007 through August 31, 2017.
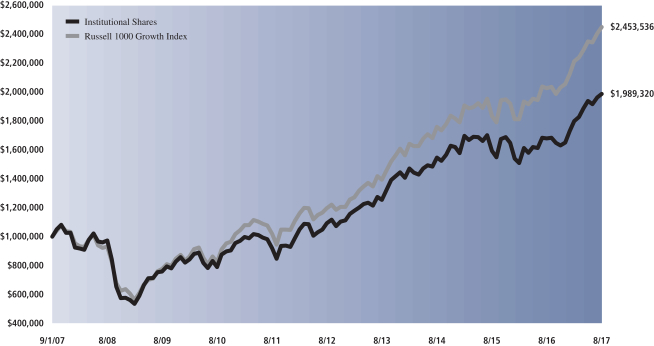
| | | | | | | | | | | | | | |
| Average Annual Total Return through August 31, 2017 | | | One Year | | | | Five Years | | | | Ten Years | | | Since Inception |
Class A (Commenced September 3, 2002) | | | | | | | | | | | | | | |
Excluding sales charges | | | 17.75% | | | | 12.26% | | | | 6.69% | | | 7.82% |
Including sales charges | | | 11.25% | | | | 11.00% | | | | 6.09% | | | 7.42% |
|
Class C (Commenced September 3, 2002) | | | | | | | | | | | | | | |
Excluding contingent deferred sales charges | | | 16.88% | | | | 11.43% | | | | 5.89% | | | 7.01% |
Including contingent deferred sales charges | | | 15.87% | | | | 11.43% | | | | 5.89% | | | 7.01% |
|
Institutional Class (Commenced September 3, 2002) | | | 18.22% | | | | 12.71% | | | | 7.11% | | | 8.25% |
|
Investor (Commenced November 30, 2007) | | | 18.14% | | | | 12.55% | | | | N/A | | | 6.85% |
|
Class R (Commenced November 30, 2007) | | | 17.46% | | | | 11.99% | | | | N/A | | | 6.33% |
|
Class R6 (Commenced July 31, 2015) | | | 18.17% | | | | N/A | | | | N/A | | | 7.68% |
|
19
PORTFOLIO RESULTS
Goldman Sachs Dynamic U.S. Equity Fund
Portfolio Composition
Since the Fund’s inception, the Goldman Sachs Growth Equity Investment Team and the Goldman Sachs Fundamental Equity Value Investment Team have focused on several key investment criteria that they believe can drive a company’s growth over the long term. These characteristics are: dominant market share, established brand name, pricing power, recurring revenue stream, free cash flow, high returns on invested capital, predictable growth, sustainable growth, long product life cycle, enduring competitive advantage, favorable demographic trends and excellent management. The Teams strive to purchase these companies at reasonable valuations in order to capture the full benefits of their growth.
Portfolio Management Discussion and Analysis
Below, the Goldman Sachs Growth Equity Investment Team and the Goldman Sachs Value Equity Investment Team discuss the Goldman Sachs Dynamic U.S. Equity Fund’s (the “Fund”) performance and positioning for the 12-month period ended August 31, 2017 (the “Reporting Period”).
| Q | | How did the Fund perform during the Reporting Period? |
| A | | During the Reporting Period, the Fund’s Class A, C, Institutional, Investor, R and R6 Shares generated average annual total returns, without sales charges, of 14.06%, 13.18%, 14.43%, 14.27%, 13.77% and 14.52%, respectively. These returns compare to the 16.23% average annual total return of the Fund’s benchmark, the Standard & Poor’s 500® Index (the “S&P 500 Index”), during the same period. |
| Q | | What key factors were responsible for the Fund’s performance during the Reporting Period? |
| A | | The Fund posted positive double-digit absolute returns, but stock selection overall detracted from the Fund’s performance relative to the S&P 500 Index during the Reporting Period. Sector allocation as a whole contributed positively, albeit modestly. |
| Q | | Which equity market sectors most significantly affected Fund performance? |
| A | | Challenging stock selection in industrials, energy and health care detracted from the Fund’s relative results most. The sectors that contributed most positively to the Fund’s relative performance during the Reporting Period were financials, real estate and telecommunication services. Effective stock selection helped most in financials and real estate. Having no exposure to telecommunication services, which was the second-weakest sector in the S&P 500 Index during the Reporting Period, drove results in that sector. |
| Q | | Which stocks detracted significantly from the Fund’s performance during the Reporting Period? |
| A | | Among those stocks detracting most from the Fund’s results relative to the S&P 500 Index were positions in oil and gas exploration and production company Southwestern Energy, U.S.-based media conglomerate Viacom and diversified industrial business General Electric. |
| | Much of the decline in Southwestern Energy’s stock price came as the company announced disappointing earnings that fell below market estimates. In February 2017, its earnings per share came in lower than market consensus due to higher costs and declining production across all three regions in which the company operates. The company did, however, provide strong guidance moving forward and also announced an increase in capital expenditures. During the second calendar quarter, Southwestern Energy’s stock experienced weakness as the price of natural gas was pressured. Market volatility also continued to plague the stock. Despite the decline in the company’s share price, we believed at the end of the Reporting Period that our thesis on demand drivers within natural gas remained intact, even with potential macro headwinds. We also continued to see upside potential for Southwestern Energy given what we view as the company’s high quality assets, specifically in the Marcellus, Fayetteville and Utica shales. We remained encouraged by its management team’s focus on cutting costs and divesting assets as it seeks to reduce debt and believed Southwestern Energy is one of the most attractively valued companies among its peers. |
20
PORTFOLIO RESULTS
| | At the beginning of May 2017, Viacom announced earnings that were better than market estimates on both earnings per share and revenue. Investors reacted negatively to the earnings, however, and the stock fell sharply as the market maintained concerns on the changing TV landscape. Its stock remained under pressure and further sold off in July 2017, as investor concerns around the company’s outlook and growth heightened. While we continued to believe at the end of the Reporting Period that the company was attractively valued with a broad network and strong viewership base, we felt its risk/reward profile was less favorable given the continued disruption in the TV landscape. We therefore took the opportunity to exit the position and allocate the capital to names we felt had more favorable prospects moving forward. |
| | General Electric announced earnings in January 2017 that were in-line with market consensus on earnings per share but were below market expectations on revenue and free cash flow, leading its stock price lower. Later in the Reporting Period, the company again announced disappointing earnings that, while beating market estimates on earnings per share, were weak on cash flow with lower than market expected guidance. Despite the decline in General Electric’s stock price, we continued at the end of the Reporting Period to be positive on the leadership changes that have taken place within the company. We believe such changes could bring more focus on change and improvement. We also continued to be positive on General Electric’s acquisition of Alstrom and the potential cost synergies it may create through 2018. We feel General Electric’s dominant market position and balance sheet flexibility should position it well looking ahead. |
| Q | | What were some of the Fund’s best-performing individual stocks? |
| A | | The Fund benefited most relative to the S&P 500 Index from positions in U.S.-based bank holding company Bank of America, food retailer Whole Foods Market and payments company MasterCard. |
| | After the U.S. presidential election in early November 2016 and throughout the rest of the Reporting Period, Bank of America and the financials sector as a whole rose. The increase was largely the result of the market seeing greater potential for a more favorable regulatory environment as well as higher domestic growth and interest rates under the new Administration. Bank of America also continued to outperform its peers in the financials sector, which we believe was due to good banking fundamentals and its management’s emphasis on cost reductions. Overall, at the end of the Reporting Period, we remained positive on Bank of America’s business outlook and its ability to capitalize on potentially higher growth and interest rates, and we continued to find the company’s valuation attractive. |
| | At the end of June 2017, Amazon announced its intention to acquire Whole Foods Market at a large premium, which caused Whole Foods Market’s stock price to spike. We believed Whole Foods Market was a market leader in one of the most attractive segments of food retailers, i.e. natural organic, with a strong balance sheet and free cash flow that was trading at an attractive valuation. Despite increased competition, we also were optimistic that the company was taking the necessary steps to address its challenges to reaccelerate growth and profitability. We believe Amazon’s acquisition validated our investment thesis that Whole Foods Market is a valuable strategic asset. Following the news and subsequent rise in stock price, we decided to exit the Fund’s position and allocate the capital to other opportunities. |
| | Much of the increase in MasterCard’s share price was not driven, we believe, by stock-specific factors but rather by strong performance in the information technology sector and payment companies in general. MasterCard’s stock did react positively after the company announced first and second quarter 2017 earnings in which revenues and earnings outpaced market expectations. This strong performance was explained by the company to be caused by higher processed transactions and robust cross-border volume. At the end of the Reporting Period, we were optimistic on the company’s ability to grow its core payments business through new client wins as well as through further differentiation of the company by expanding to new growth areas such as consumer credit and peer-to-peer lending. We were also positive on operating trends and on MasterCard’s ongoing focus on diversification and fee-based revenue stream, which we believe position the company well relative to competitors. |
| Q | | How did the Fund use derivatives and similar instruments during the Reporting Period? |
| A | | During the Reporting Period, we did not use derivatives as part of an active management strategy. |
| Q | | Did the Fund make any significant purchases or sales during the Reporting Period? |
| A | | During the Reporting Period, we initiated a Fund position in Wells Fargo, a diversified financials company. Following the surprise 2016 U.S. presidential election results and the potential volatility that might create, we took the opportunity to add what we view as a strong company with good growth potential moving forward. We have conviction in Wells |
21
PORTFOLIO RESULTS
| | Fargo’s strong deposit franchise and leading national distribution network. We also believed its shares traded, at the time of purchase, at a compelling valuation relative to its peer group. |
| | We established a Fund position in information technology giant Microsoft. We are positive on the company as it continued to grow its commercial cloud business, and we feel the company presents a good risk/reward opportunity. We feel Microsoft is attractively valued with a strong balance sheet and robust free cash flow. We believe Microsoft’s strong brand, dominant market position and what we consider to be its experienced management team are poised to continue moving the company in the right direction. |
| | Conversely, in addition to those sales already mentioned, we exited the Fund’s position in McKesson. McKesson, a provider of pharmaceutical distribution services and medical supplies, saw its stock price decline during the Reporting Period, as the health care sector broadly saw increased scrutiny over drug pricing. While we continue to like the company, greater uncertainty in the near term led us to find other companies that we believe offer a more compelling risk/ reward outlook. |
| | We eliminated the Fund’s position in health care equipment and services company Abbott Laboratories. The company’s share price had experienced weakness over acquisition-related news, along with foreign exchange headwinds and market growth deterioration in its pediatric nutrition segment in China. Although we continue to believe Abbott Laboratories is a growing business that capitalizes on strong execution, we exited the Fund’s position to invest in companies we considered to have a more favorable risk/ reward profile. |
| Q | | Were there any notable changes in the Fund’s weightings during the Reporting Period? |
| A | | In constructing the Fund’s portfolio, we focus on picking stocks rather than on making industry or sector bets. We seek to outpace the benchmark index by overweighting stocks that we expect to outperform and underweighting those that we think may lag. Consequently, changes in its sector weights are generally the direct result of individual stock selection or of stock appreciation or depreciation. That said, during the Reporting Period, the Fund’s exposure to health care and real estate increased and its allocations to consumer staples, information technology and telecommunication services decreased relative to the Russell Index. The Fund’s position in cash increased during the Reporting Period. |
| Q | | How was the Fund positioned relative to its benchmark index at the end of August 2017? |
| A | | At the end of August 2017, the Fund had overweighted positions relative to the S&P 500 Index in financials and real estate. On the same date, the Fund had underweighted positions compared to the S&P 500 Index in consumer staples, information technology and health care and was rather neutrally weighted to the S&P 500 Index in consumer discretionary, energy, industrials and materials. The Fund had no positions at all in telecommunication services and utilities at the end of the Reporting Period. |
22
FUND BASICS
Dynamic U.S. Equity Fund
as of August 31, 2017
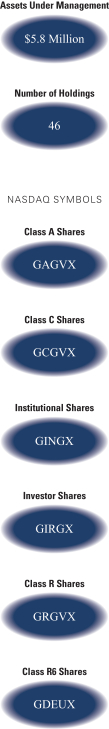
| | | | | | | | | | |
| | PERFORMANCE REVIEW | |
| | | September 1, 2016–August 31, 2017 | | Fund Total Return
(based on NAV)1 | | | S&P 500® Index2 | |
| | Class A | | | 14.06 | % | | | 16.23 | % |
| | Class C | | | 13.18 | | | | 16.23 | |
| | Institutional | | | 14.43 | | | | 16.23 | |
| | Investor | | | 14.27 | | | | 16.23 | |
| | Class R | | | 13.77 | | | | 16.23 | |
| | | Class R6 | | | 14.52 | | | | 16.23 | |
| | 1 | | The net asset value (“NAV”) represents the net assets of the class of the Fund (ex-dividend) divided by the total number of shares of the class outstanding. The Fund’s performance reflects the reinvestment of dividends and other distributions. The Fund’s performance does not reflect the deduction of any applicable sales charges. |
| | 2 | | The S&P 500® Index is the Standard & Poor’s 500 Composite Index of 500 stocks, an unmanaged index of common stock prices. The Index figures do not reflect any deduction for fees, expenses or taxes. It is not possible to invest directly in an index. |
| | | | | | | | | | | | | | | | |
| | STANDARDIZED TOTAL RETURNS3 |
| | | For the period ended 6/30/17 | | One Year | | | Five Years | | | Since Inception | | | Inception Date |
| | Class A | | | 12.80 | % | | | 11.51 | % | | | 10.14 | % | | 11/30/09 |
| | Class C | | | 17.43 | | | | 11.93 | | | | 10.12 | | | 11/30/09 |
| | Institutional | | | 19.78 | | | | 13.21 | | | | 11.40 | | | 11/30/09 |
| | Investor | | | 19.61 | | | | 13.04 | | | | 11.22 | | | 11/30/09 |
| | Class R | | | 19.01 | | | | 12.50 | | | | 10.68 | | | 11/30/09 |
| | | Class R6 | | | 19.87 | | | | N/A | | | | 5.83 | | | 7/31/15 |
| | 3 | | The Standardized Total Returns are average annual total returns or cumulative total returns (only if the performance period is one year or less) as of the most recent calendar quarter-end. They assume reinvestment of all distributions at NAV. These returns reflect a maximum initial sales charge of 5.5% for Class A Shares and the assumed contingent deferred sales charge for Class C Shares (1% if redeemed within 12 months of purchase). Because Institutional, Investor, Class R and Class R6 Shares do not involve a sales charge, such a charge is not applied to their Standardized Total Returns. |
The returns set forth in the tables above represent past performance. Past performance does not guarantee future results. The Fund’s investment return and principal value will fluctuate so that an investor’s shares, when redeemed, may be worth more or less than their original cost. Current performance may be lower or higher than the performance quoted above. Please visit our web site at www.GSAMFUNDS.com to obtain the most recent month-end returns. Performance reflects applicable fee waivers and/or expense limitations in effect during the periods shown. In their absence, performance would be reduced. Returns do not reflect the deduction of taxes that a shareholder would pay on Fund distributions or the redemption of Fund shares.
23
FUND BASICS
| | | | | | | | | | |
| | EXPENSE RATIOS4 | |
| | | | | Net Expense Ratio (Current) | | | Gross Expense Ratio (Before Waivers) | |
| | Class A | | | 1.19 | % | | | 3.60 | % |
| | Class C | | | 1.94 | | | | 4.33 | |
| | Institutional | | | 0.82 | | | | 3.16 | |
| | Investor | | | 0.94 | | | | 3.54 | |
| | Class R | | | 1.44 | | | | 3.70 | |
| | | Class R6 | | | 0.81 | | | | 3.14 | |
| | 4 | | The expense ratios of the Fund, both current (net of applicable fee waivers and/or expense limitations) and before waivers (gross of applicable fee waivers and/or expense limitations) are as set forth above according to the most recent publicly available Prospectus for the Fund and may differ from the expense ratios disclosed in the Financial Highlights in this report. Pursuant to a contractual arrangement, the Fund’s waivers and/or expense limitations will remain in place through at least April 28, 2018, and prior to such date the Investment Adviser may not terminate the arrangements without the approval of the Fund’s Board of Trustees. If these arrangements are discontinued in the future, the expense ratios may change without shareholder approval. |
| | | | | | | | |
| | TOP TEN HOLDINGS AS OF 8/31/175 |
| | | Holding | | % of Net Assets | | | Line of Business |
| | MasterCard, Inc. Class A | | | 4.8 | % | | IT Services |
| | Wells Fargo & Co. | | | 4.7 | | | Banks |
| | Bank of America Corp. | | | 4.3 | | | Banks |
| | General Electric Co. | | | 4.0 | | | Industrial Conglomerates |
| | Apple, Inc. | | | 3.8 | | | Technology Hardware, Storage &
Peripherals |
| | Pfizer, Inc. | | | 3.7 | | | Pharmaceuticals |
| | Microsoft Corp. | | | 3.4 | | | Software |
| | Exxon Mobil Corp. | | | 3.3 | | | Oil, Gas & Consumable Fuels |
| | American Tower Corp. | | | 2.7 | | | Equity Real Estate Investment Trusts
(REITs) |
| | | The Walt Disney Co. | | | 2.6 | | | Media |
| | 5 | | The top 10 holdings may not be representative of the Fund’s future investments. |
24
FUND BASICS
|
| FUND VS. BENCHMARK SECTOR ALLOCATION6 |
| As of August 31, 2017 |
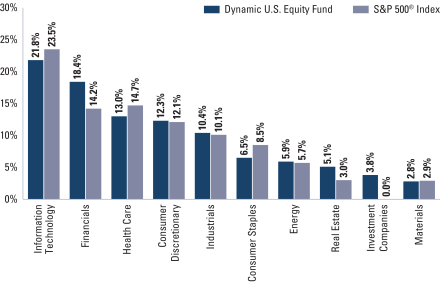
| | 6 | | The Fund is actively managed and, as such, its composition may differ over time. Consequently, the Fund’s overall sector allocations may differ from the percentages contained in the graph above. The graph categorizes investments using the Global Industry Classification Standard (“GICS”), however, the sector classifications used by the portfolio management team may differ from GICS. The percentage shown for each investment category reflects the value of investments in that category as a percentage of market value. The graph depicts the Fund’s investments but may not represent the Fund’s market exposure due to the exclusion of certain derivatives, if any, as listed in the Additional Investment Information section of the Schedule of Investments. |
25
GOLDMAN SACHS DYNAMIC U.S. EQUITY FUND
Performance Summary
August 31, 2017
The following graph shows the value, as of August 31, 2017, of a $1,000,000 investment made on November 30, 2009 (commencement of operations) in Institutional Shares at NAV. For comparative purposes, the performance of the Fund’s benchmark, the S&P 500® Index (with dividends reinvested), is shown. This performance data represents past performance and should not be considered indicative of future performance, which will fluctuate with changes in market conditions. These performance fluctuations may cause an investor’s shares, when redeemed, to be worth more or less than their original cost. Performance reflects applicable fee waivers and/or expense limitations in effect during the periods shown and in their absence, performance would be reduced. Returns do not reflect the deduction of taxes that a shareholder would pay on Fund distributions or the redemption of Fund shares. Performance of Class A, Class C, Investor, Class R and Class R6 Shares will vary from Institutional Shares due to differences in class specific fees and any applicable sales charges. In addition to the Investment Adviser’s decisions regarding issuer/industry investment selection and allocation, other factors may affect Fund performance. These factors include, but are not limited to, Fund operating fees and expenses, portfolio turnover and subscription and redemption cash flows affecting the Fund.
|
| Dynamic U.S. Equity Fund’s Lifetime Performance |
Performance of a $1,000,000 Investment, including any applicable sales charges, with distributions reinvested, from November 30, 2009 through August 31, 2017.
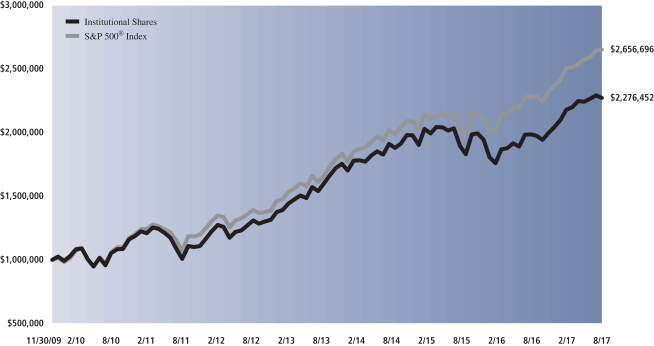
| | | | | | | | | | |
| Average Annual Total Return through August 31, 2017 | | | One Year | | | | Five Years | | | Since Inception |
Class A (Commenced November 30, 2009) | | | | | | | | | | |
Excluding sales charges | | | 14.06% | | | | 11.93% | | | 10.75% |
Including sales charges | | | 7.80% | | | | 10.66% | | | 9.95% |
|
Class C (Commenced November 30, 2009) | | | | | | | | | | |
Excluding contingent deferred sales charges | | | 13.18% | | | | 11.10% | | | 9.91% |
Including contingent deferred sales charges | | | 12.18% | | | | 11.10% | | | 9.91% |
|
Institutional Class (Commenced November 30, 2009) | | | 14.43% | | | | 12.37% | | | 11.18% |
|
Investor (Commenced November 30, 2009) | | | 14.27% | | | | 12.20% | | | 11.01% |
|
Class R (Commenced November 30, 2009) | | | 13.77% | | | | 11.66% | | | 10.47% |
|
Class R6 (Commenced July 31, 2015) | | | 14.52% | | | | N/A | | | 5.51% |
|
26
PORTFOLIO RESULTS
Goldman Sachs Flexible Cap Fund
Portfolio Composition
The Fund invests primarily in U.S. equity investments in small-, mid- and large-capitalization issuers. Since the Fund’s inception, the Goldman Sachs Growth Equity Investment Team has focused on several key investment criteria that it believes can drive a company’s growth over the long term. These characteristics are: dominant market share, established brand name, pricing power, recurring revenue stream, free cash flow, high returns on invested capital, predictable growth, sustainable growth, long product life cycle, enduring competitive advantage, favorable demographic trends and excellent management. The Team strives to purchase these companies at reasonable valuations in order to capture the full benefits of their growth.
Portfolio Management Discussion and Analysis
Below, the Goldman Sachs Growth Equity Investment Team discusses the Goldman Sachs Flexible Cap Fund’s (the “Fund”) performance and positioning for the 12-month period ended August 31, 2017 (the “Reporting Period”).
| Q | | How did the Fund perform during the Reporting Period? |
| A | | During the Reporting Period, the Fund’s Class A, C, Institutional, Investor, R and R6 Shares generated average annual total returns, without sales charges, of 20.14%, 19.18%, 20.61%, 20.43%, 19.83% and 20.61%, respectively. These returns compare to the 20.47% average annual total return of the Fund’s benchmark, the Russell 3000® Growth Index (with dividends reinvested) (the “Russell Index”), during the same period. After the close of business on August 31, 2017, the Fund’s benchmark was changed to the S&P 500® Index. |
| Q | | What key factors were responsible for the Fund’s performance during the Reporting Period? |
| A | | Most share classes of the Fund performed in line with the Russell Index during the Reporting Period, attributable primarily to effective stock selection overall. Sector allocation as a whole detracted, albeit modestly. |
| Q | | Which equity market sectors most significantly affected Fund performance? |
| A | | The sectors that contributed most positively to the Fund’s relative performance during the Reporting Period were real estate, consumer staples and health care, wherein effective stock selection drove results. Having an underweighted allocation to consumer staples, which was the second weakest sector in the Russell Index during the Reporting Period, also helped. The sectors that detracted most from the Fund’s relative results during the Reporting Period were energy, information technology and materials, wherein stock selection proved challenging. Allocation positioning in energy, which was the weakest sector in the Russell Index during the Reporting Period, hurt as well. |
| Q | | What were some of the Fund’s best-performing individual stocks? |
| A | | Among those stocks the Fund benefited most from relative to the Russell Index were positions in investment banking advisory company Evercore Partners, multinational developer, manufacturer and marketer of medical devices C.R. Bard and fast casual restaurant chain Panera Bread. |
| | Shares of Evercore Partners, a new purchase for the Fund during the Reporting Period, rallied sharply following the November 2016 U.S. elections, as investor sentiment around deregulation improved, creating an optimistic outlook for the investment bank. Evercore Partners’ stock continued to perform well as the company announced positive first and second quarter 2017 earnings driven by a healthy merger and acquisition backlog. We also saw Evercore Partners continuing to take share from bulge bracket firms and other independent boutiques. (The bulge bracket comprises the world’s largest and most profitable multinational investment banks whose investment banking clients are usually large corporations, institutions and governments.) The company had also made a conscious decision to reduce its investment management business and focus on delivering margins through higher productivity and cost control initiatives. With a meaningful share buyback and rise in dividends, Evercore Partners’ management has emphasized a focus on returning capital to shareholders. We initiated the purchase as we |
27
PORTFOLIO RESULTS
| | viewed Evercore Partners as a high quality growth company with an experienced management team and a favorable valuation. As our investment thesis largely played out, we sold the Fund’s position in the company toward the middle of the Reporting Period. |
| | During the Reporting Period, C.R. Bard announced it had accepted a buyout offer from Becton Dickinson, which caused C.R. Bard’s stock price to rise. We were encouraged by this news, as we have viewed C.R. Bard as having a strong business franchise with favorable long-term prospects and a high quality management team. Following the announcement, we took the opportunity to sell the Fund’s position in C.R. Bard and reallocate the capital to other investment opportunities. |
| | Panera Bread’s gains were largely driven by JAB Holdings’ purchase of the fast casual restaurant chain. The premium paid for Panera Bread was a positive recognition of its previous investment to improve efficiencies and grow margins. Following strong performance and seeing a potential shift in leadership, we felt it prudent to exit the Fund’s position and look for opportunities elsewhere. |
| Q | | Which stocks detracted significantly from the Fund’s performance during the Reporting Period? |
| A | | Detracting most from the Fund’s results relative to the Russell Index were positions in oil well services company Schlumberger, food manufacturer TreeHouse Foods and beer producer and seller Molson Coors Brewing. |
| | During the Reporting Period, Schlumberger announced fourth quarter 2016 earnings that were ahead of consensus expectations. However, its shares were weak, as the company expressed a slower than market expected recovery in international activity. Like many companies in the energy sector, Schlumberger’s stock price also came under pressure amidst volatility in global oil prices. While we believe trends may stabilize and improve over the long term and believe Schlumberger is a high quality company, we opted to sell the position based on what we view as the company’s risk/reward profile given the recent downturn in crude oil prices. |
| | Shares of TreeHouse Foods declined after the company reported mixed second quarter 2016 earnings and announced the retirement of its Chief Financial Officer. Then, in November 2016, the company reported disappointing third calendar quarter results with sales and earnings below market expectations. TreeHouse Foods also announced management changes, which, alongside plans to reorganize its sales force, led to some near-term uncertainty. Following the drop in its stock price, however, the company saw better performance, especially in February 2017 when it announced earnings that were better than the market expected, causing its stock price to regain some of the prior losses. In May 2017, its shares fell sharply following the company’s first quarter 2017 earnings release in which it missed earnings per share market estimates due to weaker than market expected margins. We decided to exit the Fund’s position due to what we believed was ongoing uncertainty around the company’s management changes and the integration of recent merger and acquisition activity. |
| | Molson Coors Brewing’s share price declined following the U.S. elections in November 2016 and in early 2017 due to widespread concerns around slowing beer industry volumes. In February 2017, the company reported better than market expected earnings, but softer scanner data through March 2017 continued to weigh on its shares. (Scanner data is retail purchase information (such as price, brand, product size, amount purchased) gathered at the point of purchase by an electronic device that reads a coded ticket on the product through the use of an electronic reader over which the product passes.) The company’s share price declined further in June 2017 following an investor meeting during which its management announced a downward revision to its margin guidance. At the end of the Reporting Period, we expected the recent Miller Lite deal to unlock greater cost and revenue synergy opportunities than the market originally expected, which could potentially drive significant margin expansion over time. (On October 11, 2016, SABMiller sold its stake in MillerCoors for around $12 billion after the company was acquired by Anheuser-Busch InBev, making Molson Coors the 100% owner of MillerCoors. In effect, MillerCoors became the U.S. business unit of Molson Coors. In Canada, Molson Coors regained the right (from SABMiller) to make and market Miller Genuine Draft and Miller Lite.) Additionally, we believed further consolidation within the industry could have potentially positive implications for Molson Coors Brewing. |
| Q | | How did the Fund use derivatives and similar instruments during the Reporting Period? |
| A | | During the Reporting Period, we did not use derivatives as part of an active management strategy. |
| Q | | Did the Fund make any significant purchases or sales during the Reporting Period? |
| A | | In addition to the purchases already mentioned, we established a Fund position in leading pharmaceutical |
28
PORTFOLIO RESULTS
| | company Eli Lilly. In our view, Eli Lilly has a history of innovation and a strong drug pipeline. We believe the company is aiming to improve its financial profile through a combination of cost savings and revenue growth by reducing its research and development and marketing costs over time. |
| | Shares of the company had been weak in early 2016, and we took the opportunity to initiate a Fund position in what we believe is a high quality company with a leading franchise, strong growth prospects and a healthy and improving financial profile. |
| | We initiated a Fund position in Northern Trust, an international financial services firm. Northern Trust is a company we had previously owned in our portfolios for its high quality fundamentals, including a solid balance sheet and cash position. We believe Northern Trust is well positioned to benefit from interest rate hikes and significant organic growth opportunities within the custody and fund administration business. We are additionally positive on the company’s wealth management segment given its mix of both active and passive strategies. The company’s management has stated it expects to reinvest its earnings into the business while targeting a meaningful return on equity, which could benefit shareholders. Northern Trust also has a high payout ratio and is well capitalized, in our view. Finally, we believe Northern Trust may further benefit from potentially lower corporate tax rates. With what we consider to be an experienced management team and a high quality franchise, we are optimistic on Northern Trust’s growth prospects. |
| | Conversely, in addition to those sales mentioned earlier, we eliminated the Fund’s position in wholesale membership warehouse operator Costco Wholesale. Though we continued to like the business, we believed it no longer merited a position in the Fund, as competition in the grocery sector intensified and its risk/reward opportunity became less compelling, in our view. |
| Q | | Were there any notable changes in the Fund’s weightings during the Reporting Period? |
| A | | In constructing the Fund’s portfolio, we focus on picking stocks rather than on making industry or sector bets. We seek to outpace the benchmark index by overweighting stocks that we expect to outperform and underweighting those that we think may lag. Consequently, changes in its sector weights are generally the direct result of individual stock selection or of stock appreciation or depreciation. That said, during the Reporting Period, the Fund’s exposure to health care and real estate increased and its allocations to consumer staples, information technology and telecommunication services decreased relative to the Russell Index. The Fund’s position in cash increased during the Reporting Period. |
| Q | | How was the Fund positioned relative to its benchmark index at the end of August 2017? |
| A | | At the end of August 2017, the Fund had overweighted positions relative to the Russell Index in the health care, real estate and financials sectors. On the same date, the Fund had underweighted positions compared to the Russell Index in information technology, consumer discretionary, materials and telecommunications and was rather neutrally weighted to the Russell Index in consumer staples, energy and industrials. The Fund had no positions at all in the utilities and telecommunication services sectors at the end of the Reporting Period. |
29
FUND BASICS
Flexible Cap Fund
as of August 31, 2017
| | | | | | | | | | | | | | |
| | PERFORMANCE REVIEW | |
| | | September 1, 2016–August 31, 2017 | | Fund Total Return
(based on NAV)1 | | | S&P 500 Index2 | | | Russell 3000®
Growth Index3 | |
| | Class A | | | 20.14 | % | | | 16.23 | % | | | 20.47 | % |
| | Class C | | | 19.18 | | | | 16.23 | | | | 20.47 | |
| | Institutional | | | 20.61 | | | | 16.23 | | | | 20.47 | |
| | Investor | | | 20.43 | | | | 16.23 | | | | 20.47 | |
| | Class R | | | 19.83 | | | | 16.23 | | | | 20.47 | |
| | | Class R6 | | | 20.61 | | | | 16.23 | | | | 20.47 | |
| | 1 | | The net asset value (“NAV”) represents the net assets of the class of the Fund (ex-dividend) divided by the total number of shares of the class outstanding. The Fund’s performance reflects the reinvestment of dividends and other distributions. The Fund’s performance does not reflect the deduction of any applicable sales charges. |
| | 2 | | After the close of business on August 31, 2017, the Fund’s benchmark was changed to the S&P 500® Index. The S&P 500® Index is the Standard & Poor’s 500 Composite Index of 500 stocks, an unmanaged index of common stock prices. The Index figures do not reflect any deduction for fees, expenses or taxes. It is not possible to invest directly in an index. |
| | 3 | | The unmanaged Russell 3000® Growth Index measures the performance of the 3,000 largest U.S. companies based on total market capitalization. The Index figures do not reflect any deduction for fees, expenses or taxes. It is not possible to invest directly in an index. |
| | | | | | | | | | | | | | | | |
| | STANDARDIZED TOTAL RETURNS4 |
| | | For the period ended 6/30/17 | | One Year | | | Five Year | | | Since Inception | | | Inception Date |
| | Class A | | | 13.60 | % | | | 13.19 | % | | | 9.16 | % | | 1/31/08 |
| | Class C | | | 18.36 | | | | 13.64 | | | | 9.03 | | | 1/31/08 |
| | Institutional | | | 20.69 | | | | 14.94 | | | | 10.27 | | | 1/31/08 |
| | Investor | | | 20.50 | | | | 14.78 | | | | 10.11 | | | 1/31/08 |
| | Class R | | | 20.00 | | | | 14.22 | | | | 9.57 | | | 1/31/08 |
| | | Class R6 | | | 20.69 | | | | N/A | | | | 6.81 | | | 7/31/15 |
| | 4 | | The Standardized Total Returns are average annual total returns or cumulative total returns (only if the performance period is one year or less) as of the most recent calendar quarter-end. They assume reinvestment of all distributions at NAV. These returns reflect a maximum initial sales charge of 5.5% for Class A Shares and the assumed contingent deferred sales charge for Class C Shares (1% if redeemed within 12 months of purchase). Because Institutional, Investor, Class R and Class R6 Shares do not involve a sales charge, such a charge is not applied to their Standardized Total Returns. |
The returns set forth in the tables above represent past performance. Past performance does not guarantee future results. The Fund’s investment return and principal value will fluctuate so that an investor’s shares, when redeemed, may be worth more or less than their original cost. Current performance may be lower or higher than the performance quoted above. Please visit our web site at www.GSAMFUNDS.com to obtain the most recent month-end returns. Performance reflects applicable fee waivers and/or expense limitations in effect during the periods shown. In their absence, performance would be reduced. Returns do not reflect the deduction of taxes that a shareholder would pay on Fund distributions or the redemption of Fund shares.
30
FUND BASICS
| | | | | | | | | | |
| | EXPENSE RATIOS5 | |
| | | | | Net Expense Ratio (Current) | | | Gross Expense Ratio (Before Waivers) | |
| | Class A | | | 0.95 | % | | | 2.61 | % |
| | Class C | | | 1.70 | | | | 3.36 | |
| | Institutional | | | 0.59 | | | | 2.23 | |
| | Investor | | | 0.70 | | | | 2.30 | |
| | Class R | | | 1.20 | | | | 2.87 | |
| | | Class R6 | | | 0.58 | | | | 2.21 | |
| | 5 | | The expense ratios of the Fund, both current (net of applicable fee waivers and/or expense limitations) and before waivers (gross of applicable fee waivers and/or expense limitations) are as set forth above according to the most recent publicly available Prospectus for the Fund and may differ from the expense ratios disclosed in the Financial Highlights in this report. Pursuant to a contractual arrangement, the Fund’s waivers and/or expense limitations will remain in place through at least August 31, 2018, and prior to such date the Investment Adviser may not terminate the arrangements without the approval of the Fund’s Board of Trustees. If these arrangements are discontinued in the future, the expense ratios may change without shareholder approval. |
| | | | | | | | |
| | TOP TEN HOLDINGS AS OF 8/31/176 |
| | | Holding | | % of Net Assets | | | Line of Business |
| | Apple, Inc. | | | 6.4 | % | | Technology Hardware, Storage &
Peripherals |
| | Facebook, Inc. Class A | | | 4.2 | | | Internet Software & Services |
| | Amazon.com, Inc. | | | 3.2 | | | Internet & Direct Marketing
Retail |
| | Microsoft Corp. | | | 2.8 | | | Software |
| | Alphabet, Inc. Class C | | | 2.4 | | | Internet Software & Services |
| | MasterCard, Inc. Class A | | | 2.4 | | | IT Services |
| | Alphabet, Inc. Class A | | | 2.3 | | | Internet Software & Services |
| | Honeywell International, Inc. | | | 2.1 | | | Industrial Conglomerates |
| | Comcast Corp. Class A | | | 1.9 | | | Media |
| | | Xylem, Inc. | | | 1.8 | | | Machinery |
| | 6 | | The top 10 holdings may not be representative of the Fund’s future investments. |
31
FUND BASICS
|
| FUND VS. BENCHMARK SECTOR ALLOCATION7 |
| As of August 31, 2017 |
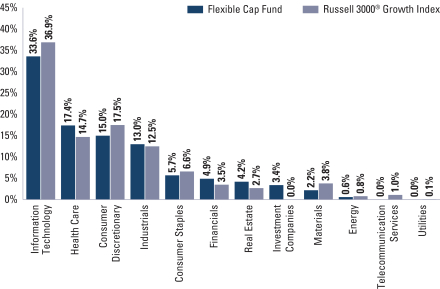
| | 7 | | The Fund is actively managed and, as such, its composition may differ over time. Consequently, the Fund’s overall sector allocations may differ from the percentages contained in the graph above. The graph categorizes investments using the Global Industry Classification Standard (“GICS”), however, the sector classifications used by the portfolio management team may differ from GICS. The percentage shown for each investment category reflects the value of investments in that category as a percentage of market value (excluding investments in the securities lending reinvestment vehicle, if any). Investments in the securities lending reinvestment vehicle represented 1.8% of the Fund’s net assets as of August 31, 2017. The graph depicts the Fund’s investments but may not represent the Fund’s market exposure due to the exclusion of certain derivatives, if any, as listed in the Additional Investment Information section of the Schedule of Investments. |
32
GOLDMAN SACHS FLEXIBLE CAP FUND
Performance Summary
August 31, 2017
The following graph shows the value, as of August 31, 2017, of a $1,000,000 investment made on January 31, 2008 (commencement of operations) in Institutional Shares at NAV. For comparative purposes, the performance of the Fund’s current benchmark, the S&P 500® Index (with dividends reinvested), and the Fund’s former benchmark, the Russell 3000 Growth Index, is shown. As of August 31, 2017, the Fund’s benchmark was changed from the Russell 3000® Growth Index to the S&P 500® Index. The Investment Adviser believes that the S&P 500® Index is a more appropriate index against which to measure performance in light of the changes to the Fund’s investment strategy. This performance data represents past performance and should not be considered indicative of future performance, which will fluctuate with changes in market conditions. These performance fluctuations may cause an investor’s shares, when redeemed, to be worth more or less than their original cost. Performance reflects applicable fee waivers and/or expense limitations in effect during the periods shown and in their absence, performance would be reduced. Returns do not reflect the deduction of taxes that a shareholder would pay on Fund distributions or the redemption of Fund shares. Performance of Class A, Class C, Investor, Class R and Class R6 Shares will vary from Institutional Shares due to differences in class specific fees and any applicable sales charges. In addition to the Investment Adviser’s decisions regarding issuer/industry investment selection and allocation, other factors may affect Fund performance. These factors include, but are not limited to, Fund operating fees and expenses, portfolio turnover and subscription and redemption cash flows affecting the Fund.
|
| Flexible Cap Fund’s Lifetime Performance |
Performance of a $1,000,000 Investment, including any applicable sales charges, with distributions reinvested, from January 31, 2008 through August 31, 2017.
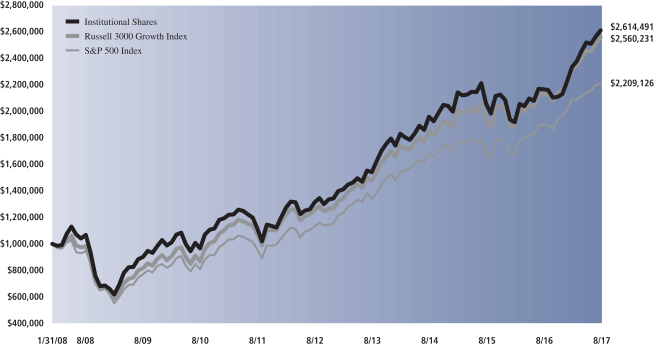
| | | | | | | | | | |
| Average Annual Total Return through August 31, 2017 | | | One Year | | | | Five Years | | | Since Inception |
Class A (Commenced January 31, 2008) | | | | | | | | | | |
Excluding sales charges | | | 20.14% | | | | 14.28% | | | 10.08% |
Including sales charges | | | 13.57% | | | | 12.99% | | | 9.44% |
|
Class C (Commenced January 31, 2008) | | | | | | | | | | |
Excluding contingent deferred sales charges | | | 19.18% | | | | 13.42% | | | 9.29% |
Including contingent deferred sales charges | | | 18.18% | | | | 13.42% | | | 9.29% |
|
Institutional Class (Commenced January 31, 2008) | | | 20.61% | | | | 14.73% | | | 10.54% |
|
Investor (Commenced January 31, 2008) | | | 20.43% | | | | 14.58% | | | 10.38% |
|
Class R (Commenced January 31, 2008) | | | 19.83% | | | | 14.02% | | | 9.84% |
|
Class R6 (Commenced July 31, 2015) | | | 20.61% | | | | N/A | | | 8.28% |
|
33
PORTFOLIO RESULTS
Goldman Sachs Growth Opportunities Fund
Portfolio Composition
The Fund invests primarily in medium-sized growth companies. Since the Fund’s inception, the Goldman Sachs Growth Equity Investment Team has focused on several key investment criteria that it believes can drive a company’s growth over the long term. These characteristics are: dominant market share, established brand name, pricing power, recurring revenue stream, free cash flow, high returns on invested capital, predictable growth, sustainable growth, long product life cycle, enduring competitive advantage, favorable demographic trends and excellent management. The Team strives to purchase these companies at reasonable valuations in order to capture the full benefits of their growth.
Portfolio Management Discussion and Analysis
Below, the Goldman Sachs Growth Equity Investment Team discusses the Goldman Sachs Growth Opportunities Fund’s (the “Fund”) performance and positioning for the 12-month period ended August 31, 2017 (the “Reporting Period”).
| Q | | How did the Fund perform during the Reporting Period? |
| A | | During the Reporting Period, the Fund’s Class A, C, Institutional, Service, Investor, R and R6 Shares generated average annual total returns, without sales charges, of 13.40%, 12.49%, 13.81%, 13.22%, 13.71%, 13.13% and 13.80%, respectively. These returns compare to the 14.52% average annual total return of the Fund’s benchmark, the Russell Midcap® Growth Index (with dividends reinvested) (the “Russell Index”), during the same period. |
| Q | | What key factors were responsible for the Fund’s performance during the Reporting Period? |
| A | | The Fund generated positive double-digit absolute returns, but stock selection overall detracted from the Fund’s performance relative to the Russell Index during the Reporting Period. Sector allocation as a whole had a rather neutral effect on the Fund’s performance during the Reporting Period. |
| Q | | Which equity market sectors most significantly affected Fund performance? |
| A | | Detracting most from the Fund’s relative results was challenging stock selection in the information technology, materials and financials sectors. The sectors that contributed most positively to the Fund’s relative performance during the Reporting Period were health care, industrials and real estate, wherein effective stock selection drove results. |
| Q | | Which stocks detracted significantly from the Fund’s performance during the Reporting Period? |
| A | | Detracting most from the Fund’s results relative to the Russell Index were positions in auto parts retailer Advance Auto Parts, food manufacturer TreeHouse Foods and consumer products retailer Newell Brands. |
| | Through most of the Reporting Period, Advance Auto Parts’ stock price had been weak based largely on a combination of concerns about increased competition within the auto parts industry and weaker than market expected margins. Further, the company announced disappointing results throughout the Reporting Period. Advance Auto Parts’ management explained the disappointing results as being caused by mild winter weather and weaker consumer demand. We decided to exit the Fund’s position to allocate capital in companies in which we had higher conviction. |
| | Shares of TreeHouse Foods declined after the company reported mixed second quarter 2016 earnings and announced the retirement of its Chief Financial Officer. Then, in November 2016, the company reported disappointing third calendar quarter results with sales and earnings below market expectations. TreeHouse Foods also announced management changes, which, alongside plans to reorganize its sales force, led to some near-term uncertainty. Following the drop in its stock price, however, the company saw better performance, especially in February 2017 when it announced earnings that were better than the market feared, causing its stock price to regain some of the prior losses. In May 2017, its shares fell |
34
PORTFOLIO RESULTS
| | sharply following the company’s first quarter 2017 earnings release in which it missed earnings per share market estimates due to weaker than market expected margins. We decided to exit the Fund’s position due to what we believed was ongoing uncertainty around the company’s management changes and the integration of recent merger and acquisition activity. |
| | In late 2016, Newell Brands reported third quarter 2016 results that were below market expectations, causing its share price to decline. There was short-term concern that sales momentum may slow in the coming quarters due to ongoing integration work. During May 2017, the company’s stock rallied after it reported strong first quarter 2017 results led by better than market expected core sales growth. Newell Brands also reported earnings per share that exceeded market estimates while raising guidance. This was well received by investors as many of the company’s peers had reported disappointing earnings around the same time. The company’s share price, however, then sharply declined in early August 2017 following a disappointing earnings release in which organic sales were below consensus estimates. Investors reacted negatively to this, as the consumer sector has been challenged in 2017 year to date through the end of August. Despite its underperformance, we continued to like the business and believed, at the end of the Reporting Period, that Newell Brands potentially represents a multi-year, double-digit earnings growth story. In our view, the company’s acquisition of Jarden, a similar holding company of consumer durable goods, could yield meaningful synergies and earnings flexibility. Overall, we believed at the end of the Reporting Period that Newell Brands has a strong management team with a demonstrated track record of delivering shareholder value through both organic growth and acquisitions. |
| Q | | What were some of the Fund’s best-performing individual stocks? |
| A | | The Fund benefited most relative to the Russell Index from positions in fast casual restaurant chain Panera Bread, precision and measuring instruments manufacturer Mettler-Toledo International and diversified technology company Roper Technologies. |
| | Panera Bread’s gains were largely driven by JAB Holdings’ purchase of the fast casual restaurant chain. The premium paid for Panera Bread was a positive recognition of its previous investment to improve efficiencies and grow margins. Following strong performance and seeing a potential shift in leadership, we felt it prudent to exit the Fund’s position and look for opportunities elsewhere. |
| | In early February 2017, Mettler-Toledo International reported strong fourth quarter 2016 results that beat market estimates across the majority of meaningful metrics. Its share price continued to increase through the Reporting Period, as the company showed healthy fundamentals across segments and geographies, leading to strong organic growth and, ultimately, to better than market expected earnings growth. At the end of the Reporting Period, we believed Mettler-Toledo International was a unique asset with robust upside potential and strong fundamentals. |
| | Roper Technologies provides engineered products and solutions for the global niche markets. For much of the Reporting Period, the company performed in line with the overall market. However, in February 2017, its stock price spiked, as it announced solid earnings that beat market expectations on earnings per share and also announced strong guidance. The company released strong results the next two quarters, beating market estimates and raising guidance in each. Roper Technologies focuses on cash return on investment (“CROI”) metrics, which have historically served the company well. In our view, Roper Technologies has a significant runway for its differentiated merger and acquisition strategy to potentially grow the business. We think the company’s margins and CROI could continue to expand as it transitions from an industrial company to a more software aligned company. At the end of the Reporting Period, we were optimistic on what we viewed as the company’s innovative measures, disciplined capital deployment and its management’s solid execution ability. |
| Q | | How did the Fund use derivatives and similar instruments during the Reporting Period? |
| A | | During the Reporting Period, we did not use derivatives as part of an active management strategy. |
| Q | | Did the Fund make any significant purchases or sales during the Reporting Period? |
| A | | We initiated a Fund position in Northern Trust, an international financial services firm. Northern Trust is a company we had previously owned in our portfolios for its high quality fundamentals, including a solid balance sheet and cash position. We believe Northern Trust is well positioned to benefit from interest rate hikes and significant organic growth opportunities within the custody and fund administration business. We are additionally positive on the |
35
PORTFOLIO RESULTS
| | company’s wealth management segment given its mix of both active and passive strategies. The company’s management has stated it expects to reinvest its earnings into the business while targeting a meaningful return on equity, which could benefit shareholders. Northern Trust also has a high payout ratio and is well capitalized, in our view. Finally, we believe Northern Trust may further benefit from potentially lower corporate tax rates. With what we consider to be an experienced management team and a high quality franchise, we are optimistic on Northern Trust’s growth prospects. |
| | We established a Fund position in Total System Services, a payment processing services provider. We view Total System Services as a high quality payments franchise, and we bought the stock on the back of what we considered to be an attractive valuation. The company’s share price dropped during the Reporting Period, as it released second quarter 2017 results with slower organic revenue growth and guidance on the low end. Total System Services also faces regulatory uncertainties, which we think will subside over time. In our view, these headwinds are near-term in nature and have created an opportunity to hold shares in a fundamentally solid company with potential for strong organic growth that may lead to multiple expansion. |
| | Conversely, in addition to those sales already mentioned, we exited the Fund’s position in Fidelity National Information Services. In February 2017, the company reported fourth quarter 2016 results that were in line with market expectations but lowered its outlook for 2017. Based on this disappointing outlook, we decided to sell the Fund’s position and allocate capital into other ideas with what we believed to be more compelling risk/reward opportunities. |
| Q | | Were there any notable changes in the Fund’s weightings during the Reporting Period? |
| A | | In constructing the Fund’s portfolio, we focus on picking stocks rather than on making industry or sector bets. We seek to outpace the benchmark index by overweighting stocks that we expect to outperform and underweighting those that we think may lag. Consequently, changes in its sector weights are generally the direct result of individual stock selection or of stock appreciation or depreciation. That said, during the Reporting Period, the Fund’s exposure to financials, health care, industrials and information technology increased and its allocations to consumer staples, materials and telecommunication services decreased relative to the Russell Index. |
| Q | | How was the Fund positioned relative to its benchmark index at the end of August 2017? |
| A | | At the end of August 2017, the Fund had overweighted positions relative to the Russell Index in the financials, health care and industrials sectors. On the same date, the Fund had underweighted positions compared to the Russell Index in consumer discretionary, information technology and materials. The Fund was rather neutrally weighted to the Index in consumer staples, energy and real estate and had no positions at all in telecommunication services and utilities at the end of the Reporting Period. |
36
FUND BASICS
Growth Opportunities Fund
as of August 31, 2017
| | | | | | | | | | |
| | PERFORMANCE REVIEW | |
| | | September 1, 2016–August 31, 2017 | | Fund Total Return
(based on NAV)1 | | | Russell Midcap®
Growth Index2 | |
| | Class A | | | 13.40 | % | | | 14.52 | % |
| | Class C | | | 12.49 | | | | 14.52 | |
| | Institutional | | | 13.81 | | | | 14.52 | |
| | Service | | | 13.22 | | | | 14.52 | |
| | Investor | | | 13.71 | | | | 14.52 | |
| | Class R | | | 13.13 | | | | 14.52 | |
| | | Class R6 | | | 13.80 | | | | 14.52 | |
| | 1 | | The net asset value (“NAV”) represents the net assets of the class of the Fund (ex-dividend) divided by the total number of shares of the class outstanding. The Fund’s performance reflects the reinvestment of dividends and other distributions. The Fund’s performance does not reflect the deduction of any applicable sales charges. |
| | 2 | | The Russell Midcap® Growth Index is an unmanaged market capitalization weighted index that measures the performance of those Russell Midcap companies with higher price-to-book ratios and higher forecasted growth values. The Index figures do not reflect any deduction for fees, expenses or taxes. It is not possible to invest directly in an index. |
| | | | | | | | | | | | | | | | | | | | |
| | STANDARDIZED TOTAL RETURNS3 |
| | | For the period ended 6/30/17 | | One Year | | | Five Years | | | Ten Years | | | Since Inception | | | Inception Date |
| | Class A | | | 7.50 | % | | | 10.05 | % | | | 7.20 | % | | | 10.21 | % | | 5/24/99 |
| | Class C | | | 11.93 | | | | 10.47 | | | | 7.00 | | | | 9.73 | | | 5/24/99 |
| | Institutional | | | 14.18 | | | | 11.73 | | | | 8.23 | | | | 10.99 | | | 5/24/99 |
| | Service | | | 13.55 | | | | 11.16 | | | | 7.69 | | | | 10.43 | | | 5/24/99 |
| | Investor | | | 14.02 | | | | 11.58 | | | | N/A | | | | 8.23 | | | 11/30/07 |
| | Class R | | | 13.51 | | | | 11.03 | | | | N/A | | | | 7.70 | | | 11/30/07 |
| | | Class R6 | | | 14.22 | | | | N/A | | | | N/A | | | | 3.90 | | | 7/31/15 |
| | 3 | | The Standardized Total Returns are average annual total returns or cumulative total returns (only if the performance period is one year or less) as of the most recent calendar quarter-end. They assume reinvestment of all distributions at NAV. These returns reflect a maximum initial sales charge of 5.5% for Class A Shares and the assumed contingent deferred sales charge for Class C Shares (1% if redeemed within 12 months of purchase). Because Institutional, Service, Investor, Class R and Class R6 Shares do not involve a sales charge, such a charge is not applied to their Standardized Total Returns. |
The returns set forth in the tables above represent past performance. Past performance does not guarantee future results. The Fund’s investment return and principal value will fluctuate so that an investor’s shares, when redeemed, may be worth more or less than their original cost. Current performance may be lower or higher than the performance quoted above. Please visit our web site at www.GSAMFUNDS.com to obtain the most recent month-end returns. Performance reflects applicable fee waivers and/or expense limitations in effect during the periods shown. In their absence, performance would be reduced. Returns do not reflect the deduction of taxes that a shareholder would pay on Fund distributions or the redemption of Fund shares.
37
FUND BASICS
| | | | | | | | | | |
| | EXPENSE RATIOS4 | |
| | | | | Net Expense Ratio (Current) | | | Gross Expense Ratio (Before Waivers) | |
| | Class A | | | 1.32 | % | | | 1.42 | % |
| | Class C | | | 2.07 | | | | 2.17 | |
| | Institutional | | | 0.95 | | | | 1.02 | |
| | Service | | | 1.45 | | | | 1.52 | |
| | Investor | | | 1.07 | | | | 1.17 | |
| | Class R | | | 1.57 | | | | 1.67 | |
| | | Class R6 | | | 0.93 | | | | 1.01 | |
| | 4 | | The expense ratios of the Fund, both current (net of applicable fee waivers and/or expense limitations) and before waivers (gross of applicable fee waivers and/or expense limitations) are as set forth above according to the most recent publicly available Prospectus for the Fund and may differ from the expense ratios disclosed in the Financial Highlights in this report. Pursuant to a contractual arrangement, the Fund’s waivers and/or expense limitations will remain in place through at least April 28, 2018, and prior to such date the Investment Adviser may not terminate the arrangements without the approval of the Fund’s Board of Trustees. If these arrangements are discontinued in the future, the expense ratios may change without shareholder approval. |
| | | | | | | | |
| | TOP TEN HOLDINGS AS OF 8/31/175 |
| | | Holding | | % of Net Assets | | | Line of Business |
| | Amphenol Corp. Class A | | | 3.2 | | | Electronic Equipment, Instruments &
Components |
| | Roper Technologies, Inc. | | | 2.8 | | | Industrial Conglomerates |
| | Xylem, Inc. | | | 2.6 | | | Machinery |
| | The Middleby Corp. | | | 2.5 | | | Machinery |
| | Edwards Lifesciences Corp. | | | 2.4 | | | Health Care Equipment & Supplies |
| | Zoetis, Inc. | | | 2.2 | | | Pharmaceuticals |
| | Northern Trust Corp. | | | 2.2 | | | Capital Markets |
| | Agilent Technologies, Inc. | | | 2.0 | | | Life Sciences Tools & Services |
| | Black Knight Financial Services, | | | 2.0 | | | IT Services |
| | Inc. Class A | | | | | | |
| | | Total System Services, Inc. | | | 2.0 | | | IT Services |
| | 5 | | The top 10 holdings may not be representative of the Fund’s future investments. |
38
FUND BASICS
|
| FUND VS. BENCHMARK SECTOR ALLOCATION6 |
| As of August 31, 2017 |
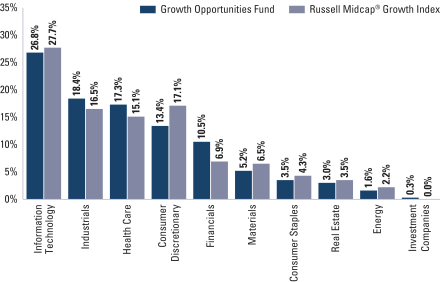
| | 6 | | The Fund is actively managed and, as such, its composition may differ over time. Consequently, the Fund’s overall sector allocations may differ from the percentages contained in the graph above. The graph categorizes investments using the Global Industry Classification Standard (“GICS”), however, the sector classifications used by the portfolio management team may differ from GICS. The percentage shown for each investment category reflects the value of investments in that category as a percentage of market value. The graph depicts the Fund’s investments but may not represent the Fund’s market exposure due to the exclusion of certain derivatives, if any, as listed in the Additional Investment Information section of the Schedule of Investments. |
39
GOLDMAN SACHS GROWTH OPPORTUNITIES FUND
Performance Summary
August 31, 2017
The following graph shows the value, as of August 31, 2017, of a $1,000,000 investment made on September 1, 2007 in Institutional Shares at NAV. For comparative purposes, the performance of the Fund’s benchmark the Russell Midcap® Growth Index (with dividends reinvested), is shown. This performance data represents past performance and should not be considered indicative of future performance, which will fluctuate with changes in market conditions. These performance fluctuations may cause an investor’s shares, when redeemed, to be worth more or less than their original cost. Performance reflects applicable fee waivers and/or expense limitations in effect during the periods shown and in their absence, performance would be reduced. Returns do not reflect the deduction of taxes that a shareholder would pay on Fund distributions or the redemption of Fund shares. Performance of Class A, Class C, Service, Investor, Class R and Class R6 Shares will vary from Institutional Shares due to differences in class specific fees and any applicable sales charges. In addition to the Investment Adviser’s decisions regarding issuer/industry investment selection and allocation, other factors may affect Fund performance. These factors include, but are not limited to, Fund operating fees and expenses, portfolio turnover and subscription and redemption cash flows affecting the Fund.
|
| Growth Opportunities Fund’s 10 Year Performance |
Performance of a $1,000,000 Investment, including any applicable sales charges, with distributions reinvested, from September 1, 2007 through August 31, 2017.
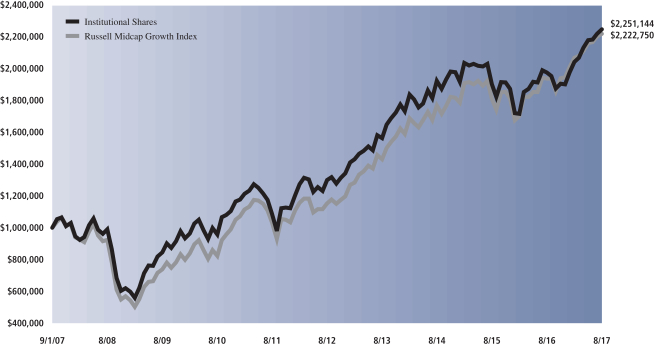
| | | | | | | | | | | | | | |
| Average Annual Total Return through August 31, 2017 | | | One Year | | | | Five Years | | | | Ten Years | | | Since Inception |
Class A (Commenced May 24, 1999) | | | | | | | | | | | | | | |
Excluding sales charges | | | 13.40% | | | | 11.15% | | | | 8.02% | | | 10.62% |
Including sales charges | | | 7.18% | | | | 9.90% | | | | 7.41% | | | 10.28% |
|
Class C (Commenced May 24, 1999) | | | | | | | | | | | | | | |
Excluding contingent deferred sales charges | | | 12.49% | | | | 10.32% | | | | 7.21% | | | 9.80% |
Including contingent deferred sales charges | | | 11.46% | | | | 10.32% | | | | 7.21% | | | 9.80% |
|
Institutional Class (Commenced May 24, 1999) | | | 13.81% | | | | 11.58% | | | | 8.45% | | | 11.06% |
|
Service Class (Commenced May 24, 1999) | | | 13.22% | | | | 11.02% | | | | 7.91% | | | 10.50% |
|
Investor (Commenced November 30, 2007) | | | 13.71% | | | | 11.43% | | | | N/A | | | 8.40% |
|
Class R (Commenced November 30, 2007) | | | 13.13% | | | | 10.88% | | | | N/A | | | 7.86% |
|
Class R6 (Commenced July 31, 2015) | | | 13.80% | | | | N/A | | | | N/A | | | 5.01% |
|
40
PORTFOLIO RESULTS
Goldman Sachs Small/Mid Cap Growth Fund
Portfolio Composition
The Fund invests primarily in small and medium-sized growth companies. Since the Fund’s inception, the Goldman Sachs Growth Equity Investment Team has focused on several key investment criteria that it believes can drive a company’s growth over the long term. These characteristics are: dominant market share, established brand name, pricing power, recurring revenue stream, free cash flow, high returns on invested capital, predictable growth, sustainable growth, long product life cycle, enduring competitive advantage, favorable demographic trends and excellent management. The Team strives to purchase these companies at reasonable valuations in order to capture the full benefits of their growth.
Portfolio Management Discussion and Analysis
Below, the Goldman Sachs Growth Equity Investment Team discusses the Goldman Sachs Small/Mid Cap Growth Fund’s (the “Fund”) performance and positioning for the 12-month period ended August 31, 2017 (the “Reporting Period”).
| Q | | How did the Fund perform during the Reporting Period? |
| A | | During the Reporting Period, the Fund’s Class A, C, Institutional, Service, Investor, R and R6 Shares generated average annual total returns, without sales charges, of 13.78%, 12.98%, 14.21%, 13.59%, 14.06%, 13.47% and 14.26%, respectively. These returns compare to the 15.57% average annual total return of the Fund’s benchmark, the Russell 2500® Growth Index (with dividends reinvested) (the “Russell Index”), during the same period. |
| Q | | What key factors were responsible for the Fund’s performance during the Reporting Period? |
| A | | The Fund generated positive double-digit absolute returns, but stock selection overall detracted from the Fund’s performance relative to the Russell Index during the Reporting Period. Sector allocation as a whole contributed positively, albeit more modestly. |
| Q | | Which equity market sectors most significantly affected Fund performance? |
| A | | Detracting from relative results most during the Reporting Period were health care, information technology and materials, wherein stock selection was challenging. Effective stock selection in the financials, real estate and industrials sectors helped the Fund’s performance most relative to the Russell Index. Allocation positioning in financials and real estate also buoyed the Fund’s relative results. |
| Q | | Which stocks detracted significantly from the Fund’s performance during the Reporting Period? |
| A | | Among those stocks detracting most from the Fund’s results relative to the Russell Index were positions in digital printing company Electronics for Imaging, auto parts retailer Advance Auto Parts and food manufacturer TreeHouse Foods. |
| | In October 2016 and April 2017, Electronics for Imaging reported mixed quarterly results that caused its stock price to decline. However, the majority of its weak performance occurred at the beginning of August 2017 when the company indefinitely postponed the release of its June 2017 quarterly results, as there was an issue stemming from the timing of revenue recognition. While the company announced there was no material aggregate misstatement, the uncertainty surrounding the situation caused its stock price to plummet. In our view, at the end of the Reporting Period, the company still had a dominant market position in its legacy printer controllers business, which provides strong cash flow to fund other of its growth businesses, and is well positioned for the transition from analog to digital printing. In addition, we believed the company has an effective and disciplined merger and acquisition strategy that supplements organic growth in its inkjet printing and software businesses. Overall, we believed the company was positioned well to benefit from favorable secular trends should analog continue to shift toward digital printing. |
| | Through most of the Reporting Period, Advance Auto Parts’ stock price had been weak based largely on a combination of concerns about increased competition within the auto parts industry and weaker than market expected margins. Further, |
41
PORTFOLIO RESULTS
| | the company announced disappointing results throughout the Reporting Period. Advance Auto Parts’ management explained the disappointing results as being caused by mild winter weather and weaker consumer demand. We decided to exit the Fund’s position to allocate capital in companies in which we had higher conviction. |
| | Shares of TreeHouse Foods declined after the company reported mixed second quarter 2016 earnings and announced the retirement of its Chief Financial Officer. Then, in November 2016, the company reported disappointing third calendar quarter results with sales and earnings below market expectations. TreeHouse Foods also announced management changes, which, alongside plans to reorganize its sales force, led to some near-term uncertainty. Following the drop in its stock price, however, the company saw better performance, especially in February 2017 when it announced earnings that were better than the market feared, causing its stock price to regain some of the prior losses. In May 2017, its shares fell sharply following the company’s first quarter 2017 earnings release in which it missed earnings per share market estimates due to weaker than market expected margins. We decided to exit the Fund’s position due to what we believed was ongoing uncertainty around the company’s management changes and the integration of recent merger and acquisition activity. |
| Q | | What were some of the Fund’s best-performing individual stocks? |
| A | | Among those stocks the Fund benefited most from relative to the Russell Index were positions in biopharmaceutical company Exelixis, fast casual restaurant chain Panera Bread and veterinary clinics operator VCA. |
| | Exelixis engages in the development and commercialization of oncology treatments. Its shares gained following strong results during the Reporting Period. Exelixis’ main drug, Cabometyx, which is in phase two kidney cancer trials, reported sales that beat market expectations. The drug has been capturing market share and posting positive test results at what we consider to be an impressive rate. We believe the drug can continue to be a real earnings growth driver. At the end of the Reporting Period, we remained positive on the company and believed it is a well-run and profitable oncology company that has what we view as attractive growth and value opportunities within its industry. |
| | Panera Bread’s gains were largely driven by JAB Holdings’ purchase of the fast casual restaurant chain. The premium paid for Panera Bread was a positive recognition of its previous investment to improve efficiencies and grow margins. Following strong performance and seeing a potential shift in leadership, we felt it prudent to exit the Fund’s position and look for opportunities elsewhere. |
| | VCA announced during the Reporting Period that it had accepted a buyout offer from Mars, Inc. We had initiated a position in VCA earlier in 2016, as we believed there was positive momentum in the U.S. veterinary market, and the company’s same-store revenue growth had remained strong. We were encouraged by this acquisition news and exited the Fund’s position in VCA accordingly. |
| Q | | How did the Fund use derivatives and similar instruments during the Reporting Period? |
| A | | During the Reporting Period, we did not use derivatives as part of an active management strategy. |
| Q | | Did the Fund make any significant purchases or sales during the Reporting Period? |
| A | | We initiated a Fund position in Dunkin’ Brands Group. We believe Dunkin’ Brands Group is a high quality business due to its entirely franchised restaurant model, allowing the parent company to maintain what we view as an attractive capital structure. We are also positive on the company’s recent hire of Dave Hoffman, a well respected veteran in the industry, who is working to use his experience at McDonald’s to introduce growth initiatives, such as a simplified menu and a strong digital platform. Overall, we believe Dunkin’ Brands Groups presents a strong growth story at attractive valuations. |
| | We established a Fund position in Total System Services, a payment processing services provider. We view Total System Services as a high quality payments franchise, and we bought the stock on the back of what we considered to be an attractive valuation. The company’s share price dropped during the Reporting Period, as it released second quarter 2017 results with slower organic revenue growth and guidance on the low end. Total System Services also faces regulatory uncertainties, which we think will subside over time. In our view, these headwinds are near-term in nature and have created an opportunity to hold shares in a fundamentally solid company with potential for strong organic growth that may lead to multiple expansion. |
| | Conversely, we sold several Fund positions during the Reporting Period, with the most significant being those of Panera Bread and VCA, each mentioned earlier. |
42
PORTFOLIO RESULTS
| Q | | Were there any notable changes in the Fund’s weightings during the Reporting Period? |
| A | | In constructing the Fund’s portfolio, we focus on picking stocks rather than on making industry or sector bets. We seek to outpace the benchmark index by overweighting stocks that we expect to outperform and underweighting those that we think may lag. Consequently, changes in its sector weights are generally the direct result of individual stock selection or of stock appreciation or depreciation. That said, during the Reporting Period, the Fund’s exposure to energy, financials, health care, industrials and information technology increased and its allocations to consumer discretionary, consumer staples, materials and telecommunication services decreased relative to the Russell Index. The Fund’s position in cash increased during the Reporting Period. |
| Q | | How was the Fund positioned relative to its benchmark index at the end of August 2017? |
| A | | At the end of August 2017, the Fund had overweighted positions relative to the Russell Index in the health care and financials sectors. On the same date, the Fund had underweighted positions compared to the Russell Index in consumer discretionary, real estate, information technology and materials. The Fund was rather neutrally weighted to the Russell Index in consumer staples, energy and industrials and had no positions at all in telecommunication services and utilities at the end of the Reporting Period. |
43
FUND BASICS
Small/Mid Cap Growth Fund
as of August 31, 2017
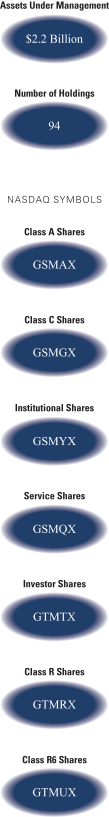
| | | | | | | | | | |
| | PERFORMANCE REVIEW | |
| | | September 1, 2016–August 31, 2017 | | Fund Total Return
(based on NAV)1 | | | Russell 2500®
Growth Index2 | |
| | Class A | | | 13.78 | % | | | 15.57 | % |
| | Class C | | | 12.98 | | | | 15.57 | |
| | Institutional | | | 14.21 | | | | 15.57 | |
| | Service | | | 13.59 | | | | 15.57 | |
| | Investor | | | 14.06 | | | | 15.57 | |
| | Class R | | | 13.47 | | | | 15.57 | |
| | | Class R6 | | | 14.26 | | | | 15.57 | |
| | 1 | | The net asset value (“NAV”) represents the net assets of the class of the Fund (ex-dividend) divided by the total number of shares of the class outstanding. The Fund’s performance reflects the reinvestment of dividends and other distributions. The Fund’s performance does not reflect the deduction of any applicable sales charges. |
| | 2 | | The Russell 2500® Growth Index is an unmanaged index that measures the performance of the small- to mid-cap growth segment of the US equity universe. The Russell 2500® Growth Index is constructed to provide a comprehensive and unbiased barometer of the small- to mid-cap growth market. Based on ongoing empirical research of investment manager behavior, the methodology used to determine growth probability approximates the aggregate small- to mid-cap growth manager’s opportunity set. The Index figures do not reflect any deduction for fees, expenses or taxes. It is not possible to invest directly in an index. |
| | | | | | | | | | | | | | | | | | | | | | |
| | STANDARDIZED TOTAL RETURNS3 | |
| | | For the period ended 6/30/17 | | One Year | | | Five Years | | | Ten Years | | | Since Inception | | | Inception Date | |
| | Class A | | | 9.91 | % | | | 11.90 | % | | | 8.25 | % | | | 9.65 | % | | | 6/30/05 | |
| | Class C | | | 14.34 | | | | 12.33 | | | | 8.04 | | | | 9.31 | | | | 6/30/05 | |
| | Institutional | | | 16.70 | | | | 13.61 | | | | 9.28 | | | | 10.57 | | | | 6/30/05 | |
| | Service | | | 16.14 | | | | 13.06 | | | | 8.74 | | | | 10.02 | | | | 6/30/05 | |
| | Investor | | | 16.59 | | | | 13.47 | | | | N/A | | | | 9.33 | | | | 11/30/07 | |
| | Class R | | | 15.96 | | | | 12.89 | | | | N/A | | | | 8.79 | | | | 11/30/07 | |
| | | Class R6 | | | 16.69 | | | | N/A | | | | N/A | | | | 1.83 | | | | 7/31/15 | |
| | 3 | | The Standardized Total Returns are average annual total returns or cumulative total returns (only if the performance period is one year or less) as of the most recent calendar quarter-end. They assume reinvestment of all distributions at NAV. These returns reflect a maximum initial sales charge of 5.5% for Class A Shares and the assumed contingent deferred sales charge for Class C Shares (1% if redeemed within 12 months of purchase). Because Institutional, Service, Investor, Class R, and Class R6 Shares do not involve a sales charge, such a charge is not applied to their Standardized Total Returns. |
The returns set forth in the tables above represent past performance. Past performance does not guarantee future results. The Fund’s investment return and principal value will fluctuate so that an investor’s shares, when redeemed, may be worth more or less than their original cost. Current performance may be lower or higher than the performance quoted above. Please visit our web site at www.GSAMFUNDS.com to obtain the most recent month-end returns. Performance reflects applicable fee waivers and/or expense limitations in effect during the periods shown. In their absence, performance would be reduced. Returns do not reflect the deduction of taxes that a shareholder would pay on Fund distributions or the redemption of Fund shares.
44
FUND BASICS
| | | | | | | | | | |
| | EXPENSE RATIOS4 | |
| | | | | Net Expense Ratio (Current) | | | Gross Expense Ratio (Before Waivers) | |
| | Class A | | | 1.31 | % | | | 1.45 | % |
| | Class C | | | 2.06 | | | | 2.20 | |
| | Institutional | | | 0.93 | | | | 1.05 | |
| | Service | | | 1.43 | | | | 1.55 | |
| | Investor | | | 1.06 | | | | 1.20 | |
| | Class R | | | 1.56 | | | | 1.70 | |
| | | Class R6 | | | 0.92 | | | | 1.04 | |
| | 4 | | The expense ratios of the Fund, both current (net of applicable fee waivers and/or expense limitations) and before waivers (gross of applicable fee waivers and/or expense limitations) are as set forth above according to the most recent publicly available Prospectus for the Fund and may differ from the expense ratios disclosed in the Financial Highlights in this report. Pursuant to a contractual arrangement, the Fund’s waivers and/or expense limitations will remain in place through at least April 28, 2018, and prior to such date the Investment Adviser may not terminate the arrangements without the approval of the Fund’s Board of Trustees. If these arrangements are discontinued in the future, the expense ratios may change without shareholder approval. |
| | | | | | | | |
| | TOP TEN HOLDINGS AS OF 8/31/175 |
| | | Holding | | % of Net Assets | | | Line of Business |
| | The Middleby Corp. | | | 2.7 | % | | Machinery |
| | Xylem, Inc. | | | 2.4 | | | Machinery |
| | Black Knight Financial Services, Inc. Class A | | | 2.3 | | | IT Services |
| | Eagle Bancorp, Inc. | | | 1.9 | | | Banks |
| | Global Payments, Inc. | | | 1.9 | | | IT Services |
| | Tyler Technologies, Inc. | | | 1.8 | | | Software |
| | Lazard Ltd. Class A | | | 1.8 | | | Capital Markets |
| | GoDaddy, Inc. Class A | | | 1.7 | | | Internet Software & Services |
| | Affiliated Managers Group, Inc. | | | 1.7 | | | Capital Markets |
| | | First Republic Bank | | | 1.7 | | | Banks |
| | 5 | | The top 10 holdings may not be representative of the Fund’s future investments. |
45
FUND BASICS
|
| FUND VS. BENCHMARK SECTOR ALLOCATION6 |
| As of August 31, 2017 |
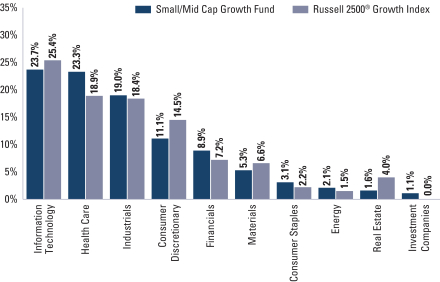
| | 6 | | The Fund is actively managed and, as such, its composition may differ over time. Consequently, the Fund’s overall sector allocations may differ from the percentages contained in the graph above. The graph categorizes investments using the Global Industry Classification Standard (“GICS”), however, the sector classifications used by the portfolio management team may differ from GICS. The percentage shown for each investment category reflects the value of investments in that category as a percentage of market value (excluding investments in the securities lending reinvestment vehicle, if any). Investments in the securities lending reinvestment vehicle represented 0.8% of the Fund’s net assets as of August 31, 2017. The graph depicts the Fund’s investments but may not represent the Fund’s market exposure due to the exclusion of certain derivatives, if any, as listed in the Additional Investment Information section of the Schedule of Investments. |
46
GOLDMAN SACHS SMALL/MID CAP GROWTH FUND
Performance Summary
August 31, 2017
The following graph shows the value, as of August 31, 2017, of a $1,000,000 investment made on September 1, 2007 in Institutional Shares at NAV. For comparative purposes, the performance of the Fund’s benchmark, the Russell 2500® Growth Index (with dividends reinvested), is shown. This performance data represents past performance and should not be considered indicative of future performance, which will fluctuate with changes in market conditions. These performance fluctuations may cause an investor’s shares, when redeemed, to be worth more or less than their original cost. Performance reflects applicable fee waivers and/or expense limitations in effect during the periods shown and in their absence, performance would be reduced. Returns do not reflect the deduction of taxes that a shareholder would pay on Fund distributions or the redemption of Fund shares. Performance of Class A, Class C, Service, Investor, Class R and Class R6 Shares will vary from Institutional Shares due to differences in class specific fees and any applicable sales charges. In addition to the Investment Adviser’s decisions regarding issuer/industry investment selection and allocation, other factors may affect Fund performance. These factors include, but are not limited to, Fund operating fees and expenses, portfolio turnover and subscription and redemption cash flows affecting the Fund.
|
| Small/Mid Cap Growth Fund’s 10 Year Performance |
Performance of a $1,000,000 Investment, including any applicable sales charges, with distributions reinvested, from September 1, 2007 through August 31, 2017.
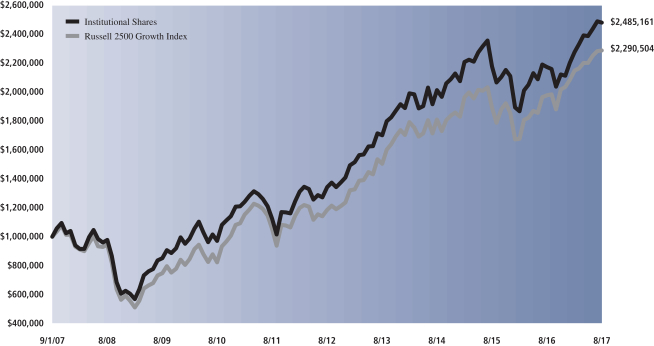
| | | | | | | | | | | | | | |
| Average Annual Total Return through August 31, 2017 | | | One Year | | | | Five Years | | | | Ten Years | | | Since Inception |
Class A (Commenced June 30, 2005) | | | | | | | | | | | | | | |
Excluding sales charges | | | 13.78% | | | | 12.63% | | | | 9.09% | | | 10.17% |
Including sales charges | | | 7.50% | | | | 11.37% | | | | 8.48% | | | 9.66% |
|
Class C (Commenced June 30, 2005) | | | | | | | | | | | | | | |
Excluding contingent deferred sales charges | | | 12.98% | | | | 11.79% | | | | 8.28% | | | 9.31% |
Including contingent deferred sales charges | | | 11.94% | | | | 11.79% | | | | 8.28% | | | 9.31% |
|
Institutional Class (Commenced June 30, 2005) | | | 14.21% | | | | 13.07% | | | | 9.52% | | | 10.58% |
|
Service Class (Commenced June 30, 2005) | | | 13.59% | | | | 12.49% | | | | 8.97% | | | 10.02% |
|
Investor (Commenced November 30, 2007) | | | 14.06% | | | | 12.91% | | | | N/A | | | 9.35% |
|
Class R (Commenced November 30, 2007) | | | 13.47% | | | | 12.34% | | | | N/A | | | 8.81% |
|
Class R6 (Commenced July 31, 2015) | | | 14.26% | | | | N/A | | | | N/A | | | 2.53% |
|
47
PORTFOLIO RESULTS
Goldman Sachs Strategic Growth Fund
Portfolio Composition
The Fund invests primarily in U.S. equity investments. The Fund is more selective and focused than many mutual funds and there are typically 50 to 70 holdings in the portfolio. Since the Fund’s inception, the Goldman Sachs Growth Equity Investment Team has focused on several key investment criteria that it believes can drive a company’s growth over the long term. These characteristics are: dominant market share, established brand name, pricing power, recurring revenue stream, free cash flow, high returns on invested capital, predictable growth, sustainable growth, long product life cycle, enduring competitive advantage, favorable demographic trends and excellent management. The Team strives to purchase these companies at reasonable valuations in order to capture the full benefits of their growth.
Portfolio Management Discussion and Analysis
Below, the Goldman Sachs Growth Equity Investment Team discusses the Goldman Sachs Strategic Growth Fund’s (the “Fund”) performance and positioning for the 12-month period ended August 31, 2017 (the “Reporting Period”).
| Q | | How did the Fund perform during the Reporting Period? |
| A | | During the Reporting Period, the Fund’s Class A, C, Institutional, Service, Investor, R6 and R Shares generated average annual total returns, without sales charges, of 19.79%, 18.89%, 20.29%, 19.66%, 20.15%, 19.56% and 20.33%, respectively. These returns compare to the 20.82% average annual total return of the Fund’s benchmark, the Russell 1000® Growth Index (with dividends reinvested) (the “Russell Index”), during the same period. |
| Q | | What key factors were responsible for the Fund’s performance during the Reporting Period? |
| A | | The Fund posted solid double-digit absolute gains, but sector allocation overall detracted modestly from the Fund’s performance relative to the Russell Index during the Reporting Period. Stock selection contributed positively during the Reporting Period. |
| Q | | Which equity market sectors most significantly affected Fund performance? |
| A | | Challenging stock selection in health care and financials detracted from the Fund’s relative results most during the Reporting Period. Having an overweight to energy, by far the worst performing sector in the Russell Index during the Reporting Period, also hurt. The sectors that contributed most positively to the Fund’s relative performance during the Reporting Period were real estate, consumer staples and consumer discretionary, wherein effective stock selection drove results. |
| Q | | Which stocks detracted significantly from the Fund’s performance during the Reporting Period? |
| A | | Among the stocks detracting most from the Fund’s results relative to the Russell Index were beer producer and seller Molson Coors Brewing, oil well services company Schlumberger and athletic footwear and apparel company NIKE. |
| | Molson Coors Brewing’s share price declined following the U.S. elections in November 2016 and in early 2017 due to widespread concerns around slowing beer industry volumes. In February 2017, the company reported better than market expected earnings, but softer scanner data through March 2017 continued to weigh on its shares (Scanner data is retail purchase information (such as price, brand, product size, amount purchased) gathered at the point of purchase by an electronic device that reads a coded ticket on the product through the use of an electronic reader over which the product passes.). The company’s share price declined further in June 2017 following an investor meeting during which its management announced a downward revision to its margin guidance. At the end of the Reporting Period, we expected the recent Miller Lite deal to unlock greater cost and revenue synergy opportunities than the market originally expected, which could potentially drive significant margin expansion over time. (On October 11, 2016, SABMiller sold its stake in MillerCoors for around $12 billion after the company was acquired by Anheuser-Busch InBev, making Molson Coors the 100% owner of MillerCoors. In effect, MillerCoors became the U.S. business unit of Molson Coors. In Canada, Molson Coors regained the right (from SABMiller) to make |
48
PORTFOLIO RESULTS
| | and market Miller Genuine Draft and Miller Lite.) Additionally, we believed further consolidation within the industry could have potentially positive implications for Molson Coors Brewing. |
| | During the Reporting Period, Schlumberger announced fourth quarter 2016 earnings that were ahead of consensus expectations. However, its shares were weak, as the company expressed a slower than market expected recovery in international activity. Like many companies in the energy sector, Schlumberger’s stock price also came under pressure amidst volatility in global oil prices. While we believe trends may stabilize and improve over the long term and believe Schlumberger is a high quality company, we decided to exit the position to pursue other opportunities. |
| | NIKE reported solid fiscal first quarter results during the Reporting Period, with revenue growth and earnings above market estimates. However, both its gross margin and sales guidance came in below consensus expectations. NIKE’s shares quickly rebounded, with its stock price spiking on the last day of June 2017 when the company announced earnings that were better than market expectations on revenue and earnings per share, while also announcing in-line guidance. However, its shares then turned downward again following the footwear retailer Foot Locker’s announcement of significantly weaker than market expected earnings; this was viewed by many investors as a negative indicator for footwear sales broadly. At the end of the Reporting Period, we remained positive on the company’s focus on innovation and product development, which we believe is stronger than it has been in the recent past. One example of this is NIKE announcing a deal to sell its shoes through Amazon. In our view, NIKE has a resilient business model, with diverse product offerings, global channels, market share gains and meaningful share buybacks. We continued to believe at the end of the Reporting Period that the company is a best-in-class franchise in a structurally healthy and growing category, and we remained positive on its long-term growth potential. |
| Q | | What were some of the Fund’s best-performing individual stocks? |
| A | | Among those stocks the Fund benefited most from relative to the Russell Index were positions in international freight transportation provider CSX, digital media streaming company Netflix and information technology giant Apple. |
| | CSX, a new position for the Fund during the Reporting Period, provides rail, intermodal, domestic container shipping and contract logistics services around the world. |
| | Since being added to the Fund’s portfolio during the fourth quarter of 2016, the company saw its stock price spike in January 2017, as Canadian Pacific Chief Executive Officer (“CEO”), Hunter Harrison, resigned and was reportedly seeking a senior management position at CSX. The market viewed the potential move positively given Harrison’s strong reputation, and indeed Harrison was hired later in the quarter as CEO. Further, in April 2017, the company reported strong first calendar quarter results in which better pricing and impressive cost control led to better than market expected earnings per share and revenues. The company’s share price took a pause in July 2017, following an earnings miss due to poorer operating efficiencies than reported in the preceding quarters. Still, at the end of the Reporting Period, we continued to believe CSX was well positioned to benefit from a possible inflationary environment given its cyclical business model and also from potential tax reforms given its currently high tax rate. Overall, we were optimistic at the end of the Reporting Period about what we viewed as CSX’s growth outlook, operational improvement and strong free cash flow generation. |
| | Early in the Reporting Period, Netflix’s shares gained sharply following exceptionally strong third quarter 2016 results, with revenues and earnings well ahead of market expectations. Importantly, subscriber growth across both domestic and international markets was strong. Netflix’s stock spiked again in July 2017 following its second quarter 2017 earnings release in which the company beat consensus estimates on earnings and guidance. The company’s strong performance was primarily driven by new, well-received content and increased distribution on traditional distribution channels. At the end of the Reporting Period, we remained positive on Netflix as the market leader within the movie streaming industry, offering a convenient way to consume content without the burden of ownership. We further believed the company was well positioned to capture subscriber growth globally. |
| | Apple reported strong fiscal first quarter results at the beginning of February 2017 that beat market expectations on both revenue and earnings per share, driven by better than market expected iPhone sales. This report caused Apple’s stock price to jump. The company then announced results at the beginning of May 2017 that were broadly in line with market estimates on most metrics and guidance. In August 2017, the company reported solid earnings ahead of the |
49
PORTFOLIO RESULTS
| | highly anticipated release of its new iPhone. Apple’s positive performance was led by strong iPad and services revenue growth. At the end of the Reporting Period, we continued to see what we believe are a number of strong growth catalysts for Apple, including solid iPhone demand and ongoing product innovation and development. Apple also has continued to deliver strong services growth, which, in our view, is important as this decreases transactional volatility tied to product cycles. Further, we remained optimistic on Apple’s significant installed base, experienced management and established brand name. |
| Q | | How did the Fund use derivatives and similar instruments during the Reporting Period? |
| A | | During the Reporting Period, we did not use derivatives as part of an active management strategy. |
| Q | | Did the Fund make any significant purchases or sales during the Reporting Period? |
| A | | In addition to those purchases already mentioned, we established a Fund position in media and entertainment company Walt Disney & Co. As the outlook for U.S. economic growth improved for many following the 2016 U.S. elections, we are positive on the ability of the company to capitalize on potential opportunities, especially in its theme park revenue. We also felt that some of the perceived risks surrounding its ESPN business were overdone. In our view, Disney has a strong balance sheet and robust free cash flow and earnings growth and remains committed to buying back shares. At the time of purchase, we were positive on the company moving forward and on its potential for sustained growth. |
| | We initiated a Fund position in semiconductor and analog company Texas Instruments. We view the company as a best-in-class analog semiconductor company with strong market share. We believe the company’s long-term growth prospects are strong, as the industry has become more fragmented. Overall, we believe the company is a high quality name that has exposure to diversified end-markets, long product cycles and a superior management team. |
| | Conversely, in addition to those sales already mentioned, we exited the Fund’s position in health care products and services company Abbott Laboratories. The company’s share price had experienced weakness over acquisition-related news as well as foreign exchange headwinds and market growth deterioration in its pediatric nutrition segment in China. |
| | Although we continue to believe Abbott Laboratories is a growing business that capitalizes on strong execution, we exited the Fund’s position to invest in companies we felt had more favorable risk/reward profiles. |
| | We eliminated the Fund’s position in specialty coffee retailer Starbucks. During the Reporting Period, Starbucks reported a disappointing comparable same-store sales growth report that dampened investor sentiment. In our view, this was because the results were perceived as indicators of a further slowdown in its growth rate beyond market expectations. Though we continue to like the company and the strength of its franchise, we believe there are other ideas with more compelling risk/ reward profiles and thus decided to exit the position. |
| Q | | Were there any notable changes in the Fund’s weightings during the Reporting Period? |
| A | | In constructing the Fund’s portfolio, we focus on picking stocks rather than on making industry or sector bets. We seek to outpace the benchmark index by overweighting stocks that we expect to outperform and underweighting those that we think may lag. Consequently, changes in its sector weights are generally the direct result of individual stock selection or of stock appreciation or depreciation. That said, during the Reporting Period, the Fund’s exposure to consumer discretionary and consumer staples increased and its allocations to information technology and materials decreased relative to the Russell Index. The Fund’s position in cash also decreased during the Reporting Period. |
| Q | | How was the Fund positioned relative to its benchmark index at the end of August 2017? |
| A | | At the end of August 2017, the Fund had an overweighted position relative to the Russell Index in the consumer staples sector. On the same date, the Fund had underweighted positions compared to the Russell Index in materials and information technology. The Fund was rather neutrally weighted to the Russell Index in consumer discretionary, energy, financials, health care, industrials and real estate and had no positions at all in utilities and telecommunication services at the end of the Reporting Period. |
50
FUND BASICS
Strategic Growth Fund
as of August 31, 2017
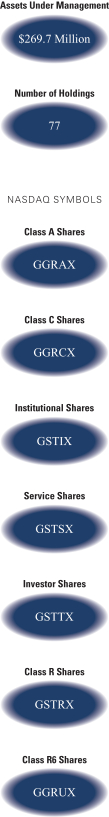
| | | | | | | | | | |
| | PERFORMANCE REVIEW | |
| | | September 1, 2016–August 31, 2017 | | Fund Total Return
(based on NAV)1 | | | Russell 1000®
Growth Index2 | |
| | Class A | | | 19.79 | % | | | 20.82 | % |
| | Class C | | | 18.89 | | | | 20.82 | |
| | Institutional | | | 20.29 | | | | 20.82 | |
| | Service | | | 19.66 | | | | 20.82 | |
| | Investor | | | 20.15 | | | | 20.82 | |
| | Class R | | | 19.56 | | | | 20.82 | |
| | | Class R6 | | | 20.33 | | | | 20.82 | |
| | 1 | | The net asset value (“NAV”) represents the net assets of the class of the Fund (ex-dividend) divided by the total number of shares of the class outstanding. The Fund’s performance reflects the reinvestment of dividends and other distributions. The Fund’s performance does not reflect the deduction of any applicable sales charges. |
| | 2 | | The Russell 1000® Growth Index is an unmanaged market capitalization weighted index that measures the performance of those Russell 1000® companies with higher price-to-book ratios and higher forecasted growth values. The Index figures do not reflect any deduction for fees, expenses or taxes. It is not possible to invest directly in an index. |
| | | | | | | | | | | | | | | | | | | | |
| | STANDARDIZED TOTAL RETURNS3 |
| | | For the period ended 6/30/17 | | One Year | | | Five Years | | | Ten Years | | | Since Inception | | | Inception Date |
| | Class A | | | 13.12 | % | | | 13.01 | % | | | 6.78 | % | | | 3.99 | % | | 5/24/99 |
| | Class C | | | 17.82 | | | | 13.47 | | | | 6.58 | | | | 3.54 | | | 5/24/99 |
| | Institutional | | | 20.23 | | | | 14.75 | | | | 7.80 | | | | 4.73 | | | 5/24/99 |
| | Service | | | 19.71 | | | | 14.21 | | | | 7.33 | | | | 4.29 | | | 5/24/99 |
| | Investor | | | 20.00 | | | | 14.59 | | | | N/A | | | | 14.71 | | | 1/06/09 |
| | Class R | | | 19.39 | | | | 14.04 | | | | N/A | | | | 14.20 | | | 1/06/09 |
| | | Class R6 | | | 20.17 | | | | N/A | | | | N/A | | | | 7.82 | | | 7/31/15 |
| | 3 | | The Standardized Total Returns are average annual total returns or cumulative total returns (only if the performance period is one year or less) as of the most recent calendar quarter-end. They assume reinvestment of all distributions at NAV. These returns reflect a maximum initial sales charge of 5.5% for Class A Shares and the assumed contingent deferred sales charge for Class C Shares (1% if redeemed within 12 months of purchase). Because Institutional, Service, Investor, Class R and Class R6 Shares do not involve a sales charge, such a charge is not applied to their Standardized Total Returns. |
The returns set forth in the tables above represent past performance. Past performance does not guarantee future results. The Fund’s investment return and principal value will fluctuate so that an investor’s shares, when redeemed, may be worth more or less than their original cost. Current performance may be lower or higher than the performance quoted above. Please visit our web site at www.GSAMFUNDS.com to obtain the most recent month-end returns. Performance reflects applicable fee waivers and/or expense limitations in effect during the periods shown. In their absence, performance would be reduced. Returns do not reflect the deduction of taxes that a shareholder would pay on Fund distributions or the redemption of Fund shares.
51
FUND BASICS
| | | | | | | | | | |
| | EXPENSE RATIOS4 | |
| | | | | Net Expense Ratio (Current) | | | Gross Expense Ratio (Before Waivers) | |
| | Class A | | | 1.15 | % | | | 1.54 | % |
| | Class C | | | 1.90 | | | | 2.29 | |
| | Institutional | | | 0.75 | | | | 1.14 | |
| | Service | | | 1.25 | | | | 1.64 | |
| | Investor | | | 0.90 | | | | 1.29 | |
| | Class R | | | 1.40 | | | | 1.79 | |
| | | Class R6 | | | 0.76 | | | | 1.15 | |
| | 4 | | The expense ratios of the Fund, both current (net of applicable fee waivers and/or expense limitations) and before waivers (gross of applicable fee waivers and/or expense limitations) are as set forth above according to the most recent publicly available Prospectus for the Fund and may differ from the expense ratios disclosed in the Financial Highlights in this report. Pursuant to a contractual arrangement, the Fund’s waivers and/or expense limitations will remain in place through at least Aprill 28, 2018, and prior to such date the Investment Adviser may not terminate the arrangements without the approval of the Fund’s Board of Trustees. If these arrangements are discontinued in the future, the expense ratios may change without shareholder approval. |
| | | | | | | | |
| | TOP TEN HOLDINGS AS OF 8/31/175 |
| | | Holding | | % of Net Assets | | | Line of Business |
| | Apple, Inc. | | | 6.9 | % | | Technology Hardware, Storage &
Peripherals |
| | Microsoft Corp. | | | 4.5 | | | Software |
| | Facebook, Inc. Class A | | | 4.2 | | | Internet Software & Services |
| | Amazon.com, Inc. | | | 3.8 | | | Internet & Direct Marketing Retail |
| | Alphabet, Inc. Class A | | | 3.1 | | | Internet Software & Services |
| | MasterCard, Inc. Class A | | | 2.5 | | | IT Services |
| | Comcast Corp. Class A | | | 2.5 | | | Media |
| | Alphabet, Inc. Class C | | | 2.3 | | | Internet Software & Services |
| | The Walt Disney Co. | | | 2.0 | | | Media |
| | | Eli Lilly & Co. | | | 1.9 | | | Pharmaceuticals |
| | 5 | | The top 10 holdings may not be representative of the Fund’s future investments. |
52
FUND BASICS
| | |
| FUND VS. BENCHMARK SECTOR ALLOCATION6 | | |
| As of August 31, 2017 | | |
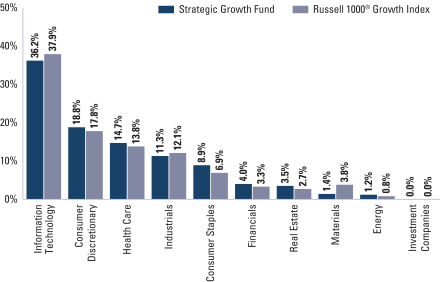
| | 6 | | The Fund is actively managed and, as such, its composition may differ over time. Consequently, the Fund’s overall sector allocations may differ from the percentages contained in the graph above. The graph categorizes investments using the Global Industry Classification Standard (“GICS”), however, the sector classifications used by the portfolio management team may differ from GICS. The percentage shown for each investment category reflects the value of investments in that category as a percentage of market value. The graph depicts the Fund’s investments but may not represent the Fund’s market exposure due to the exclusion of certain derivatives, if any, as listed in the Additional Investment Information section of the Schedule of Investments. |
53
GOLDMAN SACHS STRATEGIC GROWTH FUND
Performance Summary
August 31, 2017
The following graph shows the value, as of August 31, 2017, of a $1,000,000 investment made on September 1, 2007 in Institutional Shares at NAV. For comparative purposes, the performance of the Fund’s benchmark, the Russell 1000® Growth Index (with dividends reinvested), is shown. This performance data represents past performance and should not be considered indicative of future performance which will fluctuate with changes in market conditions. These performance fluctuations may cause an investor’s shares, when redeemed, to be worth more or less than their original cost. Performance reflects applicable fee waivers and/or expense limitations in effect during the periods shown and in their absence, performance would be reduced. Returns do not reflect the deduction of taxes that a shareholder would pay on Fund distributions or the redemption of Fund shares. Performance of Class A, Class C, Service, Investor, Class R and Class R6 Shares will vary from Institutional Shares due to differences in class specific fees and any applicable sales charges. In addition to the Investment Adviser’s decisions regarding issuer/industry investment selection and allocation, other factors may affect Fund performance. These factors include, but are not limited to, Fund operating fees and expenses, portfolio turnover, and subscription and redemption cash flows affecting the Fund.
|
| Strategic Growth Fund’s 10 Year Performance |
Performance of a $1,000,000 Investment, including any applicable sales charges, with distributions reinvested, from September 1, 2007 through August 31, 2017.
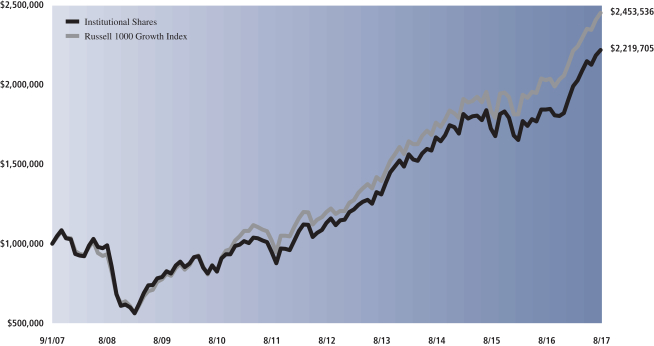
| | | | | | | | | | | | | | | | |
| Average Annual Total Return through August 31, 2017 | | | One Year | | | | Five Years | | | | Ten Years | | | | Since Inception | |
Class A (Commenced May 24, 1999) | | | | | | | | | | | | | | | | |
Excluding sales charges | | | 19.79% | | | | 13.99% | | | | 7.86% | | | | 4.51% | |
Including sales charges | | | 13.23% | | | | 12.72% | | | | 7.26% | | | | 4.18% | |
| |
Class C (Commenced May 24, 1999) | | | | | | | | | | | | | | | | |
Excluding contingent deferred sales charges | | | 18.89% | | | | 13.14% | | | | 7.05% | | | | 3.74% | |
Including contingent deferred sales charges | | | 17.85% | | | | 13.14% | | | | 7.05% | | | | 3.74% | |
| |
Institutional Class (Commenced May 24, 1999) | | | 20.29% | | | | 14.45% | | | | 8.29% | | | | 4.93% | |
| |
Service Class (Commenced May 24, 1999) | | | 19.66% | | | | 13.87% | | | | 7.80% | | | | 4.49% | |
| |
Investor (Commenced January 6, 2009) | | | 20.15% | | | | 14.27% | | | | N/A | | | | 14.96% | |
| |
Class R (Commenced January 6, 2009) | | | 19.56% | | | | 13.74% | | | | N/A | | | | 14.45% | |
| |
Class R6 (Commenced July 31, 2015) | | | 20.33% | | | | N/A | | | | N/A | | | | 9.37% | |
| |
54
PORTFOLIO RESULTS
Goldman Sachs Technology Opportunities Fund
Portfolio Composition
The Fund invests, under normal circumstances, at least 80% of its net assets plus any borrowing for investment purposes (measured at time of purchase) in equity investments in technology companies. The Fund seeks to achieve its investment objective by investing, under normal circumstances, in approximately 30-40 companies that are considered by the Investment Adviser to benefit from the proliferation of technology. Although the Fund invests primarily in publicly traded U.S. securities, it may invest up to 25% of its total assets measured at the time of purchase in foreign securities, including securities of issuers in countries with emerging markets or economies and securities quoted in foreign currencies. The Fund may also invest in privately held companies and companies that only recently began to trade publicly.
Portfolio Management Discussion and Analysis
Below, the Goldman Sachs Growth Equity Investment Team discusses the Goldman Sachs Technology Opportunities Fund’s (the “Fund”) performance and positioning for the 12-month period ended August 31, 2017 (the “Reporting Period”).
| Q | | How did the Fund perform during the Reporting Period? |
| A | | During the Reporting Period, the Fund’s Class A, C, Institutional, Service and Investor Shares generated average annual total returns, without sales charges, of 29.17%, 28.18%, 29.66%, 29.03% and 29.46%, respectively. These returns compare to the 29.27% average annual total return of the Fund’s benchmark, the S&P North American Technology Sector Index (the “S&P Technology Index”), during the same period. |
| Q | | What key factors were responsible for the Fund’s performance during the Reporting Period? |
| A | | The Fund performed in line with the S&P Technology Index during the Reporting Period due primarily to effective stock selection overall. Sector allocation as a whole also contributed positively, albeit more modestly. |
| Q | | Which equity market sectors most significantly affected Fund performance? |
| A | | As both the Fund and the S&P Technology Index have the majority of their respective assets allocated to the information technology sector, broad equity market sector performance generally does not have a meaningful impact on relative performance. That said, contributing most positively to the Fund’s relative results was effective stock selection in information technology and having exposure to the real estate sector, which is not a component of the S&P Technology Index but which outpaced the S&P Technology Index during the Reporting Period. The only sector that detracted from the Fund’s relative results during the Reporting Period was financials. Having exposure to financials, which is not a component of the S&P Technology Index but which lagged the S&P Technology Index during the Reporting Period, dampened the Fund’s relative performance. |
| Q | | What were some of the Fund’s best-performing individual stocks? |
| A | | Among those stocks the Fund benefited most from relative to the S&P Technology Index were positions in cloud-based services provider ServiceNow, materials engineering solutions provider Applied Materials and open source software solutions provider Red Hat. |
| | ServiceNow provides cloud-based services to automate enterprise information technology operations. During the Reporting Period, the company reported positive third and fourth quarter 2016 results, with revenues and earnings ahead of market estimates. Such results were driven by a number of large deals, increasing add-on sales and growing success in the company’s new Inspire program, which helps organizations improve their platforms. Its share price rose further in April 2017 after the company reported first quarter 2017 earnings that again exceeded market expectations on earnings per share and revenues. ServiceNow grew add-on sales while maintaining what we viewed as impressive margins, leading to strong earnings growth. At the end of the Reporting Period, we viewed ServiceNow as a high quality growth business in the software industry that could generate shareholder value through continued product innovation and thoughtful acquisitions. |
55
PORTFOLIO RESULTS
| | Applied Materials is a global leader in materials engineering solutions for semiconductor systems and advanced display technology. During the Reporting Period, the company reported consecutive quarters of better than market expected results, driven by strong revenue growth that was broad-based across its businesses. At the end of the Reporting Period, we believed Applied Materials is a high quality company with strong earnings growth potential, as it has continued to gain market share and increase its margins. Additionally, we believed the company would likely continue to benefit from the increase in penetration of OLED display screens in smartphones. (OLED stands for organic light-emitting diode.) |
| | In late March 2017, Red Hat reported strong fourth quarter 2016 results, led by strong billings growth and margin expansion. In June 2017, the company reported strong first quarter 2017 results, in which it beat market estimates on earnings per share and revenues while raising its full-year revenue guidance. As Red Hat has shown the ability to grow its deal sizes, we continued to believe at the end of the Reporting Period that Red Hat was well positioned in a growing infrastructure software industry. We viewed the company as a strong growth company because of what we saw as its stable top-line growth, margin expansion and high quality management team. |
| Q | | Which stocks detracted significantly from the Fund’s performance during the Reporting Period? |
| A | | Detracting most from the Fund’s results relative to the S&P Technology Index were positions in digital printing company Electronics for Imaging, social networking, user review and local search website operator Yelp and specialized payment products and services provider FleetCor Technologies. |
| | In October 2016 and April 2017, Electronics for Imaging reported mixed quarterly results that caused its stock price to decline. However, the majority of its weak performance occurred at the beginning of August 2017 when the company indefinitely postponed the release of its June 2017 quarterly results, as there was an issue stemming from the timing of revenue recognition. While the company announced there was no material aggregate misstatement, the uncertainty surrounding the situation caused its stock price to plummet. In our view, at the end of the Reporting Period, the company still had a dominant market position in its legacy printer controllers business, which provides strong cash flow to fund other of its growth businesses, and is well positioned for the transition from analog to digital printing. In addition, we believed the company has an effective and disciplined merger and acquisition strategy that supplements organic growth in its inkjet printing and software businesses. Overall, we believed the company was positioned well to benefit from favorable secular trends should analog continue to shift toward digital printing. |
| | Shares of Yelp, a new position for the Fund during the Reporting Period, declined after the company reported mixed fourth quarter 2016 earnings with guidance below market expectations. The company also announced that its sales force had decreased during the Reporting Period, which investors viewed negatively. The company subsequently reported first quarter 2017 results in which earnings per share slightly beat market expectations. However, Yelp’s management lowered its full year guidance, which caused its share price to sharply decline. The revised guidance was due to poor customer retention in its local advertising business. We decided to exit the Fund’s position in Yelp and pursue opportunities we viewed as having more compelling risk/ reward profiles. |
| | FleetCor Technologies reported revenues and earnings in November 2016 that were lower than market expectations as same-store sales declined. Its stock price then dropped sharply in early April 2017, as Citron Research, an activist research firm, released a report questioning the company’s fee policies and advocating short selling of FleetCor Technologies’ stock. In May 2017, the company reported disappointing same-store sales, causing its stock price, again, to come under pressure. We decided to exit the Fund’s position in FleetCor Technologies and allocate the capital to higher conviction companies. |
| Q | | How did the Fund use derivatives and similar instruments during the Reporting Period? |
| A | | During the Reporting Period, we did not use derivatives as part of an active management strategy. |
| Q | | Did the Fund make any significant purchases or sales during the Reporting Period? |
| A | | In addition to those purchases already mentioned, we initiated a Fund position in Total System Services, a payment processing services provider. We view Total System Services as a high quality payments franchise, and we bought the stock on the back of what we considered to be an attractive valuation. The company’s share price dropped during the Reporting Period, as it released second quarter 2017 results with slower organic revenue growth and guidance on the low end. Total System Services also faces regulatory uncertainties, |
56
PORTFOLIO RESULTS
| | which we think will subside over time. In our view, these headwinds are near-term in nature and have created an opportunity to hold shares in a fundamentally solid company with potential for strong organic growth that may lead to multiple expansion. |
| | We established a Fund position in Global Payments, a provider of payment technology services. In January 2017, the company reported fiscal first quarter results that slightly beat market expectations. The highlights of its earnings were good operating margins, particularly in the U.S., and accelerating organic revenue growth. In our view, there are multiple levers the company can utilize to deliver earnings growth—cost synergies and pricing opportunities at Heartland, which the company acquired, and capital allocation via joint ventures and share repurchases. We sought to take advantage of the pullback in technology stocks to invest in what we believe is a high quality growth company at an attractive valuation. |
| | Conversely, in addition to those sales mentioned earlier, we exited the Fund’s position in NXP Semiconductors. Its shares had gained sharply early in the Reporting Period following the announcement by Qualcomm that it would acquire NXP Semiconductors. Our thesis was that the company was a high quality franchise, had a diverse opportunity set, a differentiated product lineup and an effective management team, positioning it well for long-term growth. Later in the Reporting Period, we sold the Fund’s position in favor of other ideas, taking profits. |
| | We eliminated the Fund’s position in payment services provider Fidelity National Information Services. In February 2017, the company reported fourth quarter 2016 results that were in-line with market expectations but lowered its outlook for 2017. As a result of the disappointing outlook, we decided to sell the position and allocate capital into other ideas we believed to have more compelling risk/reward opportunities. |
| Q | | Were there any notable changes in the Fund’s weightings during the Reporting Period? |
| A | | In constructing the Fund’s portfolio, we focus on picking stocks rather than on making industry or sector bets. We seek to outpace the benchmark index by overweighting stocks that we expect to outperform and underweighting those that we think may lag. Consequently, changes in its sector weights are generally the direct result of individual stock selection or of stock appreciation or depreciation. That said, during the Reporting Period, the Fund’s exposure to information technology increased and its exposure to consumer discretionary decreased relative to the S&P Technology Index. The Fund’s position in cash also decreased during the Reporting Period; its exposure to real estate increased; and its exposure to financials and telecommunication services decreased. |
| Q | | How was the Fund positioned relative to its benchmark index at the end of August 2017? |
| A | | At the end of August 2017, the Fund’s was underweighted relative to the S&P Technology Index in the information technology and consumer discretionary sectors, the only two components of the S&P Technology Index. On the same date, the Fund had exposure to the financials and real estate sectors. The Fund had no exposure to the telecommunication services sector at the end of the Reporting Period. |
57
FUND BASICS
Technology Opportunities Fund
as of August 31, 2017
| | | | | | | | | | |
| | PERFORMANCE REVIEW | |
| | | September 1, 2016–August 31, 2017 | | Fund Total Return
(based on NAV)1 | | | S&P North American
Technology Sector
Index2 | |
| | Class A | | | 29.17 | % | | | 29.27 | % |
| | Class C | | | 28.18 | | | | 29.27 | |
| | Institutional | | | 29.66 | | | | 29.27 | |
| | Service | | | 29.03 | | | | 29.27 | |
| | | Investor | | | 29.46 | | | | 29.27 | |
| | 1 | | The net asset value (“NAV”) represents the net assets of the class of the Fund (ex-dividend) divided by the total number of shares of the class outstanding. The Fund’s performance reflects the reinvestment of dividends and other distributions. The Fund’s performance does not reflect the deduction of any applicable sales charges. |
| | 2 | | The S&P North American Technology Sector Index provides investors with a benchmark that represents U.S. securities classified under the Global Industry Classification Standard (“GICS”)® technology sector and Internet retail sub-industry |
| | | | | | | | | | | | | | | | | | | | |
| | STANDARDIZED TOTAL RETURNS3 |
| | | For the period ended 6/30/17 | | One Year | | | Five Years | | | Ten Years | | | Since Inception | | | Inception Date |
| | Class A | | | 22.15 | % | | | 14.09 | % | | | 9.98 | % | | | 5.49 | % | | 10/1/99 |
| | Class C | | | 27.11 | | | | 14.53 | | | | 9.77 | | | | 5.02 | | | 10/1/99 |
| | Institutional | | | 29.66 | | | | 15.85 | | | | 11.04 | | | | 6.25 | | | 10/1/99 |
| | Service | | | 29.04 | | | | 15.27 | | | | 10.51 | | | | 5.74 | | | 10/1/99 |
| | | Investor | | | 29.47 | | | | 15.68 | | | | N/A | | | | 13.30 | | | 9/30/10 |
| | 3 | | The Standardized Total Returns are average annual total returns or cumulative total returns (only if the performance period is one year or less) as of the most recent calendar quarter-end. They assume reinvestment of all distributions at NAV. These returns reflect a maximum initial sales charge of 5.5% for Class A Shares and the assumed contingent deferred sales charge for Class C Shares (1% if redeemed within 12 months of purchase). Because Institutional, Service and Investor Shares do not involve a sales charge, such a charge is not applied to their Standardized Total Returns. |
The returns set forth in the tables above represent past performance. Past performance does not guarantee future results. The Fund’s investment return and principal value will fluctuate so that an investor’s shares, when redeemed, may be worth more or less than their original cost. Current performance may be lower or higher than the performance quoted above. Please visit our web site at www.GSAMFUNDS.com to obtain the most recent month-end returns. Performance reflects applicable fee waivers and/or expense limitations in effect during the periods shown. In their absence, performance would be reduced. Returns do not reflect the deduction of taxes that a shareholder would pay on Fund distributions or the redemption of Fund shares.
58
FUND BASICS
| | | | | | | | | | |
| | EXPENSE RATIOS4 | |
| | | | | Net Expense Ratio (Current) | | | Gross Expense Ratio (Before Waivers) | |
| | Class A | | | 1.39 | % | | | 1.55 | % |
| | Class C | | | 2.14 | | | | 2.30 | |
| | Institutional | | | 0.99 | | | | 1.15 | |
| | Service | | | 1.49 | | | | 1.65 | |
| | | Investor | | | 1.14 | | | | 1.30 | |
| | 4 | | The expense ratios of the Fund, both current (net of applicable fee waivers and/or expense limitations) and before waivers (gross of applicable fee waivers and/or expense limitations) are as set forth above according to the most recent publicly available Prospectus for the Fund and may differ from the expense ratios disclosed in the Financial Highlights in this report. Pursuant to a contractual arrangement, the Fund’s waivers and/or expense limitations will remain in place through at least April 28, 2018, and prior to such date the Investment Adviser may not terminate the arrangements without the approval of the Fund’s Board of Trustees. If these arrangements are discontinued in the future, the expense ratios may change without shareholder approval. |
| | | | | | | | |
| | TOP TEN HOLDINGS AS OF 8/31/175 |
| | | Holding | | % of Net Assets | | | Line of Business |
| | Apple, Inc. | | | 7.7 | | | Technology Hardware, Storage
& Peripherals |
| | Facebook, Inc. Class A | | | 6.4 | | | Internet Software & Services |
| | Amazon.com, Inc. | | | 6.0 | | | Internet & Direct Marketing Retail |
| | Alphabet, Inc. Class A | | | 4.3 | | | Internet Software & Services |
| | Alphabet, Inc. Class C | | | 4.1 | | | Internet Software & Services |
| | Oracle Corp. | | | 4.0 | | | Software |
| | Microsoft Corp. | | | 4.0 | | | Software |
| | Amphenol Corp. Class A | | | 3.6 | | | Electronic Equipment, Instruments &
Components |
| | MasterCard, Inc. Class A | | | 3.4 | | | IT Services |
| | | SBA Communications Corp. | | | 3.4 | | | Equity Real Estate Investment Trusts
(REITs) |
| | 5 | | The top 10 holdings may not be representative of the Fund’s future investments. |
59
FUND BASICS
|
| FUND VS. BENCHMARK SECTOR ALLOCATION6 |
| As of August 31, 2017 |
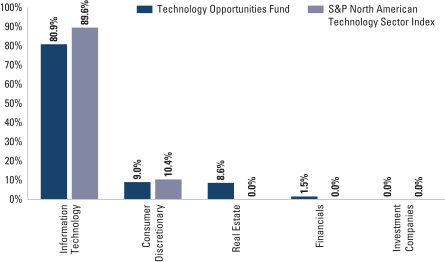
| | 6 | | The Fund is actively managed and, as such, its composition may differ over time. Consequently, the Fund’s overall sector allocations may differ from the percentages contained in the graph above. The graph categorizes investments using the Global Industry Classification Standard (“GICS”), however, the sector classifications used by the portfolio management team may differ from GICS. The percentage shown for each investment category reflects the value of investments in that category as a percentage of market value (excluding investments in the securities lending reinvestment vehicle, if any). Investments in the securities lending reinvestment vehicle represented 0.6% of the Fund’s net assets as of August 31, 2017. The graph depicts the Fund’s investments but may not represent the Fund’s market exposure due to the exclusion of certain derivatives, if any, as listed in the Additional Investment Information section of the Schedule of Investments. |
60
GOLDMAN SACHS TECHNOLOGY OPPORTUNITIES FUND
Performance Summary
August 31, 2017
The following graph shows the value as of August 31, 2017, of a $1,000,000 investment made on September 1, 2007 in Institutional Shares at NAV. For comparative purposes, the performance of the Fund’s benchmark, the S&P North American Technology Sector Index is shown. This performance data represents past performance and should not be considered indicative of future performance, which will fluctuate with changes in market conditions. These performance fluctuations may cause an investor’s shares, when redeemed, to be worth more or less than their original cost. Performance reflects applicable fee waivers and/or expense limitations in effect during the periods shown and in their absence, performance would be reduced. Returns do not reflect the deduction of taxes that a shareholder would pay on Fund distributions or the redemption of Fund shares. Performance of Class A, Class C, Service and Investor Shares will vary from Institutional Shares due to differences in class specific fees and any applicable sales charges. In addition to the Investment Adviser’s decisions regarding issuer/industry investment selection and allocation, other factors may affect Fund performance. These factors include, but are not limited to, Fund operating fees and expenses, portfolio turnover and subscription and redemption cash flows affecting the Fund.
|
| Technology Opportunities Fund’s 10 Year Performance |
Performance of a $1,000,000 Investment, including any applicable sales charges, with distributions reinvested, from September 1, 2007 through August 31, 2017.
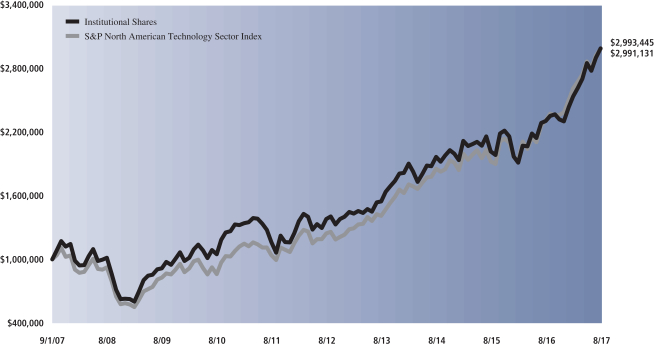
| | | | | | | | | | | | | | | | |
| Average Annual Total Return through August 31, 2017 | | | One Year | | | | Five Years | | | | Ten Years | | | | Since Inception | |
Class A (Commenced October 1, 1999) | | | | | | | | | | | | | | | | |
Excluding sales charges | | | 29.17% | | | | 16.24% | | | | 11.14% | | | | 6.19% | |
Including sales charges | | | 22.07% | | | | 14.94% | | | | 10.52% | | | | 5.86% | |
| |
Class C (Commenced October 1, 1999) | | | | | | | | | | | | | | | | |
Excluding contingent deferred sales charges | | | 28.18% | | | | 15.37% | | | | 10.30% | | | | 5.39% | |
Including contingent deferred sales charges | | | 27.12% | | | | 15.37% | | | | 10.30% | | | | 5.39% | |
| |
Institutional Class (Commenced October 1, 1999) | | | 29.66% | | | | 16.72% | | | | 11.58% | | | | 6.62% | |
| |
Service Class (Commenced October 1, 1999) | | | 29.03% | | | | 16.13% | | | | 11.03% | | | | 6.10% | |
| |
Investor (Commenced September 30, 2010) | | | 29.46% | | | | 16.53% | | | | N/A | | | | 14.14% | |
| |
61
GOLDMAN SACHS CAPITAL GROWTH FUND
Schedule of Investments
August 31, 2017
| | | | | | | | |
| Shares | | | Description | | Value | |
| Common Stocks – 99.3% | |
| Aerospace & Defense – 3.1% | |
| | 30,347 | | | General Dynamics Corp. | | $ | 6,110,368 | |
| | 18,280 | | | Northrop Grumman Corp. | | | 4,975,999 | |
| | 71,704 | | | The Boeing Co. | | | 17,184,581 | |
| | | | | | | | |
| | | | 28,270,948 | |
| | |
| Air Freight & Logistics – 0.7% | |
| | 30,209 | | | FedEx Corp. | | | 6,476,205 | |
| | |
| Auto Components – 0.5% | |
| | 26,673 | | | BorgWarner, Inc. | | | 1,237,894 | |
| | 37,773 | | | Delphi Automotive PLC | | | 3,641,317 | |
| | | | | | | | |
| | | | 4,879,211 | |
| | |
| Banks – 0.9% | |
| | 23,197 | | | First Republic Bank | | | 2,251,269 | |
| | 113,864 | | | SunTrust Banks, Inc. | | | 6,273,906 | |
| | | | | | | | |
| | | | 8,525,175 | |
| | |
| Beverages – 2.8% | |
| | 76,103 | | | Brown-Forman Corp. Class B | | | 4,036,503 | |
| | 57,306 | | | Molson Coors Brewing Co. Class B | | | 5,143,213 | |
| | 176,719 | | | Monster Beverage Corp.* | | | 9,864,455 | |
| | 148,713 | | | The Coca-Cola Co. | | | 6,773,877 | |
| | | | | | | | |
| | | | 25,818,048 | |
| | |
| Biotechnology – 4.3% | |
| | 17,813 | | | Alexion Pharmaceuticals, Inc.* | | | 2,536,749 | |
| | 54,283 | | | Alkermes PLC* | | | 2,756,491 | |
| | 49,442 | | | Amgen, Inc. | | | 8,789,304 | |
| | 63,546 | | | Incyte Corp.* | | | 8,731,856 | |
| | 48,661 | | | Shire PLC ADR | | | 7,269,467 | |
| | 56,459 | | | Vertex Pharmaceuticals, Inc.* | | | 9,063,928 | |
| | | | | | | | |
| | | | 39,147,795 | |
| | |
| Building Products – 0.5% | |
| | 67,863 | | | Fortune Brands Home & Security, Inc. | | | 4,243,473 | |
| | |
| Capital Markets – 2.8% | |
| | 20,093 | | | Affiliated Managers Group, Inc. | | | 3,550,232 | |
| | 82,383 | | | Intercontinental Exchange, Inc. | | | 5,327,709 | |
| | 40,249 | | | Lazard Ltd. Class A | | | 1,726,280 | |
| | 17,049 | | | MSCI, Inc. | | | 1,953,986 | |
| | 83,248 | | | Northern Trust Corp. | | | 7,367,448 | |
| | 39,035 | | | S&P Global, Inc. | | | 6,024,271 | |
| | | | | | | | |
| | | | 25,949,926 | |
| | |
| Chemicals – 2.6% | |
| | 57,670 | | | Ashland Global Holdings, Inc. | | | 3,578,424 | |
| | 47,258 | | | Ecolab, Inc. | | | 6,299,491 | |
| | 79,172 | | | RPM International, Inc. | | | 3,877,053 | |
| | 22,950 | | | The Sherwin-Williams Co. | | | 7,786,246 | |
| | 116,819 | | | Valvoline, Inc. | | | 2,487,077 | |
| | | | | | | | |
| | | | | | | 24,028,291 | |
| | |
| Communications Equipment – 0.7% | | | |
| | 194,853 | | | Cisco Systems, Inc. | | | 6,276,215 | |
| | |
| Common Stocks – (continued) | |
| Construction Materials* – 0.1% | |
| | 25,861 | | | Summit Materials, Inc. Class A | | | 763,934 | |
| | |
| Consumer Finance* – 0.2% | |
| | 189,200 | | | SLM Corp. | | | 1,924,164 | |
| | |
| Containers & Packaging – 0.2% | |
| | 19,885 | | | Avery Dennison Corp. | | | 1,874,360 | |
| | |
| Electrical Equipment* – 0.5% | |
| | 101,109 | | | Sensata Technologies Holding NV | | | 4,515,528 | |
| | |
| Electronic Equipment, Instruments & Components – 0.9% | |
| | 105,174 | | | Amphenol Corp. Class A | | | 8,512,784 | |
| | |
| Energy Equipment & Services – 0.2% | |
| | 26,252 | | | Schlumberger Ltd. | | | 1,667,265 | |
| | |
| Equity Real Estate Investment Trusts (REITs) – 2.3% | |
| | 83,123 | | | American Tower Corp. | | | 12,306,360 | |
| | 18,686 | | | Equinix, Inc. | | | 8,752,709 | |
| | | | | | | | |
| | | | 21,059,069 | |
| | |
| Food & Staples Retailing – 1.5% | |
| | 56,021 | | | Costco Wholesale Corp. | | | 8,780,732 | |
| | 58,775 | | | Walgreens Boots Alliance, Inc. | | | 4,790,162 | |
| | | | | | | | |
| | | | 13,570,894 | |
| | |
| Food Products – 0.6% | |
| | 111,460 | | | Blue Buffalo Pet Products, Inc.* | | | 2,871,210 | |
| | 13,072 | | | The Hershey Co. | | | 1,371,514 | |
| | 14,149 | | | The Kraft Heinz Co. | | | 1,142,532 | |
| | | | | | | | |
| | | | 5,385,256 | |
| | |
| Health Care Equipment & Supplies – 2.9% | |
| | 291,573 | | | Boston Scientific Corp.* | | | 8,032,836 | |
| | 77,498 | | | Danaher Corp. | | | 6,464,883 | |
| | 78,689 | | | Edwards Lifesciences Corp.* | | | 8,943,792 | |
| | 21,506 | | | Nevro Corp.* | | | 1,853,387 | |
| | 12,021 | | | West Pharmaceutical Services, Inc. | | | 1,046,308 | |
| | | | | | | | |
| | | | 26,341,206 | |
| | |
| Health Care Providers & Services – 1.9% | |
| | 23,694 | | | Aetna, Inc. | | | 3,736,544 | |
| | 71,288 | | | UnitedHealth Group, Inc. | | | 14,179,183 | |
| | | | | | | | |
| | | | 17,915,727 | |
| | |
| Hotels, Restaurants & Leisure – 3.6% | |
| | 39,094 | | | Dunkin’ Brands Group, Inc. | | | 2,015,687 | |
| | 23,109 | | | Hilton Worldwide Holdings, Inc. | | | 1,486,602 | |
| | 67,436 | | | Las Vegas Sands Corp. | | | 4,195,193 | |
| | 115,542 | | | McDonald’s Corp. | | | 18,483,254 | |
| | 85,865 | | | Yum! Brands, Inc. | | | 6,596,149 | |
| | | | | | | | |
| | | | 32,776,885 | |
| | |
| Household Durables – 0.6% | |
| | 117,445 | | | Newell Brands, Inc. | | | 5,670,245 | |
| | |
| | |
| 62 | | The accompanying notes are an integral part of these financial statements. |
GOLDMAN SACHS CAPITAL GROWTH FUND
| | | | | | | | |
| Shares | | | Description | | Value | |
| Common Stocks – (continued) | |
| Household Products – 0.4% | |
| | 49,043 | | | Colgate-Palmolive Co. | | $ | 3,513,440 | |
| | |
| Industrial Conglomerates – 3.5% | |
| | 32,993 | | | 3M Co. | | | 6,741,130 | |
| | 137,609 | | | Honeywell International, Inc. | | | 19,027,196 | |
| | 29,236 | | | Roper Technologies, Inc. | | | 6,743,576 | |
| | | | | | | | |
| | | | 32,511,902 | |
| | |
| Internet & Direct Marketing Retail – 5.8% | |
| | 32,143 | | | Amazon.com, Inc.* | | | 31,519,426 | |
| | 14,944 | | | Expedia, Inc. | | | 2,217,092 | |
| | 47,879 | | | Netflix, Inc.* | | | 8,364,940 | |
| | 5,840 | | | The Priceline Group, Inc.* | | | 10,816,147 | |
| | | | | | | | |
| | | | 52,917,605 | |
| | |
| Internet Software & Services* – 8.8% | |
| | 23,920 | | | Alphabet, Inc. Class A | | | 22,849,341 | |
| | 24,483 | | | Alphabet, Inc. Class C | | | 22,997,616 | |
| | 22,721 | | | eBay, Inc. | | | 820,910 | |
| | 196,311 | | | Facebook, Inc. Class A | | | 33,759,603 | |
| | | | | | | | |
| | | | 80,427,470 | |
| | |
| IT Services – 6.3% | |
| | 47,926 | | | Accenture PLC Class A | | | 6,266,804 | |
| | 106,764 | | | Black Knight Financial Services, Inc. Class A*(a) | | | 4,548,146 | |
| | 28,837 | | | DXC Technology Co. | | | 2,451,145 | |
| | 27,817 | | | Fiserv, Inc.* | | | 3,441,241 | |
| | 9,640 | | | FleetCor Technologies, Inc.* | | | 1,385,943 | |
| | 40,775 | | | Global Payments, Inc. | | | 3,893,605 | |
| | 211,583 | | | MasterCard, Inc. Class A | | | 28,204,014 | |
| | 80,960 | | | PayPal Holdings, Inc.* | | | 4,993,613 | |
| | 39,146 | | | Total System Services, Inc. | | | 2,705,771 | |
| | | | | | | | |
| | | | 57,890,282 | |
| | |
| Life Sciences Tools & Services – 1.6% | |
| | 74,706 | | | Agilent Technologies, Inc. | | | 4,834,972 | |
| | 32,937 | | | Illumina, Inc.* | | | 6,734,299 | |
| | 4,872 | | | Mettler-Toledo International, Inc.* | | | 2,947,999 | |
| | | | | | | | |
| | | | 14,517,270 | |
| | |
| Machinery – 2.4% | |
| | 20,409 | | | Fortive Corp. | | | 1,325,973 | |
| | 20,937 | | | IDEX Corp. | | | 2,461,772 | |
| | 64,010 | | | The Middleby Corp.* | | | 7,790,017 | |
| | 15,588 | | | WABCO Holdings, Inc.* | | | 2,238,749 | |
| | 138,471 | | | Xylem, Inc. | | | 8,594,895 | |
| | | | | | | | |
| | | | 22,411,406 | |
| | |
| Media – 3.9% | |
| | 536,979 | | | Comcast Corp. Class A | | | 21,806,717 | |
| | 136,208 | | | The Walt Disney Co. | | | 13,784,250 | |
| | | | | | | | |
| | | | 35,590,967 | |
| | |
| | | | | | | | |
| Shares | | | Description | | Value | |
| Common Stocks – (continued) | |
| Oil, Gas & Consumable Fuels* – 0.6% | |
| | 29,619 | | | Concho Resources, Inc. | | $ | 3,286,820 | |
| | 25,181 | | | Diamondback Energy, Inc. | | | 2,286,183 | |
| | | | | | | | |
| | | | 5,573,003 | |
| | |
| Personal Products – 0.9% | |
| | 75,367 | | | The Estee Lauder Cos., Inc. Class A | | | 8,063,515 | |
| | |
| Pharmaceuticals – 3.1% | |
| | 20,473 | | | Allergan PLC | | | 4,698,144 | |
| | 212,893 | | | Eli Lilly & Co. | | | 17,306,072 | |
| | 101,359 | | | Zoetis, Inc. | | | 6,355,209 | |
| | | | | | | | |
| | | | 28,359,425 | |
| | |
| Professional Services – 0.1% | |
| | 7,468 | | | Equifax, Inc. | | | 1,063,966 | |
| | |
| Road & Rail – 0.6% | |
| | 118,646 | | | CSX Corp. | | | 5,956,029 | |
| | |
| Semiconductors & Semiconductor Equipment – 4.0% | |
| | 132,335 | | | Applied Materials, Inc. | | | 5,970,955 | |
| | 14,817 | | | Broadcom Ltd. | | | 3,734,921 | |
| | 34,163 | | | NVIDIA Corp. | | | 5,788,579 | |
| | 31,740 | | | Qorvo, Inc.* | | | 2,324,003 | |
| | 169,906 | | | Texas Instruments, Inc. | | | 14,071,615 | |
| | 78,464 | | | Xilinx, Inc. | | | 5,183,332 | |
| | | | | | | | |
| | | | 37,073,405 | |
| | |
| Software – 9.4% | |
| | 58,996 | | | Activision Blizzard, Inc. | | | 3,867,778 | |
| | 43,037 | | | Adobe Systems, Inc.* | | | 6,677,621 | |
| | 19,693 | | | Autodesk, Inc.* | | | 2,254,061 | |
| | 28,265 | | | Electronic Arts, Inc.* | | | 3,434,197 | |
| | 34,845 | | | Intuit, Inc. | | | 4,928,825 | |
| | 482,976 | | | Microsoft Corp. | | | 36,112,116 | |
| | 318,004 | | | Oracle Corp. | | | 16,005,141 | |
| | 48,786 | | | salesforce.com, Inc.* | | | 4,658,575 | |
| | 13,152 | | | ServiceNow, Inc.* | | | 1,528,131 | |
| | 60,422 | | | Splunk, Inc.* | | | 4,053,712 | |
| | 7,412 | | | The Ultimate Software Group, Inc.* | | | 1,489,071 | |
| | 8,541 | | | Tyler Technologies, Inc.* | | | 1,475,885 | |
| | | | | | | | |
| | | | 86,485,113 | |
| | |
| Specialty Retail – 2.6% | |
| | 21,181 | | | Advance Auto Parts, Inc. | | | 2,073,620 | |
| | 100,438 | | | Ross Stores, Inc. | | | 5,870,601 | |
| | 85,037 | | | The Home Depot, Inc. | | | 12,744,495 | |
| | 12,564 | | | Ulta Salon, Cosmetics & Fragrance, Inc.* | | | 2,776,770 | |
| | | | | | | | |
| | | | | | | 23,465,486 | |
| | |
| Technology Hardware, Storage & Peripherals – 7.4% | |
| | 414,396 | | | Apple, Inc. | | | 67,960,944 | |
| | |
| | |
| The accompanying notes are an integral part of these financial statements. | | 63 |
GOLDMAN SACHS CAPITAL GROWTH FUND
Schedule of Investments (continued)
August 31, 2017
| | | | | | | | |
| Shares | | | Description | | Value | |
| Common Stocks – (continued) | |
| Textiles, Apparel & Luxury Goods – 1.3% | | | |
| | 160,814 | | | NIKE, Inc. Class B | | $ | 8,492,587 | |
| | 28,281 | | | PVH Corp. | | | 3,560,295 | |
| | | | | | | | |
| | | | | | | 12,052,882 | |
| | |
| Tobacco – 2.2% | | | |
| | 140,443 | | | Altria Group, Inc. | | | 8,904,086 | |
| | 95,426 | | | Philip Morris International, Inc. | | | 11,158,162 | |
| | | | | | | | |
| | | | | | | 20,062,248 | |
| | |
| | TOTAL COMMON STOCKS | | | | |
| | (Cost $581,435,099) | | $ | 911,488,962 | |
| | |
| | | | | | | | |
| Shares | | | Distribution
Rate | | Value | |
| Investment Companies(b) – 0.3% | |
| Goldman Sachs Financial Square Government Fund –
Institutional Shares |
|
| | 2,846,511 | | | 0.927% | | $ | 2,846,511 | |
| | (Cost $2,846,511) | | | | |
| | |
| TOTAL INVESTMENTS BEFORE
SECURITIES LENDING
REINVESTMENT VEHICLE | | | | |
| | (Cost $584,281,610) | | $ | 914,335,473 | |
| | |
| | |
| Securities Lending Reinvestment Vehicle(b) – 0.0% | |
| Goldman Sachs Financial Square Government Fund –
Institutional Shares |
|
| | 381,393 | | | 0.927% | | $ | 381,393 | |
| | (Cost $381,393) | | | | |
| | |
| | TOTAL INVESTMENTS – 99.6% | | | | |
| | (Cost $584,663,003) | | $ | 914,716,866 | |
| | |
| OTHER ASSETS IN EXCESS OF
LIABILITIES – 0.4% | | | 3,345,190 | |
| | |
| | NET ASSETS – 100.0% | | $ | 918,062,056 | |
| | |
| | |
| The percentage shown for each investment category reflects the value of investments in that category as a percentage of net assets. |
* | | Non-income producing security. |
(a) | | All or a portion of security is on loan. |
(b) | | Represents an Affiliated fund. |
| | |
|
Investment Abbreviations: |
ADR | | —American Depositary Receipt |
PLC | | —Public Limited Company |
|
| | |
| 64 | | The accompanying notes are an integral part of these financial statements. |
GOLDMAN SACHS CONCENTRATED GROWTH FUND
Schedule of Investments
August 31, 2017
| | | | | | | | |
| Shares | | | Description | | Value | |
| Common Stocks – 99.6% | |
| Beverages* – 2.0% | | | |
| | 53,722 | | | Monster Beverage Corp. | | $ | 2,998,762 | |
| | |
| Biotechnology – 6.3% | | | |
| | 13,662 | | | Amgen, Inc. | | | 2,428,694 | |
| | 18,527 | | | Incyte Corp.* | | | 2,545,795 | |
| | 16,683 | | | Shire PLC ADR | | | 2,492,273 | |
| | 12,402 | | | Vertex Pharmaceuticals, Inc.* | | | 1,991,017 | |
| | | | | | | | |
| | | | | | | 9,457,779 | |
| | |
| Capital Markets – 4.6% | | | |
| | 51,953 | | | Intercontinental Exchange, Inc. | | | 3,359,801 | |
| | 40,948 | | | Northern Trust Corp. | | | 3,623,898 | |
| | | | | | | | |
| | | | | | | 6,983,699 | |
| | |
| Chemicals – 1.6% | | | |
| | 6,954 | | | The Sherwin-Williams Co. | | | 2,359,284 | |
| | |
| Equity Real Estate Investment Trusts (REITs) – 5.4% | | | |
| | 30,349 | | | American Tower Corp. | | | 4,493,170 | |
| | 7,852 | | | Equinix, Inc. | | | 3,677,955 | |
| | | | | | | | |
| | | | | | | 8,171,125 | |
| | |
| Food & Staples Retailing – 2.8% | | | |
| | 17,498 | | | Costco Wholesale Corp. | | | 2,742,637 | |
| | 18,921 | | | Walgreens Boots Alliance, Inc. | | | 1,542,061 | |
| | | | | | | | |
| | | | | | | 4,284,698 | |
| | |
| Food Products – 1.5% | | | |
| | 27,541 | | | The Kraft Heinz Co. | | | 2,223,936 | |
| | |
| Health Care Equipment & Supplies – 4.9% | | | |
| | 99,263 | | | Boston Scientific Corp.* | | | 2,734,696 | |
| | 36,433 | | | Danaher Corp. | | | 3,039,241 | |
| | 15,061 | | | Edwards Lifesciences Corp.* | | | 1,711,833 | |
| | | | | | | | |
| | | | | | | 7,485,770 | |
| | |
| Hotels, Restaurants & Leisure – 2.7% | | | |
| | 25,794 | | | McDonald’s Corp. | | | 4,126,266 | |
| | |
| Household Products – 1.6% | | | |
| | 33,524 | | | Colgate-Palmolive Co. | | | 2,401,659 | |
| | |
| Industrial Conglomerates – 4.4% | | | |
| | 27,058 | | | Honeywell International, Inc. | | | 3,741,310 | |
| | 12,868 | | | Roper Technologies, Inc. | | | 2,968,133 | |
| | | | | | | | |
| | | | | | | 6,709,443 | |
| | |
| Internet & Direct Marketing Retail* – 6.5% | | | |
| | 6,170 | | | Amazon.com, Inc. | | | 6,050,302 | |
| | 8,607 | | | Netflix, Inc. | | | 1,503,729 | |
| | 1,214 | | | The Priceline Group, Inc. | | | 2,248,425 | |
| | | | | | | | |
| | | | | | | 9,802,456 | |
| | |
| Internet Software & Services* – 10.4% | | | |
| | 6,547 | | | Alphabet, Inc. Class A | | | 6,253,956 | |
| | 2,814 | | | Alphabet, Inc. Class C | | | 2,643,275 | |
| | 39,833 | | | Facebook, Inc. Class A | | | 6,850,081 | |
| | | | | | | | |
| | | | | | | 15,747,312 | |
| | |
| Common Stocks – (continued) | |
| IT Services – 2.8% | | | |
| | 31,504 | | | MasterCard, Inc. Class A | | $ | 4,199,483 | |
| | |
| Machinery – 4.2% | | | |
| | 23,356 | | | The Middleby Corp.* | | | 2,842,425 | |
| | 55,422 | | | Xylem, Inc. | | | 3,440,044 | |
| | | | | | | | |
| | | | | | | 6,282,469 | |
| | |
| Media – 6.0% | | | |
| | 125,666 | | | Comcast Corp. Class A | | | 5,103,296 | |
| | 39,746 | | | The Walt Disney Co. | | | 4,022,295 | |
| | | | | | | | |
| | | | | | | 9,125,591 | |
| | |
| Oil, Gas & Consumable Fuels* – 1.3% | | | |
| | 20,929 | | | Diamondback Energy, Inc. | | | 1,900,144 | |
| | |
| Pharmaceuticals – 2.5% | | | |
| | 46,335 | | | Eli Lilly & Co. | | | 3,766,572 | |
| | |
| Road & Rail – 1.7% | | | |
| | 52,215 | | | CSX Corp. | | | 2,621,193 | |
| | |
| Semiconductors & Semiconductor Equipment – 2.3% | | | |
| | 42,666 | | | Texas Instruments, Inc. | | | 3,533,598 | |
| | |
| Software – 11.1% | | | |
| | 17,303 | | | Electronic Arts, Inc.* | | | 2,102,314 | |
| | 14,212 | | | Intuit, Inc. | | | 2,010,287 | |
| | 99,923 | | | Microsoft Corp. | | | 7,471,243 | |
| | 63,132 | | | Oracle Corp. | | | 3,177,434 | |
| | 20,451 | | | salesforce.com, Inc.* | | | 1,952,866 | |
| | | | | | | | |
| | | | | | | 16,714,144 | |
| | |
| Specialty Retail – 2.0% | | | |
| | 51,092 | | | Ross Stores, Inc. | | | 2,986,327 | |
| | |
| Technology Hardware, Storage & Peripherals – 7.0% | | | |
| | 64,946 | | | Apple, Inc. | | | 10,651,144 | |
| | |
| Textiles, Apparel & Luxury Goods – 2.5% | | | |
| | 70,495 | | | NIKE, Inc. Class B | | | 3,722,841 | |
| | |
| Tobacco – 1.5% | | | |
| | 19,441 | | | Philip Morris International, Inc. | | | 2,273,236 | |
| | |
| | TOTAL COMMON STOCKS | | | | |
| | (Cost $102,070,303) | | $ | 150,528,931 | |
| | |
| | |
| The accompanying notes are an integral part of these financial statements. | | 65 |
GOLDMAN SACHS CONCENTRATED GROWTH FUND
Schedule of Investments (continued)
August 31, 2017
| | | | | | | | |
| Shares | | | Distribution
Rate | | Value | |
| Investment Company(a) – 0.0% | | | |
| Goldman Sachs Financial Square Government Fund –
Institutional Shares |
|
| | 84 | | | 0.927% | | $ | 84 | |
| | (Cost $84) | | | | |
| | |
| | TOTAL INVESTMENTS – 99.6% | | | | |
| | (Cost $102,070,387) | | $ | 150,529,015 | |
| | |
| OTHER ASSETS IN EXCESS OF
LIABILITIES – 0.4% | | | 640,167 | |
| | |
| | NET ASSETS – 100.0% | | $ | 151,169,182 | |
| | |
| | |
| The percentage shown for each investment category reflects the value of investments in that category as a percentage of net assets. |
* | | Non-income producing security. |
(a) | | Represents an Affiliated fund. |
| | |
|
Investment Abbreviations: |
ADR | | —American Depositary Receipt |
PLC | | —Public Limited Company |
|
| | |
| 66 | | The accompanying notes are an integral part of these financial statements. |
GOLDMAN SACHS DYNAMIC U.S. EQUITY FUND
Schedule of Investments
August 31, 2017
| | | | | | | | |
| Shares | | | Description | | Value | |
| Common Stocks – 95.4% | | | |
| Airlines* – 1.4% | | | |
| | 4,106 | | | JetBlue Airways Corp. | | $ | 81,340 | |
| | |
| Banks – 10.9% | | | |
| | 10,426 | | | Bank of America Corp. | | | 249,077 | |
| | 1,189 | | | JPMorgan Chase & Co. | | | 108,068 | |
| | 5,295 | | | Wells Fargo & Co. | | | 270,416 | |
| | | | | | | | |
| | | | | | | 627,561 | |
| | |
| Beverages – 2.9% | | | |
| | 1,152 | | | Molson Coors Brewing Co. Class B | | | 103,392 | |
| | 1,412 | | | The Coca-Cola Co. | | | 64,317 | |
| | | | | | | | |
| | | | | | | 167,709 | |
| | |
| Biotechnology – 3.1% | | | |
| | 542 | | | Incyte Corp.* | | | 74,476 | |
| | 689 | | | Shire PLC ADR | | | 102,930 | |
| | | | | | | | |
| | | | | | | 177,406 | |
| | |
| Capital Markets – 2.6% | | | |
| | 2,306 | | | Intercontinental Exchange, Inc. | | | 149,129 | |
| | |
| Chemicals – 2.8% | | | |
| | 1,247 | | | E.I. du Pont de Nemours & Co. | | | 104,661 | |
| | 169 | | | The Sherwin-Williams Co. | | | 57,336 | |
| | | | | | | | |
| | | | | | | 161,997 | |
| | |
| Communications Equipment – 1.5% | | | |
| | 2,769 | | | Cisco Systems, Inc. | | | 89,189 | |
| | |
| Electrical Equipment – 1.4% | | | |
| | 1,367 | | | Emerson Electric Co. | | | 80,708 | |
| | |
| Equity Real Estate Investment Trusts (REITs) – 5.1% | | | |
| | 1,051 | | | American Tower Corp. | | | 155,600 | |
| | 292 | | | Equinix, Inc. | | | 136,776 | |
| | | | | | | | |
| | | | | | | 292,376 | |
| | |
| Food & Staples Retailing – 0.9% | | | |
| | 315 | | | Costco Wholesale Corp. | | | 49,373 | |
| | |
| Food Products – 0.8% | | | |
| | 565 | | | The Kraft Heinz Co. | | | 45,624 | |
| | |
| Health Care Equipment & Supplies – 4.2% | | | |
| | 1,602 | | | Danaher Corp. | | | 133,639 | |
| | 964 | | | Edwards Lifesciences Corp.* | | | 109,568 | |
| | | | | | | | |
| | | | | | | 243,207 | |
| | |
| Household Products – 0.8% | | | |
| | 647 | | | Colgate-Palmolive Co. | | | 46,351 | |
| | |
| Industrial Conglomerates – 4.0% | | | |
| | 9,410 | | | General Electric Co. | | | 231,015 | |
| | |
| Insurance – 4.8% | | | |
| | 2,486 | | | American International Group, Inc. | | | 150,353 | |
| | 754 | | | Brighthouse Financial, Inc.* | | | 43,031 | |
| | |
| Common Stocks – (continued) | | | |
| Insurance – (continued) | | | |
| | 1,831 | | | MetLife, Inc. | | | 85,746 | |
| | | | | | | | |
| | | | | | | 279,130 | |
| | |
| Internet & Direct Marketing Retail* – 4.4% | | | |
| | 149 | | | Amazon.com, Inc. | | | 146,109 | |
| | 60 | | | The Priceline Group, Inc. | | | 111,125 | |
| | | | | | | | |
| | | | | | | 257,234 | |
| | |
| Internet Software & Services* – 6.0% | | | |
| | 124 | | | Alphabet, Inc. Class A | | | 118,450 | |
| | 93 | | | Alphabet, Inc. Class C | | | 87,357 | |
| | 833 | | | Facebook, Inc. Class A | | | 143,251 | |
| | | | | | | | |
| | | | | | | 349,058 | |
| | |
| IT Services – 4.8% | | | |
| | 2,064 | | | MasterCard, Inc. Class A | | | 275,131 | |
| | |
| Machinery – 2.1% | | | |
| | 1,914 | | | Xylem, Inc. | | | 118,802 | |
| | |
| Media – 2.6% | | | |
| | 1,503 | | | The Walt Disney Co. | | | 152,104 | |
| | |
| Oil, Gas & Consumable Fuels – 5.9% | | | |
| | 1,876 | | | ConocoPhillips | | | 81,906 | |
| | 2,491 | | | Exxon Mobil Corp. | | | 190,138 | |
| | 12,435 | | | Southwestern Energy Co.* | | | 67,771 | |
| | | | | | | | |
| | | | | | | 339,815 | |
| | |
| Pharmaceuticals – 5.6% | | | |
| | 1,341 | | | Eli Lilly & Co. | | | 109,010 | |
| | 6,338 | | | Pfizer, Inc. | | | 214,985 | |
| | | | | | | | |
| | | | | | | 323,995 | |
| | |
| Road & Rail – 1.4% | | | |
| | 796 | | | Union Pacific Corp. | | | 83,819 | |
| | |
| Software – 5.4% | | | |
| | 2,663 | | | Microsoft Corp. | | | 199,112 | |
| | 2,254 | | | Oracle Corp. | | | 113,444 | |
| | | | | | | | |
| | | | | | | 312,556 | |
| | |
| Specialty Retail – 1.0% | | | |
| | 1,030 | | | Ross Stores, Inc. | | | 60,204 | |
| | |
| Technology Hardware, Storage & Peripherals – 3.8% | | | |
| | 1,356 | | | Apple, Inc. | | | 222,384 | |
| | |
| Textiles, Apparel & Luxury Goods – 4.1% | | | |
| | 2,870 | | | NIKE, Inc. Class B | | | 151,565 | |
| | 677 | | | PVH Corp. | | | 85,227 | |
| | | | | | | | |
| | | | | | | 236,792 | |
| | |
| Tobacco – 1.1% | | | |
| | 529 | | | Philip Morris International, Inc. | | | 61,856 | |
| | |
| | TOTAL COMMON STOCKS | | | | |
| | (Cost $4,451,929) | | $ | 5,515,865 | |
| | |
| | |
| The accompanying notes are an integral part of these financial statements. | | 67 |
GOLDMAN SACHS DYNAMIC U.S. EQUITY FUND
Schedule of Investments (continued)
August 31, 2017
| | | | | | | | |
| Shares | | | Distribution
Rate | | Value | |
| Investment Companies(a) – 3.8% | | | |
| Goldman Sachs Financial Square Government Fund –
Institutional Shares |
|
| | 218,033 | | | 0.927% | | $ | 218,033 | |
| | (Cost $218,033) | | | | |
| | |
| | TOTAL INVESTMENTS – 99.2% | | | | |
| | (Cost $4,669,962) | | $ | 5,733,898 | |
| | |
| OTHER ASSETS IN EXCESS OF
LIABILITIES – 0.8% | | | 43,712 | |
| | |
| | NET ASSETS – 100.0% | | $ | 5,777,610 | |
| | |
| | | | |
| The percentage shown for each investment category reflects the value of investments in that category as a percentage of net assets. |
* | | Non-income producing security. |
(a) | | Represents an Affiliated fund. |
| | |
|
Investment Abbreviations: |
| | | | |
ADR | | —American Depositary Receipt |
PLC | | —Public Limited Company |
|
| | |
| 68 | | The accompanying notes are an integral part of these financial statements. |
GOLDMAN SACHS FLEXIBLE CAP FUND
Schedule of Investments
August 31, 2017
| | | | | | | | |
| Shares | | | Description | | Value | |
| Common Stocks – 95.6% | |
| Aerospace & Defense – 0.4% | |
| | 310 | | | Northrop Grumman Corp. | | $ | 84,385 | |
| | |
| Air Freight & Logistics – 1.0% | |
| | 901 | | | FedEx Corp. | | | 193,156 | |
| | |
| Auto Components – 0.8% | |
| | 1,487 | | | Delphi Automotive PLC | | | 143,347 | |
| | |
| Banks – 2.0% | |
| | 2,282 | | | Eagle Bancorp, Inc.* | | | 141,941 | |
| | 4,091 | | | SunTrust Banks, Inc. | | | 225,414 | |
| | | | | | | | |
| | | | | | | 367,355 | |
| | |
| Beverages – 1.8% | | | |
| | 1,014 | | | Molson Coors Brewing Co. Class B | | | 91,006 | |
| | 4,236 | | | Monster Beverage Corp.* | | | 236,454 | |
| | | | | | | | |
| | | | | | | 327,460 | |
| | |
| Biotechnology – 6.6% | | | |
| | 4,571 | | | ACADIA Pharmaceuticals, Inc.*(a) | | | 162,773 | |
| | 1,243 | | | Agios Pharmaceuticals, Inc.* | | | 78,632 | |
| | 1,288 | | | Alkermes PLC* | | | 65,405 | |
| | 1,377 | | | Amgen, Inc. | | | 244,789 | |
| | 1,793 | | | Incyte Corp.* | | | 246,376 | |
| | 1,571 | | | Shire PLC ADR | | | 234,692 | |
| | 1,197 | | | Vertex Pharmaceuticals, Inc.* | | | 192,167 | |
| | | | | | | | |
| | | | | | | 1,224,834 | |
| | |
| Building Products – 0.4% | | | |
| | 1,296 | | | Fortune Brands Home & Security, Inc. | | | 81,039 | |
| | |
| Capital Markets – 2.9% | |
| | 2,751 | | | Intercontinental Exchange, Inc. | | | 177,907 | |
| | 2,003 | | | Lazard Ltd. Class A | | | 85,909 | |
| | 3,113 | | | Northern Trust Corp. | | | 275,500 | |
| | | | | | | | |
| | | | | | | 539,316 | |
| | |
| Chemicals – 2.1% | | | |
| | 1,303 | | | Ashland Global Holdings, Inc. | | | 80,851 | |
| | 565 | | | The Sherwin-Williams Co. | | | 191,688 | |
| | 5,996 | | | Valvoline, Inc. | | | 127,655 | |
| | | | | | | | |
| | | | | | | 400,194 | |
| | |
| Commercial Services & Supplies – 0.4% | | | |
| | 1,544 | | | Healthcare Services Group, Inc. | | | 79,053 | |
| | |
| Electrical Equipment* – 0.9% | |
| | 3,728 | | | Sensata Technologies Holding NV | | | 166,492 | |
| | |
| Electronic Equipment, Instruments & Components – 1.3% | |
| | 2,936 | | | Amphenol Corp. Class A | | | 237,640 | |
| | |
| Equity Real Estate Investment Trusts (REITs) – 4.2% | |
| | 1,868 | | | American Tower Corp. | | | 276,557 | |
| | 580 | | | Equinix, Inc. | | | 271,678 | |
| | 1,487 | | | SBA Communications Corp.* | | | 228,329 | |
| | | | | | | | |
| | | | | | | 776,564 | |
| | |
| Common Stocks – (continued) | |
| Food & Staples Retailing – 0.9% | | | |
| | 1,956 | | | Walgreens Boots Alliance, Inc. | | | 159,414 | |
| | |
| Health Care Equipment & Supplies – 4.0% | |
| | 5,597 | | | Boston Scientific Corp.* | | | 154,197 | |
| | 1,618 | | | Danaher Corp. | | | 134,973 | |
| | 2,213 | | | Edwards Lifesciences Corp.* | | | 251,530 | |
| | 2,483 | | | Nevro Corp.* | | | 213,985 | |
| | | | | | | | |
| | | | | | | 754,685 | |
| | |
| Health Care Providers & Services – 0.8% | | | |
| | 1,243 | | | Acadia Healthcare Co., Inc.*(a) | | | 58,346 | |
| | 598 | | | Aetna, Inc. | | | 94,305 | |
| | | | | | | | |
| | | | | | | 152,651 | |
| | |
| Hotels, Restaurants & Leisure – 2.6% | | | |
| | 1,639 | | | Dunkin’ Brands Group, Inc. | | | 84,507 | |
| | 1,514 | | | Las Vegas Sands Corp. | | | 94,186 | |
| | 1,883 | | | McDonald’s Corp. | | | 301,223 | |
| | | | | | | | |
| | | | | | | 479,916 | |
| | |
| Household Durables – 0.6% | | | |
| | 2,243 | | | Newell Brands, Inc. | | | 108,292 | |
| | |
| Household Products – 0.4% | |
| | 1,163 | | | Colgate-Palmolive Co. | | | 83,317 | |
| | |
| Industrial Conglomerates – 4.8% | |
| | 1,374 | | | 3M Co. | | | 280,736 | |
| | 2,817 | | | Honeywell International, Inc. | | | 389,507 | |
| | 996 | | | Roper Technologies, Inc. | | | 229,737 | |
| | | | | | | | |
| | | | | | | 899,980 | |
| | |
| Internet & Direct Marketing Retail* – 4.1% | | | |
| | 604 | | | Amazon.com, Inc. | | | 592,282 | |
| | 96 | | | The Priceline Group, Inc. | | | 177,800 | |
| | | | | | | | |
| | | | | | | 770,082 | |
| | |
| Internet Software & Services* – 8.8% | | | |
| | 444 | | | Alphabet, Inc. Class A | | | 424,127 | |
| | 475 | | | Alphabet, Inc. Class C | | | 446,182 | |
| | 4,549 | | | Facebook, Inc. Class A | | | 782,291 | |
| | | | | | | | |
| | | | | | | 1,652,600 | |
| | |
| IT Services – 4.6% | | | |
| | 3,267 | | | Black Knight Financial Services, Inc. Class A*(a) | | | 139,174 | |
| | 732 | | | Fiserv, Inc.* | | | 90,556 | |
| | 899 | | | Global Payments, Inc. | | | 85,846 | |
| | 3,301 | | | MasterCard, Inc. Class A | | | 440,023 | |
| | 1,545 | | | Total System Services, Inc. | | | 106,790 | |
| | | | | | | | |
| | | | | | | 862,389 | |
| | |
| Life Sciences Tools & Services – 2.7% | | | |
| | 3,283 | | | Agilent Technologies, Inc. | | | 212,476 | |
| | 705 | | | Illumina, Inc.* | | | 144,144 | |
| | 232 | | | Mettler-Toledo International, Inc.* | | | 140,381 | |
| | | | | | | | |
| | | | | | | 497,001 | |
| | |
| | |
| The accompanying notes are an integral part of these financial statements. | | 69 |
GOLDMAN SACHS FLEXIBLE CAP FUND
Schedule of Investments (continued)
August 31, 2017
| | | | | | | | |
| Shares | | | Description | | Value | |
| Common Stocks – (continued) | |
| Machinery – 4.2% | | | |
| | 2,007 | | | Fortive Corp. | | $ | 130,395 | |
| | 796 | | | IDEX Corp. | | | 93,594 | |
| | 1,899 | | | The Middleby Corp.* | | | 231,108 | |
| | 5,443 | | | Xylem, Inc. | | | 337,847 | |
| | | | | | | | |
| | | | | | | 792,944 | |
| | |
| Media – 3.1% | | | |
| | 8,811 | | | Comcast Corp. Class A | | | 357,815 | |
| | 2,169 | | | The Walt Disney Co. | | | 219,503 | |
| | | | | | | | |
| | | | | | | 577,318 | |
| | |
| Oil, Gas & Consumable Fuels* – 0.6% | | | |
| | 1,042 | | | Concho Resources, Inc. | | | 115,631 | |
| | |
| Personal Products – 1.4% | | | |
| | 2,418 | | | The Estee Lauder Cos., Inc. Class A | | | 258,702 | |
| | |
| Pharmaceuticals – 3.1% | | | |
| | 547 | | | Allergan PLC | | | 125,525 | |
| | 3,516 | | | Eli Lilly & Co. | | | 285,816 | |
| | 2,800 | | | Zoetis, Inc. | | | 175,560 | |
| | | | | | | | |
| | | | | | | 586,901 | |
| | |
| Road & Rail – 0.6% | | | |
| | 2,241 | | | CSX Corp. | | | 112,498 | |
| | |
| Semiconductors & Semiconductor Equipment – 2.4% | | | |
| | 2,838 | | | Applied Materials, Inc. | | | 128,051 | |
| | 736 | | | Qorvo, Inc.* | | | 53,890 | |
| | 2,060 | | | Texas Instruments, Inc. | | | 170,609 | |
| | 1,388 | | | Xilinx, Inc. | | | 91,691 | |
| | | | | | | | |
| | | | | | | 444,241 | |
| | |
| Software – 9.8% | | | |
| | 1,288 | | | Adobe Systems, Inc.* | | | 199,846 | |
| | 1,544 | | | Electronic Arts, Inc.* | | | 187,596 | |
| | 1,246 | | | Intuit, Inc. | | | 176,247 | |
| | 7,044 | | | Microsoft Corp. | | | 526,680 | |
| | 5,649 | | | Oracle Corp. | | | 284,314 | |
| | 1,713 | | | Red Hat, Inc.* | | | 184,148 | |
| | 2,203 | | | salesforce.com, Inc.* | | | 210,364 | |
| | 837 | | | Splunk, Inc.* | | | 56,154 | |
| | | | | | | | |
| | | | | | | 1,825,349 | |
| | |
| Specialty Retail – 1.7% | | | |
| | 3,003 | | | Ross Stores, Inc. | | | 175,525 | |
| | 954 | | | The Home Depot, Inc. | | | 142,976 | |
| | | | | | | | |
| | | | | | | 318,501 | |
| | |
| Technology Hardware, Storage & Peripherals – 6.4% | | | |
| | 7,251 | | | Apple, Inc. | | | 1,189,164 | |
| | |
| Textiles, Apparel & Luxury Goods – 2.0% | | | |
| | 5,281 | | | NIKE, Inc. Class B | | | 278,889 | |
| | 738 | | | PVH Corp. | | | 92,907 | |
| | | | | | | | |
| | | | | | | 371,796 | |
| | |
| Common Stocks – (continued) | |
| Tobacco – 1.2% | | | |
| | 1,929 | | | Philip Morris International, Inc. | | $ | 225,558 | |
| | |
| | TOTAL COMMON STOCKS | | | | |
| | (Cost $11,674,831) | | $ | 17,859,765 | |
| | |
| | | | | | | | |
Shares | | | Distribution
Rate | | Value | |
| Investment Companies(b) – 3.3% | | | |
| Goldman Sachs Financial Square Government Fund –
Institutional Shares |
|
| | 619,814 | | | 0.927% | | $ | 619,814 | |
| | (Cost $619,814) | | | | |
| | |
| TOTAL INVESTMENTS BEFORE
SECURITIES LENDING
REINVESTMENT VEHICLE | | | | |
| | (Cost $12,294,645) | | $ | 18,479,579 | |
| | |
| | | | | | | | |
| Securities Lending Reinvestment Vehicle(b) – 1.8% | |
| Goldman Sachs Financial Square Government Fund –
Institutional Shares |
|
| | 323,320 | | | 0.927% | | $ | 323,320 | |
| | (Cost $323,320) | | | | |
| | |
| | TOTAL INVESTMENTS – 100.7% | | | | |
| | (Cost $12,617,965) | | $ | 18,802,899 | |
| | |
| LIABILITIES IN EXCESS OF
OTHER ASSETS – (0.7)% | | | (121,839 | ) |
| | |
| | NET ASSETS – 100.0% | | $ | 18,681,060 | |
| | |
| | |
| The percentage shown for each investment category reflects the value of investments in that category as a percentage of net assets. |
* | | Non-income producing security. |
(a) | | All or a portion of security is on loan. |
(b) | | Represents an Affiliated fund. |
| | |
|
Investment Abbreviations: |
ADR | | —American Depositary Receipt |
PLC | | —Public Limited Company |
|
| | |
| 70 | | The accompanying notes are an integral part of these financial statements. |
GOLDMAN SACHS GROWTH OPPORTUNITIES FUND
Schedule of Investments
August 31, 2017
| | | | | | | | |
| Shares | | | Description | | Value | |
| Common Stocks – 98.5% | | | |
| Aerospace & Defense – 1.3% | | | |
| | 188,571 | | | L3 Technologies, Inc. | | $ | 34,221,865 | |
| | |
| Auto Components – 0.6% | | | |
| | 154,044 | | | Delphi Automotive PLC | | | 14,849,842 | |
| | |
| Banks – 3.6% | | | |
| | 584,628 | | | Eagle Bancorp, Inc.* | | | 36,363,862 | |
| | 350,318 | | | First Republic Bank | | | 33,998,362 | |
| | 406,963 | | | SunTrust Banks, Inc. | | | 22,423,661 | |
| | | | | | | | |
| | | | | | | 92,785,885 | |
| | |
| Beverages* – 1.4% | | | |
| | 643,001 | | | Monster Beverage Corp. | | | 35,892,316 | |
| | |
| | | | |
| Biotechnology* – 5.2% | | | |
| | 372,628 | | | ACADIA Pharmaceuticals, Inc. | | | 13,269,283 | |
| | 91,613 | | | Agios Pharmaceuticals, Inc. | | | 5,795,438 | |
| | 528,797 | | | Alkermes PLC | | | 26,852,312 | |
| | 690,692 | | | Exelixis, Inc. | | | 20,195,834 | |
| | 269,577 | | | Incyte Corp. | | | 37,042,575 | |
| | 259,485 | | | Neurocrine Biosciences, Inc. | | | 14,686,851 | |
| | 101,416 | | | Vertex Pharmaceuticals, Inc. | | | 16,281,325 | |
| | | | | | | | |
| | | | | | | 134,123,618 | |
| | |
| Building Products – 1.0% | | | |
| | 431,324 | | | Fortune Brands Home & Security, Inc. | | | 26,970,690 | |
| | |
| Capital Markets – 6.8% | | | |
| | 158,825 | | | Affiliated Managers Group, Inc. | | | 28,062,789 | |
| | 687,590 | | | Intercontinental Exchange, Inc. | | | 44,466,445 | |
| | 631,581 | | | Lazard Ltd. Class A | | | 27,088,509 | |
| | 179,914 | | | MSCI, Inc. | | | 20,619,944 | |
| | 628,659 | | | Northern Trust Corp. | | | 55,636,322 | |
| | | | | | | | |
| | | | | | | 175,874,009 | |
| | |
| Chemicals – 3.4% | | | |
| | 222,302 | | | Ashland Global Holdings, Inc. | | | 13,793,839 | |
| | 508,483 | | | RPM International, Inc. | | | 24,900,413 | |
| | 62,638 | | | The Sherwin-Williams Co. | | | 21,251,194 | |
| | 1,312,294 | | | Valvoline, Inc. | �� | | 27,938,739 | |
| | | | | | | | |
| | | | | | | 87,884,185 | |
| | |
| Containers & Packaging – 1.8% | | | |
| | 480,193 | | | Avery Dennison Corp. | | | 45,262,992 | |
| | |
| Diversified Consumer Services* – 1.0% | | | |
| | 330,631 | | | Bright Horizons Family Solutions, Inc. | | | 26,427,336 | |
| | |
| Electrical Equipment – 2.3% | | | |
| | 170,245 | | | Hubbell, Inc. | | | 19,201,934 | |
| | 922,670 | | | Sensata Technologies Holding NV* | | | 41,206,442 | |
| | | | | | | | |
| | | | | | | 60,408,376 | |
| | |
| Electronic Equipment, Instruments & Components – 3.2% | |
| | 1,024,657 | | | Amphenol Corp. Class A | | | 82,935,738 | |
| | |
| Common Stocks – (continued) | | | |
| Equity Real Estate Investment Trusts (REITs) – 3.0% | | | |
| | 71,179 | | | Equinix, Inc. | | | 33,340,955 | |
| | 280,732 | | | SBA Communications Corp.* | | | 43,106,399 | |
| | | | | | | | |
| | | | | | | 76,447,354 | |
| | |
| Food Products – 2.0% | | | |
| | 1,043,250 | | | Blue Buffalo Pet Products, Inc.* | | | 26,874,120 | |
| | 243,310 | | | The Hershey Co. | | | 25,528,085 | |
| | | | | | | | |
| | | | | | | 52,402,205 | |
| | |
| Health Care Equipment & Supplies – 4.1% | | | |
| | 537,825 | | | Edwards Lifesciences Corp.* | | | 61,129,189 | |
| | 301,414 | | | Nevro Corp.* | | | 25,975,859 | |
| | 78,979 | | | The Cooper Cos., Inc. | | | 19,810,303 | |
| | | | | | | | |
| | | | | | | 106,915,351 | |
| | |
| Hotels, Restaurants & Leisure – 2.2% | | | |
| | 599,520 | | | Dunkin’ Brands Group, Inc. | | | 30,911,251 | |
| | 354,567 | | | Yum! Brands, Inc. | | | 27,237,837 | |
| | | | | | | | |
| | | | | | | 58,149,088 | |
| | |
| Household Durables – 1.4% | | | |
| | 737,361 | | | Newell Brands, Inc. | | | 35,599,789 | |
| | |
| Industrial Conglomerates – 2.8% | | | |
| | 313,134 | | | Roper Technologies, Inc. | | | 72,227,488 | |
| | |
| Internet & Direct Marketing Retail – 1.8% | | | |
| | 315,263 | | | Expedia, Inc. | | | 46,772,419 | |
| | |
| Internet Software & Services* – 1.1% | | | |
| | 652,563 | | | GoDaddy, Inc. Class A | | | 29,247,874 | |
| | |
| IT Services – 7.8% | | | |
| | 1,237,447 | | | Black Knight Financial Services, Inc. Class A* | | | 52,715,242 | |
| | 403,967 | | | Fiserv, Inc.* | | | 49,974,757 | |
| | 480,989 | | | Global Payments, Inc. | | | 45,929,640 | |
| | 760,660 | | | Total System Services, Inc. | | | 52,576,819 | |
| | | | | | | | |
| | | | | | | 201,196,458 | |
| | |
| Life Sciences Tools & Services – 5.6% | | | |
| | 814,671 | | | Agilent Technologies, Inc. | | | 52,725,507 | |
| | 237,441 | | | Illumina, Inc.* | | | 48,547,187 | |
| | 73,725 | | | Mettler-Toledo International, Inc.* | | | 44,610,260 | |
| | | | | | | | |
| | | | | | | 145,882,954 | |
| | |
| Machinery – 9.6% | | | |
| | 645,125 | | | Fortive Corp. | | | 41,913,771 | |
| | 215,927 | | | IDEX Corp. | | | 25,388,697 | |
| | 200,789 | | | John Bean Technologies Corp. | | | 17,809,984 | |
| | 528,649 | | | The Middleby Corp.* | | | 64,336,583 | |
| | 215,927 | | | WABCO Holdings, Inc.* | | | 31,011,436 | |
| | 1,078,192 | | | Xylem, Inc. | | | 66,923,378 | |
| | | | | | | | |
| | | | | | | 247,383,849 | |
| | |
| Media – 1.7% | | | |
| | 594,445 | | | Altice USA, Inc. Class A* | | | 18,136,517 | |
| | |
| | |
| The accompanying notes are an integral part of these financial statements. | | 71 |
GOLDMAN SACHS GROWTH OPPORTUNITIES FUND
Schedule of Investments (continued)
August 31, 2017
| | | | | | | | |
| Shares | | | Description | | Value | |
| Common Stocks – (continued) | | | |
| Media – (continued) | | | |
| | 411,935 | | | CBS Corp. Class B | | $ | 26,388,556 | |
| | | | | | | | |
| | | | | | | 44,525,073 | |
| | |
| Oil, Gas & Consumable Fuels* – 1.6% | |
| | 186,181 | | | Concho Resources, Inc. | | | 20,660,506 | |
| | 232,395 | | | Diamondback Energy, Inc. | | | 21,099,142 | |
| | | | | | | | |
| | | | | | 41,759,648 | |
| | |
| Pharmaceuticals – 2.2% | | | |
| | 910,719 | | | Zoetis, Inc. | | | 57,102,081 | |
| | |
| Professional Services – 1.1% | | | |
| | 208,003 | | | Equifax, Inc. | | | 29,634,187 | |
| | |
| Semiconductors & Semiconductor Equipment – 5.7% | | | |
| | 684,799 | | | Advanced Micro Devices, Inc.* | | | 8,902,387 | |
| | 569,432 | | | Analog Devices, Inc. | | | 47,644,375 | |
| | 254,173 | | | Lam Research Corp. | | | 42,187,635 | |
| | 183,791 | | | Qorvo, Inc.* | | | 13,457,177 | |
| | 523,750 | | | Xilinx, Inc. | | | 34,598,925 | |
| | | | | | | | |
| | | | | | | 146,790,499 | |
| | |
| Software – 8.7% | | | |
| | 292,418 | | | Autodesk, Inc.* | | | 33,470,164 | |
| | 279,403 | | | Electronic Arts, Inc.* | | | 33,947,465 | |
| | 368,909 | | | Intuit, Inc. | | | 52,182,178 | |
| | 351,646 | | | Red Hat, Inc.* | | | 37,801,945 | |
| | 176,317 | | | ServiceNow, Inc.* | | | 20,486,272 | |
| | 430,522 | | | Splunk, Inc.* | | | 28,883,721 | |
| | 109,159 | | | Tyler Technologies, Inc.* | | | 18,862,675 | |
| | | | | | | | |
| | | | | | | 225,634,420 | |
| | |
| Specialty Retail – 3.1% | | | |
| | 335,547 | | | Five Below, Inc.* | | | 15,961,971 | |
| | 715,828 | | | Ross Stores, Inc. | | | 41,840,146 | |
| | 102,595 | | | Ulta Salon, Cosmetics & Fragrance, Inc.* | | | 22,674,521 | |
| | | | | | | | |
| | | | | | | 80,476,638 | |
| | |
| Textiles, Apparel & Luxury Goods – 1.4% | |
| | 285,512 | | | PVH Corp. | | | 35,943,106 | |
| | |
| | TOTAL COMMON STOCKS | | | | |
| | (Cost $1,915,736,997) | | $ | 2,551,727,333 | |
| | |
| Shares | | | Distribution
Rate | | Value | |
| | Investment Company(a) – 0.3% | |
| Goldman Sachs Financial Square Government Fund –
Institutional Shares |
|
| | 7,868,408 | | | 0.927% | | $ | 7,868,408 | |
| | (Cost $7,868,408) | | | | |
| | |
| | TOTAL INVESTMENTS – 98.8% | |
| | (Cost $1,923,605,405) | | $ | 2,559,595,741 | |
| | |
| OTHER ASSETS IN EXCESS OF
LIABILITIES – 1.2% | | | 31,434,541 | |
| | |
| | NET ASSETS – 100.0% | | $ | 2,591,030,282 | |
| | |
| | | | |
| The percentage shown for each investment category reflects the value of investments in that category as a percentage of net assets. |
* | | Non-income producing security. |
(a) | | Represents an Affiliated fund. |
| | | | |
|
Investment Abbreviations: |
PLC | | —Public Limited Company |
REIT | | —Real Estate Investment Trusts |
|
| | |
| 72 | | The accompanying notes are an integral part of these financial statements. |
GOLDMAN SACHS SMALL/MID CAP GROWTH FUND
Schedule of Investments
August 31, 2017
| | | | | | | | |
| Shares | | | Description | | Value | |
| Common Stocks – 97.5% | | | |
| Aerospace & Defense – 1.3% | | | |
| | 161,611 | | | L3 Technologies, Inc. | | $ | 29,329,164 | |
| | |
| Banks – 3.6% | | | |
| | 687,968 | | | Eagle Bancorp, Inc.* | | | 42,791,610 | |
| | 390,143 | | | First Republic Bank | | | 37,863,378 | |
| | | | | | | | |
| | | | | | | 80,654,988 | |
| | |
| Beverages – 1.3% | | | |
| | 505,207 | | | MGP Ingredients, Inc. | | | 28,407,790 | |
| | |
| Biotechnology* – 9.6% | | | |
| | 674,849 | | | ACADIA Pharmaceuticals, Inc. | | | 24,031,373 | |
| | 346,179 | | | Acceleron Pharma, Inc. | | | 13,417,898 | |
| | 391,355 | | | Agios Pharmaceuticals, Inc.(a) | | | 24,757,117 | |
| | 795,827 | | | Alder Biopharmaceuticals, Inc. | | | 7,799,105 | |
| | 581,520 | | | Alkermes PLC | | | 29,529,585 | |
| | 1,042,728 | | | Exelixis, Inc. | | | 30,489,367 | |
| | 137,739 | | | Galapagos NV ADR(a) | | | 12,739,480 | |
| | 483,931 | | | Neurocrine Biosciences, Inc. | | | 27,390,495 | |
| | 120,700 | | | Sarepta Therapeutics, Inc. | | | 4,863,003 | |
| | 168,204 | | | TESARO, Inc.(a) | | | 21,721,864 | |
| | 305,013 | | | Ultragenyx Pharmaceutical, Inc. | | | 17,404,042 | |
| | | | | | | | |
| | | | | | | 214,143,329 | |
| | |
| Building Products – 1.3% | | | |
| | 453,283 | | | Fortune Brands Home & Security, Inc. | | | 28,343,786 | |
| | |
| Capital Markets – 4.3% | | | |
| | 215,256 | | | Affiliated Managers Group, Inc. | | | 38,033,583 | |
| | 910,590 | | | Lazard Ltd. Class A | | | 39,055,205 | |
| | 155,187 | | | MSCI, Inc. | | | 17,785,982 | |
| | | | | | | | |
| | | | | | | 94,874,770 | |
| | |
| Chemicals – 3.0% | | | |
| | 254,354 | | | Ashland Global Holdings, Inc. | | | 15,782,666 | |
| | 523,398 | | | RPM International, Inc. | | | 25,630,800 | |
| | 1,195,786 | | | Valvoline, Inc. | | | 25,458,284 | |
| | | | | | | | |
| | | | | | | 66,871,750 | |
| | |
| Commercial Services & Supplies – 1.6% | | | |
| | 691,197 | | | Healthcare Services Group, Inc. | | | 35,389,286 | |
| | |
| Construction Materials* – 0.7% | | | |
| | 495,951 | | | Summit Materials, Inc. Class A | | | 14,650,393 | |
| | |
| Consumer Finance* – 1.0% | | | |
| | 2,118,711 | | | SLM Corp. | | | 21,547,291 | |
| | |
| Containers & Packaging – 1.6% | | | |
| | 370,838 | | | Avery Dennison Corp. | | | 34,955,190 | |
| | |
| Diversified Consumer Services* – 1.0% | | | |
| | 288,850 | | | Bright Horizons Family Solutions, Inc. | | | 23,087,780 | |
| | |
| Electrical Equipment – 2.7% | | | |
| | 212,102 | | | Hubbell, Inc. | | | 23,922,985 | |
| | 833,173 | | | Sensata Technologies Holding NV* | | | 37,209,506 | |
| | | | | | | | |
| | | | | | | 61,132,491 | |
| | |
| Common Stocks – (continued) | | | |
| Electronic Equipment, Instruments & Components – 1.9% | |
| | 578,832 | | | Badger Meter, Inc. | | | 26,568,389 | |
| | 151,878 | | | Cognex Corp. | | | 16,550,145 | |
| | | | | | | | |
| | | | | | | 43,118,534 | |
| | |
| Equity Real Estate Investment Trusts (REITs)* – 0.8% | | | |
| | 110,158 | | | SBA Communications Corp. | | | 16,914,761 | |
| | |
| Food Products – 1.8% | | | |
| | 943,695 | | | Blue Buffalo Pet Products, Inc.* | | | 24,309,583 | |
| | 442,091 | | | Snyder’s-Lance, Inc. | | | 15,703,073 | |
| | | | | | | | |
| | | | | | | 40,012,656 | |
| | |
| Health Care Equipment & Supplies – 6.3% | | | |
| | 193,500 | | | ABIOMED, Inc.* | | | 29,179,800 | |
| | 146,602 | | | ICU Medical, Inc.* | | | 25,560,059 | |
| | 40,534 | | | IDEXX Laboratories, Inc.* | | | 6,300,199 | |
| | 155,732 | | | Neogen Corp.* | | | 10,729,935 | |
| | 295,763 | | | Nevro Corp.* | | | 25,488,855 | |
| | 69,381 | | | The Cooper Cos., Inc. | | | 17,402,836 | |
| | 288,570 | | | West Pharmaceutical Services, Inc. | | | 25,117,133 | |
| | | | | | | | |
| | | | | | | 139,778,817 | |
| | |
| Health Care Providers & Services* – 2.1% | | | |
| | 516,437 | | | Acadia Healthcare Co., Inc. | | | 24,241,553 | |
| | 124,927 | | | WellCare Health Plans, Inc. | | | 21,822,248 | |
| | | | | | | | |
| | | | | | | 46,063,801 | |
| | |
| Health Care Technology* – 1.5% | | | |
| | 126,652 | | | athenahealth, Inc. | | | 17,849,067 | |
| | 875,846 | | | Evolent Health, Inc. Class A(a) | | | 14,626,628 | |
| | | | | | | | |
| | | | | | | 32,475,695 | |
| | |
| Hotels, Restaurants & Leisure – 4.9% | | | |
| | 720,647 | | | Dunkin’ Brands Group, Inc. | | | 37,156,559 | |
| | 176,250 | | | Jack in the Box, Inc. | | | 16,500,525 | |
| | 245,039 | | | Shake Shack, Inc. Class A*(a) | | | 7,576,606 | |
| | 99,067 | | | Vail Resorts, Inc. | | | 22,582,323 | |
| | 806,095 | | | Wingstop, Inc.(a) | | | 26,125,539 | |
| | | | | | | | |
| | | | | | | 109,941,552 | |
| | |
| Household Durables* – 0.9% | | | |
| | 789,375 | | | M/I Homes, Inc. | | | 19,418,625 | |
| | |
| Internet Software & Services* – 2.1% | | | |
| | 854,715 | | | GoDaddy, Inc. Class A | | | 38,308,326 | |
| | 122,436 | | | Wix.com Ltd. | | | 7,970,584 | |
| | | | | | | | |
| | | | | | | 46,278,910 | |
| | |
| IT Services – 7.9% | | | |
| | 1,168,919 | | | Black Knight Financial Services, Inc. Class A* | | | 49,795,949 | |
| | 106,612 | | | Gartner, Inc.* | | | 12,856,341 | |
| | 442,288 | | | Global Payments, Inc. | | | 42,234,081 | |
| | 658,706 | | | InterXion Holding NV* | | | 34,153,906 | |
| | 516,947 | | | Total System Services, Inc. | | | 35,731,377 | |
| | | | | | | | |
| | | | | | | 174,771,654 | |
| | |
| | |
| The accompanying notes are an integral part of these financial statements. | | 73 |
GOLDMAN SACHS SMALL/MID CAP GROWTH FUND
Schedule of Investments (continued)
August 31, 2017
| | | | | | | | |
| Shares | | | Description | | Value | |
| Common Stocks – (continued) | | | |
| Life Sciences Tools & Services – 3.7% | | | |
| | 177,757 | | | Agilent Technologies, Inc. | | $ | 11,504,433 | |
| | 38,471 | | | Mettler-Toledo International, Inc.* | | | 23,278,417 | |
| | 532,074 | | | PerkinElmer, Inc. | | | 35,643,637 | |
| | 150,891 | | | PRA Health Sciences, Inc.* | | | 11,678,964 | |
| | | | | | | | |
| | | | | | | 82,105,451 | |
| | |
| Machinery – 11.9% | | | |
| | 105,650 | | | Graco, Inc. | | | 12,203,631 | |
| | 217,733 | | | IDEX Corp. | | | 25,601,046 | |
| | 369,097 | | | John Bean Technologies Corp. | | | 32,738,904 | |
| | 514,327 | | | Kornit Digital Ltd.*(a) | | | 8,743,559 | |
| | 307,168 | | | Tennant Co. | | | 18,721,890 | |
| | 486,068 | | | The Gorman-Rupp Co. | | | 14,795,910 | |
| | 486,003 | | | The Middleby Corp.* | | | 59,146,565 | |
| | 198,520 | | | WABCO Holdings, Inc.* | | | 28,511,442 | |
| | 595,259 | | | Welbilt, Inc.* | | | 11,845,654 | |
| | 854,468 | | | Xylem, Inc. | | | 53,036,829 | |
| | | | | | | | |
| | | | | | | 265,345,430 | |
| | |
| Oil, Gas & Consumable Fuels* – 2.1% | | | |
| | 127,886 | | | Concho Resources, Inc. | | | 14,191,509 | |
| | 352,816 | | | Diamondback Energy, Inc. | | | 32,032,165 | |
| | | | | | | | |
| | | | | | | 46,223,674 | |
| | |
| Real Estate Management & Development – 0.8% | | | |
| | 491,238 | | | HFF, Inc. Class A | | | 18,730,905 | |
| | |
| Semiconductors & Semiconductor Equipment – 3.4% | | | |
| | 885,140 | | | Advanced Micro Devices, Inc.* | | | 11,506,820 | |
| | 211,676 | | | Cavium, Inc.* | | | 13,401,208 | |
| | 162,076 | | | Monolithic Power Systems, Inc. | | | 16,421,540 | |
| | 161,687 | | | Qorvo, Inc.* | | | 11,838,722 | |
| | 349,616 | | | Xilinx, Inc. | | | 23,095,633 | |
| | | | | | | | |
| | | | | | | 76,263,923 | |
| | |
| Software* – 6.7% | | | |
| | 220,843 | | | Red Hat, Inc. | | | 23,740,623 | |
| | 214,100 | | | ServiceNow, Inc. | | | 24,876,279 | |
| | 410,824 | | | Splunk, Inc. | | | 27,562,182 | |
| | 88,451 | | | Tableau Software, Inc. Class A | | | 6,410,928 | |
| | 135,881 | | | The Ultimate Software Group, Inc. | | | 27,298,493 | |
| | 229,868 | | | Tyler Technologies, Inc. | | | 39,721,190 | |
| | | | | | | | |
| | | | | | | 149,609,695 | |
| | |
| Specialty Retail – 2.9% | | | |
| | 269,221 | | | Burlington Stores, Inc.* | | | 23,457,226 | |
| | 440,694 | | | Five Below, Inc.* | | | 20,963,813 | |
| | 173,272 | | | Tractor Supply Co. | | | 10,311,417 | |
| | 45,758 | | | Ulta Salon, Cosmetics & Fragrance, Inc.* | | | 10,112,976 | |
| | | | | | | | |
| | | | | | | 64,845,432 | |
| | |
| Technology Hardware, Storage & Peripherals* – 1.5% | |
| | 925,337 | | | Electronics For Imaging, Inc. | | | 32,904,984 | |
| | |
| Common Stocks – (continued) | | | |
| Textiles, Apparel & Luxury Goods – 1.3% | | | |
| | 225,673 | | | PVH Corp. | | | 28,409,974 | |
| | |
| | TOTAL COMMON STOCKS | | | | |
| | (Cost $1,720,254,339) | | $ | 2,166,602,481 | |
| | |
| | |
| Shares | | | Distribution
Rate | | Value | |
| Investment Company(b) – 1.1% | |
| Goldman Sachs Financial Square Government Fund –
Institutional Shares |
|
| | 24,263,812 | | | 0.927% | | $ | 24,263,812 | |
| | (Cost $24,263,812) | | | | |
| | |
| TOTAL INVESTMENTS BEFORE
SECURITIES LENDING REINVESTMENT
VEHICLE | | | | |
| | (Cost $1,744,518,151) | | $ | 2,190,866,293 | |
| | |
| | |
| Securities Lending Reinvestment Vehicle(b) – 0.8% | |
| Goldman Sachs Financial Square Government Fund –
Institutional Shares |
|
| | 17,851,259 | | | 0.927% | | $ | 17,851,259 | |
| | (Cost $17,851,259) | | | | | | | |
| | |
| | TOTAL INVESTMENTS – 99.4% | | | | |
| | (Cost $1,762,369,410) | | $ | 2,208,717,552 | |
| | |
| OTHER ASSETS IN EXCESS OF
LIABILITIES – 0.6% | | | 12,786,197 | |
| | |
| | NET ASSETS – 100.0% | | $ | 2,221,503,749 | |
| | |
| | |
| The percentage shown for each investment category reflects the value of investments in that category as a percentage of net assets. |
* | | Non-income producing security. |
(a) | | All or a portion of security is on loan. |
(b) | | Represents an Affiliated fund. |
| | | | |
|
Investment Abbreviations: |
ADR | | —American Depositary Receipt |
PLC | | —Public Limited Company |
|
| | |
| 74 | | The accompanying notes are an integral part of these financial statements. |
GOLDMAN SACHS STRATEGIC GROWTH FUND
Schedule of Investments
August 31, 2017
| | | | | | | | |
| Shares | | | Description | | Value | |
| Common Stocks – 98.9% | | | |
| Aerospace & Defense – 2.5% | | | |
| | 6,429 | | | General Dynamics Corp. | | $ | 1,294,479 | |
| | 12,070 | | | Northrop Grumman Corp. | | | 3,285,575 | |
| | 8,700 | | | The Boeing Co. | | | 2,085,042 | |
| | | | | | | | |
| | | | | | | 6,665,096 | |
| | |
| Auto Components – 0.5% | | | |
| | 15,200 | | | Delphi Automotive PLC | | | 1,465,280 | |
| | |
| Banks – 0.9% | | | |
| | 41,920 | | | SunTrust Banks, Inc. | | | 2,309,792 | |
| | |
| Beverages – 2.7% | | | |
| | 26,744 | | | Molson Coors Brewing Co. Class B | | | 2,400,274 | |
| | 65,150 | | | Monster Beverage Corp.* | | | 3,636,673 | |
| | 27,030 | | | The Coca-Cola Co. | | | 1,231,216 | |
| | | | | | | | |
| | | | | | | 7,268,163 | |
| | |
| Biotechnology – 4.8% | | | |
| | 8,317 | | | Alexion Pharmaceuticals, Inc.* | | | 1,184,424 | |
| | 15,057 | | | Amgen, Inc. | | | 2,676,683 | |
| | 26,791 | | | Incyte Corp.* | | | 3,681,351 | |
| | 19,971 | | | Shire PLC ADR | | | 2,983,468 | |
| | 15,320 | | | Vertex Pharmaceuticals, Inc.* | | | 2,459,473 | |
| | | | | | | | |
| | | | | | | 12,985,399 | |
| | |
| Capital Markets – 3.1% | | | |
| | 51,957 | | | Intercontinental Exchange, Inc. | | | 3,360,059 | |
| | 41,059 | | | Northern Trust Corp. | | | 3,633,722 | |
| | 8,891 | | | S&P Global, Inc. | | | 1,372,148 | |
| | | | | | | | |
| | | | | | | 8,365,929 | |
| | |
| Chemicals – 1.4% | | | |
| | 8,270 | | | The Sherwin-Williams Co. | | | 2,805,763 | |
| | 47,345 | | | Valvoline, Inc. | | | 1,007,975 | |
| | | | | | | | |
| | | | | | | 3,813,738 | |
| | |
| Communications Equipment – 0.5% | | | |
| | 37,928 | | | Cisco Systems, Inc. | | | 1,221,661 | |
| | |
| Electronic Equipment, Instruments & Components – 0.6% | |
| | 20,888 | | | Amphenol Corp. Class A | | | 1,690,675 | |
| | |
| Equity Real Estate Investment Trusts (REITs) – 3.5% | | | |
| | 34,152 | | | American Tower Corp. | | | 5,056,203 | |
| | 9,202 | | | Equinix, Inc. | | | 4,310,309 | |
| | | | | | | | |
| | | | | | | 9,366,512 | |
| | |
| Food & Staples Retailing – 2.1% | | | |
| | 25,113 | | | Costco Wholesale Corp. | | | 3,936,212 | |
| | 19,813 | | | Walgreens Boots Alliance, Inc. | | | 1,614,759 | |
| | | | | | | | |
| | | | | | | 5,550,971 | |
| | |
| Food Products – 0.9% | | | |
| | 29,439 | | | The Kraft Heinz Co. | | | 2,377,199 | |
| | |
| Health Care Equipment & Supplies – 3.2% | | | |
| | 92,442 | | | Boston Scientific Corp.* | | | 2,546,777 | |
| | 42,541 | | | Danaher Corp. | | | 3,548,770 | |
| | |
| Common Stocks – (continued) | | | |
| Health Care Equipment & Supplies – (continued) | | | |
| | 21,940 | | | Edwards Lifesciences Corp.* | | | 2,493,701 | |
| | | | | | | | |
| | | | | | | 8,589,248 | |
| | |
| Health Care Providers & Services – 1.1% | | | |
| | 19,335 | | | Aetna, Inc. | | | 3,049,129 | |
| | |
| Hotels, Restaurants & Leisure – 2.3% | | | |
| | 26,167 | | | Las Vegas Sands Corp. | | | 1,627,849 | |
| | 28,441 | | | McDonald’s Corp. | | | 4,549,707 | |
| | | | | | | | |
| | | | | | | 6,177,556 | |
| | |
| Household Durables – 0.5% | | | |
| | 30,042 | | | Newell Brands, Inc. | | | 1,450,428 | |
| | |
| Household Products – 0.7% | | | |
| | 25,788 | | | Colgate-Palmolive Co. | | | 1,847,452 | |
| | |
| Industrial Conglomerates – 3.8% | | | |
| | 11,233 | | | 3M Co. | | | 2,295,127 | |
| | 35,061 | | | Honeywell International, Inc. | | | 4,847,884 | |
| | 13,456 | | | Roper Technologies, Inc. | | | 3,103,761 | |
| | | | | | | | |
| | | | | | | 10,246,772 | |
| | |
| Internet & Direct Marketing Retail* – 6.4% | | | |
| | 10,492 | | | Amazon.com, Inc. | | | 10,288,455 | |
| | 18,929 | | | Netflix, Inc. | | | 3,307,085 | |
| | 2,008 | | | The Priceline Group, Inc. | | | 3,718,977 | |
| | | | | | | | |
| | | | | | | 17,314,517 | |
| | |
| Internet Software & Services* – 9.6% | | | |
| | 8,805 | | | Alphabet, Inc. Class A | | | 8,410,888 | |
| | 6,764 | | | Alphabet, Inc. Class C | | | 6,353,628 | |
| | 65,221 | | | Facebook, Inc. Class A | | | 11,216,056 | |
| | | | | | | | |
| | | | | | | 25,980,572 | |
| | |
| IT Services – 4.1% | | | |
| | 23,015 | | | Fiserv, Inc.* | | | 2,847,186 | |
| | 14,603 | | | Global Payments, Inc. | | | 1,394,440 | |
| | 51,216 | | | MasterCard, Inc. Class A | | | 6,827,093 | |
| | | | | | | | |
| | | | | | | 11,068,719 | |
| | |
| Life Sciences Tools & Services – 1.8% | | | |
| | 28,202 | | | Agilent Technologies, Inc. | | | 1,825,234 | |
| | 15,057 | | | Illumina, Inc.* | | | 3,078,554 | |
| | | | | | | | |
| | | | | | | 4,903,788 | |
| | |
| Machinery – 3.7% | | | |
| | 28,727 | | | Fortive Corp. | | | 1,866,393 | |
| | 21,295 | | | The Middleby Corp.* | | | 2,591,602 | |
| | 10,636 | | | WABCO Holdings, Inc.* | | | 1,527,542 | |
| | 64,887 | | | Xylem, Inc. | | | 4,027,536 | |
| | | | | | | | |
| | | | | | | 10,013,073 | |
| | |
| Media – 4.5% | | | |
| | 167,056 | | | Comcast Corp. Class A | | | 6,784,144 | |
| | 51,838 | | | The Walt Disney Co. | | | 5,246,006 | |
| | | | | | | | |
| | | | | | | 12,030,150 | |
| | |
| | |
| The accompanying notes are an integral part of these financial statements. | | 75 |
GOLDMAN SACHS STRATEGIC GROWTH FUND
Schedule of Investments (continued)
August 31, 2017
| | | | | | | | |
| Shares | | | Description | | Value | |
| Common Stocks – (continued) | | | |
| Oil, Gas & Consumable Fuels* – 1.2% | | | |
| | 10,899 | | | Concho Resources, Inc. | | $ | 1,209,462 | |
| | 22,107 | | | Diamondback Energy, Inc. | | | 2,007,095 | |
| | | | | | | | |
| | | | | | | 3,216,557 | |
| | |
| Personal Products – 0.8% | | | |
| | 19,287 | | | The Estee Lauder Cos., Inc. Class A | | | 2,063,516 | |
| | |
| Pharmaceuticals – 3.6% | | | |
| | 8,987 | | | Allergan PLC | | | 2,062,337 | |
| | 63,811 | | | Eli Lilly & Co. | | | 5,187,196 | |
| | 39,649 | | | Zoetis, Inc. | | | 2,485,992 | |
| | | | | | | | |
| | | | | | | 9,735,525 | |
| | |
| Road & Rail – 1.1% | | | |
| | 61,589 | | | CSX Corp. | | | 3,091,768 | |
| | |
| Semiconductors & Semiconductor Equipment – 3.2% | | | |
| | 43,545 | | | Applied Materials, Inc. | | | 1,964,750 | |
| | 14,101 | | | NVIDIA Corp. | | | 2,389,274 | |
| | 50,499 | | | Texas Instruments, Inc. | | | 4,182,327 | |
| | | | | | | | |
| | | | | | | 8,536,351 | |
| | |
| Software – 10.8% | | | |
| | 20,458 | | | Adobe Systems, Inc.* | | | 3,174,263 | |
| | 27,461 | | | Electronic Arts, Inc.* | | | 3,336,512 | |
| | 21,199 | | | Intuit, Inc. | | | 2,998,599 | |
| | 164,116 | | | Microsoft Corp. | | | 12,270,953 | |
| | 80,421 | | | Oracle Corp. | | | 4,047,589 | |
| | 35,682 | | | salesforce.com, Inc.* | | | 3,407,274 | |
| | | | | | | | |
| | | | | | | 29,235,190 | |
| | |
| Specialty Retail – 1.8% | | | |
| | 53,821 | | | Ross Stores, Inc. | | | 3,145,837 | |
| | 11,639 | | | The Home Depot, Inc. | | | 1,744,337 | |
| | | | | | | | |
| | | | | | | 4,890,174 | |
| | |
| Technology Hardware, Storage & Peripherals – 6.9% | | | |
| | 113,952 | | | Apple, Inc. | | | 18,688,128 | |
| | |
| Textiles, Apparel & Luxury Goods – 2.5% | | | |
| | 86,946 | | | NIKE, Inc. Class B | | | 4,591,618 | |
| | 17,017 | | | PVH Corp. | | | 2,142,270 | |
| | | | | | | | |
| | | | | | | 6,733,888 | |
| | |
| Tobacco – 1.8% | | | |
| | 22,466 | | | Altria Group, Inc. | | | 1,424,344 | |
| | 28,106 | | | Philip Morris International, Inc. | | | 3,286,435 | |
| | | | | | | | |
| | | | | | | 4,710,779 | |
| | |
| | TOTAL COMMON STOCKS | | | | |
| | (Cost $163,094,311) | | $ | 266,653,695 | |
| | |
| Shares | | | Distribution
Rate | | Value | |
| | Investment Company(a) – 0.0% | |
| Goldman Sachs Financial Square Government Fund –
Institutional Shares |
|
| | 58 | | | 0.927% | | $ | 58 | |
| | (Cost $58) | | | | |
| | |
| | TOTAL INVESTMENTS – 98.9% | |
| | (Cost $163,094,369) | | $ | 266,653,753 | |
| | |
| OTHER ASSETS IN EXCESS OF
LIABILITIES – 1.1% | | | 3,021,150 | |
| | |
| | NET ASSETS – 100.0% | | $ | 269,674,903 | |
| | |
| | |
| The percentage shown for each investment category reflects the value of investments in that category as a percentage of net assets. |
* | | Non-income producing security. |
(a) | | Represents an Affiliated fund. |
| | | | |
|
Investment Abbreviations: |
ADR | | —American Depositary Receipt |
PLC | | —Public Limited Company |
|
| | |
| 76 | | The accompanying notes are an integral part of these financial statements. |
GOLDMAN SACHS TECHNOLOGY OPPORTUNITIES FUND
Schedule of Investments
August 31, 2017
| | | | | | | | |
| Shares | | | Description | | Value | |
| Common Stocks – 99.7% | | | |
| Capital Markets – 1.5% | | | |
| | 100,608 | | | Intercontinental Exchange, Inc. | | $ | 6,506,319 | |
| | |
| Electronic Equipment, Instruments & Components – 3.6% | |
| | 200,655 | | | Amphenol Corp. Class A | | | 16,241,016 | |
| | |
| Equity Real Estate Investment Trusts (REITs) – 8.6% | | | |
| | 95,230 | | | American Tower Corp. | | | 14,098,802 | |
| | 20,016 | | | Equinix, Inc. | | | 9,375,695 | |
| | 98,250 | | | SBA Communications Corp.* | | | 15,086,287 | |
| | | | | | | | |
| | | | | | | 38,560,784 | |
| | |
| Internet & Direct Marketing Retail – 9.0% | | | |
| | 27,324 | | | Amazon.com, Inc.* | | | 26,793,915 | |
| | 37,042 | | | Expedia, Inc. | | | 5,495,551 | |
| | 4,153 | | | The Priceline Group, Inc.* | | | 7,691,688 | |
| | | | | | | | |
| | | | | | | 39,981,154 | |
| | |
| Internet Software & Services* – 16.3% | | | |
| | 20,292 | | | Alphabet, Inc. Class A | | | 19,383,730 | |
| | 19,278 | | | Alphabet, Inc. Class C | | | 18,108,404 | |
| | 183,257 | | | eBay, Inc. | | | 6,621,075 | |
| | 165,814 | | | Facebook, Inc. Class A | | | 28,515,034 | |
| | | | | | | | |
| | | | | | | 72,628,243 | |
| | |
| IT Services – 12.7% | | | |
| | 68,560 | | | Accenture PLC Class A | | | 8,964,905 | |
| | 179,898 | | | Black Knight Financial Services, Inc. Class A*(a) | | | 7,663,655 | |
| | 42,688 | | | Gartner, Inc.* | | | 5,147,746 | |
| | 101,204 | | | Global Payments, Inc. | | | 9,663,970 | |
| | 114,889 | | | MasterCard, Inc. Class A | | | 15,314,704 | |
| | 145,335 | | | Total System Services, Inc. | | | 10,045,555 | |
| | | | | | | | |
| | | | | | | 56,800,535 | |
| | |
| Semiconductors & Semiconductor Equipment – 10.8% | | | |
| | 294,289 | | | Applied Materials, Inc. | | | 13,278,320 | |
| | 18,014 | | | Broadcom Ltd. | | | 4,540,789 | |
| | 87,568 | | | Cavium, Inc.* | | | 5,543,930 | |
| | 95,687 | | | Qorvo, Inc.* | | | 7,006,202 | |
| | 164,480 | | | Texas Instruments, Inc. | | | 13,622,234 | |
| | 65,692 | | | Xilinx, Inc. | | | 4,339,613 | |
| | | | | | | | |
| | | | | | | 48,331,088 | |
| | |
| Software – 28.3% | | | |
| | 80,329 | | | Activision Blizzard, Inc. | | | 5,266,369 | |
| | 70,146 | | | Adobe Systems, Inc.* | | | 10,883,853 | |
| | 45,277 | | | Autodesk, Inc.* | | | 5,182,405 | |
| | 78,690 | | | Electronic Arts, Inc.* | | | 9,560,835 | |
| | 76,176 | | | Intuit, Inc. | | | 10,775,095 | |
| | 236,541 | | | Microsoft Corp. | | | 17,686,171 | |
| | 354,813 | | | Oracle Corp. | | | 17,857,738 | |
| | 101,057 | | | Red Hat, Inc.* | | | 10,863,628 | |
| | 91,349 | | | Salesforce.com, Inc.* | | | 8,722,916 | |
| | 124,579 | | | ServiceNow, Inc.* | | | 14,474,834 | |
| | 156,525 | | | Splunk, Inc.* | | | 10,501,262 | |
| | 43,898 | | | Workday, Inc. Class A* | | | 4,815,172 | |
| | | | | | | | |
| | | | | | | 126,590,278 | |
| | |
| Common Stocks – (continued) | | | |
| Technology Hardware, Storage & Peripherals – 8.9% | | | |
| | 209,283 | | | Apple, Inc. | | | 34,322,412 | |
| | 151,182 | | | Electronics For Imaging, Inc.* | | | 5,376,032 | |
| | | | | | | | |
| | | | | | | 39,698,444 | |
| | |
| | TOTAL COMMON STOCKS | | | | |
| | (Cost $218,337,456) | | $ | 445,337,861 | |
| | |
| | |
| Shares | | | Distribution
Rate | | Value | |
| Investment Companies(b) – 0.0% | |
| Goldman Sachs Financial Square Government Fund –
Institutional Shares |
|
| | 15 | | | 0.927% | | $ | 15 | |
| | (Cost $15) | | | | |
| | |
| TOTAL INVESTMENTS BEFORE
SECURITIES LENDING REINVESTMENT
VEHICLE | | | | |
| | (Cost $218,337,471) | | $ | 445,337,876 | |
| | |
| | |
| Securities Lending Reinvestment Vehicle(b) – 0.6% | |
| Goldman Sachs Financial Square Government Fund –
Institutional Shares |
|
| | 2,637,072 | | | 0.927% | | $ | 2,637,072 | |
| | (Cost $2,637,072) | | | | | | | |
| | |
| | TOTAL INVESTMENTS – 100.3% | | | | |
| | (Cost $220,974,543) | | $ | 447,974,948 | |
| | |
| LIABILITIES IN EXCESS OF
OTHER ASSETS – (0.3)% | | | (1,119,117 | ) |
| | |
| | NET ASSETS – 100.0% | | $ | 446,855,831 | |
| | |
| | |
| The percentage shown for each investment category reflects the value of investments in that category as a percentage of net assets. |
* | | Non-income producing security. |
(a) | | All or a portion of security is on loan. |
(b) | | Represents an Affiliated fund. |
| | | | |
|
Investment Abbreviations: |
PLC | | —Public Limited Company |
|
| | |
| The accompanying notes are an integral part of these financial statements. | | 77 |
GOLDMAN SACHS FUNDAMENTAL EQUITY GROWTH FUNDS
Statements of Assets and Liabilities
August 31, 2017
| | | | | | |
| | | | |
Capital
Growth Fund | |
| | Assets: | | | | |
| | Investments of unaffiliated issuers, at value (cost $581,435,099, $102,070,303, $4,451,929, $11,674,831, $1,915,736,997, $1,720,254,339, $163,094,311 and $218,337,456) | | $ | 911,488,962 | |
| | Investments of affiliated issuers, at value (cost $2,846,511, $84, $218,033, $619,814, $7,868,408, $24,263,812, $58 and $15) | | | 2,846,511 | |
| | Investments in securities lending reinvestment vehicle — affiliated issuer, at value (cost $381,393, $0, $0, $323,320, $0, $17,851,259, $0 and $2,637,072)(a) | | | 381,393 | |
| | Cash | | | 3,943,571 | |
| | Receivables: | | | | |
| | Dividends | | | 1,277,422 | |
| | Reimbursement from investment adviser | | | 101,913 | |
| | Fund shares sold | | | 46,881 | |
| | Foreign tax reclaims | | | 32,145 | |
| | Securities lending income | | | 209 | |
| | Investments sold | | | — | |
| | Other assets | | | 1,864 | |
| | Total assets | | | 920,120,871 | |
| | | | | | |
| | Liabilities: | | | | |
| | Payables: | | | | |
| | Fund shares redeemed | | | 597,360 | |
| | Management fees | | | 546,063 | |
| | Payable upon return of securities loaned | | | 381,393 | |
| | Distribution and Service fees and Transfer Agency fees | | | 315,580 | |
| | Investments purchased | | | 547 | |
| | Payable to investment advisor | | | | |
| | Accrued expenses | | | 217,872 | |
| | Total liabilities | | | 2,058,815 | |
| | | | | | |
| | Net Assets: | | | | |
| | Paid-in capital | | | 523,930,299 | |
| | Undistributed (distributions in excess of) net investment income | | | 1,308,106 | |
| | Accumulated net realized gain | | | 62,769,788 | |
| | Net unrealized gain | | | 330,053,863 | |
| | | NET ASSETS | | $ | 918,062,056 | |
| | | Net Assets: | | | | |
| | | Class A | | $ | 671,371,076 | |
| | | Class C | | | 62,700,648 | |
| | | Institutional | | | 165,947,652 | |
| | | Service | | | 1,436,732 | |
| | | Investor | | | 8,496,489 | |
| | | Class R | | | 8,093,313 | |
| | | Class R6 | | | 16,146 | |
| | | Total Net Assets | | $ | 918,062,056 | |
| | | Shares Outstanding $0.001 par value (unlimited number of shares authorized): | | | | |
| | | Class A | | | 23,215,732 | |
| | | Class C | | | 2,833,668 | |
| | | Institutional | | | 5,251,973 | |
| | | Service | | | 51,314 | |
| | | Investor | | | 289,886 | |
| | | Class R | | | 288,938 | |
| | | Class R6 | | | 511 | |
| | | Net asset value, offering and redemption price per share:(b) | | | | |
| | | Class A | | | $28.92 | |
| | | Class C | | | 22.13 | |
| | | Institutional | | | 31.60 | |
| | | Service | | | 28.00 | |
| | | Investor | | | 29.31 | |
| | | Class R | | | 28.01 | |
| | | Class R6 | | | 31.60 | |
| | (a) | | Includes loaned securities having a market value of $373,278, $316,138, $17,383,744 and $2,585,360 for the Capital Growth, Flexible Cap, Small/Mid Cap Growth and Technology Opportunities Funds, respectively. |
| | (b) | | Maximum public offering price per share for Class A Shares of the Capital Growth, Concentrated Growth, Dynamic U.S. Equity, Flexible Cap, Growth Opportunities, Small/Mid Cap Growth, Strategic Growth and Technology Opportunities Funds is $30.60, $18.65, $15.70, $14.91, $25.37, $23.08, $14.59 and $24.38, respectively. At redemption, Class C Shares may be subject to a contingent deferred sales charge, assessed on the amount equal to the lesser of the current net asset value (“NAV”) or the original purchase price of the shares. |
| | |
| 78 | | The accompanying notes are an integral part of these financial statements. |
GOLDMAN SACHS FUNDAMENTAL EQUITY GROWTH FUNDS
| | | | | | | | | | | | | | | | | | | | | | | | | | | | | | | | | | | | | | | | |
| | | Concentrated
Growth Fund | | | | | Dynamic U.S.
Equity Fund | | | | | Flexible Cap
Fund | | | | | Growth
Opportunities
Fund | | | | | Small/Mid Cap
Growth Fund | | | | | Strategic Growth
Fund | | | | | Technology
Opportunities
Fund | |
| | | | | | | | | | | | | | | | | | | | | | | | | | | | | | | | | | | | | | | | |
| | $ | 150,528,931 | | | | | $ | 5,515,865 | | | | | $ | 17,859,765 | | | | | $ | 2,551,727,333 | | | | | $ | 2,166,602,481 | | | | | $ | 266,653,695 | | | | | $ | 445,337,861 | |
| | | 84 | | | | | | 218,033 | | | | | | 619,814 | | | | | | 7,868,408 | | | | | | 24,263,812 | | | | | | 58 | | | | | | 15 | |
| | | — | | | | | | — | | | | | | 323,320 | | | | | | — | | | | | | 17,851,259 | | | | | | — | | | | | | 2,637,072 | |
| | | 1,158,562 | | | | | | 88,843 | | | | | | 280,339 | | | | | | 38,910,544 | | | | | | 33,053,820 | | | | | | 3,951,025 | | | | | | 2,085,993 | |
| | | | | | | | | | | | | | | | | | | | | | | | | | | | | | | | | | | | | | | | |
| | | 225,608 | | | | | | 14,638 | | | | | | 25,361 | | | | | | 2,176,965 | | | | | | 1,979,791 | | | | | | 399,041 | | | | | | 174,080 | |
| | | 57,818 | | | | | | — | | | | | | 11,044 | | | | | | — | | | | | | — | | | | | | 43,356 | | | | | | 58,757 | |
| | | 112,050 | | | | | | 1,116 | | | | | | 201 | | | | | | 21,883,089 | | | | | | 1,080,664 | | | | | | 68,933 | | | | | | 165,356 | |
| | | — | | | | | | 233 | | | | | | — | | | | | | — | | | | | | — | | | | | | — | | | | | | — | |
| | | — | | | | | | — | | | | | | 59 | | | | | | 812 | | | | | | 8,839 | | | | | | — | | | | | | 530 | |
| | | — | | | | | | — | | | | | | — | | | | | | 8,753,321 | | | | | | — | | | | | | — | | | | | | 591,071 | |
| | | 393 | | | | | | 59,757 | | | | | | 2,928 | | | | | | 6,364 | | | | | | 5,172 | | | | | | 750 | | | | | | 888 | |
| | | 152,083,446 | | | | | | 5,898,485 | | | | | | 19,122,831 | | | | | | 2,631,326,836 | | | | | | 2,244,845,838 | | | | | | 271,116,858 | | | | | | 451,051,623 | |
| | | | | | | | | | | | | | | | | | | | | | | | | | | | | | | | | | | | | | | | |
| | | | | | | | | | | | | | | | | | | | | | | | | | | | | | | | | | | | | | | | |
| | | | | | | | | | | | | | | | | | | | | | | | | | | | | | | | | | | | | | | | |
| | | 255,587 | | | | | | — | | | | | | 4,000 | | | | | | 37,720,564 | | | | | | 3,258,364 | | | | | | 306,755 | | | | | | 921,922 | |
| | | 99,033 | | | | | | 3,382 | | | | | | 12,068 | | | | | | 1,973,177 | | | | | | 1,581,851 | | | | | | 160,634 | | | | | | 351,591 | |
| | | — | | | | | | — | | | | | | 323,320 | | | | | | — | | | | | | 17,851,259 | | | | | | — | | | | | | 2,637,072 | |
| | | 8,854 | | | | | | 964 | | | | | | 3,773 | | | | | | 350,404 | | | | | | 438,761 | | | | | | 33,301 | | | | | | 152,074 | |
| | | 437,513 | | | | | | 136 | | | | | | 545 | | | | | | 874 | | | | | | 23,803 | | | | | | 833,537 | | | | | | 15 | |
| | | — | | | | | | 21,611 | | | | | | — | | | | | | — | | | | | | — | | | | | | — | | | | | | — | |
| | | 113,277 | | | | | | 94,782 | | | | | | 98,065 | | | | | | 251,535 | | | | | | 188,051 | | | | | | 107,728 | | | | | | 133,118 | |
| | | 914,264 | | | | | | 120,875 | | | | | | 441,771 | | | | | | 40,296,554 | | | | | | 23,342,089 | | | | | | 1,441,955 | | | | | | 4,195,792 | |
| | | | | | | | | | | | | | | | | | | | | | | | | | | | | | | | | | | | | | | | |
| | | | | | | | | | | | | | | | | | | | | | | | | | | | | | | | | | | | | | | | |
| | | 92,314,746 | | | | | | 3,670,082 | | | | | | 11,070,407 | | | | | | 1,638,948,275 | | | | | | 1,558,156,721 | | | | | | 116,296,390 | | | | | | 197,576,468 | |
| | | 481,013 | | | | | | 39,404 | | | | | | 13,337 | | | | | | (5,528,419 | ) | | | | | (4,405,886 | ) | | | | | 1,285,219 | | | | | | (1,923,459 | ) |
| | | 9,914,795 | | | | | | 1,004,188 | | | | | | 1,412,382 | | | | | | 321,620,090 | | | | | | 221,404,772 | | | | | | 48,533,910 | | | | | | 24,202,417 | |
| | | 48,458,628 | | | | | | 1,063,936 | | | | | | 6,184,934 | | | | | | 635,990,336 | | | | | | 446,348,142 | | | | | | 103,559,384 | | | | | | 227,000,405 | |
| | | $ | 151,169,182 | | | | | $ | 5,777,610 | | | | | $ | 18,681,060 | | | | | $ | 2,591,030,282 | | | | | $ | 2,221,503,749 | | | | | $ | 269,674,903 | | | | | $ | 446,855,831 | |
| | | | | | | | | | | | | | | | | | | | | | | | | | | | | | | | | | | | | | | | | |
| | | $ | 5,462,453 | | | | | $ | 1,880,382 | | | | | $ | 5,627,331 | | | | | $ | 486,114,922 | | | | | $ | 351,252,586 | | | | | $ | 46,113,904 | | | | | $ | 268,746,331 | |
| | | | 2,210,214 | | | | | | 177,648 | | | | | | 1,511,937 | | | | | | 91,086,284 | | | | | | 217,384,866 | | | | | | 9,326,170 | | | | | | 50,778,570 | |
| | | | 142,623,134 | | | | | | 3,498,779 | | | | | | 11,111,027 | | | | | | 1,670,808,048 | | | | | | 1,149,458,856 | | | | | | 211,311,400 | | | | | | 85,094,748 | |
| | | | — | | | | | | — | | | | | | — | | | | | | 33,159,009 | | | | | | 16,520,441 | | | | | | 477,626 | | | | | | 18,919,315 | |
| | | | 779,921 | | | | | | 187,957 | | | | | | 379,465 | | | | | | 132,003,296 | | | | | | 437,308,720 | | | | | | 2,264,474 | | | | | | 23,316,867 | |
| | | | 25,336 | | | | | | 21,657 | | | | | | 39,492 | | | | | | 59,225,110 | | | | | | 26,918,007 | | | | | | 169,272 | | | | | | — | |
| | | | 68,124 | | | | | | 11,187 | | | | | | 11,808 | | | | | | 118,633,613 | | | | | | 22,660,273 | | | | | | 12,057 | | | | | | — | |
| | | $ | 151,169,182 | | | | | $ | 5,777,610 | | | | | $ | 18,681,060 | | | | | $ | 2,591,030,282 | | | | | $ | 2,221,503,749 | | | | | $ | 269,674,903 | | | | | $ | 446,855,831 | |
| | | | | | | | | | | | | | | | | | | | | | | | | | | | | | | | | | | | | | | | | |
| | | | 309,979 | | | | | | 126,714 | | | | | | 399,487 | | | | | | 20,282,711 | | | | | | 16,107,271 | | | | | | 3,344,938 | | | | | | 11,665,392 | |
| | | | 147,990 | | | | | | 12,367 | | | | | | 118,569 | | | | | | 5,073,765 | | | | | | 11,282,488 | | | | | | 814,004 | | | | | | 2,610,053 | |
| | | | 7,645,506 | | | | | | 234,435 | | | | | | 746,750 | | | | | | 60,674,162 | | | | | | 49,812,377 | | | | | | 14,406,141 | | | | | | 3,383,697 | |
| | | | — | | | | | | — | | | | | | — | | | | | | 1,438,574 | | | | | | 774,347 | | | | | | 34,860 | | | | | | 835,841 | |
| | | | 43,632 | | | | | | 12,594 | | | | | | 25,943 | | | | | | 5,302,003 | | | | | | 19,455,306 | | | | | | 154,518 | | | | | | 938,694 | |
| | | | 1,479 | | | | | | 1,455 | | | | | | 2,890 | | | | | | 2,562,899 | | | | | | 1,271,476 | | | | | | 12,485 | | | | | | — | |
| | | | 3,652 | | | | | | 749 | | | | | | 794 | | | | | | 4,306,506 | | | | | | 981,598 | | | | | | 823 | | | | | | — | |
| | | | | | | | | | | | | | | | | | | | | | | | | | | | | | | | | | | | | | | | | |
| | | | $17.62 | | | | | | $14.84 | | | | | | $14.09 | | | | | | $23.97 | | | | | | $21.81 | | | | | | $13.79 | | | | | | $23.04 | |
| | | | 14.93 | | | | | | 14.36 | | | | | | 12.75 | | | | | | 17.95 | | | | | | 19.27 | | | | | | 11.46 | | | | | | 19.45 | |
| | | | 18.65 | | | | | | 14.92 | | | | | | 14.88 | | | | | | 27.54 | | | | | | 23.08 | | | | | | 14.67 | | | | | | 25.15 | |
| | | | — | | | | | | — | | | | | | — | | | | | | 23.05 | | | | | | 21.33 | | | | | | 13.70 | | | | | | 22.64 | |
| | | | 17.88 | | | | | | 14.92 | | | | | | 14.63 | | | | | | 24.90 | | | | | | 22.48 | | | | | | 14.66 | | | | | | 24.84 | |
| | | | 17.13 | | | | | | 14.89 | | | | | | 13.67 | | | | | | 23.11 | | | | | | 21.17 | | | | | | 13.56 | | | | | | — | |
| | | | 18.65 | | | | | | 14.93 | | | | | | 14.88 | | | | | | 27.55 | | | | | | 23.09 | | | | | | 14.66 | | | | | | — | |
| | |
| The accompanying notes are an integral part of these financial statements. | | 79 |
GOLDMAN SACHS FUNDAMENTAL EQUITY GROWTH FUNDS
Statements of Operations
For the Fiscal Year Ended August 31, 2017
| | | | | | |
| | | | |
Capital Growth
Fund | |
| | Investment income: | | | | |
| | Dividends — unaffiliated issuers (net of foreign withholding taxes of $12,313, $2,361, $0, $0, $0, $0, $31,343 and $0) | | $ | 11,066,347 | |
| | Dividends — affiliated issuers | | | 8,537 | |
| | Interest | | | 2,356 | |
| | Securities lending income — affiliated issuer | | | 83,726 | |
| | Total investment income | | | 11,160,966 | |
| | | | | | |
| | Expenses: | | | | |
| | Management fees | | | 8,633,098 | |
| | Distribution and Service fees(a) | | | 2,275,434 | |
| | Transfer Agency fees(a) | | | 1,407,078 | |
| | Custody, accounting and administrative services | | | 258,197 | |
| | Professional fees | | | 111,275 | |
| | Registration fees | | | 98,047 | |
| | Printing and mailing costs | | | 96,737 | |
| | Trustee fees | | | 18,652 | |
| | Service Share fees — Service Plan | | | 3,830 | |
| | Service Share fees — Shareholder Administration Plan | | | 3,830 | |
| | Other | | | 40,065 | |
| | Total expenses | | | 12,946,243 | |
| | Less — expense reductions | | | (3,088,422 | ) |
| | Net expenses | | | 9,857,821 | |
| | NET INVESTMENT INCOME (LOSS) | | | 1,303,145 | |
| | | | | | |
| | Realized and unrealized gain (loss): | | | | |
| | Net realized gain from: | | | | |
| | Investments — unaffiliated issuers (including commission recapture of $0, $6,046, $84, $202, $100,192, $69,943, $10,796 and $4,707) | | | 65,849,893 | |
| | Investments — affiliated issuers | | | — | |
| | Net change in unrealized gain on: | | | | |
| | Investments — unaffiliated issuers | | | 101,955,647 | |
| | Investments — affiliated issuers | | | — | |
| | Net realized and unrealized gain | | | 167,805,540 | |
| | NET INCREASE IN NET ASSETS RESULTING FROM OPERATIONS | | $ | 169,108,685 | |
| | (a) | | Class specific Distribution and Service and Transfer Agency fees were as follows: |
| | | | | | | | | | | | | | | | | | | | | | | | | | | | | | | | | | | | | | | | |
| | | Distribution and Service Fees | | | Transfer Agency Fees | |
Fund | | Class A | | | Class C | | | Class R | | | Class A | | | Class C | | | Institutional | | | Service | | | Investor | | | Class R | | | Class R6 | |
Capital Growth Fund | | $ | 1,588,477 | | | $ | 663,780 | | | $ | 23,177 | | | $ | 1,200,878 | | | $ | 125,523 | | | $ | 59,675 | | | $ | 613 | | | $ | 11,654 | | | $ | 8,731 | | | $ | 4 | |
Concentrated Growth Fund | | | 13,956 | | | | 21,410 | | | | 121 | | | | 10,556 | | | | 4,047 | | | | 50,475 | | | | — | | | | 1,069 | | | | 46 | | | | 5 | |
Dynamic U.S. Equity Fund | | | 4,935 | | | | 1,758 | | | | 102 | | | | 3,733 | | | | 332 | | | | 1,877 | | | | — | | | | 430 | | | | 39 | | | | 4 | |
Flexible Cap Fund | | | 13,614 | | | | 13,724 | | | | 166 | | | | 10,293 | | | | 2,593 | | | | 3,998 | | | | — | | | | 716 | | | | 63 | | | | 4 | |
Growth Opportunities Fund | | | 1,332,846 | | | | 1,066,653 | | | | 298,265 | | | | 1,008,310 | | | | 201,791 | | | | 763,492 | | | | 13,579 | | | | 250,037 | | | | 112,772 | | | | 18,923 | |
Small/Mid Cap Growth Fund | | | 1,250,474 | | | | 2,311,899 | | | | 148,700 | | | | 947,011 | | | | 437,181 | | | | 454,297 | | | | 5,984 | | | | 710,310 | | | | 56,251 | | | | 3,670 | |
Strategic Growth Fund | | | 112,767 | | | | 98,517 | | | | 728 | | | | 85,265 | | | | 18,631 | | | | 101,685 | | | | 150 | | | | 2,709 | | | | 275 | | | | 4 | |
Technology Opportunities Fund | | | 601,100 | | | | 516,917 | | | | — | | | | 454,326 | | | | 97,737 | | | | 33,070 | | | | 5,561 | | | | 31,145 | | | | — | | | | — | |
| | |
| 80 | | The accompanying notes are an integral part of these financial statements. |
GOLDMAN SACHS FUNDAMENTAL EQUITY GROWTH FUNDS
| | | | | | | | | | | | | | | | | | | | | | | | | | | | | | | | | | | | | | | | |
| | |
Concentrated
Growth Fund | | | | | Dynamic U.S.
Equity Fund | | | | | Flexible Cap
Fund | | | | | Growth
Opportunities
Fund | | | | | Small/Mid Cap
Growth Fund | | | | | Strategic
Growth Fund | | | | | Technology
Opportunities
Fund | |
| | | | | | | | | | | | | | | | | | | | | | | | | | | | | | | | | | | | | | | | |
| | $ | 1,784,515 | | | | | $ | 119,094 | | | | | $ | 196,194 | | | | | $ | 20,443,896 | | | | | $ | 15,031,556 | | | | | $ | 3,900,044 | | | | | $ | 2,698,665 | |
| | | 2,004 | | | | | | 503 | | | | | | 1,439 | | | | | | 42,985 | | | | | | 97,325 | | | | | | 1,970 | | | | | | 715 | |
| | | 5,859 | | | | | | — | | | | | | 5,498 | | | | | | 12,621 | | | | | | 8,840 | | | | | | 3,744 | | | | | | 11,230 | |
| | | 455 | | | | | | 27 | | | | | | 3,567 | | | | | | 719,719 | | | | | | 572,339 | | | | | | 41,646 | | | | | | 49,154 | |
| | | 1,792,833 | | | | | | 119,624 | | | | | | 206,698 | | | | | | 21,219,221 | | | | | | 15,710,060 | | | | | | 3,947,404 | | | | | | 2,759,764 | |
| | | | | | | | | | | | | | | | | | | | | | | | | | | | | | | | | | | | | | | | |
| | | | | | | | | | | | | | | | | | | | | | | | | | | | | | | | | | | | | | | | |
| | | 1,345,166 | | | | | | 49,704 | | | | | | 172,346 | | | | | | 27,784,508 | | | | | | 22,746,249 | | | | | | 3,111,416 | | | | | | 4,052,183 | |
| | | 35,487 | | | | | | 6,795 | | | | | | 27,504 | | | | | | 2,697,764 | | | | | | 3,711,073 | | | | | | 212,012 | | | | | | 1,118,017 | |
| | | 66,198 | | | | | | 6,415 | | | | | | 17,667 | | | | | | 2,368,904 | | | | | | 2,614,704 | | | | | | 208,719 | | | | | | 621,839 | |
| | | 48,884 | | | | | | 43,363 | | | | | | 56,200 | | | | | | 200,766 | | | | | | 163,042 | | | | | | 69,725 | | | | | | 68,973 | |
| | | 103,934 | | | | | | 83,431 | | | | | | 86,028 | | | | | | 85,297 | | | | | | 74,801 | | | | | | 114,749 | | | | | | 115,561 | |
| | | 83,795 | | | | | | 82,235 | | | | | | 79,254 | | | | | | 121,607 | | | | | | 126,807 | | | | | | 84,089 | | | | | | 66,876 | |
| | | 28,752 | | | | | | 16,464 | | | | | | 25,931 | | | | | | 111,445 | | | | | | 217,980 | | | | | | 25,219 | | | | | | 76,967 | |
| | | 16,284 | | | | | | 17,364 | | | | | | 17,384 | | | | | | 21,355 | | | | | | 20,925 | | | | | | 17,822 | | | | | | 17,968 | |
| | | — | | | | | | — | | | | | | — | | | | | | 84,868 | | | | | | 37,403 | | | | | | 940 | | | | | | 34,757 | |
| | | — | | | | | | — | | | | | | — | | | | | | 84,868 | | | | | | 37,403 | | | | | | 940 | | | | | | 34,757 | |
| | | 11,081 | | | | | | 8,084 | | | | | | 7,772 | | | | | | 84,236 | | | | | | 117,870 | | | | | | 17,261 | | | | | | 17,706 | |
| | | 1,739,581 | | | | | | 313,855 | | | | | | 490,086 | | | | | | 33,645,618 | | | | | | 29,868,257 | | | | | | 3,862,892 | | | | | | 6,225,604 | |
| | | (585,296 | ) | | | | | (247,874 | ) | | | | | (311,564 | ) | | | | | (2,653,468 | ) | | | | | (3,516,096 | ) | | | | | (1,219,567 | ) | | | | | (449,386 | ) |
| | | 1,154,285 | | | | | | 65,981 | | | | | | 178,522 | | | | | | 30,992,150 | | | | | | 26,352,161 | | | | | | 2,643,325 | | | | | | 5,776,218 | |
| | | 638,548 | | | | | | 53,643 | | | | | | 28,176 | | | | | | (9,772,929 | ) | | | | | (10,642,101 | ) | | | | | 1,304,079 | | | | | | (3,016,454 | ) |
| | | | | | | | | | | | | | | | | | | | | | | | | | | | | | | | | | | | | | | | |
| | | | | | | | | | | | | | | | | | | | | | | | | | | | | | | | | | | | | | | | |
| | | | | | | | | | | | | | | | | | | | | | | | | | | | | | | | | | | | | | | | |
| | | 13,025,972 | | | | | | 1,424,777 | | | | | | 1,505,809 | | | | | | 393,054,686 | | | | | | 259,155,327 | | | | | | 58,561,041 | | | | | | 27,226,851 | |
| | | — | | | | | | — | | | | | | — | | | | | | — | | | | | | (5,076,804 | ) | | | | | — | | | | | | — | |
| | | | | | | | | | | | | | | | | | | | | | | | | | | | | | | | | | | | | | | | |
| | | 8,307,250 | | | | | | (486,767 | ) | | | | | 1,684,947 | | | | | | (32,271,065 | ) | | | | | 37,263,155 | | | | | | (1,626,503 | ) | | | | | 80,622,920 | |
| | | — | | | | | | — | | | | | | — | | | | | | — | | | | | | 3,346,996 | | | | | | — | | | | | | — | |
| | | 21,333,222 | | | | | | 938,010 | | | | | | 3,190,756 | | | | | | 360,783,621 | | | | | | 294,688,674 | | | | | | 56,934,538 | | | | | | 107,849,771 | |
| | $ | 21,971,770 | | | | | $ | 991,653 | | | | | $ | 3,218,932 | | | | | $ | 351,010,692 | | | | | $ | 284,046,573 | | | | | $ | 58,238,617 | | | | | $ | 104,833,317 | |
| | |
| The accompanying notes are an integral part of these financial statements. | | 81 |
GOLDMAN SACHS FUNDAMENTAL EQUITY GROWTH FUNDS
Statements of Changes in Net Assets
| | | | | | | | | | |
| | | | | Capital Growth Fund | |
| | | | | For the Fiscal
Year Ended
August 31, 2017 | | | For the Fiscal
Year Ended
August 31, 2016 | |
| | From operations: | |
| | Net investment income (loss) | | $ | 1,303,145 | | | $ | 1,001,228 | |
| | Net realized gain (loss) | | | 65,849,893 | | | | 12,702,788 | |
| | Net change in unrealized gain (loss) | | | 101,955,647 | | | | 32,983,438 | |
| | Net increase (decrease) in net assets resulting from operations | | | 169,108,685 | | | | 46,687,454 | |
| | | | | | | | | | |
| | Distributions to shareholders: | | | | | | | | |
| | From net investment income | | | | | | | | |
| | Class A Shares | | | (351,955 | ) | | | — | |
| | Institutional Shares | | | (602,702 | ) | | | (262,248 | ) |
| | Service Shares | | | — | | | | — | |
| | Investor Shares | | | (15,368 | ) | | | (3,425 | ) |
| | Class R Shares | | | — | | | | — | |
| | Class R6 Shares | | | (45 | ) | | | (18 | ) |
| | From net realized gains | | | | | | | | |
| | Class A Shares | | | (8,263,004 | ) | | | (53,960,173 | ) |
| | Class C Shares | | | (1,166,606 | ) | | | (7,608,296 | ) |
| | Institutional Shares | | | (1,734,258 | ) | | | (13,105,149 | ) |
| | Service Shares | | | (21,688 | ) | | | (152,819 | ) |
| | Investor Shares | | | (59,705 | ) | | | (374,339 | ) |
| | Class R Shares | | | (48,146 | ) | | | (304,242 | ) |
| | Class R6 Shares | | | (123 | ) | | | (712 | ) |
| | Total distributions to shareholders | | | (12,263,600 | ) | | | (75,771,421 | ) |
| | | | | | | | | | |
| | From share transactions: | | | | | | | | |
| | Proceeds from sales of shares | | | 53,323,647 | | | | 34,992,956 | |
| | Proceeds received in connection with merger | | | — | | | | — | |
| | Reinvestment of distributions | | | 11,586,016 | | | | 71,646,769 | |
| | Cost of shares redeemed | | | (153,503,624 | ) | | | (155,817,837 | ) |
| | Net decrease in net assets resulting from share transactions | | | (88,593,961 | ) | | | (49,178,112 | ) |
| | TOTAL INCREASE (DECREASE) | | | 68,251,124 | | | | (78,262,079 | ) |
| | | | | | | | | | |
| | Net assets: | | | | | | | | |
| | Beginning of year | | | 849,810,932 | | | | 928,073,011 | |
| | End of year | | $ | 918,062,056 | | | $ | 849,810,932 | |
| | Undistributed net investment income | | $ | 1,308,106 | | | $ | 979,312 | |
| | |
| 82 | | The accompanying notes are an integral part of these financial statements. |
GOLDMAN SACHS FUNDAMENTAL EQUITY GROWTH FUNDS
| | | | | | | | | | | | | | | | | | | | | | |
| | | Concentrated Growth Fund | | | | | Dynamic U.S. Equity Fund | |
| | | For the Fiscal
Year Ended
August 31, 2017 | | | | | For the Fiscal
Year Ended
August 31, 2016 | | | | | For the Fiscal
Year Ended
August 31, 2017 | | | | | For the Fiscal
Year Ended
August 31, 2016 | |
| | | | | | | | | | | | | | | | | | | | | | |
| | $ | 638,548 | | | | | $ | 600,808 | | | | | $ | 53,643 | | | | | $ | 104,373 | |
| | | 13,025,972 | | | | | | (2,449,540 | ) | | | | | 1,424,777 | | | | | | (63,632 | ) |
| | | 8,307,250 | | | | | | 9,687,706 | | | | | | (486,767 | ) | | | | | 332,852 | |
| | | 21,971,770 | | | | | | 7,838,974 | | | | | | 991,653 | | | | | | 373,593 | |
| | | | | | | | | | | | | | | | | | | | | | |
| | | | | | | | | | | | | | | | | | | | | | |
| | | | | | | | | | | | | | | | | | | | | | |
| | | (11,087 | ) | | | | | — | | | | | | (10,370 | ) | | | | | (17,622 | ) |
| | | (751,721 | ) | | | | | (373,404 | ) | | | | | (57,578 | ) | | | | | (103,664 | ) |
| | | — | | | | | | — | | | | | | — | | | | | | — | |
| | | (2,033 | ) | | | | | (483 | ) | | | | | (1,491 | ) | | | | | (2,981 | ) |
| | | — | | | | | | — | | | | | | — | | | | | | — | |
| | | (63 | ) | | | | | (26 | ) | | | | | (101 | ) | | | | | (102 | ) |
| | | | | | | | | | | | | | | | | | | | | | |
| | | (23,848 | ) | | | | | (842,410 | ) | | | | | (326 | ) | | | | | (290,672 | ) |
| | | (10,841 | ) | | | | | (395,561 | ) | | | | | (23 | ) | | | | | (33,918 | ) |
| | | (508,883 | ) | | | | | (16,282,694 | ) | | | | | (796 | ) | | | | | (976,319 | ) |
| | | — | | | | | | — | | | | | | — | | | | | | — | |
| | | (1,669 | ) | | | | | (36,485 | ) | | | | | (31 | ) | | | | | (40,105 | ) |
| | | (104 | ) | | | | | (3,308 | ) | | | | | (3 | ) | | | | | (5,478 | ) |
| | | (40 | ) | | | | | (1,002 | ) | | | | | (2 | ) | | | | | (901 | ) |
| | | (1,310,289 | ) | | | | | (17,935,373 | ) | | | | | (70,721 | ) | | | | | (1,471,762 | ) |
| | | | | | | | | | | | | | | | | | | | | | |
| | | | | | | | | | | | | | | | | | | | | | |
| | | 4,745,172 | | | | | | 6,131,931 | | | | | | 2,329,929 | | | | | | 1,218,198 | |
| | | 16,473,232 | | | | | | — | | | | | | — | | | | | | — | |
| | | 1,290,974 | | | | | | 17,572,644 | | | | | | 70,721 | | | | | | 1,161,930 | |
| | | (36,067,794 | ) | | | | | (36,526,581 | ) | | | | | (4,802,428 | ) | | | | | (9,246,741 | ) |
| | | (13,558,416 | ) | | | | | (12,822,006 | ) | | | | | (2,401,778 | ) | | | | | (6,866,613 | ) |
| | | 7,103,065 | | | | | | (22,918,405 | ) | | | | | (1,480,846 | ) | | | | | (7,964,782 | ) |
| | | | | | | | | | | | | | | | | | | | | | |
| | | | | | | | | | | | | | | | | | | | | | |
| | | 144,066,117 | | | | | | 166,984,522 | | | | | | 7,258,456 | | | | | | 15,223,238 | |
| | $ | 151,169,182 | | | | | $ | 144,066,117 | | | | | $ | 5,777,610 | | | | | $ | 7,258,456 | |
| | $ | 481,013 | | | | | $ | 609,650 | | | | | $ | 39,404 | | | | | $ | 55,441 | |
| | |
| The accompanying notes are an integral part of these financial statements. | | 83 |
GOLDMAN SACHS FUNDAMENTAL EQUITY GROWTH FUNDS
Statements of Changes in Net Assets (continued)
| | | | | | | | | | |
| | | | | Flexible Cap Fund | |
| | | | | For the Fiscal
Year Ended
August 31, 2017 | | | For the Fiscal
Year Ended
August 31, 2016 | |
| | From operations: | |
| | Net investment income (loss) | | $ | 28,176 | | | $ | (13,099 | ) |
| | Net realized gain (loss) | | | 1,505,809 | | | | 193,770 | |
| | Net change in unrealized gain (loss) | | | 1,684,947 | | | | 596,395 | |
| | Net increase (decrease) in net assets resulting from operations | | | 3,218,932 | | | | 777,066 | |
| | | | | | | | | | |
| | Distributions to shareholders: | | | | | | | | |
| | From net investment income | | | | | | | | |
| | Class A Shares | | | — | | | | — | |
| | Institutional Shares | | | — | | | | — | |
| | Service Shares | | | — | | | | — | |
| | Investor Shares | | | — | | | | — | |
| | Class R Shares | | | — | | | | — | |
| | Class R6 Shares | | | — | | | | — | |
| | From net realized gains | | | | | | | | |
| | Class A Shares | | | (5,826 | ) | | | (458,035 | ) |
| | Class C Shares | | | (1,496 | ) | | | (116,932 | ) |
| | Institutional Shares | | | (9,494 | ) | | | (497,675 | ) |
| | Service Shares | | | — | | | | — | |
| | Investor Shares | | | (198 | ) | | | (13,475 | ) |
| | Class R Shares | | | (27 | ) | | | (2,254 | ) |
| | Class R6 Shares | | | (10 | ) | | | (544 | ) |
| | Total distributions to shareholders | | | (17,051 | ) | | | (1,088,915 | ) |
| | | | | | | | | | |
| | From share transactions: | | | | | | | | |
| | Proceeds from sales of shares | | | 3,771,805 | | | | 3,195,796 | |
| | Reinvestment of distributions | | | 17,051 | | | | 1,088,915 | |
| | Cost of shares redeemed | | | (5,285,565 | ) | | | (4,728,552 | ) |
| | Net decrease in net assets resulting from share transactions | | | (1,496,709 | ) | | | (443,841 | ) |
| | TOTAL INCREASE (DECREASE) | | | 1,705,172 | | | | (755,690 | ) |
| | | | | | | | | | |
| | Net assets: | | | | | | | | |
| | Beginning of year | | | 16,975,888 | | | | 17,731,578 | |
| | End of year | | $ | 18,681,060 | | | $ | 16,975,888 | |
| | Undistributed (distributions in excess of) net investment income (loss) | | $ | 13,337 | | | $ | (5,278 | ) |
| | |
| 84 | | The accompanying notes are an integral part of these financial statements. |
GOLDMAN SACHS FUNDAMENTAL EQUITY GROWTH FUNDS
| | | | | | | | | | | | | | | | | | | | | | |
| | | Growth Opportunities Fund | | | | | Small/Mid Cap Growth Fund | |
| | | For the Fiscal
Year Ended
August 31, 2017 | | | | | For the Fiscal
Year Ended
August 31, 2016 | | | | | For the Fiscal
Year Ended
August 31, 2017 | | | | | For the Fiscal
Year Ended
August 31, 2016 | |
| | | | | | | | | | | | | | | | | | | | | | |
| | $ | (9,772,929 | ) | | | | $ | (9,095,539 | ) | | | | $ | (10,642,101 | ) | | | | $ | (16,317,215 | ) |
| | | 393,054,686 | | | | | | 143,274,021 | | | | | | 254,078,523 | | | | | | 52,255,039 | |
| | | (32,271,065 | ) | | | | | (51,072,627 | ) | | | | | 40,610,151 | | | | | | (71,634,818 | ) |
| | | 351,010,692 | | | | | | 83,105,855 | | | | | | 284,046,573 | | | | | | (35,696,994 | ) |
| | | | | | | | | | | | | | | | | | | | | | |
| | | | | | | | | | | | | | | | | | | | | | |
| | | | | | | | | | | | | | | | | | | | | | |
| | | — | | | | | | — | | | | | | — | | | | | | — | |
| | | — | | | | | | — | | | | | | — | | | | | | — | |
| | | — | | | | | | — | | | | | | — | | | | | | — | |
| | | — | | | | | | — | | | | | | — | | | | | | — | |
| | | — | | | | | | — | | | | | | — | | | | | | — | |
| | | — | | | | | | — | | | | | | — | | | | | | — | |
| | | | | | | | | | | | | | | | | | | | | | |
| | | (14,410,877 | ) | | | | | (97,819,695 | ) | | | | | (22,115,735 | ) | | | | | (33,875,139 | ) |
| | | (3,935,680 | ) | | | | | (23,532,032 | ) | | | | | (9,352,469 | ) | | | | | (10,986,288 | ) |
| | | (45,399,922 | ) | | | | | (309,058,207 | ) | | | | | (37,610,927 | ) | | | | | (47,806,278 | ) |
| | | (939,914 | ) | | | | | (5,746,888 | ) | | | | | (484,480 | ) | | | | | (475,742 | ) |
| | | (3,279,388 | ) | | | | | (18,674,509 | ) | | | | | (10,342,325 | ) | | | | | (10,051,807 | ) |
| | | (1,600,130 | ) | | | | | (9,066,946 | ) | | | | | (1,149,251 | ) | | | | | (1,254,158 | ) |
| | | (2,386,639 | ) | | | | | (1,081,229 | ) | | | | | (610,048 | ) | | | | | (313 | ) |
| | | (71,952,550 | ) | | | | | (464,979,506 | ) | | | | | (81,665,235 | ) | | | | | (104,449,725 | ) |
| | | | | | | | | | | | | | | | | | | | | | |
| | | | | | | | | | | | | | | | | | | | | | |
| | | 603,609,908 | | | | | | 664,433,721 | | | | | | 686,406,541 | | | | | | 1,008,705,061 | |
| | | 64,113,934 | | | | | | 390,089,513 | | | | | | 73,298,159 | | | | | | 93,324,637 | |
| | | (1,557,638,716 | ) | | | | | (2,055,513,321 | ) | | | | | (1,349,413,511 | ) | | | | | (1,151,579,076 | ) |
| | | (889,914,874 | ) | | | | | (1,000,990,087 | ) | | | | | (589,708,811 | ) | | | | | (49,549,378 | ) |
| | | (610,856,732 | ) | | | | | (1,382,863,738 | ) | | | | | (387,327,473 | ) | | | | | (189,696,097 | ) |
| | | | | | | | | | | | | | | | | | | | | | |
| | | | | | | | | | | | | | | | | | | | | | |
| | | 3,201,887,014 | | | | | | 4,584,750,752 | | | | | | 2,608,831,222 | | | | | | 2,798,527,319 | |
| | $ | 2,591,030,282 | | | | | $ | 3,201,887,014 | | | | | $ | 2,221,503,749 | | | | | $ | 2,608,831,222 | |
| | $ | (5,528,419 | ) | | | | $ | (7,887,321 | ) | | | | $ | (4,405,886 | ) | | | | $ | (10,953,820 | ) |
| | |
| The accompanying notes are an integral part of these financial statements. | | 85 |
GOLDMAN SACHS FUNDAMENTAL EQUITY GROWTH FUNDS
Statements of Changes in Net Assets (continued)
| | | | | | | | | | |
| | | | | Strategic Growth Fund | |
| | | | | For the Fiscal
Year Ended
August 31, 2017 | | | For the Fiscal
Year Ended
August 31, 2016 | |
| | From operations: | |
| | Net investment income (loss) | | $ | 1,304,079 | | | $ | 2,040,512 | |
| | Net realized gain (loss) | | | 58,561,041 | | | | 1,548,451 | |
| | Net change in unrealized gain (loss) | | | (1,626,503 | ) | | | 21,597,125 | |
| | Net increase (decrease) in net assets resulting from operations | | | 58,238,617 | | | | 25,186,088 | |
| | | | | | | | | | |
| | Distributions to shareholders: | | | | | | | | |
| | From net investment income | | | | | | | | |
| | Class A Shares | | | (143,097 | ) | | | (72,760 | ) |
| | Institutional Shares | | | (1,865,022 | ) | | | (1,396,604 | ) |
| | Service Shares | | | (1,064 | ) | | | (299 | ) |
| | Investor Shares | | | (4,837 | ) | | | (2,572 | ) |
| | Class R Shares | | | (579 | ) | | | (106 | ) |
| | Class R6 Shares | | | (71 | ) | | | (42 | ) |
| | From net realized gains | | | | | | | | |
| | Class A Shares | | | (1,309,232 | ) | | | (2,662,084 | ) |
| | Class C Shares | | | (359,532 | ) | | | (747,201 | ) |
| | Institutional Shares | | | (7,706,675 | ) | | | (18,504,227 | ) |
| | Service Shares | | | (8,931 | ) | | | (12,976 | ) |
| | Investor Shares | | | (24,506 | ) | | | (47,249 | ) |
| | Class R Shares | | | (4,139 | ) | | | (4,036 | ) |
| | Class R6 Shares | | | (285 | ) | | | (516 | ) |
| | Total distributions to shareholders | | | (11,427,970 | ) | | | (23,450,672 | ) |
| | | | | | | | | | |
| | From share transactions: | | | | | | | | |
| | Proceeds from sales of shares | | | 58,640,340 | | | | 110,866,442 | |
| | Reinvestment of distributions | | | 11,138,138 | | | | 22,818,629 | |
| | Cost of shares redeemed | | | (200,254,330 | ) | | | (166,077,206 | ) |
| | Net decrease in net assets resulting from share transactions | | | (130,475,852 | ) | | | (32,392,135 | ) |
| | TOTAL INCREASE (DECREASE) | | | (83,665,205 | ) | | | (30,656,719 | ) |
| | | | | | | | | | |
| | Net assets: | | | | | | | | |
| | Beginning of year | | | 353,340,108 | | | | 383,996,827 | |
| | End of year | | $ | 269,674,903 | | | $ | 353,340,108 | |
| | Undistributed net investment income | | $ | 1,285,219 | | | $ | 2,008,192 | |
| | |
| 86 | | The accompanying notes are an integral part of these financial statements. |
GOLDMAN SACHS FUNDAMENTAL EQUITY GROWTH FUNDS
| | | | | | | | | | |
| | | Technology Opportunities Fund | |
| | | For the Fiscal
Year Ended
August 31, 2017 | | | | | For the Fiscal
Year Ended
August 31, 2016 | |
| | | | | | | | | | |
| | $ | (3,016,454 | ) | | | | $ | (2,695,009 | ) |
| | | 27,226,851 | | | | | | 18,604,630 | |
| | | 80,622,920 | | | | | | 31,771,257 | |
| | | 104,833,317 | | | | | | 47,680,878 | |
| | | | | | | | | | |
| | | | | | | | | | |
| | | | | | | | | | |
| | | — | | | | | | — | |
| | | — | | | | | | — | |
| | | — | | | | | | — | |
| | | — | | | | | | — | |
| | | — | | | | | | — | |
| | | — | | | | | | — | |
| | | | | | | | | | |
| | | (10,972,102 | ) | | | | | (21,931,579 | ) |
| | | (2,857,031 | ) | | | | | (5,298,231 | ) |
| | | (3,662,504 | ) | | | | | (6,969,643 | ) |
| | | (563,605 | ) | | | | | (975,553 | ) |
| | | (412,820 | ) | | | | | (511,029 | ) |
| | | — | | | | | | — | |
| | | — | | | | | | — | |
| | | (18,468,062 | ) | | | | | (35,686,035 | ) |
| | | | | | | | | | |
| | | | | | | | | | |
| | | 101,121,736 | | | | | | 64,248,588 | |
| | | 16,881,342 | | | | | | 32,420,710 | |
| | | (145,124,804 | ) | | | | | (133,609,474 | ) |
| | | (27,121,726 | ) | | | | | (36,940,176 | ) |
| | | 59,243,529 | | | | | | (24,945,333 | ) |
| | | | | | | | | | |
| | | | | | | | | | |
| | | 387,612,302 | | | | | | 412,557,635 | |
| | $ | 446,855,831 | | | | | $ | 387,612,302 | |
| | $ | (1,923,459 | ) | | | | $ | (1,944,623 | ) |
| | |
| The accompanying notes are an integral part of these financial statements. | | 87 |
GOLDMAN SACHS CAPITAL GROWTH FUND
Financial Highlights
Selected Data for a Share Outstanding Throughout Each Year
| | | | | | | | | | | | | | | | | | | | | | | | | | | | | | |
| | | | | | | | Income (loss) from
investment operations | | | Distributions
to shareholders | |
| | | Year - Share Class | | Net asset
value,
beginning
of year | | | Net
investment
income (loss)(a) | | | Net realized
and unrealized
gain (loss) | | | Total from
investment
operations | | | From net
investment
income | | | From net
realized
gains | | | Total
distributions | |
| | FOR THE FISCAL YEARS ENDED AUGUST 31, | |
| | 2017 - A | | $ | 24.15 | | | $ | 0.04 | | | $ | 5.07 | | | $ | 5.11 | | | $ | (0.01 | ) | | $ | (0.33 | ) | | $ | (0.34 | ) |
| | 2017 - C | | | 18.68 | | | | (0.12 | ) | | | 3.90 | | | | 3.78 | | | | — | | | | (0.33 | ) | | | (0.33 | ) |
| | 2017 - Institutional | | | 26.35 | | | | 0.15 | | | | 5.54 | | | | 5.69 | | | | (0.11 | ) | | | (0.33 | ) | | | (0.44 | ) |
| | 2017 - Service | | | 23.40 | | | | — | | | | 4.93 | | | | 4.93 | | | | — | | | | (0.33 | ) | | | (0.33 | ) |
| | 2017 - Investor(g) | | | 24.48 | | | | 0.11 | | | | 5.13 | | | | 5.24 | | | | (0.08 | ) | | | (0.33 | ) | | | (0.41 | ) |
| | 2017 - R | | | 23.44 | | | | (0.03 | ) | | | 4.93 | | | | 4.90 | | | | — | | | | (0.33 | ) | | | (0.33 | ) |
| | 2017 - R6 | | | 26.34 | | | | 0.16 | | | | 5.55 | | | | 5.71 | | | | (0.12 | ) | | | (0.33 | ) | | | (0.45 | ) |
| | 2016 - A | | | 24.80 | | | | 0.03 | | | | 1.37 | | | | 1.40 | | | | — | | | | (2.05 | ) | | | (2.05 | ) |
| | 2016 - C | | | 19.77 | | | | (0.12 | ) | | | 1.08 | | | | 0.96 | | | | — | | | | (2.05 | ) | | | (2.05 | ) |
| | 2016 - Institutional | | | 26.82 | | | | 0.13 | | | | 1.49 | | | | 1.62 | | | | (0.04 | ) | | | (2.05 | ) | | | (2.09 | ) |
| | 2016 - Service | | | 24.12 | | | | — | (d) | | | 1.33 | | | | 1.33 | | | | — | | | | (2.05 | ) | | | (2.05 | ) |
| | 2016 - Investor(g) | | | 25.07 | | | | 0.08 | | | | 1.40 | | | | 1.48 | | | | (0.02 | ) | | | (2.05 | ) | | | (2.07 | ) |
| | 2016 - R | | | 24.19 | | | | (0.03 | ) | | | 1.33 | | | | 1.30 | | | | — | | | | (2.05 | ) | | | (2.05 | ) |
| | 2016 - R6 | | | 26.82 | | | | 0.13 | | | | 1.49 | | | | 1.62 | | | | (0.05 | ) | | | (2.05 | ) | | | (2.10 | ) |
| | 2015 - A | | | 28.16 | | | | 0.01 | | | | 1.00 | | | | 1.01 | | | | — | | | | (4.37 | ) | | | (4.37 | ) |
| | 2015 - C | | | 23.45 | | | | (0.15 | ) | | | 0.84 | | | | 0.69 | | | | — | | | | (4.37 | ) | | | (4.37 | ) |
| | 2015 - Institutional | | | 30.01 | | | | 0.12 | | | | 1.06 | | | | 1.18 | | | | — | | | | (4.37 | ) | | | (4.37 | ) |
| | 2015 - Service | | | 27.53 | | | | (0.02 | ) | | | 0.98 | | | | 0.96 | | | | — | | | | (4.37 | ) | | | (4.37 | ) |
| | 2015 - Investor(g) | | | 28.36 | | | | 0.07 | | | | 1.01 | | | | 1.08 | | | | — | | | | (4.37 | ) | | | (4.37 | ) |
| | 2015 - R | | | 27.64 | | | | (0.06 | ) | | | 0.98 | | | | 0.92 | | | | — | | | | (4.37 | ) | | | (4.37 | ) |
| | 2015 - R6 (Commenced July 31, 2015) | | | 28.86 | | | | 0.01 | | | | (2.05 | ) | | | (2.04 | ) | | | — | | | | — | | | | — | |
| | 2014 - A | | | 28.13 | | | | (0.01 | ) | | | 6.41 | | | | 6.40 | | | | (0.08 | ) | | | (6.29 | ) | | | (6.37 | ) |
| | 2014 - C | | | 24.46 | | | | (0.18 | ) | | | 5.46 | | | | 5.28 | | | | — | | | | (6.29 | ) | | | (6.29 | ) |
| | 2014 - Institutional | | | 29.57 | | | | 0.10 | | | | 6.79 | | | | 6.89 | | | | (0.16 | ) | | | (6.29 | ) | | | (6.45 | ) |
| | 2014 - Service | | | 27.62 | | | | (0.04 | ) | | | 6.29 | | | | 6.25 | | | | (0.05 | ) | | | (6.29 | ) | | | (6.34 | ) |
| | 2014 - Investor(g) | | | 28.28 | | | | 0.06 | | | | 6.44 | | | | 6.50 | | | | (0.13 | ) | | | (6.29 | ) | | | (6.42 | ) |
| | 2014 - R | | | 27.75 | | | | (0.08 | ) | | | 6.31 | | | | 6.23 | | | | (0.05 | ) | | | (6.29 | ) | | | (6.34 | ) |
| | 2013 - A | | | 24.40 | | | | 0.10 | (f) | | | 3.66 | | | | 3.76 | | | | (0.03 | ) | | | — | | | | (0.03 | ) |
| | 2013 - C | | | 21.35 | | | | (0.08 | )(f) | | | 3.19 | | | | 3.11 | | | | — | | | | — | | | | — | |
| | 2013 - Institutional | | | 25.64 | | | | 0.21 | (f) | | | 3.84 | | | | 4.05 | | | | (0.12 | ) | | | — | | | | (0.12 | ) |
| | 2013 - Service | | | 23.96 | | | | 0.07 | (f) | | | 3.60 | | | | 3.67 | | | | (0.01 | ) | | | — | | | | (0.01 | ) |
| | 2013 - Investor(g) | | | 24.53 | | | | 0.18 | (f) | | | 3.67 | | | | 3.85 | | | | (0.10 | ) | | | — | | | | (0.10 | ) |
| | 2013 - R | | | 24.14 | | | | 0.03 | (f) | | | 3.62 | | | | 3.65 | | | | (0.04 | ) | | | — | | | | (0.04 | ) |
| | (a) | | Calculated based on the average shares outstanding methodology. |
| | (b) | | Assumes investment at the NAV at the beginning of the year, reinvestment of all dividends and distributions, a complete redemption of the investment at the NAV at the end of the year and no sales or redemption charges. Total returns would be reduced if a sales or redemption charge was taken into account. Returns do not reflect the impact of taxes to shareholders relating to Fund distributions or the redemption of Fund shares. Total returns for periods less than one full year are not annualized. |
| | (c) | | The Fund’s portfolio turnover rate is calculated in accordance with regulatory requirements, without regard to transactions involving short term investments. If such transactions were included, the Fund’s portfolio turnover rate may be higher. |
| | (d) | | Amount is less than $0.005 per share. |
| | (f) | | Reflects income recognized from special dividends which amounted to $0.06 per share and 0.21% of average net assets. |
| | (g) | | Effective before the opening of business on August 15, 2017, Class IR Shares were designated as Investor Shares. |
| | |
| 88 | | The accompanying notes are an integral part of these financial statements. |
GOLDMAN SACHS CAPITAL GROWTH FUND
| | | | | | | | | | | | | | | | | | | | | | | | | | | | | | | | | | | | | | | | |
| | | | | | | | | | | | | | | | | | | | | | | | | | | | | | | | | | |
| | | Net asset
value, end
of year | | | | | Total
return(b) | | | | | Net assets,
end of
year
(in 000s) | | | | | Ratio of
net expenses
to average
net assets | | | | | Ratio of
total expenses
to average
net assets | | | | | Ratio of
net investment
income (loss)
to average
net assets | | | | | Portfolio
turnover
rate(c) | |
| | | | | | | | | | | | | | | | | | | | | | | | | | | | | | | | | | | | | | | | |
| | $ | 28.92 | | | | | | 21.47 | % | | | | $ | 671,371 | | | | | | 1.15 | % | | | | | 1.51 | % | | | | | 0.14 | % | | | | | 48 | % |
| | | 22.13 | | | | | | 20.59 | | | | | | 62,701 | | | | | | 1.90 | | | | | | 2.26 | | | | | | (0.61 | ) | | | | | 48 | |
| | | 31.60 | | | | | | 21.96 | | | | | | 165,948 | | | | | | 0.75 | | | | | | 1.11 | | | | | | 0.54 | | | | | | 48 | |
| | | 28.00 | | | | | | 21.36 | | | | | | 1,437 | | | | | | 1.25 | | | | | | 1.61 | | | | | | 0.02 | | | | | | 48 | |
| | | 29.31 | | | | | | 21.77 | | | | | | 8,496 | | | | | | 0.90 | | | | | | 1.26 | | | | | | 0.43 | | | | | | 48 | |
| | | 28.01 | | | | | | 21.19 | | | | | | 8,093 | | | | | | 1.40 | | | | | | 1.77 | | | | | | (0.10 | ) | | | | | 48 | |
| | | 31.60 | | | | | | 21.99 | | | | | | 16 | | | | | | 0.75 | | | | | | 1.10 | | | | | | 0.56 | | | | | | 48 | |
| | | 24.15 | | | | | | 5.79 | | | | | | 630,091 | | | | | | 1.15 | | | | | | 1.51 | | | | | | 0.11 | | | | | | 45 | |
| | | 18.68 | | | | | | 4.98 | | | | | | 68,960 | | | | | | 1.90 | | | | | | 2.26 | | | | | | (0.64 | ) | | | | | 45 | |
| | | 26.35 | | | | | | 6.19 | | | | | | 141,442 | | | | | | 0.75 | | | | | | 1.11 | | | | | | 0.50 | | | | | | 45 | |
| | | 23.40 | | | | | | 5.66 | | | | | | 1,561 | | | | | | 1.25 | | | | | | 1.61 | | | | | | 0.01 | | | | | | 45 | |
| | | 24.48 | | | | | | 6.05 | | | | | | 4,297 | | | | | | 0.90 | | | | | | 1.26 | | | | | | 0.35 | | | | | | 45 | |
| | | 23.44 | | | | | | 5.51 | | | | | | 3,450 | | | | | | 1.40 | | | | | | 1.76 | | | | | | (0.15 | ) | �� | | | | 45 | |
| | | 26.34 | | | | | | 6.19 | | | | | | 10 | | | | | | 0.74 | | | | | | 1.09 | | | | | | 0.52 | | | | | | 45 | |
| | | 24.80 | | | | | | 3.34 | | | | | | 669,345 | | | | | | 1.15 | | | | | | 1.49 | | | | | | 0.04 | | | | | | 55 | |
| | | 19.77 | | | | | | 2.55 | | | | | | 75,941 | | | | | | 1.90 | | | | | | 2.25 | | | | | | (0.71 | ) | | | | | 55 | |
| | | 26.82 | | | | | | 3.75 | | | | | | 173,539 | | | | | | 0.75 | | | | | | 1.09 | | | | | | 0.44 | | | | | | 55 | |
| | | 24.12 | | | | | | 3.23 | | | | | | 1,917 | | | | | | 1.25 | | | | | | 1.60 | | | | | | (0.08 | ) | | | | | 55 | |
| | | 25.07 | | | | | | 3.59 | | | | | | 3,823 | | | | | | 0.90 | | | | | | 1.24 | | | | | | 0.28 | | | | | | 55 | |
| | | 24.19 | | | | | | 3.05 | | | | | | 3,500 | | | | | | 1.40 | | | | | | 1.74 | | | | | | (0.21 | ) | | | | | 55 | |
| | | 26.82 | | | | | | (7.07 | ) | | | | | 9 | | | | | | 0.76 | (e) | | | | | 1.11 | (e) | | | | | 0.54 | (e) | | | | | 55 | |
| | | 28.16 | | | | | | 25.50 | | | | | | 702,534 | | | | | | 1.16 | | | | | | 1.51 | | | | | | (0.05 | ) | | | | | 75 | |
| | | 23.45 | | | | | | 24.57 | | | | | | 81,954 | | | | | | 1.91 | | | | | | 2.26 | | | | | | (0.80 | ) | | | | | 75 | |
| | | 30.01 | | | | | | 26.03 | | | | | | 147,642 | | | | | | 0.76 | | | | | | 1.11 | | | | | | 0.35 | | | | | | 75 | |
| | | 27.53 | | | | | | 25.39 | | | | | | 1,135 | | | | | | 1.26 | | | | | | 1.61 | | | | | | (0.15 | ) | | | | | 75 | |
| | | 28.36 | | | | | | 25.80 | | | | | | 2,951 | | | | | | 0.91 | | | | | | 1.26 | | | | | | 0.20 | | | | | | 75 | |
| | | 27.64 | | | | | | 25.18 | | | | | | 3,571 | | | | | | 1.41 | | | | | | 1.76 | | | | | | (0.30 | ) | | | | | 75 | |
| | | 28.13 | | | | | | 15.41 | | | | | | 630,495 | | | | | | 1.14 | | | | | | 1.50 | | | | | | 0.38 | (f) | | | | | 52 | |
| | | 24.46 | | | | | | 14.57 | | | | | | 75,375 | | | | | | 1.89 | | | | | | 2.25 | | | | | | (0.37 | )(f) | | | | | 52 | |
| | | 29.57 | | | | | | 15.89 | | | | | | 124,795 | | | | | | 0.74 | | | | | | 1.10 | | | | | | 0.75 | (f) | | | | | 52 | |
| | | 27.62 | | | | | | 15.32 | | | | | | 980 | | | | | | 1.24 | | | | | | 1.60 | | | | | | 0.27 | (f) | | | | | 52 | |
| | | 28.28 | | | | | | 15.75 | | | | | | 2,112 | | | | | | 0.89 | | | | | | 1.25 | | | | | | 0.67 | (f) | | | | | 52 | |
| | | 27.75 | | | | | | 15.15 | | | | | | 2,480 | | | | | | 1.39 | | | | | | 1.75 | | | | | | 0.13 | (f) | | | | | 52 | |
| | |
| The accompanying notes are an integral part of these financial statements. | | 89 |
GOLDMAN SACHS CONCENTRATED GROWTH FUND
Financial Highlights
Selected Data for a Share Outstanding Throughout Each Year
| | | | | | | | | | | | | | | | | | | | | | | | | | | | | | |
| | | | | | | | Income (loss)
from
investment operations | | | Distributions
to shareholders | |
| | | Year - Share Class | |
Net asset
value,
beginning
of year | | | Net
investment
income (loss)(a) | | | Net realized
and unrealized
gain (loss) | | | Total from
investment
operations | | | From net
investment
income | | | From net
realized
gains | | | Total
distributions | |
| | FOR THE FISCAL YEARS ENDED AUGUST 31, | |
| | 2017 - A | | $ | 15.06 | | | $ | 0.02 | | | $ | 2.64 | | | $ | 2.66 | | | $ | (0.03 | ) | | $ | (0.07 | ) | | $ | (0.10 | ) |
| | 2017 - C | | | 12.84 | | | | (0.08 | ) | | | 2.24 | | | | 2.16 | | | | — | | | | (0.07 | ) | | | (0.07 | ) |
| | 2017 - Institutional | | | 15.94 | | | | 0.09 | | | | 2.78 | | | | 2.87 | | | | (0.09 | ) | | | (0.07 | ) | | | (0.16 | ) |
| | 2017 - Investor(i) | | | 15.28 | | | | 0.07 | | | | 2.67 | | | | 2.74 | | | | (0.07 | ) | | | (0.07 | ) | | | (0.14 | ) |
| | 2017 - R | | | 14.65 | | | | (0.02 | ) | | | 2.57 | | | | 2.55 | | | | — | | | | (0.07 | ) | | | (0.07 | ) |
| | 2017 - R6 | | | 15.95 | | | | 0.13 | | | | 2.74 | | | | 2.87 | | | | (0.10 | ) | | | (0.07 | ) | | | (0.17 | ) |
| | 2016 - A | | | 16.06 | | | | — | (d) | | | 0.81 | | | | 0.81 | | | | — | | | | (1.81 | ) | | | (1.81 | ) |
| | 2016 - C | | | 14.05 | | | | (0.09 | )(d) | | | 0.69 | | | | 0.60 | | | | — | | | | (1.81 | ) | | | (1.81 | ) |
| | 2016 - Institutional | | | 16.88 | | | | 0.07 | (d) | | | 0.84 | | | | 0.91 | | | | (0.04 | ) | | | (1.81 | ) | | | (1.85 | ) |
| | 2016 - Investor(i) | | | 16.26 | | | | 0.04 | (d) | | | 0.81 | | | | 0.85 | | | | (0.02 | ) | | | (1.81 | ) | | | (1.83 | ) |
| | 2016 - R | | | 15.71 | | | | (0.04 | )(d) | | | 0.79 | | | | 0.75 | | | | — | | | | (1.81 | ) | | | (1.81 | ) |
| | 2016 - R6 | | | 16.88 | | | | 0.07 | (d) | | | 0.85 | | | | 0.92 | | | | (0.04 | ) | | | (1.81 | ) | | | (1.85 | ) |
| | 2015 - A | | | 18.94 | | | | — | (e)(f) | | | 0.55 | | | | 0.55 | | | | — | | | | (3.43 | ) | | | (3.43 | ) |
| | 2015 - C | | | 17.09 | | | | (0.11 | )(e) | | | 0.50 | | | | 0.39 | | | | — | | | | (3.43 | ) | | | (3.43 | ) |
| | 2015 - Institutional | | | 19.71 | | | | 0.08 | (e) | | | 0.57 | | | | 0.65 | | | | (0.05 | ) | | | (3.43 | ) | | | (3.48 | ) |
| | 2015 - Investor(i) | | | 19.10 | | | | 0.05 | (e) | | | 0.56 | | | | 0.61 | | | | (0.02 | ) | | | (3.43 | ) | | | (3.45 | ) |
| | 2015 - R | | | 18.64 | | | | (0.05 | )(e) | | | 0.55 | | | | 0.50 | | | | — | | | | (3.43 | ) | | | (3.43 | ) |
| | 2015 - R6 (Commenced July 31, 2015) | | | 18.04 | | | | 0.01 | (e) | | | (1.17 | ) | | | (1.16 | ) | | | — | | | | — | | | | — | |
| | 2014 - A | | | 17.05 | | | | (0.06 | ) | | | 3.78 | | | | 3.72 | | | | — | | | | (1.83 | ) | | | (1.83 | ) |
| | 2014 - C | | | 15.65 | | | | (0.17 | ) | | | 3.44 | | | | 3.27 | | | | — | | | | (1.83 | ) | | | (1.83 | ) |
| | 2014 - Institutional | | | 17.63 | | | | 0.02 | | | | 3.92 | | | | 3.94 | | | | (0.03 | ) | | | (1.83 | ) | | | (1.86 | ) |
| | 2014 - Investor(i) | | | 17.15 | | | | (0.01 | ) | | | 3.81 | | | | 3.80 | | | | (0.02 | ) | | | (1.83 | ) | | | (1.85 | ) |
| | 2014 - R | | | 16.84 | | | | (0.10 | ) | | | 3.73 | | | | 3.63 | | | | — | | | | (1.83 | ) | | | (1.83 | ) |
| | 2013 - A | | | 14.97 | | | | 0.11 | (h) | | | 2.03 | | | | 2.14 | | | | (0.06 | ) | | | — | | | | (0.06 | ) |
| | 2013 - C | | | 13.79 | | | | (0.06 | )(h) | | | 1.93 | | | | 1.87 | | | | (0.01 | ) | | | — | | | | (0.01 | ) |
| | 2013 - Institutional | | | 15.48 | | | | 0.09 | (h) | | | 2.18 | | | | 2.27 | | | | (0.12 | ) | | | — | | | | (0.12 | ) |
| | 2013 - Investor(i) | | | 15.07 | | | | 0.12 | (h) | | | 2.07 | | | | 2.19 | | | | (0.11 | ) | | | — | | | | (0.11 | ) |
| | 2013 - R | | | 14.80 | | | | 0.01 | (h) | | | 2.06 | | | | 2.07 | | | | (0.03 | ) | | | — | | | | (0.03 | ) |
| | (a) | | Calculated based on the average shares outstanding methodology. |
| | (b) | | Assumes investment at the NAV at the beginning of the year, reinvestment of all dividends and distributions, a complete redemption of the investment at the NAV at the end of the year and no sales or redemption charges. Total returns would be reduced if a sales or redemption charge was taken into account. Returns do not reflect the impact of taxes to shareholders relating to Fund distributions or the redemption of Fund shares. Total returns for periods less than one full year are not annualized. |
| | (c) | | The Fund’s portfolio turnover rate is calculated in accordance with regulatory requirements, without regard to transactions involving short term investments. If such transactions were included, the Fund’s portfolio turnover rate may be higher. On July 28, 2017, Goldman Sachs Concentrated Growth Fund acquired all of the net assets of Goldman Sachs Focused Growth Fund pursuant to an Agreement and Plan of Reorganization. Portfolio turnover excludes purchases and sales of securities by Goldman Sachs Focused Growth Fund (acquired fund) prior to the merger date. |
| | (d) | | Reflects income recognized from a special dividend which amounted to $0.03 per share and 0.19% of average net assets. |
| | (e) | | Reflects income recognized from a special dividend which amounted to $0.05 per share and 0.30% of average net assets. |
| | (f) | | Amount is less than $0.005 per share. |
| | (h) | | Reflects income recognized from a special dividend which amounted to $0.06 per share and 0.35% of average net assets. |
| | (i) | | Effective before the opening of business on August 15, 2017, Class IR Shares were designated as Investor Shares. |
| | |
| 90 | | The accompanying notes are an integral part of these financial statements. |
GOLDMAN SACHS CONCENTRATED GROWTH FUND
| | | | | | | | | | | | | | | | | | | | | | | | | | | | | | | | | | | | | | | | |
| | | | | | | | | | | | | | | | | | | | | | | | | | | | | | | | | | |
| | | Net asset
value, end
of year | | | | | Total
return(b) | | | | | Net assets,
end of
year
(in 000s) | | | | | Ratio of
net expenses
to average
net assets | | | | | Ratio of
total expenses
to average
net assets | | | | | Ratio of
net investment
income (loss)
to average
net assets | | | | | Portfolio
turnover
rate(c) | |
| | | | | | | | | | | | | | | | | | | | | | | | | | | | | | | | | | | | | | | | |
| | $ | 17.62 | | | | | | 17.75 | % | | | | $ | 5,462 | | | | | | 1.20 | % | | | | | 1.65 | % | | | | | 0.11 | % | | | | | 54 | % |
| | | 14.93 | | | | | | 16.88 | | | | | | 2,210 | | | | | | 1.95 | | | | | | 2.40 | | | | | | (0.61 | ) | | | | | 54 | |
| | | 18.65 | | | | | | 18.22 | | | | | | 142,623 | | | | | | 0.82 | | | | | | 1.26 | | | | | | 0.51 | | | | | | 54 | |
| | | 17.88 | | | | | | 18.14 | | | | | | 780 | | | | | | 0.95 | | | | | | 1.41 | | | | | | 0.45 | | | | | | 54 | |
| | | 17.13 | | | | | | 17.46 | | | | | | 25 | | | | | | 1.45 | | | | | | 1.91 | | | | | | (0.14 | ) | | | | | 54 | |
| | | 18.65 | | | | | | 18.17 | | | | | | 68 | | | | | | 0.82 | | | | | | 1.32 | | | | | | 0.74 | | | | | | 54 | |
| | | 15.06 | | | | | | 5.10 | | | | | | 6,573 | | | | | | 1.22 | | | | | | 1.63 | | | | | | 0.03 | (d) | | | | | 55 | |
| | | 12.84 | | | | | | 4.27 | | | | | | 2,192 | | | | | | 1.98 | | | | | | 2.38 | | | | | | (0.71 | )(d) | | | | | 55 | |
| | | 15.94 | | | | | | 5.47 | | | | | | 134,818 | | | | | | 0.82 | | | | | | 1.23 | | | | | | 0.43 | (d) | | | | | 55 | |
| | | 15.28 | | | | | | 5.31 | | | | | | 452 | | | | | | 0.97 | | | | | | 1.38 | | | | | | 0.27 | (d) | | | | | 55 | |
| | | 14.65 | | | | | | 4.81 | | | | | | 22 | | | | | | 1.48 | | | | | | 1.89 | | | | | | (0.25 | )(d) | | | | | 55 | |
| | | 15.95 | | | | | | 5.56 | | | | | | 10 | | | | | | 0.81 | | | | | | 1.21 | | | | | | 0.44 | (d) | | | | | 55 | |
| | | 16.06 | | | | | | 2.54 | | | | | | 7,350 | | | | | | 1.24 | | | | | | 1.60 | | | | | | 0.02 | (e) | | | | | 47 | |
| | | 14.05 | | | | | | 1.78 | | | | | | 3,604 | | | | | | 1.99 | | | | | | 2.35 | | | | | | (0.74 | )(e) | | | | | 47 | |
| | | 16.88 | | | | | | 2.97 | | | | | | 155,652 | | | | | | 0.84 | | | | | | 1.20 | | | | | | 0.42 | (e) | | | | | 47 | |
| | | 16.26 | | | | | | 2.84 | | | | | | 342 | | | | | | 0.99 | | | | | | 1.35 | | | | | | 0.29 | (e) | | | | | 47 | |
| | | 15.71 | | | | | | 2.28 | | | | | | 27 | | | | | | 1.49 | | | | | | 1.87 | | | | | | (0.31 | )(e) | | | | | 47 | |
| | | 16.88 | | | | | | (6.43 | ) | | | | | 9 | | | | | | 0.77 | (g) | | | | | 1.48 | (g) | | | | | 0.46 | (e)(g) | | | | | 47 | |
| | | 18.94 | | | | | | 22.88 | | | | | | 7,564 | | | | | | 1.27 | | | | | | 1.60 | | | | | | (0.32 | ) | | | | | 60 | |
| | | 17.09 | | | | | | 21.98 | | | | | | 3,460 | | | | | | 2.02 | | | | | | 2.35 | | | | | | (1.06 | ) | | | | | 60 | |
| | | 19.71 | | | | | | 23.44 | | | | | | 169,387 | | | | | | 0.87 | | | | | | 1.20 | | | | | | 0.09 | | | | | | 60 | |
| | | 19.10 | | | | | | 23.20 | | | | | | 385 | | | | | | 1.02 | | | | | | 1.35 | | | | | | (0.06 | ) | | | | | 60 | |
| | | 18.64 | | | | | | 22.61 | | | | | | 14 | | | | | | 1.50 | | | | | | 1.84 | | | | | | (0.55 | ) | | | | | 60 | |
| | | 17.05 | | | | | | 14.36 | | | | | | 8,476 | | | | | | 1.26 | | | | | | 1.62 | | | | | | 0.69 | (h) | | | | | 57 | |
| | | 15.65 | | | | | | 13.57 | | | | | | 2,561 | | | | | | 2.01 | | | | | | 2.37 | | | | | | (0.39 | )(h) | | | | | 57 | |
| | | 17.63 | | | | | | 14.81 | | | | | | 146,183 | | | | | | 0.86 | | | | | | 1.23 | | | | | | 0.56 | (h) | | | | | 57 | |
| | | 17.15 | | | | | | 14.61 | | | | | | 346 | | | | | | 1.01 | | | | | | 1.38 | | | | | | 0.76 | (h) | | | | | 57 | |
| | | 16.84 | | | | | | 14.13 | | | | | | 12 | | | | | | 1.51 | | | | | | 1.87 | | | | | | 0.09 | (h) | | | | | 57 | |
| | |
| The accompanying notes are an integral part of these financial statements. | | 91 |
GOLDMAN SACHS DYNAMIC U.S. EQUITY FUND
Financial Highlights
Selected Data for a Share Outstanding Throughout Each Year
| | | | | | | | | | | | | | | | | | | | | | | | | | | | | | |
| | | | | | | | Income (loss) from
Investment Operations | | | Distributions
to shareholders | |
| | | Year - Share Class | |
Net asset
value,
beginning
of year | | | Net
investment
income (loss)(a) | | | Net realized
and unrealized
gain (loss) | | | Total from
investment
operations | | | From net
investment
income | | | From net
realized
gains | | | Total
distributions | |
| | FOR THE FISCAL YEARS ENDED AUGUST 31, | |
| | 2017 - A | | $ | 13.08 | | | $ | 0.07 | | | $ | 1.76 | | | $ | 1.83 | | | $ | (0.07 | ) | | $ | — | (d) | | $ | (0.07 | ) |
| | 2017 - C | | | 12.69 | | | | (0.02 | ) | | | 1.69 | | | | 1.67 | | | | — | | | | — | (d) | | | — | (d) |
| | 2017 - Institutional | | | 13.17 | | | | 0.12 | | | | 1.77 | | | | 1.89 | | | | (0.14 | ) | | | — | (d) | | | (0.14 | ) |
| | 2017 - Investor(f) | | | 13.16 | | | | 0.11 | | | | 1.76 | | | | 1.87 | | | | (0.11 | ) | | | — | (d) | | | (0.11 | ) |
| | 2017 - R | | | 13.09 | | | | 0.04 | | | | 1.76 | | | | 1.80 | | | | — | | | | — | (d) | | | — | (d) |
| | 2017 - R6 | | | 13.17 | | | | 0.13 | | | | 1.77 | | | | 1.90 | | | | (0.14 | ) | | | — | (d) | | | (0.14 | ) |
| | 2016 - A | | | 13.92 | | | | 0.09 | | | | 0.50 | | | | 0.59 | | | | (0.07 | ) | | | (1.36 | ) | | | (1.43 | ) |
| | 2016 - C | | | 13.56 | | | | (0.01 | ) | | | 0.50 | | | | 0.49 | | | | — | | | | (1.36 | ) | | | (1.36 | ) |
| | 2016 - Institutional | | | 14.01 | | | | 0.14 | | | | 0.51 | | | | 0.65 | | | | (0.13 | ) | | | (1.36 | ) | | | (1.49 | ) |
| | 2016 - Investor(f) | | | 13.98 | | | | 0.13 | | | | 0.50 | | | | 0.63 | | | | (0.09 | ) | | | (1.36 | ) | | | (1.45 | ) |
| | 2016 - R | | | 13.88 | | | | 0.07 | | | | 0.50 | | | | 0.57 | | | | — | | | | (1.36 | ) | | | (1.36 | ) |
| | 2016 - R6 | | | 14.01 | | | | 0.14 | | | | 0.51 | | | | 0.65 | | | | (0.13 | ) | | | (1.36 | ) | | | (1.49 | ) |
| | 2015 - A | | | 16.66 | | | | 0.09 | | | | (0.17 | ) | | | (0.08 | ) | | | (0.07 | ) | | | (2.59 | ) | | | (2.66 | ) |
| | 2015 - C | | | 16.33 | | | | (0.03 | ) | | | (0.15 | ) | | | (0.18 | ) | | | — | | | | (2.59 | ) | | | (2.59 | ) |
| | 2015 - Institutional | | | 16.75 | | | | 0.14 | | | | (0.16 | ) | | | (0.02 | ) | | | (0.13 | ) | | | (2.59 | ) | | | (2.72 | ) |
| | 2015 - Investor(f) | | | 16.72 | | | | 0.11 | | | | (0.15 | ) | | | (0.04 | ) | | | (0.11 | ) | | | (2.59 | ) | | | (2.70 | ) |
| | 2015 - R | | | 16.62 | | | | 0.04 | | | | (0.16 | ) | | | (0.12 | ) | | | (0.03 | ) | | | (2.59 | ) | | | (2.62 | ) |
| | 2015 - R6 (Commenced July 31, 2015) | | | 15.04 | | | | 0.01 | | | | (1.04 | ) | | | (1.03 | ) | | | — | | | | — | | | | — | |
| | 2014 - A | | | 14.79 | | | | 0.06 | | | | 3.23 | | | | 3.29 | | | | (0.05 | ) | | | (1.37 | ) | | | (1.42 | ) |
| | 2014 - C | | | 14.58 | | | | (0.06 | ) | | | 3.18 | | | | 3.12 | | | | — | | | | (1.37 | ) | | | (1.37 | ) |
| | 2014 - Institutional | | | 14.85 | | | | 0.12 | | | | 3.25 | | | | 3.37 | | | | (0.10 | ) | | | (1.37 | ) | | | (1.47 | ) |
| | 2014 - Investor(f) | | | 14.83 | | | | 0.10 | | | | 3.24 | | | | 3.34 | | | | (0.08 | ) | | | (1.37 | ) | | | (1.45 | ) |
| | 2014 - R | | | 14.78 | | | | 0.02 | | | | 3.23 | | | | 3.25 | | | | (0.04 | ) | | | (1.37 | ) | | | (1.41 | ) |
| | 2013 - A | | | 12.30 | | | | 0.09 | | | | 2.48 | | | | 2.57 | | | | (0.08 | ) | | | — | | | | (0.08 | ) |
| | 2013 - C | | | 12.13 | | | | (0.01 | ) | | | 2.46 | | | | 2.45 | | | | — | | | | — | | | | — | |
| | 2013 - Institutional | | | 12.35 | | | | 0.14 | | | | 2.50 | | | | 2.64 | | | | (0.14 | ) | | | — | | | | (0.14 | ) |
| | 2013 - Investor(f) | | | 12.34 | | | | 0.12 | | | | 2.50 | | | | 2.62 | | | | (0.13 | ) | | | — | | | | (0.13 | ) |
| | 2013 - R | | | 12.29 | | | | 0.04 | | | | 2.51 | | | | 2.55 | | | | (0.06 | ) | | | — | | | | (0.06 | ) |
| | (a) | | Calculated based on the average shares outstanding methodology. |
| | (b) | | Assumes investment at the NAV at the beginning of the year, reinvestment of all dividends and distributions, a complete redemption of the investment at the NAV at the end of the year and no sales or redemption charges. Total returns would be reduced if a sales or redemption charge was taken into account. Returns do not reflect the impact of taxes to shareholders relating to Fund distributions or the redemption of Fund shares. Total returns for periods less than one full year are not annualized. |
| | (c) | | The Fund’s portfolio turnover rate is calculated in accordance with regulatory requirements, without regard to transactions involving short term investments. If such transactions were included, the Fund’s portfolio turnover rate may be higher. |
| | (d) | | Amount is less than $0.005 per share. |
| | (f) | | Effective before the opening of business on August 15, 2017, Class IR Shares were designated as Investor Shares. |
| | |
| 92 | | The accompanying notes are an integral part of these financial statements. |
GOLDMAN SACHS DYNAMIC U.S. EQUITY FUND
| | | | | | | | | | | | | | | | | | | | | | | | | | | | | | | | | | | | | | | | |
| | | | | | | | | | | | | | | | | | | | | | | | | | | | | | | | | | |
| | | Net asset
value, end
of year | | | | | Total
return(b) | | | | | Net assets,
end of
year
(in 000s) | | | | | Ratio of
net expenses
to average
net assets | | | | | Ratio of
total expenses
to average
net assets | | | | | Ratio of
net investment
income (loss)
to average
net assets | | | | | Portfolio
turnover
rate(c) | |
| | | | | | | | | | | | | | | | | | | | | | | | | | | | | | | | | | | | | | | | |
| | $ | 14.84 | | | | | | 14.06 | % | | | | $ | 1,880 | | | | | | 1.17 | % | | | | | 4.64 | % | | | | | 0.53 | % | | | | | 77 | % |
| | | 14.36 | | | | | | 13.18 | | | | | | 178 | | | | | | 1.92 | | | | | | 5.38 | | | | | | (0.18 | ) | | | | | 77 | |
| | | 14.92 | | | | | | 14.43 | | | | | | 3,499 | | | | | | 0.79 | | | | | | 4.28 | | | | | | 0.88 | | | | | | 77 | |
| | | 14.92 | | | | | | 14.27 | | | | | | 188 | | | | | | 0.92 | | | | | | 4.47 | | | | | | 0.78 | | | | | | 77 | |
| | | 14.89 | | | | | | 13.77 | | | | | | 22 | | | | | | 1.41 | | | | | | 4.88 | | | | | | 0.30 | | | | | | 77 | |
| | | 14.93 | | | | | | 14.52 | | | | | | 11 | | | | | | 0.77 | | | | | | 4.20 | | | | | | 0.95 | | | | | | 77 | |
| | | 13.08 | | | | | | 4.39 | | | | | | 2,124 | | | | | | 1.22 | | | | | | 3.60 | | | | | | 0.67 | | | | | | 49 | |
| | | 12.69 | | | | | | 3.66 | | | | | | 195 | | | | | | 1.97 | | | | | | 4.33 | | | | | | (0.10 | ) | | | | | 49 | |
| | | 13.17 | | | | | | 4.84 | | | | | | 4,754 | | | | | | 0.82 | | | | | | 3.16 | | | | | | 1.10 | | | | | | 49 | |
| | | 13.16 | | | | | | 4.67 | | | | | | 156 | | | | | | 0.97 | | | | | | 3.54 | | | | | | 0.97 | | | | | | 49 | |
| | | 13.09 | | | | | | 4.18 | | | | | | 19 | | | | | | 1.47 | | | | | | 3.70 | | | | | | 0.49 | | | | | | 49 | |
| | | 13.17 | | | | | | 4.86 | | | | | | 10 | | | | | | 0.81 | | | | | | 3.14 | | | | | | 1.09 | | | | | | 49 | |
| | | 13.92 | | | | | | (1.22 | ) | | | | | 3,086 | | | | | | 1.21 | | | | | | 2.81 | | | | | | 0.57 | | | | | | 67 | |
| | | 13.56 | | | | | | (1.96 | ) | | | | | 355 | | | | | | 1.97 | | | | | | 3.56 | | | | | | (0.21 | ) | | | | | 67 | |
| | | 14.01 | | | | | | (0.82 | ) | | | | | 10,855 | | | | | | 0.81 | | | | | | 2.42 | | | | | | 0.93 | | | | | | 67 | |
| | | 13.98 | | | | | | (0.98 | ) | | | | | 800 | | | | | | 0.96 | | | | | | 1.06 | | | | | | 0.73 | | | | | | 67 | |
| | | 13.88 | | | | | | (1.48 | ) | | | | | 118 | | | | | | 1.46 | | | | | | 3.10 | | | | | | 0.28 | | | | | | 67 | |
| | | 14.01 | | | | | | (6.85 | ) | | | | | 9 | | | | | | 0.76 | (e) | | | | | 1.65 | (e) | | | | | 1.08 | (e) | | | | | 67 | |
| | | 16.66 | | | | | | 23.41 | | | | | | 4,542 | | | | | | 1.20 | | | | | | 3.04 | | | | | | 0.37 | | | | | | 67 | |
| | | 16.33 | | | | | | 22.44 | | | | | | 247 | | | | | | 1.95 | | | | | | 3.78 | | | | | | (0.37 | ) | | | | | 67 | |
| | | 16.75 | | | | | | 23.92 | | | | | | 8,995 | | | | | | 0.80 | | | | | | 2.65 | | | | | | 0.76 | | | | | | 67 | |
| | | 16.72 | | | | | | 23.71 | | | | | | 205 | | | | | | 0.95 | | | | | | 2.80 | | | | | | 0.61 | | | | | | 67 | |
| | | 16.62 | | | | | | 23.06 | | | | | | 110 | | | | | | 1.45 | | | | | | 3.30 | | | | | | 0.11 | | | | | | 67 | |
| | | 14.79 | | | | | | 21.05 | | | | | | 2,869 | | | | | | 1.18 | | | | | | 3.66 | | | | | | 0.68 | | | | | | 61 | |
| | | 14.58 | | | | | | 20.20 | | | | | | 126 | | | | | | 1.93 | | | | | | 4.41 | | | | | | (0.09 | ) | | | | | 61 | |
| | | 14.85 | | | | | | 21.56 | | | | | | 8,646 | | | | | | 0.78 | | | | | | 3.24 | | | | | | 1.06 | | | | | | 61 | |
| | | 14.83 | | | | | | 21.39 | | | | | | 174 | | | | | | 0.93 | | | | | | 3.39 | | | | | | 0.90 | | | | | | 61 | |
| | | 14.78 | | | | | | 20.83 | | | | | | 51 | | | | | | 1.43 | | | | | | 3.80 | | | | | | 0.29 | | | | | | 61 | |
| | |
| The accompanying notes are an integral part of these financial statements. | | 93 |
GOLDMAN SACHS FLEXIBLE CAP FUND
Financial Highlights
Selected Data for a Share Outstanding Throughout Each Year
| | | | | | | | | | | | | | | | | | | | | | | | | | | | | | |
| | | | | | | | Income (loss) from
investment operations | | | Distributions
to shareholders | |
| | | Year - Share Class | |
Net asset
value,
beginning
of year | | | Net
investment
income (loss)(a) | | | Net realized
and unrealized
gain (loss) | | | Total from
investment
operations | | | From net
investment
income | | | From net
realized
gains | | | Total
distributions | |
| | FOR THE FISCAL YEARS ENDED AUGUST 31, | |
| | 2017 - A | | $ | 11.74 | | | $ | — | (d) | | $ | 2.36 | | | $ | 2.36 | | | $ | — | | | $ | (0.01 | ) | | $ | (0.01 | ) |
| | 2017 - C | | | 10.71 | | | | (0.09 | ) | | | 2.14 | | | | 2.05 | | | | — | | | | (0.01 | ) | | | (0.01 | ) |
| | 2017 - Institutional | | | 12.35 | | | | 0.05 | | | | 2.49 | | | | 2.54 | | | | — | | | | (0.01 | ) | | | (0.01 | ) |
| | 2017 - Investor(i) | | | 12.16 | | | | 0.05 | | | | 2.43 | | | | 2.48 | | | | — | | | | (0.01 | ) | | | (0.01 | ) |
| | 2017 - R | | | 11.42 | | | | (0.03 | ) | | | 2.29 | | | | 2.26 | | | | — | | | | (0.01 | ) | | | (0.01 | ) |
| | 2017 - R6 | | | 12.35 | | | | 0.05 | | | | 2.49 | | | | 2.54 | | | | — | | | | (0.01 | ) | | | (0.01 | ) |
| | 2016 - A | | | 11.90 | | | | (0.02 | ) | | | 0.59 | | | | 0.57 | | | | — | | | | (0.73 | ) | | | (0.73 | ) |
| | 2016 - C | | | 11.00 | | | | (0.10 | ) | | | 0.54 | | | | 0.44 | | | | — | | | | (0.73 | ) | | | (0.73 | ) |
| | 2016 - Institutional | | | 12.44 | | | | 0.02 | | | | 0.62 | | | | 0.64 | | | | — | | | | (0.73 | ) | | | (0.73 | ) |
| | 2016 - Investor(i) | | | 12.27 | | | | — | (d) | | | 0.62 | | | | 0.62 | | | | — | | | | (0.73 | ) | | | (0.73 | ) |
| | 2016 - R | | | 11.63 | | | | (0.05 | ) | | | 0.57 | | | | 0.52 | | | | — | | | | (0.73 | ) | | | (0.73 | ) |
| | 2016 - R6 | | | 12.44 | | | | 0.03 | | | | 0.61 | | | | 0.64 | | | | — | | | | (0.73 | ) | | | (0.73 | ) |
| | 2015 - A | | | 13.21 | | | | (0.04 | )(e) | | | 0.63 | | | | 0.59 | | | | — | | | | (1.90 | ) | | | (1.90 | ) |
| | 2015 - C | | | 12.43 | | | | (0.12 | )(e) | | | 0.59 | | | | 0.47 | | | | — | | | | (1.90 | ) | | | (1.90 | ) |
| | 2015 - Institutional | | | 13.68 | | | | 0.01 | (e) | | | 0.65 | | | | 0.66 | | | | — | | | | (1.90 | ) | | | (1.90 | ) |
| | 2015 - Investor(i) | | | 13.53 | | | | — | (d)(e) | | | 0.64 | | | | 0.64 | | | | — | | | | (1.90 | ) | | | (1.90 | ) |
| | 2015 - R | | | 12.97 | | | | (0.07 | )(e) | | | 0.63 | | | | 0.56 | | | | — | | | | (1.90 | ) | | | (1.90 | ) |
| | 2015 - R6 (Commenced July 31, 2015) | | | 13.38 | | | | — | (d)(e) | | | (0.94 | ) | | | (0.94 | ) | | | — | | | | — | | | | — | |
| | 2014 - A | | | 11.83 | | | | (0.05 | ) | | | 3.01 | | | | 2.96 | | | | — | | | | (1.58 | ) | | | (1.58 | ) |
| | 2014 - C | | | 11.29 | | | | (0.14 | ) | | | 2.86 | | | | 2.72 | | | | — | | | | (1.58 | ) | | | (1.58 | ) |
| | 2014 - Institutional | | | 12.17 | | | | — | (d) | | | 3.11 | | | | 3.11 | | | | (0.02 | ) | | | (1.58 | ) | | | (1.60 | ) |
| | 2014 - Investor(i) | | | 12.05 | | | | (0.02 | ) | | | 3.08 | | | | 3.06 | | | | — | | | | (1.58 | ) | | | (1.58 | ) |
| | 2014 - R | | | 11.66 | | | | (0.08 | ) | | | 2.97 | | | | 2.89 | | | | — | | | | (1.58 | ) | | | (1.58 | ) |
| | 2013 - A | | | 11.48 | | | | — | (d)(h) | | | 1.71 | | | | 1.71 | | | | — | | | | (1.36 | ) | | | (1.36 | ) |
| | 2013 - C | | | 11.09 | | | | (0.08 | )(h) | | | 1.64 | | | | 1.56 | | | | — | | | | (1.36 | ) | | | (1.36 | ) |
| | 2013 - Institutional | | | 11.73 | | | | 0.04 | (h) | | | 1.76 | | | | 1.80 | | | | — | | | | (1.36 | ) | | | (1.36 | ) |
| | 2013 - Investor(i) | | | 11.64 | | | | 0.03 | (h) | | | 1.74 | | | | 1.77 | | | | — | | | | (1.36 | ) | | | (1.36 | ) |
| | 2013 - R | | | 11.36 | | | | (0.02 | )(h) | | | 1.68 | | | | 1.66 | | | | — | | | | (1.36 | ) | | | (1.36 | ) |
| | (a) | | Calculated based on the average shares outstanding methodology. |
| | (b) | | Assumes investment at the NAV at the beginning of the year, reinvestment of all dividends and distributions, a complete redemption of the investment at the NAV at the end of the year and no sales or redemption charges. Total returns would be reduced if a sales or redemption charge was taken into account. Returns do not reflect the impact of taxes to shareholders relating to Fund distributions or the redemption of Fund shares. Total returns for periods less than one full year are not annualized. |
| | (c) | | The Fund’s portfolio turnover rate is calculated in accordance with regulatory requirements, without regard to transactions involving short term investments. If such transactions were included, the Fund’s portfolio turnover rate may be higher. |
| | (d) | | Amount is less than $0.005 per share. |
| | (e) | | Reflects income recognized from special dividends which amounted to $0.02 per share and 0.13% of average net assets. |
| | (g) | | Amount is less than 0.005% per share. |
| | (h) | | Reflects income recognized from special dividends which amounted to $0.02 per share and 0.20% of average net assets. |
| | (i) | | Effective before the opening of business on August 15, 2017, Class IR Shares were designated as Investor Shares. |
| | |
| 94 | | The accompanying notes are an integral part of these financial statements. |
GOLDMAN SACHS FLEXIBLE CAP FUND
| | | | | | | | | | | | | | | | | | | | | | | | | | | | | | | | | | | | | | | | |
| | | | | | | | | | | | | | | | | | | | | | | | | | | | | | | | | | |
| | | Net asset
value, end
of year | | | | | Total
return(b) | | | | | Net assets,
end of
year
(in 000s) | | | | | Ratio of
net expenses
to average
net assets | | | | | Ratio of
total expenses
to average
net assets | | | | | Ratio of
net investment
income (loss)
to average
net assets | | | | | Portfolio
turnover
rate(c) | |
| | | | | | | | | | | | | | | | | | | | | | | | | | | | | | | | | | | | | | | | |
| | $ | 14.09 | | | | | | 20.14 | % | | | | $ | 5,627 | | | | | | 1.20 | % | | | | | 3.01 | % | | | | | (0.01 | )% | | | | | 47 | % |
| | | 12.75 | | | | | | 19.18 | | | | | | 1,512 | | | | | | 1.95 | | | | | | 3.76 | | | | | | (0.75 | ) | | | | | 47 | |
| | | 14.88 | | | | | | 20.61 | | | | | | 11,111 | | | | | | 0.82 | | | | | | 2.62 | | | | | | 0.38 | | | | | | 47 | |
| | | 14.63 | | | | | | 20.43 | | | | | | 379 | | | | | | 0.95 | | | | | | 2.83 | | | | | | 0.35 | | | | | | 47 | |
| | | 13.67 | | | | | | 19.83 | | | | | | 39 | | | | | | 1.45 | | | | | | 3.28 | | | | | | (0.23 | ) | | | | | 47 | |
| | | 14.88 | | | | | | 20.61 | | | | | | 12 | | | | | | 0.82 | | | | | | 2.61 | | | | | | 0.39 | | | | | | 47 | |
| | | 11.74 | | | | | | 4.93 | | | | | | 5,927 | | | | | | 1.22 | | | | | | 3.07 | | | | | | (0.21 | ) | | | | | 46 | |
| | | 10.71 | | | | | | 4.12 | | | | | | 1,474 | | | | | | 1.97 | | | | | | 3.82 | | | | | | (0.96 | ) | | | | | 46 | |
| | | 12.35 | | | | | | 5.29 | | | | | | 9,330 | | | | | | 0.82 | | | | | | 2.68 | | | | | | 0.20 | | | | | | 46 | |
| | | 12.16 | | | | | | 5.20 | | | | | | 197 | | | | | | 0.97 | | | | | | 2.76 | | | | | | 0.03 | | | | | | 46 | |
| | | 11.42 | | | | | | 4.61 | | | | | | 37 | | | | | | 1.47 | | | | | | 3.33 | | | | | | (0.45 | ) | | | | | 46 | |
| | | 12.35 | | | | | | 5.29 | | | | | | 10 | | | | | | 0.81 | | | | | | 2.66 | | | | | | 0.22 | | | | | | 46 | |
| | | 11.90 | | | | | | 4.59 | | | | | | 7,048 | | | | | | 1.24 | | | | | | 2.97 | | | | | | (0.30 | )(e) | | | | | 41 | |
| | | 11.00 | | | | | | 3.83 | | | | | | 1,802 | | | | | | 1.98 | | | | | | 3.71 | | | | | | (1.04 | )(e) | | | | | 41 | |
| | | 12.44 | | | | | | 4.99 | | | | | | 8,586 | | | | | | 0.84 | | | | | | 2.57 | | | | | | 0.09 | (e) | | | | | 41 | |
| | | 12.27 | | | | | | 4.88 | | | | | | 253 | | | | | | 0.98 | | | | | | 2.66 | | | | | | (0.03 | )(e) | | | | | 41 | |
| | | 11.63 | | | | | | 4.43 | | | | | | 33 | | | | | | 1.49 | | | | | | 3.24 | | | | | | (0.55 | )(e) | | | | | 41 | |
| | | 12.44 | | | | | | (7.03 | ) | | | | | 9 | | | | | | 0.84 | (f) | | | | | 4.34 | (f) | | | | | 0.24 | (e)(f) | | | | | 41 | |
| | | 13.21 | | | | | | 26.62 | | | | | | 5,665 | | | | | | 1.28 | | | | | | 3.32 | | | | | | (0.40 | ) | | | | | 56 | |
| | | 12.43 | | | | | | 25.68 | | | | | | 1,119 | | | | | | 2.03 | | | | | | 4.09 | | | | | | (1.15 | ) | | | | | 56 | |
| | | 13.68 | | | | | | 27.21 | | | | | | 8,262 | | | | | | 0.88 | | | | | | 2.92 | | | | | | — | (g) | | | | | 56 | |
| | | 13.53 | | | | | | 26.98 | | | | | | 126 | | | | | | 1.03 | | | | | | 3.04 | | | | | | (0.17 | ) | | | | | 56 | |
| | | 12.97 | | | | | | 26.38 | | | | | | 55 | | | | | | 1.53 | | | | | | 3.56 | | | | | | (0.65 | ) | | | | | 56 | |
| | | 11.83 | | | | | | 16.78 | | | | | | 4,584 | | | | | | 1.26 | | | | | | 3.62 | | | | | | 0.03 | (h) | | | | | 40 | |
| | | 11.29 | | | | | | 15.94 | | | | | | 1,005 | | | | | | 2.01 | | | | | | 4.32 | | | | | | (0.75 | )(h) | | | | | 40 | |
| | | 12.17 | | | | | | 17.23 | | | | | | 6,215 | | | | | | 0.86 | | | | | | 3.18 | | | | | | 0.37 | (h) | | | | | 40 | |
| | | 12.05 | | | | | | 17.08 | | | | | | 167 | | | | | | 1.01 | | | | | | 3.35 | | | | | | 0.26 | (h) | | | | | 40 | |
| | | 11.66 | | | | | | 16.50 | | | | | | 41 | | | | | | 1.51 | | | | | | 3.91 | | | | | | (0.19 | )(h) | | | | | 40 | |
| | |
| The accompanying notes are an integral part of these financial statements. | | 95 |
GOLDMAN SACHS GROWTH OPPORTUNITIES FUND
Financial Highlights
Selected Data for a Share Outstanding Throughout Each Year
| | | | | | | | | | | | | | | | | | | | | | |
| | | | | | | | Income (loss) from
investment operations | | | | |
| | | Year - Share Class | |
Net asset
value,
beginning
of year | | | Net
investment
income (loss)(a) | | | Net realized
and unrealized
gain (loss) | | | Total from
investment
operations | | | Distributions
to shareholders from net
realized
gains | |
| | FOR THE FISCAL YEARS ENDED AUGUST 31, | |
| | 2017 - A | | $ | 21.70 | | | $ | (0.12 | ) | | $ | 2.94 | | | $ | 2.82 | | | $ | (0.55 | ) |
| | 2017 - C | | | 16.52 | | | | (0.22 | ) | | | 2.20 | | | | 1.98 | | | | (0.55 | ) |
| | 2017 - Institutional | | | 24.76 | | | | (0.05 | ) | | | 3.38 | | | | 3.33 | | | | (0.55 | ) |
| | 2017 - Service | | | 20.92 | | | | (0.15 | ) | | | 2.83 | | | | 2.68 | | | | (0.55 | ) |
| | 2017 - Investor(h) | | | 22.46 | | | | (0.07 | ) | | | 3.06 | | | | 2.99 | | | | (0.55 | ) |
| | 2017 - R | | | 20.99 | | | | (0.17 | ) | | | 2.84 | | | | 2.67 | | | | (0.55 | ) |
| | 2017 - R6 | | | 24.77 | | | | (0.04 | ) | | | 3.37 | | | | 3.33 | | | | (0.55 | ) |
| | 2016 - A | | | 23.84 | | | | (0.10 | )(d) | | | 0.77 | | | | 0.67 | | | | (2.81 | ) |
| | 2016 - C | | | 18.95 | | | | (0.20 | )(d) | | | 0.58 | | | | 0.38 | | | | (2.81 | ) |
| | 2016 - Institutional | | | 26.71 | | | | (0.03 | )(d) | | | 0.89 | | | | 0.86 | | | | (2.81 | ) |
| | 2016 - Service | | | 23.11 | | | | (0.13 | )(d) | | | 0.75 | | | | 0.62 | | | | (2.81 | ) |
| | 2016 - Investor(h) | | | 24.52 | | | | (0.05 | )(d) | | | 0.80 | | | | 0.75 | | | | (2.81 | ) |
| | 2016 - R | | | 23.21 | | | | (0.15 | )(d) | | | 0.74 | | | | 0.59 | | | | (2.81 | ) |
| | 2016 - R6 | | | 26.71 | | | | (0.04 | )(d) | | | 0.91 | | | | 0.87 | | | | (2.81 | ) |
| | 2015 - A | | | 30.22 | | | | (0.17 | )(e) | | | (0.05 | ) | | | (0.22 | ) | | | (6.16 | ) |
| | 2015 - C | | | 25.42 | | | | (0.30 | )(e) | | | (0.01 | ) | | | (0.31 | ) | | | (6.16 | ) |
| | 2015 - Institutional | | | 33.02 | | | | (0.07 | )(e) | | | (0.08 | ) | | | (0.15 | ) | | | (6.16 | ) |
| | 2015 - Service | | | 29.51 | | | | (0.19 | )(e) | | | (0.05 | ) | | | (0.24 | ) | | | (6.16 | ) |
| | 2015 - Investor(h) | | | 30.85 | | | | (0.11 | )(e) | | | (0.06 | ) | | | (0.17 | ) | | | (6.16 | ) |
| | 2015 - R | | | 29.65 | | | | (0.23 | )(e) | | | (0.05 | ) | | | (0.28 | ) | | | (6.16 | ) |
| | 2015 - R6 (Commenced July 31, 2015) | | | 28.49 | | | | (0.01 | )(e) | | | (1.77 | ) | | | (1.78 | ) | | | — | |
| | 2014 - A | | | 26.65 | | | | (0.19 | ) | | | 5.95 | | | | 5.76 | | | | (2.19 | ) |
| | 2014 - C | | | 22.89 | | | | (0.34 | ) | | | 5.06 | | | | 4.72 | | | | (2.19 | ) |
| | 2014 - Institutional | | | 28.83 | | | | (0.08 | ) | | | 6.46 | | | | 6.38 | | | | (2.19 | ) |
| | 2014 - Service | | | 26.10 | | | | (0.21 | ) | | | 5.81 | | | | 5.60 | | | | (2.19 | ) |
| | 2014 - Investor(h) | | | 27.10 | | | | (0.12 | ) | | | 6.06 | | | | 5.94 | | | | (2.19 | ) |
| | 2014 - R | | | 26.25 | | | | (0.25 | ) | | | 5.84 | | | | 5.59 | | | | (2.19 | ) |
| | 2013 - A | | | 23.88 | | | | (0.11 | )(g) | | | 4.53 | | | | 4.42 | | | | (1.65 | ) |
| | 2013 - C | | | 20.89 | | | | (0.26 | )(g) | | | 3.91 | | | | 3.65 | | | | (1.65 | ) |
| | 2013 - Institutional | | | 25.59 | | | | (0.01 | )(g) | | | 4.90 | | | | 4.89 | | | | (1.65 | ) |
| | 2013 - Service | | | 23.44 | | | | (0.13 | )(g) | | | 4.44 | | | | 4.31 | | | | (1.65 | ) |
| | 2013 - Investor(h) | | | 24.19 | | | | (0.05 | )(g) | | | 4.61 | | | | 4.56 | | | | (1.65 | ) |
| | 2013 - R | | | 23.59 | | | | (0.17 | )(g) | | | 4.48 | | | | 4.31 | | | | (1.65 | ) |
| | (a) | | Calculated based on the average shares outstanding methodology. |
| | (b) | | Assumes investment at the NAV at the beginning of the year, reinvestment of all dividends and distributions, a complete redemption of the investment at the NAV at the end of the year and no sales or redemption charges. Total returns would be reduced if a sales or redemption charge was taken into account. Returns do not reflect the impact of taxes to shareholders relating to Fund distributions or the redemption of Fund shares. Total returns for periods less than one full year are not annualized. |
| | (c) | | The Fund’s portfolio turnover rate is calculated in accordance with regulatory requirements, without regard to transactions involving short term investments. If such transactions were included, the Fund’s portfolio turnover rate may be higher. |
| | (d) | | Reflects income recognized from special dividends which amounted to $0.04 per share and 0.16% of average net assets. |
| | (e) | | Reflects income recognized from special dividends which amounted to $0.03 per share and 0.10% of average net assets. |
| | (g) | | Reflects income recognized from special dividends which amounted to $0.04 per share and 0.17% of average net assets. |
| | (h) | | Effective before the opening of business on August 15, 2017, Class IR Shares were designated as Investor Shares. |
| | |
| 96 | | The accompanying notes are an integral part of these financial statements. |
GOLDMAN SACHS GROWTH OPPORTUNITIES FUND
| | | | | | | | | | | | | | | | | | | | | | | | | | | | | | | | | | | | | | | | |
| | | | | | | | | | | | | | | | | | | | | | | | | | | | | | | | | | |
| | | Net asset
value, end
of year | | | | | Total
return(b) | | | | | Net assets,
end of
year
(in 000s) | | | | | Ratio of
net expenses
to average
net assets | | | | | Ratio of
total expenses
to average
net assets | | | | | Ratio of
net investment
income (loss)
to average
net assets | | | | | Portfolio
turnover
rate(c) | |
| | | | | | | | | | | | | | | | | | | | | | | | | | | | | | | | | | | | | | | | |
| | $ | 23.97 | | | | | | 13.40 | % | | | | $ | 486,115 | | | | | | 1.30 | % | | | | | 1.43 | % | | | | | (0.56 | )% | | | | | 61 | % |
| | | 17.95 | | | | | | 12.49 | | | | | | 91,086 | | | | | | 2.05 | | | | | | 2.18 | | | | | | (1.32 | ) | | | | | 61 | |
| | | 27.54 | | | | | | 13.81 | | | | | | 1,670,808 | | | | | | 0.95 | | | | | | 1.03 | | | | | | (0.21 | ) | | | | | 61 | |
| | | 23.05 | | | | | | 13.22 | | | | | | 33,159 | | | | | | 1.45 | | | | | | 1.53 | | | | | | (0.71 | ) | | | | | 61 | |
| | | 24.90 | | | | | | 13.71 | | | | | | 132,003 | | | | | | 1.05 | | | | | | 1.18 | | | | | | (0.31 | ) | | | | | 61 | |
| | | 23.11 | | | | | | 13.13 | | | | | | 59,225 | | | | | | 1.55 | | | | | | 1.68 | | | | | | (0.81 | ) | | | | | 61 | |
| | | 27.55 | | | | | | 13.80 | | | | | | 118,634 | | | | | | 0.93 | | | | | | 1.01 | | | | | | (0.18 | ) | | | | | 61 | |
| | | 21.70 | | | | | | 3.39 | | | | | | 631,053 | | | | | | 1.32 | | | | | | 1.42 | | | | | | (0.47 | )(d) | | | | | 55 | |
| | | 16.52 | | | | | | 2.66 | | | | | | 128,788 | | | | | | 2.07 | | | | | | 2.17 | | | | | | (1.23 | )(d) | | | | | 55 | |
| | | 24.76 | | | | | | 3.76 | | | | | | 2,160,714 | | | | | | 0.95 | | | | | | 1.02 | | | | | | (0.11 | )(d) | | | | | 55 | |
| | | 20.92 | | | | | | 3.27 | | | | | | 37,432 | | | | | | 1.45 | | | | | | 1.52 | | | | | | (0.61 | )(d) | | | | | 55 | |
| | | 22.46 | | | | | | 3.64 | | | | | | 135,930 | | | | | | 1.07 | | | | | | 1.17 | | | | | | (0.23 | )(d) | | | | | 55 | |
| | | 20.99 | | | | | | 3.12 | | | | | | 63,105 | | | | | | 1.57 | | | | | | 1.67 | | | | | | (0.73 | )(d) | | | | | 55 | |
| | | 24.77 | | | | | | 3.81 | | | | | | 44,865 | | | | | | 0.93 | | | | | | 1.01 | | | | | | (0.19 | )(d) | | | | | 55 | |
| | | 23.84 | | | | | | (1.47 | ) | | | | | 946,463 | | | | | | 1.35 | | | | | | 1.40 | | | | | | (0.65 | )(e) | | | | | 51 | |
| | | 18.95 | | | | | | (2.23 | ) | | | | | 168,461 | | | | | | 2.10 | | | | | | 2.15 | | | | | | (1.40 | )(e) | | | | | 51 | |
| | | 26.71 | | | | | | (1.08 | ) | | | | | 3,171,058 | | | | | | 0.95 | | | | | | 1.00 | | | | | | (0.24 | )(e) | | | | | 51 | |
| | | 23.11 | | | | | | (1.59 | ) | | | | | 49,105 | | | | | | 1.45 | | | | | | 1.50 | | | | | | (0.75 | )(e) | | | | | 51 | |
| | | 24.52 | | | | | | (1.25 | ) | | | | | 171,980 | | | | | | 1.10 | | | | | | 1.15 | | | | | | (0.41 | )(e) | | | | | 51 | |
| | | 23.21 | | | | | | (1.74 | ) | | | | | 77,673 | | | | | | 1.60 | | | | | | 1.65 | | | | | | (0.90 | )(e) | | | | | 51 | |
| | | 26.71 | | | | | | (6.25 | ) | | | | | 9 | | | | | | 0.97 | (f) | | | | | 1.02 | (f) | | | | | (0.32 | )(e)(f) | | | | | 51 | |
| | | 30.22 | | | | | | 22.57 | | | | | | 1,110,320 | | | | | | 1.36 | | | | | | 1.40 | | | | | | (0.66 | ) | | | | | 59 | |
| | | 25.42 | | | | | | 21.67 | | | | | | 191,125 | | | | | | 2.11 | | | | | | 2.15 | | | | | | (1.41 | ) | | | | | 59 | |
| | | 33.02 | | | | | | 23.04 | | | | | | 3,750,790 | | | | | | 0.96 | | | | | | 1.00 | | | | | | (0.26 | ) | | | | | 59 | |
| | | 29.51 | | | | | | 22.42 | | | | | | 57,643 | | | | | | 1.46 | | | | | | 1.50 | | | | | | (0.76 | ) | | | | | 59 | |
| | | 30.85 | | | | | | 22.87 | | | | | | 143,249 | | | | | | 1.11 | | | | | | 1.15 | | | | | | (0.41 | ) | | | | | 59 | |
| | | 29.65 | | | | | | 22.25 | | | | | | 80,542 | | | | | | 1.61 | | | | | | 1.65 | | | | | | (0.91 | ) | | | | | 59 | |
| | | 26.65 | | | | | | 19.84 | | | | | | 1,130,449 | | | | | | 1.35 | | | | | | 1.41 | | | | | | (0.44 | )(g) | | | | | 41 | |
| | | 22.89 | | | | | | 18.94 | | | | | | 172,010 | | | | | | 2.10 | | | | | | 2.16 | | | | | | (1.19 | )(g) | | | | | 41 | |
| | | 28.83 | | | | | | 20.38 | | | | | | 3,207,925 | | | | | | 0.95 | | | | | | 1.01 | | | | | | (0.05 | )(g) | | | | | 41 | |
| | | 26.10 | | | | | | 19.74 | | | | | | 60,977 | | | | | | 1.45 | | | | | | 1.51 | | | | | | (0.54 | )(g) | | | | | 41 | |
| | | 27.10 | | | | | | 20.18 | | | | | | 91,093 | | | | | | 1.10 | | | | | | 1.16 | | | | | | (0.21 | )(g) | | | | | 41 | |
| | | 26.25 | | | | | | 19.61 | | | | | | 71,263 | | | | | | 1.60 | | | | | | 1.66 | | | | | | (0.71 | )(g) | | | | | 41 | |
| | |
| The accompanying notes are an integral part of these financial statements. | | 97 |
GOLDMAN SACHS SMALL/MID CAP GROWTH FUND
Financial Highlights
Selected Data for a Share Outstanding Throughout Each Year
| | | | | | | | | | | | | | | | | | | | | | |
| | | | | | | | Income( loss) from
investment operations | | | | |
| | | Year - Share Class | | Net asset
value,
beginning
of year | | | Net
investment
income (loss)(a) | | | Net realized
and unrealized
gain (loss) | | | Total from
investment
operations | | | Distributions
to shareholders
from net
realized
gains | |
| | FOR THE FISCAL YEARS ENDED AUGUST 31, | |
| | 2017 - A | | $ | 19.85 | | | $ | (0.12 | )(d) | | $ | 2.77 | | | $ | 2.65 | | | $ | (0.69 | ) |
| | 2017 - C | | | 17.75 | | | | (0.24 | )(d) | | | 2.45 | | | | 2.21 | | | | (0.69 | ) |
| | 2017 - Institutional | | | 20.89 | | | | (0.05 | )(d) | | | 2.93 | | | | 2.88 | | | | (0.69 | ) |
| | 2017 - Service | | | 19.46 | | | | (0.14 | )(d) | | | 2.70 | | | | 2.56 | | | | (0.69 | ) |
| | 2017 - Investor(j) | | | 20.39 | | | | (0.08 | )(d) | | | 2.86 | | | | 2.78 | | | | (0.69 | ) |
| | 2017 - R | | | 19.34 | | | | (0.17 | )(d) | | | 2.69 | | | | 2.52 | | | | (0.69 | ) |
| | 2017 - R6 | | | 20.89 | | | | (0.04 | )(d) | | | 2.93 | | | | 2.89 | | | | (0.69 | ) |
| | 2016 - A | | | 20.72 | | | | (0.14 | )(e) | | | — | | | | (0.14 | ) | | | (0.73 | ) |
| | 2016 - C | | | 18.74 | | | | (0.25 | )(e) | | | (0.01 | ) | | | (0.26 | ) | | | (0.73 | ) |
| | 2016 - Institutional | | | 21.69 | | | | (0.07 | )(e) | | | — | | | | (0.07 | ) | | | (0.73 | ) |
| | 2016 - Service | | | 20.35 | | | | (0.16 | )(e) | | | — | | | | (0.16 | ) | | | (0.73 | ) |
| | 2016 - Investor(j) | | | 21.21 | | | | (0.09 | )(e) | | | — | | | | (0.09 | ) | | | (0.73 | ) |
| | 2016 - R | | | 20.26 | | | | (0.18 | )(e) | | | (0.01 | ) | | | (0.19 | ) | | | (0.73 | ) |
| | 2016 - R6 | | | 21.69 | | | | (0.06 | )(e) | | | (0.01 | ) | | | (0.07 | ) | | | (0.73 | ) |
| | 2015 - A | | | 20.90 | | | | (0.18 | )(f) | | | 1.71 | | | | 1.53 | | | | (1.71 | ) |
| | 2015 - C | | | 19.20 | | | | (0.31 | )(f) | | | 1.56 | | | | 1.25 | | | | (1.71 | ) |
| | 2015 - Institutional | | | 21.71 | | | | (0.10 | )(f) | | | 1.79 | | | | 1.69 | | | | (1.71 | ) |
| | 2015 - Service | | | 20.58 | | | | (0.20 | )(f) | | | 1.68 | | | | 1.48 | | | | (1.71 | ) |
| | 2015 - Investor(j) | | | 21.30 | | | | (0.13 | )(f) | | | 1.75 | | | | 1.62 | | | | (1.71 | ) |
| | 2015 - R | | | 20.51 | | | | (0.23 | )(f) | | | 1.69 | | | | 1.46 | | | | (1.71 | ) |
| | 2015 - R6 (Commenced July 31, 2015) | | | 23.47 | | | | (0.01 | )(f) | | | (1.77 | ) | | | (1.78 | ) | | | — | |
| | 2014 - A | | | 18.63 | | | | (0.16 | )(h) | | | 3.43 | | | | 3.27 | | | | (1.00 | ) |
| | 2014 - C | | | 17.31 | | | | (0.29 | )(h) | | | 3.18 | | | | 2.89 | | | | (1.00 | ) |
| | 2014 - Institutional | | | 19.25 | | | | (0.09 | )(h) | | | 3.55 | | | | 3.46 | | | | (1.00 | ) |
| | 2014 - Service | | | 18.38 | | | | (0.18 | )(h) | | | 3.38 | | | | 3.20 | | | | (1.00 | ) |
| | 2014 - Investor(j) | | | 18.93 | | | | (0.12 | )(h) | | | 3.49 | | | | 3.37 | | | | (1.00 | ) |
| | 2014 - R | | | 18.35 | | | | (0.21 | )(h) | | | 3.37 | | | | 3.16 | | | | (1.00 | ) |
| | 2013 - A | | | 15.52 | | | | (0.11 | )(i) | | | 3.99 | | | | 3.88 | | | | (0.77 | ) |
| | 2013 - C | | | 14.58 | | | | (0.23 | )(i) | | | 3.73 | | | | 3.50 | | | | (0.77 | ) |
| | 2013 - Institutional | | | 15.95 | | | | (0.06 | )(i) | | | 4.13 | | | | 4.07 | | | | (0.77 | ) |
| | 2013 - Service | | | 15.34 | | | | (0.13 | )(i) | | | 3.94 | | | | 3.81 | | | | (0.77 | ) |
| | 2013 - Investor(j) | | | 15.72 | | | | (0.08 | )(i) | | | 4.06 | | | | 3.98 | | | | (0.77 | ) |
| | 2013 - R | | | 15.34 | | | | (0.15 | )(i) | | | 3.93 | | | | 3.78 | | | | (0.77 | ) |
| | (a) | | Calculated based on the average shares outstanding methodology. |
| | (b) | | Assumes investment at the NAV at the beginning of the year, reinvestment of all dividends and distributions, a complete redemption of the investment at the NAV at the end of the year and no sales or redemption charges. Total returns would be reduced if a sales or redemption charge was taken into account. Returns do not reflect the impact of taxes to shareholders relating to Fund distributions or the redemption of Fund shares. Total returns for periods less than one full year are not annualized. |
| | (c) | | The Fund’s portfolio turnover rate is calculated in accordance with regulatory requirements, without regard to transactions involving short term investments. If such transactions were included, the Fund’s portfolio turnover rate may be higher. |
| | (d) | | Reflects income recognized from special dividends which amounted to $0.03 per share and 0.14% of average net assets. |
| | (e) | | Reflects income recognized from special dividends which amounted to $0.03 per share and 0.15% of average net assets. |
| | (f) | | Reflects income recognized from special dividends which amounted to $0.01 per share and 0.05% of average net assets. |
| | (h) | | Reflects income recognized from special dividends which amounted to $0.01 per share and 0.12% of average net assets. |
| | (i) | | Reflects income recognized from special dividends which amounted to $0.02 per share and 0.14% of average net assets. |
| | (j) | | Effective before the opening of business on August 15, 2017, Class IR Shares were designated as Investor Shares. |
| | |
| 98 | | The accompanying notes are an integral part of these financial statements. |
GOLDMAN SACHS SMALL/MID CAP GROWTH FUND
| | | | | | | | | | | | | | | | | | | | | | | | | | | | | | | | | | | | | | | | |
| | | | | | | | | | | | | | | | | | | | | | | | | | | | | | | | | | |
| | | Net asset Value, end of year | | | | | Total
return(b) | | | | | Net assets,
end of
year
(in 000s) | | | | | Ratio of
net expenses
to average
net assets | | | | | Ratio of
total expenses
to average
net assets | | | | | Ratio of
net investment
income (loss)
to average
net assets | | | | | Portfolio
turnover
rate(c) | |
| | | | | | | | | | | | | | | | | | | | | | | | | | | | | | | | | | | | | | | | |
| | $ | 21.81 | | | | | | 13.78 | % | | | | $ | 351,253 | | | | | | 1.29 | % | | | | | 1.46 | % | | | | | (0.62 | )%(d) | | | | | 60 | % |
| | | 19.27 | | | | | | 12.98 | | | | | | 217,385 | | | | | | 2.04 | | | | | | 2.21 | | | | | | (1.36 | )(d) | | | | | 60 | |
| | | 23.08 | | | | | | 14.21 | | | | | | 1,149,459 | | | | | | 0.92 | | | | | | 1.06 | | | | | | (0.24 | )(d) | | | | | 60 | |
| | | 21.33 | | | | | | 13.59 | | | | | | 16,520 | | | | | | 1.42 | | | | | | 1.56 | | | | | | (0.73 | )(d) | | | | | 60 | |
| | | 22.48 | | | | | | 14.06 | | | | | | 437,309 | | | | | | 1.04 | | | | | | 1.21 | | | | | | (0.36 | )(d) | | | | | 60 | |
| | | 21.17 | | | | | | 13.47 | | | | | | 26,918 | | | | | | 1.54 | | | | | | 1.71 | | | | | | (0.86 | )(d) | | | | | 60 | |
| | | 23.09 | | | | | | 14.26 | | | | | | 22,660 | | | | | | 0.90 | | | | | | 1.04 | | | | | | (0.18 | )(d) | | | | | 60 | |
| | | 19.85 | | | | | | (0.56 | ) | | | | | 736,221 | | | | | | 1.31 | | | | | | 1.45 | | | | | | (0.73 | )(e) | | | | | 67 | |
| | | 17.75 | | | | | | (1.34 | ) | | | | | 265,282 | | | | | | 2.06 | | | | | | 2.20 | | | | | | (1.48 | )(e) | | | | | 67 | |
| | | 20.89 | | | | | | (0.21 | ) | | | | | 1,235,282 | | | | | | 0.93 | | | | | | 1.05 | | | | | | (0.35 | )(e) | | | | | 67 | |
| | | 19.46 | | | | | | (0.67 | ) | | | | | 13,956 | | | | | | 1.43 | | | | | | 1.55 | | | | | | (0.85 | )(e) | | | | | 67 | |
| | | 20.39 | | | | | | (0.31 | ) | | | | | 313,812 | | | | | | 1.06 | | | | | | 1.20 | | | | | | (0.48 | )(e) | | | | | 67 | |
| | | 19.34 | | | | | | (0.83 | ) | | | | | 34,493 | | | | | | 1.56 | | | | | | 1.70 | | | | | | (0.98 | )(e) | | | | | 67 | |
| | | 20.89 | | | | | | (0.21 | ) | | | | | 9,785 | | | | | | 0.92 | | | | | | 1.04 | | | | | | (0.28 | )(e) | | | | | 67 | |
| | | 20.72 | | | | | | 7.67 | | | | | | 906,362 | | | | | | 1.33 | | | | | | 1.45 | | | | | | (0.85 | )(f) | | | | | 47 | |
| | | 18.74 | | | | | | 6.84 | | | | | | 268,384 | | | | | | 2.08 | | | | | | 2.20 | | | | | | (1.60 | )(f) | | | | | 47 | |
| | | 21.69 | | | | | | 8.15 | | | | | | 1,355,322 | | | | | | 0.93 | | | | | | 1.05 | | | | | | (0.45 | )(f) | | | | | 47 | |
| | | 20.35 | | | | | | 7.54 | | | | | | 12,695 | | | | | | 1.42 | | | | | | 1.55 | | | | | | (0.95 | )(f) | | | | | 47 | |
| | | 21.21 | | | | | | 7.97 | | | | | | 221,058 | | | | | | 1.08 | | | | | | 1.20 | | | | | | (0.60 | )(f) | | | | | 47 | |
| | | 20.26 | | | | | | 7.46 | | | | | | 34,697 | | | | | | 1.58 | | | | | | 1.70 | | | | | | (1.10 | )(f) | | | | | 47 | |
| | | 21.69 | | | | | | (7.58 | ) | | | | | 9 | | | | | | 0.92 | (g) | | | | | 1.05 | (g) | | | | | (0.34 | )(f)(g) | | | | | 47 | |
| | | 20.9 | | | | | | 17.97 | | | | | | 741,254 | | | | | | 1.33 | | | | | | 1.48 | | | | | | (0.82 | )(h) | | | | | 43 | |
| | | 19.2 | | | | | | 17.11 | | | | | | 221,451 | | | | | | 2.08 | | | | | | 2.23 | | | | | | (1.57 | )(h) | | | | | 43 | |
| | | 21.71 | | | | | | 18.39 | | | | | | 1,077,769 | | | | | | 0.93 | | | | | | 1.08 | | | | | | (0.42 | )(h) | | | | | 43 | |
| | | 20.58 | | | | | | 17.83 | | | | | | 8,692 | | | | | | 1.43 | | | | | | 1.58 | | | | | | (0.92 | )(h) | | | | | 43 | |
| | | 21.3 | | | | | | 18.22 | | | | | | 171,779 | | | | | | 1.08 | | | | | | 1.23 | | | | | | (0.57 | )(h) | | | | | 43 | |
| | | 20.51 | | | | | | 17.63 | | | | | | 34,118 | | | | | | 1.58 | | | | | | 1.73 | | | | | | (1.07 | )(h) | | | | | 43 | |
| | | 18.63 | | | | | | 26.18 | | | | | | 592,798 | | | | | | 1.34 | | | | | | 1.49 | | | | | | (0.68 | )(i) | | | | | 37 | |
| | | 17.31 | | | | | | 25.23 | | | | | | 150,744 | | | | | | 2.09 | | | | | | 2.24 | | | | | | (1.44 | )(i) | | | | | 37 | |
| | | 19.25 | | | | | | 26.68 | | | | | | 725,662 | | | | | | 0.94 | | | | | | 1.09 | | | | | | (0.32 | )(i) | | | | | 37 | |
| | | 18.38 | | | | | | 26.02 | | | | | | 8,495 | | | | | | 1.44 | | | | | | 1.59 | | | | | | (0.77 | )(i) | | | | | 37 | |
| | | 18.93 | | | | | | 26.49 | | | | | | 93,255 | | | | | | 1.09 | | | | | | 1.24 | | | | | | (0.45 | )(i) | | | | | 37 | |
| | | 18.35 | | | | | | 25.82 | | | | | | 24,420 | | | | | | 1.59 | | | | | | 1.74 | | | | | | (0.93 | )(i) | | | | | 37 | |
| | |
| The accompanying notes are an integral part of these financial statements. | | 99 |
GOLDMAN SACHS STRATEGIC GROWTH FUND
Financial Highlights
Selected Data for a Share Outstanding Throughout Each Year
| | | | | | | | | | | | | | | | | | | | | | | | | | | | | | |
| | | | | | | | Income (loss) from
investment operations | | | Distributions
to shareholders | |
| | | Year - Share Class | |
Net asset
value,
beginning
of year | | | Net
investment
income (loss)(a) | | | Net realized
and unrealized
gain (loss) | | | Total from
investment
operations | | | From net
investment
income | | | From net
realized
gains | | | Total
distributions | |
| | FOR THE FISCAL YEARS ENDED AUGUST 31, | |
| | 2017 - A | | $ | 11.91 | | | $ | 0.02 | | | $ | 2.26 | | | $ | 2.28 | | | $ | (0.04 | ) | | $ | (0.36 | ) | | $ | (0.40 | ) |
| | 2017 - C | | | 10.00 | | | | (0.06 | ) | | | 1.88 | | | | 1.82 | | | | — | | | | (0.36 | ) | | | (0.36 | ) |
| | 2017 - Institutional | | | 12.64 | | | | 0.07 | | | | 2.40 | | | | 2.47 | | | | (0.08 | ) | | | (0.36 | ) | | | (0.44 | ) |
| | 2017 - Service | | | 11.85 | | | | 0.01 | | | | 2.24 | | | | 2.25 | | | | (0.04 | ) | | | (0.36 | ) | | | (0.40 | ) |
| | 2017 - Investor(h) | | | 12.63 | | | | 0.06 | | | | 2.40 | | | | 2.46 | | | | (0.07 | ) | | | (0.36 | ) | | | (0.43 | ) |
| | 2017 - R | | | 11.75 | | | | (0.01 | ) | | | 2.23 | | | | 2.22 | | | | (0.05 | ) | | | (0.36 | ) | | | (0.41 | ) |
| | 2017 - R6 | | | 12.63 | | | | 0.08 | | | | 2.40 | | | | 2.48 | | | | (0.09 | ) | | | (0.36 | ) | | | (0.45 | ) |
| | 2016 - A | | | 11.86 | | | | 0.02 | | | | 0.74 | | | | 0.76 | | | | (0.02 | ) | | | (0.69 | ) | | | (0.71 | ) |
| | 2016 - C | | | 10.12 | | | | (0.05 | ) | | | 0.62 | | | | 0.57 | | | | — | | | | (0.69 | ) | | | (0.69 | ) |
| | 2016 - Institutional | | | 12.53 | | | | 0.07 | | | | 0.78 | | | | 0.85 | | | | (0.05 | ) | | | (0.69 | ) | | | (0.74 | ) |
| | 2016 - Service | | | 11.81 | | | | 0.01 | | | | 0.73 | | | | 0.74 | | | | (0.01 | ) | | | (0.69 | ) | | | (0.70 | ) |
| | 2016 - Investor(h) | | | 12.53 | | | | 0.05 | | | | 0.78 | | | | 0.83 | | | | (0.04 | ) | | | (0.69 | ) | | | (0.73 | ) |
| | 2016 - R | | | 11.74 | | | | (0.01 | ) | | | 0.73 | | | | 0.72 | | | | (0.02 | ) | | | (0.69 | ) | | | (0.71 | ) |
| | 2016 - R6 | | | 12.53 | | | | 0.07 | | | | 0.77 | | | | 0.84 | | | | (0.05 | ) | | | (0.69 | ) | | | (0.74 | ) |
| | 2015 - A | | | 13.50 | | | | 0.02 | (d) | | | 0.42 | | | | 0.44 | | | | — | | | | (2.08 | ) | | | (2.08 | ) |
| | 2015 - C | | | 11.90 | | | | (0.07 | )(d) | | | 0.37 | | | | 0.30 | | | | — | | | | (2.08 | ) | | | (2.08 | ) |
| | 2015 - Institutional | | | 14.15 | | | | 0.07 | (d) | | | 0.43 | | | | 0.50 | | | | (0.04 | ) | | | (2.08 | ) | | | (2.12 | ) |
| | 2015 - Service | | | 13.47 | | | | — | (d)(e) | | | 0.42 | | | | 0.42 | | | | — | | | | (2.08 | ) | | | (2.08 | ) |
| | 2015 - Investor(h) | | | 14.14 | | | | 0.05 | (d) | | | 0.44 | | | | 0.49 | | | | (0.02 | ) | | | (2.08 | ) | | | (2.10 | ) |
| | 2015 - R | | | 13.42 | | | | (0.01 | )(d) | | | 0.41 | | | | 0.40 | | | | — | | | | (2.08 | ) | | | (2.08 | ) |
| | 2015 - R6 (Commenced July 31, 2015) | | | 13.36 | | | | 0.01 | (d) | | | (0.84 | ) | | | (0.83 | ) | | | — | | | | — | | | | — | |
| | 2014 - A | | | 12.29 | | | | (0.01 | ) | | | 3.06 | | | | 3.05 | | | | (0.01 | ) | | | (1.83 | ) | | | (1.84 | ) |
| | 2014 - C | | | 11.09 | | | | (0.10 | ) | | | 2.74 | | | | 2.64 | | | | — | | | | (1.83 | ) | | | (1.83 | ) |
| | 2014 - Institutional | | | 12.79 | | | | 0.04 | | | | 3.21 | | | | 3.25 | | | | (0.06 | ) | | | (1.83 | ) | | | (1.89 | ) |
| | 2014 - Service | | | 12.28 | | | | (0.02 | ) | | | 3.05 | | | | 3.03 | | | | (0.01 | ) | | | (1.83 | ) | | | (1.84 | ) |
| | 2014 - Investor(h) | | | 12.80 | | | | 0.02 | | | | 3.20 | | | | 3.22 | | | | (0.05 | ) | | | (1.83 | ) | | | (1.88 | ) |
| | 2014 - R | | | 12.26 | | | | (0.04 | ) | | | 3.05 | | | | 3.01 | | | | (0.02 | ) | | | (1.83 | ) | | | (1.85 | ) |
| | 2013 - A | | | 11.57 | | | | 0.06 | (g) | | | 1.58 | | | | 1.64 | | | | (0.05 | ) | | | (0.87 | ) | | | (0.92 | ) |
| | 2013 - C | | | 10.54 | | | | (0.04 | )(g) | | | 1.46 | | | | 1.42 | | | | — | | | | (0.87 | ) | | | (0.87 | ) |
| | 2013 - Institutional | | | 12.00 | | | | 0.10 | (g) | | | 1.66 | | | | 1.76 | | | | (0.10 | ) | | | (0.87 | ) | | | (0.97 | ) |
| | 2013 - Service | | | 11.59 | | | | 0.03 | (g) | | | 1.61 | | | | 1.64 | | | | (0.08 | ) | | | (0.87 | ) | | | (0.95 | ) |
| | 2013 - Investor(h) | | | 12.01 | | | | 0.07 | (g) | | | 1.68 | | | | 1.75 | | | | (0.09 | ) | | | (0.87 | ) | | | (0.96 | ) |
| | 2013 - R | | | 11.53 | | | | 0.03 | (g) | | | 1.60 | | | | 1.63 | | | | (0.03 | ) | | | (0.87 | ) | | | (0.90 | ) |
| | (a) | | Calculated based on the average shares outstanding methodology. |
| | (b) | | Assumes investment at the NAV at the beginning of the year, reinvestment of all dividends and distributions, a complete redemption of the investment at the NAV at the end of the year and no sales or redemption charges. Total returns would be reduced if a sales or redemption charge was taken into account. Returns do not reflect the impact of taxes to shareholders relating to Fund distributions or the redemption of Fund shares. Total returns for periods less than one full year are not annualized. |
| | (c) | | The Fund’s portfolio turnover rate is calculated in accordance with regulatory requirements, without regard to transactions involving short term investments. If such transactions were included, the Fund’s portfolio turnover rate may be higher. |
| | (d) | | Reflects income recognized from special dividends which amounted to $0.02 per share and 0.18% of average net assets. |
| | (e) | | Amount is less than $0.005 per share. |
| | (g) | | Reflects income recognized from special dividends which amounted to $0.03 per share and 0.29% of average net assets. |
| | (h) | | Effective before the opening of business on August 15, 2017, Class IR Shares were designated as Investor Shares. |
| | |
| 100 | | The accompanying notes are an integral part of these financial statements. |
GOLDMAN SACHS STRATEGIC GROWTH FUND
| | | | | | | | | | | | | | | | | | | | | | | | | | | | | | | | | | | | | | | | |
| | | | | | | | | | | | | | | | | | | | | | | | | | | | | | | | | | |
| | | Net asset
value, end
of year | | | | | Total
return(b) | | | | | Net assets,
end of
year
(in 000s) | | | | | Ratio of
net expenses
to average
net assets | | | | | Ratio of
total expenses
to average
net assets | | | | | Ratio of
net investment
income (loss)
to average
net assets | | | | | Portfolio
turnover
rate(c) | |
| | | | | | | | | | | | | | | | | | | | | | | | | | | | | | | | | | | | | | | | |
| | $ | 13.79 | | | | | | 19.79 | % | | | | $ | 46,114 | | | | | | 1.15 | % | | | | | 1.55 | % | | | | | 0.15 | % | | | | | 54 | % |
| | | 11.46 | | | | | | 18.89 | | | | | | 9,326 | | | | | | 1.90 | | | | | | 2.30 | | | | | | (0.60 | ) | | | | | 54 | |
| | | 14.67 | | | | | | 20.29 | | | | | | 211,311 | | | | | | 0.75 | | | | | | 1.14 | | | | | | 0.51 | | | | | | 54 | |
| | | 13.70 | | | | | | 19.66 | | | | | | 478 | | | | | | 1.25 | | | | | | 1.65 | | | | | | 0.09 | | | | | | 54 | |
| | | 14.66 | | | | | | 20.15 | | | | | | 2,264 | | | | | | 0.90 | | | | | | 1.30 | | | | | | 0.48 | | | | | | 54 | |
| | | 13.56 | | | | | | 19.56 | | | | | | 169 | | | | | | 1.40 | | | | | | 1.80 | | | | | | (0.07 | ) | | | | | 54 | |
| | | 14.66 | | | | | | 20.33 | | | | | | 12 | | | | | | 0.75 | | | | | | 1.14 | | | | | | 0.57 | | | | | | 54 | |
| | | 11.91 | | | | | | 6.48 | | | | | | 46,093 | | | | | | 1.15 | | | | | | 1.54 | | | | | | 0.19 | | | | | | 56 | |
| | | 10.00 | | | | | | 5.70 | | | | | | 11,103 | | | | | | 1.90 | | | | | | 2.29 | | | | | | (0.56 | ) | | | | | 56 | |
| | | 12.64 | | | | | | 6.89 | | | | | | 294,952 | | | | | | 0.75 | | | | | | 1.14 | | | | | | 0.59 | | | | | | 56 | |
| | | 11.85 | | | | | | 6.40 | | | | | | 272 | | | | | | 1.25 | | | | | | 1.64 | | | | | | 0.11 | | | | | | 56 | |
| | | 12.63 | | | | | | 6.69 | | | | | | 829 | | | | | | 0.90 | | | | | | 1.29 | | | | | | 0.44 | | | | | | 56 | |
| | | 11.75 | | | | | | 6.18 | | | | | | 81 | | | | | | 1.40 | | | | | | 1.79 | | | | | | (0.05 | ) | | | | | 56 | |
| | | 12.63 | | | | | | 6.83 | | | | | | 10 | | | | | | 0.76 | | | | | | 1.15 | | | | | | 0.59 | | | | | | 56 | |
| | | 11.86 | | | | | | 3.09 | | | | | | 45,046 | | | | | | 1.15 | | | | | | 1.52 | | | | | | 0.13 | (d) | | | | | 52 | |
| | | 10.12 | | | | | | 2.23 | | | | | | 11,175 | | | | | | 1.90 | | | | | | 2.27 | | | | | | (0.63 | )(d) | | | | | 52 | |
| | | 12.53 | | | | | | 3.43 | | | | | | 326,619 | | | | | | 0.75 | | | | | | 1.12 | | | | | | 0.52 | (d) | | | | | 52 | |
| | | 11.81 | | | | | | 2.93 | | | | | | 254 | | | | | | 1.25 | | | | | | 1.62 | | | | | | (0.01 | )(d) | | | | | 52 | |
| | | 12.53 | | | | | | 3.34 | | | | | | 817 | | | | | | 0.90 | | | | | | 1.27 | | | | | | 0.37 | (d) | | | | | 52 | |
| | | 11.74 | | | | | | 2.78 | | | | | | 77 | | | | | | 1.40 | | | | | | 1.76 | | | | | | (0.07 | )(d) | | | | | 52 | |
| | | 12.53 | | | | | | (6.21 | ) | | | | | 9 | | | | | | 0.73 | (f) | | | | | 1.06 | (f) | | | | | 0.68 | (d)(f) | | | | | 52 | |
| | | 13.50 | | | | | | 26.74 | | | | | | 51,626 | | | | | | 1.16 | | | | | | 1.53 | | | | | | (0.10 | ) | | | | | 64 | |
| | | 11.90 | | | | | | 25.83 | | | | | | 11,717 | | | | | | 1.91 | | | | | | 2.28 | | | | | | (0.85 | ) | | | | | 64 | |
| | | 14.15 | | | | | | 27.32 | | | | | | 332,401 | | | | | | 0.76 | | | | | | 1.13 | | | | | | 0.30 | | | | | | 64 | |
| | | 13.47 | | | | | | 26.55 | | | | | | 156 | | | | | | 1.26 | | | | | | 1.63 | | | | | | (0.20 | ) | | | | | 64 | |
| | | 14.14 | | | | | | 27.03 | | | | | | 994 | | | | | | 0.91 | | | | | | 1.28 | | | | | | 0.15 | | | | | | 64 | |
| | | 13.42 | | | | | | 26.49 | | | | | | 15 | | | | | | 1.38 | | | | | | 1.75 | | | | | | (0.30 | ) | | | | | 64 | |
| | | 12.29 | | | | | | 15.53 | | | | | | 87,987 | | | | | | 1.15 | | | | | | 1.54 | | | | | | 0.49 | (g) | | | | | 55 | |
| | | 11.09 | | | | | | 14.68 | | | | | | 9,314 | | | | | | 1.90 | | | | | | 2.29 | | | | | | (0.35 | )(g) | | | | | 55 | |
| | | 12.79 | | | | | | 15.98 | | | | | | 242,865 | | | | | | 0.75 | | | | | | 1.14 | | | | | | 0.81 | (g) | | | | | 55 | |
| | | 12.28 | | | | | | 15.45 | | | | | | 82 | | | | | | 1.25 | | | | | | 1.64 | | | | | | 0.24 | (g) | | | | | 55 | |
| | | 12.80 | | | | | | 15.80 | | | | | | 884 | | | | | | 0.90 | | | | | | 1.29 | | | | | | 0.57 | (g) | | | | | 55 | |
| | | 12.26 | | | | | | 15.36 | | | | | | 6 | | | | | | 1.34 | | | | | | 1.73 | | | | | | 0.22 | (g) | | | | | 55 | |
| | |
| The accompanying notes are an integral part of these financial statements. | | 101 |
GOLDMAN SACHS TECHNOLOGY OPPORTUNITIES FUND
Financial Highlights
Selected Data for a Share Outstanding Throughout Each Year
| | | | | | | | | | | | | | | | | | | | | | |
| | | | | | | | Income (loss) from
investment operations | | | | |
| | | Year - Share Class | |
Net asset
value,
beginning
of year | | | Net
investment
income (loss)(a) | | | Net realized
and unrealized
gain | | | Total from
investment
operations | | | Distributions to
shareholders from
net realized gains | |
| | FOR THE FISCAL YEARS ENDED AUGUST 31, | |
| | 2017 - A | | $ | 18.73 | | | $ | (0.15 | ) | | $ | 5.37 | | | $ | 5.22 | | | $ | (0.91 | ) |
| | 2017 - C | | | 16.07 | | | | (0.25 | ) | | | 4.54 | | | | 4.29 | | | | (0.91 | ) |
| | 2017 - Institutional | | | 20.29 | | | | (0.07 | ) | | | 5.84 | | | | 5.77 | | | | (0.91 | ) |
| | 2017 - Service | | | 18.44 | | | | (0.16 | ) | | | 5.27 | | | | 5.11 | | | | (0.91 | ) |
| | 2017 - Investor(f) | | | 20.08 | | | | (0.10 | ) | | | 5.77 | | | | 5.67 | | | | (0.91 | ) |
| | 2016 - A | | | 17.93 | | | | (0.12 | )(d) | | | 2.50 | | | | 2.38 | | | | (1.58 | ) |
| | 2016 - C | | | 15.70 | | | | (0.22 | )(d) | | | 2.17 | | | | 1.95 | | | | (1.58 | ) |
| | 2016 - Institutional | | | 19.22 | | | | (0.05 | )(d) | | | 2.70 | | | | 2.65 | | | | (1.58 | ) |
| | 2016 - Service | | | 17.69 | | | | (0.14 | )(d) | | | 2.47 | | | | 2.33 | | | | (1.58 | ) |
| | 2016 - Investor(f) | | | 19.07 | | | | (0.08 | )(d) | | | 2.67 | | | | 2.59 | | | | (1.58 | ) |
| | 2015 - A | | | 18.97 | | | | (0.14 | )(e) | | | 0.57 | | | | 0.43 | | | | (1.47 | ) |
| | 2015 - C | | | 16.91 | | | | (0.24 | )(e) | | | 0.50 | | | | 0.26 | | | | (1.47 | ) |
| | 2015 - Institutional | | | 20.16 | | | | (0.07 | )(e) | | | 0.60 | | | | 0.53 | | | | (1.47 | ) |
| | 2015 - Service | | | 18.76 | | | | (0.15 | )(e) | | | 0.55 | | | | 0.40 | | | | (1.47 | ) |
| | 2015 - Investor(f) | | | 20.04 | | | | (0.10 | )(e) | | | 0.60 | | | | 0.50 | | | | (1.47 | ) |
| | 2014 - A | | | 15.20 | | | | (0.15 | ) | | | 4.16 | | | | 4.01 | | | | (0.24 | ) |
| | 2014 - C | | | 13.68 | | | | (0.25 | ) | | | 3.72 | | | | 3.47 | | | | (0.24 | ) |
| | 2014 - Institutional | | | 16.08 | | | | (0.08 | ) | | | 4.40 | | | | 4.32 | | | | (0.24 | ) |
| | 2014 - Service | | | 15.04 | | | | (0.16 | ) | | | 4.12 | | | | 3.96 | | | | (0.24 | ) |
| | 2014 - Investor(f) | | | 16.01 | | | | (0.11 | ) | | | 4.38 | | | | 4.27 | | | | (0.24 | ) |
| | 2013 - A | | | 13.62 | | | | (0.12 | ) | | | 1.70 | | | | 1.58 | | | | — | |
| | 2013 - C | | | 12.34 | | | | (0.20 | ) | | | 1.54 | | | | 1.34 | | | | — | |
| | 2013 - Institutional | | | 14.34 | | | | (0.06 | ) | | | 1.80 | | | | 1.74 | | | | — | |
| | 2013 - Service | | | 13.49 | | | | (0.13 | ) | | | 1.68 | | | | 1.55 | | | | — | |
| | 2013 - Investor(f) | | | 14.30 | | | | (0.09 | ) | | | 1.80 | | | | 1.71 | | | | — | |
| | (a) | | Calculated based on the average shares outstanding methodology. |
| | (b) | | Assumes investment at the net asset value at the beginning of the year, reinvestment of all dividends and distributions, a complete redemption of the investment at the net asset value at the end of the year and no sales or redemption charges. Total returns would be reduced if a sales or redemption charge was taken into account. Returns do not reflect the impact of taxes to shareholder relating to Fund distributions or the redemption of Fund shares. |
| | (c) | | The Fund’s portfolio turnover rate is calculated in accordance with regulatory requirements, without regard to transactions involving short term investments. If such transactions were included, the Fund’s portfolio turnover rate may be higher. |
| | (d) | | Reflects income recognized from special dividends which amounted to $0.02 per share and 0.13% of average net assets. |
| | (e) | | Reflects income recognized from special dividends which amounted to $0.02 per share and 0.10% of average net assets. |
| | (f) | | Effective before the opening of business on August 15, 2017, Class IR Shares were designated as Investor Shares. |
| | |
| 102 | | The accompanying notes are an integral part of these financial statements. |
GOLDMAN SACHS TECHNOLOGY OPPORTUNITIES FUND
| | | | | | | | | | | | | | | | | | | | | | | | | | | | | | | | | | | | | | | | |
| | | | | | | | | | | | | | | | | | | | | | | | | | | | | | | | | | |
| | | Net asset value, end
of year | | | | | Total
return(b) | | | | | Net assets,
end of
year
(in 000s) | | | | | Ratio of
net expenses
to average
net assets | | | | | Ratio of
total expenses
to average
net assets | | | | | Ratio of
net investment
income (loss)
to average
net assets | | | | | Portfolio
turnover
rate(c) | |
| | | | | | | | | | | | | | | | | | | | | | | | | | | | | | | | | | | | | | | | |
| | $ | 23.04 | | | | | | 29.17 | % | | | | $ | 268,746 | | | | | | 1.42 | % | | | | | 1.53 | % | | | | | (0.74 | )% | | | | | 19 | % |
| | | 19.45 | | | | | | 28.18 | | | | | | 50,779 | | | | | | 2.17 | | | | | | 2.28 | | | | | | (1.49 | ) | | | | | 19 | |
| | | 25.15 | | | | | | 29.66 | | | | | | 85,095 | | | | | | 1.02 | | | | | | 1.13 | | | | | | (0.34 | ) | | | | | 19 | |
| | | 22.64 | | | | | | 29.03 | | | | | | 18,919 | | | | | | 1.51 | | | | | | 1.63 | | | | | | (0.83 | ) | | | | | 19 | |
| | | 24.84 | | | | | | 29.46 | | | | | | 23,317 | | | | | | 1.16 | | | | | | 1.28 | | | | | | (0.46 | ) | | | | | 19 | |
| | | 18.73 | | | | | | 13.71 | | | | | | 233,097 | | | | | | 1.47 | | | | | | 1.55 | | | | | | (0.68 | )(d) | | | | | 22 | |
| | | 16.07 | | | | | | 12.87 | | | | | | 52,843 | | | | | | 2.22 | | | | | | 2.30 | | | | | | (1.43 | )(d) | | | | | 22 | |
| | | 20.29 | | | | | | 14.22 | | | | | | 83,746 | | | | | | 1.07 | | | | | | 1.15 | | | | | | (0.27 | )(d) | | | | | 22 | |
| | | 18.44 | | | | | | 13.61 | | | | | | 11,186 | | | | | | 1.57 | | | | | | 1.65 | | | | | | (0.79 | )(d) | | | | | 22 | |
| | | 20.08 | | | | | | 14.00 | | | | | | 6,741 | | | | | | 1.22 | | | | | | 1.30 | | | | | | (0.43 | )(d) | | | | | 22 | |
| | | 17.93 | | | | | | 2.31 | | | | | | 250,087 | | | | | | 1.48 | | | | | | 1.54 | | | | | | (0.74 | )(e) | | | | | 41 | |
| | | 15.70 | | | | | | 1.53 | | | | | | 53,556 | | | | | | 2.23 | | | | | | 2.29 | | | | | | (1.49 | )(e) | | | | | 41 | |
| | | 19.22 | | | | | | 2.68 | | | | | | 92,483 | | | | | | 1.08 | | | | | | 1.14 | | | | | | (0.33 | )(e) | | | | | 41 | |
| | | 17.69 | | | | | | 2.17 | | | | | | 10,329 | | | | | | 1.58 | | | | | | 1.64 | | | | | | (0.84 | )(e) | | | | | 41 | |
| | | 19.07 | | | | | | 2.54 | | | | | | 6,103 | | | | | | 1.23 | | | | | | 1.29 | | | | | | (0.52 | )(e) | | | | | 41 | |
| | | 18.97 | | | | | | 26.55 | | | | | | 260,982 | | | | | | 1.51 | | | | | | 1.55 | | | | | | (0.85 | ) | | | | | 39 | |
| | | 16.91 | | | | | | 25.54 | | | | | | 58,602 | | | | | | 2.26 | | | | | | 2.30 | | | | | | (1.60 | ) | | | | | 39 | |
| | | 20.16 | | | | | | 27.03 | | | | | | 99,039 | | | | | | 1.11 | | | | | | 1.15 | | | | | | (0.45 | ) | | | | | 39 | |
| | | 18.76 | | | | | | 26.49 | | | | | | 10,712 | | | | | | 1.61 | | | | | | 1.65 | | | | | | (0.96 | ) | | | | | 39 | |
| | | 20.04 | | | | | | 26.83 | | | | | | 3,228 | | | | | | 1.26 | | | | | | 1.30 | | | | | | (0.59 | ) | | | | | 39 | |
| | | 15.20 | | | | | | 11.60 | | | | | | 228,424 | | | | | | 1.50 | | | | | | 1.55 | | | | | | (0.85 | ) | | | | | 33 | |
| | | 13.68 | | | | | | 10.86 | | | | | | 50,278 | | | | | | 2.25 | | | | | | 2.30 | | | | | | (1.59 | ) | | | | | 33 | |
| | | 16.08 | | | | | | 12.13 | | | | | | 70,416 | | | | | | 1.10 | | | | | | 1.15 | | | | | | (0.43 | ) | | | | | 33 | |
| | | 15.04 | | | | | | 11.49 | | | | | | 10,167 | | | | | | 1.60 | | | | | | 1.65 | | | | | | (0.95 | ) | | | | | 33 | |
| | | 16.01 | | | | | | 11.96 | | | | | | 2,651 | | | | | | 1.25 | | | | | | 1.30 | | | | | | (0.59 | ) | | | | | 33 | |
| | |
| The accompanying notes are an integral part of these financial statements. | | 103 |
GOLDMAN SACHS FUNDAMENTAL EQUITY GROWTH FUNDS
Notes to Financial Statements
August 31, 2017
Goldman Sachs Trust (the “Trust”) is a Delaware statutory trust registered under the Investment Company Act of 1940, as amended (the “Act”), as an open-end management investment company. The following table lists those series of the Trust that are included in this report (collectively, the “Funds” or individually a “Fund”), along with their corresponding share classes and respective diversification status under the Act:
| | | | |
| Fund | | Share Classes Offered | | Diversified/ Non-diversified |
Capital Growth, Growth Opportunities, Small/Mid Cap Growth and Strategic Growth | | A, C, Institutional, Service, Investor, R and R6 | | Diversified |
Concentrated Growth, Dynamic U.S. Equity and Flexible Cap* | | A, C, Institutional, Investor, R and R6 | | Diversified |
Technology Opportunities | | A, C, Institutional, Service and Investor | | Diversified |
| * | | Formerly known as Goldman Sachs Flexible Cap Growth Fund. Effective August 31, 2017, the Fund changed its name to the Goldman Sachs Flexible Cap Fund. |
Class A Shares are sold with a front-end sales charge of up to 5.50%. Class C Shares are sold with a contingent deferred sales charge (“CDSC”) of 1.00%, which is imposed on redemptions made within 12 months of purchase. Institutional, Service, Investor, Class R and Class R6 Shares are not subject to a sales charge. Previously, Investor Shares were known as Class IR Shares.
Goldman Sachs Asset Management, L.P. (“GSAM”), an affiliate of Goldman Sachs & Co. LLC (formerly, Goldman, Sachs & Co.) (“Goldman Sachs”), serves as investment adviser to the Funds pursuant to a management agreement (the “Agreement”) with the Trust.
Pursuant to an Agreement and Plan of Reorganization (the “Reorganization Agreement”) approved by the Trust’s Board of Trustees, all of the assets and liabilities of the Goldman Sachs Focused Growth Fund (the “Acquired Fund”) were transferred to the Goldman Sachs Concentrated Growth Fund (the “Survivor Fund”) as of the close of business on July 28, 2017. (the “Reorganization”). As part of the Reorganization, holders of the Acquired Fund’s Class A, Class C, Institutional, Investor and Class R received the Survivor Fund’s Class A, Class C, Institutional, Investor and Class R shares, respectively in an amount equal to the aggregate net asset value of their investment in the Acquired Fund. The exchange was a tax-free event to shareholders.
|
| 2. SIGNIFICANT ACCOUNTING POLICIES |
The financial statements have been prepared in accordance with accounting principles generally accepted in the United States of America (“GAAP”) and require management to make estimates and assumptions that may affect the reported amounts and disclosures. Actual results may differ from those estimates and assumptions.
A. Investment Valuation — The Funds’ valuation policy is to value investments at fair value.
B. Investment Income and Investments — Investment income includes interest income, dividend income and securities lending income. Interest income is accrued daily and adjusted for amortization of premiums and accretion of discounts. Dividend income is recognized on ex-dividend date or, for certain foreign securities, as soon as such information is obtained subsequent to the ex-dividend date. Investment transactions are reflected on trade date. Realized gains and losses are calculated using identified cost. Investment transactions are recorded on the following business day for daily net asset value (“NAV”) calculations. Investment income is recorded net of any foreign withholding taxes, less any amounts reclaimable. The Funds may file withholding tax reclaims in certain jurisdictions to recover a portion of amounts previously withheld. Any foreign capital gains tax is accrued daily based upon net unrealized gains, and is payable upon sale of such investments. Distributions received from the
104
GOLDMAN SACHS FUNDAMENTAL EQUITY GROWTH FUNDS
|
| 2. SIGNIFICANT ACCOUNTING POLICIES (continued) |
Funds’ investments in U.S. real estate investment trusts (“REITs”) may be characterized as ordinary income, net capital gain or a return of capital. A return of capital is recorded by the Funds as a reduction to the cost basis of the REIT.
C. Class Allocations and Expenses — Investment income, realized and unrealized gain (loss), if any, and non-class specific expenses of each Fund are allocated daily based upon the proportion of net assets of each class. Non-class specific expenses directly incurred by a Fund are charged to that Fund, while such expenses incurred by the Trust are allocated across the applicable Funds on a straight-line and/or pro-rata basis depending upon the nature of the expenses. Class specific expenses, where applicable, are borne by the respective share classes and include Distribution and Service, Transfer Agency and Service and Shareholder Administration fees.
D. Federal Taxes and Distributions to Shareholders — It is each Fund’s policy to comply with the requirements of the Internal Revenue Code of 1986, as amended (the “Code”), applicable to regulated investment companies (mutual funds) and to distribute each year substantially all of its investment company taxable income and capital gains to its shareholders. Accordingly, each Fund is not required to make any provisions for the payment of federal income tax. Distributions to shareholders are recorded on the ex-dividend date. Income and capital gains distributions, if any, are declared and paid annually.
Net capital losses, if any, are carried forward to future fiscal years and may be used to the extent allowed by the Code to offset any future capital gains. Losses that are carried forward will retain their character as either short-term or long-term capital losses. Utilization of capital loss carryforwards will reduce the requirement of future capital gains distributions.
The characterization of distributions to shareholders for financial reporting purposes is determined in accordance with federal income tax rules, which may differ from GAAP. The source of each Fund’s distributions may be shown in the accompanying financial statements as either from net investment income, net realized gain or capital. Certain components of the Funds’ net assets on the Statements of Assets and Liabilities reflect permanent GAAP/tax differences based on the appropriate tax character.
E. Commission Recapture — GSAM, on behalf of certain Funds, may direct portfolio trades, subject to seeking best execution, to various brokers who have agreed to rebate a portion of the commissions generated. Such rebates are made directly to a Fund as cash payments and are included in net realized gain (loss) from investments on the Statements of Operations.
| | |
| 3. INVESTMENTS AND FAIR VALUE MEASUREMENTS | | |
U.S. GAAP defines the fair value of a financial instrument as the amount that would be received to sell an asset or paid to transfer a liability in an orderly transaction between market participants at the measurement date (i.e., the exit price); the Funds’policy is to use the market approach. GAAP establishes a fair value hierarchy that prioritizes the inputs to valuation techniques used to measure fair value. The hierarchy gives the highest priority to unadjusted quoted prices in active markets for identical assets or liabilities (Level 1 measurements) and the lowest priority to unobservable inputs (Level 3 measurements). The levels used for classifying investments are not necessarily an indication of the risk associated with investing in these investments. The three levels of the fair value hierarchy are described below:
Level 1 — Unadjusted quoted prices in active markets that are accessible at the measurement date for identical, unrestricted assets or liabilities;
Level 2 — Quoted prices in markets that are not active or financial instruments for which significant inputs are observable (including, but not limited to, quoted prices for similar investments, interest rates, foreign exchange rates, volatility and credit spreads), either directly or indirectly;
Level 3 — Prices or valuations that require significant unobservable inputs (including GSAM’s assumptions in determining fair value measurement).
Changes in valuation techniques may result in transfers into or out of an assigned level within the hierarchy. In accordance with the Funds’ policy, transfers between different levels of the fair value hierarchy resulting from such changes are deemed to have occurred as of the beginning of the reporting period.
105
GOLDMAN SACHS FUNDAMENTAL EQUITY GROWTH FUNDS
Notes to Financial Statements (continued)
August 31, 2017
|
| 3. INVESTMENTS AND FAIR VALUE MEASUREMENTS (continued) |
The Board of Trustees (“Trustees”) has approved Valuation Procedures that govern the valuation of the portfolio investments held by the Funds, including investments for which market quotations are not readily available. The Trustees have delegated to GSAM day-to-day responsibility for implementing and maintaining internal controls and procedures related to the valuation of the Funds’ investments. To assess the continuing appropriateness of pricing sources and methodologies, GSAM regularly performs price verification procedures and issues challenges as necessary to third party pricing vendors or brokers, and any differences are reviewed in accordance with the Valuation Procedures.
A. Level 1 and Level 2 Fair Value Investments — The valuation techniques and significant inputs used in determining the fair values for investments classified as Level 1 and Level 2 are as follows:
Equity Securities — Equity securities traded on a United States (“U.S.”) securities exchange or the NASDAQ system, or those located on certain foreign exchanges, including but not limited to the Americas, are valued daily at their last sale price or official closing price on the principal exchange or system on which they are traded. If there is no sale or official closing price or such price is believed by GSAM to not represent fair value, equity securities are valued at the last bid price for long positions and at the last ask price for short positions. To the extent these investments are actively traded, they are classified as Level 1 of the fair value hierarchy, otherwise they are generally classified as Level 2.
Unlisted equity securities for which market quotations are available are valued at the last sale price on the valuation date, or if no sale occurs, at the last bid price. Securities traded on certain foreign securities exchanges are valued daily at fair value determined by an independent fair value service (if available) under Valuation Procedures approved by the Trustees and consistent with applicable regulatory guidance. The independent fair value service takes into account multiple factors including, but not limited to, movements in the securities markets, certain depositary receipts, futures contracts and foreign currency exchange rates that have occurred subsequent to the close of the foreign securities exchange. These investments are generally classified as Level 2 of the fair value hierarchy.
Money Market Funds — Investments in the Goldman Sachs Financial Square Government Fund (“Underlying Fund”) are valued at the NAV of the Institutional Share class on the day of valuation. These investments are generally classified as Level 1 of the fair value hierarchy. For information regarding an Underlying Fund’s accounting policies and investment holdings, please see the Underlying Fund’s shareholder report.
Short Term Investments — Short-term investments having a maturity of 60 days or less are valued using available market quotations as provided by a third party pricing vendor or broker. These investments are classified as Level 2 of the fair value hierarchy.
i. Repurchase Agreements — Repurchase agreements involve the purchase of securities subject to the seller’s agreement to repurchase the securities at a mutually agreed upon date and price, under the terms of a Master Repurchase Agreement (“MRA”). During the term of a repurchase agreement, the value of the underlying securities held as collateral on behalf of a Fund, including accrued interest, is required to exceed the value of the repurchase agreement, including accrued interest. The gross value of repurchase agreements is included in the Statements of Assets and Liabilities for financial reporting purposes. The underlying securities for all repurchase agreements are held at the Funds’ custodian or designated sub-custodians under tri-party repurchase agreements.
An MRA governs transactions between a Fund and select counterparties. An MRA contains provisions for, among other things, initiation of the transaction, income payments, events of default and maintenance of securities for repurchase agreements. An MRA also permits offsetting with collateral to create one single net payment in the event of default or similar events, including the bankruptcy or insolvency of a counterparty.
If the seller defaults, a Fund could suffer a loss to the extent that the proceeds from the sale of the underlying securities and other collateral held by the Fund are less than the repurchase price and the Fund’s costs associated with delay and enforcement of the repurchase agreement. In addition, in the event of default or insolvency of the seller, a court could determine that a Fund’s interest in the collateral is not enforceable, resulting in additional losses to the Fund.
Pursuant to exemptive relief granted by the Securities and Exchange Commission (“SEC”) and terms and conditions contained therein, the Funds, together with other funds of the Trust and registered investment companies having management
106
GOLDMAN SACHS FUNDAMENTAL EQUITY GROWTH FUNDS
|
| 3. INVESTMENTS AND FAIR VALUE MEASUREMENTS (continued) |
agreements with GSAM or its affiliates, may transfer uninvested cash into joint accounts, the daily aggregate balance of which is invested in one or more repurchase agreements. Under these joint accounts, the Funds maintain pro-rata credit exposure to the underlying repurchase agreements’ counterparties. With the exception of certain transaction fees, the Funds are not subject to any expenses in relation to these investments.
B. Level 3 Fair Value Investments — To the extent that significant inputs to valuation models and other alternative pricing sources are unobservable, or if quotations are not readily available, or if GSAM believes that such quotations do not accurately reflect fair value, the fair value of a Fund’s investments may be determined under Valuation Procedures approved by the Trustees. GSAM, consistent with its procedures and applicable regulatory guidance, may make an adjustment to the most recent valuation prices of either domestic or foreign securities in light of significant events to reflect what it believes to be the fair value of the securities at the time of determining a Fund’s NAV. Significant events which could affect a large number of securities in a particular market may include, but are not limited to: significant fluctuations in U.S. or foreign markets; market dislocations; market disruptions; or unscheduled market closings. Significant events which could also affect a single issuer may include, but are not limited to: corporate actions such as reorganizations, mergers and buy-outs; ratings downgrades; and bankruptcies.
C. Fair Value Hierarchy — The following is a summary of the Funds’ investments classified in the fair value hierarchy as of August 31, 2017:
| | | | | | | | | | | | |
|
| CAPITAL GROWTH | |
| | | |
| Investment Type | | Level 1 | | | Level 2 | | | Level 3 | |
| Assets | | | | | | | | | | | | |
Common Stock and/or Other Equity Investments(a) | | | | | | | | | | | | |
Europe | | $ | 12,664,612 | | | $ | — | | | $ | — | |
North America | | | 898,824,350 | | | | — | | | | — | |
Investment Company | | | 2,846,511 | | | | — | | | | — | |
Securities Lending Reinvestment Vehicle | | | 381,393 | | | | — | | | | — | |
| Total | | $ | 914,716,866 | | | $ | — | | | $ | — | |
| | | |
| CONCENTRATED GROWTH | | | | | | | | | | | | |
| | | |
| Investment Type | | Level 1 | | | Level 2 | | | Level 3 | |
| Assets | | | | | | | | | | | | |
Common Stock and/or Other Equity Investments(a) | | | | | | | | | | | | |
North America | | $ | 150,528,931 | | | $ | — | | | $ | — | |
Investment Company | | | 84 | | | | — | | | | — | |
| Total | | $ | 150,529,015 | | | $ | — | | | $ | — | |
| | | |
| DYNAMIC U.S. EQUITY | | | | | | | | | | | | |
| | | |
| Investment Type | | Level 1 | | | Level 2 | | | Level 3 | |
| Assets | | | | | | | | | | | | |
Common Stock and/or Other Equity Investments(a) | | | | | | | | | | | | |
North America | | $ | 5,515,865 | | | $ | — | | | $ | — | |
Investment Company | | | 218,033 | | | | — | | | | — | |
| Total | | $ | 5,733,898 | | | $ | — | | | $ | — | |
107
GOLDMAN SACHS FUNDAMENTAL EQUITY GROWTH FUNDS
Notes to Financial Statements (continued)
August 31, 2017
|
| 3. INVESTMENTS AND FAIR VALUE MEASUREMENTS (continued) |
| | | | | | | | | | | | |
| | | |
| FLEXIBLE CAP | | | | | | | | | | | | |
| | | |
| Investment Type | | Level 1 | | | Level 2 | | | Level 3 | |
| Assets | | | | | | | | | | | | |
Common Stock and/or Other Equity Investments(a) | | | | | | | | | | | | |
Europe | | $ | 208,752 | | | $ | — | | | $ | — | |
North America | | | 17,651,013 | | | | — | | | | — | |
Investment Company | | | 619,814 | | | | — | | | | — | |
Securities Lending Reinvestment Vehicle | | | 323,320 | | | | — | | | | — | |
| Total | | $ | 18,802,899 | | | $ | — | | | $ | — | |
| | | |
| GROWTH OPPORTUNITIES | | | | | | | | | | | | |
| | | |
| Investment Type | | Level 1 | | | Level 2 | | | Level 3 | |
| Assets | | | | | | | | | | | | |
Common Stock and/or Other Equity Investments(a) | | | | | | | | | | | | |
Europe | | $ | 41,702,154 | | | $ | — | | | $ | — | |
North America | | | 2,510,025,179 | | | | — | | | | — | |
Investment Company | | | 7,868,408 | | | | — | | | | — | |
| Total | | $ | 2,559,595,741 | | | $ | — | | | $ | — | |
| | | |
| SMALL/MID CAP GROWTH | | | | | | | | | | | | |
| | | |
| Investment Type | | Level 1 | | | Level 2 | | | Level 3 | |
| Assets | | | | | | | | | | | | |
Common Stock and/or Other Equity Investments(a) | | | | | | | | | | | | |
Asia | | $ | 16,714,143 | | | $ | — | | | $ | — | |
Europe | | | 76,422,971 | | | | — | | | | — | |
North America | | | 2,073,465,367 | | | | — | | | | — | |
Investment Company | | | 24,263,812 | | | | — | | | | — | |
Securities Lending Reinvestment Vehicle | | | 17,851,259 | | | | — | | | | — | |
| Total | | $ | 2,208,717,552 | | | $ | — | | | $ | — | |
| | | |
| STRATEGIC GROWTH | | | | | | | | | | | | |
| | | |
| Investment Type | | Level 1 | | | Level 2 | | | Level 3 | |
| Assets | | | | | | | | | | | | |
Common Stock and/or Other Equity Investments(a) | | | | | | | | | | | | |
Europe | | $ | 4,448,748 | | | $ | — | | | $ | — | |
North America | | | 262,204,947 | | | | — | | | | — | |
Investment Company | | | 58 | | | | — | | | | — | |
| Total | | $ | 266,653,753 | | | $ | — | | | $ | — | |
108
GOLDMAN SACHS FUNDAMENTAL EQUITY GROWTH FUNDS
|
| 3. INVESTMENTS AND FAIR VALUE MEASUREMENTS (continued) |
| | | | | | | | | | | | |
| | | |
| TECHNOLOGY OPPORTUNITIES | | | | | | | | | | | | |
| | | |
| Investment Type | | Level 1 | | | Level 2 | | | Level 3 | |
| Assets | | | | | | | | | | | | |
Common Stock and/or Other Equity Investments(a) | | | | | | | | | | | | |
Europe | | $ | 8,964,905 | | | $ | — | | | $ | — | |
North America | | | 436,372,956 | | | | — | | | | — | |
Investment Company | | | 15 | | | | — | | | | — | |
Securities Lending Reinvestment Vehicle | | | 2,637,072 | | | | — | | | | — | |
| Total | | $ | 447,974,948 | | | $ | — | | | $ | — | |
| (a) | | Amounts are disclosed by continent to highlight the impact of time zone differences between local market close and the calculation of net asset value. Security valuations are based on the principal exchange or system on which they are traded, which may differ from country of domicile noted in the table. The Funds utilize fair value model prices provided by an independent fair value service for international equity securities, resulting in a Level 2 classification. |
For further information regarding security characteristics, see the Schedules of Investments.
|
| 4. AGREEMENTS AND AFFILIATED TRANSACTIONS |
A. Management Agreement — Under the Agreement, GSAM manages the Funds, subject to the general supervision of the Trustees.
As compensation for the services rendered pursuant to the Agreement, the assumption of the expenses related thereto and administration of the Funds’ business affairs, including providing facilities, GSAM is entitled to a management fee, accrued daily and paid monthly, equal to an annual percentage rate of each Fund’s average daily net assets.
For the fiscal year ended August 31, 2017 , contractual and effective net management fees with GSAM were at the following rates:
| | | | | | | | | | | | | | | | | | | | | | | | | | | | | | |
| | | | | Contractual Management Rate | | | Effective Net
Management
Rate | |
| Fund | | | | First
$1 billion | | | Next
$1 billion | | | Next
$3 billion | | | Next
$3 billion | | | Over
$8 billion | | | Effective
Rate | | |
Capital Growth | | | | | 1.00 | % | | | 0.90 | % | | | 0.80 | % | | | 0.80 | % | | | 0.80 | % | | | 1.00 | % | | | 0.71 | %# |
Concentrated Growth* | | | | | 1.00 | | | | 0.90 | | | | 0.86 | | | | 0.84 | | | | 0.82 | | | | 1.00 | | | | 0.78 | # |
Dynamic U.S. Equity | | | | | 0.70 | | | | 0.63 | | | | 0.60 | | | | 0.59 | | | | 0.58 | | | | 0.70 | | | | 0.70 | # |
Flexible Cap | | | | | 1.00 | | | | 0.90 | | | | 0.86 | | | | 0.84 | | | | 0.82 | | | | 1.00 | | | | 0.78 | # |
Growth Opportunities | | | | | 1.00 | | | | 1.00 | | | | 0.90 | | | | 0.86 | | | | 0.84 | | | | 0.97 | | | | 0.90 | # |
Small/Mid Cap Growth | | | | | 1.00 | | | | 1.00 | | | | 0.90 | | | | 0.86 | | | | 0.84 | | | | 0.98 | | | | 0.85 | # |
Strategic Growth | | | | | 1.00 | | | | 0.90 | | | | 0.86 | | | | 0.84 | | | | 0.82 | | | | 1.00 | | | | 0.71 | # |
Technology Opportunities | | | | | 1.00 | | | | 0.90 | | | | 0.86 | | | | 0.84 | | | | 0.82 | | | | 1.00 | | | | 0.97 | #^ |
| # | | GSAM has agreed to waive a portion of its management fee in order to achieve the net management fee rates, set forth in the Funds’ most recent prospectuses. In addition, the Effective Net Management Rate includes the impact of management fee waivers of affiliated underlying funds, if any. These waivers will be effective through at least April 28, 2018, and prior to such date GSAM may not terminate the arrangements without the approval of the Trustees. |
| * | | Following the reorganization of the Goldman Sachs Focused Growth Fund with and into the Concentrated Growth Fund, GSAM has agreed to increase the management fee waiver in place for the Concentrated Growth Fund by 0.02% in order to achieve an effective management fee rate of 0.76% as an annual percentage rate of the average daily net assets of the Concentrated Growth Fund. This arrangement will remain in effect through at least July 28, 2018, and prior to such date, GSAM may not terminate the arrangement without the approval of the Trustees. |
| ^ | | Effective December 29, 2016, GSAM elected to implement a management fee waiver of 5 basis points on management fees charged to the first $1 billion in net assets. |
109
GOLDMAN SACHS FUNDAMENTAL EQUITY GROWTH FUNDS
Notes to Financial Statements (continued)
August 31, 2017
|
| 4. AGREEMENTS AND AFFILIATED TRANSACTIONS (continued) |
The Funds invest in Institutional Shares of the Goldman Sachs Financial Square Government Fund (“Government Money Market Fund”), which is an affiliated Underlying Fund. GSAM has agreed to waive a portion of its management fee payable by the Funds in an amount equal to the management fee it earns as an investment adviser to the affiliated Underlying Fund in which the Funds invest, except those management fees it earns from the Funds’ investments of cash collateral received in connection with securities lending transactions in the Goldman Sachs Financial Square Government Fund. For the fiscal year ended August 31, 2017, the management fee waived by GSAM for each Fund was as follows:
| | | | | | |
| Fund | | | | Management Fee Waived | |
Capital Growth | | | | $ | 3,618 | |
Concentrated Growth | | | | | 759 | |
Dynamic US Equity | | | | | 123 | |
Flexible Cap | | | | | 303 | |
Growth Opportunities | | | | | 13,703 | |
Small/Mid-Cap Growth | | | | | 21,968 | |
Strategic Growth | | | | | 817 | |
Technology Opportunities | | | | | 212 | |
B. Distribution and/or Service (12b-1) Plans — The Trust, on behalf of Class A and Class R Shares of each applicable Fund, has adopted Distribution and Service Plans subject to Rule 12b-1 under the Act. Under the Distribution and Service Plans, Goldman Sachs, which serves as distributor (the “Distributor”), is entitled to a fee accrued daily and paid monthly, for distribution services and personal and account maintenance services, which may then be paid by Goldman Sachs to authorized dealers. These fees are equal to an annual percentage rate of the average daily net assets attributable to Class A or Class R Shares of the Funds, as applicable, as set forth below.
The Trust, on behalf of Class C Shares of each applicable Fund, has adopted a Distribution Plan subject to Rule 12b-1 under the Act. Under the Distribution Plan, Goldman Sachs as Distributor is entitled to a fee accrued daily and paid monthly for distribution services, which may then be paid by Goldman Sachs to authorized dealers. These fees are equal to an annual percentage rate of the average daily net assets attributable to Class C Shares of the Funds, as set forth below.
The Trust, on behalf of Service Shares of each applicable Fund, has adopted a Service Plan subject to Rule 12b-1 under the Act to allow Service Shares to compensate service organizations (including Goldman Sachs) for providing personal and account maintenance services to their customers who are beneficial owners of such shares. The Service Plan provides for compensation to the service organizations equal to an annual percentage rate of the average daily net assets attributable to Services Shares of the Funds, as set forth below.
| | | | | | | | | | | | | | | | |
| | | Distribution and Service Plan Rates | |
| | | Class A* | | | Class C | | | Class R* | | | Service | |
Distribution Plan | | | 0.25 | % | | | 0.75 | % | | | 0.50 | % | | | — | |
Service Plan | | | — | | | | — | | | | — | | | | 0.25 | % |
| * | | With respect to Class A and Class R Shares, the Distributor at its discretion may use compensation for distribution services paid under the Distribution Plan to compensate service organizations for personal and account maintenance services and expenses as long as such total compensation does not exceed the maximum cap on “service fees” imposed by the Financial Industry Regulatory Authority. |
110
GOLDMAN SACHS FUNDAMENTAL EQUITY GROWTH FUNDS
|
| 4. AGREEMENTS AND AFFILIATED TRANSACTIONS (continued) |
C. Distribution Agreement — Goldman Sachs, as Distributor of the shares of the Funds pursuant to a Distribution Agreement, may retain a portion of the Class A Shares’ front end sales charge and Class C Shares’ CDSC. During the fiscal year ended August 31, 2017, Goldman Sachs advised that it retained the following amounts:
| | | | | | | | | | |
| | | | | Front End
Sales Charge | | | Contingent Deferred
Sales Charge | |
| Fund | | | | Class A | | | Class C | |
Capital Growth | | | | $ | 16,006 | | | $ | 2,321 | |
Concentrated Growth | | | | | 1,471 | | | | — | |
Dynamic U.S. Equity | | | | | 741 | | | | — | |
Flexible Cap | | | | | 2,447 | | | | — | |
Growth Opportunities | | | | | 14,106 | | | | 753 | |
Small/Mid Cap Growth | | | | | 55,773 | | | | — | |
Strategic Growth | | | | | 5,701 | | | | — | |
Technology Opportunities | | | | | 17,199 | | | | 671 | |
D. Service and/or Shareholder Administration Plans — The Trust, on behalf of each applicable Fund, has adopted Service and/or Shareholder Administration Plans to allow Class C and Service Shares, respectively, to compensate service organizations (including Goldman Sachs) for providing varying levels of personal and account maintenance and/or shareholder administration services to their customers who are beneficial owners of such shares. The Service and/or Shareholder Administration Plans each provide for compensation to the service organizations equal to an annual percentage rate of 0.25% of the average daily net assets attributable to Class C or Service Shares of the Funds.
E. Transfer Agency Agreement — Goldman Sachs also serves as the transfer agent of the Funds for a fee pursuant to the Transfer Agency Agreement. The fees charged for such transfer agency services are accrued daily and paid monthly at annual rates as follows: 0.18% of the average daily net assets of Class A, Class C, Investor and Class R Shares; 0.03% of the average daily net assets of Class R6 Shares; and 0.04% of the average daily net assets of Institutional and Service Shares. Prior to July 28, 2017, Goldman Sachs charged transfer agency fees at the rates of 0.19% of the average daily net assets of Class A, Class C, Investor and Class R Shares and 0.02% of the average daily net assets of Class R6 Shares.
Goldman Sachs has agreed to waive a portion of its transfer agency fee equal to 0.05% as an annual percentage rate of the average daily net assets attributable to Class A, Class C, Investor, and Class R Shares of the Growth Opportunities Fund. This arrangement will remain in effect through at least April 28, 2018, and prior to such date, the Investment Adviser may not terminate the arrangement without the approval of the Board of Trustees.
Goldman Sachs has agreed to waive a portion of its transfer agency fee equal to 0.03% as an annual percentage rate of the average daily net assets attributable to Class A, Class C, Investor, and Class R Shares of the Concentrated Growth, Dynamic U.S. Equity, Flexible Cap and Small/Mid Cap Growth Funds. This waiver was effective on December 29, 2016 for the Concentrated Growth, Dynamic U.S. Equity, and Flexible Cap Funds. This arrangement will remain in effect through at least April 28, 2018, and prior to such date, the Investment Adviser may not terminate the arrangement without the approval of the Board of Trustees.
111
GOLDMAN SACHS FUNDAMENTAL EQUITY GROWTH FUNDS
Notes to Financial Statements (continued)
August 31, 2017
|
| 4. AGREEMENTS AND AFFILIATED TRANSACTIONS (continued) |
F. Other Expense Agreements and Affiliated Transactions — GSAM has agreed to limit certain “Other Expenses” of the Funds (excluding acquired fund fees and expenses, transfer agency fees and expenses, service fees and shareholder administration fees (as applicable), taxes, interest, brokerage fees, expenses of shareholder meetings, litigation and indemnification and extraordinary expenses) to the extent such expenses exceed, on an annual basis, a percentage rate of the average daily net assets of each Fund. Such Other Expense reimbursements, if any, are accrued daily and paid monthly. In addition, the Funds are not obligated to reimburse GSAM for prior fiscal year expense reimbursements, if any. The Other Expense limitations as an annual percentage rate of average daily net assets for Capital Growth, Concentrated Growth, Dynamic U.S. Equity, Flexible Cap, Growth Opportunities, Small/Mid Cap Growth, Strategic Growth, and Technology Opportunities Funds are 0.004%, 0.004%, 0.084%, 0.004%, 0.014%, 0.064%, 0.004%, and 0.004%, respectively. Prior to December 29, 2016, the Other Expense limitation for Technology Opportunities Fund was 0.034%. These Other Expense limitations will remain in place through at least April 28, 2018, and prior to such date GSAM may not terminate the arrangements without the approval of the Trustees. In addition, the Funds have entered into certain offset arrangements with the transfer agent, which may result in a reduction of the Funds’ expenses and are received irrespective of the application of the “Other Expense” limitations described above.
For the fiscal year ended August 31, 2017, these expense reductions, including any fee waivers and Other Expense reimbursements, were as follows:
| | | | | | | | | | | | | | | | | | |
| Fund | | | | Management
Fee Waiver | | | Transfer Agency
Fee Waiver | | | Other
Expense
Reimbursements | | | Total
Expense
Reductions | |
Capital Growth | | | | $ | 2,507,216 | | | $ | 260 | | | $ | 580,946 | | | $ | 3,088,422 | |
Concentrated Growth | | | | | 296,696 | | | | 1,697 | | | | 286,903 | | | | 585,296 | |
Dynamic U.S. Equity | | | | | 123 | | | | 489 | | | | 247,262 | | | | 247,874 | |
Flexible Cap | | | | | 38,219 | | | | 1,465 | | | | 271,880 | | | | 311,564 | |
Growth Opportunities | | | | | 2,013,702 | | | | 416,151 | | | | 223,615 | | | | 2,653,468 | |
Small/Mid Cap Growth | | | | | 3,174,537 | | | | 341,559 | | | | — | | | | 3,516,096 | |
Strategic Growth | | | | | 903,127 | | | | 19 | | | | 316,421 | | | | 1,219,567 | |
Technology Opportunities | | | | | 140,004 | | | | 100 | | | | 309,282 | | | | 449,386 | |
G. Line of Credit Facility — As of August 31, 2017, the Funds participated in a $1,100,000,000 committed, unsecured revolving line of credit facility (the “facility”) together with other funds of the Trust and certain registered investment companies having management agreements with GSAM or its affiliates. This facility is to be used for temporary emergency purposes, or to allow for an orderly liquidation of securities to meet redemption requests. The interest rate on borrowings is based on the federal funds rate. The facility also requires a fee to be paid by the Funds based on the amount of the commitment that has not been utilized. For the fiscal year ended August 31, 2017, the Funds did not have any borrowings under the facility.
H. Other Transactions with Affiliates — For the fiscal year ended August 31, 2017, Goldman Sachs did not earn any brokerage commissions from portfolio transactions, on behalf of the Funds.
112
GOLDMAN SACHS FUNDAMENTAL EQUITY GROWTH FUNDS
|
| 4. AGREEMENTS AND AFFILIATED TRANSACTIONS (continued) |
An investment by a Fund representing greater than 5% of the voting securities of an issuer makes that issuer an affiliated person (as defined by the Act) of such Fund. The following table provides information about the investment by the Small/Mid Cap Growth Fund in shares of issuers of which the Fund is an affiliate for the fiscal year ended August 31, 2017:
| | | | | | | | | | | | | | | | | | | | | | | | | | | | | | |
| Name of Affiliated Issuer* | | Beginning
Value
as of
August 31, 2016 | | Purchases
at Cost | | | Proceeds
from Sales | | | Net Realized
Gain (Loss)
on sales of
Affiliated
Issuer | | | Net Change in
Unrealized
Appreciation
(Depreciation) | | | Ending Value
as of
August 31, 2017 | | | Shares as of
August 31, 2017 | | | Dividend
Income | |
Corium International, Inc. | | 9,218,322 | | | — | | | | (4,768,704 | ) | | | (8,232,070 | ) | | | 3,782,452 | | | | — | | | | — | | | | — | |
| M/I Homes, Inc | | 28,904,359 | | | 4,095,361 | | | | (16,300,905 | ) | | | 3,155,266 | | | | (435,456 | ) | | | 19,418,625 | | | | 789,375 | | | | — | |
| * | | Security was no longer affiliated as of August 31, 2017. |
The table below shows the transactions in and earnings from investments in the Goldman Sachs Financial Square Government Fund — Institutional Shares for the fiscal year ended August 31, 2017:
| | | | | | | | | | | | | | | | | | | | | | | | |
| Fund | | Market
Value
as of
August 31, 2016 | | | Purchases
at Cost | | | Proceeds
from Sales | | | Market Value
as of
August 31, 2017 | | | Shares as of
August 31, 2017 | | | Dividend
Income | |
Capital Growth | | $ | 7,550,880 | | | $ | 27,719,008 | | | | (32,423,377 | ) | | $ | 2,846,511 | | | | 2,846,511 | | | $ | 8,537 | |
Concentrated Growth | | | — | | | | 22,760,303 | | | | (22,760,219 | ) | | | 84 | | | | 84 | | | | 2,004 | |
Dynamic U.S. Equity | | | — | | | | 3,586,400 | | | | (3,368,367 | ) | | | 218,033 | | | | 218,033 | | | | 503 | |
Flexible Cap | | | — | | | | 4,015,562 | | | | (3,395,748 | ) | | | 619,814 | | | | 619,814 | | | | 1,439 | |
Growth Opportunities | | | 651 | | | | 586,502,914 | | | | (578,635,157 | ) | | | 7,868,408 | | | | 7,868,408 | | | | 42,985 | |
Small/Mid Cap Growth | | | — | | | | 574,283,005 | | | | (550,019,193 | ) | | | 24,263,812 | | | | 24,263,812 | | | | 97,325 | |
Strategic Growth | | | — | | | | 28,526,927 | | | | (28,526,869 | ) | | | 58 | | | | 58 | | | | 1,970 | |
Technology Opportunities | | | — | | | | 10,634,365 | | | | (10,634,350 | ) | | | 15 | | | | 15 | | | | 715 | |
As of August 31, 2017, The Goldman Sachs Group, Inc. was the beneficial owner of 5% or more of outstanding Class C, Institutional, Investor, Class R and Class R6 Shares of the following funds:
| | | | | | | | | | | | | | | | | | | | |
| Fund | | Class C | | | Institutional | | | Investor | | | Class R | | | Class R6 | |
Capital Growth | | | — | % | | | — | % | | | — | % | | | — | % | | | 75 | % |
Concentrated Growth | | | — | | | | — | | | | — | | | | 72 | | | | 17 | |
Dynamic U.S. Equity | | | 12 | | | | 24 | | | | 12 | | | | 100 | | | | 100 | |
Flexible Cap | | | — | | | | — | | | | 7 | | | | 60 | | | | 100 | |
Strategic Growth | | | — | | | | — | | | | — | | | | — | | | | 100 | |
113
GOLDMAN SACHS FUNDAMENTAL EQUITY GROWTH FUNDS
Notes to Financial Statements (continued)
August 31, 2017
|
| 5. PORTFOLIO SECURITIES TRANSACTIONS |
The cost of purchases and proceeds from sales and maturities of long-term securities for the fiscal year ended August 31, 2017, were as follows:
| | | | | | | | | | |
| Fund | | | | Purchases | | | Sales and Maturities | |
Capital Growth | | | | $ | 411,603,919 | | | $ | 507,189,764 | |
Concentrated Growth | | | | | 72,489,279 | | | | 100,927,577 | |
Dynamic U.S. Equity | | | | | 5,304,821 | | | | 7,974,943 | |
Flexible Cap | | | | | 7,933,309 | | | | 9,924,310 | |
Growth Opportunities | | | | | 1,729,195,749 | | | | 2,694,305,460 | |
Small/Mid Cap Growth | | | | | 1,373,216,754 | | | | 2,076,353,959 | |
Strategic Growth | | | | | 163,216,020 | | | | 297,250,521 | |
Technology Opportunities | | | | | 76,265,721 | | | | 112,727,797 | |
The Funds may lend their securities through a securities lending agent, the Bank of New York Mellon (“BNYM”), to certain qualified borrowers. In accordance with the Funds’ securities lending procedures, the Funds receive cash and/or U.S. Treasury securities collateral at least equal to the market value of the securities on loan. The market value of the loaned securities is determined at the close of business of the Funds at their last sale price or official closing price on the principal exchange or system on which they are traded, and any additional required collateral is delivered to the Funds on the next business day. As with other extensions of credit, the Funds may experience delay in the recovery of their securities or incur a loss should the borrower of the securities breach its agreement with the Funds or become insolvent at a time when the collateral is insufficient to cover the cost of repurchasing securities on loan. Dividend income received from securities on loan may not be subject to withholding taxes and therefore withholding taxes paid may differ from the amounts listed in the Statements of Operations. Loans of securities are terminable at any time and as such 1) the remaining contractual maturities of the outstanding securities lending transactions are considered to be overnight and continuous and 2) the borrower, after notice, is required to return borrowed securities within the standard time period for settlement of securities transactions.
The Capital Growth, Flexible Cap, Growth Opportunities, Small/Mid Cap Growth, Strategic Growth, and Technology Opportunities Funds invest the cash collateral received in connection with securities lending transactions in the Government Money Market Fund, an affiliated series of the Trust. The Government Money Market Fund is registered under the Act as an open end investment company, is subject to Rule 2a-7 under the Act, and is managed by GSAM, for which GSAM may receive a management fee of up to 0.205% on an annualized basis of the average daily net assets of the Government Money Market Fund.
In the event of a default by a borrower with respect to any loan, BNYM may exercise any and all remedies provided under the applicable borrower agreement to make the Funds whole. These remedies include purchasing replacement securities by applying the collateral held from the defaulting broker against the purchase cost of the replacement securities. If BNYM is unable to purchase replacement securities, BNYM will indemnify the Funds by paying the Funds an amount equal to the market value of the securities loaned minus the value of cash and/or U.S. Treasury securities collateral received from the borrower for the loan, subject to an exclusion for any shortfalls resulting from a loss of value in such cash and/or U.S. Treasury securities collateral due to reinvestment risk. The Funds’ loaned securities were all subject to enforceable Securities Lending Agreements and the value of the collateral is at least equal to the value of the cash and/or U.S. Treasury securities received. The amounts of the Funds’ overnight and continuous agreements which represent the gross amounts of recognized liabilities for securities lending transactions outstanding as of August 31, 2017 are disclosed as “Payable upon return of securities loaned” on the Statements of Assets and Liabilities.
114
GOLDMAN SACHS FUNDAMENTAL EQUITY GROWTH FUNDS
|
| 6. SECURITIES LENDING (continued) |
Each of the Funds and BNYM received compensation relating to the lending of the Funds’ securities. The amounts earned, if any, by the Funds for the Fiscal year ended August 31, 2017, are reported under Investment Income on the Statements of Operations.
The following table provides information about the Funds’ investments in the Goldman Sachs Financial Square Government Fund For the fiscal year ended August 31, 2017:
| | | | | | | | | | | | | | | | | | | | | | | | |
| Fund | | Beginning Value as of 31-Oct-16 | | | Purchases at Cost | | | Proceeds From Sales | | | Ending value as of 31-Aug-17 | | | Shares of 31-Aug-17 | | | Dividend
Income | |
Capital Growth | | $ | — | | | $ | 39,395,983 | | | $ | 39,014,589 | | | $ | 381,393 | | | | 381,393 | | | $ | 83,726 | |
Flexible Cap | | | — | | | | 3,200,968 | | | | 2,877,648 | | | | 323,320 | | | | 323,320 | | | | 3,567 | |
Growth Opportunities | | | — | | | | 195,858,034 | | | | 195,858,034 | | | | — | | | | — | | | | 719,719 | |
Small/Mid Cap Growth | | | — | | | | 462,450,213 | | | | 444,598,954 | | | | 17,851,259 | | | | 17,851,259 | | | | 572,339 | |
Strategic Growth | | | — | | | | 16,589,199 | | | | 16,589,199 | | | | — | | | | — | | | | 41,646 | |
Technology Opportunities | | | — | | | | 29,803,303 | | | | 27,166,232 | | | | 2,637,071 | | | | 2,637,071 | | | | 49,154 | |
The tax character of distributions paid during the fiscal year ended August 31, 2017 was as follows:
| | | | | | | | | | | | | | | | | | | | | | | | | | | | | | | | |
| | | Capital
Growth | | | Concentrated
Growth | | | Dynamic
U.S. Equity | | | Flexible Cap | | | Growth
Opportunities | | | Small/Mid Cap
Growth | | | Strategic
Growth | | | Technology
Opportunities | |
Distribution paid from: | | | | | | | | | | | | | | | | | | | | | | | | | | | | | | | | |
Ordinary income | | $ | 970,070 | | | $ | 764,904 | | | $ | 69,540 | | | $ | — | | | $ | — | | | $ | — | | | $ | 2,014,768 | | | $ | — | |
Net long-term capital gains | | | 11,293,530 | | | | 545,385 | | | | 1,181 | | | | 17,051 | | | | 71,952,550 | | | | 81,665,235 | | | | 9,413,202 | | | | 18,468,062 | |
Total taxable distributions | | $ | 12,263,600 | | | $ | 1,310,289 | | | $ | 70,721 | | | $ | 17,051 | | | $ | 71,952,550 | | | $ | 81,665,235 | | | $ | 11,427,970 | | | $ | 18,468,062 | |
The tax character of distributions paid during the fiscal year ended August 31, 2016 was as follows:
| | | | | | | | | | | | | | | | | | | | | | | | | | | | | | | | |
| | | Capital
Growth | | | Concentrated
Growth | | | Dynamic
U.S. Equity | | | Flexible Cap | | | Growth
Opportunities | | | Small/Mid Cap
Growth | | | Strategic
Growth | | | Technology
Opportunities | |
Distribution paid from: | | | | | | | | | | | | | | | | | | | | | | | | | | | | | | | | |
Ordinary income | | $ | 4,712,785 | | | $ | 3,626,144 | | | $ | 331,071 | | | $ | 183,465 | | | $ | — | | | $ | 19,672,456 | | | $ | 4,324,429 | | | $ | — | |
Net long-term capital gains | | | 71,058,636 | | | | 14,309,229 | | | | 1,140,691 | | | | 905,450 | | | | 464,979,506 | | | | 84,777,269 | | | | 19,126,243 | | | | 35,686,035 | |
Total taxable distributions | | $ | 75,771,421 | | | $ | 17,935,373 | | | $ | 1,471,762 | | | $ | 1,088,915 | | | $ | 464,979,506 | | | $ | 104,449,725 | | | $ | 23,450,672 | | | $ | 35,686,035 | |
115
GOLDMAN SACHS FUNDAMENTAL EQUITY GROWTH FUNDS
Notes to Financial Statements (continued)
August 31, 2017
|
| 7. TAX INFORMATION (continued) |
As of August 31, 2017, the components of accumulated earnings (losses) on a tax basis were as follows:
| | | | | | | | | | | | | | | | | | | | | | | | | | | | | | | | |
| | | Capital
Growth | | | Concentrated
Growth | | | Dynamic
U.S. Equity | | | Flexible Cap | | | Growth
Opportunities | | | Small/Mid Cap
Growth | | | Strategic
Growth | | | Technology
Opportunities | |
Undistributed ordinary income — net | | $ | 9,868,578 | | | $ | 472,629 | | | $ | 39,180 | | | $ | 14,465 | | | $ | — | | | $ | — | | | $ | 8,297,376 | | | $ | — | |
Undistributed long-term capital gains | | | 55,306,355 | | | | 10,057,335 | | | | 1,013,668 | | | | 1,461,132 | | | | 333,975,990 | | | | 230,113,676 | | | | 42,141,931 | | | | 24,880,960 | |
Total undistributed earnings | | $ | 65,174,933 | | | $ | 10,529,964 | | | $ | 1,052,848 | | | $ | 1,475,597 | | | $ | 333,975,990 | | | $ | 230,113,676 | | | $ | 50,439,307 | | | $ | 24,880,960 | |
Timing differences (Qualified Late Year Loss Deferral and Post October Losses) | | $ | — | | | $ | — | | | $ | — | | | $ | — | | | $ | (6,459,100 | ) | | $ | (6,604,381 | ) | | $ | — | | | $ | (2,387,152 | ) |
Unrealized gains (losses) — net | | | 328,956,826 | | | | 48,324,472 | | | | 1,054,680 | | | | 6,135,056 | | | | 624,565,117 | | | | 439,837,733 | | | | 102,939,206 | | | | 226,785,555 | |
Total accumulated earnings (losses) net | | $ | 394,131,759 | | | $ | 58,854,436 | | | $ | 2,107,528 | | | $ | 7,610,653 | | | $ | 952,082,007 | | | $ | 663,347,028 | | | $ | 153,378,513 | | | $ | 249,279,363 | |
As of August 31, 2017, the Funds’ aggregate security unrealized gains and losses based on cost for U.S. federal income tax purposes were as follows:
| | | | | | | | | | | | | | | | | | | | | | | | | | | | | | | | |
| | | Capital
Growth | | | Concentrated
Growth | | | Dynamic
U.S. Equity | | | Flexible Cap | | | Growth
Opportunities | | | Small/Mid Cap
Growth | | | Strategic
Growth | | | Technology
Opportunities | |
Tax Cost | | $ | 585,760,040 | | | $ | 102,204,543 | | | $ | 4,679,218 | | | $ | 12,667,843 | | | $ | 1,935,030,624 | | | $ | 1,768,879,819 | | | $ | 163,714,547 | | | $ | 221,189,393 | |
Gross unrealized gain | | | 335,006,668 | | | | 49,206,538 | | | | 1,213,235 | | | | 6,204,312 | | | | 646,258,109 | | | | 474,418,754 | | | | 105,110,336 | | | | 228,186,896 | |
Gross unrealized loss | | | (6,049,842 | ) | | | (882,066 | ) | | | (158,555 | ) | | | (69,256 | ) | | | (21,692,992 | ) | | | (34,581,021 | ) | | | (2,171,130 | ) | | | (1,401,341 | ) |
Net unrealized gains (losses) | | $ | 328,956,826 | | | $ | 48,324,472 | | | $ | 1,054,680 | | | $ | 6,135,056 | | | $ | 624,565,117 | | | $ | 439,837,733 | | | $ | 102,939,206 | | | $ | 226,785,555 | |
The difference between GAAP-basis and tax basis unrealized gains (losses) is attributable primarily to wash sales, differences in the tax treatment of underlying fund investments, and partnership investments.
| | | | | | | | | | | | | | |
| Fund | | | | Paid-in-Capital | | | Accumulated Net Realized Gain (Loss) | | | Undistributed Net Investment Income (Loss) | |
Capital Growth | | | | $ | — | | | $ | 4,281 | | | $ | (4,281 | ) |
Concentrated Growth | | | | | 41,890 | | | | (39,609 | ) | | | (2,281 | ) |
Dynamic U.S. Equity | | | | | — | | | | 140 | | | | (140 | ) |
Flexible Cap | | | | | — | | | | 9,561 | | | | (9,561 | ) |
Growth Opportunities | | | | | 24,661,951 | | | | (36,793,782 | ) | | | 12,131,831 | |
Small/Mid Cap Growth | | | | | (14,548,292 | ) | | | (2,641,743 | ) | | | 17,190,035 | |
Strategic Growth | | | | | — | | | | 12,382 | | | | (12,382 | ) |
Technology Opportunities | | | | | (2,100,071 | ) | | | (937,547 | ) | | | 3,037,618 | |
116
GOLDMAN SACHS FUNDAMENTAL EQUITY GROWTH FUNDS
|
| 7. TAX INFORMATION (continued) |
In order to present certain components of the Funds’ capital accounts on a tax-basis, certain reclassifications have been recorded to the Funds’ accounts. These reclassifications have no impact on the net asset value of the Funds’ and result primarily from fund acquisition, net operating losses, redemptions utilized as distributions, dividend re-designations and the differences in the tax treatment of the underlying fund investments.
GSAM has reviewed the Funds’ tax positions for all open tax years (the current and prior three years, as applicable) and has concluded that no provision for income tax is required in the Funds’ financial statements. Such open tax years remain subject to examination and adjustment by tax authorities.
The Funds’ risks include, but are not limited to, the following:
Industry Concentration Risk — The Technology Opportunities Fund invests primarily in equity investments in high-quality technology, media, or service companies that adopt or use technology to improve their cost structure, revenue opportunities or competitive advantage. Because of its focus on technology, media and service companies, the Technology Opportunities Fund is subject to greater risk of loss as a result of adverse economic, business or other developments than if its investments were diversified across different industry sectors. The Technology Opportunities Fund may also invest in a relatively few number of issuers. Thus, the Technology Opportunities Fund may be more susceptible to adverse developments affecting any single issuer held in its portfolio and may be more susceptible to greater losses because of these developments.
Investments in Other Investment Companies Risk — As a shareholder of another investment company, a Fund will indirectly bear its proportionate share of any net management fees and other expenses paid by such other investment companies, in addition to the fees and expenses regularly borne by the Fund.
Large Shareholder Transactions Risk — A Fund may experience adverse effects when certain large shareholders, such as other funds, institutional investors (including those trading by use of non-discretionary mathematical formulas), financial intermediaries (who may make investment decisions on behalf of underlying clients and/or include a Fund in their investment model), individuals, accounts and Goldman Sachs affiliates, purchase or redeem large amounts of shares of a Fund. Such large shareholder redemptions may cause a Fund to sell portfolio securities at times when it would not otherwise do so, which may negatively impact a Fund’s NAV and liquidity. These transactions may also accelerate the realization of taxable income to shareholders if such sales of investments resulted in gains, and may also increase transaction costs. In addition, a large redemption could result in a Fund’s current expenses being allocated over a smaller asset base, leading to an increase in the Fund’s expense ratio. Similarly, large Fund share purchases may adversely affect a Fund’s performance to the extent that the Fund is delayed in investing new cash and is required to maintain a larger cash position than it ordinarily would.
Liquidity Risk — A Fund may make investments that are illiquid or that may become less liquid in response to market developments or adverse investor perceptions. Illiquid investments may be more difficult to value. Liquidity risk may also refer to the risk that a Fund will not be able to pay redemption proceeds within the allowable time period because of unusual market conditions, an unusually high volume of redemption requests, or other reasons. To meet redemption requests, a Fund may be forced to sell investments at an unfavorable time and/or under unfavorable conditions.
Market and Credit Risks — In the normal course of business, the Funds trade financial instruments and enter into financial transactions where risk of potential loss exists due to changes in the market (market risk). Additionally, the Funds may also be exposed to credit risk in the event that an issuer or guarantor fails to perform or that an institution or entity with which the Funds have unsettled or open transactions defaults.
Under the Trust’s organizational documents, its Trustees, officers, employees and agents are indemnified, to the extent permitted by the Act and state law, against certain liabilities that may arise out of performance of their duties to the Funds. Additionally, in
117
GOLDMAN SACHS FUNDAMENTAL EQUITY GROWTH FUNDS
Notes to Financial Statements (continued)
August 31, 2017
|
| 9. INDEMNIFICATIONS (continued) |
the course of business, the Funds enter into contracts that contain a variety of indemnification clauses. The Funds’ maximum exposure under these arrangements is unknown, as this would involve future claims that may be made against the Funds that have not yet occurred. However, GSAM believes the risk of loss under these arrangements to be remote.
Mergers and Reorganizations — At a meeting held on May 19-20, 2017, the Board of Trustees of the Trust approved the Reorganization Agreement providing for the tax-free acquisition by the Goldman Sachs Concentrated Growth Fund (“Survivor Fund”) of the assets and liabilities of the Goldman Sachs Focused Growth Fund (“Acquired Fund”). The acquisition was completed as of the close of business on July 28, 2017.
The reorganization was recommended by the Funds’ investment adviser in connection with an effort to optimize the Goldman Sachs Funds and eliminate overlapping products.
Pursuant to the Reorganization Agreement, the assets and liabilities of the Acquired Fund were transferred in exchange for the Survivor Fund’s Class A, Class C, Institutional, Class Investor Shares and Class R Shares, which were then redistributed to the Acquired Fund’s shareholders, in a tax-free exchange as follows:
| | | | | | | | | | | | |
| Acquired Fund/Survivor Fund | | Exchanged Shares of Survivor Fund Issued | | | Value of Exchanged Shares | | | Acquired Fund’s Shares Outstanding as of July 28, 2017 | |
Focused Growth, Class A/ Concentrated Growth, Class A | | | 11,969 | | | $ | 209,101 | | | | 13,637 | |
Focused Growth, Class C/ Concentrated Growth, Class C | | | 14,381 | | | | 213,126 | | | | 14,355 | |
Focused Growth, Class Institutional/ Concentrated Growth, Class Institutional | | | 860,061 | | | | 15,902,538 | | | | 1,026,586 | |
Focused Growth, Class Investor/ Concentrated Growth, Class Investor | | | 3,740 | | | | 66,267 | | | | 4,286 | |
Focused Growth, Class R/ Concentrated Growth, Class R | | | 1,138 | | | | 19,335 | | | | 1,268 | |
Focused Growth, Class R6/ Concentrated Growth, Class R6 | | | 3,400 | | | | 62,865 | | | | 4,058 | |
The following chart shows the Survivor Fund’s and Acquired Fund’s aggregate net assets (immediately before and after the completion of the acquisition) and the Acquired Fund’s unrealized appreciation:
| | | | | | | | | | | | | | | | |
| Acquired Fund/Survivor Fund | | Survivor Fund’s Aggregate Net Assets before acquisition | | | Acquired Fund’s Aggregate
Net Assets before acquisition | | | Survivor Fund’s Aggregate Net
Assets
Immediately
after
acquisition | | | Acquired Fund’s Unrealized Appreciation# | |
Focused Growth/ Concentrated Growth | | $ | 135,662,493 | | | $ | 16,473,232 | | | $ | 152,135,725 | | | $ | 3,269,678 | |
| # | | The Survivor Fund has elected to carry forward the assets of the Acquired Fund at the Acquired Fund’s historical cost basis for purposes of measuring unrealized appreciation and future realized gain or loss of those acquired assets. |
118
GOLDMAN SACHS FUNDAMENTAL EQUITY GROWTH FUNDS
|
| 10. OTHER MATTERS (continued) |
Assuming the acquisition had been completed on September 1, 2016, the Fund’s pro-forma results of operations for the year ended August 31, 2017 are as follows:
| | | | |
Net investment income | | $ | 768,829 | (a) |
Net realized and unrealized gain on investments | | $ | 23,258,319 | (b) |
Net increase in net assets from operations | | $ | 24,027,148 | |
Because the combined investment funds have been managed as a single integrated fund since the acquisition was completed, it is not practicable to separate the amounts of revenue and earnings of the Acquired Fund that have been included in the Fund’s Statement of Operations since July 28, 2017.
| (a) | | $638,548 net investment income as reported at August 31, 2017, plus $99,860 from Acquired Fund pre-merger net investment income, plus $26,001 in lower net advisory fees, plus $4,420 of pro-forma eliminated other expenses. |
| (b) | | $48,458,628 unrealized appreciation as reported at August 31, 2017, minus $40,559,275 pro-forma August 31, 2016 unrealized depreciation, plus $13,025,972 net realized gain as reported at August 31 2017, plus $2,332,994 in net realized gain from Acquired Fund pre-merger. |
Subsequent events after the Statements of Assets and Liabilities date have been evaluated and GSAM has concluded that there is no impact requiring adjustment or disclosure in the financial statements.
119
GOLDMAN SACHS FUNDAMENTAL EQUITY GROWTH FUNDS
Notes to Financial Statements (continued)
August 31, 2017
|
| 12. SUMMARY OF SHARE TRANSACTIONS |
Share activity is as follows:
| | | | | | | | | | | | | | | | |
| | | Capital Growth Fund | |
| | | | |
| | | For the Fiscal Year Ended
August 31, 2017 | | | For the Fiscal Year Ended
August 31, 2016 | |
| | | Shares | | | Dollars | | | Shares | | | Dollars | |
| | | | |
| Class A Shares | | | | | | | | | | | | | | | | |
Shares sold | | | 730,413 | | | $ | 19,345,431 | | | | 664,254 | | | $ | 15,685,065 | |
Shares issued in connection with merger | | | — | | | | — | | | | — | | | | — | |
Reinvestment of distributions | | | 342,923 | | | | 8,210,400 | | | | 2,165,893 | | | | 51,418,306 | |
Shares redeemed | | | (3,951,439 | ) | | | (101,849,606 | ) | | | (3,725,446 | ) | | | (88,186,013 | ) |
| | | | (2,878,103 | ) | | | (74,293,775 | ) | | | (895,299 | ) | | | (21,082,642 | ) |
| Class C Shares | | | | | | | | | | | | | | | | |
Shares sold | | | 267,217 | | | | 5,342,666 | | | | 249,049 | | | | 4,603,944 | |
Shares issued in connection with merger | | | — | | | | — | | | | — | | | | — | |
Reinvestment of distributions | | | 57,361 | | | | 1,056,008 | | | | 372,429 | | | | 6,878,768 | |
Shares redeemed | | | (1,182,494 | ) | | | (23,978,382 | ) | | | (771,189 | ) | | | (14,309,764 | ) |
| | | | (857,916 | ) | | | (17,579,708 | ) | | | (149,711 | ) | | | (2,827,052 | ) |
| Institutional Shares | | | | | | | | | | | | | | | | |
Shares sold | | | 653,327 | | | | 18,523,159 | | | | 435,916 | | | | 11,486,482 | |
Shares issued in connection with merger | | | — | | | | — | | | | — | | | | — | |
Reinvestment of distributions | | | 83,334 | | | | 2,181,053 | | | | 485,148 | | | | 12,546,206 | |
Shares redeemed | | | (853,052 | ) | | | (23,800,378 | ) | | | (2,024,093 | ) | | | (49,724,048 | ) |
| | | | (116,391 | ) | | | (3,096,166 | ) | | | (1,103,029 | ) | | | (25,691,360 | ) |
| Service Shares | | | | | | | | | | | | | | | | |
Shares sold | | | 10,672 | | | | 272,764 | | | | 6,962 | | | | 162,356 | |
Shares issued in connection with merger | | | — | | | | — | | | | — | | | | — | |
Reinvestment of distributions | | | 870 | | | | 20,175 | | | | 5,946 | | | | 136,873 | |
Shares redeemed | | | (26,953 | ) | | | (702,157 | ) | | | (25,655 | ) | | | (593,276 | ) |
| | | | (15,411 | ) | | | (409,218 | ) | | | (12,747 | ) | | | (294,047 | ) |
| Investor Shares | | | | | | | | | | | | | | | | |
Shares sold | | | 181,091 | | | | 4,753,841 | | | | 53,124 | | | | 1,326,280 | |
Shares issued in connection with merger | | | — | | | | — | | | | — | | | | — | |
Reinvestment of distributions | | | 3,091 | | | | 75,073 | | | | 15,717 | | | | 377,764 | |
Shares redeemed | | | (69,852 | ) | | | (1,851,953 | ) | | | (45,766 | ) | | | (1,054,398 | ) |
| | | | 114,330 | | | | 2,976,961 | | | | 23,075 | | | | 649,646 | |
| Class R Shares | | | | | | | | | | | | | | | | |
Shares sold | | | 192,857 | | | | 5,081,740 | | | | 73,489 | | | | 1,728,829 | |
Shares issued in connection with merger | | | — | | | | — | | | | — | | | | — | |
Reinvestment of distributions | | | 1,858 | | | | 43,139 | | | | 12,478 | | | | 288,122 | |
Shares redeemed | | | (52,946 | ) | | | (1,321,148 | ) | | | (83,452 | ) | | | (1,950,338 | ) |
| | | | 141,769 | | | | 3,803,731 | | | | 2,515 | | | | 66,613 | |
| Class R6 Shares | | | | | | | | | | | | | | | | |
Shares sold | | | 130 | | | | 4,046 | | | | — | | | | — | |
Shares issued in connection with merger | | | — | | | | — | | | | — | | | | — | |
Reinvestment of distributions | | | 6 | | | | 168 | | | | 28 | | | | 730 | |
Shares redeemed | | | — | | | | — | | | | — | | | | — | |
| | | | 136 | | | | 4,214 | | | | 28 | | | | 730 | |
NET DECREASE | | | (3,611,586 | ) | | $ | (88,593,961 | ) | | | (2,135,168 | ) | | $ | (49,178,112 | ) |
120
GOLDMAN SACHS FUNDAMENTAL EQUITY GROWTH FUNDS
|
| 12. SUMMARY OF SHARE TRANSACTIONS (continued) |
| | | | | | | | | | | | | | | | | | | | | | | | | | | | | | |
| Concentrated Growth Fund | | | Dynamic U.S. Equity Fund | |
For the Fiscal Year Ended
August 31, 2017 | | | For the Fiscal Year Ended
August 31, 2016 | | | For the Fiscal Year Ended
August 31, 2017 | | | For the Fiscal Year Ended
August 31, 2016 | |
| Shares | | | Dollars | | | Shares | | | Dollars | | | Shares | | | Dollars | | | Shares | | | Dollars | |
| | | | | | | | | | | | | | | | | | | | | | | | | | | | | | |
| | 35,414 | | | $ | 581,983 | | | | 52,192 | | | $ | 821,213 | | | | 43,292 | | | $ | 607,319 | | | | 12,607 | | | $ | 162,541 | |
| | 11,969 | | | | 209,101 | | | | — | | | | — | | | | — | | | | — | | | | — | | | | — | |
| | 1,772 | | | | 26,307 | | | | 45,827 | | | | 684,660 | | | | 789 | | | | 10,696 | | | | 23,802 | | | | 308,204 | |
| | (175,677 | ) | | | (2,797,132 | ) | | | (119,056 | ) | | | (1,736,160 | ) | | | (79,777 | ) | | | (1,106,012 | ) | | | (95,770 | ) | | | (1,210,967 | ) |
| | (126,522 | ) | | | (1,979,741 | ) | | | (21,037 | ) | | | (230,287 | ) | | | (35,696 | ) | | | (487,997 | ) | | | (59,361 | ) | | | (740,222 | ) |
| | | | | | | | | | | | | | | | | | | | | | | | | | | | | | |
| | 14,042 | | | | 190,404 | | | | 31,025 | | | | 409,544 | | | | 9,430 | | | | 123,911 | | | | 4,026 | | | | 49,591 | |
| | 14,381 | | | | 213,126 | | | | — | | | | — | | | | — | | | | — | | | | — | | | | — | |
| | 594 | | | | 7,494 | | | | 20,916 | | | | 267,936 | | | | 2 | | | | 23 | | | | 2,696 | | | | 33,918 | |
| | (51,727 | ) | | | (721,732 | ) | | | (137,702 | ) | | | (1,784,637 | ) | | | (12,450 | ) | | | (161,341 | ) | | | (17,511 | ) | | | (219,594 | ) |
| | (22,710 | ) | | | (310,708 | ) | | | (85,761 | ) | | | (1,107,157 | ) | | | (3,018 | ) | | | (37,407 | ) | | | (10,789 | ) | | | (136,085 | ) |
| | | | | | | | | | | | | | | | | | | | | | | | | | | | | | |
| | 224,592 | | | | 3,678,152 | | | | 296,640 | | | | 4,728,852 | | | | 97,118 | | | | 1,362,329 | | | | 48,423 | | | | 656,390 | |
| | 860,062 | | | | 15,902,538 | | | | — | | | | — | | | | — | | | | — | | | | — | | | | — | |
| | 79,695 | | | | 1,253,285 | | | | 1,049,110 | | | | 16,578,987 | | | | 4,295 | | | | 58,374 | | | | 59,033 | | | | 770,241 | |
| | (1,975,171 | ) | | | (32,387,904 | ) | | | (2,109,806 | ) | | | (32,916,814 | ) | | | (228,010 | ) | | | (3,297,706 | ) | | | (521,192 | ) | | | (6,696,086 | ) |
| | (810,822 | ) | | | (11,553,929 | ) | | | (764,056 | ) | | | (11,608,975 | ) | | | (126,597 | ) | | | (1,877,003 | ) | | | (413,736 | ) | | | (5,269,455 | ) |
| | | | | | | | | | | | | | | | | | | | | | | | | | | | | | |
| | — | | | | — | | | | — | | | | — | | | | — | | | | — | | | | — | | | | — | |
| | — | | | | — | | | | — | | | | — | | | | — | | | | — | | | | — | | | | — | |
| | — | | | | — | | | | — | | | | — | | | | — | | | | — | | | | — | | | | — | |
| | — | | | | — | | | | — | | | | — | | | | — | | | | — | | | | — | | | | — | |
| | — | | | | — | | | | — | | | | — | | | | — | | | | — | | | | — | | | | — | |
| | | | | | | | | | | | | | | | | | | | | | | | | | | | | | |
| | 19,700 | | | | 317,334 | | | | 11,110 | | | | 165,677 | | | | 16,901 | | | | 236,370 | | | | 28,181 | | | | 344,243 | |
| | 3,740 | | | | 66,267 | | | | — | | | | — | | | | — | | | | — | | | | — | | | | — | |
| | 246 | | | | 3,701 | | | | 2,439 | | | | 36,968 | | | | 112 | | | | 1,522 | | | | 3,311 | | | | 43,086 | |
| | (9,604 | ) | | | (156,239 | ) | | | (5,059 | ) | | | (76,091 | ) | | | (16,262 | ) | | | (237,369 | ) | | | (76,845 | ) | | | (1,011,626 | ) |
| | 14,082 | | | | 231,063 | | | | 8,490 | | | | 126,554 | | | | 751 | | | | 523 | | | | (45,353 | ) | | | (624,297 | ) |
| | | | | | | | | | | | | | | | | | | | | | | | | | | | | | |
| | (910 | ) | | | (15,835 | ) | | | 461 | | | | 6,645 | | | | — | | | | — | | | | 428 | | | | 5,433 | |
| | 1,138 | | | | 19,335 | | | | — | | | | — | | | | — | | | | — | | | | — | | | | — | |
| | 6 | | | | 84 | | | | 211 | | | | 3,065 | | | | 1 | | | | 3 | | | | 424 | | | | 5,478 | |
| | (288 | ) | | | (4,715 | ) | | | (876 | ) | | | (12,879 | ) | | | — | | | | — | | | | (7,899 | ) | | | (108,468 | ) |
| | (54 | ) | | | (1,131 | ) | | | (204 | ) | | | (3,169 | ) | | | 1 | | | | 3 | | | | (7,047 | ) | | | (97,557 | ) |
| | | | | | | | | | | | | | | | | | | | | | | | | | | | | | |
| | (370 | ) | | | (6,866 | ) | | | — | | | | — | | | | — | | | | — | | | | — | | | | — | |
| | 3,400 | | | | 62,865 | | | | — | | | | — | | | | — | | | | — | | | | — | | | | — | |
| | 7 | | | | 103 | | | | 65 | | | | 1,028 | | | | 7 | | | | 103 | | | | 77 | | | | 1,003 | |
| | (4 | ) | | | (72 | ) | | | — | | | | — | | | | — | | | | — | | | | — | | | | — | |
| | 3,033 | | | | 56,030 | | | | 65 | | | | 1,028 | | | | 7 | | | | 103 | | | | 77 | | | | 1,003 | |
| | (942,993 | ) | | $ | (13,558,416 | ) | | | (862,503 | ) | | $ | (12,822,006 | ) | | | (164,552 | ) | | $ | (2,401,778 | ) | | | (536,209 | ) | | $ | (6,866,613 | ) |
121
GOLDMAN SACHS FUNDAMENTAL EQUITY GROWTH FUNDS
Notes to Financial Statements (continued)
August 31, 2017
|
| 12. SUMMARY OF SHARE TRANSACTIONS (continued) |
| | | | | | | | | | | | | | | | |
| | | Flexible Cap Fund | |
| | | | |
| | | For the Fiscal Year Ended
August 31, 2017 | | | For the Fiscal Year Ended
August 31, 2016 | |
| | | Shares | | | Dollars | | | Shares | | | Dollars | |
| | | | |
| Class A Shares | | | | | | | | | | | | | | | | |
Shares sold | | | 66,603 | | | $ | 845,733 | | | | 136,627 | | | $ | 1,598,220 | |
Reinvestment of distributions | | | 500 | | | | 5,826 | | | | 40,108 | | | | 458,035 | |
Shares redeemed | | | (172,497 | ) | | | (2,115,900 | ) | | | (263,936 | ) | | | (2,915,077 | ) |
| | | | (105,394 | ) | | | (1,264,341 | ) | | | (87,201 | ) | | | (858,822 | ) |
| Class C Shares | | | | | | | | | | | | | | | | |
Shares sold | | | 30,505 | | | | 345,757 | | | | 36,060 | | | | 382,842 | |
Reinvestment of distributions | | | 141 | | | | 1,496 | | | | 11,168 | | | | 116,932 | |
Shares redeemed | | | (49,741 | ) | | | (542,288 | ) | | | (73,393 | ) | | | (766,608 | ) |
| | | | (19,095 | ) | | | (195,035 | ) | | | (26,165 | ) | | | (266,834 | ) |
| Institutional Shares | | | | | | | | | | | | | | | | |
Shares sold | | | 156,495 | | | | 2,027,089 | | | | 93,234 | | | | 1,069,282 | |
Reinvestment of distributions | | | 774 | | | | 9,494 | | | | 41,542 | | | | 497,675 | |
Shares redeemed | | | (165,736 | ) | | | (2,168,710 | ) | | | (69,689 | ) | | | (843,461 | ) |
| | | | (8,467 | ) | | | (132,127 | ) | | | 65,087 | | | | 723,496 | |
| Service Shares | | | | | | | | | | | | | | | | |
Shares sold | | | — | | | | — | | | | — | | | | — | |
Reinvestment of distributions | | | — | | | | — | | | | — | | | | — | |
Shares redeemed | | | — | | | | — | | | | — | | | | — | |
| | | | — | | | | — | | | | — | | | | — | |
| Investor Shares | | | | | | | | | | | | | | | | |
Shares sold | | | 42,544 | | | | 544,209 | | | | 11,548 | | | | 134,523 | |
Reinvestment of distributions | | | 16 | | | | 198 | | | | 1,142 | | | | 13,475 | |
Shares redeemed | | | (32,853 | ) | | | (445,459 | ) | | | (17,043 | ) | | | (195,238 | ) |
| | | | 9,707 | | | | 98,948 | | | | (4,353 | ) | | | (47,240 | ) |
| Class R Shares | | | | | | | | | | | | | | | | |
Shares sold | | | 791 | | | | 9,017 | | | | 973 | | | | 10,929 | |
Reinvestment of distributions | | | 2 | | | | 27 | | | | 203 | | | | 2,254 | |
Shares redeemed | | | (1,157 | ) | | | (13,208 | ) | | | (749 | ) | | | (8,168 | ) |
| | | | (364 | ) | | | (4,164 | ) | | | 427 | | | | 5,015 | |
| Class R6 Shares | | | | | | | | | | | | | | | | |
Shares sold | | | — | | | | — | | | | — | | | | — | |
Reinvestment of distributions | | | 1 | | | | 10 | | | | 46 | | | | 544 | |
Shares redeemed | | | — | | | | — | | | | — | | | | — | |
| | | | 1 | | | | 10 | | | | 46 | | | | 544 | |
NET DECREASE | | | (123,612 | ) | | $ | (1,496,709 | ) | | | (52,159 | ) | | $ | (443,841 | ) |
122
GOLDMAN SACHS FUNDAMENTAL EQUITY GROWTH FUNDS
|
| 12. SUMMARY OF SHARE TRANSACTIONS (continued) |
| | | | | | | | | | | | | | | | | | | | | | | | | | | | | | |
| | Growth Opportunities Fund | | | | Small/Mid Cap Growth Fund | |
For the Fiscal Year Ended
August 31, 2017 | | | For the Fiscal Year Ended
August 31, 2016 | | | For the Fiscal Year Ended
August 31, 2017 | | | For the Fiscal Year Ended
August 31, 2016 | |
| Shares | | | Dollars | | | Shares | | | Dollars | | | Shares | | | Dollars | | | Shares | | | Dollars | |
| | | | | | | | | | | | | | | | | | | | | | | | | | | | | | |
| | 3,948,841 | | | $ | 86,976,946 | | | | 5,188,410 | | | $ | 109,990,949 | | | | 3,797,922 | | | $ | 75,715,396 | | | | 13,059,932 | | | $ | 248,962,765 | |
| | 616,532 | | | | 12,830,026 | | | | 4,305,749 | | | | 89,085,946 | | | | 1,063,586 | | | | 20,548,483 | | | | 1,658,772 | | | | 32,113,835 | |
| | (13,363,194 | ) | | | (292,738,087 | ) | | | (20,121,034 | ) | | | (429,709,764 | ) | | | (25,848,187 | ) | | | (513,599,609 | ) | | | (21,364,280 | ) | | | (402,785,510 | ) |
| | (8,797,821 | ) | | | (192,931,115 | ) | | | (10,626,875 | ) | | | (230,632,869 | ) | | | (20,986,679 | ) | | | (417,335,730 | ) | | | (6,645,576 | ) | | | (121,708,910 | ) |
| | | | | | | | | | | | | | | | | | | | | | | | | | | | | | |
| | 327,692 | | | | 5,350,331 | | | | 962,529 | | | | 15,367,206 | | | | 1,040,863 | | | | 18,593,918 | | | | 3,947,819 | | | | 67,860,295 | |
| | 201,442 | | | | 3,156,597 | | | | 1,130,439 | | | | 17,894,856 | | | | 486,596 | | | | 8,349,983 | | | | 552,467 | | | | 9,612,934 | |
| | (3,253,166 | ) | | | (53,741,818 | ) | | | (3,185,261 | ) | | | (51,807,187 | ) | | | (5,194,599 | ) | | | (91,887,203 | ) | | | (3,869,475 | ) | | | (65,440,359 | ) |
| | (2,724,032 | ) | | | (45,234,890 | ) | | | (1,092,293 | ) | | | (18,545,125 | ) | | | (3,667,140 | ) | | | (64,943,302 | ) | | | 630,811 | | | | 12,032,870 | |
| | | | | | | | | | | | | | | | | | | | | | | | | | | | | | |
| | 12,716,492 | | | | 318,354,392 | | | | 18,570,813 | | | | 439,755,390 | | | | 12,957,008 | | | | 275,379,906 | | | | 23,356,509 | | | | 467,210,062 | |
| | 1,689,189 | | | | 40,287,147 | | | | 10,632,111 | | | | 250,386,206 | | | | 1,573,154 | | | | 32,076,604 | | | | 1,970,711 | | | | 40,044,852 | |
| | (40,983,720 | ) | | | (1,038,080,205 | ) | | | (60,682,704 | ) | | | (1,450,641,387 | ) | | | (23,856,792 | ) | | | (500,218,708 | ) | | | (28,679,407 | ) | | | (559,510,889 | ) |
| | (26,578,039 | ) | | | (679,438,666 | ) | | | (31,479,780 | ) | | | (760,499,791 | ) | | | (9,326,630 | ) | | | (192,762,198 | ) | | | (3,352,187 | ) | | | (52,255,975 | ) |
| | | | | | | | | | | | | | | | | | | | | | | | | | | | | | |
| | 125,857 | | | | 2,635,331 | | | | 212,601 | | | | 4,302,039 | | | | 287,704 | | | | 5,645,566 | | | | 281,592 | | | | 5,278,687 | |
| | 36,199 | | | | 725,434 | | | | 224,585 | | | | 4,484,961 | | | | 20,720 | | | | 392,014 | | | | 20,051 | | | | 380,769 | |
| | (512,580 | ) | | | (10,732,449 | ) | | | (772,840 | ) | | | (15,380,698 | ) | | | (251,303 | ) | | | (4,950,109 | ) | | | (208,125 | ) | | | (3,881,601 | ) |
| | (350,524 | ) | | | (7,371,684 | ) | | | (335,654 | ) | | | (6,593,698 | ) | | | 57,121 | | | | 1,087,471 | | | | 93,518 | | | | 1,777,855 | |
| | | | | | | | | | | | | | | | | | | | | | | | | | | | | | |
| | 2,311,524 | | | | 51,977,934 | | | | 1,654,412 | | | | 36,014,147 | | | | 14,003,481 | | | | 288,091,753 | | | | 10,006,149 | | | | 196,523,636 | |
| | 151,961 | | | | 3,279,315 | | | | 873,457 | | | | 18,674,509 | | | | 520,109 | | | | 10,339,759 | | | | 506,347 | | | | 10,050,989 | |
| | (3,212,330 | ) | | | (72,743,080 | ) | | | (3,491,281 | ) | | | (76,158,982 | ) | | | (10,461,903 | ) | | | (215,173,618 | ) | | | (5,540,314 | ) | | | (106,415,747 | ) |
| | (748,845 | ) | | | (17,485,831 | ) | | | (963,412 | ) | | | (21,470,326 | ) | | | 4,061,687 | | | | 83,257,894 | | | | 4,972,182 | | | | 100,158,878 | |
| | | | | | | | | | | | | | | | | | | | | | | | | | | | | | |
| | 606,539 | | | | 13,007,450 | | | | 660,335 | | | | 13,556,973 | | | | 389,436 | | | | 7,641,743 | | | | 666,389 | | | | 12,300,998 | |
| | 72,078 | | | | 1,448,776 | | | | 423,033 | | | | 8,481,806 | | | | 52,223 | | | | 981,268 | | | | 59,341 | | | | 1,120,945 | |
| | (1,121,497 | ) | | | (23,899,233 | ) | | | (1,424,623 | ) | | | (29,193,359 | ) | | | (954,048 | ) | | | (18,569,971 | ) | | | (654,691 | ) | | | (12,142,962 | ) |
| | (442,880 | ) | | | (9,443,007 | ) | | | (341,255 | ) | | | (7,154,580 | ) | | | (512,389 | ) | | | (9,946,960 | ) | | | 71,039 | | | | 1,278,981 | |
| | | | | | | | | | | | | | | | | | | | | | | | | | | | | | |
| | 4,994,842 | | | | 125,307,524 | | | | 1,874,647 | | | | 45,447,017 | | | | 720,880 | | | | 15,338,259 | | | | 537,717 | | | | 10,568,618 | |
| | 100,027 | | | | 2,386,639 | | | | 45,912 | | | | 1,081,229 | | | | 29,904 | | | | 610,048 | | | | 16 | | | | 313 | |
| | (2,599,791 | ) | | | (65,703,844 | ) | | | (109,482 | ) | | | (2,621,944 | ) | | | (237,520 | ) | | | (5,014,293 | ) | | | (69,825 | ) | | | (1,402,008 | ) |
| | 2,495,078 | | | | 61,990,319 | | | | 1,811,077 | | | | 43,906,302 | | | | 513,264 | | | | 10,934,014 | | | | 467,908 | | | | 9,166,923 | |
| | (37,147,063 | ) | | $ | (889,914,874 | ) | | | (43,028,192 | ) | | $ | (1,000,990,087 | ) | | | (29,860,766 | ) | | $ | (589,708,811 | ) | | | (3,762,305 | ) | | $ | (49,549,378 | ) |
123
GOLDMAN SACHS FUNDAMENTAL EQUITY GROWTH FUNDS
Notes to Financial Statements (continued)
August 31, 2017
|
| 12. SUMMARY OF SHARE TRANSACTIONS (continued) |
| | | | | | | | | | | | | | | | |
| | | Strategic Growth Fund | |
| | | | |
| | | For the Fiscal Year Ended
August 31, 2017 | | | For the Fiscal Year Ended
August 31, 2016 | |
| | | Shares | | | Dollars | | | Shares | | | Dollars | |
| Class A Shares | | | | | | | | | | | | | | | | |
Shares sold | | | 800,544 | | | $ | 9,730,490 | | | | 823,979 | | | $ | 9,618,983 | |
Reinvestment of distributions | | | 118,583 | | | | 1,364,885 | | | | 219,495 | | | | 2,569,040 | |
Shares redeemed | | | (1,445,808 | ) | | | (17,905,833 | ) | | | (970,584 | ) | | | (11,223,910 | ) |
| | | | (526,681 | ) | | | (6,810,458 | ) | | | 72,890 | | | | 964,113 | |
| Class C Shares | | | | | | | | | | | | | | | | |
Shares sold | | | 84,221 | | | | 875,616 | | | | 162,871 | | | | 1,581,949 | |
Reinvestment of distributions | | | 29,118 | | | | 278,952 | | | | 55,139 | | | | 544,217 | |
Shares redeemed | | | (410,008 | ) | | | (4,226,604 | ) | | | (211,544 | ) | | | (2,076,408 | ) |
| | | | (296,669 | ) | | | (3,072,036 | ) | | | 6,466 | | | | 49,758 | |
| Institutional Shares | | | | | | | | | | | | | | | | |
Shares sold | | | 3,641,772 | | | | 46,202,866 | | | | 8,220,144 | | | | 99,417,986 | |
Reinvestment of distributions | | | 772,278 | | | | 9,454,373 | | | | 1,582,533 | | | | 19,641,430 | |
Shares redeemed | | | (13,344,676 | ) | | | (177,635,831 | ) | | | (12,531,831 | ) | | | (152,494,532 | ) |
| | | | (8,930,626 | ) | | | (121,978,592 | ) | | | (2,729,154 | ) | | | (33,435,116 | ) |
| Service Shares | | | | | | | | | | | | | | | | |
Shares sold | | | 14,693 | | | | 181,127 | | | | 5,667 | | | | 65,578 | |
Reinvestment of distributions | | | 873 | | | | 9,995 | | | | 1,139 | | | | 13,275 | |
Shares redeemed | | | (3,658 | ) | | | (46,981 | ) | | | (5,357 | ) | | | (64,372 | ) |
| | | | 11,908 | | | | 144,141 | | | | 1,449 | | | | 14,481 | |
| Investor Shares | | | | | | | | | | | | | | | | |
Shares sold | | | 115,400 | | | | 1,539,553 | | | | 13,080 | | | | 164,860 | |
Reinvestment of distributions | | | 2,398 | | | | 29,343 | | | | 4,008 | | | | 49,728 | |
Shares redeemed | | | (28,917 | ) | | | (393,178 | ) | | | (16,658 | ) | | | (204,493 | ) |
| | | | 88,881 | | | | 1,175,718 | | | | 430 | | | | 10,095 | |
| Class R Shares | | | | | | | | | | | | | | | | |
Shares sold | | | 9,245 | | | | 110,688 | | | | 1,497 | | | | 17,086 | |
Reinvestment of distributions | | | 21 | | | | 234 | | | | 33 | | | | 381 | |
Shares redeemed | | | (3,700 | ) | | | (45,903 | ) | | | (1,162 | ) | | | (13,491 | ) |
| | | | 5,566 | | | | 65,019 | | | | 368 | | | | 3,976 | |
| Class R6 Shares | | | | | | | | | | | | | | | | |
Shares sold | | | — | | | | — | | | | — | | | | — | |
Reinvestment of distributions | | | 30 | | | | 356 | | | | 44 | | | | 558 | |
Shares redeemed | | | — | | | | — | | | | — | | | | — | |
| | | | 30 | | | | 356 | | | | 44 | | | | 558 | |
NET DECREASE | | | (9,647,591 | ) | | $ | (130,475,852 | ) | | | (2,647,507 | ) | | $ | (32,392,135 | ) |
124
GOLDMAN SACHS FUNDAMENTAL EQUITY GROWTH FUNDS
|
| 12. SUMMARY OF SHARE TRANSACTIONS (continued) |
| | | | | | | | | | | | | | |
| Technology Opportunities Fund | |
For the Fiscal Year Ended
August 31, 2017 | | | For the Fiscal Year Ended
August 31, 2016 | |
| Shares | | | Dollars | | | Shares | | | Dollars | |
| | | | | | | | | | | | | | |
| | 2,122,974 | | | $ | 42,750,908 | | | | 1,770,746 | | | $ | 31,374,570 | |
| | 561,198 | | | | 10,202,588 | | | | 1,154,064 | | | | 20,565,422 | |
| | (3,463,681 | ) | | | (68,197,564 | ) | | | (4,430,997 | ) | | | (75,088,065 | ) |
| | (779,509 | ) | | | (15,244,068 | ) | | | (1,506,187 | ) | | | (23,148,073 | ) |
| | | | | | | | | | | | | | |
| | 242,799 | | | | 4,110,605 | | | | 311,683 | | | | 4,754,165 | |
| | 155,295 | | | | 2,396,207 | | | | 282,440 | | | | 4,341,104 | |
| | (1,075,976 | ) | | | (18,697,895 | ) | | | (717,473 | ) | | | (10,769,123 | ) |
| | (677,882 | ) | | | (12,191,083 | ) | | | (123,350 | ) | | | (1,673,854 | ) |
| | | | | | | | | | | | | | |
| | 1,178,660 | | | | 25,315,518 | | | | 1,051,764 | | | | 19,886,091 | |
| | 169,963 | | | | 3,363,564 | | | | 318,400 | | | | 6,126,021 | |
| | (2,093,144 | ) | | | (45,000,118 | ) | | | (2,053,226 | ) | | | (39,107,713 | ) |
| | (744,521 | ) | | | (16,321,036 | ) | | | (683,062 | ) | | | (13,095,601 | ) |
| | | | | | | | | | | | | | |
| | 542,582 | | | | 10,844,901 | | | | 378,536 | | | | 6,613,636 | |
| | 28,325 | | | | 506,163 | | | | 49,979 | | | | 877,134 | |
| | (341,783 | ) | | | (6,700,203 | ) | | | (405,820 | ) | | | (6,930,197 | ) |
| | 229,124 | | | | 4,650,861 | | | | 22,695 | | | | 560,573 | |
| | | | | | | | | | | | | | |
| | 877,816 | | | | 18,099,804 | | | | 83,801 | | | | 1,620,126 | |
| | 21,094 | | | | 412,820 | | | | 26,798 | | | | 511,029 | |
| | (295,943 | ) | | | (6,529,024 | ) | | | (94,969 | ) | | | (1,714,376 | ) |
| | 602,967 | | | | 11,983,600 | | | | 15,630 | | | | 416,779 | |
| | | | | | | | | | | | | | |
| | — | | | | — | | | | — | | | | — | |
| | — | | | | — | | | | — | | | | — | |
| | — | | | | — | | | | — | | | | — | |
| | — | | | | — | | | | — | | | | — | |
| | | | | | | | | | | | | | |
| | — | | | | — | | | | — | | | | — | |
| | — | | | | — | | | | — | | | | — | |
| | — | | | | — | | | | — | | | | — | |
| | — | | | | — | | | | — | | | | — | |
| | (1,369,821 | ) | | $ | (27,121,726 | ) | | | (2,274,274 | ) | | $ | (36,940,176 | ) |
125
Report of Independent Registered Public Accounting Firm
To the Board of Trustees of Goldman Sachs Trust and Shareholders of
the Goldman Sachs Capital Growth Fund, Goldman Sachs Concentrated Growth Fund, Goldman Sachs Dynamic U.S. Equity Fund, Goldman Sachs Flexible Cap Fund (formerly Goldman Sachs Flexible Cap Growth Fund), Goldman Sachs Growth Opportunities Fund, Goldman Sachs Small/Mid Cap Growth Fund, Goldman Sachs Strategic Growth Fund, and Goldman Sachs Technology Opportunities Fund:
In our opinion, the accompanying statements of assets and liabilities, including the schedules of investments, and the related statements of operations and of changes in net assets and the financial highlights present fairly, in all material respects, the financial position of the Goldman Sachs Capital Growth Fund, Goldman Sachs Concentrated Growth Fund, Goldman Sachs Dynamic U.S. Equity Fund, Goldman Sachs Flexible Cap Fund (formerly Goldman Sachs Flexible Cap Growth Fund), Goldman Sachs Growth Opportunities Fund, Goldman Sachs Small/Mid Cap Growth Fund, Goldman Sachs Strategic Growth Fund, and Goldman Sachs Technology Opportunities Fund (collectively the “Funds”), funds of the Goldman Sachs Trust, as of August 31, 2017, and the results of each of their operations for the year then ended, the changes in each of their net assets for each of the two years in the period then ended, and the financial highlights for each of the periods presented therein, in conformity with accounting principles generally accepted in the United States of America. These financial statements and financial highlights (hereafter referred to as “financial statements”) are the responsibility of the Funds’ management. Our responsibility is to express an opinion on these financial statements based on our audits. We conducted our audits of these financial statements in accordance with the standards of the Public Company Accounting Oversight Board (United States). Those standards require that we plan and perform the audit to obtain reasonable assurance about whether the financial statements are free of material misstatement. An audit includes examining, on a test basis, evidence supporting the amounts and disclosures in the financial statements, assessing the accounting principles used and significant estimates made by management, and evaluating the overall financial statement presentation. We believe that our audits, which included confirmation of securities as of August 31, 2017 by correspondence with the custodian, transfer agent of the underlying funds, and the application of alternative auditing procedures where securities purchased confirmations had not been received, provide a reasonable basis for our opinion.
PricewaterhouseCoopers LLP
Boston, Massachusetts
October 24, 2017
126
GOLDMAN SACHS FUNDAMENTAL EQUITY GROWTH FUNDS
Fund Expenses — Six Month Period Ended August 31, 2017 (Unaudited)
As a shareholder of Class A, Class C, Institutional, Service, Investor, Class R and Class R6 Shares of a Fund, you incur two types of costs: (1) transaction costs, including sales charges on purchase payments (with respect to Class A Shares), contingent deferred sales charges on redemptions (with respect to Class C Shares), and (2) ongoing costs, including management fees; distribution and/or service (12b-1) fees (with respect to Class A, Class C, Service and Class R Shares); and other Fund expenses. This Example is intended to help you understand your ongoing costs (in dollars) of investing in Class A, Class C, Institutional, Service, Investor, Class R or Class R6 Shares of the Funds and to compare these costs with the ongoing costs of investing in other mutual funds.
The Example is based on an investment of $1,000 invested at the beginning of the period and held for the entire period from March 1, 2017 through August 31, 2017, which represents a period of 184 days in a 365-day year.
Actual Expenses — The first line under each share class in the table below provides information about actual account values and actual expenses. You may use the information in this line, together with the amount you invested, to estimate the expenses that you paid over the period. Simply divide your account value by $1,000 (for example, an $8,600 account value divided by $1,000=8.6), then multiply the result by the number in the first line under the heading entitled “Expenses Paid” to estimate the expenses you paid on your account during this period.
Hypothetical Example for Comparison Purposes — The second line under each share class in the table below provides information about hypothetical account values and hypothetical expenses based on the Funds’ actual net expense ratios and an assumed rate of return of 5% per year before expenses, which is not the Funds’ actual return. The hypothetical account values and expenses may not be used to estimate the actual ending account balance or expenses you paid for the period. You may use this information to compare the ongoing costs of investing in the Funds and other funds. To do so, compare this 5% hypothetical example with the 5% hypothetical examples that appear in the shareholder reports of the other funds.
Please note that the expenses shown in the table are meant to highlight your ongoing costs only and do not reflect any transactional costs, such as sales charges, redemption fees, or exchange fees. Therefore, the second line of the table is useful in comparing ongoing costs only, and will not help you determine the relative total costs of owning different funds. In addition, if these transactional costs were included, your costs would have been higher.
| | | | | | | | | | | | | | | | | | | | | | | | | | | | | | | | | | | | | | | | | | | | | | | | |
| | | Capital Growth Fund | | | Concentrated Growth Fund | | | Dynamic U.S. Equity Fund | | | Flexible Cap Fund | |
| Share Class | | Beginning
Account
Value
3/1/17 | | | Ending
Account
Value
8/31/17 | | | Expenses
Paid for the
6 months ended
8/31/17* | | | Beginning
Account
Value
3/1/17 | | | Ending
Account
Value
8/31/17 | | | Expenses
Paid for the
6 months ended
8/31/17* | | | Beginning
Account
Value
3/1/17 | | | Ending
Account
Value
8/31/17 | | | Expenses
Paid for the
6 months ended
8/31/17* | | | Beginning
Account
Value
3/1/17 | | | Ending
Account
Value
8/31/17 | | | Expenses
Paid for the
6 months ended
8/31/17* | |
| Class A | | | | | | | | | | | | | | | | | | | | | | | | | | | | | | | | | | | | | | | | | | | | | | | | |
Actual | | $ | 1,000.00 | | | $ | 1,116.2 | | | $ | 6.13 | | | $ | 1,000.00 | | | $ | 1,102.60 | | | $ | 6.31 | | | $ | 1,000.00 | | | $ | 1,040.70 | | | $ | 5.81 | | | $ | 1,000.00 | | | $ | 1,118.30 | | | $ | 6.35 | |
Hypothetical 5% return | | | 1,000.00 | | | | 1,019.41 | + | | | 5.85 | | | | 1,000.00 | | | | 1,019.21 | + | | | 6.06 | | | | 1,000.00 | | | | 1,019.51 | + | | | 5.75 | | | | 1,000.00 | | | | 1,019.21 | + | | | 6.06 | |
| Class C | | | | | | | | | | | | | | | | | | | | | | | | | | | | | | | | | | | | | | | | | | | | | | | | |
Actual | | | 1,000.00 | | | | 1,112.10 | | | | 10.11 | | | | 1,000.00 | | | | 1,098.60 | | | | 10.26 | | | | 1,000.00 | | | | 1,036.80 | | | | 9.65 | | | | 1,000.00 | | | | 1,113.50 | | | | 10.33 | |
Hypothetical 5% return | | | 1,000.00 | | | | 1,015.63 | + | | | 9.65 | | | | 1,000.00 | | | | 1,015.43 | + | | | 9.86 | | | | 1,000.00 | | | | 1,015.73 | + | | | 9.55 | | | | 1,000.00 | | | | 1,015.43 | + | | | 9.86 | |
| Institutional | | | | | | | | | | | | | | | | | | | | | | | | | | | | | | | | | | | | | | | | | | | | | | | | |
Actual | | | 1,000.00 | | | | 1,118.60 | | | | 4.01 | | | | 1,000.00 | | | | 1,104.90 | | | | 4.35 | | | | 1,000.00 | | | | 1,042.60 | | | | 3.86 | | | | 1,000.00 | | | | 1,119.60 | | | | 4.38 | |
Hypothetical 5% return | | | 1,000.00 | | | | 1,021.42 | + | | | 3.82 | | | | 1,000.00 | | | | 1,021.07 | + | | | 4.18 | | | | 1,000.00 | | | | 1,021.42 | + | | | 3.82 | | | | 1,000.00 | | | | 1,021.07 | + | | | 4.18 | |
| Service | | | | | | | | | | | | | | | | | | | | | | | | | | | | | | | | | | | | | | | | | | | | | | | | |
Actual | | | 1,000.00 | | | | 1,116.00 | | | | 6.67 | | | | N/A | | | | N/A | | | | N/A | | | | N/A | | | | N/A | | | | N/A | | | | N/A | | | | N/A | | | | N/A | |
Hypothetical 5% return | | | 1,000.00 | | | | 1,018.90 | + | | | 6.36 | | | | N/A | | | | N/A | | | | N/A | | | | N/A | | | | N/A | | | | N/A | | | | N/A | | | | N/A | | | | N/A | |
| Investor | | | | | | | | | | | | | | | | | | | | | | | | | | | | | | | | | | | | | | | | | | | | | | | | |
Actual | | | 1,000.00 | | | | 1,117.80 | | | | 4.80 | | | | 1,000.00 | | | | 1,105.10 | | | | 4.99 | | | | 1,000.00 | | | | 1,041.90 | | | | 4.58 | | | | 1,000.00 | | | | 1,119.40 | | | | 5.02 | |
Hypothetical 5% return | | | 1,000.00 | | | | 1,020.67 | + | | | 4.58 | | | | 1,000.00 | | | | 1,020.47 | + | | | 4.79 | | | | 1,000.00 | | | | 1,020.72 | + | | | 4.53 | | | | 1,000.00 | | | | 1,020.47 | + | | | 4.79 | |
| Class R | | | | | | | | | | | | | | | | | | | | | | | | | | | | | | | | | | | | | | | | | | | | | | | | |
Actual | | | 1,000.00 | | | | 1,115.00 | | | | 7.46 | | | | 1,000.00 | | | | 1,101.60 | | | | 7.63 | | | | 1,000.00 | | | | 1,039.80 | | | | 7.04 | | | | 1,000.00 | | | | 1,116.80 | | | | 7.68 | |
Hypothetical 5% return | | | 1,000.00 | | | | 1,018.15 | + | | | 7.12 | | | | 1,000.00 | | | | 1,017.95 | + | | | 7.32 | | | | 1,000.00 | | | | 1,018.30 | + | | | 6.97 | | | | 1,000.00 | | | | 1,017.95 | + | | | 7.32 | |
| Class R6 | | | | | | | | | | | | | | | | | | | | | | | | | | | | | | | | | | | | | | | | | | | | | | | | |
Actual | | | 1,000.00 | | | | 1,118.60 | | | | 4.01 | | | | 1,000.00 | | | | 1,104.90 | | | | 4.30 | | | | 1,000.00 | | | | 1,042.60 | | | | 3.71 | | | | 1,000.00 | | | | 1,119.60 | | | | 4.33 | |
Hypothetical 5% return | | | 1,000.00 | | | | 1,021.42 | + | | | 3.82 | | | | 1,000.00 | | | | 1,021.12 | + | | | 4.13 | | | | 1,000.00 | | | | 1,021.58 | + | | | 3.67 | | | | 1,000.00 | | | | 1,021.12 | + | | | 4.13 | |
127
GOLDMAN SACHS FUNDAMENTAL EQUITY GROWTH FUNDS
Fund Expenses — Six Month Period Ended August 31, 2017 (Unaudited) (continued)
| | | | | | | | | | | | | | | | | | | | | | | | | | | | | | | | | | | | | | | | | | | | | | | | |
| | | Growth Opportunities Fund | | | Small/Mid Cap Growth Fund | | | Strategic Growth Fund | | | Technology Opportunities Fund | |
| Share Class | | Beginning
Account
Value
3/1/17 | | | Ending
Account
Value
8/31/17 | | | Expenses
Paid for the
6 months ended
8/31/17* | | | Beginning
Account
Value
3/1/17 | | | Ending
Account
Value
8/31/17 | | | Expenses
Paid for the
6 months ended
8/31/17* | | | Beginning
Account
Value
3/1/17 | | | Ending
Account
Value
8/31/17 | | | Expenses
Paid for the
6 months ended
8/31/17* | | | Beginning
Account
Value
3/1/17 | | | Ending
Account
Value
8/31/17 | | | Expenses
Paid for the
6 months ended
8/31/17* | |
| Class A | | | | | | | | | | | | | | | | | | | | | | | | | | | | | | | | | | | | | | | | | | | | | | | | |
Actual | | $ | 1,000.00 | | | $ | 1,099.50 | | | $ | 6.88 | | | $ | 1,000.00 | | | $ | 1,087.80 | | | $ | 6.74 | | | $ | 1,000.00 | | | $ | 1,113.00 | | | $ | 6.12 | | | $ | 1,000.00 | | | $ | 1,176.10 | | | $ | 7.62 | |
Hypothetical 5% return | | | 1,000.00 | | | | 1,018.65 | + | | | 6.61 | | | | 1,000.00 | | | | 1,018.75 | + | | | 6.51 | | | | 1,000.00 | | | | 1,019.41 | + | | | 5.85 | | | | 1,000.00 | | | | 1,018.20 | + | | | 7.07 | |
| Class C | | | | | | | | | | | | | | | | | | | | | | | | | | | | | | | | | | | | | | | | | | | | | | | | |
Actual | | | 1,000.00 | | | | 1,095.20 | | | | 10.83 | | | | 1,000.00 | | | | 1,083.80 | | | | 10.66 | | | | 1,000.00 | | | | 1,108.30 | | | | 10.10 | | | | 1,000.00 | | | | 1,171.70 | | | | 11.71 | |
Hypothetical 5% return | | | 1,000.00 | | | | 1,014.87 | + | | | 10.41 | | | | 1,000.00 | | | | 1,014.97 | + | | | 10.31 | | | | 1,000.00 | | | | 1,015.63 | + | | | 9.65 | | | | 1,000.00 | | | | 1,014.42 | + | | | 10.87 | |
| Institutional | | | | | | | | | | | | | | | | | | | | | | | | | | | | | | | | | | | | | | | | | | | | | | | | |
Actual | | | 1,000.00 | | | | 1,101.20 | | | | 5.03 | | | | 1,000.00 | | | | 1,090.20 | | | | 4.85 | | | | 1,000.00 | | | | 1,114.70 | | | | 4.00 | | | | 1,000.00 | | | | 1,178.50 | | | | 5.44 | |
Hypothetical 5% return | | | 1,000.00 | | | | 1,020.42 | + | | | 4.84 | | | | 1,000.00 | | | | 1,020.57 | + | | | 4.69 | | | | 1,000.00 | | | | 1,021.42 | + | | | 3.82 | | | | 1,000.00 | | | | 1,020.21 | + | | | 5.04 | |
| Service | | | | | | | | | | | | | | | | | | | | | | | | | | | | | | | | | | | | | | | | | | | | | | | | |
Actual | | | 1,000.00 | | | | 1,098.70 | | | | 7.67 | | | | 1,000.00 | | | | 1,086.60 | | | | 7.47 | | | | 1,000.00 | | | | 1,112.00 | | | | 6.65 | | | | 1,000.00 | | | | 1,176.10 | | | | 8.17 | |
Hypothetical 5% return | | | 1,000.00 | | | | 1,017.90 | + | | | 7.38 | | | | 1,000.00 | | | | 1,018.05 | + | | | 7.22 | | | | 1,000.00 | | | | 1,018.90 | + | | | 6.36 | | | | 1,000.00 | | | | 1,017.69 | + | | | 7.58 | |
| Investor | | | | | | | | | | | | | | | | | | | | | | | | | | | | | | | | | | | | | | | | | | | | | | | | |
Actual | | | 1,000.00 | | | | 1,100.80 | | | | 5.56 | | | | 1,000.00 | | | | 1,089.10 | | | | 5.42 | | | | 1,000.00 | | | | 1,114.00 | | | | 4.80 | | | | 1,000.00 | | | | 1,177.80 | | | | 6.26 | |
Hypothetical 5% return | | | 1,000.00 | | | | 1,019.91 | + | | | 5.35 | | | | 1,000.00 | | | | 1,020.01 | + | | | 5.24 | | | | 1,000.00 | | | | 1,020.67 | + | | | 4.58 | | | | 1,000.00 | | | | 1,019.46 | + | | | 5.80 | |
| Class R | | | | | | | | | | | | | | | | | | | | | | | | | | | | | | | | | | | | | | | | | | | | | | | | |
Actual | | | 1,000.00 | | | | 1,097.90 | | | | 8.20 | | | | 1,000.00 | | | | 1,086.20 | | | | 8.05 | | | | 1,000.00 | | | | 1,111.50 | | | | 7.45 | | | | N/A | | | | N/A | | | | — | |
Hypothetical 5% return | | | 1,000.00 | | | | 1,017.39 | + | | | 7.88 | | | | 1,000.00 | | | | 1,017.49 | + | | | 7.78 | | | | 1,000.00 | | | | 1,018.15 | + | | | 7.12 | | | | N/A | | | | N/A | | | | N/A | |
| Class R6 | | | | | | | | | | | | | | | | | | | | | | | | | | | | | | | | | | | | | | | | | | | | | | | | |
Actual | | | 1,000.00 | | | | 1,101.60 | | | | 4.93 | | | | 1,000.00 | | | | 1,090.20 | | | | 4.74 | | | | 1,000.00 | | | | 1,114.80 | | | | 3.94 | | | | N/A | | | | N/A | | | | — | |
Hypothetical 5% return | | | 1,000.00 | | | | 1,020.52 | + | | | 4.74 | | | | 1,000.00 | | | | 1,020.67 | + | | | 4.58 | | | | 1,000.00 | | | | 1,021.47 | + | | | 3.77 | | | | N/A | | | | N/A | | | | N/A | |
| * | | Expenses for each share class are calculated using each Fund’s annualized net expense ratio for each class, which represents the ongoing expenses as a percentage of net assets for the six months ended August 31, 2017. Expenses are calculated by multiplying the annualized net expense ratio by the average account value for the period; then multiplying the result by the number of days in the most recent fiscal half year; and then dividing that result by the number of days in the fiscal year. The annualized net expense ratios for the period were as follows: |
| | | | | | | | | | | | | | | | | | | | | | | | | | | | |
| Fund | | Class A | | | Class C | | | Institutional | | | Service | | | Investor | | | Class R | | | Class R6 | |
Capital Growth | | | 1.15 | % | | | 1.90 | % | | | 0.75 | % | | | 1.25 | % | | | 0.90 | % | | | 1.40 | % | | | 0.75 | % |
Concentrated Growth | | | 1.19 | | | | 1.94 | | | | 0.82 | | | | N/A | | | | 0.94 | | | | 1.44 | | | | 0.81 | |
Dynamic U.S. Equity | | | 1.13 | | | | 1.88 | | | | 0.75 | | | | N/A | | | | 0.89 | | | | 1.37 | | | | 0.72 | |
Flexible Cap | | | 1.19 | | | | 1.94 | | | | 0.82 | | | | N/A | | | | 0.94 | | | | 1.44 | | | | 0.81 | |
Growth Opportunities | | | 1.30 | | | | 2.05 | | | | 0.95 | | | | 1.45 | | | | 1.05 | | | | 1.55 | | | | 0.93 | |
Small/Mid Cap Growth | | | 1.28 | | | | 2.03 | | | | 0.92 | | | | 1.42 | | | | 1.03 | | | | 1.53 | | | | 0.90 | |
Strategic Growth | | | 1.15 | | | | 1.90 | | | | 0.75 | | | | 1.25 | | | | 0.90 | | | | 1.40 | | | | 0.74 | |
Technology Opportunities | | | 1.39 | | | | 2.14 | | | | 0.99 | | | | 1.49 | | | | 1.14 | | | | N/A | | | | N/A | |
| + | | Hypothetical expenses are based on each Fund’s actual annualized net expense ratios and an assumed rate of return of 5% per year before expenses. |
128
GOLDMAN SACHS FUNDAMENTAL EQUITY GROWTH FUNDS
Statement Regarding Basis for Approval of Management Agreement (Unaudited)
Background
The Goldman Sachs Capital Growth Fund, Goldman Sachs Concentrated Growth Fund, Goldman Sachs Dynamic U.S. Equity Fund, Goldman Sachs Flexible Cap Fund (formerly, Goldman Sachs Flexible Cap Growth Fund), Goldman Sachs Growth Opportunities Fund, Goldman Sachs Small/Mid Cap Growth Fund, Goldman Sachs Strategic Growth Fund, and Goldman Sachs Technology Opportunities Fund (the “Funds”) are investment portfolios of Goldman Sachs Trust (the “Trust”). The Board of Trustees oversees the management of the Trust and reviews the investment performance and expenses of the Funds at regularly scheduled meetings held throughout the year. In addition, the Board of Trustees determines annually whether to approve the continuance of the Trust’s investment management agreement (the “Management Agreement”) with Goldman Sachs Asset Management, L.P. (the “Investment Adviser”) on behalf of the Funds.
The Management Agreement was most recently approved for continuation until June 30, 2018 by the Board of Trustees, including those Trustees who are not parties to the Management Agreement or “interested persons” (as defined in the Investment Company Act of 1940, as amended) of any party thereto (the “Independent Trustees”), at a meeting held on June 14-15, 2017 (the “Annual Meeting”).
The review process undertaken by the Trustees spans the course of the year and culminates with the Annual Meeting. To assist the Trustees in their deliberations, the Trustees have established a Contract Review Committee (the “Committee”), comprised of the Independent Trustees. The Committee held four meetings over the course of the year since the Management Agreement was last approved. At those Committee meetings, regularly scheduled Board or other committee meetings, and/or the Annual Meeting, matters relevant to the renewal of the Management Agreement were considered by the Board, or the Independent Trustees, as applicable. With respect to each Fund, such matters included:
| | (a) | | the nature and quality of the advisory, administrative, and other services provided to the Fund by the Investment Adviser and its affiliates, including information about: |
| | (i) | | the structure, staff, and capabilities of the Investment Adviser and its portfolio management teams; |
| | (ii) | | the groups within the Investment Adviser and its affiliates that support the portfolio management teams or provide other types of necessary services, including fund services groups (e.g., accounting and financial reporting, tax, shareholder services, and operations); controls and risk management groups (e.g., legal, compliance, valuation oversight, credit risk management, internal audit, compliance testing, market risk analysis, finance, and central funding); sales and distribution support groups, and others (e.g., information technology and training); |
| | (iii) | | trends in employee headcount; |
| | (iv) | | the Investment Adviser’s financial resources and ability to hire and retain talented personnel and strengthen its operations; and |
| | (v) | | the parent company’s support of the Investment Adviser and its mutual fund business, as expressed by the firm’s senior management; |
129
GOLDMAN SACHS FUNDAMENTAL EQUITY GROWTH FUNDS
Statement Regarding Basis for Approval of Management Agreement (Unaudited) (continued)
| | (b) | | information on the investment performance of the Fund, including comparisons to the performance of similar mutual funds, as provided by a third-party mutual fund data provider engaged as part of the contract review process (the “Outside Data Provider”), a benchmark performance index, and, (in the case of the Concentrated Growth, Growth Opportunities, Small/Mid Cap Growth, and Strategic Growth Funds), a composite of accounts with comparable investment strategies managed by the Investment Adviser; and information on general investment outlooks in the markets in which the Fund invests; |
| | (c) | | information provided by the Investment Adviser indicating the Investment Adviser’s views on whether the Fund’s peer group and/or benchmark index had high, medium, or low relevance given the Fund’s particular investment strategy; |
| | (d) | | the terms of the Management Agreement and other agreements with affiliated service providers entered into by the Trust on behalf of the Fund; |
| | (e) | | fee and expense information for the Fund, including: |
| | (i) | | the relative management fee and expense levels of the Fund as compared to those of comparable funds managed by other advisers, as provided by the Outside Data Provider; |
| | (ii) | | the Fund’s expense trends over time; and |
| | (iii) | | to the extent the Investment Adviser manages other types of accounts (such as bank collective trusts, private wealth management accounts, institutional separate accounts, sub-advised mutual funds, and non-U.S. funds) having investment objectives and policies similar to those of the Fund, comparative information on the advisory fees charged and services provided to those accounts by the Investment Adviser; |
| | (f) | | with respect to the extensive investment performance and expense comparison data provided by the Outside Data Provider, its processes in producing that data for the Fund; |
| | (g) | | the undertakings of the Investment Adviser and its affiliates to implement fee waivers and/or expense limitations; |
| | (h) | | information relating to the profitability of the Management Agreement and the transfer agency and distribution and service arrangements of the Fund to the Investment Adviser and its affiliates; |
| | (i) | | whether the Fund’s existing management fee schedule adequately addressed any economies of scale; |
| | (j) | | a summary of the “fall-out” benefits derived by the Investment Adviser and its affiliates from their relationships with the Fund, including the fees received by the Investment Adviser’s affiliates from the Fund for transfer agency, portfolio trading, distribution and other services; |
| | (k) | | a summary of potential benefits derived by the Fund as a result of its relationship with the Investment Adviser; |
| | (l) | | information regarding commissions paid by the Fund and broker oversight, an update on the Investment Adviser’s soft dollars practices, other information regarding portfolio trading, and how the Investment Adviser carries out its duty to seek best execution; |
| | (m) | | portfolio manager ownership of Fund shares; the manner in which portfolio manager compensation is determined; and the number and types of accounts managed by the portfolio managers; |
| | (n) | | the nature and quality of the services provided to the Fund by its unaffiliated service providers, and the Investment Adviser’s general oversight and evaluation (including reports on due diligence) of those service providers as part of the administrative services provided under the Management Agreement; and |
| | (o) | | the Investment Adviser’s processes and policies addressing various types of potential conflicts of interest; its approach to risk management; the annual review of the effectiveness of the Fund’s compliance program; and periodic compliance reports. |
130
GOLDMAN SACHS FUNDAMENTAL EQUITY GROWTH FUNDS
Statement Regarding Basis for Approval of Management Agreement (Unaudited) (continued)
The Trustees also received an overview of the Funds’ distribution arrangements. They received information regarding the Funds’ assets, share purchase and redemption activity, and payment of distribution, service, and shareholder administration fees, as applicable. Information was also provided to the Trustees relating to revenue sharing payments made by and services provided by the Investment Adviser and its affiliates to intermediaries that promote the sale, distribution, and/or servicing of Fund shares. The Independent Trustees also discussed the broad range of other investment choices that are available to Fund investors, including the availability of comparable funds managed by other advisers.
The presentations made at the Board and Committee meetings and at the Annual Meeting encompassed the Funds and other mutual funds for which the Board of Trustees has responsibility. In evaluating the Management Agreement at the Annual Meeting, the Trustees relied upon their knowledge, resulting from their meetings and other interactions throughout the year, of the Investment Adviser and its affiliates, their services, and the Funds. In conjunction with these meetings, the Trustees received written materials and oral presentations on the topics covered, and the Investment Adviser addressed the questions and concerns of the Trustees, including concerns regarding the investment performance of certain of the funds they oversee. The Independent Trustees were advised by their independent legal counsel regarding their responsibilities and other regulatory requirements related to the approval and continuation of mutual fund investment management agreements under applicable law. In addition, the Investment Adviser and its affiliates provided the Independent Trustees with a written response to a formal request for information sent on behalf of the Independent Trustees by their independent legal counsel. During the course of their deliberations, the Independent Trustees met in executive sessions with their independent legal counsel, without representatives of the Investment Adviser or its affiliates present.
Nature, Extent, and Quality of the Services Provided Under the Management Agreement
As part of their review, the Trustees considered the nature, extent, and quality of the services provided to the Funds by the Investment Adviser. In this regard, the Trustees considered both the investment advisory services and non-advisory services that are provided by the Investment Adviser and its affiliates. The Trustees noted the transition in the leadership and changes in personnel of various of the Investment Adviser’s portfolio management teams that had occurred in recent periods, and the ongoing recruitment efforts aimed at bringing high quality investment talent to the Investment Adviser. They also noted the Investment Adviser’s commitment to maintaining high quality systems and expending substantial resources to respond to ongoing changes to the regulatory and control environment in which the Funds and their service providers operate, as well as the efforts of the Investment Adviser and its affiliates to combat cyber security risks. The Trustees concluded that the Investment Adviser continued to commit substantial financial and operational resources to the Funds and expressed confidence that the Investment Adviser would continue to do so in the future. The Trustees also recognized that the Investment Adviser had made significant commitments to address regulatory compliance requirements applicable to the Funds and the Investment Adviser and its affiliates.
131
GOLDMAN SACHS FUNDAMENTAL EQUITY GROWTH FUNDS
Statement Regarding Basis for Approval of Management Agreement (Unaudited) (continued)
Investment Performance
The Trustees also considered the investment performance of the Funds. In this regard, they compared the investment performance of each Fund to its peers using rankings and ratings compiled by the Outside Data Provider as of December 31, 2016, and updated performance information prepared by the Investment Adviser using the peer group identified by the Outside Data Provider as of March 31, 2017. The information on each Fund’s investment performance was provided for the one-, three-, five-, and ten-year periods ending on the applicable dates, to the extent that each Fund had been in existence for those periods. The Trustees also reviewed each Fund’s investment performance relative to its performance benchmark. As part of this review, they considered the investment performance trends of the Funds over time, and reviewed the investment performance of each Fund in light of its investment objective and policies and market conditions. The Trustees also received information comparing the Concentrated Growth, Growth Opportunities, Small/Mid Cap Growth, and Strategic Growth Funds’ performance to that of composites of accounts with comparable investment strategies managed by the Investment Adviser.
In addition, the Trustees considered materials prepared and presentations made by the Investment Adviser’s senior management and portfolio management personnel in which Fund performance was assessed. The Trustees also considered the Investment Adviser’s periodic reports with respect to the Funds’ risk profiles, and how the Investment Adviser’s approach to risk monitoring and management influences portfolio management.
The Trustees noted that the Capital Growth Fund’s Institutional Shares had placed in the second quartile of the Fund’s peer group for the one-, three-, five-, and ten-year periods ended March 31, 2017, and had outperformed the Fund’s benchmark index for the one-year period and underperformed for the three-, five-, and ten-year periods ended April 30, 2017. They noted that the Concentrated Growth Fund’s Institutional Shares had placed in the third quartile of the Fund’s peer group for the one-, three-, five-, and ten-year periods ended March 31, 2017, and had outperformed the Fund’s benchmark index for the one-year period and underperformed for the three-, five-, and ten-year periods ended April 30, 2017. They also noted that they had approved the reorganization of the Goldman Sachs Focused Growth Fund into the Concentrated Growth Fund, effective in July 2017. The Trustees noted that the Dynamic U.S. Equity Fund’s Institutional Shares had placed in the first quartile of the Fund’s peer group for the one-year period and in the third quartile for the three- and five-year periods ended March 31, 2017, and had outperformed the Fund’s benchmark index for the one-year period and underperformed for the three- and five-year periods ended April 30, 2017. The Trustees noted that the Flexible Cap Fund’s Institutional Shares had placed in the second quartile of the Fund’s peer group and had underperformed the Fund’s benchmark index for the one-, three-, and five-year periods ended March 31, 2017. They also noted that they had approved the repositioning of the Flexible Cap Fund and changing the Fund’s name, effective in August 2017. The Trustees noted that the Growth Opportunities Fund’s Institutional Shares had placed in the first quartile of the Fund’s peer group for the ten-year period, in the third quartile for the five-year period, and in the fourth quartile for the one- and three-year periods, and had outperformed the Fund’s benchmark index for the ten-year period and underperformed for the one-, three-, and five-year periods ended March 31, 2017. The Trustees observed that the Small/Mid Cap Growth Fund’s Institutional Shares had placed in the top half of the Fund’s peer group for the one-, five-, and ten-year periods and placed in the third quartile for the three-year period, and had outperformed the Fund’s benchmark index for the ten-year period and underperformed the Fund’s benchmark for the one-, three-, and five-year periods ended March 31, 2017. They observed that the Strategic Growth Fund’s Institutional Shares had placed in the second quartile of the Fund’s peer group for the three-, five-, and ten-year periods and in the third quartile for the one-year period ended March 31, 2017, and had outperformed the Fund’s benchmark index for the one-year period and underperformed for the three-, five-, and ten-year periods ended April 30, 2017. They observed that the Technology Opportunities Fund’s Institutional Shares had placed in the top half of the Fund’s peer group for the one- and ten-year periods and in the third quartile for the three- and five-year periods, and had underperformed the Fund’s benchmark index for the one-, three-, five-, and ten-year periods ended March 31, 2017.
132
GOLDMAN SACHS FUNDAMENTAL EQUITY GROWTH FUNDS
Statement Regarding Basis for Approval of Management Agreement (Unaudited) (continued)
Costs of Services Provided and Competitive Information
The Trustees considered the contractual terms of the Management Agreement and the fee rates payable by each Fund thereunder. In this regard, the Trustees considered information on the services rendered by the Investment Adviser to the Funds, which included both advisory and administrative services that were directed to the needs and operations of the Funds as registered mutual funds.
In particular, the Trustees reviewed analyses prepared by the Outside Data Provider regarding the expense rankings of the Funds. The analyses provided a comparison of each Fund’s management fee and breakpoints to those of a relevant peer group and category universe; an expense analysis which compared each Fund’s overall net and gross expenses to a peer group and a category universe; and data comparing each Fund’s net expenses to the peer and category medians. The analyses also compared each Fund’s transfer agency, custody, and distribution fees, other expenses and fee waivers/reimbursements to those of the peer group and category medians. The Trustees concluded that the comparisons provided by the Outside Data Provider were useful in evaluating the reasonableness of the management fees and total expenses paid by the Funds.
With respect to the Capital Growth, Concentrated Growth, Flexible Cap, Growth Opportunities, Small/Mid Cap Growth, Strategic Growth, and Technology Opportunities Funds, the Trustees noted that the management fee breakpoint schedules were being reduced at all asset levels. In addition, the Trustees considered the Investment Adviser’s undertakings to implement fee waivers and/or expense limitations. They also considered, to the extent that the Investment Adviser manages other types of accounts having investment objectives and policies similar to those of the Funds, comparative fee information for services provided by the Investment Adviser to those accounts, and information that indicated that services provided to the Funds differed in various significant respects from the services provided to other types of accounts which, in many cases, operated under less stringent legal and regulatory structures, required fewer services from the Investment Adviser to a smaller number of client contact points, and were less time-intensive.
In addition, the Trustees noted that shareholders are able to redeem their Fund shares at any time if shareholders believe that the Fund fees and expenses are too high or if they are dissatisfied with the performance of the Fund.
Profitability
The Trustees reviewed each Fund’s contribution to the Investment Adviser’s revenues and pre-tax profit margins. In this regard the Trustees noted that they had received, among other things, profitability analyses and summaries, revenue and expense schedules by Fund and by function (i.e., investment management, transfer agency and distribution and service), and information on the Investment Adviser’s expense allocation methodology. They observed that the profitability and expense figures are substantially similar to those used by the Investment Adviser for many internal purposes, including compensation decisions among various business groups, and are thus subject to a vigorous internal debate about how certain revenue and expenses should be allocated. The Trustees also noted that the internal audit group within the Goldman Sachs organization had audited the expense allocation methodology and that the internal audit group was satisfied with the reasonableness, consistency, and accuracy of the Investment Adviser’s expense allocation methodology and profitability analysis calculations. Profitability data for each Fund was provided for 2016 and 2015, and the Trustees considered this information in relation to the Investment Adviser’s overall profitability.
133
GOLDMAN SACHS FUNDAMENTAL EQUITY GROWTH FUNDS
Statement Regarding Basis for Approval of Management Agreement (Unaudited) (continued)
Economies of Scale
The Trustees considered the information that had been provided regarding the Investment Adviser’s profitability. The Trustees also considered the breakpoints in the fee rate payable under the Management Agreement for each of the Funds at the following annual percentage rates of the average daily net assets of the Funds:
| | | | | | | | | | | | | | | | |
Average Daily
Net Assets | | Capital
Growth Fund | | | Concentrated
Growth Fund | | | Dynamic U.S.
Equity Fund | | | Flexible
Cap Fund | |
| First $1 billion | | | 1.00 | % | | | 1.00 | % | | | 0.70 | % | | | 1.00 | % |
| Next $1 billion | | | 0.90 | | | | 0.90 | | | | 0.63 | | | | 0.90 | |
| Next $3 billion | | | 0.80 | | | | 0.86 | | | | 0.60 | | | | 0.86 | |
| Next $3 billion | | | 0.80 | | | | 0.84 | | | | 0.59 | | | | 0.84 | |
| Over $8 billion | | | 0.80 | | | | 0.82 | | | | 0.58 | | | | 0.82 | |
| | | | | | | | | | | | | | | | |
Average Daily Net Assets | | Growth
Opportunities
Fund | | | Small/Mid
Cap
Growth Fund | | | Strategic
Growth Fund | | | Technology
Opportunities
Fund | |
| First $1 billion | | | 1.00 | % | | | 1.00 | % | | | 1.00 | % | | | 1.00 | % |
| Next $1 billion | | | 1.00 | | | | 1.00 | | | | 0.90 | | | | 0.90 | |
| Next $3 billion | | | 0.90 | | | | 0.90 | | | | 0.86 | | | | 0.86 | |
| Next $3 billion | | | 0.86 | | | | 0.86 | | | | 0.84 | | | | 0.84 | |
| Over $8 billion | | | 0.84 | | | | 0.84 | | | | 0.82 | | | | 0.82 | |
The Trustees noted that the breakpoints were designed to share potential economies of scale, if any, with the Funds and their shareholders as assets under management reach those asset levels. The Trustees considered the amounts of assets in the Funds; the Funds’ recent share purchase and redemption activity; the information provided by the Investment Adviser relating to the costs of the services provided by the Investment Adviser and its affiliates and their realized profits; information comparing fee rates charged by the Investment Adviser with fee rates charged to other funds in the peer groups; and the Investment Adviser’s undertakings to waive a portion of its management fee (with respect to the Capital Growth, Concentrated Growth, Flexible Cap, Growth Opportunities, Small/Mid Cap Growth, Strategic Growth, and Technology Opportunities Funds) and to limit certain expenses of the Funds that exceed specified levels, as well as Goldman Sachs & Co. LLC’s (“Goldman Sachs”) undertaking to waive a portion of the transfer agency fees paid by the Concentrated Growth, Dynamic U.S. Equity, Flexible Cap, Growth Opportunities and Small/Mid Cap Growth Funds’ Class A, Class C, Investor (formerly Class IR Shares), Class R, and Class T Shares, as applicable. Upon reviewing these matters at the Annual Meeting, the Trustees concluded that the fee breakpoints represented a means of assuring that benefits of scalability, if any, would be passed along to shareholders at the specified asset levels. They also noted that the Investment Adviser had passed along savings to shareholders of the Growth Opportunities and Small/Mid Cap Growth Funds, which had asset levels above at least the first breakpoint during the prior fiscal year.
134
GOLDMAN SACHS FUNDAMENTAL EQUITY GROWTH FUNDS
Statement Regarding Basis for Approval of Management Agreement (Unaudited) (continued)
Other Benefits to the Investment Adviser and Its Affiliates
The Trustees also considered the other benefits derived by the Investment Adviser and its affiliates from their relationships with the Funds as stated above, including: (a) transfer agency fees received by Goldman Sachs; (b) brokerage and futures commissions earned by Goldman Sachs for executing securities and futures transactions on behalf of the Funds; (c) research received by the Investment Adviser from broker-dealers in exchange for executing certain transactions on behalf of the Funds; (d) trading efficiencies resulting from aggregation of orders of the Funds with those for other funds or accounts managed by the Investment Adviser; (e) the Investment Adviser’s ability to leverage the infrastructure designed to service the Funds on behalf of its other clients; (f) the Investment Adviser’s ability to cross-market other products and services to Fund shareholders; (g) Goldman Sachs’ retention of certain fees as Fund Distributor; (h) the Investment Adviser’s ability to negotiate better pricing with custodians on behalf of its other clients, as a result of the relationship with the Funds; and (i) the possibility that the working relationship between the Investment Adviser and the Funds’ third-party service providers may cause those service providers to be more likely to do business with other areas of Goldman Sachs. In the course of considering the foregoing, the Independent Trustees requested and received further information quantifying certain of these fall-out benefits.
Other Benefits to the Funds and Their Shareholders
The Trustees also noted that the Funds receive certain potential benefits as a result of their relationship with the Investment Adviser, including: (a) trading efficiencies resulting from aggregation of orders of the Funds with those of other funds or accounts managed by the Investment Adviser; (b) enhanced servicing from vendors because of the volume of business generated by the Investment Adviser and its affiliates; (c) enhanced servicing from broker-dealers because of the volume of business generated by the Investment Adviser and its affiliates; (d) the Investment Adviser’s knowledge and experience gained from managing other accounts and products; (e) the Investment Adviser’s ability to hire and retain qualified personnel to provide services to the Funds because of the reputation of the Goldman Sachs organization; (f) the Funds’ access, through the Investment Adviser, to certain firmwide resources (e.g., proprietary risk management systems and databases), subject to certain restrictions; and (g) the Funds’ access to certain affiliated distribution channels. In addition, the Trustees noted the competitive nature of the mutual fund marketplace, and considered that many of the Funds’ shareholders invested in the Funds in part because of the Funds’ relationship with the Investment Adviser and that those shareholders have a general expectation that the relationship will continue.
Conclusion
In connection with their consideration of the Management Agreement, the Trustees gave weight to each of the factors described above, but did not identify any particular factor as controlling their decision. After deliberation and consideration of all of the information provided, including the factors described above, the Trustees concluded, in the exercise of their business judgment, that the management fees paid by each of the Funds were reasonable in light of the services provided to it by the Investment Adviser, the Investment Adviser’s costs and each Fund’s current and reasonably foreseeable asset levels. The Trustees unanimously concluded that the Investment Adviser’s continued management likely would benefit each Fund and its shareholders and that the Management Agreement should be approved and continued with respect to each Fund until June 30, 2018.
135
GOLDMAN SACHS FUNDAMENTAL EQUITY GROWTH FUNDS
Trustees and Officers (Unaudited) Independent Trustees
| | | | | | | | | | |
Name, Address and Age1 | | Position(s) Held with the Trust | | Term of Office and Length of Time Served2 | | Principal Occupation(s) During Past 5 Years | | Number of Portfolios in Fund Complex Overseen by Trustee3 | | Other Directorships Held by Trustee4 |
Ashok N. Bakhru Age: 75 | | Chairman of the Board of Trustees | | Since 1996 (Trustee since 1991) | | Mr. Bakhru is retired. He was formerly Chairman of the Board of Trustees, Goldman Sachs Trust II (2012-2016), Goldman Sachs MLP Income Opportunities Fund (2013-2016), Goldman Sachs MLP and Energy Renaissance Fund (2014-2016), and Goldman Sachs ETF Trust (2014-2016); Director, Apollo Investment Corporation (a business development company) (2008-2013); President, ABN Associates (a management and financial consulting firm) (1994-1996 and 1998- 2012); Trustee, Scholarship America (1998-2005); Trustee, Institute for Higher Education Policy (2003-2008); Director, Private Equity Investors — III and IV (1998-2007), and Equity-Linked Investors II (April 2002-2007). Chairman of the Board of Trustees — Goldman Sachs Trust; Goldman Sachs Variable Insurance Trust; Goldman Sachs BDC, Inc.; and Goldman Sachs Private Middle Market Credit LLC. | | 106 | | None |
Kathryn A. Cassidy Age: 63 | | Trustee | | Since 2015 | | Ms. Cassidy is retired. Formerly, she was Advisor to the Chairman (May 2014-December 2014); and Senior Vice President and Treasurer (2008-2014), General Electric Company & General Electric Capital Corporation (technology and financial services companies). Trustee — Goldman Sachs Trust and Goldman Sachs Variable Insurance Trust. | | 104 | | None |
Diana M. Daniels Age: 68 | | Trustee | | Since 2007 | | Ms. Daniels is retired. Formerly, she was Vice President, General Counsel and Secretary, The Washington Post Company (1991-2006). Ms. Daniels is a Trustee Emeritus and serves as a Presidential Councillor of Cornell University (2013-Present); former Member of the Legal Advisory Board, New York Stock Exchange (2003- 2006) and of the Corporate Advisory Board, Standish Mellon Management Advisors (2006- 2007). Trustee — Goldman Sachs Trust and Goldman Sachs Variable Insurance Trust. | | 104 | | None |
Herbert J. Markley Age: 67 | | Trustee | | Since 2013 | | Mr. Markley is retired. Formerly, he was Executive Vice President, Deere & Company (an agricultural and construction equipment manufacturer) (2007- 2009); and President, Agricultural Division, Deere & Company (2001-2007). Previously, Mr. Markley served as an Advisory Board Member of Goldman Sachs Trust and Goldman Sachs Variable Insurance Trust (June 2013-October 2013). Trustee — Goldman Sachs Trust and Goldman Sachs Variable Insurance Trust. | | 104 | | None |
Jessica Palmer Age: 68 | | Trustee | | Since 2007 | | Ms. Palmer is retired. She is Director, Emerson Center for the Arts and Culture (2011-Present); and was formerly a Consultant, Citigroup Human Resources Department (2007-2008); Managing Director, Citigroup Corporate and Investment Banking (previously, Salomon Smith Barney/ Salomon Brothers) (1984-2006). Ms. Palmer was a Member of the Board of Trustees of Indian Mountain School (private elementary and secondary school) (2004-2009). Trustee — Goldman Sachs Trust and Goldman Sachs Variable Insurance Trust. | | 104 | | None |
| | | | | | | | | | |
136
GOLDMAN SACHS FUNDAMENTAL EQUITY GROWTH FUNDS
Trustees and Officers (Unaudited) (continued) Independent Trustees
| | | | | | | | | | |
Name, Address and Age1 | | Position(s) Held with the Trust | | Term of Office and Length of Time Served2 | | Principal Occupation(s) During Past 5 Years | | Number of Portfolios in Fund Complex Overseen by Trustee3 | | Other Directorships Held by Trustee4 |
Roy W. Templin Age: 57 | | Trustee | | Since 2013 | | Mr. Templin is retired. He is Director, Armstrong World Industries, Inc. (a designer and manufacturer of ceiling, wall and suspension system solutions) (2016-Present); and was formerly Chairman of the Board of Directors, Con-Way Incorporated (a transportation, logistics and supply chain management service company) (2014-2015); Executive Vice President and Chief Financial Officer, Whirlpool Corporation (an appliance manufacturer and marketer) (2004- 2012). Previously, Mr. Templin served as an Advisory Board Member of Goldman Sachs Trust and Goldman Sachs Variable Insurance Trust (June 2013-October 2013). Trustee — Goldman Sachs Trust and Goldman Sachs Variable Insurance Trust. | | 104 | | Armstrong World Industries, Inc. (a ceiling, wall and suspension system solutions manufacturer) |
Gregory G. Weaver Age: 65 | | Trustee | | Since 2015 | | Mr. Weaver is retired. He is Director, Verizon Communications Inc. (2015-Present); and was formerly Chairman and Chief Executive Officer, Deloitte & Touche LLP (a professional services firm) (2001-2005 and 2012-2014); and Member of the Board of Directors, Deloitte & Touche LLP (2006-2012). Trustee — Goldman Sachs Trust and Goldman Sachs Variable Insurance Trust. | | 104 | | Verizon Communications Inc. |
| | | | | | | | | | |
137
GOLDMAN SACHS FUNDAMENTAL EQUITY GROWTH FUNDS
Trustees and Officers (Unaudited) (continued) Interested Trustee*
| | | | | | | | | | |
Name, Address and Age1 | | Position(s) Held with the Trust | | Term of Office and Length of Time Served2 | | Principal Occupation(s) During Past 5 Years | | Number of Portfolios in Fund Complex Overseen by Trustee3 | | Other Directorships Held by Trustee4 |
James A. McNamara Age: 54 | | President and Trustee | | Since 2007 | | Managing Director, Goldman Sachs (December 1998-Present); Director of Institutional Fund Sales, GSAM (April 1998-December 2000); and Senior Vice President and Manager, Dreyfus Institutional Service Corporation (January 1993- April 1998). President and Trustee — Goldman Sachs Trust; Goldman Sachs Variable Insurance Trust; Goldman Sachs Trust II; Goldman Sachs MLP Income Opportunities Fund; Goldman Sachs MLP and Energy Renaissance Fund; and Goldman Sachs ETF Trust. | | 142 | | None |
| | | | | | | | | | |
| * | | Mr. McNamara is considered to be an “Interested Trustee” because he holds positions with Goldman Sachs and owns securities issued by The Goldman Sachs Group, Inc. Mr. McNamara holds comparable positions with certain other companies of which Goldman Sachs, GSAM or an affiliate thereof is the investment adviser, administrator and/or distributor. |
| 1 | | Each Trustee may be contacted by writing to the Trustee, c/o Goldman Sachs, 200 West Street, New York, New York, 10282, Attn: Caroline Kraus. Information is provided as of August 31, 2017. |
| 2 | | Subject to such policies as may be adopted by the Board from time-to-time, each Trustee holds office for an indefinite term, until the earliest of: (a) the election of his or her successor; (b) the date the Trustee resigns or is removed by the Board or shareholders, in accordance with the Trust’s Declaration of Trust; or (c) the termination of the Trust. The Board has adopted policies which provide that (a) no Trustee shall hold office for more than 15 years and (b) a Trustee shall retire as of December 31st of the calendar year in which he or she reaches his or her 74th birthday, unless a waiver of such requirement shall have been adopted by a majority of the other Trustees. These policies may be changed by the Trustees without shareholder vote. One Trustee has been granted a waiver from the foregoing policies which permits him to serve until December 31, 2017. |
| 3 | | The Goldman Sachs Fund Complex includes certain other companies listed above for each respective Trustee. As of August 31, 2017, Goldman Sachs Trust consisted of 90 portfolios (89 of which offered shares to the public); Goldman Sachs Variable Insurance Trust consisted of 14 portfolios; Goldman Sachs Trust II consisted of 17 portfolios (16 of which offered shares to the public); Goldman Sachs BDC, Inc., Goldman Sachs Private Middle Market Credit LLC, Goldman Sachs MLP Income Opportunities Fund, and Goldman Sachs MLP and Energy Renaissance Fund each consisted of one portfolio; and Goldman Sachs ETF Trust consisted of 19 portfolios (eight of which offered shares to the public). Goldman Sachs Private Middle Market Credit LLC does not offer shares to the public. |
| 4 | | This column includes only directorships of companies required to report to the Securities and Exchange Commission under the Securities Exchange Act of 1934 (i.e., “public companies”) or other investment companies registered under the Act. |
Additional information about the Trustees is available in the Funds’ Statement of Additional Information, which can be obtained from Goldman Sachs free of charge by calling this toll-free number (in the United States of America): 1-800-526-7384.
138
GOLDMAN SACHS FUNDAMENTAL EQUITY GROWTH FUNDS
Trustees and Officers (Unaudited) (continued)
Officers of the Trust*
| | | | | | |
Name, Address and Age1 | | Position(s) Held with the Trust | | Term of
Office and
Length of
Time Served2 | | Principal Occupation(s) During Past 5 Years |
James A. McNamara 200 West Street New York, NY 10282 Age: 54 | | Trustee and President | | Since 2007 | | Managing Director, Goldman Sachs (December 1998-Present); Director of Institutional Fund Sales, GSAM (April 1998-December 2000); and Senior Vice President and Manager, Dreyfus Institutional Service Corporation (January 1993-April 1998). President and Trustee — Goldman Sachs Trust; Goldman Sachs Variable Insurance Trust; Goldman Sachs Trust II; Goldman Sachs MLP Income Opportunities Fund; Goldman Sachs MLP and Energy Renaissance Fund; and Goldman Sachs ETF Trust. |
Caroline L. Kraus 200 West Street New York, NY 10282 Age: 40 | | Secretary | | Since 2012 | | Managing Director, Goldman Sachs (January 2016-Present); Vice President, Goldman Sachs (August 2006-December 2015); Associate General Counsel, Goldman Sachs (2012-Present); Assistant General Counsel, Goldman Sachs (August 2006-December 2011); and Associate, Weil, Gotshal & Manges, LLP (2002-2006). Secretary — Goldman Sachs Trust (previously Assistant Secretary (2012)); Goldman Sachs Variable Insurance Trust (previously Assistant Secretary (2012)); Goldman Sachs Trust II; Goldman Sachs BDC, Inc.; Goldman Sachs Private Middle Market Credit LLC; Goldman Sachs Middle Market Lending Corp.; Goldman Sachs MLP Income Opportunities Fund; Goldman Sachs MLP and Energy Renaissance Fund; and Goldman Sachs ETF Trust. |
Scott M. McHugh 200 West Street New York, NY 10282 Age: 45 | | Treasurer, Senior Vice President and Principal Financial Officer | | Since 2009 (Principal Financial Officer since 2013) | | Managing Director, Goldman Sachs (January 2016-Present); Vice President, Goldman Sachs (February 2007-December 2015); Assistant Treasurer of certain mutual funds administered by DWS Scudder (2005-2007); and Director (2005-2007), Vice President (2000-2005), and Assistant Vice President (1998-2000), Deutsche Asset Management or its predecessor (1998-2007). Treasurer, Senior Vice President and Principal Financial Officer — Goldman Sachs Trust; Goldman Sachs Variable Insurance Trust; Goldman Sachs Trust II; Goldman Sachs MLP Income Opportunities Fund; Goldman Sachs MLP and Energy Renaissance Fund; and Goldman Sachs ETF Trust. |
Joseph F. DiMaria 30 Hudson Street Jersey City, NJ 07302 Age: 49 | | Assistant Treasurer and Principal Accounting Officer | | Since 2016 (Principal Accounting Officer since 2017) | | Managing Director, Goldman Sachs (November 2015-Present) and Vice President-Mutual Fund Administration, Columbia Management Investment Advisers, LLC (May 2010-October 2015). Assistant Treasurer and Principal Accounting Officer — Goldman Sachs Trust; Goldman Sachs Variable Insurance Trust; Goldman Sachs Trust II; Goldman Sachs MLP Income Opportunities Fund; Goldman Sachs MLP and Energy Renaissance Fund; and Goldman Sachs ETF Trust. |
| | | | | | |
| * | | Represents a partial list of officers of the Trust. Additional information about all the officers is available in the Funds’ Statement of Additional Information, which can be obtained from Goldman Sachs free of charge by calling this toll-free number (in the United States): 1-800-526-7384. |
| 1 | | Information is provided as of August 31, 2017. |
| 2 | | Officers hold office at the pleasure of the Board of Trustees or until their successors are duly elected and qualified. Each officer holds comparable positions with certain other companies of which Goldman Sachs, GSAM or an affiliate thereof is the investment adviser, administrator and/or distributor. |
139
GOLDMAN SACHS FUNDAMENTAL EQUITY GROWTH FUNDS
Goldman Sachs Trust — Fundamental Equity Growth Funds — Tax Information (Unaudited)
For the year ended August 31, 2017, 100%, 100%, 100%, and 100% of the dividends paid from net investment company taxable income by the Capital Growth, Concentrated Growth, Dynamic U.S. Equity, and Strategic Growth Funds, respectively, qualify for the dividends received deduction available to corporations.
Pursuant to Section 852 of the Internal Revenue Code, the Capital Growth, Concentrated Growth, Dynamic U.S. Equity, Flexible Cap, Growth Opportunities, Small/Mid Cap Growth, Strategic Growth, and Technology Opportunities Funds, designate $11,293,530, $545,385, $1,181, $17,051, $102,518,841, $81,665,235, $9,413,202, and $18,468,062, respectively, or if different, the maximum amount allowable, as capital gain dividends paid during the year ended August 31, 2017.
For the year ended August 31, 2017, 100%, 100%, 100%, and 100%, of the dividends paid from net investment company taxable income by the Capital Growth, Concentrated Growth, Dynamic U.S. Equity and Strategic Growth Funds, respectively, qualify for the reduced tax rate under the Jobs and Growth Tax Relief and Reconciliation Act of 2003.
140
FUNDS PROFILE
Goldman Sachs Funds
Goldman Sachs is a premier financial services firm, known since 1869 for creating thoughtful and customized investment solutions in complex global markets.
Today, the Investment Management Division of Goldman Sachs serves a diverse set of clients worldwide, including private institutions, public entities and individuals. With approximately $1.21 trillion in assets under supervision as of June 30, 2017, Goldman Sachs Asset Management (“GSAM”) has portfolio management teams located around the world and our investment professionals bring firsthand knowledge of local markets to every investment decision. Assets under supervision includes assets under management and other client assets for which Goldman Sachs does not have full discretion. GSAM leverages the resources of Goldman Sachs & Co. LLC subject to legal, internal and regulatory restrictions.
Money Market
Financial Square FundsSM
| ∎ | | Financial Square Treasury Solutions Fund1 |
| ∎ | | Financial Square Government Fund1 |
| ∎ | | Financial Square Money Market Fund2 |
| ∎ | | Financial Square Prime Obligations Fund2 |
| ∎ | | Financial Square Treasury Instruments Fund1 |
| ∎ | | Financial Square Treasury Obligations Fund1 |
| ∎ | | Financial Square Federal Instruments Fund1 |
| ∎ | | Financial Square Tax-Exempt Money Market Fund2 |
Investor FundsSM
| ∎ | | Investor Money Market Fund3 |
| ∎ | | Investor Tax-Exempt Money Market Fund3 |
Fixed Income
Short Duration and Government
| ∎ | | High Quality Floating Rate Fund |
| ∎ | | Short-Term Conservative Income Fund |
| ∎ | | Short Duration Government Fund |
| ∎ | | Short Duration Income Fund |
| ∎ | | Inflation Protected Securities Fund |
Multi-Sector
Municipal and Tax-Free
| ∎ | | High Yield Municipal Fund |
| ∎ | | Dynamic Municipal Income Fund |
| ∎ | | Short Duration Tax-Free Fund |
Single Sector
| ∎ | | Investment Grade Credit Fund |
| ∎ | | High Yield Floating Rate Fund |
| ∎ | | Emerging Markets Debt Fund |
| ∎ | | Local Emerging Markets Debt Fund |
| ∎ | | Dynamic Emerging Markets Debt Fund |
Fixed Income Alternatives
| ∎ | | Long Short Credit Strategies Fund |
Fundamental Equity
| ∎ | | Small/Mid Cap Value Fund |
| ∎ | | Small/Mid Cap Growth Fund |
| ∎ | | Concentrated Growth Fund7 |
| ∎ | | Technology Opportunities Fund |
| ∎ | | Growth Opportunities Fund |
| ∎ | | Rising Dividend Growth Fund |
Tax-Advantaged Equity
| ∎ | | U.S. Tax-Managed Equity Fund |
| ∎ | | International Tax-Managed Equity Fund |
| ∎ | | U.S. Equity Dividend and Premium Fund |
| ∎ | | International Equity Dividend and Premium Fund |
Equity Insights
| ∎ | | Small Cap Equity Insights Fund |
| ∎ | | U.S. Equity Insights Fund |
| ∎ | | Small Cap Growth Insights Fund |
| ∎ | | Large Cap Growth Insights Fund |
| ∎ | | Large Cap Value Insights Fund |
| ∎ | | Small Cap Value Insights Fund |
| ∎ | | International Small Cap Insights Fund |
| ∎ | | International Equity Insights Fund |
| ∎ | | Emerging Markets Equity Insights Fund |
Fundamental Equity International
| ∎ | | Strategic International Equity Fund |
| ∎ | | Focused International Equity Fund |
| ∎ | | Emerging Markets Equity Fund |
Select Satellite
| ∎ | | Real Estate Securities Fund |
| ∎ | | International Real Estate Securities Fund |
| ∎ | | Commodity Strategy Fund |
| ∎ | | Global Real Estate Securities Fund |
| ∎ | | Alternative Premia Fund9 |
| ∎ | | Absolute Return Tracker Fund |
| ∎ | | Managed Futures Strategy Fund |
| ∎ | | MLP Energy Infrastructure Fund |
| ∎ | | Multi-Manager Alternatives Fund |
| ∎ | | Absolute Return Multi-Asset Fund |
| ∎ | | Global Infrastructure Fund |
Total Portfolio Solutions
| ∎ | | Global Managed Beta Fund |
| ∎ | | Multi-Manager Non-Core Fixed Income Fund |
| ∎ | | Multi-Manager U.S. Dynamic Equity Fund |
| ∎ | | Multi-Manager Global Equity Fund |
| ∎ | | Multi-Manager International Equity Fund |
| ∎ | | Tactical Tilt Overlay Fund |
| ∎ | | Balanced Strategy Portfolio |
| ∎ | | Multi-Manager U.S. Small Cap Equity Fund |
| ∎ | | Multi-Manager Real Assets Strategy Fund |
| ∎ | | Growth and Income Strategy Portfolio |
| ∎ | | Growth Strategy Portfolio |
| ∎ | | Equity Growth Strategy Portfolio |
| ∎ | | Satellite Strategies Portfolio |
| ∎ | | Enhanced Dividend Global Equity Portfolio |
| ∎ | | Tax-Advantaged Global Equity Portfolio |
| ∎ | | Strategic Factor Allocation Fund |
| ∎ | | Target Date 2020 Portfolio |
| ∎ | | Target Date 2025 Portfolio |
| ∎ | | Target Date 2030 Portfolio |
| ∎ | | Target Date 2035 Portfolio |
| ∎ | | Target Date 2040 Portfolio |
| ∎ | | Target Date 2045 Portfolio |
| ∎ | | Target Date 2050 Portfolio |
| ∎ | | Target Date 2055 Portfolio |
| ∎ | | GQG Partners International Opportunities Fund |
| 1 | | You could lose money by investing in the Fund. Although the Fund seeks to preserve the value of your investment at $1.00 per share, it cannot guarantee it will do so. An investment in the Fund is not a deposit of a bank and is not insured or guaranteed by the Federal Deposit Insurance Corporation or any other government agency. The Fund’s sponsor has no legal obligation to provide financial support to the Fund, and you should not expect that the sponsor will provide financial support to the Fund at any time. |
| 2 | | You could lose money by investing in the Fund. Because the share price of the Fund will fluctuate, when you sell your shares they may be worth more or less than what you originally paid for them. The Fund may impose a fee upon sale of your shares or may temporarily suspend your ability to sell shares if the Fund’s liquidity falls below required minimums because of market conditions or other factors. An investment in the Fund is not a deposit of a bank and is not insured or guaranteed by the Federal Deposit Insurance Corporation or any other government agency. The Fund’s sponsor has no legal obligation to provide financial support to the Fund, and you should not expect that the sponsor will provide financial support to the Fund at any time. |
| 3 | | You could lose money by investing in the Fund. Although the Fund seeks to preserve the value of your investment at $1.00 per share, it cannot guarantee it will do so. The Fund may impose a fee upon sale of your shares or may temporarily suspend your ability to sell shares if the Fund’s liquidity falls below required minimums because of market conditions or other factors. An investment in the Fund is not a deposit of a bank and is not insured or guaranteed by the Federal Deposit Insurance Corporation or any other government agency. The Fund’s sponsor has no legal obligation to provide financial support to the Fund, and you should not expect that the sponsor will provide financial support to the Fund at any time. |
| 4 | | Effective on June 20, 2017, the Goldman Sachs Fixed Income Macro Strategies Fund was renamed the Goldman Sachs Strategic Macro Fund. |
| 5 | | Effective on June 20, 2017, the Goldman Sachs Growth and Income Fund was renamed the Goldman Sachs Equity Income Fund. |
| 6 | | Effective after the close of business on August 31, 2017, the Goldman Sachs Flexible Cap Growth Fund was renamed the Goldman Sachs Flexible Cap Fund. |
| 7 | | Effective on July 28, 2017, the Goldman Sachs Focused Growth Fund was reorganized with and into the Goldman Sachs Concentrated Growth Fund. |
| 8 | | Effective after the close of business on October 31, 2017, the Goldman Sachs Dynamic U.S. Equity Fund was renamed the Goldman Sachs Blue Chip Fund. |
| 9 | | Effective after the close of business on October 30, 2017, the Goldman Sachs Dynamic Allocation Fund was renamed the Goldman Sachs Alternative Premia Fund. Financial Square FundsSM and Investor FundsSM are registered service marks of Goldman Sachs & Co. LLC. |
| * | | This list covers open-end funds only. Please visit our website at www.GSAMFUNDS.com to learn about our closed-end funds and exchange-traded funds. |
| | |
TRUSTEES Ashok N. Bakhru, Chairman Kathryn A. Cassidy Diana M. Daniels Herbert J. Markley James A. McNamara Jessica Palmer Roy W. Templin Gregory G. Weaver | | OFFICERS James A. McNamara, President Scott M. McHugh, Treasurer, Senior Vice President and Principal Financial Officer Joseph F. DiMaria, Assistant Treasurer and Principal Accounting Officer Caroline L. Kraus, Secretary |
| |
GOLDMAN SACHS & CO. LLC Distributor and Transfer Agent | | GOLDMAN SACHS ASSET MANAGEMENT, L.P. Investment Adviser |
Visit our web site at www.GSAMFUNDS.com to obtain the most recent month-end returns.
Goldman Sachs Asset Management, L.P. 200 West Street, New York, New York 10282
The reports concerning the Funds included in this shareholder report may contain certain forward-looking statements about the factors that may affect the performance of the Funds in the future. These statements are based on Fund management’s predictions and expectations concerning certain future events and their expected impact on the Funds, such as performance of the economy as a whole and of specific industry sectors, changes in the levels of interest rates, the impact of developing world events, and other factors that may influence the future performance of the Funds. Management believes these forward-looking statements to be reasonable, although they are inherently uncertain and difficult to predict. Actual events may cause adjustments in portfolio management strategies from those currently expected to be employed.
A description of the policies and procedures that the Funds use to determine how to vote proxies relating to portfolio securities and information regarding how a Fund voted proxies relating to portfolio securities during the most recent 12-month period ended June 30 is available (i) without charge, upon request by calling 1-800-526-7384 (for Retail Shareholders) or 1-800-621-2550 (for Institutional Shareholders); and (ii) on the Securities and Exchange Commission (“SEC”) web site at http://www.sec.gov.
The Funds file their complete schedule of portfolio holdings with the SEC for the first and third quarters of each fiscal year on Form N-Q. The Funds’ Forms N-Q are available on the SEC’s web site at http://www.sec.gov within 60 days after the Funds’ first and third fiscal quarters. The Funds’ Forms N-Q may be reviewed and copied at the SEC’s Public Reference Room in Washington, D.C., and information on the operation of the Public Reference Room may also be obtained by calling 1-800-SEC-0330. Forms N-Q may be obtained upon request and without charge by calling 1-800-526-7384 (for Retail Shareholders) or 1-800-621-2550 (for Institutional Shareholders).
Goldman Sachs & Co. LLC (‘‘Goldman Sachs’’) does not provide legal, tax or accounting advice. Any statement contained in this communication (including any attachments) concerning U.S. tax matters was not intended or written to be used, and cannot be used, for the purpose of avoiding penalties under the Internal Revenue Code, and was written to support the promotion or marketing of the transaction(s) or matter(s) addressed. Clients of Goldman Sachs should obtain their own independent tax advice based on their particular circumstances.
Fund holdings and allocations shown are as of August 31, 2017 and may not be representative of future investments. Fund holdings should not be relied on in making investment decisions and should not be construed as research or investment advice regarding particular securities. Current and future holdings are subject to risk.
The Global Industry Classification Standard (GICS) was developed by and is the exclusive property and a service mark of Morgan Stanley Capital International Inc. (MSCI) and Standard & Poor’s, a division of The McGraw-Hill Companies, Inc. (S&P) and is licensed for use by Goldman Sachs. Neither MSCI, S&P nor any other party involved in making or compiling the GICS or any GICS classifications makes any express or implied warranties or representations with respect to such standard or classification (or the results to be obtained by the use thereof), and all such parties hereby expressly disclaim all warranties of originality, accuracy, completeness, merchantability or fitness for a particular purpose with respect to any of such standard or classification. Without limiting any of the foregoing, in no event shall MSCI, S&P, any of their affiliates or any third party involved in making or compiling the GICS or any GICS classifications have any liability for any direct, indirect, special, punitive, consequential or any other damages (including lost profits) even if notified of the possibility of such damages.
The portfolio risk management process includes an effort to monitor and manage risk, but does not imply low risk.
THIS MATERIAL IS FOR INFORMATIONAL PURPOSES ONLY AND IS PROVIDED SOLELY ON THE BASIS THAT IT WILL NOT CONSTITUTE INVESTMENT OR OTHER ADVICE OR A RECOMMENDATION RELATING TO ANY PERSON’S OR PLAN’S INVESTMENT OR OTHER DECISIONS, AND GOLDMAN SACHS IS NOT A FIDUCIARY OR ADVISOR WITH RESPECT TO ANY PERSON OR PLAN BY REASON OF PROVIDING THE MATERIAL OR CONTENT HEREIN INCLUDING UNDER THE EMPLOYEE RETIREMENT INCOME SECURITY ACT OF 1974 OR DEPARTMENT OF LABOR REGULATIONS. PLAN SPONSORS AND OTHER FIDUCIARIES SHOULD CONSIDER THEIR OWN CIRCUMSTANCES IN ASSESSING ANY POTENTIAL COURSE OF ACTION.
This material is not authorized for distribution to prospective investors unless preceded or accompanied by a current prospectus or summary prospectus, if applicable. Investors should consider a Fund’s objective, risks, and charges and expenses, and read the summary prospectus, if available, and/or the prospectus carefully before investing or sending money. The summary prospectus, if available, and the prospectus contain this and other information about a Fund and may be obtained from your Authorized Institution or from Goldman Sachs & Co. LLC by calling (retail – 1-800-526-7384) (institutional – 1-800-621-2550).
© 2016 Goldman Sachs. All rights reserved. 107520-OTU-631873 EQGRWAR-17/118k
Goldman Sachs Funds

| | | | |
| | |
| Annual Report | | | | August 31, 2017 |
| | |
| | | | Fundamental Equity Value Funds |
| | | | Equity Income* |
| | | | Focused Value |
| | | | Large Cap Value |
| | | | Mid Cap Value |
| | | | Small Cap Value |
| | | | Small/Mid Cap Value |
*Effective after the close of business on June 20, 2017, the Goldman Sachs Growth & Income Fund was renamed the Goldman Sachs Equity Income Fund.

Goldman Sachs Fundamental Equity Value Funds
| | | | |
| | | |
| NOT FDIC-INSURED | | May Lose Value | | No Bank Guarantee |
GOLDMAN SACHS FUNDAMENTAL EQUITY VALUE FUNDS
What Differentiates the Goldman Sachs Fundamental Equity Value Investment Process?
Goldman Sachs’ Fundamental Equity Value Team believes that all successful investing should thoughtfully weigh two important attributes of a stock: price and prospects. Through independent fundamental research, the Team seeks to identify and invest in quality businesses that are selling at compelling valuations.


At the heart of our value investment philosophy is a belief in the rigorous analysis of business fundamentals. Our approach may include:
| ∎ | | Meetings with management teams and on-site company visits |
| ∎ | | Industry-specific, proprietary financial and valuation models |
| ∎ | | Assessment of management quality |
| ∎ | | Analysis of each company’s competitive position and industry dynamics |
| ∎ | | Interviews with competitors, suppliers and customers |

We seek to invest in companies when we believe:
| ∎ | | Market uncertainty exists |
| ∎ | | Their economic value is not recognized by the market |

We seek to buy companies with quality characteristics. For us, this means companies that have:
| ∎ | | Sustainable operating earnings, or competitive advantage |
| ∎ | | Excellent stewardship of capital |
| ∎ | | Capability to earn above their cost of capital |
| ∎ | | Strong or improving balance sheets and cash flow |

Value portfolios that strive to offer:
| | ∎ | | Capital appreciation potential as each company’s true value is recognized in the marketplace | |
| | ∎ | | Investment style consistency | |
1
MARKET REVIEW
Goldman Sachs Fundamental Equity Value Funds
Market Review
Overall, U.S. equities rallied during the 12 months ended August 31, 2017 (the “Reporting Period”), despite unexpected political events both domestically and abroad and three Federal Reserve (“Fed”) interest rate hikes. The Standard & Poor’s 500® Index (the “S&P 500 Index”) ended the Reporting Period with a gain of 16.23%. The Russell 3000® Index generated a return of 16.06%.
As the Reporting Period began in early September 2016, U.S. and international equities alike fell as the European Central Bank disappointed markets with its lack of commitment to extend quantitative easing. However, there was a subsequent rebound following the Fed’s decision in September 2016 to leave interest rates unchanged. In October 2016, a combination of hawkish Fed commentary and mounting strong U.S. economic data led to increased market pricing for a December 2016 interest rate hike. (Hawkish commentary tends to suggest higher interest rates; opposite of dovish.) U.S. Gross Domestic Product (“GDP”) increased by 3.5% on an annualized basis for the third quarter of 2016, above consensus expectations and the strongest growth rate in two years. Following the unexpected results of the November 2016 U.S. presidential elections, U.S. equities quickly reversed a short-lived sell-off and surged on anticipation of a pro-growth effect of the incoming Administration’s fiscal stimulus plan. The Fed raised rates 0.25% in December 2016, for the first time in a year but as had largely been anticipated, and set a more hawkish hike path for 2017, causing equities to decline, albeit modestly, following the announcement.
U.S. equities rallied significantly in the first two months of 2017 before declining in March. In January 2017, markets rallied to new highs on the prospect of deregulation following executive orders on oil pipelines and on optimism around infrastructure spending after a $1 trillion proposal from Senate Democrats. Despite political uncertainty and protectionism concerns, U.S. equities continued to rally in February 2017 driven by risk-on sentiment owing to potential U.S. tax reform and deregulation as well as by stronger economic data. In March 2017, the Fed raised interest rates for the third time since the 2007-2009 global financial crisis and maintained projections for three additional interest rate increases before the end of 2017. However, a seemingly cautious stance on the future path of monetary tightening from Fed Chair Janet Yellen and the presence of a dissenter on the Fed committee led to a dovish market reaction. Political risks subsequently drove U.S. equities lower in the wake of House Republicans’ struggle to schedule a vote on health care.
U.S. equities declined in April 2017, as Fed minutes suggested stocks were overvalued, but then rebounded on strong first quarter 2017 earnings reports and receding European political risk following the French presidential election. Although the labor market remained strong, economic activity and inflation data appeared to be moderating during the second quarter of 2017. Core inflation softened to 1.7% year-over-year in May 2017, marking a third consecutive month of weakness, while core personal consumption expenditure (“PCE”) remained below the Fed’s 2% target at just 1.4% year over year. In addition, market expectations for pro-growth U.S. fiscal policy were dampened by domestic political developments. Nonetheless, the Fed proceeded to raise the federal funds rate by 25 basis points in June 2017, citing ongoing strength in the labor market and a pickup in household spending and business fixed investment. (A basis point is 1/100th of a percentage point.) The results of the Fed’s 2017 Comprehensive Capital Analysis and Review (“CCAR”) stress test for banks were encouraging, with improving payout ratios.
2
MARKET REVIEW
U.S. equities gained in July 2017. The Institute for Supply Management (“ISM”) manufacturing index rose in June 2017 to 57.8, the highest level in nearly three years. However, inflation dynamics remained weaker. The core consumer price index (“CPI”) was still soft in June 2017, rising 1.7% year over year and 0.1% month over month. Fed Chair Yellen’s assessment during her Congressional testimony that the federal funds rate was close to its neutral policy rate was interpreted dovishly by markets. The Fed kept its monetary policy unchanged in July 2017, as had been widely expected. The Fed’s statement included an upgrade to its assessment of job growth as well as an acknowledgment that inflation was “below” target. This compares with its prior view, which noted inflation was “somewhat below” its 2% target, a shift that resulted in a mildly dovish market reaction. The Fed also stated it expected its balance sheet normalization to begin “relatively soon.” (Balance sheet normalization refers to the steps the Fed will take to reverse quantitative easing and remove the substantial monetary accommodation it has provided to the economy since the financial crisis began in 2007.)
U.S. equities were roughly flat in August 2017. U.S. economic activity continued to be strong, with several surveys on consumer sentiment and manufacturing showing unexpectedly positive results. This remained in contrast to subdued inflation, which was unexpectedly below estimated levels for the fifth consecutive month in July 2017, albeit largely due to idiosyncratic factors. The Fed’s minutes suggested increased concerns on inflation, highlighting that “many participants” saw “some likelihood that inflation may remain below 2 percent for longer than expected.” Hurricane Harvey caused extensive flooding and damages in Texas and Louisiana and significantly impacted refinery operations, resulting in a surge in gasoline prices.
For the Reporting Period overall, information technology and financials were the best performing sectors in the S&P 500 Index by a wide margin. The weakest performing sectors in the S&P 500 Index were energy and telecommunication services, the only two to post a negative absolute return, followed by consumer staples and real estate, which were comparatively weak but generated positive returns during the Reporting Period.
Within the U.S. equity market, all capitalization segments posted positive returns, but large-cap stocks, as measured by the Russell 1000® Index, performed best, followed by small-cap stocks, as measured by the Russell 2000® Index, and then mid-cap stocks, as measured by the Russell Midcap® Index. From a style perspective, growth-oriented stocks significantly outpaced value-oriented stocks across the capitalization spectrum. (All as measured by the FTSE Russell indices.)
Looking Ahead
At the end of the Reporting Period, we were cautiously optimistic with respect to pro-growth policy actions and their ability to spur a more accommodative operating environment. In our view, most companies will likely benefit from aggressive fiscal policy, including lower taxes and increased spending, and from a less restrictive regulatory environment. We were also encouraged by strong first and second quarter 2017 reporting seasons by companies, as sales, margins, and earnings all exceeded consensus expectations. Aggregate S&P 500 Index earnings growth of 13.5% on a year-over-year basis for the Reporting Period represented the strongest rate of growth since 2011. Earnings in most markets across the world surpassed consensus estimates as well. All else being equal, we believe broadening global economic growth should be supportive of a continuation in corporate earnings growth and equity market appreciation. While our return expectations for the U.S. equity market remains relatively muted given what we perceive to be rather full valuations, we believe U.S. equities are still more attractive than most other asset classes and can continue to be driven by earnings growth in the absence of
3
MARKET REVIEW
multiple expansion (Multiple expansion is an increase in the price/earnings ratio, or multiple, of a stock or group of stocks). Additionally, after several years of thematic-driven markets, we were excited at the end of the Reporting Period about lower correlations at the stock level. We believe an active investment approach is poised to benefit in this type of market environment.
Regardless of market direction, our fundamental, bottom-up stock selection continues to drive our process, rather than headlines or sentiment. We maintain high conviction in the companies the Funds own and believe they have the potential to outperform relative to the broader market regardless of economic growth conditions. We continue to focus on seeking undervalued companies that we believe have comparatively greater control of their own destiny, such as innovators with differentiated products, companies with low cost structures or companies that have been investing in their own businesses and may be poised to gain market share. We maintain our discipline in identifying companies with what we believe to be strong or improving balance sheets, led by quality management teams and trading at discounted valuations. We remain focused on the long-term performance of the Funds.
As always, deep research resources, a prospective investment process and truly actively managed portfolios are keys, in our view, to both preserving capital and outperforming the market over the long term.
4
PORTFOLIO RESULTS
Goldman Sachs Equity Income Fund
Portfolio Composition
Under normal circumstances, the Fund invests at least 80% of its net assets in equity investments that the Goldman Sachs Value Equity Investment Team considers to have favorable prospects for capital appreciation and/or dividend-paying ability. Although the Fund will invest primarily in publicly traded U.S. securities, including preferred and convertible securities, it may invest up to 25% of its total net assets in foreign securities, including securities of issuers in emerging countries and securities quoted in foreign currencies. The Fund may also invest up to 20% of its total net assets in fixed income securities, such as government, corporate and bank debt obligations, which the Investment Adviser believes offer the potential to further the Fund’s investment objective of long-term capital appreciation and growth of income.
Portfolio Management Discussion and Analysis
Effective after the close of business June 20, 2017, the Goldman Sachs Growth and Income Fund was re-named the Goldman Sachs Equity Income Fund (the “Fund”) and certain of its strategies differed). Below, the Goldman Sachs Value Equity Investment Team discusses the Fund’s performance and positioning for the 12-month period ended August 31, 2017 (the “Reporting Period”).
| Q | | How did the Fund perform during the Reporting Period? |
| A | | During the Reporting Period, the Fund’s Class A, C, Institutional, Service, Investor, R and R6 Shares generated average annual total returns, without sales charges, of 9.93%, 9.10%, 10.38%, 9.84%, 10.21%, 9.68% and 10.39%, respectively. These returns compare to the 11.58% average annual total return of the Fund’s benchmark, the Russell 1000® Value Index (with dividends reinvested) (the “Russell Index”), during the same period. |
| Q | | What key factors were responsible for the Fund’s performance during the Reporting Period? |
| A | | The Fund posted solid absolute gains, but sector allocation overall detracted from the Fund’s performance relative to the Russell Index during the Reporting Period. Stock selection as a whole contributed positively, albeit modestly. |
| Q | | Which equity market sectors most significantly affected Fund performance? |
| A | | The sectors that detracted most from the Fund’s relative results during the Reporting Period were industrials, consumer discretionary and telecommunication services, wherein stock selection proved challenging. Effective stock selection in the energy, information technology and consumer staples sectors helped the Fund’s relative results most. |
| Q | | Which stocks detracted significantly from the Fund’s performance during the Reporting Period? |
| A | | Detracting most from the Fund’s results relative to the Russell Index were positions in diversified industrial business General Electric, U.S.-based media conglomerate Viacom and wireless telecommunications provider Verizon Communications. |
| | General Electric’s shares fell as the stock was pressured by weakness in power and oil & gas end-markets. Despite mixed earnings results due to lower margins and cash flow, we remained constructive at the end of the Reporting Period on General Electric’s prospects due to a strong backlog and a high exposure to service revenues. Additionally, we believe restructuring and working capital actions taken by its management have the potential to improve the company’s margins and cash flow. In our view, General Electric’s strong market position and product technology situate the company well for future growth. |
| | We believe Viacom’s stock came under pressure due to broader investor concerns around traditional cable television subscriber losses. This pervasive theme distracted from the company’s first quarter 2017 earnings results, which came in well above consensus expectations due to strength within Media Networks and Paramount Pictures. At the end of the Reporting Period, we continued to believe in Viacom’s turnaround strategy under recently appointed Chief Executive |
5
PORTFOLIO RESULTS
| | Officer, Bob Bakish. Further, in our view, the company’s underlying fundamentals have been strengthening. Additionally, we believe Paramount is a rare asset within the media industry and was not being fully appreciated by investors at valuations seen at the end of the Reporting Period. |
| | Verizon Communications experienced weakness after the company began offering an unlimited plan to its mobile subscribers and reduced its long-range forecasts for revenue growth. Additionally, with consolidation within cable and wireless operators accelerating, we believed there was heightened risk around Verizon Communications overpaying for an acquisition. With these two risks introduced, we believed the stock was no longer as attractively valued and so we opted to trim the position. |
| Q | | What were some of the Fund’s best-performing individual stocks? |
| A | | The Fund benefited most relative to the Russell Index from positions in global financial services company Bank of America, natural and organic foods supermarket Whole Foods Market and software and hardware services provider Microsoft. |
| | Bank of America’s shares, like the financials sector broadly, rose sharply following the U.S. presidential election as investor sentiment around the sector, and banks in particular, improved. Sentiment improved as investors anticipated both a more attractive regulatory environment and increases in interest rates. Additionally, on a more company-specific level, the stock price of Bank of America strengthened after the company reported revenue and earnings that exceeded consensus expectations, largely due to improved trading and investment banking growth. At the end of the Reporting Period, we believed shares of Bank of America remained attractively valued given rising U.S. interest rates and an improving U.S. economy. In our view, Bank of America’s management is committed to bettering execution, growing margins and returning capital to shareholders. However, in light of recent outperformance, we slightly moderated the Fund’s position to better reflect what we saw as the stock’s risk/return profile. |
| | At the end of June 2017, Amazon announced its intention to acquire Whole Foods Market at a large premium, which caused Whole Foods Market’s stock price to spike. We believed Whole Foods Market was a market leader in one of the most attractive segments of food retailers, i.e. natural organic, with a strong balance sheet and free cash flow that was trading at an attractive valuation. Despite increased competition, we also were optimistic that the company was taking the necessary steps to address its challenges to reaccelerate growth and profitability. We believe Amazon’s acquisition validated our investment thesis that Whole Foods Market is a valuable strategic asset. Following the news and subsequent rise in stock price, we decided to exit the Fund’s position and allocate the capital to other opportunities. |
| | Shares of Microsoft rose primarily due to Azure gaining market share in the structurally growing cloud computing market. (Microsoft Azure is a growing collection of integrated cloud services that developers and information technology professionals use to build, deploy and manage applications through Microsoft’s global network of datacenters.) Additionally, we believe strength in Microsoft’s operating expense management has helped its earnings per share growth. At the end of the Reporting Period, we believed Microsoft was in a strong position to capture market share in enterprise technology budgets due to its commercial cloud business. We were also constructive on its revenue and earnings growth potential, as it could, in our view, contribute positively to the stock’s performance. |
| Q | | How did the Fund use derivatives and similar instruments during the Reporting Period? |
| A | | During the Reporting Period, we did not use derivatives as part of an active management strategy. |
| Q | | Did the Fund make any significant purchases or sales during the Reporting Period? |
| A | | During the Reporting Period, we initiated a Fund position in American International Group, an insurance company based in New York. We believe its new Chief Executive Officer’s initiatives and capabilities may well serve as a positive catalyst and lead to margin improvement. We established the Fund position in the company because of what we considered to be its attractive valuation and our belief in the upcoming inflection in its fundamentals. Additionally, we believe the company’s newly upgraded financial strength rating could be accretive to its earnings over time. |
| | We established a Fund position in Emerson Electric, a global diversified technology and engineering company. We believe Emerson Electric’s restructuring efforts have resulted in a simplified business model with the potential for improved margins and higher organic growth over time. We are also positive on the company’s recent acquisition of Pentair’s valves and controls business, which, in our view, may be accretive to its earnings. Furthermore, we feel the |
6
PORTFOLIO RESULTS
| | company has a strong balance sheet and robust free cash flow generation. |
| | Conversely, in addition to those sales already mentioned, we exited the Fund’s position in global financial services corporation American Express. We had originally initiated a position in the company because we believed concerns regarding credit and longer-term secular headwinds were overblown, leading to an excessively depressed valuation. While we continue to view American Express as a high quality company with good long-term growth potential, its stock approached our price target after strong first quarter 2017 results, and so we sold the position in favor of what we considered to be more compelling investment opportunities. |
| Q | | Were there any notable changes in the Fund’s weightings during the Reporting Period? |
| A | | In constructing the Fund’s portfolio, we focus on picking stocks rather than on making industry or sector bets. We seek to outpace the benchmark index by overweighting stocks that we expect to outperform and underweighting those that we think may lag. Consequently, changes in its sector weights are generally the direct result of individual stock selection or of stock appreciation or depreciation. That said, during the Reporting Period, the Fund’s allocations compared to the Russell Index in consumer staples, energy, financials, industrials, information technology and materials increased. The Fund’s exposure to consumer discretionary, health care and utilities decreased compared to the Russell Index as did its position in cash. |
| Q | | How was the Fund positioned relative to its benchmark index at the end of August 2017? |
| A | | At the end of August 2017, the Fund had overweighted positions relative to the Russell Index in the information technology, consumer staples and industrials sectors. On the same date, the Fund had underweighted positions compared to the Russell Index in consumer discretionary, utilities and real estate and was rather neutrally weighted to the Russell Index in financials, health care, energy, telecommunication services and materials. |
7
FUND BASICS
Equity Income Fund
as of August 31, 2017
| | | | | | | | | | |
| | PERFORMANCE REVIEW | |
| | | September 1, 2016–August 31, 2017 | | Fund Total Return
(based on NAV)1 | | | Russell 1000
Value Index2 | |
| | Class A | | | 9.93 | % | | | 11.58 | % |
| | Class C | | | 9.10 | | | | 11.58 | |
| | Institutional | | | 10.38 | | | | 11.58 | |
| | Service | | | 9.84 | | | | 11.58 | |
| | Investor | | | 10.21 | | | | 11.58 | |
| | Class R | | | 9.68 | | | | 11.58 | |
| | | Class R6 | | | 10.39 | | | | 11.58 | |
| | 1 | | The net asset value (“NAV”) represents the net assets of the class of the Fund (ex-dividend) divided by the total number of shares of the class outstanding. The Fund’s performance reflects the reinvestment of dividends and other distributions. The Fund’s performance does not reflect the deduction of any applicable sales charges. |
| | 2 | | The unmanaged Russell 1000 Value Index is a market capitalization weighted index of the 1,000 largest U.S. companies with lower price-to-book ratios and lower forecasted growth values. The Index figures do not reflect any deduction of fees, expenses or taxes. It is not possible to invest directly in an unmanaged index. |
| | | | | | | | | | | | | | | | | | | | |
| | STANDARDIZED TOTAL RETURNS3 |
| | | For the period ended 6/30/17 | | One Year | | | Five Years | | | Ten Years | | | Since Inception | | | Inception Date |
| | Class A | | | 6.89 | % | | | 11.49 | % | | | 3.48 | % | | | 6.92 | % | | 2/5/93 |
| | Class C | | | 11.24 | | | | 11.91 | | | | 3.29 | | | | 3.29 | | | 8/15/97 |
| | Institutional | | | 13.60 | | | | 13.21 | | | | 4.47 | | | | 6.20 | | | 6/3/96 |
| | Service | | | 13.01 | | | | 12.65 | | | | 3.96 | | | | 5.75 | | | 3/6/96 |
| | Investor | | | 13.40 | | | | 13.04 | | | | N/A | | | | 5.02 | | | 11/30/07 |
| | Class R | | | 12.86 | | | | 12.48 | | | | N/A | | | | 4.51 | | | 11/30/07 |
| | | Class R6 | | | 13.57 | | | | N/A | | | | N/A | | | | 6.43 | | | 7/31/15 |
| | 3 | | The Standardized Total Returns are average annual total returns or cumulative total returns (only if the performance period is one year or less) as of the most recent calendar quarter-end. They assume reinvestment of all distributions at NAV. These returns reflect a maximum initial sales charge of 5.50% for Class A Shares and the assumed contingent deferred sales charge for Class C Shares (1.00% if redeemed within 12 months of purchase). Because Institutional, Service, Investor, Class R and Class R6 Shares do not involve a sales charge, such a charge is not applied to their Standardized Total Returns. |
The returns set forth in the tables above represent past performance. Past performance does not guarantee future results. The Fund’s investment return and principal value will fluctuate so that an investor’s shares, when redeemed, may be worth more or less than their original cost. Current performance may be lower or higher than the performance quoted above. Please visit our web site at www.GSAMFUNDS.com to obtain the most recent month-end returns. Performance reflects applicable fee waivers and/or expense limitations in effect during the periods shown. In their absence, performance would be reduced. Returns do not reflect the deduction of taxes that a shareholder would pay on Fund distributions or the redemption of Fund shares.
8
FUND BASICS
| | | | | | | | | | |
| | EXPENSE RATIOS4 | |
| | | | | Net Expense Ratio (Current) | | | Gross Expense Ratio (Before Waivers) | |
| | Class A | | | 1.14 | % | | | 1.27 | % |
| | Class C | | | 1.89 | | | | 2.02 | |
| | Institutional | | | 0.74 | | | | 0.87 | |
| | Service | | | 1.24 | | | | 1.37 | |
| | Investor | | | 0.89 | | | | 1.02 | |
| | Class R | | | 1.39 | | | | 1.52 | |
| | | Class R6 | | | 0.74 | | | | 0.87 | |
| | 4 | | The expense ratios of the Fund, both current (net of any fee waivers or expense limitations) and before waivers (gross of any fee waivers or expense limitations) are as set forth above according to the most recent publicly available Prospectus for the Fund and may differ from the expense ratios disclosed in the Financial Highlights in this report. Pursuant to a contractual arrangement, the Fund’s waivers and/or expense limitations will remain in place through at least April 28, 2018, and prior to such date the investment adviser may not terminate the arrangements without the approval of the Fund’s Board of Trustees. If these arrangements are discontinued in the future, the expense ratios may change without shareholder approval. |
| | | | | | | | |
| | TOP TEN HOLDINGS AS OF 8/31/175 |
| | | Holding | | % of Net Assets | | | Line of Business |
| | Wells Fargo & Co. | | | 5.0 | % | | Banks |
| | Pfizer, Inc. | | | 4.9 | | | Pharmaceuticals |
| | Exxon Mobil Corp. | | | 4.8 | | | Oil, Gas & Consumable Fuels |
| | Bank of America Corp. | | | 4.6 | | | Banks |
| | General Electric Co. | | | 4.4 | | | Industrial Conglomerates |
| | Cisco Systems, Inc. | | | 3.6 | | | Communications Equipment |
| | The Procter & Gamble Co. | | | 3.4 | | | Household Products |
| | Johnson & Johnson | | | 3.3 | | | Pharmaceuticals |
| | American International Group, Inc. | | | 2.7 | | | Insurance |
| | | Abbott Laboratories | | | 2.7 | | | Health Care Equipment & Supplies |
| | 5 | | The top 10 holdings may not be representative of the Fund’s future investments. |
9
FUND BASICS
| | |
| | FUND VS. BENCHMARK SECTOR ALLOCATIONS6 |
| | | As of August 31, 2017 |
| | 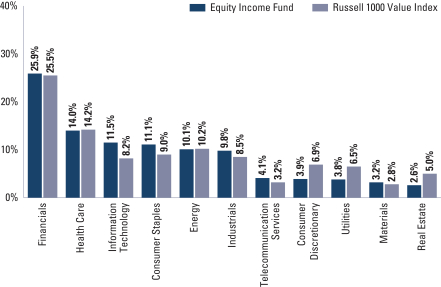 |
| | 6 | | The Fund is actively managed and, as such, its composition may differ over time. Consequently, the Fund’s overall sector allocations may differ from the percentages contained in the graph above. The graph categorizes investments using the Global Industry Classification Standard (“GICS”), however, the sector classifications used by the portfolio management team may differ from GICS. The percentage shown for each investment category reflects the value of investments in that category as a percentage of market value (excluding investments in the securities lending reinvestment vehicle, if any). Investments in the securities lending reinvestment vehicle represented 1.4% of the Fund’s net assets as of August 31, 2017. The graph depicts the Fund’s investments but may not represent the Fund’s market exposure due to the exclusion of certain derivatives, if any, as listed in the Additional Investment Information section of the Schedule of Investments. |
10
GOLDMAN SACHS EQUITY INCOME FUND
Performance Summary
August 31, 2017
The following graph shows the value, as of August 31, 2017, of a $10,000 investment made on September 1, 2007 in Class A Shares (with the maximum sales charge of 5.5%). For comparative purposes, the performance of the Fund’s benchmark, the Russell 1000® Value Index (with dividends reinvested), is shown. This performance data represents past performance and should not be considered indicative of future performance, which will fluctuate with changes in market conditions. These performance fluctuations may cause an investor’s shares, when redeemed, to be worth more or less than their original cost. Performance reflects applicable fee waivers and/or expense limitations in effect during the periods shown and in their absence, performance would be reduced. Returns do not reflect the deduction of taxes that a shareholder would pay on Fund distributions or the redemption of Fund shares. Performance of Class C, Institutional, Service, Investor, Class R and Class R6 Shares will vary from Class A Shares due to differences in class specific fees and any applicable sales charges. In addition to the Investment Adviser’s decisions regarding issuer/industry investment selection and allocation, other factors may affect Fund performance. These factors include, but are not limited to, Fund operating fees and expenses, portfolio turnover and subscription and redemption cash flows affecting the Fund.
|
| Equity Income Fund’s 10 Year Performance |
Performance of a $10,000 Investment, including any applicable sales charges, with distributions reinvested, from September 1, 2007 through August 31, 2017.
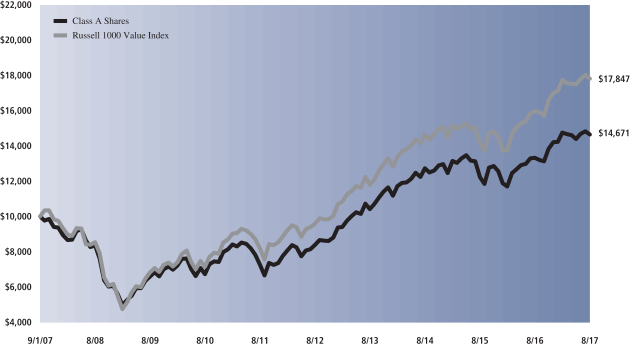
| | | | | | | | | | | | | | |
| Average Annual Total Return through August 31, 2017 | | | One Year | | | | Five Years | | | | Ten Years | | | Since Inception |
Class A (Commenced February 5, 1993) | | | | | | | | | | | | | | |
Excluding sales charges | | | 9.93% | | | | 11.89% | | | | 4.49% | | | 7.11% |
Including sales charges | | | 3.89% | | | | 10.64% | | | | 3.90% | | | 6.86% |
|
Class C (Commenced August 15, 1997) | | | | | | | | | | | | | | |
Excluding contingent deferred sales charges | | | 9.10% | | | | 11.05% | | | | 3.71% | | | 3.24% |
Including contingent deferred sales charges | | | 8.09% | | | | 11.05% | | | | 3.71% | | | 3.24% |
|
Institutional Class (Commenced June 3, 1996) | | | 10.38% | | | | 12.35% | | | | 4.90% | | | 6.14% |
|
Service Class (Commenced March 6, 1996) | | | 9.84% | | | | 11.79% | | | | 4.39% | | | 5.69% |
|
Investor (Commenced November 30, 2007) | | | 10.21% | | | | 12.17% | | | | N/A | | | 4.91% |
|
Class R (Commenced November 30, 2007) | | | 9.68% | | | | 11.62% | | | | N/A | | | 4.40% |
|
Class R6 (Commenced July 31, 2015) | | | 10.39% | | | | N/A | | | | N/A | | | 5.82% |
|
11
PORTFOLIO RESULTS
Goldman Sachs Focused Value Fund
Portfolio Composition
The Fund’s investment objective is to seek long-term capital appreciation. The Fund invests, under normal circumstances, at least 80% of its net assets plus any borrowings for investment purposes (measured at time of purchase) in a portfolio of equity investments, including common stocks, preferred stocks and other securities and instruments having equity characteristics. The Fund seeks to achieve its investment objective by investing, under normal circumstances, in approximately 20-35 companies that are considered value opportunities, which the Investment Adviser defines as companies with identifiable competitive advantages whose intrinsic value is not reflected in the stock price. The Fund may invest in securities of companies of any capitalization. Although the Fund will invest primarily in publicly traded U.S. securities, it may invest up to 20% of its total assets in foreign securities, including securities of issuers in countries with emerging markets or economies (“emerging countries”) and securities quoted in foreign currencies. The Fund may invest in fixed income securities, such as government, corporate and bank debt obligations.
Portfolio Management Discussion and Analysis
Below, the Goldman Sachs Value Equity Investment Team discusses the Goldman Sachs Focused Value Fund’s (the “Fund”) performance and positioning for the 12-month period ended August 31, 2017 (the “Reporting Period”).
| Q | | How did the Fund perform during the Reporting Period? |
| A | | During the Reporting Period, the Fund’s Class A, C, Institutional, Investor, R and R6 Shares generated average annual total returns, without sales charges, of 13.42%, 12.64%, 13.79%, 13.65%, 13.08% and 13.91%, respectively. These returns compare to the 11.58% average annual total return of the Fund’s benchmark, the Russell 1000® Value Index (with dividends reinvested) (the “Russell Index”), during the same period. |
| Q | | What key factors were responsible for the Fund’s performance during the Reporting Period? |
| A | | The Fund outperformed the Russell Index due primarily to effective stock selection as a whole. Sector allocation overall detracted, albeit modestly, from the Fund’s performance relative to the Russell Index during the Reporting Period. |
| Q | | Which equity market sectors most significantly affected Fund performance? |
| A | | Stock selection was most effective in financials, information technology and consumer staples, which helped the Fund’s performance relative to the Russell Index. The sector that most meaningfully detracted from the Fund’s relative results during the Reporting Period was utilities, where having an underweight to the sector, which outpaced the Russell Index during the Reporting period, hurt. Further, stock selection was challenged in the industrials and telecommunication services sectors, which dampened relative results. |
| Q | | What were some of the Fund’s best-performing individual stocks? |
| A | | The Fund benefited most relative to the Russell Index from positions in global financial services company Bank of America, investment banking products and services provider Morgan Stanley and enterprise information management software provider Oracle. |
| | Financial companies broadly rose following the U.S. presidential election as investor sentiment around the sector, and banks in particular, improved. Sentiment improved as investors anticipated both a more attractive regulatory environment and increases in interest rates. |
| | Additionally, on a more company-specific level, the stock price of Bank of America strengthened after the company reported revenue and earnings that exceeded consensus expectations, largely due to improved trading and investment banking growth. At the end of the Reporting Period, we believed shares of Bank of America remained attractively valued given rising U.S. interest rates and an improving U.S. economy. In our view, its management is committed to bettering execution, growing margins and returning capital to shareholders. However, in light of recent outperformance, we |
12
PORTFOLIO RESULTS
| | slightly moderated the Fund’s position to better reflect what we see as the stock’s risk/return profile. |
| | During the first two quarters of 2017, Morgan Stanley’s fixed income, currencies and commodities business delivered solid revenue numbers that indicated the strength of its trading franchise. In our view, Morgan Stanley has been emerging from a period of significant change in its business mix, a restructuring of its expense base and an improvement in its capital levels. In addition, we believe we have seen increased capital returns because of the company’s high capital levels and earnings generation. At the end of the Reporting Period, we maintained our conviction in the company’s management team and its future prospects. |
| | Oracle was a new purchase for the Fund during the Reporting Period. Oracle’s stock price rose sharply after the company reported strong growth in its cloud computing business as well as earnings that exceeded consensus expectations. Further, we were encouraged by its management’s 2018 revenue expectations. At the end of the Reporting Period, we believed Oracle may become a powerful player in cloud computing, as it transitions its existing customer base from on-premise to cloud computing platforms. As investors come to better appreciate this transition, we believe there may be multiple expansion for the company. Its margins, in our view, also have upside potential as more customers transition given the large fixed investment Oracle has made in cloud computing. |
| Q | | Which stocks detracted significantly from the Fund’s performance during the Reporting Period? |
| A | | Detracting most from the Fund’s results relative to the Russell Index were positions in oil and gas exploration and production company Southwestern Energy, U.S.-based media conglomerate Viacom and diversified industrial business General Electric. |
| | Much of the decline in Southwestern Energy’s stock price came as the company announced disappointing earnings that fell below market estimates. In February 2017, its earnings per share came in lower than market consensus due to higher costs and declining production across all three regions in which the company operates. The company did, however, provide strong guidance moving forward and also announced an increase in capital expenditures. During the second calendar quarter, Southwestern Energy’s stock experienced weakness as the price of natural gas was pressured. Market volatility also continued to plague the stock. Despite the decline in the company’s share price, we believed at the end of the Reporting Period that our thesis on demand drivers within natural gas remained intact, even with potential macro headwinds. We also continued to see upside potential for Southwestern Energy given what we view as the company’s high quality assets, specifically in the Marcellus, Fayetteville and Utica shales. We remained encouraged by its management team’s focus on cutting costs and divesting assets as it seeks to reduce debt and believed Southwestern Energy was one of the most attractively valued companies among its peers. |
| | We believe Viacom’s stock came under pressure due to broader investor concerns around traditional cable television subscriber losses. This pervasive theme distracted from the company’s first quarter 2017 earnings results, which came in well above consensus expectations due to strength within Media Networks and Paramount Pictures. At the end of the Reporting Period, we continued to believe in Viacom’s turnaround strategy under recently appointed Chief Executive Officer, Bob Bakish. Further, in our view, the company’s underlying fundamentals have been strengthening. Additionally, we believe Paramount is a rare asset within the media industry and was not being fully appreciated by investors at valuations seen at the end of the Reporting Period. |
| | General Electric’s shares fell as the stock was pressured by weakness in power and oil & gas end-markets. Despite mixed earnings results due to lower margins and cash flow, we remained constructive on General Electric’s future prospects due to a strong backlog and a high exposure to service revenues. Additionally, we believe restructuring and working capital actions taken by its management have the potential to improve the company’s margins and cash flow. In our view, General Electric’s strong market position and product technology could situate the company well for growth looking ahead. |
| Q | | How did the Fund use derivatives and similar instruments during the Reporting Period? |
| A | | During the Reporting Period, we did not use derivatives as part of an active management strategy. |
| Q | | Did the Fund make any significant purchases or sales during the Reporting Period? |
| A | | In addition to the purchases already mentioned, we initiated a Fund position in Exxon Mobil during the Reporting Period. Exxon Mobil is the largest integrated oil company based on reserves and market capitalization. We believe the company has an integrated business model and competitive advantages |
13
PORTFOLIO RESULTS
| | that have helped produce industry-leading returns. In our view, the company has potential to grow production with moderating capital expenditures following an investment phase and has strong free cash flow generation that appears to support ongoing shareholder distributions. We are constructive on its management team, its focus on efficiency and its balance sheet, which we believe provide financial flexibility. |
| | Conversely, in addition to those sales mentioned earlier, we exited the Fund’s position in Verizon Communications, a leading provider of wireless telecommunications in the U.S., after the company began offering an unlimited plan to its mobile subscribers and reduced its long-range forecasts for revenue growth. Additionally, with consolidation within cable and wireless operators accelerating, we believed there was heightened risk around Verizon Communications overpaying for an acquisition. With these two risks introduced, we believed the stock was no longer attractively valued and so we opted to sell the position. |
| | We eliminated the Fund’s position in information technology giant Apple. We had originally entered the position due to what we saw as the company’s low cost smart phone opportunity, distribution expansion, buy-back efforts and customer lock-in benefits. However, we believe consensus expectations for unit growth in 2018 are aggressive and that the company’s strong performance may have reached its peak for the cycle. While we continue to view Apple as a high quality company with good long-term growth potential, we exited the position in favor of what we believe are more compelling investment opportunities. |
| Q | | Were there any notable changes in the Fund’s weightings during the Reporting Period? |
| A | | In constructing the Fund’s portfolio, we focus on picking stocks rather than on making industry or sector bets. We seek to outpace the benchmark index by overweighting stocks that we expect to outperform and underweighting those that we think may lag. Consequently, changes in its sector weights are generally the direct result of individual stock selection or of stock appreciation or depreciation. That said, during the Reporting Period, the Fund’s allocations compared to the Russell Index in energy, financials, industrials and information technology increased. The Fund’s exposure to the consumer discretionary, consumer staples, health care and telecommunication services sectors decreased compared to the Russell Index. The Fund completely eliminated its exposure to the utilities sector and decreased its position in cash. |
| Q | | How was the Fund positioned relative to its benchmark index at the end of August 2017? |
| A | | At the end of August 2017, the Fund was overweighted in information technology, consumer discretionary, industrials, financials and health care relative to the Russell Index. On the same date, the Fund was underweighted in consumer staples, and telecommunication services and was rather neutrally weighted to the Russell Index in energy. The Fund had no allocation to materials, utilities and real estate at the end of August 2017. |
14
FUND BASICS
Focused Value Fund
as of August 31, 2017
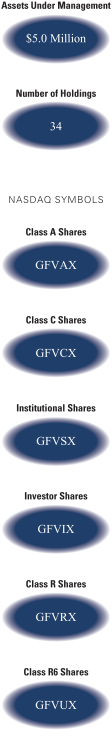
| | | | | | | | | | |
| | PERFORMANCE REVIEW | |
| | | September 1, 2016–August 31, 2017 | | Fund Total Return
(based on NAV)1 | | | Russell 1000
Value Index2 | |
| | Class A | | | 13.42 | % | | | 11.58 | % |
| | Class C | | | 12.64 | | | | 11.58 | |
| | Institutional | | | 13.79 | | | | 11.58 | |
| | Investor | | | 13.65 | | | | 11.58 | |
| | Class R | | | 13.08 | | | | 11.58 | |
| | | Class R6 | | | 13.91 | | | | 11.58 | |
| | 1 | | The net asset value (“NAV”) represents the net assets of the class of the Fund (ex-dividend) divided by the total number of shares of the class outstanding. The Fund’s performance reflects the reinvestment of dividends and other distributions. The Fund’s performance does not reflect the deduction of any applicable sales charges. |
| | 2 | | The unmanaged Russell 1000 Value Index is a market capitalization weighted index of the 1,000 largest U.S. companies with lower price-to-book ratios and lower forecasted growth values. The Index figures do not reflect any deduction of fees, expenses or taxes. It is not possible to invest directly in an unmanaged index. |
| | | | | | | | | | | | |
| | STANDARDIZED TOTAL RETURNS3 |
| | | For the period ended 6/30/17 | | One Year | | | Since Inception | | | Inception Date |
| | Class A | | | 13.98 | % | | | 3.76 | % | | 7/31/15 |
| | Class C | | | 18.72 | | | | 6.07 | | | 7/31/15 |
| | Institutional | | | 21.16 | | | | 7.30 | | | 7/31/15 |
| | Investor | | | 20.89 | | | | 7.14 | | | 7/31/15 |
| | Class R | | | 20.42 | | | | 6.63 | | | 7/31/15 |
| | | Class R6 | | | 21.18 | | | | 7.32 | | | 7/31/15 |
| | 3 | | The Standardized Total Returns are average annual total returns or cumulative total returns (only if the performance period is one year or less) as of the most recent calendar quarter-end. They assume reinvestment of all distributions at NAV. These returns reflect a maximum initial sales charge of 5.50% for Class A Shares and the assumed contingent deferred sales charge for Class C Shares (1.00% if redeemed within 12 months of purchase). Because Institutional, Investor, Class R and Class R6 Shares do not involve a sales charge, such a charge is not applied to their Standardized Total Returns. |
The returns set forth in the tables above represent past performance. Past performance does not guarantee future results. The Fund’s investment return and principal value will fluctuate so that an investor’s shares, when redeemed, may be worth more or less than their original cost. Current performance may be lower or higher than the performance quoted above. Please visit our web site at www.GSAMFUNDS.com to obtain the most recent month-end returns. Performance reflects applicable fee waivers and/or expense limitations in effect during the periods shown. In their absence, performance would be reduced. Returns do not reflect the deduction of taxes that a shareholder would pay on Fund distributions or the redemption of Fund shares.
15
FUND BASICS
| | | | | | | | | | |
| | EXPENSE RATIOS4 | |
| | | | | Net Expense Ratio (Current) | | | Gross Expense Ratio (Before Waivers) | |
| | Class A | | | 1.13 | % | | | 7.70 | % |
| | Class C | | | 1.88 | | | | 8.45 | |
| | Institutional | | | 0.73 | | | | 7.30 | |
| | Investor | | | 0.88 | | | | 7.45 | |
| | Class R | | | 1.38 | | | | 7.95 | |
| | | Class R6 | | | 0.71 | | | | 7.28 | |
| | 4 | | The expense ratios of the Fund, both current (net of any fee waivers or expense limitations) and before waivers (gross of any fee waivers or expense limitations) are as set forth above according to the most recent publicly available Prospectus for the Fund and may differ from the expense ratios disclosed in the Financial Highlights in this report. Pursuant to a contractual arrangement, the Fund’s waivers and/or expense limitations will remain in place through at least April 28, 2018, and prior to such date the investment adviser may not terminate the arrangements without the approval of the Fund’s Board of Trustees. If these arrangements are discontinued in the future, the expense ratios may change without shareholder approval. |
| | | | | | | | |
| | TOP TEN HOLDINGS AS OF 8/31/175 |
| | | Holding | | % of Net Assets | | | Line of Business |
| | General Electric Co. | | | 5.1 | % | | Industrial Conglomerates |
| | Exxon Mobil Corp. | | | 4.9 | | | Oil, Gas & Consumable Fuels |
| | Bank of America Corp. | | | 4.8 | | | Banks |
| | Oracle Corp. | | | 4.7 | | | Software |
| | Wells Fargo & Co. | | | 4.7 | | | Banks |
| | Alphabet, Inc. Class A | | | 4.6 | | | Internet Software & Services |
| | The Procter & Gamble Co. | | | 3.9 | | | Household Products |
| | Liberty Global PLC Series C | | | 3.9 | | | Media |
| | Allergan PLC | | | 3.8 | | | Pharmaceuticals |
| | | Pfizer, Inc. | | | 3.8 | | | Pharmaceuticals |
| | 5 | | The top 10 holdings may not be representative of the Fund’s future investments. |
16
FUND BASICS
|
| FUND VS. BENCHMARK SECTOR ALLOCATIONS6 |
| As of August 31, 2017 |
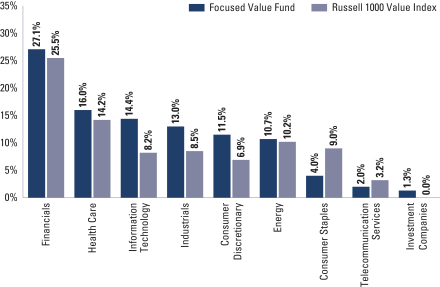
| | 6 | | The Fund is actively managed and, as such, its composition may differ over time. Consequently, the Fund’s overall sector allocations may differ from the percentages contained in the graph above. The graph categorizes investments using the Global Industry Classification Standard (“GICS”), however, the sector classifications used by the portfolio management team may differ from GICS. The percentage shown for each investment category reflects the value of investments in that category as a percentage of market value (excluding investments in the securities lending reinvestment vehicle, if any). Investments in the securities lending reinvestment vehicle represented 1.9% of the Fund’s net assets as of August 31, 2017. The graph depicts the Fund’s investments but may not represent the Fund’s market exposure due to the exclusion of certain derivatives, if any, as listed in the Additional Investment Information section of the Schedule of Investments. |
17
GOLDMAN SACHS FOCUSED VALUE FUND
Performance Summary
August 31, 2017
The following graph shows the value, as of August 31, 2017, of a $1,000,000 investment made on July 31, 2015 (commencement of operations) in Institutional Shares at NAV. For comparative purposes, the performance of the Fund’s benchmark, the Russell 1000 Value Index (with dividends reinvested), is shown. This performance data represents past performance and should not be considered indicative of future performance, which will fluctuate with changes in market conditions. These performance fluctuations may cause an investor’s shares, when redeemed, to be worth more or less than their original cost. Performance reflects applicable fee waivers and/or expense limitations in effect during the periods shown and in their absence, performance would be reduced. Returns do not reflect the deduction of taxes that a shareholder would pay on Fund distributions or the redemption of Fund shares. Performance of Class A, Class C, Investor, Class R and Class R6 Shares will vary from Institutional Shares due to differences in class specific fees and any applicable sales charges. In addition to the Investment Adviser’s decisions regarding issuer/industry investment selection and allocation, other factors may affect Fund performance. These factors include, but are not limited to, Fund operating fees and expenses, portfolio turnover and subscription and redemption cash flows affecting the Fund.
|
| Focused Value Fund’s Lifetime Performance |
Performance of a $1,000,000 Investment, including any applicable sales charges, with distributions reinvested, from July 31, 2015 through August 31, 2017.
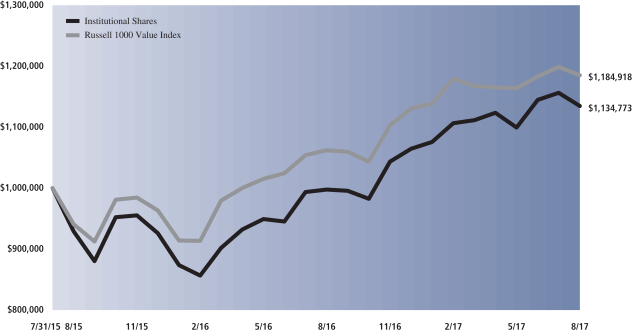
| | | | | | |
| Average Annual Total Return through August 31, 2017 | | | One Year | | | Since Inception |
Class A (Commenced July 31, 2015) | | | | | | |
Excluding sales charges | | | 13.42% | | | 5.83% |
Including sales charges | | | 7.13% | | | 3.01% |
|
Class C (Commenced July 31, 2015) | | | | | | |
Excluding sales charges | | | 12.64% | | | 5.06% |
Including sales charges | | | 11.63% | | | 5.06% |
|
Institutional Class (Commenced July 31, 2015) | | | 13.79% | | | 6.23% |
|
Investor (Commenced July 31, 2015) | | | 13.65% | | | 6.09% |
|
Class R (Commenced July 31, 2015) | | | 13.08% | | | 5.57% |
|
Class R6 (Commenced July 31, 2015) | | | 13.91% | | | 6.29% |
|
18
PORTFOLIO RESULTS
Goldman Sachs Large Cap Value Fund
Portfolio Composition
The Fund invests, under normal circumstances, at least 80% of its net assets plus any borrowings for investment purposes (measured at the time of purchase) in a diversified portfolio of equity investments in large-cap U.S. issuers with public stock market capitalizations within the range of the market capitalization of companies constituting the Russell 1000® Value Index at the time of investment. The Fund seeks its investment objective of long-term capital appreciation by investing in value opportunities that the Goldman Sachs Value Equity Investment Team defines as companies with identifiable competitive advantages whose intrinsic value is not reflected in the stock price. Although the Fund will invest primarily in publicly traded U.S. securities, it may invest up to 20% of its net assets in foreign securities, including securities of issuers in emerging countries and securities quoted in foreign currencies. The Fund may also invest up to 20% of its total net assets in fixed income securities, such as government, corporate and bank debt obligations.
Portfolio Management Discussion and Analysis
Below, the Goldman Sachs Value Equity Investment Team discusses the Goldman Sachs Large Cap Value Fund’s (the “Fund”) performance and positioning for the 12-month period ended August 31, 2017 (the “Reporting Period”).
| Q | | How did the Fund perform during the Reporting Period? |
| A | | During the Reporting Period, the Fund’s Class A, C, Institutional, Service, Investor, R and R6 Shares generated average annual total returns, without sales charges, of 9.04%, 8.18%, 9.41%, 8.80%, 9.26%, 8.73% and 9.63%, respectively. |
| | These returns compare to the 11.58% average annual total return of the Fund’s benchmark, the Russell 1000® Value Index (with dividends reinvested) (the “Russell Index”), during the same period. |
| Q | | What key factors were responsible for the Fund’s performance during the Reporting Period? |
| A | | The Fund generated solid absolute gains, but stock selection and sector allocation overall detracted from the Fund’s performance relative to the Russell Index during the Reporting Period. |
| Q | | Which equity market sectors most significantly affected Fund performance? |
| A | | Detracting most from the Fund’s performance relative to the Russell Index were industrials, consumer discretionary and energy, wherein stock selection was comparatively weak. Having an allocation to cash during a Reporting Period when the Russell Index rallied further dampened the Fund’s relative results. Effective stock selection in the financials, health care and information technology sectors contributed most positively. |
| Q | | Which stocks detracted significantly from the Fund’s performance during the Reporting Period? |
| A | | Detracting most from the Fund’s results relative to the Russell Index were positions in oil and gas exploration and production companies Southwestern Energy and Range Resources and in diversified industrial business General Electric. |
| | Much of the decline in Southwestern Energy’s stock price came as the company announced disappointing earnings that fell below market estimates. In February 2017, its earnings per share came in lower than market consensus due to higher costs and declining production across all three regions in which the company operates. The company did, however, provide strong guidance moving forward and also announced an increase in capital expenditures. During the second calendar quarter, Southwestern Energy’s stock experienced weakness as the price of natural gas was pressured. Market volatility also continued to plague the stock. Despite the decline in the company’s share price, we believed at the end of the Reporting Period that our thesis on demand drivers within natural gas remained intact, even with potential macro |
19
PORTFOLIO RESULTS
| | headwinds. We also continued to see upside potential for Southwestern Energy given what we view as the company’s high quality assets, specifically in the Marcellus, Fayetteville and Utica shales. We remained encouraged by its management team’s focus on cutting costs and divesting assets as it seeks to reduce debt and believed Southwestern Energy was one of the most attractively valued companies among its peers. |
| | Range Resources’ stock was pressured by investors’ concerns about increased oil production, which has the potential to increase supply of associated gas and thus lower gas prices. In our view, however, the long-term demand drivers of natural gas, such as coal plant retirements, liquid natural gas exports and industrial/electricity generation, remain intact. Range Resources, we believe, has a strong asset base in the Appalachian and Midcontinent regions, which its management has indicated could experience significant production growth in 2018. At the end of the Reporting Period, we were also positive on Range Resources’ acquisition of Memorial Resource Development, which should help diversify its assets. |
| | General Electric’s shares fell as the stock was pressured by weakness in power and oil & gas end-markets. Despite mixed earnings results due to lower margins and cash flow, we remained constructive on General Electric’s prospects due to a strong backlog and a high exposure to service revenues. Additionally, we believe restructuring and working capital actions taken by its management have the potential to improve the company’s margins and cash flow. In our view, General Electric’s strong market position and product technology could situate the company well future growth. |
| Q | | What were some of the Fund’s best-performing individual stocks? |
| A | | The Fund benefited most relative to the Russell Index from positions in global financial services company Bank of America, U.S.-based pharmaceutical company Vertex Pharmaceuticals and telecommunications and digital entertainment services provider AT&T. |
| | Bank of America’s shares, like the financials sector broadly, rose sharply following the U.S. presidential election as investor sentiment around the sector, and banks in particular, improved. Sentiment improved as investors anticipated both a more attractive regulatory environment and increases in interest rates. Additionally, on a more company-specific level, the stock price of Bank of America strengthened after the company reported revenue and earnings that exceeded consensus expectations, largely due to improved trading and investment banking growth. At the end of the Reporting Period, we believed shares of Bank of America remained attractively valued given rising U.S. interest rates and an improving U.S. economy. In our view, its management is committed to bettering execution, growing margins and returning capital to shareholders. However, in light of recent outperformance, we slightly moderated the Fund’s position to better reflect what we see as the stock’s risk/return profile. |
| | Vertex Pharmaceuticals announced earnings in January 2017 that were better than market estimates on earnings per share and total revenue. Most of the movement in the stock, however, occurred later in the first calendar quarter when its share price spiked as the company announced the successful clinical trial of one of its next-generation cystic fibrosis pipeline drugs. Its shares also rose after the company reported fourth quarter 2016 earnings that exceeded consensus expectations and raised 2017 guidance. Additionally, Vertex Pharmaceuticals sold its cancer research pipeline for $230 million. Investors viewed this positively given the possibility of royalties on future sales. At the end of the Reporting Period, we believed Vertex Pharmaceuticals was likely to continue to expand its reach into the cystic fibrosis market through its next-generation pipeline drugs. In our view, the stock was trading at a compelling valuation, and the company was well insulated relative to its peer group if regulatory changes are made to the broader health care sector. However, following the stock’s recent strong performance, we moderated the Fund’s position to better reflect what we saw as the stock’s then-current risk/reward profile. |
20
PORTFOLIO RESULTS
| | We believe AT&T performed well as investors generally appeared to agree that the company is better positioned strategically after its acquisitions of DirecTV, an American direct broadcast satellite service provider; Time Warner Cable, a global leader in media and entertainment; and the 5G wireless spectrum gained in recent auctions. Furthermore, at the end of the Reporting Period, we believed AT&T’s 5%-plus dividend was well positioned and that the company could potentially be a beneficiary from any changes to tax legislation. |
| Q | | How did the Fund use derivatives and similar instruments during the Reporting Period? |
| A | | During the Reporting Period, we did not use derivatives as part of an active management strategy. |
| Q | | Did the Fund make any significant purchases or sales during the Reporting Period? |
| A | | During the Reporting Period, we initiated a Fund position in American International Group, an insurance company based in New York. We believe its new Chief Executive Officer’s initiatives and capabilities may well serve as a positive catalyst and lead to margin improvement. We established the Fund position in the company because of what we considered to be its attractive valuation and our belief in the upcoming inflection in its fundamentals. Additionally, we believe the company’s new financial strength rating could be accretive to its earnings over time. |
| | We established a Fund position in Liberty Global, an international broadband company. We initiated a position in the company due to what we view as its strong cable TV business model and earnings before interest, taxes, depreciation and amortization (“EBITDA”) acceleration in 2018. We are also constructive on its management team and its ability to create value and divest assets. In our view, its free cash flow should improve once cash flow demand from Project Lightning in the U.K. declines, allowing for increased share buybacks. (Project Lightning, launched in February 2016, is the single largest investment in broadband digital infrastructure in the U.K. in more than a decade.) Additionally, we believe the company was attractively valued at the time of purchase relative to private market value and peers. |
| | Conversely, we exited the Fund’s position in Verizon Communications, a leading provider of wireless telecommunications in the U.S., after the company began offering an unlimited plan to its mobile subscribers and reduced its long-range forecasts for revenue growth. Additionally, with consolidation within cable and wireless operators accelerating, we believed there was heightened risk around Verizon Communications overpaying for an acquisition. With these two risks introduced, we believed the stock was no longer attractively valued and so we opted to sell the position. |
| | We sold the Fund’s position in United Technologies, an industrial conglomerate. We originally initiated a position in the company due to our view that its shares were undervalued given future growth and margin expansion opportunities for the company. Additionally, we were constructive on its new management team and its focus on cost cutting efforts, divestitures and share repurchases. As our investment thesis was realized and as its shares approached our price target, we exited the position in favor of opportunities that we believed to have better risk-adjusted return potential. |
| Q | | Were there any notable changes in the Fund’s weightings during the Reporting Period? |
| A | | In constructing the Fund’s portfolio, we focus on picking stocks rather than on making industry or sector bets. We seek to outpace the benchmark index by overweighting stocks that we expect to outperform and underweighting those that we think may lag. Consequently, changes in its sector weights are generally the direct result of individual stock selection or of stock appreciation or depreciation. That said, during the Reporting Period, the Fund’s allocations compared to the Russell Index in consumer discretionary, energy, financials and industrials increased. The Fund’s exposure to health care and utilities decreased compared to the Russell Index. |
21
PORTFOLIO RESULTS
| Q | | How was the Fund positioned relative to its benchmark index at the end of August 2017? |
| A | | At the end of August 2017, the Fund had overweighted positions relative to the Russell Index in the industrials, information technology, consumer discretionary, and health care sectors. On the same date, the Fund had underweighted positions compared to the Russell Index in consumer staples, real estate and utilities and was rather neutrally weighted to the Russell Index in financials, energy, materials and telecommunication services. |
22
FUND BASICS
Large Cap Value Fund
as of August 31, 2017
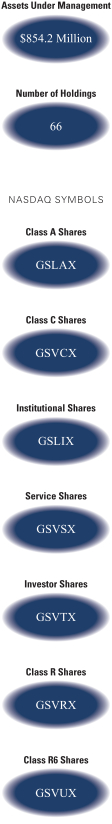
| | | | | | | | | | |
| | PERFORMANCE REVIEW | |
| | | September 1, 2016–August 31, 2017 | | Fund Total Return
(based on NAV)1 | | | Russell 1000
Value Index2 | |
| | Class A | | | 9.04 | % | | | 11.58 | % |
| | Class C | | | 8.18 | | | | 11.58 | |
| | Institutional | | | 9.41 | | | | 11.58 | |
| | Service | | | 8.80 | | | | 11.58 | |
| | Investor | | | 9.26 | | | | 11.58 | |
| | Class R | | | 8.73 | | | | 11.58 | |
| | | Class R6 | | | 9.63 | | | | 11.58 | |
| | 1 | | The net asset value (“NAV”) represents the net assets of the class of the Fund (ex-dividend) divided by the total number of shares of the class outstanding. The Fund’s performance reflects the reinvestment of dividends and other distributions. The Fund’s performance does not reflect the deduction of any applicable sales charges. |
| | 2 | | The unmanaged Russell 1000 Value Index is a market capitalization weighted index of the 1,000 largest U.S. companies with lower price-to-book ratios and lower forecasted growth values. The Index figures do not reflect any deduction of fees, expenses or taxes. It is not possible to invest directly in an unmanaged index. |
| | | | | | | | | | | | | | | | | | | | |
| | STANDARDIZED TOTAL RETURNS3 |
| | | For the period ended 6/30/17 | | One Year | | | Five Years | | | Ten Years | | | Since Inception | | | Inception Date |
| | Class A | | | 9.50 | % | | | 11.47 | % | | | 3.85 | % | | | 5.75 | % | | 12/15/99 |
| | Class C | | | 14.03 | | | | 11.90 | | | | 3.67 | | | | 5.29 | | | 12/15/99 |
| | Institutional | | | 16.30 | | | | 13.17 | | | | 4.85 | | | | 6.50 | | | 12/15/99 |
| | Service | | | 15.76 | | | | 12.62 | | | | 4.33 | | | | 6.00 | | | 12/15/99 |
| | Investor | | | 16.20 | | | | 13.02 | | | | N/A | | | | 5.32 | | | 11/30/07 |
| | Class R | | | 15.66 | | | | 12.46 | | | | N/A | | | | 4.82 | | | 11/30/07 |
| | | Class R6 | | | 16.53 | | | | N/A | | | | N/A | | | | 6.14 | | | 7/31/15 |
| | 3 | | The Standardized Total Returns are average annual total returns or cumulative total returns (only if the performance period is one year or less) as of the most recent calendar quarter-end. They assume reinvestment of all distributions at NAV. These returns reflect a maximum initial sales charge of 5.50% for Class A Shares and the assumed contingent deferred sales charge for Class C Shares (1.00% if redeemed within 12 months of purchase). Because Instiutional, Service, Investor, Class R and Class R6 Shares do not involve a sales charge, such a charge is not applied to their Standardized Total Returns. |
The returns set forth in the tables above represent past performance. Past performance does not guarantee future results. The Fund’s investment return and principal value will fluctuate so that an investor’s shares, when redeemed, may be worth more or less than their original cost. Current performance may be lower or higher than the performance quoted above. Please visit our web site at www.GSAMFUNDS.com to obtain the most recent month-end returns. Performance reflects applicable fee waivers and/or expense limitations in effect during the periods shown. In their absence, performance would be reduced. Returns do not reflect the deduction of taxes that a shareholder would pay on Fund distributions or the redemption of Fund shares.
23
FUND BASICS
| | | | | | | | | | |
| | EXPENSE RATIOS4 | |
| | | | | Net Expense Ratio (Current) | | | Gross Expense Ratio (Before Waivers) | |
| | Class A | | | 1.12 | % | | | 1.23 | % |
| | Class C | | | 1.87 | | | | 1.98 | |
| | Institutional | | | 0.79 | | | | 0.83 | |
| | Service | | | 1.29 | | | | 1.33 | |
| | Investor | | | 0.87 | | | | 0.98 | |
| | Class R | | | 1.37 | | | | 1.48 | |
| | | Class R6 | | | 0.77 | | | | 0.81 | |
| | 4 | | The expense ratios of the Fund, both current (net of any fee waivers or expense limitations) and before waivers (gross of any fee waivers or expense limitations) are as set forth above according to the most recent publicly available Prospectus for the Fund and may differ from the expense ratios disclosed in the Financial Highlights in this report. Pursuant to a contractual arrangement, the Fund’s waivers and/or expense limitations will remain in place through at least April 28, 2018, and prior to such date the investment adviser may not terminate the arrangements without the approval of the Fund’s Board of Trustees. If these arrangements are discontinued in the future, the expense ratios may change without shareholder approval. |
| | | | | | | | |
| | TOP TEN HOLDINGS AS OF 8/31/175 |
| | | Holding | | % of Net Assets | | | Line of Business |
| | Wells Fargo & Co. | | | 4.8 | % | | Banks |
| | Exxon Mobil Corp. | | | 4.8 | | | Oil, Gas & Consumable Fuels |
| | Bank of America Corp. | | | 4.8 | | | Banks |
| | General Electric Co. | | | 3.6 | | | Industrial Conglomerates |
| | Pfizer, Inc. | | | 3.5 | | | Pharmaceuticals |
| | JPMorgan Chase & Co. | | | 3.3 | | | Banks |
| | Allergan PLC | | | 3.3 | | | Pharmaceuticals |
| | Oracle Corp. | | | 3.0 | | | Software |
| | MetLife, Inc. | | | 2.9 | | | Insurance |
| | | The Procter & Gamble Co. | | | 2.9 | | | Household Products |
| | 5 | | The top 10 holdings may not be representative of the Fund’s future investments. |
24
FUND BASICS
|
| FUND VS. BENCHMARK SECTOR ALLOCATIONS6 |
| As of August 31, 2017 |
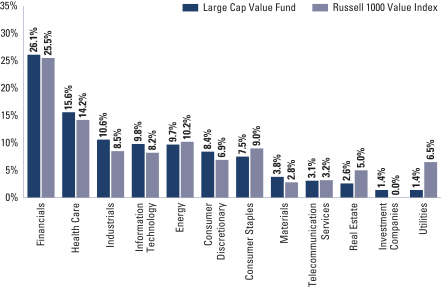
| | 6 | | The Fund is actively managed and, as such, its composition may differ over time. Consequently, the Fund’s overall sector allocations may differ from the percentages contained in the graph above. The graph categorizes investments using the Global Industry Classification Standard (“GICS”), however, the sector classifications used by the portfolio management team may differ from GICS. The percentage shown for each investment category reflects the value of investments in that category as a percentage of market value (excluding investments in the securities lending reinvestment vehicle, if any). Investments in the securities lending reinvestment vehicle represented 1.0% of the Fund’s net assets as of August 31, 2017. The graph depicts the Fund’s investments but may not represent the Fund’s market exposure due to the exclusion of certain derivatives, if any, as listed in the Additional Investment Information section of the Schedule of Investments. |
25
GOLDMAN SACHS LARGE CAP VALUE FUND
Performance Summary
August 31, 2017
The following graph shows the value, as of August 31, 2017, of a $1,000,000 investment made on September 1, 2007 in Institutional Shares at NAV. For comparative purposes, the performance of the Fund’s benchmark, the Russell 1000® Value Index (with dividends reinvested), is shown. This performance data represents past performance and should not be considered indicative of future performance, which will fluctuate with changes in market conditions. These performance fluctuations may cause an investor’s shares, when redeemed, to be worth more or less than their original cost. Performance reflects applicable fee waivers and/or expense limitations in effect during the periods shown and in their absence, performance would be reduced. Returns do not reflect the deduction of taxes that a shareholder would pay on Fund distributions or the redemption of Fund shares. Performance of Class A, Class C, Service, Investor, Class R and Class R6 Shares will vary from Institutional Shares due to differences in class specific fees and any applicable sales charges. In addition to the Investment Adviser’s decisions regarding issuer/industry investment selection and allocation, other factors may affect Fund performance. These factors include, but are not limited to, Fund operating fees and expenses, portfolio turnover and subscription and redemption cash flows affecting the Fund.
|
| Large Cap Value Fund’s 10 Year Performance |
Performance of a $1,000,000 Investment, including any applicable sales charges, with distributions reinvested, from September 1, 2007 through August 31, 2017.
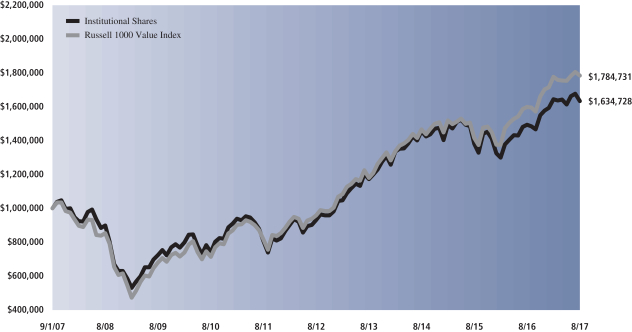
| | | | | | | | | | | | | | |
| Average Annual Total Return through August 31, 2017 | | | One Year | | | | Five Years | | | | Ten Years | | | Since Inception |
Class A (Commenced December 15, 1999) | | | | | | | | | | | | | | |
Excluding sales charges | | | 9.04% | | | | 11.49% | | | | 4.62% | | | 5.92% |
Including sales charges | | | 3.02% | | | | 10.23% | | | | 4.03% | | | 5.58% |
|
Class C (Commenced December 15, 1999) | | | | | | | | | | | | | | |
Excluding contingent deferred sales charges | | | 8.18% | | | | 10.65% | | | | 3.84% | | | 5.12% |
Including contingent deferred sales charges | | | 7.17% | | | | 10.65% | | | | 3.84% | | | 5.12% |
|
Institutional Class (Commenced December 15, 1999) | | | 9.41% | | | | 11.91% | | | | 5.03% | | | 6.33% |
|
Service Class (Commenced December 15, 1999) | | | 8.80% | | | | 11.36% | | | | 4.51% | | | 5.83% |
|
Investor (Commenced November 30, 2007) | | | 9.26% | | | | 11.76% | | | | N/A | | | 5.04% |
|
Class R (Commenced November 30, 2007) | | | 8.73% | | | | 11.21% | | | | N/A | | | 4.54% |
|
Class R6 (Commenced July 31, 2015) | | | 9.63% | | | | N/A | | | | N/A | | | 4.77% |
|
26
PORTFOLIO RESULTS
Goldman Sachs Mid Cap Value Fund
Portfolio Composition
The Fund invests, under normal circumstances, at least 80% of its net assets plus any borrowings for investment purposes (measured at the time of purchase) in a diversified portfolio of equity investments in mid-cap issuers with public stock market capitalizations within the range of the market capitalization of companies constituting the Russell Midcap® Value Index at the time of investment. The Fund seeks its investment objective of long-term capital appreciation by investing in value opportunities that the Investment Adviser defines as companies with identifiable competitive advantages whose intrinsic value is not reflected in stock price. Although the Fund will invest primarily in publicly traded U.S. securities, it may invest up to 25% of its total net assets in foreign securities, including securities of issuers in emerging countries and securities quoted in foreign currencies. The Fund may also invest in the aggregate up to 20% of its total net assets in companies with public stock market capitalizations outside the range of companies constituting the Russell Midcap® Value Index at the time of investment and in fixed income securities, such as government, corporate and bank debt obligations.
Portfolio Management Discussion and Analysis
Below, the Goldman Sachs Value Equity Investment Team discusses the Goldman Sachs Mid Cap Value Fund’s (the “Fund”) performance and positioning for the 12-month period ended August 31, 2017 (the “Reporting Period”).
| Q | | How did the Fund perform during the Reporting Period? |
| A | | During the Reporting Period, the Fund’s Class A, C, Institutional, Service, Investor, R and R6 Shares generated average annual total returns, without sales charges, of 9.66%, 8.86%, 10.12%, 9.56%, 9.94%, 9.40% and 10.13%, respectively. These returns compare to the 10.82% average annual total return of the Fund’s benchmark, the Russell Midcap® Value Index (with dividends reinvested) (the “Russell Index”), during the same period. |
| Q | | What key factors were responsible for the Fund’s performance during the Reporting Period? |
| A | | The Fund posted solid positive absolute returns, but sector allocation overall detracted from the Fund’s performance relative to the Russell Index during the Reporting Period. Stock selection as a whole also detracted, albeit more modestly, from the Fund’s results. |
| Q | | Which equity market sectors most significantly affected Fund performance? |
| A | | Detracting from the Fund’s performance most relative to the Russell Index was stock selection in real estate, industrials and consumer discretionary. Stock selection and having an underweighted allocation to utilities, which outpaced the Russell Index during the Reporting Period, also hurt. Having a position in cash during a Reporting Period when the Russell Index rallied further dampened relative results. Partially offsetting these detractors was effective stock selection in the information technology, financials and materials sectors, which contributed positively. |
| Q | | Which stocks detracted significantly from the Fund’s performance during the Reporting Period? |
| A | | Detracting most from the Fund’s results relative to the Russell Index were positions in DDR, Brixmor Property Group and Federal Realty Investment Trust. |
| | DDR, an owner and manager of retail shopping centers in the U.S. and Puerto Rico, was the top detractor from the Fund’s relative results during the Reporting Period. We believe the majority of its stock’s underperformance of the Russell Index during the Reporting Period can be attributed to market concerns around store closures and retailer bankruptcies, resulting from disappointing retail sales. Despite its underperformance, we believed at the end of the Reporting Period that the company’s fundamentals remained healthy and its high quality tenant base provided it with an advantage relative to its peers. Further, we maintained a high level of conviction in its new management team and its extensive experience and deep relationships in the strip mall/retail park space. |
| | Brixmor Property Group, an owner of grocery-anchored community shopping centers, was also a significant detractor |
27
PORTFOLIO RESULTS
| | from the Fund’s relative results during the Reporting Period. We believe its underperformance of the Russell Index was largely due to investor concerns about store closures within the industry, resulting from disappointing retail sales. In our view, these fears are overblown, especially given Brixmor Property Group’s base in high quality grocery-anchored shopping centers. Overall, at the end of the Reporting Period, we remained positive on Brixmor Property Group’s long-term growth potential as well as its portfolio of assets. Fundamentals in the industry remained healthy, in our view, as supply, relative to historical levels, was low, and demand was still strong. Finally, we were encouraged by its management’s focus on high return redevelopment projects and on improving the company’s balance sheet. |
| | | Federal Realty Investment Trust is a real estate investment trust (“REIT”) that engages in the ownership, operation and redevelopment of high quality retail-based properties located primarily in major coastal markets. We believe its underperformance of the Russell Index during the Reporting Period can be attributed to market concerns about a rising e-commerce environment and anchor vacancies within the retail space. Its shares also declined after the company reported weak third quarter 2016 earnings. Despite a challenging retail environment, we remained constructive at the end of the Reporting Period on the company’s commitment to align its portfolio with the changing consumer. Additionally, we remained attracted to what we see as the company’s strong management team, as it continues to divest unprofitable assets and allocate capital to opportunities with greater upside potential. |
| Q | | What were some of the Fund’s best-performing individual stocks? |
| A | | The Fund benefited most relative to the Russell Index from positions in IAC/InterActive (“IAC”), SLM and Marvell Technology Group. |
| | IAC is a leading media and Internet company. Its outperformance of the Russell Index was primarily driven by the company’s announcement to merge its Home Advisor subsidiary into Angie’s List to create ANGI HomeServices, an online home services company with industry-leading market share. In addition to gaining significant market share in a growing industry, the deal allows IAC to preserve Angie’s Lists’ public company status, essentially resulting in a public listing of HomeAdvisor. IAC’s shares also rose after the company reported strong first quarter 2017 earnings results in all five of its business segments. In our view, the stock was trading at a compelling valuation and was well positioned to benefit from a rapidly growing home services segment. However, given its stock’s recent strong performance, we opted to sell the position and allocate proceeds to what we viewed as investment opportunities with more compelling upside potential. |
| | SLM, a company that provides funding and servicing for student loans, commonly known as Sallie Mae, was also a top positive contributor to the Fund’s results during the Reporting Period. We had invested in SLM because we felt the company had strong and highly visible growth, a dominant position in a market with high barriers to entry and a new Chief Executive Officer with a track record of success at other companies. Despite solid performance at SLM, perceived political risk weighed heavily on the stock ahead of the U.S. presidential elections. Its shares subsequently spiked following the election results, and sentiment continued to improve as investors anticipated a more attractive regulatory environment for SLM. Despite its recent strong performance, at the end of the Reporting Period, we continued to see upside potential for the company and opportunities for future growth. |
| | Marvell Technology Group is a company specializing in the design of semiconductors used in storage and networking devices. We believe the company was trading at an attractive valuation during the Reporting Period. We also believed the declining hard-disk drive storage market provided an opportunity for the company to increase its market share as competitors exited the arena. At the end of the Reporting Period, we remained constructive on its management team’s commitment to divesting lower-margin businesses while also introducing higher-margin products into its list of offerings. |
| Q | | How did the Fund use derivatives and similar instruments during the Reporting Period? |
| A | | During the Reporting Period, we did not use derivatives as part of an active management strategy. |
| Q | | Did the Fund make any significant purchases or sales during the Reporting Period? |
| A | | We initiated a Fund position in SunTrust Banks, a bank holding company based in Atlanta, Georgia. We are positive on what we consider to be SunTrust Banks’ attractive relative valuation and its broad footprint in the fast-growing southeastern U.S. We also are encouraged by its management’s execution on plans to improve its capital efficiency. |
| | We established a Fund position in Newell Brands, a leading global consumer goods company. We are constructive on the |
28
PORTFOLIO RESULTS
| | company’s business model and its management team’s track record of execution and value creation. We believe Newell Brands was attractively valued at the time of our purchase given what we view as the strength of its franchise and the potential for further realization of cost and growth synergies from its acquisition of Jarden in 2015. |
| | Conversely, in addition to those sales already mentioned, we exited the Fund’s position in Pentair, a diversified industrial company. We were positive on Pentair’s plan to improve margins and operational efficiency. Additionally, in our view, the sale of its valves and controls business improved the company’s capital structure and resulted in a simpler business model with high quality construction and water businesses, areas we viewed as the most compelling for growth. Following the U.S. election results, however, we became increasingly concerned that U.K.-based Pentair could be negatively affected by proposed changes to the U.S. tax code. We chose to transition the capital from the sale of Pentair to industrials companies with higher U.S. exposure. |
| | We eliminated the Fund’s position in Centene, a health care insurance and services company. We had been positive on the company’s attractive valuation and potential opportunities for future growth, as states continue to outsource Medicaid. Additionally, we were positive on the potential synergies from the company’s acquisition of Health Net. Following the U.S. election results, however, its shares dropped, as investors became wary of possible changes to Medicaid and the Affordable Care Act and the subsequent negative effect on Centene, which has exposure to both. In light of increased uncertainty regarding health care reform, we decided to exit the Fund’s position in favor of another opportunity we felt provided greater upside potential. |
| Q | | Were there any notable changes in the Fund’s weightings during the Reporting Period? |
| A | | In constructing the Fund’s portfolio, we focus on picking stocks rather than on making industry or sector bets. We seek to outpace the benchmark index by overweighting stocks that we expect to outperform and underweighting those that we think may lag. Consequently, changes in its sector weights are generally the direct result of individual stock selection or of stock appreciation or depreciation. That said, during the Reporting Period, the Fund’s allocations compared to the Russell Index in consumer discretionary, consumer staples, financials, information technology and materials increased. The Fund’s exposure to the health care sector decreased compared to the Russell Index. The Fund’s position in cash also decreased during the Reporting Period. |
| Q | | How was the Fund positioned relative to its benchmark index at the end of August 2017? |
| A | | At the end of August 2017, the Fund had overweighted positions relative to the Russell Index in the consumer discretionary, consumer staples and information technology sectors. On the same date, the Fund had underweighted positions compared to the Russell Index in real estate, financials and utilities and was rather neutrally weighted to the Russell Index in energy, health care, industrials, materials and telecommunication services. |
29
FUND BASICS
Mid Cap Value Fund
as of August 31, 2017
| | | | | | | | | | |
| | PERFORMANCE REVIEW | |
| | | September 1, 2016–August 31, 2017 | | Fund Total Return
(based on NAV)1 | | | Russell Midcap
Value Index2 | |
| | Class A | | | 9.66 | % | | | 10.82 | % |
| | Class C | | | 8.86 | | | | 10.82 | |
| | Institutional | | | 10.12 | | | | 10.82 | |
| | Service | | | 9.56 | | | | 10.82 | |
| | Investor | | | 9.94 | | | | 10.82 | |
| | Class R | | | 9.40 | | | | 10.82 | |
| | | Class R6 | | | 10.13 | | | | 10.82 | |
| | 1 | | The net asset value (“NAV”) represents the net assets of the class of the Fund (ex-dividend) divided by the total number of shares of the class outstanding. The Fund’s performance reflects the reinvestment of dividends and other distributions. The Fund’s performance does not reflect the deduction of any applicable sales charges. |
| | 2 | | The Russell Midcap Value® Index is an unmanaged index of common stock prices that measures the performance of those Russell Midcap companies with lower price-to-book ratios and lower forecasted growth values. The Index figures do not reflect any deduction for fees, expenses or taxes. It is not possible to invest directly in an unmanaged index. |
| | | | | | | | | | | | | | | | | | | | |
| | STANDARDIZED TOTAL RETURNS3 |
| | | For the period ended 6/30/17 | | One Year | | | Five Years | | | Ten Years | | | Since Inception | | | Inception Date |
| | Class A | | | 7.14 | % | | | 10.57 | % | | | 4.98 | % | | | 8.37 | % | | 8/15/97 |
| | Class C | | | 11.54 | | | | 11.00 | | | | 4.79 | | | | 7.88 | | | 8/15/97 |
| | Institutional | | | 13.84 | | | | 12.28 | | | | 6.00 | | | | 10.87 | | | 8/1/95 |
| | Service | | | 13.26 | | | | 11.72 | | | | 5.48 | | | | 8.70 | | | 7/18/97 |
| | Investor | | | 13.66 | | | | 12.11 | | | | N/A | | | | 6.91 | | | 11/30/07 |
| | Class R | | | 13.11 | | | | 11.56 | | | | N/A | | | | 12.59 | | | 1/6/09 |
| | | Class R6 | | | 13.85 | | | | N/A | | | | N/A | | | | 4.19 | | | 7/31/15 |
| | 3 | | The Standardized Total Returns are average annual total returns or total returns (only if the performance period is one year or less) as of the most recent calendar quarter-end. They assume reinvestment of all distributions at NAV. These returns reflect a maximum initial sales charge of 5.50% for Class A Shares and the assumed contingent deferred sales charge for Class C Shares (1.00% if redeemed within 12 months of purchase). Because Institutional, Service, Investor, Class R and Class R6 Shares do not involve a sales charge, such a charge is not applied to their Standardized Total Returns. |
The returns set forth in the tables above represent past performance. Past performance does not guarantee future results. The Fund’s investment return and principal value will fluctuate so that an investor’s shares, when redeemed, may be worth more or less than their original cost. Current performance may be lower or higher than the performance quoted above. Please visit our web site at www.GSAMFUNDS.com to obtain the most recent month-end returns. Performance reflects applicable fee waivers and/or expense limitations in effect during the periods shown. In their absence, performance would be reduced. Returns do not reflect the deduction of taxes that a shareholder would pay on Fund distributions or the redemption of Fund shares.
30
FUND BASICS
| | | | | | | | | | |
| | EXPENSE RATIOS4 | |
| | | | | Net Expense Ratio (Current) | | | Gross Expense Ratio (Before Waivers) | |
| | Class A | | | 1.16 | % | | | 1.16 | % |
| | Class C | | | 1.91 | | | | 1.91 | |
| | Institutional | | | 0.76 | | | | 0.76 | |
| | Service | | | 1.26 | | | | 1.26 | |
| | Investor | | | 0.91 | | | | 0.91 | |
| | Class R | | | 1.41 | | | | 1.41 | |
| | | Class R6 | | | 0.74 | | | | 0.74 | |
| | 4 | | The expense ratios of the Fund, both current (net of applicable fee waivers and/or expense limitations) and before waivers (gross of applicable fee waivers and/or expense limitations), are as set forth above according to the most recent publicly available Prospectus for the Fund and may differ from the expense ratios disclosed in the Financial Highlights of this report. The expense ratios of the Fund do not have a fee waiver and expense limitation. The Net and Gross expense ratios will be the same. |
| | | | | | | | |
| | TOP TEN HOLDINGS AS OF 8/31/175 |
| | | Holding | | % of Net Assets | | | Line of Business |
| | PG&E Corp. | | | 2.2 | % | | Electric Utilities |
| | SunTrust Banks, Inc. | | | 2.1 | | | Banks |
| | Citizens Financial Group, Inc. | | | 2.0 | | | Banks |
| | Molson Coors Brewing Co. Class B | | | 2.0 | | | Beverages |
| | Marvell Technology Group Ltd. | | | 1.9 | | | Semiconductors & Semiconductor
Equipment |
| | Stanley Black & Decker, Inc. | | | 1.9 | | | Machinery |
| | Pinnacle West Capital Corp. | | | 1.8 | | | Electric Utilities |
| | Newell Brands, Inc. | | | 1.8 | | | Household Durables |
| | EQT Corp. | | | 1.8 | | | Oil, Gas & Consumable Fuels |
| | | Huntington Bancshares, Inc. | | | 1.7 | | | Banks |
| | 5 | | The top 10 holdings may not be representative of the Fund’s future investments. |
31
FUND BASICS
|
| FUND VS. BENCHMARK SECTOR ALLOCATIONS6 |
| As of August 31, 2017 |
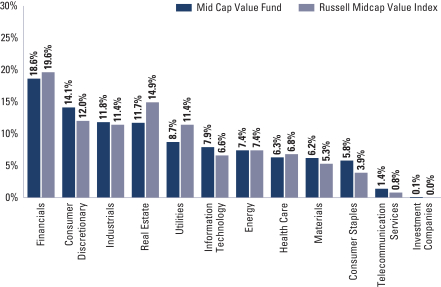
| | 6 | | The Fund is actively managed and, as such, its composition may differ over time. Consequently, the Fund’s overall sector allocations may differ from the percentages contained in the graph above. The graph categorizes investments using the Global Industry Classification Standard (“GICS”), however, the sector classifications used by the portfolio management team may differ from GICS. The percentage shown for each investment category reflects the value of investments in that category as a percentage of market value (excluding investments in the securities lending reinvestment vehicle, if any). Investments in the securities lending reinvestment vehicle represented 1.9% of the Fund’s net assets as of August 31, 2017. The graph depicts the Fund’s investments but may not represent the Fund’s market exposure due to the exclusion of certain derivatives, if any, as listed in the Additional Investment Information section of the Schedule of Investments.stments. |
32
GOLDMAN SACHS MID CAP VALUE FUND
Performance Summary
August 31, 2017
The following graph shows the value, as of August 31, 2017, of a $1,000,000 investment made on September 1, 2007 in Institutional Shares at NAV. For comparative purposes, the performance of the Fund’s benchmark, the Russell Midcap® Value Index (with dividends reinvested), is shown. This performance data represents past performance and should not be considered indicative of future performance, which will fluctuate with changes in market conditions. These performance fluctuations may cause an investor’s shares, when redeemed, to be worth more or less than their original cost. Performance reflects applicable fee waivers and/or expense limitations in effect during the periods shown and in their absence, performance would be reduced. Returns do not reflect the deduction of taxes that a shareholder would pay on Fund distributions or the redemption of Fund shares. Performance of Class A, Class C, Service, Investor, Class R and Class R6 Shares will vary from Institutional Shares due to differences in class specific fees and any applicable sales charges. In addition to the Investment Adviser’s decisions regarding issuer/industry investment selection and allocation, other factors may affect Fund performance. These factors include, but are not limited to, Fund operating fees and expenses, portfolio turnover and subscription and redemption cash flows affecting the Fund.
|
| Mid Cap Value Fund’s 10 Year Performance |
Performance of a $1,000,000 Investment, including any applicable sales charges, with distributions reinvested, from September 1, 2007 through August 31, 2017.
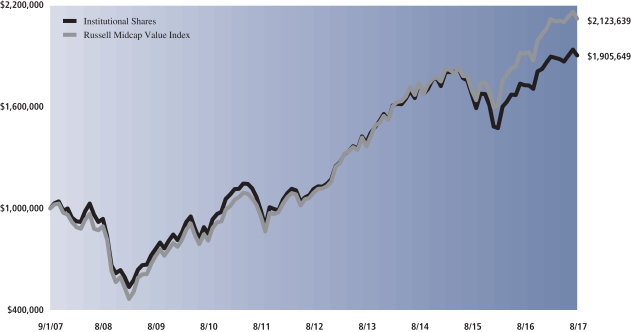
| | | | | | | | | | | | | | |
| Average Annual Total Return through August 31, 2017 | | | One Year | | | | Five Years | | | | Ten Years | | | Since Inception |
Class A (Commenced August 15, 1997) | | | | | | | | | | | | | | |
Excluding sales charges | | | 9.66% | | | | 10.88% | | | | 6.23% | | | 8.60% |
Including sales charges | | | 3.63% | | | | 9.64% | | | | 5.63% | | | 8.30% |
|
Class C (Commenced August 15, 1997) | | | | | | | | | | | | | | |
Excluding contingent deferred sales charges | | | 8.86% | | | | 10.05% | | | | 5.43% | | | 7.81% |
Including contingent deferred sales charges | | | 7.86% | | | | 10.05% | | | | 5.43% | | | 7.81% |
|
Institutional Class (Commenced August 1, 1995) | | | 10.12% | | | | 11.33% | | | | 6.66% | | | 10.79% |
|
Service Class (Commenced July 18, 1997) | | | 9.56% | | | | 10.78% | | | | 6.12% | | | 8.62% |
|
Investor (Commenced November 30, 2007) | | | 9.94% | | | | 11.16% | | | | N/A | | | 6.79% |
|
Class R (Commenced January 6, 2009) | | | 9.40% | | | | 10.60% | | | | N/A | | | 12.33% |
|
Class R6 (Commenced July 31, 2015) | | | 10.13% | | | | N/A | | | | N/A | | | 3.91% |
|
33
PORTFOLIO RESULTS
Goldman Sachs Small Cap Value Fund
Portfolio Composition
The Fund invests, under normal circumstances, at least 80% of its net assets plus any borrowings for investment purposes (measured at the time of purchase) in a diversified portfolio of equity investments in small-cap issuers with public stock market capitalizations within the range of the market capitalization of companies constituting the Russell 2000® Value Index at the time of investment. Under normal circumstances, the Fund’s investment horizon for ownership of stocks will be two to three years. The Fund seeks its investment objective of long-term capital appreciation by investing in value opportunities that the Investment Adviser defines as companies with identifiable competitive advantages whose intrinsic value is not reflected in the stock price. Although the Fund will invest primarily in publicly traded U.S. securities, it may invest up to 25% of its total net assets in foreign securities, including securities of issuers in emerging countries and securities quoted in foreign currencies. The Fund may also invest in the aggregate up to 20% of its net assets in companies with public stock market capitalizations outside the range of companies constituting the Russell 2000® Value Index at the time of investment and in fixed income securities, such as government, corporate and bank debt obligations.
Portfolio Management Discussion and Analysis
Below, the Goldman Sachs Value Equity Investment Team discusses the Goldman Sachs Small Cap Value Fund’s (the “Fund”) performance and positioning for the 12-month period ended August 31, 2017 (the “Reporting Period”).
| Q | | How did the Fund perform during the Reporting Period? |
| A | | During the Reporting Period, the Fund’s Class A, C, Institutional, Service, Investor, R and R6 Shares generated average annual total returns, without sales charges, of 11.56%, 10.72%, 12.00%, 11.44%, 11.84%, 11.28% and 12.03%, respectively. These returns compare to the 13.47% average annual total return of the Fund’s benchmark, the Russell 2000® Value Index (with dividends reinvested) (the “Russell Index”), during the same period. |
| Q | | What key factors were responsible for the Fund’s performance during the Reporting Period? |
| A | | The Fund generated solid double-digit absolute gains, but stock selection overall detracted from the Fund’s performance relative to the Russell Index during the Reporting Period. Sector allocation as a whole contributed positively, albeit modestly, to the Fund’s results. |
| Q | | Which equity market sectors most significantly affected Fund performance? |
| A | | Detracting from the Fund’s relative results most was weak stock selection in the energy, materials and health care sectors. Having a position in cash during a Reporting Period when the Russell Index rallied also hurt performance. Effective stock selection in the consumer discretionary and utilities sectors helped the Fund’s performance most relative to the Russell Index. Having no exposure to telecommunication services, which was the second-weakest sector in the Russell Index during the Reporting Period, also buoyed the Fund’s relative results. |
| Q | | Which stocks detracted significantly from the Fund’s performance during the Reporting Period? |
| A | | Detracting most from the Fund’s results relative to the Russell Index were positions in food manufacturer TreeHouse Foods, shopping center and retail real estate investment trust (“REIT”) Acadia Realty Trust and digital printing company Electronics for Imaging. |
| | Shares of TreeHouse Foods, a supplier of private label food and beverage products, declined after the company reported mixed second quarter 2016 earnings and announced the retirement of its Chief Financial Officer. At the end of 2016, we exited the Fund’s position. We had originally initiated a position in its stock due to our view that the company would make operational improvements and that its acquisition of ConAgra’s private brands business could generate substantial synergies. However, the ConAgra deal has proven to be more difficult than we anticipated from an integration perspective. Additionally, in the event food inflation increases, it could be more difficult for TreeHouse Foods to pass along cost increases to consumers relative to branded food peers. |
34
PORTFOLIO RESULTS
| | Acadia Realty Trust, a REIT that specializes in management and leasing of shopping center and retail properties, faced headline risk and poor sentiment toward brick and mortar retail as did the broader retail REIT market. What we view as the extreme discount to which the REIT declined overlooks, in our opinion, the quality of its properties, including prime locations and favorable demographics, and does not account for the shift of demand from traditional retailers to low cost, fitness and native online retailers. Despite market headwinds, at the end of the Reporting Period, Acadia Realty Trust remained a high conviction name that holds what we consider to be valuable properties. |
| | In October 2016 and April 2017, Electronics for Imaging reported mixed quarterly results that caused its stock price to decline. However, the majority of its weak performance occurred at the beginning of August 2017 when the company indefinitely postponed the release of its June 2017 quarterly results, as there was an issue stemming from the timing of revenue recognition. While the company announced there was no material aggregate misstatement, the uncertainty surrounding the situation caused its stock price to plummet. We believe the sell-off was largely an overreaction, but we opted to sell the Fund’s position in the company given the persistent uncertainty as to when the company may release a report on internal controls. |
| Q | | What were some of the Fund’s best-performing individual stocks? |
| A | | The Fund benefited most relative to the Russell Index from positions in global transportation company XPO Logistics, electronic design company Mentor Graphics and property and casualty insurance and reinsurance company Endurance Specialty Holdings. |
| | XPO Logistics differentiated itself from its peers by delivering strong organic growth and margin improvement during the first quarter of 2017. At the end of the Reporting Period, we believed XPO Logistics had further cost reduction opportunities to undertake that could lead to further margin expansion. Additionally, we viewed the company as well positioned to demonstrate consistent organic growth as a result of its exposure to secular growth in e-commerce and outsourced logistics. Finally, the stock was trading at the end of the Reporting Period at what we considered to be an attractive valuation relative to its margin expansion and organic growth potential. |
| | Mentor Graphics is a software provider of automated electronic design and analysis. We had originally initiated the Fund position in Mentor Graphics when the stock was trading at what we viewed as a discount following a challenging period for the company due to increased competition. Shares of Mentor Graphics rose sharply after its announcement that Siemens agreed to acquire the company for $4.5 billion in cash or $37.25 per share, a significant premium over the previous closing price. After the acquisition announcement, we sold the Fund’s position in Mentor Graphics. |
| | Endurance Specialty Holdings saw its stock price rise sharply in the fourth quarter of 2016 after the company reached an agreement to sell itself to a Japanese insurer at a 43% premium relative to its previous closing price. We had originally initiated a position in Endurance Specialty Holdings based on our positive view of its management team’s turnaround strategy. In particular, we were constructive on its efforts to enhance the company’s earnings profile by shifting its mix toward the insurance segment. Additionally, we held a positive view on the company’s then-recently appointed Chief Executive Officer and the tenured team of insurance underwriters that he recruited to the company. Following the announcement of the acquisition, we exited the Fund’s position in Endurance Specialty Holdings and used the proceeds to add to investments with what we viewed as more attractive risk-adjusted upside potential. |
| Q | | How did the Fund use derivatives and similar instruments during the Reporting Period? |
| A | | During the Reporting Period, we did not use derivatives as part of an active management strategy. |
| Q | | Did the Fund make any significant purchases or sales during the Reporting Period? |
| A | | We initiated a Fund position in Hilton Grand Vacations, a real estate company involved in vacation lodges, condominiums and resorts. We believe the fundamental backdrop in the timeshare industry is compelling following a period of consolidation. We are attracted to Hilton Grand Vacations in particular because it is one of the few timeshare companies that has been able to generate net owner growth. As a result, we believe there are significant opportunities to realize profits from secondary timeshare sales. Finally, we believe the company is less constrained from a capital allocation perspective following its spin-off from the Hilton parent company. |
| | We established a Fund position in MGIC Investment, a company that provides private mortgage insurance in the U.S. |
35
PORTFOLIO RESULTS
| | We expect the company, which we see as well managed, to benefit from a broadening of the housing market. In our view, the company has a strong balance sheet, based on both its reserves and capital levels. |
| | Conversely, in addition to those sales already mentioned, we exited the Fund’s position in Intersil, a semiconductor manufacturer, as a result of an acquisition. At the time of the Fund’s purchase, we had believed Intersil was under-earning relative to its peers, which led to what we considered to be an attractive valuation. We were also constructive on the company’s plan to reallocate research and development spending to its higher margin businesses. Intersil was a long-term holding of the Fund, and we were encouraged by improving operating margins and successful new product launches as a result of its increased research and development investment. Its shares spiked after Renesas Electronic, a Japanese automotive chip manufacturer, announced the acquisition of Intersil at a significant premium, and so we sold the Fund’s shares in the company. |
| | We sold the Fund’s position in PrivateBancorp, a bank that provides middle market commercial banking, investment management services, and small and private banking solutions. We exited the Fund’s position in early June 2017 when it was a target of an acquisition by Canadian Imperial Bank of Commerce. |
| Q | | Were there any notable changes in the Fund’s weightings during the Reporting Period? |
| A | | In constructing the Fund’s portfolio, we focus on picking stocks rather than on making industry or sector bets. We seek to outpace the benchmark index by overweighting stocks that we expect to outperform and underweighting those that we think may lag. Consequently, changes in its sector weights are generally the direct result of individual stock selection or of stock appreciation or depreciation. That said, during the Reporting Period, the Fund’s allocations compared to the Russell Index in consumer discretionary and industrials increased and its allocations compared to the Russell Index in health care, information technology and real estate decreased. |
| Q | | How was the Fund positioned relative to its benchmark index at the end of August 2017? |
| A | | At the end of August 2017, the Fund was overweighted in industrials and materials and underweighted in real estate, utilities and health care relative to the Russell Index. The Fund was rather neutrally weighted in financials, consumer discretionary, information technology, energy and consumer staples relative to the Russell Index at the end of August 2017. The Fund had no allocation to telecommunication services at the end of the Reporting Period. |
36
FUND BASICS
Small Cap Value Fund
as of August 31, 2017
| | | | | | | | | | |
| | PERFORMANCE REVIEW | |
| | | September 1, 2016–August 31, 2017 | | Fund Total Return
(based on NAV)1 | | | Russell 2000
Value Index2 | |
| | Class A | | | 11.56 | % | | | 13.47 | % |
| | Class C | | | 10.72 | | | | 13.47 | |
| | Institutional | | | 12.00 | | | | 13.47 | |
| | Service | | | 11.44 | | | | 13.47 | |
| | Investor | | | 11.84 | | | | 13.47 | |
| | Class R | | | 11.28 | | | | 13.47 | |
| | | Class R6 | | | 12.03 | | | | 13.47 | |
| | 1 | | The net asset value (“NAV”) represents the net assets of the class of the Fund (ex-dividend) divided by the total number of shares of the class outstanding. The Fund’s performance reflects the reinvestment of dividends and other distributions. The Fund’s performance does not reflect the deduction of any applicable sales charges. |
| | 2 | | The Russell 2000 Value Index is an unmanaged index of common stock prices that measures the performance of those Russell 2000 companies with lower price-to-book ratios and lower forecasted growth values. The Index figures do not reflect any deduction for fees, expenses or taxes. It is not possible to invest directly in an unmanaged index. |
| | | | | | | | | | | | | | | | | | | | |
| | STANDARDIZED TOTAL RETURNS3 |
| | | For the period ended 6/30/17 | | One Year | | | Five Years | | | Ten Years | | | Since Inception | | | Inception Date |
| | Class A | | | 13.77 | % | | | 12.60 | % | | | 7.30 | % | | | 10.46 | % | | 10/22/92 |
| | Class C | | | 18.44 | | | | 13.03 | | | | 7.11 | | | | 8.61 | | | 8/15/97 |
| | Institutional | | | 20.85 | | | | 14.33 | | | | 8.35 | | | | 9.88 | | | 8/15/97 |
| | Service | | | 20.25 | | | | 13.77 | | | | 7.81 | | | | 9.33 | | | 8/15/97 |
| | Investor | | | 20.68 | | | | 14.16 | | | | N/A | | | | 9.66 | | | 11/30/07 |
| | Class R | | | 20.10 | | | | 13.60 | | | | N/A | | | | 9.12 | | | 11/30/07 |
| | | Class R6 | | | 20.88 | | | | N/A | | | | N/A | | | | 9.55 | | | 7/31/15 |
| | 3 | | The Standardized Total Returns are average annual total returns or cumulative total returns (only if the performance period is one year or less) as of the most recent calendar quarter-end. They assume reinvestment of all distributions at NAV. These returns reflect a maximum initial sales charge of 5.50% for Class A Shares and the assumed contingent deferred sales charge for Class C Shares (1.00% if redeemed within 12 months of purchase). Because Institutional, Service, Investor, Class R and Class R6 Shares do not involve a sales charge, such a charge is not applied to their Standardized Total Returns. |
The returns set forth in the tables above represent past performance. Past performance does not guarantee future results. The Fund’s investment return and principal value will fluctuate so that an investor’s shares, when redeemed, may be worth more or less than their original cost. Current performance may be lower or higher than the performance quoted above. Please visit our web site at www.GSAMFUNDS.com to obtain the most recent month-end returns. Performance reflects applicable fee waivers and/or expense limitations in effect during the periods shown. In their absence, performance would be reduced. Returns do not reflect the deduction of taxes that a shareholder would pay on Fund distributions or the redemption of Fund shares.
37
FUND BASICS
| | | | | | | | | | |
| | EXPENSE RATIOS4 | |
| | | | | Net Expense Ratio (Current) | | | Gross Expense Ratio (Before Waivers) | |
| | Class A | | | 1.37 | % | | | 1.41 | % |
| | Class C | | | 2.12 | | | | 2.16 | |
| | Institutional | | | 0.97 | | | | 1.01 | |
| | Service | | | 1.47 | | | | 1.51 | |
| | Investor | | | 1.12 | | | | 1.16 | |
| | Class R | | | 1.62 | | | | 1.66 | |
| | | Class R6 | | | 0.95 | | | | 1.00 | |
| | 4 | | The expense ratios of the Fund, both current (net of any fee waivers or expense limitations) and before waivers (gross of any fee waivers or expense limitations) are as set forth above according to the most recent publicly available Prospectus for the Fund and may differ from the expense ratios disclosed in the Financial Highlights in this report. Pursuant to a contractual arrangement, the Fund’s waivers and/or expense limitations will remain in place through at least April 28, 2018, and prior to such date the investment adviser may not terminate the arrangements without the approval of the Fund’s Board of Trustees. If these arrangements are discontinued in the future, the expense ratios may change without shareholder approval. |
| | | | | | | | |
| | TOP TEN HOLDINGS AS OF 8/31/175 |
| | | Holding | | % of Net Assets | | | Line of Business |
| | Black Hills Corp. | | | 1.4 | % | | Multi-Utilities |
| | Pebblebrook Hotel Trust | | | 1.3 | | | Equity Real Estate Investment |
| | | | | | | | Trusts (REITs) |
| | Portland General Electric Co. | | | 1.1 | | | Electric Utilities |
| | Pinnacle Financial Partners, Inc. | | | 1.0 | | | Banks |
| | Acadia Realty Trust | | | 1.0 | | | Equity Real Estate Investment |
| | | | | | | | Trusts (REITs) |
| | CyrusOne, Inc. | | | 1.0 | | | Equity Real Estate Investment |
| | | | | | | | Trusts (REITs) |
| | Chesapeake Lodging Trust | | | 1.0 | | | Equity Real Estate Investment |
| | | | | | | | Trusts (REITs) |
| | Webster Financial Corp. | | | 0.9 | | | Banks |
| | XPO Logistics, Inc. | | | 0.9 | | | Air Freight & Logistics |
| | | Hilton Grand Vacations, Inc. | | | 0.9 | | | Hotels, Restaurants & Leisure |
| | 5 | | The top 10 holdings may not be representative of the Fund’s future investments. |
38
FUND BASICS
| | |
| | FUND VS. BENCHMARK SECTOR ALLOCATIONS6 |
| | | As of August 31, 2017 |
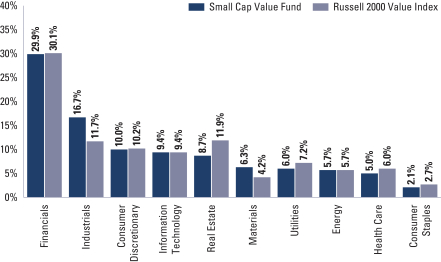
| | 6 | | The Fund is actively managed and, as such, its composition may differ over time. Consequently, the Fund’s overall sector allocations may differ from the percentages contained in the graph above. The graph categorizes investments using the Global Industry Classification Standard (“GICS”), however, the sector classifications used by the portfolio management team may differ from GICS. Underlying sector allocations of Exchange Traded Funds held by the Fund are not reflected in the graph above. The percentage shown for each investment category reflects the value of investments in that category as a percentage of market value (excluding investments in the securities lending reinvestment vehicle, if any). Investments in the securities lending reinvestment vehicle represented 1.5% of the Fund’s net assets as of August 31, 2017. The graph depicts the Fund’s investments but may not represent the Fund’s market exposure due to the exclusion of certain derivatives, if any, as listed in the Additional Investment Information section of the Schedule of Investments. |
39
GOLDMAN SACHS SMALL CAP VALUE FUND
Performance Summary
August 31, 2017
The following graph shows the value, as of August 31, 2017, of a $1,000,000 investment made on September 1, 2007 in Institutional Shares at NAV. For comparative purposes, the performance of the Fund’s benchmark, the Russell 2000® Value Index (with dividends reinvested), is shown. This performance data represents past performance and should not be considered indicative of future performance, which will fluctuate with changes in market conditions. These performance fluctuations may cause an investor’s shares, when redeemed, to be worth more or less than their original cost. Performance reflects applicable fee waivers and/or expense limitations in effect during the periods shown and in their absence, performance would be reduced. Returns do not reflect the deduction of taxes that a shareholder would pay on Fund distributions or the redemption of Fund shares. Performance of Class A, Class C, Service, Investor, Class R and Class R6 Shares will vary from Institutional Shares due to differences in class specific fees and any applicable sales charges. In addition to the Investment Adviser’s decisions regarding issuer/industry investment selection and allocation, other factors may affect Fund performance. These factors include, but are not limited to, Fund operating fees and expenses, portfolio turnover and subscription and redemption cash flows affecting the Fund.
|
| Small Cap Value Fund’s 10 Year Performance |
Performance of a $1,000,000 Investment, including any applicable sales charges, with distributions reinvested, from September 1, 2007 through August 31, 2017.
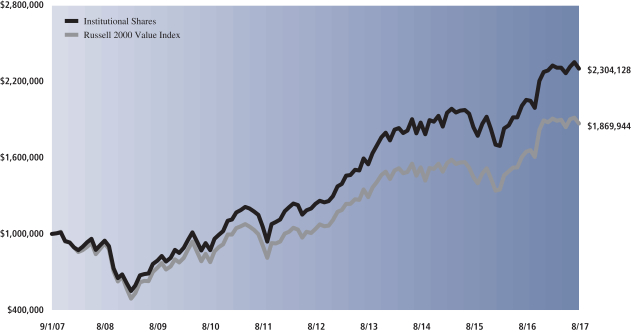
| | | | | | | | | | | | | | |
| Average Annual Total Return through August 31, 2017 | | | One Year | | | | Five Years | | | | Ten Years | | | Since Inception |
Class A (Commenced October 22, 1992) | | | | | | | | | | | | | | |
Excluding sales charges | | | 11.56% | | | | 12.81% | | | | 8.26% | | | 10.60% |
Including sales charges | | | 5.41% | | | | 11.54% | | | | 7.65% | | | 10.35% |
|
Class C (Commenced August 15, 1997) | | | | | | | | | | | | | | |
Excluding contingent deferred sales charges | | | 10.72% | | | | 11.97% | | | | 7.46% | | | 8.49% |
Including contingent deferred sales charges | | | 9.68% | | | | 11.97% | | | | 7.46% | | | 8.49% |
|
Institutional Class (Commenced August 15, 1997) | | | 12.00% | | | | 13.26% | | | | 8.70% | | | 9.76% |
|
Service Class (Commenced August 15, 1997) | | | 11.44% | | | | 12.69% | | | | 8.16% | | | 9.21% |
|
Investor (Commenced November 30, 2007) | | | 11.84% | | | | 13.09% | | | | N/A | | | 9.41% |
|
Class R (Commenced November 30, 2007) | | | 11.28% | | | | 12.53% | | | | N/A | | | 8.87% |
|
Class R6 (Commenced July 31, 2015) | | | 12.03% | | | | N/A | | | | N/A | | | 8.40% |
|
40
PORTFOLIO RESULTS
Goldman Sachs Small/Mid Cap Value Fund
Portfolio Composition
The Fund’s investment objective is to seek long-term capital appreciation. The Fund invests, under normal circumstances, at least 80% of its net assets plus any borrowings for investment purposes (measured at time of purchase) in a diversified portfolio of equity investments in small- and mid-cap issuers with public stock market capitalizations within the range of the market capitalization of companies constituting the Russell 2000® Value Index and the Russell Midcap Value Index, respectively, at the time of investment. As of September 30, 2016, the capitalization range of the companies in these indexes was between $36.4 million and $43.5 billion. Under normal circumstances, the Fund’s investment horizon for ownership of stocks will be two to three years. Although the Fund will invest primarily in publicly traded U.S. securities, it may also invest in foreign securities, including securities of issuers in emerging countries and securities quoted in foreign currencies. The Fund may invest in companies with public stock market capitalizations outside the range of companies constituting the Russell 2000® Value Index and the Russell Midcap Value Index at the time of investment and in fixed income securities, such as government, corporate and bank debt obligations.
Portfolio Management Discussion and Analysis
Below, the Goldman Sachs Value Equity Investment Team discusses the Goldman Sachs Small/Mid Cap Value Fund’s (the “Fund”) performance and positioning for the 12-month period ended August 31, 2017 (the “Reporting Period”).
| Q | | How did the Fund perform during the Reporting Period? |
| A | | During the Reporting Period, the Fund’s Class A, C, Institutional, Investor, R and R6 Shares generated average annual total returns, without sales charges, of 11.30%, 10.48%, 11.71%, 11.52%, 11.06% and 11.80%, respectively. These returns compare to the 11.12% average annual total return of the Fund’s benchmark, the Russell 2500® Value Index (with dividends reinvested) (the “Russell Index”), during the same period. |
| Q | | What key factors were responsible for the Fund’s performance during the Reporting Period? |
| A | | Most share classes of the Fund outperformed the Russell Index during the Reporting Period due primarily to effective stock selection overall. Sector allocation as a whole also contributed positively, albeit more modestly. |
| Q | | Which equity market sectors most significantly affected Fund performance? |
| A | | Effective stock selection in the information technology and consumer discretionary sectors helped the Fund’s performance most relative to the Russell Index. Having no exposure to telecommunication services, which was the weakest sector in the Russell Index during the Reporting Period, also buoyed the Fund’s relative results. The sectors that detracted most from the Fund’s relative results during the Reporting Period were energy, real estate and materials, wherein stock selection proved challenging. Having an allocation to cash during a period when the Russell Index rallied also hurt performance. |
| Q | | What were some of the Fund’s best-performing individual stocks? |
| A | | The Fund benefited most relative to the Russell Index from positions in leading media and Internet company IAC/InterActive (“IAC”), global transportation company XPO Logistics and property and casualty insurance and reinsurance company Endurance Specialty Holdings. |
| | IAC’s outperformance of the Russell Index was primarily driven by the company’s announcement to merge its Home Advisor subsidiary into Angie’s List to create ANGI HomeServices, an online home services company with industry-leading market share. In addition to gaining significant market share in a growing industry, the deal allows IAC to preserve Angie’s Lists’ public company status, essentially resulting in a public listing of HomeAdvisor. IAC’s shares also rose after the company reported strong first quarter 2017 earnings results in all five of its business segments. In our view, the stock was trading at a compelling valuation and was well positioned to benefit from a rapidly growing home services |
41
FUND BASICS
| | segment. At the end of the Reporting Period, we remained positive on the company due to what we viewed as its attractive valuation and capital allocation track record. |
| | XPO Logistics differentiated itself from its peers by delivering strong organic growth and margin improvement during the first quarter of 2017. At the end of the Reporting Period, we believed XPO Logistics had further cost reduction opportunities to undertake that could lead to further margin expansion. Additionally, we viewed the company as well positioned to demonstrate consistent organic growth as a result of its exposure to secular growth in e-commerce and outsourced logistics. Finally, the stock was trading at the end of the Reporting Period at what we considered to be an attractive valuation relative to its margin expansion and organic growth potential. |
| | Endurance Specialty Holdings saw its stock price rise sharply in the fourth quarter of 2016 after the company reached an agreement to sell itself to a Japanese insurer at a 43% premium relative to its previous closing price. We had originally initiated a position in Endurance Specialty Holdings based on our positive view of its management team’s turnaround strategy. In particular, we were constructive on its efforts to enhance the company’s earnings profile by shifting its mix toward the insurance segment. Additionally, we held a positive view on the company’s then-recently appointed Chief Executive Officer and the tenured team of insurance underwriters that he recruited to the company. Following the announcement of the acquisition, we exited the Fund’s position in Endurance Specialty Holdings and used the proceeds to add investments with what we viewed as more attractive risk-adjusted upside potential. |
| Q | | Which stocks detracted significantly from the Fund’s performance during the Reporting Period? |
| A | | Detracting most from the Fund’s results relative to the Russell Index were positions in Brixmor Property Group, Federal Realty Investment Trust and Taubman Centers. |
| | Brixmor Property Group, an owner of grocery-anchored community shopping centers, was the top detractor from the Fund’s relative results during the Reporting Period. We believe its underperformance of the Russell Index was largely due to investor concerns about store closures within the industry, resulting from disappointing retail sales. In our view, these fears are overblown, especially given Brixmor Property Group’s base in high quality grocery-anchored shopping centers. Overall, at the end of the Reporting Period, we remained positive on Brixmor Property Group’s long-term growth potential as well as its portfolio of assets. Fundamentals in the industry remained healthy, in our view, as supply, relative to historical levels, was low, and demand was still strong. Finally, we were encouraged by its management’s focus on high return redevelopment projects and on improving the company’s balance sheet. |
| | Federal Realty Investment Trust is a real estate investment trust (“REIT”) that engages in the ownership, operation and redevelopment of high quality retail-based properties located primarily in major coastal markets. We believe its underperformance of the Russell Index during the Reporting Period can be attributed to market concerns about a rising e-commerce environment and anchor vacancies within the retail space. Its shares also declined after the company reported weak third quarter 2016 earnings. Despite a challenging retail environment, we remained constructive at the end of the Reporting Period on the company’s commitment to align its portfolio with the changing consumer. Additionally, we remained attracted to what we see as the company’s strong management team, as it continues to divest unprofitable assets and allocate capital to opportunities with greater upside potential. |
| | Taubman Centers is a REIT engaged in the development and management of regional shopping centers. The broader retail REIT market segment, especially those with exposure to shopping malls, faced challenges of elevated tenant bankruptcies, store closure and rising leasing capital expenditures. Taubman Centers has also faced these challenges and revised down its occupancy and lease space during the second quarter of 2017. Given these headwinds, we opted to reduce the Fund’s exposure to the retail REIT market segment and sold the Fund’s position in Taubman Centers by the end of the Reporting Period. |
| Q | | How did the Fund use derivatives and similar instruments during the Reporting Period? |
| A | | During the Reporting Period, we did not use derivatives as part of an active management strategy. |
| Q | | Did the Fund make any significant purchases or sales during the Reporting Period? |
| A | | We initiated a Fund position in United Rentals, the largest equipment rental company in the U.S. We had bought United Rentals soon after the U.S. presidential elections on the back of expectations of an industrial economic recovery following eight quarters of negative industrial growth in the U.S. We |
42
FUND BASICS
| | believe the company’s broad-based exposure to the construction end-markets could benefit from any infrastructure plans that may be enacted. Utilization and pricing had been weak for the company in 2016, and we anticipate these trends to reach an inflection point in the coming quarter, which could drive earnings and margin expansion. In addition, we believe the company’s unlevered balance sheet makes it attractive for possible merger and acquisition opportunities. |
| | We established a Fund position in Hilton Grand Vacations, a real estate company involved in vacation lodges, condominiums and resorts. We believe the fundamental backdrop in the timeshare industry is compelling following a period of consolidation. We are attracted to Hilton Grand Vacations in particular because it is one of the few timeshare companies that has been able to generate net owner growth. As a result, we believe there are significant opportunities to realize profits from secondary timeshare sales. Finally, we believe the company is less constrained from a capital allocation perspective following its spin-off from the Hilton parent company. |
| | Conversely, in addition to those sales already mentioned, we exited the Fund’s position in Post Properties, a REIT that develops and operates multifamily apartment communities in the U.S. Its stock was a top contributor to the Fund’s relative results during the third quarter of 2016 after it was announced that Mid-America Apartment Communities was acquiring Post Properties in an all-stock deal valued at $17 billion. We are positive on this transaction given the opportunity for substantial operating synergies. Additionally, we believe the scale of the combined company may allow for stronger pricing power and more stable rent growth. We exited the Fund’s position in Post Properties when the deal closed in December 2016, though the Fund maintained high conviction in the combined company through its position in Mid-America Apartment Communities, an owner and operator of apartments across the Sunbelt region. |
| | We sold the Fund’s position in Care Capital Properties, an owner of triple-net leased properties focused on post-acute care and skilled nursing facilities. (A triple net lease is a lease agreement that designates the lessee, which is the tenant, as being solely responsible for all the costs relating to the asset being leased, in addition to the rent fee applied under the lease. The structure of this type of lease requires the lessee to pay the net amount for three types of costs, including net real estate taxes on the leased asset, net building insurance and net common area maintenance.) Earlier in the Reporting Period, Sabra Health Care announced it had reached an agreement with Care Capital Properties to merge in an all-stock deal. In July 2017, shares of Care Capital Properties declined following news that multiple investors in Sabra Health Care would not be voting to support the merger with Care Capital Properties due to concerns about changes in the health care system that could reduce demand for the properties in Care Capital Properties’ portfolio. Further, Institutional Shareholder Services, a prominent shareholder advisory firm, recommended that shareholders vote against the deal, adding fuel to arguments leveled by dissident shareholders. We exited the Fund’s position in Care Capital Properties prior to the merger closing, as we were a bit concerned that the deal may not go through and that Care Capital Properties’ shares might decline further as a result. |
| Q | | Were there any notable changes in the Fund’s weightings during the Reporting Period? |
| A | | In constructing the Fund’s portfolio, we focus on picking stocks rather than on making industry or sector bets. We seek to outpace the benchmark index by overweighting stocks that we expect to outperform and underweighting those that we think may lag. Consequently, changes in its sector weights are generally the direct result of individual stock selection or of stock appreciation or depreciation. That said, during the Reporting Period, the Fund’s allocations compared to the Russell Index in industrials and materials increased and its allocations compared to the Russell Index in consumer discretionary, consumer staples and health care decreased. The Fund’s position in cash also decreased during the Reporting Period. |
| Q | | How was the Fund positioned relative to its benchmark index at the end of August 2017? |
| A | | At the end of August 2017, the Fund was overweighted in the industrials, materials and information technology sectors relative to the Russell Index. On the same date, the Fund had underweighted positions compared to the Russell Index in real estate, consumer staples and consumer discretionary and was rather neutrally weighted to the Russell Index in the remaining sectors of the Russell Index, with the exception of telecommunication services, in which the Fund held no position at the end of the Reporting Period. |
43
FUND BASICS
Small/Mid Cap Value Fund
as of August 31, 2017
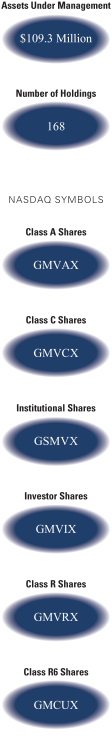
| | | | | | | | | | |
| | PERFORMANCE REVIEW | |
| | | September 1, 2016–August 31, 2017 | | Fund Total Return
(based on NAV)1 | | | Russell 2500
Value Index2 | |
| | Class A | | | 11.30 | % | | | 11.12 | % |
| | Class C | | | 10.48 | | | | 11.12 | |
| | Institutional | | | 11.71 | | | | 11.12 | |
| | Investor | | | 11.52 | | | | 11.12 | |
| | Class R | | | 11.06 | | | | 11.12 | |
| | | Class R6 | | | 11.80 | | | | 11.12 | |
| | 1 | | The net asset value (“NAV”) represents the net assets of the class of the Fund (ex-dividend) divided by the total number of shares of the class outstanding. The Fund’s performance reflects the reinvestment of dividends and other distributions. The Fund’s performance does not reflect the deduction of any applicable sales charges. |
| | 2 | | The Russell 2500 Value Index is composed of the smallest 2,500 of the 3,000 largest U.S. companies based on total market capitalization with lower price-to-book ratios and lower forecast growth values. It is calculated by Frank Russell Company, and reflects reinvestment of all dividends and capital gains. The Index figures do not reflect any deduction for fees, expenses or taxes. It is not possible to invest directly in an unmanaged index. |
| | | | | | | | | | | | |
| | STANDARDIZED TOTAL RETURNS3 |
| | | For the period ended 6/30/17 | | One Year | | | Since Inception | | | Inception Date |
| | Class A | | | 10.51 | % | | | 5.58 | % | | 1/31/14 |
| | Class C | | | 15.15 | | | | 6.59 | | | 1/31/14 |
| | Institutional | | | 17.44 | | | | 7.82 | | | 1/31/14 |
| | Investor | | | 17.26 | | | | 7.62 | | | 1/31/14 |
| | Class R | | | 16.71 | | | | 7.09 | | | 1/31/14 |
| | | Class R6 | | | 17.54 | | | | 7.08 | | | 7/31/15 |
| | 3 | | The Standardized Total Returns are average annual total returns or cumulative total returns (only if the performance period is one year or less) as of the most recent calendar quarter-end. They assume reinvestment of all distributions at NAV. These returns reflect a maximum initial sales charge of 5.50% for Class A Shares and the assumed contingent deferred sales charge for Class C Shares (1.00% if redeemed within 12 months of purchase). Because Institutional, Investor, Class R and Class R6 Shares do not involve a sales charge, such a charge is not applied to their Standardized Total Returns. |
The returns set forth in the tables above represent past performance. Past performance does not guarantee future results. The Fund’s investment return and principal value will fluctuate so that an investor’s shares, when redeemed, may be worth more or less than their original cost. Current performance may be lower or higher than the performance quoted above. Please visit our web site at www.GSAMFUNDS.com to obtain the most recent month-end returns. Performance reflects applicable fee waivers and/or expense limitations in effect during the periods shown. In their absence, performance would be reduced. Returns do not reflect the deduction of taxes that a shareholder would pay on Fund distributions or the redemption of Fund shares.
44
FUND BASICS
| | | | | | | | | | |
| | EXPENSE RATIOS4 | |
| | | | | Net Expense Ratio (Current) | | | Gross Expense Ratio (Before Waivers) | |
| | Class A | | | 1.26 | % | | | 2.25 | % |
| | Class C | | | 2.01 | | | | 2.99 | |
| | Institutional | | | 0.87 | | | | 1.84 | |
| | Investor | | | 1.01 | | | | 2.03 | |
| | Class R | | | 1.52 | | | | 2.50 | |
| | | Class R6 | | | 0.88 | | | | 1.90 | |
| | 4 | | The expense ratios of the Fund, both current (net of any fee waivers or expense limitations) and before waivers (gross of any fee waivers or expense limitations) are as set forth above according to the most recent publicly available Prospectus for the Fund and may differ from the expense ratios disclosed in the Financial Highlights in this report. Pursuant to a contractual arrangement, the Fund’s waivers and/or expense limitations will remain in place through at least April 28, 2018, and prior to such date the investment adviser may not terminate the arrangements without the approval of the Fund’s Board of Trustees. If these arrangements are discontinued in the future, the expense ratios may change without shareholder approval. |
| | | | | | | | |
| | TOP TEN HOLDINGS AS OF 8/31/175 |
| | | Holding | | % of Net Assets | | | Line of Business |
| | Mid-America Apartment | | | 2.9 | % | | Equity Real Estate Investment |
| | Communities, Inc. | | | | | | Trusts (REITs) |
| | Pinnacle West Capital Corp. | | | 1.4 | | | Electric Utilities |
| | Federal Realty Investment Trust | | | 1.3 | | | Equity Real Estate Investment |
| | | | | | | | Trusts (REITs) |
| | Atmos Energy Corp. | | | 1.3 | | | Gas Utilities |
| | American Financial Group, Inc. | | | 1.3 | | | Insurance |
| | XPO Logistics, Inc. | | | 1.2 | | | Air Freight & Logistics |
| | Steel Dynamics, Inc. | | | 1.2 | | | Metals & Mining |
| | Pebblebrook Hotel Trust | | | 1.2 | | | Equity Real Estate Investment |
| | | | | | | | Trusts (REITs) |
| | East West Bancorp, Inc. | | | 1.2 | | | Banks |
| | | E*TRADE Financial Corp. | | | 1.2 | | | Capital Markets |
| | 5 | | The top 10 holdings may not be representative of the Fund’s future investments. |
45
FUND BASICS
| | |
| | FUND VS. BENCHMARK SECTOR ALLOCATIONS6 |
| | | As of August 31, 2017 |
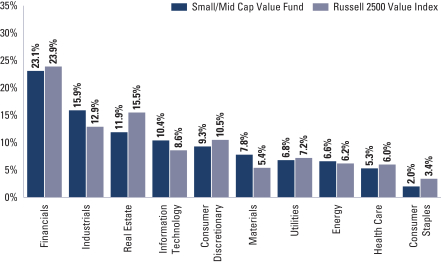
| | 6 | | The Fund is actively managed and, as such, its composition may differ over time. Consequently, the Fund’s overall sector allocations may differ from the percentages contained in the graph above. The graph categorizes investments using the Global Industry Classification Standard (“GICS”), however, the sector classifications used by the portfolio management team may differ from GICS. The percentage shown for each investment category reflects the value of investments in that category as a percentage of market value (excluding investments in the securities lending reinvestment vehicle, if any). Investments in the securities lending reinvestment vehicle represented 0.9% of the Fund’s net assets as of August 31, 2017. The graph depicts the Fund’s investments but may not represent the Fund’s market exposure due to the exclusion of certain derivatives, if any, as listed in the Additional Investment Information section of the Schedule of Investments. |
46
GOLDMAN SACHS SMALL/MID CAP VALUE FUND
Performance Summary
August 31, 2017
The following graph shows the value, as of August 31, 2017, of a $1,000,000 investment made on January 31, 2014 (commencement of operations) in Institutional Shares at NAV. For comparative purposes, the performance of the Fund’s benchmark, the Russell 2500 Value Index (with dividends reinvested), is shown. This performance data represents past performance and should not be considered indicative of future performance, which will fluctuate with changes in market conditions. These performance fluctuations may cause an investor’s shares, when redeemed, to be worth more or less than their original cost. Performance reflects applicable fee waivers and/or expense limitations in effect during the periods shown and in their absence, performance would be reduced. Returns do not reflect the deduction of taxes that a shareholder would pay on Fund distributions or the redemption of Fund shares. Performance of Class A, Class C, Investor, Class R and Class R6 Shares will vary from Institutional Shares due to differences in class specific fees and any applicable sales charges. In addition to the Investment Adviser’s decisions regarding issuer/industry investment selection and allocation, other factors may affect Fund performance. These factors include, but are not limited to, Fund operating fees and expenses, portfolio turnover and subscription and redemption cash flows affecting the Fund.
|
| Small/Mid Cap Value Fund’s Lifetime Performance |
Performance of a $1,000,000 Investment, including any applicable sales charges, with distributions reinvested, from January 31, 2014 through August 31, 2017.
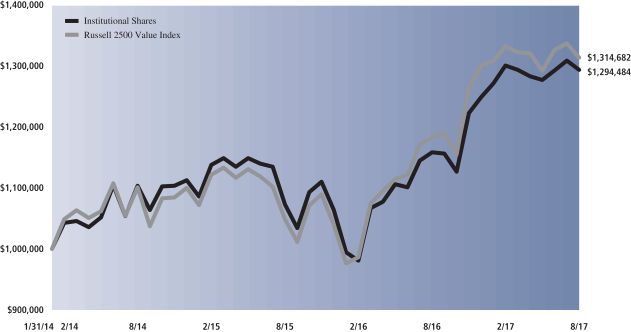
| | | | | | |
| Average Annual Total Return through August 31, 2017 | | | One Year | | | Since Inception |
Class A (Commenced January 31, 2014) | | | | | | |
Excluding sales charges | | | 11.30% | | | 6.97% |
Including sales charges | | | 5.19% | | | 5.30% |
|
Class C (Commenced January 31, 2014) | | | | | | |
Excluding contingent deferred sales charges | | | 10.48% | | | 6.22% |
Including contingent deferred sales charges | | | 9.48% | | | 6.22% |
|
Institutional Class (Commenced January 31, 2014) | | | 11.71% | | | 7.46% |
|
Investor (Commenced January 31, 2014) | | | 11.52% | | | 7.25% |
|
Class R (Commenced January 31, 2014) | | | 11.06% | | | 6.74% |
|
Class R6 (Commenced July 31, 2015) | | | 11.80% | | | 6.53% |
|
47
GOLDMAN SACHS EQUITY INCOME FUND
Schedule of Investments
August 31, 2017
| | | | | | | | |
| Shares | | | Description | | Value | |
| Common Stocks – 98.6% | | | |
| Air Freight & Logistics – 2.1% | | | |
| | 71,159 | | | United Parcel Service, Inc. Class B | | $ | 8,137,743 | |
| | �� |
| Automobiles – 0.6% | | | |
| | 60,731 | | | General Motors Co. | | | 2,219,111 | |
| | |
| Banks – 15.1% | | | |
| | 741,700 | | | Bank of America Corp. | | | 17,719,213 | |
| | 131,746 | | | BB&T Corp. | | | 6,072,173 | |
| | 106,162 | | | JPMorgan Chase & Co. | | | 9,649,064 | |
| | 104,708 | | | SunTrust Banks, Inc. | | | 5,769,411 | |
| | 377,721 | | | Wells Fargo & Co. | | | 19,290,212 | |
| | | | | | | | |
| | | | 58,500,073 | |
| | |
| Beverages – 2.2% | | | |
| | 33,624 | | | Anheuser-Busch InBev SA ADR | | | 3,980,073 | |
| | 51,217 | | | Molson Coors Brewing Co. Class B | | | 4,596,726 | |
| | | | | | | | |
| | | | 8,576,799 | |
| | |
| Capital Markets – 3.1% | | | |
| | 133,236 | | | AllianceBernstein Holding LP | | | 3,124,384 | |
| | 290,182 | | | Deutsche Bank AG | | | 4,640,010 | |
| | 93,023 | | | Morgan Stanley | | | 4,232,547 | |
| | | | | | | | |
| | | | 11,996,941 | |
| | |
| Chemicals – 2.4% | | | |
| | 110,813 | | | E.I. du Pont de Nemours & Co. | | | 9,300,535 | |
| | |
| Communications Equipment – 3.6% | | | |
| | 434,864 | | | Cisco Systems, Inc. | | | 14,006,969 | |
| | |
| Consumer Finance – 1.3% | | | |
| | 62,272 | | | Capital One Financial Corp. | | | 4,957,474 | |
| | |
| Diversified Telecommunication Services – 4.0% | | | |
| | 326,936 | | | CenturyLink, Inc.(a) | | | 6,447,178 | |
| | 190,092 | | | Verizon Communications, Inc. | | | 9,118,713 | |
| | | | | | | | |
| | | | 15,565,891 | |
| | |
| Electric Utilities – 3.8% | | | |
| | 61,916 | | | Duke Energy Corp. | | | 5,405,267 | |
| | 120,693 | | | FirstEnergy Corp. | | | 3,932,178 | |
| | 60,020 | | | Pinnacle West Capital Corp. | | | 5,399,999 | |
| | | | | | | | |
| | | | 14,737,444 | |
| | |
| Electrical Equipment – 2.0% | | | |
| | 134,021 | | | Emerson Electric Co. | | | 7,912,600 | |
| | |
| Energy Equipment & Services – 0.4% | | | |
| | 26,531 | | | Schlumberger Ltd. | | | 1,684,984 | |
| | |
| Equity Real Estate Investment Trusts (REITs) – 2.6% | | | |
| | 428,316 | | | DDR Corp. | | | 4,146,099 | |
| | 94,117 | | | RLJ Lodging Trust | | | 1,899,281 | |
| | 24,844 | | | Simon Property Group, Inc. | | | 3,896,781 | |
| | | | | | | | |
| | | | 9,942,161 | |
| | |
| Food & Staples Retailing – 2.3% | | | |
| | 113,504 | | | Wal-Mart Stores, Inc. | | | 8,861,257 | |
| | |
| Common Stocks – (continued) | | | |
| Food Products – 1.0% | | | |
| | 99,897 | | | Mondelez International, Inc. Class A | | | 4,061,812 | |
| | |
| Health Care Equipment & Supplies – 2.7% | | | |
| | 203,394 | | | Abbott Laboratories | | | 10,360,890 | |
| | |
| Household Products – 3.4% | | | |
| | 143,807 | | | The Procter & Gamble Co. | | | 13,269,072 | |
| | |
| Industrial Conglomerates – 4.4% | | | |
| | 701,746 | | | General Electric Co. | | | 17,227,864 | |
| | |
| Insurance – 6.1% | | | |
| | 172,780 | | | American International Group, Inc. | | | 10,449,734 | |
| | 51,241 | | | Brighthouse Financial, Inc.* | | | 2,924,324 | |
| | 216,819 | | | MetLife, Inc. | | | 10,153,634 | |
| | | | | | | | |
| | | | 23,527,692 | |
| | |
| Media – 2.3% | | | |
| | 78,293 | | | DISH Network Corp. Class A* | | | 4,485,406 | |
| | 154,779 | | | Viacom, Inc. Class B | | | 4,426,679 | |
| | | | | | | | |
| | | | 8,912,085 | |
| | |
| Metals & Mining – 0.7% | | | |
| | 51,830 | | | Nucor Corp. | | | 2,856,351 | |
| | |
| Oil, Gas & Consumable Fuels – 9.5% | | | |
| | 172,613 | | | BP PLC ADR | | | 5,994,849 | |
| | 38,630 | | | Chevron Corp. | | | 4,157,361 | |
| | 180,568 | | | ConocoPhillips | | | 7,883,599 | |
| | 245,663 | | | Exxon Mobil Corp. | | | 18,751,457 | |
| | | | | | | | |
| | | | 36,787,266 | |
| | |
| Personal Products – 1.1% | | | |
| | 68,919 | | | Unilever NV | | | 4,100,681 | |
| | |
| Pharmaceuticals – 11.2% | | | |
| | 100,074 | | | Bristol-Myers Squibb Co. | | | 6,052,476 | |
| | 95,895 | | | Johnson & Johnson | | | 12,693,621 | |
| | 89,275 | | | Merck & Co., Inc. | | | 5,701,102 | |
| | 557,834 | | | Pfizer, Inc. | | | 18,921,729 | |
| | | | | | | | |
| | | | 43,368,928 | |
| | |
| Road & Rail – 1.1% | | | |
| | 38,933 | | | Union Pacific Corp. | | | 4,099,645 | |
| | |
| Semiconductors & Semiconductor Equipment – 1.7% | |
| | 377,649 | | | Marvell Technology Group Ltd. | | | 6,763,694 | |
| | |
| Software – 4.2% | | | |
| | 106,668 | | | Microsoft Corp. | | | 7,975,566 | |
| | 162,490 | | | Oracle Corp. | | | 8,178,122 | |
| | | | | | | | |
| | | | | | | 16,153,688 | |
| | |
| Technology Hardware, Storage & Peripherals – 1.8% | |
| | 42,512 | | | Apple, Inc. | | | 6,971,968 | |
| | |
| Textiles, Apparel & Luxury Goods – 1.0% | | | |
| | 93,919 | | | Coach, Inc. | | | 3,916,422 | |
| | |
| | |
| 48 | | The accompanying notes are an integral part of these financial statements. |
GOLDMAN SACHS EQUITY INCOME FUND
| | | | | | | | |
| Shares | | | Description | | Value | |
| Common Stocks – (continued) | | | |
| Tobacco – 0.9% | | | |
| | 54,065 | | | Altria Group, Inc. | | $ | 3,427,721 | |
| | |
| | TOTAL COMMON STOCKS | | | | |
| | (Cost $343,474,445) | | $ | 382,205,761 | |
| | |
| | | | | | | | |
| Shares | | | Distribution
Rate | | Value | |
| Investment Company(b) – 0.0% | | | |
| Goldman Sachs Financial Square Government Fund –
Institutional Shares |
|
| | 4,642 | | | 0.927% | | $ | 4,642 | |
| | (Cost $4,642) | | | | |
| | |
| TOTAL INVESTMENTS BEFORE SECURITIES LENDING
REINVESTMENT VEHICLE |
|
| | (Cost $343,479,087) | | $ | 382,210,403 | |
| | |
| | | | | | | | |
| Securities Lending Reinvestment Vehicle(b) – 1.4% | |
| Goldman Sachs Financial Square Government Fund –
Institutional Shares |
|
| | 5,493,780 | | | 0.927% | | $ | 5,493,780 | |
| | (Cost $5,493,780) | | | | |
| | |
| | TOTAL INVESTMENTS – 100.0% | | | | |
| | (Cost $348,972,867) | | $ | 387,704,183 | |
| | |
| OTHER ASSETS IN EXCESS OF
LIABILITIES – 0.0% | | | 112,071 | |
| | |
| | NET ASSETS – 100.0% | | $ | 387,816,254 | |
| | |
| | |
| The percentage shown for each investment category reflects the value of investments in that category as a percentage of net assets. |
* | | Non-income producing security. |
(a) | | All or a portion of security is on loan. |
(b) | | Represents an Affiliated fund. |
| | |
|
Investment Abbreviations: |
ADR | | —American Depositary Receipt |
LP | | —Limited Partnership |
PLC | | —Public Limited Company |
|
| | |
| The accompanying notes are an integral part of these financial statements. | | 49 |
GOLDMAN SACHS FOCUSED VALUE FUND
Schedule of Investments
August 31, 2017
| | | | | | | | |
| Shares | | | Description | | Value | |
| Common Stocks – 97.8% | | | |
| Aerospace & Defense – 2.2% | | | |
| | 2,206 | | | Textron, Inc. | | $ | 108,292 | |
| | |
| Airlines* – 2.8% | | | |
| | 6,944 | | | JetBlue Airways Corp. | | | 137,561 | |
| | |
| Automobiles – 3.4% | | | |
| | 5,516 | | | Volkswagen AG ADR | | | 170,665 | |
| | |
| Banks – 17.3% | | | |
| | 10,020 | | | Bank of America Corp. | | | 239,378 | |
| | 2,493 | | | Citizens Financial Group, Inc. | | | 82,593 | |
| | 1,684 | | | JPMorgan Chase & Co. | | | 153,059 | |
| | 2,704 | | | SunTrust Banks, Inc. | | | 148,990 | |
| | 4,633 | | | Wells Fargo & Co. | | | 236,607 | |
| | | | | | | | |
| | | | | | | 860,627 | |
| | |
| Biotechnology* – 2.6% | | | |
| | 943 | | | Celgene Corp. | | | 131,011 | |
| | |
| Capital Markets – 1.5% | | | |
| | 1,612 | | | Morgan Stanley | | | 73,346 | |
| | |
| Diversified Telecommunication Services(a) – 2.0% | | | |
| | 4,980 | | | CenturyLink, Inc. | | | 98,206 | |
| | |
| Electrical Equipment – 2.8% | | | |
| | 2,371 | | | Emerson Electric Co. | | | 139,984 | |
| | |
| Health Care Equipment & Supplies – 2.4% | | | |
| | 2,352 | | | Abbott Laboratories | | | 119,811 | |
| | |
| Household Products – 3.9% | | | |
| | 2,129 | | | The Procter & Gamble Co. | | | 196,443 | |
| | |
| Industrial Conglomerates – 5.2% | | | |
| | 10,444 | | | General Electric Co. | | | 256,400 | |
| | |
| Insurance – 8.1% | | | |
| | 2,443 | | | American International Group, Inc. | | | 147,753 | |
| | 1,793 | | | Brighthouse Financial, Inc.* | | | 102,326 | |
| | 3,322 | | | MetLife, Inc. | | | 155,569 | |
| | | | | | | | |
| | | | | | | 405,648 | |
| | |
| Internet Software & Services* – 7.2% | | | |
| | 241 | | | Alphabet, Inc. Class A | | | 230,213 | |
| | 3,065 | | | Yelp, Inc. | | | 130,569 | |
| | | | | | | | |
| | | | | | | 360,782 | |
| | |
| Media – 7.9% | | | |
| | 2,019 | | | DISH Network Corp. Class A* | | | 115,668 | |
| | 5,828 | | | Liberty Global PLC Series C* | | | 192,499 | |
| | 3,068 | | | Viacom, Inc. Class B | | | 87,745 | |
| | | | | | | | |
| | | | | | | 395,912 | |
| | |
| Oil, Gas & Consumable Fuels – 10.6% | | | |
| | 1,667 | | | ConocoPhillips | | | 72,781 | |
| | 1,461 | | | EQT Corp. | | | 91,079 | |
| | 3,173 | | | Exxon Mobil Corp. | | | 242,195 | |
| | 22,093 | | | Southwestern Energy Co.* | | | 120,407 | |
| | | | | | | | |
| | | | | | | 526,462 | |
| | |
| Common Stocks – (continued) | | | |
| Pharmaceuticals – 10.8% | | | |
| | 818 | | | Allergan PLC | | | 187,715 | |
| | 2,728 | | | Bristol-Myers Squibb Co. | | | 164,989 | |
| | 5,518 | | | Pfizer, Inc. | | | 187,171 | |
| | | | | | | | |
| | | | | | | 539,875 | |
| | |
| Semiconductors & Semiconductor Equipment – 2.3% | | | |
| | 6,407 | | | Marvell Technology Group Ltd. | | | 114,749 | |
| | |
| Software – 4.8% | | | |
| | 4,704 | | | Oracle Corp. | | | 236,752 | |
| | |
| | TOTAL COMMON STOCKS | | | | |
| | (Cost $4,711,940) | | $ | 4,872,526 | |
| | |
| | | | | | | | |
| Shares | | | Distribution
Rate | | Value | |
| Investment Company(b) – 1.2% | | | |
| Goldman Sachs Financial Square Government Fund –
Institutional Shares |
|
| | 61,761 | | | 0.927% | | $ | 61,761 | |
| | (Cost $61,761) | | | | |
| | |
| TOTAL INVESTMENTS BEFORE SECURITIES
LENDING REINVESTMENT VEHICLE | | | | |
| | (Cost $4,773,701) | | $ | 4,934,287 | |
| | |
| | | | | | | | |
| Securities Lending Reinvestment Vehicle(b) – 1.9% | |
| Goldman Sachs Financial Square Government Fund –
Institutional Shares |
|
| | 95,910 | | | 0.927% | | $ | 95,910 | |
| | (Cost $95,910) | | | | |
| | |
| | TOTAL INVESTMENTS – 100.9% | |
| | (Cost $4,869,611) | | $ | 5,030,197 | |
| | |
| LIABILITIES IN EXCESS OF
OTHER ASSETS – (0.9)% | | | (45,339 | ) |
| | |
| | NET ASSETS – 100.0% | | $ | 4,984,858 | |
| | |
| | |
| The percentage shown for each investment category reflects the value of investments in that category as a percentage of net assets. |
* | | Non-income producing security. |
(a) | | All or a portion of security is on loan. |
(b) | | Represents an Affiliated fund. |
| | |
|
Investment Abbreviations: |
ADR | | —American Depositary Receipt |
PLC | | —Public Limited Company |
|
| | |
| 50 | | The accompanying notes are an integral part of these financial statements. |
GOLDMAN SACHS LARGE CAP VALUE FUND
Schedule of Investments
August 31, 2017
| | | | | | | | |
| Shares | | | Description | | Value | |
| Common Stocks – 96.9% | | | |
| Aerospace & Defense – 1.1% | | | |
| | 187,471 | | | Textron, Inc. | | $ | 9,202,951 | |
| | |
| Air Freight & Logistics – 0.8% | | | |
| | 97,358 | | | C.H. Robinson Worldwide, Inc. | | | 6,876,396 | |
| | |
| Airlines* – 0.8% | | | |
| | 328,426 | | | JetBlue Airways Corp. | | | 6,506,119 | |
| | |
| Automobiles – 1.0% | | | |
| | 271,752 | | | Volkswagen AG ADR | | | 8,408,007 | |
| | |
| Banks – 15.1% | | | |
| | 1,708,329 | | | Bank of America Corp. | | | 40,811,980 | |
| | 185,214 | | | Citizens Financial Group, Inc. | | | 6,136,140 | |
| | 312,136 | | | JPMorgan Chase & Co. | | | 28,370,041 | |
| | 225,310 | | | SunTrust Banks, Inc. | | | 12,414,581 | |
| | 807,571 | | | Wells Fargo & Co. | | | 41,242,651 | |
| | | | | | | | |
| | | | | | | 128,975,393 | |
| | |
| Beverages – 1.0% | | | |
| | 68,840 | | | Anheuser-Busch InBev SA ADR | | | 8,148,591 | |
| | |
| Biotechnology* – 1.9% | | | |
| | 99,807 | | | BioMarin Pharmaceutical, Inc. | | | 9,001,593 | |
| | 28,932 | | | Celgene Corp. | | | 4,019,523 | |
| | 22,065 | | | Vertex Pharmaceuticals, Inc. | | | 3,542,315 | |
| | | | | | | | |
| | | | | | | 16,563,431 | |
| | |
| Capital Markets – 2.0% | | | |
| | 691,803 | | | Deutsche Bank AG | | | 11,061,930 | |
| | 137,741 | | | Morgan Stanley | | | 6,267,215 | |
| | | | | | | | |
| | | | | | | 17,329,145 | |
| | |
| Chemicals – 1.9% | | | |
| | 195,252 | | | E.I. du Pont de Nemours & Co. | | | 16,387,500 | |
| | |
| Communications Equipment – 2.7% | | | |
| | 712,793 | | | Cisco Systems, Inc. | | | 22,959,063 | |
| | |
| Consumer Finance – 1.7% | | | |
| | 187,072 | | | Capital One Financial Corp. | | | 14,892,802 | |
| | |
| Containers & Packaging – 0.9% | | | |
| | 197,923 | | | Ball Corp. | | | 7,914,941 | |
| | |
| Diversified Telecommunication Services – 2.2% | | | |
| | 236,691 | | | AT&T, Inc. | | | 8,866,445 | |
| | 501,612 | | | CenturyLink, Inc.(a) | | | 9,891,788 | |
| | | | | | | | |
| | | | | | | 18,758,233 | |
| | |
| Electric Utilities – 1.3% | | | |
| | 173,018 | | | FirstEnergy Corp. | | | 5,636,927 | |
| | 83,766 | | | PG&E Corp. | | | 5,895,451 | |
| | | | | | | | |
| | | | | | | 11,532,378 | |
| | |
| Electrical Equipment – 1.9% | | | |
| | 276,636 | | | Emerson Electric Co. | | | 16,332,589 | |
| | |
| Common Stocks – (continued) | | | |
| Energy Equipment & Services – 0.7% | | | |
| | 154,674 | | | Halliburton Co. | | | 6,027,646 | |
| | |
| Equity Real Estate Investment Trusts (REITs) – 2.6% | |
| | 789,213 | | | DDR Corp. | | | 7,639,582 | |
| | 51,116 | | | Simon Property Group, Inc. | | | 8,017,545 | |
| | 87,980 | | | Vornado Realty Trust | | | 6,553,630 | |
| | | | | | | | |
| | | | | | | 22,210,757 | |
| | |
| Food & Staples Retailing – 0.7% | | | |
| | 72,070 | | | CVS Health Corp. | | | 5,573,894 | |
| | |
| Food Products – 1.0% | | | |
| | 204,705 | | | Mondelez International, Inc. Class A | | | 8,323,305 | |
| | |
| Health Care Equipment & Supplies – 2.3% | | | |
| | 377,859 | | | Abbott Laboratories | | | 19,248,137 | |
| | |
| Health Care Providers & Services – 1.1% | | | |
| | 56,949 | | | Aetna, Inc. | | | 8,980,857 | |
| | |
| Household Durables – 1.2% | | | |
| | 215,399 | | | Newell Brands, Inc. | | | 10,399,464 | |
| | |
| Household Products – 2.9% | | | |
| | 269,894 | | | The Procter & Gamble Co. | | | 24,903,119 | |
| | |
| Industrial Conglomerates – 3.6% | | | |
| | 1,265,865 | | | General Electric Co. | | | 31,076,986 | |
| | |
| Insurance – 6.8% | | | |
| | 378,626 | | | American International Group, Inc. | | | 22,899,300 | |
| | 177,811 | | | Brighthouse Financial, Inc.* | | | 10,147,674 | |
| | 532,243 | | | MetLife, Inc. | | | 24,924,940 | |
| | | | | | | | |
| | | | | | | 57,971,914 | |
| | |
| Internet Software & Services* – 2.0% | | | |
| | 17,975 | | | Alphabet, Inc. Class A | | | 17,170,439 | |
| | |
| IT Services – 0.6% | | | |
| | 47,369 | | | Visa, Inc. Class A | | | 4,903,639 | |
| | |
| Machinery* – 0.9% | | | |
| | 54,559 | | | WABCO Holdings, Inc. | | | 7,835,764 | |
| | |
| Media – 3.7% | | | |
| | 117,425 | | | DISH Network Corp. Class A* | | | 6,727,278 | |
| | 518,043 | | | Liberty Global PLC Series C* | | | 17,110,961 | |
| | 274,920 | | | Viacom, Inc. Class B | | | 7,862,712 | |
| | | | | | | | |
| | | | | | | 31,700,951 | |
| | |
| Metals & Mining – 0.9% | | | |
| | 144,650 | | | Nucor Corp. | | | 7,971,661 | |
| | |
| Oil, Gas & Consumable Fuels – 8.9% | | | |
| | 373,830 | | | BP PLC ADR | | | 12,983,116 | |
| | 248,972 | | | ConocoPhillips | | | 10,870,118 | |
| | 537,553 | | | Exxon Mobil Corp. | | | 41,031,420 | |
| | 1,986,341 | | | Southwestern Energy Co.* | | | 10,825,558 | |
| | | | | | | | |
| | | | | | | 75,710,212 | |
| | |
| | |
| The accompanying notes are an integral part of these financial statements. | | 51 |
GOLDMAN SACHS LARGE CAP VALUE FUND
Schedule of Investments (continued)
August 31, 2017
| | | | | | | | |
| Shares | | | Description | | Value | |
| Common Stocks – (continued) | | | |
| Personal Products – 1.9% | | | |
| | 496,576 | | | Coty, Inc. Class A | | $ | 8,233,230 | |
| | 127,321 | | | Unilever NV | | | 7,575,600 | |
| | | | | | | | |
| | | | | | | 15,808,830 | |
| | |
| Pharmaceuticals – 10.1% | | | |
| | 121,394 | | | Allergan PLC | | | 27,857,495 | |
| | 249,893 | | | Bristol-Myers Squibb Co. | | | 15,113,529 | |
| | 67,652 | | | Johnson & Johnson | | | 8,955,095 | |
| | 69,314 | | | Merck & Co., Inc. | | | 4,426,392 | |
| | 878,556 | | | Pfizer, Inc. | | | 29,800,620 | |
| | | | | | | | |
| | | | | | | 86,153,131 | |
| | |
| Road & Rail – 1.3% | | | |
| | 108,122 | | | Kansas City Southern | | | 11,183,058 | |
| | |
| Semiconductors & Semiconductor Equipment – 0.5% | | | |
| | 56,298 | | | Texas Instruments, Inc. | | | 4,662,600 | |
| | |
| Software – 3.8% | | | |
| | 516,440 | | | Oracle Corp. | | | 25,992,425 | |
| | 225,273 | | | Symantec Corp. | | | 6,753,685 | |
| | | | | | | | |
| | | | | | | 32,746,110 | |
| | |
| Specialty Retail – 1.3% | | | |
| | 31,378 | | | The Home Depot, Inc. | | | 4,702,621 | |
| | 88,431 | | | The TJX Cos., Inc. | | | 6,393,561 | |
| | | | | | | | |
| | | | | | | 11,096,182 | |
| | |
| Textiles, Apparel & Luxury Goods – 1.0% | | | |
| | 203,979 | | | Coach, Inc. | | | 8,505,924 | |
| | |
| Wireless Telecommunication Services* – 0.8% | | | |
| | 107,003 | | | T-Mobile US, Inc. | | | 6,924,164 | |
| | |
| | TOTAL COMMON STOCKS | | | | |
| | (Cost $724,685,585) | | $ | 827,876,283 | |
| | |
| | | | | | | | |
| Shares | | | Distribution
Rate | | Value | |
| Investment Company(b) – 1.4% | | | |
| Goldman Sachs Financial Square Government Fund –
Institutional Shares |
|
| | 11,928,930 | | | 0.927% | | $ | 11,928,930 | |
| | (Cost $11,928,930) | | | | |
| | |
| TOTAL INVESTMENTS BEFORE SECURITIES LENDING
REINVESTMENT VEHICLE |
|
| | (Cost $736,614,515) | | $ | 839,805,213 | |
| | |
| Securities Lending Reinvestment Vehicle(b) – 1.0% | |
| Goldman Sachs Financial Square Government Fund –
Institutional Shares |
|
| | 8,376,426 | | | 0.927% | | | 8,376,426 | |
| | (Cost $8,376,426) | | | | |
| | |
| | TOTAL INVESTMENTS – 99.3% | | | | |
| | (Cost $744,990,941) | | $ | 848,181,639 | |
| | |
| OTHER ASSETS IN EXCESS OF
LIABILITIES – 0.7% | | | 6,026,527 | |
| | |
| | NET ASSETS – 100.0% | | $ | 854,208,166 | |
| | |
| | |
| The percentage shown for each investment category reflects the value of investments in that category as a percentage of net assets. |
* | | Non-income producing security. |
(a) | | All or a portion of security is on loan. |
(b) | | Represents an Affiliated fund. |
| | |
|
Investment Abbreviations: |
ADR | | —American Depositary Receipt |
PLC | | —Public Limited Company |
|
| | |
| 52 | | The accompanying notes are an integral part of these financial statements. |
GOLDMAN SACHS MID CAP VALUE FUND
Schedule of Investments
August 31, 2017
| | | | | | | | |
| Shares | | | Description | | Value | |
| Common Stocks – 100.1% | | | |
| Aerospace & Defense – 1.4% | | | |
| | 208,217 | | | L3 Technologies, Inc. | | $ | 37,787,221 | |
| | |
| Air Freight & Logistics* – 0.9% | | | |
| | 377,262 | | | XPO Logistics, Inc. | | | 23,088,434 | |
| | |
| Airlines* – 1.4% | | | |
| | 1,928,509 | | | JetBlue Airways Corp. | | | 38,203,763 | |
| | |
| Banks – 7.9% | | | |
| | 1,618,968 | | | Citizens Financial Group, Inc. | | | 53,636,410 | |
| | 1,234,825 | | | First Horizon National Corp. | | | 21,251,338 | |
| | 3,618,738 | | | Huntington Bancshares, Inc. | | | 45,559,911 | |
| | 256,096 | | | Signature Bank* | | | 32,867,361 | |
| | 1,024,382 | | | SunTrust Banks, Inc. | | | 56,443,448 | |
| | | | | | | | |
| | | | | | | 209,758,468 | |
| | |
| Beverages – 2.0% | | | |
| | 589,020 | | | Molson Coors Brewing Co. Class B | | | 52,864,545 | |
| | |
| Biotechnology* – 2.3% | | | |
| | 120,254 | | | Alexion Pharmaceuticals, Inc. | | | 17,125,372 | |
| | 328,471 | | | BioMarin Pharmaceutical, Inc. | | | 29,624,800 | |
| | 85,737 | | | Vertex Pharmaceuticals, Inc. | | | 13,764,218 | |
| | | | | | | | |
| | | | | | | 60,514,390 | |
| | |
| Capital Markets – 2.1% | | | |
| | 198,196 | | | Ameriprise Financial, Inc. | | | 27,452,128 | |
| | 700,365 | | | E*TRADE Financial Corp.* | | | 28,721,969 | |
| | | | | | | | |
| | | | | | | 56,174,097 | |
| | |
| Chemicals – 1.4% | | | |
| | 386,370 | | | Celanese Corp. Series A | | | 37,485,617 | |
| | |
| Communications Equipment – 1.5% | | | |
| | 869,611 | | | Juniper Networks, Inc. | | | 24,114,313 | |
| | 1,586,678 | | | Viavi Solutions, Inc.* | | | 15,930,247 | |
| | | | | | | | |
| | | | | | | 40,044,560 | |
| | |
| Construction & Engineering – 1.3% | | | |
| | 613,516 | | | Jacobs Engineering Group, Inc. | | | 33,430,487 | |
| | |
| Construction Materials – 1.0% | | | |
| | 128,048 | | | Martin Marietta Materials, Inc. | | | 27,144,896 | |
| | |
| Consumer Finance – 2.3% | | | |
| | 1,949,665 | | | SLM Corp.* | | | 19,828,093 | |
| | 1,328,355 | | | Synchrony Financial | | | 40,900,051 | |
| | | | | | | | |
| | | | | | | 60,728,144 | |
| | |
| Containers & Packaging – 1.5% | | | |
| | 983,184 | | | Ball Corp. | | | 39,317,528 | |
| | |
| Distributors* – 1.0% | | | |
| | 754,925 | | | LKQ Corp. | | | 26,158,151 | |
| | |
| Diversified Telecommunication Services(a) – 1.4% | | | |
| | 1,830,525 | | | CenturyLink, Inc. | | | 36,097,953 | |
| | |
| Electric Utilities – 6.0% | | | |
| | 335,151 | | | Edison International | | | 26,872,407 | |
| | |
| Common Stocks – (continued) | | | |
| Electric Utilities – (continued) | | | |
| | 739,336 | | | FirstEnergy Corp. | | | 24,087,567 | |
| | 846,228 | | | PG&E Corp. | | | 59,557,527 | |
| | 538,914 | | | Pinnacle West Capital Corp. | | | 48,486,092 | |
| | | | | | | | |
| | | | | | | 159,003,593 | |
| | |
| Electrical Equipment – 0.9% | | | |
| | 393,051 | | | AMETEK, Inc. | | | 24,860,476 | |
| | |
| Electronic Equipment, Instruments & Components* – 0.6% | |
| | 777,194 | | | VeriFone Systems, Inc. | | | 15,365,125 | |
| | |
| Equity Real Estate Investment Trusts (REITs) – 11.7% | | | |
| | 240,507 | | | Alexandria Real Estate Equities, Inc. | | | 29,175,904 | |
| | 329,584 | | | Boston Properties, Inc. | | | 39,747,830 | |
| | 1,343,944 | | | Brixmor Property Group, Inc. | | | 25,158,632 | |
| | 251,642 | | | CyrusOne, Inc. | | | 15,860,995 | |
| | 3,046,421 | | | DDR Corp. | | | 29,489,355 | |
| | 597,927 | | | Equity Residential Properites Trust | | | 40,150,798 | |
| | 130,275 | | | Federal Realty Investment Trust | | | 16,535,806 | |
| | 623,537 | | | Hudson Pacific Properties, Inc. | | | 20,576,721 | |
| | 340,719 | | | Mid-America Apartment Communities, Inc. | | | 36,272,945 | |
| | 974,276 | | | RLJ Lodging Trust | | | 19,660,890 | |
| | 512,191 | | | Vornado Realty Trust | | | 38,153,108 | |
| | | | | | | | |
| | | | | | | 310,782,984 | |
| | |
| Food & Staples Retailing* – 1.7% | | | |
| | 1,644,577 | | | US Foods Holding Corp. | | | 45,143,639 | |
| | |
| Food Products – 0.9% | | | |
| | 777,194 | | | Conagra Brands, Inc. | | | 25,227,717 | |
| | |
| Gas Utilities – 1.2% | | | |
| | 355,193 | | | Atmos Energy Corp. | | | 31,271,192 | |
| | |
| Health Care Equipment & Supplies – 1.3% | | | |
| | 300,634 | | | Zimmer Biomet Holdings, Inc. | | | 34,353,447 | |
| | |
| Health Care Providers & Services – 2.7% | | | |
| | 368,555 | | | Acadia Healthcare Co., Inc.* | | | 17,299,972 | |
| | 380,803 | | | Cardinal Health, Inc. | | | 25,688,970 | |
| | 180,381 | | | Laboratory Corp. of America Holdings* | | | 28,296,368 | |
| | | | | | | | |
| | | | | | | 71,285,310 | |
| | |
| Hotels, Restaurants & Leisure – 1.2% | | | |
| | 945,326 | | | MGM Resorts International | | | 31,157,945 | |
| | |
| Household Durables – 3.0% | | | |
| | 43,425 | | | Mohawk Industries, Inc.* | | | 10,991,736 | |
| | 999,885 | | | Newell Brands, Inc. | | | 48,274,448 | |
| | 534,460 | | | Toll Brothers, Inc. | | | 20,822,562 | |
| | | | | | | | |
| | | | | | | 80,088,746 | |
| | |
| Insurance – 5.5% | | | |
| | 399,732 | | | Arch Capital Group Ltd.* | | | 38,909,913 | |
| | 356,307 | | | Brighthouse Financial, Inc.* | | | 20,334,440 | |
| | 517,758 | | | The Hartford Financial Services Group, Inc. | | | 27,995,175 | |
| | |
| | |
| The accompanying notes are an integral part of these financial statements. | | 53 |
GOLDMAN SACHS MID CAP VALUE FUND
Schedule of Investments (continued)
August 31, 2017
| | | | | | | | |
| Shares | | | Description | | Value | |
| Common Stocks – (continued) | | | |
| Insurance – (continued) | | | |
| | 410,866 | | | The Progressive Corp. | | $ | 19,097,052 | |
| | 439,816 | | | Unum Group | | | 21,190,335 | |
| | 268,344 | | | W.R. Berkley Corp. | | | 17,882,444 | |
| | | | | | | | |
| | | | | | | 145,409,359 | |
| | |
| Internet & Direct Marketing Retail – 1.3% | | | |
| | 227,255 | | | Expedia, Inc. | | | 33,715,552 | |
| | |
| Internet Software & Services* – 1.4% | | | |
| | 458,745 | | | GoDaddy, Inc. Class A | | | 20,560,951 | |
| | 416,434 | | | Yelp, Inc. | | | 17,740,088 | |
| | | | | | | | |
| | | | | | | 38,301,039 | |
| | |
| IT Services – 0.8% | | | |
| | 241,621 | | | DXC Technology Co. | | | 20,537,785 | |
| | |
| Machinery – 4.7% | | | |
| | 351,853 | | | Stanley Black & Decker, Inc. | | | 50,666,832 | |
| | 455,405 | | | Terex Corp. | | | 17,555,863 | |
| | 791,669 | | | Trinity Industries, Inc. | | | 22,831,734 | |
| | 492,149 | | | Wabtec Corp.(a) | | | 34,730,955 | |
| | | | | | | | |
| | | | | | | 125,785,384 | |
| | |
| Media – 4.5% | | | |
| | 918,603 | | | Discovery Communications, Inc. Class A* | | | 20,402,173 | |
| | 454,291 | | | DISH Network Corp. Class A* | | | 26,026,331 | |
| | 226,032 | | | Liberty Broadband Corp. Class C* | | | 22,949,029 | |
| | 639,125 | | | Liberty Media Corp-Liberty Formula One Class C*(a) | | | 25,117,612 | |
| | 828,413 | | | Viacom, Inc. Class B | | | 23,692,612 | |
| | | | | | | | |
| | | | | | | 118,187,757 | |
| | |
| Metals & Mining – 2.3% | | | |
| | 1,645,691 | | | Freeport-McMoRan, Inc.* | | | 24,323,313 | |
| | 1,071,147 | | | Steel Dynamics, Inc. | | | 36,901,014 | |
| | | | | | | | |
| | | | | | | 61,224,327 | |
| | |
| Mortgage Real Estate Investment Trusts (REITs) – 0.9% | |
| | 1,048,878 | | | Starwood Property Trust, Inc. | | | 23,295,580 | |
| | |
| Multi-Utilities – 1.5% | | | |
| | 326,244 | | | SCANA Corp. | | | 19,698,613 | |
| | 182,608 | | | Sempra Energy | | | 21,534,961 | |
| | | | | | | | |
| | | | | | | 41,233,574 | |
| | |
| Oil, Gas & Consumable Fuels – 7.4% | | | |
| | 321,790 | | | Andeavor | | | 32,227,269 | |
| | 318,449 | | | Cheniere Energy, Inc.* | | | 13,626,433 | |
| | 768,286 | | | EQT Corp. | | | 47,894,949 | |
| | 1,598,926 | | | Parsley Energy, Inc. Class A* | | | 40,053,096 | |
| | 635,785 | | | RSP Permian, Inc.* | | | 19,950,933 | |
| | 1,037,743 | | | The Williams Cos., Inc. | | | 30,852,100 | |
| | 1,257,094 | | | WPX Energy, Inc.* | | | 12,558,369 | |
| | | | | | | | |
| | | | | | | 197,163,149 | |
| | |
| Common Stocks – (continued) | | | |
| Personal Products* – 1.2% | | | |
| | 409,753 | | | Edgewell Personal Care Co. | | | 31,116,643 | |
| | |
| Road & Rail – 1.1% | | | |
| | 296,909 | | | Old Dominion Freight Line, Inc. | | | 29,661,209 | |
| | |
| Semiconductors & Semiconductor Equipment – 3.6% | | | |
| | 2,849,339 | | | Marvell Technology Group Ltd. | | | 51,031,662 | |
| | 361,874 | | | Mellanox Technologies Ltd.*(a) | | | 16,989,984 | |
| | 360,761 | | | Qorvo, Inc.* | | | 26,414,920 | |
| | | | | | | | |
| | | | | | | 94,436,566 | |
| | |
| Specialty Retail – 1.2% | | | |
| | 201,536 | | | Burlington Stores, Inc.* | | | 17,559,832 | |
| | 367,566 | | | L Brands, Inc. | | | 13,313,240 | |
| | | | | | | | |
| | | | | | | 30,873,072 | |
| | |
| Textiles, Apparel & Luxury Goods – 2.1% | | | |
| | 761,606 | | | Coach, Inc. | | | 31,758,970 | |
| | 188,175 | | | PVH Corp. | | | 23,689,351 | |
| | | | | | | | |
| | | | | | | 55,448,321 | |
| | |
| | TOTAL COMMON STOCKS | | | | |
| | (Cost $2,455,404,956) | | $ | 2,653,727,745 | |
| | |
| | | | | | | | |
| Shares | | | Distribution
Rate | | Value | |
| Investment Company(b) – 0.1% | | | |
| Goldman Sachs Financial Square Government Fund –
Institutional Shares |
|
| | 3,199,933 | | | 0.927% | | $ | 3,199,933 | |
| | (Cost $3,199,933) | | | | |
| | |
| TOTAL INVESTMENTS BEFORE SECURITIES LENDING
REINVESTMENT VEHICLE |
|
| | (Cost $2,458,604,889) | | $ | 2,656,927,678 | |
| | |
| | | | | | | | |
| Securities Lending Reinvestment Vehicle(b) – 1.9% | |
| Goldman Sachs Financial Square Government Fund –
Institutional Shares |
|
| | 50,158,515 | | | 0.927% | | $ | 50,158,515 | |
| | (Cost $ 50,158,515) | | | | |
| | |
| | TOTAL INVESTMENTS – 102.1% | | | | |
| | (Cost $2,508,763,404) | | $ | 2,707,086,193 | |
| | |
| LIABILITIES IN EXCESS OF
OTHER ASSETS – (2.1)% | | | (55,009,674 | ) |
| | |
| | NET ASSETS – 100.0% | | $ | 2,652,076,519 | |
| | |
| | |
| The percentage shown for each investment category reflects the value of investments in that category as a percentage of net assets. |
* | | Non-income producing security. |
(a) | | All or a portion of security is on loan. |
(b) | | Represents an Affiliated fund. |
| | |
| 54 | | The accompanying notes are an integral part of these financial statements. |
GOLDMAN SACHS SMALL CAP VALUE FUND
Schedule of Investments
August 31, 2017
| | | | | | | | |
| Shares | | | Description | | Value | |
| Common Stocks – 99.4% | |
| Aerospace & Defense – 2.7% | |
| | 251,464 | | | Curtiss-Wright Corp. | | $ | 24,346,744 | |
| | 436,799 | | | Esterline Technologies Corp.* | | | 37,302,635 | |
| | 920,718 | | | KLX, Inc.* | | | 44,139,221 | |
| | 695,774 | | | Mercury Systems, Inc.* | | | 33,571,096 | |
| | 493,294 | | | Moog, Inc. Class A* | | | 37,865,247 | |
| | | | | | | | |
| | | | 177,224,943 | |
| | |
| Air Freight & Logistics – 1.2% | |
| | 333,665 | | | Forward Air Corp. | | | 17,340,570 | |
| | 985,237 | | | XPO Logistics, Inc.* | | | 60,296,504 | |
| | | | | | | | |
| | | | 77,637,074 | |
| | |
| Airlines – 0.3% | | | |
| | 566,550 | | | SkyWest, Inc. | | | 19,659,285 | |
| | 69,637 | | | Spirit Airlines, Inc.* | | | 2,371,140 | |
| | | | | | | | |
| | | | 22,030,425 | |
| | |
| Auto Components – 0.8% | |
| | 91,668 | | | Cooper Tire & Rubber Co. | | | 3,080,045 | |
| | 1,693,378 | | | Dana, Inc. | | | 40,759,608 | |
| | 197,302 | | | Standard Motor Products, Inc. | | | 8,701,018 | |
| | | | | | | | |
| | | | 52,540,671 | |
| | |
| Automobiles(a) – 0.3% | |
| | 482,395 | | | Winnebago Industries, Inc. | | | 17,438,579 | |
| | |
| Banks – 18.9% | |
| | 634,408 | | | Ameris Bancorp | | | 27,945,672 | |
| | 970,518 | | | BancorpSouth, Inc. | | | 28,193,548 | |
| | 963,853 | | | Banner Corp. | | | 53,127,577 | |
| | 1,613,033 | | | Boston Private Financial Holdings, Inc. | | | 23,711,585 | |
| | 1,361,725 | | | Brookline Bancorp, Inc. | | | 19,540,754 | |
| | 233,501 | | | Bryn Mawr Bank Corp. | | | 9,561,866 | |
| | 1,536,692 | | | CenterState Banks, Inc. | | | 37,602,853 | |
| | 1,192,022 | | | CoBiz Financial, Inc. | | | 20,323,975 | |
| | 1,305,102 | | | Columbia Banking System, Inc. | | | 48,510,641 | |
| | 680,738 | | | Community Bank System, Inc. | | | 35,030,778 | |
| | 883,800 | | | ConnectOne Bancorp, Inc. | | | 20,150,640 | |
| | 307,271 | | | CU Bancorp* | | | 10,954,211 | |
| | 2,267,326 | | | CVB Financial Corp. | | | 46,933,648 | |
| | 942,237 | | | First Financial Bankshares, Inc.(a) | | | 37,736,592 | |
| | 1,023,147 | | | First Merchants Corp. | | | 40,178,983 | |
| | 1,376,472 | | | First Midwest Bancorp, Inc. | | | 29,016,030 | |
| | 754,258 | | | Flushing Financial Corp. | | | 20,621,414 | |
| | 1,209,183 | | | Glacier Bancorp, Inc. | | | 40,156,967 | |
| | 1,242,516 | | | Great Western Bancorp, Inc. | | | 44,631,175 | |
| | 516,989 | | | Guaranty Bancorp | | | 13,338,316 | |
| | 640,786 | | | Heritage Financial Corp. | | | 16,756,554 | |
| | 1,132,053 | | | Home BancShares, Inc. | | | 26,388,155 | |
| | 563,658 | | | Independent Bank Corp. | | | 39,061,499 | |
| | 449,954 | | | Independent Bank Group, Inc. | | | 25,039,940 | |
| | 584,190 | | | Lakeland Financial Corp. | | | 25,388,897 | |
| | 1,380,111 | | | LegacyTexas Financial Group, Inc. | | | 49,670,195 | |
| | 1,263,467 | | | MB Financial, Inc. | | | 50,248,083 | |
| | 238,890 | | | National Commerce Corp.* | | | 9,495,878 | |
| | |
| Common Stocks – (continued) | |
| Banks – (continued) | |
| | 142,737 | | | PacWest Bancorp | | | 6,444,576 | |
| | 1,054,495 | | | Pinnacle Financial Partners, Inc. | | | 65,589,589 | |
| | 521,344 | | | Prosperity Bancshares, Inc. | | | 31,150,304 | |
| | 1,077,715 | | | Renasant Corp. | | | 42,925,388 | |
| | 426,055 | | | Sandy Spring Bancorp, Inc. | | | 16,432,941 | |
| | 586,267 | | | South State Corp. | | | 48,220,461 | |
| | 816,537 | | | State Bank Financial Corp. | | | 21,940,349 | |
| | 625,414 | | | Texas Capital Bancshares, Inc.* | | | 46,436,990 | |
| | 480,194 | | | The First of Long Island Corp. | | | 12,845,190 | |
| | 319,497 | | | Towne Bank | | | 9,808,558 | |
| | 443,001 | | | TriCo Bancshares | | | 15,761,976 | |
| | 1,294,030 | | | Webster Financial Corp. | | | 60,405,320 | |
| | | | | | | | |
| | | | 1,227,278,068 | |
| | |
| Building Products* – 0.8% | | | |
| | 108,085 | | | American Woodmark Corp. | | | 8,949,438 | |
| | 810,832 | | | Gibraltar Industries, Inc. | | | 23,716,836 | |
| | 239,002 | | | Patrick Industries, Inc. | | | 17,686,148 | |
| | | | | | | | |
| | | | 50,352,422 | |
| | |
| Capital Markets – 1.3% | | | |
| | 419,787 | | | Golub Capital BDC, Inc. | | | 7,803,840 | |
| | 1,614,895 | | | OM Asset Management PLC | | | 22,818,466 | |
| | 876,315 | | | Stifel Financial Corp. | | | 41,844,041 | |
| | 624,631 | | | Virtu Financial, Inc. Class A(a) | | | 11,212,127 | |
| | | | | | | | |
| | | | 83,678,474 | |
| | |
| Chemicals – 2.3% | | | |
| | 254,800 | | | GCP Applied Technologies, Inc.* | | | 7,198,100 | |
| | 628,436 | | | Minerals Technologies, Inc. | | | 40,219,904 | |
| | 530,812 | | | Olin Corp. | | | 17,108,071 | |
| | 152,477 | | | Quaker Chemical Corp. | | | 21,227,848 | |
| | 321,499 | | | Trinseo SA | | | 21,508,283 | |
| | 2,191,594 | | | Tronox Ltd. Class A | | | 45,344,080 | |
| | | | | | | | |
| | | | 152,606,286 | |
| | |
| Commercial Services & Supplies – 1.5% | | | |
| | 794,604 | | | ABM Industries, Inc. | | | 35,304,256 | |
| | 822,793 | | | Advanced Disposal Services, Inc.* | | | 19,615,385 | |
| | 818,644 | | | Mobile Mini, Inc. | | | 24,763,981 | |
| | 345,634 | | | US Ecology, Inc. | | | 17,765,587 | |
| | | | | | | | |
| | | | 97,449,209 | |
| | |
| Communications Equipment* – 1.7% | | | |
| | 1,024,526 | | | Extreme Networks, Inc. | | | 11,710,332 | |
| | 664,007 | | | Finisar Corp. | | | 16,035,769 | |
| | 1,285,160 | | | NetScout Systems, Inc. | | | 42,088,990 | |
| | 3,928,283 | | | Viavi Solutions, Inc. | | | 39,439,962 | |
| | | | | | | | |
| | | | 109,275,053 | |
| | |
| Construction & Engineering – 0.9% | | | |
| | 535,775 | | | EMCOR Group, Inc. | | | 35,382,581 | |
| | 417,881 | | | Granite Construction, Inc. | | | 23,079,568 | |
| | | | | | | | |
| | | | | | | 58,462,149 | |
| | |
| | |
| The accompanying notes are an integral part of these financial statements. | | 55 |
GOLDMAN SACHS SMALL CAP VALUE FUND
Schedule of Investments (continued)
August 31, 2017
| | | | | | | | |
| Shares | | | Description | | Value | |
| Common Stocks – (continued) | |
| Construction Materials – 1.1% | | | |
| | 346,754 | | | Eagle Materials, Inc. | | $ | 33,721,826 | |
| | 1,191,240 | | | Summit Materials, Inc. Class A* | | | 35,189,230 | |
| | | | | | | | |
| | | | | | | 68,911,056 | |
| | |
| Containers & Packaging* – 0.5% | | | |
| | 615,629 | | | Berry Global Group, Inc. | | | 34,622,975 | |
| | |
| Diversified Consumer Services – 0.1% | | | |
| | 195,245 | | | Adtalem Global Education, Inc. | | | 6,677,379 | |
| | |
| Electric Utilities – 2.7% | | | |
| | 541,110 | | | IDACORP, Inc. | | | 48,147,968 | |
| | 1,339,413 | | | PNM Resources, Inc. | | | 56,791,111 | |
| | 1,519,476 | | | Portland General Electric Co. | | | 72,190,305 | |
| | | | | | | | |
| | | | | | | 177,129,384 | |
| | |
| Electrical Equipment* – 0.2% | | | |
| | 909,687 | | | Thermon Group Holdings, Inc. | | | 15,028,029 | |
| | |
| Electronic Equipment, Instruments & Components – 3.2% | |
| | 516,954 | | | Anixter International, Inc.* | | | 38,151,205 | |
| | 956,249 | | | CTS Corp. | | | 21,515,603 | |
| | 595,931 | | | II-VI, Inc.* | | | 21,364,126 | |
| | 306,555 | | | OSI Systems, Inc.* | | | 25,462,458 | |
| | 478,380 | | | SYNNEX Corp. | | | 57,219,032 | |
| | 427,221 | | | Tech Data Corp.* | | | 47,118,204 | |
| | | | | | | | |
| | | | | | | 210,830,628 | |
| | |
| Energy Equipment & Services* – 0.6% | | | |
| | 463,402 | | | Basic Energy Services, Inc. | | | 6,598,845 | |
| | 773,835 | | | C&J Energy Services, Inc. | | | 19,547,072 | |
| | 572,294 | | | NCS Multistage Holdings, Inc. | | | 11,308,529 | |
| | | | | | | | |
| | | | | | | 37,454,446 | |
| | |
| Equity Real Estate Investment Trusts (REITs) – 8.1% | | | |
| | 2,190,390 | | | Acadia Realty Trust | | | 62,842,289 | |
| | 2,406,896 | | | Chesapeake Lodging Trust | | | 61,592,469 | |
| | 2,443,965 | | | Columbia Property Trust, Inc. | | | 51,323,265 | |
| | 986,541 | | | CyrusOne, Inc. | | | 62,181,679 | |
| | 876,765 | | | Hudson Pacific Properties, Inc. | | | 28,933,245 | |
| | 734,060 | | | Life Storage, Inc. | | | 54,019,475 | |
| | 582,219 | | | National Health Investors, Inc. | | | 46,682,319 | |
| | 2,466,031 | | | Pebblebrook Hotel Trust | | | 82,833,981 | |
| | 223,679 | | | PS Business Parks, Inc. | | | 30,221,270 | |
| | 1,242,799 | | | RLJ Lodging Trust | | | 25,079,684 | |
| | 471,858 | | | Terreno Realty Corp. | | | 17,104,853 | |
| | | | | | | | |
| | | | | | | 522,814,529 | |
| | |
| Food & Staples Retailing – 0.2% | | | |
| | 429,219 | | | SpartanNash Co. | | | 10,575,956 | |
| | |
| Food Products – 1.8% | | | |
| | 1,329,116 | | | Snyder’s-Lance, Inc. | | | 47,210,200 | |
| | 710,997 | | | The Hain Celestial Group, Inc.* | | | 28,596,300 | |
| | 3,266,014 | | | The Simply Good Foods Co.* | | | 38,702,266 | |
| | | | | | | | |
| | | | | | | 114,508,766 | |
| | |
| Common Stocks – (continued) | |
| Gas Utilities – 1.8% | | | |
| | 163,746 | | | Chesapeake Utilities Corp. | | | 13,009,620 | |
| | 1,235,868 | | | New Jersey Resources Corp. | | | 53,945,638 | |
| | 1,463,175 | | | South Jersey Industries, Inc. | | | 52,498,719 | |
| | | | | | | | |
| | | | | | | 119,453,977 | |
| | |
| Health Care Equipment & Supplies – 2.4% | | | |
| | 637,213 | | | CONMED Corp. | | | 31,605,765 | |
| | 884,191 | | | Halyard Health, Inc.* | | | 40,045,010 | |
| | 123,550 | | | ICU Medical, Inc.* | | | 21,540,943 | |
| | 610,821 | | | Integra LifeSciences Holdings Corp.* | | | 31,145,763 | |
| | 455,861 | | | Quidel Corp.* | | | 15,927,783 | |
| | 575,819 | | | Wright Medical Group NV*(a) | | | 17,044,242 | |
| | | | | | | | |
| | | | | | | 157,309,506 | |
| | |
| Health Care Providers & Services – 1.4% | | | |
| | 645,605 | | | Acadia Healthcare Co., Inc.* | | | 30,304,699 | |
| | 379,909 | | | Almost Family, Inc.* | | | 18,501,568 | |
| | 433,139 | | | American Renal Associates Holdings, Inc.*(a) | | | 6,206,882 | |
| | 536,599 | | | AMN Healthcare Services, Inc.* | | | 20,041,973 | |
| | 1,578,574 | | | Kindred Healthcare, Inc. | | | 12,786,449 | |
| | | | | | | | |
| | | | | | | 87,841,571 | |
| | |
| Health Care Technology* – 0.8% | | | |
| | 2,713,162 | | | Allscripts Healthcare Solutions, Inc. | | | 35,650,949 | |
| | 1,077,830 | | | HMS Holdings Corp. | | | 19,099,147 | |
| | | | | | | | |
| | | | | | | 54,750,096 | |
| | |
| Hotels, Restaurants & Leisure – 3.3% | | | |
| | 1,166,030 | | | Boyd Gaming Corp. | | | 30,829,833 | |
| | 335,100 | | | Del Taco Restaurants, Inc.* | | | 4,718,208 | |
| | 1,512,035 | | | Extended Stay America, Inc. | | | 29,620,766 | |
| | 1,631,351 | | | Hilton Grand Vacations, Inc.* | | | 59,136,474 | |
| | 196,627 | | | ILG, Inc. | | | 5,190,953 | |
| | 263,867 | | | Marriott Vacations Worldwide Corp. | | | 30,703,564 | |
| | 558,006 | | | Red Rock Resorts, Inc. Class A | | | 12,610,936 | |
| | 133,722 | | | Vail Resorts, Inc. | | | 30,481,930 | |
| | 339,206 | | | Wingstop, Inc. | | | 10,993,666 | |
| | | | | | | | |
| | | | | | | 214,286,330 | |
| | |
| Household Durables* – 1.1% | | | |
| | 255,276 | | | Meritage Homes Corp. | | | 10,389,733 | |
| | 577,388 | | | Taylor Morrison Home Corp. Class A | | | 11,674,785 | |
| | 606,973 | | | TopBuild Corp. | | | 36,023,848 | |
| | 447,096 | | | William Lyon Homes Class A | | | 10,725,833 | |
| | | | | | | | |
| | | | | | | 68,814,199 | |
| | |
| Household Products(a) – 0.2% | | | |
| | 103,543 | | | Spectrum Brands Holdings, Inc. | | | 11,385,588 | |
| | |
| Insurance – 4.4% | | | |
| | 346,775 | | | AMERISAFE, Inc. | | | 18,656,495 | |
| | 2,548,688 | | | CNO Financial Group, Inc. | | | 56,963,177 | |
| | 115,686 | | | Enstar Group Ltd.* | | | 24,010,629 | |
| | |
| | |
| 56 | | The accompanying notes are an integral part of these financial statements. |
GOLDMAN SACHS SMALL CAP VALUE FUND
| | | | | | | | |
| Shares | | | Description | | Value | |
| Common Stocks – (continued) | |
| Insurance – (continued) | | | |
| | 507,398 | | | James River Group Holdings Ltd. | | $ | 20,235,032 | |
| | 588,525 | | | Kinsale Capital Group, Inc. | | | 22,275,671 | |
| | 775,117 | | | Maiden Holdings Ltd. | | | 5,619,598 | |
| | 642,644 | | | National General Holdings Corp. | | | 11,034,198 | |
| | 388,415 | | | Primerica, Inc. | | | 29,733,168 | |
| | 535,924 | | | ProAssurance Corp. | | | 28,537,953 | |
| | 529,415 | | | RLI Corp. | | | 28,334,291 | |
| | 775,546 | | | Selective Insurance Group, Inc. | | | 39,087,519 | |
| | | | | | | | |
| | | | | | | 284,487,731 | |
| | |
| Internet Software & Services* – 0.5% | | | |
| | 854,176 | | | Cornerstone OnDemand, Inc. | | | 29,879,076 | |
| | |
| IT Services – 0.4% | | | |
| | 703,996 | | | Convergys Corp. | | | 16,543,906 | |
| | 190,740 | | | DST Systems, Inc. | | | 9,790,684 | |
| | | | | | | | |
| | | | | | | 26,334,590 | |
| | |
| Machinery – 4.3% | | | |
| | 455,699 | | | CIRCOR International, Inc. | | | 21,882,666 | |
| | 1,639,224 | | | Federal Signal Corp. | | | 30,637,096 | |
| | 789,835 | | | ITT, Inc. | | | 31,877,741 | |
| | 602,850 | | | Kennametal, Inc. | | | 21,099,750 | |
| | 150,472 | | | RBC Bearings, Inc.* | | | 16,592,547 | |
| | 1,393,327 | | | Rexnord Corp.* | | | 33,272,649 | |
| | 176,966 | | | Standex International Corp. | | | 16,891,405 | |
| | 249,765 | | | Tennant Co. | | | 15,223,177 | |
| | 758,625 | | | Terex Corp. | | | 29,244,994 | |
| | 105,440 | | | The Greenbrier Cos., Inc.(a) | | | 4,523,376 | |
| | 1,316,853 | | | TriMas Corp.* | | | 31,867,843 | |
| | 420,335 | | | Watts Water Technologies, Inc. Class A | | | 25,934,669 | |
| | | | | | | | |
| | | | | | | 279,047,913 | |
| | |
| Media – 1.8% | | | |
| | 1,230,184 | | | Live Nation Entertainment, Inc.* | | | 49,158,153 | |
| | 309,061 | | | MSG Networks, Inc. Class A* | | | 6,629,358 | |
| | 649,452 | | | Nexstar Media Group, Inc. Class A | | | 39,097,010 | |
| | 1,422,988 | | | WideOpenWest, Inc.* | | | 22,824,728 | |
| | | | | | | | |
| | | | | | | 117,709,249 | |
| | |
| Metals & Mining – 2.0% | | | |
| | 1,113,806 | | | AK Steel Holding Corp.*(a) | | | 6,237,314 | |
| | 209,079 | | | Allegheny Technologies, Inc.(a) | | | 4,355,116 | |
| | 87,999 | | | Carpenter Technology Corp. | | | 3,566,600 | |
| | 616,966 | | | Century Aluminum Co.* | | | 12,043,176 | |
| | 1,612,919 | | | Cleveland-Cliffs, Inc.* | | | 13,484,003 | |
| | 2,086,951 | | | Commercial Metals Co. | | | 39,422,504 | |
| | 1,879,075 | | | Hecla Mining Co. | | | 9,921,516 | |
| | 201,172 | | | Kaiser Aluminum Corp. | | | 19,376,887 | |
| | 155,451 | | | Royal Gold, Inc. | | | 14,500,469 | |
| | 971,385 | | | Ryerson Holding Corp.* | | | 8,353,911 | |
| | | | | | | | |
| | | | | | | 131,261,496 | |
| | |
| Mortgage Real Estate Investment Trusts (REITs) – 2.6% | |
| | 1,464,686 | | | Blackstone Mortgage Trust, Inc. Class A | | | 45,917,906 | |
| | |
| Common Stocks – (continued) | |
| Mortgage Real Estate Investment Trusts (REITs) – (continued) | |
| | 1,797,286 | | | Granite Point Mortgage Trust, Inc.* | | | 34,400,054 | |
| | 1,961,723 | | | PennyMac Mortgage Investment Trust | | | 33,918,191 | |
| | 5,047,760 | | | Two Harbors Investment Corp. | | | 51,638,585 | |
| | | | | | | | |
| | | | | | | 165,874,736 | |
| | |
| Multi-Utilities – 1.4% | | | |
| | 1,288,535 | | | Black Hills Corp. | | | 90,687,093 | |
| | |
| Oil, Gas & Consumable Fuels – 5.1% | | | |
| | 4,811,184 | | | Callon Petroleum Co.* | | | 49,843,866 | |
| | 1,076,189 | | | CONSOL Energy, Inc.* | | | 15,658,550 | |
| | 2,090,085 | | | Golar LNG Ltd.(a) | | | 45,313,043 | |
| | 1,298,871 | | | Jagged Peak Energy, Inc.*(a) | | | 16,638,537 | |
| | 2,033,981 | | | Oasis Petroleum, Inc.* | | | 14,848,061 | |
| | 693,751 | | | PDC Energy, Inc.* | | | 27,285,227 | |
| | 1,626,394 | | | Rice Energy, Inc.* | | | 44,498,140 | |
| | 1,835,941 | | | RSP Permian, Inc.* | | | 57,611,829 | |
| | 2,604,645 | | | SRC Energy, Inc.* | | | 20,550,649 | |
| | 3,720,766 | | | WPX Energy, Inc.* | | | 37,170,452 | |
| | | | | | | | |
| | | | | | | 329,418,354 | |
| | |
| Paper & Forest Products – 0.3% | | | |
| | 636,219 | | | KapStone Paper & Packaging Corp. | | | 14,232,219 | |
| | 394,326 | | | Mercer International, Inc. | | | 4,357,302 | |
| | | | | | | | |
| | | | | | | 18,589,521 | |
| | |
| Pharmaceuticals* – 0.3% | | | |
| | 740,857 | | | Impax Laboratories, Inc. | | | 16,039,554 | |
| | 130,517 | | | Prestige Brands Holdings, Inc. | | | 6,618,517 | |
| | | | | | | | |
| | | | | | | 22,658,071 | |
| | |
| Professional Services* – 0.5% | | | |
| | 685,021 | | | On Assignment, Inc. | | | 32,675,502 | |
| | |
| Real Estate Management & Development – 0.6% | | | |
| | 1,975,987 | | | Kennedy-Wilson Holdings, Inc. | | | 38,136,549 | |
| | |
| Road & Rail – 1.6% | | | |
| | 95,278 | | | ArcBest Corp. | | | 2,829,757 | |
| | 1,008,806 | | | Knight Transportation, Inc.(a) | | | 39,393,874 | |
| | 940,242 | | | Marten Transport Ltd. | | | 16,125,150 | |
| | 559,531 | | | Saia, Inc.* | | | 31,641,478 | |
| | 454,431 | | | Swift Transportation Co.* | | | 12,746,790 | |
| | | | | | | | |
| | | | | | | 102,737,049 | |
| | |
| Semiconductors & Semiconductor Equipment – 1.9% | | | |
| | 1,156,905 | | | Cree, Inc.* | | | 28,147,499 | |
| | 1,920,106 | | | Cypress Semiconductor Corp.(a) | | | 26,286,251 | |
| | 1,588,480 | | | Entegris, Inc.* | | | 40,426,816 | |
| | 691,263 | | | Semtech Corp.* | | | 25,991,489 | |
| | | | | | | | |
| | | | | | | 120,852,055 | |
| | |
| Software* – 1.7% | | | |
| | 756,546 | | | Bottomline Technologies de, Inc. | | | 22,930,909 | |
| | 586,492 | | | CommVault Systems, Inc. | | | 35,805,337 | |
| | 1,377,211 | | | Verint Systems, Inc. | | | 54,675,277 | |
| | | | | | | | |
| | | | | | | 113,411,523 | |
| | |
| | |
| The accompanying notes are an integral part of these financial statements. | | 57 |
GOLDMAN SACHS SMALL CAP VALUE FUND
Schedule of Investments (continued)
August 31, 2017
| | | | | | | | |
| Shares | | | Description | | Value | |
| Common Stocks – (continued) | |
| Specialty Retail – 2.2% | | | |
| | 119,442 | | | Abercrombie & Fitch Co. Class A | | $ | 1,521,691 | |
| | 1,523,059 | | | American Eagle Outfitters, Inc. | | | 18,200,555 | |
| | 358,387 | | | Boot Barn Holdings, Inc.* | | | 2,902,935 | |
| | 401,562 | | | Burlington Stores, Inc.* | | | 34,988,097 | |
| | 336,851 | | | Lithia Motors, Inc. Class A | | | 36,379,908 | |
| | 3,897,825 | | | Office Depot, Inc. | | | 16,721,669 | |
| | 643,257 | | | Party City Holdco, Inc.*(a) | | | 8,973,435 | |
| | 217,239 | | | The Children’s Place, Inc. | | | 23,059,920 | |
| | | | | | | | |
| | | | | | | 142,748,210 | |
| | |
| Textiles, Apparel & Luxury Goods – 0.4% | | | |
| | 181,485 | | | Columbia Sportswear Co. | | | 10,397,276 | |
| | 491,654 | | | Wolverine World Wide, Inc. | | | 12,930,500 | |
| | | | | | | | |
| | | | | | | 23,327,776 | |
| | |
| Thrifts & Mortgage Finance – 2.6% | | | |
| | 4,677,750 | | | MGIC Investment Corp.* | | | 53,560,237 | |
| | 852,766 | | | OceanFirst Financial Corp. | | | 21,285,039 | |
| | 397,818 | | | Oritani Financial Corp. | | | 6,384,979 | |
| | 1,088,230 | | | Provident Financial Services, Inc. | | | 27,042,516 | |
| | 1,207,725 | | | Washington Federal, Inc. | | | 37,741,406 | |
| | 526,271 | | | WSFS Financial Corp. | | | 23,524,314 | |
| | | | | | | | |
| | | | | | | 169,538,491 | |
| | |
| Trading Companies & Distributors – 2.6% | | | |
| | 1,206,819 | | | Beacon Roofing Supply, Inc.* | | | 56,841,175 | |
| | 1,289,997 | | | Foundation Building Materials, Inc.* | | | 16,847,361 | |
| | 608,725 | | | Herc Holdings, Inc.*(a) | | | 25,700,370 | |
| | 567,533 | | | Kaman Corp. | | | 27,831,818 | |
| | 1,401,950 | | | Univar, Inc.* | | | 39,549,009 | |
| | | | | | | | |
| | | | | | | 166,769,733 | |
| | |
| | TOTAL COMMON STOCKS | | | | |
| | (Cost $5,181,842,551) | | $ | 6,444,512,486 | |
| | |
| | | | | | | | |
| Exchange Traded Funds – 0.3% | |
| | 167,255 | | | iShares Russell 2000 Value ETF (Cost $19,259,095) | | $ | 19,431,686 | |
| | |
| TOTAL INVESTMENTS BEFORE SECURITIES LENDING
REINVESTMENT VEHICLE |
|
| | (Cost $5,201,101,646) | | $ | 6,463,944,172 | |
| | |
| Shares | | | Distribution
Rate | | Value | |
| Securities Lending Reinvestment Vehicle(b) – 1.5% | |
| Goldman Sachs Financial Square Government Fund –
Institutional Shares |
|
| | 93,690,576 | | | 0.927% | | | 93,690,576 | |
| | (Cost $93,690,576) | | | | |
| | |
| | TOTAL INVESTMENTS – 101.2% | | | | |
| | (Cost $5,294,792,222) | | $ | 6,557,634,748 | |
| | |
| LIABILITIES IN EXCESS OF
OTHER ASSETS – (1.2)% | | | (76,678,276 | ) |
| | |
| | NET ASSETS – 100.0% | | $ | 6,480,956,472 | |
| | |
| | |
| The percentage shown for each investment category reflects the value of investments in that category as a percentage of net assets. |
* | | Non-income producing security. |
(a) | | All or a portion of security is on loan. |
(b) | | Represents an Affiliated fund. |
| | |
|
Investment Abbreviations: |
ETF | | —Exchange Traded Fund |
PLC | | —Public Limited Company |
|
| | |
| 58 | | The accompanying notes are an integral part of these financial statements. |
GOLDMAN SACHS SMALL/MID CAP VALUE FUND
Schedule of Investments
August 31, 2017
| | | | | | | | |
| Shares | | | Description | | Value | |
| Common Stocks – 99.1% | | | |
| Aerospace & Defense – 1.6% | | | |
| | 3,545 | | | Curtiss-Wright Corp. | | $ | 343,227 | |
| | 3,580 | | | Huntington Ingalls Industries, Inc. | | | 765,977 | |
| | 12,635 | | | KLX, Inc.* | | | 605,722 | |
| | | | | | | | |
| | | | | | | 1,714,926 | |
| | |
| Air Freight & Logistics* – 1.2% | | | |
| | 22,149 | | | XPO Logistics, Inc. | | | 1,355,519 | |
| | |
| Airlines – 0.5% | | | |
| | 5,019 | | | JetBlue Airways Corp.* | | | 99,426 | |
| | 12,838 | | | SkyWest, Inc. | | | 445,479 | |
| | 1,158 | | | Spirit Airlines, Inc.* | | | 39,430 | |
| | | | | | | | |
| | | | | | | 584,335 | |
| | |
| Automobiles – 0.3% | | | |
| | 2,984 | | | Thor Industries, Inc. | | | 324,182 | |
| | |
| Banks – 11.7% | | | |
| | 10,179 | | | Bank of Hawaii Corp. | | | 795,285 | |
| | 11,828 | | | Bank of the Ozarks, Inc. | | | 508,131 | |
| | 9,090 | | | BOK Financial Corp. | | | 731,563 | |
| | 14,847 | | | Commerce Bancshares, Inc. | | | 816,437 | |
| | 23,129 | | | East West Bancorp, Inc. | | | 1,280,653 | |
| | 5,581 | | | First Republic Bank | | | 541,636 | |
| | 15,864 | | | Glacier Bancorp, Inc. | | | 526,843 | |
| | 18,250 | | | Home BancShares, Inc. | | | 425,408 | |
| | 10,354 | | | MB Financial, Inc. | | | 411,779 | |
| | 18,566 | | | PacWest Bancorp | | | 838,255 | |
| | 13,162 | | | Pinnacle Financial Partners, Inc. | | | 818,676 | |
| | 11,407 | | | Prosperity Bancshares, Inc. | | | 681,568 | |
| | 8,213 | | | Signature Bank* | | | 1,054,056 | |
| | 8,669 | | | South State Corp. | | | 713,025 | |
| | 24,849 | | | Synovus Financial Corp. | | | 1,046,640 | |
| | 7,756 | | | Texas Capital Bancshares, Inc.* | | | 575,883 | |
| | 21,444 | | | Webster Financial Corp. | | | 1,001,006 | |
| | | | | | | | |
| | | | | | | 12,766,844 | |
| | |
| Building Products – 0.6% | | | |
| | 3,931 | | | Fortune Brands Home & Security, Inc. | | | 245,805 | |
| | 13,478 | | | JELD-WEN Holding, Inc.* | | | 411,349 | |
| | | | | | | | |
| | | | | | | 657,154 | |
| | |
| Capital Markets – 2.0% | | | |
| | 30,815 | | | E*TRADE Financial Corp.* | | | 1,263,723 | |
| | 18,566 | | | OM Asset Management PLC | | | 262,338 | |
| | 10,845 | | | Stifel Financial Corp. | | | 517,849 | |
| | 9,757 | | | Virtu Financial, Inc. Class A | | | 175,138 | |
| | | | | | | | |
| | | | | | | 2,219,048 | |
| | |
| Chemicals – 2.9% | | | |
| | 28,464 | | | Huntsman Corp. | | | 756,289 | |
| | 3,967 | | | Ingevity Corp.* | | | 249,802 | |
| | 6,857 | | | Minerals Technologies, Inc. | | | 438,848 | |
| | 13,513 | | | Olin Corp. | | | 435,524 | |
| | 7,476 | | | The Chemours Co. | | | 366,847 | |
| | 11,758 | | | Westlake Chemical Corp. | | | 904,308 | |
| | | | | | | | |
| | | | | | | 3,151,618 | |
| | |
| Commercial Services & Supplies – 0.4% | | | |
| | 6,879 | | | Waste Connections, Inc. | | | 458,760 | |
| | |
| Common Stocks – (continued) | | | |
| Communications Equipment* – 1.3% | | | |
| | 16,566 | | | ARRIS International PLC | | | 461,529 | |
| | 17,619 | | | CommScope Holding Co., Inc. | | | 582,484 | |
| | 13,162 | | | NetScout Systems, Inc. | | | 431,055 | |
| | | | | | | | |
| | | | | | | 1,475,068 | |
| | |
| Construction & Engineering – 1.1% | | | |
| | 12,881 | | | Jacobs Engineering Group, Inc. | | | 701,885 | |
| | 3,545 | | | Valmont Industries, Inc. | | | 508,885 | |
| | | | | | | | |
| | | | | | | 1,210,770 | |
| | |
| Construction Materials – 1.0% | | | |
| | 5,651 | | | Eagle Materials, Inc. | | | 549,560 | |
| | 112 | | | Martin Marietta Materials, Inc. | | | 23,743 | |
| | 16,476 | | | Summit Materials, Inc. Class A* | | | 486,701 | |
| | | | | | | | |
| | | | | | | 1,060,004 | |
| | |
| Containers & Packaging – 0.8% | | | |
| | 9,967 | | | Ardagh Group SA | | | 207,214 | |
| | 12,284 | | | Berry Global Group, Inc.* | | | 690,852 | |
| | | | | | | | |
| | | | | | | 898,066 | |
| | |
| Electric Utilities – 2.9% | | | |
| | 24,392 | | | Alliant Energy Corp. | | | 1,042,514 | |
| | 7,617 | | | IDACORP, Inc. | | | 677,761 | |
| | 16,671 | | | Pinnacle West Capital Corp. | | | 1,499,890 | |
| | | | | | | | |
| | | | | | | 3,220,165 | |
| | |
| Electrical Equipment – 0.5% | | | |
| | 5,265 | | | Hubbell, Inc. | | | 593,839 | |
| | |
| Electronic Equipment, Instruments & Components – 1.8% | |
| | 20,742 | | | Keysight Technologies, Inc.* | | | 847,518 | |
| | 5,721 | | | SYNNEX Corp. | | | 684,289 | |
| | 3,686 | | | Tech Data Corp.* | | | 406,529 | |
| | | | | | | | |
| | | | | | | 1,938,336 | |
| | |
| Energy Equipment & Services – 0.2% | | | |
| | 13,864 | | | Patterson-UTI Energy, Inc. | | | 221,408 | |
| | |
| Equity Real Estate Investment Trusts (REITs) – 11.5% | | | |
| | 60,646 | | | Brixmor Property Group, Inc. | | | 1,135,293 | |
| | 44,503 | | | Columbia Property Trust, Inc. | | | 934,563 | |
| | 51,557 | | | Empire State Realty Trust, Inc. Class A | | | 1,049,185 | |
| | 11,617 | | | Federal Realty Investment Trust | | | 1,474,546 | |
| | 21,339 | | | Highwoods Properties, Inc. | | | 1,114,536 | |
| | 5,581 | | | Life Storage, Inc. | | | 410,706 | |
| | 29,902 | | | Mid-America Apartment Communities, Inc. | | | 3,183,367 | |
| | 9,698 | | | National Health Investors, Inc. | | | 777,585 | |
| | 38,466 | | | Pebblebrook Hotel Trust | | | 1,292,073 | |
| | 3,089 | | | PS Business Parks, Inc. | | | 417,355 | |
| | 36,255 | | | RLJ Lodging Trust | | | 731,626 | |
| | | | | | | | |
| | | | | | | 12,520,835 | |
| | |
| Food & Staples Retailing* – 0.4% | | | |
| | 16,063 | | | US Foods Holding Corp. | | | 440,929 | |
| | |
| | |
| The accompanying notes are an integral part of these financial statements. | | 59 |
GOLDMAN SACHS SMALL/MID CAP VALUE FUND
Schedule of Investments (continued)
August 31, 2017
| | | | | | | | |
| Shares | | | Description | | Value | |
| Common Stocks – (continued) | | | |
| Food Products – 1.0% | | | |
| | 913 | | | Pinnacle Foods, Inc. | | $ | 54,150 | |
| | 10,494 | | | Snyder’s-Lance, Inc. | | | 372,747 | |
| | 17,128 | | | The Hain Celestial Group, Inc.* | | | 688,888 | |
| | | | | | | | |
| | | | | | | 1,115,785 | |
| | |
| Gas Utilities – 2.0% | | | |
| | 16,426 | | | Atmos Energy Corp. | | | 1,446,145 | |
| | 15,794 | | | New Jersey Resources Corp. | | | 689,408 | |
| | | | | | | | |
| | | | | | | 2,135,553 | |
| | |
| Health Care Equipment & Supplies – 1.8% | | | |
| | 4,528 | | | Hill-Rom Holdings, Inc. | | | 348,475 | |
| | 7,020 | | | NuVasive, Inc.* | | | 438,610 | |
| | 7,160 | | | STERIS PLC | | | 624,065 | |
| | 2,555 | | | Teleflex, Inc. | | | 541,021 | |
| | | | | | | | |
| | | | | | | 1,952,171 | |
| | |
| Health Care Providers & Services – 1.9% | | | |
| | 21,128 | | | Acadia Healthcare Co., Inc.* | | | 991,748 | |
| | 11,652 | | | Envision Healthcare Corp.* | | | 610,681 | |
| | 6,002 | | | MEDNAX, Inc.* | | | 269,190 | |
| | 6,739 | | | Patterson Cos., Inc. | | | 259,452 | |
| | | | | | | | |
| | | | | | | 2,131,071 | |
| | |
| Health Care Technology* – 0.6% | | | |
| | 27,516 | | | Allscripts Healthcare Solutions, Inc. | | | 361,560 | |
| | 2,317 | | | athenahealth, Inc. | | | 326,535 | |
| | | | | | | | |
| | | | | | | 688,095 | |
| | |
| Hotels, Restaurants & Leisure – 2.7% | | | |
| | 28,779 | | | Hilton Grand Vacations, Inc.* | | | 1,043,239 | |
| | 8,143 | | | ILG, Inc. | | | 214,975 | |
| | 2,423 | | | Marriott Vacations Worldwide Corp. | | | 281,940 | |
| | 28,850 | | | MGM Resorts International | | | 950,896 | |
| | 1,931 | | | Vail Resorts, Inc. | | | 440,172 | |
| | | | | | | | |
| | | | | | | 2,931,222 | |
| | |
| Household Durables – 0.5% | | | |
| | 15,969 | | | D.R. Horton, Inc. | | | 577,279 | |
| | |
| Household Products(a) – 0.2% | | | |
| | 2,141 | | | Spectrum Brands Holdings, Inc. | | | 235,424 | |
| | |
| Industrial Conglomerates – 0.9% | | | |
| | 10,179 | | | Carlisle Cos., Inc. | | | 963,849 | |
| | |
| Insurance – 6.7% | | | |
| | 13,933 | | | American Financial Group, Inc. | | | 1,418,519 | |
| | 11,723 | | | Arch Capital Group Ltd.* | | | 1,141,117 | |
| | 31,306 | | | CNO Financial Group, Inc. | | | 699,689 | |
| | 6,353 | | | Primerica, Inc. | | | 486,322 | |
| | 11,828 | | | ProAssurance Corp. | | | 629,841 | |
| | 7,721 | | | The Hanover Insurance Group, Inc. | | | 758,048 | |
| | 11,442 | | | Torchmark Corp. | | | 880,691 | |
| | 6,488 | | | Validus Holdings Ltd. | | | 325,373 | |
| | 14,004 | | | W.R. Berkley Corp. | | | 933,226 | |
| | | | | | | | |
| | | | | | | 7,272,826 | |
| | |
| Common Stocks – (continued) | | | |
| Internet & Direct Marketing Retail* – 1.1% | | | |
| | 12,214 | | | Liberty Expedia Holdings, Inc. Class A | | | 667,984 | |
| | 8,213 | | | Liberty Ventures Series A | | | 505,592 | |
| | | | | | | | |
| | | | | | | 1,173,576 | |
| | |
| Internet Software & Services* – 0.8% | | | |
| | 13,829 | | | Cornerstone OnDemand, Inc. | | | 483,738 | |
| | 3,072 | | | IAC/InterActiveCorp. | | | 348,703 | |
| | | | | | | | |
| | | | | | | 832,441 | |
| | |
| IT Services – 1.7% | | | |
| | 11,477 | | | Booz Allen Hamilton Holding Corp. | | | 391,481 | |
| | 10,916 | | | DST Systems, Inc. | | | 560,318 | |
| | 10,494 | | | Leidos Holdings, Inc. | | | 612,010 | |
| | 4,493 | | | Total System Services, Inc. | | | 310,556 | |
| | | | | | | | |
| | | | | | | 1,874,365 | |
| | |
| Leisure Products – 0.4% | | | |
| | 7,968 | | | Brunswick Corp. | | | 418,161 | |
| | |
| Life Sciences Tools & Services – 0.7% | | | |
| | 11,126 | | | PerkinElmer, Inc. | | | 745,331 | |
| | |
| Machinery – 4.5% | | | |
| | 26,954 | | | Colfax Corp.* | | | 1,074,926 | |
| | 14,671 | | | Flowserve Corp. | | | 576,277 | |
| | 16,461 | | | ITT, Inc. | | | 664,366 | |
| | 18,496 | | | Terex Corp. | | | 713,021 | |
| | 35,729 | | | Trinity Industries, Inc. | | | 1,030,424 | |
| | 13,617 | | | Xylem, Inc. | | | 845,207 | |
| | | | | | | | |
| | | | | | | 4,904,221 | |
| | |
| Media – 1.9% | | | |
| | 3,790 | | | Liberty Broadband Corp. Class C* | | | 384,799 | |
| | 23,445 | | | Live Nation Entertainment, Inc.* | | | 936,862 | |
| | 12,319 | | | Nexstar Media Group, Inc. Class A | | | 741,604 | |
| | | | | | | | |
| | | | | | | 2,063,265 | |
| | |
| Metals & Mining – 3.1% | | | |
| | 15,302 | | | Alcoa Corp. | | | 671,452 | |
| | 25,270 | | | Commercial Metals Co. | | | 477,350 | |
| | 3,790 | | | Reliance Steel & Aluminum Co. | | | 274,472 | |
| | 5,475 | | | Royal Gold, Inc. | | | 510,708 | |
| | 39,097 | | | Steel Dynamics, Inc. | | | 1,346,891 | |
| | 5,334 | | | United States Steel Corp.(a) | | | 141,938 | |
| | | | | | | | |
| | | | | | | 3,422,811 | |
| | |
| Mortgage Real Estate Investment Trusts (REITs) – 1.7% | | | |
| | 37,483 | | | PennyMac Mortgage Investment Trust | | | 648,081 | |
| | 22,567 | | | Starwood Property Trust, Inc. | | | 501,213 | |
| | 71,738 | | | Two Harbors Investment Corp. | | | 733,880 | |
| | | | | | | | |
| | | | | | | 1,883,174 | |
| | |
| Multi-Utilities – 1.3% | | | |
| | 13,302 | | | CMS Energy Corp. | | | 645,679 | |
| | 11,687 | | | Vectren Corp. | | | 766,784 | |
| | | | | | | | |
| | | | | | | 1,412,463 | |
| | |
| | |
| 60 | | The accompanying notes are an integral part of these financial statements. |
GOLDMAN SACHS SMALL/MID CAP VALUE FUND
| | | | | | | | |
| Shares | | | Description | | Value | |
| Common Stocks – (continued) | | | |
| Multiline Retail – 0.5% | | | |
| | 14,355 | | | Kohl’s Corp. | | $ | 571,042 | |
| | |
| Oil, Gas & Consumable Fuels – 6.4% | | | |
| | 7,546 | | | Andeavor | | | 755,732 | |
| | 41,835 | | | Callon Petroleum Co.* | | | 433,411 | |
| | 12,846 | | | Cheniere Energy, Inc.* | | | 549,680 | |
| | 13,372 | | | EQT Corp. | | | 833,610 | |
| | 25,305 | | | Golar LNG Ltd. | | | 548,612 | |
| | 37,694 | | | Parsley Energy, Inc. Class A* | | | 944,235 | |
| | 14,284 | | | Plains GP Holdings LP Class A | | | 321,104 | |
| | 29,201 | | | RSP Permian, Inc.* | | | 916,327 | |
| | 19,233 | | | Targa Resources Corp. | | | 857,215 | |
| | 80,651 | | | WPX Energy, Inc.* | | | 805,704 | |
| | | | | | | | |
| | | | | | | 6,965,630 | |
| | |
| Personal Products* – 0.4% | | | |
| | 5,300 | | | Edgewell Personal Care Co. | | | 402,482 | |
| | |
| Pharmaceuticals* – 0.3% | | | |
| | 7,968 | | | Catalent, Inc. | | | 328,999 | |
| | |
| Real Estate Management & Development – 0.5% | | | |
| | 27,656 | | | Kennedy-Wilson Holdings, Inc. | | | 533,761 | |
| | |
| Road & Rail – 2.0% | | | |
| | 23,725 | | | Knight Transportation, Inc.(a) | | | 926,461 | |
| | 3,088 | | | Landstar System, Inc. | | | 288,265 | |
| | 7,933 | | | Old Dominion Freight Line, Inc. | | | 792,507 | |
| | 7,719 | | | Swift Transportation Co.* | | | 216,518 | |
| | | | | | | | |
| | | | | | | 2,223,751 | |
| | |
| Semiconductors & Semiconductor Equipment – 2.7% | | | |
| | 60,822 | | | Cypress Semiconductor Corp. | | | 832,653 | |
| | 64,402 | | | Marvell Technology Group Ltd. | | | 1,153,440 | |
| | 5,265 | | | Microchip Technology, Inc. | | | 457,002 | |
| | 14,355 | | | Versum Materials, Inc. | | | 530,130 | |
| | | | | | | | |
| | | | | | | 2,973,225 | |
| | |
| Software – 2.1% | | | |
| | 46,082 | | | Nuance Communications, Inc.* | | | 740,538 | |
| | 19,479 | | | SS&C Technologies Holdings, Inc. | | | 754,032 | |
| | 20,321 | | | Verint Systems, Inc.* | | | 806,743 | |
| | | | | | | | |
| | | | | | | 2,301,313 | |
| | |
| Specialty Retail – 1.5% | | | |
| | 30,233 | | | American Eagle Outfitters, Inc. | | | 361,284 | |
| | 9,231 | | | Burlington Stores, Inc.* | | | 804,297 | |
| | 3,370 | | | Lithia Motors, Inc. Class A | | | 363,960 | |
| | 18,530 | | | Office Depot, Inc. | | | 79,494 | |
| | | | | | | | |
| | | | | | | 1,609,035 | |
| | |
| Textiles, Apparel & Luxury Goods – 0.4% | | | |
| | 5,230 | | | Carter’s, Inc. | | | 453,493 | |
| | |
| Thrifts & Mortgage Finance – 1.0% | | | |
| | 55,382 | | | MGIC Investment Corp.* | | | 634,124 | |
| | 14,039 | | | Washington Federal, Inc. | | | 438,719 | |
| | | | | | | | |
| | | | | | | 1,072,843 | |
| | |
| Common Stocks – (continued) | | | |
| Trading Companies & Distributors* – 2.5% | | | |
| | 13,907 | | | Beacon Roofing Supply, Inc. | | | 655,020 | |
| | 9,687 | | | United Rentals, Inc. | | | 1,143,647 | |
| | 33,377 | | | Univar, Inc. | | | 941,565 | |
| | | | | | | | |
| | | | | | | 2,740,232 | |
| | |
| Water Utilities – 0.6% | | | |
| | 20,918 | | | Aqua America, Inc. | | | 698,661 | |
| | |
| | TOTAL COMMON STOCKS | | | | |
| | (Cost $104,538,945) | | $ | 108,419,356 | |
| | |
| | | | | | | | |
| Shares | | | Distribution
Rate | | Value | |
| Investment Companies(b) – 0.0% | |
| Goldman Sachs Financial Square Government Fund –
Institutional Shares |
|
| | 39 | | | 0.927% | | $ | 39 | |
| | (Cost $39) | | | | |
| | |
| TOTAL INVESTMENTS BEFORE SECURITIES LENDING
REINVESTMENT VEHICLE |
|
| | (Cost $104,538,984) | | $ | 108,419,395 | |
| | |
| | | | | | | | |
| Securities Lending Reinvestment Vehicle(b) – 0.9% | |
| Goldman Sachs Financial Square Government Fund –
Institutional Shares |
|
| | 952,271 | | | 0.927% | | $ | 952,271 | |
| | (Cost $952,271) | | | | |
| | |
| | TOTAL INVESTMENTS – 100.0% | | | | |
| | (Cost $105,491,255) | | $ | 109,371,666 | |
| | |
| LIABILITIES IN EXCESS OF
OTHER ASSETS – (0.0)% | | | (31,177 | ) |
| | |
| | NET ASSETS – 100.0% | | $ | 109,340,489 | |
| | |
| | |
| The percentage shown for each investment category reflects the value of investments in that category as a percentage of net assets. |
* | | Non-income producing security. |
(a) | | All or a portion of security is on loan. |
(b) | | Represents an Affiliated fund. |
| | |
|
Investment Abbreviations: |
GP | | —General Partnership |
LP | | —Limited Partnership |
PLC | | —Public Limited Company |
|
| | |
| The accompanying notes are an integral part of these financial statements. | | 61 |
GOLDMAN SACHS FUNDAMENTAL EQUITY VALUE FUNDS
Statements of Assets and Liabilities
August 31, 2017
| | | | | | |
| | | | | Equity
Income Fund | |
| | Assets: | | | | |
| | Investments of unaffiliated issuers, at value (cost $343,474,445, $4,711,940, $724,685,585, $2,455,404,956, $5,201,101,646 and $104,538,945) | | $ | 382,205,761 | |
| | Investments of affiliated issuers, at value (cost $4,642, $61,761, $11,928,930, $3,199,933, $0 and $39) | | | 4,642 | |
| | Investments in securities lending reinvestment vehicle — affiliated issuer, at value (cost $5,493,780, $95,910, $8,376,426, $50,158,515, $93,690,576 and $952,271) (a) | | | 5,493,780 | |
| | Cash | | | 4,473,825 | |
| | Receivables: | | | | |
| | Dividends and interest | | | 1,679,083 | |
| | Reimbursement from investment adviser | | | 79,088 | |
| | Foreign tax reclaims | | | 41,050 | |
| | Fund shares sold | | | 8,069 | |
| | Securities lending income | | | 1,817 | |
| | Investments sold | | | — | |
| | Other assets | | | 973 | |
| | Total assets | | | 393,988,088 | |
| | | | | | |
| | Liabilities: | | | | |
| | Payables: | | | | |
| | Payable upon return of securities loaned | | | 5,493,780 | |
| | Management fees | | | 228,042 | |
| | Fund shares redeemed | | | 177,073 | |
| | Distribution and Service fees and Transfer Agency fees | | | 141,933 | |
| | Investments purchased | | | 4,642 | |
| | Payable from investment adviser | | | — | |
| | Accrued expenses | | | 126,364 | |
| | Total liabilities | | | 6,171,834 | |
| | | | | | |
| | Net Assets: | | | | |
| | Paid-in capital | | | 433,516,978 | |
| | Undistributed net investment income | | | 1,610,857 | |
| | Accumulated net realized gain (loss) | | | (86,042,897 | ) |
| | Net unrealized gain | | | 38,731,316 | |
| | | NET ASSETS | | $ | 387,816,254 | |
| | | Net Assets: | | | | |
| | | Class A | | $ | 327,650,049 | |
| | | Class C | | | 18,460,354 | |
| | | Institutional | | | 37,414,964 | |
| | | Service | | | 85,568 | |
| | | Investor | | | 2,623,081 | |
| | | Class R | | | 1,570,982 | |
| | | Class R6 | | | 11,256 | |
| | | Total Net Assets | | $ | 387,816,254 | |
| | | Shares Outstanding $0.001 par value (unlimited number of shares authorized): | | | | |
| | | Class A | | | 9,316,316 | |
| | | Class C | | | 551,042 | |
| | | Institutional | | | 1,046,108 | |
| | | Service | | | 2,425 | |
| | | Investor | | | 74,685 | |
| | | Class R | | | 44,915 | |
| | | Class R6 | | | 315 | |
| | | Net asset value, offering and redemption price per share:(b) | | | | |
| | | Class A | | | $35.17 | |
| | | Class C | | | 33.50 | |
| | | Institutional | | | 35.77 | |
| | | Service | | | 35.28 | (c) |
| | | Investor | | | 35.12 | |
| | | Class R | | | 34.98 | |
| | | Class R6 | | | 35.76 | (c) |
| | (a) | | Includes loaned securities having a market value of $5,355,584, $93,886, $8,169,021, $48,940,898, $91,404,781 and $929,329 for the Equity Income, Focused Value, Large Cap Value, Mid Cap Value, Small Cap Value and Small/Mid Cap Value Funds, respectively. |
| | (b) | | Maximum public offering price per share for Class A Shares of the Equity Income, Focused Value, Large Cap Value, Mid Cap Value, Small Cap Value and Small/Mid Cap Value Funds is $37.22, $11.75, $18.25, $40.50, $59.93 and $13.09, respectively. At redemption, Class C Shares may be subject to a contingent deferred sales charge, assessed on the amount equal to the lesser of the current net asset value (“NAV”) or the original purchase price of the shares. |
| | (c) | | Net asset value may not recalculate due to rounding of fractional shares. |
| | |
| 62 | | The accompanying notes are an integral part of these financial statements. |
GOLDMAN SACHS FUNDAMENTAL EQUITY VALUE FUNDS
| | | | | | | | | | | | | | | | | | | | | | | | | | | | |
| | | Focused
Value Fund | | | | | Large Cap
Value Fund | | | | | Mid Cap
Value Fund | | | | | Small Cap
Value Fund | | | | | Small/Mid
Cap Value Fund | |
| | | | | | | | | | | | | | | | | | | | | | | | | | | | |
| | $ | 4,872,526 | | | | | $ | 827,876,283 | | | | | $ | 2,653,727,745 | | | | | $ | 6,463,944,172 | | | | | $ | 108,419,356 | |
| | | 61,761 | | | | | | 11,928,930 | | | | | | 3,199,933 | | | | | | — | | | | | | 39 | |
| |
|
95,910 |
| | | | | 8,376,426 | | | | | | 50,158,515 | | | | | | 93,690,576 | | | | | | 952,271 | |
| | | 74,971 | | | | | | 12,896,816 | | | | | | 40,162,280 | | | | | | 27,332,782 | | | | | | 969,381 | |
| | | | | | | | | | | | | | | | | | | | | | | | | | | | |
| | | 14,061 | | | | | | 2,841,439 | | | | | | 4,018,285 | | | | | | 3,345,537 | | | | | | 114,133 | |
| | | 14,622 | | | | | | 31,079 | | | | | | — | | | | | | 142,888 | | | | | | — | |
| | | 320 | | | | | | 58,868 | | | | | | — | | | | | | — | | | | | | — | |
| | | — | | | | | | 93,042 | | | | | | 304,603 | | | | | | 10,771,988 | | | | | | 251,186 | |
| | | 17 | | | | | | 1,637 | | | | | | 12,600 | | | | | | 36,170 | | | | | | 520 | |
| | | — | | | | | | — | | | | | | 1,385,299 | | | | | | 58,533,389 | | | | | | 734,074 | |
| | | 32 | | | | | | 2,289 | | | | | | 10,511 | | | | | | 24,708 | | | | | | 146 | |
| | | 5,134,220 | | | | | | 864,106,809 | | | | | | 2,752,979,771 | | | | | | 6,657,822,210 | | | | | | 111,441,106 | |
| | | | | | | | | | | | | | | | | | | | | | | | | | | | |
| | | | | | | | | | | | | | | | | | | | | | | | | | | | |
| | | | | | | | | | | | | | | | | | | | | | | | | | | | |
| | | 95,910 | | | | | | 8,376,426 | | | | | | 50,158,515 | | | | | | 93,690,576 | | | | | | 952,271 | |
| | | 2,815 | | | | | | 553,062 | | | | | | 1,701,644 | | | | | | 4,944,950 | | | | | | 74,045 | |
| | | — | | | | | | 680,065 | | | | | | 26,985,558 | | | | | | 7,975,670 | | | | | | 1,288 | |
| | | 247 | | | | | | 111,512 | | | | | | 506,589 | | | | | | 621,033 | | | | | | 5,239 | |
| | | 95 | | | | | | 625 | | | | | | 21,220,899 | | | | | | 69,344,280 | | | | | | 955,135 | |
| | | — | | | | | | — | | | | | | — | | | | | | — | | | | | | 2,134 | |
| | | 50,295 | | | | | | 176,953 | | | | | | 330,047 | | | | | | 289,229 | | | | | | 110,505 | |
| | | 149,362 | | | | | | 9,898,643 | | | | | | 100,903,252 | | | | | | 176,865,738 | | | | | | 2,100,617 | |
| | | | | | | | | | | | | | | | | | | | | | | | | | | | |
| | | | | | | | | | | | | | | | | | | | | | | | | | | | |
| | | 4,472,443 | | | | | | 682,447,259 | | | | | | 2,212,852,564 | | | | | | 4,649,176,383 | | | | | | 101,862,146 | |
| | | 42,096 | | | | | | 9,924,598 | | | | | | 7,044,108 | | | | | | 10,760,962 | | | | | | 614,163 | |
| | | 309,733 | | | | | | 58,645,611 | | | | | | 233,857,058 | | | | | | 558,176,601 | | | | | | 2,983,769 | |
| | | 160,586 | | | | | | 103,190,698 | | | | | | 198,322,789 | | | | | | 1,262,842,526 | | | | | | 3,880,411 | |
| | | $ | 4,984,858 | | | | | $ | 854,208,166 | | | | | $ | 2,652,076,519 | | | | | $ | 6,480,956,472 | | | | | $ | 109,340,489 | |
| | | | | | | | | | | | | | | | | | | | | | | | | | | | | |
| | | $ | 50,081 | | | | | $ | 153,608,104 | | | | | $ | 851,680,910 | | | | | $ | 851,496,722 | | | | | $ | 1,497,035 | |
| | | | 48,457 | | | | | | 39,402,761 | | | | | | 102,928,124 | | | | | | 37,356,837 | | | | | | 1,126,474 | |
| | | | 4,801,643 | | | | | | 645,551,892 | | | | | | 1,424,886,244 | | | | | | 4,393,986,300 | | | | | | 42,084,747 | |
| | | | — | | | | | | 2,913,732 | | | | | | 87,437,905 | | | | | | 145,996,126 | | | | | | — | |
| | | | 28,290 | | | | | | 6,516,488 | | | | | | 77,445,580 | | | | | | 168,986,071 | | | | | | 3,249,585 | |
| | | | 27,995 | | | | | | 6,204,165 | | | | | | 34,193,172 | | | | | | 124,039,144 | | | | | | 131,194 | |
| | | | 28,392 | | | | | | 11,024 | | | | | | 73,504,584 | | | | | | 759,095,272 | | | | | | 61,251,454 | |
| | | | $4,984,858 | | | | | $ | 854,208,166 | | | | | $ | 2,652,076,519 | | | | | $ | 6,480,956,472 | | | | | $ | 109,340,489 | |
| | | | | | | | | | | | | | | | | | | | | | | | | | | | | |
| | | | 4,512 | | | | | | 8,905,973 | | | | | | 22,254,282 | | | | | | 15,035,400 | | | | | | 121,012 | |
| | | | 4,386 | | | | | | 2,386,586 | | | | | | 2,967,773 | | | | | | 839,512 | | | | | | 92,779 | |
| | | | 430,957 | | | | | | 37,065,071 | | | | | | 36,837,646 | | | | | | 72,288,445 | | | | | | 3,367,049 | |
| | | | — | | | | | | 169,958 | | | | | | 2,324,699 | | | | | | 2,652,416 | | | | | | — | |
| | | | 2,542 | | | | | | 377,083 | | | | | | 2,061,608 | | | | | | 3,000,490 | | | | | | 261,133 | |
| | | | 2,525 | | | | | | 367,965 | | | | | | 917,079 | | | | | | 2,230,953 | | | | | | 10,627 | |
| | | | 2,547 | | | | | | 632 | | | | | | 1,901,063 | | | | | | 12,490,690 | | | | | | 4,897,988 | |
| | | | | | | | | | | | | | | | | | | | | | | | | | | | | |
| | | | $11.10 | | | | | | $17.25 | | | | | | $38.27 | | | | | | $56.63 | | | | | | $12.37 | |
| | | | 11.05 | | | | | | 16.51 | | | | | | 34.68 | | | | | | 44.50 | | | | | | 12.14 | |
| | | | 11.14 | | | | | | 17.42 | | | | | | 38.68 | | | | | | 60.78 | | | | | | 12.50 | |
| | | | — | | | | | | 17.14 | | | | | | 37.61 | | | | | | 55.04 | | | | | | — | |
| | | | 11.13 | | | | | | 17.28 | | | | | | 37.57 | | | | | | 56.32 | | | | | | 12.44 | |
| | | | 11.09 | | | | | | 16.86 | | | | | | 37.28 | | | | | | 55.60 | | | | | | 12.35 | |
| | | | 11.15 | | | | | | 17.45 | (c) | | | | | 38.66 | | | | | | 60.77 | | | | | | 12.51 | |
| | |
| The accompanying notes are an integral part of these financial statements. | | 63 |
GOLDMAN SACHS FUNDAMENTAL EQUITY VALUE FUNDS
Statements of Operations
For the Fiscal Year Ended August 31, 2017
| | | | | | |
| | | | | Equity Income Fund | |
| | Investment income: | | | | |
| | Dividends — unaffiliated issuers (net of foreign withholding taxes of $5,114, $422, $94,609, $63,703, $3,294 and $1,735) | | $ | 11,815,265 | |
| | Dividends — affiliated issuers | | | 25,901 | |
| | Interest | | | 15,511 | |
| | Securities lending income — affiliated issuer | | | 7,060 | |
| | Total investment income | | | 11,863,737 | |
| | | | | | |
| | Expenses: | | | | |
| | Management fees | | | 2,858,150 | |
| | Distribution and Service fees(a) | | | 1,090,700 | |
| | Transfer Agency fees(a) | | | 717,890 | |
| | Professional fees | | | 112,000 | |
| | Registration fees | | | 101,077 | |
| | Printing and mailing costs | | | 86,647 | |
| | Custody, accounting and administrative services | | | 74,180 | |
| | Trustee fees | | | 17,994 | |
| | Service Share fees — Service Plan | | | 658 | |
| | Service Share fees — Shareholder Administration Plan | | | 658 | |
| | Other | | | 27,652 | |
| | Total expenses | | | 5,087,606 | |
| | Less — expense reductions | | | (451,004 | ) |
| | Net expenses | | | 4,636,602 | |
| | NET INVESTMENT INCOME | | | 7,227,135 | |
| | | | | | |
| | Realized and unrealized gain (loss): | | | | |
| | Net realized gain from: | | | | |
| | Investments — unaffiliated issuers (including commission recapture of $21,282, $119, $134,714, $187,759, $333,569 and $1,201) | | | 33,457,057 | |
| | Net change in unrealized gain (loss) on: | | | | |
| | Investments — unaffiliated issuers | | | (1,659,812 | ) |
| | Net realized and unrealized gain | | | 31,797,245 | |
| | NET INCREASE IN NET ASSETS RESULTING FROM OPERATIONS | | $ | 39,024,380 | |
| | (a) | | Class specific Distribution and Service and Transfer Agent fees were as follows: |
| | | | | | | | | | | | | | | | | | | | | | | | | | | | | | | | | | | | | | | | |
| | | Distribution and Service Fees | | | Transfer Agency Fees | |
Fund | | Class A | | | Class C | | | Class R | | | Class A | | | Class C | | | Institutional | | | Class R6 | | | Service | | | Investor | | | Class R | |
Equity Income | | $ | 867,742 | | | $ | 215,293 | | | $ | 7,665 | | | $ | 656,309 | | | $ | 40,726 | | | $ | 14,423 | | | $ | 4 | | | $ | 105 | | | $ | 3,425 | | | $ | 2,898 | |
Focused Value | | | 99 | | | | 394 | | | | 134 | | | | 75 | | | | 73 | | | | 1,477 | | | | 6 | | | | — | | | | 51 | | | | 51 | |
Large Cap Value | | | 457,640 | | | | 424,768 | | | | 34,218 | | | | 346,303 | | | | 80,323 | | | | 318,842 | | | | 14,635 | | | | 1,289 | | | | 9,727 | | | | 12,942 | |
Mid Cap Value | | | 2,679,893 | | | | 1,257,244 | | | | 191,043 | | | | 2,028,423 | | | | 237,873 | | | | 983,115 | | | | 54,843 | | | | 42,092 | | | | 351,860 | | | | 72,265 | |
Small Cap Value | | | 2,318,774 | | | | 447,058 | | | | 646,591 | | | | 1,754,005 | | | | 84,579 | | | | 1,844,619 | | | | 117,657 | | | | 54,425 | | | | 336,764 | | | | 244,508 | |
Small/Mid Cap Value | | | 3,098 | | | | 9,954 | | | | 649 | | | | 2,341 | | | | 1,881 | | | | 17,015 | | | | 6,013 | | | | — | | | | 5,754 | | | | 245 | |
| | |
| 64 | | The accompanying notes are an integral part of these financial statements. |
GOLDMAN SACHS FUNDAMENTAL EQUITY VALUE FUNDS
| | | | | | | | | | | | | | | | | | | | | | | | | | | | |
| | | Focused
Value Fund | | | | | Large Cap
Value Fund | | | | | Mid Cap Value
Fund | | | | | Small Cap Value
Fund | | | | | Small/Mid Cap
Value Fund | |
| | | | | | | | | | | | | | | | | | | | | | | | | | | | |
| | $ | 80,775 | | | | | $ | 24,805,353 | | | | | $ | 71,365,288 | | | | | $ | 106,550,241 | | | | | $ | 1,350,593 | |
| | | 537 | | | | | | 48,299 | | | | | | 206,627 | | | | | | 65,946 | | | | | | 2,456 | |
| | | 67 | | | | | | 13,866 | | | | | | 31,265 | | | | | | 11,253 | | | | | | 1,026 | |
| | | 122 | | | | | | 10,244 | | | | | | 94,694 | | | | | | 336,886 | | | | | | 4,670 | |
| | | 81,501 | | | | | | 24,877,762 | | | | | | 71,697,874 | | | | | | 106,964,326 | | | | | | 1,358,745 | |
| | | | | | | | | | | | | | | | | | | | | | | | | | | | |
| | | | | | | | | | | | | | | | | | | | | | | | | | | | |
| | | 28,892 | | | | | | 8,234,934 | | | | | | 30,301,556 | | | | | | 60,581,462 | | | | | | 638,017 | |
| | | 627 | | | | | | 916,626 | | | | | | 4,128,180 | | | | | | 3,412,423 | | | | | | 13,701 | |
| | | 1,733 | | | | | | 784,061 | | | | | | 3,770,471 | | | | | | 4,436,557 | | | | | | 33,249 | |
| | | 82,969 | | | | | | 120,867 | | | | | | 79,214 | | | | | | 80,864 | | | | | | 78,617 | |
| | | 87,786 | | | | | | 95,208 | | | | | | 152,200 | | | | | | 220,609 | | | | | | 82,571 | |
| | | 23,931 | | | | | | 49,136 | | | | | | 328,127 | | | | | | 258,132 | | | | | | 21,836 | |
| | | 33,073 | | | | | | 122,137 | | | | | | 274,948 | | | | | | 387,875 | | | | | | 65,968 | |
| | | 17,363 | | | | | | 19,190 | | | | | | 23,182 | | | | | | 26,990 | | | | | | 17,436 | |
| | | — | | | | | | 8,056 | | | | | | 263,075 | | | | | | 340,156 | | | | | | — | |
| | | — | | | | | | 8,056 | | | | | | 263,075 | | | | | | 340,156 | | | | | | — | |
| | | 9,909 | | | | | | 42,415 | | | | | | 100,652 | | | | | | 140,292 | | | | | | 10,809 | |
| | | 286,283 | | | | | | 10,400,686 | | | | | | 39,684,680 | | | | | | 70,225,516 | | | | | | 962,204 | |
| | | (257,339 | ) | | | | | (531,595 | ) | | | | | (68,737 | ) | | | | | (2,279,873 | ) | | | | | (312,484 | ) |
| | | 28,944 | | | | | | 9,869,091 | | | | | | 39,615,943 | | | | | | 67,945,643 | | | | | | 649,720 | |
| | | 52,557 | | | | | | 15,008,671 | | | | | | 32,081,931 | | | | | | 39,018,683 | | | | | | 709,025 | |
| | | | | | | | | | | | | | | | | | | | | | | | | | | | |
| | | | | | | | | | | | | | | | | | | | | | | | | | | | |
| | | | | | | | | | | | | | | | | | | | | | | | | | | | |
| | | 477,994 | | | | | | 149,879,990 | | | | | | 906,847,744 | | | | | | 753,390,574 | | | | | | 4,700,498 | |
| | | | | | | | | | | | | | | | | | | | | | | | | | | | |
| | | (66,919 | ) | | | | | (58,122,597 | ) | | | | | (481,033,601 | ) | | | | | (78,347,827 | ) | | | | | (19,800 | ) |
| | | 411,075 | | | | | | 91,757,393 | | | | | | 425,814,143 | | | | | | 675,042,747 | | | | | | 4,680,698 | |
| | $ | 463,632 | | | | | $ | 106,766,064 | | | | | $ | 457,896,074 | | | | | $ | 714,061,430 | | | | | $ | 5,389,723 | |
| | |
| The accompanying notes are an integral part of these financial statements. | | 65 |
GOLDMAN SACHS FUNDAMENTAL EQUITY VALUE FUNDS
Statements of Changes in Net Assets
| | | | | | | | | | |
| | | | | Equity Income Fund | |
| | | | | For the Fiscal
Year Ended
August 31, 2017 | | | For the Fiscal
Year Ended
August 31, 2016 | |
| | From operations: | |
| | Net investment income | | $ | 7,227,135 | | | $ | 9,129,312 | |
| | Net realized gain (loss) | | | 33,457,057 | | | | (1,546,227 | ) |
| | Net change in unrealized gain (loss) | | | (1,659,812 | ) | | | 27,651,809 | |
| | Net increase in net assets resulting from operations | | | 39,024,380 | | | | 35,234,894 | |
| | | | | | | | | | |
| | Distributions to shareholders: | | | | | | | | |
| | From net investment income | | | | | | | | |
| | Class A Shares | | | (5,822,762 | ) | | | (7,510,203 | ) |
| | Class C Shares | | | (214,913 | ) | | | (341,165 | ) |
| | Institutional Shares | | | (728,388 | ) | | | (727,273 | ) |
| | Service Shares | | | (3,815 | ) | | | (5,397 | ) |
| | Investor Shares | | | (31,786 | ) | | | (12,891 | ) |
| | Class R Shares | | | (21,663 | ) | | | (24,426 | ) |
| | Class R6 Shares | | | (221 | ) | | | (234 | ) |
| | From net realized gains | | | | | | | | |
| | Class A Shares | | | — | | | | — | |
| | Class C Shares | | | — | | | | — | |
| | Institutional Shares | | | — | | | | — | |
| | Service Shares | | | — | | | | — | |
| | Investor Shares | | | — | | | | — | |
| | Class R Shares | | | — | | | | — | |
| | Class R6 Shares | | | — | | | | — | |
| | Total distributions to shareholders | | | (6,823,548 | ) | | | (8,621,589 | ) |
| | | | | | | | | | |
| | From share transactions: | | | | | | | | |
| | Proceeds from sales of shares | | | 31,513,018 | | | | 20,994,089 | |
| | Reinvestment of distributions | | | 6,658,236 | | | | 8,417,238 | |
| | Cost of shares redeemed | | | (97,892,013 | ) | | | (64,767,655 | ) |
| | Net increase (decrease) in net assets resulting from share transactions | | | (59,720,759 | ) | | | (35,356,328 | ) |
| | TOTAL INCREASE (DECREASE) | | | (27,519,927 | ) | | | (8,743,023 | ) |
| | | | | | | | | | |
| | Net assets: | | | | | | | | |
| | Beginning of year | | | 415,336,181 | | | | 424,079,204 | |
| | End of year | | $ | 387,816,254 | | | $ | 415,336,181 | |
| | Undistributed net investment income | | $ | 1,610,857 | | | $ | 1,894,053 | |
| | |
| 66 | | The accompanying notes are an integral part of these financial statements. |
GOLDMAN SACHS FUNDAMENTAL EQUITY VALUE FUNDS
| | | | | | | | | | | | | | | | | | | | | | |
| | | Focused Value Fund | | | | | Large Cap Value Fund | |
| | | For the Fiscal
Year Ended
August 31, 2017 | | | | | For the Fiscal
Year Ended
August 31, 2016 | | | | | For the Fiscal
Year Ended
August 31, 2017 | | | | | For the Fiscal
Year Ended
August 31, 2016 | |
| | | | | | | | | | | | | | | | | | | | | | |
| | $ | 52,557 | | | | | $ | 47,668 | | | | | $ | 15,008,671 | | | | | $ | 23,490,510 | |
| | | 477,994 | | | | | | (162,280 | ) | | | | | 149,879,990 | | | | | | (79,500,175 | ) |
| | | (66,919 | ) | | | | | 366,284 | | | | | | (58,122,597 | ) | | | | | 155,911,654 | |
| | | 463,632 | | | | | | 251,672 | | | | | | 106,766,064 | | | | | | 99,901,989 | |
| | | | | | | | | | | | | | | | | | | | | | |
| | | | | | | | | | | | | | | | | | | | | | |
| | | | | | | | | | | | | | | | | | | | | | |
| | | (365 | ) | | | | | (81 | ) | | | | | (3,168,556 | ) | | | | | (1,835,132 | ) |
| | | (80 | ) | | | | | (9 | ) | | | | | (479,583 | ) | | | | | (16,247 | ) |
| | | (45,341 | ) | | | | | (13,283 | ) | | | | | (15,369,112 | ) | | | | | (10,860,853 | ) |
| | | — | | | | | | — | | | | | | (46,424 | ) | | | | | (27,148 | ) |
| | | (317 | ) | | | | | (105 | ) | | | | | (60,284 | ) | | | | | (63,987 | ) |
| | | (198 | ) | | | | | (57 | ) | | | | | (99,802 | ) | | | | | (44,370 | ) |
| | | (359 | ) | | | | | (122 | ) | | | | | (2,620,640 | ) | | | | | (1,585,777 | ) |
| | | | | | | | | | | | | | | | | | | | | | |
| | | — | | | | | | — | | | | | | — | | | | | | (20,098,855 | ) |
| | | — | | | | | | — | | | | | | — | | | | | | (3,706,735 | ) |
| | | — | | | | | | — | | | | | | — | | | | | | (77,563,606 | ) |
| | | — | | | | | | — | | | | | | — | | | | | | (354,118 | ) |
| | | — | | | | | | — | | | | | | — | | | | | | (531,543 | ) |
| | | — | | | | | | — | | | | | | — | | | | | | (683,585 | ) |
| | | — | | | | | | — | | | | | | — | | | | | | (10,757,503 | ) |
| | | (46,660 | ) | | | | | (13,657 | ) | | | | | (21,844,401 | ) | | | | | (128,129,459 | ) |
| | | | | | | | | | | | | | | | | | | | | | |
| | | | | | | | | | | | | | | | | | | | | | |
| | | 1,234,469 | | | | | | 1,241,520 | | | | | | 362,065,594 | | | | | | 315,581,215 | |
| | | 46,660 | | | | | | 13,656 | | | | | | 20,260,815 | | | | | | 120,394,537 | |
| | | (43,078 | ) | | | | | (20,643 | ) | | | | | (893,886,974 | ) | | | | | (460,476,523 | ) |
| | | 1,238,051 | | | | | | 1,234,533 | | | | | | (511,560,565 | ) | | | | | (24,500,771 | ) |
| | | 1,655,023 | | | | | | 1,472,548 | | | | | | (426,638,902 | ) | | | | | (52,728,241 | ) |
| | | | | | | | | | | | | | | | | | | | | | |
| | | | | | | | | | | | | | | | | | | | | | |
| | | 3,329,835 | | | | | | 1,857,287 | | | | | | 1,280,847,068 | | | | | | 1,333,575,309 | |
| | $ | 4,984,858 | | | | | $ | 3,329,835 | | | | | $ | 854,208,166 | | | | | $ | 1,280,847,068 | |
| | $ | 42,096 | | | | | $ | 36,199 | | | | | $ | 9,924,598 | | | | | $ | 18,222,853 | |
| | |
| The accompanying notes are an integral part of these financial statements. | | 67 |
GOLDMAN SACHS FUNDAMENTAL EQUITY VALUE FUNDS
Statements of Changes in Net Assets (continued)
| | | | | | | | | | |
| | | | | Mid Cap Value Fund | |
| | | | | For the Fiscal
Year Ended
August 31, 2017 | | | For the Fiscal
Year Ended
August 31, 2016 | |
| | From operations: | |
| | Net investment income | | $ | 32,081,931 | | | $ | 85,311,197 | |
| | Net realized gain (loss) | | | 906,847,744 | | | | (616,500,387 | ) |
| | Net change in unrealized gain (loss) | | | (481,033,601 | ) | | | 659,084,221 | |
| | Net increase in net assets resulting from operations | | | 457,896,074 | | | | 127,895,031 | |
| | | | | | | | | | |
| | Distributions to shareholders: | | | | | | | | |
| | From net investment income | | | | | | | | |
| | Class A Shares | | | (11,704,983 | ) | | | (5,185,015 | ) |
| | Class C Shares | | | (608,413 | ) | | | — | |
| | Institutional Shares | | | (43,679,489 | ) | | | (38,827,756 | ) |
| | Service Shares | | | (1,007,350 | ) | | | (392,088 | ) |
| | Investor Shares | | | (2,803,522 | ) | | | (1,578,650 | ) |
| | Class R Shares | | | (350,898 | ) | | | (58,485 | ) |
| | Class R6 Shares | | | (5,955,039 | ) | | | (2,752,664 | ) |
| | From net realized gains | | | | | | | | |
| | Class A Shares | | | — | | | | (198,998,854 | ) |
| | Class C Shares | | | — | | | | (20,878,172 | ) |
| | Institutional Shares | | | — | | | | (584,837,789 | ) |
| | Service Shares | | | — | | | | (24,166,112 | ) |
| | Investor Shares | | | — | | | | (31,136,007 | ) |
| | Class R Shares | | | — | | | | (4,906,942 | ) |
| | Class R6 Shares | | | — | | | | (37,233,452 | ) |
| | Total distributions to shareholders | | | (66,109,694 | ) | | | (950,951,986 | ) |
| | | | | | | | | | |
| | From share transactions: | | | | | | | | |
| | Proceeds from sales of shares | | | 749,627,451 | | | | 1,696,909,879 | |
| | Reinvestment of distributions | | | 60,932,584 | | | | 863,240,443 | |
| | Cost of shares redeemed | | | (4,514,654,937 | ) | | | (4,266,756,472 | ) |
| | Net increase (decrease) in net assets resulting from share transactions | | | (3,704,094,902 | ) | | | (1,706,606,150 | ) |
| | TOTAL INCREASE (DECREASE) | | | (3,312,308,522 | ) | | | (2,529,663,105 | ) |
| | | | | | | | | | |
| | Net assets: | | | | | | | | |
| | Beginning of year | | | 5,964,385,041 | | | | 8,494,048,146 | |
| | End of year | | $ | 2,652,076,519 | | | $ | 5,964,385,041 | |
| | Undistributed net investment income | | $ | 7,044,108 | | | $ | 43,940,194 | |
| | |
| 68 | | The accompanying notes are an integral part of these financial statements. |
GOLDMAN SACHS FUNDAMENTAL EQUITY VALUE FUNDS
| | | | | | | | | | | | | | | | | | | | | | |
| | | Small Cap Value Fund | | | | | Small/Mid Cap Value Fund | |
| | | For the Fiscal
Year Ended
August 31, 2017 | | | | | For the Fiscal
Year Ended
August 31, 2016 | | | | | For the Fiscal
Year Ended
August 31, 2017 | | | | | For the Fiscal
Year Ended
August 31, 2016 | |
| | | | | | | | | | | | | | | | | | | | | | |
| | $ | 39,018,683 | | | | | $ | 41,052,168 | | | | | $ | 709,025 | | | | | $ | 400,670 | |
| | | 753,390,574 | | | | | | 84,626,845 | | | | | | 4,700,498 | | | | | | (1,516,138 | ) |
| | | (78,347,827 | ) | | | | | 521,918,591 | | | | | | (19,800 | ) | | | | | 4,624,271 | |
| | | 714,061,430 | | | | | | 647,597,604 | | | | | | 5,389,723 | | | | | | 3,508,803 | |
| | | | | | | | | | | | | | | | | | | | | | |
| | | | | | | | | | | | | | | | | | | | | | |
| | | | | | | | | | | | | | | | | | | | | | |
| | | (3,930,212 | ) | | | | | (2,980,112 | ) | | | | | (8,340 | ) | | | | | (434 | ) |
| | | — | | | | | | (9 | ) | | | | | (1,887 | ) | | | | | — | |
| | | (33,806,922 | ) | | | | | (30,748,151 | ) | | | | | (435,647 | ) | | | | | (61,810 | ) |
| | | (405,224 | ) | | | | | (294,661 | ) | | | | | — | | | | | | — | |
| | | (1,144,758 | ) | | | | | (951,071 | ) | | | | | (17,996 | ) | | | | | (10,063 | ) |
| | | (268,369 | ) | | | | | (64,171 | ) | | | | | (338 | ) | | | | | — | |
| | | (3,388,115 | ) | | | | | (357,573 | ) | | | | | (99 | ) | | | | | (19 | ) |
| | | | | | | | | | | | | | | | | | | | | | |
| | | (29,858,961 | ) | | | | | (44,642,227 | ) | | | | | — | | | | | | (3,634 | ) |
| | | (1,859,091 | ) | | | | | (3,294,839 | ) | | | | | — | | | | | | (1,782 | ) |
| | | (135,269,543 | ) | | | | | (194,855,378 | ) | | | | | — | | | | | | (130,208 | ) |
| | | (3,933,444 | ) | | | | | (6,631,448 | ) | | | | | — | | | | | | — | |
| | | (5,441,781 | ) | | | | | (7,430,439 | ) | | | | | — | | | | | | (25,440 | ) |
| | | (4,176,976 | ) | | | | | (6,298,200 | ) | | | | | — | | | | | | (294 | ) |
| | | (12,010,906 | ) | | | | | (2,172,148 | ) | | | | | — | | | | | | (48 | ) |
| | | (235,494,302 | ) | | | | | (300,720,427 | ) | | | | | (464,307 | ) | | | | | (233,732 | ) |
| | | | | | | | | | | | | | | | | | | | | | |
| | | | | | | | | | | | | | | | | | | | | | |
| | | 2,157,143,285 | | | | | | 1,486,570,672 | | | | | | 87,159,431 | | | | | | 29,746,543 | |
| | | 225,307,017 | | | | | | 287,034,432 | | | | | | 462,700 | | | | | | 233,709 | |
| | | (2,554,716,042 | ) | | | | | (1,885,709,406 | ) | | | | | (27,116,773 | ) | | | | | (16,212,125 | ) |
| | | (172,265,740 | ) | | | | | (112,104,302 | ) | | | | | 60,505,358 | | | | | | 13,768,127 | |
| | | 306,301,388 | | | | | | 234,772,875 | | | | | | 65,430,774 | | | | | | 17,043,198 | |
| | | | | | | | | | | | | | | | | | | | | | |
| | | | | | | | | | | | | | | | | | | | | | |
| | | 6,174,655,084 | | | | | | 5,939,882,209 | | | | | | 43,909,715 | | | | | | 26,866,517 | |
| | $ | 6,480,956,472 | | | | | $ | 6,174,655,084 | | | | | $ | 109,340,489 | | | | | $ | 43,909,715 | |
| | $ | 10,760,962 | | | | | $ | 16,206,480 | | | | | $ | 614,163 | | | | | $ | 378,040 | |
| | |
| The accompanying notes are an integral part of these financial statements. | | 69 |
GOLDMAN SACHS EQUITY INCOME FUND
Financial Highlights
Selected Data for a Share Outstanding Throughout Each Year
| | | | | | | | | | | | | | | | | | | | | | |
| | | | | | | | From
investment operations | | | | |
| | | Year - Share Class | | Net asset
value,
beginning
of year | | | Net
investment
income(a) | | | Net realized
and unrealized
gain (loss) | | | Total from
investment
operations | | | Distributions
to shareholders
from net
investment
income | |
| | FOR THE FISCAL YEARS ENDED AUGUST 31, | |
| | 2017 - A | | $ | 32.53 | | | $ | 0.61 | | | $ | 2.60 | | | $ | 3.21 | | | $ | (0.57 | ) |
| | 2017 - C | | | 31.01 | | | | 0.33 | | | | 2.48 | | | | 2.81 | | | | (0.32 | ) |
| | 2017 - Institutional | | | 33.07 | | | | 0.77 | | | | 2.64 | | | | 3.41 | | | | (0.71 | ) |
| | 2017 - Service | | | 32.53 | | | | 0.57 | | | | 2.61 | | | | 3.18 | | | | (0.43 | ) |
| | 2017 - Investor(e) | | | 32.49 | | | | 0.75 | | | | 2.55 | | | | 3.30 | | | | (0.67 | ) |
| | 2017 - R | | | 32.35 | | | | 0.53 | | | | 2.59 | | | | 3.12 | | | | (0.49 | ) |
| | 2017 - R6 | | | 33.06 | | | | 0.77 | | | | 2.64 | | | | 3.41 | | | | (0.71 | ) |
| | 2016 - A | | | 30.47 | | | | 0.68 | | | | 2.02 | | | | 2.70 | | | | (0.64 | ) |
| | 2016 - C | | | 29.08 | | | | 0.43 | | | | 1.93 | | | | 2.36 | | | | (0.43 | ) |
| | 2016 - Institutional | | | 30.96 | | | | 0.82 | | | | 2.06 | | | | 2.88 | | | | (0.77 | ) |
| | 2016 - Service | | | 30.46 | | | | 0.65 | | | | 2.02 | | | | 2.67 | | | | (0.60 | ) |
| | 2016 - Investor(e) | | | 30.41 | | | | 0.76 | | | | 2.02 | | | | 2.78 | | | | (0.70 | ) |
| | 2016 - R | | | 30.32 | | | | 0.60 | | | | 2.00 | | | | 2.60 | | | | (0.57 | ) |
| | 2016 - R6 | | | 30.97 | | | | 0.82 | | | | 2.04 | | | | 2.86 | | | | (0.77 | ) |
| | 2015 - A | | | 32.21 | | | | 0.55 | | | | (1.80 | ) | | | (1.25 | ) | | | (0.49 | ) |
| | 2015 - C | | | 30.77 | | | | 0.29 | | | | (1.72 | ) | | | (1.43 | ) | | | (0.26 | ) |
| | 2015 - Institutional | | | 32.72 | | | | 0.69 | | | | (1.83 | ) | | | (1.14 | ) | | | (0.62 | ) |
| | 2015 - Service | | | 32.20 | | | | 0.51 | | | | (1.79 | ) | | | (1.28 | ) | | | (0.46 | ) |
| | 2015 - Investor(e) | | | 32.15 | | | | 0.62 | | | | (1.79 | ) | | | (1.17 | ) | | | (0.57 | ) |
| | 2015 - R | | | 32.05 | | | | 0.46 | | | | (1.78 | ) | | | (1.32 | ) | | | (0.41 | ) |
| | 2015 - R6 (Commenced July 31, 2015) | | | 33.24 | | | | 0.08 | | | | (2.35 | ) | | | (2.27 | ) | | | — | |
| | 2014 - A | | | 26.70 | | | | 0.42 | | | | 5.48 | | | | 5.90 | | | | (0.39 | ) |
| | 2014 - C | | | 25.54 | | | | 0.19 | | | | 5.23 | | | | 5.42 | | | | (0.19 | ) |
| | 2014 - Institutional | | | 27.12 | | | | 0.55 | | | | 5.56 | | | | 6.11 | | | | (0.51 | ) |
| | 2014 - Service | | | 26.69 | | | | 0.39 | | | | 5.48 | | | | 5.87 | | | | (0.36 | ) |
| | 2014 - Investor(e) | | | 26.65 | | | | 0.51 | | | | 5.46 | | | | 5.97 | | | | (0.47 | ) |
| | 2014 - R | | | 26.60 | | | | 0.35 | | | | 5.45 | | | | 5.80 | | | | (0.35 | ) |
| | 2013 - A | | | 21.68 | | | | 0.29 | | | | 5.02 | | | | 5.31 | | | | (0.29 | ) |
| | 2013 - C | | | 20.78 | | | | 0.11 | | | | 4.80 | | | | 4.91 | | | | (0.15 | ) |
| | 2013 - Institutional | | | 22.01 | | | | 0.40 | | | | 5.09 | | | | 5.49 | | | | (0.38 | ) |
| | 2013 - Service | | | 21.66 | | | | 0.27 | | | | 5.02 | | | | 5.29 | | | | (0.26 | ) |
| | 2013 - Investor(e) | | | 21.64 | | | | 0.38 | | | | 4.97 | | | | 5.35 | | | | (0.34 | ) |
| | 2013 - R | | | 21.60 | | | | 0.23 | | | | 5.00 | | | | 5.23 | | | | (0.23 | ) |
| | (a) | | Calculated based on the average shares outstanding methodology. |
| | (b) | | Assumes investment at the NAV at the beginning of the year, reinvestment of all dividends and distributions, a complete redemption of the investment at the NAV at the end of the year and no sales or redemption charges. Total returns would be reduced if a sales or redemption charge was taken into account. Returns do not reflect the impact of taxes to shareholders relating to Fund distributions or the redemption of Fund shares. Total returns for periods less than one full year are not annualized. |
| | (c) | | The Fund’s portfolio turnover rate is calculated in accordance with regulatory requirements, without regard to transactions involving short term investments. If such transactions were included, the Fund’s portfolio turnover rate may be higher. |
| | (e) | | Effective before the opening of business on August 15, 2017, Class IR Shares were designated as Investor Shares. |
| | |
| 70 | | The accompanying notes are an integral part of these financial statements. |
GOLDMAN SACHS EQUITY INCOME FUND
| | | | | | | | | | | | | | | | | | | | | | | | | | | | | | | | | | | | | | | | |
| | | | | | | | | | | | | | | | | | | | | | | | | | | | | | | | | | |
| | | Net asset
value, end
of year | | | | | Total
return(b) | | | | | Net assets,
end of
year
(in 000s) | | | | | Ratio of
net expenses
to average
net assets | | | | | Ratio of
total expenses
to average
net assets | | | | | Ratio of
net investment
income
to average
net assets | | | | | Portfolio
turnover
rate(c) | |
| | | | | | | | | | | | | | | | | | | | | | | | | | | | | | | | | | | | | | | | |
| | $ | 35.17 | | | | | | 9.93 | % | | | | $ | 327,650 | | | | | | 1.13 | % | | | | | 1.24 | % | | | | | 1.77 | % | | | | | 43 | % |
| | | 33.50 | | | | | | 9.10 | | | | | | 18,460 | | | | | | 1.88 | | | | | | 1.99 | | | | | | 1.02 | | | | | | 43 | |
| | | 35.77 | | | | | | 10.38 | | | | | | 37,415 | | | | | | 0.73 | | | | | | 0.84 | | | | | | 2.19 | | | | | | 43 | |
| | | 35.28 | | | | | | 9.84 | | | | | | 86 | | | | | | 1.23 | | | | | | 1.33 | | | | | | 1.66 | | | | | | 43 | |
| | | 35.12 | | | | | | 10.21 | | | | | | 2,623 | | | | | | 0.88 | | | | | | 1.00 | | | | | | 2.17 | | | | | | 43 | |
| | | 34.98 | | | | | | 9.68 | | | | | | 1,571 | | | | | | 1.38 | | | | | | 1.49 | | | | | | 1.54 | | | | | | 43 | |
| | | 35.76 | | | | | | 10.39 | | | | | | 11 | | | | | | 0.73 | | | | | | 0.84 | | | | | | 2.20 | | | | | | 43 | |
| | | 32.53 | | | | | | 9.01 | | | | | | 359,003 | | | | | | 1.13 | | | | | | 1.26 | | | | | | 2.22 | | | | | | 61 | |
| | | 31.01 | | | | | | 8.21 | | | | | | 22,371 | | | | | | 1.88 | | | | | | 2.01 | | | | | | 1.47 | | | | | | 61 | |
| | | 33.07 | | | | | | 9.46 | | | | | | 31,409 | | | | | | 0.73 | | | | | | 0.86 | | | | | | 2.61 | | | | | | 61 | |
| | | 32.53 | | | | | | 8.88 | | | | | | 324 | | | | | | 1.23 | | | | | | 1.36 | | | | | | 2.11 | | | | | | 61 | |
| | | 32.49 | | | | | | 9.27 | | | | | | 743 | | | | | | 0.88 | | | | | | 1.01 | | | | | | 2.47 | | | | | | 61 | |
| | | 32.35 | | | | | | 8.71 | | | | | | 1,477 | | | | | | 1.38 | | | | | | 1.51 | | | | | | 1.96 | | | | | | 61 | |
| | | 33.06 | | | | | | 9.40 | | | | | | 10 | | | | | | 0.73 | | | | | | 0.86 | | | | | | 2.62 | | | | | | 61 | |
| | | 30.47 | | | | | | (3.98 | ) | | | | | 369,115 | | | | | | 1.14 | | | | | | 1.22 | | | | | | 1.68 | | | | | | 47 | |
| | | 29.08 | | | | | | (4.70 | ) | | | | | 23,534 | | | | | | 1.89 | | | | | | 1.97 | | | | | | 0.93 | | | | | | 47 | |
| | | 30.96 | | | | | | (3.59 | ) | | | | | 29,243 | | | | | | 0.74 | | | | | | 0.82 | | | | | | 2.09 | | | | | | 47 | |
| | | 30.46 | | | | | | (4.06 | ) | | | | | 397 | | | | | | 1.24 | | | | | | 1.32 | | | | | | 1.58 | | | | | | 47 | |
| | | 30.41 | | | | | | (3.74 | ) | | | | | 614 | | | | | | 0.89 | | | | | | 0.97 | | | | | | 1.90 | | | | | | 47 | |
| | | 30.32 | | | | | | (4.19 | ) | | | | | 1,167 | | | | | | 1.39 | | | | | | 1.47 | | | | | | 1.44 | | | | | | 47 | |
| | | 30.97 | | | | | | (6.83 | ) | | | | | 9 | | | | | | 0.69 | (d) | | | | | 0.84 | (d) | | | | | 2.79 | (d) | | | | | 47 | |
| | | 32.21 | | | | | | 22.27 | | | | | | 414,276 | | | | | | 1.18 | | | | | | 1.24 | | | | | | 1.42 | | | | | | 40 | |
| | | 30.77 | | | | | | 21.32 | | | | | | 26,742 | | | | | | 1.93 | | | | | | 1.99 | | | | | | 0.67 | | | | | | 40 | |
| | | 32.72 | | | | | | 22.73 | | | | | | 29,476 | | | | | | 0.78 | | | | | | 0.84 | | | | | | 1.82 | | | | | | 40 | |
| | | 32.20 | | | | | | 22.12 | | | | | | 368 | | | | | | 1.28 | | | | | | 1.34 | | | | | | 1.33 | | | | | | 40 | |
| | | 32.15 | | | | | | 22.58 | | | | | | 3,937 | | | | | | 0.93 | | | | | | 0.98 | | | | | | 1.71 | | | | | | 40 | |
| | | 32.05 | | | | | | 21.94 | | | | | | 1,462 | | | | | | 1.43 | | | | | | 1.49 | | | | | | 1.16 | | | | | | 40 | |
| | | 26.70 | | | | | | 24.68 | | | | | | 379,500 | | | | | | 1.19 | | | | | | 1.24 | | | | | | 1.21 | | | | | | 83 | |
| | | 25.54 | | | | | | 23.77 | | | | | | 24,154 | | | | | | 1.94 | | | | | | 1.99 | | | | | | 0.46 | | | | | | 83 | |
| | | 27.12 | | | | | | 25.20 | | | | | | 19,279 | | | | | | 0.79 | | | | | | 0.84 | | | | | | 1.60 | | | | | | 83 | |
| | | 26.69 | | | | | | 24.62 | | | | | | 356 | | | | | | 1.29 | | | | | | 1.34 | | | | | | 1.09 | | | | | | 83 | |
| | | 26.65 | | | | | | 24.98 | | | | | | 2,158 | | | | | | 0.94 | | | | | | 1.01 | | | | | | 1.54 | | | | | | 83 | |
| | | 26.60 | | | | | | 24.41 | | | | | | 609 | | | | | | 1.44 | | | | | | 1.49 | | | | | | 0.94 | | | | | | 83 | |
| | |
| The accompanying notes are an integral part of these financial statements. | | 71 |
GOLDMAN SACHS FOCUSED VALUE FUND
Financial Highlights
Selected Data for a Share Outstanding Throughout Each Year
| | | | | | | | | | | | | | | | | | | | | | |
| | | | | | | | From
investment operations | | | | |
| | | Year - Share Class | | Net asset
value,
beginning
of year | | | Net
investment
income(a) | | | Net realized
and unrealized
gain (loss) | | | Total from
investment
operations | | | Distributions
to shareholders
from net
investment
income | |
| | FOR THE FISCAL YEARS ENDED AUGUST 31, | |
| | 2017 - A | | $ | 9.89 | | | $ | 0.10 | | | $ | 1.22 | | | $ | 1.32 | | | $ | (0.11 | ) |
| | 2017 - C | | | 9.84 | | | | 0.03 | | | | 1.21 | | | | 1.24 | | | | (0.03 | ) |
| | 2017 - Institutional | | | 9.92 | | | | 0.15 | | | | 1.21 | | | | 1.36 | | | | (0.14 | ) |
| | 2017 - Investor(f) | | | 9.91 | | | | 0.13 | | | | 1.22 | | | | 1.35 | | | | (0.13 | ) |
| | 2017 - R | | | 9.88 | | | | 0.07 | | | | 1.22 | | | | 1.29 | | | | (0.08 | ) |
| | 2017 - R6 | | | 9.92 | | | | 0.15 | | | | 1.22 | | | | 1.37 | | | | (0.14 | ) |
| | 2016 - A | | | 9.28 | | | | 0.12 | | | | 0.52 | | | | 0.64 | | | | (0.03 | ) |
| | 2016 - C | | | 9.28 | | | | 0.05 | | | | 0.51 | | | | 0.56 | | | | — | (d) |
| | 2016 - Institutional | | | 9.29 | | | | 0.16 | | | | 0.52 | | | | 0.68 | | | | (0.05 | ) |
| | 2016 - Investor(f) | | | 9.29 | | | | 0.15 | | | | 0.51 | | | | 0.66 | | | | (0.04 | ) |
| | 2016 - R | | | 9.28 | | | | 0.10 | | | | 0.52 | | | | 0.62 | | | | (0.02 | ) |
| | 2016 - R6 | | | 9.29 | | | | 0.16 | | | | 0.52 | | | | 0.68 | | | | (0.05 | ) |
| | | | | | | | | | | | | | | | | | | | | | |
| | FOR THE PERIOD ENDED AUGUST 31, | |
| | 2015 - A (Commenced July 31, 2015) | | | 10.00 | | | | 0.01 | | | | (0.73 | ) | | | (0.72 | ) | | | — | |
| | 2015 - C (Commenced July 31, 2015) | | | 10.00 | | | | — | (d) | | | (0.72 | ) | | | (0.72 | ) | | | — | |
| | 2015 - Institutional (Commenced July 31, 2015) | | | 10.00 | | | | 0.01 | | | | (0.72 | ) | | | (0.71 | ) | | | — | |
| | 2015 - Investor (Commenced July 31, 2015) (f) | | | 10.00 | | | | 0.01 | | | | (0.72 | ) | | | (0.71 | ) | | | — | |
| | 2015 - R (Commenced July 31, 2015) | | | 10.00 | | | | 0.01 | | | | (0.73 | ) | | | (0.72 | ) | | | — | |
| | 2015 - R6 (Commenced July 31, 2015) | | | 10.00 | | | | 0.01 | | | | (0.72 | ) | | | (0.71 | ) | | | — | |
| | (a) | | Calculated based on the average shares outstanding methodology. |
| | (b) | | Assumes investment at the NAV at the beginning of the year, reinvestment of all dividends and distributions, a complete redemption of the investment at the NAV at the end of the year and no sales or redemption charges. Total returns would be reduced if a sales or redemption charge was taken into account. Returns do not reflect the impact of taxes to shareholders relating to Fund distributions or the redemption of Fund shares. Total returns for periods less than one full year are not annualized. |
| | (c) | | The Fund’s portfolio turnover rate is calculated in accordance with regulatory requirements, without regard to transactions involving short term investments. If such transactions were included, the Fund’s portfolio turnover rate may be higher. |
| | (d) | | Amount is less than $0.005 per share. |
| | (f) | | Effective before the opening of business on August 15, 2017, Class IR Shares were designated as Investor Shares. |
| | |
| 72 | | The accompanying notes are an integral part of these financial statements. |
GOLDMAN SACHS FOCUSED VALUE FUND
| | | | | | | | | | | | | | | | | | | | | | | | | | | | | | | | | | | | | | | | |
| | | | | | | | | | | | | | | | | | | | | | | | | | | | | | | | | | |
| | | Net asset
value, end
of year | | | | | Total
return(b) | | | | | Net assets,
end of
year
(in 000s) | | | | | Ratio of
net expenses
to average
net assets | | | | | Ratio of
total expenses
to average
net assets | | | | | Ratio of
net investment
income
to average
net assets | | | | | Portfolio
turnover
rate(c) | |
| | | | | | | | | | | | | | | | | | | | | | | | | | | | | | | | | | | | | | | | |
| | $ | 11.10 | | | | | | 13.42 | % | | | | $ | 50 | | | | | | 1.13 | % | | | | | 7.96 | % | | | | | 0.95 | % | | | | | 126 | % |
| | | 11.05 | | | | | | 12.64 | | | | | | 48 | | | | | | 1.88 | | | | | | 8.66 | | | | | | 0.25 | | | | | | 126 | |
| | | 11.14 | | | | | | 13.79 | | | | | | 4,802 | | | | | | 0.73 | | | | | | 7.40 | | | | | | 1.39 | | | | | | 126 | |
| | | 11.13 | | | | | | 13.65 | | | | | | 28 | | | | | | 0.88 | | | | | | 7.61 | | | | | | 1.20 | | | | | | 126 | |
| | | 11.09 | | | | | | 13.08 | | | | | | 28 | | | | | | 1.38 | | | | | | 8.12 | | | | | | 0.70 | | | | | | 126 | |
| | | 11.15 | | | | | | 13.91 | | | | | | 28 | | | | | | 0.71 | | | | | | 7.46 | | | | | | 1.37 | | | | | | 126 | |
| | | 9.89 | | | | | | 6.93 | | | | | | 25 | | | | | | 1.13 | | | | | | 14.54 | | | | | | 1.33 | | | | | | 161 | |
| | | 9.84 | | | | | | 6.06 | | | | | | 25 | | | | | | 1.88 | | | | | | 15.30 | | | | | | 0.58 | | | | | | 161 | |
| | | 9.92 | | | | | | 7.33 | | | | | | 3,206 | | | | | | 0.73 | | | | | | 13.52 | | | | | | 1.73 | | | | | | 161 | |
| | | 9.91 | | | | | | 7.26 | | | | | | 25 | | | | | | 0.88 | | | | | | 14.28 | | | | | | 1.58 | | | | | | 161 | |
| | | 9.88 | | | | | | 6.60 | | | | | | 25 | | | | | | 1.38 | | | | | | 14.79 | | | | | | 1.08 | | | | | | 161 | |
| | | 9.92 | | | | | | 7.34 | | | | | | 25 | | | | | | 0.71 | | | | | | 14.11 | | | | | | 1.75 | | | | | | 161 | |
| | | | | | | | | | | | | | | | | | | | | | | | | | | | | | | | | | | | | | | | |
| | | | | | | | | | | | | | | | | | | | | | | | | | | | | | | | | | | | | | | | |
| | | 9.28 | | | | | | (7.20 | ) | | | | | 23 | | | | | | 1.13 | (e) | | | | | 25.55 | (e) | | | | | 0.97 | (e) | | | | | 2 | |
| | | 9.28 | | | | | | (7.20 | ) | | | | | 23 | | | | | | 1.89 | (e) | | | | | 26.30 | (e) | | | | | 0.21 | (e) | | | | | 2 | |
| | | 9.29 | | | | | | (7.10 | ) | | | | | 1,741 | | | | | | 0.74 | (e) | | | | | 25.15 | (e) | | | | | 1.37 | (e) | | | | | 2 | |
| | | 9.29 | | | | | | (7.20 | ) | | | | | 23 | | | | | | 0.89 | (e) | | | | | 25.30 | (e) | | | | | 1.21 | (e) | | | | | 2 | |
| | | 9.28 | | | | | | (7.10 | ) | | | | | 23 | | | | | | 1.39 | (e) | | | | | 25.80 | (e) | | | | | 0.71 | (e) | | | | | 2 | |
| | | 9.29 | | | | | | (7.10 | ) | | | | | 23 | | | | | | 0.72 | (e) | | | | | 25.14 | (e) | | | | | 1.39 | (e) | | | | | 2 | |
| | |
| The accompanying notes are an integral part of these financial statements. | | 73 |
GOLDMAN SACHS LARGE CAP VALUE FUND
Financial Highlights
Selected Data for a Share Outstanding Throughout Each Year
| | | | | | | | | | | | | | | | | | | | | | | | | | | | | | |
| | | | | | | | From
investment operations | | | Distributions
to shareholders | |
| | | Year - Share Class | | Net asset
value,
beginning
of year | | | Net
investment
income(a) | | | Net realized
and unrealized
gain (loss) | | | Total from
investment
operations | | | From net
investment
income | | | From net
realized
gains | | | Total
distributions | |
| | FOR THE FISCAL YEARS ENDED AUGUST 31, | | | | | | | | | |
| | 2017 - A | | $ | 16.08 | | | $ | 0.19 | | | $ | 1.26 | | | $ | 1.45 | | | $ | (0.28 | ) | | $ | — | | | $ | (0.28 | ) |
| | 2017 - C | | | 15.43 | | | | 0.07 | | | | 1.19 | | | | 1.26 | | | | (0.18 | ) | | | — | | | | (0.18 | ) |
| | 2017 - Institutional | | | 16.25 | | | | 0.25 | | | | 1.27 | | | | 1.52 | | | | (0.35 | ) | | | — | | | | (0.35 | ) |
| | 2017 - Service | | | 15.99 | | | | 0.17 | | | | 1.23 | | | | 1.40 | | | | (0.25 | ) | | | — | | | | (0.25 | ) |
| | 2017 - Investor(f) | | | 16.11 | | | | 0.25 | | | | 1.23 | | | | 1.48 | | | | (0.31 | ) | | | — | | | | (0.31 | ) |
| | 2017 - R | | | 15.73 | | | | 0.15 | | | | 1.22 | | | | 1.37 | | | | (0.24 | ) | | | — | | | | (0.24 | ) |
| | 2017 - R6 | | | 16.25 | | | | 0.21 | | | | 1.34 | | | | 1.55 | | | | (0.35 | ) | | | — | | | | (0.35 | ) |
| | 2016 - A | | | 16.45 | | | | 0.24 | | | | 0.95 | | | | 1.19 | | | | (0.12 | ) | | | (1.44 | ) | | | (1.56 | ) |
| | 2016 - C | | | 15.83 | | | | 0.12 | | | | 0.93 | | | | 1.05 | | | | (0.01 | ) | | | (1.44 | ) | | | (1.45 | ) |
| | 2016 - Institutional | | | 16.61 | | | | 0.30 | | | | 0.97 | | | | 1.27 | | | | (0.19 | ) | | | (1.44 | ) | | | (1.63 | ) |
| | 2016 - Service | | | 16.36 | | | | 0.22 | | | | 0.96 | | | | 1.18 | | | | (0.11 | ) | | | (1.44 | ) | | | (1.55 | ) |
| | 2016 - Investor(f) | | | 16.47 | | | | 0.27 | | | | 0.97 | | | | 1.24 | | | | (0.16 | ) | | | (1.44 | ) | | | (1.60 | ) |
| | 2016 - R | | | 16.12 | | | | 0.20 | | | | 0.94 | | | | 1.14 | | | | (0.09 | ) | | | (1.44 | ) | | | (1.53 | ) |
| | 2016 - R6 | | | 16.61 | | | | 0.31 | | | | 0.96 | | | | 1.27 | | | | (0.19 | ) | | | (1.44 | ) | | | (1.63 | ) |
| | 2015 - A | | | 18.50 | | | | 0.16 | | | | (1.11 | ) | | | (0.95 | ) | | | (0.14 | ) | | | (0.96 | ) | | | (1.10 | ) |
| | 2015 - C | | | 17.86 | | | | 0.03 | | | | (1.08 | ) | | | (1.05 | ) | | | (0.02 | ) | | | (0.96 | ) | | | (0.98 | ) |
| | 2015 - Institutional | | | 18.67 | | | | 0.24 | | | | (1.12 | ) | | | (0.88 | ) | | | (0.22 | ) | | | (0.96 | ) | | | (1.18 | ) |
| | 2015 - Service | | | 18.42 | | | | 0.15 | | | | (1.11 | ) | | | (0.96 | ) | | | (0.14 | ) | | | (0.96 | ) | | | (1.10 | ) |
| | 2015 - Investor(f) | | | 18.34 | | | | 0.21 | | | | (1.12 | ) | | | (0.91 | ) | | | — | | | | (0.96 | ) | | | (0.96 | ) |
| | 2015 - R | | | 18.17 | | | | 0.12 | | | | (1.09 | ) | | | (0.97 | ) | | | (0.12 | ) | | | (0.96 | ) | | | (1.08 | ) |
| | 2015 - R6 (Commenced July 31, 2015) | | | 17.88 | | | | 0.03 | | | | (1.30 | ) | | | (1.27 | ) | | | — | | | | — | | | | — | |
| | 2014 - A | | | 15.06 | | | | 0.13 | | | | 3.41 | | | | 3.54 | | | | (0.10 | ) | | | — | | | | (0.10 | ) |
| | 2014 - C | | | 14.56 | | | | — | (e) | | | 3.31 | | | | 3.31 | | | | (0.01 | ) | | | — | | | | (0.01 | ) |
| | 2014 - Institutional | | | 15.20 | | | | 0.19 | | | | 3.45 | | | | 3.64 | | | | (0.17 | ) | | | — | | | | (0.17 | ) |
| | 2014 - Service | | | 14.99 | | | | 0.11 | | | | 3.40 | | | | 3.51 | | | | (0.08 | ) | | | — | | | | (0.08 | ) |
| | 2014 - Investor(f) | | | 14.94 | | | | 0.17 | | | | 3.38 | | | | 3.55 | | | | (0.15 | ) | | | — | | | | (0.15 | ) |
| | 2014 - R | | | 14.80 | | | | 0.08 | | | | 3.36 | | | | 3.44 | | | | (0.07 | ) | | | — | | | | (0.07 | ) |
| | 2013 - A | | | 12.13 | | | | 0.12 | | | | 2.95 | | | | 3.07 | | | | (0.14 | ) | | | — | | | | (0.14 | ) |
| | 2013 - C | | | 11.74 | | | | 0.01 | | | | 2.86 | | | | 2.87 | | | | (0.05 | ) | | | — | | | | (0.05 | ) |
| | 2013 - Institutional | | | 12.26 | | | | 0.17 | | | | 2.97 | | | | 3.14 | | | | (0.20 | ) | | | — | | | | (0.20 | ) |
| | 2013 - Service | | | 12.06 | | | | 0.10 | | | | 2.94 | | | | 3.04 | | | | (0.11 | ) | | | — | | | | (0.11 | ) |
| | 2013 - Investor(f) | | | 12.05 | | | | 0.15 | | | | 2.92 | | | | 3.07 | | | | (0.18 | ) | | | — | | | | (0.18 | ) |
| | 2013 - R | | | 11.93 | | | | 0.08 | | | | 2.90 | | | | 2.98 | | | | (0.11 | ) | | | — | | | | (0.11 | ) |
| | (a) | | Calculated based on the average shares outstanding methodology. |
| | (b) | | Assumes investment at the NAV at the beginning of the year, reinvestment of all dividends and distributions, a complete redemption of the investment at the NAV at the end of the year and no sales or redemption charges. Total returns would be reduced if a sales or redemption charge was taken into account. Returns do not reflect the impact of taxes to shareholders relating to Fund distributions or the redemption of Fund shares. Total returns for periods less than one full year are not annualized. |
| | (c) | | The Fund’s portfolio turnover rate is calculated in accordance with regulatory requirements, without regard to transactions involving short term investments. If such transactions were included, the Fund’s portfolio turnover rate may be higher. |
| | (e) | | Amount is less than $0.005 per share. |
| | (f) | | Effective before the opening of business on August 15, 2017, Class IR Shares were designated as Investor Shares. |
| | |
| 74 | | The accompanying notes are an integral part of these financial statements. |
GOLDMAN SACHS LARGE CAP VALUE FUND
| | | | | | | | | | | | | | | | | | | | | | | | | | | | | | | | | | | | | | | | |
| | | | | | | | | | | | | | | | | | | | | | | | | | | | | | | | | | |
| | | Net asset
value, end
of year | | | | | Total
return(b) | | | | | Net assets,
end of
year
(in 000s) | | | | | Ratio of
net expenses
to average
net assets | | | | | Ratio of
total expenses
to average
net assets | | | | | Ratio of
net investment
income (loss)
to average
net assets | | | | | Portfolio
turnover
rate(c) | |
| | | | | | | | | | | | | | | | | | | | | | | | | | | | | | | | | | | | | | | | |
| | $ | 17.25 | | | | | | 9.04 | % | | | | $ | 153,608 | | | | | | 1.14 | % | | | | | 1.22 | % | | | | | 1.14 | % | | | | | 124 | % |
| | | 16.51 | | | | | | 8.18 | | | | | | 39,403 | | | | | | 1.89 | | | | | | 1.97 | | | | | | 0.41 | | | | | | 124 | |
| | | 17.42 | | | | | | 9.41 | | | | | | 645,552 | | | | | | 0.78 | | | | | | 0.82 | | | | | | 1.46 | | | | | | 124 | |
| | | 17.14 | | | | | | 8.80 | | | | | | 2,914 | | | | | | 1.28 | | | | | | 1.32 | | | | | | 1.01 | | | | | | 124 | |
| | | 17.28 | | | | | | 9.26 | | | | | | 6,516 | | | | | | 0.88 | | | | | | 0.97 | | | | | | 1.47 | | | | | | 124 | |
| | | 16.86 | | | | | | 8.73 | | | | | | 6,204 | | | | | | 1.39 | | | | | | 1.47 | | | | | | 0.90 | | | | | | 124 | |
| | | 17.45 | | | | | | 9.63 | | | | | | 11 | | | | | | 0.76 | | | | | | 0.79 | | | | | | 1.27 | | | | | | 124 | |
| | | 16.08 | | | | | | 7.73 | | | | | | 197,754 | | | | | | 1.18 | | | | | | 1.22 | | | | | | 1.54 | | | | | | 116 | |
| | | 15.43 | | | | | | 7.01 | | | | | | 41,587 | | | | | | 1.93 | | | | | | 1.97 | | | | | | 0.79 | | | | | | 116 | |
| | | 16.25 | | | | | | 8.17 | | | | | | 905,400 | | | | | | 0.78 | | | | | | 0.82 | | | | | | 1.93 | | | | | | 116 | |
| | | 15.99 | | | | | | 7.67 | | | | | | 3,549 | | | | | | 1.28 | | | | | | 1.32 | | | | | | 1.45 | | | | | | 116 | |
| | | 16.11 | | | | | | 8.05 | | | | | | 3,654 | | | | | | 0.93 | | | | | | 0.97 | | | | | | 1.77 | | | | | | 116 | |
| | | 15.73 | | | | | | 7.51 | | | | | | 7,130 | | | | | | 1.43 | | | | | | 1.47 | | | | | | 1.30 | | | | | | 116 | |
| | | 16.25 | | | | | | 8.21 | | | | | | 121,773 | | | | | | 0.76 | | | | | | 0.80 | | | | | | 2.05 | | | | | | 116 | |
| | | 16.45 | | | | | | (5.51 | ) | | | | | 234,810 | | | | | | 1.17 | | | | | | 1.20 | | | | | | 0.92 | | | | | | 79 | |
| | | 15.83 | | | | | | (6.28 | ) | | | | | 42,221 | | | | | | 1.92 | | | | | | 1.95 | | | | | | 0.16 | | | | | | 79 | |
| | | 16.61 | | | | | | (5.13 | ) | | | | | 1,037,653 | | | | | | 0.77 | | | | | | 0.80 | | | | | | 1.31 | | | | | | 79 | |
| | | 16.36 | | | | | | (5.63 | ) | | | | | 4,294 | | | | | | 1.27 | | | | | | 1.30 | | | | | | 0.84 | | | | | | 79 | |
| | | 16.47 | | | | | | (5.29 | ) | | | | | 6,878 | | | | | | 0.92 | | | | | | 0.95 | | | | | | 1.17 | | | | | | 79 | |
| | | 16.12 | | | | | | (5.77 | ) | | | | | 7,710 | | | | | | 1.42 | | | | | | 1.45 | | | | | | 0.66 | | | | | | 79 | |
| | | 16.61 | | | | | | (7.10 | ) | | | | | 9 | | | | | | 0.77 | (d) | | | | | 0.81 | (d) | | | | | 2.01 | (d) | | | | | 79 | |
| | | 18.50 | | | | | | 23.62 | | | | | | 260,256 | | | | | | 1.19 | | | | | | 1.20 | | | | | | 0.74 | | | | | | 67 | |
| | | 17.86 | | | | | | 22.73 | | | | | | 45,535 | | | | | | 1.94 | | | | | | 1.95 | | | | | | (0.01 | ) | | | | | 67 | |
| | | 18.67 | | | | | | 24.15 | | | | | | 1,206,895 | | | | | | 0.79 | | | | | | 0.80 | | | | | | 1.14 | | | | | | 67 | |
| | | 18.42 | | | | | | 23.53 | | | | | | 3,185 | | | | | | 1.29 | | | | | | 1.30 | | | | | | 0.64 | | | | | | 67 | |
| | | 18.34 | | | | | | 23.93 | | | | | | 6,618 | | | | | | 0.95 | | | | | | 0.95 | | | | | | 1.05 | | | | | | 67 | |
| | | 18.17 | | | | | | 23.33 | | | | | | 7,705 | | | | | | 1.44 | | | | | | 1.45 | | | | | | 0.49 | | | | | | 67 | |
| | | 15.06 | | | | | | 25.56 | | | | | | 229,781 | | | | | | 1.20 | | | | | | 1.20 | | | | | | 0.89 | | | | | | 98 | |
| | | 14.56 | | | | | | 24.56 | | | | | | 37,763 | | | | | | 1.95 | | | | | | 1.95 | | | | | | 0.08 | | | | | | 98 | |
| | | 15.20 | | | | | | 25.95 | | | | | | 1,048,489 | | | | | | 0.80 | | | | | | 0.80 | | | | | | 1.22 | | | | | | 98 | |
| | | 14.99 | | | | | | 25.39 | | | | | | 2,985 | | | | | | 1.30 | | | | | | 1.30 | | | | | | 0.74 | | | | | | 98 | |
| | | 14.94 | | | | | | 25.82 | | | | | | 141,673 | | | | | | 0.95 | | | | | | 0.95 | | | | | | 1.07 | | | | | | 98 | |
| | | 14.80 | | | | | | 25.22 | | | | | | 6,702 | | | | | | 1.45 | | | | | | 1.45 | | | | | | 0.58 | | | | | | 98 | |
| | |
| The accompanying notes are an integral part of these financial statements. | | 75 |
GOLDMAN SACHS MID CAP VALUE FUND
Financial Highlights
Selected Data for a Share Outstanding Throughout Each Year
| | | | | | | | | | | | | | | | | | | | | | | | | | | | | | |
| | | | | | | | From
investment operations | | | Distributions
to shareholders | |
| | | Year - Share Class | | Net asset
value,
beginning
of year | | | Net
investment
income
(loss)(a) | | | Net realized
and unrealized
gain (loss) | | | Total from
investment
operations | | | From net
investment
income | | | From net
realized
gains | | | Total
distributions | |
| | FOR THE FISCAL YEARS ENDED AUGUST 31, | | | | | | | | | |
| | 2017 - A | | $ | 35.25 | | | $ | 0.19 | | | $ | 3.20 | | | $ | 3.39 | | | $ | (0.37 | ) | | $ | — | | | $ | (0.37 | ) |
| | 2017 - C | | | 32.00 | | | | (0.09 | ) | | | 2.92 | | | | 2.83 | | | | (0.15 | ) | | | — | | | | (0.15 | ) |
| | 2017 - Institutional | | | 35.64 | | | | 0.34 | | | | 3.25 | | | | 3.59 | | | | (0.55 | ) | | | — | | | | (0.55 | ) |
| | 2017 - Service | | | 34.63 | | | | 0.15 | | | | 3.15 | | | | 3.30 | | | | (0.32 | ) | | | — | | | | (0.32 | ) |
| | 2017 - Investor(f) | | | 34.63 | | | | 0.27 | | | | 3.17 | | | | 3.44 | | | | (0.50 | ) | | | — | | | | (0.50 | ) |
| | 2017 - R | | | 34.38 | | | | 0.09 | | | | 3.13 | | | | 3.22 | | | | (0.32 | ) | | | — | | | | (0.32 | ) |
| | 2017 - R6 | | | 35.64 | | | | 0.36 | | | | 3.22 | | | | 3.58 | | | | (0.56 | ) | | | — | | | | (0.56 | ) |
| | 2016 - A | | | 38.81 | | | | 0.32 | | | | 0.56 | | | | 0.88 | | | | (0.10 | ) | | | (4.34 | ) | | | (4.44 | ) |
| | 2016 - C | | | 35.80 | | | | 0.05 | | | | 0.49 | | | | 0.54 | | | | — | | | | (4.34 | ) | | | (4.34 | ) |
| | 2016 - Institutional | | | 39.22 | | | | 0.46 | | | | 0.56 | | | | 1.02 | | | | (0.26 | ) | | | (4.34 | ) | | | (4.60 | ) |
| | 2016 - Service | | | 38.21 | | | | 0.28 | | | | 0.54 | | | | 0.82 | | | | (0.06 | ) | | | (4.34 | ) | | | (4.40 | ) |
| | 2016 - Investor(f) | | | 38.23 | | | | 0.39 | | | | 0.55 | | | | 0.94 | | | | (0.20 | ) | | | (4.34 | ) | | | (4.54 | ) |
| | 2016 - R | | | 38.00 | | | | 0.22 | | | | 0.55 | | | | 0.77 | | | | (0.05 | ) | | | (4.34 | ) | | | (4.39 | ) |
| | 2016 - R6 | | | 39.23 | | | | 0.47 | | | | 0.56 | | | | 1.03 | | | | (0.28 | ) | | | (4.34 | ) | | | (4.62 | ) |
| | 2015 - A | | | 49.03 | | | | 0.13 | | | | (1.75 | ) | | | (1.62 | ) | | | (0.13 | ) | | | (8.47 | ) | | | (8.60 | ) |
| | 2015 - C | | | 46.05 | | | | (0.19 | ) | | | (1.59 | ) | | | (1.78 | ) | | | — | (d) | | | (8.47 | ) | | | (8.47 | ) |
| | 2015 - Institutional | | | 49.55 | | | | 0.29 | | | | (1.75 | ) | | | (1.46 | ) | | | (0.40 | ) | | | (8.47 | ) | | | (8.87 | ) |
| | 2015 - Service | | | 48.40 | | | | 0.08 | | | | (1.71 | ) | | | (1.63 | ) | | | (0.09 | ) | | | (8.47 | ) | | | (8.56 | ) |
| | 2015 - Investor(f) | | | 48.52 | | | | 0.22 | | | | (1.70 | ) | | | (1.48 | ) | | | (0.34 | ) | | | (8.47 | ) | | | (8.81 | ) |
| | 2015 - R | | | 48.28 | | | | — | (d) | | | (1.69 | ) | | | (1.69 | ) | | | (0.12 | ) | | | (8.47 | ) | | | (8.59 | ) |
| | 2015 - R6 (Commenced July 31, 2015) | | | 41.24 | | | | (0.02 | ) | | | (1.99 | ) | | | (2.01 | ) | | | — | | | | — | | | | — | |
| | 2014 - A | | | 46.08 | | | | 0.18 | | | | 10.10 | | | | 10.28 | | | | (0.22 | ) | | | (7.11 | ) | | | (7.33 | ) |
| | 2014 - C | | | 43.79 | | | | (0.17 | ) | | | 9.54 | | | | 9.37 | | | | — | | | | (7.11 | ) | | | (7.11 | ) |
| | 2014 - Institutional | | | 46.52 | | | | 0.36 | | | | 10.19 | | | | 10.55 | | | | (0.41 | ) | | | (7.11 | ) | | | (7.52 | ) |
| | 2014 - Service | | | 45.59 | | | | 0.13 | | | | 9.97 | | | | 10.10 | | | | (0.18 | ) | | | (7.11 | ) | | | (7.29 | ) |
| | 2014 - Investor(f) | | | 45.70 | | | | 0.30 | | | | 9.98 | | | | 10.28 | | | | (0.35 | ) | | | (7.11 | ) | | | (7.46 | ) |
| | 2014 - R | | | 45.54 | | | | 0.05 | | | | 9.97 | | | | 10.02 | | | | (0.17 | ) | | | (7.11 | ) | | | (7.28 | ) |
| | 2013 - A | | | 37.43 | | | | 0.24 | | | | 8.75 | | | | 8.99 | | | | (0.34 | ) | | | — | | | | (0.34 | ) |
| | 2013 - C | | | 35.57 | | | | (0.07 | ) | | | 8.34 | | | | 8.27 | | | | (0.05 | ) | | | — | | | | (0.05 | ) |
| | 2013 - Institutional | | | 37.77 | | | | 0.41 | | | | 8.83 | | | | 9.24 | | | | (0.49 | ) | | | — | | | | (0.49 | ) |
| | 2013 - Service | | | 37.02 | | | | 0.19 | | | | 8.67 | | | | 8.86 | | | | (0.29 | ) | | | — | | | | (0.29 | ) |
| | 2013 - Investor(f) | | | 37.12 | | | | 0.34 | | | | 8.68 | | | | 9.02 | | | | (0.44 | ) | | | — | | | | (0.44 | ) |
| | 2013 - R | | | 37.04 | | | | 0.12 | | | | 8.67 | | | | 8.79 | | | | (0.29 | ) | | | — | | | | (0.29 | ) |
| | (a) | | Calculated based on the average shares outstanding methodology. |
| | (b) | | Assumes investment at the NAV at the beginning of the year, reinvestment of all dividends and distributions, a complete redemption of the investment at the NAV at the end of the year and no sales or redemption charges. Total returns would be reduced if a sales or redemption charge was taken into account. Returns do not reflect the impact of taxes to shareholders relating to Fund distributions or the redemption of Fund shares. Total returns for periods less than one full year are not annualized. |
| | (c) | | The Fund’s portfolio turnover rate is calculated in accordance with regulatory requirements, without regard to transactions involving short term investments. If such transactions were included, the Fund’s portfolio turnover rate may be higher. |
| | (d) | | Amount is less than $0.005 per share. |
| | (f) | | Effective before the opening of business on August 15, 2017, Class IR Shares were designated as Investor Shares. |
| | |
| 76 | | The accompanying notes are an integral part of these financial statements. |
GOLDMAN SACHS MID CAP VALUE FUND
| | | | | | | | | | | | | | | | | | | | | | | | | | | | | | | | | | | | | | | | |
| | | | | | | | | | | | | | | | | | | | | | | | | | | | | | | | | | |
| | | Net asset
value, end
of year | | | | | Total
return(b) | | | | | Net assets,
end of
year
(in 000s) | | | | | Ratio of
net expenses
to average
net assets | | | | | Ratio of
total expenses
to average
net assets | | | | | Ratio of
net investment
income (loss)
to average
net assets | | | | | Portfolio
turnover
rate(c) | |
| | | | | | | | | | | | | | | | | | | | | | | | | | | | | | | | | | | | | | | | |
| | $ | 38.27 | | | | | | 9.66 | % | | | | $ | 851,681 | | | | | | 1.17 | % | | | | | 1.17 | % | | | | | 0.51 | % | | | | | 124 | % |
| | | 34.68 | | | | | | 8.86 | | | | | | 102,928 | | | | | | 1.92 | | | | | | 1.92 | | | | | | (0.25 | ) | | | | | 124 | |
| | | 38.68 | | | | | | 10.12 | | | | | | 1,424,886 | | | | | | 0.77 | | | | | | 0.77 | | | | | | 0.91 | | | | | | 124 | |
| | | 37.61 | | | | | | 9.56 | | | | | | 87,438 | | | | | | 1.27 | | | | | | 1.28 | | | | | | 0.40 | | | | | | 124 | |
| | | 37.57 | | | | | | 9.94 | | | | | | 77,446 | | | | | | 0.92 | | | | | | 0.92 | | | | | | 0.73 | | | | | | 124 | |
| | | 37.28 | | | | | | 9.40 | | | | | | 34,193 | | | | | | 1.42 | | | | | | 1.43 | | | | | | 0.25 | | | | | | 124 | |
| | | 38.66 | | | | | | 10.13 | | | | | | 73,505 | | | | | | 0.75 | | | | | | 0.75 | | | | | | 0.97 | | | | | | 124 | |
| | | 35.25 | | | | | | 3.00 | | | | | | 1,363,093 | | | | | | 1.15 | | | | | | 1.15 | | | | | | 0.92 | | | | | | 111 | |
| | | 32.00 | | | | | | 2.20 | | | | | | 141,081 | | | | | | 1.90 | | | | | | 1.90 | | | | | | 0.16 | | | | | | 111 | |
| | | 35.64 | | | | | | 3.39 | | | | | | 3,687,681 | | | | | | 0.75 | | | | | | 0.75 | | | | | | 1.31 | | | | | | 111 | |
| | | 34.63 | | | | | | 2.87 | | | | | | 139,677 | | | | | | 1.25 | | | | | | 1.25 | | | | | | 0.84 | | | | | | 111 | |
| | | 34.63 | | | | | | 3.24 | | | | | | 220,429 | | | | | | 0.90 | | | | | | 0.90 | | | | | | 1.16 | | | | | | 111 | |
| | | 34.38 | | | | | | 2.72 | | | | | | 40,111 | | | | | | 1.40 | | | | | | 1.40 | | | | | | 0.66 | | | | | | 111 | |
| | | 35.64 | | | | | | 3.41 | | | | | | 372,313 | | | | | | 0.73 | | | | | | 0.73 | | | | | | 1.39 | | | | | | 111 | |
| | | 38.81 | | | | | | (4.21 | ) | | | | | 1,876,387 | | | | | | 1.14 | | | | | | 1.14 | | | | | | 0.31 | | | | | | 95 | |
| | | 35.80 | | | | | | (4.91 | ) | | | | | 180,780 | | | | | | 1.89 | | | | | | 1.89 | | | | | | (0.47 | ) | | | | | 95 | |
| | | 39.22 | | | | | | (3.82 | ) | | | | | 5,868,055 | | | | | | 0.74 | | | | | | 0.74 | | | | | | 0.68 | | | | | | 95 | |
| | | 38.21 | | | | | | (4.30 | ) | | | | | 222,149 | | | | | | 1.24 | | | | | | 1.24 | | | | | | 0.19 | | | | | | 95 | |
| | | 38.23 | | | | | | (3.96 | ) | | | | | 304,390 | | | | | | 0.89 | | | | | | 0.89 | | | | | | 0.52 | | | | | | 95 | |
| | | 38.00 | | | | | | (4.45 | ) | | | | | 42,277 | | | | | | 1.39 | | | | | | 1.39 | | | | | | 0.01 | | | | | | 95 | |
| | | 39.23 | | | | | | (4.87 | ) | | | | | 10 | | | | | | 0.73 | (e) | | | | | 0.73 | (e) | | | | | (0.62 | )(e) | | | | | 95 | |
| | | 49.03 | | | | | | 24.77 | | | | | | 3,153,971 | | | | | | 1.14 | | | | | | 1.14 | | | | | | 0.38 | | | | | | 87 | |
| | | 46.05 | | | | | | 23.81 | | | | | | 202,083 | | | | | | 1.89 | | | | | | 1.89 | | | | | | (0.38 | ) | | | | | 87 | |
| | | 49.55 | | | | | | 25.25 | | | | | | 6,347,006 | | | | | | 0.74 | | | | | | 0.74 | | | | | | 0.77 | | | | | | 87 | |
| | | 48.40 | | | | | | 24.63 | | | | | | 368,720 | | | | | | 1.24 | | | | | | 1.24 | | | | | | 0.28 | | | | | | 87 | |
| | | 48.52 | | | | | | 25.07 | | | | | | 295,017 | | | | | | 0.89 | | | | | | 0.89 | | | | | | 0.66 | | | | | | 87 | |
| | | 48.28 | | | | | | 24.44 | | | | | | 35,896 | | | | | | 1.39 | | | | | | 1.39 | | | | | | 0.12 | | | | | | 87 | |
| | | 46.08 | | | | | | 24.20 | | | | | | 3,297,185 | | | | | | 1.14 | | | | | | 1.14 | | | | | | 0.58 | | | | | | 103 | |
| | | 43.79 | | | | | | 23.29 | | | | | | 174,875 | | | | | | 1.89 | | | | | | 1.89 | | | | | | (0.18 | ) | | | | | 103 | |
| | | 46.52 | | | | | | 24.74 | | | | | | 5,328,684 | | | | | | 0.74 | | | | | | 0.74 | | | | | | 0.96 | | | | | | 103 | |
| | | 45.59 | | | | | | 24.11 | | | | | | 334,583 | | | | | | 1.24 | | | | | | 1.24 | | | | | | 0.47 | | | | | | 103 | |
| | | 45.70 | | | | | | 24.54 | | | | | | 97,243 | | | | | | 0.89 | | | | | | 0.89 | | | | | | 0.80 | | | | | | 103 | |
| | | 45.54 | | | | | | 23.91 | | | | | | 24,201 | | | | | | 1.39 | | | | | | 1.39 | | | | | | 0.28 | | | | | | 103 | |
| | |
| The accompanying notes are an integral part of these financial statements. | | 77 |
GOLDMAN SACHS SMALL CAP VALUE FUND
Financial Highlights
Selected Data for a Share Outstanding Throughout Each Year
| | | | | | | | | | | | | | | | | | | | | | | | | | | | | | |
| | | | | | | | From
investment operations | | | Distributions
to shareholders | |
| | | Year - Share Class | | Net asset
value,
beginning
of year | | | Net
investment
income
(loss)(a) | | | Net realized
and unrealized
gain (loss) | | | Total from
investment
operations | | | From net
investment
income | | | From net
realized
gains | | | Total
distributions | |
| | FOR THE FISCAL YEARS ENDED AUGUST 31, | | | | | | | | | |
| | 2017 - A | | $ | 52.52 | | | $ | 0.16 | | | $ | 5.92 | | | $ | 6.08 | | | $ | (0.22 | ) | | $ | (1.75 | ) | | $ | (1.97 | ) |
| | 2017 - C | | | 41.75 | | | | (0.20 | ) | | | 4.70 | | | | 4.50 | | | | — | | | | (1.75 | ) | | | (1.75 | ) |
| | 2017 - Institutional | | | 56.20 | | | | 0.41 | | | | 6.34 | | | | 6.75 | | | | (0.42 | ) | | | (1.75 | ) | | | (2.17 | ) |
| | 2017 - Service | | | 51.10 | | | | 0.09 | | | | 5.77 | | | | 5.86 | | | | (0.17 | ) | | | (1.75 | ) | | | (1.92 | ) |
| | 2017 - Investor(h) | | | 52.23 | | | | 0.29 | | | | 5.90 | | | | 6.19 | | | | (0.35 | ) | | | (1.75 | ) | | | (2.10 | ) |
| | 2017 - R | | | 51.62 | | | | 0.02 | | | | 5.82 | | | | 5.84 | | | | (0.11 | ) | | | (1.75 | ) | | | (1.86 | ) |
| | 2017 - R6 | | | 56.19 | | | | 0.38 | | | | 6.39 | | | | 6.77 | | | | (0.44 | ) | | | (1.75 | ) | | | (2.19 | ) |
| | 2016 - A | | | 49.78 | | | | 0.20 | | | | 5.11 | | | | 5.31 | | | | (0.16 | ) | | | (2.41 | ) | | | (2.57 | ) |
| | 2016 - C | | | 40.23 | | | | (0.13 | ) | | | 4.06 | | | | 3.93 | | | | — | (d) | | | (2.41 | ) | | | (2.41 | ) |
| | 2016 - Institutional | | | 53.10 | | | | 0.42 | | | | 5.45 | | | | 5.87 | | | | (0.36 | ) | | | (2.41 | ) | | | (2.77 | ) |
| | 2016 - Service | | | 48.50 | | | | 0.15 | | | | 4.96 | | | | 5.11 | | | | (0.10 | ) | | | (2.41 | ) | | | (2.51 | ) |
| | 2016 - Investor(h) | | | 49.55 | | | | 0.32 | | | | 5.07 | | | | 5.39 | | | | (0.30 | ) | | | (2.41 | ) | | | (2.71 | ) |
| | 2016 - R | | | 48.95 | | | | 0.08 | | | | 5.03 | | | | 5.11 | | | | (0.03 | ) | | | (2.41 | ) | | | (2.44 | ) |
| | 2016 - R6 | | | 53.10 | | | | 0.37 | | | | 5.51 | | | | 5.88 | | | | (0.38 | ) | | | (2.41 | ) | | | (2.79 | ) |
| | 2015 - A | | | 55.40 | | | | 0.16 | (e) | | | (1.32 | ) | | | (1.16 | ) | | | (0.10 | ) | | | (4.36 | ) | | | (4.46 | ) |
| | 2015 - C | | | 45.84 | | | | (0.19 | )(e) | | | (1.06 | ) | | | (1.25 | ) | | | — | | | | (4.36 | ) | | | (4.36 | ) |
| | 2015 - Institutional | | | 58.80 | | | | 0.39 | (e) | | | (1.40 | ) | | | (1.01 | ) | | | (0.33 | ) | | | (4.36 | ) | | | (4.69 | ) |
| | 2015 - Service | | | 54.08 | | | | 0.11 | (e) | | | (1.29 | ) | | | (1.18 | ) | | | (0.04 | ) | | | (4.36 | ) | | | (4.40 | ) |
| | 2015 - Investor(h) | | | 55.18 | | | | 0.28 | (e) | | | (1.30 | ) | | | (1.02 | ) | | | (0.25 | ) | | | (4.36 | ) | | | (4.61 | ) |
| | 2015 - R | | | 54.58 | | | | 0.03 | (e) | | | (1.30 | ) | | | (1.27 | ) | | | — | | | | (4.36 | ) | | | (4.36 | ) |
| | 2015 - R6 (Commenced July 31, 2015) | | | 56.15 | | | | (0.03 | )(e) | | | (3.02 | ) | | | (3.05 | ) | | | — | | | | — | | | | — | |
| | 2014 - A | | | 50.43 | | | | 0.12 | | | | 9.94 | | | | 10.06 | | | | (0.18 | ) | | | (4.91 | ) | | | (5.09 | )�� |
| | 2014 - C | | | 42.64 | | | | (0.25 | ) | | | 8.36 | | | | 8.11 | | | | — | | | | (4.91 | ) | | | (4.91 | ) |
| | 2014 - Institutional | | | 53.22 | | | | 0.33 | | | | 10.53 | | | | 10.86 | | | | (0.37 | ) | | | (4.91 | ) | | | (5.28 | ) |
| | 2014 - Service | | | 49.36 | | | | 0.05 | | | | 9.74 | | | | 9.79 | | | | (0.16 | ) | | | (4.91 | ) | | | (5.07 | ) |
| | 2014 - Investor(h) | | | 50.25 | | | | 0.23 | | | | 9.93 | | | | 10.16 | | | | (0.32 | ) | | | (4.91 | ) | | | (5.23 | ) |
| | 2014 - R | | | 49.80 | | | | (0.03 | ) | | | 9.82 | | | | 9.79 | | | | (0.10 | ) | | | (4.91 | ) | | | (5.01 | ) |
| | 2013 - A | | | 43.11 | | | | 0.35 | (g) | | | 9.73 | | | | 10.08 | | | | (0.48 | ) | | | (2.28 | ) | | | (2.76 | ) |
| | 2013 - C | | | 36.89 | | | | 0.01 | (g) | | | 8.25 | | | | 8.26 | | | | (0.23 | ) | | | (2.28 | ) | | | (2.51 | ) |
| | 2013 - Institutional | | | 45.36 | | | | 0.55 | (g) | | | 10.26 | | | | 10.81 | | | | (0.67 | ) | | | (2.28 | ) | | | (2.95 | ) |
| | 2013 - Service | | | 42.30 | | | | 0.30 | (g) | | | 9.52 | | | | 9.82 | | | | (0.48 | ) | | | (2.28 | ) | | | (2.76 | ) |
| | 2013 - Investor(h) | | | 43.00 | | | | 0.41 | (g) | | | 9.74 | | | | 10.15 | | | | (0.62 | ) | | | (2.28 | ) | | | (2.90 | ) |
| | 2013 - R | | | 42.65 | | | | 0.19 | (g) | | | 9.65 | | | | 9.84 | | | | (0.41 | ) | | | (2.28 | ) | | | (2.69 | ) |
| | (a) | | Calculated based on the average shares outstanding methodology. |
| | (b) | | Assumes investment at the NAV at the beginning of the year, reinvestment of all dividends and distributions, a complete redemption of the investment at the NAV at the end of the year and no sales or redemption charges. Total returns would be reduced if a sales or redemption charge was taken into account. Returns do not reflect the impact of taxes to shareholders relating to Fund distributions or the redemption of Fund shares. Total returns for periods less than one full year are not annualized. |
| | (c) | | The Fund’s portfolio turnover rate is calculated in accordance with regulatory requirements, without regard to transactions involving short term investments. If such transactions were included, the Fund’s portfolio turnover rate may be higher. |
| | (d) | | Amount is less than $0.005 per share. |
| | (e) | | Reflects income recognized from special dividends which amounted to $0.10 per share and 0.18% of average net assets. |
| | (g) | | Reflects income recognized from special dividends which amounted to $0.26 per share and 0.55% of average net assets. |
| | (h) | | Effective before the opening of business on August 15, 2017, Class IR Shares were designated as Investor Shares. |
| | |
| 78 | | The accompanying notes are an integral part of these financial statements. |
GOLDMAN SACHS SMALL CAP VALUE FUND
| | | | | | | | | | | | | | | | | | | | | | | | | | | | | | | | | | | | | | | | |
| | | | | | | | | | | | | | | | | | | | | | | | | | | | | | | | | | |
| | | Net asset
value, end
of year | | | | | Total
return(b) | | | | | Net assets,
end of
year
(in 000s) | | | | | Ratio of
net expenses
to average
net assets | | | | | Ratio of
total expenses
to average
net assets | | | | | Ratio of
net investment
income (loss)
to average
net assets | | | | | Portfolio
turnover
rate(c) | |
| | | | | | | | | | | | | | | | | | | | | | | | | | | | | | | | | | | | | | | | |
| | $ | 56.63 | | | | | | 11.56 | % | | | | $ | 851,497 | | | | | | 1.34 | % | | | | | 1.38 | % | | | | | 0.29 | % | | | | | 68 | % |
| | | 44.50 | | | | | | 10.72 | | | | | | 37,357 | | | | | | 2.09 | | | | | | 2.13 | | | | | | (0.45 | ) | | | | | 68 | |
| | | 60.78 | | | | | | 12.00 | | | | | | 4,393,986 | | | | | | 0.94 | | | | | | 0.98 | | | | | | 0.69 | | | | | | 68 | |
| | | 55.04 | | | | | | 11.44 | | | | | | 145,996 | | | | | | 1.44 | | | | | | 1.48 | | | | | | 0.17 | | | | | | 68 | |
| | | 56.32 | | | | | | 11.84 | | | | | | 168,986 | | | | | | 1.09 | | | | | | 1.13 | | | | | | 0.53 | | | | | | 68 | |
| | | 55.60 | | | | | | 11.28 | | | | | | 124,039 | | | | | | 1.59 | | | | | | 1.63 | | | | | | 0.04 | | | | | | 68 | |
| | | 60.77 | | | | | | 12.03 | | | | | | 759,095 | | | | | | 0.92 | | | | | | 0.96 | | | | | | 0.63 | | | | | | 68 | |
| | | 52.52 | | | | | | 11.22 | | | | | | 928,091 | | | | | | 1.35 | | | | | | 1.39 | | | | | | 0.42 | | | | | | 46 | |
| | | 41.75 | | | | | | 10.40 | | | | | | 47,925 | | | | | | 2.10 | | | | | | 2.14 | | | | | | (0.33 | ) | | | | | 46 | |
| | | 56.20 | | | | | | 11.66 | | | | | | 4,476,848 | | | | | | 0.95 | | | | | | 0.99 | | | | | | 0.82 | | | | | | 46 | |
| | | 51.10 | | | | | | 11.11 | | | | | | 119,315 | | | | | | 1.45 | | | | | | 1.49 | | | | | | 0.32 | | | | | | 46 | |
| | | 52.23 | | | | | | 11.50 | | | | | | 162,661 | | | | | | 1.10 | | | | | | 1.14 | | | | | | 0.67 | | | | | | 46 | |
| | | 51.62 | | | | | | 10.96 | | | | | | 122,526 | | | | | | 1.60 | | | | | | 1.64 | | | | | | 0.18 | | | | | | 46 | |
| | | 56.19 | | | | | | 11.68 | | | | | | 317,289 | | | | | | 0.93 | | | | | | 0.98 | | | | | | 0.71 | | | | | | 46 | |
| | | 49.78 | | | | | | (2.31 | ) | | | | | 950,196 | | | | | | 1.34 | | | | | | 1.39 | | | | | | 0.30(e | ) | | | | | 49 | |
| | | 40.23 | | | | | | (3.04 | ) | | | | | 59,341 | | | | | | 2.09 | | | | | | 2.14 | | | | | | (0.45 | )(e) | | | | | 49 | |
| | | 53.10 | | | | | | (1.92 | ) | | | �� | | 4,503,821 | | | | | | 0.94 | | | | | | 0.99 | | | | | | 0.70 | (e) | | | | | 49 | |
| | | 48.50 | | | | | | (2.41 | ) | | | | | 134,195 | | | | | | 1.44 | | | | | | 1.49 | | | | | | 0.21 | (e) | | | | | 49 | |
| | | 49.55 | | | | | | (2.07 | ) | | | | | 128,838 | | | | | | 1.09 | | | | | | 1.14 | | | | | | 0.54 | (e) | | | | | 49 | |
| | | 48.95 | | | | | | (2.56 | ) | | | | | 136,644 | | | | | | 1.59 | | | | | | 1.64 | | | | | | 0.05 | (e) | | | | | 49 | |
| | | 53.10 | | | | | | (5.43 | ) | | | | | 26,847 | | | | | | 0.93 | (f) | | | | | 1.00 | (f) | | | | | (0.62 | )(e)(f) | | | | | 49 | |
| | | 55.40 | | | | | | 20.72 | | | | | | 1,080,393 | | | | | | 1.35 | | | | | | 1.40 | | | | | | 0.22 | | | | | | 46 | |
| | | 45.84 | | | | | | 19.85 | | | | | | 69,319 | | | | | | 2.10 | | | | | | 2.15 | | | | | | (0.55 | ) | | | | | 46 | |
| | | 58.80 | | | | | | 21.22 | | | | | | 4,694,737 | | | | | | 0.95 | | | | | | 1.00 | | | | | | 0.58 | | | | | | 46 | |
| | | 54.08 | | | | | | 20.62 | | | | | | 176,500 | | | | | | 1.45 | | | | | | 1.50 | | | | | | 0.10 | | | | | | 46 | |
| | | 55.18 | | | | | | 21.05 | | | | | | 121,895 | | | | | | 1.10 | | | | | | 1.15 | | | | | | 0.43 | | | | | | 46 | |
| | | 54.58 | | | | | | 20.44 | | | | | | 139,858 | | | | | | 1.60 | | | | | | 1.65 | | | | | | (0.06 | ) | | | | | 46 | |
| | | 50.43 | | | | | | 24.86 | | | | | | 1,141,424 | | | | | | 1.38 | | | | | | 1.42 | | | | | | 0.75 | (g) | | | | | 57 | |
| | | 42.64 | | | | | | 23.89 | | | | | | 64,751 | | | | | | 2.13 | | | | | | 2.17 | | | | | | 0.03 | (g) | | | | | 57 | |
| | | 53.22 | | | | | | 25.34 | | | | | | 2,891,932 | | | | | | 0.98 | | | | | | 1.02 | | | | | | 1.12 | (g) | | | | | 57 | |
| | | 49.36 | | | | | | 24.70 | | | | | | 162,696 | | | | | | 1.48 | | | | | | 1.52 | | | | | | 0.65 | (g) | | | | | 57 | |
| | | 50.25 | | | | | | 25.16 | | | | | | 73,723 | | | | | | 1.13 | | | | | | 1.17 | | | | | | 0.86 | (g) | | | | | 57 | |
| | | 49.80 | | | | | | 24.51 | | | | | | 101,060 | | | | | | 1.63 | | | | | | 1.67 | | | | | | 0.40 | (g) | | | | | 57 | |
| | |
| The accompanying notes are an integral part of these financial statements. | | 79 |
GOLDMAN SACHS SMALL/MID CAP VALUE FUND
Financial Highlights
Selected Data for a Share Outstanding Throughout Each Year
| | | | | | | | | | | | | | | | | | | | | | | | | | | | | | |
| | | | | | | | From
investment operations | | | Distributions
to shareholders | |
| | | Year - Share Class | | Net asset
value,
beginning
of year | | | Net
investment
income
(loss)(a) | | | Net realized
and unrealized
gain (loss) | | | Total from
investment
operations | | | From net
investment
income | | | From net
realized
gains | | | Total
distributions | |
| | FOR THE FISCAL YEARS ENDED AUGUST 31, | | | | | | | | | |
| | 2017 - A | | $ | 11.18 | | | $ | 0.07 | | | $ | 1.19 | | | $ | 1.26 | | | $ | (0.07 | ) | | $ | — | | | $ | (0.07 | ) |
| | 2017 - C | | | 11.01 | | | | (0.02 | ) | | | 1.17 | | | | 1.15 | | | | (0.02 | ) | | | — | | | | (0.02 | ) |
| | 2017 - Institutional | | | 11.29 | | | | 0.12 | | | | 1.20 | | | | 1.32 | | | | (0.11 | ) | | | — | | | | (0.11 | ) |
| | 2017 - Investor(g) | | | 11.23 | | | | 0.10 | | | | 1.19 | | | | 1.29 | | | | (0.08 | ) | | | — | | | | (0.08 | ) |
| | 2017 - R | | | 11.15 | | | | 0.04 | | | | 1.19 | | | | 1.23 | | | | (0.03 | ) | | | — | | | | (0.03 | ) |
| | 2017 - R6 | | | 11.29 | | | | 0.12 | | | | 1.21 | | | | 1.33 | | | | (0.11 | ) | | | — | | | | (0.11 | ) |
| | 2016 - A | | | 10.46 | | | | 0.08 | (d) | | | 0.70 | | | | 0.78 | | | | (0.01 | ) | | | (0.05 | ) | | | (0.06 | ) |
| | 2016 - C | | | 10.37 | | | | — | (e) | | | 0.69 | | | | 0.69 | | | | — | | | | (0.05 | ) | | | (0.05 | ) |
| | 2016 - Institutional | | | 10.53 | | | | 0.12 | (d) | | | 0.71 | | | | 0.83 | | | | (0.02 | ) | | | (0.05 | ) | | | (0.07 | ) |
| | 2016 - Investor(g) | | | 10.49 | | | | 0.11 | (d) | | | 0.71 | | | | 0.82 | | | | (0.03 | ) | | | (0.05 | ) | | | (0.08 | ) |
| | 2016 - R | | | 10.45 | | | | 0.05 | (d) | | | 0.70 | | | | 0.75 | | | | — | | | | (0.05 | ) | | | (0.05 | ) |
| | 2016 - R6 | | | 10.53 | | | | 0.12 | (d) | | | 0.72 | | | | 0.84 | | | | (0.03 | ) | | | (0.05 | ) | | | (0.08 | ) |
| | 2015 - A | | | 11.01 | | | | 0.02 | | | | (0.38 | ) | | | (0.36 | ) | | | (0.03 | ) | | | (0.16 | ) | | | (0.19 | ) |
| | 2015 - C | | | 10.97 | | | | (0.07 | ) | | | (0.37 | ) | | | (0.44 | ) | | | — | | | | (0.16 | ) | | | (0.16 | ) |
| | 2015 - Institutional | | | 11.04 | | | | 0.06 | | | | (0.36 | ) | | | (0.30 | ) | | | (0.05 | ) | | | (0.16 | ) | | | (0.21 | ) |
| | 2015 - Investor(g) | | | 11.03 | | | | 0.05 | | | | (0.39 | ) | | | (0.34 | ) | | | (0.04 | ) | | | (0.16 | ) | | | (0.20 | ) |
| | 2015 - R | | | 11.00 | | | | (0.02 | ) | | | (0.37 | ) | | | (0.39 | ) | | | — | | | | (0.16 | ) | | | (0.16 | ) |
| | 2015 - R6 (Commenced July 31, 2015) | | | 11.14 | | | | — | (e) | | | (0.61 | ) | | | (0.61 | ) | | | — | | | | — | | | | — | |
| | | | | | | | | | | | | | | | | | | | | | | | | | | | | | |
| | FOR THE PERIOD ENDED AUGUST 31, | |
| | 2014 - A (Commenced January 31, 2014) | | | 10.00 | | | | (0.02 | ) | | | 1.03 | | | | 1.01 | | | | — | | | | — | | | | — | |
| | 2014 - C (Commenced January 31, 2014) | | | 10.00 | | | | (0.06 | ) | | | 1.03 | | | | 0.97 | | | | — | | | | — | | | | — | |
| | 2014 - Institutional (Commenced January 31, 2014) | | | 10.00 | | | | 0.03 | | | | 1.01 | | | | 1.04 | | | | — | | | | — | | | | — | |
| | 2014 - Investor (Commenced January 31, 2014)(g) | | | 10.00 | | | | 0.02 | | | | 1.01 | | | | 1.03 | | | | — | | | | — | | | | — | |
| | 2014 - R (Commenced January 31, 2014) | | | 10.00 | | | | (0.01 | ) | | | 1.01 | | | | 1.00 | | | | — | | | | — | | | | — | |
| | (a) | | Calculated based on the average shares outstanding methodology. |
| | (b) | | Assumes investment at the NAV at the beginning of the year, reinvestment of all dividends and distributions, a complete redemption of the investment at the NAV at the end of the year and no sales or redemption charges. Total returns would be reduced if a sales or redemption charge was taken into account. Returns do not reflect the impact of taxes to shareholders relating to Fund distributions or the redemption of Fund shares. Total returns for periods less than one full year are not annualized. |
| | (c) | | The Fund’s portfolio turnover rate is calculated in accordance with regulatory requirements, without regard to transactions involving short term investments. If such transactions were included, the Fund’s portfolio turnover rate may be higher. |
| | (d) | | Reflects income recognized from special dividends which amounted to $0.03 per share and 0.29% of average net assets. |
| | (e) | | Amount is less than $0.005 per share. |
| | (g) | | Effective before the opening of business on August 15, 2017, Class IR Shares were designated as Investor Shares. |
| | |
| 80 | | The accompanying notes are an integral part of these financial statements. |
GOLDMAN SACHS SMALL/MID CAP VALUE FUND
| | | | | | | | | | | | | | | | | | | | | | | | | | | | | | | | | | | | | | | | |
| | | | | | | | | | | | | | | | | | | | | | | | | | | | | | | | | | |
| | | Net asset
value, end
of year | | | | | Total
return(b) | | | | | Net assets,
end of
year
(in 000s) | | | | | Ratio of
net expenses
to average
net assets | | | | | Ratio of
total expenses
to average
net assets | | | | | Ratio of
net investment
income (loss)
to average
net assets | | | | | Portfolio
turnover
rate(c) | |
| | | | | | | | | | | | | | | | | | | | | | | | | | | | | | | | | | | | | | | | |
| | $ | 12.37 | | | | | | 11.30 | % | | | | $ | 1,497 | | | | | | 1.24 | % | | | | | 1.73 | % | | | | | 0.58 | % | | | | | 108 | % |
| | | 12.14 | | | | | | 10.48 | | | | | | 1,126 | | | | | | 1.99 | | | | | | 2.47 | | | | | | (0.17 | ) | | | | | 108 | |
| | | 12.50 | | | | | | 11.71 | | | | | | 42,085 | | | | | | 0.84 | | | | | | 1.35 | | | | | | 0.97 | | | | | | 108 | |
| | | 12.44 | | | | | | 11.52 | | | | | | 3,250 | | | | | | 0.99 | | | | | | 1.48 | | | | | | 0.82 | | | | | | 108 | |
| | | 12.35 | | | | | | 11.06 | | | | | | 131 | | | | | | 1.49 | | | | | | 2.00 | | | | | | 0.32 | | | | | | 108 | |
| | | 12.51 | | | | | | 11.80 | | | | | | 61,251 | | | | | | 0.83 | | | | | | 1.08 | | | | | | 0.97 | | | | | | 108 | |
| | | 11.18 | | | | | | 7.49 | | | | | | 1,128 | | | | | | 1.26 | | | | | | 2.25 | | | | | | 0.78 | (d) | | | | | 109 | |
| | | 11.01 | | | | | | 6.71 | | | | | | 618 | | | | | | 2.01 | | | | | | 2.99 | | | | | | 0.04 | (d) | | | | | 109 | |
| | | 11.29 | | | | | | 7.96 | | | | | | 39,176 | | | | | | 0.87 | | | | | | 1.84 | | | | | | 1.18 | (d) | | | | | 109 | |
| | | 11.23 | | | | | | 7.81 | | | | | | 2,846 | | | | | | 1.01 | | | | | | 2.03 | | | | | | 1.08 | (d) | | | | | 109 | |
| | | 11.15 | | | | | | 7.24 | | | | | | 132 | | | | | | 1.52 | | | | | | 2.50 | | | | | | 0.49 | (d) | | | | | 109 | |
| | | 11.29 | | | | | | 7.98 | | | | | | 10 | | | | | | 0.88 | | | | | | 1.90 | | | | | | 1.14 | (d) | | | | | 109 | |
| | | 10.46 | | | | | | (3.34 | ) | | | | | 530 | | | | | | 1.34 | | | | | | 4.38 | | | | | | 0.14 | | | | | | 122 | |
| | | 10.37 | | | | | | (4.02 | ) | | | | | 321 | | | | | | 2.09 | | | | | | 5.25 | | | | | | (0.61 | ) | | | | | 122 | |
| | | 10.53 | | | | | | (2.79 | ) | | | | | 25,756 | | | | | | 0.93 | | | | | | 3.41 | | | | | | 0.51 | | | | | | 122 | |
| | | 10.49 | | | | | | (3.11 | ) | | | | | 119 | | | | | | 1.09 | | | | | | 4.00 | | | | | | 0.43 | | | | | | 122 | |
| | | 10.45 | | | | | | (3.55 | ) | | | | | 130 | | | | | | 1.59 | | | | | | 3.81 | | | | | | (0.19 | ) | | | | | 122 | |
| | | 10.53 | | | | | | (5.48 | ) | | | | | 9 | | | | | | 0.94 | (f) | | | | | 4.88 | (f) | | | | | (0.43 | )(f) | | | | | 122 | |
| | | | | | | | | | | | | | | | | | | | | | | | | | | | | | | | | | | | | | | | |
| | | | | | | | | | | | | | | | | | | | | | | | | | | | | | | | | | | | | | | | |
| | | 11.01 | | | | | | 10.10 | | | | | | 150 | | | | | | 1.33 | (f) | | | | | 6.90 | (f) | | | | | (0.27 | )(f) | | | | | 53 | |
| | | 10.97 | | | | | | 9.70 | | | | | | 105 | | | | | | 2.08 | (f) | | | | | 8.31 | (f) | | | | | (1.01 | )(f) | | | | | 53 | |
| | | 11.04 | | | | | | 10.40 | | | | | | 3,755 | | | | | | 0.93 | (f) | | | | | 12.86 | (f) | | | | | 0.49(f | ) | | | | | 53 | |
| | | 11.03 | | | | | | 10.30 | | | | | | 28 | | | | | | 1.08 | (f) | | | | | 13.25 | (f) | | | | | 0.39(f | ) | | | | | 53 | |
| | | 11.00 | | | | | | 10.00 | | | | | | 28 | | | | | | 1.58 | (f) | | | | | 13.76 | (f) | | | | | (0.11 | )(f) | | | | | 53 | |
| | |
| The accompanying notes are an integral part of these financial statements. | | 81 |
GOLDMAN SACHS FUNDAMENTAL EQUITY VALUE FUNDS
Notes to Financial Statements
August 31, 2017
Goldman Sachs Trust (the “Trust”) is a Delaware statutory trust registered under the Investment Company Act of 1940, as amended (the “Act”), as an open-end management investment company. The following table lists those series of the Trust that are included in this report (collectively, the “Funds” or individually a “Fund”), along with their corresponding share classes and respective diversification status under the Act:
| | | | |
| Fund | | Share Classes Offered* | | Diversified/ Non-diversified |
Focused Value | | A, C, Institutional, Investor, R and R6 | | Non-diversified |
Equity Income*, Large Cap Value, Mid Cap Value, Small Cap Value | | A, C, Institutional, Service, Investor, R and R6 | | Diversified |
Small/Mid Cap Value | | A, C, Institutional, Investor, R and R6 | | Diversified |
| * | | Formerly the Goldman Sachs Growth & Income Fund. Effective after the close of business on June 20, 2017, the Fund changed its name to the Goldman Sachs Equity Income Fund. |
Class A Shares are sold with a front-end sales charge of up to 5.50%. Class C Shares are sold with a contingent deferred sales charge (“CDSC”) of 1.00%, which is imposed on redemptions made within 12 months of purchase. Institutional, Service, Investor, Class R and Class R6 Shares are not subject to a sales charge. Previously, the Investor Shares were known as Class IR Shares.
Goldman Sachs Asset Management, L.P. (“GSAM”), an affiliate of Goldman Sachs & Co. LLC (formerly, Goldman, Sachs & Co.) (“Goldman Sachs”), serves as investment adviser to the Funds pursuant to a management agreement (the “Agreement”) with the Trust.
|
| 2. SIGNIFICANT ACCOUNTING POLICIES |
The financial statements have been prepared in accordance with accounting principles generally accepted in the United States of America (“GAAP”) and require management to make estimates and assumptions that may affect the reported amounts and disclosures. Actual results may differ from those estimates and assumptions.
A. Investment Valuation — The Funds’ valuation policy is to value investments at fair value.
B. Investment Income and Investments — Investment income includes interest income, dividend income, and securities lending income. Interest income is accrued daily and adjusted for amortization of premiums and accretion of discounts. Dividend income is recognized on ex-dividend date or, for certain foreign securities, as soon as such information is obtained subsequent to the ex-dividend date. Investment transactions are reflected on trade date. Realized gains and losses are calculated using identified cost. Investment transactions are recorded on the following business day for daily net asset value (“NAV”) calculations. Investment income is recorded net of any foreign withholding taxes, less any amounts reclaimable. The Funds may file withholding tax reclaims in certain jurisdictions to recover a portion of amounts previously withheld. Any foreign capital gains tax is accrued daily based upon net unrealized gains, and is payable upon sale of such investments. Distributions received from the Funds’ investments in U.S. real estate investment trusts (“REITs”) may be characterized as ordinary income, net capital gain or a return of capital. A return of capital is recorded by the Funds as a reduction to the cost basis of the REIT.
C. Class Allocations and Expenses — Investment income, realized and unrealized gain (loss), if any, and non-class specific expenses of each Fund are allocated daily based upon the proportion of net assets of each class. Non-class specific expenses directly incurred by a Fund are charged to that Fund, while such expenses incurred by the Trust are allocated across the applicable Funds on a straight-line and/or pro-rata basis depending upon the nature of the expenses. Class specific expenses, where applicable, are borne by the respective share classes and include Distribution and Service, Transfer Agency, and Service and Shareholder Administration fees.
82
GOLDMAN SACHS FUNDAMENTAL EQUITY VALUE FUNDS
|
| 2. SIGNIFICANT ACCOUNTING POLICIES (continued) |
D. Federal Taxes and Distributions to Shareholders — It is each Fund’s policy to comply with the requirements of the Internal Revenue Code of 1986, as amended (the “Code”), applicable to regulated investment companies (mutual funds) and to distribute each year substantially all of its investment company taxable income and capital gains to its shareholders. Accordingly, each Fund is not required to make any provisions for the payment of federal income tax. Distributions to shareholders are recorded on the ex-dividend date. Income and capital gains distributions, if any, are declared and paid according to the following schedule:
| | | | | | |
| Fund | | | | Income Distributions Declared/Paid | | Capital Gains Distributions Declared/Paid |
Equity Income | | | | Quarterly | | Annually |
Focused Value, Large Cap Value, Mid Cap Value,
Small Cap Value and Small/Mid Cap Value | | | | Annually | | Annually |
Net capital losses, if any, are carried forward to future fiscal years and may be used to the extent allowed by the Code to offset any future capital gains. Losses that are carried forward will retain their character as either short-term or long-term capital losses. Utilization of capital loss carryforwards will reduce the requirement of future capital gains distributions.
The characterization of distributions to shareholders for financial reporting purposes is determined in accordance with federal income tax rules, which may differ from GAAP. The source of each Fund’s distributions may be shown in the accompanying financial statements as either from net investment income, net realized gain or capital. Certain components of the Funds’ net assets on the Statements of Assets and Liabilities reflect permanent GAAP/tax differences based on the appropriate tax character.
E. Foreign Currency Translation — The accounting records and reporting currency of the Funds are maintained in U.S. dollars. Assets and liabilities denominated in foreign currencies are translated into U.S. dollars using the current exchange rates at the close of each business day. The effect of changes in foreign currency exchange rates on investments is included within net realized and unrealized gain (loss) on investments. Changes in the value of other assets and liabilities as a result of fluctuations in foreign exchange rates are included in the Statements of Operations within net change in unrealized gain (loss) on foreign currency translations. Transactions denominated in foreign currencies are translated into U.S. dollars on the date the transaction occurred, the effects of which are included within net realized gain (loss) on foreign currency transactions.
F. Commission Recapture — GSAM, on behalf of certain Funds, may direct portfolio trades, subject to seeking best execution, to various brokers who have agreed to rebate a portion of the commissions generated. Such rebates are made directly to a Fund as cash payments and are included in net realized gain (loss) from investments on the Statements of Operations.
| | |
| 3. INVESTMENTS AND FAIR VALUE MEASUREMENTS | | |
U.S. GAAP defines the fair value of a financial instrument as the amount that would be received to sell an asset or paid to transfer a liability in an orderly transaction between market participants at the measurement date (i.e., the exit price); the Funds’ policy is to use the market approach. GAAP establishes a fair value hierarchy that prioritizes the inputs to valuation techniques used to measure fair value. The hierarchy gives the highest priority to unadjusted quoted prices in active markets for identical assets or liabilities (Level 1 measurements) and the lowest priority to unobservable inputs (Level 3 measurements). The levels used for classifying investments are not necessarily an indication of the risk associated with investing in these investments. The three levels of the fair value hierarchy are described below:
Level 1 — Unadjusted quoted prices in active markets that are accessible at the measurement date for identical, unrestricted assets or liabilities;
Level 2 — Quoted prices in markets that are not active or financial instruments for which significant inputs are observable (including, but not limited to, quoted prices for similar investments, interest rates, foreign exchange rates, volatility and credit spreads), either directly or indirectly;
Level 3 — Prices or valuations that require significant unobservable inputs (including GSAM’s assumptions in determining fair value measurement).
83
GOLDMAN SACHS FUNDAMENTAL EQUITY VALUE FUNDS
Notes to Financial Statements (continued)
August 31, 2017
|
| 3. INVESTMENTS AND FAIR VALUE MEASUREMENTS (continued) |
Changes in valuation techniques may result in transfers into or out of an assigned level within the hierarchy. In accordance with the Funds’ policy, transfers between different levels of the fair value hierarchy resulting from such changes are deemed to have occurred as of the beginning of the reporting period.
The Board of Trustees (“Trustees”) has approved Valuation Procedures that govern the valuation of the portfolio investments held by the Funds, including investments for which market quotations are not readily available. The Trustees have delegated to GSAM day-to-day responsibility for implementing and maintaining internal controls and procedures related to the valuation of the Funds’ investments. To assess the continuing appropriateness of pricing sources and methodologies, GSAM regularly performs price verification procedures and issues challenges as necessary to third party pricing vendors or brokers, and any differences are reviewed in accordance with the Valuation Procedures.
A. Level 1 and Level 2 Fair Value Investments — The valuation techniques and significant inputs used in determining the fair values for investments classified as Level 1 and Level 2 are as follows:
Equity Securities — Equity securities traded on a United States (“U.S.”) securities exchange or the NASDAQ system, or those located on certain foreign exchanges, including but not limited to the Americas, are valued daily at their last sale price or official closing price on the principal exchange or system on which they are traded. If there is no sale or official closing price or such price is believed by GSAM to not represent fair value, equity securities are valued at the last bid price for long positions and at the last ask price for short positions. To the extent these investments are actively traded, they are classified as Level 1 of the fair value hierarchy, otherwise they are generally classified as Level 2.
Unlisted equity securities for which market quotations are available are valued at the last sale price on the valuation date, or if no sale occurs, at the last bid price. Securities traded on certain foreign securities exchanges are valued daily at fair value determined by an independent fair value service (if available) under Valuation Procedures approved by the Trustees and consistent with applicable regulatory guidance. The independent fair value service takes into account multiple factors including, but not limited to, movements in the securities markets, certain depositary receipts, futures contracts and foreign currency exchange rates that have occurred subsequent to the close of the foreign securities exchange. These investments are generally classified as Level 2 of the fair value hierarchy.
Underlying Funds (including Money Market Funds) — Underlying Funds (“Underlying Funds”) include other investment companies and exchange-traded funds (“ETFs”). Investments in the Underlying Funds (except ETFs) are valued at the NAV per share of the Institutional Share class on the day of valuation. ETFs are valued daily at the last sale price or official closing price on the principal exchange or system on which the investment is traded. Because the Funds invest in Underlying Funds that fluctuate in value, the Funds’ shares will correspondingly fluctuate in value. To the extent these investments are actively traded, they are classified as Level 1 of the fair value hierarchy, otherwise they are generally classified as Level 2. For information regarding an Underlying Fund’s accounting policies and investment holdings, please see the Underlying Fund’s shareholder report.
B. Level 3 Fair Value Investments — To the extent that significant inputs to valuation models and other alternative pricing sources are unobservable, or if quotations are not readily available, or if GSAM believes that such quotations do not accurately reflect fair value, the fair value of a Fund’s investments may be determined under Valuation Procedures approved by the Trustees. GSAM, consistent with its procedures and applicable regulatory guidance, may make an adjustment to the most recent valuation prices of either domestic or foreign securities in light of significant events to reflect what it believes to be the fair value of the securities at the time of determining a Fund’s NAV. Significant events which could affect a large number of securities in a particular market may include, but are not limited to: significant fluctuations in U.S. or foreign markets; market dislocations; market disruptions; or unscheduled market closings. Significant events which could also affect a single issuer may include, but are not limited to: corporate actions such as reorganizations, mergers and buy-outs; ratings downgrades; and bankruptcies.
84
GOLDMAN SACHS FUNDAMENTAL EQUITY VALUE FUNDS
|
| 3. INVESTMENTS AND FAIR VALUE MEASUREMENTS (continued) |
C. Fair Value Hierarchy — The following is a summary of the Funds’ investments classified in the fair value hierarchy as of August 31, 2017:
| | | | | | | | | | | | |
|
| EQUITY INCOME | |
| | | |
| Investment Type | | Level 1 | | | Level 2 | | | Level 3 | |
| Assets | | | | | | | | | | | | |
Common Stock and/or Other Equity Investments(a) | | | | | | | | | | | | |
Europe | | $ | 18,715,613 | | | $ | — | | | $ | — | |
North America | | | 363,490,148 | | | | — | | | | — | |
Investment Company | | | 4,642 | | | | — | | | | — | |
Securities Lending Reinvestment Vehicle | | | 5,493,780 | | | | — | | | | — | |
| Total | | $ | 387,704,183 | | | $ | — | | | $ | — | |
| | | |
| FOCUSED VALUE | | | | | | | | | | | | |
| | | |
| Investment Type | | Level 1 | | | Level 2 | | | Level 3 | |
| Assets | | | | | | | | | | | | |
Common Stock and/or Other Equity Investments(a) | | | | | | | | | | | | |
Europe | | $ | 363,164 | | | $ | — | | | $ | — | |
North America | | | 4,509,362 | | | | — | | | | — | |
Investment Company | | | 61,761 | | | | — | | | | — | |
Securities Lending Reinvestment Vehicle | | | 95,910 | | | | — | | | | — | |
| Total | | $ | 5,030,197 | | | $ | — | | | $ | — | |
| | | |
| LARGE CAP VALUE | | | | | | | | | | | | |
| | | |
| Investment Type | | Level 1 | | | Level 2 | | | Level 3 | |
| Assets | | | | | | | | | | | | |
Common Stock and/or Other Equity Investments(a) | | | | | | | | | | | | |
Europe | | $ | 65,288,205 | | | $ | — | | | $ | — | |
North America | | | 762,588,078 | | | | — | | | | — | |
Investment Company | | | 11,928,930 | | | | — | | | | — | |
Securities Lending Reinvestment Vehicle | | | 8,376,426 | | | | — | | | | — | |
| Total | | $ | 848,181,639 | | | $ | — | | | $ | — | |
85
GOLDMAN SACHS FUNDAMENTAL EQUITY VALUE FUNDS
Notes to Financial Statements (continued)
August 31, 2017
|
| 3. INVESTMENTS AND FAIR VALUE MEASUREMENTS (continued) |
| | | | | | | | | | | | |
| | | |
| MID CAP VALUE | | | | | | | | | | | | |
| | | |
| Investment Type | | Level 1 | | | Level 2 | | | Level 3 | |
| Assets | | | | | | | | | | | | |
Common Stock and/or Other Equity Investments(a) | | | | | | | | | | | | |
Asia | | $ | 16,989,984 | | | $ | — | | | $ | — | |
North America | | | 2,636,737,761 | | | | — | | | | — | |
Investment Company | | | 3,199,933 | | | | — | | | | — | |
Securities Lending Reinvestment Vehicle | | | 50,158,515 | | | | — | | | | — | |
| Total | | $ | 2,707,086,193 | | | $ | — | | | $ | — | |
| | | |
| SMALL CAP VALUE | | | | | | | | | | | | |
| | | |
| Investment Type | | Level 1 | | | Level 2 | | | Level 3 | |
| Assets | | | | | | | | | | | | |
Common Stock and/or Other Equity Investments(a) | | | | | | | | | | | | |
Europe | | $ | 39,862,708 | | | $ | — | | | $ | — | |
North America | | | 6,404,649,778 | | | | — | | | | — | |
Exchange Traded Fund | | | 19,431,686 | | | | — | | | | — | |
Securities Lending Reinvestment Vehicle | | | 93,690,576 | | | | — | | | | — | |
| Total | | $ | 6,557,634,748 | | | $ | — | | | $ | — | |
| | | |
| SMALL/MID CAP VALUE | | | | | | | | | | | | |
| | | |
| Investment Type | | Level 1 | | | Level 2 | | | Level 3 | |
| Assets | | | | | | | | | | | | |
Common Stock and/or Other Equity Investments(a) | | | | | | | | | | | | |
Europe | | $ | 1,093,617 | | | $ | — | | | $ | — | |
North America | | | 107,325,739 | | | | — | | | | — | |
Investment Company | | | 39 | | | | — | | | | — | |
Securities Lending Reinvestment Vehicle | | | 952,271 | | | | — | | | | — | |
| Total | | $ | 109,371,666 | | | $ | — | | | $ | — | |
| (a) | | Amounts are disclosed by continent to highlight the impact of time zone differences between local market close and the calculation of net asset value. Security valuations are based on the principal exchange or system on which they are traded, which may differ from country of domicile noted in the table. |
For further information regarding security characteristics, see the Schedules of Investments.
|
| 4. AGREEMENTS AND AFFILIATED TRANSACTIONS |
A. Management Agreement — Under the Agreement, GSAM manages the Funds, subject to the general supervision of the Trustees.
As compensation for the services rendered pursuant to the Agreement, the assumption of the expenses related thereto and administration of the Funds’ business affairs, including providing facilities, GSAM is entitled to a management fee, accrued daily and paid monthly, equal to an annual percentage rate of each Fund’s average daily net assets.
86
GOLDMAN SACHS FUNDAMENTAL EQUITY VALUE FUNDS
|
| 4. AGREEMENTS AND AFFILIATED TRANSACTIONS (continued) |
For the fiscal year ended August 31, 2017, contractual and effective net management fees with GSAM were at the following rates:
| | | | | | | | | | | | | | | | | | | | | | | | | | | | | | |
| | | | | Contractual Management Rate | | | Effective Net
Management
Rate | |
| Fund | | | | First $1 Billion | | | Next $1 Billion | | | Next $3 Billion | | | Next $3 Billion | | | Over $8 Billion | | | Effective
Rate | | |
Equity Income | | | | | 0.70 | % | | | 0.63 | % | | | 0.60 | % | | | 0.59 | % | | | 0.58 | % | | | 0.70 | % | | | 0.69 | %* |
| Focused Value | | | | | 0.75 | | | | 0.68 | | | | 0.64 | | | | 0.63 | | | | 0.62 | | | | 0.75 | | | | 0.69 | * |
| Large Cap Value | | | | | 0.75 | | | | 0.68 | | | | 0.65 | | | | 0.64 | | | | 0.63 | | | | 0.74 | | | | 0.74 | |
| Mid Cap Value | | | | | 0.75 | | | | 0.75 | | | | 0.68 | | | | 0.65 | | | | 0.64 | | | | 0.71 | | | | 0.71 | |
| Small Cap Value | | | | | 1.00 | | | | 1.00 | | | | 0.90 | | | | 0.86 | | | | 0.84 | | | | 0.92 | | | | 0.90 | * |
| Small/Mid Cap Value | | | | | 0.85 | | | | 0.85 | | | | 0.77 | | | | 0.73 | | | | 0.71 | | | | 0.85 | | | | 0.80 | * |
| * | | GSAM has agreed to waive a portion of its management fee in order to achieve net management fee rates, as set forth in the Funds’ most recent prospectuses. These waivers will be effective through at least April 28, 2018, and prior to such date GSAM may not terminate the arrangements without the approval of the Trustees. |
The Funds invest in Institutional Shares of Goldman Sachs Financial Square Government Fund (“Government Money Market Fund”), which is an affiliated Underlying Fund. GSAM has agreed to waive a portion of its management fee payable by the Funds in an amount equal to the management fee it earns as an investment adviser to the affiliated Underlying Fund in which the Funds invest, except those management fees it earns from the Funds’ investments of cash collateral received in connection with securities lending transactions in the Government Money Market Fund. For the fiscal year ended August 31, 2017, the management fee waived by GSAM for each Fund was as follows:
| | |
| Fund | | Management Fee Waived |
Equity Income | | $ 6,820 |
Focused Value | | 151 |
Large Cap Value | | 15,720 |
Mid Cap Value | | 68,210 |
Small Cap Value | | 27,881 |
Small/Mid Cap Value | | 716 |
B. Distribution and/or Service(12b-1) Plans — The Trust, on behalf of Class A and Class R Shares of each applicable Fund, has adopted Distribution and Service Plans subject to Rule 12b-1 under the Act. Under the Distribution and Service Plans, Goldman Sachs, which serves as distributor (the “Distributor”), is entitled to a fee accrued daily and paid monthly, for distribution services and personal and account maintenance services, which may then be paid by Goldman Sachs to authorized dealers. These fees are equal to an annual percentage rate of the average daily net assets attributable to Class A or Class R Shares of the Funds, as applicable, as set forth below.
The Trust, on behalf of Class C Shares of each applicable Fund, has adopted a Distribution Plan subject to Rule 12b-1 under the Act. Under the Distribution Plan, Goldman Sachs as Distributor is entitled to a fee accrued daily and paid monthly for distribution services, which may then be paid by Goldman Sachs to authorized dealers. These fees are equal to an annual percentage rate of the average daily net assets attributable to Class C Shares of the Funds, as set forth below.
87
GOLDMAN SACHS FUNDAMENTAL EQUITY VALUE FUNDS
Notes to Financial Statements (continued)
August 31, 2017
|
| 4. AGREEMENTS AND AFFILIATED TRANSACTIONS (continued) |
The Trust, on behalf of Service Shares of each applicable Fund, has adopted a Service Plan subject to Rule 12b-1 under the Act to allow Service Shares to compensate service organizations (including Goldman Sachs) for providing personal and account maintenance services to their customers who are beneficial owners of such shares. The Service Plan provides for compensation to the service organizations equal to an annual percentage rate of the average daily net assets attributable to Services Shares of the Funds, as set forth below.
| | | | | | | | | | | | | | | | |
| | | Distribution and Service Plan Rates | |
| | | Class A* | | | Class C | | | Class R* | | | Service | |
Distribution and/or Service Plan | | | 0.25 | % | | | 0.75 | % | | | 0.50 | % | | | — | % |
Service Plan | | | — | | | | — | | | | — | | | | 0.25 | |
| * | | With respect to Class A and Class R Shares, the Distributor at its discretion may use compensation for distribution services paid under the Distribution Plan to compensate service organizations for personal and account maintenance services and expenses as long as such total compensation does not exceed the maximum cap on “service fees” imposed by the Financial Industry Regulatory Authority. |
C. Distribution Agreement — Goldman Sachs, as Distributor of the shares of the Funds pursuant to a Distribution Agreement, may retain a portion of the Class A Shares’ front end sales charge and Class C Shares’ CDSC. During the fiscal year ended August 31, 2017, Goldman Sachs advised that it retained the following amounts:
| | | | | | | | | | |
| | | | | Front End
Sales Charge | | | Contingent Deferred
Sales Charge | |
| Fund | | | | Class A | | | Class C | |
Equity Income | | | | $ | 16,368 | | | $ | — | |
Focused Value | | | | | 76 | | | | — | |
Large Cap Value | | | | | 8,724 | | | | 1,265 | |
Mid Cap Value | | | | | 46,234 | | | | 26 | |
Small Cap Value | | | | | 6,665 | | | | 1 | |
Small/Mid Cap Value | | | | | 1,402 | | | | — | |
D. Service and/or Shareholder Administration Plans — The Trust, on behalf of each applicable Fund, has adopted Service and/or Shareholder Administration Plans to allow Class C and Service Shares, respectively, to compensate service organizations (including Goldman Sachs) for providing varying levels of personal and account maintenance and/or shareholder administration services to their customers who are beneficial owners of such shares. The Service and/or Shareholder Administration Plans each provide for compensation to the service organizations equal to an annual percentage rate of 0.25% of the average daily net assets attributable to Class C or Service Shares of the Funds.
E. Transfer Agency Agreement — Goldman Sachs also serves as the transfer agent of the Funds for a fee pursuant to the Transfer Agency Agreement. The fees charged for such transfer agency services are accrued daily and paid monthly at annual rates as follows: 0.18% of the average daily net assets of Class A, Class C, Investor and Class R Shares; 0.03% of the average daily net assets of Class R6 Shares; and 0.04% of the average daily net assets of Institutional and Service Shares. Prior to July 28, 2017, the annual rates were as follows: 0.19% of the average daily net assets of Class A, Class C, Investor and Class R Shares and 0.02% of the average daily net assets of Class R6 Shares.
Effective December 29, 2016, Goldman Sachs has agreed to waive a portion of its transfer agency fee equal to 0.07% as an annual percentage rate of the average daily net assets attributable to Class A, Class C, Investor and Class R Shares of the Equity Income, Large Cap Value, Small Cap Value and Small/Mid Cap Value Fund. This arrangement will remain in effect through at least April 28, 2018, and prior to such date, the Investment Adviser may not terminate the arrangement without the approval of the Board of Trustees.
88
GOLDMAN SACHS FUNDAMENTAL EQUITY VALUE FUNDS
|
| 4. AGREEMENTS AND AFFILIATED TRANSACTIONS (continued) |
F. Other Expense Agreements and Affiliated Transactions — GSAM has agreed to limit certain “Other Expenses” of the Funds (excluding acquired fund fees and expenses, transfer agency fees and expenses, service fees and shareholder administration fees (as applicable), taxes, interest, brokerage fees, expenses of shareholder meetings, litigation and indemnification, and extraordinary expenses) to the extent such expenses exceed, on an annual basis, a percentage rate of the average daily net assets of each Fund. Such Other Expense reimbursements, if any, are accrued daily and paid monthly. In addition, the Funds are not obligated to reimburse GSAM for prior fiscal year expense reimbursements, if any. The Other Expense limitations as an annual percentage rate of average daily net assets for Equity Income, Focused Value, Large Cap Value, Mid Cap Value, Small Cap Value and Small/Mid Cap Value Funds is 0.004%. These Other Expense limitations will remain in place through at least April 28, 2018, and prior to such date GSAM may not terminate the arrangements without the approval of the Trustees. In addition, the Funds have entered into certain offset arrangements with the transfer agent, which may result in a reduction of the Funds’ expenses and are received irrespective of the application of the “Other Expense” limitations described above.
For the fiscal year ended August 31, 2017, these expense reductions, including any fee waivers and Other Expense reimbursements, were as follows:
| | | | | | | | | | | | | | | | | | |
| Fund | | | | Management
Fee Waiver | | | Transfer Agency
Fee Waiver | | | Other
Expense
Reimbursements | | | Total
Expense
Reductions | |
Equity Income | | | | $ | 47,650 | | | $ | 136 | | | $ | 403,218 | | | $ | 451,004 | |
Focused Value | | | | | 2,462 | | | | — | | | | 254,877 | | | | 257,339 | |
Large Cap Value | | | | | 15,720 | | | | 111,283 | | | | 404,592 | | | | 531,595 | |
Mid Cap Value | | | | | 68,210 | | | | — | | | | 527 | | | | 68,737 | |
Small Cap Value | | | | | 1,427,882 | | | | 399 | | | | 851,592 | | | | 2,279,873 | |
Small/Mid Cap Value | | | | | 38,247 | | | | 2 | | | | 274,235 | | | | 312,484 | |
G. Line of Credit Facility — As of August 31, 2017, the Funds participated in a $1,100,000,000 committed, unsecured revolving line of credit facility (the “facility”) together with other funds of the Trust and certain registered investment companies having management agreements with GSAM or its affiliates. This facility is to be used for temporary emergency purposes, or to allow for an orderly liquidation of securities to meet redemption requests. The interest rate on borrowings is based on the federal funds rate. The facility also requires a fee to be paid by the Funds based on the amount of the commitment that has not been utilized. For the fiscal year ended August 31, 2017, the Funds did not have any borrowings under the facility.
H. Other Transactions with Affiliates — For the fiscal year ended August 31, 2017, Goldman Sachs earned $477, $321,875, $246,968 and $1,626 in brokerage commissions from portfolio transactions, on behalf of the Large Cap Value, Mid Cap Value, Small Cap Value and Small/Mid Cap Value Funds, respectively.
89
GOLDMAN SACHS FUNDAMENTAL EQUITY VALUE FUNDS
Notes to Financial Statements (continued)
August 31, 2017
|
| 4. AGREEMENTS AND AFFILIATED TRANSACTIONS (continued) |
The table below shows the transactions in and earnings from the investments by the Funds in the Goldman Sachs Financial Square Government Fund for the fiscal year ended August 31, 2017:
| | | | | | | | | | | | | | | | | | | | | | | | |
| Fund | | Market
Value as of
August 31,
2016 | | | Purchases
at Cost | | | Proceeds
from Sales | | | Market
Value as of
August 31,
2017 | | | Shares as of
August 31,
2017 | | | Dividend
Income | |
Equity Income | | $ | — | | | $ | 81,738,072 | | | $ | 81,733,430 | | | $ | 4,642 | | | | 4,642 | | | $ | 25,901 | |
Focused Value | | | 98,592 | | | | 2,390,345 | | | | 2,427,176 | | | | 61,761 | | | | 61,761 | | | | 537 | |
Large Cap Value | | | 6,290,932 | | | | 523,324,797 | | | | 517,686,799 | | | | 11,928,930 | | | | 11,928,930 | | | | 48,299 | |
Mid Cap Value | | | 81,376,569 | | | | 2,319,804,756 | | | | 2,397,981,392 | | | | 3,199,933 | | | | 3,199,933 | | | | 206,627 | |
Small Cap Value | | | 1,568 | | | | 702,113,352 | | | | 702,114,920 | | | | — | | | | — | | | | 65,946 | |
Small/Mid Cap Value | | | — | | | | 79,726,716 | | | | 79,726,677 | | | | 39 | | | | 39 | | | | 2,456 | |
As of August 31, 2017, The Goldman Sachs Group, Inc. was the beneficial owner of 5% or more of total outstanding shares of the following funds:
| | | | | | | | | | | | | | | | | | | | | | | | | | |
| Fund | | | | Class A | | | Class C | | | Institutional | | | Investor | | | Class R | | | Class R6 | |
Equity Income | | | | | — | % | | | — | % | | | — | % | | | — | % | | | — | % | | | 100 | % |
Focused Value | | | | | 56 | | | | 57 | | | | 44 | | | | 100 | | | | 100 | | | | 100 | |
Large Cap Value | | | | | — | | | | — | | | | — | | | | — | | | | — | | | | 100 | |
Small/Mid Cap Value | | | | | — | | | | — | | | | — | | | | — | | | | 8 | | | | — | |
|
| 5. PORTFOLIO SECURITIES TRANSACTIONS |
The cost of purchases and proceeds from sales and maturities of long-term securities for the fiscal year ended August 31, 2017, were as follows:
| | | | | | | | | | |
| Fund | | | | Purchases | | | Sales and Maturities | |
Equity Income | | | | $ | 172,444,913 | | | $ | 215,782,981 | |
Focused Value | | | | | 5,981,086 | | | | 4,689,257 | |
Large Cap Value | | | | | 1,337,389,465 | | | | 1,842,609,305 | |
Mid Cap Value | | | | | 5,143,016,891 | | | | 8,685,466,393 | |
Small Cap Value | | | | | 4,391,777,699 | | | | 4,677,070,520 | |
Small/Mid Cap Value | | | | | 143,003,166 | | | | 82,272,665 | |
The Funds may lend their securities through a securities lending agent, the Bank of New York Mellon (“BNYM”), to certain qualified borrowers. In accordance with the Funds’ securities lending procedures, the Funds receive cash collateral at least equal to
90
GOLDMAN SACHS FUNDAMENTAL EQUITY VALUE FUNDS
|
| 6. SECURITIES LENDING (continued) |
the market value of the securities on loan. The market value of the loaned securities is determined at the close of business of the Funds, at their last sale price or official closing price on the principal exchange or system on which they are traded, and any additional required collateral is delivered to the Funds on the next business day. As with other extensions of credit, the Funds may experience delay in the recovery of their securities or incur a loss should the borrower of the securities breach its agreement with the Funds or become insolvent at a time when the collateral is insufficient to cover the cost of repurchasing securities on loan. Dividend income received from securities on loan may not be subject to withholding taxes and therefore withholding taxes paid may differ from the amounts listed in the Statements of Operations. Loans of securities are terminable at any time and as such 1) the remaining contractual maturities of the outstanding securities lending transactions are considered to be overnight and continuous and 2) the borrower, after notice, is required to return borrowed securities within the standard time period for settlement of securities transactions.
Effective December 31, 2016, the Funds began lending their securities and investing the cash collateral received in connection with securities lending transactions in the Government Money Market Fund, an affiliated series of the Trust. The Government Money Market Fund is registered under the Act as an open end investment company, is subject to Rule 2a-7 under the Act, and is managed by GSAM, for which GSAM may receive a management fee of up to 0.205% on an annualized basis of the average daily net assets of the Government Money Market Fund.
In the event of a default by a borrower with respect to any loan, BNYM may exercise any and all remedies provided under the applicable borrower agreement to make the Funds whole. These remedies include purchasing replacement securities by applying the collateral held from the defaulting broker against the purchase cost of the replacement securities. If BNYM is unable to purchase replacement securities, BNYM will indemnify the Funds by paying the Funds an amount equal to the market value of the securities loaned minus the value of cash collateral received from the borrower for the loan, subject to an exclusion for any shortfalls resulting from a loss of value in such cash collateral due to reinvestment risk. The amounts of the Funds’ overnight and continuous agreements represent the gross amounts of recognized liabilities for securities lending transactions outstanding as of August 31, 2017 are disclosed as “Payable upon return of securities loaned” on the Statements of Assets and Liabilities.
Each of the Funds and BNYM received compensation relating to the lending of the Funds’ securities. The amounts earned, if any, by the Funds’ for the fiscal year ended August 31, 2017, are reported under Investment Income on the Statements of Operations.
The following table provides information about the Funds’ investments in the Goldman Sachs Financial Square Government Fund for the fiscal year ended August 31, 2017:
| | | | | | | | | | | | | | | | | | | | | | | | | | |
| Fund | | | | Market
Value as of
August 31,
2016 | | | Purchases at Cost | | | Proceeds from Sales | | | Market Value as of
August 31,
2017 | | | Shares as of August 31,
2017 | | | Dividend Income
from Affiliated
Securities Lending
Reinvestment
Vehicle | |
Equity Income | | | | $ | — | | | $ | 42,062,591 | | | $ | 36,568,811 | | | $ | 5,493,780 | | | | 5,493,780 | | | $ | 7,060 | |
Focused Value | | | | | — | | | | 969,140 | | | | 873,230 | | | | 95,910 | | | | 95,910 | | | | 122 | |
Large Cap Value | | | | | — | | | | 81,446,408 | | | | 73,069,982 | | | | 8,376,426 | | | | 8,376,426 | | | | 10,244 | |
Mid Cap Value | | | | | — | | | | 385,977,718 | | | | 335,819,203 | | | | 50,158,515 | | | | 50,158,515 | | | | 94,694 | |
Small Cap Value | | | | | — | | | | 731,997,196 | | | | 638,306,620 | | | | 93,690,576 | | | | 93,690,576 | | | | 336,886 | |
Small/Mid Cap Value | | | | | — | | | | 19,369,379 | | | | 18,417,108 | | | | 952,271 | | | | 952,271 | | | | 4,670 | |
91
GOLDMAN SACHS FUNDAMENTAL EQUITY VALUE FUNDS
Notes to Financial Statements (continued)
August 31, 2017
The tax character of distributions paid during the fiscal year ended August 31, 2017 was as follows:
| | | | | | | | | | | | | | | | | | | | | | | | |
| | | Equity
Income | | | Focused
Value | | | Large Cap
Value | | | Mid Cap
Value | | | Small Cap
Value | | | Small/Mid
Cap Value | |
Distribution paid from: | | | | | | | | | | | | | | | | | | | | | | | | |
Ordinary income | | $ | 6,823,548 | | | $ | 46,660 | | | $ | 21,844,401 | | | $ | 66,109,694 | | | $ | 42,943,600 | | | $ | 464,307 | |
Net long-term capital gains | | | — | | | | — | | | | — | | | | — | | | | 192,550,702 | | | | — | |
Total taxable distributions | | $ | 6,823,548 | | | $ | 46,660 | | | $ | 21,844,401 | | | $ | 66,109,694 | | | $ | 235,494,302 | | | $ | 464,307 | |
Tax return of capital | | $ | — | | | $ | — | | | $ | — | | | $ | — | | | $ | — | | | $ | — | |
The tax character of distributions paid during the fiscal year ended August 31, 2016 was as follows:
| | | | | | | | | | | | | | | | | | | | | | | | | | | | |
| | | | | | Equity Income | | | Focused
Value | | | Large Cap
Value | | | Mid Cap Value | | | Small Cap Value | | | Small/Mid
Cap Value | |
Distribution paid from: | | | | | | | | | | | | | | | | | | | | | | | | | | | | |
Ordinary income | | | | | | $ | 8,621,589 | | | $ | 13,657 | | | $ | 59,520,502 | | | $ | 231,836,648 | | | $ | 67,813,890 | | | $ | 81,562 | |
Net long-term capital gains | | | | | | | — | | | | — | | | | 68,608,957 | | | | 719,115,338 | | | | 232,906,537 | | | | 152,170 | |
Total taxable distributions | | | | | | $ | 8,621,589 | | | $ | 13,657 | | | $ | 128,129,459 | | | $ | 950,951,986 | | | $ | 300,720,427 | | | $ | 233,732 | |
As of August 31, 2017, the components of accumulated earnings (losses) on a tax basis were as follows:
| | | | | | | | | | | | | | | | | | | | | | | | |
| | | Equity
Income | | | Focused
Value | | | Large Cap
Value | | | Mid Cap
Value | | | Small Cap
Value | | | Small/Mid
Cap Value | |
Undistributed ordinary income — net | | $ | 1,465,959 | | | $ | 205,975 | | | $ | 34,178,540 | | | $ | 6,631,097 | | | $ | 102,221,329 | | | $ | 612,829 | |
Undistributed long-term capital gains | | | — | | | | 165,177 | | | | 55,952,605 | | | | 264,449,871 | | | | 490,992,140 | | | | 3,721,871 | |
Total undistributed earnings | | $ | 1,465,959 | | | $ | 371,152 | | | $ | 90,131,145 | | | $ | 271,080,968 | | | $ | 593,213,469 | | | $ | 4,334,700 | |
Capital loss carryforwards:(1)(2) | | | | | | | | | | | | | | | | | | | | | | | | |
Expiring 2016 | | $ | — | | | $ | — | | | $ | — | | | $ | — | | | $ | — | | | $ | — | |
Expiring 2018 | | | (85,961,079 | ) | | | — | | | | — | | | | — | | | | — | | | | — | |
Expiring 2019 | | | — | | | | — | | | | — | | | | — | | | | — | | | | — | |
Perpetual Short-Term | | | — | | | | — | | | | — | | | | — | | | | — | | | | — | |
Total capital loss carryforwards | | $ | (85,961,079 | ) | | $ | — | | | $ | — | | | $ | — | | | $ | — | | | $ | — | |
Timing differences (Post October Loss Deferrals) | | $ | — | | | $ | — | | | $ | — | | | $ | — | | | $ | — | | | $ | — | |
Unrealized gains (losses) — net | | | 38,794,396 | | | | 141,263 | | | | 81,629,762 | | | | 168,142,987 | | | | 1,238,566,620 | | | | 3,143,643 | |
Total accumulated earnings (losses) net | | $ | (45,700,724 | ) | | $ | 512,415 | | | $ | 171,760,907 | | | $ | 439,223,955 | | | $ | 1,831,780,089 | | | $ | 7,478,343 | |
| (1) | | Expiration occurs on August 31 of the year indicated. |
| (2) | | The Equity Income, Focused Value, Large Cap Value, Mid Cap Value and Small/Mid Cap Value Funds utilized $28,860,013, $20,098, $9,271,203, $172,712,441 and $168,549, respectively, of capital losses in the current fiscal year. |
92
GOLDMAN SACHS FUNDAMENTAL EQUITY VALUE FUNDS
|
| 7. TAX INFORMATION (continued) |
As of August 31, 2017, the Funds’ aggregate security unrealized gains and losses based on cost for U.S. federal income tax purposes were as follows:
| | | | | | | | | | | | | | | | | | | | | | | | |
| | | Equity
Income | | | Focused
Value | | | Large Cap
Value | | | Mid Cap
Value | | | Small Cap
Value | | | Small/Mid
Cap Value | |
Tax Cost | | $ | 348,909,787 | | | $ | 4,888,934 | | | $ | 766,551,877 | | | $ | 2,538,943,206 | | | $ | 5,319,068,128 | | | $ | 106,228,023 | |
Gross unrealized gain | | | 55,545,210 | | | | 370,687 | | | | 122,089,963 | | | | 269,979,301 | | | | 1,402,169,277 | | | | 7,566,332 | |
Gross unrealized loss | | | (16,750,814 | ) | | | (229,424 | ) | | | (40,460,201 | ) | | | (101,836,314 | ) | | | (163,602,657 | ) | | | (4,422,689 | ) |
Net unrealized security gain | | $ | 38,794,396 | | | $ | 141,263 | | | $ | 81,629,762 | | | $ | 168,142,987 | | | $ | 1,238,566,620 | | | $ | 3,143,643 | |
The difference between GAAP- basis and tax-basis unrealized gains (losses) is attributable to wash sales, differences related to the tax treatment of partnerships and underlying fund investments.
In order to present certain components of the Fund’s capital accounts on a tax-basis, certain reclassifications have been recorded to the Funds’ accounts. These reclassifications have no impact on the net asset value of the Funds and result primarily from certain non-deductible expenses, redemptions utilized as distributions, dividend redesignations, differences in the tax treatment of underlying fund investments, partnership investments and foreign currency transactions.
| | | | | | | | | | | | | | |
| Fund | | | | Paid-in-Capital | | | Accumulated Net Realized Gain (Loss) | | | Undistributed Net Investment Income (Loss) | |
Equity Income | | | | $ | — | | | $ | 686,783 | | | $ | (686,783 | ) |
Large Cap Value | | | | | 8,132,978 | | | | (6,670,453 | ) | | | (1,462,525 | ) |
Mid Cap Value | | | | | 25,048,476 | | | | (22,180,153 | ) | | | (2,868,323 | ) |
Small Cap Value | | | | | 57,014,956 | | | | (55,494,355 | ) | | | (1,520,601 | ) |
Small/Mid Cap Value | | | | | — | | | | 8,595 | | | | (8,595 | ) |
GSAM has reviewed the Funds’ tax positions for all open tax years (the current and prior three years, as applicable) and has concluded that no provision for income tax is required in the Funds’ financial statements. Such open tax years remain subject to examination and adjustment by tax authorities.
The Funds’ risks include, but are not limited to, the following:
Investments in Other Investment Companies Risk — As a shareholder of another investment company, including an exchange-traded fund (“ETF”), a Fund will indirectly bear its proportionate share of any net management fees and other expenses paid by such other investment companies, in addition to the fees and expenses regularly borne by the Fund. ETFs are subject to risks that do not apply to conventional mutual funds, including but not limited to the following: (i) the market price of the ETF’s shares may trade at a premium or a discount to their NAV; and (ii) an active trading market for an ETF’s shares may not develop or be maintained.
Large Shareholder Transactions Risk — A Fund may experience adverse effects when certain large shareholders, such as other funds, institutional investors (including those trading by use of non-discretionary mathematical formulas), financial intermediaries (who may make investment decisions on behalf of underlying clients and/or include a Fund in their investment model), individuals, accounts and Goldman Sachs affiliates, purchase or redeem large amounts of shares of a Fund. Such large shareholder redemptions may cause a Fund to sell portfolio securities at times when it would not otherwise do so, which may
93
GOLDMAN SACHS FUNDAMENTAL EQUITY VALUE FUNDS
Notes to Financial Statements (continued)
August 31, 2017
|
| 8. OTHER RISKS (continued) |
negatively impact a Fund’s NAV and liquidity. These transactions may also accelerate the realization of taxable income to shareholders if such sales of investments resulted in gains, and may also increase transaction costs. In addition, a large redemption could result in a Fund’s current expenses being allocated over a smaller asset base, leading to an increase in the Fund’s expense ratio. Similarly, large Fund share purchases may adversely affect a Fund’s performance to the extent that the Fund is delayed in investing new cash and is required to maintain a larger cash position than it ordinarily would.
Liquidity Risk — The Funds may make investments that are illiquid or that may become less liquid in response to market developments or adverse investor perceptions. Illiquid investments may be more difficult to value. Liquidity risk may also refer to the risk that a Fund will not be able to pay redemption proceeds within the allowable time period because of unusual market conditions, an unusually high volume of redemption requests, or other reasons. To meet redemption requests, a Fund may be forced to sell investments at an unfavorable time and/or under unfavorable conditions.
Market and Credit Risks — In the normal course of business, the Funds trade financial instruments and enter into financial transactions where risk of potential loss exists due to changes in the market (market risk). Additionally, the Funds may also be exposed to credit risk in the event that an issuer or guarantor fails to perform or that an institution or entity with which the Funds have unsettled or open transactions defaults.
Non-Diversification Risk — The Focused Value Fund is non-diversified, meaning that it is permitted to invest a larger percentage of its assets in fewer issuers than diversified mutual funds. Thus, the Fund may be more susceptible to adverse developments affecting any single issuer held in its portfolio, and may be more susceptible to greater losses because of these developments.
Under the Trust’s organizational documents, its Trustees, officers, employees and agents are indemnified, to the extent permitted by the Act and state law, against certain liabilities that may arise out of performance of their duties to the Funds. Additionally, in the course of business, the Funds enter into contracts that contain a variety of indemnification clauses. The Funds’ maximum exposure under these arrangements is unknown, as this would involve future claims that may be made against the Funds that have not yet occurred. However, GSAM believes the risk of loss under these arrangements to be remote.
Subsequent events after the Statements of Assets and Liabilities date have been evaluated and GSAM has concluded that there is no impact requiring adjustment or disclosure in the financial statements.
94
GOLDMAN SACHS FUNDAMENTAL EQUITY VALUE FUNDS
|
| 11. SUMMARY OF SHARE TRANSACTIONS |
Share activity is as follows:
| | | | | | | | | | | | | | | | |
| | | Equity Income Fund | |
| | | | |
| | | For the Fiscal Year Ended
August 31, 2017
| | | For the Fiscal Year Ended
August 31, 2016
| |
| | | | |
| | | Shares | | | Dollars | | | Shares | | | Dollars | |
| | | | |
| Class A Shares | | | | | | | | | | | | | | | | |
Shares sold | | | 341,103 | | | $ | 11,831,082 | | | | 342,897 | | | $ | 10,501,962 | |
Reinvestment of distributions | | | 167,005 | | | | 5,719,784 | | | | 242,552 | | | | 7,386,341 | |
Shares redeemed | | | (2,229,258 | ) | | | (76,413,259 | ) | | | (1,662,316 | ) | | | (51,415,996 | ) |
| | | | (1,721,150 | ) | | | (58,862,393 | ) | | | (1,076,867 | ) | | | (33,527,693 | ) |
| Class C Shares | | | | | | | | | | | | | | | | |
Shares sold | | | 50,462 | | | | 1,670,712 | | | | 59,369 | | | | 1,746,612 | |
Reinvestment of distributions | | | 5,770 | | | | 188,481 | | | | 10,108 | | | | 294,790 | |
Shares redeemed | | | (226,703 | ) | | | (7,491,088 | ) | | | (157,161 | ) | | | (4,599,071 | ) |
| | | | (170,471 | ) | | | (5,631,895 | ) | | | (87,684 | ) | | | (2,557,669 | ) |
| Institutional Shares | | | | | | | | | | | | | | | | |
Shares sold | | | 444,262 | | | | 15,248,820 | | | | 248,012 | | | | 7,964,100 | |
Reinvestment of distributions | | | 20,109 | | | | 701,563 | | | | 22,754 | | | | 703,391 | |
Shares redeemed | | | (368,114 | ) | | | (12,686,424 | ) | | | (265,314 | ) | | | (8,153,380 | ) |
| | | | 96,257 | | | | 3,263,959 | | | | 5,452 | | | | 514,111 | |
| Service Shares | | | | | | | | | | | | | | | | |
Shares sold | | | 2,130 | | | | 73,749 | | | | 1,875 | | | | 55,691 | |
Reinvestment of distributions | | | 39 | | | | 1,328 | | | | 62 | | | | 1,874 | |
Shares redeemed | | | (9,698 | ) | | | (334,143 | ) | | | (5,024 | ) | | | (152,217 | ) |
| | | | (7,529 | ) | | | (259,066 | ) | | | (3,087 | ) | | | (94,652 | ) |
| Investor Shares | | | | | | | | | | | | | | | | |
Shares sold | | | 73,736 | | | | 2,553,367 | | | | 10,920 | | | | 345,895 | |
Reinvestment of distributions | | | 915 | | | | 31,786 | | | | 423 | | | | 12,891 | |
Shares redeemed | | | (22,820 | ) | | | (790,860 | ) | | | (8,671 | ) | | | (261,484 | ) |
| | | | 51,831 | | | | 1,794,293 | | | | 2,672 | | | | 97,302 | |
| Class R Shares | | | | | | | | | | | | | | | | |
Shares sold | | | 3,953 | | | | 135,288 | | | | 12,666 | | | | 379,829 | |
Reinvestment of distributions | | | 442 | | | | 15,073 | | | | 583 | | | | 17,717 | |
Shares redeemed | | | (5,136 | ) | | | (176,239 | ) | | | (6,081 | ) | | | (185,507 | ) |
| | | | (741 | ) | | | (25,878 | ) | | | 7,168 | | | | 212,039 | |
| Class R6 Shares | | | | | | | | | | | | | | | | |
Reinvestment of distributions | | | 7 | | | | 221 | | | | 7 | | | | 234 | |
| | | | 7 | | | | 221 | | | | 7 | | | | 234 | |
NET DECREASE | | | (1,751,796 | ) | | $ | (59,720,759 | ) | | | (1,152,339 | ) | | $ | (35,356,328 | ) |
95
GOLDMAN SACHS FUNDAMENTAL EQUITY VALUE FUNDS
Notes to Financial Statements (continued)
August 31, 2017
|
| 11. SUMMARY OF SHARE TRANSACTIONS (continued) |
Share activity is as follows:
| | | | | | | | | | | | | | | | |
| | | Focused Value Fund | |
| | | | |
| | | For the Fiscal Year Ended
August 31, 2017
| | | For the Fiscal Year Ended
August 31, 2016
| |
| | | | |
| | | Shares | | | Dollars | | | Shares | | | Dollars | |
| | | | |
| Class A Shares | | | | | | | | | | | | | | | | |
Shares sold | | | 3,472 | | | $ | 37,456 | | | | 1 | | | $ | 5 | |
Reinvestment of distributions | | | 34 | | | | 365 | | | | 9 | | | | 81 | |
Shares redeemed | | | (1,504 | ) | | | (16,332 | ) | | | (1 | ) | | | (5 | ) |
| | | | 2,002 | | | | 21,489 | | | | 9 | | | | 81 | |
| Class C Shares | | | | | | | | | | | | | | | | |
Shares sold | | | 1,878 | | | | 20,000 | | | | — | | | | — | |
Reinvestment of distributions | | | 7 | | | | 80 | | | | 1 | | | | 9 | |
| | | | 1,885 | | | | 20,080 | | | | 1 | | | | 9 | |
| Institutional Shares | | | | | | | | | | | | | | | | |
Shares sold | | | 105,958 | | | | 1,177,013 | | | | 136,539 | | | | 1,241,515 | |
Reinvestment of distributions | | | 4,273 | | | | 45,341 | | | | 1,471 | | | | 13,283 | |
Shares redeemed | | | (2,534 | ) | | | (26,746 | ) | | | (2,250 | ) | | | (20,638 | ) |
| | | | 107,697 | | | | 1,195,608 | | | | 135,760 | | | | 1,234,160 | |
| Investor Shares | | | | | | | | | | | | | | | | |
Reinvestment of distributions | | | 30 | | | | 317 | | | | 12 | | | | 105 | |
| | | | 30 | | | | 317 | | | | 12 | | | | 105 | |
| Class R Shares | | | | | | | | | | | | | | | | |
Reinvestment of distributions | | | 19 | | | | 198 | | | | 6 | | | | 56 | |
| | | | 19 | | | | 198 | | | | 6 | | | | 56 | |
| Class R6 Shares | | | | | | | | | | | | | | | | |
Reinvestment of distributions | | | 34 | | | | 359 | | | | 13 | | | | 122 | |
| | | | 34 | | | | 359 | | | | 13 | | | | 122 | |
NET INCREASE | | | 111,667 | | | $ | 1,238,051 | | | | 135,801 | | | $ | 1,234,533 | |
96
GOLDMAN SACHS FUNDAMENTAL EQUITY VALUE FUNDS
|
| 11. SUMMARY OF SHARE TRANSACTIONS (continued) |
Share activity is as follows:
| | | | | | | | | | | | | | | | |
| | | Large Cap Value Fund | |
| | | | |
| | | For the Fiscal Year Ended
August 31, 2017
| | | For the Fiscal Year Ended
August 31, 2016
| |
| | | | |
| | | Shares | | | Dollars | | | Shares | | | Dollars | |
| | | | |
| Class A Shares | | | | | | | | | | | | | | | | |
Shares sold | | | 1,886,754 | | | $ | 31,930,444 | | | | 2,885,635 | | | $ | 43,866,574 | |
Reinvestment of distributions | | | 181,127 | | | | 3,055,620 | | | | 1,381,919 | | | | 21,255,786 | |
Shares redeemed | | | (5,458,571 | ) | | | (92,596,706 | ) | | | (6,248,569 | ) | | | (96,897,243 | ) |
| | | | (3,390,690 | ) | | | (57,610,642 | ) | | | (1,981,015 | ) | | | (31,774,883 | ) |
| Class C Shares | | | | | | | | | | | | | | | | |
Shares sold | | | 313,983 | | | | 5,073,733 | | | | 411,235 | | | | 6,024,820 | |
Reinvestment of distributions | | | 26,279 | | | | 426,759 | | | | 216,657 | | | | 3,197,552 | |
Shares redeemed | | | (649,429 | ) | | | (10,605,292 | ) | | | (598,844 | ) | | | (8,936,943 | ) |
| | | | (309,167 | ) | | | (5,104,800 | ) | | | 29,048 | | | | 285,429 | |
| Institutional Shares | | | | | | | | | | | | | | | | |
Shares sold | | | 17,928,749 | | | | 312,568,899 | | | | 8,029,852 | | | | 124,203,173 | |
Reinvestment of distributions | | | 822,933 | | | | 13,989,850 | | | | 5,291,545 | | | | 82,208,815 | |
Shares redeemed | | | (37,401,314 | ) | | | (645,778,276 | ) | | | (20,093,530 | ) | | | (326,391,476 | ) |
| | | | (18,649,632 | ) | | | (319,219,527 | ) | | | (6,772,133 | ) | | | (119,979,488 | ) |
| Service Shares | | | | | | | | | | | | | | | | |
Shares sold | | | 21,477 | | | | 364,341 | | | | 69,996 | | | | 1,054,317 | |
Reinvestment of distributions | | | 654 | | | | 10,985 | | | | 6,411 | | | | 98,009 | |
Shares redeemed | | | (74,189 | ) | | | (1,239,691 | ) | | | (116,934 | ) | | | (1,790,061 | ) |
| | | | (52,058 | ) | | | (864,365 | ) | | | (40,527 | ) | | | (637,735 | ) |
| Investor Shares | | | | | | | | | | | | | | | | |
Shares sold | | | 265,786 | | | | 4,553,952 | | | | 79,726 | | | | 1,274,606 | |
Reinvestment of distributions | | | 3,571 | | | | 60,284 | | | | 38,678 | | | | 595,530 | |
Shares redeemed | | | (119,133 | ) | | | (2,010,246 | ) | | | (309,166 | ) | | | (4,895,897 | ) |
| | | | 150,224 | | | | 2,603,990 | | | | (190,762 | ) | | | (3,025,761 | ) |
| Class R Shares | | | | | | | | | | | | | | | | |
Shares sold | | | 88,110 | | | | 1,450,031 | | | | 82,228 | | | | 1,247,761 | |
Reinvestment of distributions | | | 5,852 | | | | 96,677 | | | | 46,232 | | | | 695,565 | |
Shares redeemed | | | (179,311 | ) | | | (2,938,210 | ) | | | (153,436 | ) | | | (2,332,484 | ) |
| | | | (85,349 | ) | | | (1,391,502 | ) | | | (24,976 | ) | | | (389,158 | ) |
| Class R6 Shares | | | | | | | | | | | | | | | | |
Shares sold | | | 362,303 | | | | 6,124,194 | | | | 7,942,737 | | | | 137,909,964 | |
Reinvestment of distributions | | | 154,155 | | | | 2,620,640 | | | | 794,300 | | | | 12,343,280 | |
Shares redeemed | | | (8,008,387 | ) | | | (138,718,553 | ) | | | (1,245,035 | ) | | | (19,232,419 | ) |
| | | | (7,491,929 | ) | | | (129,973,719 | ) | | | 7,492,002 | | | | 131,020,825 | |
NET DECREASE | | | (29,828,601 | ) | | $ | (511,560,565 | ) | | | (1,488,363 | ) | | $ | (24,500,771 | ) |
97
GOLDMAN SACHS FUNDAMENTAL EQUITY VALUE FUNDS
Notes to Financial Statements (continued)
August 31, 2017
|
| 11. SUMMARY OF SHARE TRANSACTIONS (continued) |
Share activity is as follows:
| | | | | | | | | | | | | | | | |
| | | Mid Cap Value Fund | |
| | | | |
| | | For the Fiscal Year Ended
August 31, 2017
| | | For the Fiscal Year Ended
August 31, 2016
| |
| | | | |
| | | Shares | | | Dollars | | | Shares | | | Dollars | |
| | | | |
| Class A Shares | | | | | | | | | | | | | | | | |
Shares sold | | | 3,554,117 | | | $ | 132,100,813 | | | | 6,355,588 | | | $ | 216,420,779 | |
Reinvestment of distributions | | | 285,115 | | | | 10,617,685 | | | | 5,591,955 | | | | 185,793,826 | |
Shares redeemed | | | (20,258,821 | ) | | | (749,120,345 | ) | | | (21,620,247 | ) | | | (734,771,946 | ) |
| | | | (16,419,589 | ) | | | (606,401,847 | ) | | | (9,672,704 | ) | | | (332,557,341 | ) |
| Class C Shares | | | | | | | | | | | | | | | | |
Shares sold | | | 135,749 | | | | 4,596,304 | | | | 377,449 | | | | 11,755,203 | |
Reinvestment of distributions | | | 14,976 | | | | 508,148 | | | | 571,513 | | | | 17,294,001 | |
Shares redeemed | | | (1,591,198 | ) | | | (53,894,346 | ) | | | (1,590,480 | ) | | | (49,300,924 | ) |
| | | | (1,440,473 | ) | | | (48,789,894 | ) | | | (641,518 | ) | | | (20,251,720 | ) |
| Institutional Shares | | | | | | | | | | | | | | | | |
Shares sold | | | 10,788,194 | | | | 403,461,978 | | | | 25,105,530 | | | | 849,735,755 | |
Reinvestment of distributions | | | 1,061,528 | | | | 39,849,763 | | | | 16,670,552 | | | | 560,463,699 | |
Shares redeemed | | | (78,473,532 | ) | | | (2,935,071,290 | ) | | | (87,925,338 | ) | | | (3,039,743,596 | ) |
| | | | (66,623,810 | ) | | | (2,491,759,549 | ) | | | (46,149,256 | ) | | | (1,629,544,142 | ) |
| Service Shares | | | | | | | | | | | | | | | | |
Shares sold | | | 303,331 | | | | 11,099,829 | | | | 721,569 | | | | 24,266,187 | |
Reinvestment of distributions | | | 24,888 | | | | 911,644 | | | | 697,149 | | | | 22,758,583 | |
Shares redeemed | | | (2,036,528 | ) | | | (73,352,020 | ) | | | (3,199,705 | ) | | | (104,551,077 | ) |
| | | | (1,708,309 | ) | | | (61,340,547 | ) | | | (1,780,987 | ) | | | (57,526,307 | ) |
| Investor Shares | | | | | | | | | | | | | | | | |
Shares sold | | | 3,015,843 | | | | 111,164,624 | | | | 2,045,977 | | | | 70,085,435 | |
Reinvestment of distributions | | | 76,806 | | | | 2,802,661 | | | | 1,001,683 | | | | 32,713,762 | |
Shares redeemed | | | (7,396,177 | ) | | | (272,882,410 | ) | | | (4,644,981 | ) | | | (157,407,717 | ) |
| | | | (4,303,528 | ) | | | (158,915,125 | ) | | | (1,597,321 | ) | | | (54,608,520 | ) |
| Class R Shares | | | | | | | | | | | | | | | | |
Shares sold | | | 204,741 | | | | 7,429,211 | | | | 405,682 | | | | 13,700,699 | |
Reinvestment of distributions | | | 7,913 | | | | 287,644 | | | | 130,451 | | | | 4,230,456 | |
Shares redeemed | | | (462,168 | ) | | | (16,799,584 | ) | | | (482,052 | ) | | | (16,053,475 | ) |
| | | | (249,514 | ) | | | (9,082,729 | ) | | | 54,081 | | | | 1,877,680 | |
| Class R6 Shares | | | | | | | | | | | | | | | | |
Shares sold | | | 2,149,472 | | | | 79,774,692 | | | | 13,963,340 | | | | 510,945,821 | |
Reinvestment of distributions | | | 158,716 | | | | 5,955,039 | | | | 1,189,720 | | | | 39,986,116 | |
Shares redeemed | | | (10,854,967 | ) | | | (413,534,942 | ) | | | (4,705,460 | ) | | | (164,927,737 | ) |
| | | | (8,546,779 | ) | | | (327,805,211 | ) | | | 10,447,600 | | | | 386,004,200 | |
NET DECREASE | | | (99,292,002 | ) | | $ | (3,704,094,902 | ) | | | (49,340,105 | ) | | $ | (1,706,606,150 | ) |
98
GOLDMAN SACHS FUNDAMENTAL EQUITY VALUE FUNDS
|
| 11. SUMMARY OF SHARE TRANSACTIONS (continued) |
Share activity is as follows:
| | | | | | | | | | | | | | | | |
| | | Small Cap Value Fund | |
| | | | |
| | | For the Fiscal Year Ended
August 31, 2017
| | | For the Fiscal Year Ended
August 31, 2016
| |
| | | | |
| | | Shares | | | Dollars | | | Shares | | | Dollars | |
| | | | |
| Class A Shares | | | | | | | | | | | | | | | | |
Shares sold | | | 3,491,779 | | | $ | 195,280,134 | | | | 3,238,202 | | | $ | 154,375,191 | |
Reinvestment of distributions | | | 526,209 | | | | 30,118,450 | | | | 901,558 | | | | 42,559,273 | |
Shares redeemed | | | (6,653,639 | ) | | | (372,070,556 | ) | | | (5,556,748 | ) | | | (264,856,085 | ) |
| | | | (2,635,651 | ) | | | (146,671,972 | ) | | | (1,416,988 | ) | | | (67,921,621 | ) |
| Class C Shares | | | | | | | | | | | | | | | | |
Shares sold | | | 59,570 | | | | 2,626,266 | | | | 85,898 | | | | 3,279,343 | |
Reinvestment of distributions | | | 34,974 | | | | 1,576,275 | | | | 68,406 | | | | 2,576,165 | |
Shares redeemed | | | (403,022 | ) | | | (17,714,849 | ) | | | (481,475 | ) | | | (18,395,042 | ) |
| | | | (308,478 | ) | | | (13,512,308 | ) | | | (327,171 | ) | | | (12,539,534 | ) |
| Institutional Shares | | | | | | | | | | | | | | | | |
Shares sold | | | 21,286,708 | | | | 1,270,304,794 | | | | 17,427,197 | | | | 886,530,469 | |
Reinvestment of distributions | | | 2,661,796 | | | | 163,363,244 | | | | 4,333,376 | | | | 218,630,055 | |
Shares redeemed | | | (31,317,362 | ) | | | (1,860,067,130 | ) | | | (26,928,367 | ) | | | (1,386,761,311 | ) |
| | | | (7,368,858 | ) | | | (426,399,092 | ) | | | (5,167,794 | ) | | | (281,600,787 | ) |
| Service Shares | | | | | | | | | | | | | | | | |
Shares sold | | | 1,105,815 | | | | 59,919,977 | | | | 715,838 | | | | 33,131,625 | |
Reinvestment of distributions | | | 74,473 | | | | 4,143,684 | | | | 144,414 | | | | 6,634,801 | |
Shares redeemed | | | (862,767 | ) | | | (46,698,576 | ) | | | (1,292,420 | ) | | | (59,025,815 | ) |
| | | | 317,521 | | | | 17,365,085 | | | | (432,168 | ) | | | (19,259,389 | ) |
| Investor Shares | | | | | | | | | | | | | | | | |
Shares sold | | | 1,253,311 | | | | 69,504,603 | | | | 1,414,732 | | | | 67,475,547 | |
Reinvestment of distributions | | | 115,731 | | | | 6,586,539 | | | | 178,553 | | | | 8,381,286 | |
Shares redeemed | | | (1,482,905 | ) | | | (82,500,866 | ) | | | (1,079,227 | ) | | | (51,005,223 | ) |
| | | | (113,863 | ) | | | (6,409,724 | ) | | | 514,058 | | | | 24,851,610 | |
| Class R Shares | | | | | | | | | | | | | | | | |
Shares sold | | | 651,452 | | | | 35,649,530 | | | | 627,785 | | | | 29,542,384 | |
Reinvestment of distributions | | | 73,500 | | | | 4,131,777 | | | | 123,318 | | | | 5,723,131 | |
Shares redeemed | | | (867,711 | ) | | | (47,774,451 | ) | | | (1,168,739 | ) | | | (55,180,884 | ) |
| | | | (142,759 | ) | | | (7,993,144 | ) | | | (417,636 | ) | | | (19,915,369 | ) |
| Class R6 Shares | | | | | | | | | | | | | | | | |
Shares sold | | | 8,716,635 | | | | 523,857,981 | | | | 6,108,964 | | | | 312,236,113 | |
Reinvestment of distributions | | | 250,770 | | | | 15,387,048 | | | | 50,143 | | | | 2,529,721 | |
Shares redeemed | | | (2,122,961 | ) | | | (127,889,614 | ) | | | (1,018,482 | ) | | | (50,485,046 | ) |
| | | | 6,844,444 | | | | 411,355,415 | | | | 5,140,625 | | | | 264,280,788 | |
NET DECREASE | | | (3,407,644 | ) | | $ | (172,265,740 | ) | | | (2,107,074 | ) | | $ | (112,104,302 | ) |
99
GOLDMAN SACHS FUNDAMENTAL EQUITY VALUE FUNDS
Notes to Financial Statements (continued)
August 31, 2017
|
| 11. SUMMARY OF SHARE TRANSACTIONS (continued) |
Share activity is as follows:
| | | | | | | | | | | | | | | | |
| | | Small/Mid Cap Value Fund | |
| | | | |
| | | For the Fiscal Year Ended
August 31, 2017
| | | For the Fiscal Year Ended
August 31, 2016
| |
| | | | |
| | | Shares | | | Dollars | | | Shares | | | Dollars | |
| | | | |
| Class A Shares | | | | | | | | | | | | | | | | |
Shares sold | | | 101,511 | | | $ | 1,235,192 | | | | 62,953 | | | $ | 638,988 | |
Reinvestment of distributions | | | 685 | | | | 8,317 | | | | 394 | | | | 4,068 | |
Shares redeemed | | | (82,054 | ) | | | (1,010,596 | ) | | | (13,144 | ) | | | (133,211 | ) |
| | | | 20,142 | | | | 232,913 | | | | 50,203 | | | | 509,845 | |
| Class C Shares | | | | | | | | | | | | | | | | |
Shares sold | | | 45,708 | | | | 535,335 | | | | 28,884 | | | | 281,741 | |
Reinvestment of distributions | | | 157 | | | | 1,874 | | | | 172 | | | | 1,759 | |
Shares redeemed | | | (9,181 | ) | | | (110,712 | ) | | | (3,950 | ) | | | (36,741 | ) |
| | | | 36,684 | | | | 426,497 | | | | 25,106 | | | | 246,759 | |
| Institutional Shares | | | | | | | | | | | | | | | | |
Shares sold | | | 1,139,894 | | | | 13,907,291 | | | | 2,311,718 | | | | 23,637,673 | |
Reinvestment of distributions | | | 35,493 | | | | 434,076 | | | | 18,556 | | | | 192,017 | |
Shares redeemed | | | (1,279,686 | ) | | | (15,855,828 | ) | | | (1,305,658 | ) | | | (13,429,411 | ) |
| | | | (104,299 | ) | | | (1,514,461 | ) | | | 1,024,616 | | | | 10,400,279 | |
| Investor Shares | | | | | | | | | | | | | | | | |
Shares sold | | | 88,468 | | | | 1,098,210 | | | | 477,865 | | | | 5,127,405 | |
Reinvestment of distributions | | | 1,476 | | | | 17,996 | | | | 3,440 | | | | 35,503 | |
Shares redeemed | | | (82,326 | ) | | | (964,026 | ) | | | (239,140 | ) | | | (2,537,181 | ) |
| | | | 7,618 | | | | 152,180 | | | | 242,165 | | | | 2,625,727 | |
| Class R Shares | | | | | | | | | | | | | | | | |
Shares sold | | | 501 | | | | 5,968 | | | | 6,481 | | | | 60,736 | |
Reinvestment of distributions | | | 28 | | | | 338 | | | | 28 | | | | 294 | |
Shares redeemed | | | (1,747 | ) | | | (20,571 | ) | | | (7,144 | ) | | | (75,581 | ) |
| | | | (1,218 | ) | | | (14,265 | ) | | | (635 | ) | | | (14,551 | ) |
| Class R6 Shares | | | | | | | | | | | | | | | | |
Shares sold | | | 5,630,623 | | | | 70,377,435 | | | | — | | | | — | |
Reinvestment of distributions | | | 8 | | | | 99 | | | | 6 | | | | 68 | |
Shares redeemed | | | (733,547 | ) | | | (9,155,040 | ) | | | — | | | | — | |
| | | | 4,897,084 | | | | 61,222,494 | | | | 6 | | | | 68 | |
NET INCREASE | | | 4,856,011 | | | $ | 60,505,358 | | | | 1,341,461 | | | $ | 13,768,127 | |
100
Report of Independent Registered Public
Accounting Firm
To the Board of Trustees of Goldman Sachs Trust and Shareholders of
the Goldman Sachs Focused Value Fund, Goldman Sachs Equity Income Fund (formerly Goldman Sachs Growth and Income Fund), Goldman Sachs Large Cap Value Fund, Goldman Sachs Mid Cap Value Fund, Goldman Sachs Small Cap Value Fund, and Goldman Sachs Small/Mid Cap Value Fund:
In our opinion, the accompanying statements of assets and liabilities, including the schedules of investments, and the related statements of operations and of changes in net assets and the financial highlights present fairly, in all material respects, the financial position of the Goldman Sachs Focused Value Fund, Goldman Sachs Equity Income Fund (formerly Goldman Sachs Growth and Income Fund), Goldman Sachs Large Cap Value Fund, Goldman Sachs Mid Cap Value Fund, Goldman Sachs Small Cap Value Fund, and Goldman Sachs Small/Mid Cap Value Fund (collectively the “Funds”), funds of the Goldman Sachs Trust, as of August 31, 2017, and the results of each of their operations for the year then ended, the changes in each of their net assets for each of the two years in the period then ended and the financial highlights for each of the periods presented therein, in conformity with accounting principles generally accepted in the United States of America. These financial statements and financial highlights (hereafter referred to as “financial statements”) are the responsibility of the Funds’ management. Our responsibility is to express an opinion on these financial statements based on our audits. We conducted our audits of these financial statements in accordance with the standards of the Public Company Accounting Oversight Board (United States). Those standards require that we plan and perform the audit to obtain reasonable assurance about whether the financial statements are free of material misstatement. An audit includes examining, on a test basis, evidence supporting the amounts and disclosures in the financial statements, assessing the accounting principles used and significant estimates made by management, and evaluating the overall financial statement presentation. We believe that our audits, which included confirmation of securities as of August 31, 2017 by correspondence with the custodian, transfer agent of the underlying funds, and the application of alternative auditing procedures where securities purchased confirmations had not been received, provide a reasonable basis for our opinion.
PricewaterhouseCoopers LLP
Boston, Massachusetts
October 24, 2017
101
GOLDMAN SACHS FUNDAMENTAL EQUITY VALUE FUNDS
Fund Expenses — Six Month Period Ended August 31, 2017 (Unaudited)
As a shareholder of Class A, Class C, Institutional, Service, Investor, Class R and Class R6 Shares of a Fund, you incur two types of costs: (1) transaction costs, including sales charges on purchase payments (with respect to Class A Shares) and contingent deferred sales charges on redemptions (with respect to Class C Shares), and (2) ongoing costs, including management fees, distribution and/or service (12b-1) fees (with respect to Class A, Class C, Service and Class R Shares), and other Fund expenses. This Example is intended to help you understand your ongoing costs (in dollars) of investing in Class A, Class C, Institutional, Service, Investor, Class R or Class R6 Shares of the Funds and to compare these costs with the ongoing costs of investing in other mutual funds.
The Example is based on an investment of $1,000 invested at the beginning of the period and held for the entire period from March 1, 2017 through August 31, 2017, which represents a period of 184 days in a 365-day year.
Actual Expenses — The first line under each share class in the table below provides information about actual account values and actual expenses. You may use the information in this line, together with the amount you invested, to estimate the expenses that you paid over the period. Simply divide your account value by $1,000 (for example, an $8,600 account value divided by $1,000=8.6), then multiply the result by the number in the first line under the heading entitled “Expenses Paid” to estimate the expenses you paid on your account during this period.
Hypothetical Example for Comparison Purposes — The second line under each share class in the table below provides information about hypothetical account values and hypothetical expenses based on the Funds’ actual net expense ratios and an assumed rate of return of 5% per year before expenses, which is not the Funds’ actual return. The hypothetical account values and expenses may not be used to estimate the actual ending account balance or expenses you paid for the period. You may use this information to compare the ongoing costs of investing in the Funds and other funds. To do so, compare this 5% hypothetical example with the 5% hypothetical examples that appear in the shareholder reports of the other funds.
Please note that the expenses shown in the table are meant to highlight your ongoing costs only and do not reflect any transactional costs, such as sales charges, redemption fees, or exchange fees. Therefore, the second line of the table is useful in comparing ongoing costs only, and will not help you determine the relative total costs of owning different funds. In addition, if these transactional costs were included, your costs would have been higher.
| | | | | | | | | | | | | | | | | | | | | | | | | | | | | | | | | | | | |
| | | Equity Income Fund | | | Focused Value Fund | | | Large Cap Value Fund | |
| Share Class | | Beginning
Account
Value 3/1/17 | | | Ending
Account
Value
8/31/17 | | | Expenses
Paid for the
6 months ended
8/31/17(a) | | | Beginning
Account
Value 3/1/17 | | | Ending
Account
Value
8/31/17 | | | Expenses
Paid for the
6 months ended
8/31/17(a) | | | Beginning
Account
Value
3/1/17 | | | Ending
Account
Value
8/31/17 | | | Expenses
Paid for the
6 months ended
8/31/17(a) | |
| Class A | | | | | | | | | | | | | | | | | | | | | | | | | | | | | | | | | | | | |
Actual | | $ | 1,000.00 | | | $ | 992.30 | | | $ | 5.68 | | | $ | 1,000.00 | | | $ | 1,024.00 | | | $ | 5.76 | | | $ | 1,000.00 | | | $ | 991.90 | | | $ | 5.62 | |
Hypothetical 5% return | | | 1,000.00 | | | | 1,019.51 | (b) | | | 5.75 | | | | 1,000.00 | | | | 1,019.51 | (b) | | | 5.75 | | | | 1,000.00 | | | | 1,019.56 | (b) | | | 5.70 | |
| Class C | | | | | | | | | | | | | | | | | | | | | | | | | | | | | | | | | | | | |
Actual | | | 1,000.00 | | | | 988.50 | | | | 9.45 | | | | 1,000.00 | | | | 1,020.30 | | | | 9.57 | | | | 1,000.00 | | | | 988.00 | | | | 9.37 | |
Hypothetical 5% return | | | 1,000.00 | | | | 1,015.73 | (b) | | | 9.55 | | | | 1,000.00 | | | | 1,015.73 | (b) | | | 9.55 | | | | 1,000.00 | | | | 1,015.78 | (b) | | | 9.50 | |
| Institutional | | | | | | | | | | | | | | | | | | | | | | | | | | | | | | | | | | | | |
Actual | | | 1,000.00 | | | | 994.30 | | | | 3.67 | | | | 1,000.00 | | | | 1,025.80 | | | | 3.73 | | | | 1,000.00 | | | | 993.70 | | | | 3.97 | |
Hypothetical 5% return | | | 1,000.00 | | | | 1,021.53 | (b) | | | 3.72 | | | | 1,000.00 | | | | 1,021.53 | (b) | | | 3.72 | | | | 1,000.00 | | | | 1,021.22 | (b) | | | 4.02 | |
| Service | | | | | | | | | | | | | | | | | | | | | | | | | | | | | | | | | | | | |
Actual | | | N/A | | | | 991.80 | | | | 6.18 | | | | N/A | | | | N/A | | | | N/A | | | | 1,000.00 | | | | 990.80 | | | | 6.47 | |
Hypothetical 5% return | | | N/A | | | | 1,019.00 | (b) | | | 6.26 | | | | N/A | | | | N/A | | | | N/A | | | | 1,000.00 | | | | 1,018.70 | (b) | | | 6.56 | |
| Investor | | | | | | | | | | | | | | | | | | | | | | | | | | | | | | | | | | | | |
Actual | | | 1,000.00 | | | | 993.60 | | | | 4.42 | | | | 1,000.00 | | | | 1,024.90 | | | | 4.49 | | | | 1,000.00 | | | | 993.10 | | | | 4.37 | |
Hypothetical 5% return | | | 1,000.00 | | | | 1,020.77 | (b) | | | 4.48 | | | | 1,000.00 | | | | 1,020.77 | (b) | | | 4.48 | | | | 1,000.00 | | | | 1,020.82 | (b) | | | 4.43 | |
| Class R | | | | | | | | | | | | | | | | | | | | | | | | | | | | | | | | | | | | |
Actual | | | 1,000.00 | | | | 991.20 | | | | 6.94 | | | | 1,000.00 | | | | 1,023.10 | | | | 7.04 | | | | 1,000.00 | | | | 990.60 | | | | 6.87 | |
Hypothetical 5% return | | | 1,000.00 | | | | 1,018.25 | (b) | | | 7.02 | | | | 1,000.00 | | | | 1,018.25 | (b) | | | 7.02 | | | | 1,000.00 | | | | 1,018.30 | (b) | | | 6.97 | |
| Class R6 | | | | | | | | | | | | | | | | | | | | | | | | | | | | | | | | | | | | |
Actual | | | 1,000.00 | | | | 994.30 | | | | 3.62 | | | | 1,000.00 | | | | 1,026.70 | | | | 3.68 | | | | 1,000.00 | | | | 995.40 | | | | 3.82 | |
Hypothetical 5% return | | | 1,000.00 | | | | 1,021.58 | (b) | | | 3.67 | | | | 1,000.00 | | | | 1,021.58 | (b) | | | 3.67 | | | | 1,000.00 | | | | 1,021.37 | (b) | | | 3.87 | |
102
GOLDMAN SACHS FUNDAMENTAL EQUITY VALUE FUNDS
Fund Expenses — Six Month Period Ended August 31, 2017 (Unaudited) (continued)
| | | | | | | | | | | | | | | | | | | | | | | | | | | | | | | | | | | | |
| | | Mid Cap Value Fund | | | Small Cap Value Fund | | | Small/Mid Cap Value Fund | |
| Share Class | | Beginning
Account
Value 3/1/17 | | | Ending
Account
Value
8/31/17 | | | Expenses
Paid for the
6 months ended
8/31/17(a) | | | Beginning
Account
Value 3/1/17 | | | Ending
Account
Value
8/31/17 | | | Expenses
Paid for the
6 months ended
8/31/17(a) | | | Beginning
Account
Value 3/1/17 | | | Ending
Account
Value
8/31/17 | | | Expenses
Paid for the
6 months ended
8/31/17(a) | |
| Class A | | | | | | | | | | | | | | | | | | | | | | | | | | | | | | | | | | | | |
Actual | | $ | 1,000.00 | | | $ | 1,001.60 | | | $ | 5.95 | | | $ | 1,000.00 | | | $ | 987.80 | | | $ | 6.71 | | | $ | 1,000.00 | | | $ | 992.00 | | | $ | 6.23 | |
Hypothetical 5% return | | | 1,000.00 | | | | 1,019.26 | (b) | | | 6.01 | | | | 1,000.00 | | | | 1,018.45 | (b) | | | 6.82 | | | | 1,000.00 | | | | 1,018.95 | (b) | | | 6.31 | |
| Class C | | | | | | | | | | | | | | | | | | | | | | | | | | | | | | | | | | | | |
Actual | | | 1,000.00 | | | | 997.70 | | | | 9.72 | | | | 1,000.00 | | | | 984.10 | | | | 10.45 | | | | 1,000.00 | | | | 988.60 | | | | 9.97 | |
Hypothetical 5% return | | | 1,000.00 | | | | 1,015.48 | (b) | | | 9.80 | | | | 1,000.00 | | | | 1,014.67 | (b) | | | 10.61 | | | | 1,000.00 | | | | 1,015.17 | (b) | | | 10.11 | |
| Institutional | | | | | | | | | | | | | | | | | | | | | | | | | | | | | | | | | | | | |
Actual | | | 1,000.00 | | | | 1,003.40 | | | | 3.94 | | | | 1,000.00 | | | | 989.70 | | | | 4.71 | | | | 1,000.00 | | | | 994.40 | | | | 4.22 | |
Hypothetical 5% return | | | 1,000.00 | | | | 1,021.27 | (b) | | | 3.97 | | | | 1,000.00 | | | | 1,020.47 | (b) | | | 4.79 | | | | 1,000.00 | | | | 1,020.97 | (b) | | | 4.28 | |
| Service | | | | | | | | | | | | | | | | | | | | | | | | | | | | | | | | | | | | |
Actual | | | 1,000.00 | | | | 1,000.80 | | | | 6.46 | | | | 1,000.00 | | | | 987.30 | | | | 7.21 | | | | N/A | | | | N/A | | | | N/A | |
Hypothetical 5% return | | | 1,000.00 | | | | 1,018.75 | (b) | | | 6.51 | | | | 1,000.00 | | | | 1,017.95 | (b) | | | 7.32 | | | | N/A | | | | N/A | | | | N/A | |
| Investor | | | | | | | | | | | | | | | | | | | | | | | | | | | | | | | | | | | | |
Actual | | | 1,000.00 | | | | 1,002.70 | | | | 4.69 | | | | 1,000.00 | | | | 988.90 | | | | 5.46 | | | | 1,000.00 | | | | 993.60 | | | | 4.97 | |
Hypothetical 5% return | | | 1,000.00 | | | | 1,020.52 | (b) | | | 4.74 | | | | 1,000.00 | | | | 1,019.71 | (b) | | | 5.55 | | | | 1,000.00 | | | | 1,020.21 | (b) | | | 5.04 | |
| Class R | | | | | | | | | | | | | | | | | | | | | | | | | | | | | | | | | | | | |
Actual | | | 1,000.00 | | | | 1,000.00 | | | | 7.21 | | | | 1,000.00 | | | | 986.50 | | | | 7.96 | | | | 1,000.00 | | | | 992.00 | | | | 7.48 | |
Hypothetical 5% return | | | 1,000.00 | | | | 1,018.00 | (b) | | | 7.27 | | | | 1,000.00 | | | | 1,017.19 | (b) | | | 8.08 | | | | 1,000.00 | | | | 1,017.69 | (b) | | | 7.58 | |
| Class R6 | | | | | | | | | | | | | | | | | | | | | | | | | | | | | | | | | | | | |
Actual | | | 1,000.00 | | | | 1,003.60 | | | | 3.79 | | | | 1,000.00 | | | | 989.70 | | | | 4.66 | | | | 1,000.00 | | | | 995.20 | | | | 4.17 | |
Hypothetical 5% return | | | 1,000.00 | | | | 1,021.42 | (b) | | | 3.82 | | | | 1,000.00 | | | | 1,020.52 | (b) | | | 4.74 | | | | 1,000.00 | | | | 1,021.02 | (b) | | | 4.23 | |
| | (a) | | Expenses for each share class are calculated using each Fund’s annualized net expense ratio for each class, which represents the ongoing expenses as a percentage of net assets for the six months ended August 31, 2017. Expenses are calculated by multiplying the annualized net expense ratio by the average account value for the period; then multiplying the result by the number of days in the most recent fiscal half year; and then dividing that result by the number of days in the fiscal year. The annualized net expense ratios for the period were as follows: | |
| | (b) | | Hypothetical expenses are based on each Fund’s actual annualized net expense ratios and an assumed rate of return of 5% per year before expenses. | |
| | | | | | | | | | | | | | | | | | | | | | | | | | | | |
| Fund | | Class A | | | Class C | | | Institutional | | | Service | | | Investor | | | Class R | | | Class R6 | |
Equity Income+ | | | 1.13 | | | | 1.88 | | | | 0.73 | | | | 1.23 | | | | 0.88 | | | | 1.38 | | | | N/A | |
Focused Value+ | | | 1.13 | | | | 1.88 | | | | 0.73 | | | | N/A | | | | 0.88 | | | | 1.38 | | | | N/A | |
Large Cap Value+ | | | 1.12 | | | | 1.87 | | | | 0.79 | | | | 1.29 | | | | 0.87 | | | | 1.37 | | | | N/A | |
Mid Cap Value+ | | | 1.18 | | | | 1.93 | | | | 0.78 | | | | 1.28 | | | | 0.93 | | | | 1.43 | | | | N/A | |
Small Cap Value+ | | | 1.34 | | | | 2.09 | | | | 0.94 | | | | 1.44 | | | | 1.09 | | | | 1.59 | | | | N/A | |
Small/Mid Cap Value+ | | | 1.24 | | | | 1.99 | | | | 0.84 | | | | N/A | | | | 0.99 | | | | 1.49 | | | | N/A | |
| + | | Hypothetical expenses are based on each Fund’s actual annualized net expense ratios and an assumed rate of return of 5% per year before expenses. |
103
GOLDMAN SACHS FUNDAMENTAL EQUITY VALUE FUNDS
Statement Regarding Basis for Approval of Management Agreement (Unaudited)
Background
The Goldman Sachs Equity Income Fund (formerly, Goldman Sachs Growth and Income Fund), Goldman Sachs Focused Value Fund, Goldman Sachs Large Cap Value Fund, Goldman Sachs Mid Cap Value Fund, Goldman Sachs Small Cap Value Fund, and Goldman Sachs Small/Mid Cap Value Fund (the “Funds”) are investment portfolios of Goldman Sachs Trust (the “Trust”). The Board of Trustees oversees the management of the Trust and reviews the investment performance and expenses of the Funds at regularly scheduled meetings held throughout the year. In addition, the Board of Trustees determines annually whether to approve the continuance of the Trust’s investment management agreement (the “Management Agreement”) with Goldman Sachs Asset Management, L.P. (the “Investment Adviser”) on behalf of the Funds.
The Management Agreement was most recently approved for continuation until June 30, 2018 by the Board of Trustees, including those Trustees who are not parties to the Management Agreement or “interested persons” (as defined in the Investment Company Act of 1940, as amended) of any party thereto (the “Independent Trustees”), at a meeting held on June 14-15, 2017 (the “Annual Meeting”).
The review process undertaken by the Trustees spans the course of the year and culminates with the Annual Meeting. To assist the Trustees in their deliberations, the Trustees have established a Contract Review Committee (the “Committee”), comprised of the Independent Trustees. The Committee held four meetings over the course of the year since the Management Agreement was last approved. At those Committee meetings, regularly scheduled Board or other committee meetings, and/or the Annual Meeting, matters relevant to the renewal of the Management Agreement were considered by the Board, or the Independent Trustees, as applicable. With respect to each Fund, such matters included:
| | (a) | | the nature and quality of the advisory, administrative, and other services provided to the Fund by the Investment Adviser and its affiliates, including information about: |
| | (i) | | the structure, staff, and capabilities of the Investment Adviser and its portfolio management teams; |
| | (ii) | | the groups within the Investment Adviser and its affiliates that support the portfolio management teams or provide other types of necessary services, including fund services groups (e.g., accounting and financial reporting, tax, shareholder services, and operations); controls and risk management groups (e.g., legal, compliance, valuation oversight, credit risk management, internal audit, compliance testing, market risk analysis, finance, and central funding); sales and distribution support groups, and others (e.g., information technology and training); |
| | (iii) | | trends in employee headcount; |
| | (iv) | | the Investment Adviser’s financial resources and ability to hire and retain talented personnel and strengthen its operations; and |
| | (v) | | the parent company’s support of the Investment Adviser and its mutual fund business, as expressed by the firm’s senior management; |
| | (b) | | information on the investment performance of the Fund, including comparisons to the performance of similar mutual funds, as provided by a third-party mutual fund data provider engaged as part of the contract review process (the “Outside Data Provider”), a benchmark performance index, and, (in the case of the Large Cap Value, Mid Cap Value, Small Cap Value, and Small/Mid Cap Value Funds), a composite of accounts with comparable investment strategies managed by the Investment Adviser; and information on general investment outlooks in the markets in which the Fund invests; |
| | (c) | | information provided by the Investment Adviser indicating the Investment Adviser’s views on whether the Fund’s peer group and/or benchmark index had high, medium, or low relevance given the Fund’s particular investment strategy; |
| | (d) | | the terms of the Management Agreement and other agreements with affiliated service providers entered into by the Trust on behalf of the Fund; |
| | (e) | | fee and expense information for the Fund, including: |
| | (i) | | the relative management fee and expense levels of the Fund as compared to those of comparable funds managed by other advisers, as provided by the Outside Data Provider; |
| | (ii) | | the Fund’s expense trends over time; and |
| | (iii) | | to the extent the Investment Adviser manages other types of accounts (such as bank collective trusts, private wealth management accounts, institutional separate accounts, sub-advised mutual funds, and non-U.S. funds) having investment objectives and policies similar to those of the Fund, comparative information on the advisory fees charged and services provided to those accounts by the Investment Adviser; |
| | (f) | | with respect to the extensive investment performance and expense comparison data provided by the Outside Data Provider, its processes in producing that data for the Fund; |
| | (g) | | the undertakings of the Investment Adviser and its affiliates to implement fee waivers and/or expense limitations; |
104
GOLDMAN SACHS FUNDAMENTAL EQUITY VALUE FUNDS
Statement Regarding Basis for Approval of Management Agreement (Unaudited) (continued)
| | (h) | | information relating to the profitability of the Management Agreement and the transfer agency and distribution and service arrangements of the Fund to the Investment Adviser and its affiliates; |
| | (i) | | whether the Fund’s existing management fee schedule adequately addressed any economies of scale; |
| | (j) | | a summary of the “fall-out” benefits derived by the Investment Adviser and its affiliates from their relationships with the Fund, including the fees received by the Investment Adviser’s affiliates from the Fund for transfer agency, portfolio trading, distribution and other services; |
| | (k) | | a summary of potential benefits derived by the Fund as a result of its relationship with the Investment Adviser; |
| | (l) | | information regarding commissions paid by the Fund and broker oversight, an update on the Investment Adviser’s soft dollars practices, other information regarding portfolio trading, and how the Investment Adviser carries out its duty to seek best execution; |
| | (m) | | portfolio manager ownership of Fund shares; the manner in which portfolio manager compensation is determined; and the number and types of accounts managed by the portfolio managers; |
| | (n) | | the nature and quality of the services provided to the Fund by its unaffiliated service providers, and the Investment Adviser’s general oversight and evaluation (including reports on due diligence) of those service providers as part of the administrative services provided under the Management Agreement; and |
| | (o) | | the Investment Adviser’s processes and policies addressing various types of potential conflicts of interest; its approach to risk management; the annual review of the effectiveness of the Fund’s compliance program; and periodic compliance reports. |
The Trustees also received an overview of the Funds’ distribution arrangements. They received information regarding the Funds’ assets, share purchase and redemption activity, and payment of distribution, service, and shareholder administration fees, as applicable. Information was also provided to the Trustees relating to revenue sharing payments made by and services provided by the Investment Adviser and its affiliates to intermediaries that promote the sale, distribution, and/or servicing of Fund shares. The Independent Trustees also discussed the broad range of other investment choices that are available to Fund investors, including the availability of comparable funds managed by other advisers.
The presentations made at the Board and Committee meetings and at the Annual Meeting encompassed the Funds and other mutual funds for which the Board of Trustees has responsibility. In evaluating the Management Agreement at the Annual Meeting, the Trustees relied upon their knowledge, resulting from their meetings and other interactions throughout the year, of the Investment Adviser and its affiliates, their services, and the Funds. In conjunction with these meetings, the Trustees received written materials and oral presentations on the topics covered, and the Investment Adviser addressed the questions and concerns of the Trustees, including concerns regarding the investment performance of certain of the funds they oversee. The Independent Trustees were advised by their independent legal counsel regarding their responsibilities and other regulatory requirements related to the approval and continuation of mutual fund investment management agreements under applicable law. In addition, the Investment Adviser and its affiliates provided the Independent Trustees with a written response to a formal request for information sent on behalf of the Independent Trustees by their independent legal counsel. During the course of their deliberations, the Independent Trustees met in executive sessions with their independent legal counsel, without representatives of the Investment Adviser or its affiliates present.
Nature, Extent, and Quality of the Services Provided Under the Management Agreement
As part of their review, the Trustees considered the nature, extent, and quality of the services provided to the Funds by the Investment Adviser. In this regard, the Trustees considered both the investment advisory services and non-advisory services that are provided by the Investment Adviser and its affiliates. The Trustees noted the transition in the leadership and changes in personnel of various of the Investment Adviser’s portfolio management teams that had occurred in recent periods, and the ongoing recruitment efforts aimed at bringing high quality investment talent to the Investment Adviser. They also noted the Investment Adviser’s commitment to maintaining high quality systems and expending substantial resources to respond to ongoing changes to the regulatory and control environment in which the Funds and their service providers operate, as well as the efforts of the Investment Adviser and its affiliates to combat cyber security risks. The Trustees concluded that the Investment Adviser continued to commit substantial financial and operational resources to the Funds and expressed confidence that the Investment Adviser would continue to do so in the future. The Trustees also recognized that the Investment Adviser had made significant commitments to address regulatory compliance requirements applicable to the Funds and the Investment Adviser and its affiliates.
Investment Performance
The Trustees also considered the investment performance of the Funds. In this regard, they compared the investment performance of each Fund to its peers using rankings and ratings (rankings only with respect to the Focused Value and Small/Mid
105
GOLDMAN SACHS FUNDAMENTAL EQUITY VALUE FUNDS
Statement Regarding Basis for Approval of Management Agreement (Unaudited) (continued)
Cap Value Funds) compiled by the Outside Data Provider as of December 31, 2016, and updated performance information prepared by the Investment Adviser using the peer group identified by the Outside Data Provider as of March 31, 2017. The information on each Fund’s investment performance was provided for the one-, three-, five-, and ten-year periods ending on the applicable dates, to the extent that each Fund had been in existence for those periods. The Trustees also reviewed each Fund’s investment performance relative to its performance benchmark. As part of this review, they considered the investment performance trends of the Funds over time, and reviewed the investment performance of each Fund in light of its investment objective and policies and market conditions. The Trustees also received information comparing the Large Cap Value, Mid Cap Value, Small Cap Value, and Small/Mid Cap Value Funds’ performance to that of composites of accounts with comparable investment strategies managed by the Investment Adviser.
In addition, the Trustees considered materials prepared and presentations made by the Investment Adviser’s senior management and portfolio management personnel in which Fund performance was assessed. The Trustees also considered the Investment Adviser’s periodic reports with respect to the Funds’ risk profiles, and how the Investment Adviser’s approach to risk monitoring and management influences portfolio management.
The Trustees noted that the Equity Income Fund’s Institutional Shares had placed in the second quartile of the Fund’s peer group for the one-, three-, and five-year periods and in the third quartile for the ten-year period, and had underperformed the Fund’s benchmark index for the one-, three-, five-, and ten-year periods ended March 31, 2017. The Trustees also noted that they had approved introducing call options writing into Equity Income Fund’s strategy in June 2017. The Trustees noted that the Focused Value Fund’s Institutional Shares had placed in the first quartile of the Fund’s peer group and had outperformed the Fund’s benchmark for the one-year period ended March 31, 2017. They observed that the Large Cap Value Fund’s Institutional Shares had placed in the second quartile of the Fund’s peer group for the one- and five-year periods and in the third quartile for the three- and ten-year periods, and had underperformed the Fund’s benchmark index for the one-, three-, five-, and ten-year periods ended March 31, 2017. They noted that the Mid Cap Value Fund’s Institutional Shares had placed in the third quartile of the Fund’s peer group for the one- and ten-year periods and in the fourth quartile for the three- and five-year periods, and had underperformed the Fund’s benchmark for the one-, three-, five-, and ten-year periods ended March 31, 2017. The Trustees noted that the Small/Mid Cap Value Fund’s Institutional Shares had placed in the top half of the Fund’s peer group and had underperformed the Fund’s benchmark index for the one- and three-year periods ended March 31, 2017. They observed that the Small Cap Value Fund’s Institutional Shares had placed in the first quartile of the Fund’s peer group for the one-, three-, five-, and ten-year periods, and had outperformed the Fund’s benchmark index for the three-, five-, and ten-year periods and underperformed the Fund’s benchmark for the one-year period ended March 31, 2017.
Costs of Services Provided and Competitive Information
The Trustees considered the contractual terms of the Management Agreement and the fee rates payable by each Fund thereunder. In this regard, the Trustees considered information on the services rendered by the Investment Adviser to the Funds, which included both advisory and administrative services that were directed to the needs and operations of the Funds as registered mutual funds.
In particular, the Trustees reviewed analyses prepared by the Outside Data Provider regarding the expense rankings of the Funds. The analyses provided a comparison of each Fund’s management fee and breakpoints to those of a relevant peer group and category universe; an expense analysis which compared each Fund’s overall net and gross expenses to a peer group and a category universe; and data comparing each Fund’s net expenses to the peer and category medians. The analyses also compared each Fund’s transfer agency, custody, and distribution fees, other expenses and fee waivers/reimbursements to those of the peer group and category medians. The Trustees concluded that the comparisons provided by the Outside Data Provider were useful in evaluating the reasonableness of the management fees and total expenses paid by the Funds.
With respect to the Equity Income, Focused Value, Small Cap Value, and Small/Mid Cap Value Funds, the Trustees noted that the management fee breakpoint schedules were being reduced at certain asset levels. In addition, the Trustees considered the Investment Adviser’s undertakings to implement fee waivers and/or expense limitations. They also considered, to the extent that the Investment Adviser manages other types of accounts having investment objectives and policies similar to those of the Funds, comparative fee information for services provided by the Investment Adviser to those accounts, and information that indicated that services provided to the Funds differed in various significant respects from the services provided to other types of accounts which, in many cases, operated under less stringent legal and regulatory structures, required fewer services from the Investment Adviser to a smaller number of client contact points, and were less time-intensive.
In addition, the Trustees noted that shareholders are able to redeem their Fund shares at any time if shareholders believe that the Fund fees and expenses are too high or if they are dissatisfied with the performance of the Fund.
106
GOLDMAN SACHS FUNDAMENTAL EQUITY VALUE FUNDS
Statement Regarding Basis for Approval of Management Agreement (Unaudited) (continued)
Profitability
The Trustees reviewed each Fund’s contribution to the Investment Adviser’s revenues and pre-tax profit margins. In this regard the Trustees noted that they had received, among other things, profitability analyses and summaries, revenue and expense schedules by Fund and by function (i.e., investment management, transfer agency and distribution and service), and information on the Investment Adviser’s expense allocation methodology. They observed that the profitability and expense figures are substantially similar to those used by the Investment Adviser for many internal purposes, including compensation decisions among various business groups, and are thus subject to a vigorous internal debate about how certain revenue and expenses should be allocated. The Trustees also noted that the internal audit group within the Goldman Sachs organization had audited the expense allocation methodology and that the internal audit group was satisfied with the reasonableness, consistency, and accuracy of the Investment Adviser’s expense allocation methodology and profitability analysis calculations. Profitability data for each Fund was provided for 2016 and 2015, and the Trustees considered this information in relation to the Investment Adviser’s overall profitability.
Economies of Scale
The Trustees considered the information that had been provided regarding the Investment Adviser’s profitability. The Trustees also considered the breakpoints in the fee rate payable under the Management Agreement for each of the Funds at the following annual percentage rates of the average daily net assets of the Funds:
| | | | | | | | | | | | | | | | | | | | | | | | |
| | | Equity
Income
Fund | | | Focused
Value | | | Large Cap Value
Fund | | | Mid Cap Value
Fund | | | Small Cap Value
Fund | | | Small/Mid Cap
Value
Fund | |
| First $1 billion | | | 0.70 | % | | | 0.75 | % | | | 0.75 | % | | | 0.75 | % | | | 1.00 | % | | | 0.85 | % |
| Next $1 billion | | | 0.63 | | | | 0.68 | | | | 0.68 | | | | 0.75 | | | | 1.00 | | | | 0.85 | |
| Next $3 billion | | | 0.60 | | | | 0.64 | | | | 0.65 | | | | 0.68 | | | | 0.90 | | | | 0.77 | |
| Next $3 billion | | | 0.59 | | | | 0.63 | | | | 0.64 | | | | 0.65 | | | | 0.86 | | | | 0.73 | |
| Over $8 billion | | | 0.58 | | | | 0.62 | | | | 0.63 | | | | 0.64 | | | | 0.84 | | | | 0.71 | |
The Trustees noted that the breakpoints were designed to share potential economies of scale, if any, with the Funds and their shareholders as assets under management reach those asset levels. The Trustees considered the amounts of assets in the Funds; the Funds’ recent share purchase and redemption activity; the information provided by the Investment Adviser relating to the costs of the services provided by the Investment Adviser and its affiliates and their realized profits; information comparing fee rates charged by the Investment Adviser with fee rates charged to other funds in the peer groups; and the Investment Adviser’s undertakings to waive a portion of its management fee (with respect to the Equity Income, Focused Value, Small Cap Value, and Small/Mid Cap Value Funds) and to limit certain expenses of the Funds that exceed specified levels, as well as Goldman Sachs & Co. LLC’s (“Goldman Sachs”) undertaking to waive a portion of the transfer agency fees paid by the Large Cap Value Fund’s Class A, Class C, Investor (formerly Class IR Shares), Class R and Class T Shares. Upon reviewing these matters at the Annual Meeting, the Trustees concluded that the fee breakpoints represented a means of assuring that benefits of scalability, if any, would be passed along to shareholders at the specified asset levels. They also noted that the Investment Adviser had passed along savings to shareholders of the Large Cap Value, Mid Cap Value, and Small Cap Value Funds, which had asset levels above at least the first breakpoint during the prior fiscal year.
Other Benefits to the Investment Adviser and Its Affiliates
The Trustees also considered the other benefits derived by the Investment Adviser and its affiliates from their relationships with the Funds as stated above, including: (a) transfer agency fees received by Goldman Sachs; (b) brokerage and futures commissions earned by Goldman Sachs for executing securities and futures transactions on behalf of the Funds; (c) research received by the Investment Adviser from broker-dealers in exchange for executing certain transactions on behalf of the Funds; (d) trading efficiencies resulting from aggregation of orders of the Funds with those for other funds or accounts managed by the Investment Adviser; (e) the Investment Adviser’s ability to leverage the infrastructure designed to service the Funds on behalf of its other clients; (f) the Investment Adviser’s ability to cross-market other products and services to Fund shareholders; (g) Goldman Sachs’ retention of certain fees as Fund Distributor; (h) the Investment Adviser’s ability to negotiate better pricing with custodians on behalf of its other clients, as a result of the relationship with the Funds; and (i) the possibility that the working relationship between the Investment Adviser and the Funds’ third-party service providers may cause those service providers to be more likely to do business with other areas of Goldman Sachs. In the course of considering the foregoing, the Independent Trustees requested and received further information quantifying certain of these fall-out benefits.
107
GOLDMAN SACHS FUNDAMENTAL EQUITY VALUE FUNDS
Statement Regarding Basis for Approval of Management Agreement (Unaudited) (continued)
Other Benefits to the Funds and Their Shareholders
The Trustees also noted that the Funds receive certain potential benefits as a result of their relationship with the Investment Adviser, including: (a) trading efficiencies resulting from aggregation of orders of the Funds with those of other funds or accounts managed by the Investment Adviser; (b) enhanced servicing from vendors because of the volume of business generated by the Investment Adviser and its affiliates; (c) enhanced servicing from broker-dealers because of the volume of business generated by the Investment Adviser and its affiliates; (d) the Investment Adviser’s knowledge and experience gained from managing other accounts and products; (e) the Investment Adviser’s ability to hire and retain qualified personnel to provide services to the Funds because of the reputation of the Goldman Sachs organization; (f) the Funds’ access, through the Investment Adviser, to certain firmwide resources (e.g., proprietary risk management systems and databases), subject to certain restrictions; and (g) the Funds’ access to certain affiliated distribution channels. In addition, the Trustees noted the competitive nature of the mutual fund marketplace, and considered that many of the Funds’ shareholders invested in the Funds in part because of the Funds’ relationship with the Investment Adviser and that those shareholders have a general expectation that the relationship will continue.
Conclusion
In connection with their consideration of the Management Agreement, the Trustees gave weight to each of the factors described above, but did not identify any particular factor as controlling their decision. After deliberation and consideration of all of the information provided, including the factors described above, the Trustees concluded, in the exercise of their business judgment, that the management fees paid by each of the Funds were reasonable in light of the services provided to it by the Investment Adviser, the Investment Adviser’s costs and each Fund’s current and reasonably foreseeable asset levels. The Trustees unanimously concluded that the Investment Adviser’s continued management likely would benefit each Fund and its shareholders and that the Management Agreement should be approved and continued with respect to each Fund until June 30, 2018.
108
GOLDMAN SACHS FUNDAMENTAL EQUITY VALUE FUNDS
Trustees and Officers (Unaudited)
Independent Trustees
| | | | | | | | | | |
Name, Address and Age1 | | Position(s) Held with the Trust | | Term of Office and Length of Time Served2 | | Principal Occupation(s) During Past 5 Years | | Number of Portfolios in Fund Complex Overseen by Trustee3 | | Other Directorships Held by Trustee4 |
Ashok N. Bakhru Age: 75 | | Chairman of the Board of Trustees | | Since 1996 (Trustee since 1991) | | Mr. Bakhru is retired. He was formerly Chairman of the Board of Trustees, Goldman Sachs Trust II (2012-2016), Goldman Sachs MLP Income Opportunities Fund (2013-2016), Goldman Sachs MLP and Energy Renaissance Fund (2014-2016), and Goldman Sachs ETF Trust (2014-2016); Director, Apollo Investment Corporation (a business development company) (2008-2013); President, ABN Associates (a management and financial consulting firm) (1994-1996 and 1998- 2012); Trustee, Scholarship America (1998-2005); Trustee, Institute for Higher Education Policy (2003-2008); Director, Private Equity Investors — III and IV (1998-2007), and Equity-Linked Investors II (April 2002-2007). Chairman of the Board of Trustees — Goldman Sachs Trust; Goldman Sachs Variable Insurance Trust; Goldman Sachs BDC, Inc.; and Goldman Sachs Private Middle Market Credit LLC. | | 106 | | None |
Kathryn A. Cassidy Age: 63 | | Trustee | | Since 2015 | | Ms. Cassidy is retired. Formerly, she was Advisor to the Chairman (May 2014-December 2014); and Senior Vice President and Treasurer (2008-2014), General Electric Company & General Electric Capital Corporation (technology and financial services companies). Trustee — Goldman Sachs Trust and Goldman Sachs Variable Insurance Trust. | | 104 | | None |
Diana M. Daniels Age: 68 | | Trustee | | Since 2007 | | Ms. Daniels is retired. Formerly, she was Vice President, General Counsel and Secretary, The Washington Post Company (1991-2006). Ms. Daniels is a Trustee Emeritus and serves as a Presidential Councillor of Cornell University (2013-Present); former Member of the Legal Advisory Board, New York Stock Exchange (2003-2006) and of the Corporate Advisory Board, Standish Mellon Management Advisors (2006-2007). Trustee — Goldman Sachs Trust and Goldman Sachs Variable Insurance Trust. | | 104 | | None |
Herbert J. Markley Age: 67 | | Trustee | | Since 2013 | | Mr. Markley is retired. Formerly, he was Executive Vice President, Deere & Company (an agricultural and construction equipment manufacturer) (2007- 2009); and President, Agricultural Division, Deere & Company (2001-2007). Previously, Mr. Markley served as an Advisory Board Member of Goldman Sachs Trust and Goldman Sachs Variable Insurance Trust (June 2013-October 2013). Trustee — Goldman Sachs Trust and Goldman Sachs Variable Insurance Trust. | | 104 | | None |
Jessica Palmer Age: 68 | | Trustee | | Since 2007 | | Ms. Palmer is retired. She is Director, Emerson Center for the Arts and Culture (2011-Present); and was formerly a Consultant, Citigroup Human Resources Department (2007-2008); Managing Director, Citigroup Corporate and Investment Banking (previously, Salomon Smith Barney/ Salomon Brothers) (1984-2006). Ms. Palmer was a Member of the Board of Trustees of Indian Mountain School (private elementary and secondary school) (2004-2009). Trustee — Goldman Sachs Trust and Goldman Sachs Variable Insurance Trust. | | 104 | | None |
Roy W. Templin Age: 57 | | Trustee | | Since 2013 | | Mr. Templin is retired. He is Director, Armstrong World Industries, Inc. (a designer and manufacturer of ceiling, wall and suspension system solutions) (2016-Present); and was formerly Chairman of the Board of Directors, Con-Way Incorporated (a transportation, logistics and supply chain management service company) (2014-2015); Executive Vice President and Chief Financial Officer, Whirlpool Corporation (an appliance manufacturer and marketer) (2004- 2012). Previously, Mr. Templin served as an Advisory Board Member of Goldman Sachs Trust and Goldman Sachs Variable Insurance Trust (June 2013-October 2013). Trustee — Goldman Sachs Trust and Goldman Sachs Variable Insurance Trust. | | 104 | | Armstrong World Industries, Inc. (a ceiling, wall and suspension system solutions manufacturer) |
| | | | | | | | | | |
109
GOLDMAN SACHS FUNDAMENTAL EQUITY VALUE FUNDS
Trustees and Officers (Unaudited) (continued)
Independent Trustees
| | | | | | | | | | |
Name, Address and Age1 | | Position(s) Held with the Trust | | Term of Office and Length of Time Served2 | | Principal Occupation(s) During Past 5 Years | | Number of Portfolios in Fund Complex Overseen by Trustee3 | | Other Directorships Held by Trustee4 |
Gregory G. Weaver Age: 65 | | Trustee | | Since 2015 | | Mr. Weaver is retired. He is Director, Verizon Communications Inc. (2015-Present); and was formerly Chairman and Chief Executive Officer, Deloitte & Touche LLP (a professional services firm) (2001-2005 and 2012-2014); and Member of the Board of Directors, Deloitte & Touche LLP (2006-2012). Trustee — Goldman Sachs Trust and Goldman Sachs Variable Insurance Trust. | | 104 | | Verizon Communications Inc. |
| | | | | | | | | | |
110
GOLDMAN SACHS FUNDAMENTAL EQUITY VALUE FUNDS
Trustees and Officers (Unaudited) (continued) Interested Trustee*
| | | | | | | | | | |
Name, Address and Age1 | | Position(s) Held with the Trust | | Term of Office and Length of Time Served2 | | Principal Occupation(s) During Past 5 Years | | Number of Portfolios in Fund Complex Overseen by Trustee3 | | Other Directorships Held by Trustee4 |
James A. McNamara Age: 54 | | President and Trustee | | Since 2007 | | Managing Director, Goldman Sachs (December 1998-Present); Director of Institutional Fund Sales, GSAM (April 1998-December 2000); and Senior Vice President and Manager, Dreyfus Institutional Service Corporation (January 1993- April 1998). President and Trustee — Goldman Sachs Trust; Goldman Sachs Variable Insurance Trust; Goldman Sachs Trust II; Goldman Sachs MLP Income Opportunities Fund; Goldman Sachs MLP and Energy Renaissance Fund; and Goldman Sachs ETF Trust. | | 142 | | None |
| | | | | | | | | | |
| * | | Mr. McNamara is considered to be an “Interested Trustee” because he holds positions with Goldman Sachs and owns securities issued by The Goldman Sachs Group, Inc. Mr. McNamara holds comparable positions with certain other companies of which Goldman Sachs, GSAM or an affiliate thereof is the investment adviser, administrator and/or distributor. |
| 1 | | Each Trustee may be contacted by writing to the Trustee, c/o Goldman Sachs, 200 West Street, New York, New York, 10282, Attn: Caroline Kraus. Information is provided as of August 31, 2017. |
| 2 | | Subject to such policies as may be adopted by the Board from time-to-time, each Trustee holds office for an indefinite term, until the earliest of: (a) the election of his or her successor; (b) the date the Trustee resigns or is removed by the Board or shareholders, in accordance with the Trust’s Declaration of Trust; or (c) the termination of the Trust. The Board has adopted policies which provide that (a) no Trustee shall hold office for more than 15 years and (b) a Trustee shall retire as of December 31st of the calendar year in which he or she reaches his or her 74th birthday, unless a waiver of such requirement shall have been adopted by a majority of the other Trustees. These policies may be changed by the Trustees without shareholder vote. One Trustee has been granted a waiver from the foregoing policies which permits him to serve until December 31, 2017. |
| 3 | | The Goldman Sachs Fund Complex includes certain other companies listed above for each respective Trustee. As of August 31, 2017, Goldman Sachs Trust consisted of 90 portfolios (88 of which offered shares to the public); Goldman Sachs Variable Insurance Trust consisted of 14 portfolios; Goldman Sachs Trust II consisted of 17 portfolios (16 of which offered shares to the public); Goldman Sachs BDC, Inc., Goldman Sachs Private Middle Market Credit LLC, Goldman Sachs MLP Income Opportunities Fund, and Goldman Sachs MLP and Energy Renaissance Fund each consisted of one portfolio; and Goldman Sachs ETF Trust consisted of 19 portfolios (eight of which offered shares to the public). Goldman Sachs Private Middle Market Credit LLC does not offer shares to the public. |
| 4 | | This column includes only directorships of companies required to report to the Securities and Exchange Commission under the Securities Exchange Act of 1934 (i.e., “public companies”) or other investment companies registered under the Act. |
Additional information about the Trustees is available in the Funds’ Statement of Additional Information, which can be obtained from Goldman Sachs free of charge by calling this toll-free number (in the United States of America): 1-800-526-7384.
111
GOLDMAN SACHS FUNDAMENTAL EQUITY VALUE FUNDS
Trustees and Officers (Unaudited) (continued)
Officers of the Trust*
| | | | | | |
Name, Address and Age1 | | Position(s) Held with the Trust | | Term of
Office and
Length of
Time Served2 | | Principal Occupation(s) During Past 5 Years |
James A. McNamara 200 West Street New York, NY 10282 Age: 54 | | Trustee and President | | Since 2007 | | Managing Director, Goldman Sachs (December 1998-Present); Director of Institutional Fund Sales, GSAM (April 1998-December 2000); and Senior Vice President and Manager, Dreyfus Institutional Service Corporation (January 1993-April 1998). President and Trustee — Goldman Sachs Trust; Goldman Sachs Variable Insurance Trust; Goldman Sachs Trust II; Goldman Sachs MLP Income Opportunities Fund; Goldman Sachs MLP and Energy Renaissance Fund; and Goldman Sachs ETF Trust. |
Caroline L. Kraus 200 West Street New York, NY 10282 Age: 40 | | Secretary | | Since 2012 | | Managing Director, Goldman Sachs (January 2016-Present); Vice President, Goldman Sachs (August 2006-December 2015); Associate General Counsel, Goldman Sachs (2012-Present); Assistant General Counsel, Goldman Sachs (August 2006-December 2011); and Associate, Weil, Gotshal & Manges, LLP (2002-2006). Secretary — Goldman Sachs Trust (previously Assistant Secretary (2012)); Goldman Sachs Variable Insurance Trust (previously Assistant Secretary (2012)); Goldman Sachs Trust II; Goldman Sachs BDC, Inc.; Goldman Sachs Private Middle Market Credit LLC; Goldman Sachs Middle Market Lending Corp.; Goldman Sachs MLP Income Opportunities Fund; Goldman Sachs MLP and Energy Renaissance Fund; and Goldman Sachs ETF Trust. |
Scott M. McHugh 200 West Street New York, NY 10282 Age: 45 | | Treasurer, Senior Vice President and Principal Financial Officer | | Since 2009 (Principal Financial Officer since 2013) | | Managing Director, Goldman Sachs (January 2016-Present); Vice President, Goldman Sachs (February 2007-December 2015); Assistant Treasurer of certain mutual funds administered by DWS Scudder (2005-2007); and Director (2005-2007), Vice President (2000-2005), and Assistant Vice President (1998-2000), Deutsche Asset Management or its predecessor (1998-2007). Treasurer, Senior Vice President and Principal Financial Officer — Goldman Sachs Trust; Goldman Sachs Variable Insurance Trust; Goldman Sachs Trust II; Goldman Sachs MLP Income Opportunities Fund; Goldman Sachs MLP and Energy Renaissance Fund; and Goldman Sachs ETF Trust. |
Joseph F. DiMaria 30 Hudson Street Jersey City, NJ 07302 Age: 49 | | Assistant Treasurer and Principal Accounting Officer | | Since 2016 (Principal Accounting Officer since 2017) | | Managing Director, Goldman Sachs (November 2015-Present) and Vice President — Mutual Fund Administration, Columbia Management Investment Advisers, LLC (May 2010-October 2015). Assistant Treasurer and Principal Accounting Officer — Goldman Sachs Trust; Goldman Sachs Variable Insurance Trust; Goldman Sachs Trust II; Goldman Sachs MLP Income Opportunities Fund; Goldman Sachs MLP and Energy Renaissance Fund; and Goldman Sachs ETF Trust. Principal Accounting Officer — Goldman Sachs Trust; Goldman Sachs Variable Insurance Trust; Goldman Sachs Trust II; Goldman Sachs MLP Income Opportunities Fund; Goldman Sachs MLP and Energy Renaissance Fund; and Goldman Sachs ETF Trust. |
| | | | | | |
| * | | Represents a partial list of officers of the Trust. Additional information about all the officers is available in the Funds’ Statement of Additional Information, which can be obtained from Goldman Sachs free of charge by calling this toll-free number (in the United States): 1-800-526-7384. |
| 1 | | Information is provided as of August 31, 2017. |
| 2 | | Officers hold office at the pleasure of the Board of Trustees or until their successors are duly elected and qualified. Each officer holds comparable positions with certain other companies of which Goldman Sachs, GSAM or an affiliate thereof is the investment adviser, administrator and/or distributor. |
Goldman Sachs Trust — Fundamental Equity Value Funds — Tax Information (Unaudited)
For the year ended August 31, 2017, 84.75%, 100%, 90.59%, 100%, 63.42% and 100%, respectively, of the dividends paid from net investment company taxable income by the Focused Value, Equity Income, Large Cap Value, Mid Cap Value, Small Cap Value and Small/Mid Cap Value Funds, respectively, qualify for the dividends received deduction available to corporations.
Pursuant to Section 852 of the Internal Revenue Code, the Large Cap Value, Mid Cap Value, and Small Cap Value Funds designate $5,048,879, $24,435,748, and $239,740,958, respectively or if different, the maximum amount allowable, as capital gain dividends paid during the fiscal year ended August 31, 2017.
For the year ended August 31, 2017, the Focused Value, Equity Income, Large Cap Value, Mid Cap Value, Small Cap Value and Small/Mid Cap Value Funds designate 100%, 100%, 100%, 100%, 100% and 100%, respectively, of the dividends paid from net investment company taxable income as qualifying for the reduced tax rate under the Jobs and Growth Tax Relief and Reconciliation Act of 2003.
112
FUNDS PROFILE
Goldman Sachs Funds
Goldman Sachs is a premier financial services firm, known since 1869 for creating thoughtful and customized investment solutions in complex global markets.
Today, the Investment Management Division of Goldman Sachs serves a diverse set of clients worldwide, including private institutions, public entities and individuals. With approximately $1.21 trillion in assets under supervision as of June 30, 2017, Goldman Sachs Asset Management (“GSAM”) has portfolio management teams located around the world and our investment professionals bring firsthand knowledge of local markets to every investment decision. Assets under supervision includes assets under management and other client assets for which Goldman Sachs does not have full discretion. GSAM leverages the resources of Goldman Sachs & Co. LLC subject to legal, internal and regulatory restrictions.
Money Market
Financial Square FundSM
| ∎ | | Financial Square Treasury Solutions Fund1 |
| ∎ | | Financial Square Government Fund1 |
| ∎ | | Financial Square Money Market Fund2 |
| ∎ | | Financial Square Prime Obligations Fund2 |
| ∎ | | Financial Square Treasury Instruments Fund1 |
| ∎ | | Financial Square Treasury Obligations Fund1 |
| ∎ | | Financial Square Federal Instruments Fund1 |
| ∎ | | Financial Square Tax-Exempt Money Market Fund2 |
Investor FundsSM
| ∎ | | Investor Money Market Fund3 |
| ∎ | | Investor Tax-Exempt Money Market Fund3 |
Fixed Income
Short Duration and Government
| ∎ | | High Quality Floating Rate Fund |
| ∎ | | Short-Term Conservative Income Fund |
| ∎ | | Short Duration Government Fund |
| ∎ | | Short Duration Income Fund |
| ∎ | | Inflation Protected Securities Fund |
Multi-Sector
Municipal and Tax-Free
| ∎ | | High Yield Municipal Fund |
| ∎ | | Dynamic Municipal Income Fund |
| ∎ | | Short Duration Tax-Free Fund |
Single Sector
| ∎ | | Investment Grade Credit Fund |
| ∎ | | High Yield Floating Rate Fund |
| ∎ | | Emerging Markets Debt Fund |
| ∎ | | Local Emerging Markets Debt Fund |
| ∎ | | Dynamic Emerging Markets Debt Fund |
Fixed Income Alternatives
| ∎ | | Long Short Credit Strategies Fund |
Fundamental Equity
| ∎ | | Small/Mid Cap Value Fund |
| ∎ | | Small/Mid Cap Growth Fund |
| ∎ | | Concentrated Growth Fund7 |
| ∎ | | Technology Opportunities Fund |
| ∎ | | Growth Opportunities Fund |
| ∎ | | Rising Dividend Growth Fund |
Tax-Advantaged Equity
| ∎ | | U.S. Tax-Managed Equity Fund |
| ∎ | | International Tax-Managed Equity Fund |
| ∎ | | U.S. Equity Dividend and Premium Fund |
| ∎ | | International Equity Dividend and Premium Fund |
Equity Insights
| ∎ | | Small Cap Equity Insights Fund |
| ∎ | | U.S. Equity Insights Fund |
| ∎ | | Small Cap Growth Insights Fund |
| ∎ | | Large Cap Growth Insights Fund |
| ∎ | | Large Cap Value Insights Fund |
| ∎ | | Small Cap Value Insights Fund |
| ∎ | | International Small Cap Insights Fund |
| ∎ | | International Equity Insights Fund |
| ∎ | | Emerging Markets Equity Insights Fund |
Fundamental Equity International
| ∎ | | Strategic International Equity Fund |
| ∎ | | Focused International Equity Fund |
| ∎ | | Emerging Markets Equity Fund |
Select Satellite
| ∎ | | Real Estate Securities Fund |
| ∎ | | International Real Estate Securities Fund |
| ∎ | | Commodity Strategy Fund |
| ∎ | | Global Real Estate Securities Fund |
| ∎ | | Alternative Premia Fund9 |
| ∎ | | Absolute Return Tracker Fund |
| ∎ | | Managed Futures Strategy Fund |
| ∎ | | MLP Energy Infrastructure Fund |
| ∎ | | Multi-Manager Alternatives Fund |
| ∎ | | Absolute Return Multi-Asset Fund |
| ∎ | | Global Infrastructure Fund |
Total Portfolio Solutions
| ∎ | | Global Managed Beta Fund |
| ∎ | | Multi-Manager Non-Core Fixed Income Fund |
| ∎ | | Multi-Manager U.S. Dynamic Equity Fund |
| ∎ | | Multi-Manager Global Equity Fund |
| ∎ | | Multi-Manager International Equity Fund |
| ∎ | | Tactical Tilt Overlay Fund |
| ∎ | | Balanced Strategy Portfolio |
| ∎ | | Multi-Manager U.S. Small Cap Equity Fund |
| ∎ | | Multi-Manager Real Assets Strategy Fund |
| ∎ | | Growth and Income Strategy Portfolio |
| ∎ | | Growth Strategy Portfolio |
| ∎ | | Equity Growth Strategy Portfolio |
| ∎ | | Satellite Strategies Portfolio |
| ∎ | | Enhanced Dividend Global Equity Portfolio |
| ∎ | | Tax-Advantaged Global Equity Portfolio |
| ∎ | | Strategic Factor Allocation Fund |
| ∎ | | Target Date 2020 Portfolio |
| ∎ | | Target Date 2025 Portfolio |
| ∎ | | Target Date 2030 Portfolio |
| ∎ | | Target Date 2035 Portfolio |
| ∎ | | Target Date 2040 Portfolio |
| ∎ | | Target Date 2045 Portfolio |
| ∎ | | Target Date 2050 Portfolio |
| ∎ | | Target Date 2055 Portfolio |
| ∎ | | GQG Partners International Opportunities Fund |
| 1 | | You could lose money by investing in the Fund. Although the Fund seeks to preserve the value of your investment at $1.00 per share, it cannot guarantee it will do so. An investment in the Fund is not a deposit of a bank and is not insured or guaranteed by the Federal Deposit Insurance Corporation or any other government agency. The Fund’s sponsor has no legal obligation to provide financial support to the Fund, and you should not expect that the sponsor will provide financial support to the Fund at any time. |
| 2 | | You could lose money by investing in the Fund. Because the share price of the Fund will fluctuate, when you sell your shares they may be worth more or less than what you originally paid for them. The Fund may impose a fee upon sale of your shares or may temporarily suspend your ability to sell shares if the Fund’s liquidity falls below required minimums because of market conditions or other factors. An investment in the Fund is not a deposit of a bank and is not insured or guaranteed by the Federal Deposit Insurance Corporation or any other government agency. The Fund’s sponsor has no legal obligation to provide financial support to the Fund, and you should not expect that the sponsor will provide financial support to the Fund at any time. |
| 3 | | You could lose money by investing in the Fund. Although the Fund seeks to preserve the value of your investment at $1.00 per share, it cannot guarantee it will do so. The Fund may impose a fee upon sale of your shares or may temporarily suspend your ability to sell shares if the Fund’s liquidity falls below required minimums because of market conditions or other factors. An investment in the Fund is not a deposit of a bank and is not insured or guaranteed by the Federal Deposit Insurance Corporation or any other government agency. The Fund’s sponsor has no legal obligation to provide financial support to the Fund, and you should not expect that the sponsor will provide financial support to the Fund at any time. |
| 4 | | Effective on June 20, 2017, the Goldman Sachs Fixed Income Macro Strategies Fund was renamed the Goldman Sachs Strategic Macro Fund. |
| 5 | | Effective on June 20, 2017, the Goldman Sachs Growth and Income Fund was renamed the Goldman Sachs Equity Income Fund. |
| 6 | | Effective after the close of business on August 31, 2017, the Goldman Sachs Flexible Cap Growth Fund was renamed the Goldman Sachs Flexible Cap Fund. |
| 7 | | Effective on July 28, 2017, the Goldman Sachs Focused Growth Fund was reorganized with and into the Goldman Sachs Concentrated Growth Fund. |
| 8 | | Effective after the close of business on October 31, 2017, the Goldman Sachs Dynamic U.S. Equity Fund was renamed the Goldman Sachs Blue Chip Fund. |
| 9 | | Effective after the close of business on October 30, 2017, the Goldman Sachs Dynamic Allocation Fund was renamed the Goldman Sachs Alternative Premia Fund. |
Financial Square FundsSM and Investor FundsSM are registered service marks of Goldman Sachs & Co. LLC.
| * | | This list covers open-end funds only. Please visit our website at www.GSAMFUNDS.com to learn about our closed-end funds and exchange-traded funds. |
| | |
TRUSTEES Ashok N. Bakhru, Chairman Kathryn A. Cassidy Diana M. Daniels Herbert J. Markley James A. McNamara Jessica Palmer Roy W. Templin Gregory G. Weaver | | OFFICERS James A. McNamara, President Scott M. McHugh, Treasurer, Senior Vice President and Principal Financial Officer Joseph F. DiMaria, Assistant Treasurer and Principal Accounting Officer Caroline L. Kraus, Secretary |
| |
| |
| |
| |
| |
| |
| |
| |
| |
GOLDMAN SACHS & CO. LLC Distributor and Transfer Agent | | GOLDMAN SACHS ASSET MANAGEMENT, L.P. Investment Adviser |
Visit our web site at www.GSAMFUNDS.com to obtain the most recent month-end returns.
Goldman Sachs Asset Management, L.P. 200 West Street, New York, New York 10282
The reports concerning the Funds included in this shareholder report may contain certain forward-looking statements about the factors that may affect the performance of the Funds in the future. These statements are based on Fund management’s predictions and expectations concerning certain future events and their expected impact on the Funds, such as performance of the economy as a whole and of specific industry sectors, changes in the levels of interest rates, the impact of developing world events, and other factors that may influence the future performance of the Funds. Management believes these forward-looking statements to be reasonable, although they are inherently uncertain and difficult to predict. Actual events may cause adjustments in portfolio management strategies from those currently expected to be employed.
A description of the policies and procedures that the Funds use to determine how to vote proxies relating to portfolio securities and information regarding how a Fund voted proxies relating to portfolio securities during the most recent 12-month period ended June 30 is available (i) without charge, upon request by calling 1-800-526-7384 (for Retail Shareholders) or 1-800-621-2550 (for Institutional Shareholders); and (ii) on the Securities and Exchange Commission (“SEC”) web site at http://www.sec.gov.
The Funds file their complete schedule of portfolio holdings with the SEC for the first and third quarters of each fiscal year on Form N-Q. The Funds’ Forms N-Q are available on the SEC’s web site at http://www.sec.gov within 60 days after the Funds’ first and third fiscal quarters. The Funds’ Forms N-Q may be reviewed and copied at the SEC’s Public Reference Room in Washington, D.C., and information on the operation of the Public Reference Room may also be obtained by calling 1-800-SEC-0330. Forms N-Q may be obtained upon request and without charge by calling 1-800-526-7384 (for Retail Shareholders) or 1-800-621-2550 (for Institutional Shareholders).
Goldman Sachs & Co. LLC (‘‘Goldman Sachs’’) does not provide legal, tax or accounting advice. Any statement contained in this communication (including any attachments) concerning U.S. tax matters was not intended or written to be used, and cannot be used, for the purpose of avoiding penalties under the Internal Revenue Code, and was written to support the promotion or marketing of the transaction(s) or matter(s) addressed. Clients of Goldman Sachs should obtain their own independent tax advice based on their particular circumstances.
Fund holdings and allocations shown are as of August 31, 2017 and may not be representative of future investments. Fund holdings should not be relied on in making investment decisions and should not be construed as research or investment advice regarding particular securities. Current and future holdings are subject to risk.
The Global Industry Classification Standard (GICS) was developed by and is the exclusive property and a service mark of Morgan Stanley Capital International Inc. (MSCI) and Standard & Poor’s, a division of The McGraw-Hill Companies, Inc. (S&P) and is licensed for use by Goldman Sachs. Neither MSCI, S&P nor any other party involved in making or compiling the GICS or any GICS classifications makes any express or implied warranties or representations with respect to such standard or classification (or the results to be obtained by the use thereof), and all such parties hereby expressly disclaim all warranties of originality, accuracy, completeness, merchantability or fitness for a particular purpose with respect to any of such standard or classification. Without limiting any of the foregoing, in no event shall MSCI, S&P, any of their affiliates or any third party involved in making or compiling the GICS or any GICS classifications have any liability for any direct, indirect, special, punitive, consequential or any other damages (including lost profits) even if notified of the possibility of such damages.
The portfolio risk management process includes an effort to monitor and manage risk, but does not imply low risk.
THIS MATERIAL IS FOR INFORMATIONAL PURPOSES ONLY AND IS PROVIDED SOLELY ON THE BASIS THAT IT WILL NOT CONSTITUTE INVESTMENT OR OTHER ADVICE OR A RECOMMENDATION RELATING TO ANY PERSON’S OR PLAN’S INVESTMENT OR OTHER DECISIONS, AND GOLDMAN SACHS IS NOT A FIDUCIARY OR ADVISOR WITH RESPECT TO ANY PERSON OR PLAN BY REASON OF PROVIDING THE MATERIAL OR CONTENT HEREIN INCLUDING UNDER THE EMPLOYEE RETIREMENT INCOME SECURITY ACT OF 1974 OR DEPARTMENT OF LABOR REGULATIONS. PLAN SPONSORS AND OTHER FIDUCIARIES SHOULD CONSIDER THEIR OWN CIRCUMSTANCES IN ASSESSING ANY POTENTIAL COURSE OF ACTION.
This material is not authorized for distribution to prospective investors unless preceded or accompanied by a current Prospectus or summary prospectus, if applicable. Investors should consider a Fund’s objective, risks, and charges and expenses, and read the summary prospectus, if available, and/or the Prospectus carefully before investing or sending money. The summary prospectus, if available, and the Prospectus contain this and other information about a Fund and may be obtained from your Authorized Institution or from Goldman Sachs & Co. LLC by calling (retail – 1-800-526-7384) (institutional – 1-800-621-2550).
© 2017 Goldman Sachs. All rights reserved. 107098-TMPL-10/2017-632033 EQVALAR-17/156K
Goldman Sachs Funds

| | | | |
| | |
| Annual Report | | | | August 31, 2017 |
| | |
| | | | Global Managed Beta Fund |

Goldman Sachs Global Managed Beta Fund
| | | | |
| | | |
| NOT FDIC-INSURED | | May Lose Value | | No Bank Guarantee |
PORTFOLIO RESULTS
Goldman Sachs Global Managed Beta Fund
Investment Objective
The Fund seeks to provide long-term capital growth.
Portfolio Management Discussion and Analysis
The Board of Trustees of Goldman Sachs Trust approved a change to the fiscal year end of the Goldman Sachs Global Managed Beta Fund (the “Fund”). Effective August 25, 2017, the Fund’s fiscal year end changed from October 31 to August 31. Below, the Goldman Sachs Global Portfolio Solutions Team discusses the Fund’s performance and positioning for the period from November 1, 2016 through August 31, 2017 (the “Reporting Period”).
| Q | | How did the Fund perform during the Reporting Period? |
| A | | During the Reporting Period, the Fund’s Institutional Shares generated a cumulative total return, without sales charges, of 17.43%. This return compares to the 17.94% cumulative total return of the Fund’s benchmark, the MSCI All Country World Index Investable Market Index (Net, USD, 50% Non-US Developed Hedged to USD) (the “Index”), during the same time period. |
| Q | | What economic and market factors most influenced the Fund during the Reporting Period? |
| A | | Investor sentiment was dominated during the Reporting Period by global central bank monetary policy, geopolitical events and uncertainty about the ability of the new U.S. Administration to enact policy. |
| | During the first part of the Reporting Period, investors were focused largely on the November 2016 U.S. presidential elections and the unexpected outcome. Markets reacted positively following the results, as the potential for significant infrastructure spending, lower taxes and lighter regulation increased expectations for economic growth and inflation. Reflecting market optimism about a continued upward trend in U.S. economic growth, the CBOE Volatility Index® (“VIX®”) approached its post-financial crisis low after the elections. U.S. banks and small-cap equities were among the chief beneficiaries of the “risk on” sentiment, or increased risk appetite, that emerged following the elections. In contrast, emerging markets assets (specifically, equities and currencies) struggled due to concerns about new U.S. policies that could have protectionist implications. At the end of November 2016, the Organization of the Petroleum Exporting Countries (“OPEC”) announced the most comprehensive supply cut in a decade. |
| | The “risk on” rally, which continued into the first part of 2017, was further supported by a stream of better than consensus expected U.S. economic data, reflected in non-farm payroll numbers, purchasing managers’ indices, and consumer- and producer-sentiment gauges — which together reinforced opinions about a more positive macroeconomic picture. In addition, the U.S. inflation rate rose higher than the Federal Reserve’s (“Fed”) stated 2.0% target. These factors, along with positive survey data, led Fed policymakers, who had previously raised short-term interest rates in December 2016, to guide market expectations toward another rate hike in March 2017. As a result, the March interest rate increase caused minimal market disruption. Fed officials also said that several interest rate hikes could occur during 2017, and the minutes from the Fed’s March policy meeting indicated that balance sheet normalization might begin by the end of the calendar year. (Balance sheet normalization refers to the steps the Fed will take to reverse quantitative easing and remove the substantial monetary accommodation it has provided to the economy since the financial crisis began in 2007.) However, economic data at the end of the first quarter of 2017 failed to keep up with lofty survey data. Additionally, the U.S. Administration was unsuccessful in its first attempt to pass a health care bill, raising concern about its ability to enact legislation related to taxes and infrastructure. In this environment, global stocks gave up some of their gains, with cyclical stocks generally underperforming defensive stocks. Yields fell, driving a rally in the U.S. Treasury market, and the U.S. dollar weakened. Sharp rallies followed in emerging markets assets, particularly emerging markets currencies. In Europe, |
1
PORTFOLIO RESULTS
| | optimism about the European Central Bank’s (“ECB”) tapering of its asset purchases, as well as positive purchasing managers’ data, was well received by investors, who nevertheless remained cautious given political uncertainties surrounding the then-upcoming presidential election in France. |
| | Investor sentiment in Europe remained pro-risk during the second calendar quarter, driven by the outcome of the French election, broadly improving global economic growth and robust corporate earnings reports. In France, the victory of the centrist candidate was viewed as positive by many market participants, leading to strong rallies in European equities and the euro. In the U.S., Fed policymakers noted that the fundamentals underpinning consumption growth remained solid despite data showing lackluster first quarter 2017 economic growth. At the Fed’s June 2017 policy meeting, it raised interest rates for the second time during the calendar year. Meanwhile, political risks centering on the U.S. Administration and the speed, or lack thereof, of its pro-growth agenda led to increased U.S. equity market volatility. Commodities, specifically crude oil, struggled due to oversupply concerns even though OPEC announced extended output cuts. Continued weakness in the U.S. dollar, easier financial conditions and a more stable macro environment pushed emerging markets assets higher, led by Chinese equities. |
| Q | | What key factors were responsible for the Fund’s performance during the Reporting Period? |
| A | | The Fund primarily seeks to achieve its investment objective by investing in a diversified portfolio of underlying asset classes that provide broad beta exposure to the global equity markets. (Beta refers to the component of returns that is attributable to market risk exposure, rather than manager skill.) While posting robust double-digit absolute gains, the Fund slightly underperformed the Index during the Reporting Period, largely because of its strategic allocation to the macro hedging strategy, which detracted as the market started pricing in Fed rate hike expectations. These losses were offset somewhat by our preference for emerging markets equities over developed markets equities during the Reporting Period, which contributed positively. |
| Q | | How was the Fund positioned at the beginning of the Reporting Period? |
| A | | In terms of its strategic allocation at the beginning of the Reporting Period, the Fund had 98.00% of its total net assets invested in equity-related investments, 1.44% in the macro hedging strategy and 0.56% in cash and cash equivalents. The Fund also maintained a position in cash and cash equivalents to cover the exposure of various derivatives positions. This above sector breakout is inclusive of derivative exposure across all asset classes. |
| Q | | How did you tactically manage the Fund’s allocations during the Reporting Period? |
| A | | During the Reporting Period, we gradually adjusted the Fund’s strategic allocation to align it with our long-term view of asset classes. This adjustment increased the Fund’s allocations to U.S. and emerging markets equities and decreased its allocations to non-U.S. developed markets equities and associated currency hedging positions. In addition, we increased the Fund’s allocation to the macro hedging strategy to put it in line with our long-term target, as we believed it could potentially hedge the Fund’s downside risk. We also initiated a steepening position on the front, or short term, end of the U.S. interest rate yield curve, as we sought to mitigate the potential risk to the Fund and the macro hedging strategy of faster than expected Fed interest rate hikes. (In a steepening yield curve, the differential in yields between longer-term and shorter-term maturities widens. Yield curve is a spectrum of maturities.) |
| | Additionally, at the beginning of 2017, we increased the Fund’s allocation to our factor-based diversification approach through which we seek to gain exposure to underlying asset classes rather than obtaining such exposure through capitalization-weighted indices. The factor-based diversification approach, which is expected to be a long-term strategic allocation, seeks to capture common sources of active equity returns, including, but not limited to, the Momentum, Valuation, Volatility and Quality factors. The Momentum factor seeks to identify companies whose stock prices are expected to increase or decrease (by, among other things, evaluating each company’s recent performance results). The Valuation factor seeks to identify companies whose stock prices are trading at a discount to their fundamental or intrinsic value (by, among other things, comparing each company’s book value to market value). The Volatility factor seeks to identify companies whose stock prices are expected to have a relatively lower degree of fluctuation over time. The Quality factor seeks to identify companies that are expected to generate higher returns on assets (i.e., more profitable). The factor-based diversification |
2
PORTFOLIO RESULTS
| | approach is implemented through a separately managed account, established in January 2017, composed of individual stock positions. |
| Q | | How did the Fund use derivatives and similar instruments during the Reporting Period? |
| A | | During the Reporting Period, equity futures were employed to express our passive investment views with greater versatility. The use of these instruments to gain exposure to the Canadian equity market and the U.S. small-cap equity market during the Reporting Period added to the Fund’s performance, as these positions generated returns similar to the asset classes they represented. In addition, the Fund employed currency forwards and interest rate options to afford greater risk management of macroeconomic and foreign exchange risks in the portfolio. The use of currency forwards had a negative impact on Fund results. The Fund’s interest rate options detracted from performance during the Reporting Period. |
| Q | | How was the Fund positioned at the end of the Reporting Period? |
| A | | In terms of its strategic allocation at the end of the Reporting Period, the Fund had 97.96% of its total net assets invested in equity-related investments, 1.79% in the macro hedging strategy and 0.25% in cash and cash equivalents. The Fund also maintained a position in cash and cash equivalents to cover the exposure of various derivatives positions. This above sector breakout is inclusive of derivative exposure across all asset classes. |
| Q | | What is the Fund’s tactical asset allocation view and strategy for the months ahead? |
| A | | At the end of the Reporting Period, we were focused on three macro themes. First, we expected a widening economic expansion in 2017, should growth in emerging markets countries continue to improve from previous weakness and should growth in the U.S. and Europe continue at a more moderate pace. Second, we believed improvements in economic growth, together with increasing U.S. inflationary pressures, may reduce investor conviction in the secular stagnation thesis, with higher bond yields a likely consequence. (Secular stagnation is a condition of negligible or no economic growth in a market-based economy.) Third, we thought investor uncertainty remained elevated because of macro risks. These risks have the potential to cause temporary pullbacks, in our opinion, which could result in range-bound returns across all asset classes and therefore require a dynamic approach to asset allocation. |
| | At the asset class level, we considered equities relatively cheap at the end of the Reporting Period given macro conditions and low bond yields. However, we expect the valuation gap between stocks and bonds, which has already narrowed significantly, to close further as bond yields rise. That said, we believe broadening economic growth and a recovery in corporate earnings should support some upside in equities, and we expect positive but moderate returns over the medium term. At the start of 2017, we thought the market was too dovish in its expectations about Fed interest rate hikes. (Dovish implies lower interest rates; opposite of hawkish.) We also thought longer-term U.S. Treasury yields did not sufficiently reflect investor uncertainty about the Fed’s tolerance for inflation and a possible decrease in the ECB’s bond purchases. Our view was strengthened by the drop in U.S. Treasury yields late in the Reporting Period, which occurred despite strong economic growth and the hawkish drift of the Fed. We consider a rapid rise in yields to be a significant risk in the near term, and therefore, we remained more constructive on equities than on bonds at the end of the Reporting Period. |
| | At the regional level, we had a positive outlook on emerging markets equities versus developed markets equities, which was reflected in the Fund’s strategic allocations at the end of the Reporting Period. We believe sufficient progress has been made in recent years on various fronts, including valuations, macro imbalances, dissipation of growth challenges and perceptions by investors of improvements in the emerging markets. We remained concerned about possible downside risks from higher interest rates, but we think any impact is likely to be temporary. Additionally, we believed there was sufficient government policy support to limit potential downside risks from China. |
| | As for the Fund’s macro hedging strategy, we view it as a long term structural allocation and a capital-efficient means of diversifying the Fund’s exposure to global equities. In positioning the Fund in anticipation of Fed interest rate increases, we plan to continue monitoring the potential impact of events related to key political and monetary policy decisions in the near term. |
3
GOLDMAN SACHS GLOBAL MANAGED BETA FUND
Index Definitions
The CBOE Volatility Index® (VIX®) is a key measure of market expectations of near-term volatility conveyed by S&P 500® stock index option prices. Since its introduction in 1993, VIX has been considered by many to be the world’s premier barometer of investor sentiment and market volatility.
4
FUND BASICS
Global Managed Beta Fund
as of August 31, 2017
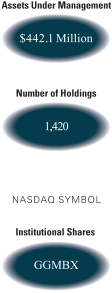
| | | | | | | | | | |
| | PERFORMANCE REVIEW | | | | | | | | |
| | | November 1, 2016–August 31, 2017 | | Fund Total Return
(based on NAV)1 | | | MSCI All Country World
Index Investable Market Index2 | |
| | | Institutional Shares | | | 17.43 | % | | | 17.94 | % |
| | 1 | | The net asset value (“NAV”) represents the net assets of the class of the Fund (ex-dividend) divided by the total number of shares of the class outstanding. The Fund’s performance assumes the reinvestment of dividends and other distributions. The Fund’s performance does not reflect the deduction of any applicable sales charges. |
| | 2 | | The MSCI ACWI IMI captures large, mid and small cap representation across 23 developed markets and 24 emerging markets. With 8,603 constituent, the MSCI ACWI IMI is comprehensive, covering approximately 99% of the global equity investment opportunity set. As of August 31, 2017, the 23 developed markets in the MSCI ACWI IMI include Australia, Austria, Belgium, Canada, Denmark, Finland, France, Germany, Hong Kong, Ireland, Israel, Italy, Japan, Netherlands, New Zealand, Norway, Portugal, Singapore, Spain, Sweden, Switzerland, the U.K. and the U.S. The 24 emerging markets include Brazil, Chile, China, Colombia, Czech Republic, Egypt, Greece, Hungary, India, Indonesia, South Korea, Malaysia, Mexico, Pakistan, Peru, Philippines, Poland, Russia, Qatar, South Africa, Taiwan, Thailand, Turkey and United Arab Emirates. |
| | | | | | | | | | | | | | |
| | STANDARDIZED TOTAL RETURNS3 | |
| | | For the period ended 6/30/17 | | One Year | | | Since Inception | | | Inception Date | |
| | | Institutional Shares | | | 18.20 | % | | | 6.17 | % | | | 4/30/2015 | |
| | 3 | | The Standardized Total Returns are average annual total returns or cumulative total returns (only if the performance period is one year or less) as of the most recent calendar quarter-end. They assume reinvestment of all distributions at NAV. Because Institutional Shares do not involve a sales charge, such a charge is not applied to their Standardized Total Returns. |
The returns set forth in the tables above represent past performance. Past performance does not guarantee future results. The Fund’s investment return and principal value will fluctuate so that an investor’s shares, when redeemed, may be worth more or less than their original cost. Current performance may be lower or higher than the performance quoted above. Please visit our web site at www.GSAMFUNDS.com to obtain the most recent month-end returns. Performance reflects applicable fee waivers and/or expense limitations in effect during the periods shown. In their absence, performance would be reduced. Returns do not reflect the deduction of taxes that a shareholder would pay on Fund distributions or the redemption of Fund shares.
| | | | | | | | | | |
| | EXPENSE RATIOS4 | | | | | | | | |
| | | | | Net Expense Ratio (Current) | | | Gross Expense Ratio (Before Waivers) | |
| | | Institutional Shares | | | 0.30 | % | | | 0.61 | % |
| | 4 | | The expense ratios of the Fund, both current (net of applicable fee waivers and/or expense limitations) and before waivers (gross of applicable fee waivers and/or expense limitations) are as set forth above according to the most recent publicly available Prospectus for the Fund and may differ from the expense ratios disclosed in the Financial Highlights in this report. Pursuant to a contractual arrangement, the Fund’s waivers and/or expense limitations will remain in place through at least February 28, 2018, and prior to such date the investment adviser may not terminate the arrangements without the approval of the Fund’s Board of Trustees. If these arrangements are discontinued in the future, the expense ratios may change without shareholder approval. |
5
FUND BASICS
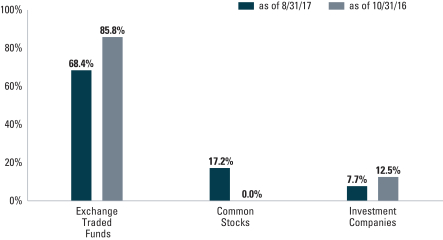
| | 5 | | Underlying sector allocations of exchange traded funds and investment companies held by the Fund are not reflected in the graph above. The percentage shown for each investment category reflects the value of investments in that category as a percentage of net assets. Figures in the graph may not sum to 100% due to the exclusion of other assets and liabilities. The graph does not depict the investment in the securities lending reinvestment vehicle. The Investment in the securities lending reinvestment vehicle represented 0.2% of the Fund’s net assets as of August 31, 2017 and October 31, 2016. The graph depicts the Fund’s investments but may not represent the Fund’s market exposure due to the exclusion of certain derivatives, if any, as listed in the Additional Investment Information section of the Schedule of Investments. |
6
GOLDMAN SACHS GLOBAL MANAGED BETA FUND
Performance Summary
August 31, 2017
The following graph shows the value, as of August 31, 2017, of a $1,000,000 investment made on April 30, 2015 (commencement of operations) in Institutional Shares at NAV. For comparative purposes, the performance of the Fund’s benchmark, the MSCI All Country World Index Investable Market Index (Net, USD, 50% Non-US Developed Hedged to USD), is shown. This performance data represents past performance and should not be considered indicative of future performance, which will fluctuate with changes in market conditions. These performance fluctuations may cause an investor’s shares, when redeemed, to be worth more or less than their original cost. Performance reflects applicable fee waivers and/or expense limitations in effect during the periods shown and in their absence, performance would be reduced. Returns do not reflect the deduction of taxes that a shareholder would pay on Fund distributions or the redemption of Fund shares. In addition to the Investment Adviser’s decisions regarding issuer/industry investment selection and allocation, other factors may affect Fund performance. These factors include, but are not limited to, Fund operating fees and expenses, portfolio turnover and subscription and redemption cash flows affecting the Fund.
|
| Global Managed Beta Fund’s Lifetime Performance |
Performance of a $1,000,000 Investment, with distributions reinvested, from April 30, 2015 through August 31, 2017.
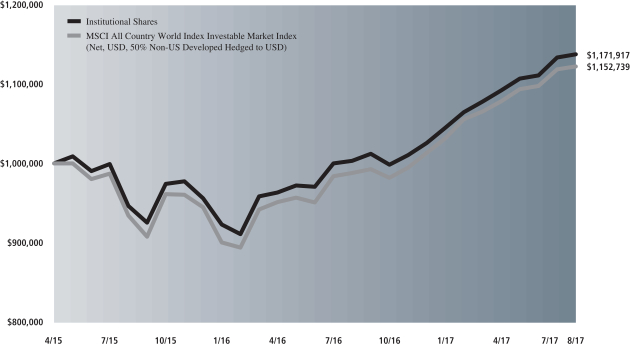
| | | | |
| Average Annual Total Return through August 31, 2017 | | One Year | | Since Inception |
Institutional Shares (Commenced April 30, 2015) | | 16.72% | | 7.01% |
|
7
GOLDMAN SACHS GLOBAL MANAGED BETA FUND
Schedule of Investments
August 31, 2017
| | | | | | | | |
Shares | | | Description | | Value | |
| Common Stocks – 17.2% | |
| Aerospace & Defense – 0.3% | | | |
| | 376 | | | Airbus SE | | $ | 31,666 | |
| | 635 | | | Arconic, Inc. | | | 16,174 | |
| | 2,345 | | | BAE Systems PLC | | | 18,428 | |
| | 1,247 | | | CAE, Inc. | | | 20,581 | |
| | 8 | | | Dassault Aviation SA | | | 12,233 | |
| | 87 | | | Elbit Systems Ltd. | | | 11,980 | |
| | 395 | | | General Dynamics Corp. | | | 79,533 | |
| | 383 | | | Huntington Ingalls Industries, Inc. | | | 81,947 | |
| | 587 | | | L3 Technologies, Inc. | | | 106,529 | |
| | 4,567 | | | Leonardo SpA | | | 77,383 | |
| | 312 | | | Lockheed Martin Corp. | | | 95,282 | |
| | 1,769 | | | Meggitt PLC | | | 11,849 | |
| | 244 | | | Northrop Grumman Corp. | | | 66,419 | |
| | 416 | | | Raytheon Co. | | | 75,716 | |
| | 224 | | | Rockwell Collins, Inc. | | | 29,355 | |
| | 2,578 | | | Rolls-Royce Holdings PLC* | | | 30,448 | |
| | 309 | | | Safran SA | | | 30,004 | |
| | 5,110 | | | Singapore Technologies Engineering Ltd. | | | 13,783 | |
| | 1,825 | | | Textron, Inc. | | | 89,589 | |
| | 366 | | | Thales SA | | | 40,519 | |
| | 1,016 | | | The Boeing Co. | | | 243,495 | |
| | 688 | | | United Technologies Corp. | | | 82,367 | |
| | | | | | | | |
| | | | | | | 1,265,280 | |
| | |
| Air Freight & Logistics – 0.1% | | | |
| | 1,344 | | | C.H. Robinson Worldwide, Inc. | | | 94,927 | |
| | 4,713 | | | Deutsche Post AG | | | 195,709 | |
| | 545 | | | Expeditors International of Washington, Inc. | | | 30,574 | |
| | 235 | | | FedEx Corp. | | | 50,379 | |
| | 19,495 | | | Royal Mail PLC | | | 99,306 | |
| | 472 | | | United Parcel Service, Inc. Class B | | | 53,978 | |
| | 817 | | | Yamato Holdings Co. Ltd. | | | 17,421 | |
| | | | | | | | |
| | | | | | | 542,294 | |
| | |
| Airlines – 0.1% | | | |
| | 3,370 | | | ANA Holdings, Inc. | | | 12,512 | |
| | 1,497 | | | Delta Air Lines, Inc. | | | 70,643 | |
| | 2,443 | | | Deutsche Lufthansa AG | | | 61,356 | |
| | 9,030 | | | International Consolidated Airlines Group SA | | | 71,591 | |
| | 329 | | | Japan Airlines Co. Ltd. | | | 11,328 | |
| | 9,269 | | | Qantas Airways Ltd. | | | 42,190 | |
| | 1,358 | | | Singapore Airlines Ltd. | | | 10,337 | |
| | 1,429 | | | Southwest Airlines Co. | | | 74,508 | |
| | 1,080 | | | United Continental Holdings, Inc.* | | | 66,917 | |
| | | | | | | | |
| | | | | | | 421,382 | |
| | |
| Auto Components – 0.1% | | | |
| | 301 | | | Aisin Seiki Co. Ltd. | | | 15,124 | |
| | 808 | | | BorgWarner, Inc. | | | 37,499 | |
| | 853 | | | Bridgestone Corp. | | | 36,594 | |
| | 287 | | | Cie Generale des Etablissements Michelin | | | 39,149 | |
| | 61 | | | Continental AG | | | 13,773 | |
| | 216 | | | Denso Corp. | | | 10,473 | |
| | 3,992 | | | GKN PLC | | | 16,452 | |
| | |
| Common Stocks – (continued) | |
| Auto Components – (continued) | | | |
| | 319 | | | Koito Manufacturing Co. Ltd. | | | 19,884 | |
| | 473 | | | Lear Corp. | | | 70,732 | |
| | 782 | | | Linamar Corp. | | | 43,604 | |
| | 611 | | | Magna International, Inc. | | | 29,401 | |
| | 449 | | | Stanley Electric Co. Ltd. | | | 14,911 | |
| | 546 | | | Sumitomo Electric Industries Ltd. | | | 8,543 | |
| | 2,000 | | | Sumitomo Rubber Industries Ltd. | | | 33,170 | |
| | 1,565 | | | The Goodyear Tire & Rubber Co. | | | 47,420 | |
| | 1,643 | | | The Yokohama Rubber Co. Ltd. | | | 30,376 | |
| | 462 | | | Toyoda Gosei Co. Ltd. | | | 10,765 | |
| | 293 | | | Valeo SA | | | 19,613 | |
| | | | | | | | |
| | | | | | | 497,483 | |
| | |
| Automobiles – 0.2% | | | |
| | 129 | | | Bayerische Motoren Werke AG | | | 11,996 | |
| | 334 | | | Daimler AG | | | 24,373 | |
| | 605 | | | Ferrari NV | | | 69,298 | |
| | 5,610 | | | Fiat Chrysler Automobiles NV* | | | 84,755 | |
| | 8,855 | | | Ford Motor Co. | | | 97,671 | |
| | 330 | | | General Motors Co. | | | 12,058 | |
| | 573 | | | Harley-Davidson, Inc. | | | 26,937 | |
| | 2,011 | | | Honda Motor Co. Ltd. | | | 56,328 | |
| | 1,215 | | | Isuzu Motors Ltd. | | | 15,854 | |
| | 2,667 | | | Mazda Motor Corp. | | | 39,174 | |
| | 1,754 | | | Nissan Motor Co. Ltd. | | | 17,462 | |
| | 3,283 | | | Peugeot SA | | | 69,416 | |
| | 469 | | | Subaru Corp. | | | 16,392 | |
| | 493 | | | Suzuki Motor Corp. | | | 24,755 | |
| | 138 | | | Tesla, Inc.*(a) | | | 49,114 | |
| | 1,536 | | | Toyota Motor Corp. | | | 86,483 | |
| | 48 | | | Volkswagen AG | | | 7,421 | |
| | 1,672 | | | Yamaha Motor Co. Ltd. | | | 47,216 | |
| | | | | | | | |
| | | | | | | 756,703 | |
| | |
| Banks – 1.2% | | | |
| | 607 | | | ABN AMRO Group NV(b) | | | 17,006 | |
| | 2,841 | | | Aozora Bank Ltd. | | | 10,748 | |
| | 4,086 | | | Australia & New Zealand Banking Group Ltd. | | | 95,649 | |
| | 7,251 | | | Banco Bilbao Vizcaya Argentaria SA | | | 64,163 | |
| | 22,155 | | | Banco de Sabadell SA | | | 48,787 | |
| | 18,354 | | | Banco Santander SA | | | 119,622 | |
| | 6,651 | | | Bank Hapoalim BM | | | 44,769 | |
| | 8,744 | | | Bank Leumi Le-Israel BM | | | 45,828 | |
| | 13,703 | | | Bank of America Corp. | | | 327,365 | |
| | 3,245 | | | Bank of Ireland Group PLC* | | | 27,041 | |
| | 1,091 | | | Bank of Montreal | | | 78,290 | |
| | 2,440 | | | Bank of Queensland Ltd. | | | 24,465 | |
| | 3,478 | | | Bankia SA | | | 16,948 | |
| | 2,134 | | | Bankinter SA | | | 20,376 | |
| | 10,677 | | | Barclays PLC | | | 26,405 | |
| | 1,338 | | | BB&T Corp. | | | 61,668 | |
| | 5,582 | | | Bendigo & Adelaide Bank Ltd. | | | 53,075 | |
| | 2,026 | | | BNP Paribas SA | | | 154,033 | |
| | 12,024 | | | BOC Hong Kong Holdings Ltd. | | | 61,431 | |
| | 3,942 | | | CaixaBank SA | | | 20,396 | |
| | |
| | |
| 8 | | The accompanying notes are an integral part of these financial statements. |
GOLDMAN SACHS GLOBAL MANAGED BETA FUND
| | | | | | | | |
Shares | | | Description | | Value | |
| Common Stocks – (continued) | |
| Banks – (continued) | | | |
| | 840 | | | Canadian Imperial Bank of Commerce | | $ | 70,570 | |
| | 828 | | | CIT Group, Inc. | | | 37,136 | |
| | 4,540 | | | Citigroup, Inc. | | | 308,856 | |
| | 1,037 | | | Citizens Financial Group, Inc. | | | 34,356 | |
| | 432 | | | Comerica, Inc. | | | 29,484 | |
| | 1,620 | | | Commerzbank AG* | | | 20,156 | |
| | 1,689 | | | Commonwealth Bank of Australia | | | 102,040 | |
| | 4,108 | | | Credit Agricole SA | | | 72,505 | |
| | 1,038 | | | Danske Bank A/S | | | 40,379 | |
| | 6,479 | | | DBS Group Holdings Ltd. | | | 98,712 | |
| | 1,536 | | | DNB ASA | | | 30,002 | |
| | 326 | | | East West Bancorp, Inc. | | | 18,051 | |
| | 912 | | | Erste Groupe Bank AG* | | | 38,571 | |
| | 2,314 | | | Fifth Third Bancorp | | | 60,465 | |
| | 404 | | | First Republic Bank | | | 39,208 | |
| | 2,022 | | | Hang Seng Bank Ltd. | | | 46,630 | |
| | 19,455 | | | HSBC Holdings PLC | | | 188,611 | |
| | 2,053 | | | Huntington Bancshares, Inc. | | | 25,847 | |
| | 6,376 | | | ING Groep NV | | | 113,179 | |
| | 12,957 | | | Intesa Sanpaolo SpA | | | 43,866 | |
| | 4,193 | | | Intesa Sanpaolo SpA RSP | | | 13,270 | |
| | 602 | | | Japan Post Bank Co. Ltd. | | | 7,662 | |
| | 5,160 | | | JPMorgan Chase & Co. | | | 468,992 | |
| | 456 | | | KBC Group NV | | | 37,484 | |
| | 2,258 | | | KeyCorp | | | 38,860 | |
| | 33,607 | | | Lloyds Banking Group PLC | | | 27,702 | |
| | 233 | | | M&T Bank Corp. | | | 34,451 | |
| | 3,275 | | | Mebuki Financial Group, Inc. | | | 11,614 | |
| | 1,077 | | | Mediobanca SpA | | | 11,079 | |
| | 14,739 | | | Mitsubishi UFJ Financial Group, Inc. | | | 89,813 | |
| | 1,771 | | | Mizrahi Tefahot Bank Ltd. | | | 31,563 | |
| | 38,629 | | | Mizuho Financial Group, Inc. | | | 66,286 | |
| | 2,650 | | | National Australia Bank Ltd. | | | 63,712 | |
| | 905 | | | National Bank of Canada | | | 41,657 | |
| | 3,004 | | | Nordea Bank AB | | | 40,445 | |
| | 9,699 | | | Oversea-Chinese Banking Corp. Ltd. | | | 80,006 | |
| | 1,039 | | | People’s United Financial, Inc. | | | 17,351 | |
| | 1,012 | | | Raiffeisen Bank International AG* | | | 33,228 | |
| | 3,128 | | | Regions Financial Corp. | | | 44,136 | |
| | 5,755 | | | Resona Holdings, Inc. | | | 28,643 | |
| | 1,942 | | | Royal Bank of Canada | | | 144,132 | |
| | 9,145 | | | Shinsei Bank Ltd. | | | 14,624 | |
| | 59 | | | Signature Bank* | | | 7,572 | |
| | 1,440 | | | Skandinaviska Enskilda Banken AB | | | 18,748 | |
| | 1,853 | | | Societe Generale SA | | | 103,660 | |
| | 2,445 | | | Standard Chartered PLC* | | | 24,353 | |
| | 1,297 | | | Sumitomo Mitsui Financial Group, Inc. | | | 48,292 | |
| | 481 | | | Sumitomo Mitsui Trust Holdings, Inc. | | | 16,599 | |
| | 1,033 | | | SunTrust Banks, Inc. | | | 56,918 | |
| | 67 | | | SVB Financial Group* | | | 11,346 | |
| | 693 | | | Svenska Handelsbanken AB Class A | | | 10,374 | |
| | 1,053 | | | Swedbank AB Class A | | | 28,483 | |
| | 1,438 | | | The Bank of Nova Scotia | | | 89,464 | |
| | 659 | | | The PNC Financial Services Group, Inc. | | | 82,645 | |
| | 2,429 | | | The Toronto-Dominion Bank | | | 130,441 | |
| | 1,867 | | | U.S. Bancorp | | | 95,684 | |
| | |
| Common Stocks – (continued) | |
| Banks – (continued) | | | |
| | 5,510 | | | United Overseas Bank Ltd. | | | 97,706 | |
| | 6,486 | | | Wells Fargo & Co. | | | 331,240 | |
| | 3,453 | | | Westpac Banking Corp. | | | 85,937 | |
| | 342 | | | Zions Bancorporation | | | 14,932 | |
| | | | | | | | |
| | | | | | | 5,337,793 | |
| | |
| Beverages – 0.3% | | | |
| | 247 | | | Anheuser-Busch InBev SA | | | 29,252 | |
| | 817 | | | Asahi Group Holdings Ltd. | | | 35,552 | |
| | 1,201 | | | Brown-Forman Corp. Class B | | | 63,701 | |
| | 1,047 | | | Carlsberg A/S Class B | | | 120,338 | |
| | 3,179 | | | Coca-Cola Amatil Ltd. | | | 20,374 | |
| | 1,381 | | | Coca-Cola Bottlers Japan, Inc. | | | 47,306 | |
| | 540 | | | Coca-Cola European Partners PLC | | | 23,123 | |
| | 711 | | | Coca-Cola HBC AG* | | | 24,313 | |
| | 129 | | | Constellation Brands, Inc. Class A | | | 25,813 | |
| | 2,837 | | | Diageo PLC | | | 94,892 | |
| | 498 | | | Dr. Pepper Snapple Group, Inc. | | | 45,343 | |
| | 999 | | | Heineken Holding NV | | | 98,686 | |
| | 195 | | | Heineken NV | | | 20,465 | |
| | 2,992 | | | Kirin Holdings Co. Ltd. | | | 67,887 | |
| | 642 | | | Molson Coors Brewing Co. Class B | | | 57,620 | |
| | 1,041 | | | Monster Beverage Corp.* | | | 58,109 | |
| | 2,156 | | | PepsiCo, Inc. | | | 249,514 | |
| | 178 | | | Pernod Ricard SA | | | 24,338 | |
| | 192 | | | Remy Cointreau SA | | | 21,943 | |
| | 1,323 | | | Suntory Beverage & Food Ltd. | | | 61,153 | |
| | 3,171 | | | The Coca-Cola Co. | | | 144,439 | |
| | 1,372 | | | Treasury Wine Estates Ltd. | | | 15,801 | |
| | | | | | | | |
| | | | | | | 1,349,962 | |
| | |
| Biotechnology – 0.3% | | | |
| | 1,117 | | | AbbVie, Inc. | | | 84,110 | |
| | 582 | | | Amgen, Inc. | | | 103,462 | |
| | 417 | | | Biogen, Inc.* | | | 132,005 | |
| | 569 | | | Celgene Corp.* | | | 79,051 | |
| | 613 | | | CSL Ltd. | | | 62,738 | |
| | 3,403 | | | Gilead Sciences, Inc. | | | 284,865 | |
| | 409 | | | Grifols SA | | | 11,579 | |
| | 168 | | | Incyte Corp.* | | | 23,085 | |
| | 854 | | | Seattle Genetics, Inc.* | | | 44,861 | |
| | 1,825 | | | Shire PLC | | | 90,770 | |
| | 80 | | | TESARO, Inc.* | | | 10,331 | |
| | 579 | | | United Therapeutics Corp.* | | | 75,733 | |
| | 740 | | | Vertex Pharmaceuticals, Inc.* | | | 118,800 | |
| | | | | | | | |
| | | | | | | 1,121,390 | |
| | |
| Building Products – 0.1% | | | |
| | 678 | | | A.O. Smith Corp. | | | 37,758 | |
| | 506 | | | Allegion PLC | | | 39,827 | |
| | 696 | | | Asahi Glass Co. Ltd. | | | 27,174 | |
| | 517 | | | Assa Abloy AB Class B | | | 11,175 | |
| | 753 | | | Cie de Saint-Gobain | | | 41,281 | |
| | 472 | | | Daikin Industries Ltd. | | | 47,167 | |
| | 879 | | | Fortune Brands Home & Security, Inc. | | | 54,964 | |
| | 32 | | | Geberit AG | | | 14,627 | |
| | |
| | |
| The accompanying notes are an integral part of these financial statements. | | 9 |
GOLDMAN SACHS GLOBAL MANAGED BETA FUND
Schedule of Investments (continued)
August 31, 2017
| | | | | | | | |
Shares | | | Description | | Value | |
| Common Stocks – (continued) | |
| Building Products – (continued) | | | |
| | 549 | | | Johnson Controls International PLC | | $ | 21,735 | |
| | 402 | | | Lennox International, Inc. | | | 66,623 | |
| | 636 | | | LIXIL Group Corp. | | | 16,694 | |
| | 1,327 | | | Masco Corp. | | | 48,794 | |
| | 671 | | | TOTO Ltd. | | | 25,543 | |
| | | | | | | | |
| | | | | | | 453,362 | |
| | |
| Capital Markets – 0.5% | | | |
| | 12,653 | | | 3i Group PLC | | | 158,741 | |
| | 138 | | | Ameriprise Financial, Inc. | | | 19,114 | |
| | 487 | | | ASX Ltd. | | | 21,202 | |
| | 64 | | | BlackRock, Inc. | | | 26,817 | |
| | 697 | | | Brookfield Asset Management, Inc. Class A | | | 27,567 | |
| | 388 | | | CBOE Holdings, Inc. | | | 39,145 | |
| | 2,483 | | | CI Financial Corp. | | | 54,363 | |
| | 393 | | | CME Group, Inc. | | | 49,439 | |
| | 554 | | | Deutsche Boerse AG | | | 59,271 | |
| | 589 | | | E*TRADE Financial Corp.* | | | 24,155 | |
| | 2,113 | | | Eaton Vance Corp. | | | 100,537 | |
| | 245 | | | Franklin Resources, Inc. | | | 10,591 | |
| | 6,534 | | | Hargreaves Lansdown PLC | | | 118,231 | |
| | 1,716 | | | Hong Kong Exchanges & Clearing Ltd. | | | 46,928 | |
| | 306 | | | IGM Financial, Inc. | | | 10,020 | |
| | 616 | | | Intercontinental Exchange, Inc. | | | 39,837 | |
| | 510 | | | Invesco Ltd. | | | 16,718 | |
| | 2,315 | | | Investec PLC | | | 17,687 | |
| | 270 | | | Julius Baer Group Ltd.* | | | 15,098 | |
| | 570 | | | London Stock Exchange Group PLC | | | 29,129 | |
| | 382 | | | Macquarie Group Ltd. | | | 26,437 | |
| | 159 | | | Moody’s Corp. | | | 21,311 | |
| | 2,563 | | | Morgan Stanley | | | 116,616 | |
| | 1,095 | | | MSCI, Inc. | | | 125,498 | |
| | 293 | | | Nasdaq, Inc. | | | 22,086 | |
| | 2,651 | | | Natixis SA | | | 19,910 | |
| | 2,126 | | | Nomura Holdings, Inc. | | | 11,829 | |
| | 397 | | | Northern Trust Corp. | | | 35,135 | |
| | 136 | | | Partners Group Holding AG | | | 88,225 | |
| | 374 | | | Raymond James Financial, Inc. | | | 29,292 | |
| | 1,275 | | | S&P Global, Inc. | | | 196,771 | |
| | 2,333 | | | SBI Holdings, Inc. | | | 32,448 | |
| | 342 | | | Schroders PLC | | | 14,897 | |
| | 1,047 | | | SEI Investments Co. | | | 61,208 | |
| | 9,386 | | | Singapore Exchange Ltd. | | | 51,957 | |
| | 712 | | | St. James’s Place PLC | | | 10,629 | |
| | 660 | | | State Street Corp. | | | 61,043 | |
| | 548 | | | T. Rowe Price Group, Inc. | | | 46,229 | |
| | 733 | | | TD Ameritrade Holding Corp. | | | 31,754 | |
| | 1,708 | | | The Bank of New York Mellon Corp. | | | 89,294 | |
| | 1,176 | | | The Charles Schwab Corp. | | | 46,922 | |
| | 426 | | | Thomson Reuters Corp. | | | 19,479 | |
| | 1,666 | | | UBS Group AG* | | | 27,450 | |
| | | | | | | | |
| | | | | | | 2,071,010 | |
| | |
| Chemicals – 0.4% | | | |
| | 235 | | | Air Liquide SA | | | 28,692 | |
| | 179 | | | Air Products & Chemicals, Inc. | | | 26,021 | |
| | |
| Common Stocks – (continued) | |
| Chemicals – (continued) | | | |
| | 504 | | | Air Water, Inc. | | | 9,304 | |
| | 553 | | | Akzo Nobel NV | | | 50,526 | |
| | 240 | | | Albemarle Corp. | | | 27,902 | |
| | 1,155 | | | Arkema SA | | | 125,618 | |
| | 3,572 | | | Asahi Kasei Corp. | | | 42,841 | |
| | 836 | | | Axalta Coating Systems Ltd.* | | | 24,679 | |
| | 960 | | | BASF SE | | | 93,118 | |
| | 235 | | | Celanese Corp. Series A | | | 22,800 | |
| | 136 | | | Chr Hansen Holding A/S | | | 11,716 | |
| | 730 | | | Covestro AG(b) | | | 57,415 | |
| | 389 | | | Croda International PLC | | | 19,345 | |
| | 622 | | | Eastman Chemical Co. | | | 53,616 | |
| | 255 | | | Ecolab, Inc. | | | 33,991 | |
| | 170 | | | EMS-Chemie Holding AG | | | 116,315 | |
| | 277 | | | FMC Corp. | | | 23,883 | |
| | 8 | | | Givaudan SA | | | 16,357 | |
| | 796 | | | Hitachi Chemical Co. Ltd. | | | 21,561 | |
| | 3,334 | | | Incitec Pivot Ltd. | | | 8,845 | |
| | 97 | | | International Flavors & Fragrances, Inc. | | | 13,274 | |
| | 590 | | | Johnson Matthey PLC | | | 21,110 | |
| | 763 | | | JSR Corp. | | | 14,862 | |
| | 311 | | | Kansai Paint Co. Ltd. | | | 7,907 | |
| | 352 | | | Koninklijke DSM NV | | | 26,718 | |
| | 2,094 | | | Kuraray Co. Ltd. | | | 39,783 | |
| | 373 | | | LANXESS AG | | | 27,855 | |
| | 157 | | | Linde AG | | | 30,145 | |
| | 773 | | | LyondellBasell Industries NV Class A | | | 70,026 | |
| | 2,992 | | | Mitsubishi Chemical Holdings Corp. | | | 27,887 | |
| | 1,891 | | | Mitsubishi Gas Chemical Co., Inc. | | | 47,011 | |
| | 3,375 | | | Mitsui Chemicals, Inc. | | | 20,215 | |
| | 658 | | | Monsanto Co. | | | 77,118 | |
| | 286 | | | Nippon Paint Holdings Co. Ltd. | | | 9,776 | |
| | 740 | | | Nissan Chemical Industries Ltd. | | | 24,819 | |
| | 248 | | | Nitto Denko Corp. | | | 21,880 | |
| | 2,526 | | | Orica Ltd. | | | 40,997 | |
| | 357 | | | PPG Industries, Inc. | | | 37,242 | |
| | 207 | | | Praxair, Inc. | | | 27,229 | |
| | 338 | | | Shin-Etsu Chemical Co. Ltd. | | | 29,939 | |
| | 6 | | | Sika AG | | | 42,578 | |
| | 184 | | | Solvay SA | | | 26,708 | |
| | 1,256 | | | Sumitomo Chemical Co. Ltd. | | | 7,539 | |
| | 161 | | | Symrise AG | | | 11,777 | |
| | 749 | | | Teijin Ltd. | | | 15,216 | |
| | 1,713 | | | The Dow Chemical Co. | | | 114,171 | |
| | 202 | | | The Sherwin-Williams Co. | | | 68,533 | |
| | 994 | | | Toray Industries, Inc. | | | 9,476 | |
| | 873 | | | Tosoh Corp. | | | 10,263 | |
| | 473 | | | Umicore SA | | | 35,315 | |
| | 120 | | | W.R. Grace & Co. | | | 8,578 | |
| | | | | | | | |
| | | | | | | 1,780,492 | |
| | |
| Commercial Services & Supplies – 0.1% | | | |
| | 517 | | | Cintas Corp. | | | 69,800 | |
| | 699 | | | Dai Nippon Printing Co. Ltd. | | | 8,256 | |
| | 2,782 | | | G4S PLC | | | 10,191 | |
| | 410 | | | ISS A/S | | | 15,958 | |
| | |
| | |
| 10 | | The accompanying notes are an integral part of these financial statements. |
GOLDMAN SACHS GLOBAL MANAGED BETA FUND
| | | | | | | | |
Shares | | | Description | | Value | |
| Common Stocks – (continued) | |
| Commercial Services & Supplies – (continued) | | | |
| | 618 | | | Park24 Co. Ltd. | | $ | 14,872 | |
| | 816 | | | Republic Services, Inc. | | | 53,236 | |
| | 3,078 | | | Rollins, Inc. | | | 136,694 | |
| | 180 | | | Secom Co. Ltd. | | | 13,359 | |
| | 2,275 | | | Securitas AB Class B | | | 37,422 | |
| | 256 | | | Societe BIC SA | | | 30,752 | |
| | 290 | | | Stericycle, Inc.* | | | 20,848 | |
| | 3,263 | | | Toppan Printing Co. Ltd. | | | 32,688 | |
| | 813 | | | Waste Connections, Inc. | | | 54,219 | |
| | 831 | | | Waste Management, Inc. | | | 64,078 | |
| | | | | | | | |
| | | | | | | 562,373 | |
| | |
| Communications Equipment – 0.1% | | | |
| | 138 | | | Arista Networks, Inc.* | | | 24,309 | |
| | 5,323 | | | Cisco Systems, Inc. | | | 171,454 | |
| | 748 | | | CommScope Holding Co., Inc.* | | | 24,729 | |
| | 864 | | | F5 Networks, Inc.* | | | 103,144 | |
| | 371 | | | Harris Corp. | | | 45,596 | |
| | 1,110 | | | Juniper Networks, Inc. | | | 30,780 | |
| | 493 | | | Motorola Solutions, Inc. | | | 43,443 | |
| | 11,012 | | | Telefonaktiebolaget LM Ericsson Class B | | | 64,580 | |
| | | | | | | | |
| | | | | | | 508,035 | |
| | |
| Construction & Engineering – 0.2% | | | |
| | 2,794 | | | ACS Actividades de Construccion y Servicios SA | | | 105,763 | |
| | 865 | | | Boskalis Westminster | | | 28,271 | |
| | 173 | | | Bouygues SA | | | 7,848 | |
| | 1,380 | | | CIMIC Group Ltd. | | | 46,196 | |
| | 740 | | | Eiffage SA | | | 76,457 | |
| | 404 | | | Ferrovial SA | | | 9,219 | |
| | 2,836 | | | Fluor Corp. | | | 109,384 | |
| | 267 | | | HOCHTIEF AG | | | 47,111 | |
| | 2,254 | | | Jacobs Engineering Group, Inc. | | | 122,820 | |
| | 3,832 | | | Kajima Corp. | | | 35,182 | |
| | 2,126 | | | Obayashi Corp. | | | 25,088 | |
| | 2,345 | | | Shimizu Corp. | | | 24,232 | |
| | 480 | | | Skanska AB Class B | | | 10,848 | |
| | 211 | | | SNC-Lavalin Group, Inc. | | | 9,217 | |
| | 2,915 | | | Taisei Corp. | | | 29,249 | |
| | 519 | | | Vinci SA | | | 47,753 | |
| | | | | | | | |
| | | | | | | 734,638 | |
| | |
| Construction Materials – 0.1% | | | |
| | 2,674 | | | Boral Ltd. | | | 14,232 | |
| | 1,961 | | | CRH PLC | | | 68,490 | |
| | 4,023 | | | Fletcher Building Ltd. | | | 23,632 | |
| | 255 | | | HeidelbergCement AG | | | 24,489 | |
| | 475 | | | Imerys SA | | | 41,762 | |
| | 3,080 | | | James Hardie Industries PLC | | | 43,446 | |
| | 127 | | | LafargeHolcim Ltd.* | | | 7,473 | |
| | 5,781 | | | Taiheiyo Cement Corp. | | | 22,294 | |
| | | | | | | | |
| | | | | | | 245,818 | |
| | |
| Consumer Finance – 0.1% | | | |
| | 3,227 | | | Ally Financial, Inc. | | | 72,930 | |
| | 1,860 | | | American Express Co. | | | 160,146 | |
| | |
| Common Stocks – (continued) | |
| Consumer Finance – (continued) | | | |
| | 1,073 | | | Capital One Financial Corp. | | | 85,422 | |
| | 762 | | | Credit Saison Co. Ltd. | | | 13,792 | |
| | 1,145 | | | Discover Financial Services | | | 67,498 | |
| | 4,122 | | | Navient Corp. | | | 54,410 | |
| | 2,507 | | | Provident Financial PLC | | | 28,659 | |
| | 1,351 | | | Synchrony Financial | | | 41,597 | |
| | | | | | | | |
| | | | | | | 524,454 | |
| | |
| Containers & Packaging – 0.1% | | | |
| | 1,256 | | | Amcor Ltd. | | | 16,132 | |
| | 172 | | | Avery Dennison Corp. | | | 16,213 | |
| | 260 | | | Ball Corp. | | | 10,397 | |
| | 888 | | | Crown Holdings, Inc.* | | | 52,418 | |
| | 455 | | | International Paper Co. | | | 24,511 | |
| | 373 | | | Packaging Corp. of America | | | 41,929 | |
| | 363 | | | Sealed Air Corp. | | | 16,110 | |
| | 960 | | | Toyo Seikan Group Holdings Ltd. | | | 15,821 | |
| | 1,868 | | | WestRock Co. | | | 106,308 | |
| | | | | | | | |
| | | | | | | 299,839 | |
| | |
| Distributors – 0.0% | | | |
| | 826 | | | Genuine Parts Co. | | | 68,417 | |
| | 1,485 | | | Jardine Cycle & Carriage Ltd. | | | 43,807 | |
| | 412 | | | LKQ Corp.* | | | 14,276 | |
| | | | | | | | |
| | | | | | | 126,500 | |
| | |
| Diversified Consumer Services – 0.0% | | | |
| | 311 | | | Benesse Holdings, Inc. | | | 11,960 | |
| | 4,458 | | | H&R Block, Inc. | | | 119,207 | |
| | | | | | | | |
| | | | | | | 131,167 | |
| | |
| Diversified Financial Services – 0.2% | | | |
| | 2,821 | | | AMP Ltd. | | | 11,461 | |
| | 1,637 | | | Berkshire Hathaway, Inc. Class B* | | | 296,559 | |
| | 2,342 | | | Challenger Ltd. | | | 23,417 | |
| | 409 | | | Eurazeo SA | | | 33,826 | |
| | 1,068 | | | EXOR NV | | | 68,635 | |
| | 120 | | | Groupe Bruxelles Lambert SA | | | 12,215 | |
| | 1,442 | | | Industrivarden AB Class C | | | 34,178 | |
| | 691 | | | Investor AB Class B | | | 32,326 | |
| | 252 | | | Kinnevik AB Class B | | | 7,586 | |
| | 617 | | | L E Lundbergforetagen AB Class B | | | 47,805 | |
| | 1,886 | | | Leucadia National Corp. | | | 44,660 | |
| | 4,146 | | | Mitsubishi UFJ Lease & Finance Co. Ltd. | | | 20,972 | |
| | 1,648 | | | Onex Corp. | | | 131,774 | |
| | 1,974 | | | ORIX Corp. | | | 31,637 | |
| | 316 | | | Pargesa Holding SA | | | 25,618 | |
| | 1,328 | | | Standard Life Aberdeen PLC | | | 7,380 | |
| | 143 | | | Wendel SA | | | 22,673 | |
| | | | | | | | |
| | | | | | | 852,722 | |
| | |
| Diversified Telecommunication Services – 0.2% | | | |
| | 7,912 | | | AT&T, Inc. | | | 296,384 | |
| | 301 | | | BCE, Inc. | | | 14,327 | |
| | 32,566 | | | Bezeq The Israeli Telecommunication Corp. Ltd. | | | 47,977 | |
| | |
| | |
| The accompanying notes are an integral part of these financial statements. | | 11 |
GOLDMAN SACHS GLOBAL MANAGED BETA FUND
Schedule of Investments (continued)
August 31, 2017
| | | | | | | | |
Shares | | | Description | | Value | |
| Common Stocks – (continued) | |
| Diversified Telecommunication Services – (continued) | | | |
| | 2,154 | | | BT Group PLC | | $ | 8,136 | |
| | 499 | | | CenturyLink, Inc.(a) | | | 9,840 | |
| | 3,789 | | | Deutsche Telekom AG | | | 68,524 | |
| | 299 | | | Elisa Oyj | | | 13,064 | |
| | 2,865 | | | Koninklijke KPN NV | | | 10,133 | |
| | 682 | | | Level 3 Communications, Inc.* | | | 37,121 | |
| | 1,097 | | | Nippon Telegraph & Telephone Corp. | | | 54,613 | |
| | 802 | | | Orange SA | | | 13,617 | |
| | 69,739 | | | PCCW Ltd. | | | 38,927 | |
| | 283 | | | Proximus SADP | | | 9,978 | |
| | 3,570 | | | Singapore Telecommunications Ltd. | | | 9,784 | |
| | 6,705 | | | Spark New Zealand Ltd. | | | 18,864 | |
| | 31 | | | Swisscom AG | | | 15,647 | |
| | 3,534 | | | TDC A/S | | | 21,081 | |
| | 46,173 | | | Telecom Italia SpA* | | | 44,307 | |
| | 52,947 | | | Telecom Italia SpA RSP | | | 41,171 | |
| | 4,219 | | | Telefonica SA | | | 45,517 | |
| | 596 | | | Telenor ASA | | | 12,063 | |
| | 2,026 | | | Telia Co. AB | | | 9,668 | |
| | 6,753 | | | Telstra Corp. Ltd. | | | 19,707 | |
| | 413 | | | TELUS Corp. | | | 14,952 | |
| | 4,108 | | | Verizon Communications, Inc. | | | 197,061 | |
| | 624 | | | Zayo Group Holdings, Inc.* | | | 21,322 | |
| | | | | | | | |
| | | | | | | 1,093,785 | |
| | |
| Electric Utilities – 0.3% | | | |
| | 746 | | | Alliant Energy Corp. | | | 31,884 | |
| | 468 | | | American Electric Power Co., Inc. | | | 34,459 | |
| | 12,240 | | | AusNet Services | | | 16,946 | |
| | 998 | | | Chubu Electric Power Co., Inc. | | | 13,056 | |
| | 1,290 | | | CK Infrastructure Holdings Ltd. | | | 11,702 | |
| | 3,125 | | | CLP Holdings Ltd. | | | 33,016 | |
| | 7,473 | | | Contact Energy Ltd. | | | 30,005 | |
| | 192 | | | DONG Energy A/S(b) | | | 10,005 | |
| | 595 | | | Duke Energy Corp. | | | 51,944 | |
| | 509 | | | Edison International | | | 40,812 | |
| | 10,837 | | | EDP – Energias de Portugal SA | | | 41,664 | |
| | 312 | | | Emera, Inc. | | | 11,983 | |
| | 1,902 | | | Endesa SA | | | 45,956 | |
| | 5,314 | | | Enel SpA | | | 32,194 | |
| | 273 | | | Entergy Corp. | | | 21,613 | |
| | 566 | | | Eversource Energy | | | 35,658 | |
| | 2,255 | | | Exelon Corp. | | | 85,397 | |
| | 1,639 | | | FirstEnergy Corp. | | | 53,399 | |
| | 498 | | | Fortis, Inc. | | | 18,221 | |
| | 785 | | | Fortum Oyj | | | 14,097 | |
| | 32,782 | | | HK Electric Investments & HK Electric Investments Ltd.(b) | | | 30,088 | |
| | 772 | | | Hydro One Ltd.(b) | | | 14,324 | |
| | 8,217 | | | Iberdrola SA | | | 67,232 | |
| | 857 | | | Kyushu Electric Power Co., Inc. | | | 10,075 | |
| | 6,793 | | | Mercury NZ Ltd. | | | 16,778 | |
| | 676 | | | NextEra Energy, Inc. | | | 101,745 | |
| | 795 | | | OGE Energy Corp. | | | 28,397 | |
| | 660 | | | PG&E Corp. | | | 46,451 | |
| | 387 | | | Pinnacle West Capital Corp. | | | 34,818 | |
| | |
| Common Stocks – (continued) | |
| Electric Utilities – (continued) | | | |
| | 1,199 | | | Power Assets Holdings Ltd. | | | 10,578 | |
| | 989 | | | PPL Corp. | | | 38,808 | |
| | 1,123 | | | SSE PLC | | | 20,698 | |
| | 3,154 | | | Terna Rete Elettrica Nazionale SpA | | | 18,637 | |
| | 747 | | | The Chugoku Electric Power Co., Inc. | | | 8,613 | |
| | 2,945 | | | The Kansai Electric Power Co., Inc. | | | 41,295 | |
| | 809 | | | The Southern Co. | | | 39,042 | |
| | 769 | | | Tohoku Electric Power Co., Inc. | | | 10,521 | |
| | 8,177 | | | Tokyo Electric Power Co. Holdings., Inc* | | | 33,111 | |
| | 753 | | | Westar Energy, Inc. | | | 38,636 | |
| | 756 | | | Xcel Energy, Inc. | | | 37,422 | |
| | | | | | | | |
| | | | | | | 1,281,280 | |
| | |
| Electrical Equipment – 0.1% | | | |
| | 1,806 | | | ABB Ltd. | | | 41,788 | |
| | 272 | | | Acuity Brands, Inc. | | | 48,087 | |
| | 243 | | | AMETEK, Inc. | | | 15,370 | |
| | 1,548 | | | Eaton Corp. PLC | | | 111,084 | |
| | 757 | | | Emerson Electric Co. | | | 44,693 | |
| | 3,499 | | | Fuji Electric Co. Ltd. | | | 19,304 | |
| | 324 | | | Legrand SA | | | 22,723 | |
| | 2,068 | | | Mitsubishi Electric Corp. | | | 30,600 | |
| | 403 | | | Nidec Corp. | | | 45,707 | |
| | 93 | | | OSRAM Licht AG | | | 7,639 | |
| | 2,580 | | | Prysmian SpA | | | 81,324 | |
| | 226 | | | Rockwell Automation, Inc. | | | 37,078 | |
| | 523 | | | Schneider Electric SE* | | | 42,175 | |
| | 1,025 | | | Sensata Technologies Holding NV* | | | 45,777 | |
| | 191 | | | Vestas Wind Systems A/S | | | 17,407 | |
| | | | | | | | |
| | | | | | | 610,756 | |
| | |
| Electronic Equipment, Instruments & Components – 0.2% | |
| | 469 | | | Alps Electric Co. Ltd. | | | 12,897 | |
| | 822 | | | Amphenol Corp. Class A | | | 66,533 | |
| | 272 | | | Arrow Electronics, Inc.* | | | 21,605 | |
| | 478 | | | Avnet, Inc. | | | 18,436 | |
| | 531 | | | CDW Corp. | | | 33,676 | |
| | 2,085 | | | Corning, Inc. | | | 59,965 | |
| | 5,067 | | | Flex Ltd.* | | | 82,440 | |
| | 573 | | | FLIR Systems, Inc. | | | 21,774 | |
| | 563 | | | Hamamatsu Photonics KK | | | 17,434 | |
| | 284 | | | Hexagon AB Class B | | | 13,946 | |
| | 126 | | | Hirose Electric Co. Ltd. | | | 17,455 | |
| | 613 | | | Hitachi High-Technologies Corp. | | | 21,893 | |
| | 3,487 | | | Hitachi Ltd. | | | 24,003 | |
| | 159 | | | Ingenico Group SA | | | 15,772 | |
| | 140 | | | Keyence Corp. | | | 72,990 | |
| | 394 | | | Kyocera Corp. | | | 23,656 | |
| | 49 | | | Murata Manufacturing Co. Ltd. | | | 7,506 | |
| | 547 | | | Nippon Electric Glass Co. Ltd. | | | 20,819 | |
| | 896 | | | Omron Corp. | | | 45,046 | |
| | 564 | | | TE Connectivity Ltd. | | | 44,894 | |
| | 821 | | | Trimble, Inc.* | | | 31,756 | |
| | 1,225 | | | Yaskawa Electric Corp. | | | 37,131 | |
| | 2,373 | | | Yokogawa Electric Corp. | | | 37,006 | |
| | | | | | | | |
| | | | | | | 748,633 | |
| | |
| | |
| 12 | | The accompanying notes are an integral part of these financial statements. |
GOLDMAN SACHS GLOBAL MANAGED BETA FUND
| | | | | | | | |
Shares | | | Description | | Value | |
| Common Stocks – (continued) | |
| Energy Equipment & Services – 0.1% | | | |
| | 292 | | | Halliburton Co. | | $ | 11,379 | |
| | 2,357 | | | National Oilwell Varco, Inc. | | | 72,289 | |
| | 17,838 | | | Saipem SpA* | | | 66,312 | |
| | 592 | | | Schlumberger Ltd. | | | 37,598 | |
| | 1,579 | | | TechnipFMC PLC* | | | 40,786 | |
| | | | | | | | |
| | | | | | | 228,364 | |
| | |
| Equity Real Estate Investment Trusts (REITs) – 0.3% | | | |
| | 288 | | | Alexandria Real Estate Equities, Inc. | | | 34,937 | |
| | 488 | | | American Tower Corp. | | | 72,248 | |
| | 3,922 | | | Ascendas Real Estate Investment Trust | | | 7,700 | |
| | 103 | | | AvalonBay Communities, Inc. | | | 19,336 | |
| | 98 | | | Boston Properties, Inc. | | | 11,819 | |
| | 1,106 | | | Camden Property Trust | | | 98,965 | |
| | 9,747 | | | CapitaLand Commercial Trust | | | 12,523 | |
| | 625 | | | Colony NorthStar, Inc. Class A | | | 8,194 | |
| | 188 | | | Crown Castle International Corp. | | | 20,387 | |
| | 8 | | | Daiwa House REIT Investment Corp. | | | 19,561 | |
| | 1,957 | | | Dexus | | | 14,955 | |
| | 526 | | | Digital Realty Trust, Inc. | | | 62,247 | |
| | 547 | | | Duke Realty Corp. | | | 16,257 | |
| | 115 | | | Equinix, Inc. | | | 53,867 | |
| | 272 | | | Equity Residential | | | 18,265 | |
| | 77 | | | Essex Property Trust, Inc. | | | 20,480 | |
| | 141 | | | Extra Space Storage, Inc. | | | 10,946 | |
| | 91 | | | Federal Realty Investment Trust | | | 11,551 | |
| | 121 | | | Fonciere Des Regions | | | 11,970 | |
| | 77 | | | Gecina SA | | | 11,999 | |
| | 401 | | | GGP, Inc. | | | 8,321 | |
| | 3,897 | | | Goodman Group | | | 25,752 | |
| | 683 | | | H&R Real Estate Investment Trust | | | 11,683 | |
| | 1,989 | | | Hammerson PLC | | | 14,445 | |
| | 316 | | | HCP, Inc. | | | 9,420 | |
| | 5,640 | | | Host Hotels & Resorts, Inc. | | | 102,197 | |
| | 127 | | | ICADE | | | 11,291 | |
| | 3,328 | | | Intu Properties PLC | | | 10,722 | |
| | 259 | | | Iron Mountain, Inc. | | | 10,210 | |
| | 4 | | | Japan Prime Realty Investment Corp. | | | 14,372 | |
| | 3 | | | Japan Real Estate Investment Corp. | | | 15,555 | |
| | 6 | | | Japan Retail Fund Investment Corp. | | | 11,039 | |
| | 449 | | | Kimco Realty Corp. | | | 8,809 | |
| | 260 | | | Klepierre SA | | | 10,481 | |
| | 981 | | | Land Securities Group PLC | | | 12,824 | |
| | 828 | | | Liberty Property Trust | | | 35,273 | |
| | 5,195 | | | Link REIT | | | 42,915 | |
| | 100 | | | Mid-America Apartment Communities, Inc. | | | 10,646 | |
| | 7,473 | | | Mirvac Group | | | 13,823 | |
| | 218 | | | National Retail Properties, Inc. | | | 9,119 | |
| | 3 | | | Nippon Building Fund, Inc. | | | 15,964 | |
| | 6 | | | Nippon Prologis REIT, Inc. | | | 13,036 | |
| | 12 | | | Nomura Real Estate Master Fund, Inc. | | | 15,860 | |
| | 720 | | | Prologis, Inc. | | | 45,619 | |
| | 81 | | | Public Storage | | | 16,632 | |
| | 218 | | | Realty Income Corp. | | | 12,548 | |
| | 158 | | | Regency Centers Corp. | | | 10,162 | |
| | |
| Common Stocks – (continued) | |
| Equity Real Estate Investment Trusts (REITs) – (continued) | |
| | 582 | | | RioCan Real Estate Investment Trust | | | 11,092 | |
| | 159 | | | SBA Communications Corp.* | | | 24,414 | |
| | 4,918 | | | Scentre Group | | | 15,126 | |
| | 3,570 | | | Segro PLC | | | 24,863 | |
| | 144 | | | Simon Property Group, Inc. | | | 22,586 | |
| | 514 | | | SL Green Realty Corp. | | | 49,539 | |
| | 384 | | | Smart Real Estate Investment Trust | | | 9,357 | |
| | 5,942 | | | Stockland | | | 20,961 | |
| | 1,399 | | | The British Land Co. PLC | | | 11,085 | |
| | 3,043 | | | The GPT Group | | | 12,124 | |
| | 163 | | | The Macerich Co. | | | 8,601 | |
| | 273 | | | UDR, Inc. | | | 10,598 | |
| | 57 | | | Unibail-Rodamco SE | | | 14,500 | |
| | 11 | | | United Urban Investment Corp. | | | 16,600 | |
| | 281 | | | Ventas, Inc. | | | 19,232 | |
| | 6,258 | | | VEREIT, Inc. | | | 52,817 | |
| | 4,521 | | | Vicinity Centres | | | 9,428 | |
| | 240 | | | Vornado Realty Trust | | | 17,878 | |
| | 308 | | | Welltower, Inc. | | | 22,552 | |
| | 1,545 | | | Westfield Corp. | | | 9,138 | |
| | 446 | | | Weyerhaeuser Co. | | | 14,544 | |
| | | | | | | | |
| | | | | | | 1,453,960 | |
| | |
| Food & Staples Retailing – 0.5% | | | |
| | 1,024 | | | AEON Co. Ltd. | | | 15,119 | |
| | 829 | | | Alimentation Couche-Tard, Inc. Class B | | | 39,586 | |
| | 837 | | | Carrefour SA | | | 16,884 | |
| | 386 | | | Casino Guichard Perrachon SA | | | 21,940 | |
| | 392 | | | Colruyt SA | | | 21,767 | |
| | 767 | | | Costco Wholesale Corp. | | | 120,220 | |
| | 2,308 | | | CVS Health Corp. | | | 178,501 | |
| | 12,250 | | | Distribuidora Internacional de Alimentacion SA | | | 77,596 | |
| | 7,818 | | | Empire Co. Ltd. | | | 131,411 | |
| | 350 | | | FamilyMart UNY Holdings Co. Ltd. | | | 18,965 | |
| | 712 | | | George Weston Ltd. | | | 61,881 | |
| | 295 | | | ICA Gruppen AB | | | 11,763 | |
| | 16,640 | | | J Sainsbury PLC | | | 50,653 | |
| | 2,421 | | | Jeronimo Martins SGPS SA | | | 48,334 | |
| | 4,453 | | | Koninklijke Ahold Delhaize NV | | | 80,050 | |
| | 732 | | | Lawson, Inc. | | | 49,217 | |
| | 1,053 | | | Loblaw Cos. Ltd. | | | 57,113 | |
| | 572 | | | METRO AG* | | | 11,181 | |
| | 739 | | | Metro, Inc. | | | 24,394 | |
| | 265 | | | Seven & i Holdings Co. Ltd. | | | 10,515 | |
| | 1,130 | | | Sundrug Co. Ltd. | | | 46,863 | |
| | 2,595 | | | Sysco Corp. | | | 136,679 | |
| | 30,154 | | | Tesco PLC* | | | 70,457 | |
| | 734 | | | The Jean Coutu Group PJC, Inc. Class A | | | 13,090 | |
| | 3,819 | | | The Kroger Co. | | | 83,522 | |
| | 555 | | | Tsuruha Holdings, Inc. | | | 66,116 | |
| | 4,570 | | | Wal-Mart Stores, Inc. | | | 356,780 | |
| | 2,240 | | | Walgreens Boots Alliance, Inc. | | | 182,560 | |
| | 2,335 | | | Wesfarmers Ltd. | | | 79,159 | |
| | 30,733 | | | William Morrison Supermarkets PLC | | | 97,716 | |
| | 6,159 | | | Woolworths Ltd. | | | 127,379 | |
| | | | | | | | |
| | | | | | | 2,307,411 | |
| | |
| | |
| The accompanying notes are an integral part of these financial statements. | | 13 |
GOLDMAN SACHS GLOBAL MANAGED BETA FUND
Schedule of Investments (continued)
August 31, 2017
| | | | | | | | |
Shares | | | Description | | Value | |
| Common Stocks – (continued) | |
| Food Products – 0.5% | | | |
| | 474 | | | Ajinomoto Co., Inc. | | $ | 9,362 | |
| | 3,353 | | | Archer-Daniels-Midland Co. | | | 138,546 | |
| | 184 | | | Associated British Foods PLC | | | 7,915 | |
| | 35 | | | Barry Callebaut AG* | | | 50,338 | |
| | 2,102 | | | Bunge Ltd. | | | 156,872 | |
| | 1,333 | | | Calbee, Inc. | | | 45,566 | |
| | 1,369 | | | Campbell Soup Co. | | | 63,248 | |
| | 2 | | | Chocoladefabriken Lindt & Spruengli AG | | | 11,471 | |
| | 2,155 | | | Conagra Brands, Inc. | | | 69,951 | |
| | 1,218 | | | Danone SA | | | 95,960 | |
| | 629 | | | General Mills, Inc. | | | 33,501 | |
| | 106,622 | | | Golden Agri-Resources Ltd. | | | 31,060 | |
| | 475 | | | Hormel Foods Corp. | | | 14,602 | |
| | 1,015 | | | Ingredion, Inc. | | | 125,677 | |
| | 329 | | | Kellogg Co. | | | 21,536 | |
| | 267 | | | Kerry Group PLC Class A | | | 24,865 | |
| | 431 | | | Kikkoman Corp. | | | 13,495 | |
| | 4,320 | | | Marine Harvest ASA* | | | 85,816 | |
| | 396 | | | McCormick & Co., Inc. | | | 37,672 | |
| | 558 | | | MEIJI Holdings Co. Ltd. | | | 44,453 | |
| | 637 | | | Mondelez International, Inc. Class A | | | 25,900 | |
| | 2,575 | | | Nestle SA | | | 218,298 | |
| | 1,664 | | | NH Foods Ltd. | | | 48,810 | |
| | 1,038 | | | Nisshin Seifun Group, Inc. | | | 18,027 | |
| | 148 | | | Nissin Foods Holdings Co. Ltd. | | | 9,126 | |
| | 1,080 | | | Orkla ASA | | | 11,089 | |
| | 1,729 | | | Saputo, Inc. | | | 58,374 | |
| | 3,502 | | | Tate & Lyle PLC | | | 30,922 | |
| | 904 | | | The Hershey Co. | | | 94,848 | |
| | 759 | | | The J.M. Smucker Co. | | | 79,513 | |
| | 371 | | | The Kraft Heinz Co. | | | 29,958 | |
| | 229 | | | Toyo Suisan Kaisha Ltd. | | | 8,465 | |
| | 2,344 | | | Tyson Foods, Inc. Class A | | | 148,375 | |
| | 90,939 | | | WH Group Ltd.(b) | | | 95,317 | |
| | 128 | | | Yakult Honsha Co. Ltd. | | | 8,865 | |
| | 3,614 | | | Yamazaki Baking Co. Ltd. | | | 68,498 | |
| | | | | | | | |
| | | | | | | 2,036,291 | |
| | |
| Gas Utilities – 0.1% | | | |
| | 1,599 | | | APA Group | | | 11,274 | |
| | 233 | | | Atmos Energy Corp. | | | 20,513 | |
| | 426 | | | Gas Natural SDG SA | | | 10,365 | |
| | 17,472 | | | Hong Kong & China Gas Co. Ltd. | | | 33,080 | |
| | 7,441 | | | Osaka Gas Co. Ltd. | | | 29,128 | |
| | 2,262 | | | Toho Gas Co. Ltd. | | | 14,929 | |
| | 5,267 | | | Tokyo Gas Co. Ltd. | | | 27,925 | |
| | 1,775 | | | UGI Corp. | | | 87,703 | |
| | | | | | | | |
| | | | | | | 234,917 | |
| | |
| Health Care Equipment & Supplies – 0.4% | | | |
| | 1,390 | | | Abbott Laboratories | | | 70,807 | |
| | 1,025 | | | Align Technology, Inc.* | | | 181,158 | |
| | 843 | | | Baxter International, Inc. | | | 52,300 | |
| | 291 | | | Becton Dickinson & Co. | | | 58,037 | |
| | 843 | | | Boston Scientific Corp.* | | | 23,225 | |
| | |
| Common Stocks – (continued) | |
| Health Care Equipment & Supplies – (continued) | | | |
| | 372 | | | C.R. Bard, Inc. | | | 119,341 | |
| | 1,106 | | | Cochlear Ltd. | | | 137,760 | |
| | 490 | | | Coloplast A/S Class B | | | 40,157 | |
| | 2,821 | | | ConvaTec Group PLC*(b) | | | 10,466 | |
| | 639 | | | Danaher Corp. | | | 53,305 | |
| | 287 | | | DENTSPLY SIRONA, Inc. | | | 16,236 | |
| | 1,396 | | | DexCom, Inc.* | | | 104,156 | |
| | 547 | | | Edwards Lifesciences Corp.* | | | 62,172 | |
| | 141 | | | Essilor International SA | | | 17,808 | |
| | 2,645 | | | Getinge AB Class B | | | 49,168 | |
| | 404 | | | Hologic, Inc.* | | | 15,594 | |
| | 1,432 | | | Hoya Corp. | | | 82,066 | |
| | 955 | | | IDEXX Laboratories, Inc.* | | | 148,436 | |
| | 53 | | | Intuitive Surgical, Inc.* | | | 53,247 | |
| | 2,669 | | | Koninklijke Philips NV | | | 101,219 | |
| | 791 | | | Medtronic PLC | | | 63,770 | |
| | 848 | | | Olympus Corp. | | | 29,364 | |
| | 203 | | | ResMed, Inc. | | | 15,749 | |
| | 5,091 | | | Smith & Nephew PLC | | | 92,097 | |
| | 82 | | | Sonova Holding AG | | | 13,864 | |
| | 126 | | | Straumann Holding AG | | | 80,904 | |
| | 547 | | | Stryker Corp. | | | 77,329 | |
| | 576 | | | Sysmex Corp. | | | 35,648 | |
| | 129 | | | Teleflex, Inc. | | | 27,316 | |
| | 318 | | | Terumo Corp. | | | 12,304 | |
| | 161 | | | The Cooper Cos., Inc. | | | 40,384 | |
| | 219 | | | Varian Medical Systems, Inc.* | | | 23,269 | |
| | 396 | | | William Demant Holding A/S* | | | 10,487 | |
| | 219 | | | Zimmer Biomet Holdings, Inc. | | | 25,025 | |
| | | | | | | | |
| | | | | | | 1,944,168 | |
| | |
| Health Care Providers & Services – 0.4% | | | |
| | 738 | | | Aetna, Inc. | | | 116,383 | |
| | 2,573 | | | Alfresa Holdings Corp. | | | 48,520 | |
| | 415 | | | AmerisourceBergen Corp. | | | 33,304 | |
| | 551 | | | Anthem, Inc. | | | 108,018 | |
| | 234 | | | Cardinal Health, Inc. | | | 15,786 | |
| | 1,043 | | | Centene Corp.* | | | 92,670 | |
| | 477 | | | Cigna Corp. | | | 86,843 | |
| | 645 | | | DaVita, Inc.* | | | 37,771 | |
| | 240 | | | Envision Healthcare Corp.* | | | 12,578 | |
| | 1,283 | | | Express Scripts Holding Co.* | | | 80,598 | |
| | 230 | | | Fresenius Medical Care AG & Co. KGaA | | | 21,576 | |
| | 161 | | | Fresenius SE & Co. KGaA | | | 13,665 | |
| | 445 | | | HCA Healthcare, Inc.* | | | 35,004 | |
| | 472 | | | Henry Schein, Inc.* | | | 81,977 | |
| | 411 | | | Humana, Inc. | | | 105,882 | |
| | 386 | | | Laboratory Corp. of America Holdings* | | | 60,552 | |
| | 358 | | | McKesson Corp. | | | 53,453 | |
| | 4,804 | | | Mediclinic International PLC | | | 47,583 | |
| | 997 | | | Medipal Holdings Corp. | | | 17,599 | |
| | 339 | | | MEDNAX, Inc.* | | | 15,204 | |
| | 718 | | | Miraca Holdings, Inc. | | | 32,693 | |
| | 204 | | | Patterson Cos., Inc. | | | 7,854 | |
| | 494 | | | Quest Diagnostics, Inc. | | | 53,525 | |
| | 159 | | | Ramsay Health Care Ltd. | | | 8,638 | |
| | |
| | |
| 14 | | The accompanying notes are an integral part of these financial statements. |
GOLDMAN SACHS GLOBAL MANAGED BETA FUND
| | | | | | | | |
Shares | | | Description | | Value | |
| Common Stocks – (continued) | |
| Health Care Providers & Services – (continued) | | | |
| | 688 | | | Sonic Healthcare Ltd. | | $ | 11,982 | |
| | 868 | | | Suzuken Co. Ltd. | | | 31,640 | |
| | 1,471 | | | UnitedHealth Group, Inc. | | | 292,582 | |
| | 249 | | | Universal Health Services, Inc. Class B | | | 26,924 | |
| | | | | | | | |
| | | | | | | 1,550,804 | |
| | |
| Health Care Technology – 0.0% | | | |
| | 414 | | | Cerner Corp.* | | | 28,061 | |
| | 598 | | | M3, Inc. | | | 15,567 | |
| | 183 | | | Veeva Systems, Inc. Class A* | | | 10,888 | |
| | | | | | | | |
| | | | | | | 54,516 | |
| | |
| Hotels, Restaurants & Leisure – 0.4% | | | |
| | 2,697 | | | Aramark | | | 109,741 | |
| | 4,571 | | | Aristocrat Leisure Ltd. | | | 76,970 | |
| | 1,238 | | | Carnival Corp. | | | 86,016 | |
| | 388 | | | Carnival PLC | | | 26,997 | |
| | 3,547 | | | Compass Group PLC | | | 75,848 | |
| | 659 | | | Darden Restaurants, Inc. | | | 54,097 | |
| | 799 | | | Domino’s Pizza, Inc. | | | 145,626 | |
| | 3,738 | | | Flight Centre Travel Group Ltd. | | | 144,007 | |
| | 3,397 | | | Galaxy Entertainment Group Ltd. | | | 21,404 | |
| | 17,779 | | | Genting Singapore PLC | | | 15,572 | |
| | 1,163 | | | Hilton Worldwide Holdings, Inc. | | | 74,816 | |
| | 710 | | | InterContinental Hotels Group PLC | | | 35,420 | |
| | 513 | | | Las Vegas Sands Corp. | | | 31,914 | |
| | 577 | | | Marriott International, Inc. Class A | | | 59,766 | |
| | 970 | | | McDonald’s Corp. | | | 155,171 | |
| | 1,055 | | | McDonald’s Holdings Co. Japan Ltd. | | | 46,895 | |
| | 515 | | | Melco Resorts & Entertainment Ltd. ADR | | | 11,304 | |
| | 1,425 | | | Merlin Entertainments PLC(b) | | | 8,501 | |
| | 7,743 | | | MGM China Holdings Ltd. | | | 15,558 | |
| | 1,229 | | | MGM Resorts International | | | 40,508 | |
| | 273 | | | Norwegian Cruise Line Holdings Ltd.* | | | 16,232 | |
| | 276 | | | Oriental Land Co. Ltd. | | | 20,755 | |
| | 280 | | | Restaurant Brands International, Inc. | | | 17,092 | |
| | 856 | | | Royal Caribbean Cruises Ltd. | | | 106,538 | |
| | 5,931 | | | Shangri-La Asia Ltd. | | | 9,946 | |
| | 148,532 | | | SJM Holdings Ltd. | | | 129,852 | |
| | 159 | | | Sodexo SA | | | 18,561 | |
| | 1,267 | | | Starbucks Corp. | | | 69,508 | |
| | 4,070 | | | Tabcorp Holdings Ltd. | | | 13,311 | |
| | 132 | | | Vail Resorts, Inc. | | | 30,089 | |
| | 1,235 | | | Whitbread PLC | | | 60,034 | |
| | 812 | | | Wyndham Worldwide Corp. | | | 80,940 | |
| | 7,900 | | | Wynn Macau Ltd. | | | 17,410 | |
| | 143 | | | Wynn Resorts Ltd. | | | 19,875 | |
| | 1,057 | | | Yum! Brands, Inc. | | | 81,199 | |
| | | | | | | | |
| | | | | | | 1,927,473 | |
| | |
| Household Durables – 0.2% | | | |
| | 10,047 | | | Barratt Developments PLC | | | 81,395 | |
| | 317 | | | Berkeley Group Holdings PLC | | | 15,360 | |
| | 384 | | | D.R. Horton, Inc. | | | 13,882 | |
| | 1,338 | | | Electrolux AB Series B | | | 48,681 | |
| | |
| Common Stocks – (continued) | |
| Household Durables – (continued) | | | |
| | 191 | | | Garmin Ltd. | | | 9,836 | |
| | 1,644 | | | Husqvarna AB Class B | | | 16,595 | |
| | 444 | | | Leggett & Platt, Inc. | | | 20,411 | |
| | 559 | | | Lennar Corp. Class A | | | 28,934 | |
| | 48 | | | Mohawk Industries, Inc.* | | | 12,150 | |
| | 264 | | | Newell Brands, Inc. | | | 12,746 | |
| | 1,363 | | | Nikon Corp. | | | 22,468 | |
| | 11 | | | NVR, Inc.* | | | 29,929 | |
| | 2,158 | | | Panasonic Corp. | | | 28,766 | |
| | 842 | | | Persimmon PLC | | | 28,995 | |
| | 895 | | | PulteGroup, Inc. | | | 23,109 | |
| | 119 | | | Rinnai Corp. | | | 10,344 | |
| | 464 | | | SEB SA | | | 84,279 | |
| | 1,262 | | | Sekisui Chemical Co. Ltd. | | | 23,564 | |
| | 610 | | | Sekisui House Ltd. | | | 10,561 | |
| | 5,232 | | | Sharp Corp.* | | | 15,700 | |
| | 2,113 | | | Sony Corp. | | | 83,608 | |
| | 8,939 | | | Taylor Wimpey PLC | | | 23,226 | |
| | 7,948 | | | Techtronic Industries Co. Ltd. | | | 41,181 | |
| | 600 | | | Toll Brothers, Inc. | | | 23,376 | |
| | 161 | | | Whirlpool Corp. | | | 27,631 | |
| | | | | | | | |
| | | | 736,727 | |
| | |
| Household Products – 0.2% | |
| | 661 | | | Church & Dwight Co., Inc. | | | 33,162 | |
| | 2,338 | | | Colgate-Palmolive Co. | | | 167,494 | |
| | 309 | | | Essity AB* | | | 8,579 | |
| | 388 | | | Henkel AG & Co. KGaA | | | 49,129 | |
| | 687 | | | Kimberly-Clark Corp. | | | 84,700 | |
| | 5,214 | | | Lion Corp. | | | 103,936 | |
| | 400 | | | Reckitt Benckiser Group PLC | | | 37,932 | |
| | 544 | | | Spectrum Brands Holdings, Inc.(a) | | | 59,818 | |
| | 757 | | | The Clorox Co. | | | 104,867 | |
| | 2,647 | | | The Procter & Gamble Co. | | | 244,239 | |
| | 1,208 | | | Unicharm Corp. | | | 28,440 | |
| | | | | | | | |
| | | | 922,296 | |
| | |
| Independent Power and Renewable Electricity Producers – 0.0% | |
| | 11,969 | | | AES Corp. | | | 132,138 | |
| | 10,375 | | | Meridian Energy Ltd. | | | 21,985 | |
| | | | | | | | |
| | | | 154,123 | |
| | |
| Industrial Conglomerates – 0.2% | |
| | 1,063 | | | 3M Co. | | | 217,192 | |
| | 1,601 | | | CK Hutchison Holdings Ltd. | | | 20,990 | |
| | 111 | | | DCC PLC | | | 10,121 | |
| | 4,666 | | | General Electric Co. | | | 114,550 | |
| | 919 | | | Honeywell International, Inc. | | | 127,070 | |
| | 255 | | | Jardine Matheson Holdings Ltd. | | | 16,772 | |
| | 727 | | | Jardine Strategic Holdings Ltd. | | | 31,918 | |
| | 1,875 | | | Keihan Holdings Co. Ltd. | | | 11,314 | |
| | 7,832 | | | NWS Holdings Ltd. | | | 15,074 | |
| | 140 | | | Roper Technologies, Inc. | | | 32,293 | |
| | 800 | | | Siemens AG | | | 104,727 | |
| | 1,977 | | | Smiths Group PLC | | | 39,507 | |
| | | | | | | | |
| | | | 741,528 | |
| | |
| | |
| The accompanying notes are an integral part of these financial statements. | | 15 |
GOLDMAN SACHS GLOBAL MANAGED BETA FUND
Schedule of Investments (continued)
August 31, 2017
| | | | | | | | |
Shares | | | Description | | Value | |
| Common Stocks – (continued) | |
| Insurance – 0.8% | |
| | 4,756 | | | Admiral Group PLC | | $ | 118,815 | |
| | 1,294 | | | Aegon NV | | | 7,399 | |
| | 908 | | | Aflac, Inc. | | | 74,955 | |
| | 323 | | | Ageas | | | 14,995 | |
| | 11,449 | | | AIA Group Ltd. | | | 88,178 | |
| | 56 | | | Alleghany Corp.* | | | 31,515 | |
| | 604 | | | Allianz SE | | | 129,453 | |
| | 363 | | | American Financial Group, Inc. | | | 36,957 | |
| | 647 | | | American International Group, Inc. | | | 39,131 | |
| | 798 | | | Aon PLC | | | 111,050 | |
| | 424 | | | Arch Capital Group Ltd.* | | | 41,272 | |
| | 442 | | | Arthur J. Gallagher & Co. | | | 25,592 | |
| | 1,452 | | | Assicurazioni Generali SpA | | | 26,046 | |
| | 579 | | | Assurant, Inc. | | | 54,826 | |
| | 373 | | | Athene Holding Ltd. Class A* | | | 19,959 | |
| | 4,146 | | | Aviva PLC | | | 28,036 | |
| | 1,957 | | | AXA SA | | | 56,742 | |
| | 715 | | | Axis Capital Holdings Ltd. | | | 43,072 | |
| | 181 | | | Baloise Holding AG | | | 28,845 | |
| | 442 | | | Brighthouse Financial, Inc.* | | | 25,225 | |
| | 553 | | | Chubb Ltd. | | | 78,205 | |
| | 357 | | | Cincinnati Financial Corp. | | | 27,432 | |
| | 1,380 | | | CNP Assurances | | | 32,031 | |
| | 1,225 | | | Dai-ichi Life Holdings, Inc. | | | 19,589 | |
| | 2,108 | | | Direct Line Insurance Group PLC | | | 10,360 | |
| | 212 | | | Everest Re Group Ltd. | | | 53,526 | |
| | 732 | | | FNF Group | | | 35,312 | |
| | 661 | | | Gjensidige Forsikring ASA | | | 11,567 | |
| | 1,039 | | | Great-West Lifeco, Inc. | | | 28,780 | |
| | 74 | | | Hannover Rueck SE | | | 8,977 | |
| | 1,301 | | | Industrial Alliance Insurance & Financial Services, Inc. | | | 55,832 | |
| | 4,952 | | | Insurance Australia Group Ltd. | | | 25,271 | |
| | 280 | | | Intact Financial Corp. | | | 23,082 | |
| | 747 | | | Japan Post Holdings Co. Ltd. | | | 9,276 | |
| | 6,978 | | | Legal & General Group PLC | | | 23,498 | |
| | 723 | | | Lincoln National Corp. | | | 49,063 | |
| | 635 | | | Loews Corp. | | | 29,578 | |
| | 4,245 | | | Manulife Financial Corp. | | | 83,387 | |
| | 6,669 | | | Mapfre SA | | | 23,643 | |
| | 19 | | | Markel Corp.* | | | 19,988 | |
| | 1,604 | | | Marsh & McLennan Cos., Inc. | | | 125,240 | |
| | 14,527 | | | Medibank Pvt. Ltd. | | | 35,167 | |
| | 1,145 | | | MetLife, Inc. | | | 53,620 | |
| | 691 | | | MS&AD Insurance Group Holdings, Inc. | | | 22,762 | |
| | 238 | | | Muenchener Rueckversicherungs-Gesellschaft AG in Muenchen | | | 49,156 | |
| | 741 | | | NN Group NV | | | 29,420 | |
| | 3,548 | | | Old Mutual PLC | | | 9,530 | |
| | 3,802 | | | Poste Italiane SpA(b) | | | 27,648 | |
| | 2,134 | | | Power Corp. of Canada | | | 52,156 | |
| | 1,872 | | | Power Financial Corp. | | | 50,535 | |
| | 826 | | | Principal Financial Group, Inc. | | | 51,642 | |
| | 1,042 | | | Prudential Financial, Inc. | | | 106,367 | |
| | 1,856 | | | Prudential PLC | | | 43,568 | |
| | 5,593 | | | QBE Insurance Group Ltd. | | | 46,447 | |
| | |
| Common Stocks – (continued) | |
| Insurance – (continued) | |
| | 574 | | | Reinsurance Group of America, Inc. | | | 77,174 | |
| | 229 | | | RenaissanceRe Holdings Ltd. | | | 31,868 | |
| | 3,319 | | | RSA Insurance Group PLC | | | 28,616 | |
| | 400 | | | Sampo Oyj Class A | | | 21,118 | |
| | 687 | | | SCOR SE | | | 28,760 | |
| | 653 | | | Sompo Holdings, Inc. | | | 24,526 | |
| | 2,083 | | | Sun Life Financial, Inc. | | | 79,984 | |
| | 4,549 | | | Suncorp Group Ltd. | | | 47,238 | |
| | 99 | | | Swiss Life Holding AG* | | | 35,442 | |
| | 439 | | | Swiss Re AG | | | 39,750 | |
| | 880 | | | T&D Holdings, Inc. | | | 11,982 | |
| | 792 | | | The Allstate Corp. | | | 71,676 | |
| | 1,003 | | | The Hartford Financial Services Group, Inc. | | | 54,232 | |
| | 1,246 | | | The Progressive Corp. | | | 57,914 | |
| | 589 | | | The Travelers Cos., Inc. | | | 71,375 | |
| | 341 | | | Tokio Marine Holdings, Inc. | | | 13,579 | |
| | 550 | | | Torchmark Corp. | | | 42,334 | |
| | 385 | | | Tryg A/S | | | 8,907 | |
| | 7,462 | | | UnipolSai Assicurazioni SpA | | | 16,958 | |
| | 1,380 | | | Unum Group | | | 66,488 | |
| | 630 | | | W.R. Berkley Corp. | | | 41,983 | |
| | 117 | | | Willis Towers Watson PLC | | | 17,371 | |
| | 926 | | | XL Group Ltd. | | | 37,929 | |
| | 189 | | | Zurich Insurance Group AG | | | 56,567 | |
| | | | | | | | |
| | | | | | | 3,337,489 | |
| | |
| Internet & Direct Marketing Retail – 0.3% | | | |
| | 647 | | | Amazon.com, Inc.* | | | 634,448 | |
| | 413 | | | Expedia, Inc. | | | 61,273 | |
| | 2,908 | | | Liberty Interactive Corp. QVC Group Class A* | | | 64,325 | |
| | 969 | | | Netflix, Inc.* | | | 169,294 | |
| | 4,940 | | | Start Today Co. Ltd. | | | 153,783 | |
| | 98 | | | The Priceline Group, Inc.* | | | 181,504 | |
| | 1,743 | | | TripAdvisor, Inc.*(a) | | | 74,478 | |
| | 1,629 | | | Zalando SE*(b) | | | 77,237 | |
| | | | | | | | |
| | | | | | | 1,416,342 | |
| | |
| Internet Software & Services – 0.5% | | | |
| | 1,118 | | | Akamai Technologies, Inc.* | | | 52,714 | |
| | 474 | | | Alphabet, Inc. Class A* | | | 452,784 | |
| | 497 | | | Alphabet, Inc. Class C* | | | 466,847 | |
| | 20,824 | | | Auto Trader Group PLC(b) | | | 95,272 | |
| | 80 | | | CoStar Group, Inc.* | | | 22,929 | |
| | 506 | | | DeNA Co. Ltd. | | | 10,816 | |
| | 2,558 | | | eBay, Inc.* | | | 92,420 | |
| | 3,507 | | | Facebook, Inc. Class A* | | | 603,099 | |
| | 4,887 | | | Kakaku.com, Inc. | | | 60,921 | |
| | 179 | | | MercadoLibre, Inc. | | | 46,266 | |
| | 2,269 | | | Mixi, Inc. | | | 121,195 | |
| | 440 | | | Shopify, Inc. Class A* | | | 48,625 | |
| | 1,273 | | | Twitter, Inc.* | | | 21,526 | |
| | 231 | | | United Internet AG | | | 13,728 | |
| | 333 | | | VeriSign, Inc.* | | | 34,549 | |
| | 1,729 | | | Yahoo Japan Corp. | | | 7,938 | |
| | 498 | | | Zillow Group, Inc. Class C* | | | 19,731 | |
| | | | | | | | |
| | | | | | | 2,171,360 | |
| | |
| | |
| 16 | | The accompanying notes are an integral part of these financial statements. |
GOLDMAN SACHS GLOBAL MANAGED BETA FUND
| | | | | | | | |
Shares | | | Description | | Value | |
| Common Stocks – (continued) | |
| IT Services – 0.5% | | | |
| | 1,468 | | | Accenture PLC Class A | | $ | 191,956 | |
| | 368 | | | Alliance Data Systems Corp. | | | 82,984 | |
| | 577 | | | Amadeus IT Group SA | | | 35,821 | |
| | 1,565 | | | Atos SE | | | 241,394 | |
| | 582 | | | Automatic Data Processing, Inc. | | | 61,966 | |
| | 498 | | | Broadridge Financial Solutions, Inc. | | | 38,909 | |
| | 711 | | | Capgemini SE | | | 78,823 | |
| | 978 | | | Cognizant Technology Solutions Corp. Class A | | | 69,213 | |
| | 1,248 | | | Computershare Ltd. | | | 13,965 | |
| | 1,108 | | | DXC Technology Co. | | | 94,180 | |
| | 1,436 | | | Fidelity National Information Services, Inc. | | | 133,433 | |
| | 392 | | | Fiserv, Inc.* | | | 48,494 | |
| | 78 | | | FleetCor Technologies, Inc.* | | | 11,214 | |
| | 9,379 | | | Fujitsu Ltd. | | | 69,525 | |
| | 609 | | | Gartner, Inc.* | | | 73,439 | |
| | 118 | | | Global Payments, Inc. | | | 11,268 | |
| | 1,536 | | | International Business Machines Corp. | | | 219,694 | |
| | 270 | | | Jack Henry & Associates, Inc. | | | 27,829 | |
| | 535 | | | Leidos Holdings, Inc. | | | 31,201 | |
| | 1,262 | | | MasterCard, Inc. Class A | | | 168,225 | |
| | 242 | | | Nomura Research Institute Ltd. | | | 9,423 | |
| | 3,340 | | | NTT Data Corp. | | | 36,071 | |
| | 204 | | | Obic Co. Ltd. | | | 12,797 | |
| | 117 | | | Otsuka Corp. | | | 7,754 | |
| | 823 | | | Paychex, Inc. | | | 46,936 | |
| | 1,234 | | | PayPal Holdings, Inc.* | | | 76,113 | |
| | 1,087 | | | Sabre Corp. | | | 20,044 | |
| | 1,303 | | | The Western Union Co. | | | 24,653 | |
| | 1,217 | | | Total System Services, Inc. | | | 84,119 | |
| | 419 | | | Vantiv, Inc. Class A* | | | 29,619 | |
| | 1,476 | | | Visa, Inc. Class A | | | 152,795 | |
| | 6,224 | | | Worldpay Group PLC(b) | | | 33,585 | |
| | | | | | | | |
| | | | | | | 2,237,442 | |
| | |
| Leisure Products – 0.0% | | | |
| | 1,179 | | | Bandai Namco Holdings, Inc. | | | 39,571 | |
| | 725 | | | Hasbro, Inc. | | | 71,231 | |
| | 470 | | | Mattel, Inc. | | | 7,623 | |
| | 362 | | | Sankyo Co. Ltd. | | | 11,821 | |
| | 1,145 | | | Sega Sammy Holdings, Inc. | | | 16,473 | |
| | | | | | | | |
| | | | | | | 146,719 | |
| | |
| Life Sciences Tools & Services – 0.1% | | | |
| | 352 | | | Agilent Technologies, Inc. | | | 22,781 | |
| | 26 | | | Eurofins Scientific SE | | | 14,867 | |
| | 248 | | | Illumina, Inc.* | | | 50,706 | |
| | 65 | | | Lonza Group AG* | | | 16,479 | |
| | 239 | | | Mettler-Toledo International, Inc.* | | | 144,616 | |
| | 1,208 | | | QIAGEN NV* | | | 38,971 | |
| | 1,033 | | | Quintiles IMS Holdings, Inc.* | | | 99,199 | |
| | 540 | | | Thermo Fisher Scientific, Inc. | | | 101,056 | |
| | 245 | | | Waters Corp.* | | | 44,953 | |
| | | | | | | | |
| | | | | | | 533,628 | |
| | |
| Common Stocks – (continued) | |
| Machinery – 0.3% | | | |
| | 1,010 | | | AGCO Corp. | | | 69,135 | |
| | 368 | | | Alfa Laval AB | | | 8,339 | |
| | 321 | | | ANDRITZ AG | | | 17,480 | |
| | 1,299 | | | Atlas Copco AB Class A | | | 50,963 | |
| | 899 | | | Atlas Copco AB Class B | | | 32,104 | |
| | 609 | | | Caterpillar, Inc. | | | 71,551 | |
| | 5,235 | | | CNH Industrial NV | | | 59,463 | |
| | 454 | | | Cummins, Inc. | | | 72,359 | |
| | 397 | | | Deere & Co. | | | 46,024 | |
| | 281 | | | Dover Corp. | | | 23,851 | |
| | 185 | | | FANUC Corp. | | | 35,942 | |
| | 497 | | | Fortive Corp. | | | 32,290 | |
| | 921 | | | Hitachi Construction Machinery Co. Ltd. | | | 25,966 | |
| | 104 | | | IDEX Corp. | | | 12,228 | |
| | 6,116 | | | IHI Corp.* | | | 20,252 | |
| | 654 | | | Illinois Tool Works, Inc. | | | 89,932 | |
| | 662 | | | IMI PLC | | | 9,720 | |
| | 1,203 | | | Ingersoll-Rand PLC | | | 102,724 | |
| | 170 | | | KION Group AG | | | 15,529 | |
| | 1,466 | | | Komatsu Ltd. | | | 39,564 | |
| | 228 | | | Kone Oyj Class B | | | 12,373 | |
| | 586 | | | Kubota Corp. | | | 10,137 | |
| | 428 | | | Kurita Water Industries Ltd. | | | 12,323 | |
| | 334 | | | Makita Corp. | | | 13,429 | |
| | 198 | | | MAN SE | | | 22,232 | |
| | 463 | | | MINEBEA MITSUMI, Inc. | | | 7,610 | |
| | 358 | | | Nabtesco Corp. | | | 12,536 | |
| | 799 | | | NSK Ltd. | | | 9,470 | |
| | 281 | | | PACCAR, Inc. | | | 18,639 | |
| | 351 | | | Parker-Hannifin Corp. | | | 56,472 | |
| | 666 | | | Pentair PLC | | | 41,325 | |
| | 2,397 | | | Sandvik AB | | | 39,630 | |
| | 128 | | | Schindler Holding AG | | | 27,178 | |
| | 591 | | | SKF AB Class B | | | 11,814 | |
| | 223 | | | Snap-on, Inc. | | | 32,908 | |
| | 244 | | | Stanley Black & Decker, Inc. | | | 35,136 | |
| | 2,053 | | | Sumitomo Heavy Industries Ltd. | | | 15,309 | |
| | 218 | | | The Middleby Corp.* | | | 26,531 | |
| | 360 | | | THK Co. Ltd. | | | 12,016 | |
| | 2,428 | | | Volvo AB Class B | | | 41,500 | |
| | 55 | | | WABCO Holdings, Inc.* | | | 7,899 | |
| | 133 | | | Wabtec Corp.(a) | | | 9,386 | |
| | 250 | | | Wartsila Oyj Abp | | | 17,254 | |
| | 299 | | | Xylem, Inc. | | | 18,559 | |
| | 40,723 | | | Yangzijiang Shipbuilding Holdings Ltd. | | | 45,008 | |
| | | | | | | | |
| | | | | | | 1,392,090 | |
| | |
| Marine – 0.0% | | | |
| | 4 | | | AP Moller – Maersk A/S Class B | | | 8,262 | |
| | 697 | | | Kuehne & Nagel International AG | | | 126,311 | |
| | 6,380 | | | Mitsui OSK Lines Ltd. | | | 20,479 | |
| | | | | | | | |
| | | | | | | 155,052 | |
| | |
| Media – 0.3% | | | |
| | 336 | | | Altice NV Class A* | | | 7,751 | |
| | 186 | | | Axel Springer SE | | | 11,525 | |
| | |
| | |
| The accompanying notes are an integral part of these financial statements. | | 17 |
GOLDMAN SACHS GLOBAL MANAGED BETA FUND
Schedule of Investments (continued)
August 31, 2017
| | | | | | | | |
Shares | | | Description | | Value | |
| Common Stocks – (continued) | |
| Media – (continued) | | | |
| | 247 | | | Charter Communications, Inc. Class A* | | $ | 98,439 | |
| | 5,000 | | | Comcast Corp. Class A | | | 203,050 | |
| | 600 | | | Discovery Communications, Inc. Class A* | | | 13,326 | |
| | 752 | | | Discovery Communications, Inc. Class C* | | | 15,800 | |
| | 1,080 | | | Eutelsat Communications SA | | | 31,402 | |
| | 271 | | | GEDI Gruppo Editoriale SpA* | | | 232 | |
| | 971 | | | Hakuhodo DY Holdings, Inc. | | | 13,208 | |
| | 5,806 | | | I-CABLE Communications Ltd.* | | | 216 | |
| | 422 | | | Liberty Broadband Corp. Class C* | | | 42,846 | |
| | 826 | | | Liberty Global PLC Class A* | | | 28,084 | |
| | 1,092 | | | Liberty Global PLC Series C* | | | 36,069 | |
| | 800 | | | Liberty Media Corp.-Liberty SiriusXM Class A* | | | 35,760 | |
| | 979 | | | Liberty Media Corp.-Liberty SiriusXM Class C* | | | 43,673 | |
| | 3,025 | | | News Corp. Class A | | | 40,444 | |
| | 442 | | | Omnicom Group, Inc. | | | 31,992 | |
| | 252 | | | ProSiebenSat.1 Media SE | | | 8,453 | |
| | 546 | | | Publicis Groupe SA | | | 36,846 | |
| | 641 | | | RTL Group* | | | 48,710 | |
| | 2,435 | | | Schibsted ASA Class A | | | 59,165 | |
| | 2,599 | | | Schibsted ASA Class B | | | 59,545 | |
| | 374 | | | Scripps Networks Interactive, Inc. Class A | | | 32,033 | |
| | 738 | | | Shaw Communications, Inc. Class B | | | 16,465 | |
| | 3,053 | | | Sirius XM Holdings, Inc.(a) | | | 17,555 | |
| | 177 | | | Telenet Group Holding NV* | | | 11,988 | |
| | 536 | | | The Interpublic Group of Cos., Inc. | | | 10,795 | |
| | 1,445 | | | The Walt Disney Co. | | | 146,234 | |
| | 984 | | | Time Warner, Inc. | | | 99,482 | |
| | 306 | | | Toho Co. Ltd. | | | 11,375 | |
| | 696 | | | Twenty-First Century Fox, Inc. Class A | | | 19,203 | |
| | 337 | | | Twenty-First Century Fox, Inc. Class B | | | 9,133 | |
| | 1,223 | | | Viacom, Inc. Class B | | | 34,978 | |
| | 418 | | | Vivendi SA | | | 9,589 | |
| | 1,755 | | | WPP PLC | | | 32,006 | |
| | | | | | | | |
| | | | | | | 1,317,372 | |
| | |
| Metals & Mining – 0.3% | | | |
| | 14,505 | | | Alumina Ltd. | | | 24,497 | |
| | 5,057 | | | Anglo American PLC | | | 92,050 | |
| | 834 | | | Antofagasta PLC | | | 11,181 | |
| | 1,209 | | | ArcelorMittal* | | | 32,213 | |
| | 1,528 | | | Barrick Gold Corp. | | | 27,519 | |
| | 2,563 | | | BHP Billiton Ltd. | | | 55,794 | |
| | 1,688 | | | BHP Billiton PLC | | | 32,135 | |
| | 5,206 | | | BlueScope Steel Ltd. | | | 45,061 | |
| | 933 | | | Boliden AB | | | 32,652 | |
| | 10,919 | | | Fortescue Metals Group Ltd. | | | 52,537 | |
| | 5,095 | | | Freeport-McMoRan, Inc.* | | | 75,304 | |
| | 34,921 | | | Glencore PLC* | | | 162,748 | |
| | 670 | | | Hitachi Metals Ltd. | | | 8,951 | |
| | 741 | | | JFE Holdings, Inc. | | | 14,612 | |
| | 4,175 | | | Kinross Gold Corp.* | | | 19,024 | |
| | 526 | | | Maruichi Steel Tube Ltd. | | | 15,569 | |
| | |
| Common Stocks – (continued) | |
| Metals & Mining – (continued) | | | |
| | 496 | | | Mitsubishi Materials Corp. | | | 17,826 | |
| | 1,655 | | | Newcrest Mining Ltd. | | | 30,336 | |
| | 2,096 | | | Newmont Mining Corp. | | | 80,361 | |
| | 1,182 | | | Nippon Steel & Sumitomo Metal Corp. | | | 28,218 | |
| | 1,377 | | | Norsk Hydro ASA | | | 9,942 | |
| | 155 | | | Nucor Corp. | | | 8,542 | |
| | 497 | | | Rio Tinto Ltd. | | | 26,945 | |
| | 1,442 | | | Rio Tinto PLC | | | 70,040 | |
| | 37,524 | | | South32 Ltd. | | | 87,802 | |
| | 1,093 | | | Steel Dynamics, Inc. | | | 37,654 | |
| | 2,227 | | | Teck Resources Ltd. Class B | | | 55,427 | |
| | 285 | | | voestalpine AG | | | 14,790 | |
| | | | | | | | |
| | | | | | | 1,169,730 | |
| | |
| Mortgage Real Estate Investment Trusts (REITs) – 0.0% | | | |
| | 3,606 | | | AGNC Investment Corp. | | | 77,673 | |
| | 5,679 | | | Annaly Capital Management, Inc. | | | 70,988 | |
| | | | | | | | |
| | | | | | | 148,661 | |
| | |
| Multi-Utilities – 0.2% | | | |
| | 2,168 | | | AGL Energy Ltd. | | | 41,432 | |
| | 586 | | | Ameren Corp. | | | 35,154 | |
| | 413 | | | Atco Ltd. Class I | | | 15,217 | |
| | 362 | | | Canadian Utilities Ltd. Class A | | | 11,283 | |
| | 1,546 | | | CenterPoint Energy, Inc. | | | 45,793 | |
| | 16,088 | | | Centrica PLC | | | 41,582 | |
| | 626 | | | CMS Energy Corp. | | | 30,386 | |
| | 550 | | | Consolidated Edison, Inc. | | | 46,348 | |
| | 719 | | | Dominion Energy, Inc. | | | 56,636 | |
| | 397 | | | DTE Energy Co. | | | 44,591 | |
| | 3,343 | | | E.ON SE | | | 37,834 | |
| | 806 | | | Engie SA | | | 13,459 | |
| | 272 | | | Innogy SE(b) | | | 11,998 | |
| | 2,482 | | | National Grid PLC | | | 31,283 | |
| | 615 | | | NiSource, Inc. | | | 16,525 | |
| | 476 | | | Public Service Enterprise Group, Inc. | | | 22,296 | |
| | 2,581 | | | RWE AG* | | | 64,456 | |
| | 428 | | | SCANA Corp. | | | 25,843 | |
| | 265 | | | Sempra Energy | | | 31,251 | |
| | 500 | | | Suez | | | 9,486 | |
| | 510 | | | Veolia Environnement SA | | | 11,957 | |
| | 477 | | | WEC Energy Group, Inc. | | | 31,110 | |
| | | | | | | | |
| | | | | | | 675,920 | |
| | |
| Multiline Retail – 0.2% | | | |
| | 67 | | | Canadian Tire Corp. Ltd. Class A | | | 7,930 | |
| | 1,169 | | | Dollar General Corp. | | | 84,823 | |
| | 498 | | | Dollar Tree, Inc.* | | | 39,661 | |
| | 1,284 | | | Dollarama, Inc. | | | 126,544 | |
| | 3,516 | | | Harvey Norman Holdings Ltd. | | | 11,425 | |
| | 2,783 | | | Kohl’s Corp. | | | 110,708 | |
| | 3,746 | | | Macy’s, Inc. | | | 77,804 | |
| | 20,560 | | | Marks & Spencer Group PLC | | | 85,123 | |
| | 1,854 | | | Next PLC | | | 99,084 | |
| | 2,324 | | | Nordstrom, Inc.(a) | | | 103,697 | |
| | 381 | | | Ryohin Keikaku Co. Ltd. | | | 105,822 | |
| | |
| | |
| 18 | | The accompanying notes are an integral part of these financial statements. |
GOLDMAN SACHS GLOBAL MANAGED BETA FUND
| | | | | | | | |
Shares | | | Description | | Value | |
| Common Stocks – (continued) | |
| Multiline Retail – (continued) | | | |
| | 1,380 | | | Takashimaya Co. Ltd. | | $ | 12,664 | |
| | 2,071 | | | Target Corp. | | | 112,932 | |
| | | | | | | | |
| | | | | | | 978,217 | |
| | |
| Oil, Gas & Consumable Fuels – 0.5% | | | |
| | 947 | | | Andeavor | | | 94,842 | |
| | 13,484 | | | BP PLC | | | 77,889 | |
| | 1,573 | | | Caltex Australia Ltd. | | | 41,833 | |
| | 3,149 | | | Cameco Corp. | | | 31,572 | |
| | 6,161 | | | Cenovus Energy, Inc. | | | 48,203 | |
| | 1,831 | | | Chevron Corp. | | | 197,052 | |
| | 446 | | | ConocoPhillips | | | 19,472 | |
| | 480 | | | Enagas SA | | | 14,159 | |
| | 623 | | | Enbridge, Inc. | | | 24,905 | |
| | 1,144 | | | Eni SpA | | | 17,968 | |
| | 187 | | | EOG Resources, Inc. | | | 15,893 | |
| | 3,620 | | | Exxon Mobil Corp. | | | 276,315 | |
| | 802 | | | Galp Energia SGPS SA | | | 13,286 | |
| | 2,681 | | | HollyFrontier Corp. | | | 83,942 | |
| | 4,399 | | | Husky Energy, Inc.* | | | 51,467 | |
| | 1,635 | | | Idemitsu Kosan Co. Ltd. | | | 39,937 | |
| | 1,547 | | | Imperial Oil Ltd. | | | 45,664 | |
| | 594 | | | Inter Pipeline Ltd. | | | 10,879 | |
| | 7,964 | | | JXTG Holdings, Inc. | | | 38,573 | |
| | 646 | | | Kinder Morgan, Inc. | | | 12,487 | |
| | 3,067 | | | Marathon Oil Corp. | | | 34,105 | |
| | 1,007 | | | Marathon Petroleum Corp. | | | 52,817 | |
| | 2,958 | | | Murphy Oil Corp. | | | 67,028 | |
| | 349 | | | Occidental Petroleum Corp. | | | 20,835 | |
| | 1,091 | | | OMV AG | | | 62,765 | |
| | 268 | | | ONEOK, Inc. | | | 14,515 | |
| | 4,769 | | | Origin Energy Ltd.* | | | 29,111 | |
| | 418 | | | Pembina Pipeline Corp. | | | 13,473 | |
| | 367 | | | Phillips 66 | | | 30,758 | |
| | 5,459 | | | Repsol SA | | | 93,932 | |
| | 4,305 | | | Royal Dutch Shell PLC Class A | | | 118,641 | |
| | 3,846 | | | Royal Dutch Shell PLC Class B | | | 107,344 | |
| | 5,100 | | | Santos Ltd.* | | | 15,355 | |
| | 2,441 | | | Showa Shell Sekiyu K.K. | | | 26,775 | |
| | 3,898 | | | Snam SpA | | | 18,992 | |
| | 1,123 | | | Statoil ASA | | | 21,251 | |
| | 629 | | | Suncor Energy, Inc. | | | 19,710 | |
| | 1,137 | | | The Williams Cos., Inc. | | | 33,803 | |
| | 1,411 | | | TOTAL SA | | | 73,213 | |
| | 688 | | | TransCanada Corp. | | | 34,936 | |
| | 2,659 | | | Valero Energy Corp. | | | 181,078 | |
| | 1,548 | | | Veresen, Inc. | | | 21,805 | |
| | 490 | | | Woodside Petroleum Ltd. | | | 11,276 | |
| | | | | | | | |
| | | | | | | 2,259,856 | |
| | |
| Paper & Forest Products – 0.0% | | | |
| | 1,303 | | | Mondi PLC | | | 35,604 | |
| | 4,753 | | | Oji Holdings Corp. | | | 24,952 | |
| | 3,139 | | | Stora Enso Oyj Class R | | | 41,261 | |
| | 3,253 | | | UPM-Kymmene Oyj | | | 84,678 | |
| | 514 | | | West Fraser Timber Co. Ltd. | | | 26,668 | |
| | | | | | | | |
| | | | | | | 213,163 | |
| | |
| Common Stocks – (continued) | |
| Personal Products – 0.3% | | | |
| | 808 | | | Beiersdorf AG | | | 86,347 | |
| | 1,476 | | | Kao Corp. | | | 92,273 | |
| | 998 | | | Kose Corp. | | | 125,398 | |
| | 652 | | | L’Oreal SA | | | 137,742 | |
| | 3,148 | | | Pola Orbis Holdings, Inc. | | | 101,070 | |
| | 2,986 | | | Shiseido Co. Ltd. | | | 123,720 | |
| | 1,541 | | | The Estee Lauder Cos., Inc. Class A | | | 164,871 | |
| | 2,021 | | | Unilever NV | | | 120,319 | |
| | 2,727 | | | Unilever PLC | | | 159,106 | |
| | | | | | | | |
| | | | | | | 1,110,846 | |
| | |
| Pharmaceuticals – 0.7% | | | |
| | 98 | | | Allergan PLC | | | 22,489 | |
| | 4,261 | | | Astellas Pharma, Inc. | | | 53,822 | |
| | 952 | | | AstraZeneca PLC | | | 55,814 | |
| | 1,397 | | | Bayer AG | | | 179,059 | |
| | 2,189 | | | Bristol-Myers Squibb Co. | | | 132,391 | |
| | 737 | | | Daiichi Sankyo Co. Ltd. | | | 17,446 | |
| | 1,448 | | | Eli Lilly & Co. | | | 117,708 | |
| | 7,225 | | | GlaxoSmithKline PLC | | | 143,342 | |
| | 139 | | | H. Lundbeck A/S | | | 8,870 | |
| | 813 | | | Ipsen SA | | | 109,372 | |
| | 174 | | | Jazz Pharmaceuticals PLC* | | | 25,989 | |
| | 3,307 | | | Johnson & Johnson | | | 437,748 | |
| | 3,026 | | | Mallinckrodt PLC* | | | 124,308 | |
| | 2,460 | | | Merck & Co., Inc. | | | 157,096 | |
| | 459 | | | Merck KGaA | | | 50,462 | |
| | 1,084 | | | Mitsubishi Tanabe Pharma Corp. | | | 26,739 | |
| | 4,578 | | | Mylan NV* | | | 144,115 | |
| | 1,128 | | | Novartis AG | | | 95,098 | |
| | 1,869 | | | Novo Nordisk A/S Class B | | | 89,058 | |
| | 1,654 | | | Orion Oyj Class B | | | 78,312 | |
| | 456 | | | Otsuka Holdings Co. Ltd. | | | 18,381 | |
| | 1,089 | | | Perrigo Co. PLC | | | 85,987 | |
| | 5,423 | | | Pfizer, Inc. | | | 183,948 | |
| | 793 | | | Recordati SpA | | | 34,011 | |
| | 723 | | | Roche Holding AG | | | 183,693 | |
| | 867 | | | Sanofi | | | 84,533 | |
| | 1,686 | | | Sumitomo Dainippon Pharma Co. Ltd. | | | 23,015 | |
| | 152 | | | Taisho Pharmaceutical Holdings Co. Ltd. | | | 11,901 | |
| | 642 | | | Takeda Pharmaceutical Co. Ltd. | | | 35,602 | |
| | 811 | | | Taro Pharmaceutical Industries Ltd.*(a) | | | 85,025 | |
| | 7,696 | | | Teva Pharmaceutical Industries Ltd. ADR | | | 122,059 | |
| | 3,255 | | | Valeant Pharmaceuticals International, Inc.* | | | 43,765 | |
| | 1,294 | | | Zoetis, Inc. | | | 81,134 | |
| | | | | | | | |
| | | | | | | 3,062,292 | |
| | |
| Professional Services – 0.2% | | | |
| | 657 | | | Adecco Group AG | | | 47,621 | |
| | 512 | | | Bureau Veritas SA | | | 12,172 | |
| | 5,699 | | | Capita PLC | | | 47,829 | |
| | 109 | | | Equifax, Inc. | | | 15,529 | |
| | 1,741 | | | Experian PLC | | | 35,008 | |
| | 519 | | | IHS Markit Ltd.* | | | 24,310 | |
| | 323 | | | Intertek Group PLC | | | 21,372 | |
| | |
| | |
| The accompanying notes are an integral part of these financial statements. | | 19 |
GOLDMAN SACHS GLOBAL MANAGED BETA FUND
Schedule of Investments (continued)
August 31, 2017
| | | | | | | | |
Shares | | | Description | | Value | |
| Common Stocks – (continued) | |
| Professional Services – (continued) | | | |
| | 798 | | | ManpowerGroup, Inc. | | $ | 88,985 | |
| | 329 | | | Nielsen Holdings PLC | | | 12,782 | |
| | 862 | | | Randstad Holding NV | | | 50,398 | |
| | 7,647 | | | Recruit Holdings Co. Ltd. | | | 152,401 | |
| | 1,573 | | | RELX NV | | | 33,033 | |
| | 2,132 | | | RELX PLC | | | 46,619 | |
| | 2,578 | | | Robert Half International, Inc. | | | 116,783 | |
| | 591 | | | SEEK Ltd. | | | 7,883 | |
| | 41 | | | SGS SA | | | 91,517 | |
| | 190 | | | Verisk Analytics, Inc.* | | | 15,399 | |
| | 1,240 | | | Wolters Kluwer NV | | | 54,173 | |
| | | | | | | | |
| | | | | | | 873,814 | |
| | |
| Real Estate Management & Development – 0.2% | | | |
| | 155 | | | Azrieli Group Ltd. | | | 8,941 | |
| | 11,727 | | | CapitaLand Ltd. | | | 32,772 | |
| | 1,192 | | | CBRE Group, Inc. Class A* | | | 43,007 | |
| | 6,299 | | | Cheung Kong Property Holdings Ltd. | | | 55,430 | |
| | 1,459 | | | City Developments Ltd. | | | 12,627 | |
| | 258 | | | Daito Trust Construction Co. Ltd. | | | 45,715 | |
| | 460 | | | Daiwa House Industry Co. Ltd. | | | 16,087 | |
| | 182 | | | Deutsche Wohnen SE | | | 7,735 | |
| | 792 | | | First Capital Realty, Inc. | | | 12,869 | |
| | 6,630 | | | Global Logistic Properties Ltd. | | | 15,856 | |
| | 5,214 | | | Hang Lung Group Ltd. | | | 19,672 | |
| | 5,502 | | | Hang Lung Properties Ltd. | | | 13,415 | |
| | 1,368 | | | Henderson Land Development Co. Ltd. | | | 8,497 | |
| | 2,422 | | | Hongkong Land Holdings Ltd. | | | 17,970 | |
| | 882 | | | Jones Lang LaSalle, Inc. | | | 107,525 | |
| | 10,491 | | | Kerry Properties Ltd. | | | 41,643 | |
| | 2,061 | | | LendLease Group | | | 27,242 | |
| | 25,527 | | | New World Development Co. Ltd. | | | 34,937 | |
| | 5,154 | | | Sino Land Co. Ltd. | | | 8,929 | |
| | 2,026 | | | Sun Hung Kai Properties Ltd. | | | 33,859 | |
| | 1,435 | | | Swire Pacific Ltd. Class A | | | 14,615 | |
| | 4,709 | | | Swire Properties Ltd. | | | 16,339 | |
| | 155 | | | Swiss Prime Site AG* | | | 14,024 | |
| | 3,680 | | | The Wharf Holdings Ltd. | | | 35,106 | |
| | 4,344 | | | Tokyu Fudosan Holdings Corp. | | | 25,920 | |
| | 1,468 | | | UOL Group Ltd. | | | 8,870 | |
| | 341 | | | Vonovia SE | | | 14,424 | |
| | 8,975 | | | Wheelock & Co. Ltd. | | | 67,245 | |
| | | | | | | | |
| | | | | | | 761,271 | |
| | |
| Road & Rail – 0.1% | | | |
| | 29 | | | AMERCO | | | 10,823 | |
| | 7,423 | | | Aurizon Holdings Ltd. | | | 29,240 | |
| | 699 | | | Canadian National Railway Co. | | | 56,659 | |
| | 241 | | | Central Japan Railway Co. | | | 40,863 | |
| | 1,040 | | | CSX Corp. | | | 52,208 | |
| | 196 | | | DSV A/S | | | 13,913 | |
| | 173 | | | East Japan Railway Co. | | | 15,882 | |
| | 319 | | | Hankyu Hanshin Holdings, Inc. | | | 12,165 | |
| | 290 | | | J.B. Hunt Transport Services, Inc. | | | 28,678 | |
| | 148 | | | Kansas City Southern | | | 15,308 | |
| | 2,587 | | | Keikyu Corp. | | | 27,500 | |
| | |
| Common Stocks – (continued) | |
| Road & Rail – (continued) | | | |
| | 1,113 | | | Keio Corp. | | | 9,262 | |
| | 280 | | | Keisei Electric Railway Co. Ltd. | | | 7,634 | |
| | 3,600 | | | Kintetsu Group Holdings Co. Ltd. | | | 13,604 | |
| | 340 | | | Kyushu Railway Co. | | | 10,650 | |
| | 5,493 | | | MTR Corp. Ltd. | | | 32,151 | |
| | 2,395 | | | Nagoya Railroad Co. Ltd. | | | 10,726 | |
| | 8,968 | | | Nippon Express Co. Ltd. | | | 61,889 | |
| | 355 | | | Norfolk Southern Corp. | | | 42,785 | |
| | 2,305 | | | Tobu Railway Co. Ltd. | | | 12,756 | |
| | 807 | | | Union Pacific Corp. | | | 84,977 | |
| | 306 | | | West Japan Railway Co. | | | 22,256 | |
| | | | | | | | |
| | | | | | | 611,929 | |
| | |
| Semiconductors & Semiconductor Equipment – 0.4% | | | |
| | 4,004 | | | Advanced Micro Devices, Inc.* | | | 52,052 | |
| | 966 | | | Analog Devices, Inc. | | | 80,825 | |
| | 3,501 | | | Applied Materials, Inc. | | | 157,965 | |
| | 1,620 | | | ASM Pacific Technology Ltd. | | | 20,077 | |
| | 505 | | | ASML Holding NV | | | 78,843 | |
| | 445 | | | Broadcom Ltd. | | | 112,171 | |
| | 43 | | | Disco Corp. | | | 7,720 | |
| | 1,082 | | | Infineon Technologies AG | | | 24,988 | |
| | 9,185 | | | Intel Corp. | | | 322,118 | |
| | 668 | | | KLA-Tencor Corp. | | | 62,585 | |
| | 607 | | | Lam Research Corp. | | | 100,750 | |
| | 1,382 | | | Marvell Technology Group Ltd. | | | 24,752 | |
| | 389 | | | Maxim Integrated Products, Inc. | | | 18,151 | |
| | 512 | | | Microchip Technology, Inc. | | | 44,442 | |
| | 960 | | | Micron Technology, Inc.* | | | 30,691 | |
| | 1,054 | | | NVIDIA Corp. | | | 178,590 | |
| | 122 | | | NXP Semiconductors NV* | | | 13,781 | |
| | 892 | | | Qorvo, Inc.* | | | 65,312 | |
| | 580 | | | QUALCOMM, Inc. | | | 30,317 | |
| | 162 | | | Rohm Co. Ltd. | | | 12,613 | |
| | 607 | | | Skyworks Solutions, Inc. | | | 63,953 | |
| | 1,216 | | | STMicroelectronics NV | | | 21,149 | |
| | 2,550 | | | Texas Instruments, Inc. | | | 211,191 | |
| | 374 | | | Tokyo Electron Ltd. | | | 52,674 | |
| | 488 | | | Xilinx, Inc. | | | 32,237 | |
| | | | | | | | |
| | | | | | | 1,819,947 | |
| | |
| Software – 0.8% | | | |
| | 1,263 | | | Activision Blizzard, Inc. | | | 82,802 | |
| | 904 | | | Adobe Systems, Inc.* | | | 140,265 | |
| | 296 | | | ANSYS, Inc.* | | | 38,131 | |
| | 507 | | | Autodesk, Inc.* | | | 58,031 | |
| | 1,785 | | | CA, Inc. | | | 59,226 | |
| | 4,523 | | | Cadence Design Systems, Inc.* | | | 177,709 | |
| | 750 | | | CDK Global, Inc. | | | 48,375 | |
| | 221 | | | Check Point Software Technologies Ltd.* | | | 24,723 | |
| | 1,323 | | | Citrix Systems, Inc.* | | | 103,472 | |
| | 253 | | | Constellation Software, Inc. | | | 140,679 | |
| | 258 | | | Dassault Systemes SE | | | 25,413 | |
| | 2,323 | | | Dell Technologies, Inc. Class V* | | | 174,062 | |
| | 820 | | | Electronic Arts, Inc.* | | | 99,630 | |
| | 826 | | | Fortinet, Inc.* | | | 31,553 | |
| | |
| | |
| 20 | | The accompanying notes are an integral part of these financial statements. |
GOLDMAN SACHS GLOBAL MANAGED BETA FUND
| | | | | | | | |
Shares | | | Description | | Value | |
| Common Stocks – (continued) | |
| Software – (continued) | | | |
| | 1,112 | | | Gemalto NV | | $ | 60,129 | |
| | 1,251 | | | Intuit, Inc. | | | 176,954 | |
| | 141 | | | Konami Holdings Corp. | | | 7,352 | |
| | 975 | | | LINE Corp.* | | | 34,463 | |
| | 10,824 | | | Microsoft Corp. | | | 809,311 | |
| | 306 | | | Nexon Co. Ltd.* | | | 7,646 | |
| | 137 | | | Nice Ltd. | | | 10,745 | |
| | 74 | | | Nintendo Co. Ltd. | | | 24,681 | |
| | 6,060 | | | Nuance Communications, Inc.* | | | 97,384 | |
| | 4,412 | | | Oracle Corp. | | | 233,831 | |
| | 749 | | | Red Hat, Inc.* | | | 80,518 | |
| | 652 | | | salesforce.com, Inc.* | | | 62,260 | |
| | 934 | | | SAP SE | | | 98,025 | |
| | 746 | | | ServiceNow, Inc.* | | | 86,678 | |
| | 670 | | | Splunk, Inc.* | | | 44,950 | |
| | 499 | | | SS&C Technologies Holdings, Inc. | | | 19,316 | |
| | 1,726 | | | Symantec Corp. | | | 51,746 | |
| | 1,327 | | | Synopsys, Inc.* | | | 106,717 | |
| | 10,272 | | | The Sage Group PLC | | | 92,004 | |
| | 533 | | | VMware, Inc. Class A*(a) | | | 57,617 | |
| | | | | | | | |
| | | | | | | 3,366,398 | |
| | |
| Specialty Retail – 0.6% | | | |
| | 280 | | | ABC-Mart, Inc. | | | 14,407 | |
| | 350 | | | Advance Auto Parts, Inc. | | | 34,265 | |
| | 864 | | | AutoNation, Inc.* | | | 39,200 | |
| | 165 | | | AutoZone, Inc.* | | | 87,193 | |
| | 4,275 | | | Bed Bath & Beyond, Inc. | | | 117,947 | |
| | 3,170 | | | Best Buy Co., Inc. | | | 172,004 | |
| | 3,606 | | | Dick’s Sporting Goods, Inc. | | | 95,054 | |
| | 5,130 | | | Dixons Carphone PLC | | | 11,520 | |
| | 85 | | | Dufry AG* | | | 13,107 | |
| | 170 | | | Fast Retailing Co. Ltd. | | | 48,625 | |
| | 2,876 | | | Foot Locker, Inc. | | | 101,322 | |
| | 5,325 | | | Hennes & Mauritz AB Class B | | | 134,938 | |
| | 684 | | | Hikari Tsushin, Inc. | | | 84,757 | |
| | 2,795 | | | Industria de Diseno Textil SA | | | 106,317 | |
| | 16,408 | | | Kingfisher PLC | | | 63,401 | |
| | 2,243 | | | L Brands, Inc. | | | 81,241 | |
| | 1,876 | | | Lowe’s Cos., Inc. | | | 138,618 | |
| | 723 | | | Nitori Holdings Co. Ltd. | | | 111,741 | |
| | 439 | | | O’Reilly Automotive, Inc.* | | | 86,101 | |
| | 2,138 | | | Ross Stores, Inc. | | | 124,966 | |
| | 143 | | | Shimamura Co. Ltd. | | | 17,471 | |
| | 903 | | | Signet Jewelers Ltd.(a) | | | 56,952 | |
| | 13,806 | | | Staples, Inc. | | | 141,028 | |
| | 5,394 | | | The Gap, Inc. | | | 127,406 | |
| | 2,223 | | | The Home Depot, Inc. | | | 333,161 | |
| | 2,008 | | | The TJX Cos., Inc. | | | 145,178 | |
| | 769 | | | Tiffany & Co. | | | 70,287 | |
| | 1,621 | | | Tractor Supply Co. | | | 96,466 | |
| | 344 | | | Ulta Salon, Cosmetics & Fragrance, Inc.* | | | 76,027 | |
| | 951 | | | USS Co. Ltd. | | | 18,705 | |
| | 6,591 | | | Yamada Denki Co. Ltd. | | | 35,688 | |
| | | | | | | | |
| | | | | | | 2,785,093 | |
| | |
| Common Stocks – (continued) | |
| Technology Hardware, Storage & Peripherals – 0.4% | | | |
| | 8,708 | | | Apple, Inc. | | | 1,428,112 | |
| | 2,837 | | | Brother Industries Ltd. | | | 67,302 | |
| | 1,156 | | | Canon, Inc. | | | 40,520 | |
| | 1,078 | | | FUJIFILM Holdings Corp. | | | 42,412 | |
| | 1,358 | | | Hewlett Packard Enterprise Co. | | | 24,525 | �� |
| | 3,269 | | | HP, Inc. | | | 62,373 | |
| | 6,164 | | | Konica Minolta, Inc. | | | 49,194 | |
| | 692 | | | NetApp, Inc. | | | 26,753 | |
| | 504 | | | Seagate Technology PLC | | | 15,891 | |
| | 547 | | | Seiko Epson Corp. | | | 14,037 | |
| | 732 | | | Western Digital Corp. | | | 64,614 | |
| | 2,123 | | | Xerox Corp. | | | 68,509 | |
| | | | | | | | |
| | | | | | | 1,904,242 | |
| | |
| Textiles, Apparel & Luxury Goods – 0.5% | | | |
| | 860 | | | adidas AG | | | 193,150 | |
| | 1,656 | | | Asics Corp. | | | 24,971 | |
| | 6,327 | | | Burberry Group PLC | | | 147,073 | |
| | 399 | | | Cie Financiere Richemont SA | | | 35,668 | |
| | 2,656 | | | Coach, Inc. | | | 110,755 | |
| | 308 | | | Hermes International | | | 162,922 | |
| | 1,398 | | | HUGO BOSS AG | | | 118,528 | |
| | 100 | | | Kering | | | 37,513 | |
| | 17,142 | | | Li & Fung Ltd. | | | 7,743 | |
| | 1,797 | | | Lululemon Athletica, Inc.* | | | 103,417 | |
| | 1,882 | | | Luxottica Group SpA | | | 108,470 | |
| | 496 | | | LVMH Moet Hennessy Louis Vuitton SE | | | 130,284 | |
| | 3,401 | | | Michael Kors Holdings Ltd.* | | | 143,590 | |
| | 2,613 | | | NIKE, Inc. Class B | | | 137,993 | |
| | 257 | | | Pandora A/S | | | 27,339 | |
| | 623 | | | PVH Corp. | | | 78,430 | |
| | 1,563 | | | Ralph Lauren Corp. | | | 137,372 | |
| | 205 | | | The Swatch Group AG | | | 25,876 | |
| | 3,776 | | | Under Armour, Inc. Class A*(a) | | | 60,982 | |
| | 4,763 | | | Under Armour, Inc. Class C*(a) | | | 71,921 | |
| | 1,895 | | | VF Corp. | | | 119,139 | |
| | | | | | | | |
| | | | | | | 1,983,136 | |
| | |
| Thrifts & Mortgage Finance – 0.0% | | | |
| | 838 | | | New York Community Bancorp, Inc. | | | 10,098 | |
| | |
| Tobacco – 0.1% | | | |
| | 2,185 | | | Altria Group, Inc. | | | 138,529 | |
| | 2,003 | | | British American Tobacco PLC | | | 124,957 | |
| | 1,089 | | | Imperial Brands PLC | | | 45,050 | |
| | 552 | | | Japan Tobacco, Inc. | | | 18,909 | |
| | 2,339 | | | Philip Morris International, Inc. | | | 273,499 | |
| | 1,233 | | | Swedish Match AB | | | 43,992 | |
| | | | | | | | |
| | | | | | | 644,936 | |
| | |
| Trading Companies & Distributors – 0.2% | | | |
| | 180 | | | AerCap Holdings NV* | | | 9,054 | |
| | 190 | | | Brenntag AG | | | 10,084 | |
| | 478 | | | Bunzl PLC | | | 14,287 | |
| | 2,442 | | | Fastenal Co. | | | 104,200 | |
| | 1,602 | | | Ferguson PLC | | | 95,400 | |
| | |
| | |
| The accompanying notes are an integral part of these financial statements. | | 21 |
GOLDMAN SACHS GLOBAL MANAGED BETA FUND
Schedule of Investments (continued)
August 31, 2017
| | | | | | | | |
Shares | | | Description | | Value | |
| Common Stocks – (continued) | |
| Trading Companies & Distributors – (continued) | | | |
| | 1,285 | | | Finning International, Inc. | | $ | 29,399 | |
| | 856 | | | HD Supply Holdings, Inc.* | | | 28,505 | |
| | 3,060 | | | Itochu Corp. | | | 49,969 | |
| | 5,278 | | | Marubeni Corp. | | | 34,347 | |
| | 1,836 | | | MISUMI Group, Inc. | | | 47,159 | |
| | 2,607 | | | Mitsubishi Corp. | | | 60,314 | |
| | 4,376 | | | Mitsui & Co. Ltd. | | | 65,493 | |
| | 2,680 | | | Rexel SA | | | 40,062 | |
| | 4,238 | | | Sumitomo Corp. | | | 60,030 | |
| | 1,167 | | | Toyota Tsusho Corp. | | | 35,910 | |
| | 399 | | | Travis Perkins PLC | | | 7,765 | |
| | 381 | | | United Rentals, Inc.* | | | 44,981 | |
| | 739 | | | W.W. Grainger, Inc. | | | 120,139 | |
| | | | | | | | |
| | | | | | | 857,098 | |
| | |
| Transportation Infrastructure – 0.0% | | | |
| | 805 | | | Abertis Infraestructuras SA | | | 16,293 | |
| | 189 | | | Aena SA(b) | | | 36,970 | |
| | 153 | | | Aeroports de Paris | | | 27,285 | |
| | 580 | | | Atlantia SpA | | | 18,675 | |
| | 179 | | | Fraport AG Frankfurt Airport Services Worldwide | | | 17,680 | |
| | 1,389 | | | Kamigumi Co. Ltd. | | | 15,380 | |
| | 267 | | | Macquarie Infrastructure Corp. | | | 19,886 | |
| | 1,339 | | | Sydney Airport | | | 7,887 | |
| | 1,496 | | | Transurban Group | | | 14,502 | |
| | | | | | | | |
| | | | | | | 174,558 | |
| | |
| Water Utilities – 0.0% | | | |
| | 334 | | | American Water Works Co., Inc. | | | 27,021 | |
| | 588 | | | Severn Trent PLC | | | 17,249 | |
| | 1,441 | | | United Utilities Group PLC | | | 16,949 | |
| | | | | | | | |
| | | | | | | 61,219 | |
| | |
| Wireless Telecommunication Services – 0.1% | | | |
| | 1,077 | | | KDDI Corp. | | | 29,056 | |
| | 824 | | | NTT DOCOMO, Inc. | | | 19,115 | |
| | 413 | | | Rogers Communications, Inc. Class B | | | 21,560 | |
| | 810 | | | SoftBank Group Corp. | | | 65,943 | |
| | 1,735 | | | Sprint Corp.* | | | 14,314 | |
| | 16,649 | | | StarHub Ltd. | | | 32,058 | |
| | 814 | | | T-Mobile US, Inc.* | | | 52,674 | |
| | 652 | | | Tele2 AB Class B | | | 7,593 | |
| | 23,877 | | | Vodafone Group PLC | | | 68,329 | |
| | | | | | | | |
| | | | | | | 310,642 | |
| | |
| | TOTAL COMMON STOCKS | | | | |
| | (Cost $69,712,595) | | $ | 76,100,289 | |
| | |
Shares | | | Rate | | Value | |
| Preferred Stocks – 0.0% | |
| Automobiles – 0.0% | | | |
| | Volkswagen AG | |
| | 61 | | | 2.151% | | $ | 9,114 | |
| | (Cost $9,397) | | | | |
| | |
| Chemicals – 0.0% | | | |
| | FUCHS PETROLUB SE | |
| | 1,468 | | | 2.183 | | | 81,729 | |
| | (Cost $67,460) | | | | |
| | |
| | TOTAL PREFERRED STOCKS | | | | |
| | (Cost $76,857) | | $ | 90,843 | |
| | |
| | | | | | | | |
| Units | | | Expiration
Date | | Value | |
| Right* – 0.0% | |
| | Getinge AB | |
| | 2,645 | | | 09/14/17 | | | 979 | |
| | (Cost $0) | | | | |
| | |
| | | | | | | | |
| Shares | | | Description | | Value | |
| Exchange Traded Funds – 68.4% | |
| | 1,544,563 | | | iShares Core MSCI Emerging Markets ETF | | | 83,421,848 | |
| | 1,075,562 | | | iShares MSCI EAFE ETF | | | 71,955,098 | |
| | 478,865 | | | iShares MSCI EAFE Small-Cap ETF | | | 28,846,827 | |
| | 520,539 | | | Vanguard S&P 500 ETF | | | 118,318,515 | |
| | |
| | TOTAL EXCHANGE TRADED FUNDS | | | | |
| | (Cost $254,946,116) | | $ | 302,542,288 | |
| | |
| | | | | | | | |
| Shares | | | Distribution Rate | | Value | |
| Investment Company(c) – 7.7% | |
| Goldman Sachs Financial Square Government Fund –
Institutional Shares |
|
| | 33,972,216 | | | 0.927% | | $ | 33,972,216 | |
| | (Cost $33,972,216) | | | | |
| | |
| TOTAL INVESTMENTS BEFORE SECURITIES
LENDING REINVESTMENT VEHICLE | | | | |
| | (Cost $358,707,784) | | $ | 412,706,615 | |
| | |
| | | | | | | | |
| Securities Lending Reinvestment Vehicle(c) – 0.2% | |
| Goldman Sachs Financial Square Government Fund –
Institutional Shares |
|
| | 635,996 | | | 0.927% | | | 635,996 | |
| | (Cost $635,996) | | | | |
| | |
| | TOTAL INVESTMENTS – 93.5% | | | | |
| | (Cost $359,343,780) | | $ | 413,342,611 | |
| | |
| OTHER ASSETS IN EXCESS OF
LIABILITIES – 6.5% | | | 28,727,956 | |
| | |
| | NET ASSETS – 100.0% | | $ | 442,070,567 | |
| | |
| | |
| 22 | | The accompanying notes are an integral part of these financial statements. |
GOLDMAN SACHS GLOBAL MANAGED BETA FUND
| | |
| The percentage shown for each investment category reflects the value of investments in that category as a percentage of net assets. |
* | | Non-income producing security. |
(a) | | All or a portion of security is on loan. |
(b) | | Exempt from registration under Rule 144A of the Securities Act of 1933. Such securities may be deemed liquid by the investment adviser and may be resold, normally to qualified institutional buyers in transactions exempt from registration. Total market value of Rule 144A securities amounts to $525,832, which represents approximately 0.1% of net assets as of August 31, 2017. |
(c) | | Represents an Affiliated fund. |
| | |
|
Currency Legend |
AUD | | —Australian Dollar |
CAD | | —Canadian Dollar |
CHF | | —Swiss Franc |
DKK | | —Danish Krone |
EUR | | —Euro |
GBP | | —British Pound |
HKD | | —Hong Kong Dollar |
ILS | | —Israeli Shekel |
JPY | | —Japanese Yen |
NOK | | —Norwegian Krone |
NZD | | —New Zealand Dollar |
SEK | | —Swedish Krona |
SGD | | —Singapore Dollar |
USD | | —U.S. Dollar |
| | |
Investment Abbreviations: |
ADR | | —American Depositary Receipt |
ETF | | —Exchange Traded Fund |
PLC | | —Public Limited Company |
REIT | | —Real Estate Investment Trust |
|
| | |
| The accompanying notes are an integral part of these financial statements. | | 23 |
GOLDMAN SACHS GLOBAL MANAGED BETA FUND
Schedule of Investments (continued)
August 31, 2017
|
| ADDITIONAL INVESTMENT INFORMATION |
FORWARD FOREIGN CURRENCY EXCHANGE CONTRACTS WITH UNREALIZED GAIN
| | | | | | | | | | | | | | | | | | | | | | | | |
| Counterparty | | Currency Purchased | | | Currency Sold | | | Current Value | | | Settlement Date | | | Unrealized Gain | |
Morgan Stanley & Co. International PLC | | AUD | | | 2,410,000 | | | USD | | | 1,824,216 | | | $ | 1,915,371 | | | | 09/20/17 | | | $ | 91,155 | |
| | CHF | | | 2,580,000 | | | USD | | | 2,661,204 | | | | 2,694,004 | | | | 09/20/17 | | | | 32,800 | |
| | DKK | | | 2,940,000 | | | USD | | | 443,057 | | | | 471,127 | | | | 09/20/17 | | | | 28,070 | |
| | EUR | | | 7,650,000 | | | USD | | | 8,568,467 | | | | 9,116,696 | | | | 09/20/17 | | | | 548,229 | |
| | GBP | | | 3,775,000 | | | USD | | | 4,831,853 | | | | 4,884,837 | | | | 09/20/17 | | | | 52,984 | |
| | JPY | | | 675,000,000 | | | USD | | | 6,112,110 | | | | 6,145,686 | | | | 09/20/17 | | | | 33,577 | |
| | NOK | | | 1,450,000 | | | USD | | | 170,681 | | | | 186,989 | | | | 09/20/17 | | | | 16,309 | |
| | SEK | | | 7,650,000 | | | USD | | | 878,959 | | | | 963,868 | | | | 09/20/17 | | | | 84,910 | |
| | SGD | | | 470,000 | | | USD | | | 340,203 | | | | 346,661 | | | | 09/20/17 | | | | 6,459 | |
| | USD | | | 15,996,885 | | | GBP | | | 12,340,000 | | | | 15,967,917 | | | | 09/20/17 | | | | 28,968 | |
| | USD | | | 2,854,038 | | | HKD | | | 22,190,000 | | | | 2,837,175 | | | | 09/20/17 | | | | 16,863 | |
| | USD | | | 226,629 | | | ILS | | | 800,000 | | | | 223,376 | | | | 09/20/17 | | | | 3,253 | |
| | USD | | | 20,726,239 | | | JPY | | | 2,274,000,000 | | | | 20,704,135 | | | | 09/20/17 | | | | 22,104 | |
| | | USD | | | 143,621 | | | NZD | | | 200,000 | | | | 143,546 | | | | 09/20/17 | | | | 75 | |
| TOTAL | | | | | | | | | | | $ | 965,756 | |
| | |
| 24 | | The accompanying notes are an integral part of these financial statements. |
GOLDMAN SACHS GLOBAL MANAGED BETA FUND
|
| ADDITIONAL INVESTMENT INFORMATION (continued) |
FORWARD FOREIGN CURRENCY EXCHANGE CONTRACTS WITH UNREALIZED LOSS
| | | | | | | | | | | | | | | | | | | | | | | | |
| Counterparty | | Currency Purchased | | | Currency Sold | | | Current Value | | | Settlement Date | | | Unrealized Loss | |
Morgan Stanley & Co. International PLC | | HKD | | | 6,630,000 | | | USD | | | 851,871 | | | $ | 847,700 | | | | 09/20/17 | | | $ | (4,170 | ) |
| | ILS | | | 240,000 | | | USD | | | 68,269 | | | | 67,013 | | | | 09/20/17 | | | | (1,256 | ) |
| | NZD | | | 60,000 | | | USD | | | 43,185 | | | | 43,064 | | | | 09/20/17 | | | | (121 | ) |
| | USD | | | 6,113,362 | | | AUD | | | 8,110,000 | | | | 6,445,502 | | | | 09/20/17 | | | | (332,140 | ) |
| | USD | | | 230,455 | | | CAD | | | 290,780 | | | | 232,866 | | | | 09/05/17 | | | | (2,411 | ) |
| | USD | | | 1,843,925 | | | CAD | | | 2,480,000 | | | | 1,986,394 | | | | 09/20/17 | | | | (142,470 | ) |
| | USD | | | 8,015,618 | | | CHF | | | 7,690,000 | | | | 8,029,804 | | | | 09/20/17 | | | | (14,185 | ) |
| | USD | | | 1,571,652 | | | DKK | | | 10,340,000 | | | | 1,656,955 | | | | 09/20/17 | | | | (85,303 | ) |
| | USD | | | 28,710,161 | | | EUR | | | 25,420,000 | | | | 30,293,649 | | | | 09/20/17 | | | | (1,583,488 | ) |
| | USD | | | 548,375 | | | NOK | | | 4,650,000 | | | | 599,656 | | | | 09/20/17 | | | | (51,281 | ) |
| | USD | | | 2,598,362 | | | SEK | | | 22,500,000 | | | | 2,834,907 | | | | 09/20/17 | | | | (236,545 | ) |
| | | USD | | | 1,137,495 | | | SGD | | | 1,570,000 | | | | 1,157,996 | | | | 09/20/17 | | | | (20,502 | ) |
| TOTAL | | | | | | | | | | | $ | (2,473,872 | ) |
FUTURES CONTRACTS — At August 31, 2017, the Fund had the following futures contracts:
| | | | | | | | | | | | | | |
| Description | | Number of Contracts | | | Expiration Date | | Notional Amount | | | Unrealized Appreciation/ (Depreciation) | |
Long position contracts: | |
| | | | |
Russell 2000 Mini Index | | | 621 | | | 09/15/17 | | $ | 43,606,620 | | | $ | (564,576 | ) |
S&P Toronto Stock Exchange 60 Index | | | 74 | | | 09/14/17 | | | 10,560,000 | | | | (183,526 | ) |
| TOTAL | | | $ | (748,102 | ) |
| | |
| The accompanying notes are an integral part of these financial statements. | | 25 |
GOLDMAN SACHS GLOBAL MANAGED BETA FUND
Schedule of Investments (continued)
August 31, 2017
|
| ADDITIONAL INVESTMENT INFORMATION (continued) |
PURCHASED OPTIONS CONTRACTS — For the fiscal ended August 31, 2017 the Fund had the following purchased options:
OPTIONS ON FUTURES CONTRACTS
| | | | | | | | | | | | | | | | | | | | | | | | | | | | | | |
| Description | | Counterparty | | Exercise
Price | | | Expiration
Date | | | Number of
Contracts | | | Notional Amount | | | Market Value | | | Premiums
Paid (Received)
by Fund | | | Unrealized
Appreciation/
(Depreciation) | |
Purchased Options Contracts: | |
Calls: | |
Eurodollar Futures | | Credit Suisse International (London) | | | 98.00 USD | | | | 09/18/17 | | | USD | 1,709 | | | $ | 4,272,500 | | | $ | 2,894,619 | | | $ | 2,655,098 | | | $ | 239,521 | |
Eurodollar Futures | | Credit Suisse International (London) | | | 97.00 USD | | | | 12/18/17 | | | USD | 1,221 | | | | 3,052,500 | | | | 4,838,212 | | | | 4,406,858 | | | | 431,354 | |
Eurodollar Futures | | Credit Suisse International (London) | | | 97.88 USD | | | | 12/18/17 | | | USD | 1,517 | | | | 3,792,500 | | | | 2,692,675 | | | | 2,298,342 | | | | 394,333 | |
Eurodollar Futures | | Credit Suisse International (London) | | | 97.75 USD | | | | 03/19/18 | | | USD | 440 | | | | 1,100,000 | | | | 869,000 | | | | 595,016 | | | | 273,984 | |
Eurodollar Futures | | Credit Suisse International (London) | | | 98.38 USD | | | | 03/19/18 | | | USD | 71 | | | | 177,500 | | | | 33,725 | | | | 116,722 | | | | (82,997 | ) |
Eurodollar Futures | | Credit Suisse International (London) | | | 98.25 USD | | | | 06/18/18 | | | USD | 33 | | | | 82,500 | | | | 22,688 | | | | 31,426 | | | | (8,738 | ) |
Eurodollar Futures | | Credit Suisse International (London) | | | 98.38 USD | | | | 06/18/18 | | | USD | 99 | | | | 247,500 | | | | 45,787 | | | | 178,261 | | | | (132,474 | ) |
Eurodollar Futures | | Credit Suisse International (London) | | | 98.13 USD | | | | 09/17/18 | | | USD | 80 | | | | 200,000 | | | | 73,000 | | | | 89,185 | | | | (16,185 | ) |
Eurodollar Futures | | Credit Suisse International (London) | | | 98.25 USD | | | | 09/17/18 | | | USD | 112 | | | | 280,000 | | | | 75,600 | | | | 229,174 | | | | (153,574 | ) |
Eurodollar Futures | | Credit Suisse International (London) | | | 98.00 USD | | | | 12/17/18 | | | USD | 104 | | | | 260,000 | | | | 112,450 | | | | 130,240 | | | | (17,790 | ) |
Eurodollar Futures | | Credit Suisse International (London) | | | 98.13 USD | | | | 12/17/18 | | | USD | 120 | | | | 300,000 | | | | 102,000 | | | | 266,792 | | | | (164,792 | ) |
Eurodollar Futures | | Credit Suisse International (London) | | | 99.00 USD | | | | 12/17/18 | | | USD | 3,240 | | | | 8,100,000 | | | | 202,500 | | | | 250,484, | | | | (47,984 | ) |
Eurodollar Futures | | Credit Suisse International (London) | | | 97.88 USD | | | | 03/18/19 | | | USD | 99 | | | | 247,500 | | | | 131,794 | | | | 143,779 | | | | (11,985 | ) |
Eurodollar Futures | | Credit Suisse International (London) | | | 98.00 USD | | | | 03/18/19 | | | USD | 141 | | | | 352,500 | | | | 154,219 | | | | 296,584 | | | | (142,365 | ) |
Eurodollar Futures | | Credit Suisse International (London) | | | 99.00 USD | | | | 03/18/19 | | | USD | 1,873 | | | | 4,682,500 | | | | 175,594 | | | | 191,627 | | | | (16,033 | ) |
Eurodollar Futures | | Credit Suisse International (London) | | | 97.75 USD | | | | 06/17/19 | | | USD | 166 | | | | 415,000 | | | | 261,450 | | | | 357,870 | | | | (96,420 | ) |
Eurodollar Futures | | Credit Suisse International (London) | | | 99.00 USD | | | | 06/17/19 | | | USD | 614 | | | | 1,535,000 | | | | 76,750 | | | | 78,168 | | | | (1,418 | ) |
| Total Calls | | | | | | | | | 11,639 | | | $ | 29,097,500 | | | $ | 12,762,063 | | | $ | 12,315,626 | | | $ | 446,437 | |
Puts: | | | | | | | | | | | | | | | | | | | | | | | | | | | | |
Eurodollar Futures | | Credit Suisse International (London) | | | 100.00 USD | | | | 03/16/20 | | | USD | 1,221 | | | $ | 3,052,500 | | | $ | 5,555,550 | | | $ | 7,377,298 | | | $ | (1,821,748 | ) |
| Total purchased options contracts | | | | | | | | 12,860 | | | $ | 32,150,000 | | | $ | 18,317,613 | | | $ | 19,692,924 | | | $ | (1,375,311 | ) |
| | |
| 26 | | The accompanying notes are an integral part of these financial statements. |
GOLDMAN SACHS GLOBAL MANAGED BETA FUND
Statement of Assets and Liabilities
August 31, 2017
| | | | | | |
| | | | | | |
| | Assets: | | | | |
| | Investments of unaffiliated issuers, at value (cost $324,735,568)(a) | | $ | 378,734,399 | |
| | Investments of affiliated issuers, at value (cost $33,972,216) | | | 33,972,216 | |
| | Investments in securities lending reinvestment vehicle — affiliated issuer, at value (cost $635,996) | | | 635,996 | |
| | Cash | | | 6,870,954 | |
| | Foreign currencies, at value (cost $260,575) | | | 264,696 | |
| | Purchased options, at value (proceeds received $19,692,924) | | | 18,317,613 | |
| | Unrealized gain on forward foreign currency exchange contracts | | | 965,756 | |
| | Variation margin on certain derivative contracts | | | 452,520 | |
| | Receivables: | | | | |
| | Collateral on certain derivative contracts(b) | | | 5,621,002 | |
| | Investments sold | | | 2,091,921 | |
| | Dividends | | | 171,289 | |
| | Fund shares sold | | | 100,000 | |
| | Foreign tax reclaims | | | 23,292 | |
| | Reimbursement from investment adviser | | | 4,562 | |
| | Securities lending income | | | 804 | |
| | Other assets | | | 472 | |
| | Total assets | | | 448,227,492 | |
| | | | | | |
| | Liabilities: | | | | |
| | Unrealized loss on forward foreign currency exchange contracts | | | 2,473,872 | |
| | Payables: | | | | |
| | Investments purchased | | | 2,901,638 | |
| | Payable upon return of securities loaned | | | 635,996 | |
| | Transfer Agency fees | | | 7,429 | |
| | Accrued expenses | | | 137,990 | |
| | Total liabilities | | | 6,156,925 | |
| | | | | | |
| | Net Assets: | | | | |
| | Paid-in capital | | | 377,644,700 | |
| | Undistributed net investment income | | | 3,167,595 | |
| | Accumulated net realized gain | | | 10,885,032 | |
| | Net unrealized gain | | | 50,373,240 | |
| | NET ASSETS | | $ | 442,070,567 | |
| | Shares Outstanding $0.001 par value (unlimited number of shares authorized): | | | 39,017,202 | |
| | Institutional | | | 11.33 | |
| | (a) | | Includes loaned securities having a market value of $620,617. |
| | (b) | | Includes amounts segregated for initial margin requirements and/or collateral on futures and forward foreign currency exchange contracts transactions of $2,801,002 and $2,820,000, respectively. |
| | |
| The accompanying notes are an integral part of these financial statements. | | 27 |
GOLDMAN SACHS GLOBAL MANAGED BETA FUND
Statements of Operations
| | | | | | | | | | |
| | | | | For the Period
November 1, 2016 –
August 31, 2017(a) | | | For the Fiscal
Year ended
October 31, 2016 | |
| | Investment income: | | | | |
| | Dividends — unaffiliated issuers (net of foreign withholding taxes of $54,602) | | $ | 5,982,986 | | | $ | 2,893,889 | |
| | Dividends — affiliated issuers | | | 166,779 | | | | 29,238 | |
| | Interest — unaffiliated issuers | | | 14,243 | | | | — | |
| | Securities lending income — affiliated issuer | | | 11,308 | | | | — | |
| | Total investment income | | | 6,175,316 | | | | 2,923,127 | |
| | | | | | | | | | |
| | Expenses: | | | | |
| | Management fees | | | 1,021,334 | | | | 424,841 | |
| | Professional fees | | | 100,928 | | | | 87,876 | |
| | Custody, accounting and administrative services | | | 130,434 | | | | 55,703 | |
| | Transfer Agency fees | | | 68,089 | | | | 28,323 | |
| | Printing and mailing costs | | | 49,217 | | | | 28,234 | |
| | Registration fees | | | 23,318 | | | | 28,330 | |
| | Trustee fees | | | 14,948 | | | | 21,625 | |
| | Other | | | 19,716 | | | | 2,064 | |
| | Total expenses | | | 1,427,984 | | | | 676,996 | |
| | Less — expense reductions | | | (1,063,057 | ) | | | (443,298 | ) |
| | Net expenses | | | 364,927 | | | | 233,698 | |
| | NET INVESTMENT INCOME | | | 5,810,389 | | | | 2,689,429 | |
| | | | | | | | | | |
| | Realized and unrealized gain (loss): | | | | |
| | Net realized gain (loss) from: | | | | | | | | |
| | Investments — unaffiliated issuers | | | 9,331,147 | | | | (2,431,261 | ) |
| | Purchased options | | | (1,105,972 | ) | | | (127,833 | ) |
| | Futures contracts | | | 3,795,290 | | | | 1,927,543 | |
| | Forward foreign currency exchange contracts | | | 235,645 | | | | (555,197 | ) |
| | Foreign currency transactions | | | (27,451 | ) | | | (1,649 | ) |
| | Net change in unrealized gain (loss) on: | | | | | | | | |
| | Investments — unaffiliated issuers | | | 48,481,984 | | | | 3,365,327 | |
| | Purchased options | | | (1,012,533 | ) | | | (467,036 | ) |
| | Futures contracts | | | (109,438 | ) | | | (1,035,352 | ) |
| | Forward foreign currency exchange contracts | | | (2,784,820 | ) | | | 1,130,821 | |
| | Foreign currency translation | | | 7,626 | | | | (1,688 | ) |
| | Net realized and unrealized gain | | | 56,811,478 | | | | 1,803,675 | |
| | NET INCREASE IN NET ASSETS RESULTING FROM OPERATIONS | | $ | 62,621,867 | | | $ | 4,493,104 | |
| | (a) | | The Fund changed its fiscal year end from October 31 to August 31. |
| | |
| 28 | | The accompanying notes are an integral part of these financial statements. |
GOLDMAN SACHS GLOBAL MANAGED BETA FUND
Statements of Changes in Net Assets
| | | | | | | | | | | | | | |
| | | | | For the Period November 1, 2016 – August 31, 2017* | | | For the Fiscal Year Ended October 31, 2016 | | | For the Period Ended October 31, 2015(a) | |
| | From operations: | | | | | | | | | | | | |
| | Net investment income | | $ | 5,810,389 | | | $ | 2,689,429 | | | $ | 298,117 | |
| | Net realized gain (loss) | | | 12,228,659 | | | | (1,188,397 | ) | | | (16,536 | ) |
| | Net change in unrealized gain | | | 44,582,819 | | | | 2,992,072 | | | | 2,798,349 | |
| | Net increase in net assets resulting from operations | | | 62,621,867 | | | | 4,493,104 | | | | 3,079,930 | |
| | | | | | | | | | | | | | |
| | Distributions to shareholders: | | | | | | | | | | | | |
| | From net investment income | | | (3,930,110 | ) | | | (1,511,756 | ) | | | — | |
| | From net realized gains | | | — | | | | (327,168 | ) | | | — | |
| | Total distributions to shareholders | | | (3,930,110 | ) | | | (1,838,924 | ) | | | — | |
| | | | | | | | | | | | | | |
| | From share transactions: | | | | | | | | | | | | |
| | Proceeds from sales of shares | | | 410,869,272 | | | | 44,950,010 | | | | 136,000,015 | |
| | Reinvestment of distributions | | | 3,930,110 | | | | 1,838,924 | | | | — | |
| | Cost of shares redeemed | | | (175,666,473 | ) | | | (42,181,348 | ) | | | (2,095,810 | ) |
| | Net increase in net assets resulting from share transactions | | | 239,132,909 | | | | 4,607,586 | | | | 133,904,205 | |
| | TOTAL INCREASE | | | 297,824,666 | | | | 7,261,766 | | | | 136,984,135 | |
| | | | | | | | | | | | | | |
| | Net assets: | | | | | | | | | | | | |
| | Beginning of year | | | 144,245,901 | | | | 136,984,135 | | | | — | |
| | End of year | | $ | 442,070,567 | | | $ | 144,245,901 | | | $ | 136,984,135 | |
| | Undistributed net investment income | | $ | 3,167,595 | | | $ | 1,076,187 | | | $ | 455,975 | |
| | * | | The Fund changed its fiscal year end from October 31 to August 31. |
| | (a) | | Commenced operations April 30, 2015. |
| | |
| The accompanying notes are an integral part of these financial statements. | | 29 |
GOLDMAN SACHS GLOBAL MANAGED BETA FUND
Financial Highlights
Selected Data for a Share Outstanding Throughout Each Period
| | | | | | | | | | | | | | | | | | | | | | | | | | | | | | |
| | | | | | From
investment operations | | | Distributions
to shareholders | |
| | | Year - Share Class | | Net asset value, beginning of period | | | Net investment income(a) | | | Net realized and unrealized gain (loss) | | | Total from investment operations | | | From net investment income | | | From net realized gains | | | Total distributions | |
| | FOR THE PERIOD NOVEMBER 1, 2016 – AUGUST 31,* | |
| | 2017 - Institutional Shares | | $ | 9.84 | | | $ | 0.15 | | | $ | 1.54 | | | $ | 1.69 | | | $ | (0.20 | ) | | $ | — | | | $ | (0.20 | ) |
| | | | | | | | | | | | | | | | | | | | | | | | | | | | | | |
| | FOR THE FISCAL YEAR ENDED OCTOBER 31, | | | | | |
| | 2016 - Institutional Shares | | | 9.68 | | | | 0.18 | | | | 0.11 | | | | 0.29 | | | | (0.11 | ) | | | (0.02 | ) | | | (0.13 | ) |
| | | | | | | | | | | | | | | | | | | | | | | | | | | | | | |
| | FOR THE PERIOD ENDED OCTOBER 31, | | | | | |
| | 2015 - Institutional Shares (Commenced April 30, 2015) | | | 10.00 | | | | 0.05 | | | | (0.37 | ) | | | (0.32 | ) | | | — | | | | — | | | | — | |
| | * | | The Fund changed its fiscal year end from October 31 to August 31. |
| | (a) | | Calculated based on the average shares outstanding methodology. |
| | (b) | | Assumes investment at the NAV at the beginning of the period, reinvestment of all dividends and distributions, a complete redemption of the investment at the NAV at the end of the period and no sales or redemption charges. Total returns would be reduced if a sales or redemption charge was taken into account. Returns do not reflect the impact of taxes to shareholder relating to Fund distributions or the redemption of Fund shares. Total returns for periods less than one full year are not annualized. |
| | (c) | | Expense ratios exclude the expenses of the other investment companies and exchange traded funds in which the Fund invests. |
| | (d) | | The Fund’s portfolio turnover rate is calculated in accordance with regulatory requirements, without regard to transactions involving short term investments and certain derivatives. If such transactions were included, the Fund’s portfolio turnover rate may be higher. |
| | (f) | | Portfolio Turnover rounds to less than 0.5%. |
| | |
| 30 | | The accompanying notes are an integral part of these financial statements. |
GOLDMAN SACHS GLOBAL MANAGED BETA FUND
| | | | | | | | | | | | | | | | | | | | | | | | | | | | | | | | | | | | | | | | |
| | | | | | | | | | | | | |
| | | | | | | | | | | | | | | | | | | | | | | | | | | | | | | | | | |
| | | Net asset value, end of period | | | | | Total return(b) | | | | | Net assets, end of period (in 000s) | | | | | Ratio of net expenses to average net assets(c) | | | | | Ratio of total expenses to average net assets(c) | | | | | Ratio of net investment income to average net assets | | | | | Portfolio turnover rate(d) | |
| | | | | | | | | | | | | | | | | | | | | | | | | | | | | | | | | | | | | | | | |
| | $ | 11.33 | | | | | | 17.43 | % | | | | $ | 442,071 | | | | | | 0.10 | %(e) | | | | | 0.42 | %(e) | | | | | 1.71 | %(e) | | | | | 44 | % |
| | | | | | | | | | | | | | | | | | | | | | | | | | | | | | | | | | | | | | | | |
| | | | | | | | | | | | | | | | | | | | | | | | | | | | | | | | | | | | | | | | |
| | | 9.84 | | | | | | 3.08 | | | | | | 144,246 | | | | | | 0.17 | | | | | | 0.48 | | | | | | 1.90 | | | | | | 37 | |
| | | | | | | | | | | | | | | | | | | | | | | | | | | | | | | | | | | | | | | | |
| | | | | | | | | | | | | | | | | | | | | | | | | | | | | | | | | | | | | | | | |
| | | 9.68 | | | | | | (3.20 | ) | | | | | 136,984 | | | | | | 0.37 | (e) | | | | | 0.68 | (e) | | | | | 1.04 | (e) | | | | | — | (f) |
| | |
| The accompanying notes are an integral part of these financial statements. | | 31 |
GOLDMAN SACHS GLOBAL MANAGED BETA FUND
Notes to Financial Statements
August 31, 2017
Goldman Sachs Trust (the “Trust”) is a Delaware statutory trust registered under the Investment Company Act of 1940, as amended (the “Act”), as an open-end management investment company. Goldman Sachs Global Managed Beta Fund (the “Fund”) is a diversified fund that currently offers one class of shares — Institutional Shares. Effective August 25, 2017, the Fund changed its fiscal year end from October 31 to August 31. Goldman Sachs Asset Management, L.P. (“GSAM”), an affiliate of Goldman Sachs & Co. LLC (formerly, Goldman, Sachs & Co.) (“Goldman Sachs”), serves as investment adviser to the Fund pursuant to a management agreement (the “Agreement”) with the Trust.
|
| 2. SIGNIFICANT ACCOUNTING POLICIES |
The financial statements have been prepared in accordance with accounting principles generally accepted in the United States of America (“GAAP”) and require management to make estimates and assumptions that may affect the reported amounts and disclosures. Actual results may differ from those estimates and assumptions.
A. Investment Valuation — The Fund’s valuation policy is to value investments at fair value.
B. Investment Income and Investments — Investment income includes interest income, dividend income, and securities lending income. Interest income is accrued daily and adjusted for amortization of premiums and accretion of discounts. Dividend income is recognized on ex-dividend date or, for certain foreign securities, as soon as such information is obtained subsequent to the ex-dividend date. Investment transactions are reflected on trade date. Realized gains and losses are calculated using identified cost. Investment transactions are recorded on the following business day for daily net asset value (“NAV”) calculations. Investment income is recorded net of any foreign withholding taxes, less any amounts reclaimable. The Fund may file withholding tax reclaims in certain jurisdictions to recover a portion of amounts previously withheld. Any foreign capital gains tax is accrued daily based upon net unrealized gains, and is payable upon sale of such investments. Distributions received from the Fund’s investments in U.S. real estate investment trusts (“REITs”) may be characterized as ordinary income, net capital gain or a return of capital. A return of capital is recorded by the Fund as a reduction to the cost basis of the REIT.
For derivative contracts, realized gains and losses are recorded upon settlement of the contract.
C. Expenses — Expenses incurred directly by the Fund are charged to the Fund, and certain expenses incurred by the Trust that may not solely relate to the Fund are allocated to the Fund and the other applicable funds of the Trust on a straight-line and/or pro-rata basis, depending upon the nature of the expenses, and are accrued daily.
D. Federal Taxes and Distributions to Shareholders — It is the Fund’s policy to comply with the requirements of the Internal Revenue Code of 1986, as amended (the “Code”), applicable to regulated investment companies (mutual funds) and to distribute each year substantially all of its investment company taxable income and capital gains to its shareholders. Accordingly, the Fund is not required to make any provisions for the payment of federal income tax. Distributions to shareholders are recorded on the ex-dividend date. Income and capital gains distributions, if any, are declared and paid annually.
Net capital losses, if any, are carried forward to future fiscal years and may be used to the extent allowed by the Code to offset any future capital gains. Losses that are carried forward will retain their character as either short-term or long-term capital losses. Utilization of capital loss carryforwards will reduce the requirement of future capital gains distributions.
The characterization of distributions to shareholders for financial reporting purposes is determined in accordance with federal income tax rules, which may differ from GAAP. The source of the Fund’s distributions may be shown in the accompanying financial statements as either from net investment income, net realized gain or capital. Certain components of the Fund’s net assets on the Statement of Assets and Liabilities reflect permanent GAAP/tax differences based on the appropriate tax character.
E. Foreign Currency Translation — The accounting records and reporting currency of the Fund are maintained in U.S. dollars. Assets and liabilities denominated in foreign currencies are translated into U.S. dollars using the current exchange rates at the close of each business day. The effect of changes in foreign currency exchange rates on investments is included within net realized and unrealized gain (loss) on investments. Changes in the value of other assets and liabilities as a result of fluctuations in foreign
32
GOLDMAN SACHS GLOBAL MANAGED BETA FUND
|
| 2. SIGNIFICANT ACCOUNTING POLICIES (continued) |
exchange rates are included in the Statement of Operations within net change in unrealized gain (loss) on foreign currency translations. Transactions denominated in foreign currencies are translated into U.S. dollars on the date the transaction occurred, the effects of which are included within net realized gain (loss) on foreign currency transactions.
| | |
| 3. INVESTMENTS AND FAIR VALUE MEASUREMENTS |
U.S. GAAP defines the fair value of a financial instrument as the amount that would be received to sell an asset or paid to transfer a liability in an orderly transaction between market participants at the measurement date (i.e., the exit price); the Fund’s policy is to use the market approach. GAAP establishes a fair value hierarchy that prioritizes the inputs to valuation techniques used to measure fair value. The hierarchy gives the highest priority to unadjusted quoted prices in active markets for identical assets or liabilities (Level 1 measurements) and the lowest priority to unobservable inputs (Level 3 measurements). The levels used for classifying investments are not necessarily an indication of the risk associated with investing in these investments. The three levels of the fair value hierarchy are described below:
Level 1 — Unadjusted quoted prices in active markets that are accessible at the measurement date for identical, unrestricted assets or liabilities;
Level 2 — Quoted prices in markets that are not active or financial instruments for which significant inputs are observable (including, but not limited to, quoted prices for similar investments, interest rates, foreign exchange rates, volatility and credit spreads), either directly or indirectly;
Level 3 — Prices or valuations that require significant unobservable inputs (including GSAM’s assumptions in determining fair value measurement).
Changes in valuation techniques may result in transfers into or out of an assigned level within the hierarchy. In accordance with the Fund’s policy, transfers between different levels of the fair value hierarchy resulting from such changes are deemed to have occurred as of the beginning of the reporting period.
The Board of Trustees (“Trustees”) has approved Valuation Procedures that govern the valuation of the portfolio investments held by the Fund, including investments for which market quotations are not readily available. The Trustees have delegated to GSAM day-to-day responsibility for implementing and maintaining internal controls and procedures related to the valuation of the Fund’s investments. To assess the continuing appropriateness of pricing sources and methodologies, GSAM regularly performs price verification procedures and issues challenges as necessary to third party pricing vendors or brokers, and any differences are reviewed in accordance with the Valuation Procedures.
A. Level 1 and Level 2 Fair Value Investments — The valuation techniques and significant inputs used in determining the fair values for investments classified as Level 1 and Level 2 are as follows:
Equity Securities — Equity securities traded on a United States (“U.S.”) securities exchange or the NASDAQ system, or those located on certain foreign exchanges, including but not limited to the Americas, are valued daily at their last sale price or official closing price on the principal exchange or system on which they are traded. If there is no sale or official closing price or such price is believed by GSAM to not represent fair value, equity securities are valued at the last bid price for long positions and at the last ask price for short positions. To the extent these investments are actively traded, they are classified as Level 1 of the fair value hierarchy, otherwise they are generally classified as Level 2.
Unlisted equity securities for which market quotations are available are valued at the last sale price on the valuation date, or if no sale occurs, at the last bid price. Securities traded on certain foreign securities exchanges are valued daily at fair value determined by an independent fair value service (if available) under Valuation Procedures approved by the Trustees and consistent with applicable regulatory guidance. The independent fair value service takes into account multiple factors including, but not limited to, movements in the securities markets, certain depositary receipts, futures contracts and foreign currency exchange rates that have occurred subsequent to the close of the foreign securities exchange. These investments are generally classified as Level 2 of the fair value hierarchy.
33
GOLDMAN SACHS GLOBAL MANAGED BETA FUND
Notes to Financial Statements (continued)
August 31, 2017
|
| 3. INVESTMENTS AND FAIR VALUE MEASUREMENTS (continued) |
Underlying Funds (including Money Market Funds) — Underlying Funds (“Underlying Funds”) include other investment companies and exchange-traded funds (“ETFs”). Investments in the Underlying Funds (except ETFs) are valued at the NAV per share of the Institutional Share class on the day of valuation. ETFs are valued daily at the last sale price or official closing price on the principal exchange or system on which the investment is traded. Because the Fund invests in Underlying Funds that fluctuate in value, the Fund’s shares will correspondingly fluctuate in value. To the extent these investments are actively traded, they are classified as Level 1 of the fair value hierarchy, otherwise they are generally classified as Level 2. For information regarding an Underlying Fund’s accounting policies and investment holdings, please see the Underlying Fund’s shareholder report.
Derivative Contracts — A derivative is an instrument whose value is derived from underlying assets, indices, reference rates or a combination of these factors. The Fund enters into derivative transactions to hedge against changes in interest rates, securities prices, and/or currency exchange rates, to increase total return, or to gain access to certain markets or attain exposure to other underliers.
Exchange-traded derivatives, including futures and options contracts, are valued at the last sale or settlement price and typically fall within Level 1 of the fair value hierarchy. Over-the-counter (“OTC”) and centrally cleared derivatives are valued using market transactions and other market evidence, including market-based inputs to models, calibration to market-clearing transactions, broker or dealer quotations, or other alternative pricing sources. Where models are used, the selection of a particular model to value OTC and centrally cleared derivatives depends upon the contractual terms of, and specific risks inherent in, the instrument, as well as the availability of pricing information in the market. Valuation models require a variety of inputs, including contractual terms, market prices, yield curves, credit curves, measures of volatility, voluntary and involuntary prepayment rates, loss severity rates and correlations of such inputs. For OTC and centrally cleared derivatives that trade in liquid markets, model inputs can generally be verified and model selection does not involve significant management judgment. OTC and centrally cleared derivatives are classified within Level 2 of the fair value hierarchy when significant inputs are corroborated by market evidence.
i. Forward Contracts — A forward contract is a contract between two parties to buy or sell an asset at a specified price on a future date. A forward contract settlement can occur on a cash or delivery basis. Forward contracts are marked-to-market daily using independent vendor prices, and the change in value, if any, is recorded as an unrealized gain or loss. Cash and certain investments may be used to collateralize forward contracts.
A forward foreign currency exchange contract is a forward contract in which the Fund agrees to receive or deliver a fixed quantity of one currency for another, at a pre-determined price at a future date. All forward foreign currency exchange contracts are marked-to-market daily at the applicable forward rate. Non-deliverable forward foreign currency exchange contracts are settled with the counterparty in cash without the delivery of foreign currency.
ii. Futures Contracts — Futures contracts are contracts to buy or sell a standardized quantity of a specified commodity or security and are valued based on exchanged settlement prices or independent market quotes. Futures contracts are valued at the last settlement price, or in the absence of a sale, the last bid price for long positions and at the last ask price for short positions, at the end of each day on the board of trade or exchange upon which they are traded. Upon entering into a futures contract, the Fund deposits cash or securities in an account on behalf of the broker in an amount sufficient to meet the initial margin requirement. Subsequent payments are made or received by the Fund equal to the daily change in the contract value and are recorded as variation margin receivable or payable with a corresponding offset to unrealized gains or losses. For financial reporting purposes, cash collateral that has been pledged to cover obligations of the Fund and cash collateral received, if, any, is reported separately on the Statement of Assets and Liabilities as receivables/payables for collateral on certain derivative contracts. Non-cash collateral pledged by the Fund if any, is noted in the Schedule of Investments.
iii. Options — When the Fund writes call or put options, an amount equal to the premium received is recorded as a liability and is subsequently marked-to-market to reflect the current value of the option written. Swaptions are options on interest rate swap contracts.
Upon the purchase of a call option or a put option by the Fund, the premium paid is recorded as an investment and subsequently marked-to-market to reflect the current value of the option. Certain options may be purchased with premiums to be determined on a future date. The premiums for these options are based upon implied volatility parameters at specified terms.
34
GOLDMAN SACHS GLOBAL MANAGED BETA FUND
|
| 3. INVESTMENTS AND FAIR VALUE MEASUREMENTS (continued) |
B. Level 3 Fair Value Investments — To the extent that significant inputs to valuation models and other alternative pricing sources are unobservable, or if quotations are not readily available, or if GSAM believes that such quotations do not accurately reflect fair value, the fair value of the Fund’s investments may be determined under Valuation Procedures approved by the Trustees. GSAM, consistent with its procedures and applicable regulatory guidance, may make an adjustment to the most recent valuation prices of either domestic or foreign securities in light of significant events to reflect what it believes to be the fair value of the securities at the time of determining the Fund’s NAV. Significant events which could affect a large number of securities in a particular market may include, but are not limited to: significant fluctuations in U.S. or foreign markets; market dislocations; market disruptions; or unscheduled market closings. Significant events which could also affect a single issuer may include, but are not limited to: corporate actions such as reorganizations, mergers and buy-outs; ratings downgrades; and bankruptcies.
C. Fair Value Hierarchy — The following is a summary of the Fund’s investments and derivatives classified in the fair value hierarchy as of August 31, 2017:
| | | | | | | | | | | | |
|
| GLOBAL MANAGED BETA | |
| | | |
| Investment Type | | Level 1 | | | Level 2 | | | Level 3 | |
| Assets | | | | | | | | | | | | |
Common Stock and/or Other Equity Investments(a) | | | | | | | | | | | | |
Africa | | $ | — | | | $ | 100,874 | | | | $ — | |
Asia | | | 415,615 | | | | 9,402,957 | | | | — | |
Australia and Oceania | | | 16,778 | | | | 2,371,262 | | | | — | |
Europe | | | 1,166,649 | | | | 16,858,321 | | | | — | |
North America | | | 45,683,462 | | | | 117,767 | | | | — | |
South America | | | 46,266 | | | | 11,181 | | | | — | |
Rights | | | — | | | | 979 | | | | | |
Exchange Traded Funds | | | 302,542,288 | | | | — | | | | — | |
Investment Company | | | 33,972,216 | | | | — | | | | — | |
Securities Lending Reinvestment Vehicle | | | 635,996 | | | | — | | | | — | |
| Total | | $ | 384,479,270 | | | $ | 28,863,341 | | | $ | — | |
| | | |
| Derivative Type | | | | | | | | | |
| Assets | | | | | | | | | | | | |
Options Purchased | | $ | 18,317,613 | | | $ | — | | | $ | — | |
Forward Foreign Currency Exchange Contracts(b) | | | — | | | | 965,756 | | | | — | |
| Total | | $ | 18,317,613 | | | $ | 965,756 | | | $ | — | |
| Liabilities(b) | | | | | | | | | | | | |
Forward Foreign Currency Exchange Contracts | | $ | — | | | $ | (2,473,872 | ) | | $ | — | |
Futures Contracts | | | (748,102 | ) | | | — | | | | — | |
| Total | | $ | (748,102 | ) | | $ | (2,473,872 | ) | | $ | — | |
| (a) | | Amounts are disclosed by continent to highlight the impact of time zone differences between local market close and the calculation of net asset value. Security valuations are based on the principal exchange or system on which they are traded, which may differ from country of domicile noted in the table. The Fund utilizes fair value model prices provided by an independent fair value service for international equity securities, resulting in a Level 2 classification. |
| (b) | | Amount shown represents unrealized gain (loss) at period end. |
For further information regarding security characteristics, see the Schedule of Investments.
35
GOLDMAN SACHS GLOBAL MANAGED BETA FUND
Notes to Financial Statements (continued)
August 31, 2017
|
| 4. INVESTMENTS IN DERIVATIVES |
The following tables set forth, by certain risk types, the gross value of derivative contracts as of August 31, 2017. These instruments were used as part of the Fund’s investment strategies and to obtain and/or manage exposure related to the risks below. The values in the tables below exclude the effects of cash collateral received or posted pursuant to these derivative contracts, and therefore are not representative of the Fund’s net exposure.
| | | | | | | | | | | | |
| Risk | | Statement of Assets
and Liabilities | | Assets | | | Statement of Assets
and Liabilities | | Liabilities | |
Interest | | Purchased options, at value | | $ | 18,317,613 | | | — | | $ | — | |
Currency | | Receivable for unrealized gain on forward foreign currency exchange contracts | | | 965,756 | | | Payable for unrealized loss on forward foreign currency exchange contracts | | | (2,473,872) | |
Equity | | — | | | — | | | Variation margin on certain derivative contracts | | | (748,102) | (a) |
| Total | | | | $ | 19,283,369 | | | | | $ | (3,221,974) | |
| (a) | | Represents unrealized gain (loss) on futures contracts described in the Additional Investment Information sections of the Schedule of Investments. Only the current day’s variation margin is reported within the Statement of Assets and Liabilities. |
The following tables set forth, by certain risk types, the Fund’s gains (losses) related to these derivatives and their indicative volumes for the period ended August 31, 2017. These gains (losses) should be considered in the context that these derivative contracts may have been executed to create investment opportunities and/or economically hedge certain investments, and accordingly, certain gains (losses) on such derivative contracts may offset certain (losses) gains attributable to investments. These gains (losses) are included in “Net realized gain (loss)” or “Net change in unrealized gain (loss)” on the Statement of Operations:
| | | | | | | | | | | | |
| Risk | | Statement of Operations | | Net Realized Gain (Loss) | | | Net Change in Unrealized
Gain (Loss) | | Average Number of Contracts(a) | |
Interest | | Net realized gain (loss) from purchased options/Net unrealized gain (loss) on purchased options | | $ | (1,105,972) | | | $(1,012,533) | | | 19 | |
Currency | | Net realized gain (loss) from forward foreign currency exchange contracts/ Net unrealized gain (loss) on forward foreign currency exchange contracts | | | 235,645 | | | (2,784,820) | | | 40 | |
Equity | | Net unrealized gain (loss) on futures contracts/Net unrealized gain (loss) on futures contracts | | | 3,795,290 | | | (109,438) | | | 700 | |
| Total | | $ | 2,924,963 | | | $(3,906,791) | | | 759 | |
| (a) | | Average number of contracts is based on the average of month end balances for the period ended August 31, 2017. |
In order to better define its contractual rights and to secure rights that will help the Fund mitigate its counterparty risk, the Fund may enter into an International Swaps and Derivatives Association, Inc. Master Agreement (“ISDA Master Agreement”) or similar agreement with its derivatives counterparties. An ISDA Master Agreement is a bilateral agreement between the Fund and a counterparty that governs OTC derivatives (including forward foreign currency exchange contracts, and certain options and swaps), and typically contains, among other things, collateral posting terms and netting provisions in the event of a default and/or termination event. The provisions of the ISDA Master Agreement typically permit a single net payment in the event of a default (close-out netting) or similar event, including the bankruptcy or insolvency of the counterparty.
36
GOLDMAN SACHS GLOBAL MANAGED BETA FUND
|
| 4. INVESTMENTS IN DERIVATIVES (continued) |
Collateral and margin requirements differ between exchange traded derivatives and OTC derivatives. Margin requirements are established by the broker or clearing house for exchange-traded and centrally cleared derivatives (financial futures contracts, options and centrally cleared swaps) pursuant to governing agreements for those instrument types. Brokers can ask for margin in excess of the minimum in certain circumstances. Collateral terms are contract-specific for OTC derivatives. For derivatives traded under an ISDA Master Agreement, the collateral requirements are typically calculated by netting the marked to market amount for each transaction under such agreement and comparing that amount to the value of any collateral currently pledged by the Fund and the counterparty. Additionally, the Fund may be required to post initial margin to the counterparty, the terms of which would be outlined in the confirmation of the OTC transaction.
For financial reporting purposes, cash collateral that has been pledged to cover obligations of the Fund and cash collateral received from the counterparty, if any, is reported separately on the Statement of Assets and Liabilities as receivables/payables for collateral on certain derivative contracts. Non-cash collateral pledged by the Fund, if any, is noted in the Schedule of Investments. Generally, the amount of collateral due from or to a counterparty must exceed a minimum transfer amount threshold before a transfer is required to be made. To the extent amounts due to the Fund from its counterparties are not fully collateralized, contractually or otherwise, the Fund bears the risk of loss from counterparty nonperformance. The Fund attempts to mitigate counterparty risk by only entering into agreements with counterparties that the Investment Adviser believes to be of good standing and by monitoring the financial stability of those counterparties.
Additionally, the netting of assets and liabilities and the offsetting of collateral pledged or received are based on contractual netting/set-off provisions in the ISDA Master Agreement or similar agreements. However, in the event of a default or insolvency of a counterparty, a court could determine that such rights are not enforceable due to the restrictions or prohibitions against the right of setoff that may be imposed in accordance with a particular jurisdiction’s bankruptcy or insolvency laws.
|
| 5. AGREEMENTS AND AFFILIATED TRANSACTIONS |
A. Management Agreement — Under the Agreement, GSAM manages the Fund, subject to the general supervision of the Trustees.
As compensation for the services rendered pursuant to the Agreement, the assumption of the expenses related thereto and administration of the Fund’s business affairs, including providing facilities, GSAM is entitled to a management fee, accrued daily and paid monthly, equal to an annual percentage rate of 0.30% of the Fund’s average daily net assets.
GSAM has agreed to waive all management fees payable by the Fund, except those management fees it earns from the Fund’s investment of cash collateral received in connection with securities lending transactions in the Goldman Sachs Financial Square Government Fund (the “Government Money Market Fund”). This arrangement will remain in place through at least February 28, 2018 and prior to such date GSAM may not terminate this arrangement without the approval of the Trustees. For the period ended August 31, 2017, GSAM waived $1,021,334 in management fees.
B. Transfer Agency Agreement — Goldman Sachs also serves as the transfer agent of the Fund for a fee pursuant to the Transfer Agency Agreement. The fees charged for such transfer agency services are accrued daily and paid monthly at an annual rates of 0.02% of the average daily net assets of the Institutional Shares.
C. Other Expense Agreements and Affiliated Transactions — GSAM has agreed to limit certain “Other Expenses” of the Fund (excluding acquired fund fees and expenses, transfer agency fees and expenses, service fees and shareholder administration fees (as applicable), taxes, interest, brokerage fees, expenses of shareholder meetings, litigation and indemnification and extraordinary expenses) to the extent such expenses exceed, on an annual basis, a percentage rate of the average daily net assets of the Fund. Such Other Expense reimbursements, if any, are accrued daily and paid monthly. In addition, the Fund is not obligated to reimburse GSAM for prior fiscal year expense reimbursements, if any. The Other Expense limitations as an annual percentage rate of average daily net assets for the Fund are 0.204%. For the period ended August 31, 2017, the Fund did not have any other expense reimbursements from GSAM.
The Fund invests in Institutional Shares of the Government Money Market Fund, which is an affiliated Underlying Fund. GSAM has agreed to reduce or limit “Other Expenses” in an amount equal to the management fee it earns as an investment adviser
37
GOLDMAN SACHS GLOBAL MANAGED BETA FUND
Notes to Financial Statements (continued)
August 31, 2017
|
| 5. AGREEMENTS AND AFFILIATED TRANSACTIONS (continued) |
to any of the affiliated money market funds in which the Fund invests. For the period ended August 31, 2017, GSAM waived $41,723 of the Fund’s management fee.
These Other Expense limitations will remain in place through at least February 28, 2018, and prior to such date GSAM may not terminate the arrangements without the approval of the Trustees. In addition, the Fund has entered into certain offset arrangements with the transfer agent, which may result in a reduction of the Fund’s expenses and are received irrespective of the application of the “Other Expense” limitations described above.
D. Line of Credit Facility — As of August 31, 2017, the Fund participated in a $1,100,000,000 committed, unsecured revolving line of credit facility (the “facility”) together with other funds of the Trust and certain registered investment companies having management agreements with GSAM or its affiliates. This facility is to be used for temporary emergency purposes, or to allow for an orderly liquidation of securities to meet redemption requests. The interest rate on borrowings is based on the federal funds rate. The facility also requires a fee to be paid by the Fund based on the amount of the commitment that has not been utilized. For the period ended August 31, 2017, the Fund did not have any borrowings under the facility.
E. Other Transactions with Affiliates — The table below shows the transaction in and earnings from investments in the Underlying Fund for the period ended August 31, 2017:
| | | | | | | | | | | | | | | | | | | | | | | | |
| Underlying Funds | | Beginning
value as of
October 31, 2016 | | | Purchases at Cost | | | Proceeds from Sales | | | Ending
value as of
August 31, 2017 | | | Shares as of
August 31, 2017 | | | Dividend Income | |
Goldman Sachs Financial Square Government Fund | | $ | 18,075,352 | | | $ | 138,986,179 | | | $ | (123,089,315 | ) | | $ | 33,972,216 | | | | 33,972,216 | | | $ | 166,779 | |
|
| 6. PORTFOLIO SECURITIES TRANSACTIONS |
The cost of purchases and proceeds from sales and maturities of long-term securities for the period ended August 31, 2017, were $ 375,444,999 and $165,601,142 respectively.
The Fund may lend its securities through a securities lending agent, the Bank of New York Mellon (“BNYM”), to certain qualified borrowers. In accordance with the Fund’s securities lending procedures, the Fund receives cash collateral at least equal to the market value of the securities on loan. The market value of the loaned securities is determined at the close of business of the Fund, at its last sale price or official closing price on the principal exchange or system on which they are traded, and any additional required collateral is delivered to the Fund on the next business day. As with other extensions of credit, the Fund may experience delay in the recovery of their securities or incur a loss should the borrower of the securities breach its agreement with the Fund or become insolvent at a time when the collateral is insufficient to cover the cost of repurchasing securities on loan. Dividend income received from securities on loan may not be subject to withholding taxes and therefore withholding taxes paid may differ from the amounts listed in the Statement of Operations. Loans of securities are terminable at any time and as such 1) the remaining contractual maturities of the outstanding securities lending transactions are considered to be overnight and continuous and 2) the borrower, after notice, is required to return borrowed securities within the standard time period for settlement of securities transactions.
Effective December 31, 2016, the Global Managed Beta began lending its securities and investing the cash collateral received in connection with securities lending transactions in the Government Money Market Fund, an affiliated series of the Trust. The Government Money Market Fund is registered under the Act as an open end investment company, is subject to Rule 2a-7 under the Act, and is managed by GSAM, for which GSAM may receive a management fee of up to 0.205% on an annualized basis of the average daily net assets of the Government Money Market Fund.
38
GOLDMAN SACHS GLOBAL MANAGED BETA FUND
|
| 7. SECURITIES LENDING (continued) |
In the event of a default by a borrower with respect to any loan, BNYM may exercise any and all remedies provided under the applicable borrower agreement to make the Fund whole. These remedies include purchasing replacement securities by applying the collateral held from the defaulting broker against the purchase cost of the replacement securities. If BNYM is unable to purchase replacement securities, BNYM will indemnify the Fund by paying the Fund an amount equal to the market value of the securities loaned minus the value of the cash collateral received from the borrower for the loan, subject to an exclusion for any shortfalls resulting from a loss of value in such cash collateral due to reinvestment risk. The Fund’s loaned securities were all subject to enforceable Securities Lending Agreements and the value of the collateral was at least equal to the value of the cash received. The amounts of the Fund’s overnight and continuous agreements represent the gross amounts of recognized liabilities for securities lending transactions outstanding as of August 31, 2017 are disclosed as “Payable upon return of securities loaned” on the Statement of Assets and Liabilities.
Both the Fund and BNYM received compensation relating to the lending of the Fund’s securities. The amounts earned by the Fund for the period ended August 31, 2017, are reported under Investment Income on the Statement of Operations.
The table below details securities lending activity with affiliates of Goldman Sachs:
| | | | | | | | | | | | | | | | | | | | | | |
Beginning
value as of
October 31, 2016 | | | Purchases
at Cost | | | Proceeds
from Sales | | | Ending
value as of
August 31, 2017 | | | Shares as of
August 31, 2017 | | | Dividend
Income | |
| | — | | | $ | 175,736,866 | | | $ | 175,100,870 | | | $ | 635,996 | | | | 635,996 | | | $ | 11,308 | |
The tax character of distributions paid during the period ended August 31, 2017 was as follows:
| | | | |
Distribution paid from: | | | | |
Ordinary income | | $ | 3,930,110 | |
Net long-term capital gains | | | — | |
Total taxable distributions | | $ | 3,930,110 | |
The tax character of distributions paid during the fiscal year ended October 31, 2016 was as follows:
| | | | |
Distribution paid from: | | | | |
Ordinary income | | $ | 1,642,993 | |
Net long-term capital gains | | | 195,931 | |
Total taxable distributions | | $ | 1,838,924 | |
There were no distributions paid during the period ended October 31, 2015.
As of August 31, 2017, the components of accumulated earnings (losses) on a tax basis were as follows:
| | | | |
Undistributed ordinary income — net | | $ | 11,935,814 | |
Undistributed long-term capital gains | | | 1,107,140 | |
Total undistributed earnings | | $ | 13,042,954 | |
Capital loss carryforwards:(1)(2) | | | | |
Timing differences (Straddle Deferral) | | $ | (46,343 | ) |
Unrealized gains (losses) — net | | | 51,429,256 | |
Total accumulated earnings (losses) net | | $ | 64,425,867 | |
| (1) | | Expiration occurs on August 31 of the year indicated. |
| (2) | | The Fund utilized $113,474 of capital losses in the current fiscal year. |
39
GOLDMAN SACHS GLOBAL MANAGED BETA FUND
Notes to Financial Statements (continued)
August 31, 2017
|
| 8. TAX INFORMATION (continued) |
As of August 31, 2017, the Fund’s aggregate security unrealized gains and losses based on cost for U.S. federal income tax purposes were as follows:
| | | | |
Tax Cost | | $ | 358,287,764 | |
Gross unrealized gain | | | 57,084,282 | |
Gross unrealized loss | | | (5,655,026 | ) |
Net unrealized gains (losses) | | $ | 51,429,256 | |
The difference between GAAP-basis and tax basis unrealized gains (losses) is attributable primarily to wash sales and net mark to market gains (losses) on regulated futures and options contracts, net mark-to-market gain/loss on foreign currency contracts, and differences in the tax treatment of passive foreign investment company investments.
In order to present certain components of the Fund’s capital accounts on a tax-basis, certain reclassifications have been recorded to the Fund’s accounts. These reclassifications have no impact on the net asset value of the Fund and result primarily from differences in the tax treatment of foreign currency transactions, and passive foreign investment company investments.
| | |
Accumulated Net Realized Gain (Loss) | | Undistributed Net Investment Income (Loss) |
$(211,129) | | $211,129 |
GSAM has reviewed the Portfolios’ tax positions for all open tax years (the current and prior three years, as applicable) and has concluded that no provision for income tax is required in the Portfolios’ financial statements. Such open tax years remain subject to examination and adjustment by tax authorities.
Derivatives Risk — The Fund’s use of derivatives may result in loss. Derivative instruments, which may pose risks in addition to and greater than those associated with investing directly in securities, currencies or other instruments, may be illiquid or less liquid, volatile, difficult to price and leveraged so that small changes in the value of the underlying instruments may produce disproportionate losses to the Fund. Derivatives are also subject to counterparty risk, which is the risk that the other party in the transaction will not fulfill its contractual obligation. The use of derivatives is a highly specialized activity that involves investment techniques and risks different from those associated with investments in more traditional securities and instruments. Losses from derivatives can also result from a lack of correlation between changes in the value of derivative instruments and the portfolio assets (if any) being hedged.
Foreign and Emerging Countries Risk — Investing in foreign markets may involve special risks and considerations not typically associated with investing in the United States. Foreign securities may be subject to risk of loss because of more or less foreign government regulation, less public information and less economic, political and social stability in the countries in which the Fund invests. The imposition of exchange controls (including repatriation restrictions), confiscations, trade restrictions (including tariffs) and other government restrictions by the United States or other governments, or from problems in share registration, settlement or custody, may also result in losses. Foreign risk also involves the risk of negative foreign currency rate fluctuations, which may cause the value of securities denominated in such foreign currency (or other instruments through which the Fund has exposure to foreign currencies) to decline in value. Currency exchange rates may fluctuate significantly over short periods of time. To the extent that the Fund also invests in securities of issuers located in emerging markets, these risks may be more pronounced.
40
GOLDMAN SACHS GLOBAL MANAGED BETA FUND
|
| 9. OTHER RISKS (continued) |
Foreign Custody Risk — If the Fund invests in foreign securities, the Fund may hold such securities and cash with foreign banks, agents, and securities depositories appointed by the Fund’s custodian (each a “Foreign Custodian”). Some foreign custodians may be recently organized or new to the foreign custody business. In some countries, Foreign Custodians may be subject to little or no regulatory oversight over, or independent evaluation of, their operations. Further, the laws of certain countries may place limitations on the Fund’s ability to recover its assets if a Foreign Custodian enters bankruptcy.
Geographic Risk — If the Fund focuses its investments in securities of issuers located in a particular country or geographic region, the Fund may be subjected, to a greater extent than if its investments were less focused, to the risks of volatile economic cycles and/or conditions and developments that may be particular to that country or region, such as: adverse securities markets; adverse exchange rates; adverse social, political, regulatory, economic, business, environmental or other developments; or natural disasters.
Investments in Other Investment Companies — As a shareholder of another investment company, including an exchange-traded fund (“ETF”), the Fund will indirectly bear its proportionate share of any net management fees and other expenses paid by such other investment companies, in addition to the fees and expenses regularly borne by the Fund. ETFs are subject to risks that do not apply to conventional mutual funds, including but not limited to the following: (i) the market price of the ETF’s shares may trade at a premium or a discount to their NAV; and (ii) an active trading market for an ETF’s shares may not develop or be maintained.
Large Shareholder Transactions Risk — The Fund may experience adverse effects when certain large shareholders, such as other funds, institutional investors (including those trading by use of non-discretionary mathematical formulas), financial intermediaries (who may make investment decisions on behalf of underlying clients and/or include the Fund in their investment model), individuals, accounts and Goldman Sachs affiliates, purchase or redeem large amounts of shares of the Fund. Such large shareholder redemptions may cause the Fund to sell portfolio securities at times when it would not otherwise do so, which may negatively impact the Fund’s NAV and liquidity. These transactions may also accelerate the realization of taxable income to shareholders if such sales of investments resulted in gains, and may also increase transaction costs. In addition, a large redemption could result in the Fund’s current expenses being allocated over a smaller asset base, leading to an increase in the Fund’s expense ratio. Similarly, large Fund share purchases may adversely affect the Fund’s performance to the extent that the Fund is delayed in investing new cash and is required to maintain a larger cash position than it ordinarily would.
Market and Credit Risks — In the normal course of business, the Fund trades financial instruments and enters into financial transactions where risk of potential loss exists due to changes in the market (market risk). Additionally, the Fund may also be exposed to credit risk in the event that an issuer or guarantor fails to perform or that an institution or entity with which the Fund has unsettled or open transactions defaults.
Sector Risk — To the extent the Fund focuses its investments in securities of issuers in one or more sectors (such as the financial services or telecommunications sectors), the Fund may be subjected, to a greater extent than if its investments were diversified across different sectors, to the risks of volatile economic cycles and/or conditions and developments that may be particular to that sector, such as: adverse economic, business, political, environmental or other developments.
Under the Trust’s organizational documents, its Trustees, officers, employees and agents are indemnified, to the extent permitted by the Act and state law, against certain liabilities that may arise out of performance of their duties to the Fund. Additionally, in the course of business, the Fund enters into contracts that contain a variety of indemnification clauses. The Fund’s maximum exposure under these arrangements is unknown, as this would involve future claims that may be made against the Fund that have not yet occurred. However, GSAM believes the risk of loss under these arrangements to be remote.
41
GOLDMAN SACHS GLOBAL MANAGED BETA FUND
Notes to Financial Statements (continued)
August 31, 2017
Subsequent events after the Statement of Assets and Liabilities date have been evaluated and GSAM has concluded that there is no impact requiring adjustment or disclosure in the financial statements.
|
| 12. SUMMARY OF SHARE TRANSACTIONS |
Share activity is as follows:
| | | | | | | | | | | | | | | | | | | | | | | | |
| | | For the Period Ended
August 31, 2017(a) | | | For the Period Ended
October 31, 2016 | | | For the Period Ended
October 31, 2015(b) | |
| | | Shares | | | Dollars | | | Shares | | | Dollars | | | Shares | | | Dollars | |
| | | | |
| Institutional Shares | | | | | | | | | | | | | | | | | | | | | | | | |
Shares sold | | | 39,914,366 | | | | 410,869,272 | | | | 4,638,241 | | | | 44,950,010 | | | | 14,383,148 | | | | 136,000,015 | |
Reinvestment of distributions | | | 393,011 | | | | 3,930,110 | | | | 195,312 | | | | 1,838,924 | | | | — | | | | — | |
Shares redeemed | | | (15,947,066 | ) | | | (175,666,473 | ) | | | (4,329,302 | ) | | | (42,181,348 | ) | | | (230,508 | ) | | | (2,095,810 | ) |
NET INCREASE | | | 24,360,311 | | | $ | 239,132,909 | | | | 504,251 | | | $ | 4,607,586 | | | | 14,152,640 | | | $ | 133,904,205 | |
| (a) | | The Fund changed its fiscal year end from October 31 to August 31. |
| (b) | | Commenced operations April 30, 2015. |
42
Report of Independent Registered Public Accounting Firm
To the Board of Trustees of
Goldman Sachs Trust and Shareholders of the Goldman Sachs Global Managed Beta Fund:
In our opinion, the accompanying statement of assets and liabilities, including the schedule of investments, and the related statements of operations and of changes in net assets and the financial highlights present fairly, in all material respects, the financial position of the Goldman Sachs Global Managed Beta Fund (the “Fund”), a fund of the Goldman Sachs Trust, as of August 31, 2017, and the results of its operations for the periods November 1, 2016 to August 31, 2017 and November 1, 2015 to October 31, 2016, the changes in its net assets for the periods November 1, 2016 to August 31, 2017, November 1, 2015 to October 31, 2016, and April 30, 2015 (commencement of operations) to October 31, 2015 and the financial highlights for each of the periods presented therein, in conformity with accounting principles generally accepted in the United States of America. These financial statements and financial highlights (hereafter referred to as “financial statements”) are the responsibility of the Fund’s management. Our responsibility is to express an opinion on these financial statements based on our audits. We conducted our audits of these financial statements in accordance with the standards of the Public Company Accounting Oversight Board (United States). Those standards require that we plan and perform the audit to obtain reasonable assurance about whether the financial statements are free of material misstatement. An audit includes examining, on a test basis, evidence supporting the amounts and disclosures in the financial statements, assessing the accounting principles used and significant estimates made by management, and evaluating the overall financial statement presentation. We believe that our audits, which included confirmation of securities as of August 31, 2017 by correspondence with the custodian, brokers, transfer agent of the underlying funds and the application of alternative auditing procedures where securities purchased confirmations had not been received, provide a reasonable basis for our opinion.
PricewaterhouseCoopers LLP
Boston, Massachusetts
October 24, 2017
43
GOLDMAN SACHS GLOBAL MANAGED BETA FUND
| | |
Fund Expenses — Six Month Period Ended August, 31, 2017 (Unaudited) | | |
As a shareholder of Institutional Shares of the Fund, you incur ongoing costs and other Fund expenses.
This Example is intended to help you understand your ongoing costs (in dollars) of investing in the Fund and to compare these costs with the ongoing costs of investing in other mutual funds.
The Example is based on an investment of $1,000 invested at the beginning of the period and held for the entire period from March 1, 2017 through August 31, 2017, which represents a period of 184 days out of a 365 day year.
Actual Expenses — The first line in the table below provides information about actual account values and actual expenses. You may use the information in this line, together with the amount you invested, to estimate the expenses that you paid over the period. Simply divide your account value by $1,000 (for example, an $8,600 account value divided by $1,000=8.6), then multiply the result by the number in the first line under the heading entitled “Expenses Paid” to estimate the expenses you paid on your account during this period.
Hypothetical Example for Comparison Purposes — The second line in the table below provides information about hypothetical account values and hypothetical expenses based on the Fund’s actual net expense ratios and an assumed rate of return of 5% per year before expenses, which is not the Fund’s actual return. The hypothetical account values and expenses may not be used to estimate the actual ending account balance or expenses you paid for the period. You may use this information to compare the ongoing costs of investing in the Fund and other funds. To do so, compare this 5% hypothetical example with the 5% hypothetical examples that appear in the shareholder reports of the other funds.
Please note that the expenses shown in the table are meant to highlight your ongoing costs only and do not reflect any transactional costs, such as sales charges, redemption fees, or exchange fees. Therefore, the second line of the table is useful in comparing ongoing costs only, and will not help you determine the relative total costs of owning different funds. In addition, if these transactional costs were included, your costs.
| | | | | | | | | | | | |
| | | GLOBAL MANAGED BETA FUND | |
| Share Class | | Beginning Account Value 3/1/17 | | | Ending Account Value 8/31/17 | | | Expenses Paid for the 6 months ended 8/31/17* | |
| Institutional | | | | | | | | | | | | |
Actual | | | 1,000.00 | | | | 1,084.20 | | | | 0.58 | |
Hypothetical 5% return | | | 1,000.00 | | | | 1,024.65 | + | | | 0.56 | |
| | * | | Expenses for each share class are calculated using the Fund’s annualized net expense ratio for each class, which represents the ongoing expenses as a percentage of net assets for the period ended August 31, 2017. Expenses are calculated by multiplying the annualized net expense ratio by the average account value for the period; then multiplying the result by the number of days in the most recent fiscal half year; and then dividing that result by the number of days in the fiscal year. The annualized net expense ratio for the period was 0.14% | |
| | + | | Hypothetical expenses are based on the Fund’s actual annualized net expense ratios and an assumed rate of return of 5% per year before expenses. | |
44
GOLDMAN SACHS GLOBAL MANAGED BETA FUND
Statement Regarding Basis for Approval of Management Agreement (Unaudited)
Background
The Goldman Sachs Global Managed Beta Fund (the “Fund”) is an investment portfolio of Goldman Sachs Trust (the “Trust”). The Board of Trustees oversees the management of the Trust and reviews the investment performance and expenses of the Fund at regularly scheduled meetings held throughout the year. In addition, the Board of Trustees determines annually whether to approve the continuance of the Trust’s investment management agreement (the “Management Agreement”) with Goldman Sachs Asset Management, L.P. (the “Investment Adviser”) on behalf of the Fund.
The Management Agreement was most recently approved for continuation until June 30, 2018 by the Board of Trustees, including those Trustees who are not parties to the Management Agreement or “interested persons” (as defined in the Investment Company Act of 1940, as amended) of any party thereto (the “Independent Trustees”), at a meeting held on June 14-15, 2017 (the “Annual Meeting”).
The review process undertaken by the Trustees spans the course of the year and culminates with the Annual Meeting. To assist the Trustees in their deliberations, the Trustees have established a Contract Review Committee (the “Committee”), comprised of the Independent Trustees. The Committee held four meetings over the course of the year since the Management Agreement was last approved. At those Committee meetings, regularly scheduled Board or other committee meetings, and/or the Annual Meeting, matters relevant to the renewal of the Management Agreement were considered by the Board, or the Independent Trustees, as applicable. With respect to the Fund, such matters included:
| | (a) | | the nature and quality of the advisory, administrative, and other services provided to the Fund by the Investment Adviser and its affiliates, including information about: |
| | (i) | | the structure, staff, and capabilities of the Investment Adviser and its portfolio management teams; |
| | (ii) | | the groups within the Investment Adviser and its affiliates that support the portfolio management teams or provide other types of necessary services, including fund services groups (e.g., accounting and financial reporting, tax, shareholder services, and operations); controls and risk management groups (e.g., legal, compliance, valuation oversight, credit risk management, internal audit, compliance testing, market risk analysis, finance, and central funding); sales and distribution support groups, and others (e.g., information technology and training); |
| | (iii) | | trends in employee headcount; |
| | (iv) | | the Investment Adviser’s financial resources and ability to hire and retain talented personnel and strengthen its operations; and |
| | (v) | | the parent company’s support of the Investment Adviser and its mutual fund business, as expressed by the firm’s senior management; |
| | (b) | | information on the investment performance of the Fund, including comparisons to the performance of similar mutual funds, as provided by a third-party mutual fund data provider engaged as part of the contract review process (the “Outside Data Provider”), and a benchmark performance index; and information on general investment outlooks in the markets in which the Fund invests; |
| | (c) | | information provided by the Investment Adviser indicating the Investment Adviser’s views on whether the Fund’s peer group and/or benchmark index had high, medium, or low relevance given the Fund’s particular investment strategy; |
| | (d) | | the terms of the Management Agreement and other agreements with affiliated service providers entered into by the Trust on behalf of the Fund; |
| | (e) | | fee and expense information for the Fund, including: |
| | (i) | | the relative management fee and expense levels of the Fund as compared to those of comparable funds managed by other advisers, as provided by the Outside Data Provider; |
| | (ii) | | the Fund’s expense trends over time; and |
| | (iii) | | to the extent the Investment Adviser manages other types of accounts (such as bank collective trusts, private wealth management accounts, institutional separate accounts, sub-advised mutual funds, and non-U.S. funds) having investment objectives and policies similar to those of the Fund, comparative information on the advisory fees charged and services provided to those accounts by the Investment Adviser; |
| | (f) | | with respect to the investment performance and expense comparison data provided by the Outside Data Provider, its processes in producing that data for the Fund; |
| | (g) | | the undertakings of the Investment Adviser and its affiliates to implement fee waivers and/or expense limitations; |
| | (h) | | information relating to the profitability of the Management Agreement and the transfer agency and distribution and service arrangements of the Fund to the Investment Adviser and its affiliates; |
| | (i) | | whether the Fund’s existing management fee schedule adequately addressed any economies of scale; |
45
GOLDMAN SACHS GLOBAL MANAGED BETA FUND
Statement Regarding Basis for Approval of Management Agreement (Unaudited) (continued)
| | (j) | | a summary of the “fall-out” benefits derived by the Investment Adviser and its affiliates from their relationships with the Fund, including the fees received by the Investment Adviser’s affiliates from the Fund for transfer agency, portfolio trading, distribution and other services; |
| | (k) | | a summary of potential benefits derived by the Fund as a result of its relationship with the Investment Adviser; |
| | (l) | | information regarding commissions paid by the Fund and broker oversight, other information regarding portfolio trading, and how the Investment Adviser carries out its duty to seek best execution; |
| | (m) | | portfolio manager ownership of Fund shares; the manner in which portfolio manager compensation is determined; and the number and types of accounts managed by the portfolio managers; |
| | (n) | | the nature and quality of the services provided to the Fund by its unaffiliated service providers, and the Investment Adviser’s general oversight and evaluation (including reports on due diligence) of those service providers as part of the administrative services provided under the Management Agreement; and |
| | (o) | | the Investment Adviser’s processes and policies addressing various types of potential conflicts of interest; its approach to risk management; the annual review of the effectiveness of the Fund’s compliance program; and periodic compliance reports. |
The Trustees also received an overview of the Fund’s distribution arrangements. They received information regarding the Fund’s assets and share purchase and redemption activity. Information was also provided to the Trustees relating to revenue sharing payments made by and services provided by the Investment Adviser and its affiliates to intermediaries that promote the sale, distribution, and/or servicing of Fund shares. The Independent Trustees also discussed the broad range of other investment choices that are available to Fund investors, including the availability of comparable funds managed by other advisers.
The presentations made at the Board and Committee meetings and at the Annual Meeting encompassed the Fund and other mutual funds for which the Board of Trustees has responsibility. In evaluating the Management Agreement at the Annual Meeting, the Trustees relied upon their knowledge, resulting from their meetings and other interactions throughout the year, of the Investment Adviser and its affiliates, their services, and the Fund. In conjunction with these meetings, the Trustees received written materials and oral presentations on the topics covered, and the Investment Adviser addressed the questions and concerns of the Trustees, including concerns regarding the investment performance of certain of the funds they oversee. The Independent Trustees were advised by their independent legal counsel regarding their responsibilities and other regulatory requirements related to the approval and continuation of mutual fund investment management agreements under applicable law. In addition, the Investment Adviser and its affiliates provided the Independent Trustees with a written response to a formal request for information sent on behalf of the Independent Trustees by their independent legal counsel. During the course of their deliberations, the Independent Trustees met in executive sessions with their independent legal counsel, without representatives of the Investment Adviser or its affiliates present.
Nature, Extent, and Quality of the Services Provided Under the Management Agreement
As part of their review, the Trustees considered the nature, extent, and quality of the services provided to the Fund by the Investment Adviser. In this regard, the Trustees considered both the investment advisory services and non-advisory services that are provided by the Investment Adviser and its affiliates. The Trustees noted the transition in the leadership and changes in personnel of various of the Investment Adviser’s portfolio management teams that had occurred in recent periods, and the ongoing recruitment efforts aimed at bringing high quality investment talent to the Investment Adviser. They also noted the Investment Adviser’s commitment to maintaining high quality systems and expending substantial resources to respond to ongoing changes to the regulatory and control environment in which the Fund and its service providers operate, as well as the efforts of the Investment Adviser and its affiliates to combat cyber security risks. The Trustees concluded that the Investment Adviser continued to commit substantial financial and operational resources to the Fund and expressed confidence that the Investment Adviser would continue to do so in the future. The Trustees also recognized that the Investment Adviser had made significant commitments to address regulatory compliance requirements applicable to the Fund and the Investment Adviser and its affiliates.
Investment Performance
The Trustees also considered the investment performance of the Fund. In this regard, they compared the investment performance of the Fund to its peers using rankings compiled by the Outside Data Provider as of December 31, 2016. The Trustees also reviewed the Fund’s investment performance relative to its performance benchmark. They observed that the Fund had placed in the first quartile of its peer group for the one-year period ended December 31, 2016 and had underperformed its benchmark index by 0.06% for the one-year period ended April 30, 2017. As part of this review, the Trustees considered the investment performance trends of the Fund over time, and reviewed the investment performance of the Fund in light of its investment objective and policies and market conditions.
46
GOLDMAN SACHS GLOBAL MANAGED BETA FUND
Statement Regarding Basis for Approval of Management Agreement (Unaudited) (continued)
In addition, the Trustees considered materials prepared and presentations made by the Investment Adviser’s senior management and portfolio management personnel in which Fund performance was assessed. The Trustees also considered the Investment Adviser’s periodic reports with respect to the Fund’s risk profiles, and how the Investment Adviser’s approach to risk monitoring and management influences portfolio management.
Costs of Services Provided and Competitive Information
The Trustees considered the contractual terms of the Management Agreement and the fee rates payable by the Fund thereunder. In this regard, the Trustees considered information on the services rendered by the Investment Adviser to the Fund, which included both advisory and administrative services that were directed to the needs and operations of the Fund as a registered mutual fund.
In particular, the Trustees reviewed analyses prepared by the Outside Data Provider regarding the expense rankings of the Fund. The analyses provided a comparison of the Fund’s management fee to those of a relevant peer group and category universe; an expense analysis which compared the Fund’s overall net and gross expenses to a peer group and a category universe; and data comparing the Fund’s net expenses to the peer and category medians. The analyses also compared the Fund’s transfer agency and custody fees, other expenses and fee waivers/reimbursements to those of the peer group and category medians. The Trustees concluded that the comparisons provided by the Outside Data Provider were useful in evaluating the reasonableness of the management fees and total expenses paid by the Fund.
In addition, the Trustees considered the Investment Adviser’s undertakings to implement fee waivers and/or expense limitations. They also considered, to the extent that the Investment Adviser manages other types of accounts having investment objectives and policies similar to those of the Fund, comparative fee information for services provided by the Investment Adviser to those accounts, and information that indicated that services provided to the Fund differed in various significant respects from the services provided to other types of accounts which, in many cases, operated under less stringent legal and regulatory structures, required fewer services from the Investment Adviser to a smaller number of client contact points, and were less time-intensive.
In addition, the Trustees noted that shareholders are able to redeem their Fund shares at any time if shareholders believe that the Fund fees and expenses are too high or if they are dissatisfied with the performance of the Fund.
Profitability
The Trustees reviewed the Fund’s contribution to the Investment Adviser’s revenues and pre-tax profit margins. In this regard the Trustees noted that they had received, among other things, profitability analyses and summaries, revenue and expense schedules by Fund and by function (i.e., investment management, transfer agency and distribution and service), and information on the Investment Adviser’s expense allocation methodology. They observed that the profitability and expense figures are substantially similar to those used by the Investment Adviser for many internal purposes, including compensation decisions among various business groups, and are thus subject to a vigorous internal debate about how certain revenue and expenses should be allocated. The Trustees also noted that the internal audit group within the Goldman Sachs organization had audited the expense allocation methodology and that the internal audit group was satisfied with the reasonableness, consistency, and accuracy of the Investment Adviser’s expense allocation methodology and profitability analysis calculations. Profitability data for the Fund was provided for 2016 and 2015, and the Trustees considered this information in relation to the Investment Adviser’s overall profitability.
Economies of Scale
The Trustees considered the information that had been provided regarding the Investment Adviser’s profitability. The Trustees considered that the Fund is offered to the Investment Adviser’s institutional clients as part of an investment model whereby the Fund and other funds act as core “building blocks” with which the client and the Investment Adviser form an investment strategy for the client’s portfolio. The Trustees considered the Investment Adviser’s representations that its clients benefit from this investment model with increased liquidity, increased investment oversight, access to new investment strategies, economies of scale, and reduced complexity in managing client portfolios. The Trustees considered the Investment Adviser’s undertaking to waive the management fees payable by the Fund. In this regard, the Trustees noted that, pursuant to the model, clients pay a single management fee for the Investment Adviser’s management of their accounts, and that fund-level management fees are waived in order to avoid charging two layers of management fees.
Other Benefits to the Investment Adviser and Its Affiliates
The Trustees also considered the other benefits derived by the Investment Adviser and its affiliates from their relationships with the Fund as stated above, including: (a) transfer agency fees received by Goldman Sachs & Co. LLC (“Goldman Sachs”); (b) brokerage and futures commissions earned by Goldman Sachs for executing securities and futures transactions on behalf of the
47
GOLDMAN SACHS GLOBAL MANAGED BETA FUND
Statement Regarding Basis for Approval of Management Agreement (Unaudited) (continued)
Fund; (c) trading efficiencies resulting from aggregation of orders of the Fund with those for other funds or accounts managed by the Investment Adviser; (d) the Investment Adviser’s ability to leverage the infrastructure designed to service the Fund on behalf of its other clients; (e) the Investment Adviser’s ability to cross-market other products and services to Fund shareholders; (f) the Investment Adviser’s ability to negotiate better pricing with custodians on behalf of its other clients, as a result of the relationship with the Fund; and (g) the possibility that the working relationship between the Investment Adviser and the Fund’s third-party service providers may cause those service providers to be more likely to do business with other areas of Goldman Sachs. In the course of considering the foregoing, the Independent Trustees requested and received further information quantifying certain of these fall-out benefits.
Other Benefits to the Fund and Its Shareholders
The Trustees also noted that the Fund receives certain potential benefits as a result of its relationship with the Investment Adviser, including: (a) trading efficiencies resulting from aggregation of orders of the Fund with those of other funds or accounts managed by the Investment Adviser; (b) enhanced servicing from vendors because of the volume of business generated by the Investment Adviser and its affiliates; (c) enhanced servicing from broker-dealers because of the volume of business generated by the Investment Adviser and its affiliates; (d) the Investment Adviser’s ability to negotiate favorable terms with derivatives counterparties on behalf of the Fund as a result of the size and reputation of the Goldman Sachs organization; (e) the Investment Adviser’s knowledge and experience gained from managing other accounts and products; (f) the Investment Adviser’s ability to hire and retain qualified personnel to provide services to the Fund because of the reputation of the Goldman Sachs organization; (g) the Fund’s access, through the Investment Adviser, to certain firmwide resources (e.g., proprietary risk management systems and databases), subject to certain restrictions; and (h) the Fund’s access to certain affiliated distribution channels. In addition, the Trustees noted the competitive nature of the mutual fund marketplace, and considered that many of the Fund’s shareholders invested in the Fund in part because of the Fund’s relationship with the Investment Adviser and that those shareholders have a general expectation that the relationship will continue.
Conclusion
In connection with their consideration of the Management Agreement, the Trustees gave weight to each of the factors described above, but did not identify any particular factor as controlling their decision. After deliberation and consideration of all of the information provided, including the factors described above, the Trustees concluded, in the exercise of their business judgment, that the management fees paid by the Fund were reasonable in light of the services provided to it by the Investment Adviser, the Investment Adviser’s costs and the Fund’s current and reasonably foreseeable asset levels. The Trustees unanimously concluded that the Investment Adviser’s continued management likely would benefit the Fund and its shareholders and that the Management Agreement should be approved and continued with respect to the Fund until June 30, 2018.
48
GOLDMAN SACHS GLOBAL MANAGED BETA FUND
Trustees and Officers (Unaudited) Independent Trustees
| | | | | | | | | | |
Name, Address and Age1 | | Position(s) Held with the Trust | | Term of Office and Length of Time Served2 | | Principal Occupation(s) During Past 5 Years | | Number of Portfolios in Fund Complex Overseen by Trustee3 | | Other Directorships Held by Trustee4 |
Ashok N. Bakhru Age: 75 | | Chairman of the Board of Trustees | | Since 1996 (Trustee since 1991) | | Mr. Bakhru is retired. He was formerly Chairman of the Board of Trustees, Goldman Sachs Trust II (2012-2016), Goldman Sachs MLP Income Opportunities Fund (2013-2016), Goldman Sachs MLP and Energy Renaissance Fund (2014-2016), and Goldman Sachs ETF Trust (2014-2016); Director, Apollo Investment Corporation (a business development company) (2008-2013); President, ABN Associates (a management and financial consulting firm) (1994-1996 and 1998- 2012); Trustee, Scholarship America (1998-2005); Trustee, Institute for Higher Education Policy (2003-2008); Director, Private Equity Investors — III and IV (1998-2007), and Equity-Linked Investors II (April 2002-2007). Chairman of the Board of Trustees — Goldman Sachs Trust; Goldman Sachs Variable Insurance Trust; Goldman Sachs BDC, Inc.; and Goldman Sachs Private Middle Market Credit LLC. | | 106 | | None |
Kathryn A. Cassidy Age: 63 | | Trustee | | Since 2015 | | Ms. Cassidy is retired. Formerly, she was Advisor to the Chairman (May 2014-December 2014); and Senior Vice President and Treasurer (2008-2014), General Electric Company & General Electric Capital Corporation (technology and financial services companies). Trustee — Goldman Sachs Trust and Goldman Sachs Variable Insurance Trust. | | 104 | | None |
Diana M. Daniels Age: 68 | | Trustee | | Since 2007 | | Ms. Daniels is retired. Formerly, she was Vice President, General Counsel and Secretary, The Washington Post Company (1991-2006). Ms. Daniels is a Trustee Emeritus and serves as a Presidential Councillor of Cornell University (2013-Present); former Member of the Legal Advisory Board, New York Stock Exchange (2003-2006) and of the Corporate Advisory Board, Standish Mellon Management Advisors (2006-2007). Trustee — Goldman Sachs Trust and Goldman Sachs Variable Insurance Trust. | | 104 | | None |
Herbert J. Markley Age: 67 | | Trustee | | Since 2013 | | Mr. Markley is retired. Formerly, he was Executive Vice President, Deere & Company (an agricultural and construction equipment manufacturer) (2007-2009); and President, Agricultural Division, Deere & Company (2001-2007). Previously, Mr. Markley served as an Advisory Board Member of Goldman Sachs Trust and Goldman Sachs Variable Insurance Trust (June 2013-October 2013). Trustee — Goldman Sachs Trust and Goldman Sachs Variable Insurance Trust. | | 104 | | None |
Jessica Palmer Age: 68 | | Trustee | | Since 2007 | | Ms. Palmer is retired. She is Director, Emerson Center for the Arts and Culture (2011-Present); and was formerly a Consultant, Citigroup Human Resources Department (2007-2008); Managing Director, Citigroup Corporate and Investment Banking (previously, Salomon Smith Barney/ Salomon Brothers) (1984-2006). Ms. Palmer was a Member of the Board of Trustees of Indian Mountain School (private elementary and secondary school) (2004-2009). Trustee — Goldman Sachs Trust and Goldman Sachs Variable Insurance Trust. | | 104 | | None |
49
GOLDMAN SACHS GLOBAL MANAGED BETA FUND
Trustees and Officers (Unaudited) (continued)
Independent Trustees
| | | | | | | | | | |
Name, Address and Age1 | | Position(s) Held with the Trust | | Term of Office and Length of Time Served2 | | Principal Occupation(s) During Past 5 Years | | Number of Portfolios in Fund Complex Overseen by Trustee3 | | Other Directorships Held by Trustee4 |
Roy W. Templin Age: 57 | | Trustee | | Since 2013 | | Mr. Templin is retired. He is Director, Armstrong World Industries, Inc. (a designer and manufacturer of ceiling, wall and suspension system solutions) (2016-Present); and was formerly Chairman of the Board of Directors, Con-Way Incorporated (a transportation, logistics and supply chain management service company) (2014-2015); Executive Vice President and Chief Financial Officer, Whirlpool Corporation (an appliance manufacturer and marketer) (2004- 2012). Previously, Mr. Templin served as an Advisory Board Member of Goldman Sachs Trust and Goldman Sachs Variable Insurance Trust (June 2013-October 2013). Trustee — Goldman Sachs Trust and Goldman Sachs Variable Insurance Trust. | | 104 | | Armstrong World Industries, Inc. (a ceiling, wall and suspension system solutions manufacturer) |
Gregory G. Weaver Age: 65 | | Trustee | | Since 2015 | | Mr. Weaver is retired. He is Director, Verizon Communications Inc. (2015-Present); and was formerly Chairman and Chief Executive Officer, Deloitte & Touche LLP (a professional services firm) (2001-2005 and 2012-2014); and Member of the Board of Directors, Deloitte & Touche LLP (2006-2012). Trustee — Goldman Sachs Trust and Goldman Sachs Variable Insurance Trust. | | 104 | | Verizon Communications Inc. |
50
GOLDMAN SACHS GLOBAL MANAGED BETA FUND
Trustees and Officers (Unaudited) (continued)
Interested Trustee*
| | | | | | | | | | |
Name, Address and Age1 | | Position(s) Held with the Trust | | Term of Office and Length of Time Served2 | | Principal Occupation(s) During Past 5 Years | | Number of Portfolios in Fund Complex Overseen by Trustee3 | | Other Directorships Held by Trustee4 |
James A. McNamara Age: 54 | | President and Trustee | | Since 2007 | | Managing Director, Goldman Sachs (December 1998-Present); Director of Institutional Fund Sales, GSAM (April 1998-December 2000); and Senior Vice President and Manager, Dreyfus Institutional Service Corporation (January 1993- April 1998). President and Trustee — Goldman Sachs Trust; Goldman Sachs Variable Insurance Trust; Goldman Sachs Trust II; Goldman Sachs MLP Income Opportunities Fund; Goldman Sachs MLP and Energy Renaissance Fund; and Goldman Sachs ETF Trust. | | 142 | | None |
| | | | | | | | | | |
| * | | Mr. McNamara is considered to be an “Interested Trustee” because he holds positions with Goldman Sachs and owns securities issued by The Goldman Sachs Group, Inc. Mr. McNamara holds comparable positions with certain other companies of which Goldman Sachs, GSAM or an affiliate thereof is the investment adviser, administrator and/or distributor. |
| 1 | | Each Trustee may be contacted by writing to the Trustee, c/o Goldman Sachs, 200 West Street, New York, New York, 10282, Attn: Caroline Kraus. Information is provided as of August 31, 2017. |
| 2 | | Subject to such policies as may be adopted by the Board from time-to-time, each Trustee holds office for an indefinite term, until the earliest of: (a) the election of his or her successor; (b) the date the Trustee resigns or is removed by the Board or shareholders, in accordance with the Trust’s Declaration of Trust; or (c) the termination of the Trust. The Board has adopted policies which provide that (a) no Trustee shall hold office for more than 15 years and (b) a Trustee shall retire as of December 31st of the calendar year in which he or she reaches his or her 74th birthday, unless a waiver of such requirement shall have been adopted by a majority of the other Trustees. These policies may be changed by the Trustees without shareholder vote. One Trustee has been granted a waiver from the foregoing policies which permits him to serve until December 31, 2017. |
| 3 | | The Goldman Sachs Fund Complex includes certain other companies listed above for each respective Trustee. As of August 31, 2017, Goldman Sachs Trust consisted of 90 portfolios (88 of which offered shares to the public); Goldman Sachs Variable Insurance Trust consisted of 14 portfolios; Goldman Sachs Trust II consisted of 17 portfolios (16 of which offered shares to the public); Goldman Sachs BDC, Inc., Goldman Sachs Private Middle Market Credit LLC, Goldman Sachs MLP Income Opportunities Fund, and Goldman Sachs MLP and Energy Renaissance Fund each consisted of one portfolio; and Goldman Sachs ETF Trust consisted of 19 portfolios (eight of which offered shares to the public). Goldman Sachs Private Middle Market Credit LLC does not offer shares to the public. |
| 4 | | This column includes only directorships of companies required to report to the Securities and Exchange Commission under the Securities Exchange Act of 1934 (i.e., “public companies”) or other investment companies registered under the Act. |
Additional information about the Trustees is available in the Fund’s Statement of Additional Information, which can be obtained from Goldman Sachs free of charge by calling this toll-free number (in the United States of America): 1-800-526-7384.
51
GOLDMAN SACHS GLOBAL MANAGED BETA FUND
Trustees and Officers (Unaudited) (continued)
Officers of the Trust*
| | | | | | |
Name, Address and Age1 | | Position(s) Held with the Trust | | Term of
Office and
Length of
Time Served2 | | Principal Occupation(s) During Past 5 Years |
James A. McNamara 200 West Street New York, NY 10282 Age: 54 | | Trustee and President | | Since 2007 | | Managing Director, Goldman Sachs (December 1998-Present); Director of Institutional Fund Sales, GSAM (April 1998-December 2000); and Senior Vice President and Manager, Dreyfus Institutional Service Corporation (January 1993-April 1998). President and Trustee — Goldman Sachs Trust; Goldman Sachs Variable Insurance Trust; Goldman Sachs Trust II; Goldman Sachs MLP Income Opportunities Fund; Goldman Sachs MLP and Energy Renaissance Fund; and Goldman Sachs ETF Trust. |
Caroline L. Kraus 200 West Street New York, NY 10282 Age: 40 | | Secretary | | Since 2012 | | Managing Director, Goldman Sachs (January 2016-Present); Vice President, Goldman Sachs (August 2006-December 2015); Associate General Counsel, Goldman Sachs (2012-Present); Assistant General Counsel, Goldman Sachs (August 2006-December 2011); and Associate, Weil, Gotshal & Manges, LLP (2002-2006). Secretary — Goldman Sachs Trust (previously Assistant Secretary (2012)); Goldman Sachs Variable Insurance Trust (previously Assistant Secretary (2012)); Goldman Sachs Trust II; Goldman Sachs BDC, Inc.; Goldman Sachs Private Middle Market Credit LLC; Goldman Sachs Middle Market Lending Corp.; Goldman Sachs MLP Income Opportunities Fund; Goldman Sachs MLP and Energy Renaissance Fund; and Goldman Sachs ETF Trust. |
Scott M. McHugh 200 West Street New York, NY 10282 Age: 45 | | Treasurer, Senior Vice President and Principal Financial Officer | | Since 2009 (Principal Financial Officer since 2013) | | Managing Director, Goldman Sachs (January 2016-Present); Vice President, Goldman Sachs (February 2007-December 2015); Assistant Treasurer of certain mutual funds administered by DWS Scudder (2005-2007); and Director (2005-2007), Vice President (2000-2005), and Assistant Vice President (1998-2000), Deutsche Asset Management or its predecessor (1998-2007). Treasurer, Senior Vice President and Principal Financial Officer — Goldman Sachs Trust; Goldman Sachs Variable Insurance Trust; Goldman Sachs Trust II; Goldman Sachs MLP Income Opportunities Fund; Goldman Sachs MLP and Energy Renaissance Fund; and Goldman Sachs ETF Trust. |
Joseph F. DiMaria 30 Hudson Street Jersey City, NJ 07302 Age: 49 | | Assistant Treasurer and Principal Accounting Officer | | Since 2016 (Principal Accounting Officer since 2017) | | Managing Director, Goldman Sachs (November 2015-Present) and Vice President — Mutual Fund Administration, Columbia Management Investment Advisers, LLC (May 2010-October 2015). Assistant Treasurer and Principal Accounting Officer — Goldman Sachs Trust; Goldman Sachs Variable Insurance Trust; Goldman Sachs Trust II; Goldman Sachs MLP Income Opportunities Fund; Goldman Sachs MLP and Energy Renaissance Fund; and Goldman Sachs ETF Trust. |
| | | | | | |
| * | | Represents a partial list of officers of the Trust. Additional information about all the officers is available in the Funds’ Statement of Additional Information, which can be obtained from Goldman Sachs free of charge by calling this toll-free number (in the United States): 1-800-526-7384. |
| 1 | | Information is provided as of August 31, 2017. |
| 2 | | Officers hold office at the pleasure of the Board of Trustees or until their successors are duly elected and qualified. Each officer holds comparable positions with certain other companies of which Goldman Sachs, GSAM or an affiliate thereof is the investment adviser, administrator and/or distributor. |
Goldman Sachs Trust — Global Managed Beta Fund — Tax Information (Unaudited)
For the year ended August 31, 2017, 17.91%, of the dividends paid from net investment company taxable income by the Global Managed Beta Fund, qualify for the dividends received deduction available to corporations.
From distributions paid during the fiscal year ended August 31, 2017, the total amount of income received by the Global Managed Beta Fund from sources within foreign countries and possessions of the United States was $0.1243 per share, all of which is attributable to qualified passive income. The percentage of net investment income dividends paid from foreign sources by the Global Managed Beta Fund was 56.58%. The total amount of taxes paid by the Global Managed Beta Fund to such countries was $0.0089.
For the year ended August 31, 2017, 71.99% of the dividends paid from net investment company taxable income by the Global Managed Beta Fund qualify for the reduced tax rate under the Jobs and Growth Tax Relief and Reconciliation Act of 2003.
52
FUNDS PROFILE
Goldman Sachs Funds
Goldman Sachs is a premier financial services firm, known since 1869 for creating thoughtful and customized investment solutions in complex global markets.
Today, the Investment Management Division of Goldman Sachs serves a diverse set of clients worldwide, including private institutions, public entities and individuals. With approximately $1.21 trillion in assets under supervision as of June 30, 2017, Goldman Sachs Asset Management (“GSAM”) has portfolio management teams located around the world and our investment professionals bring firsthand knowledge of local markets to every investment decision. Assets under supervision includes assets under management and other client assets for which Goldman Sachs does not have full discretion. GSAM leverages the resources of Goldman Sachs & Co. LLC subject to legal, internal and regulatory restrictions.
Money Market
Financial Square FundsSM
| ∎ | | Financial Square Treasury Solutions Fund1 |
| ∎ | | Financial Square Government Fund1 |
| ∎ | | Financial Square Money Market Fund2 |
| ∎ | | Financial Square Prime Obligations Fund2 |
| ∎ | | Financial Square Treasury Instruments Fund1 |
| ∎ | | Financial Square Treasury Obligations Fund1 |
| ∎ | | Financial Square Federal Instruments Fund1 |
| ∎ | | Financial Square Tax-Exempt Money Market Fund2 |
Investor FundsSM
| ∎ | | Investor Money Market Fund3 |
| ∎ | | Investor Tax-Exempt Money Market Fund3 |
Fixed Income
| ∎ | | Short Duration and Government |
| ∎ | | High Quality Floating Rate Fund |
| ∎ | | Short-Term Conservative Income Fund |
| ∎ | | Short Duration Government Fund |
| ∎ | | Short Duration Income Fund |
| ∎ | | Inflation Protected Securities Fund |
Multi-Sector
Municipal and Tax-Free
| ∎ | | High Yield Municipal Fund |
| ∎ | | Dynamic Municipal Income Fund |
| ∎ | | Short Duration Tax-Free Fund |
Single Sector
| ∎ | | Investment Grade Credit Fund |
| ∎ | | High Yield Floating Rate Fund |
| ∎ | | Emerging Markets Debt Fund |
| ∎ | | Local Emerging Markets Debt Fund |
| ∎ | | Dynamic Emerging Markets Debt Fund |
Fixed Income Alternatives
| ∎ | | Long Short Credit Strategies Fund |
Fundamental Equity
| ∎ | | Small/Mid Cap Value Fund |
| ∎ | | Small/Mid Cap Growth Fund |
| ∎ | | Concentrated Growth Fund7 |
| ∎ | | Technology Opportunities Fund |
| ∎ | | Growth Opportunities Fund |
| ∎ | | Rising Dividend Growth Fund |
Tax-Advantaged Equity
| ∎ | | U.S. Tax-Managed Equity Fund |
| ∎ | | International Tax-Managed Equity Fund |
| ∎ | | U.S. Equity Dividend and Premium Fund |
| ∎ | | International Equity Dividend and Premium Fund |
Equity Insights
| ∎ | | Small Cap Equity Insights Fund |
| ∎ | | U.S. Equity Insights Fund |
| ∎ | | Small Cap Growth Insights Fund |
| ∎ | | Large Cap Growth Insights Fund |
| ∎ | | Large Cap Value Insights Fund |
| ∎ | | Small Cap Value Insights Fund |
| ∎ | | International Small Cap Insights Fund |
| ∎ | | International Equity Insights Fund |
| ∎ | | Emerging Markets Equity Insights Fund |
Fundamental Equity International
| ∎ | | Strategic International Equity Fund |
| ∎ | | Focused International Equity Fund |
| ∎ | | Emerging Markets Equity Fund |
Select Satellite
| ∎ | | Real Estate Securities Fund |
| ∎ | | International Real Estate Securities Fund |
| ∎ | | Commodity Strategy Fund |
| ∎ | | Global Real Estate Securities Fund |
| ∎ | | Alternative Premia Fund9 |
| ∎ | | Absolute Return Tracker Fund |
| ∎ | | Managed Futures Strategy Fund |
| ∎ | | MLP Energy Infrastructure Fund |
| ∎ | | Multi-Manager Alternatives Fund |
| ∎ | | Absolute Return Multi-Asset Fund |
| ∎ | | Global Infrastructure Fund |
Total Portfolio Solutions
| ∎ | | Global Managed Beta Fund |
| ∎ | | Multi-Manager Non-Core Fixed Income Fund |
| ∎ | | Multi-Manager U.S. Dynamic Equity Fund |
| ∎ | | Multi-Manager Global Equity Fund |
| ∎ | | Multi-Manager International Equity Fund |
| ∎ | | Tactical Tilt Overlay Fund |
| ∎ | | Balanced Strategy Portfolio |
| ∎ | | Multi-Manager U.S. Small Cap Equity Fund |
| ∎ | | Multi-Manager Real Assets Strategy Fund |
| ∎ | | Growth and Income Strategy Portfolio |
| ∎ | | Growth Strategy Portfolio |
| ∎ | | Equity Growth Strategy Portfolio |
| ∎ | | Satellite Strategies Portfolio |
| ∎ | | Enhanced Dividend Global Equity Portfolio |
| ∎ | | Tax-Advantaged Global Equity Portfolio |
| ∎ | | Strategic Factor Allocation Fund |
| ∎ | | Target Date 2020 Portfolio |
| ∎ | | Target Date 2025 Portfolio |
| ∎ | | Target Date 2030 Portfolio |
| ∎ | | Target Date 2035 Portfolio |
| ∎ | | Target Date 2040 Portfolio |
| ∎ | | Target Date 2045 Portfolio |
| ∎ | | Target Date 2050 Portfolio |
| ∎ | | Target Date 2055 Portfolio |
| ∎ | | GQG Partners International Opportunities Fund |
| 1 | | You could lose money by investing in the Fund. Although the Fund seeks to preserve the value of your investment at $1.00 per share, it cannot guarantee it will do so. An investment in the Fund is not a deposit of a bank and is not insured or guaranteed by the Federal Deposit Insurance Corporation or any other government agency. The Fund’s sponsor has no legal obligation to provide financial support to the Fund, and you should not expect that the sponsor will provide financial support to the Fund at any time. |
| 2 | | You could lose money by investing in the Fund. Because the share price of the Fund will fluctuate, when you sell your shares they may be worth more or less than what you originally paid for them. The Fund may impose a fee upon sale of your shares or may temporarily suspend your ability to sell shares if the Fund’s liquidity falls below required minimums because of market conditions or other factors. An investment in the Fund is not a deposit of a bank and is not insured or guaranteed by the Federal Deposit Insurance Corporation or any other government agency. The Fund’s sponsor has no legal obligation to provide financial support to the Fund, and you should not expect that the sponsor will provide financial support to the Fund at any time. |
| 3 | | You could lose money by investing in the Fund. Although the Fund seeks to preserve the value of your investment at $1.00 per share, it cannot guarantee it will do so. The Fund may impose a fee upon sale of your shares or may temporarily suspend your ability to sell shares if the Fund’s liquidity falls below required minimums because of market conditions or other factors. An investment in the Fund is not a deposit of a bank and is not insured or guaranteed by the Federal Deposit Insurance Corporation or any other government agency. The Fund’s sponsor has no legal obligation to provide financial support to the Fund, and you should not expect that the sponsor will provide financial support to the Fund at any time. |
| 4 | | Effective on June 20, 2017, the Goldman Sachs Fixed Income Macro Strategies Fund was renamed the Goldman Sachs Strategic Macro Fund. |
| 5 | | Effective on June 20, 2017, the Goldman Sachs Growth and Income Fund was renamed the Goldman Sachs Equity Income Fund. |
| 6 | | Effective after the close of business on August 31, 2017, the Goldman Sachs Flexible Cap Growth Fund was renamed the Goldman Sachs Flexible Cap Fund. |
| 7 | | Effective on July 28, 2017, the Goldman Sachs Focused Growth Fund was reorganized with and into the Goldman Sachs Concentrated Growth Fund. |
| 8 | | Effective after the close of business on October 31, 2017, the Goldman Sachs Dynamic U.S. Equity Fund was renamed the Goldman Sachs Blue Chip Fund. |
| 9 | | Effective after the close of business on October 30, 2017, the Goldman Sachs Dynamic Allocation Fund was renamed the Goldman Sachs Alternative Premia Fund. |
| Financial | | Square FundsSM and Investor FundsSM are registered service marks of Goldman Sachs & Co. LLC. |
| *This | | list covers open-end funds only. Please visit our website at www.GSAMFUNDS.com to learn about our closed-end funds and exchange-traded funds. |
| | |
TRUSTEES Ashok N. Bakhru, Chairman Kathryn A. Cassidy Diana M. Daniels Herbert J. Markley James A. McNamara Jessica Palmer Roy W. Templin Gregory C. Weaver | | OFFICERS James A. McNamara, President Scott M. McHugh, Treasurer, Senior Vice President and Principal Financial Officer Joseph F. DiMaria, Assistant Treasurer and Principal Accounting Officer Caroline L. Kraus, Secretary |
| |
| |
| |
| |
| |
| |
| |
| |
| |
GOLDMAN SACHS & CO. LLC Distributor and Transfer Agent | | GOLDMAN SACHS ASSET MANAGEMENT, L.P. Investment Adviser |
Visit our web site at www.GSAMFUNDS.com to obtain the most recent month-end returns.
Goldman Sachs Asset Management, L.P., 200 West Street, New York, New York 10282
The reports concerning the Fund included in this shareholder report may contain certain forward-looking statements about the factors that may affect the performance of the Fund in the future. These statements are based on Fund management’s predictions and expectations concerning certain future events and their expected impact on the Fund, such as performance of the economy as a whole and of specific industry sectors, changes in the levels of interest rates, the impact of developing world events, and other factors that may influence the future performance of the Fund. Management believes these forward-looking statements to be reasonable, although they are inherently uncertain and difficult to predict. Actual events may cause adjustments in portfolio management strategies from those currently expected to be employed.
A description of the policies and procedures that the Fund uses to determine how to vote proxies relating to portfolio securities and information regarding how a Fund voted proxies relating to portfolio securities during the most recent 12-month period ended June 30 is available (I) without charge, upon request by calling 1-800-621-2550 (for Institutional Shareholders); and (II) on the Securities and Exchange Commission (’’SEC’’) web site at http://www.sec.gov.
The website links provided are for your convenience only and are not an endorsement or recommendation by GSAM of any of these websites or the products or services offered. GSAM is not responsible for the accuracy and validity of the content of these websites.
The Fund files its complete schedule of portfolio holdings with the SEC for the first and third quarters of each fiscal year on Form N-Qs. The Fund’s Form N-Qs are available on the SEC’s web site at http://www.sec.gov within 60 days after the Fund’s first and third fiscal quarters. The Fund’s Form N-Qs may be reviewed and copied at the SEC’s Public Reference Room in Washington, D.C., and information on the operation of the Public Reference Room may also be obtained by calling 1-800-SEC-0330. Form N-Qs may be obtained upon request and without charge by calling 1-800-621-2550 (for Institutional Shareholders).
Fund holdings and allocations shown are as of August 31, 2017 and may not be representative of future investments. Fund holdings should not be relied on in making investment decisions and should not be construed as research or investment advice regarding particular securities. Current and future holdings are subject to risk.
Economic and market forecasts presented herein reflect our judgment as of the date of this presentation and are subject to change without notice. These forecasts do not take into account the specific investment objectives, restrictions, tax and financial situation or other needs of any specific client. Actual data will vary and may not be reflected here. These forecasts are subject to high levels of uncertainty that may affect actual performance. Accordingly, these forecasts should be viewed as merely representative of a broad range of possible outcomes. These forecasts are estimated, based on assumptions, and are subject to significant revision and may change materially as economic and market conditions change. Goldman Sachs has no obligation to provide updates or changes to these forecasts. Case studies and examples are for illustrative purposes only.
The portfolio risk management process includes an effort to monitor and manage risk, but does not imply low risk.
THIS MATERIAL IS FOR INFORMATIONAL PURPOSES ONLY AND IS PROVIDED SOLELY ON THE BASIS THAT IT WILL NOT CONSTITUTE INVESTMENT OR OTHER ADVICE OR A RECOMMENDATION RELATING TO ANY PERSON’S OR PLAN’S INVESTMENT OR OTHER DECISIONS, AND GOLDMAN SACHS IS NOT A FIDUCIARY OR ADVISOR WITH RESPECT TO ANY PERSON OR PLAN BY REASON OF PROVIDING THE MATERIAL OR CONTENT HEREIN INCLUDING UNDER THE EMPLOYEE RETIREMENT INCOME SECURITY ACT OF 1974 OR DEPARTMENT OF LABOR REGULATIONS. PLAN SPONSORS AND OTHER FIDUCIARIES SHOULD CONSIDER THEIR OWN CIRCUMSTANCES IN ASSESSING ANY POTENTIAL COURSE OF ACTION.
This material is not authorized for distribution to prospective investors unless preceded or accompanied by a current Prospectus or summary prospectus, if applicable. Investors should consider the Fund’s objective, risks, and charges and expenses, and read the summary prospectus, if available, and/or the Prospectus carefully before investing or sending money. The summary prospectus, if available, and the Prospectus contain this and other information about the Fund and may be obtained from your authorized dealer or from Goldman Sachs & Co. LLC by calling 1-800-621-2550.
© 2017 Goldman Sachs. All rights reserved. 107199-TMPL-10/2017-629365 MGDBETAAR-17 / 165
Goldman Sachs Funds

| | | | |
| | |
| Annual Report | | | | August 31, 2017 |
| | |
| | | | Global Tax-Aware Equity Portfolios |
| | | | Enhanced Dividend Global Equity Portfolio |
| | | | Tax-Advantaged Global Equity Portfolio |

Goldman Sachs Global Tax-Aware Equity Portfolios
| ∎ | | ENHANCED DIVIDEND GLOBAL EQUITY PORTFOLIO |
| ∎ | | TAX-ADVANTAGED GLOBAL EQUITY PORTFOLIO |
| | | | |
| | | |
| NOT FDIC-INSURED | | May Lose Value | | No Bank Guarantee |
MARKET REVIEW
Goldman Sachs Global Tax-Aware Equity Portfolios
Investment Strategy
The Portfolios invest in a strategic mix of Underlying Funds and other securities with the goal of achieving long-term growth of capital (both Portfolios) and current income (Goldman Sachs Enhanced Dividend Global Equity Portfolio only). Under normal conditions, at least 80% of the Portfolios’ total assets measured at the time of purchase will be allocated among the Underlying Funds that currently exist or that may become available for investment in the future for which Goldman Sachs Asset Management (“GSAM”) or an affiliate, now or in the future, acts as investment adviser or principal underwriter. Some of the Underlying Funds invest primarily in fixed income or money market instruments and other Underlying Funds invest primarily in equity securities. The Portfolios may also invest directly in the Underlying Tactical Fund (as defined below) and other securities or instruments, including unaffiliated exchange-traded funds and derivatives, and can use these investments for implementing tactical tilts. Under normal circumstances, each of the Portfolios also has a small strategic allocation to U.S. investment grade corporate bonds, which is used to help fund the tactical tilts.
Market Review
During the 12 months ended August 31, 2017 (the “Reporting Period”), U.S. and international equities posted strong gains overall despite unexpected geopolitical events and shifting global central bank monetary policy. Within the broad U.S. fixed income market, spread, or non-government bond, sectors generally produced positive returns as interest rates rose and investors’ risk appetite increased.
Equity Markets
When the Reporting Period began in early September 2016, U.S. and international equities alike fell as the European Central Bank (“ECB”) disappointed markets with its lack of commitment to extend quantitative easing. Later in the month, the Federal Reserve (the “Fed”) left its monetary policy unchanged, and the Bank of Japan (“BoJ”) introduced a 0% target for its 10-year government bond yield to exercise “yield curve control.” (The yield curve control framework is designed to steepen Japan’s government bond yield curve and alleviate the impact on financial institutions of low longer-term rates. Yield curve is a spectrum of maturities.) U.S. and international equities rebounded following the Fed and BoJ decisions, which the markets appeared to view as generally benign. In October 2016, a combination of hawkish Fed commentary and mounting strong U.S. economic data led to increased market pricing for a December 2016 interest rate hike. (Hawkish tends to suggest higher interest rates; opposite of dovish.) The U.S. Department of Commerce announced the U.S. Gross Domestic Product (“GDP”) increased by 3.5% on an annualized basis for the third quarter of 2016, above consensus expectations and the strongest growth rate in two years. Meanwhile, ECB minutes stressed a commitment to ongoing monthly bond-buying of 80 billion euros through at least March 2017, helping to dispel market concerns about potential tapering. The U.K.’s first official GDP growth figure since the Brexit referendum, the U.K.’s June 2016 vote to leave the European Union, was more robust than consensus expected at 0.5%. Japanese equities enjoyed strong performance owing to weakness in the Japanese yen, as BoJ governor Haruhiko Kuroda stated there was room for further easing if necessary to achieve the BoJ’s 2% inflation target. Following the unexpected results of the November 2016 U.S. elections, U.S. and international equities rallied on anticipation of a pro-growth effect of the incoming Administration’s fiscal stimulus plan, though international equities recorded a modest decline for the month overall. The Fed raised rates 25 basis points in December 2016, for the first
1
MARKET REVIEW
time in a year but as had largely been anticipated, and set a more hawkish rate hike path for 2017. (A basis point is 1/100th of a percentage point.) Although U.S. equities declined modestly after the announcement, they advanced for December 2016 overall. International equities also posted solid gains during the month, which was highlighted by the resignation of Italy’s prime minister after Italian voters’ rejection of that nation’s constitutional reform referendum and the ECB’s decision to slow its monthly pace of quantitative easing while extending the program to the end of 2017.
U.S. and international equities rallied significantly in January 2017 on the prospect of U.S. deregulation following presidential executive orders on oil pipelines and on optimism around infrastructure spending after a $1 trillion proposal from Senate Democrats. Despite political uncertainty and protectionism concerns, U.S. and international equities continued to rally in February 2017 driven by “risk on” sentiment, or increased risk appetite, owing to potential U.S. tax reform and deregulation as well as by stronger economic data. In March 2017, the Fed raised interest rates for the third time since the 2007-2009 global financial crisis and maintained projections for three additional interest rate increases before the end of 2017. However, a seemingly cautious stance on the future path of monetary tightening from Fed Chair Janet Yellen and the presence of a dissenter on the Fed committee led to a dovish market reaction and the appreciation of the Japanese yen, despite the BoJ maintaining its policy rate. Meanwhile, the ECB kept monetary policy unchanged at its March 2017 meeting but revised its economic growth and inflation forecasts upward. International equity markets interpreted the positive economic assessment as hawkish, sparking concerns around the sequencing of the ECB’s policy steps — namely, whether interest rates might rise before quantitative easing ends.
U.S. equities declined in April 2017, as Fed minutes suggested stocks were overvalued, but then rebounded on strong first quarter 2017 earnings reports and receding European political risk following the French presidential election. Although the U.S. labor market remained strong, economic activity and inflation data appeared to be moderating during the second quarter of 2017. Core inflation softened to 1.7% year-over-year in May 2017, marking a third consecutive month of weakness, while core personal consumption expenditure (“PCE”) remained below the Fed’s 2% target at just 1.4% year over year. In addition, market expectations for pro-growth U.S. fiscal policy were dampened by domestic political developments. Nonetheless, the Fed proceeded to raise the targeted federal funds rate by 25 basis points in June 2017, citing ongoing strength in the labor market and a pickup in household spending and business fixed investment. The results of the Fed’s 2017 Comprehensive Capital Analysis and Review (“CCAR”) stress test for banks were encouraging, with improving payout ratios. As for international equities, the markets were buoyed during the second calendar quarter by receding political risk, as the centrist candidate defeated the nationalist candidate in the French election and successfully secured a parliamentary majority. Political risk also declined in Italy, as the anti-establishment Five Star Movement saw a setback in local elections, and expectations for parliamentary elections this year declined. However, market optimism for pro-growth U.S. fiscal policy was dampened by political developments. Strong first quarter 2017 corporate earnings results, with double-digit growth across virtually all major developed market regions, were supportive for international equity markets. In June 2017, European markets reacted hawkishly to ECB President Mario Draghi’s optimistic outlook for recovering inflation and his cautious reference to tapering of asset purchases. Japanese equities saw a temporary pull-back in June 2017, as market sentiment deteriorated and as the Japanese yen strengthened immediately after the Fed’s June rate hike.
2
MARKET REVIEW
U.S. and international equities gained in July 2017. At the beginning of the month, the Institute for Supply Management (“ISM”) reported its manufacturing index had risen to 57.8% during June 2017, the highest level in nearly three years. However, inflation dynamics remained weak. The core consumer price index (“CPI”) stayed soft in June 2017, rising 1.7% year over year and 0.1% month over month. Fed Chair Yellen’s assessment during her Congressional testimony that the federal funds rate was close to its neutral policy rate was interpreted dovishly by markets. The Fed kept its monetary policy unchanged in July 2017, as had been widely expected. The Fed’s statement included an upgrade to its assessment of job growth as well as an acknowledgment that inflation was “below” target. This compares with its prior view, which noted inflation was “somewhat below” its 2% target, a shift that resulted in a mildly dovish market reaction. The Fed also stated it expected its balance sheet normalization to begin “relatively soon.” (Balance sheet normalization refers to the steps the Fed will take to reverse quantitative easing and remove the substantial monetary accommodation it has provided to the economy since the financial crisis began in 2007.) The dovish market reaction, combined with ongoing political turmoil in Washington, D.C., added to U.S. dollar weakness. At the same time, market expectations of asset purchase tapering by the ECB continued to support the euro, despite ECB President Draghi’s cautious and mildly dovish tone at the July 2017 policy meeting. The BoJ maintained its monetary policy during the month, pushing back the timeframe for achieving its 2% inflation target from 2018 to 2019, as slow wage growth continued to cloud the inflation outlook.
U.S. and international equities were roughly flat in August 2017. U.S. economic activity continued to be strong, with several surveys on consumer sentiment and manufacturing surprising positively. This was in contrast to subdued inflation. Minutes from the Fed’s July policy meeting suggested increased concerns on inflation, highlighting that “many participants” saw “some likelihood that inflation may remain below 2% for longer than expected.” Hurricane Harvey caused extensive flooding and damage in Texas and Louisiana and significantly impacted refinery operations, resulting in a surge in gasoline prices. In Europe, economic growth picked up to an annualized rate of 2.1% in the second calendar quarter from 1.9% in the first calendar quarter. However, economic activity indicators appeared to be moderating, though at relatively robust levels. The Japanese yen strengthened as risk sentiment deteriorated amid escalating geopolitical tensions between U.S. and North Korea, creating headwinds for Japanese equities. Contrary to the expectations of some market participants, the Fed’s Jackson Hole Economic Policy Symposium toward the end of the month provided no indication of the monetary policy outlooks of either Fed Chair Yellen or ECB President Draghi. This buoyed Japanese equities, as did moderating geopolitical risks and encouraging U.S. economic data.
Fixed Income Markets
When the Reporting Period began in September 2016, spread sectors outperformed U.S. Treasury securities. The Fed kept the target range for the federal funds rate unchanged at its September 2016 policy meeting after a summer of speeches by Fed officials that fluctuated between dovish and hawkish tones. The ECB also left its monetary policy unchanged during the month, while the BoJ extended its quantitative and qualitative monetary easing framework to include “yield curve control.”
In the fourth quarter of 2016, spread sectors advanced, generally outpacing U.S. Treasury securities. In early November 2016, the results of the U.S. Presidential election led to a change in investor expectations for future monetary, fiscal and regulatory policy. More specifically, investors appeared to anticipate fiscal stimulus, a looser regulatory agenda and a faster pace of Fed monetary policy tightening. After the U.S. election, global interest rates rose and the U.S. dollar strengthened versus other developed markets and emerging markets currencies.
3
MARKET REVIEW
Meanwhile, the U.S. economy continued to strengthen, with strong jobs growth and increased consumer spending reported. In December 2016, the Fed raised the targeted federal funds rate 25 basis points to a range of between 0.50% and 0.75% . The rate hike resulted in a further rise in U.S. Treasury yields, with a notable increase in shorter-term yields, and additional appreciation in the U.S. dollar. In Europe, the ECB announced it would reduce its monthly pace of asset purchases starting in April 2017 but stated it would extend its quantitative easing program to the end of 2017. On the political front, Italy voted to reject constitutional reforms, while the outcome of Austria’s election defied the populist tide that had claimed victories in the U.K. and U.S. during 2016. Crude oil prices rose following an agreement by the Organization of the Petroleum Exporting Countries (“OPEC”) and non-OPEC producers to cut production, which provided support for energy issuers within the corporate credit market as well as for oil-exporting emerging economies.
During the first quarter of 2017, spread sectors provided mixed results versus U.S. Treasuries, but posted gains overall. Investors focused on the prospect of pro-growth policies from the new U.S. Administration, which we believe helped boost business and consumer sentiment to near record levels. Investors also evaluated the positive impact of earlier fiscal stimulus in China. Global purchasing managers’ indices pointed to solid and synchronized global expansion, led by developed markets, most notably the U.S. In Europe, economic data strengthened and political risk remained contained, as markets weathered the official start of Brexit negotiations. Monetary policy presented few surprises during the first calendar quarter, as the ECB, BoJ and Bank of England (“BoE”) kept their respective monetary policies unchanged. In March 2017, the ECB raised its economic growth and inflation forecast, while the Fed raised its target range for the federal funds rate by 25 basis points. Minutes from the meeting raised expectations that Fed balance sheet normalization would begin in 2017. Despite the Fed’s monetary policy tightening, U.S. financial conditions eased and the U.S. dollar weakened versus both developed and emerging markets currencies during the first calendar quarter.
In the second quarter of 2017, spread sectors generally recorded positive returns, though with mixed results relative to U.S. Treasuries. Political developments led to temporary bouts of volatility early in the quarter, driving weakness in Brazilian, U.S. and U.K. fixed income assets as well as a credit rating downgrade of South Africa’s sovereign debt. Political risks receded in May 2017 on the centrist candidate’s victory in the French presidential election, which was supportive of French and European peripheral bonds broadly. On the economic front, U.S. core inflation weakened for the third consecutive month in May 2017, casting uncertainty over the pace of Fed monetary tightening. Nonetheless, comments included in minutes from the Fed’s May and June 2017 policy meetings suggested an announcement about how and when the Fed would begin reducing the size of its balance sheet would be made sooner than the markets had previously anticipated. In Europe, economic data continued to surprise to the upside. At its June 2017 policy meeting, the ECB provided an optimistic assessment of the risks to growth, but revised downward its medium-term inflation forecasts. The ECB, BoJ and BoE left their respective monetary policies unchanged during the second calendar quarter, while the Fed raised interest rates for the second time in 2017 and the fourth time in a decade at its June 2017 policy meeting. As the quarter came to an end, a string of comments from global central bankers triggered a hawkish market reaction. Global interest rates rose as the market anticipated a faster than expected pace of monetary policy tightening by the BoE, ECB and Bank of Canada. During the second quarter of 2017, the U.S. dollar continued to weaken versus many global currencies.
In July 2017, spread sectors broadly advanced, outperforming U.S. Treasury securities. The Fed kept its monetary policy unchanged, though policymakers noted that balance sheet
4
MARKET REVIEW
normalization would begin “relatively soon.” U.S. financial conditions continued to ease despite previous Fed rate hikes, while European financial conditions tightened on raised expectations for the potential withdrawal of the ECB’s accommodative monetary policy. In the U.S., second quarter 2017 GDP increased at an annualized rate of 2.6%, contrasting with inflation, which was subdued. In Europe, economic data continued to strengthen, but inflation remained below the ECB’s target and forecast. The U.S. dollar weakened relative to many global currencies.
During August 2017, spread sectors generally lagged U.S. Treasuries due to bouts of “risk off” sentiment, or increased risk aversion, amid rising geopolitical risks. In the U.S., limited progress on the Administration’s pro-growth fiscal policy measures, concerns about September 2017 debt limit and spending bill deadlines, and geopolitical uncertainty pushed down U.S. government bond yields. Second quarter 2017 U.S. GDP was revised up to an annualized rate 3.0% and the ISM manufacturing index rose to a six-year high in August 2017. In Europe, economic data was generally positive, driving appreciation of the euro against the U.S. dollar. In Japan, second quarter 2017 GDP was revised down sharply from a preliminary annualized reading of 4% to 2.8%.
Looking Ahead
At the end of the Reporting Period, we believed global economic growth was in the midst of a synchronized upswing, led by developed markets with support from recovery in emerging economies. In the U.S. the labor market continued to tighten and financial conditions remained easy. Regarding Europe, economic growth surprises have driven our growth outlook for 2017 higher. In 2018, we expect to see modest slowing in several world economies, but we do not think such slowing will end the global expansion cycle, and we expect growth to remain above trend overall.
Inflation generally remained soft at the end of the Reporting Period, despite tight labor markets in some economies, most notably the U.S. We think global factors, such as labor mobility, are subduing inflationary pressures. In the U.S., we think recent soft economic data have interrupted, not derailed, the gradual rising trend in core inflation and wages. In the Europe and Japan, we think structural challenges may continue to constrain wages and core inflation.
Regarding central bank policy, we believe the agenda is increasingly dominated by quantitative tightening, with the U.S. leading the way. In September 2017, we expect the Fed to formally unveil its plan for scaling down the size of its balance sheet and think implementation could begin in October 2017, with balance sheet normalization likely to span multiple years, in our view. In Europe, we think the ECB will likely increase communication about its strategy for tapering asset purchases starting in 2018. That said, we see the possibility that purchases could continue into 2019 due to recent currency strength weighing on an already-subdued inflation outlook. As for interest-rate policy, we expect one further rate hike by the Fed in 2017, providing inflation data improves and financial conditions do not tighten materially. We do not see rate hikes in Europe or Japan in the near term.
On the political front, market reaction to heighted geopolitical risk on the Korean Peninsula was relatively contained during the Reporting Period. In the U.S., we believe low expectations regarding the Administration’s ability to implement its pro-growth agenda creates potential for positive market surprises. We think there is a chance the Administration will press ahead with fiscal proposals during the fall of 2017. In Europe, we believe political risk could increase ahead of several upcoming events, including the Catalan Independence Referendum in Spain and elections in Austria and Italy. We expect continued uncertainty around the eventual Brexit outcome.
5
PORTFOLIO RESULTS
Goldman Sachs Enhanced Dividend Global Equity Portfolio
Investment Objective
The Portfolio seeks long-term growth of capital and current income.
Portfolio Management Discussion and Analysis
Below, the Goldman Sachs Quantitative Investment Strategies Team discusses the Goldman Sachs Enhanced Dividend Global Equity Portfolio’s (the “Portfolio”) performance and positioning for the 12-month period ended August 31, 2017 (the “Reporting Period”).
| Q | | How did the Portfolio perform during the Reporting Period? |
| A | | During the Reporting Period, the Portfolio’s Class A and Institutional Shares generated average annual total returns, without sales charges, of 12.25% and 12.66%, respectively. These returns compare to the 15.34% average annual total return of the Portfolio’s blended benchmark, the Enhanced Dividend Global Equity Composite Index (“EDGE Composite Index”), over the same time period. The components of the EDGE Composite Index generated average annual total returns of 17.08% and 0.49% for the MSCI All Country World Index (ACWI) Investable Market Index® (“MSCI ACWI IMI”) and Bloomberg Barclays U.S. Aggregate Bond Index, respectively, during the Reporting Period. |
| Q | | What key factors affected the Portfolio’s performance during the Reporting Period? |
| A | | During the Reporting Period, the Portfolio’s strategic weightings detracted from its performance versus the EDGE Composite Index. Our tactical asset allocation decisions (“tactical tilts”) contributed positively. The overall performance of the Underlying Funds hurt the Portfolio’s relative results. |
| Q | | How were the Portfolio’s tactical asset allocation decisions managed during the Reporting Period? |
| A | | In keeping with our investment process, we develop views regarding near-term expected market returns and implement tactical tilts in an attempt to enhance performance. These tactical tilts are implemented through an investment in the Goldman Sachs Tactical Tilt Overlay Fund (the “Underlying Tactical Fund”), which seeks long-term total return through the implementation of investment ideas that are generally derived from short-term or medium-term market views on a variety of asset classes and instruments. As mentioned previously, the Portfolio’s tactical tilts added to its performance during the Reporting Period. |
| Q | | How did the Portfolio’s Underlying Funds perform relative to their respective benchmark indices during the Reporting Period? |
| A | | To implement our strategic and tactical asset allocation decisions, the Portfolio invests in eight Underlying Funds. Seven of these Underlying Funds may be used to implement strategic asset allocation decisions (“Underlying Strategic Funds”). The Underlying Tactical Fund, as mentioned previously, is used to implement tactical tilts. |
| | | During the Reporting Period, the Portfolio was invested in six of the seven Underlying Strategic Funds, four of which underperformed their respective benchmark indices. (The Portfolio did not have an allocation to the Goldman Sachs Core Fixed Income Fund during the Reporting Period.) Two of these Underlying Strategic Funds that underperformed in relative terms — the Goldman Sachs U.S. Equity Dividend and Premium Fund and the Goldman Sachs International Equity Dividend and Premium Fund — are those in which the Portfolio invested a significant percentage of its equity allocation. The Goldman Sachs Small Cap Equity Insights Fund and the Goldman Sachs MLP Energy Infrastructure Fund also underperformed their respective benchmark indices during the Reporting Period. |
| | | The Goldman Sachs Emerging Markets Equity Insights Fund and the Goldman Sachs International Small Cap Equity Insights outperformed their respective benchmark indices during the Reporting Period. |
| | | The Portfolio’s Underlying Tactical Fund outperformed its cash benchmark index by more than 119 basis points1 during the Reporting Period. (A basis point is 1/100th of a percent.) |
| | 1 | | Performance quoted is for Institutional Shares. |
6
PORTFOLIO RESULTS
| Q | | How did call writing affect performance? |
| A | | As mentioned above, the Portfolio’s two largest allocations were to the Goldman Sachs U.S. Equity Dividend and Premium Fund and the Goldman Sachs International Equity Dividend and Premium Fund, which earn premiums through an equity index call writing strategy. When equity markets are down, flat or modestly positive, these Underlying Strategic Funds tend to outperform their respective benchmark indices because of the premiums they earn from call writing. When equity markets rally strongly, these two Underlying Strategic Funds are likely to trail their respective benchmark indices. Although the Underlying Strategic Funds keep the premiums they earn from call writing, they can underperform when the call options are exercised. |
| | As the U.S. and international equity markets advanced during the Reporting Period, the call writing strategies of the Goldman Sachs U.S. Equity Dividend and Premium Fund and the Goldman Sachs International Equity Dividend and Premium Fund detracted from performance. |
| Q | | How did the Portfolio use derivatives and similar instruments during the Reporting Period? |
| A | | During the Reporting Period, the Portfolio employed Standard & Poor’s 500® Index (“S&P 500 Index”) futures as part of its strategic weightings in U.S. large-cap growth stocks and U.S. large-cap value stocks. Overall, the Portfolio’s strategic weightings detracted from performance, but its holdings of S&P 500 Index futures contributed positively. The Portfolio also used forward foreign currency exchange contracts to express views on particular currencies, which had a negative impact on results. In addition, some of the Portfolio’s Underlying Funds, including the Portfolio’s Underlying Tactical Fund, used derivatives during the Reporting Period to apply their active investment views with greater versatility or to afford greater risk management precision. As market conditions warranted during the Reporting Period, some of these Underlying Funds engaged in forward foreign currency exchange contracts, financial futures contracts, options and swap contracts to enhance portfolio return and for hedging purposes. |
| Q | | What changes did you make during the Reporting Period within the Portfolio? |
| A | | No significant changes were made within the Portfolio during the Reporting Period. |
| Q | | What was the Portfolio’s strategy at the end of the Reporting Period? |
| A | | Going forward, we plan to maintain a diversified equity portfolio that implements our strategic and tactical views as we continue to seek long-term growth of capital and current income. |
7
FUND BASICS
Enhanced Dividend Global Equity Portfolio
as of August 31, 2017
| | | | | | | | | | | | | | | | | | |
| | PERFORMANCE REVIEW | |
| | | September 1, 2016–
August 31, 2017 | | Portfolio Total Return
(based on NAV)1 | | | EDGE
Composite
Index2 | | | MSCI ACWI IMI3 | | | Bloomberg Barclays
U.S. Aggregate
Bond Index4 | |
| | Class A | | | 12.25 | % | | | 15.34 | % | | | 17.08 | % | | | 0.49 | % |
| | | Institutional | | | 12.66 | | | | 15.34 | | | | 17.08 | | | | 0.49 | |
| | 1 | | The net asset value (“NAV”) represents the net assets of the class of the Portfolio (ex-dividend) divided by the total number of shares of the class outstanding. The Portfolio’s performance reflects the reinvestment of dividends and other distributions. The Portfolio’s performance does not reflect the deduction of any applicable sales charges. |
| | 2 | | The EDGE Composite Index (“EDGE Composite”) is a composite representation prepared by the investment adviser of the performance of the Portfolio’s asset classes weighted according to their respective weightings in the Portfolio’s target range. |
| | | | The EDGE Composite is comprised of MSCI ACWI IMI (90%) and the Bloomberg Barclays U.S. Aggregate Bond Index (10%). The EDGE Composite figures do not reflect any deduction for fees, expenses or taxes. |
| | 3 | | The MSCI ACWI IMI captures large, mid and small cap representation across 23 developed markets and 24 emerging markets. With 8,603 constituents, the MSCI ACWI IMI is comprehensive, covering approximately 99% of the global equity investment opportunity set. As of August 31, 2017, the 23 developed markets in the MSCI ACWI IMI include Australia, Austria, Belgium, Canada, Denmark, Finland, France, Germany, Hong Kong, Ireland, Israel, Italy, Japan, Netherlands, New Zealand, Norway, Portugal, Singapore, Spain, Sweden, Switzerland, the U.K. and the U.S. The 24 emerging markets include Brazil, Chile, China, Colombia, Czech Republic, Egypt, Greece, Hungary, India, Indonesia, South Korea, Malaysia, Mexico, Pakistan, Peru, Philippines, Poland, Russia, Qatar, South Africa, Taiwan, Thailand, Turkey and United Arab Emirates. |
| | 4 | | The Bloomberg Barclays U.S. Aggregate Bond Index represents an unmanaged diversified portfolio of fixed income securities, including U.S. Treasuries, investment grade corporate bonds and mortgage-backed and asset-backed securities. |
| | | | | | | | | | | | | | | | |
| | STANDARDIZED TOTAL RETURNS5 |
| | | For the period ended 6/30/17 | | One Year | | | Five Years | | | Since Inception | | | Inception Date |
| | Class A | | | 8.11 | % | | | 7.73 | % | | | 4.77 | % | | 4/30/08 |
| | | Institutional | | | 14.94 | | | | 9.42 | | | | 5.86 | % | | 4/30/08 |
| | 5 | | The Standardized Total Returns are average annual total returns or cumulative total returns (only if the performance period is one year or less) as of the most recent calendar quarter-end. They assume reinvestment of all distributions at NAV. These returns reflect a maximum initial sales charge of 5.5% for Class A Shares. Because Institutional Shares do not involve a sales charge, such a charge is not applied to their Standardized Total Returns. |
The returns set forth in the tables above represent past performance. Past performance does not guarantee future results. The Portfolio’s investment return and principal value will fluctuate so that an investor’s shares, when redeemed, may be worth more or less than their original cost. Current performance may be lower or higher than the performance quoted above. Please visit our web site at www.GSAMFUNDS.com to obtain the most recent month-end returns. Performance reflects applicable fee waivers and/or expense limitations in effect during the periods shown. In their absence, performance would be reduced. Returns do not reflect the deduction of taxes that a shareholder would pay on Portfolio distributions or the redemption of Portfolio shares.
8
FUND BASICS
| | | | | | | | | | |
| | EXPENSE RATIOS6 | | | | | | | | |
| | | | | Net Expense Ratio (Current) | | | Gross Expense Ratio (Before Waivers) | |
| | Class A | | | 1.37 | % | | | 1.48 | % |
| | | Institutional | | | 0.97 | | | | 1.08 | |
| | 6 | | The expense ratios of the Portfolio, both current (net of applicable fee waivers and/or expense limitations) and before waivers (gross of applicable fee waivers and/or expense limitations) are as set forth above according to the most recent publicly available Prospectus, as supplemented, for the Portfolio and may differ from the expense ratios disclosed in the Financial Highlights in this report. Pursuant to a contractual arrangement, the Portfolio’s waivers and/or expense limitations will remain in place through at least December 29, 2017, and prior to such date the Investment Adviser may not terminate the arrangements without the approval of the Portfolio’s Board of Trustees. If these arrangements are discontinued in the future, the expense ratios may change without shareholder approval. |
| | | | | | | | | | | | | | |
| | STANDARDIZED AFTER-TAX PERFORMANCE AS OF 6/30/177 | |
| | | Class A Shares | | One Year | | | Five Years | | | Since Inception
(4/30/08) | |
| | Returns before taxes* | | | 8.11 | % | | | 7.73 | % | | | 4.77 | % |
| | Returns after taxes on distributions** | | | 7.41 | | | | 6.54 | | | | 3.93 | |
| | | Returns after taxes on distributions*** and sale of Portfolio shares | | | 4.98 | | | | 5.92 | | | | 3.68 | |
| 7 | | The after-tax returns are calculated using the historically highest individual federal marginal income tax rates at the time of distributions (currently 23.8% for qualifying ordinary income dividends and long-term capital gain distributions and 43.4% for non-qualifying ordinary income dividends) and do not reflect state and local taxes. Actual after-tax returns will be calculated at calendar year-end and depend on an investor’s tax situation and may differ from those shown. In addition, the after-tax returns shown are not relevant to investors who hold Portfolio shares through tax-deferred arrangements such as 401(k) plans or individual retirement accounts. Under certain circumstances, the addition of the tax benefits from capital losses resulting from redemptions may cause the Returns After Taxes on Distributions and Sale of Portfolio Shares to be greater than the Returns After Taxes on Distributions or even Returns Before Taxes. Standardized after-tax returns assume reinvestment of all distributions at NAV and reflect a maximum initial sales charge of 5.5% for Class A Shares. |
| * | | Returns Before Taxes do not reflect taxes on distributions on the Portfolio’s Class A Shares nor do they show how performance can be impacted by taxes when shares are redeemed. |
| ** | | Returns After Taxes on Distributions assume that taxes are paid on distributions on the Portfolio’s Class A Shares (i.e., dividends and capital gains) but do not reflect taxes that may be incurred upon redemption of the Class A Shares at the end of the performance period. |
| *** | | Returns After Taxes on Distributions and Sale of Portfolio Shares reflect taxes paid on distributions on the Portfolio’s Class A Shares and taxes applicable when the shares are redeemed. |
9
FUND BASICS
|
| OVERALL UNDERLYING FUND WEIGHTINGS8,9 |
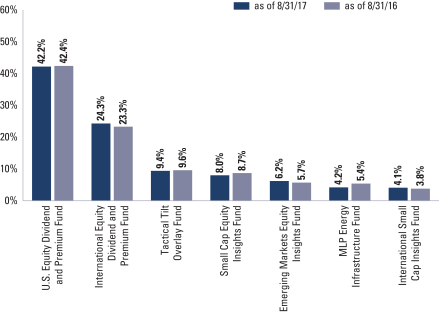
| 8 | | The Portfolio is actively managed and, as such, its composition may differ over time. The percentage shown for each Underlying Fund reflects the value of that Underlying Fund as a percentage of net assets of the Portfolio. Figures in the graph above may not sum to 100% due to rounding and/or exclusion of other assets and liabilities. The above graph depicts the Portfolio’s investments but may not represent the Portfolio’s market exposure due to the exclusion of certain derivatives, if any, as listed in the Additional Investment Information section of the Schedule of Investments. |
| 9 | | Represents affiliated Funds. |
10
GOLDMAN SACHS ENHANCED DIVIDEND GLOBAL EQUITY PORTFOLIO
Performance Summary
August 31, 2017
The following graph shows the value, as of August 31, 2017, of a $1,000,000 investment made on April 30, 2008 (commencement of operations) in Institutional Shares at NAV. For comparative purposes, the performance of the Portfolio’s benchmark the Enhanced Dividend Global Equity Composite Index (“EDGE Composite Index”), which is comprised of 10% of the Bloomberg Barclays U.S. Aggregate Bond Index, and 90% of the Morgan Stanley Capital International (MSCI) All Country World Index (ACWI) Investable Market Index (IMI) (“MSCI ACWI IMI”) (Net, USD, Unhedged), are shown. This performance data represents past performance and should not be considered indicative of future performance, which will fluctuate with changes in market conditions. These performance fluctuations may cause an investor’s shares, when redeemed, to be worth more or less than their original cost. Performance reflects expense limitations currently in effect and in their absence, performance would be reduced. Returns do not reflect the deduction of taxes that a shareholder would pay on Portfolio distributions or the redemption of Portfolio shares. Performance of Institutional Shares will vary from Class A Shares due to differences in class specific fees and any applicable sales charges. In addition to the investment adviser’s decisions regarding underlying mutual fund selection and allocations among them, other factors may affect Portfolio performance. These factors include, but are not limited to, Portfolio operating fees and expenses, portfolio turnover, and subscription and redemption cash flows affecting the Portfolio.
|
| Enhanced Dividend Global Equity Portfolio’s Lifetime Performance |
Performance of a $1,000,000 Investment, including any applicable sales charges, with distributions reinvested, from April 30, 2008 through August 31, 2017.
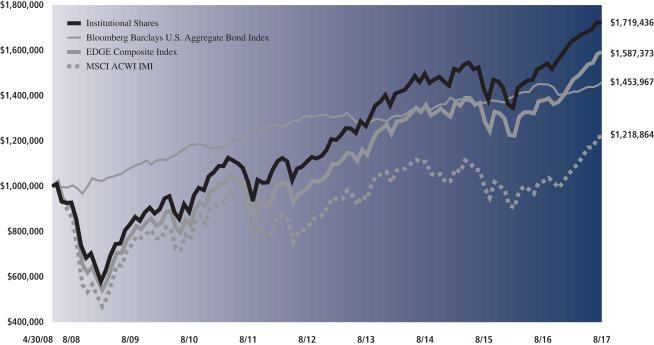
| | | | | | | | | | |
| Average Annual Total Return through August 31, 2017 | | | One Year | | | | Five Years | | | Since Inception |
Class A (Commenced April 30, 2008) | | | | | | | | | | |
Excluding sales charges | | | 12.25% | | | | 8.76% | | | 5.53% |
Including sales charges | | | 6.09% | | | | 7.53% | | | 4.89% |
|
Institutional Class (Commenced April 30, 2008) | | | 12.66% | | | | 9.21% | | | 5.96% |
|
11
PORTFOLIO RESULTS
Goldman Sachs Tax-Advantaged Global Equity Portfolio
Investment Objective
The Portfolio seeks long-term growth of capital.
Portfolio Management Discussion and Analysis
Below, the Goldman Sachs Quantitative Investment Strategies Team discusses the Goldman Sachs Tax-Advantaged Global Equity Portfolio’s (the “Portfolio”) performance and positioning for the 12-month period ended August 31, 2017 (the “Reporting Period”).
| Q | | How did the Portfolio perform during the Reporting Period? |
| A | | During the Reporting Period, the Portfolio’s Class A and Institutional Shares generated average annual total returns, without sales charges, of 15.23% and 15.74%, respectively. These returns compare to the 15.34% average annual total return of the Portfolio’s blended benchmark, the Tax-Advantaged Global Equity Composite Index (“TAG Composite Index”), over the same time period. The components of the TAG Composite Index generated average annual total returns of 17.08% and 0.49% for the MSCI All Country World Index (ACWI) Investable Market Index® (“MSCI ACWI IMI”) and the Bloomberg Barclays U.S. Aggregate Bond Index, respectively, during the Reporting Period. |
| Q | | What key factors affected the Portfolio’s performance during the Reporting Period? |
| A | | During the Reporting Period, the Portfolio’s performance was hampered by its strategic weightings. It benefited from our tactical asset allocation decisions (“tactical tilts”). The overall performance of the Underlying Funds also added to the Portfolio’s performance versus the TAG Composite Index. |
| Q | | How were the Portfolio’s tactical asset allocation decisions managed during the Reporting Period? |
| A | | In keeping with our investment process, we develop views regarding near-term expected market returns and implement tactical tilts in an attempt to enhance performance. These tactical tilts are implemented through an investment in the Goldman Sachs Tactical Tilt Overlay Fund (the “Underlying Tactical Fund”), which seeks long-term total return through the implementation of investment ideas that are generally derived from short-term or medium-term market views on a variety of asset classes and instruments. As mentioned previously, the Portfolio’s tactical tilts contributed positively to performance during the Reporting Period. |
| Q | | How did the Portfolio’s Underlying Funds perform relative to their respective benchmark indices during the Reporting Period? |
| A | | To implement our strategic and tactical asset allocation decisions, the Portfolio invests in seven Underlying Funds. Six of these Underlying Funds may be used to implement strategic asset allocation decisions (“Underlying Strategic Funds”). The Underlying Tactical Fund, as mentioned previously, is used to implement tactical tilts. |
| | During the Reporting Period, the Portfolio was invested in five of the six Underlying Strategic funds, four of which outperformed their respective benchmark indices. (The Portfolio did not have an allocation to the Goldman Sachs Core Fixed Income Fund during the Reporting Period.) |
| | Two of the Underlying Strategic Funds that outperformed in relative terms — the Goldman Sachs U.S. Tax-Managed Equity Fund and the Goldman Sachs International Tax-Managed Equity Fund — are those in which the Portfolio held its largest weightings. In addition, the Goldman Sachs Emerging Markets Equity Insights Fund and the Goldman Sachs International Small Cap Insights Fund outperformed their respective benchmark indices. |
| | The Goldman Sachs MLP Energy Infrastructure Fund underperformed its benchmark index during the Reporting Period. |
| | The Portfolio’s Underlying Tactical Fund outperformed its cash benchmark index by more than 119 basis points1 during the Reporting Period. (A basis point is 1/100th of a percent.) |
| | 1 | | Performance quoted is for Institutional Shares. |
12
PORTFOLIO RESULTS
| Q | | How did the Portfolio use derivatives and similar instruments during the Reporting Period? |
| A | | During the Reporting Period, the Portfolio employed Standard & Poor’s 500® Index (“S&P 500 Index”) futures as part of its strategic weightings in U.S. large-cap growth stocks and U.S. large-cap value stocks. Overall, the Portfolio’s strategic weightings detracted from performance, but its holdings of S&P 500 Index futures contributed positively. The Portfolio also used forward foreign currency exchange contracts to express views on particular currencies, which had a negative impact on results. In addition, some of the Portfolio’s Underlying Funds, including the Portfolio’s Underlying Tactical Fund, used derivatives during the Reporting Period to apply their active investment views with greater versatility or to afford greater risk management precision. As market conditions warranted during the Reporting Period, some of these Underlying Funds engaged in forward foreign currency exchange contracts, financial futures contracts, options and swap contracts to enhance portfolio return and for hedging purposes. |
| Q | | What changes did you make during the Reporting Period within the Portfolio? |
| A | | No significant changes were made within the Portfolio during the Reporting Period. |
| Q | | What was the Portfolio’s strategy at the end of the Reporting Period? |
| A | | Going forward, we plan to maintain a diversified equity portfolio that implements our strategic and tactical views as we continue to seek long-term growth of capital. |
13
FUND BASICS
Tax-Advantaged Global Equity Portfolio
as of August 31, 2017
| | | | | | | | | | | | | | | | | | |
| | PERFORMANCE REVIEW | |
| | | September 1, 2016–
August 31, 2017 | | Portfolio Total Return
(based on NAV)1 | | | TAG
Composite
Index2 | | | MSCI ACWI IMI3 | | | Bloomberg Barclays
U.S. Aggregate
Bond Index4 | |
| | Class A | | | 15.23 | % | | | 15.34 | % | | | 17.08 | % | | | 0.49 | % |
| | | Institutional | | | 15.74 | | | | 15.34 | | | | 17.08 | | | | 0.49 | |
| | 1 | | The net asset value (“NAV”) represents the net assets of the class of the Portfolio (ex-dividend) divided by the total number of shares of the class outstanding. The Portfolio’s performance reflects the reinvestment of dividends and other distributions. The Portfolio’s performance does not reflect the deduction of any applicable sales charges. |
| | 2 | | The TAG Composite Index (“TAG Composite”) is a composite representation prepared by the investment adviser of the performance of the Portfolio’s asset classes weighted according to their respective weightings in the Portfolio’s target range. |
| | The | | TAG Composite is comprised of the MSCI ACWI IMI (90%) and the Bloomberg Barclays U.S. Aggregate Bond Index (10%). The TAG Composite figures do not reflect any deduction for fees, expenses or taxes. |
| | 3 | | The MSCI ACWI IMI captures large, mid and small cap representation across 23 developed markets and 24 emerging markets. With 8,603 constituents, the MSCI ACWI IMI is comprehensive, covering approximately 99% of the global equity investment opportunity set. As of August 31, 2017, the 23 developed markets in the MSCI ACWI IMI include Australia, Austria, Belgium, Canada, Denmark, Finland, France, Germany, Hong Kong, Ireland, Israel, Italy, Japan, Netherlands, New Zealand, Norway, Portugal, Singapore, Spain, Sweden, Switzerland, the U.K. and the U.S. The 24 emerging markets include Brazil, Chile, China, Colombia, Czech Republic, Egypt, Greece, Hungary, India, Indonesia, South Korea, Malaysia, Mexico, Pakistan, Peru, Philippines, Poland, Russia, Qatar, South Africa, Taiwan, Thailand, Turkey and United Arab Emirates. |
| | 4 | | The Bloomberg Barclays U.S. Aggregate Bond Index represents an unmanaged diversified portfolio of fixed income securities, including U.S. Treasuries, investment grade corporate bonds and mortgage-backed and asset-backed securities |
| | | | | | | | | | | | | | | | | | |
| | STANDARDIZED TOTAL RETURNS5 | |
| | | For the period ended 6/30/17 | | One Year | | | Five Years | | | Since Inception | | | Inception Date | |
| | Class A | | | 10.35 | % | | | 9.86 | % | | | 5.36 | % | | | 4/30/08 | |
| | | Institutional | | | 17.33 | | | | 11.55 | | | | 6.44 | | | | 4/30/08 | |
| | 5 | | The Standardized Total Returns are average annual total returns or cumulative total returns (only if the performance period is one year or less) as of the most recent calendar quarter-end. They assume reinvestment of all distributions at NAV. These returns reflect a maximum initial sales charge of 5.5% for Class A Shares. Because Institutional Shares do not involve a sales charge, such a charge is not applied to their Standardized Total Returns. |
The returns set forth in the tables above represent past performance. Past performance does not guarantee future results. The Portfolio’s investment return and principal value will fluctuate so that an investor’s shares, when redeemed, may be worth more or less than their original cost. Current performance may be lower or higher than the performance quoted above. Please visit our web site at www.GSAMFUNDS.com to obtain the most recent month-end returns. Performance reflects fee waivers and/or expense limitations in effect. In their absence, performance would be reduced. Returns do not reflect the deduction of taxes that a shareholder would pay on Portfolio distributions or the redemption of Portfolio shares.
14
FUND BASICS
| | | | | | | | | | |
| | EXPENSE RATIOS6 | |
| | | | | Net Expense Ratio (Current) | | | Gross Expense Ratio (Before Waivers) | |
| | Class A | | | 1.36 | % | | | 1.44 | % |
| | | Institutional | | | 0.96 | | | | 1.04 | |
| | 6 | | The expense ratios of the Portfolio, both current (net of applicable fee waivers and/or expense limitations) and before waivers (gross of applicable fee waivers and/or expense limitations) are as set forth above according to the most recent publicly available Prospectus, as supplemented, for the Portfolio and may differ from the expense ratios disclosed in the Financial Highlights in this report. Pursuant to a contractual arrangement, the Portfolio’s waivers and/or expense limitations will remain in place through at least December 29, 2017, and prior to such date the Investment Adviser may not terminate the arrangements without the approval of the Portfolio’s Board of Trustees. If these arrangements are discontinued in the future, the expense ratios may change without shareholder approval. |
| | | | | | | | | | | | | | |
| | STANDARDIZED AFTER-TAX PERFORMANCE AS OF 6/30/177 | |
| | | Class A Shares | | One Year | | | Five Years | | | Since Inception
(4/30/08) | |
| | Returns before taxes* | | | 10.35 | % | | | 9.86 | % | | | 5.36 | % |
| | Returns after taxes on distributions** | | | 10.21 | | | | 9.32 | | | | 4.95 | |
| | | Returns after taxes on distributions***
and sale of Portfolio shares | | | 6.01 | | | | 7.72 | | | | 4.19 | |
| 7 | | The after-tax returns are calculated using the historically highest individual federal marginal income tax rates at the time of distributions (currently 23.8% for qualifying ordinary income dividends and long-term capital gain distributions and 43.4% for non-qualifying ordinary income dividends) and do not reflect state and local taxes. Actual after-tax returns will be calculated at calendar year-end and depend on an investor’s tax situation and may differ from those shown. In addition, the after-tax returns shown are not relevant to investors who hold Portfolio shares through tax-deferred arrangements such as 401(k) plans or individual retirement accounts. Under certain circumstances, the addition of the tax benefits from capital losses resulting from redemptions may cause the Returns After Taxes on Distributions and Sale of Portfolio Shares to be greater than the Returns After Taxes on Distributions or even Returns Before Taxes. Standardized after-tax returns assume reinvestment of all distributions at NAV and reflect a maximum initial sales charge of 5.5% for Class A Shares. |
| * | | Returns Before Taxes do not reflect taxes on distributions on the Portfolio’s Class A Shares nor do they show how performance can be impacted by taxes when shares are redeemed. |
| ** | | Returns After Taxes on Distributions assume that taxes are paid on distributions on the Portfolio’s Class A Shares (i.e., dividends and capital gains) but do not reflect taxes that may be incurred upon redemption of the Class A Shares at the end of the performance period. |
| *** | | Returns After Taxes on Distributions and Sale of Portfolio Shares reflect taxes paid on distributions on the Portfolio’s Class A Shares and taxes applicable when the shares are redeemed. |
15
FUND BASICS
|
| OVERALL UNDERLYING FUND WEIGHTINGS8,9 |
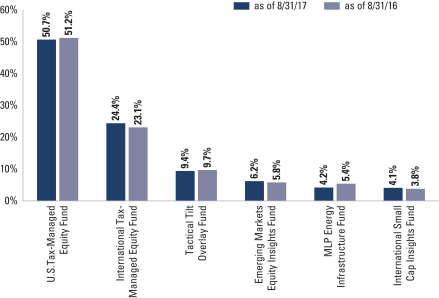
| | 8 | | The Portfolio is actively managed and, as such, its composition may differ over time. The percentage shown for each Underlying Fund reflects the value of that Underlying Fund as a percentage of net assets of the Portfolio. Figures in the graph above may not sum to 100% due to rounding and/or exclusion of other assets and liabilities. The above graph depicts the Portfolio’s investments but may not represent the Portfolio’s market exposure due to the exclusion of certain derivatives, if any, as listed in the Additional Investment Information section of the Schedule of Investments. |
| | 9 | | Represents affiliated Funds. |
16
GOLDMAN SACHS TAX-ADVANTAGED GLOBAL EQUITY PORTFOLIO
Performance Summary
August 31, 2017
The following graph shows the value, as of August 31, 2017, of a $1,000,000 investment made on April 30, 2008 (commencement of operations) in Institutional Shares at NAV. For comparative purposes, the performance of the Portfolio’s benchmark the Tax-Advantaged Global Composite Index (“TAG Composite Index”), which is comprised of 10% of the Bloomberg Barclays U.S. Aggregate Bond Index, and 90% of the Morgan Stanley Capital International (MSCI) All Country World Index (ACWI) Investable Market Index (IMI) (“MSCI ACWI IMI”) (Net, USD, Unhedged), are shown. This performance data represents past performance and should not be considered indicative of future performance, which will fluctuate with changes in market conditions. These performance fluctuations may cause an investor’s shares, when redeemed, to be worth more or less than their original cost. Performance reflects expense limitations currently in effect and in their absence, performance would be reduced. Returns do not reflect the deduction of taxes that a shareholder would pay on Portfolio distributions or the redemption of Portfolio shares. Performance of Institutional Shares will vary from Class A Shares due to differences in class specific fees and any applicable sales charges. In addition to the investment adviser’s decisions regarding underlying mutual fund selection and allocations among them, other factors may affect Portfolio performance. These factors include, but are not limited to, Portfolio operating fees and expenses, portfolio turnover, and subscription and redemption cash flows affecting the Portfolio.
|
| Tax-Advantaged Global Equity Portfolio’s Lifetime Performance |
Performance of a $1,000,000 Investment, including any applicable sales charges, with distributions reinvested, from April 30, 2008 through August 31, 2017.
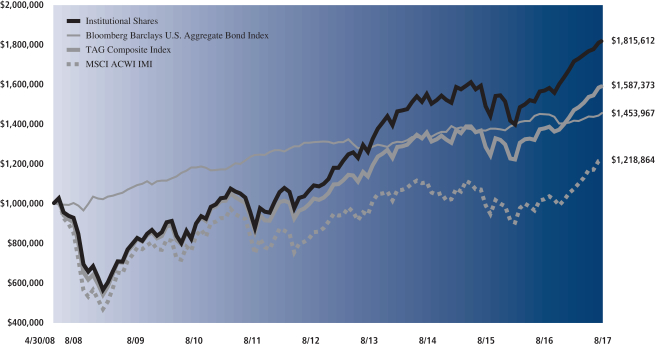
| | | | | | | | | | |
| Average Annual Total Return through August 31, 2017 | | | One Year | | | | Five Years | | | Since Inception |
Class A (Commenced April 30, 2008) | | | | | | | | | | |
Excluding sales charges | | | 15.23% | | | | 10.83% | | | 6.14% |
Including sales charges | | | 8.91% | | | | 9.58% | | | 5.51% |
|
Institutional Class (Commenced April 30, 2008) | | | 15.74% | | | | 11.26% | | | 6.57% |
|
17
MARKET REVIEW
Index Definitions
The EDGE Composite Index is a blend of 90% MSCI All Country World Index (“ACWI”) Investable Market Index® (“MSCI ACWI IMI”) and 10% Bloomberg Barclays U.S. Aggregate Bond Index.
The TAG Composite Index is a blend of 90% MSCI ACWI IMI and 10% Bloomberg Barclays U.S. Aggregate Bond Index.
The MSCI All Country World Index (“ACWI”) Investable Market Index® (“MSCI ACWI IMI”) captures large, mid and small cap representation across 23 developed markets and 24 emerging markets. The MSCI ACWI IMI is comprehensive, covering approximately 99% the global equity investment opportunity set. The 23 developed markets in the MSCI ACWI IMI include Australia, Austria, Belgium, Canada, Denmark, Finland, France, Germany, Hong Kong, Ireland, Israel, Italy, Japan, Netherlands, New Zealand, Norway, Portugal, Singapore, Spain, Sweden, Switzerland, the U.K. and the U.S. The 24 emerging markets include Brazil, Chile, China, Colombia, Czech Republic, Egypt, Greece, Hungary, India, Indonesia, South Korea, Malaysia, Mexico, Pakistan, Peru, Philippines, Poland, Russia, Qatar, South Africa, Taiwan, Thailand, Turkey and United Arab Emirates.
The Bloomberg Barclays U.S. Aggregate Bond Index is an unmanaged, broad-based index that measures the investment grade, U.S. dollar-denominated, fixed-rate taxable bond market. The index includes U.S. Treasury, government-related and corporate securities, mortgage-backed securities (agency fixed-rate and hybrid adjustable-rate mortgage pass-through securities), asset-backed securities and commercial mortgage-backed securities (agency and non-agency).
The S&P 500® Index is Standard & Poor’s index of 500 U.S. stocks, an unmanaged index of common stock prices, captures approximately 80% coverage of available U.S. market capitalization.
18
GOLDMAN SACHS ENHANCED DIVIDEND GLOBAL EQUITY PORTFOLIO
Schedule of Investments
August 31, 2017
| | | | | | | | |
Shares | | | Description | |
Value | |
| Underlying Funds (Institutional Shares)(a) – 98.4% | |
| Equity – 98.4% | |
| | 21,109,645 | | | Goldman Sachs U.S. Equity Dividend and Premium Fund | | $ | 272,525,512 | |
| | 21,357,745 | | | Goldman Sachs International Equity Dividend and Premium Fund | | | 157,193,002 | |
| | 6,254,679 | | | Goldman Sachs Tactical Tilt Overlay Fund | | | 60,858,023 | |
| | 2,196,614 | | | Goldman Sachs Small Cap Equity Insights Fund | | | 52,037,790 | |
| | 3,723,770 | | | Goldman Sachs Emerging Markets Equity Insights Fund | | | 39,993,290 | |
| | 3,739,688 | | | Goldman Sachs MLP Energy Infrastructure Fund | | | 27,449,308 | |
| | 2,036,620 | | | Goldman Sachs International Small Cap Insights Fund | | | 26,190,930 | |
| | |
| | TOTAL INVESTMENTS – 98.4% | | | | |
| | (Cost $526,075,822) | | $ | 636,247,855 | |
| | |
| OTHER ASSETS IN EXCESS OF
LIABILITIES – 1.6% | | | 10,041,735 | |
| | |
| | NET ASSETS – 100.0% | | $ | 646,289,590 | |
| | |
| | |
| The percentage shown for each investment and investment category reflects the value of the respective investment or category as a percentage of net assets. |
(a) | | Represents affiliated Funds. |
| | |
|
Investment Abbreviations: |
AUD | | —Australian Dollar |
CHF | | —Swiss Franc |
EUR | | —Euro |
GBP | | —British Pound |
JPY | | —Japanese Yen |
USD | | —United States Dollar |
|
| | |
| The accompanying notes are an integral part of these financial statements. | | 19 |
GOLDMAN SACHS ENHANCED DIVIDEND GLOBAL EQUITY PORTFOLIO
Schedule of Investments (continued)
August 31, 2017
|
| ADDITIONAL INVESTMENT INFORMATION |
FORWARD FOREIGN CURRENCY EXCHANGE CONTRACTS — At August 31, 2017, the Portfolio had the following forward foreign currency exchange contracts:
FORWARD FOREIGN CURRENCY EXCHANGE CONTRACTS WITH UNREALIZED GAIN
| | | | | | | | | | | | | | | | | | | | | | | | |
| Counterparty | | Currency Purchased | | | Currency Sold | | | Settlement Date | | | Current Value ($) | | | Unrealized Gain ($) | |
Morgan Stanley Co., Inc. | | USD | | | 14,972,015 | | | GBP | | | 11,549,415 | | | | 09/20/17 | | | | 14,942,141 | | | | 29,874 | |
| | | USD | | | 19,233,950 | | | JPY | | | 2,110,272,100 | | | | 09/20/17 | | | | 19,208,682 | | | | 25,268 | |
| TOTAL | | | | | | | | | | | | | | | | | | | | | | | 55,142 | |
FORWARD FOREIGN CURRENCY EXCHANGE CONTRACTS WITH UNREALIZED LOSS
| | | | | | | | | | | | | | | | | | | | | | | | |
| Counterparty | | Currency Purchased | | | Currency Sold | | | Settlement Date | | | Current Value ($) | | | Unrealized Loss ($) | |
Morgan Stanley Co., Inc. | | USD | | | 6,098,257 | | | AUD | | | 8,089,962 | | | | 09/20/17 | | | | 6,430,023 | | | | (331,766 | ) |
| | USD | | | 7,328,552 | | | CHF | | | 7,030,844 | | | | 09/20/17 | | | | 7,338,988 | | | | (10,436 | ) |
| | | USD | | | 26,410,892 | | | EUR | | | 23,384,225 | | | | 09/20/17 | | | | 27,859,742 | | | | (1,448,850 | ) |
| TOTAL | | | | | | | | | | | | | | | | | | | | | | | (1,791,052 | ) |
FUTURES CONTRACTS — At August 31, 2017, the Portfolio had the following futures contracts:
| | | | | | | | | | | | | | | | | | |
| Description | | Number of
Contracts | | Expiration
Date | | | Notional
Amount ($) | | | Unrealized
Appreciation/
(Depreciation) ($) | |
Long position contracts: | | | | | | | | | | | | | | | | | | |
| | | | | |
S&P 500 E-Mini Index | | 51 | | | 09/15/2017 | | | | | | | | 6,298,755 | | | | 81,752 | |
| | |
| 20 | | The accompanying notes are an integral part of these financial statements. |
GOLDMAN SACHS TAX-ADVANTAGED GLOBAL EQUITY PORTFOLIO
Schedule of Investments
August 31, 2017
| | | | | | | | |
| Shares | | | Description | |
Value | |
| Underlying Funds (Institutional Shares)(a) – 99.0% | |
| Equity – 99.0% | |
| | 53,386,683 | | | Goldman Sachs U.S. Tax-Managed Equity Fund | | $ | 1,120,052,606 | |
| | 52,167,440 | | | Goldman Sachs International Tax-Managed Equity Fund | | | 539,411,330 | |
| | 21,355,146 | | | Goldman Sachs Tactical Tilt Overlay Fund | | | 207,785,574 | |
| | 12,724,174 | | | Goldman Sachs Emerging Markets Equity Insights Fund | | | 136,657,630 | |
| | 12,748,126 | | | Goldman Sachs MLP Energy Infrastructure Fund | | | 93,571,247 | |
| | 6,958,587 | | | Goldman Sachs International Small Cap Insights Fund | | | 89,487,425 | |
| | |
| | TOTAL INVESTMENTS – 99.0% | | | | |
| | (Cost $1,604,819,975) | | $ | 2,186,965,812 | |
| | |
| OTHER ASSETS IN EXCESS OF
LIABILITIES – 1.0% | | | 21,476,672 | |
| | |
| | NET ASSETS – 100.0% | | $ | 2,208,442,484 | |
| | |
| | |
| The percentage shown for each investment and investment category reflects the value of the respective investment or category as a percentage of net assets. |
(a) | | Represents affiliated Funds. |
| | |
|
Investment Abbreviations: |
AUD | | —Australian Dollar |
CHF | | —Swiss Franc |
EUR | | —Euro |
GBP | | —British Pound |
JPY | | —Japanese Yen |
USD | | —United States Dollar |
|
| | |
| The accompanying notes are an integral part of these financial statements. | | 21 |
GOLDMAN SACHS TAX-ADVANTAGED GLOBAL EQUITY PORTFOLIO
Schedule of Investments (continued)
August 31, 2017
|
| ADDITIONAL INVESTMENT INFORMATION |
FORWARD FOREIGN CURRENCY EXCHANGE CONTRACTS — At August 31, 2017, the Portfolio had the following forward foreign currency exchange contracts:
FORWARD FOREIGN CURRENCY EXCHANGE CONTRACTS WITH UNREALIZED GAIN
| | | | | | | | | | | | | | | | | | | | | | | | |
| Counterparty | | Currency Purchased | | | Currency Sold | | | Settlement Date | | | Current Value ($) | | | Unrealized Gain ($) | |
Morgan Stanley Co., Inc. | | USD | | | 51,066,195 | | | GBP | | | 39,411,169 | | | | 09/20/17 | | | | 50,988,491 | | | | 77,704 | |
| | | USD | | | 66,518,790 | | | JPY | | | 7,289,154,282 | | | | 09/20/17 | | | | 66,349,286 | | | | 169,504 | |
| TOTAL | | | | | | | | | | | | | | | | | | | | | | | 247,208 | |
FORWARD FOREIGN CURRENCY EXCHANGE CONTRACTS WITH UNREALIZED LOSS
| | | | | | | | | | | | | | | | | | | | | | | | |
| Counterparty | | Currency Purchased | | | Currency Sold | | | Settlement Date | | | Current Value ($) | | | Unrealized Loss ($) | |
Morgan Stanley Co., Inc. | | USD | | | 20,183,532 | | | AUD | | | 26,774,774 | | | | 09/20/17 | | | | 21,280,992 | | | | (1,097,460 | ) |
| | USD | | | 24,966,423 | | | CHF | | | 23,972,984 | | | | 09/20/17 | | | | 25,023,659 | | | | (57,236 | ) |
| | | USD | | | 90,035,216 | | | EUR | | | 79,803,958 | | | | 09/20/17 | | | | 95,077,671 | | | | (5,042,455 | ) |
| TOTAL | | | | | | | | | | | | | | | | | | | | | | | (6,197,151 | ) |
FUTURES CONTRACTS — At August 31, 2017, the Portfolio had the following futures contracts:
| | | | | | | | | | | | | | |
| Description | | Number of Contracts | | Expiration Date | | | Notional Amount ($) | | | Unrealized Appreciation/ (Depreciation) ($) | |
Long position contracts: | | | | | | | | | | | | | | |
| | | | |
S&P 500 E-Mini Index | | 169 | | | 09/15/2017 | | | | 20,872,345 | | | | 270,904 | |
| | |
| 22 | | The accompanying notes are an integral part of these financial statements. |
GOLDMAN SACHS GLOBAL TAX-AWARE EQUITY PORTFOLIOS
Statements of Assets and Liabilities
August 31, 2017
| | | | | | | | | | |
| | | | | Enhanced Dividend
Global Equity
Portfolio | | | Tax-Advantaged
Global Equity
Portfolio | |
| | Assets: | | | | | | | | |
| | Investments in affiliated Underlying Funds, at value (cost $526,075,822 and $1,604,819,975) | | $ | 636,247,855 | | | $ | 2,186,965,812 | |
| | Cash | | | 5,918,264 | | | | 17,339,874 | |
| | Receivables: | | | | | | | | |
| | Portfolio shares sold | | | 4,943,951 | | | | 2,942,560 | |
| | Collateral on certain derivative contracts(a) | | | 2,480,000 | | | | 7,960,000 | |
| | Reimbursement from investment adviser | | | 18,611 | | | | 33,672 | |
| | Investments sold | | | — | | | | 2,123,573 | |
| | Unrealized gain on forward foreign currency exchange contracts | | | 55,142 | | | | 247,208 | |
| | Variation margin on futures | | | 36,468 | | | | 120,838 | |
| | Other assets | | | 932 | | | | 3,266 | |
| | Total assets | | | 649,701,223 | | | | 2,217,736,803 | |
| | | | | | | | | | |
| | Liabilities: | | | | | | | | |
| | Unrealized loss on forward foreign currency exchange contracts | | | 1,791,052 | | | | 6,197,151 | |
| | Payables: | | | | | | | | |
| | Portfolio shares redeemed | | | 1,240,371 | | | | 2,784,001 | |
| | Investments purchased | | | 250,411 | | | | — | |
| | Management fees | | | 43,262 | | | | 148,735 | |
| | Distribution and Service fees and Transfer Agency fees | | | 24,638 | | | | 74,568 | |
| | Accrued expenses | | | 61,899 | | | | 89,864 | |
| | Total liabilities | | | 3,411,633 | | | | 9,294,319 | |
| | | | | | | | | | |
| | Net Assets: | | | | | | | | |
| | Paid-in capital | | | 552,689,478 | | | | 1,690,482,025 | |
| | Undistributed net investment income | | | 1,083,264 | | | | 2,484,185 | |
| �� | Accumulated net realized loss | | | (16,001,027 | ) | | | (60,990,524 | ) |
| | Net unrealized gain | | | 108,517,875 | | | | 576,466,798 | |
| | | NET ASSETS | | $ | 646,289,590 | | | $ | 2,208,442,484 | |
| | | Net Assets: | | | | | | | | |
| | | Class A | | $ | 9,289,479 | | | $ | 615,404 | |
| | | Institutional | | | 637,000,111 | | | | 2,207,827,080 | |
| | | Total Net Assets | | $ | 646,289,590 | | | $ | 2,208,442,484 | |
| | | Shares outstanding $0.001 par value (unlimited shares authorized): | | | | | | | | |
| | | Class A | | | 794,283 | | | | 41,627 | |
| | | Institutional | | | 53,993,800 | | | | 149,940,434 | |
| | | Net asset value, offering and redemption price per share(b) | | | | | | | | |
| | | Class A | | $ | 11.70 | | | $ | 14.78 | |
| | | Institutional | | | 11.80 | | | | 14.72 | |
| | (a) | | Segregated for initial margin and/or collateral on transactions as follows: |
| | | | | | | | |
| Portfolio | | Forwards | | | Futures | |
Enhanced Dividend Global Equity | | $ | 2,030,000 | | | $ | 450,000 | |
Tax-Advantaged Global Equity | | | 6,970,000 | | | | 990,000 | |
| | (b) | | Maximum public offering price per share for Class A Shares of the Enhanced Dividend Global Equity and Tax-Advantaged Global Equity Portfolios is $12.38 and $15.64, respectively. |
| | |
| The accompanying notes are an integral part of these financial statements. | | 23 |
GOLDMAN SACHS GLOBAL TAX-AWARE EQUITY PORTFOLIOS
Statements of Operations
For the Fiscal Year Ended August 31, 2017
| | | | | | | | | | |
| | | | | Enhanced Dividend
Global Equity
Portfolio | | | Tax-Advantaged
Global Equity
Portfolio | |
| | Investment income: | |
| | Dividends from affiliated Underlying Funds | | $ | 11,862,835 | | | $ | 27,888,414 | |
| | | | | | | | | | |
| | Expenses: | | | | | | | | |
| | Management fees | | | 863,275 | | | | 3,003,400 | |
| | Transfer Agency fees(a) | | | 241,420 | | | | 801,734 | |
| | Custody, accounting and administrative services | | | 91,000 | | | | 248,832 | |
| | Professional fees | | | 60,409 | | | | 60,409 | |
| | Registration fees | | | 53,938 | | | | 55,744 | |
| | Printing and mailing costs | | | 26,233 | | | | 44,292 | |
| | Distribution and Service fees — Class A Shares | | | 18,834 | | | | 1,386 | |
| | Trustee fees | | | 18,720 | | | | 21,826 | |
| | Other | | | 19,720 | | | | 69,755 | |
| | Total expenses | | | 1,393,549 | | | | 4,307,378 | |
| | Less — expense reductions | | | (596,247 | ) | | | (1,633,511 | ) |
| | Net expenses | | | 797,302 | | | | 2,673,867 | |
| | NET INVESTMENT INCOME | | | 11,065,533 | | | | 25,214,547 | |
| | | | | | | | | | |
| | Realized and unrealized gain (loss): | | | | | | | | |
| | Net realized gain (loss) from: | | | | | | | | |
| | Investments in affiliated Underlying Funds | | | (1,003,510 | ) | | | (4,249,665 | ) |
| | Futures contracts | | | 895,430 | | | | 3,106,926 | |
| | Forward foreign currency exchange contracts | | | 1,304,729 | | | | 4,885,606 | |
| | Foreign currency transactions | | | (56 | ) | | | (169 | ) |
| | Capital gain distributions from affiliated Underlying Funds | | | 8,161,937 | | | | — | |
| | Net change in unrealized gain (loss) on: | | | | | | | | |
| | Investments in affiliated Underlying Funds | | | 49,746,340 | | | | 270,313,000 | |
| | Futures contracts | | | (116,420 | ) | | | (424,230 | ) |
| | Forward foreign currency exchange contracts | | | (2,087,355 | ) | | | (7,299,059 | ) |
| | Net realized and unrealized gain | | | 56,901,095 | | | | 266,332,409 | |
| | NET INCREASE IN NET ASSETS RESULTING FROM OPERATIONS | | $ | 67,966,628 | | | $ | 291,546,956 | |
| | (a) | | Class specific Transfer Agency fees were as follows: |
| | | | | | | | |
| | | Transfer Agency Fees | |
Portfolio | | Class A | | | Institutional | |
Enhanced Dividend Global Equity | | $ | 14,226 | | | $ | 227,194 | |
Tax-Advantaged Global Equity | | | 1,047 | | | | 800,687 | |
| | |
| 24 | | The accompanying notes are an integral part of these financial statements. |
GOLDMAN SACHS GLOBAL TAX-AWARE EQUITY PORTFOLIOS
Statements of Changes in Net Assets
| | | | | | | | | | | | | | | | | | | | | | |
| | | | | Enhanced Dividend Global Equity
Portfolio | | | | | | Tax-Advantaged Global Equity
Portfolio | |
| | | | | For the
Fiscal Year Ended
August 31, 2017 | | | For the
Fiscal Year Ended
August 31, 2016 | | | | | | For the
Fiscal Year Ended
August 31, 2017 | | | For the
Fiscal Year Ended
August 31, 2016 | |
| | From operations: | |
| | Net investment income | | $ | 11,065,533 | | | $ | 7,274,603 | | | | | | | $ | 25,214,547 | | | $ | 15,969,302 | |
| | Net realized gain (loss) | | | 9,358,530 | | | | (3,065,544 | ) | | | | | | | 3,742,698 | | | | (42,049,388 | ) |
| | Net change in unrealized gain | | | 47,542,565 | | | | 31,435,529 | | | | | | | | 262,589,711 | | | | 118,927,022 | |
| | Net increase in net assets resulting from operations | | | 67,966,628 | | | | 35,644,588 | | | | | | | | 291,546,956 | | | | 92,846,936 | |
| | | | | | | | | | | | | | | | | | | | | | |
| | Distributions to shareholders: | | | | | | | | | | | | | | | | | | | | |
| | From net investment income | | | | | | | | | | | | | | | | | | | | |
| | Class A Shares | | | (132,791 | ) | | | (72,552 | ) | | | | | | | (3,269 | ) | | | (9,103 | ) |
| | Institutional Shares | | | (11,362,300 | ) | | | (14,729,798 | ) | | | | | | | (21,198,986 | ) | | | (30,328,763 | ) |
| | From net realized gains | | | | | | | | | | | | | | | | | | | | |
| | Class A Shares | | | (41,151 | ) | | | (64,848 | ) | | | | | | | — | | | | (4,676 | ) |
| | Institutional Shares | | | (3,506,959 | ) | | | (13,622,832 | ) | | | | | | | — | | | | (12,749,009 | ) |
| | Total distributions to shareholders | | | (15,043,201 | ) | | | (28,490,030 | ) | | | | | | | (21,202,255 | ) | | | (43,091,551 | ) |
| | | | | | | | | | | | | | | | | | | | | | |
| | From share transactions: | | | | | | | | | | | | | | | | | | | | |
| | Proceeds from sales of shares | | | 118,289,334 | | | | 137,088,130 | | | | | | | | 311,048,414 | | | | 357,491,366 | |
| | Reinvestment of distributions | | | 15,008,368 | | | | 28,464,540 | | | | | | | | 21,200,470 | | | | 43,074,642 | |
| | Cost of shares redeemed | �� | | (52,769,501 | ) | | | (85,794,058 | ) | | | | | | | (211,652,542 | ) | | | (334,588,511 | ) |
| | Net increase in net assets resulting from share transactions | | | 80,528,201 | | | | 79,758,612 | | | | | | | | 120,596,342 | | | | 65,977,497 | |
| | TOTAL INCREASE | | | 133,451,628 | | | | 86,913,170 | | | | | | | | 390,941,043 | | | | 115,732,882 | |
| | | | | | | | | | | | | | | | | | | | | | |
| | Net assets: | | | | | | | | | | | | | | | | | | | | |
| | Beginning of year | | | 512,837,962 | | | | 425,924,792 | | | | | | | | 1,817,501,441 | | | | 1,701,768,559 | |
| | End of year | | $ | 646,289,590 | | | $ | 512,837,962 | | | | | | | $ | 2,208,442,484 | | | $ | 1,817,501,441 | |
| | Undistributed (distributions in excess of) net investment income | | $ | 1,083,264 | | | $ | 2 | | | | | | | $ | 2,484,185 | | | $ | (1,527,938 | ) |
| | |
| The accompanying notes are an integral part of these financial statements. | | 25 |
GOLDMAN SACHS ENHANCED DIVIDEND GLOBAL EQUITY PORTFOLIO
Financial Highlights
Selected Data for a Share Outstanding Throughout Each Year
| | | | | | | | | | | | | | | | | | | | | | | | | | | | | | |
| | | | | | | | Income (loss) from
investment operations | | | Distributions
to shareholders | |
| | | Year - Share Class | | Net asset
value,
beginning
of year | | | Net
investment
income(a)(b) | | | Net realized
and unrealized
gain (loss) | | | Total from
investment
operations | | | From net
investment
income | | | From net
realized
gains | | | Total
distributions | |
| | FOR THE FISCAL YEARS ENDED AUGUST 31, | |
| | 2017 - A | | $ | 10.68 | | | $ | 0.17 | | | $ | 1.12 | | | $ | 1.29 | | | $ | (0.20 | ) | | $ | (0.07 | ) | | $ | (0.27 | ) |
| | 2017 - Institutional | | | 10.76 | | | | 0.22 | | | | 1.12 | | | | 1.34 | | | | (0.23 | ) | | | (0.07 | ) | | | (0.30 | ) |
| | 2016 - A | | | 10.69 | | | | 0.11 | | | | 0.52 | | | | 0.63 | | | | (0.31 | ) | | | (0.33 | ) | | | (0.64 | ) |
| | 2016 - Institutional | | | 10.76 | | | | 0.16 | | | | 0.51 | | | | 0.67 | | | | (0.34 | ) | | | (0.33 | ) | | | (0.67 | ) |
| | 2015 - A | | | 11.83 | | | | 0.16 | | | | (0.73 | ) | | | (0.57 | ) | | | (0.21 | ) | | | (0.36 | ) | | | (0.57 | ) |
| | 2015 - Institutional | | | 11.89 | | | | 0.22 | | | | (0.74 | ) | | | (0.52 | ) | | | (0.25 | ) | | | (0.36 | ) | | | (0.61 | ) |
| | 2014 - A | | | 10.64 | | | | 0.23 | | | | 1.62 | | | | 1.85 | | | | (0.24 | ) | | | (0.42 | ) | | | (0.66 | ) |
| | 2014 - Institutional | | | 10.69 | | | | 0.28 | | | | 1.62 | | | | 1.90 | | | | (0.28 | ) | | | (0.42 | ) | | | (0.70 | ) |
| | 2013 - A | | | 9.73 | | | | 0.21 | | | | 1.08 | | | | 1.29 | | | | (0.27 | ) | | | (0.11 | ) | | | (0.38 | ) |
| | 2013 - Institutional | | | 9.76 | | | | 0.26 | | | | 1.09 | | | | 1.35 | | | | (0.31 | ) | | | (0.11 | ) | | | (0.42 | ) |
| | (a) | | Calculated based on the average shares outstanding methodology. |
| | (b) | | Recognition of net investment income by the Portfolio is affected by the timing of declaration of dividends by the Underlying Funds in which the Portfolio invests. |
| | (c) | | Assumes investment at the net asset value at the beginning of the year, reinvestment of all distributions, a complete redemption of the investment at the net asset value at the end of the year and no sales or redemption charges. Total returns would be reduced if a sales or redemption charge was taken into account. Returns do not reflect the impact of taxes to shareholders relating to Portfolio distributions or the redemption of Portfolio shares. |
| | (d) | | Expense ratios exclude the expenses of the Underlying Funds in which the Portfolio invests. |
| | (e) | | The portfolio turnover rate is calculated in accordance with regulatory requirements, without regard to transactions involving short term investments and certain derivatives. If such transactions were included, the portfolio turnover rate may be higher. |
| | |
| 26 | | The accompanying notes are an integral part of these financial statements. |
GOLDMAN SACHS ENHANCED DIVIDEND GLOBAL EQUITY PORTFOLIO
| | | | | | | | | | | | | | | | | | | | | | | | | | | | | | | | | | | | | | | | |
| | | | | | | | | | | | | | | | | | | | | | | | | | | | | | | | | | |
| | | Net asset value, end
of year | | | | | Total
return(c) | | | | | Net assets,
end of
year
(in 000s) | | | | | Ratio of
net expenses
to average
net assets(d) | | | | | Ratio of
total expenses
to average
net assets(d) | | | | | Ratio of
net investment
income
to average
net assets(b) | | | | | Portfolio
turnover
rate(e) | |
| | | | | | | | | | | | | | | | | | | | | | | | | | | | | | | | | | | | | | | | |
| | $ | 11.70 | | | | | | 12.25 | % | | | | $ | 9,289 | | | | | | 0.53 | % | | | | | 0.63 | % | | | | | 1.54 | % | | | | | 8 | % |
| | | 11.80 | | | | | | 12.66 | | | | | | 637,000 | | | | | | 0.13 | | | | | | 0.24 | | | | | | 1.93 | | | | | | 8 | |
| | | 10.68 | | | | | | 6.32 | | | | | | 4,993 | | | | | | 0.53 | | | | | | 0.64 | | | | | | 1.09 | | | | | | 19 | |
| | | 10.76 | | | | | | 6.67 | | | | | | 507,845 | | | | | | 0.13 | | | | | | 0.24 | | | | | | 1.58 | | | | | | 19 | |
| | | 10.69 | | | | | | (4.82 | ) | | | | | 1,729 | | | | | | 0.55 | | | | | | 0.66 | | | | | | 1.40 | | | | | | 25 | |
| | | 10.76 | | | | | | (4.29 | ) | | | | | 424,196 | | | | | | 0.17 | | | | | | 0.26 | | | | | | 1.95 | | | | | | 25 | |
| | | 11.83 | | | | | | 17.92 | | | | | | 220 | | | | | | 0.60 | | | | | | 0.66 | | | | | | 2.02 | | | | | | 14 | |
| | | 11.89 | | | | | | 18.29 | | | | | | 373,665 | | | | | | 0.20 | | | | | | 0.26 | | | | | | 2.43 | | | | | | 14 | |
| | | 10.64 | | | | | | 13.61 | | | | | | 133 | | | | | | 0.60 | | | | | | 0.68 | | | | | | 2.13 | | | | | | 40 | |
| | | 10.69 | | | | | | 14.21 | | | | | | 284,539 | | | | | | 0.20 | | | | | | 0.29 | | | | | | 2.49 | | | | | | 40 | |
| | |
| The accompanying notes are an integral part of these financial statements. | | 27 |
GOLDMAN SACHS TAX-ADVANTAGED GLOBAL EQUITY PORTFOLIO
Financial Highlights
Selected Data for a Share Outstanding Throughout Each Year
| | | | | | | | | | | | | | | | | | | | | | | | | | | | | | |
| | | | | | | | Income (loss) from
investment operations | | | Distributions
to shareholders | |
| | | Year - Share Class | | Net asset
value,
beginning
of year | | | Net
investment
income(a)(b) | | | Net realized
and unrealized
gain (loss) | | | Total from
investment
operations | | | From net
investment
income | | | From net
realized
gains | | | Total
distributions | |
| | FOR THE FISCAL YEARS ENDED AUGUST 31, | |
| | 2017 - A | | $ | 12.91 | | | $ | 0.11 | | | $ | 1.85 | | | $ | 1.96 | | | $ | (0.09 | ) | | $ | — | | | $ | (0.09 | ) |
| | 2017 - Institutional | | | 12.86 | | | | 0.17 | | | | 1.84 | | | | 2.01 | | | | (0.15 | ) | | | — | | | | (0.15 | ) |
| | 2016 - A | | | 12.58 | | | | 0.08 | | | | 0.52 | | | | 0.60 | | | | (0.18 | ) | | | (0.09 | ) | | | (0.27 | ) |
| | 2016 - Institutional | | | 12.53 | | | | 0.11 | | | | 0.53 | | | | 0.64 | | | | (0.22 | ) | | | (0.09 | ) | | | (0.31 | ) |
| | 2015 - A | | | 13.51 | | | | 0.09 | | | | (0.69 | ) | | | (0.60 | ) | | | (0.10 | ) | | | (0.23 | ) | | | (0.33 | ) |
| | 2015 - Institutional | | | 13.48 | | | | 0.17 | | | | (0.71 | ) | | | (0.54 | ) | | | (0.18 | ) | | | (0.23 | ) | | | (0.41 | ) |
| | 2014 - A | | | 11.31 | | | | 0.20 | | | | 2.31 | | | | 2.51 | | | | — | | | | (0.31 | ) | | | (0.31 | ) |
| | 2014 - Institutional | | | 11.38 | | | | 0.18 | | | | 2.39 | | | | 2.57 | | | | (0.16 | ) | | | (0.31 | ) | | | (0.47 | ) |
| | 2013 - A | | | 9.78 | | | | 0.32 | | | | 1.41 | | | | 1.73 | | | | (0.17 | ) | | | (0.03 | ) | | | (0.20 | ) |
| | 2013 - Institutional | | | 9.84 | | | | 0.15 | | | | 1.63 | | | | 1.78 | | | | (0.21 | ) | | | (0.03 | ) | | | (0.24 | ) |
| | (a) | | Calculated based on the average shares outstanding methodology. |
| | (b) | | Recognition of net investment income by the Portfolio is affected by the timing of declaration of dividends by the Underlying Funds in which the Portfolio invests. |
| | (c) | | Assumes investment at the net asset value at the beginning of the year, reinvestment of all distributions, a complete redemption of the investment at the net asset value at the end of the year and no sales or redemption charges. Total returns would be reduced if a sales or redemption charge was taken into account. Returns do not reflect the impact of taxes to shareholders relating to Portfolio distributions or the redemption of Portfolio shares. |
| | (d) | | Expense ratios exclude the expenses of the Underlying Funds in which the Portfolio invests. |
| | (e) | | The portfolio turnover rate is calculated in accordance with regulatory requirements, without regard to transactions involving short term investments and certain derivatives. If such transactions were included, the portfolio turnover rate may be higher. |
| | |
| 28 | | The accompanying notes are an integral part of these financial statements. |
GOLDMAN SACHS TAX-ADVANTAGED GLOBAL EQUITY PORTFOLIO
| | | | | | | | | | | | | | | | | | | | | | | | | | | | | | | | | | | | | | | | |
| | | | | | | | | | | | | | | | | | | | | | | | | | | | | | | | | | |
| | | Net asset
value, end
of year | | | | | Total
return(c) | | | | | Net assets, end of year (in 000s) | | | | | Ratio of
net expenses
to average
net assets(d) | | | | | Ratio of
total expenses
to average
net assets(d) | | | | | Ratio of
net investment
income
to average
net assets(b) | | | | | Portfolio
turnover
rate(e) | |
| | | | | | | | | | | | | | | | | | | | | | | | | | | | | | | | | | | | | | | | |
| | $ | 14.78 | | | | | | 15.23 | % | | | | $ | 615 | | | | | | 0.53 | % | | | | | 0.61 | % | | | | | 0.80 | % | | | | | 8 | % |
| | | 14.72 | | | | | | 15.74 | | | | | | 2,207,827 | | | | | | 0.13 | | | | | | 0.21 | | | | | | 1.26 | | | | | | 8 | |
| | | 12.91 | | | | | | 4.88 | | | | | | 591 | | | | | | 0.53 | | | | | | 0.61 | | | | | | 0.64 | | | | | | 19 | |
| | | 12.86 | | | | | | 5.22 | | | | | | 1,816,911 | | | | | | 0.13 | | | | | | 0.21 | | | | | | 0.92 | | | | | | 19 | |
| | | 12.58 | | | | | | (4.39 | ) | | | | | 543 | | | | | | 0.56 | | | | | | 0.61 | | | | | | 0.66 | | | | | | 22 | |
| | | 12.53 | | | | | | (3.96 | ) | | | | | 1,701,226 | | | | | | 0.17 | | | | | | 0.21 | | | | | | 1.31 | | | | | | 22 | |
| | | 13.51 | | | | | | 22.55 | | | | | | 235 | | | | | | 0.60 | | | | | | 0.62 | | | | | | 1.56 | | | | | | 9 | |
| | | 13.48 | | | | | | 23.05 | | | | | | 1,233,566 | | | | | | 0.20 | | | | | | 0.22 | | | | | | 1.43 | | | | | | 9 | |
| | | 11.31 | | | | | | 18.12 | | | | | | 636 | | | | | | 0.60 | | | | | | 0.64 | | | | | | 3.16 | | | | | | 36 | |
| | | 11.38 | | | | | | 18.45 | | | | | | 739,859 | | | | | | 0.20 | | | | | | 0.24 | | | | | | 1.34 | | | | | | 36 | |
| | |
| The accompanying notes are an integral part of these financial statements. | | 29 |
GOLDMAN SACHS GLOBAL TAX-AWARE EQUITY PORTFOLIOS
Notes to Financial Statements
August 31, 2017
Goldman Sachs Trust (the “Trust”) is a Delaware statutory trust registered under the Investment Company Act of 1940, as amended (the “Act”), as an open-end management investment company. The following table lists those series of the Trust that are included in this report (collectively, the “Portfolios” or individually a “Portfolio”), along with their corresponding share classes and respective diversification status under the Act:
| | | | |
| Portfolio | | Share Classes Offered | | Diversified/
Non-diversified |
Enhanced Dividend Global Equity and Tax-Advantaged Global Equity | | A and Institutional | | Diversified |
Class A Shares are sold with a front-end sales charge of up to 5.50%. Institutional Shares are not subject to a sales charge.
Goldman Sachs Asset Management, L.P. (“GSAM”), an affiliate of Goldman Sachs & Co. LLC (formerly, Goldman, Sachs & Co.) (“Goldman Sachs”), serves as investment adviser to the Portfolios pursuant to a management agreement (the “Agreement”) with the Trust.
The Portfolios are expected to invest primarily in a combination of domestic and international equity and fixed income underlying funds (“Underlying Funds”) which are registered under the Act, for which GSAM acts as the investment adviser. Additionally, these Portfolios may invest a portion of their assets directly in other securities and instruments, including unaffiliated exchange traded funds.
|
| 2. SIGNIFICANT ACCOUNTING POLICIES |
The financial statements have been prepared in accordance with accounting principles generally accepted in the United States of America (“GAAP”) and require management to make estimates and assumptions that may affect the reported amounts and disclosures. Actual results may differ from those estimates and assumptions.
A. Investment Valuation — The valuation policy of the Portfolios and Underlying Funds is to value investments at fair value.
B. Investment Income and Investments — Investment income includes interest income, dividend income, and securities lending income. Interest income is accrued daily and adjusted for amortization of premiums and accretion of discounts. Dividend income is recognized on ex-dividend date or, for certain foreign securities, as soon as such information is obtained subsequent to the ex-dividend date. Investment transactions are reflected on trade date. Realized gains and losses are calculated using identified cost. Investment transactions are recorded on the following business day for daily net asset value (“NAV”) calculations. Distributions from master limited partnerships (“MLPs”) are generally recorded based on the characterization reported on the MLP’s tax return. The Goldman Sachs MLP Energy Infrastructure Fund (the “Underlying MLP Fund”) records its pro-rata share of the income/loss and capital gains/losses, allocated from the underlying partnerships and adjusts the cost basis of the underlying partnerships accordingly. Income distributions are recognized as capital gains or income in the financial statements in accordance with the character that is distributed.
For derivative contracts, realized gains and losses are recorded upon settlement of the contract.
C. Class Allocations and Expenses — Investment income, realized and unrealized gain (loss), and non-class specific expenses of each Portfolio are allocated daily based upon the proportion of net assets of each class. Non-class specific expenses directly incurred by a Portfolio are charged to that Portfolio, while such expenses incurred by the Trust are allocated across the applicable Portfolios on a straight-line and/or pro-rata basis depending upon the nature of the expenses. Class specific expenses, where applicable, are borne by the respective share classes and include Distribution and Service and Transfer Agency fees. Expenses included in the accompanying financial statements reflect the expenses of each Portfolio and do not include any expenses associated with the Underlying Funds. Because the Underlying Funds have varied expense and fee levels and the Portfolios may own different proportions of the Underlying Funds at different times, the amount of fees and expenses incurred indirectly by each Portfolio will vary.
30
GOLDMAN SACHS GLOBAL TAX-AWARE EQUITY PORTFOLIOS
|
| 2. SIGNIFICANT ACCOUNTING POLICIES (continued) |
D. Federal Taxes and Distributions to Shareholders — It is each Portfolio’s policy to comply with the requirements of the Internal Revenue Code of 1986, as amended (the “Code”), applicable to regulated investment companies (mutual funds) and to distribute each year substantially all of its investment company taxable income and capital gains to its shareholders. Accordingly, each Portfolio is not required to make any provisions for the payment of federal income tax. Distributions to shareholders are recorded on the ex-dividend date. Income and capital gains distributions, if any, are declared and paid according to the following schedule:
| | | | | | | | |
| Portfolio | | | | Income Distributions Declared/Paid | | | | Capital Gains Distributions
Declared/Paid |
Enhanced Dividend Global Equity | | | | Quarterly | | | | Annually |
Tax-Advantaged Global Equity | | | | Annually | | | | Annually |
Net capital losses, if any, are carried forward to future fiscal years and may be used to the extent allowed by the Code to offset any future capital gains. Losses that are carried forward will retain their character as either short-term or long-term capital losses. Utilization of capital loss carryforwards will reduce the requirement of future capital gains distributions.
The characterization of distributions to shareholders for financial reporting purposes is determined in accordance with federal income tax rules, which may differ from GAAP. The source of each Portfolio’s distributions may be shown in the accompanying financial statements as either from net investment income, net realized gain or capital. Certain components of the Portfolios’ net assets on the Statements of Assets and Liabilities reflect permanent GAAP/tax differences based on the appropriate tax character.
E. Foreign Currency Translation — The accounting records and reporting currency of a Portfolio are maintained in United States (“U.S.”) dollars. Assets and liabilities denominated in foreign currencies are translated into U.S. dollars using the current exchange rates at the close of each business day. The effect of changes in foreign currency exchange rates on investments is included within net realized and unrealized gain (loss) on investments. Changes in the value of other assets and liabilities as a result of fluctuations in foreign exchange rates are included in the Statements of Operations within net change in unrealized gain (loss) on foreign currency translations. Transactions denominated in foreign currencies are translated into U.S. dollars on the date the transaction occurred, the effects of which are included within net realized gain (loss) on foreign currency transactions.
|
| 3. INVESTMENTS AND FAIR VALUE MEASUREMENTS |
U.S. GAAP defines the fair value of a financial instrument as the amount that would be received to sell an asset or paid to transfer a liability in an orderly transaction between market participants at the measurement date (i.e., the exit price); the Portfolios’ policy is to use the market approach. GAAP establishes a fair value hierarchy that prioritizes the inputs to valuation techniques used to measure fair value. The hierarchy gives the highest priority to unadjusted quoted prices in active markets for identical assets or liabilities (Level 1 measurements) and the lowest priority to unobservable inputs (Level 3 measurements). The levels used for classifying investments are not necessarily an indication of the risk associated with investing in these investments. The three levels of the fair value hierarchy are described below:
Level 1 — Unadjusted quoted prices in active markets that are accessible at the measurement date for identical, unrestricted assets or liabilities;
Level 2 — Quoted prices in markets that are not active or financial instruments for which significant inputs are observable (including, but not limited to, quoted prices for similar investments, interest rates, foreign exchange rates, volatility and credit spreads), either directly or indirectly;
Level 3 — Prices or valuations that require significant unobservable inputs (including GSAM’s assumptions in determining fair value measurement).
Changes in valuation techniques may result in transfers into or out of an assigned level within the hierarchy. In accordance with the Portfolios’ policy, transfers between different levels of the fair value hierarchy resulting from such changes are deemed to have occurred as of the beginning of the reporting period.
31
GOLDMAN SACHS GLOBAL TAX-AWARE EQUITY PORTFOLIOS
Notes to Financial Statements (continued)
August 31, 2017
|
| 3. INVESTMENTS AND FAIR VALUE MEASUREMENTS (continued) |
The Board of Trustees (“Trustees”) has approved Valuation Procedures that govern the valuation of the portfolio investments held by the Portfolios, including investments for which market quotations are not readily available. The Trustees have delegated to GSAM day-to-day responsibility for implementing and maintaining internal controls and procedures related to the valuation of the Portfolios’ investments. To assess the continuing appropriateness of pricing sources and methodologies, GSAM regularly performs price verification procedures and issues challenges as necessary to third party pricing vendors or brokers, and any differences are reviewed in accordance with the Valuation Procedures.
A. Level 1 and Level 2 Fair Value Investments — The valuation techniques and significant inputs used in determining the fair values for investments classified as Level 1 and Level 2 are as follows:
Underlying Funds — Investments in the Underlying Funds are valued at the NAV per share of the Institutional Share class of each Underlying Fund on the day of valuation. Because each Portfolio invests primarily in other mutual funds that fluctuate in value, the Portfolios’ shares will correspondingly fluctuate in value. These investments are generally classified as Level 1 of the fair value hierarchy. For information regarding an Underlying Fund’s accounting policies and investment holdings, please see the Underlying Fund’s shareholder report.
Derivative Contracts — A derivative is an instrument whose value is derived from underlying assets, indices, reference rates or a combination of these factors. A Portfolio enters into derivative transactions to hedge against changes in interest rates, securities prices, and/or currency exchange rates, to increase total return, or to gain access to certain markets or attain exposure to other underliers.
Exchange-traded derivatives, including futures and options contracts, are valued at the last sale or settlement price and typically fall within Level 1 of the fair value hierarchy. Over-the-counter (“OTC”) and centrally cleared derivatives are valued using market transactions and other market evidence, including market-based inputs to models, calibration to market-clearing transactions, broker or dealer quotations, or other alternative pricing sources. Where models are used, the selection of a particular model to value OTC and centrally cleared derivatives depends upon the contractual terms of, and specific risks inherent in, the instrument, as well as the availability of pricing information in the market. Valuation models require a variety of inputs, including contractual terms, market prices, yield curves, credit curves, measures of volatility, voluntary and involuntary prepayment rates, loss severity rates and correlations of such inputs. For OTC and centrally cleared derivatives that trade in liquid markets, model inputs can generally be verified and model selection does not involve significant management judgment. OTC and centrally cleared derivatives are classified within Level 2 of the fair value hierarchy when significant inputs are corroborated by market evidence.
i. Forward Contracts — A forward contract is a contract between two parties to buy or sell an asset at a specified price on a future date. A forward contract settlement can occur on a cash or delivery basis. Forward contracts are marked-to-market daily using independent vendor prices, and the change in value, if any, is recorded as an unrealized gain or loss. Cash and certain investments may be used to collateralize forward contracts.
A forward foreign currency exchange contract is a forward contract in which a Portfolio agrees to receive or deliver a fixed quantity of one currency for another, at a pre-determined price at a future date. All forward foreign currency exchange contracts are marked-to-market daily at the applicable forward rate. Non-deliverable forward foreign currency exchange contracts are settled with the counterparty in cash without the delivery of foreign currency.
ii. Futures Contracts — Futures contracts are contracts to buy or sell a standardized quantity of a specified commodity or security and are valued based on exchanged settlement prices or independent market quotes. Futures contracts are valued at the last settlement price, or in the absence of a sale, the last bid price for long positions and at the last ask price for short positions, at the end of each day on the board of trade or exchange upon which they are traded. Upon entering into a futures contract, a Portfolio deposits cash or securities in an account on behalf of the broker in an amount sufficient to meet the initial margin requirement. Subsequent payments are made or received by a Portfolio equal to the daily change in the contract value and are recorded as variation margin receivable or payable with a corresponding offset to unrealized gains or losses. For financial reporting purposes, cash collateral that has been pledged to cover obligations of the portfolios and cash collateral received, if any, is reported separately on the Statements of Assets and Liabilities as receivables/payables for collateral on certain derivative contracts. Non-cash collateral pledged by the Portfolios, if any, is noted in the Schedules of Investments.
32
GOLDMAN SACHS GLOBAL TAX-AWARE EQUITY PORTFOLIOS
|
| 3. INVESTMENTS AND FAIR VALUE MEASUREMENTS (continued) |
B. Level 3 Fair Value Investments — To the extent that significant inputs to valuation models and other alternative pricing sources are unobservable, or if quotations are not readily available, or if GSAM believes that such quotations do not accurately reflect fair value, the fair value of a Portfolio’s investments may be determined under Valuation Procedures approved by the Trustees. GSAM, consistent with its procedures and applicable regulatory guidance, may make an adjustment to the most recent valuation prices of either domestic or foreign securities in light of significant events to reflect what it believes to be the fair value of the securities at the time of determining a Portfolio’s NAV. Significant events which could affect a large number of securities in a particular market may include, but are not limited to: significant fluctuations in U.S. or foreign markets; market dislocations; market disruptions; or unscheduled market closings. Significant events which could also affect a single issuer may include, but are not limited to: corporate actions such as reorganizations, mergers and buy-outs; ratings downgrades; and bankruptcies.
C. Fair Value Hierarchy — The following is a summary of the Portfolios’ investments and derivatives classified in the fair value hierarchy as of August 31, 2017:
| | | | | | | | | | | | |
| | | |
| ENHANCED DIVIDEND GLOBAL EQUITY | | | | | | | | | | | | |
| | | |
| Investment Type | | Level 1 | | | Level 2 | | | Level 3 | |
| Assets | | | | | | | | | | | | |
Underlying Equity Funds | | $ | 636,247,855 | | | $ | — | | | $ | — | |
| | | |
| Derivative Type | | | | | | | | | |
| Assets(a) | | | | | | | | | | | | |
Forward Foreign Currency Exchange Contracts | | $ | — | | | $ | 55,142 | | | $ | — | |
Futures Contracts | | | 81,752 | | | | — | | | | — | |
| Total | | $ | 81,752 | | | $ | 55,142 | | | $ | — | |
| Liabilities(a) | | | | | | | | | | | | |
Forward Foreign Currency Exchange Contracts | | $ | — | | | $ | (1,791,052 | ) | | $ | — | |
| | | |
| TAX-ADVANTAGED GLOBAL EQUITY | | | | | | | | | | | | |
| | | |
| Investment Type | | Level 1 | | | Level 2 | | | Level 3 | |
| Assets | | | | | | | | | | | | |
Underlying Equity Funds | | $ | 2,186,965,812 | | | $ | — | | | $ | — | |
| | | |
| Derivative Type | | | | | | | | | |
| Assets(a) | | | | | | | | | | | | |
Forward Foreign Currency Exchange Contracts | | $ | — | | | $ | 247,208 | | | $ | — | |
Futures Contracts | | | 270,904 | | | | — | | | | — | |
| Total | | $ | 270,904 | | | $ | 247,208 | | | $ | — | |
| Liabilities(a) | | | | | | | | | | | | |
Forward Foreign Currency Exchange Contracts | | $ | — | | | $ | (6,197,151 | ) | | $ | — | |
| (a) | | Amount shown represents unrealized gain (loss) at fiscal year end. |
For further information regarding security characteristics, see the Schedules of Investments.
33
GOLDMAN SACHS GLOBAL TAX-AWARE EQUITY PORTFOLIOS
Notes to Financial Statements (continued)
August 31, 2017
|
| 4. INVESTMENTS IN DERIVATIVES |
The following tables set forth, by certain risk types, the gross value of derivative contracts as of August 31, 2017. These instruments were used as part of the Portfolios’ investment strategies and to obtain and/or manage exposure related to the risks below. The values in the tables below exclude the effects of cash collateral received or posted pursuant to these derivative contracts, and therefore are not representative of the Portfolios’ net exposure:
| | | | | | | | | | | | |
| | | |
| Enhanced Dividend Global Equity | | | | | | | | | | |
| | | | |
| Risk | | Statements of Assets
and Liabilities | | Assets | | | Statements of Assets
and Liabilities | | Liabilities | |
Currency | | Receivable for unrealized gain on forward foreign currency exchange contracts | | $ | 55,142 | | | Payable for unrealized loss on forward foreign currency exchange contracts | | $ | (1,791,052) | |
Equity | | Variation margin on certain derivative contracts | | | 81,752 | (a) | | — | | | — | |
| Total | | | | $ | 136,894 | | | | | $ | (1,791,052) | |
| | | |
| Tax-Advantaged Global Equity | | | | | | | | | | |
| | | | |
| Risk | | Statements of Assets
and Liabilities | | Assets | | | Statements of Assets
and Liabilities | | Liabilities | |
Currency | | Receivable for unrealized gain on forward foreign currency exchange contracts | | $ | 247,208 | | | Payable for unrealized loss on forward foreign currency exchange contracts | | $ | (6,197,151) | |
Equity | | Variation margin on certain derivative contracts | | | 270,904 | (a) | | — | | | — | |
| Total | | | | $ | 518,112 | | | | | $ | (6,197,151) | |
| (a) | | Includes unrealized gain (loss) on futures contracts described in the Additional Investment Information sections of the Schedules of Investments. Only the variation margin as of August 31, 2017 is reported within the Statements of Assets and Liabilities. |
The following tables set forth, by certain risk types, the Portfolios’ gains (losses) related to these derivatives and their indicative volumes for the fiscal year ended August 31, 2017. These gains (losses) should be considered in the context that these derivative contracts may have been executed to create investment opportunities and/or economically hedge certain investments, and accordingly, certain gains (losses) on such derivative contracts may offset certain (losses) gains attributable to investments. These gains (losses) are included in “Net realized gain (loss)” or “Net change in unrealized gain (loss)” on the Statements of Operations:
| | | | | | | | | | | | | | |
| | | |
| Enhanced Dividend Global Equity | | | | | | | | | | | | |
| Risk | | Statements of Operations | | Net Realized
Gain (Loss) | | | Net Change in
Unrealized
Gain (Loss) | | | Average
Number of
Contracts(a) | |
| Currency | | Net realized gain (loss) from forward foreign currency exchange contracts/Net change in unrealized gain (loss) from forward foreign currency exchange contracts | | $ | 1,304,729 | | | $ | (2,087,355 | ) | | | 8 | |
| Equity | | Net realized gain (loss) from futures contracts/Net change in unrealized gain (loss) on futures contracts | | | 895,430 | | | | (116,420 | ) | | | 50 | |
| Total | | | | $ | 2,200,159 | | | $ | (2,203,775 | ) | | | 58 | |
34
GOLDMAN SACHS GLOBAL TAX-AWARE EQUITY PORTFOLIOS
|
| 4. INVESTMENTS IN DERIVATIVES (continued) |
| | | | | | | | | | | | | | |
| | | |
| Tax-Advantaged Global Equity | | | | | | | | | | | | |
| Risk | | Statements of Operations | | Net Realized
Gain (Loss) | | | Net Change in
Unrealized
Gain (Loss) | | | Average
Number of
Contracts(a) | |
| Currency | | Net realized gain (loss) from forward foreign currency exchange contracts/Net change in unrealized gain (loss) from forward foreign currency exchange contracts | | $ | 4,885,606 | | | $ | (7,299,059 | ) | | | 8 | |
| Equity | | Net realized gain (loss) from futures contracts/Net change in unrealized gain (loss) on futures contracts | | | 3,106,926 | | | | (424,230 | ) | | | 169 | |
| Total | | | | $ | 7,992,532 | | | $ | (7,723,289 | ) | | | 177 | |
| (a) | | Average number of contracts is based on the average of month end balances for the fiscal year ended August 31, 2017. |
In order to better define its contractual rights and to secure rights that will help the Portfolios mitigate their counterparty risk, the Portfolios may enter into an International Swaps and Derivatives Association, Inc. Master Agreement (“ISDA Master Agreement”) or similar agreement with their derivatives counterparties. An ISDA Master Agreement is a bilateral agreement between a Portfolio and a counterparty that governs OTC derivatives (including forward foreign currency exchange contracts, and certain options and swaps), and typically contains, among other things, collateral posting terms and netting provisions in the event of a default and/or termination event. The provisions of the ISDA Master Agreement typically permit a single net payment in the event of a default (close-out netting) or similar event, including the bankruptcy or insolvency of the counterparty.
Collateral and margin requirements differ between exchange traded derivatives and OTC derivatives. Margin requirements are established by the broker or clearing house for exchange-traded and centrally cleared derivatives (financial futures contracts, options and centrally cleared swaps) pursuant to governing agreements for those instrument types. Brokers can ask for margin in excess of the minimum in certain circumstances. Collateral terms are contract-specific for OTC derivatives. For derivatives traded under an ISDA Master Agreement, the collateral requirements are typically calculated by netting the marked to market amount for each transaction under such agreement and comparing that amount to the value of any collateral currently pledged by the Portfolios and the counterparty. Additionally, the Portfolios may be required to post initial margin to the counterparty, the terms of which would be outlined in the confirmation of the OTC transaction.
For financial reporting purposes, cash collateral that has been pledged to cover obligations of the Portfolios and cash collateral received from the counterparty, if any, is reported separately on the Statements of Assets and Liabilities as receivables/payables for collateral on certain derivative contracts. Non-cash collateral pledged by the Portfolios, if any, is noted in the Schedules of Investments. Generally, the amount of collateral due from or to a counterparty must exceed a minimum transfer amount threshold before a transfer is required to be made. To the extent amounts due to the Portfolios from their counterparties are not fully collateralized, contractually or otherwise, the Portfolios bear the risk of loss from counterparty nonperformance. The Portfolios attempt to mitigate counterparty risk by only entering into agreements with counterparties that the Investment Adviser believes to be of good standing and by monitoring the financial stability of those counterparties.
Additionally, the netting of assets and liabilities and the offsetting of collateral pledged or received are based on contractual netting/set-off provisions in the ISDA Master Agreement or similar agreements. However, in the event of a default or insolvency of a counterparty, a court could determine that such rights are not enforceable due to the restrictions or prohibitions against the right of setoff that may be imposed in accordance with a particular jurisdiction’s bankruptcy or insolvency laws.
|
| 5. AGREEMENTS AND AFFILIATED TRANSACTIONS |
A. Management Agreement — Under the Agreement, GSAM manages the Portfolios, subject to the general supervision of the Trustees.
As compensation for the services rendered pursuant to the Agreement, the assumption of the expenses related thereto and administration of the Portfolios’ business affairs, including providing facilities, GSAM is entitled to a management fee, accrued daily and paid monthly, equal to an annual percentage rate of 0.15% of the Portfolio’s average daily net assets. GSAM has agreed
35
GOLDMAN SACHS GLOBAL TAX-AWARE EQUITY PORTFOLIOS
Notes to Financial Statements (continued)
August 31, 2017
|
| 5. AGREEMENTS AND AFFILIATED TRANSACTIONS (continued) |
to waive a portion of its management fee in order to achieve an effective rate of 0.08% as an annual percentage rate of average daily net assets of each Portfolio through at least December 29, 2017, and prior to such date, GSAM may not terminate the arrangement without the approval of the Trustees.
B. Distribution and/or Service (12b-1) Plan — The Trust, on behalf of Class A Shares of each applicable Portfolio, has adopted a Distribution and Service Plan subject to Rule 12b-1 under the Act. Under the Distribution and Service Plan, Goldman Sachs, which serves as distributor (the “Distributor”), is entitled to a fee accrued daily and paid monthly for distribution services and personal and account maintenance services, which may then be paid by Goldman Sachs to authorized dealers. These fees are equal to an annual percentage rate of 0.25% of the average daily net assets attributable to Class A Shares of the Portfolios.
C. Distribution Agreement — Goldman Sachs, as Distributor of the shares of the Portfolios pursuant to a Distribution Agreement, may retain a portion of the Class A Shares’ front end sales charge. During the fiscal year ended August 31, 2017, Goldman Sachs advised that it retained front-end sales charges of $6,857 and $46 for the Enhanced Dividend Global Equity and Tax-Advantaged Global Equity Portfolios, respectively.
D. Transfer Agency Agreement — Goldman Sachs also serves as the transfer agent of the Portfolios for a fee pursuant to the Transfer Agency Agreement. The fees charged for such transfer agency services are accrued daily and paid monthly at annual rates as follows: 0.18% of the average daily net assets of Class A Shares and 0.04% of the average daily net assets of Institutional Shares. Prior to July 28, 2017, the annual rate was 0.19% of the average daily net assets of Class A Shares.
E. Other Expense Agreements and Affiliated Transactions — GSAM has agreed to limit certain “Other Expenses” of the Portfolios (excluding acquired fund fees and expenses, transfer agency fees and expenses, service fees and shareholder administration fees (as applicable), taxes, interest, brokerage fees, expenses of shareholder meetings, litigation and indemnification, and extraordinary expenses) to the extent such expenses exceed, on an annual basis, a percentage rate of the average daily net assets of each Portfolio. Such Other Expense reimbursements, if any, are accrued daily and paid monthly. In addition, the Portfolios are not obligated to reimburse GSAM for prior fiscal year expense reimbursements, if any. These Other Expense limitations as an annual percentage rate of average daily net assets for the Portfolios is 0.014%. These Other Expense limitations will remain in place through at least December 29, 2017, and prior to such date GSAM may not terminate the arrangements without the approval of the Trustees. In addition, the Portfolios have entered into certain offset arrangements with the custodian and the transfer agent, which may result in a reduction of the Portfolios’ expenses and are received irrespective of the application of the “Other Expense” limitations described above.
For the fiscal year ended August 31, 2017, these expense reductions, including any fee waivers and Other Expense reimbursements, were as follows:
| | | | | | | | | | | | | | | | | | |
| Portfolio | | | | Management
Fee Waiver | | | Other Expense
Reimbursement | | | Custody Fee
Credits | | | Total Expense
Reductions | |
Enhanced Dividend Global Equity | | | | $ | 402,861 | | | $ | 186,578 | | | $ | 6,808 | | | $ | 596,247 | |
Tax-Advantaged Global Equity | | | | | 1,401,583 | | | | 208,819 | | | | 23,109 | | | | 1,633,511 | |
F. Line of Credit Facility — As of August 31, 2017, the Portfolios participated in a $1,100,000,000 committed, unsecured revolving line of credit facility (the “facility”) together with other funds of the Trust and certain registered investment companies having management agreements with GSAM or its affiliates. This facility is to be used for temporary emergency purposes, or to allow for an orderly liquidation of securities to meet redemption requests. The interest rate on borrowings is based on the federal funds rate. The facility also requires a fee to be paid by the Portfolios based on the amount of the commitment that has not been utilized. For the fiscal year ended August 31, 2017, the Portfolios did not have any borrowings under the facility.
36
GOLDMAN SACHS GLOBAL TAX-AWARE EQUITY PORTFOLIOS
|
| 5. AGREEMENTS AND AFFILIATED TRANSACTIONS (continued) |
G. Other Transactions with Affiliates — The Portfolios invest primarily in the Institutional Shares of the Underlying Funds. These Underlying Funds are considered to be affiliated with the Portfolios. The tables below show the transactions in and earnings from investments in these Underlying Funds for the fiscal year ended August 31, 2017:
| | | | | | | | | | | | | | | | | | | | | | | | | | | | | | | | | | | | | | | | |
|
| Enhanced Dividend Global Equity | |
Affiliated Investment
Companies | | Beginning Value
as of August 31,
2016 | | | Purchases
at Cost | | | Proceeds
from Sales | | | Return of Capital
on Dividends | | | Net Realized
Gain(Loss) on
sales of
Affiliated
Investment
Companies | | | Change in
Unrealized
Appreciation/
(Depreciation) | | | Ending Value
as of
August 31, 2017 | | | Shares as of
August 31, 2017 | | | Dividend
Income from
Affiliated
Investment
Companies | | | Capital Gain
Distributions
from Affiliated
Investment
Companies | |
Goldman Sachs Emerging Markets Equity Insights Fund | | $ | 29,257,840 | | | $ | 7,133,153 | | | $ | (5,116,289 | ) | | $ | — | | | $ | 79,965 | | | $ | 8,638,621 | | | $ | 39,993,290 | | | | 3,723,770 | | | $ | 365,707 | | | $ | — | |
Goldman Sachs International Equity Dividend and Premium Fund | | | 119,638,684 | | | | 31,301,938 | | | | (12,594,433 | ) | | | — | | | | (1,182,627 | ) | | | 20,029,440 | | | | 157,193,002 | | | | 21,357,745 | | | | 3,910,956 | | | | — | |
Goldman Sachs International Small Cap Insights Fund | | | 19,487,429 | | | | 4,590,299 | | | | (2,214,452 | ) | | | — | | | | 33,184 | | | | 4,294,470 | | | | 26,190,930 | | | | 2,036,620 | | | | 520,119 | | | | — | |
Goldman Sachs MLP Energy Infrastructure Fund | | | 27,501,403 | | | | 7,273,872 | | | | (4,636,289 | ) | | | (368,702 | ) | | | (280,641 | ) | | | (2,040,335 | ) | | | 27,449,308 | | | | 3,739,688 | | | | 1,257,725 | | | | — | |
Goldman Sachs Small Cap Equity Insights Fund | | | 44,708,447 | | | | 9,355,150 | | | | (7,238,315 | ) | | | — | | | | 556,712 | | | | 4,655,796 | | | | 52,037,790 | | | | 2,196,614 | | | | 288,171 | | | | — | |
Goldman Sachs Tactical Tilt Overlay Fund | | | 49,452,111 | | | | 13,588,679 | | | | (2,237,503 | ) | | | — | | | | (151,516 | ) | | | 206,252 | | | | 60,858,023 | | | | 6,254,679 | | | | 979,065 | | | | — | |
Goldman Sachs U.S. Equity Dividend and Premium Fund | | | 217,157,439 | | | | 52,678,566 | | | | (11,214,002 | ) | | | — | | | | (58,587 | ) | | | 13,962,096 | | | | 272,525,512 | | | | 21,109,645 | | | | 4,541,092 | | | | 8,161,937 | |
Total | | | | | | | | | | | | | | | | | | $ | (1,003,510 | ) | | $ | 49,746,340 | | | $ | 636,247,855 | | | | | | | $ | 11,862,835 | | | $ | 8,161,937 | |
37
GOLDMAN SACHS GLOBAL TAX-AWARE EQUITY PORTFOLIOS
Notes to Financial Statements (continued)
August 31, 2017
|
| 5. AGREEMENTS AND AFFILIATED TRANSACTIONS (continued) |
| | | | | | | | | | | | | | | | | | | | | | | | | | | | | | | | | | | | |
|
| Tax-Advantaged Global Equity | |
Affiliated Investment
Companies | | Beginning Value
as of August 31,
2016 | | | Purchases
at Cost | | | Proceeds
from Sales | | | Return of Capital
on Dividends | | | Net Realized
Gain(Loss) on
sales of
Affiliated
Investment
Companies | | | Change in
Unrealized
Appreciation/
(Depreciation) | | | Ending Value
as of
August 31, 2017 | | | Shares as of
August 31, 2017 | | | Dividend
Income from
Affiliated
Investment
Companies | |
Goldman Sachs Emerging Markets Equity Insights Fund | | $ | 104,981,126 | | | $ | 20,053,647 | | | $ | (18,546,607 | ) | | $ | — | | | $ | 303,309 | | | $ | 29,866,155 | | | $ | 136,657,630 | | | | 12,724,174 | | | $ | 1,287,552 | |
Goldman Sachs International Small Cap Insights Fund | | | 69,371,196 | | | | 12,901,730 | | | | (7,744,803 | ) | | | — | | | | 249,568 | | | | 14,709,734 | | | | 89,487,425 | | | | 6,958,587 | | | | 1,830,637 | |
Goldman Sachs International Tax-Managed Equity Fund | | | 419,846,351 | | | | 77,418,488 | | | | (44,866,568 | ) | | | — | | | | 11,596 | | | | 87,001,463 | | | | 539,411,330 | | | | 52,167,440 | | | | 7,608,041 | |
Goldman Sachs MLP Energy Infrastructure Fund | | | 97,868,709 | | | | 21,703,922 | | | | (16,936,607 | ) | | | (1,286,948 | ) | | | (3,889,537 | ) | | | (3,888,292 | ) | | | 93,571,247 | | | | 12,748,126 | | | | 4,330,878 | |
Goldman Sachs Tactical Tilt Overlay Fund | | | 175,989,714 | | | | 41,083,544 | | | | (9,491,216 | ) | | | — | | | | (658,686 | ) | | | 862,218 | | | | 207,785,574 | | | | 21,355,146 | | | | 3,452,079 | |
Goldman Sachs U.S. Tax-Managed Equity Fund | | | 931,079,503 | | | | 118,124,531 | | | | (70,647,235 | ) | | | — | | | | (265,915 | ) | | | 141,761,722 | | | | 1,120,052,606 | | | | 53,386,683 | | | | 9,379,227 | |
Total | | | | | | | | | | | | | | | | | | $ | (4,249,665 | ) | | $ | 270,313,000 | | | $ | 2,186,965,812 | | | | | | | $ | 27,888,414 | |
| * | | Includes reinvestment of distributions. |
As of August 31, 2017, the Portfolios were beneficial owners of 5% or more of total outstanding shares of the following Funds:
| | | | | | | | |
| Underlying Funds | | Enhanced Dividend
Global Equity | | | Tax-Advantaged
Global Equity | |
Goldman Sachs Emerging Markets Equity Insights Fund | | | — | % | | | 8 | % |
Goldman Sachs International Equity Dividend and Premium Fund | | | 38 | | | | — | |
Goldman Sachs International Tax-Managed Equity Fund | | | — | | | | 86 | |
Goldman Sachs Small Cap Equity Insights Fund | | | 19 | | | | — | |
Goldman Sachs U.S. Equity Dividend and Premium Fund | | | 8 | | | | — | |
Goldman Sachs U.S. Tax-Managed Equity Fund | | | — | | | | 86 | |
|
| 6. PORTFOLIO SECURITIES TRANSACTIONS |
The cost of purchases and proceeds from sales and maturities of long-term securities for the fiscal year ended August 31, 2017, were as follows:
| | | | | | | | | | |
| Portfolio | | | | Purchases | | | Sales | |
Enhanced Dividend Global Equity | | | | $ | 125,921,657 | | | $ | 45,251,283 | |
Tax-Advantaged Global Equity | | | | | 291,285,862 | | | | 168,233,036 | |
38
GOLDMAN SACHS GLOBAL TAX-AWARE EQUITY PORTFOLIOS
The tax character of distributions paid during the fiscal year ended August 31, 2017 was as follows:
| | | | | | | | |
| | | Enhanced Dividend
Global Equity | | | Tax-Advantaged
Global Equity | |
Distributions paid from: | | | | | | | | |
Ordinary income | | $ | 11,812,401 | | | $ | 21,202,255 | |
Net long-term capital gains | | | 3,230,800 | | | | — | |
Total taxable distributions | | $ | 15,043,201 | | | $ | 21,202,255 | |
The tax character of distributions paid during the fiscal year ended August 31, 2016 was as follows:
| | | | | | | | |
| | | Enhanced Dividend
Global Equity | | | Tax-Advantaged
Global Equity | |
Distributions paid from: | | | | | | | | |
Ordinary income | | $ | 23,736,355 | | | $ | 37,773,057 | |
Net long-term capital gains | | | 4,753,675 | | | | 5,318,494 | |
Total taxable distributions | | $ | 28,490,030 | | | $ | 43,091,551 | |
As of August 31, 2017, the components of accumulated earnings (losses) on a tax-basis were as follows:
| | | | | | | | |
| | | Enhanced Dividend
Global Equity | | | Tax-Advantaged
Global Equity | |
Undistributed ordinary income — net | | $ | 1,083,262 | | | $ | 2,484,354 | |
Undistributed long-term capital gains | | | 6,235,830 | | | | — | |
Total undistributed earnings | | $ | 7,319,092 | | | $ | 2,484,354 | |
Capital Loss Carryforwards | | | | | | | | |
Perpetual Long-Term | | | — | | | | (10,834,604 | ) |
Timing differences (Post October Capital Loss Deferral/Qualified Late Year Loss Deferral) | | | (306,377 | ) | | | (5,524,942 | ) |
Unrealized gains — net | | | 86,587,397 | | | | 531,835,651 | |
Total accumulated earnings | | $ | 93,600,112 | | | $ | 517,960,459 | |
As of August 31, 2017, the Portfolios’ aggregate security unrealized gains and losses based on cost for U.S. federal income tax purposes were as follows:
| | | | | | | | |
| | | Enhanced Dividend
Global Equity | | | Tax-Advantaged
Global Equity | |
Tax cost | | $ | 548,006,300 | | | $ | 1,649,451,122 | |
Gross unrealized gain | | | 116,032,471 | | | | 604,964,028 | |
Gross unrealized loss | | | (29,445,074 | ) | | | (73,128,377 | ) |
Net unrealized gain | | $ | 86,587,397 | | | $ | 531,835,651 | |
The difference between GAAP-basis and tax-basis unrealized gains (losses) is attributable primarily to wash sales, net mark to market gains (losses) on regulated futures and net mark to market gains (losses) on foreign currency contracts.
39
GOLDMAN SACHS GLOBAL TAX-AWARE EQUITY PORTFOLIOS
Notes to Financial Statements (continued)
August 31, 2017
|
| 7. TAX INFORMATION (continued) |
In order to present certain components of the Portfolios’ capital accounts on a tax-basis, certain reclassifications have been recorded to the Portfolios’ accounts. These reclassifications have no impact on the NAV of the Portfolios and result primarily from differences in the tax treatment of foreign currency transactions and underlying fund investments.
| | | | | | | | |
| | | Accumulated
Net realized
Gains (Loss) | | | Undistributed
Net Investment
Income (Loss) | |
Enhanced Dividend Global Equity | | $ | (1,512,820 | ) | | $ | 1,512,820 | |
Tax-Advantaged Global Equity | | | 169 | | | | (169 | ) |
GSAM has reviewed the Portfolios’ tax positions for all open tax years (the current and prior three years, as applicable) and has concluded that no provision for income tax is required in the Portfolios’ financial statements. Such open tax years remain subject to examination and adjustment by tax authorities.
The Portfolios’ and Underlying Funds’ risks include, but are not limited to, the following:
Derivatives Risk — The Portfolios’ use of derivatives may result in loss. Derivative instruments, which may pose risks in addition to and greater than those associated with investing directly in securities, currencies or other instruments, may be illiquid or less liquid, volatile, difficult to price and leveraged so that small changes in the value of the underlying instruments may produce disproportionate losses to the Portfolios. Derivatives are also subject to counterparty risk, which is the risk that the other party in the transaction will not fulfill its contractual obligation. The use of derivatives is a highly specialized activity that involves investment techniques and risks different from those associated with investments in more traditional securities and instruments. Losses from derivatives can also result from a lack of correlation between changes in the value of derivative instruments and the portfolio assets (if any) being hedged.
Energy Sector Risk — The Underlying MLP Fund concentrates its investments in the energy sector, and will therefore be susceptible to adverse economic, environmental, business, regulatory or other occurrences affecting that sector. The energy sector has historically experienced substantial price volatility. MLPs and other companies operating in the energy sector are subject to specific risks, including, among others: fluctuations in commodity prices; reduced consumer demand for commodities such as oil, natural gas or petroleum products; reduced availability of natural gas or other commodities for transporting, processing, storing or delivering; slowdowns in new construction; extreme weather or other natural disasters; and threats of attack by terrorists on energy assets. Additionally, changes in the regulatory environment for energy companies may adversely impact their profitability. Over time, depletion of natural gas reserves and other energy reserves may also affect the profitability of energy companies.
Foreign and Emerging Countries Risk — Investing in foreign markets may involve special risks and considerations not typically associated with investing in the U.S. Foreign securities may be subject to risk of loss because of more or less foreign government regulation, less public information and less economic, political and social stability in the countries in which a Portfolio or an Underlying Fund invests. The imposition of exchange controls (including repatriation restrictions), confiscations, trade restrictions (including tariffs) and other government restrictions by the U.S. or other governments, or from problems in share registration, settlement or custody, may also result in losses. Foreign risk also involves the risk of negative foreign currency rate fluctuations, which may cause the value of securities denominated in such foreign currency (or other instruments through which a Portfolio or an Underlying Fund has exposure to foreign currencies) to decline in value. Currency exchange rates may fluctuate significantly over short periods of time. To the extent that a Portfolio or an Underlying Fund also invests in securities of issuers located in emerging markets, these risks may be more pronounced.
Investments in the Underlying Funds — The Portfolios invest primarily in a combination of Underlying Funds, and are subject to the risk factors associated with the investments of those Underlying Funds in direct proportion to the amount of assets
40
GOLDMAN SACHS GLOBAL TAX-AWARE EQUITY PORTFOLIOS
|
| 8. OTHER RISKS (continued) |
allocated to each. As of August 31, 2017, the Enhanced Dividend Global Equity Portfolio invested 42.2% and 24.3% of its net assets in the Goldman Sachs U.S. Equity Dividend and Premium Fund (the “U.S. Equity Dividend and Premium Fund”) and the Goldman Sachs International Equity Dividend and Premium Fund (the “International Equity Dividend and Premium Fund”), respectively. Because of the high concentration of its assets in these Underlying Funds, the Enhanced Dividend Global Equity Portfolio has greater exposure to the risks associated with these Underlying Funds than it does to the risks associated with the other Underlying Funds in which it invests. The U.S. Equity Dividend and Premium Fund invests primarily in dividend paying equity investments in large-capitalization U.S. equity issuers, with public stock market capitalizations within the range of the market capitalization of the S&P 500® at the time of investment. This Underlying Fund expects that, under normal circumstances, it will write call options on the S&P 500® Index or related exchange-traded funds in an amount that is between 25% and 75% of the value of its portfolio. The International Equity Dividend and Premium Fund invests primarily in dividend-paying equity investments in companies that are organized outside the U.S. or whose securities are principally traded outside the U.S. with public stock market capitalizations within the range of capitalization of the Morgan Stanley Capital International (“MSCI”) Europe, Australasia, Far East (“EAFE”) Index (“MSCI EAFE Index”) at the time of investment. This Underlying Fund expects that, under normal circumstances, it will write call options on the MSCI EAFE Index, other national or regional stock market indices or related exchange-traded funds in an amount that is between 25% and 75% of the value of its portfolio.
As August 31, 2017, the Tax-Advantaged Global Equity Portfolio invested 50.7% and 24.4% of its net assets in the Goldman Sachs U.S. Tax-Managed Equity Fund (the “U.S. Tax-Managed Equity Fund”) and the Goldman Sachs International Tax-Managed Equity Fund (the “International Tax-Managed Equity Fund”), respectively. Because of the high concentration of its assets in these Underlying Funds, the Tax-Advantaged Global Equity Portfolio has greater exposure to the risks associated with these Underlying Funds than it does to the risks associated with the other Underlying Funds in which it invests. The U.S. Tax-Managed Equity Fund invests in a broadly diversified portfolio of equity investments in U.S. issuers, including foreign issuers that are traded in the U.S. This Underlying Fund will seek to maintain risk, style, capitalization and industry characteristics similar to the Russell 3000 Index. The International Tax-Managed Equity Fund invests primarily in international equity securities. This Underlying Fund will seek to maintain risk, style, capitalization and industry characteristics similar to the MSCI EAFE Index. The investment adviser may seek tax-efficiency by offsetting gains and losses, limiting portfolio turnover or selling high tax basis securities for both Underlying Funds.
The Portfolios do not invest in the Underlying Funds for the purpose of exercising management or control; however, investments by the Portfolios within their principal investment strategies may represent a significant portion of an Underlying Fund’s net assets.
Large Shareholder Transactions Risk — A Portfolio or an Underlying Fund may experience adverse effects when certain large shareholders, such as other funds, institutional investors (including those trading by use of non-discretionary mathematical formulas), financial intermediaries (who may make investment decisions on behalf of underlying clients and/or include a Portfolio or an Underlying Fund in their investment model), individuals, accounts and Goldman Sachs affiliates, purchase or redeem large amounts of shares of a Portfolio or an Underlying Fund. Such large shareholder redemptions may cause a Portfolio or an Underlying Fund to sell portfolio securities at times when it would not otherwise do so, which may negatively impact a Portfolio’s or an Underlying Fund’s NAV and liquidity. These transactions may also accelerate the realization of taxable income to shareholders if such sales of investments resulted in gains, and may also increase transaction costs. In addition, a large redemption could result in a Portfolio’s or an Underlying Fund’s current expenses being allocated over a smaller asset base, leading to an increase in the Portfolio’s or the Underlying Fund’s expense ratio. Similarly, large Portfolio or Underlying Fund share purchases may adversely affect a Portfolio’s or an Underlying Fund’s performance to the extent that the Portfolio or the Underlying Fund is delayed in investing new cash and is required to maintain a larger cash position than it ordinarily would.
Liquidity Risk — An Underlying Fund may make investments that are illiquid or that may become less liquid in response to market developments or adverse investor perceptions. Illiquid investments may be more difficult to value. Liquidity risk may also refer to the risk that a Portfolio will not be able to pay redemption proceeds within the allowable time period because of unusual market conditions, an unusually high volume of redemption requests, or other reasons. To meet redemption requests, a Portfolio may be forced to sell investments at an unfavorable time and/or under unfavorable conditions. Liquidity risk may be the result of,
41
GOLDMAN SACHS GLOBAL TAX-AWARE EQUITY PORTFOLIOS
Notes to Financial Statements (continued)
August 31, 2017
|
| 8. OTHER RISKS (continued) |
among other things, the reduced number and capacity of traditional market participants to make a market in fixed income securities or the lack of an active market. The potential for liquidity risk may be magnified by a rising interest rate environment or other circumstances where investor redemptions from fixed income mutual funds may be higher than normal, potentially causing increased supply in the market due to selling activity.
Market and Credit Risks — In the normal course of business, a Portfolio and an Underlying Fund trade financial instruments and enters into financial transactions where risk of potential loss exists due to changes in the market (market risk). Additionally, a Portfolio and/or an Underlying Fund may also be exposed to credit risk in the event that an issuer or guarantor fails to perform or that an institution or entity with which the Portfolio and the Underlying Fund have unsettled or open transactions defaults.
Under the Trust’s organizational documents, its Trustees, officers, employees and agents are indemnified, to the extent permitted by the Act and state law, against certain liabilities that may arise out of performance of their duties to the Portfolios. Additionally, in the course of business, the Portfolios enter into contracts that contain a variety of indemnification clauses. The Portfolios’ maximum exposure under these arrangements is unknown, as this would involve future claims that may be made against the Portfolios that have not yet occurred. However, GSAM believes the risk of loss under these arrangements to be remote.
Subsequent events after the Statements of Assets and Liabilities date have been evaluated, and GSAM has concluded that there is no impact requiring adjustment or disclosure in the financial statements.
|
| 11. SUMMARY OF SHARE TRANSACTIONS |
Share activity is as follows:
| | | | | | | | | | | | | | | | |
| | | Enhanced Dividend Global Equity Portfolio | |
| | | For the Fiscal Year Ended
August 31, 2017 | | | For the Fiscal Year Ended
August 31, 2016 | |
| | | | |
| | | Shares | | | Dollars | | | Shares | | | Dollars | |
| | | | |
| Class A Shares | | | | | | | | | | | | | | | | |
Shares sold | | | 587,434 | | | $ | 6,559,204 | | | | 333,387 | | | $ | 3,394,652 | |
Reinvestment of distributions | | | 15,220 | | | | 168,144 | | | | 12,636 | | | | 128,549 | |
Shares redeemed | | | (275,640 | ) | | | (3,110,263 | ) | | | (40,422 | ) | | | (412,570 | ) |
| | | | 327,014 | | | | 3,617,085 | | | | 305,601 | | | | 3,110,631 | |
| Institutional Shares | | | | | | | | | | | | | | | | |
Shares sold | | | 9,888,524 | | | | 111,730,130 | | | | 13,147,341 | | | | 133,693,478 | |
Reinvestment of distributions | | | 1,333,001 | | | | 14,840,224 | | | | 2,766,887 | | | | 28,335,991 | |
Shares redeemed | | | (4,411,203 | ) | | | (49,659,238 | ) | | | (8,171,797 | ) | | | (85,381,488 | ) |
| | | | 6,810,322 | | | | 76,911,116 | | | | 7,742,431 | | | | 76,647,981 | |
NET INCREASE | | | 7,137,336 | | | $ | 80,528,201 | | | | 8,048,032 | | | $ | 79,758,612 | |
42
GOLDMAN SACHS GLOBAL TAX-AWARE EQUITY PORTFOLIOS
|
| 11. SUMMARY OF SHARE TRANSACTIONS (continued) |
Share activity is as follows:
| | | | | | | | | | | | | | | | |
| | | Tax-Advantaged Global Equity Portfolio | |
| | | For the Fiscal Year Ended
August 31, 2017 | | | For the Fiscal Year Ended
August 31, 2016 | |
| | | | |
| | | Shares | | | Dollars | | | Shares | | | Dollars | |
| | | | |
| Class A Shares | | | | | | | | | | | | | | | | |
Shares sold | | | 6,967 | | | $ | 100,062 | | | | 13,301 | | | $ | 169,147 | |
Reinvestment of distributions | | | 244 | | | | 3,268 | | | | 1,101 | | | | 13,779 | |
Shares redeemed | | | (11,345 | ) | | | (152,128 | ) | | | (11,788 | ) | | | (142,955 | ) |
| | | | (4,134 | ) | | | (48,798 | ) | | | 2,614 | | | | 39,971 | |
| Institutional Shares | | | | | | | | | | | | | | | | |
Shares sold | | | 22,609,613 | | | | 310,948,352 | | | | 29,366,174 | | | | 357,322,219 | |
Reinvestment of distributions | | | 1,596,175 | | | | 21,197,202 | | | | 3,455,621 | | | | 43,060,863 | |
Shares redeemed | | | (15,517,596 | ) | | | (211,500,414 | ) | | | (27,315,060 | ) | | | (334,445,556 | ) |
| | | | 8,688,192 | | | | 120,645,140 | | | | 5,506,735 | | | | 65,937,526 | |
NET INCREASE | | | 8,684,058 | | | $ | 120,596,342 | | | | 5,509,349 | | | $ | 65,977,497 | |
43
Report of Independent Registered Public
Accounting Firm
To the Board of Trustees of Goldman Sachs Trust and Shareholders of the Goldman Sachs Enhanced Dividend Global Equity Portfolio and Goldman Sachs Tax-Advantaged Global Equity Portfolio:
In our opinion, the accompanying statements of assets and liabilities, including the schedules of investments, and the related statements of operations and of changes in net assets and the financial highlights present fairly, in all material respects, the financial position of the Goldman Sachs Enhanced Dividend Global Equity Portfolio and Goldman Sachs Tax-Advantaged Global Equity Portfolio (collectively the “Portfolios”), portfolios of the Goldman Sachs Trust, as of August 31, 2017, and the results of each of their operations for the year then ended, the changes in each of their net assets for the two years in the period then ended, and the financial highlights for each of the periods presented therein, in conformity with accounting principles generally accepted in the United States of America. These financial statements and financial highlights (hereafter referred to as “financial statements”) are the responsibility of the Portfolios’ management. Our responsibility is to express an opinion on these financial statements based on our audits. We conducted our audits of these financial statements in accordance with the standards of the Public Company Accounting Oversight Board (United States). Those standards require that we plan and perform the audit to obtain reasonable assurance about whether the financial statements are free of material misstatement. An audit includes examining, on a test basis, evidence supporting the amounts and disclosures in the financial statements, assessing the accounting principles used and significant estimates made by management, and evaluating the overall financial statement presentation. We believe that our audits, which included confirmation of securities as of August 31, 2017 by correspondence with the custodian, brokers, transfer agent of the underlying funds and the application of alternative auditing procedures where securities purchased confirmations had not been received, provide a reasonable basis for our opinion.
PricewaterhouseCoopers LLP
Boston, Massachusetts
October 24, 2017
44
GOLDMAN SACHS GLOBAL TAX-AWARE EQUITY PORTFOLIOS
| | |
Portfolio Expenses — Six Month Period Ended August 31, 2017 (Unaudited) | | |
As a shareholder of Class A or Institutional Shares of a Portfolio, you incur two types of costs: (1) transaction costs, including sales charges on purchase payments (with respect to Class A Shares), and (2) ongoing costs, including management fees; distribution and/or service (12b-1) fees (with respect to Class A Shares); and other Portfolio expenses. This example is intended to help you understand your ongoing costs (in dollars) of investing in Class A and Institutional Shares of the Portfolios and to compare these costs with the ongoing costs of investing in other mutual funds.
The example is based on an investment of $1,000 invested at the beginning of the period and held for the entire period from March 1, 2017 through August 31, 2017, which represents a period of 184 days of a 365 day year.
Actual Expenses — The first line under each share class in the table below provides information about actual account values and actual expenses. You may use the information in this line, together with the amount you invested, to estimate the expenses that you paid over the period. Simply divide your account value by $1,000 (for example, an $8,600 account value divided by $1,000=8.6), then multiply the result by the number in the first line under the heading entitled “Expenses Paid” to estimate the expenses you paid on your account during this period.
Hypothetical Example for Comparison Purposes — The second line under each share class in the table below provides information about hypothetical account values and hypothetical expenses based on the Portfolios’ actual net expense ratios and an assumed rate of return of 5% per year before expenses, which is not the Portfolios’ actual return. The hypothetical account values and expenses may not be used to estimate the actual ending account balance or expenses you paid for the period. You may use this information to compare the ongoing costs of investing in the Portfolios and other funds. To do so, compare this 5% hypothetical example with the 5% hypothetical examples that appear in the shareholder reports of the other funds.
Please note that the expenses shown in the table are meant to highlight your ongoing costs only and do not reflect any transactional costs, such as sales charges, redemption fees, or exchange fees and do not include expenses of Underlying Funds in which the Portfolios invest. Therefore, the second line of the table is useful in comparing ongoing costs only and will not help you determine the relative total costs of owning different funds. In addition, if these transactional costs were included, your costs would have been higher.
| | | | | | | | | | | | | | | | | | | | | | | | |
| | | Enhanced Dividend Global Equity Portfolio | | | Tax-Advantaged Global Equity Portfolio | |
| Share Class | | Beginning
Account Value
3/01/17 | | | Ending
Account Value
8/31/17 | | | Expenses
Paid for the
6 Months
Ended
8/31/17* | | | Beginning
Account Value
3/01/17 | | | Ending
Account Value
8/31/17 | | | Expenses
Paid for the
6 Months
Ended
8/31/17* | |
| Class A | | | | | | | | | | | | | | | | | | | | | | | | |
Actual | | $ | 1,000 | | | $ | 1,046.20 | | | $ | 2.73 | | | $ | 1,000 | | | $ | 1,056.50 | | | $ | 2.75 | |
Hypothetical 5% return | | | 1,000 | | | | 1,022.53 | + | | | 2.70 | | | | 1,000 | | | | 1,022.53 | + | | | 2.70 | |
| Institutional | | | | | | | | | | | | | | | | | | | | | | | | |
Actual | | | 1,000 | | | | 1,048.50 | | | | 0.67 | | | | 1,000 | | | | 1,058.20 | | | | 0.67 | |
Hypothetical 5% return | | | 1,000 | | | | 1,024.55 | + | | | 0.66 | | | | 1,000 | | | | 1,024.55 | + | | | 0.66 | |
| | * | | Expenses are calculated using each Portfolio’s annualized net expense ratio for each class, which represents the ongoing expenses as a percentage of net assets for the six months ended August 31, 2017. Expenses are calculated by multiplying the annualized net expense ratio by the average account value for the period; then multiplying the result by the number of days in the most recent fiscal half year; and then dividing that result by the number of days in the fiscal year. The annualized net expense ratios for the period were as follows: | |
| | | | | | | | |
| Portfolio | | Class A | | | Institutional | |
Enhanced Dividend Global Equity | | | 0.53 | % | | | 0.13 | % |
Tax-Advantaged Global Equity | | | 0.53 | | | | 0.13 | |
| | + | | Hypothetical expenses are based on each Portfolio’s actual annualized net expense ratios and an assumed rate of return of 5% per year before expenses. | |
45
GOLDMAN SACHS GLOBAL TAX-AWARE EQUITY PORTFOLIOS
Statement Regarding Basis for Approval of Management Agreement (Unaudited)
Background
The Goldman Sachs Enhanced Dividend Global Equity Portfolio and Goldman Sachs Tax-Advantaged Global Equity Portfolio (the “Portfolios”) are investment portfolios of Goldman Sachs Trust (the “Trust”). The Board of Trustees oversees the management of the Trust and reviews the investment performance and expenses of the Portfolios at regularly scheduled meetings held throughout the year. In addition, the Board of Trustees determines annually whether to approve the continuance of the Trust’s investment management agreement (the “Management Agreement”) with Goldman Sachs Asset Management, L.P. (the “Investment Adviser”) on behalf of the Portfolios.
The Management Agreement was most recently approved for continuation until June 30, 2018 by the Board of Trustees, including those Trustees who are not parties to the Management Agreement or “interested persons” (as defined in the Investment Company Act of 1940, as amended) of any party thereto (the “Independent Trustees”), at a meeting held on June 14-15, 2017 (the “Annual Meeting”).
The review process undertaken by the Trustees spans the course of the year and culminates with the Annual Meeting. To assist the Trustees in their deliberations, the Trustees have established a Contract Review Committee (the “Committee”), comprised of the Independent Trustees. The Committee held four meetings over the course of the year since the Management Agreement was last approved. At those Committee meetings, regularly scheduled Board or other committee meetings, and/or the Annual Meeting, matters relevant to the renewal of the Management Agreement were considered by the Board, or the Independent Trustees, as applicable. With respect to each Portfolio, such matters included:
| | (a) | | the nature and quality of the advisory, administrative, and other services provided to the Portfolio and the underlying funds in which it invests (the “Underlying Funds”) by the Investment Adviser and its affiliates, including information about: |
| | (i) | | the structure, staff, and capabilities of the Investment Adviser and its portfolio management teams; |
| | (ii) | | the groups within the Investment Adviser and its affiliates that support the portfolio management teams or provide other types of necessary services, including fund services groups (e.g., accounting and financial reporting, tax, shareholder services, and operations); controls and risk management groups (e.g., legal, compliance, valuation oversight, credit risk management, internal audit, compliance testing, market risk analysis, finance, and central funding); sales and distribution support groups, and others (e.g., information technology and training); |
| | (iii) | | trends in employee headcount; |
| | (iv) | | the Investment Adviser’s financial resources and ability to hire and retain talented personnel and strengthen its operations; and |
| | (v) | | the parent company’s support of the Investment Adviser and its mutual fund business, as expressed by the firm’s senior management; |
| | (b) | | information on the investment performance of the Underlying Funds, including comparisons to the performance of similar mutual funds, as provided by a third-party mutual fund data provider engaged as part of the contract review process (the “Outside Data Provider”), and a benchmark performance index, and information on general investment outlooks in the markets in which the Portfolio and the Underlying Funds invest; |
| | (c) | | information provided by the Investment Adviser indicating the Investment Adviser’s views on whether the Portfolio’s peer group and/or benchmark index had high, medium, or low relevance given the Portfolio’s particular investment strategy; |
| | (d) | | the terms of the Management Agreement and other agreements with affiliated service providers entered into by the Trust on behalf of the Portfolio; |
46
GOLDMAN SACHS GLOBAL TAX-AWARE EQUITY PORTFOLIOS
Statement Regarding Basis for Approval of Management Agreement (Unaudited) (continued)
| | (e) | | fee and expense information for the Portfolio, including: |
| | (i) | | the relative management fee and expense levels of the Portfolio as compared to those of comparable funds managed by other advisers, as provided by the Outside Data Provider; |
| | (ii) | | the Portfolio’s expense trends over time; and |
| | (iii) | | to the extent the Investment Adviser manages other types of accounts (such as bank collective trusts, private wealth management accounts, institutional separate accounts, sub-advised mutual funds, and non-U.S. funds) having investment objectives and policies similar to those of the Portfolio, comparative information on the advisory fees charged and services provided to those accounts by the Investment Adviser; |
| | (f) | | with respect to the extensive investment performance and expense comparison data provided by the Outside Data Provider, its processes in producing that data for the Portfolio; |
| | (g) | | the undertakings of the Investment Adviser and its affiliates to implement fee waivers and/or expense limitations; |
| | (h) | | information relating to the profitability of the Management Agreement and the transfer agency and distribution and service arrangements of the Portfolio to the Investment Adviser and its affiliates; |
| | (i) | | whether the Portfolio’s existing management fee schedule, together with the management fee schedules of the Underlying Funds, adequately addressed any economies of scale; |
| | (j) | | a summary of the “fall-out” benefits derived by the Investment Adviser and its affiliates from their relationships with the Portfolio and/or the Underlying Funds, including the fees received by the Investment Adviser’s affiliates from the Portfolio and/or the Underlying Funds for transfer agency, securities lending, portfolio trading, distribution and other services; |
| | (k) | | a summary of potential benefits derived by the Portfolio and/or the Underlying Funds as a result of their relationship with the Investment Adviser; |
| | (l) | | with respect to the applicable Underlying Funds, information regarding commissions paid by the Underlying Equity Funds and broker oversight, an update on the Investment Adviser’s soft dollars practices, other information regarding portfolio trading, and how the Investment Adviser carries out its duty to seek best execution; |
| | (m) | | portfolio manager ownership of Portfolio shares; the manner in which portfolio manager compensation is determined; and the number and types of accounts managed by the portfolio managers; |
| | (n) | | the nature and quality of the services provided to the Portfolio and the Underlying Funds by their unaffiliated service providers, and the Investment Adviser’s general oversight and evaluation (including reports on due diligence) of those service providers as part of the administrative services provided under the Management Agreement; and |
| | (o) | | the Investment Adviser’s processes and policies addressing various types of potential conflicts of interest; its approach to risk management; the annual review of the effectiveness of the Portfolio’s compliance program; and periodic compliance reports. |
The Trustees also received an overview of the Portfolios’ distribution arrangements. They received information regarding the Portfolios’ assets, share purchase and redemption activity, and payment of distribution and service fees. Information was also provided to the Trustees relating to revenue sharing payments made by and services provided by the Investment Adviser and its affiliates to intermediaries that promote the sale, distribution, and/or servicing of Portfolio shares. The Independent Trustees also discussed the broad range of other investment choices that are available to Portfolio investors, including the availability of comparable funds managed by other advisers.
The presentations made at the Board and Committee meetings and at the Annual Meeting encompassed the Portfolios and other mutual funds for which the Board of Trustees has responsibility. In evaluating the Management
47
GOLDMAN SACHS GLOBAL TAX-AWARE EQUITY PORTFOLIOS
Statement Regarding Basis for Approval of Management Agreement (Unaudited) (continued)
Agreement at the Annual Meeting, the Trustees relied upon their knowledge, resulting from their meetings and other interactions throughout the year, of the Investment Adviser and its affiliates, their services, and the Portfolios. In conjunction with these meetings, the Trustees received written materials and oral presentations on the topics covered, and the Investment Adviser addressed the questions and concerns of the Trustees, including concerns regarding the investment performance of certain of the funds they oversee. The Independent Trustees were advised by their independent legal counsel regarding their responsibilities and other regulatory requirements related to the approval and continuation of mutual fund investment management agreements under applicable law. In addition, the Investment Adviser and its affiliates provided the Independent Trustees with a written response to a formal request for information sent on behalf of the Independent Trustees by their independent legal counsel. During the course of their deliberations, the Independent Trustees met in executive sessions with their independent legal counsel, without representatives of the Investment Adviser or its affiliates present.
Nature, Extent, and Quality of the Services Provided Under the Management Agreement
As part of their review, the Trustees considered the nature, extent, and quality of the services provided to the Portfolios and the Underlying Funds by the Investment Adviser. In this regard, the Trustees considered both the investment advisory services and non-advisory services that are provided by the Investment Adviser and its affiliates. The Trustees noted the transition in the leadership and changes in personnel of various of the Investment Adviser’s portfolio management teams that had occurred in recent periods, and the ongoing recruitment efforts aimed at bringing high quality investment talent to the Investment Adviser. They also noted the Investment Adviser’s commitment to maintaining high quality systems and expending substantial resources to respond to ongoing changes to the regulatory and control environment in which the Portfolios and their service providers operate, as well as the efforts of the Investment Adviser and its affiliates to combat cyber security risks. The Trustees concluded that the Investment Adviser continued to commit substantial financial and operational resources to the Portfolios and the Underlying Funds and expressed confidence that the Investment Adviser would continue to do so in the future. The Trustees also recognized that the Investment Adviser had made significant commitments to address regulatory compliance requirements applicable to the Portfolios, the Underlying Funds, and the Investment Adviser and its affiliates.
Investment Performance
The Trustees also considered the investment performance of the Portfolios and the Underlying Funds. In this regard, they compared the investment performance of each Underlying Fund to its peers using rankings and ratings compiled by the Outside Data Provider as of December 31, 2016, and updated performance information prepared by the Investment Adviser using the peer group identified by the Outside Data Provider as of March 31, 2017. The information on each Portfolio’s investment performance was provided for the one-, three-, and five-year periods ending on the applicable dates. The Trustees also reviewed each Portfolio’s investment performance relative to its performance benchmark. As part of this review, they considered the investment performance trends of the Portfolios over time, and reviewed the investment performance of each Portfolio in light of its investment objective and policies and market conditions.
In addition, the Trustees considered materials prepared and presentations made by the Investment Adviser’s senior management and portfolio management personnel in which Portfolio and Underlying Fund performance was assessed. The Trustees also considered the Investment Adviser’s periodic reports with respect to the Portfolio’s and Underlying Funds’ risk profiles, and how the Investment Adviser’s approach to risk monitoring and management influences portfolio management. They noted the efforts of the Portfolios’ portfolio management team to continue to enhance the investment models used in managing certain Underlying Funds.
The Trustees observed that the Enhanced Dividend Global Equity Portfolio’s Institutional Shares had placed in the first quartile of the Portfolio’s peer group for the one-, three-, and five-year periods ended March 31, 2017,
48
GOLDMAN SACHS GLOBAL TAX-AWARE EQUITY PORTFOLIOS
Statement Regarding Basis for Approval of Management Agreement (Unaudited) (continued)
and had outperformed the Portfolio’s benchmark index for the one-, three-, and five-year periods ended April 30, 2017. They considered that the Enhanced Dividend Global Equity Portfolio had certain significant differences from its peer group that caused the peer groups and benchmark index, as applicable, to be imperfect bases for performance comparison. The Trustees noted that the Tax-Advantaged Global Equity Portfolio’s Institutional Shares had placed in the top half of the Portfolio’s peer group and had outperformed the Portfolio’s benchmark index for the one-, three-, and five-year periods ended March 31, 2017.
Costs of Services Provided and Competitive Information
The Trustees considered the contractual terms of the Management Agreement and the fee rates payable by each Portfolio thereunder. In this regard, the Trustees considered information on the services rendered by the Investment Adviser to the Portfolios, which included both advisory and administrative services that were directed to the needs and operations of the Portfolios as registered mutual funds.
In particular, the Trustees reviewed analyses prepared by the Outside Data Provider regarding the expense rankings of the Portfolios. The analyses provided a comparison of each Portfolio’s management fee to those of a relevant peer group and category universe; an expense analysis which compared each Portfolio’s overall net and gross expenses to a peer group and a category universe; and data comparing each Portfolio’s net expenses to the peer and category medians. The analyses also compared each Portfolio’s transfer agency, custody, and distribution fees, other expenses and fee waivers/reimbursements to those of the peer group and category medians. The Trustees concluded that the comparisons provided by the Outside Data Provider were useful in evaluating the reasonableness of the management fees and total expenses paid by the Portfolios.
In addition, the Trustees considered the Investment Adviser’s undertakings to implement fee waivers and/or expense limitations. They also considered, to the extent that the Investment Adviser manages other types of accounts having investment objectives and policies similar to those of the Portfolios, comparative fee information for services provided by the Investment Adviser to those accounts, and information that indicated that services provided to the Portfolios differed in various significant respects from the services provided to other types of accounts which, in many cases, operated under less stringent legal and regulatory structures, required fewer services from the Investment Adviser to a smaller number of client contact points, and were less time-intensive.
In addition, the Trustees noted that shareholders are able to redeem their Portfolio shares at any time if shareholders believe that the Portfolio fees and expenses are too high or if they are dissatisfied with the performance of the Portfolio.
Profitability
The Trustees reviewed each Portfolio’s contribution to the Investment Adviser’s revenues and pre-tax profit margins. In this regard the Trustees noted that they had received, among other things, profitability analyses and summaries, revenue and expense schedules by Portfolio and by function (i.e., investment management, transfer agency and distribution and service), and information on the Investment Adviser’s expense allocation methodology. They observed that the profitability and expense figures are substantially similar to those used by the Investment Adviser for many internal purposes, including compensation decisions among various business groups, and are thus subject to a vigorous internal debate about how certain revenue and expenses should be allocated. The Trustees also noted that the internal audit group within the Goldman Sachs organization had audited the expense allocation methodology and that the internal audit group was satisfied with the reasonableness, consistency, and accuracy of the Investment Adviser’s expense allocation methodology and profitability analysis calculations. Profitability data for each Portfolio was provided for 2016 and 2015, and the Trustees considered this information in relation to the Investment Adviser’s overall profitability.
49
GOLDMAN SACHS GLOBAL TAX-AWARE EQUITY PORTFOLIOS
Statement Regarding Basis for Approval of Management Agreement (Unaudited) (continued)
Economies of Scale
The Trustees considered the information that had been provided regarding the Investment Adviser’s profitability. The Trustees noted that, although the Portfolios themselves do not have breakpoints in their management fee schedules, any benefits of the breakpoints in the management fee schedules of certain Underlying Funds, when reached, would pass through to the shareholders in the Portfolios at the specified asset levels. The Trustees considered the amounts of assets in the Portfolios; the Portfolios’ recent purchase and redemption activity; the information provided by the Investment Adviser relating to the costs of the services provided by the Investment Adviser and its affiliates and the profits realized by them; information comparing the fee rates charged by the Investment Adviser with fee rates charged to other funds in the peer groups; and the Investment Adviser’s undertakings to waive a portion of its management fee and to limit certain expenses of the Portfolios and Underlying Funds that exceed specified levels. They also considered the services provided to the Portfolios under the Management Agreement and the fees and expenses borne by the Underlying Funds, and determined that the management fees payable by the Portfolios were not duplicative of the management fees paid at the Underlying Fund level.
Other Benefits to the Investment Adviser and Its Affiliates
The Trustees also considered the other benefits derived by the Investment Adviser and its affiliates from their relationships with the Portfolios and/or the Underlying Funds as stated above, including: (a) transfer agency fees received by Goldman Sachs & Co. LLC (“Goldman Sachs”); (b) brokerage and futures commissions earned by Goldman Sachs for executing securities and futures transactions on behalf of certain Underlying Funds; (c) research received by the Investment Adviser from broker-dealers in exchange for executing certain transactions on behalf of certain Underlying Funds; (d) trading efficiencies resulting from aggregation of orders of the Portfolios and/or the Underlying Funds with those for other funds or accounts managed by the Investment Adviser; (e) fees earned by Goldman Sachs Agency Lending (“GSAL”), an affiliate of the Investment Adviser, as securities lending agent for certain Underlying Funds (and fees earned by the Investment Adviser for managing the fund in which those Underlying Funds’ cash collateral is invested); (f) the Investment Adviser’s ability to leverage the infrastructure designed to service the Portfolios and the Underlying Funds on behalf of its other clients; (g) the Investment Adviser’s ability to cross-market other products and services to Portfolio shareholders; (h) Goldman Sachs’ retention of certain fees as Portfolio Distributor; (i) the Investment Adviser’s ability to negotiate better pricing with custodians on behalf of its other clients, as a result of the relationship with the Portfolios and Underlying Funds; and (j) the possibility that the working relationship between the Investment Adviser and the Portfolios’ and Underlying Funds’ third-party service providers may cause those service providers to be more likely to do business with other areas of Goldman Sachs. In the course of considering the foregoing, the Independent Trustees requested and received further information quantifying certain of these fall-out benefits.
Other Benefits to the Portfolios and Their Shareholders
The Trustees also noted that the Portfolios and/or the Underlying Funds receive certain potential benefits as a result of their relationship with the Investment Adviser, including: (a) trading efficiencies resulting from aggregation of orders of the Portfolios and/or the Underlying Funds with those of other funds or accounts managed by the Investment Adviser; (b) enhanced servicing from vendors because of the volume of business generated by the Investment Adviser and its affiliates; (c) with respect to certain Underlying Funds, enhanced servicing from broker-dealers because of the volume of business generated by the Investment Adviser and its affiliates; (d) with respect to certain Underlying Funds, the Investment Adviser’s ability to negotiate favorable terms with derivatives counterparties as a result of the size and reputation of the Goldman Sachs organization; (e) the Investment Adviser’s knowledge and experience gained from managing other accounts and products; (f) the Investment Adviser’s ability to hire and retain qualified personnel to provide services to the Portfolios and the Underlying Funds because of the reputation of the Goldman Sachs organization; (g) the Portfolios’ and Underlying Funds’ access, through the
50
GOLDMAN SACHS GLOBAL TAX-AWARE EQUITY PORTFOLIOS
Statement Regarding Basis for Approval of Management Agreement (Unaudited) (continued)
Investment Adviser, to certain firmwide resources (e.g., proprietary risk management systems and databases), subject to certain restrictions; (h) the ability of certain Underlying Funds to participate in the securities lending program administered by GSAL, as measured by the revenue received by the Underlying Funds in connection with the program; and (i) the Portfolios’ access to certain affiliated distribution channels. In addition, the Trustees noted the competitive nature of the mutual fund marketplace, and considered that many of the Portfolios’ shareholders invested in the Portfolios in part because of the Portfolios’ relationship with the Investment Adviser and that those shareholders have a general expectation that the relationship will continue.
Conclusion
In connection with their consideration of the Management Agreement, the Trustees gave weight to each of the factors described above, but did not identify any particular factor as controlling their decision. After deliberation and consideration of all of the information provided, including the factors described above, the Trustees concluded, in the exercise of their business judgment, that the management fees paid by each of the Portfolios were reasonable in light of the services provided to it by the Investment Adviser, the Investment Adviser’s costs and each Portfolio’s current and reasonably foreseeable asset levels. The Trustees unanimously concluded that the Investment Adviser’s continued management likely would benefit each Portfolio and its shareholders and that the Management Agreement should be approved and continued with respect to each Portfolio until June 30, 2018.
51
GOLDMAN SACHS GLOBAL TAX-AWARE EQUITY PORTFOLIOS
Trustees and Officers (Unaudited)
Independent Trustees
| | | | | | | | | | |
Name,
Address and Age1 | | Position(s) Held with the Trust | | Term of Office and
Length of
Time Served2 | | Principal Occupation(s) During Past 5 Years | | Number of
Portfolios in
Fund Complex
Overseen by
Trustee3 | | Other Directorships Held by Trustee4 |
Ashok N. Bakhru Age: 75 | | Chairman of the Board of Trustees | | Since 1996 (Trustee since 1991) | | Mr. Bakhru is retired. He was formerly Chairman of the Board of Trustees, Goldman Sachs Trust II (2012–2016), Goldman Sachs MLP Income Opportunities Fund (2013–2016), Goldman Sachs MLP and Energy Renaissance Fund (2014–2016), and Goldman Sachs ETF Trust (2014–2016); Director, Apollo Investment Corporation (a business development company) (2008-2013); President, ABN Associates (a management and financial consulting firm) (1994-1996 and 1998-2012); Trustee, Scholarship America (1998-2005); Trustee, Institute for Higher Education Policy (2003-2008); Director, Private Equity Investors — III and IV (1998-2007), and Equity-Linked Investors II (April 2002-2007). Chairman of the Board of Trustees — Goldman Sachs Trust; Goldman Sachs Variable Insurance Trust; Goldman Sachs BDC, Inc.; and Goldman Sachs Private Middle Market Credit LLC. | | 106 | | None |
Kathryn A. Cassidy Age: 63 | | Trustee | | Since 2015 | | Ms. Cassidy is retired. Formerly, she was Advisor to the Chairman (May 2014-December 2014); and Senior Vice President and Treasurer (2008-2014), General Electric Company & General Electric Capital Corporation (technology and financial services companies). Trustee — Goldman Sachs Trust and Goldman Sachs Variable Insurance Trust. | | 104 | | None |
Diana M. Daniels Age: 68 | | Trustee | | Since 2007 | | Ms. Daniels is retired. Formerly, she was Vice President, General Counsel and Secretary, The Washington Post Company (1991-2006). Ms. Daniels is a Trustee Emeritus and serves as a Presidential Councillor of Cornell University (2013-Present); former Member of the Legal Advisory Board, New York Stock Exchange (2003-2006) and of the Corporate Advisory Board, Standish Mellon Management Advisors (2006-2007). Trustee — Goldman Sachs Trust and Goldman Sachs Variable Insurance Trust. | | 104 | | None |
Herbert J. Markley Age: 67 | | Trustee | | Since 2013 | | Mr. Markley is retired. Formerly, he was Executive Vice President, Deere & Company (an agricultural and construction equipment manufacturer) (2007-2009); and President, Agricultural Division, Deere & Company (2001-2007). Previously, Mr. Markley served as an Advisory Board Member of Goldman Sachs Trust and Goldman Sachs Variable Insurance Trust (June 2013-October 2013). Trustee — Goldman Sachs Trust and Goldman Sachs Variable Insurance Trust. | | 104 | | None |
Jessica Palmer Age: 68 | | Trustee | | Since 2007 | | Ms. Palmer is retired. She is Director, Emerson Center for the Arts and Culture (2011-Present); and was formerly a Consultant, Citigroup Human Resources Department (2007-2008); Managing Director, Citigroup Corporate and Investment Banking (previously, Salomon Smith Barney/Salomon Brothers) (1984-2006). Ms. Palmer was a Member of the Board of Trustees of Indian Mountain School (private elementary and secondary school) (2004-2009). Trustee — Goldman Sachs Trust and Goldman Sachs Variable Insurance Trust. | | 104 | | None |
| | | | | | | | | | |
52
GOLDMAN SACHS GLOBAL TAX-AWARE EQUITY PORTFOLIOS
Trustees and Officers (Unaudited) (continued)
Independent Trustees
| | | | | | | | | | |
Name,
Address and Age1 | | Position(s) Held with the Trust | | Term of Office and
Length of
Time Served2 | | Principal Occupation(s) During Past 5 Years | | Number of
Portfolios in
Fund Complex
Overseen by
Trustee3 | | Other Directorships Held by Trustee4 |
Roy W. Templin Age: 57 | | Trustee | | Since 2013 | | Mr. Templin is retired. He is Director, Armstrong World Industries, Inc. (a designer and manufacturer of ceiling, wall and suspension system solutions) (2016–Present); and was formerly Chairman of the Board of Directors, Con-Way Incorporated (a transportation, logistics and supply chain management service company) (2014-2015); Executive Vice President and Chief Financial Officer, Whirlpool Corporation (an appliance manufacturer and marketer) (2004-2012). Previously, Mr. Templin served as an Advisory Board Member of Goldman Sachs Trust and Goldman Sachs Variable Insurance Trust (June 2013-October 2013). Trustee — Goldman Sachs Trust and Goldman Sachs Variable Insurance Trust. | | 104 | | Armstrong World Industries, Inc. (a ceiling, wall and suspension system solutions manufacturer) |
Gregory G. Weaver Age: 65 | | Trustee | | Since 2015 | | Mr. Weaver is retired. He is Director, Verizon Communications Inc. (2015-Present); and was formerly Chairman and Chief Executive Officer, Deloitte & Touche LLP (a professional services firm) (2001-2005 and 2012-2014); and Member of the Board of Directors, Deloitte & Touche LLP (2006-2012). Trustee — Goldman Sachs Trust and Goldman Sachs Variable Insurance Trust. | | 104 | | Verizon Communications Inc. |
| | | | | | | | | | |
| 1 | | Each Trustee may be contacted by writing to the Trustee, c/o Goldman Sachs, 200 West Street, New York, New York, 10282, Attn: Caroline Kraus. Information is provided as of August 31, 2017. |
| 2 | | Subject to such policies as may be adopted by the Board from time-to-time, each Trustee holds office for an indefinite term, until the earliest of: (a) the election of his or her successor; (b) the date the Trustee resigns or is removed by the Board or shareholders, in accordance with the Trust’s Declaration of Trust; or (c) the termination of the Trust. The Board has adopted policies which provide that (a) no Trustee shall hold office for more than 15 years and (b) a Trustee shall retire as of December 31st of the calendar year in which he or she reaches his or her 74th birthday, unless a waiver of such requirement shall have been adopted by a majority of the other Trustees. These policies may be changed by the Trustees without shareholder vote. One Trustee has been granted a waiver from the foregoing policies which permits him to serve until December 31, 2017. |
| 3 | | The Goldman Sachs Fund Complex includes certain other companies listed above for each respective Trustee. As of August 31, 2017, Goldman Sachs Trust consisted of 90 portfolios (88 of which offered shares to the public); Goldman Sachs Variable Insurance Trust consisted of 14 portfolios; Goldman Sachs Trust II consisted of 17 portfolios (16 of which offered shares to the public); Goldman Sachs BDC, Inc., Goldman Sachs Private Middle Market Credit LLC, Goldman Sachs MLP Income Opportunities Fund, and Goldman Sachs MLP and Energy Renaissance Fund each consisted of one portfolio; and Goldman Sachs ETF Trust consisted of 19 portfolios (eight of which offered shares to the public). Goldman Sachs Private Middle Market Credit LLC does not offer shares to the public. |
| 4 | | This column includes only directorships of companies required to report to the Securities and Exchange Commission under the Securities Exchange Act of 1934 (i.e., “public companies”) or other investment companies registered under the Act. |
Additional information about the Trustees is available in the Portfolios’ Statement of Additional Information, which can be obtained from Goldman Sachs free of charge by calling this toll-free number (in the United States of America): 1-800-526-7384.
53
GOLDMAN SACHS GLOBAL TAX-AWARE EQUITY PORTFOLIOS
Trustees and Officers (Unaudited) (continued)
Interested Trustee*
| | | | | | | | | | |
Name,
Address and Age1 | | Position(s) Held with the Trust | | Term of Office and
Length of
Time Served2 | | Principal Occupation(s) During Past 5 Years | | Number of
Portfolios in
Fund Complex
Overseen by
Trustee3 | | Other Directorships Held by Trustee4 |
James A. McNamara Age: 54 | | President and Trustee | | Since 2007 | | Managing Director, Goldman Sachs (December 1998-Present); Director of Institutional Fund Sales, GSAM (April 1998-December 2000); and Senior Vice President and Manager, Dreyfus Institutional Service Corporation (January 1993- April 1998). President and Trustee — Goldman Sachs Trust; Goldman Sachs Variable Insurance Trust; Goldman Sachs Trust II; Goldman Sachs MLP Income Opportunities Fund; Goldman Sachs MLP and Energy Renaissance Fund; and Goldman Sachs ETF Trust. | | 142 | | None |
| | | | | | | | | | |
| * | | Mr. McNamara is considered to be an “Interested Trustee” because he holds positions with Goldman Sachs and owns securities issued by The Goldman Sachs Group, Inc. Mr. McNamara holds comparable positions with certain other companies of which Goldman Sachs, GSAM or an affiliate thereof is the investment adviser, administrator and/or distributor. |
| 1 | | Each Trustee may be contacted by writing to the Trustee, c/o Goldman Sachs, 200 West Street, New York, New York, 10282, Attn: Caroline Kraus. Information is provided as of August 31, 2017. |
| 2 | | Subject to such policies as may be adopted by the Board from time-to-time, each Trustee holds office for an indefinite term, until the earliest of: (a) the election of his or her successor; (b) the date the Trustee resigns or is removed by the Board or shareholders, in accordance with the Trust’s Declaration of Trust; or (c) the termination of the Trust. The Board has adopted policies which provide that (a) no Trustee shall hold office for more than 15 years and (b) a Trustee shall retire as of December 31st of the calendar year in which he or she reaches his or her 74th birthday, unless a waiver of such requirement shall have been adopted by a majority of the other Trustees. These policies may be changed by the Trustees without shareholder vote. One Trustee has been granted a waiver from the foregoing policies which permits him to serve until December 31, 2017. |
| 3 | | The Goldman Sachs Fund Complex includes certain other companies listed above for each respective Trustee. As of August 31, 2017, Goldman Sachs Trust consisted of 90 portfolios (88 of which offered shares to the public); Goldman Sachs Variable Insurance Trust consisted of 14 portfolios; Goldman Sachs Trust II consisted of 17 portfolios (16 of which offered shares to the public); Goldman Sachs BDC, Inc., Goldman Sachs Private Middle Market Credit LLC, Goldman Sachs MLP Income Opportunities Fund, and Goldman Sachs MLP and Energy Renaissance Fund each consisted of one portfolio; and Goldman Sachs ETF Trust consisted of 19 portfolios (eight of which offered shares to the public). Goldman Sachs Private Middle Market Credit LLC does not offer shares to the public. |
| 4 | | This column includes only directorships of companies required to report to the Securities and Exchange Commission under the Securities Exchange Act of 1934 (i.e., “public companies”) or other investment companies registered under the Act. |
Additional information about the Trustees is available in the Portfolios’ Statement of Additional Information, which can be obtained from Goldman Sachs free of charge by calling this toll-free number (in the United States of America): 1-800-526-7384.
54
GOLDMAN SACHS GLOBAL TAX-AWARE EQUITY PORTFOLIOS
Trustees and Officers (Unaudited) (continued)
Officers of the Trust*
| | | | | | |
| Name, Address and Age1 | | Position(s) Held with the Trust | | Term of
Office and
Length of
Time Served2 | | Principal Occupation(s) During Past 5 Years |
James A. McNamara 200 West Street New York, NY 10282 Age: 54 | | Trustee and President | | Since 2007 | | Managing Director, Goldman Sachs (December 1998-Present); Director of Institutional Fund Sales, GSAM (April 1998-December 2000); and Senior Vice President and Manager, Dreyfus Institutional Service Corporation (January 1993-April 1998). President and Trustee — Goldman Sachs Trust; Goldman Sachs Variable Insurance Trust; Goldman Sachs Trust II; Goldman Sachs MLP Income Opportunities Fund; Goldman Sachs MLP and Energy Renaissance Fund; and Goldman Sachs ETF Trust. |
Caroline L. Kraus 200 West Street New York, NY 10282 Age: 40 | | Secretary | | Since 2012 | | Managing Director, Goldman Sachs (January 2016-Present); Vice President, Goldman Sachs (August 2006-December 2015); Associate General Counsel, Goldman Sachs (2012-Present); Assistant General Counsel, Goldman Sachs (August 2006-December 2011); and Associate, Weil, Gotshal & Manges, LLP (2002-2006). Secretary — Goldman Sachs Trust (previously Assistant Secretary (2012)); Goldman Sachs Variable Insurance Trust (previously Assistant Secretary (2012)); Goldman Sachs Trust II; Goldman Sachs BDC, Inc.; Goldman Sachs Private Middle Market Credit LLC; Goldman Sachs Middle Market Lending Corp.; Goldman Sachs MLP Income Opportunities Fund; Goldman Sachs MLP and Energy Renaissance Fund; and Goldman Sachs ETF Trust. |
Scott M. McHugh 200 West Street New York, NY 10282 Age: 45 | | Treasurer, Senior Vice President and Principal Financial Officer | | Since 2009 (Principal Financial Officer since 2013) | | Managing Director, Goldman Sachs (January 2016-Present); Vice President, Goldman Sachs (February 2007-December 2015); Assistant Treasurer of certain mutual funds administered by DWS Scudder (2005-2007); and Director (2005-2007), Vice President (2000-2005), and Assistant Vice President (1998-2000), Deutsche Asset Management or its predecessor (1998-2007). Treasurer, Senior Vice President and Principal Financial Officer — Goldman Sachs Trust; Goldman Sachs Variable Insurance Trust; Goldman Sachs Trust II; Goldman Sachs MLP Income Opportunities Fund; Goldman Sachs MLP and Energy Renaissance Fund; and Goldman Sachs ETF Trust. |
Joseph F. DiMaria 30 Hudson Street Jersey City, NJ 07302 Age: 49 | | Assistant Treasurer and Principal Accounting Officer | | Since 2016 (Principal Accounting Officer since 2017) | | Managing Director, Goldman Sachs (November 2015-Present) and Vice President — Mutual Fund Administration, Columbia Management Investment Advisers, LLC (May 2010-October 2015). Assistant Treasurer and Principal Accounting Officer — Goldman Sachs Trust; Goldman Sachs Variable Insurance Trust; Goldman Sachs Trust II; Goldman Sachs MLP Income Opportunities Fund; Goldman Sachs MLP and Energy Renaissance Fund; and Goldman Sachs ETF Trust. |
| | | | | | |
| * | | Represents a partial list of officers of the Trust. Additional information about all the officers is available in the Portfolios’ Statement of Additional Information, which can be obtained from Goldman Sachs free of charge by calling this toll-free number (in the United States): 1-800-526-7384. |
| 1 | | Information is provided as of August 31, 2017. |
| 2 | | Officers hold office at the pleasure of the Board of Trustees or until their successors are duly elected and qualified. Each officer holds comparable positions with certain other companies of which Goldman Sachs, GSAM or an affiliate thereof is the investment adviser, administrator and/or distributor. |
55
GOLDMAN SACHS GLOBAL TAX-AWARE EQUITY PORTFOLIOS
Goldman Sachs Trust — Global Tax-Aware Equity Portfolios — Tax Information (Unaudited)
For the fiscal year ended August 31, 2017, 47.81% and 39.92% of the dividends paid from net investment company taxable income by the Enhanced Dividend Global Equity and Tax-Advantaged Global Equity Portfolios, respectively, qualify for the dividends received deduction available to corporations.
From distributions paid during the fiscal year ended August 31, 2017, the total amount of income received by the Enhanced Dividend Global Equity and Tax-Advantaged Global Equity Portfolios from sources within foreign countries and possessions of the United States was $0.0921 and $0.0700 per share, respectively, all of which is attributable to qualified passive income. The percentage of net investment income dividends paid from foreign sources by the Enhanced Dividend Global Equity and Tax-Advantaged Global Equity Portfolios was 36.95% and 40.42%, respectively. The total amount of taxes paid by the Enhanced Dividend Global Equity and Tax-Advantaged Global Equity Portfolios to such countries was $0.0099 and $0.0084 per share, respectively.
For the fiscal year ended August 31, 2017, the Enhanced Dividend Global Equity and Tax-Advantaged Global Equity Portfolios designate 89.85% and 90.32%, respectively, of the dividends paid from net investment company taxable income as qualifying for the reduced tax rate under the Jobs and Growth Tax Relief and Reconciliation Act of 2003.
Pursuant to Section 852 of the Internal Revenue Code, the Enhanced Dividend Global Equity Portfolio designates $3,230,800, or, if different, the maximum amount allowable, as capital gain dividends paid during the fiscal year ended August 31, 2017.
During the fiscal year ended August 31, 2017, the Enhanced Dividend Global Equity Portfolio designates $317,310, as short-term capital gain dividends pursuant to Section 871(k) of the Internal Revenue Code.
56
FUNDS PROFILE
Goldman Sachs Funds
Goldman Sachs is a premier financial services firm, known since 1869 for creating thoughtful and customized investment solutions in complex global markets.
Today, the Investment Management Division of Goldman Sachs serves a diverse set of clients worldwide, including private institutions, public entities and individuals. With approximately $1.21 trillion in assets under supervision as of June 30, 2017, Goldman Sachs Asset Management (“GSAM”) has portfolio management teams located around the world and our investment professionals bring firsthand knowledge of local markets to every investment decision. Assets under supervision includes assets under management and other client assets for which Goldman Sachs does not have full discretion. GSAM leverages the resources of Goldman Sachs & Co. LLC subject to legal, internal and regulatory restrictions.
Money Market
Financial Square FundsSM
| ∎ | | Financial Square Treasury Solutions Fund1 |
| ∎ | | Financial Square Government Fund1 |
| ∎ | | Financial Square Money Market Fund2 |
| ∎ | | Financial Square Prime Obligations Fund2 |
| ∎ | | Financial Square Treasury Instruments Fund1 |
| ∎ | | Financial Square Treasury Obligations Fund1 |
| ∎ | | Financial Square Federal Instruments Fund1 |
| ∎ | | Financial Square Tax-Exempt Money Market Fund2 |
Investor FundsSM
| ∎ | | Investor Money Market Fund3 |
| ∎ | | Investor Tax-Exempt Money Market Fund3 |
Fixed Income
Short Duration and Government
| ∎ | | High Quality Floating Rate Fund |
| ∎ | | Short-Term Conservative Income Fund |
| ∎ | | Short Duration Government Fund |
| ∎ | | Short Duration Income Fund |
| ∎ | | Inflation Protected Securities Fund |
Multi-Sector
Municipal and Tax-Free
| ∎ | | High Yield Municipal Fund |
| ∎ | | Dynamic Municipal Income Fund |
| ∎ | | Short Duration Tax-Free Fund |
Single Sector
| ∎ | | Investment Grade Credit Fund |
| ∎ | | High Yield Floating Rate Fund |
| ∎ | | Emerging Markets Debt Fund |
| ∎ | | Local Emerging Markets Debt Fund |
| ∎ | | Dynamic Emerging Markets Debt Fund |
Fixed Income Alternatives
| ∎ | | Long Short Credit Strategies Fund |
Fundamental Equity
| ∎ | | Small/Mid Cap Value Fund |
| ∎ | | Small/Mid Cap Growth Fund |
| ∎ | | Concentrated Growth Fund7 |
| ∎ | | Technology Opportunities Fund |
| ∎ | | Growth Opportunities Fund |
| ∎ | | Rising Dividend Growth Fund |
Tax-Advantaged Equity
| ∎ | | U.S. Tax-Managed Equity Fund |
| ∎ | | International Tax-Managed Equity Fund |
| ∎ | | U.S. Equity Dividend and Premium Fund |
| ∎ | | International Equity Dividend and Premium Fund |
Equity Insights
| ∎ | | Small Cap Equity Insights Fund |
| ∎ | | U.S. Equity Insights Fund |
| ∎ | | Small Cap Growth Insights Fund |
| ∎ | | Large Cap Growth Insights Fund |
| ∎ | | Large Cap Value Insights Fund |
| ∎ | | Small Cap Value Insights Fund |
| ∎ | | International Small Cap Insights Fund |
| ∎ | | International Equity Insights Fund |
| ∎ | | Emerging Markets Equity Insights Fund |
Fundamental Equity International
| ∎ | | Strategic International Equity Fund |
| ∎ | | Focused International Equity Fund |
| ∎ | | Emerging Markets Equity Fund |
Select Satellite
| ∎ | | Real Estate Securities Fund |
| ∎ | | International Real Estate Securities Fund |
| ∎ | | Commodity Strategy Fund |
| ∎ | | Global Real Estate Securities Fund |
| ∎ | | Alternative Premia Fund9 |
| ∎ | | Absolute Return Tracker Fund |
| ∎ | | Managed Futures Strategy Fund |
| ∎ | | MLP Energy Infrastructure Fund |
| ∎ | | Multi-Manager Alternatives Fund |
| ∎ | | Absolute Return Multi-Asset Fund |
| ∎ | | Global Infrastructure Fund |
Total Portfolio Solutions
| ∎ | | Global Managed Beta Fund |
| ∎ | | Multi-Manager Non-Core Fixed Income Fund |
| ∎ | | Multi-Manager U.S. Dynamic Equity Fund |
| ∎ | | Multi-Manager Global Equity Fund |
| ∎ | | Multi-Manager International Equity Fund |
| ∎ | | Tactical Tilt Overlay Fund |
| ∎ | | Balanced Strategy Portfolio |
| ∎ | | Multi-Manager U.S. Small Cap Equity Fund |
| ∎ | | Multi-Manager Real Assets Strategy Fund |
| ∎ | | Growth and Income Strategy Portfolio |
| ∎ | | Growth Strategy Portfolio |
| ∎ | | Equity Growth Strategy Portfolio |
| ∎ | | Satellite Strategies Portfolio |
| ∎ | | Enhanced Dividend Global Equity Portfolio |
| ∎ | | Tax-Advantaged Global Equity Portfolio |
| ∎ | | Strategic Factor Allocation Fund |
| ∎ | | Target Date 2020 Portfolio |
| ∎ | | Target Date 2025 Portfolio |
| ∎ | | Target Date 2030 Portfolio |
| ∎ | | Target Date 2035 Portfolio |
| ∎ | | Target Date 2040 Portfolio |
| ∎ | | Target Date 2045 Portfolio |
| ∎ | | Target Date 2050 Portfolio |
| ∎ | | Target Date 2055 Portfolio |
| ∎ | | GQG Partners International Opportunities Fund |
| 1 | | You could lose money by investing in the Fund. Although the Fund seeks to preserve the value of your investment at $1.00 per share, it cannot guarantee it will do so. An investment in the Fund is not a deposit of a bank and is not insured or guaranteed by the Federal Deposit Insurance Corporation or any other government agency. The Fund’s sponsor has no legal obligation to provide financial support to the Fund, and you should not expect that the sponsor will provide financial support to the Fund at any time. |
| 2 | | You could lose money by investing in the Fund. Because the share price of the Fund will fluctuate, when you sell your shares they may be worth more or less than what you originally paid for them. The Fund may impose a fee upon sale of your shares or may temporarily suspend your ability to sell shares if the Fund’s liquidity falls below required minimums because of market conditions or other factors. An investment in the Fund is not a deposit of a bank and is not insured or guaranteed by the Federal Deposit Insurance Corporation or any other government agency. The Fund’s sponsor has no legal obligation to provide financial support to the Fund, and you should not expect that the sponsor will provide financial support to the Fund at any time. |
| 3 | | You could lose money by investing in the Fund. Although the Fund seeks to preserve the value of your investment at $1.00 per share, it cannot guarantee it will do so. The Fund may impose a fee upon sale of your shares or may temporarily suspend your ability to sell shares if the Fund’s liquidity falls below required minimums because of market conditions or other factors. An investment in the Fund is not a deposit of a bank and is not insured or guaranteed by the Federal Deposit Insurance Corporation or any other government agency. The Fund’s sponsor has no legal obligation to provide financial support to the Fund, and you should not expect that the sponsor will provide financial support to the Fund at any time. |
| 4 | | Effective on June 20, 2017, the Goldman Sachs Fixed Income Macro Strategies Fund was renamed the Goldman Sachs Strategic Macro Fund. |
| 5 | | Effective on June 20, 2017, the Goldman Sachs Growth and Income Fund was renamed the Goldman Sachs Equity Income Fund. |
| 6 | | Effective after the close of business on August 31, 2017, the Goldman Sachs Flexible Cap Growth Fund was renamed the Goldman Sachs Flexible Cap Fund. |
| 7 | | Effective on July 28, 2017, the Goldman Sachs Focused Growth Fund was reorganized with and into the Goldman Sachs Concentrated Growth Fund. |
| 8 | | Effective after the close of business on October 31, 2017, the Goldman Sachs Dynamic U.S. Equity Fund was renamed the Goldman Sachs Blue Chip Fund. |
| 9 | | Effective after the close of business on October 30, 2017, the Goldman Sachs Dynamic Allocation Fund was renamed the Goldman Sachs Alternative Premia Fund. Financial Square FundsSM and Investor FundsSM are registered service marks of Goldman Sachs & Co. LLC. |
| * | | This list covers open-end funds only. Please visit our website at www.GSAMFUNDS.com to learn about our closed-end funds and exchange-traded funds. |
| | |
TRUSTEES Ashok N. Bakhru, Chairman Kathryn A. Cassidy Diana M. Daniels Herbert J. Markley James A. McNamara Jessica Palmer Roy W. Templin Gregory G. Weaver | | OFFICERS James A. McNamara, President Scott M. McHugh, Treasurer, Senior Vice President and Principal Financial Officer Joseph F. DiMaria, Assistant Treasurer and Principal Accounting Officer Caroline L. Kraus, Secretary |
| |
GOLDMAN SACHS & CO. LLC Distributor and Transfer Agent | | GOLDMAN SACHS ASSET MANAGEMENT, L.P. Investment Adviser |
Visit our web site at www.GSAMFUNDS.com to obtain the most recent month-end returns.
Goldman Sachs Asset Management, L.P., 200 West Street, New York, New York 10282
Economic and market forecasts presented herein reflect our judgment as of the date of this presentation and are subject to change without notice. These forecasts do not take into account the specific investment objectives, restrictions, tax and financial situation or other needs of any specific client. Actual data will vary and may not be reflected here. These forecasts are subject to high levels of uncertainty that may affect actual performance. Accordingly, these forecasts should be viewed as merely representative of a broad range of possible outcomes. These forecasts are estimated, based on assumptions, and are subject to significant revision and may change materially as economic and market conditions change. Goldman Sachs has no obligation to provide updates or changes to these forecasts. Case studies and examples are for illustrative purposes only.
The portfolio risk management process includes an effort to monitor and manage risk, but does not imply low risk.
The reports concerning the Portfolios included in this shareholder report may contain certain forward-looking statements about the factors that may affect the performance of the Portfolios in the future. These statements are based on Portfolio management’s predictions and expectations concerning certain future events and their expected impact on the Portfolios, such as performance of the economy as a whole and of specific industry sectors, changes in the levels of interest rates, the impact of developing world events, and other factors that may influence the future performance of the Portfolios. Management believes these forward-looking statements to be reasonable, although they are inherently uncertain and difficult to predict. Actual events may cause adjustments in portfolio management strategies from those currently expected to be employed.
A description of the policies and procedures that the Portfolios use to determine how to vote proxies relating to portfolio securities and information regarding how a Portfolio voted proxies relating to portfolio securities during the most recent 12-month period ended June 30 is available (i) without charge, upon request by calling 1-800-526-7384 (for Retail Shareholders) or 1-800-621-2550 (for Institutional Shareholders); and (ii) on the Securities and Exchange Commission (“SEC”) web site at http://www.sec.gov.
The Portfolios file their complete schedule of Portfolio holdings with the SEC for the first and third quarters of each fiscal year on Form N-Q. The Portfolios’ Form N-Q are available on the SEC’s web site at http://www.sec.gov within 60 days after the Portfolios’ first and third fiscal quarters. The Portfolios’ Forms N-Q may be reviewed and copied at the SEC’s Public Reference Room in Washington, D.C. and information on the operation of the Public Reference Room may also be obtained by calling 1-800-SEC-0330. Form N-Q may be obtained upon request and without charge by calling 1-800-526-7384 (for Retail Shareholders) or 1-800-621-2550 (for Institutional Shareholders).
Goldman Sachs & Co. LLC (“Goldman Sachs”) does not provide legal, tax or accounting advice. Any statement contained in this communication (including any attachments) concerning U.S. tax matters was not intended or written to be used, and cannot be used, for the purpose of avoiding penalties under the Internal Revenue Code, and was written to support the promotion or marketing of the transaction(s) or matter(s) addressed. Clients of Goldman Sachs should obtain their own independent tax advice based on their particular circumstances.
Diversification does not protect an investor from market risk and does not ensure a profit.
Fund holdings and allocations shown are as of August 31, 2017 and may not be representative of future investments. Portfolio holdings should not be relied on in making investment decisions and should not be construed as research or investment advice regarding particular securities. Current and future holdings are subject to risk.
THIS MATERIAL IS FOR INFORMATIONAL PURPOSES ONLY AND IS PROVIDED SOLELY ON THE BASIS THAT IT WILL NOT CONSTITUTE INVESTMENT OR OTHER ADVICE OR A RECOMMENDATION RELATING TO ANY PERSON’S OR PLAN’S INVESTMENT OR OTHER DECISIONS, AND GOLDMAN SACHS IS NOT A FIDUCIARY OR ADVISOR WITH RESPECT TO ANY PERSON OR PLAN BY REASON OF PROVIDING THE MATERIAL OR CONTENT HEREIN INCLUDING UNDER THE EMPLOYEE RETIREMENT INCOME SECURITY ACT OF 1974 OR DEPARTMENT OF LABOR REGULATIONS. PLAN SPONSORS AND OTHER FIDUCIARIES SHOULD CONSIDER THEIR OWN CIRCUMSTANCES IN ASSESSING ANY POTENTIAL COURSE OF ACTION.
This material is not authorized for distribution to prospective investors unless preceded or accompanied by a current Prospectus or summary prospectus, if applicable. Investors should consider a Portfolio’s objective, risks, and charges and expenses, and read the summary prospectus, if available, and/or the Prospectus carefully before investing or sending money. The summary prospectus, if available, and the Prospectus contain this and other information about a Portfolio and may be obtained from your authorized dealer or from Goldman Sachs & Co. LLC by calling (retail – 1-800-526-7384) (institutional – 1-800-621-2550).
© 2017 Goldman Sachs. All rights reserved. 107535-TMPL-10/2017-630685 TAGEDGAR-17/3K
Goldman Sachs Funds

| | | | |
| | |
| Annual Report | | | | August 31, 2017 |
| | |
| | | | Investor FundsSM |
| | | | Money Market |
| | | | Tax-Exempt Money Market |

Goldman Sachs Investor Funds
| ∎ | | TAX-EXEMPT MONEY MARKET FUND |
| | | | |
| | | |
| NOT FDIC-INSURED | | May Lose Value | | No Bank Guarantee |
PORTFOLIO RESULTS
Goldman Sachs Investor Funds
Portfolio Management Discussion and Analysis
Below, the Goldman Sachs Money Market Portfolio Management Team discusses the Goldman Sachs Investor Funds’ (the “Funds”) performance and positioning for the 12-month period ended August 31, 2017 (the “Reporting Period”).
| Q | | What economic and market factors most influenced the money markets as a whole during the Reporting Period? |
| A | | During the Reporting Period, noteworthy events influencing the front, or short-term, end of the taxable and tax-exempt money market yield curves included Federal Reserve (“Fed”) interest rate hikes and discussion of balance sheet normalization, the possibility of the European Central Bank’s (“ECB”) tapering of its asset purchases, and geopolitical events. (Yield curve is a spectrum of maturities. Balance sheet normalization refers to the steps the Fed will take to reverse quantitative easing and remove the substantial monetary accommodation it has provided to the economy since the financial crisis began in 2007.) |
| | When the Reporting Period began in September 2016, credit spreads (the difference in yields between government and taxable bonds of comparable maturity) widened in advance of money market fund reform, with final implementation taking effect in October 2016. Meanwhile, the agency floater curve steepened, as LIBOR widened and interest in shorter floaters amongst market participants increased. (LIBOR, or the London Inter-Bank Offered Rate, is the interest rate that banks charge each other for short-term loans.) The BofA Merrill Lynch U.S. Dollar Three-Month LIBOR Constant Maturity Index spiked to its highest level since the 2008 financial crisis. However, unlike in 2008, funding costs for banks did not increase due to market stress. Instead, spreads widened because of declining demand, as prime money market funds had been a key source of short-term bank funding. (Prime money market funds primarily invest in corporate debt securities.) Most of the flows went into government money market funds that invest in agencies — and may offer higher yields benchmarked to LIBOR — benefiting government yields and reducing pressure on U.S. Treasury yields. During September and October 2016, prime money market funds lost approximately $440 billion in assets, while government money market funds gained $410 billion in assets.1 |
| | After money market fund reform was implemented on October 14, 2016, credit spreads gradually tightened to reach |
| | widths at the end of February 2017 that had been previously seen at the beginning of 2016. |
| | Money market fund reform also impacted tax-exempt money market funds, with investment outflows reducing demand for one-day to seven-day maturities. In tandem with the outflows, the Securities Industry and Financial Markets Association (“SIFMA”) Municipal Swap Index, representing seven-day tax-exempt variable rate demand obligations, rose. |
| | In November 2016, the unexpected results of the U.S. presidential elections were widely viewed as a potential regime change in monetary and fiscal policy. The U.S. Treasury yield curve steepened as the markets began pricing in higher inflation due to greater anticipated government fiscal spending. |
| | In December 2016, in a move widely expected by the markets, the Fed raised the targeted federal funds rate by 25 basis points, the second interest rate hike since the 2008 global financial crisis. (A basis point is 1/100th of a percentage point.) Fed policymakers also raised their interest rate projections on the back of continued improvement in the U.S. labor market, rising wages and the potential of fiscal policy initiatives by the then-incoming Administration. After the Fed’s December 2016 policy meeting, market expectations increased for additional Fed rate hikes in 2017, and money market yields generally moved higher. |
| | In March 2017, Fed policymakers raised the targeted federal funds rate another 25 basis points and also reiterated their interest rate projections, saying they intended to hike interest rates a total of three times during the calendar year. U.S. economic growth, which had surprised to the downside in early 2017, strengthened during the second calendar quarter, with the Gross Domestic Product (“GDP”) coming in at an annualized rate of 3.0%. In June 2017, the unemployment rate declined to 4.3%, below what the Fed considers the normal level of unemployment. Core personal consumption expenditures remained below the Fed’s 2% target at just 1.7% year-over-year in June 2017, marking the fourth consecutive month of weak inflation data. Nevertheless, in June 2017, Fed policymakers raised the federal funds rate yet another 25 basis points to a target range of between 1.00% and 1.25%, citing ongoing strength in the labor market and a |
1
PORTFOLIO RESULTS
| | pickup in household spending and business fixed investment. Also in June 2017, the Fed released a detailed addendum to its policy statement with specifics about its plan to taper reinvestment of its balance sheet. The plan was set to begin sometime in 2017 with a rundown of no greater than $10 billion a month, divided between mortgage-backed securities and U.S. Treasuries, with the total anticipated to rise steadily over the course of one year. |
| | In August 2017, at the Fed’s Jackson Hole Economic Policy Symposium, Fed Chair Janet Yellen said, “in light of the continued solid performance of the labor market and our outlook for economic activity and inflation, I believe the case for an increase in the federal funds rate has strengthened in recent months.” |
| | Also toward the end of the Reporting Period, expectations for a tapering announcement from the ECB shifted from possible to more than probable. ECB President Mario Draghi provided a rather optimistic outlook for inflation, stating “deflationary forces have been replaced by reflationary ones.” Mr. Draghi also made a cautious reference to a tapering of quantitative easing, saying an adjustment in the ECB’s “policy instruments” alongside the ongoing economic recovery would imply a constant rather than a tighter policy stance. The financial markets reacted to these comments in a hawkish manner, with the euro appreciating and German government bond yields rising. (Hawkish tends to suggest higher interest rates; opposite of dovish.) |
| Q | | What key factors were responsible for the performance of the Funds during the Reporting Period? |
| A | | The yields of the Goldman Sachs Investor Money Market Fund (“the taxable Fund”) and the Goldman Sachs Investor Tax-Exempt Money Market Fund (“the tax-exempt Fund”) rose during the Reporting Period, driven by the increase in money market yields, which occurred primarily because of the economic and market factors discussed above. The taxable and tax-exempt money market yield curves flattened, meaning differentials between yields on shorter-term maturities rose more than those on longer-term maturities. |
| Q | | How did you manage the taxable Fund during the Reporting Period? |
| A | | During the Reporting Period, the taxable Fund had investments in commercial paper, asset-backed commercial paper, repurchase agreements (“repos”), variable rate demand notes (“VRDNs”), certificates of deposit, short-term corporate obligations, asset backed securities, tender option bonds and non-U.S. sovereign government debt. |
| | In the taxable Fund, we maintained an especially low weighted average maturity of less than 10 days, along with a high level of liquidity, as the implementation of money market fund reform approached and amid uncertainty about investment flows from prime money market funds to government money market funds. Following the implementation of money market fund reform, investment flows into prime money market funds stabilized, and we gradually extended the taxable Fund’s weighted average maturity. Toward the end of January 2017, as credit spreads normalized and we sought to add yield, we meaningfully extended the taxable Fund’s weighted average maturity to a range of between 30 days and 37 days. From March through June 2017, because of continued comments from the Fed about a potential June rate increase, we shortened the weighted average maturity of the taxable Fund to a range of between 23 days and 32 days. |
| | During the first calendar quarter, we focused our purchases on floating rate securities, which would help us manage duration in the event of a more aggressive than market expected Fed rate hike scenario. (Duration is a measure of a portfolio’s sensitivity to changes in interest rates.) In the second calendar quarter, we focused our purchases on floating rate securities, asset backed securities and certificates of deposit when and where we found attractive opportunities. |
| | During July 2017, we kept the weighted average maturity of the taxable Fund in range of between 28 days and 32 days, as yields did not, in our view, offer enough compensation to extend. We focused our purchases on repos and non-U.S. sovereign government debt, which offered what we considered attractive opportunities. In August 2017, as market expectations of a U.S. debt ceiling deal stayed strong, we maintained the taxable Fund’s weighted average maturity between 30 days and 36 days. We focused purchases on non-U.S. sovereign government debt, maturing primarily in September 2017. |
| Q | | How did you manage the tax-exempt Fund during the Reporting Period? |
| A | | During the Reporting Period, the tax-exempt Fund had investments in VRDNs, tax-exempt commercial paper and other municipal securities. |
| | We maintained a particularly low weighted average maturity and a high level of liquidity in the tax-exempt Fund in |
2
PORTFOLIO RESULTS
| | response to money market fund reform, which reduced demand for short-term money market securities. Tax-exempt money market mutual funds lost approximately $151 billion in assets during August 2016, falling to less than $128 billion in the second week of October 2016, coinciding with money market fund reform. The decline in assets during 2016 pushed the front end of the tax-exempt money market yield curve out of alignment with that of the taxable money market yield curve. Historically, taxable money market mutual funds would begin buying VRDNs if the SIFMA Municipal Swap Index rose above the yields available in the taxable money markets. However, the taxable money market was also experiencing asset losses at that time and therefore, taxable money market investors did not buy a significant number of VRDNs. Furthermore, three-month and one-month LIBOR were at 0.88% and 0.53%, respectively, on October 12, 2016. The ratio of the SIFMA Municipal Swap Index to LIBOR, which had averaged less than 71% since 1997, reached 155% in October 2016. As a result, a large number of non-traditional buyers, including separately managed accounts and short duration municipal bond mutual funds, entered the tax-exempt money market, helping to push it back into equilibrium with the taxable money market by early 2017. The tax-exempt money market then stabilized, with non-traditional buyers dominating the front end of the market through the end of the Reporting Period. |
| | Tax-exempt money market mutual fund assets generally fluctuated between $132 billion and $128 billion between October 2016 and August 2017. At the end of the Reporting Period, tax-exempt money market mutual fund assets were approximately $129 billion. |
| | Between October 2016 and February 2017, we extended the weighted average maturity of the tax-exempt Fund to a range of between 22 days and 38 days. Ahead of the Fed’s June 2017 policy meeting, we shortened the tax-exempt Fund’s weighted average maturity to a range of between 20 days and 25 days. We maintained the tax-exempt Fund’s weighted average maturity, without significantly extending or shortening, through the end of the Reporting Period. During the Reporting Period overall, the weighted average maturity of the tax-exempt Fund ranged between 25 days and 33 days. |
| Q | | How did you manage the Funds’ weighted average life during the Reporting Period? |
| A | | During the Reporting Period, we managed the weighted average life of the taxable and tax- exempt Funds below 83 days. In the taxable Fund, we maintained a weighted average life in a range of between approximately 40 days and 83 days. In the tax-exempt Fund, we maintained a weighted average life in a range of between approximately five days and 35 days. The weighted average life of a money market fund is a measure of a money market fund’s price sensitivity to changes in liquidity and/or credit risk. |
| | Under amendments to Securities and Exchange Commission (“SEC”) Rule 2a-7 that became effective in May 2010, the maximum allowable weighted average life of a money market fund is 120 days. While one of the goals of the SEC’s money market fund rule is to reinforce conservative investment practices across the money market fund industry, our security selection process has long emphasized conservative investment choices. |
| Q | | Did you make any changes to the Funds’ portfolios during the Reporting Period? |
| A | | During the Reporting Period, we made adjustments to the Funds’ weighted average maturities and their allocations to specific investments based on then-current market conditions, our near-term view and anticipated and actual Fed monetary policy statements. |
| Q | | What is the Funds’ tactical view and strategy for the months ahead? |
| A | | At the end of the Reporting Period, we expected ongoing improvements in the U.S. economy, particularly in the labor market, to warrant another Fed rate hike in 2017, providing financial conditions do not tighten materially and core inflation improves. More specifically, we expect an interest rate hike in December 2017 and for balance sheet normalization to begin during the fourth quarter of 2017. (In mid-September 2017, after the Reporting Period ended, the Fed announced it would initiate balance sheet normalization in October 2017.) |
| | Looking ahead, we expect the Fed to take the lead among developed markets in terms of interest rate hikes and balance sheet normalization, while we anticipate central banks in Europe and Japan to scale back quantitative easing due to scarcity of assets while maintaining low interest rates amid subdued inflation outlooks. We believe the ECB is likely to start to reduce its asset purchases in January 2018 and that it may keep its rates on hold through 2017 and 2018. In our view, there is an increased likelihood of a tapering announcement by the ECB in September 2017, which could lead to a rise in LIBOR that might, in turn, result in higher yields for many European sovereign government bonds. In the U.K., we expect the Bank of England to remain on hold, providing inflation expectations do not rise materially. We |
3
PORTFOLIO RESULTS
| | see little scope for a near-term rate hike in Canada given recent weakness in inflation data. |
| | Overall, the taxable and tax-exempt Funds continue to be flexibly guided by shifting market conditions, and we have positioned them to seek to take advantage of anticipated interest rate movements. At the end of the Reporting Period, we viewed floating rate securities as offering value, and we intend to adjust duration guided by the context of market pricing in relation to our expectations. As always, we intend to continue to use our actively managed approach to seek the best possible return within the framework of our Funds’ investment guidelines and objectives. In addition, we will continue to manage interest, liquidity and credit risk daily. We will also continue to closely monitor economic data, Fed policy and any shifts in the taxable and tax-exempt money market yield curves, as we strive to navigate the interest rate environment. |
RETAIL MONEY MARKET FUNDS
You could lose money by investing in the Fund. Although the Fund seeks to preserve the value of your investment at $1.00 per share, it cannot guarantee it will do so. The Fund may impose a fee upon sale of your shares or may temporarily suspend your ability to sell shares if the Fund’s liquidity falls below required minimums because of market conditions or other factors. An investment in the Fund is not a deposit of a bank and is not insured or guaranteed by the Federal Deposit Insurance Corporation or any other government agency. The Fund’s sponsor has no legal obligation to provide financial support to the Fund, and you should not expect that the sponsor will provide financial support to the Fund at any time.
4
FUND BASICS
Investor Funds
as of August 31, 2017
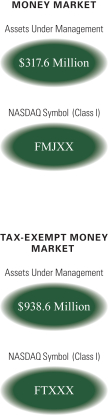
| | | | | | | | | | |
| | PERFORMANCE REVIEW1 | |
| | | September 1, 2016–August 31, 2017 | | Fund Total Return (based on NAV)2
Class I Shares | | | iMoneyNet Institutional
Average3 | |
| | Money Market | | | 0.87 | % | | | 0.45 | %4 |
| | | Tax-Exempt Money Market | | | 0.63 | | | | 0.33 | 5 |
The returns represent past performance. Past performance does not guarantee future results. The Funds’ investment returns will fluctuate. Current performance may be lower or higher than the performance quoted above. Please visit our web site at www.GSAMFUNDS.com to obtain the most recent month-end returns.
Performance reflects applicable fee waivers and/or expense limitations in effect during the periods shown. In their absence, performance would be reduced. Returns do not reflect the deduction of taxes that a shareholder would pay on Fund distributions or the redemption of Fund shares.
| | 1 | | The Money Market Fund offers seven separate classes of shares (Class I, Administration, Service, Resource, Cash Management, Class A and Class C Shares) and the Tax-Exempt Money Market Fund offers eleven separate classes of shares (Class I, Select, Preferred, Capital, Administration, Premier, Service, Resource, Cash Management, Class A and Class C Shares), each of which is subject to different fees and expenses that affect performance and entitles shareholders to different services. The Class I Shares do not have distribution and/or service (12b-1), administration or service (non-12b-1) fees. The Select, Preferred, Capital, Administration, Premier, Service, Resource, Cash Management, Class A and Class C Shares offer financial institutions the opportunity to receive fees for providing certain distribution, administrative support and/or shareholder services (as applicable). As an annualized percentage of average daily net assets, these share classes pay combined distribution and/or service (12b-1), administration and/or service (non-12b-1) fees (as applicable) at the following contractual rates: Select Shares pay 0.03%, Preferred Shares pay 0.10%, Capital Shares pay 0.15%, Administration Shares pay 0.25%, Premier Shares pay 0.35%, Service Shares pay 0.50%, Resource Shares pay 0.65%, Cash Management Shares pay 0.80%, Class A Shares pay 0.25%, and Class C Shares pay 1.00%. If these fees were reflected in the above performance, performance would have been reduced. In addition, the Fund’s performance does not reflect the deduction of any applicable sales charges. |
| | 2 | | The net asset value (“NAV”) represents the net assets of the class of the Fund (ex-dividend) divided by the total number of shares of the class outstanding. A Fund’s total return assumes the reinvestment of dividends and other distributions. |
| | 3 | | Source: iMoneyNet, Inc. August 2017. |
| | 4 | | First Tier Retail – Category includes only non-government retail funds that also are not holding any second-tier securities. Portfolio holdings of first-tier funds include US Treasury, US other, repos, time deposits, domestic bank obligations, foreign bank obligations, first-tier commercial paper, floating rate notes and asset-backed commercial paper. |
| | 5 | | Tax-Free National Retail – Category includes all retail national and state tax-free and municipal money funds. Portfolio holdings of tax-free funds include rated and unrated demand notes, rated and unrated general market notes, commercial paper, put bonds — 6 months & less, put bonds — over 6 months, alternative minimum tax paper and other tax-free holdings. Consists of all funds in the National Tax-Free Retail and State-Specific Retail categories. |
5
YIELD SUMMARY
| | | | | | | | | | | | | | | | | | | | | | | | |
| | STANDARDIZED TOTAL RETURNS1,6 |
| | | For the period
ended 6/30/17 | | SEC
7-Day
Current
Yield7 | | | One Year | | | Five Years | | | Ten Years | | | Since Inception | | | Inception Date |
| | Money Market | | | 1.11 | % | | | 0.76 | % | | | N/A | | | | N/A | | | | 0.64 | % | | 1/29/16 |
| | | Tax-Exempt Money Market | | | 0.73 | | | | 0.56 | | | | 0.13 | % | | | 0.49 | % | | | 1.77 | | | 7/19/94 |
| | 6 | | The Standardized Total Returns are average annual total returns or cumulative total returns (only if the performance period is one year or less) of Class I Shares as of the most recent calendar quarter-end. They assume reinvestment of all distributions at NAV. The SEC 7-Day Current Yield is not a Standardized Total Return. |
| | | | Because Class I Shares do not involve a sales charge, such a charge is not applied to their Standardized Total Returns. |
| | | | The yields and returns represent past performance. Past performance dose not guarantee future results. Current performance may be lower or higher than the performance quoted above. Please visit www.GSAMFUNDS.com to obtain the most recent month-end returns. Yields and returns will fluctuate as market conditions change. The yield quotations more closely reflect the current earnings of the Fund than the total return quotations. Performance reflects applicable fee waivers and/or expense limitations in effect during the periods shown. In their absence, performance would be reduced. Returns do not reflect the deduction of taxes that a shareholder would pay on Fund distributions or the redemption of Fund shares. |
| | 7 | | The SEC 7-Day Current Yield figures are as of 6/30/17 and are calculated in accordance with securities industry regulations and do not include net capital gains. SEC 7-Day Current Yield may differ slightly from the actual distribution rate of a given Fund because of the exclusion of distributed capital gains, which are non-recurring. The SEC 7-Day Current Yield more closely reflects a Fund’s current earnings than do the Standardized Total Return figures. |
| | | | | | | | | | | | | | | | | | | | | | |
| | SUMMARY OF THE CLASS I SHARES1 AS OF 8/31/17 | |
| | | Fund | | 7-Day
Dist. Yield8 | | | SEC 7-Day
Effective
Yield9 | | | 30-Day
Average
Yield10 | | | Weighted
Avg.
Maturity
(days)11 | | | Weighted
Avg. Life
(days)12 | |
| | Money Market | | | 1.17 | % | | | 1.17 | % | | | 1.17 | % | | | 31 | | | | 78 | |
| | | Tax-Exempt Money Market | | | 0.67 | | | | 0.67 | | | | 0.65 | | | | 22 | | | | 32 | |
| | | The Yields represent past performance. Past performance does not guarantee future results. Current performance may be lower or higher than the performance quoted above. |
| | | Yields reflect fee waivers and expense limitations in effect and will fluctuate as market conditions change. The yield quotations more closely reflect the current earnings of the Fund. Please visit our web site at www.GSAMFUNDS.com to obtain the most recent month-end performance. |
| 8 | | The 7-Day Distribution Yield is an annualized measure of a Fund’s dividends per share, divided by the price per share. This yield can include capital gain/loss distribution, if any. This is not an SEC Yield. |
| 9 | | The SEC 7-Day Effective Yield of a Fund is calculated in accordance with securities industry regulations and do not include net capital gains. The SEC 7-Day Effective Yield assumes reinvestment of dividends for one year. |
| 10 | | The 30-Day Average Yield is a net annualized yield of 30 days back from the current date listed. This yield includes capital gain/loss distribution. |
| 11 | | A Fund’s weighted average maturity (WAM) is an average of the effective maturities of all securities held in the portfolio, weighted by each security’s percentage of net assets. This must not exceed 60 days as calculated under SEC Rule 2a-7. |
| 12 | | A Fund’s weighted average life (WAL) is an average of the final maturities of all securities held in the portfolio, weighted by each security’s percentage of net assets. This must not exceed 120 days as calculated under SEC Rule 2a-7. |
6
SECTOR ALLOCATIONS
| | | | | | |
| | MONEY MARKET FUND13 | |
| | | As of August 31, 2017 | | | |
| | | Security Type | | Percentage of
Net Assets | |
| | Certificates of Deposit | | | 1.6 | % |
| | Certificates of Deposit — Yankeedollar | | | 9.0 | |
| | Commercial Paper & Corporate Obligations | | | 19.8 | |
| | Fixed Rate Municipal Debt Obligations | | | 4.1 | |
| | Repurchase Agreements | | | 22.2 | |
| | Variable Rate Municipal Debt Obligations | | | 6.6 | |
| | | Variable Rate Obligations | | | 37.2 | |
| 13 | | The Fund is actively managed and, as such, its portfolio composition may differ over time. The percentage shown for each investment category reflects the value of investments in that category as a percentage of net assets. Figures in the above table may not sum to 100% due to the exclusion of other assets and liabilities. |
| | | | | | |
| | MONEY MARKET FUND14 | |
| | | As of August 31, 2016 | | | |
| | | Security Type | | Percentage of
Net Assets | |
| | Certificates of Deposit — Yankeedollar | | | 11.4 | % |
| | Commercial Paper & Corporate Obligations | | | 25.0 | |
| | Fixed Rate Municipal Debt Obligations | | | 2.1 | |
| | Repurchase Agreements | | | 19.1 | |
| | Variable Rate Municipal Debt Obligations | | | 25.4 | |
| | | Variable Rate Obligations | | | 15.9 | |
| 14 | | The Fund is actively managed and, as such, its portfolio composition may differ over time. The percentage shown for each investment category reflects the value (based on amortized cost) of investments in that category as a percentage of net assets. Figures in the above table may not sum to 100% due to the exclusion of other assets and liabilities. |
7
SECTOR ALLOCATIONS
| | | | | | |
| | TAX-EXEMPT MONEY MARKET FUND15 | | | | |
| | | As of August 31, 2017 | | | |
| | | Security Type | | Percentage of
Net Assets | |
| | Bond Anticipation Notes | | | 1.6 | % |
| | Commercial Paper | | | 22.2 | |
| | Revenue Bonds | | | 1.3 | |
| | Tax and Revenue Anticipation Notes | | | 2.1 | |
| | | Variable Rate Obligations | | | 74.5 | |
| | 15 | | The Fund is actively managed and, as such, its portfolio composition may differ over time. The percentage shown for each investment category reflects the value of investments in that category as a percentage of net assets. Figures in the above table may not sum to 100% due to the exclusion of other assets and liabilities. |
| | | | | | |
| | TAX-EXEMPT MONEY MARKET FUND16 | | | | |
| | | As of August 31, 2016 | | | |
| | | Security Type | | Percentage of
Net Assets | |
| | Commercial Paper | | | 8.7 | % |
| | Put Bonds | | | 0.5 | |
| | Tax and Revenue Anticipation Notes | | | 1.3 | |
| | | Variable Rate Obligations | | | 89.5 | |
| | 16 | | The Fund is actively managed and, as such, its portfolio composition may differ over time. The percentage shown for each investment category reflects the value (based on amortized cost) of investments in that category as a percentage of net assets. Figures in the above table may not sum to 100% due to the exclusion of other assets and liabilities. |
8
PORTFOLIO RESULTS
Index Definitions
The BofA Merrill Lynch U.S. Dollar Three-Month LIBOR Constant Maturity Index is based on the assumed purchase of a synthetic instrument having three months to maturity and with a coupon equal to the closing quote for three-month LIBOR. That issue is sold the following day (priced at a yield equal to the current day closing three-month LIBOR rate) and is rolled into a new three-month instrument. The index, therefore, will always have a constant maturity equal to exactly three months.
The Securities Industry and Financial Markets Association (“SIFMA”) Municipal Swap Index is a seven-day high-grade market index comprised of tax-exempt variable rate demand obligations with certain characteristics. The Index is calculated and published by Bloomberg. The Index is overseen by SIFMA’s municipal swap index committee.
9
INVESTOR MONEY MARKET FUND
Schedule of Investments
August 31, 2017
| | | | | | | | | | | | | | |
Principal
Amount | | | Interest
Rate | | | Maturity
Date | | | Amortized
Cost | |
| Commercial Paper and Corporate Obligations – 19.8% | |
| | Albion Capital LLC | |
| $ | 2,000,000 | | | | 1.245 | % | | | 09/01/17 | | | $ | 2,000,000 | |
| | 3,000,000 | | | | 1.318 | | | | 09/26/17 | | | | 2,997,313 | |
| | Alpine Securitization Ltd. | |
| | 1,000,000 | | | | 1.370 | | | | 10/25/17 | | | | 997,990 | |
| | 2,000,000 | | | | 1.381 | | | | 12/08/17 | | | | 1,992,650 | |
| | Bank of China (Hong Kong) | |
| | 1,300,000 | | | | 1.585 | | | | 09/19/17 | | | | 1,298,993 | |
| | CAFCO LLC | |
| | 3,000,000 | | | | 1.445 | | | | 02/01/18 | | | | 2,982,023 | |
| | CHARTA LLC | |
| | 2,000,000 | | | | 1.445 | | | | 02/02/18 | | | | 1,987,937 | |
| | CRC Funding LLC | |
| | 3,000,000 | | | | 1.466 | | | | 01/10/18 | | | | 2,984,389 | |
| | DBS Bank Ltd. | |
| | 3,500,000 | | | | 1.319 | | | | 09/19/17 | | | | 3,497,743 | |
| | First Abu Dhabi Bank | |
| | 7,000,000 | | | | 1.276 | | | | 09/06/17 | | | | 6,998,784 | |
| | Kells Funding LLC | |
| | 1,500,000 | | | | 1.329 | | | | 10/30/17 | | | | 1,496,804 | |
| | 2,000,000 | | | | 1.330 | | | | 11/01/17 | | | | 1,995,594 | |
| | LMA-Americas LLC | |
| | 6,000,000 | | | | 1.101 | | | | 09/01/17 | | | | 6,000,000 | |
| | Matchpoint Finance PLC | |
| | 5,000,000 | | | | 1.204 | | | | 09/01/17 | | | | 5,000,000 | |
| | 3,000,000 | | | | 1.381 | | | | 10/02/17 | | | | 2,996,513 | |
| | Nieuw Amsterdam Receivables Corp. | |
| | 2,000,000 | | | | 1.398 | | | | 01/17/18 | | | | 1,989,343 | |
| | Northwestern Memorial Healthcare | |
| | 6,333,000 | | | | 1.297 | | | | 10/18/17 | | | | 6,322,499 | |
| | Societe Generale | |
| | 1,500,000 | | | | 1.475 | | | | 01/31/18 | | | | 1,490,880 | |
| | The State of the Netherlands | |
| | 5,000,000 | | | | 1.214 | | | | 09/01/17 | | | | 5,000,000 | |
| | Westpac Securities NZ, Ltd. | |
| | 3,000,000 | | | | 1.228 | | | | 09/05/17 | | | | 2,999,600 | |
| | |
| TOTAL COMMERCIAL PAPER AND
CORPORATE OBLIGATIONS |
| | $ | 63,029,055 | |
| | |
| | | | | | | | | | | | | | |
| Certificate of Deposit – 1.6% | |
| | State Street Bank and Trust Co. | |
| $ | 5,000,000 | | | | 1.300 | % | | | 10/23/17 | | | $ | 5,000,000 | |
| | |
| | | | | | | | | | | | | | |
| Certificates of Deposit-Yankeedollar – 9.0% | |
| | Banco Del Estado De Chile | |
| $ | 2,000,000 | | | | 1.310 | % | | | 10/06/17 | | | $ | 2,000,000 | |
| | Bank of Tokyo-Mitsubishi UFJ Ltd. (The) | |
| | 5,000,000 | | | | 1.520 | | | | 10/30/17 | | | | 5,001,087 | |
| | Citibank N.A. | |
| | 3,000,000 | | | | 1.420 | | | | 12/14/17 | | | | 3,000,000 | |
| | Cooperative Rabobank UA | |
| | 500,000 | | | | 1.400 | | | | 09/20/17 | | | | 500,000 | |
| | DZ Bank AG | |
| | 2,000,000 | | | | 1.400 | | | | 02/28/18 | | | | 2,000,000 | |
| | |
| Certificates of Deposit-Yankeedollar – (continued) | |
| | National Bank of Kuwait | |
| 4,000,000 | | | | 1.500 | | | | 10/03/17 | | | | 4,000,000 | |
| | 4,000,000 | | | | 1.500 | | | | 10/13/17 | | | | 4,000,000 | |
| | Sumitomo Mitsui Trust Bank Ltd. | |
| | 5,000,000 | | | | 1.180 | | | | 09/05/17 | | | | 5,000,000 | |
| | Toronto-Dominion Bank (The) | |
| | 3,000,000 | | | | 1.600 | | | | 08/22/18 | | | | 3,000,000 | |
| | |
| TOTAL CERTIFICATES OF
DEPOSIT-YANKEEDOLLAR |
| | $ | 28,501,087 | |
| | |
| | | | | | | | | | | | | | |
| Fixed Rate Municipal Debt Obligations – 4.1% | |
| | Bank of America N.A. | |
| $ | 2,000,000 | | | | 1.650 | % | | | 03/26/18 | | | $ | 2,001,885 | |
| | Bank of Montreal | |
| | 2,000,000 | | | | 1.450 | | | | 04/09/18 | | | | 1,999,737 | |
| | Bank of Tokyo-Mitsubishi UFJ Ltd. (The) | |
| | 2,000,000 | | | | 1.450 | (a) | | | 09/08/17 | | | | 2,000,004 | |
| | Cooperatieve Rabobank U.A. | |
| | 2,500,000 | | | | 1.700 | | | | 03/19/18 | | | | 2,502,402 | |
| | Royal Bank of Canada | |
| | 1,500,000 | | | | 1.500 | | | | 01/16/18 | | | | 1,500,860 | |
| | Swedbank AB | |
| | 1,500,000 | | | | 2.125 | (a) | | | 09/29/17 | | | | 1,500,861 | |
| | Wells Fargo Bank N.A. | |
| | 1,400,000 | | | | 1.650 | | | | 01/22/18 | | | | 1,400,625 | |
| | |
| TOTAL FIXED RATE MUNICIPAL DEBT
OBLIGATIONS |
| | $ | 12,906,374 | |
| | |
| | | | | | | | | | | | | | |
| Variable Rate Municipal Debt Obligations(b) – 6.6% | |
| BlackRock Municipal Bond Trust VRDN RB Putters
Series 2012-T0014 (JPMorgan Chase N.A., LIQ)(a) |
|
| $ | 4,000,000 | | | | 1.260 | % | | | 09/01/17 | | | $ | 4,000,000 | |
| BlackRock MuniVest Fund II, Inc. VRDN RB Putters
Series 2012-T0005 (JPMorgan Chase Bank N.A., LIQ)(a) |
|
| | 4,000,000 | | | | 1.260 | | | | 09/01/17 | | | | 4,000,000 | |
| City of Charlotte, North Carolina VRDN RB for Uptown
Revitalization Project Series 2004 (Wells Fargo Bank N.A.,
SPA) |
|
| | 1,440,000 | | | | 1.180 | | | | 09/07/17 | | | | 1,440,000 | |
| City of Portland, Maine GO VRDN for Taxable Pension Bonds
Series 2001 RMKT (Sumitomo Mitsui Banking Corp., SPA) |
|
| | 3,185,000 | | | | 1.240 | | | | 09/07/17 | | | | 3,185,000 | |
| Providence St Joseph Health Obligated Group (Bank of Toyoko-
Mitsubishi UFJ, LOC) |
|
| | 5,000,000 | | | | 1.220 | | | | 09/07/17 | | | | 5,000,000 | |
| Triborough Bridge & Tunnel Authority VRDN Refunding
Floating RB Series 2013 Subseries 2B RMKT (Bank of
America N.A., LOC) |
|
| | 3,500,000 | | | | 1.180 | | | | 09/07/17 | | | | 3,500,000 | |
| | |
| TOTAL VARIABLE RATE MUNICIPAL
DEBT OBLIGATIONS |
| | $ | 21,125,000 | |
| | |
| | |
| 10 | | The accompanying notes are an integral part of these financial statements. |
INVESTOR MONEY MARKET FUND
| | | | | | | | | | | | | | |
Principal
Amount | | | Interest
Rate | | | Maturity
Date | | | Amortized
Cost | |
| Variable Rate Obligations(c) – 37.2% | |
| | Abbey National Treasury Services PLC (1 Mo. LIBOR + 0.18%) | |
| $ | 3,000,000 | | | | 1.411 | % | | | 12/04/17 | | | $ | 3,000,000 | |
| | ASB Finance Ltd./London (1 Mo. LIBOR + 0.38%) | |
| | 815,000 | | | | 1.609 | (a) | | | 11/09/17 | | | | 815,251 | |
| Australia & New Zealand Banking Group Ltd.
(1 Mo. LIBOR + 0.09%) |
|
| | 2,000,000 | | | | 1.318 | (a) | | | 01/18/18 | | | | 1,999,927 | |
| Australia & New Zealand Banking Group Ltd.
(1 Mo. LIBOR + 0.14%) |
|
| | 1,400,000 | | | | 1.369 | (a) | | | 09/12/17 | | | | 1,399,987 | |
| | Banco Del Estado De Chile (1 Mo. LIBOR + 0.22%) | |
| | 2,500,000 | | | | 1.451 | | | | 10/20/17 | | | | 2,500,000 | |
| | Bank of Montreal (1 Mo. LIBOR + 0.19%) | |
| | 4,000,000 | | | | 1.421 | | | | 05/04/18 | | | | 4,000,000 | |
| | Bank of Nova Scotia (The) (1 Mo. LIBOR + 0.23%) | |
| | 5,000,000 | | | | 1.458 | | | | 09/17/18 | | | | 5,000,000 | |
| | Bedford Row Funding Corp. (1 Mo. LIBOR + 0.22%) | |
| | 3,000,000 | | | | 1.454 | (a) | | | 08/22/18 | | | | 3,000,000 | |
| | BNZ International Funding Ltd. (3 Mo. LIBOR + 0.49%) | |
| | 1,900,000 | | | | 1.791 | (a) | | | 10/04/17 | | | | 1,900,000 | |
| | Canadian Imperial Bank of Commerce (1 Mo. LIBOR + 0.23%) | |
| | 3,000,000 | | | | 1.466 | | | | 09/21/18 | | | | 3,000,000 | |
| | Canadian Imperial Bank of Commerce (3 Mo. LIBOR + 0.43%) | |
| | 3,000,000 | | | | 1.734 | | | | 10/13/17 | | | | 3,000,000 | |
| Collateralized Commercial Paper II Co., LLC
(1 Mo. LIBOR + 0.42%) |
|
| | 500,000 | | | | 1.649 | | | | 11/09/17 | | | | 500,192 | |
| Collateralized Commercial Paper II Co., LLC
(1 Mo. LIBOR + 0.60%)(a) |
|
| | 1,000,000 | | | | 1.828 | | | | 01/17/18 | | | | 1,000,000 | |
| | 1,000,000 | | | | 1.836 | | | | 01/24/18 | | | | 1,000,000 | |
| Collateralized Commercial Paper II Co., LLC
(3 Mo. LIBOR + 0.18%) |
|
| | 1,500,000 | | | | 1.483 | (a) | | | 07/06/18 | | | | 1,500,000 | |
| | Commonwealth Bank of Australia (1 Mo. LIBOR + 0.18%) | |
| | 3,000,000 | | | | 1.414 | (a) | | | 08/23/18 | | | | 3,000,000 | |
| | Commonwealth Bank of Australia (1 Mo. LIBOR + 0.37%) | |
| | 3,000,000 | | | | 1.606 | (a) | | | 02/23/18 | | | | 3,000,000 | |
| | Commonwealth Bank of Australia (3 Mo. LIBOR + 0.11%) | |
| | 2,000,000 | | | | 1.427 | (a) | | | 04/27/18 | | | | 2,000,000 | |
| | Commonwealth Bank of Australia (3 Mo. LIBOR + 0.34%) | |
| | 1,000,000 | | | | 1.559 | (a) | | | 12/01/17 | | | | 1,000,497 | |
| | Credit Suisse AG (1 Mo. LIBOR + 0.21%) | |
| | 2,800,000 | | | | 1.439 | | | | 01/08/18 | | | | 2,800,000 | |
| | Dexia Credit Local (1 Mo. LIBOR + 0.35%) | |
| | 1,500,000 | | | | 1.581 | | | | 12/20/17 | | | | 1,500,000 | |
| | Dexia Credit Local (1 Mo. LIBOR + 0.38%) | |
| | 3,000,000 | | | | 1.611 | | | | 12/07/17 | | | | 3,000,000 | |
| | Dexia Credit Local (1 Mo. LIBOR + 0.41%) | |
| | 2,500,000 | | | | 1.645 | | | | 11/22/17 | | | | 2,500,000 | |
| | DZ Bank AG (1 Mo. LIBOR + 0.18%) | |
| | 2,400,000 | | | | 1.409 | (a) | | | 09/08/17 | | | | 2,400,021 | |
| | Erste Abwicklungsanstalt (1 Mo. LIBOR + 0.06%) | |
| | 2,000,000 | | | | 1.294 | (a) | | | 09/25/17 | | | | 2,000,000 | |
| | Erste Abwicklungsanstalt (1 Mo. LIBOR + 0.19%) | |
| | 2,000,000 | | | | 1.418 | (a) | | | 09/18/17 | | | | 2,000,000 | |
| | |
| Variable Rate Obligations(c) – (continued) | |
| | Erste Abwicklungsanstalt (1 Mo. LIBOR + 0.22%) | |
| $ | 7,000,000 | | | | 1.451 | %(a) | | | 09/07/17 | | | $ | 7,000,000 | |
| | HSBC Bank PLC (1 Mo. LIBOR + 0.46%) | |
| | 1,500,000 | | | | 1.692 | (a) | | | 11/01/17 | | | | 1,500,000 | |
| Industrial & Commercial Bank of China Ltd./New York
(3 Mo. LIBOR + 1.19%) |
|
| | 1,750,000 | | | | 2.499 | | | | 11/13/17 | | | | 1,752,489 | |
| | J.P. Morgan Securities LLC (1 Mo. LIBOR + 0.25%) | |
| | 3,000,000 | | | | 1.482 | (a) | | | 09/01/17 | | | | 3,000,000 | |
| | Mizuho Bank Ltd. (1 Mo. LIBOR + 0.40%) | |
| | 2,000,000 | | | | 1.632 | | | | 09/01/17 | | | | 2,000,000 | |
| | National Australia Bank Ltd. (1 Mo. LIBOR + 0.30%) | |
| | 2,000,000 | | | | 1.532 | (a) | | | 04/03/18 | | | | 2,000,000 | |
| | Nordea Bank AB (3 Mo. LIBOR + 0.50%) | |
| | 650,000 | | | | 1.723 | | | | 09/06/17 | | | | 650,000 | |
| | Norinchukin Bank (The) (1 Mo. LIBOR + 0.23%) | |
| | 2,000,000 | | | | 1.464 | | | | 10/27/17 | | | | 2,000,000 | |
| | Oversea-Chinese Banking Corp., Ltd. (1 Mo. LIBOR + 0.20%) | |
| | 2,000,000 | | | | 1.429 | (a) | | | 09/11/17 | | | | 1,999,985 | |
| | Oversea-Chinese Banking Corp., Ltd. (1 Mo. LIBOR + 0.21%) | |
| | 2,000,000 | | | | 1.439 | | | | 09/14/17 | | | | 2,000,035 | |
| | Oversea-Chinese Banking Corp., Ltd. (3 Mo. LIBOR + 0.18%) | |
| | 2,000,000 | | | | 1.479 | (a) | | | 04/03/18 | | | | 2,000,000 | |
| | Oversea-Chinese Banking Corp., Ltd. (3 Mo. LIBOR + 0.33%) | |
| | 1,300,000 | | | | 1.645 | (a) | | | 11/15/17 | | | | 1,300,000 | |
| | Royal Bank of Canada (3 Mo. LIBOR + 0.13%) | |
| | 1,000,000 | | | | 1.358 | | | | 06/12/18 | | | | 1,000,000 | |
| | Royal Bank of Canada (3 Mo. LIBOR + 0.41%) | |
| | 1,500,000 | | | | 1.711 | | | | 10/05/17 | | | | 1,499,998 | |
| | Standard Chartered Bank (1 Mo. LIBOR + 0.21%) | |
| | 2,000,000 | | | | 1.441 | | | | 04/19/18 | | | | 2,000,000 | |
| | Standard Chartered Bank (1 Mo. LIBOR + 0.44%) | |
| | 3,000,000 | | | | 1.668 | | | | 12/18/17 | | | | 3,000,000 | |
| | Standard Chartered Bank (3 Mo. LIBOR + 0.46%) | |
| | 250,000 | | | | 1.764 | | | | 10/12/17 | | | | 250,000 | |
| | Standard Chartered Bank (3 Mo. LIBOR + 0.72%) | |
| | 300,000 | | | | 2.000 | | | | 09/20/17 | | | | 300,000 | |
| | Sumitomo Mitsui Banking Corp. (1 Mo. LIBOR + 0.18%) | |
| | 3,000,000 | | | | 1.414 | | | | 03/02/18 | | | | 3,000,000 | |
| | Sumitomo Mitsui Trust Bank Ltd. (1 Mo. LIBOR + 0.30%) | |
| | 1,500,000 | | | | 1.534 | | | | 09/25/17 | | | | 1,500,000 | |
| | Svenska Handelsbanken AB (1 Mo. LIBOR + 0.14%) | |
| | 2,500,000 | | | | 1.371 | | | | 04/06/18 | | | | 2,500,000 | |
| | Swedbank AB (1 Mo. LIBOR + 0.10%) | |
| | 3,000,000 | | | | 1.336 | | | | 04/18/18 | | | | 3,000,000 | |
| | Toronto-Dominion Bank (The) (1 Mo. LIBOR + 0.44%) | |
| | 3,000,000 | | | | 1.672 | | | | 11/02/17 | | | | 3,000,000 | |
| | Wells Fargo Bank N.A. (1 Mo. LIBOR + 0.19%) | |
| | 2,000,000 | | | | 1.421 | | | | 06/11/18 | | | | 2,000,000 | |
| | Wells Fargo Bank N.A. (3 Mo. LIBOR + 0.32%) | |
| | 1,500,000 | | | | 1.637 | | | | 01/26/18 | | | | 1,500,000 | |
| | Wells Fargo Bank N.A. (3 Mo. LIBOR + 0.48%) | |
| | 500,000 | | | | 1.769 | | | | 09/22/17 | | | | 500,000 | |
| | Westpac Banking Corp. (1 Mo. LIBOR + 0.15%) | |
| | 3,000,000 | | | | 1.379 | (a) | | | 07/13/18 | | | | 3,000,000 | |
| | |
| | |
| The accompanying notes are an integral part of these financial statements. | | 11 |
INVESTOR MONEY MARKET FUND
Schedule of Investments (continued)
August 31, 2017
| | | | | | | | | | | | | | |
Principal
Amount | | | Interest
Rate | | | Maturity
Date | | | Amortized
Cost | |
| Variable Rate Obligations(c) – (continued) | |
| | Westpac Securities NZ, Ltd. (1 Mo. LIBOR + 0.15%) | |
| $ | 4,000,000 | | | | 1.381 | %(a) | | | 02/20/18 | | | $ | 4,000,012 | |
| | |
| TOTAL VARIABLE RATE
OBLIGATIONS |
| | $ | 118,068,394 | |
| | |
| TOTAL INVESTMENTS BEFORE
REPURCHASE AGREEMENTS |
| | $ | 248,629,910 | |
| | |
| | | | | | | | | | | | | | |
| Repurchase Agreements(d) – 22.2% | |
| | BNP Paribas (OBFR + 0.20%) | |
| $ | 5,000,000 | | | | 1.360 | %(c) | | | 09/07/17 | | | $ | 5,000,000 | |
| | Maturity Value: $5,032,867 | |
| | Settlement Date: 03/24/17 | |
| Collateralized by a mortgage-backed obligation, 5.634%, due
01/25/24, various corporate security issuers, 3.875% to 7.500%,
due 07/16/20 to 11/24/43 and a sovereign debt security issuer,
10.125%, due 05/15/27. The aggregate market value of the
collateral, including accrued interest, was $5,481,641. |
|
| | |
| | Joint Repurchase Agreement Account III | |
| | 64,400,000 | | | | 1.076 | | | | 09/01/17 | | | | 64,400,000 | |
| | Maturity Value: $64,401,924 | |
| | |
| | Mizuho Securities USA LLC (3 Mo. LIBOR + 0.95%) | |
| | 1,000,000 | | | | 2.262 | (c)(e) | | | 11/29/17 | | | | 1,000,000 | |
| | Maturity Value: $1,013,320 | |
| | Settlement Date: 05/08/17 | |
| Collateralized by various corporate security issuers, 1.407% to
12.000%, due 05/03/18 to 05/15/35. The aggregate market
value of the collateral, including accrued interest, was
$1,061,387. |
|
| | |
| | TOTAL REPURCHASE AGREEMENTS | | | $ | 70,400,000 | |
| | |
| | TOTAL INVESTMENTS – 100.5% | | | $ | 319,029,910 | |
| | |
| LIABILITIES IN EXCESS OF
OTHER ASSETS – (0.5)% |
| | | (1,417,854 | ) |
| | |
| | NET ASSETS – 100.0% | | | $ | 317,612,056 | |
| | |
| | |
| The percentage shown for each investment category reflects the value of investments in that category as a percentage of net assets. |
(a) | | Security not registered under the Securities Act of 1933, as amended. Such securities may be deemed liquid by the Investment Adviser. At August 31, 2017, these securities amounted to $65,316,545 or approximately 20.6% of net assets. |
(b) | | Rate shown is that which is in effect on August 31, 2017. Certain variable rate securities are not based on a published reference rate and spread but are determined by the issuer or agent and are based on current market conditions. |
(c) | | Variable or floating rate security. Interest rate disclosed is that which is in effect at August 31, 2017. |
(d) | | Unless noted, all repurchase agreements were entered into on August 31, 2017. Additional information on Joint Repurchase Agreement Account III appears on page 20. |
(e) | | Security has been determined to be illiquid by the Investment Adviser. At August 31, 2017, this security amounted to $1,000,000 or approximately 0.3% of net assets, and is unaudited. |
Interest rates represent either the stated coupon rate, annualized yield on date of purchase for discounted securities, or, for floating rate securities, the current reset rate, which is based upon current interest rate indices.
Maturity dates represent either the final legal maturity date on the security, the demand date for puttable securities, or the prerefunded date for those types of securities.
| | |
|
Investment Abbreviations: |
GO | | —General Obligation |
LIBOR | | —London Interbank Offered Rate |
LIQ | | —Liquidity Agreement |
LOC | | —Letter of Credit |
OBFR | | —Overnight Bank Funding Rate |
RB | | —Revenue Bond |
RMKT | | —Remarketed |
SPA | | —Stand-by Purchase Agreement |
VRDN | | —Variable Rate Demand Notes |
|
| | |
| 12 | | The accompanying notes are an integral part of these financial statements. |
INVESTOR TAX-EXEMPT MONEY MARKET FUND
Schedule of Investments
August 31, 2017
| | | | | | | | | | | | | | |
Principal Amount | | | Interest
Rate | | | Maturity
Date | | | Amortized
Cost | |
| Municipal Debt Obligations – 101.7% | |
| Alabama – 4.1% | |
| Columbia IDB VRDN PCRB Refunding for Alabama Power Co.
Project Series 2014 C(a) |
|
| $ | 10,000,000 | | | | 0.930 | % | | | 09/01/17 | | | $ | 10,000,000 | |
| | Huntsville Health Care Authority CP Series 2017 | |
| | 17,300,000 | | | | 0.870 | | | | 10/23/17 | | | | 17,300,000 | |
| Mobile IDB VRDN PCRB for Alabama Power Co. Barry Plant
Project Series 2007 C RMKT(a) |
|
| | 11,500,000 | | | | 1.000 | | | | 09/07/17 | | | | 11,500,000 | |
| | | | | | | | | | | | | | |
| | | | | 38,800,000 | |
| | |
| Alaska – 2.5% | |
| Alaska Housing Finance Corp. VRDN RB Refunding for
Governmental Purpose Series 2001 B RMKT(a) |
|
| | 11,640,000 | | | | 0.750 | | | | 09/07/17 | | | | 11,640,000 | |
| Alaska Housing Finance Corp. VRDN RB State Capital Project
Series 2002 C RMKT(a) |
|
| | 10,365,000 | | | | 0.800 | | | | 09/07/17 | | | | 10,365,000 | |
| City of Valdez Marine Terminal VRDN RB Refunding for Exxon
Pipeline Co. Project Series 1985(a) |
|
| | 1,000,000 | | | | 0.820 | | | | 09/01/17 | | | | 1,000,000 | |
| | | | | | | | | | | | | | |
| | | | | 23,005,000 | |
| | |
| Arizona – 0.2% | |
| Arizona Health Facilities Authority VRDN RB Refunding for
Banner Health Series 2008 G (Wells Fargo Bank N.A., LOC)(a) |
|
| | 2,165,000 | | | | 0.800 | | | | 09/07/17 | | | | 2,165,000 | |
| | |
| California – 5.7% | |
| California Statewide Communities Development Authority CP for
Kaiser Permanente Series 2017 04-I |
|
| | 5,800,000 | | | | 0.940 | | | | 09/05/17 | | | | 5,800,000 | |
| | 3,350,000 | | | | 0.940 | | | | 10/17/17 | | | | 3,350,000 | |
| | 16,090,000 | | | | 0.960 | | | | 10/18/17 | | | | 16,090,000 | |
| City of Santa Clara Electric VRDN RB Refunding Series 2008
Subseries B RMKT (Bank of Tokyo-Mitsubishi UFJ, LOC)(a) |
|
| | 2,900,000 | | | | 0.760 | | | | 09/07/17 | | | | 2,900,000 | |
| Sacramento County Housing Authority VRDN RB Refunding for
River Terrace Apartments Series 1996 C RMKT (FNMA)
(FNMA, LIQ)(a) |
|
| | 835,000 | | | | 0.770 | | | | 09/07/17 | | | | 835,000 | |
| San Diego County Regional Transportation Commission VRDN
RB Refunding for Limited Tax Series 2008 A (JPMorgan
Chase Bank N.A., SPA)(a) |
|
| | 8,450,000 | | | | 0.750 | | | | 09/07/17 | | | | 8,450,000 | |
| San Diego County Regional Transportation Commission VRDN
RB Refunding for Limited Tax Series 2008 C (Mizuho Corp.
Bank, SPA)(a) |
|
| | 200,000 | | | | 0.770 | | | | 09/07/17 | | | | 200,000 | |
| Santa Clara County Financing Authority VRDN RB Refunding
for Multiple Facilities Projects Series 2008 M (Bank of
America N.A., LOC)(a) |
|
| | 3,000,000 | | | | 0.790 | | | | 09/07/17 | | | | 3,000,000 | |
| Santa Clara Valley Transportation Authority Sales Tax VRDN
RB Refunding for Measure A Series 2008 B RMKT
(Sumitomo Mitsui Banking Corp., SPA)(a) |
|
| | 2,900,000 | | | | 0.760 | | | | 09/07/17 | | | | 2,900,000 | |
| | |
| Municipal Debt Obligations – (continued) | |
| California – (continued) | |
| The Regents of the University of California Medical Center
Pooled VRDN RB Series 2013 K(a) |
|
| 4,750,000 | | | | 0.750 | | | | 09/07/17 | | | | 4,750,000 | |
| The Regents of the University of California VRDN RB Refunding
General Series 2013 AL-2(a) |
|
| | 5,425,000 | | | | 0.800 | | | | 09/07/17 | | | | 5,425,000 | |
| | | | | | | | | | | | | | |
| | | | | 53,700,000 | |
| | |
| Colorado – 3.2% | |
| City of Colorado Springs Utilities System VRDN RB for
Subordinate Lien Improvement Series 2005 A RMKT (Mizuho
Bank, Ltd., SPA)(a) |
|
| | 2,375,000 | | | | 0.830 | | | | 09/07/17 | | | | 2,375,000 | |
| City of Colorado Springs Utilities System VRDN RB for
Subordinate Lien Improvement Series 2006 B RMKT
(Landesbank Hessen-Thueringen Girozentrale, SPA)(a) |
|
| | 1,400,000 | | | | 0.830 | | | | 09/07/17 | | | | 1,400,000 | |
| City of Colorado Springs Utilities System VRDN RB for
Subordinate Lien Series 2000 A RMKT (Landesbank Hessen-
Thueringen Girozentrale, SPA)(a) |
|
| | 3,250,000 | | | | 0.830 | | | | 09/07/17 | | | | 3,250,000 | |
| City of Colorado Springs Utilities System VRDN RB
Series 2010 C (JPMorgan Chase Bank N.A., SPA)(a) |
|
| | 245,000 | | | | 0.800 | | | | 09/07/17 | | | | 245,000 | |
| Colorado Health Facilities Authority VRDN RB for SCL Health
System Series 2016 B (Wells Fargo Bank N.A., LIQ)(a) |
|
| | 400,000 | | | | 0.810 | | | | 09/07/17 | | | | 400,000 | |
| Colorado Health Facilities Authority VRDN RB for SCL Health
System Series 2016 D (Wells Fargo Bank N.A., LIQ)(a) |
|
| | 11,200,000 | | | | 0.770 | | | | 09/07/17 | | | | 11,200,000 | |
| Colorado Housing & Finance Authority VRDN RB Refunding for
Single Family Mortgage Class I Adjustable Series 2001 AA-2
RMKT (Sumitomo Mitsui Banking Corp., LOC)(a) |
|
| | 2,150,000 | | | | 0.780 | | | | 09/07/17 | | | | 2,150,000 | |
| University of Colorado Hospital Authority VRDN RB Refunding
Series 2017 B-1(a) |
|
| | 6,000,000 | | | | 0.800 | | | | 09/07/17 | | | | 6,000,000 | |
| University of Colorado Hospital Authority VRDN RB Refunding
Series 2017 B-2(a) |
|
| | 3,450,000 | | | | 0.800 | | | | 09/07/17 | | | | 3,450,000 | |
| | | | | | | | | | | | | | |
| | | | | 30,470,000 | |
| | |
| Connecticut – 5.0% | |
| Connecticut Housing Finance Authority VRDN RB Housing
Mortgage Finance Program Refunding Series 2011
Subseries E-3 (Bank of Tokyo-Mitsubishi UFJ, SPA)(a) |
|
| | 16,830,000 | | | | 0.760 | | | | 09/07/17 | | | | 16,830,000 | |
| Connecticut Housing Finance Authority VRDN RB Housing
Mortgage Finance Program Refunding Series 2013
Subseries B-6 (Bank of Tokyo-Mitsubishi UFJ, SPA)(a) |
|
| | 1,645,000 | | | | 0.760 | | | | 09/07/17 | | | | 1,645,000 | |
| Connecticut Housing Finance Authority VRDN RB Housing
Mortgage Finance Program Refunding Series 2014
Subseries C-2 (Bank of Tokyo-Mitsubishi UFJ, SPA)(a) |
|
| | 5,500,000 | | | | 0.780 | | | | 09/07/17 | | | | 5,500,000 | |
| | |
| | |
| The accompanying notes are an integral part of these financial statements. | | 13 |
INVESTOR TAX-EXEMPT MONEY MARKET FUND
Schedule of Investments (continued)
August 31, 2017
| | | | | | | | | | | | | | |
Principal Amount | | | Interest
Rate | | | Maturity
Date | | | Amortized
Cost | |
| Municipal Debt Obligations – (continued) | |
| Connecticut – (continued) | |
| Connecticut Housing Finance Authority VRDN RB Housing
Mortgage Finance Program Refunding Series 2017
Subseries A-3 (Landesbank Hessen-Thueringen Girozentrale,
SPA)(a) |
|
| $ | 175,000 | | | | 0.810 | % | | | 09/07/17 | | | $ | 175,000 | |
| State of Connecticut GO VRDN Refunding SIFMA Index
Series 2015 D (SIFMA + 0.75%) |
|
| | 20,740,000 | | | | 1.540 | | | | 06/15/18 | | | | 20,821,539 | |
| State of Connecticut GO VRDN SIFMA Index Series 2013 A
(SIFMA + 0.42%) |
|
| | 1,850,000 | | | | 1.210 | | | | 03/01/18 | | | | 1,851,645 | |
| | | | | | | | | | | | | | |
| | | | | 46,823,184 | |
| | |
| Delaware – 0.2% | |
| Delaware State Health Facilities Authority VRDN RB for
Christiana Care Health Services, Inc. Series 2010 B(a) |
|
| | 2,050,000 | | | | 0.800 | | | | 09/07/17 | | | | 2,050,000 | |
| | |
| District of Columbia – 2.4% | |
| District of Columbia Income Tax Secured VRDN RB Refunding
SIFMA Series 2014 B (SIFMA + 0.30%) |
|
| | 15,300,000 | | | | 1.090 | | | | 12/01/17 | | | | 15,302,641 | |
| District of Columbia Water & Sewer Authority Public Utility
Systems VRDN RB Subordinate Lien Series 2014
Subseries B-1 (TD Bank N.A., SPA)(a) |
|
| | 200,000 | | | | 0.800 | | | | 09/07/17 | | | | 200,000 | |
| Metropolitan Washington Airports Authority Airport System
VRDN RB Refunding Series 2009 Subseries D-1 RMKT (TD
Bank N.A., LOC)(a) |
|
| | 1,800,000 | | | | 0.800 | | | | 09/07/17 | | | | 1,800,000 | |
| Metropolitan Washington Airports Authority CP for Dulles Toll
Road Senior Second Lien Series 2017 1 (JPMorgan Chase
Bank N.A., LOC) |
|
| | 5,000,000 | | | | 0.900 | | | | 11/20/17 | | | | 5,000,000 | |
| | | | | | | | | | | | | | |
| | | | | 22,302,641 | |
| | |
| Florida – 3.4% | |
| City of Gainesville Utilities System VRDN RB Refunding
Series 2007 A (State Street Bank & Trust Co., SPA)(a) |
|
| | 155,000 | | | | 0.800 | | | | 09/07/17 | | | | 155,000 | |
| City of Gainesville Utilities System VRDN RB Refunding
Series 2012 B RMKT (Citibank N.A., SPA)(a) |
|
| | 1,375,000 | | | | 0.800 | | | | 09/07/17 | | | | 1,375,000 | |
| Jacksonville Electric Authority Electric System VRDN RB
Series Three 2008 A RMKT (Royal Bank of Canada, SPA)(a) |
|
| | 5,370,000 | | | | 0.790 | | | | 09/07/17 | | | | 5,370,000 | |
| Jacksonville Electric Authority Water & Sewer System VRDN
RB Refunding Series 2008 Subseries B-1 RMKT (State Street
Bank & Trust Co., SPA)(a) |
|
| | 2,990,000 | | | | 0.800 | | | | 09/07/17 | | | | 2,990,000 | |
| Pinellas County Health Facilities Authority VRDN RB for
BayCare Health System Series 2009 A2 (Northern Trust Co.,
LOC)(a) |
|
| | 13,025,000 | | | | 0.790 | | | | 09/07/17 | | | | 13,025,000 | |
| Pinellas County Health Facilities Authority VRDN RB Refunding
for Baycare Health System Series 2009 A1 (U.S. Bank N.A.
LOC)(a) |
|
| | 9,200,000 | | | | 0.860 | | | | 09/01/17 | | | | 9,200,000 | |
| | | | | | | | | | | | | | |
| | | | | 32,115,000 | |
| | |
| Municipal Debt Obligations – (continued) | |
| Georgia – 0.4% | |
| Private Colleges & Universities Authority VRDN RB Refunding
for Emory University Series 2005 B-1(a) |
|
| $ | 3,550,000 | | | | 0.760 | | | | 09/07/17 | | | | 3,550,000 | |
| | |
| Illinois – 1.6% | |
| Illinois Development Finance Authority VRDN RB for Evanston
Northwestern Healthcare Corp. Series 2001 B RMKT
Convertible (JPMorgan Chase Bank N.A., SPA)(a) |
|
| | 1,000,000 | | | | 0.840 | | | | 09/01/17 | | | | 1,000,000 | |
| Illinois Finance Authority VRDN RB for Northwestern
University Series 2008 Subseries B RMKT(a) |
|
| | 5,000,000 | | | | 0.760 | | | | 09/07/17 | | | | 5,000,000 | |
| Illinois Finance Authority VRDN RB Refunding for Advocate
Health Care Network Series 2008 Subseries C-2B (JPMorgan
Chase Bank N.A., SPA)(a) |
|
| | 850,000 | | | | 0.800 | | | | 09/07/17 | | | | 850,000 | |
| Illinois Finance Authority VRDN RB Refunding for University of
Chicago Series 2004 C(a) |
|
| | 7,000,000 | | | | 0.800 | | | | 09/07/17 | | | | 7,000,000 | |
| Illinois Toll Highway Authority VRDN RB Senior Priority
Series 2007 A-1B RMKT (Bank of America N.A., LOC)(a) |
|
| | 800,000 | | | | 0.820 | | | | 09/07/17 | | | | 800,000 | |
| Illinois Toll Highway Authority VRDN RB Senior Priority
Series 2007 A-2C RMKT (Landesbank Hessen-Thueringen
Girozentrale, LOC)(a) |
|
| | 800,000 | | | | 0.820 | | | | 09/07/17 | | | | 800,000 | |
| | | | | | | | | | | | | | |
| | | | | 15,450,000 | |
| | |
| Indiana – 0.8% | |
| Indiana Health Facilities Financing Authority VRDN RB
Refunding for Ascension Health Services Series 2003 E-6
RMKT(a) |
|
| | 5,150,000 | | | | 0.780 | | | | 09/07/17 | | | | 5,150,000 | |
| Purdue University VRDN RB for Student Facilities System
Series 2004 A(a) |
|
| | 900,000 | | | | 0.720 | | | | 09/07/17 | | | | 900,000 | |
| Purdue University VRDN RB for Student Facilities System
Series 2005 A(a) |
|
| | 290,000 | | | | 0.740 | | | | 09/07/17 | | | | 290,000 | |
| Purdue University VRDN RB for Student Facilities System
Series 2007 C(a) |
|
| | 700,000 | | | | 0.740 | | | | 09/07/17 | | | | 700,000 | |
| | | | | | | | | | | | | | |
| | | | | 7,040,000 | |
| | |
| Louisiana – 0.1% | |
| East Baton Rouge Parish IDB, Inc. VRDN RB for ExxonMobil
Project Gulf Opportunity Zone Series 2011 RMKT(a) |
|
| | 468,000 | | | | 0.820 | | | | 09/01/17 | | | | 468,000 | |
| | |
| Maryland – 2.0% | |
| County of Montgomery CP BANS Series 2017 10-A (PNC Bank
N.A., LIQ) |
|
| | 13,950,000 | | | | 0.910 | | | | 10/03/17 | | | | 13,950,000 | |
| Maryland Health & Higher Educational Facilities Authority CP
Series 2017 B |
|
| | 4,900,000 | | | | 0.920 | | | | 10/05/17 | | | | 4,900,000 | |
| | |
| | |
| 14 | | The accompanying notes are an integral part of these financial statements. |
INVESTOR TAX-EXEMPT MONEY MARKET FUND
| | | | | | | | | | | | | | |
Principal Amount | | | Interest
Rate | | | Maturity
Date | | | Amortized
Cost | |
| Municipal Debt Obligations – (continued) | |
| Maryland – (continued) | |
| Washington Suburban Sanitary District GO VRDN BANS
Series 2013 A (TD Bank N.A., SPA)(a) |
|
| $ | 300,000 | | | | 0.780 | % | | | 09/07/17 | | | $ | 300,000 | |
| | | | | | | | | | | | | | |
| | | | | 19,150,000 | |
| | |
| Massachusetts – 3.6% | |
| Massachusetts Department of Transportation Metropolitan
Highway System VRDN RB Refunding for Contract
Assistance Series 2010 A-3 RMKT (Landesbank Hessen-
Thueringen Gironzentrale, LOC)(a) |
|
| | 785,000 | | | | 0.780 | | | | 09/07/17 | | | | 785,000 | |
| Massachusetts Department of Transportation Metropolitan
Highway System VRDN RB Refunding for Contract
Assistance Series 2010 A-6 RMKT (Sumitomo Mitsui Banking
Corp., SPA)(a) |
|
| | 4,750,000 | | | | 0.780 | | | | 09/07/17 | | | | 4,750,000 | |
| Massachusetts Health & Educational Facilities Authority CP
Series 2017 H-1 |
|
| | 18,950,000 | | | | 0.920 | | | | 09/05/17 | | | | 18,950,000 | |
| Massachusetts Health & Educational Facilities Authority VRDN
RB for Harvard University Series 2000 Y(a) |
|
| | 6,300,000 | | | | 0.750 | | | | 09/07/17 | | | | 6,300,000 | |
| Massachusetts Health & Educational Facilities Authority VRDN
RB for Museum of Fine Arts Series 2007 A-1 RMKT (Wells
Fargo Bank N.A., SPA)(a) |
|
| | 2,050,000 | | | | 0.830 | | | | 09/01/17 | | | | 2,050,000 | |
| Massachusetts Water Resources Authority VRDN RB Refunding
Subordinated General Series 2008 E (JPMorgan Chase Bank
N.A., SPA)(a) |
|
| | 940,000 | | | | 0.800 | | | | 09/07/17 | | | | 940,000 | |
| | | | | | | | | | | | | | |
| | | | | 33,775,000 | |
| | |
| Michigan – 1.8% | |
| Michigan State University VRDN RB General Series 2000 A
(Northern Trust Co., SPA)(a) |
|
| | 300,000 | | | | 0.790 | | | | 09/07/17 | | | | 300,000 | |
| Regents of the University of Michigan VRDN RB Refunding
Series 2012 D-2(a) |
|
| | 12,740,000 | | | | 0.730 | | | | 09/07/17 | | | | 12,740,000 | |
| | University of Michigan CP Series 2017 | |
| | 2,400,000 | | | | 0.860 | | | | 09/13/17 | | | | 2,400,000 | |
| | University of Michigan CP Series 2017 K-1 | |
| | 1,160,000 | | | | 0.890 | | | | 11/01/17 | | | | 1,160,000 | |
| | | | | | | | | | | | | | |
| | | | | 16,600,000 | |
| | |
| Minnesota – 3.6% | |
| County of Hennepin GO VRDN Series 2017 B (U.S. Bank N.A.,
SPA)(a) |
|
| | 6,735,000 | | | | 0.770 | | | | 09/07/17 | | | | 6,735,000 | |
| Minnesota Higher Education Facilities Authority VRDN RB
Refunding for Carleton College Series 2005 Six D RMKT
(JPMorgan Chase Bank N.A., SPA)(a) |
|
| | 3,545,000 | | | | 0.790 | | | | 09/07/17 | | | | 3,545,000 | |
| | Rochester Health Care Facilities CP Series 2017 | |
| | 19,700,000 | | | | 0.870 | | | | 09/06/17 | | | | 19,700,000 | |
| | |
| Municipal Debt Obligations – (continued) | |
| Minnesota – (continued) | |
| Rochester Health Care Facilities VRDN RB Refunding for Mayo
Clinic Series 2008 A(a) |
|
| 4,200,000 | | | | 0.760 | | | | 09/07/17 | | | | 4,200,000 | |
| | | | | | | | | | | | | | |
| | | | | 34,180,000 | |
| | |
| Mississippi – 2.0% | |
| Mississippi Business Finance Commission Gulf Opportunity Zone
VRDN RB for Chevron USA, Inc. Project Series 2007 B
RMKT (GTY AGMT - Chevron Corp.)(a) |
|
| | 1,160,000 | | | | 0.840 | | | | 09/01/17 | | | | 1,160,000 | |
| Mississippi Business Finance Commission Gulf Opportunity Zone
VRDN RB for Chevron USA, Inc. Project Series 2009 B (GTY
AGMT - Chevron Corp.)(a) |
|
| | 6,500,000 | | | | 0.840 | | | | 09/01/17 | | | | 6,500,000 | |
| Mississippi Business Finance Commission Gulf Opportunity Zone
VRDN RB for Chevron USA, Inc. Project Series 2010 D (GTY
AGMT - Chevron Corp.)(a) |
|
| | 600,000 | | | | 0.790 | | | | 09/07/17 | | | | 600,000 | |
| Mississippi Business Finance Commission Gulf Opportunity Zone
VRDN RB for Chevron USA, Inc. Project Series 2010 F (GTY
AGMT - Chevron Corp.)(a) |
|
| | 1,180,000 | | | | 0.780 | | | | 09/07/17 | | | | 1,180,000 | |
| Mississippi Business Finance Commission Gulf Opportunity Zone
VRDN RB for Chevron USA, Inc. Project Series 2010 K (GTY
AGMT - Chevron Corp.)(a) |
|
| | 2,600,000 | | | | 0.840 | | | | 09/01/17 | | | | 2,600,000 | |
| Mississippi Business Finance Commission Gulf Opportunity Zone
VRDN RB for Chevron USA, Inc. Project Series 2011 C (GTY
AGMT - Chevron Corp.)(a) |
|
| | 2,640,000 | | | | 0.820 | | | | 09/01/17 | | | | 2,640,000 | |
| Mississippi Business Finance Commission Gulf Opportunity Zone
VRDN RB for Chevron USA, Inc. Project Series 2011 E (GTY
AGMT - Chevron Corp.)(a) |
|
| | 3,600,000 | | | | 0.830 | | | | 09/01/17 | | | | 3,600,000 | |
| Mississippi Business Finance Commission Gulf Opportunity Zone
VRDN RB for Chevron USA, Inc. Project Series 2011 F (GTY
AGMT - Chevron Corp.)(a) |
|
| | 200,000 | | | | 0.830 | | | | 09/01/17 | | | | 200,000 | |
| | | | | | | | | | | | | | |
| | | | | 18,480,000 | |
| | |
| Missouri – 5.4% | |
| | Curators University of Missouri CP Series 2017 A | |
| | 16,100,000 | | | | 0.940 | | | | 10/04/17 | | | | 16,100,000 | |
| Missouri Development Finance Board Cultural Facilities VRDN
RB for Kauffman Center Performing Arts Series 2007 A
RMKT (Northern Trust Co., SPA)(a) |
|
| | 5,000,000 | | | | 0.840 | | | | 09/01/17 | | | | 5,000,000 | |
| Missouri Health & Educational Facilities Authority VRDN RB
for Ascension Health Senior Credit Group Series 2008 C-5
RMKT(a) |
|
| | 900,000 | | | | 0.760 | | | | 09/07/17 | | | | 900,000 | |
| Missouri Health & Educational Facilities Authority VRDN RB
Refunding for Ascension Health Credit Group Series 2003 C-2
RMKT(a) |
|
| | 7,650,000 | | | | 0.760 | | | | 09/07/17 | | | | 7,650,000 | |
| | |
| | |
| The accompanying notes are an integral part of these financial statements. | | 15 |
INVESTOR TAX-EXEMPT MONEY MARKET FUND
Schedule of Investments (continued)
August 31, 2017
| | | | | | | | | | | | | | |
Principal Amount | | | Interest
Rate | | | Maturity
Date | | | Amortized
Cost | |
| Municipal Debt Obligations – (continued) | |
| Missouri – (continued) | |
| Missouri Health & Educational Facilities Authority VRDN RB
Refunding for Ascension Health Credit Group Series 2003 C-3
RMKT(a) |
|
| $ | 11,000,000 | | | | 0.790 | % | | | 09/07/17 | | | $ | 11,000,000 | |
| Missouri Health & Educational Facilities Authority VRDN RB
Refunding for BJC Health System Series 2005 B RMKT(a) |
|
| | 10,000,000 | | | | 0.810 | | | | 09/07/17 | | | | 10,000,000 | |
| | | | | | | | | | | | | | |
| | | | | 50,650,000 | |
| | |
| Multi-State – 4.7% | |
| Federal Home Loan Mortgage Corporation VRDN RB for Multi-
Family Variable Rate Certificates Series 2013-M027 Class A
(FHLMC, LIQ)(a) |
|
| | 20,360,000 | | | | 0.810 | | | | 09/07/17 | | | | 20,360,000 | |
| Federal Home Loan Mortgage Corporation VRDN RB for Multi-
Family Variable Rate Certificates Series 2014-M031 Class A
(FHLMC, LIQ) (SIFMA + 0.04%) |
|
| | 13,550,000 | | | | 0.830 | | | | 09/07/17 | | | | 13,550,000 | |
| Federal Home Loan Mortgage Corporation VRDN RB for Multi-
Family Variable Rate Certificates Series 2015-M033 Class A
(FHLMC, LIQ) (SIFMA + 0.04%) |
|
| | 10,400,000 | | | | 0.830 | | | | 09/07/17 | | | | 10,400,000 | |
| | | | | | | | | | | | | | |
| | | | | 44,310,000 | |
| | |
| New Jersey – 1.6% | |
| | County of Bergen GO BANS Refunding Series 2016 B | |
| | 14,850,000 | | | | 2.000 | | | | 12/14/17 | | | | 14,889,774 | |
| | |
| New York – 14.8% | |
| Metropolitan Transportation Authority Dedicated Tax Fund
VRDN RB Refunding Series 2008 A-1 RMKT (TD Bank N.A.,
LOC)(a) |
|
| | 14,900,000 | | | | 0.830 | | | | 09/01/17 | | | | 14,900,000 | |
| Metropolitan Transportation Authority VRDN RB Refunding
Series 2015 Subseries E-3 (Citibank N.A., LOC)(a) |
|
| | 200,000 | | | | 0.760 | | | | 09/07/17 | | | | 200,000 | |
| New York City GO VRDN Refunding Series 2008 Subseries J-5
(Bank of America N.A., SPA)(a) |
|
| | 1,500,000 | | | | 0.840 | | | | 09/01/17 | | | | 1,500,000 | |
| New York City GO VRDN Series 2008 Subseries L-3 (Bank of
America N.A., LOC) (Bank of America N.A., SPA)(a) |
|
| | 300,000 | | | | 0.840 | | | | 09/01/17 | | | | 300,000 | |
| New York City GO VRDN Series 2013 Subseries F-3 (Bank of
America N.A., LIQ)(a) |
|
| | 1,600,000 | | | | 0.840 | | | | 09/01/17 | | | | 1,600,000 | |
| New York City Housing Development Corp. Multi-Family
Mortgage VRDN RB for Elliot Chelsea Development
Series 2010 A RMKT (FHLMC, LIQ)(a) |
|
| | 800,000 | | | | 0.820 | | | | 09/07/17 | | | | 800,000 | |
| New York City Municipal Water Finance Authority Water &
Sewer System VRDN RB Refunding Series 2001 Subseries F-1
(Mizuho Bank, Ltd., SPA)(a) |
|
| | 3,700,000 | | | | 0.860 | | | | 09/01/17 | | | | 3,700,000 | |
| New York City Municipal Water Finance Authority Water &
Sewer System VRDN RB Refunding Series 2008 Subseries B-3
(Bank of America N.A., SPA)(a) |
|
| | 6,700,000 | | | | 0.840 | | | | 09/01/17 | | | | 6,700,000 | |
| | |
| Municipal Debt Obligations – (continued) | |
| New York – (continued) | |
| New York City Municipal Water Finance Authority Water &
Sewer System VRDN RB Second General Resolution
Refunding Series 2014 Subseries AA-6 (Mizuho Bank, Ltd.,
SPA)(a) |
|
| 2,000,000 | | | | 0.850 | | | | 09/01/17 | | | | 2,000,000 | |
| New York City Municipal Water Finance Authority Water &
Sewer System VRDN RB Second General Resolution
Refunding Series 2015 Subseries AA-1 (Bank of America
N.A., SPA)(a) |
|
| | 5,200,000 | | | | 0.840 | | | | 09/01/17 | | | | 5,200,000 | |
| New York City Municipal Water Finance Authority Water &
Sewer System VRDN RB Second General Resolution
Refunding Series 2015 Subseries AA-2 (PNC Bank N.A.,
SPA)(a) |
|
| | 2,000,000 | | | | 0.830 | | | | 09/01/17 | | | | 2,000,000 | |
| New York City Municipal Water Finance Authority Water &
Sewer System VRDN RB Series 2011 Subseries A-2 (Mizuho
Corporate Bank, SPA)(a) |
|
| | 6,000,000 | | | | 0.810 | | | | 09/01/17 | | | | 6,000,000 | |
| New York City Transitional Finance Authority RB Refunding for
Future Tax Secured Series 2012 B |
|
| | 12,145,000 | | | | 5.000 | | | | 11/01/17 | | | | 12,227,996 | |
| New York City Trust for Cultural Resources VRDN RB for
Metropolitan Museum of Art Series 2006 A1 RMKT(a) |
|
| | 11,900,000 | | | | 0.750 | | | | 09/07/17 | | | | 11,900,000 | |
| New York City Trust for Cultural Resources VRDN RB for
Metropolitan Museum of Art Series 2006 A2 RMKT(a) |
|
| | 7,450,000 | | | | 0.750 | | | | 09/07/17 | | | | 7,450,000 | |
| New York City Trust for Cultural Resources VRDN RB
Refunding for The New York Botanical Garden Series 2009 A
(JPMorgan Chase Bank N.A., LOC)(a) |
|
| | 6,675,000 | | | | 0.750 | | | | 09/07/17 | | | | 6,675,000 | |
| New York State Dormitory Authority State Supported Debt
VRDN RB for Cornell University Series 2004 B RMKT (Bank
of NY Mellon, SPA)(a) |
|
| | 590,000 | | | | 0.790 | | | | 09/07/17 | | | | 590,000 | |
| New York State Housing Finance Agency VRDN RB for 100
Maiden Lane Series 2004 A RMKT (FNMA, LIQ) (FNMA,
LOC)(a) |
|
| | 9,000,000 | | | | 0.870 | | | | 09/07/17 | | | | 9,000,000 | |
| New York State Housing Finance Agency VRDN RB for 20
River Terrace Housing Series 2002 A RMKT (FNMA, LIQ)
(FNMA, LOC)(a) |
|
| | 5,100,000 | | | | 0.800 | | | | 09/07/17 | | | | 5,100,000 | |
| New York State Housing Finance Agency VRDN RB for 42nd &
10th Housing Series 2010 A RMKT (FHLMC, LIQ) (FHLMC,
LOC)(a) |
|
| | 5,750,000 | | | | 0.770 | | | | 09/07/17 | | | | 5,750,000 | |
| New York State Housing Finance Agency VRDN RB Refunding
for Taconic Housing West 17th Street Series 2009 A (FNMA,
LIQ) (FNMA, LOC)(a) |
|
| | 12,300,000 | | | | 0.800 | | | | 09/07/17 | | | | 12,300,000 | |
| New York State Local Government Assistance Corp. VRDN RB
Refunding for Subordinated Lien Series 2003 4V RMKT (Bank
of America N.A., SPA)(a) |
|
| | 4,000,000 | | | | 0.800 | | | | 09/07/17 | | | | 4,000,000 | |
| | |
| | |
| 16 | | The accompanying notes are an integral part of these financial statements. |
INVESTOR TAX-EXEMPT MONEY MARKET FUND
| | | | | | | | | | | | | | |
Principal Amount | | | Interest
Rate | | | Maturity
Date | | | Amortized
Cost | |
| Municipal Debt Obligations – (continued) | |
| New York – (continued) | |
| New York State Power Authority CP Series 2017-1 (JPMorgan
Chase Bank N.A., TD Bank N.A., State Street Bank & Trust
Co. and Wells Fargo Bank N.A., LOC) |
|
| $ | 8,250,000 | | | | 0.910 | % | | | 10/03/17 | | | $ | 8,250,000 | |
| | New York State Power Authority CP Series 2017-2 | |
| | 3,000,000 | | | | 0.990 | | | | 10/12/17 | | | | 3,000,000 | |
| Triborough Bridge & Tunnel Authority VRDN RB Refunding
General Series 2001 C RMKT (Bank of Tokyo-Mitsubishi UFJ,
LOC)(a) |
|
| | 5,865,000 | | | | 0.800 | | | | 09/07/17 | | | | 5,865,000 | |
| Triborough Bridge & Tunnel Authority VRDN RB Refunding
General Series 2002 F RMKT (Landesbank Hessen-Thueringen
Girozentrale, LOC)(a) |
|
| | 1,400,000 | | | | 0.860 | | | | 09/01/17 | | | | 1,400,000 | |
| | | | | | | | | | | | | | |
| | | | | | | | | | | | | 138,407,996 | |
| | |
| North Carolina – 4.2% | |
| County of Union Enterprise System VRDN RB Series 2009
RMKT (U.S. Bank N.A., LOC)(a) |
|
| | 15,785,000 | | | | 0.780 | | | | 09/07/17 | | | | 15,785,000 | |
| North Carolina Capital Facilities Finance Agency Educational
Facilities VRDN RB Refunding for Wake Forest University
Series 2004 A(a) |
|
| | 16,350,000 | | | | 0.790 | | | | 09/07/17 | | | | 16,350,000 | |
| University of North Carolina Hospital at Chapel Hill VRDN RB
Refunding Series 2001 A RMKT (Landesbank Hessen-
Thueringen Girozentrale, SPA)(a) |
|
| | 3,400,000 | | | | 0.810 | | | | 09/01/17 | | | | 3,400,000 | |
| University of North Carolina Hospital at Chapel Hill VRDN RB
Refunding Series 2003 A (Bank of America N.A., SPA)(a) |
|
| | 1,800,000 | | | | 0.790 | | | | 09/07/17 | | | | 1,800,000 | |
| University of North Carolina Hospital at Chapel Hill VRDN RB
Series 2001 B RMKT (Landesbank Hessen-Thueringen
Girozentrale, SPA)(a) |
|
| | 2,000,000 | | | | 0.810 | | | | 09/01/17 | | | | 2,000,000 | |
| | | | | | | | | | | | | | |
| | | | | 39,335,000 | |
| | |
| Ohio – 5.0% | |
| Allen County Hospital Facilities VRDN RB for Catholic Health
Partners Series 2012 B(a) |
|
| | 10,000,000 | | | | 0.800 | | | | 09/07/17 | | | | 10,000,000 | |
| City of Columbus GO VRDN for Sanitation Sewer System
Series 2006-1(a) |
|
| | 4,535,000 | | | | 0.750 | | | | 09/07/17 | | | | 4,535,000 | |
| City of Columbus Sewerage System VRDN RB Refunding
Series 2008 B(a) |
|
| | 1,760,000 | | | | 0.750 | | | | 09/07/17 | | | | 1,760,000 | |
| Ohio Higher Educational Facility Commission CP
Series 2017 B-5 |
|
| | 12,000,000 | | | | 0.900 | | | | 10/19/17 | | | | 12,000,000 | |
| | Ohio State University VRDN RB Refunding Series 2010 E(a) | |
| | 7,500,000 | | | | 0.760 | | | | 09/07/17 | | | | 7,500,000 | |
| | Ohio State University VRDN RB Series 2001(a) | |
| | 300,000 | | | | 0.760 | | | | 09/07/17 | | | | 300,000 | |
| Ohio Water Development Authority VRDN RB for Water
Pollution Control Loan Fund Series 2016 A (BMO Harris
Bank, N.A., LIQ)(a) |
|
| | 8,350,000 | | | | 0.800 | | | | 09/07/17 | | | | 8,350,000 | |
| | |
| Municipal Debt Obligations – (continued) | |
| Ohio – (continued) | |
| State of Ohio GO VRDN for Common Schools Series 2003 D
RMKT(a) |
|
| 2,800,000 | | | | 0.780 | | | | 09/07/17 | | | | 2,800,000 | |
| | | | | | | | | | | | | | |
| | | | | 47,245,000 | |
| | |
| Oklahoma – 0.1% | |
| Oklahoma Turnpike Authority VRDN RB Refunding for Second
Senior Bonds Series 2006 B RMKT (Royal Bank of Canada,
SPA)(a) |
|
| | 765,000 | | | | 0.820 | | | | 09/01/17 | | | | 765,000 | |
| | |
| Pennsylvania – 1.5% | |
| Pennsylvania State Turnpike Commission VRDN RB Refunding
Series 2016 A-2 (1 Mo. LIBOR × 0.7 + 0.60%) |
|
| | 13,500,000 | | | | 1.462 | | | | 12/01/17 | | | | 13,502,747 | |
| Philadelphia Hospitals & Higher Education Facilities Authority
VRDN RB Refunding for Children’s Hospital of Philadelphia
Project Series 2005 A RMKT (Wells Fargo Bank N.A., SPA)(a) |
|
| | 565,000 | | | | 0.820 | | | | 09/01/17 | | | | 565,000 | |
| | | | | | | | | | | | | | |
| | | | | 14,067,747 | |
| | |
| South Carolina – 0.7% | |
| City of Columbia, South Carolina Waterworks & Sewer System
VRDN RB Series 2009 RMKT (Sumitomo Mitsui Banking
Corp., LOC)(a) |
|
| | 6,750,000 | | | | 0.790 | | | | 09/07/17 | | | | 6,750,000 | |
| | |
| Texas – 14.9% | |
| Board of Regents of the University of Texas System VRDN RB
Refunding for Financing System Series 2007 B(a) |
|
| | 3,000,000 | | | | 0.740 | | | | 09/07/17 | | | | 3,000,000 | |
| City of Austin, Texas Hotel Occupancy Tax VRDN RB
Refunding Subordinate Lien Series 2008 A RMKT (JPMorgan
Chase Bank N.A., LOC)(a) |
|
| | 19,400,000 | | | | 0.810 | | | | 09/07/17 | | | | 19,400,000 | |
| City of Austin, Texas Hotel Occupancy Tax VRDN RB
Refunding Subordinate Lien Series 2008 B (JPMorgan Chase
Bank N.A., LOC)(a) |
|
| | 1,300,000 | | | | 0.810 | | | | 09/07/17 | | | | 1,300,000 | |
| City of EL Paso Waterworks & Sewer System CP Series 2017 A
(Bank of America N.A., LIQ) |
|
| | 5,200,000 | | | | 0.910 | | | | 10/02/17 | | | | 5,200,000 | |
| City of San Antonio Electric & Gas Systems CP Series 2017 B
(State Street Bank & Trust Co. and Wells Fargo Bank N.A.,
LOC) |
|
| | 18,600,000 | | | | 0.990 | | | | 09/13/17 | | | | 18,600,000 | |
| | 19,300,000 | | | | 0.890 | | | | 10/11/17 | | | | 19,300,000 | |
| Gulf Coast, Texas IDA VRDN RB for ExxonMobil Project
Series 2012(a) |
|
| | 12,000,000 | | | | 0.850 | | | | 09/01/17 | | | | 12,000,000 | |
| Harris County Cultural Education Facilities Finance Corp. VRDN
RB for Memorial Hermann Health System Series 2014 C(a) |
|
| | 900,000 | | | | 0.750 | | | | 09/07/17 | | | | 900,000 | |
| Harris County Cultural Education Facilities Finance Corp. VRDN
RB Refunding for Memorial Hermann Health System
Series 2016 C(a) |
|
| | 950,000 | | | | 0.750 | | | | 09/07/17 | | | | 950,000 | |
| | |
| | |
| The accompanying notes are an integral part of these financial statements. | | 17 |
INVESTOR TAX-EXEMPT MONEY MARKET FUND
Schedule of Investments (continued)
August 31, 2017
| | | | | | | | | | | | | | |
Principal Amount | | | Interest
Rate | | | Maturity
Date | | | Amortized
Cost | |
| Municipal Debt Obligations – (continued) | |
| Texas – (continued) | |
| Harris County Cultural Education Facilities Finance Corp. VRDN
RB Refunding for Methodist Hospital System Series 2008
Subseries C-1 RMKT(a) |
|
| $ | 5,900,000 | | | | 0.880 | % | | | 09/01/17 | | | $ | 5,900,000 | |
| Harris County Industrial Development Corp. VRDN PCRB for
Exxon Project Series 1984(a) |
|
| | 2,200,000 | | | | 0.820 | | | | 09/01/17 | | | | 2,200,000 | |
| State of Texas GO VRDN for Veterans Bonds Series 2015 B
(Mizuho Bank, Ltd., SPA)(a) |
|
| | 390,000 | | | | 0.800 | | | | 09/07/17 | | | | 390,000 | |
| State of Texas GO VRDN for Veterans Bonds Series 2016
(Landesbank Hessen-Thueringen Girozentrale, SPA)(a) |
|
| | 1,400,000 | | | | 0.800 | | | | 09/07/17 | | | | 1,400,000 | |
| State of Texas GO VRDN for Veterans Bonds Series 2017
(Sumitomo Mitsui Banking Corp., SPA)(a) |
|
| | 5,000,000 | | | | 0.800 | | | | 09/07/17 | | | | 5,000,000 | |
| | State of Texas TRANS Series 2017(b) | |
| | 19,400,000 | | | | 4.000 | | | | 08/30/18 | | | | 19,990,730 | |
| Tarrant County Cultural Education Facilities Finance Corp.
VRDN RB Refunding for Texas Health Resources
Series 2008 A(a) |
|
| | 6,250,000 | | | | 0.750 | | | | 09/07/17 | | | | 6,250,000 | |
| Tarrant County Cultural Education Facilities Finance Corp.
VRDN RB Refunding for Texas Health Resources
Series 2008 B(a) |
|
| | 7,760,000 | | | | 0.750 | | | | 09/07/17 | | | | 7,760,000 | |
| | University of Texas CP Series 2017 | |
| | 9,600,000 | | | | 0.930 | | | | 10/03/17 | | | | 9,600,000 | |
| University of Texas System VRDN RB Refunding Series 2008-B
(University of Texas Investment Management Co., LIQ)(a) |
|
| | 350,000 | | | | 0.750 | | | | 09/07/17 | | | | 350,000 | |
| | | | | | | | | | | | | | |
| | | | | 139,490,730 | |
| | |
| Utah – 0.0% | |
| Weber County Hospital VRDN RB for IHC Health Services, Inc.
Series 2000 B (U.S. Bank N.A. SPA)(a) |
|
| | 200,000 | | | | 0.760 | | | | 09/07/17 | | | | 200,000 | |
| | |
| Virginia – 2.2% | |
| City of Norfolk Economic Development Authority Hospital
Facilities VRDN RB Refunding for Sentara Healthcare
Series 2016 B(a) |
|
| | 13,710,000 | | | | 0.760 | | | | 09/07/17 | | | | 13,710,000 | |
| Fairfax County IDA VRDN RB for Fairfax Hospital
Series 1988 A RMKT (Northern Trust Co., LOC)(a) |
|
| | 200,000 | | | | 0.820 | | | | 09/07/17 | | | | 200,000 | |
| Fairfax County IDA VRDN RB for Inova Health System
Series 2000 (Branch Banking & Trust, SPA)(a) |
|
| | 5,900,000 | | | | 0.780 | | | | 09/07/17 | | | | 5,900,000 | |
| Fairfax County IDA VRDN RB Refunding for Inova Health
System Project Series 2016 C(a) |
|
| | 625,000 | | | | 0.770 | | | | 09/07/17 | | | | 625,000 | |
| Loudoun County IDA VRDN RB for Howard Hughes Medical
Institute Series 2003 E(a) |
|
| | 450,000 | | | | 0.780 | | | | 09/07/17 | | | | 450,000 | |
| | | | | | | | | | | | | | |
| | | | | | | | | | | | | 20,885,000 | |
| | |
| Municipal Debt Obligations – (continued) | |
| Washington – 3.4% | |
| County of King Multi-Modal Limited Tax GO VRDN
Series 2010 B (State Street Bank & Trust Co., SPA)(a) |
|
| 230,000 | | | | 0.780 | | | | 09/07/17 | | | | 230,000 | |
| County of King Sewer Revenue VRDN RB Junior Lien
Series 2001 A RMKT (Landesbank Hessen-Thueringen
Girozentrale, LOC)(a) |
|
| | 6,650,000 | | | | 0.780 | | | | 09/07/17 | | | | 6,650,000 | |
| | University of Washington CP Series 2017 A | |
| | 7,300,000 | | | | 0.900 | | | | 02/20/18 | | | | 7,300,000 | |
| Washington Health Care Facilities Authority VRDN RB
Refunding for Providence Health & Services Series 2012 C
(U.S. Bank N.A., SPA)(a) |
|
| | 12,960,000 | | | | 0.810 | | | | 09/07/17 | | | | 12,960,000 | |
| Washington State Housing Finance Commission VRDN RB for
Discovery Heights Apartments Series 2010 (FHLMC, LIQ)(a) |
|
| | 4,800,000 | | | | 0.840 | | | | 09/07/17 | | | | 4,800,000 | |
| | | | | | | | | | | | | | |
| | | | | 31,940,000 | |
| | |
| Wyoming – 0.6% | |
| Sublette County VRDN PCRB Refunding for ExxonMobil
Project Series 2014(a) |
|
| | 1,000,000 | | | | 0.820 | | | | 09/01/17 | | | | 999,960 | |
| Unita County VRDN PCRB Refunding for Chevron USA, Inc.
Project Series 1993 (GTY AGMT - Chevron Corp.)(a) |
|
| | 4,500,000 | | | | 0.820 | | | | 09/01/17 | | | | 4,500,000 | |
| | | | | | | | | | | | | | |
| | | | | 5,499,960 | |
| | |
| | TOTAL INVESTMENTS – 101.7% | | | $ | 954,560,032 | |
| | |
| LIABILITIES IN EXCESS OF
OTHER ASSETS – (1.7)% |
| | | (15,940,993 | ) |
| | |
| | NET ASSETS – 100.0% | | | $ | 938,619,039 | |
| | |
| | |
| The percentage shown for each investment category reflects the value of investments in that category as a percentage of net assets. |
(a) | | Rate shown is that which is in effect on August 31, 2017. Certain variable rate securities are not based on a published reference rate and spread but are determined by the issuer or agent and are based on current market conditions. |
(b) | | All or a portion represents a forward commitment. |
Interest rates represent either the stated coupon rate, or for floating rate securities, the current reset rate, which is based upon current interest rate indices.
Maturity dates represent either the final legal maturity date on the security, the demand date for puttable securities, or the prerefunded date for those types of securities.
| | |
| 18 | | The accompanying notes are an integral part of these financial statements. |
INVESTOR TAX-EXEMPT MONEY MARKET FUND
| | |
|
Investment Abbreviations: |
BANS | | —Bond Anticipation Notes |
CP | | —Commercial Paper |
FHLMC | | —Insured by Federal Home Loan Mortgage Corp. |
FNMA | | —Insured by Federal National Mortgage Association |
GO | | —General Obligation |
GTY AGMT | | —Guaranty Agreement |
IDA | | —Industrial Development Agency |
IDB | | —Industrial Development Board |
IHC | | —Intermountain Health Care |
LIBOR | | —London Interbank Offered Rate |
LIQ | | —Liquidity Agreement |
LOC | | —Letter of Credit |
PCRB | | —Pollution Control Revenue Bond |
RB | | —Revenue Bond |
RMKT | | —Remarketed |
SIFMA | | —Securities Industry and Financial Markets Association |
SPA | | —Stand-by Purchase Agreement |
TRANS | | —Tax Revenue Anticipation Notes |
VRDN | | —Variable Rate Demand Notes |
|
| | |
| The accompanying notes are an integral part of these financial statements. | | 19 |
GOLDMAN SACHS FUNDS — INVESTOR FUNDS
Schedule of Investments
August 31, 2017
|
| ADDITIONAL INVESTMENT INFORMATION |
JOINT REPURCHASE AGREEMENT ACCOUNT III — At August 31, 2017, Investor Money Market Fund had undivided interests in the Joint Repurchase Agreement Account III, with a maturity date of September 1, 2017, as follows:
| | | | |
| Principal Amount | | Maturity Value | | Collateral Value |
| $64,400,000 | | $64,401,924 | | $66,178,211 |
REPURCHASE AGREEMENTS — At August 31, 2017, the Principal Amounts of the Investor Money Market Fund’s interest in the Joint Repurchase Agreement Account III were as follows:
| | | | | | | | |
| Counterparty | | Interest Rate | | | Principal Amount | |
ABN Amro Bank N.V. | | | 1.070 | % | | $ | 5,593,746 | |
Bank of America, N.A. | | | 1.080 | | | | 3,995,533 | |
Bank of Nova Scotia (The) | | | 1.080 | | | | 17,580,345 | |
BNP Paribas | | | 1.080 | | | | 6,073,210 | |
Citigroup Global Markets, Inc. | | | 1.080 | | | | 5,186,202 | |
TD Securities (USA), LLC | | | 1.090 | | | | 1,997,766 | |
Wells Fargo Securities, LLC | | | 1.070 | | | | 23,973,198 | |
| TOTAL | | | | | | $ | 64,400,000 | |
At August 31, 2017, the Joint Repurchase Agreement Account III was fully collateralized by:
| | | | | | | | |
| Issuer | | Interest Rates | | | Maturity Dates | |
Federal Farm Credit Bank | | | 1.550 to 3.330 | % | | | 04/13/20 to 02/01/33 | |
Federal Home Loan Bank | | | 0.625 to 1.560 | | | | 10/26/17 to 07/03/19 | |
Federal Home Loan Mortgage Corp. | | | 0.800 to 9.500 | | | | 12/28/17 to 09/01/47 | |
Federal Home Loan Mortgage Corp. Stripped Security | | | 0.000 | | | | 03/15/30 | |
Federal National Mortgage Association | | | 0.875 to 7.500 | | | | 11/24/17 to 09/01/47 | |
Federal National Mortgage Association Stripped Security | | | 0.000 | | | | 11/15/30 | |
Government National Mortgage Association | | | 2.250 to 11.000 | | | | 09/15/17 to 08/20/47 | |
U.S. Treasury Bills | | | 0.000 | | | | 09/14/17 to 11/02/17 | |
U.S. Treasury Bonds | | | 2.255 to 7.625 | | | | 11/15/22 to 08/15/47 | |
U.S. Treasury Inflation-Indexed Bonds | | | 1.750 to 2.125 | | | | 01/15/28 to 02/15/40 | |
U.S. Treasury Inflation-Indexed Notes | | | 0.375 to 0.625 | | | | 01/15/24 to 07/15/27 | |
U.S. Treasury Interest-Only Stripped Securities | | | 0.000 | | | | 02/15/20 to 05/15/43 | |
U.S. Treasury Notes | | | 0.750 to 2.625 | | | | 08/31/18 to 08/15/25 | |
U.S. Treasury Principal-Only Stripped Securities | | | 0.000 | | | | 08/15/29 to 02/15/46 | |
| | |
| 20 | | The accompanying notes are an integral part of these financial statements. |
GOLDMAN SACHS FUNDS — INVESTOR FUNDS
Statements of Assets and Liabilities
August 31, 2017
| | | | | | | | | | |
| | | | | Investor
Money Market Fund | | | Investor
Tax-Exempt Money Market Fund | |
| | Assets: | | | | | | | | |
| | Investments based on amortized cost | | $ | 248,629,910 | | | $ | 954,560,032 | |
| | Repurchase agreements based on amortized cost | | | 70,400,000 | | | | — | |
| | Cash | | | 144,398 | | | | 2,221,047 | |
| | Receivables: | | | | | | | | |
| | Investments sold | | | — | | | | 6,505,351 | |
| | Interest | | | 313,829 | | | | 1,233,735 | |
| | Fund shares sold | | | 672,012 | | | | 107,951 | |
| | Reimbursement from investment advisor | | | 21,295 | | | | 295 | |
| | Other assets | | | 252 | | | | 1,603 | |
| | Total assets | | | 320,181,696 | | | | 964,630,014 | |
| | | | | | | | | | |
| | Liabilities: | | | | | | | | |
| | Payables: | | | | | | | | |
| | Investments purchased | | | — | | | | 19,990,730 | |
| | Fund shares redeemed | | | 2,232,890 | | | | 5,137,142 | |
| | Dividend distribution | | | 121,563 | | | | 435,065 | |
| | Management fees | | | 41,738 | | | | 128,946 | |
| | Distribution and Service fees and Transfer Agency fees | | | 3,220 | | | | 8,787 | |
| | Accrued expenses | | | 170,229 | | | | 310,305 | |
| | Total liabilities | | | 2,569,640 | | | | 26,010,975 | |
| | | | | | | | | | |
| | Net Assets: | | | | | | | | |
| | Paid-in capital | | | 317,597,926 | | | | 938,618,486 | |
| | Undistributed (distributions in excess of) net investment income | | | 13,291 | | | | (29 | ) |
| | Accumulated net realized gain | | | 839 | | | | 582 | |
| | NET ASSETS | | $ | 317,612,056 | | | $ | 938,619,039 | |
| | | Net asset value, offering and redemption price per share | | | $1.00 | | | | $1.00 | |
| | | Net Assets: | | | | | | | | |
| | | Class I Shares | | $ | 216,442,602 | | | $ | 924,326,255 | |
| | | Select Shares | | | — | | | | 5,401,272 | |
| | | Preferred Shares | | | — | | | | 36,930 | |
| | | Capital Shares | | | — | | | | 1,004 | |
| | | Administration Shares | | | 100,350,673 | | | | 3,574,488 | |
| | | Premier Shares | | | — | | | | 1,003 | |
| | | Service Shares | | | 50,220 | | | | 840,784 | |
| | | Resource Shares | | | 50,152 | | | | 3,731,253 | |
| | | Cash Management Shares | | | 91,368 | | | | 54,292 | |
| | | Class A Shares | | | 563,422 | | | | 642,761 | |
| | | Class C Shares | | | 63,619 | | | | 8,997 | |
| | | Total Net Assets | | $ | 317,612,056 | | | $ | 938,619,039 | |
| | | Shares outstanding $0.001 par value (unlimited number of shares authorized): | | | | | | | | |
| | | Class I Shares | | | 216,442,034 | | | | 924,275,804 | |
| | | Select Shares | | | — | | | | 5,400,701 | |
| | | Preferred Shares | | | — | | | | 36,928 | |
| | | Capital Shares | | | — | | | | 1,004 | |
| | | Administration Shares | | | 100,350,410 | | | | 3,574,293 | |
| | | Premier Shares | | | — | | | | 1,003 | |
| | | Service Shares | | | 50,219 | | | | 840,738 | |
| | | Resource Shares | | | 50,151 | | | | 3,731,050 | |
| | | Cash Management Shares | | | 91,368 | | | | 54,289 | |
| | | Class A Shares | | | 563,416 | | | | 642,726 | |
| | | Class C Shares | | | 63,619 | | | | 8,996 | |
| | |
| The accompanying notes are an integral part of these financial statements. | | 21 |
GOLDMAN SACHS FUNDS — INVESTOR FUNDS
Statements of Operations
For the Fiscal Year Ended August 31, 2017
| | | | | | | | | | |
| | | | | Investor Money Market
Fund | | | Investor Tax-Exempt
Money Market
Fund | |
| | Investment income: | |
| | Interest income | | $ | 2,286,412 | | | $ | 7,175,503 | |
| | Total investment income | | | 2,286,412 | | | | 7,175,503 | |
| | | | | | | | | | |
| | Expenses: | |
| | Fund-Level Expenses: | | | | | | | | |
| | Management fees | | | 423,408 | | | | 1,958,519 | |
| | Registration fees | | | 112,278 | | | | 261,712 | |
| | Professional fees | | | 142,945 | | | | 189,481 | |
| | Custody, accounting and administrative services | | | 51,243 | | | | 120,181 | |
| | Printing and mailing fees | | | 131,600 | | | | 109,013 | |
| | Transfer Agency fees | | | 20,654 | | | | 95,538 | |
| | Trustee fees | | | 19,121 | | | | 10,490 | |
| | Amortization of offering costs | | | 107,052 | | | | — | |
| | Other | | | 42,359 | | | | 51,116 | |
| | Subtotal | | | 1,050,660 | | | | 2,796,050 | |
| | Class Specific Expenses: | | | | | | | | |
| | Service Share fees | | | 250 | | | | 48,495 | |
| | Resource Share fees | | | 250 | | | | 25,652 | |
| | Administration Share fees | | | 152,961 | | | | 11,085 | |
| | Distribution fees — Resource Shares | | | 75 | | | | 7,696 | |
| | Distribution and Service fees — Class A Shares | | | 2,171 | | | | 1,193 | |
| | Select Share fees | | | — | | | | 350 | |
| | Cash Management Share fees | | | 369 | | | | 159 | |
| | Distribution fees — Cash Management Shares | | | 222 | | | | 96 | |
| | Distribution fees — Class C Shares | | | 388 | | | | 68 | |
| | Capital Share fees | | | — | | | | 53 | |
| | Preferred Share fees | | | — | | | | 31 | |
| | Class C Share fees | | | 129 | | | | 23 | |
| | Premier Share fees | | | — | | | | 4 | |
| | Total expenses | | | 1,207,475 | | | | 2,890,955 | |
| | Less — expense reductions | | | (670,727 | ) | | | (1,047,872 | ) |
| | Net expenses | | | 536,748 | | | | 1,843,083 | |
| | NET INVESTMENT INCOME | | $ | 1,749,664 | | | $ | 5,332,420 | |
| | Net realized gain from investment transactions | | | 19,712 | | | | 654 | |
| | NET INCREASE IN NET ASSETS RESULTING FROM OPERATIONS | | $ | 1,769,376 | | | $ | 5,333,074 | |
| | |
| 22 | | The accompanying notes are an integral part of these financial statements. |
GOLDMAN SACHS FUNDS — INVESTOR FUNDS
Statements of Changes in Net Assets
| | | | | | | | | | | | | | | | | | |
| | | | | Investor Money Market Fund | | | Investor Tax-Exempt Money Market Fund | |
| | | | | For the Fiscal
Year Ended
August 31, 2017 | | | For the
Period Ended
August 31, 2016* | | | For the Fiscal
Year Ended
August 31, 2017 | | | For the Fiscal
Year Ended
August 31, 2016 | |
| | From operations: | | | | | | | | | |
| | Net investment income | | $ | 1,749,664 | | | $ | 24,448 | | | $ | 5,332,420 | | | $ | 2,825,733 | |
| | Net realized gain from investment transactions | | | 19,712 | | | | 50 | | | | 654 | | | | 724,670 | |
| | Net increase in net assets resulting from operations | | | 1,769,376 | | | | 24,498 | | | | 5,333,074 | | | | 3,550,403 | |
| | | | | | | | | | | | | | | | | | |
| | Distributions to shareholders: | | | | | | | | | |
| | From net investment income: | | | | | | | | | | | | | | | | |
| | Class I Shares | | | (1,302,341 | ) | | | (24,348 | ) | | | (5,305,155 | ) | | | (2,787,780 | ) |
| | Select Shares | | | — | | | | — | | | | (7,167 | ) | | | (6,816 | ) |
| | Preferred Shares | | | — | | | | (1 | ) | | | (151 | ) | | | (968 | ) |
| | Capital Shares | | | — | | | | — | | | | (105 | ) | | | (19,299 | ) |
| | Administration Shares | | | (439,885 | ) | | | (47 | ) | | | (13,462 | ) | | | (6,611 | ) |
| | Premier Shares | | | — | | | | — | | | | (4 | ) | | | (4 | ) |
| | Service Shares(a) | | | (182 | ) | | | (2 | ) | | | (3,876 | ) | | | (3,778 | ) |
| | Resource Shares(a) | | | (110 | ) | | | — | | | | (803 | ) | | | (469 | ) |
| | Cash Management Shares(a) | | | (131 | ) | | | (1 | ) | | | (4 | ) | | | (4 | ) |
| | Class A Shares(b) | | | (6,996 | ) | | | (47 | ) | | | (1,689 | ) | | | (2 | ) |
| | Class C Shares(b) | | | (19 | ) | | | (2 | ) | | | (4 | ) | | | (2 | ) |
| | From net realized gains: | | | | | | | | | | | | | | | | |
| | Class I Shares | | | (14,540 | ) | | | (36 | ) | | | (567,168 | ) | | | (198,426 | ) |
| | Select Shares | | | — | | | | — | | | | (1 | ) | | | (7,632 | ) |
| | Preferred Shares | | | — | | | | — | | | | (12 | ) | | | (206 | ) |
| | Capital Shares | | | — | | | | — | | | | (1 | ) | | | (1,525 | ) |
| | Administration Shares | | | (4,239 | ) | | | — | | | | (2,773 | ) | | | (4,514 | ) |
| | Premier Shares | | | — | | | | — | | | | (1 | ) | | | — | |
| | Service Shares(a) | | | (5 | ) | | | — | | | | (560 | ) | | | (2,046 | ) |
| | Resource Shares(a) | | | (5 | ) | | | — | | | | (3,473 | ) | | | (320 | ) |
| | Cash Management Shares(a) | | | (6 | ) | | | — | | | | (10 | ) | | | — | |
| | Class A Shares(b) | | | (87 | ) | | | — | | | | (388 | ) | | | — | |
| | Class C Shares(b) | | | (5 | ) | | | — | | | | (5 | ) | | | — | |
| | Total distributions to shareholders | | | (1,768,551 | ) | | | (24,484 | ) | | | (5,906,812 | ) | | | (3,040,402 | ) |
| | | | | | | | | | | | | | | | | | |
| | From share transactions (at $1.00 per share): | | | | | | | | | |
| | Proceeds from sales of shares | | | 638,143,101 | | | | 11,553,041 | | | | 1,278,168,435 | | | | 14,225,281,433 | |
| | Reinvestment of distributions | | | 847,042 | | | | 23,657 | | | | 679,285 | | | | 1,741,174 | |
| | Cost of shares redeemed | | | (332,357,615 | ) | | | (598,009 | ) | | | (1,805,926,440 | ) | | | (18,128,302,933 | ) |
| | Net increase (decrease) in net assets resulting from share transactions | | | 306,632,528 | | | | 10,978,689 | | | | (527,078,720 | ) | | | (3,901,280,326 | ) |
| | NET INCREASE (DECREASE) | | | 306,633,353 | | | | 10,978,703 | | | | (527,652,458 | ) | | | (3,900,770,325 | ) |
| | | | | | | | | | | | | | | | | | |
| | Net assets: | | | | | | | | | |
| | Beginning of year or period | | | 10,978,703 | | | | — | | | | 1,466,271,497 | | | | 5,367,041,822 | |
| | End of year or period | | $ | 317,612,056 | | | $ | 10,978,703 | | | $ | 938,619,039 | | | $ | 1,466,271,497 | |
| | Undistributed (distributions in excess of) net investment income | | $ | 13,291 | | | $ | 647 | | | $ | (29 | ) | | $ | (29 | ) |
| | * | | Commenced operations on January 29, 2016. |
| | (a) | | Service Shares, Resource Shares and Cash Management Shares of the Investor Money Market Fund commenced operations on May 31, 2016. |
| | (b) | | Class A Shares and Class C Shares of the Investor Tax-Exempt Money Market Fund commenced operations on March 31, 2016. |
| | |
| The accompanying notes are an integral part of these financial statements. | | 23 |
INVESTOR MONEY MARKET FUND
Financial Highlights
Selected Data for a Share Outstanding Throughout Each Period
| | | | | | | | | | | | | | | | | | | | | | | | | | | | | | |
| | | | | | | | From
investment operations | | | Distributions
to shareholders | |
| | | Year - Share Class | | Net asset value, beginning of period | | | Net
investment
income(a) | | | Net realized
gain (loss) | | | Total from
investment
operations | | | From net
investment
income | | | From net
realized
gains | | | Total
distributions(b) | |
| | FOR THE FISCAL YEAR ENDED AUGUST 31, | |
| | 2017 - Class I Shares | | $ | 1.00 | | | $ | 0.009 | | | $ | — | (d) | | $ | 0.009 | | | $ | (0.009 | ) | | $ | — | (d) | | $ | (0.009 | ) |
| | 2017 - Administration Shares | | | 1.00 | | | | 0.007 | | | | (0.001 | ) | | | 0.006 | | | | (0.006 | ) | | | — | (d) | | | (0.006 | ) |
| | 2017 - Service Shares | | | 1.00 | | | | 0.004 | | | | — | (d) | | | 0.004 | | | | (0.004 | ) | | | — | (d) | | | (0.004 | ) |
| | 2017 - Resource Shares | | | 1.00 | | | | 0.002 | | | | 0.001 | | | | 0.003 | | | | (0.003 | ) | | | — | (d) | | | (0.003 | ) |
| | 2017 - Cash Management Shares | | | 1.00 | | | | 0.002 | | | | (0.001 | ) | | | 0.001 | | | | (0.001 | ) | | | — | (d) | | | (0.001 | ) |
| | 2017 - Class A Shares | | | 1.00 | | | | 0.008 | | | | (0.002 | ) | | | 0.006 | | | | (0.006 | ) | | | — | (d) | | | (0.006 | ) |
| | 2017 - Class C Shares | | | 1.00 | | | | — | (d) | | | 0.001 | | | | 0.001 | | | | (0.001 | ) | | | — | (d) | | | (0.001 | ) |
| | | | | | | | | | | | | | | | | | | | | | | | | | | | | | |
| | FOR THE PERIOD ENDED AUGUST 31,* | |
| | 2016 - Class I Shares | | | 1.00 | | | | 0.002 | | | | — | (d) | | | 0.002 | | | | (0.002 | ) | | | — | (d) | | | (0.002 | ) |
| | 2016 - Administration Shares | | | 1.00 | | | | 0.001 | | | | — | (d) | | | 0.001 | | | | (0.001 | ) | | | — | (d) | | | (0.001 | ) |
| | 2016 - Service Shares (Commenced operations on May 31, 2016) | | | 1.00 | | | | — | (d) | | | — | (d) | | | — | (d) | | | — | (d) | | | — | (d) | | | — | (d) |
| | 2016 - Resource Shares (Commenced operations on May 31, 2016) | | | 1.00 | | | | — | (d) | | | — | (d) | | | — | (d) | | | — | (d) | | | — | (d) | | | — | (d) |
| | 2016 - Cash Management Shares (Commenced operations on May 31, 2016) | | | 1.00 | | | | — | (d) | | | — | (d) | | | — | (d) | | | — | (d) | | | — | (d) | | | — | (d) |
| | 2016 - Class A Shares | | | 1.00 | | | | 0.001 | | | | — | (d) | | | 0.001 | | | | (0.001 | ) | | | — | (d) | | | (0.001 | ) |
| | 2016 - Class C Shares | | | 1.00 | | | | — | (d) | | | — | (d) | | | — | (d) | | | — | (d) | | | — | (d) | | | — | (d) |
| | * | | Commenced operations on January 29, 2016. |
| | (a) | | Calculated based on the average shares outstanding methodology. |
| | (b) | | Distributions may not coincide with the current year net investment income or net realized gains as distributions may be paid from current or prior year earnings. |
| | (c) | | Assumes reinvestment of all distributions. Returns do not reflect the deduction of taxes that a shareholder would pay on Fund distributions. Total returns for periods less than one full year are not annualized. |
| | (d) | | Amount is less than $0.0005 per share. |
| | |
| 24 | | The accompanying notes are an integral part of these financial statements. |
INVESTOR MONEY MARKET FUND
| | | | | | | | | | | | | | | | | | | | | | | | | | | | | | | | | | |
| | | | | | | | | | | | | | | | | | | | | | | | | | | | | |
| | | Net asset
value, end
of period | | | | | Total return(c) | | | | | Net assets end of
period (in 000s) | | | | | Ratio of
net expenses
to average
net assets | | | | | Ratio of
total expenses
to average
net assets | | | | | Ratio of
net investment
income
to average
net assets | |
| | | | | | | | | | | | | | | | | | | | | | | | | | | | | | | | | | |
| | $ | 1.00 | | | | | | 0.87 | % | | | | $ | 216,443 | | | | | | 0.18 | % | | | | | 0.51 | % | | | | | 0.90 | % |
| | | 1.00 | | | | | | 0.62 | | | | | | 100,351 | | | | | | 0.43 | | | | | | 0.76 | | | | | | 0.72 | |
| | | 1.00 | | | | | | 0.39 | | | | | | 50 | | | | | | 0.68 | | | | | | 1.01 | | | | | | 0.36 | |
| | | 1.00 | | | | | | 0.26 | | | | | | 50 | | | | | | 0.82 | | | | | | 1.16 | | | | | | 0.22 | |
| | | 1.00 | | | | | | 0.15 | | | | | | 91 | | | | | | 0.95 | | | | | | 1.31 | | | | | | 0.18 | |
| | | 1.00 | | | | | | 0.62 | | | | | | 563 | | | | | | 0.43 | | | | | | 0.76 | | | | | | 0.81 | |
| | | 1.00 | | | | | | 0.06 | | | | | | 64 | | | | | | 1.02 | | | | | | 1.51 | | | | | | 0.04 | |
| | | | | | | | | | | | | | | | | | | | | | | | | | | | | | | | | | |
| | | | | | | | | | | | | | | | | | | | | | | | | | | | | | | | | | |
| | | 1.00 | | | | | | 0.24 | | | | | | 10,679 | | | | | | 0.18 | (e) | | | | | 4.88 | (e) | | | | | 0.41 | (e) |
| | | 1.00 | | | | | | 0.09 | | | | | | 50 | | | | | | 0.43 | (e) | | | | | 5.13 | (e) | | | | | 0.16 | (e) |
| | | 1.00 | | | | | | 0.05 | | | | | | 50 | | | | | | 0.61 | (e) | | | | | 5.38 | (e) | | | | | 0.02 | (e) |
| | | 1.00 | | | | | | 0.05 | | | | | | 50 | | | | | | 0.62 | (e) | | | | | 5.53 | (e) | | | | | 0.01 | (e) |
| | | 1.00 | | | | | | 0.05 | | | | | | 50 | | | | | | 0.62 | (e) | | | | | 5.68 | (e) | | | | | 0.01 | (e) |
| | | 1.00 | | | | | | 0.09 | | | | | | 50 | | | | | | 0.43 | (e) | | | | | 5.13 | (e) | | | | | 0.16 | (e) |
| | | 1.00 | | | | | | 0.05 | | | | | | 50 | | | | | | 0.58 | (e) | | | | | 5.88 | (e) | | | | | 0.01 | (e) |
| | |
| The accompanying notes are an integral part of these financial statements. | | 25 |
INVESTOR TAX-EXEMPT MONEY MARKET FUND
Financial Highlights
Selected Data for a Share Outstanding Throughout Each Period
| | | | | | | | | | | | | | | | | | | | | | | | | | | | | | |
| | | | | | | | From investment operations | | | Distributions to shareholders | |
| | | Year - Share Class | | Net asset value, beginning of year | | | Net
investment
income(a) | | | Net realized
gain (loss) | | | Total from
investment
operations | | | From net
investment
income | | | From net
realized
gains | | | Total
distributions(b) | |
| | FOR THE FISCAL YEARS ENDED AUGUST 31, | |
| | 2017 - Class I Shares | | $ | 1.00 | | | $ | 0.006 | | | $ | 0.001 | | | $ | 0.007 | | | $ | (0.006 | ) | | $ | (0.001 | ) | | $ | (0.007 | ) |
| | 2017 - Select Shares | | | 1.00 | | | | 0.006 | | | | — | (d) | | | 0.006 | | | | (0.005 | ) | | | (0.001 | ) | | | (0.006 | ) |
| | 2017 - Preferred Shares | | | 1.00 | | | | 0.005 | | | | 0.001 | | | | 0.006 | | | | (0.005 | ) | | | (0.001 | ) | | | (0.006 | ) |
| | 2017 - Capital Shares | | | 1.00 | | | | 0.003 | | | | 0.002 | | | | 0.005 | | | | (0.004 | ) | | | (0.001 | ) | | | (0.005 | ) |
| | 2017 - Administration Shares | | | 1.00 | | | | 0.003 | | | | 0.001 | | | | 0.004 | | | | (0.003 | ) | | | (0.001 | ) | | | (0.004 | ) |
| | 2017 - Premier Shares | | | 1.00 | | | | 0.004 | | | | (0.001 | ) | | | 0.003 | | | | (0.002 | ) | | | (0.001 | ) | | | (0.003 | ) |
| | 2017 - Service Shares | | | 1.00 | | | | — | (d) | | | 0.002 | | | | 0.002 | | | | (0.001 | ) | | | (0.001 | ) | | | (0.002 | ) |
| | 2017 - Resource Shares | | | 1.00 | | | | — | (d) | | | 0.001 | | | | 0.001 | | | | — | (d) | | | (0.001 | ) | | | (0.001 | ) |
| | 2017 - Cash Management Shares | | | 1.00 | | | | — | (d) | | | 0.001 | | | | 0.001 | | | | — | (d) | | | (0.001 | ) | | | (0.001 | ) |
| | 2017 - Class A Shares | | | 1.00 | | | | 0.004 | | | | — | (d) | | | 0.004 | | | | (0.003 | ) | | | (0.001 | ) | | | (0.004 | ) |
| | 2017 - Class C Shares | | | 1.00 | | | | — | (d) | | | 0.001 | | | | 0.001 | | | | — | (d) | | | (0.001 | ) | | | (0.001 | ) |
| | 2016 - Class I Shares | | | 1.00 | | | | 0.001 | | | | — | (d) | | | 0.001 | | | | (0.001 | ) | | | — | (d) | | | (0.001 | ) |
| | 2016 - Select Shares | | | 1.00 | | | | 0.001 | | | | — | (d) | | | 0.001 | | | | (0.001 | ) | | | — | (d) | | | (0.001 | ) |
| | 2016 - Preferred Shares | | | 1.00 | | | | 0.001 | | | | — | (d) | | | 0.001 | | | | (0.001 | ) | | | — | (d) | | | (0.001 | ) |
| | 2016 - Capital Shares | | | 1.00 | | | | — | (d) | | | — | (d) | | | — | (d) | | | — | (d) | | | — | (d) | | | — | (d) |
| | 2016 - Administration Shares | | | 1.00 | | | | — | (d) | | | — | (d) | | | — | (d) | | | — | (d) | | | — | (d) | | | — | (d) |
| | 2016 - Premier Shares | | | 1.00 | | | | — | (d) | | | — | (d) | | | — | (d) | | | — | (d) | | | — | (d) | | | — | (d) |
| | 2016 - Service Shares | | | 1.00 | | | | — | (d) | | | — | (d) | | | — | (d) | | | — | (d) | | | — | (d) | | | — | (d) |
| | 2016 - Resource Shares | | | 1.00 | | | | — | (d) | | | — | (d) | | | — | (d) | | | — | (d) | | | — | (d) | | | — | (d) |
| | 2016 - Cash Management Shares | | | 1.00 | | | | — | (d) | | | — | (d) | | | — | (d) | | | — | (d) | | | — | (d) | | | — | (d) |
| | 2016 - Class A Shares (Commenced operations on March 31, 2016) | | | 1.00 | | | | — | (d) | | | — | (d) | | | — | (d) | | | — | (d) | | | — | (d) | | | — | (d) |
| | 2016 - Class C Shares (Commenced operations on March 31, 2016) | | | 1.00 | | | | — | (d) | | | — | (d) | | | — | (d) | | | — | (d) | | | — | (d) | | | — | (d) |
| | 2015 - Class I Shares | | | 1.00 | | | | — | (d) | | | — | (d) | | | — | (d) | | | — | (d) | | | — | (d) | | | — | (d) |
| | 2015 - Select Shares | | | 1.00 | | | | — | (d) | | | — | (d) | | | — | (d) | | | — | (d) | | | — | (d) | | | — | (d) |
| | 2015 - Preferred Shares | | | 1.00 | | | | — | (d) | | | — | (d) | | | — | (d) | | | — | (d) | | | — | (d) | | | — | (d) |
| | 2015 - Capital Shares | | | 1.00 | | | | — | (d) | | | — | (d) | | | — | (d) | | | — | (d) | | | — | (d) | | | — | (d) |
| | 2015 - Administration Shares | | | 1.00 | | | | — | (d) | | | — | (d) | | | — | (d) | | | — | (d) | | | — | (d) | | | — | (d) |
| | 2015 - Premier Shares | | | 1.00 | | | | — | (d) | | | — | (d) | | | — | (d) | | | — | (d) | | | — | (d) | | | — | (d) |
| | 2015 - Service Shares | | | 1.00 | | | | — | (d) | | | — | (d) | | | — | (d) | | | — | (d) | | | — | (d) | | | — | (d) |
| | 2015 - Resource Shares | | | 1.00 | | | | — | (d) | | | — | (d) | | | — | (d) | | | — | (d) | | | — | (d) | | | — | (d) |
| | 2015 - Cash Management Shares | | | 1.00 | | | | — | (d) | | | — | (d) | | | — | (d) | | | — | (d) | | | — | (d) | | | — | (d) |
| | 2014 - Class I Shares | | | 1.00 | | | | — | (d) | | | — | (d) | | | — | (d) | | | — | (d) | | | — | (d) | | | — | (d) |
| | 2014 - Select Shares | | | 1.00 | | | | — | (d) | | | — | (d) | | | — | (d) | | | — | (d) | | | — | (d) | | | — | (d) |
| | 2014 - Preferred Shares | | | 1.00 | | | | — | (d) | | | — | (d) | | | — | (d) | | | — | (d) | | | — | (d) | | | — | (d) |
| | 2014 - Capital Shares | | | 1.00 | | | | — | (d) | | | — | (d) | | | — | (d) | | | — | (d) | | | — | (d) | | | — | (d) |
| | 2014 - Administration Shares | | | 1.00 | | | | — | (d) | | | — | (d) | | | — | (d) | | | — | (d) | | | — | (d) | | | — | (d) |
| | 2014 - Premier Shares | | | 1.00 | | | | — | (d) | | | — | (d) | | | — | (d) | | | — | (d) | | | — | (d) | | | — | (d) |
| | 2014 - Service Shares | | | 1.00 | | | | — | (d) | | | — | (d) | | | — | (d) | | | — | (d) | | | — | (d) | | | — | (d) |
| | 2014 - Resource Shares | | | 1.00 | | | | — | (d) | | | — | (d) | | | — | (d) | | | — | (d) | | | — | (d) | | | — | (d) |
| | 2014 - Cash Management Shares | | | 1.00 | | | | — | (d) | | | — | (d) | | | — | (d) | | | — | (d) | | | — | (d) | | | — | (d) |
| | 2013 - Class I Shares | | | 1.00 | | | | — | (d) | | | — | (d) | | | — | (d) | | | — | (d) | | | — | (d) | | | — | (d) |
| | 2013 - Select Shares | | | 1.00 | | | | — | (d) | | | — | (d) | | | — | (d) | | | — | (d) | | | — | (d) | | | — | (d) |
| | 2013 - Preferred Shares | | | 1.00 | | | | — | (d) | | | — | (d) | | | — | (d) | | | — | (d) | | | — | (d) | | | — | (d) |
| | 2013 - Capital Shares | | | 1.00 | | | | — | (d) | | | — | (d) | | | — | (d) | | | — | (d) | | | — | (d) | | | — | (d) |
| | 2013 - Administration Shares | | | 1.00 | | | | — | (d) | | | — | (d) | | | — | (d) | | | — | (d) | | | — | (d) | | | — | (d) |
| | 2013 - Premier Shares | | | 1.00 | | | | — | (d) | | | — | (d) | | | — | (d) | | | — | (d) | | | — | (d) | | | — | (d) |
| | 2013 - Service Shares | | | 1.00 | | | | — | (d) | | | — | (d) | | | — | (d) | | | — | (d) | | | — | (d) | | | — | (d) |
| | 2013 - Resource Shares | | | 1.00 | | | | — | (d) | | | — | (d) | | | — | (d) | | | — | (d) | | | — | (d) | | | — | (d) |
| | 2013 - Cash Management Shares | | | 1.00 | | | | — | (d) | | | — | (d) | | | — | (d) | | | — | (d) | | | — | (d) | | | — | (d) |
| | (a) | | Calculated based on the average shares outstanding methodology. |
| | (b) | | Distributions may not coincide with the current year net investment income or net realized gains as distributions may be paid from current or prior year earnings. |
| | (c) | | Assumes reinvestment of all distributions. Returns do not reflect the deduction of taxes that a shareholder would pay on Fund distributions. Total returns for periods less than one full year are not annualized. |
| | (d) | | Amount is less than $0.0005 per share. |
| | |
| 26 | | The accompanying notes are an integral part of these financial statements. |
INVESTOR TAX-EXEMPT MONEY MARKET FUND
| | | | | | | | | | | | | | | | | | | | | | | | | | | | | | | | | | |
| | | | | | | | | | | | | | | | | | | | | | | | | | | | | | | | | | |
| | | Net asset value, end of year | | | | | Total return(c) | | | | | Net assets end of year
(in 000s) | | | | | Ratio of
net expenses
to average
net assets | | | | | Ratio of
total expenses
to average
net assets | | | | | Ratio of
net investment
income
to average
net assets | |
| | | | | | | | | | | | | | | | | | | | | | | | | | | | | | | | | | |
| | $ | 1.00 | | | | | | 0.63 | % | | | | $ | 924,326 | | | | | | 0.18 | % | | | | | 0.29 | % | | | | | 0.57 | % |
| | | 1.00 | | | | | | 0.60 | | | | | | 5,401 | | | | | | 0.21 | | | | | | 0.32 | | | | | | 0.62 | |
| | | 1.00 | | | | | | 0.53 | | | | | | 37 | | | | | | 0.28 | | | | | | 0.39 | | | | | | 0.48 | |
| | | 1.00 | | | | | | 0.48 | | | | | | 1 | | | | | | 0.33 | | | | | | 0.44 | | | | | | 0.30 | |
| | | 1.00 | | | | | | 0.38 | | | | | | 3,575 | | | | | | 0.43 | | | | | | 0.54 | | | | | | 0.30 | |
| | | 1.00 | | | | | | 0.29 | | | | | | 1 | | | | | | 0.47 | | | | | | 0.64 | | | | | | 0.43 | |
| | | 1.00 | | | | | | 0.15 | | | | | | 841 | | | | | | 0.63 | | | | | | 0.79 | | | | | | 0.04 | |
| | | 1.00 | | | | | | 0.08 | | | | | | 3,731 | | | | | | 0.73 | | | | | | 0.94 | | | | | | 0.02 | |
| | | 1.00 | | | | | | 0.09 | | | | | | 54 | | | | | | 0.77 | | | | | | 1.09 | | | | | | 0.01 | |
| | | 1.00 | | | | | | 0.38 | | | | | | 643 | | | | | | 0.43 | | | | | | 0.54 | | | | | | 0.35 | |
| | | 1.00 | | | | | | 0.07 | | | | | | 9 | | | | | | 0.72 | | | | | | 1.29 | | | | | | 0.04 | |
| | | 1.00 | | | | | | 0.11 | | | | | | 1,387,634 | | | | | | 0.11 | | | | | | 0.24 | | | | | | 0.07 | |
| | | 1.00 | | | | | | 0.09 | | | | | | — | | | | | | 0.11 | | | | | | 0.27 | | | | | | 0.01 | |
| | | 1.00 | | | | | | 0.06 | | | | | | 46 | | | | | | 0.13 | | | | | | 0.34 | | | | | | 0.03 | |
| | | 1.00 | | | | | | 0.04 | | | | | | 886 | | | | | | 0.19 | | | | | | 0.39 | | | | | | 0.04 | |
| | | 1.00 | | | | | | 0.01 | | | | | | 13,041 | | | | | | 0.18 | | | | | | 0.49 | | | | | | 0.01 | |
| | | 1.00 | | | | | | 0.01 | | | | | | 1 | | | | | | 0.12 | | | | | | 0.59 | | | | | | 0.37 | |
| | | 1.00 | | | | | | 0.01 | | | | | | 58,173 | | | | | | 0.21 | | | | | | 0.74 | | | | | | 0.01 | |
| | | 1.00 | | | | | | 0.01 | | | | | | 6,469 | | | | | | 0.20 | | | | | | 0.89 | | | | | | 0.01 | |
| | | 1.00 | | | | | | 0.01 | | | | | | 1 | | | | | | 0.12 | | | | | | 1.04 | | | | | | 0.37 | |
| | | 1.00 | | | | | | 0.01 | | | | | | 10 | | | | | | 0.30 | (e) | | | | | 0.49 | (e) | | | | | 0.04 | (e) |
| | | 1.00 | | | | | | 0.01 | | | | | | 10 | | | | | | 0.31 | (e) | | | | | 1.24 | (e) | | | | | 0.04 | (e) |
| | | 1.00 | | | | | | 0.01 | | | | | | 4,955,885 | | | | | | 0.08 | | | | | | 0.23 | | | | | | 0.01 | |
| | | 1.00 | | | | | | 0.01 | | | | | | 193,506 | | | | | | 0.08 | | | | | | 0.26 | | | | | | 0.01 | |
| | | 1.00 | | | | | | 0.01 | | | | | | 6,914 | | | | | | 0.08 | | | | | | 0.33 | | | | | | 0.01 | |
| | | 1.00 | | | | | | 0.01 | | | | | | 22,788 | | | | | | 0.08 | | | | | | 0.38 | | | | | | 0.01 | |
| | | 1.00 | | | | | | 0.01 | | | | | | 107,676 | | | | | | 0.08 | | | | | | 0.48 | | | | | | 0.01 | |
| | | 1.00 | | | | | | 0.01 | | | | | | 1 | | | | | | 0.08 | | | | | | 0.58 | | | | | | 0.01 | |
| | | 1.00 | | | | | | 0.01 | | | | | | 72,003 | | | | | | 0.08 | | | | | | 0.73 | | | | | | 0.01 | |
| | | 1.00 | | | | | | 0.01 | | | | | | 8,268 | | | | | | 0.08 | | | | | | 0.88 | | | | | | 0.01 | |
| | | 1.00 | | | | | | 0.01 | | | | | | 1 | | | | | | 0.08 | | | | | | 1.03 | | | | | | 0.40 | |
| | | 1.00 | | | | | | 0.01 | | | | | | 5,225,304 | | | | | | 0.10 | | | | | | 0.23 | | | | | | 0.01 | |
| | | 1.00 | | | | | | 0.01 | | | | | | 267,104 | | | | | | 0.10 | | | | | | 0.26 | | | | | | 0.01 | |
| | | 1.00 | | | | | | 0.01 | | | | | | 15,635 | | | | | | 0.10 | | | | | | 0.33 | | | | | | 0.01 | |
| | | 1.00 | | | | | | 0.01 | | | | | | 5,728 | | | | | | 0.10 | | | | | | 0.38 | | | | | | 0.01 | |
| | | 1.00 | | | | | | 0.01 | | | | | | 155,732 | | | | | | 0.10 | | | | | | 0.48 | | | | | | 0.01 | |
| | | 1.00 | | | | | | 0.01 | | | | | | 1,858 | | | | | | 0.10 | | | | | | 0.58 | | | | | | 0.01 | |
| | | 1.00 | | | | | | 0.01 | | | | | | 66,226 | | | | | | 0.10 | | | | | | 0.73 | | | | | | 0.01 | |
| | | 1.00 | | | | | | 0.01 | | | | | | 12,979 | | | | | | 0.10 | | | | | | 0.88 | | | | | | 0.01 | |
| | | 1.00 | | | | | | 0.01 | | | | | | 1 | | | | | | 0.10 | | | | | | 1.03 | | | | | | 0.40 | |
| | | 1.00 | | | | | | 0.02 | | | | | | 4,762,419 | | | | | | 0.15 | | | | | | 0.23 | | | | | | 0.02 | |
| | | 1.00 | | | | | | 0.02 | | | | | | 197,985 | | | | | | 0.16 | | | | | | 0.26 | | | | | | 0.01 | |
| | | 1.00 | | | | | | 0.01 | | | | | | 19,349 | | | | | | 0.16 | | | | | | 0.33 | | | | | | 0.01 | |
| | | 1.00 | | | | | | 0.01 | | | | | | 3,511 | | | | | | 0.16 | | | | | | 0.38 | | | | | | 0.01 | |
| | | 1.00 | | | | | | 0.01 | | | | | | 134,037 | | | | | | 0.16 | | | | | | 0.48 | | | | | | 0.01 | |
| | | 1.00 | | | | | | 0.01 | | | | | | 572,262 | | | | | | 0.16 | | | | | | 0.58 | | | | | | 0.01 | |
| | | 1.00 | | | | | | 0.01 | | | | | | 16,214 | | | | | | 0.16 | | | | | | 0.73 | | | | | | 0.01 | |
| | | 1.00 | | | | | | 0.01 | | | | | | 26,818 | | | | | | 0.16 | | | | | | 0.88 | | | | | | 0.01 | |
| | | 1.00 | | | | | | 0.01 | | | | | | 1 | | | | | | 0.15 | | | | | | 1.03 | | | | | | 0.40 | |
| | |
| The accompanying notes are an integral part of these financial statements. | | 27 |
GOLDMAN SACHS FUNDS — INVESTOR FUNDS
Notes to Financial Statements
August 31, 2017
Goldman Sachs Trust (the “Trust”) is a Delaware statutory trust registered under the Investment Company Act of 1940, as amended (the “Act”), as an open-end management investment company. The following table lists those series of the Trust that are included in this report (collectively, the “Funds” or individually a “Fund”), along with their corresponding share classes and respective diversification status under the Act:
| | | | |
| Fund | | Share Classes Offered | | Diversified/
Non-Diversified |
Investor Money Market | | Class I, Administration, Service, Resource, Cash Management, Class A and Class C | | Diversified |
Investor Tax-Exempt Money Market | | Class I, Select, Preferred, Capital, Administration, Premier, Service, Resource, Cash Management, Class A and Class C | | Diversified |
Class C Shares may typically be acquired only in an exchange for Class C Shares of another Goldman Sachs Fund. Class C Shares may be subject to a contingent deferred sales charge (“CDSC”) of 1.00% during the first 12 months, measured from the time the original shares subject to the CDSC were acquired.
Goldman Sachs Asset Management, L.P. (“GSAM”), an affiliate of Goldman Sachs & Co. LLC (formerly, Goldman, Sachs & Co.) (“Goldman Sachs”), serves as investment adviser to the Funds pursuant to management agreements (the “Agreements”) with the Trust.
|
| 2. SIGNIFICANT ACCOUNTING POLICIES |
The financial statements have been prepared in accordance with accounting principles generally accepted in the United States of America (“GAAP”) and require management to make estimates and assumptions that may affect the reported amounts and disclosures. Actual results may differ from those estimates and assumptions.
A. Investment Valuation — The investment valuation policy of the Funds is to use the amortized-cost method permitted by Rule 2a-7 under the Act for valuing portfolio securities. The amortized-cost method of valuation involves valuing a security at its cost and thereafter applying a constant accretion or amortization to maturity of any discount or premium. Normally, a security’s amortized cost will approximate its market value. Under procedures and tolerances approved by the Board of Trustees (“Trustees”), GSAM evaluates daily the difference between each Fund’s net asset value (“NAV”) per share using the amortized costs of its portfolio securities and the Fund’s NAV per share using market-based values of its portfolio securities. The market-based value of a portfolio security is determined, where readily available, on the basis of market quotations provided by pricing services or securities dealers, or, where accurate market quotations are not readily available, on the basis of the security’s fair value as determined in accordance with Valuation Procedures approved by the Trustees. The pricing services may use valuation models or matrix pricing, which may consider (among other things): (i) yield or price with respect to debt securities that are considered comparable in characteristics such as rating, interest rate and maturity date or (ii) quotations from securities dealers to determine current value.
B. Investment Income and Investments — Interest income is accrued daily and adjusted for amortization of premiums and accretion of discounts. Investment transactions are reflected on trade date. Realized gains and losses are calculated using identified cost.
C. Class Allocations and Expenses — Investment income, realized gain (loss), and non-class specific expenses of each Fund are allocated daily based upon the proportion of net assets of each class. Class specific expenses, where applicable, are borne by the respective share classes and include Distribution, Service, Distribution and Service, Administration, Service and Administration, and Shareholder Administration fees and Transfer Agency fees. Non-class specific expenses directly incurred by a Fund are charged to that Fund, while such expenses incurred by the Trust are allocated across the respective Funds on a straight-line and/or pro-rata basis depending upon the nature of the expenses.
28
GOLDMAN SACHS FUNDS — INVESTOR FUNDS
|
| 2. SIGNIFICANT ACCOUNTING POLICIES (continued) |
D. Federal Taxes and Distributions to Shareholders — It is each Fund’s policy to comply with the requirements of the Internal Revenue Code of 1986, as amended (the “Code”), applicable to regulated investment companies (mutual funds) and to distribute each year substantially all of its investment company taxable and tax-exempt income and capital gains to its shareholders. Accordingly, the Funds are not required to make any provisions for the payment of federal income tax. Distributions to shareholders are declared and recorded daily and paid monthly by the Funds and may include short-term capital gains. Long-term capital gain distributions, if any, are declared and paid annually.
Net capital losses, if any, are carried forward to future fiscal years and may be used to the extent allowed by the Code to offset any future capital gains. Utilization of capital loss carryforwards will reduce the requirement of future capital gains distributions.
The characterization of distributions to shareholders for financial reporting purposes is determined in accordance with federal income tax rules, which may differ from GAAP. The source of each Fund’s distributions may be shown in the accompanying financial statements as either from net investment income, net realized gain or capital. Certain components of the Funds’ net assets on the Statements of Assets and Liabilities reflect permanent GAAP/tax differences based on the appropriate tax character.
E. Forward Commitments — A forward commitment involves entering into a contract to purchase or sell securities, typically on an extended settlement basis, for a fixed price at a future date. The purchase of securities on a forward commitment basis involves a risk of loss if the value of the security to be purchased declines before the settlement date. Conversely, the sale of securities on a forward commitment basis involves the risk that the value of the securities sold may increase before the settlement date. Although a Fund will generally purchase securities on a forward commitment basis with the intention of acquiring the securities for its portfolio, the Fund may dispose of forward commitments prior to settlement which may result in a realized gain or loss.
F. Offering Costs — Offering costs paid in connection with the offering of shares of the Investor Money Market Fund were amortized on a straight-line basis over 12 months from the date of commencement of operations.
G. Repurchase Agreements — Repurchase agreements involve the purchase of securities subject to the seller’s agreement to repurchase the securities at a mutually agreed upon date and price, under the terms of a Master Repurchase Agreement (“MRA”). During the term of a repurchase agreement, the value of the underlying securities held as collateral on behalf of a Fund, including accrued interest, is required to exceed the value of the repurchase agreement, including accrued interest. The gross value of repurchase agreements is included in the Statements of Assets and Liabilities for financial reporting purposes. The underlying securities for all repurchase agreements are held at the Funds’ custodian or designated sub-custodians under tri-party repurchase agreements.
An MRA governs transactions between a Fund and select counterparties. An MRA contains provisions for, among other things, initiation of the transaction, income payments, events of default, and maintenance of securities for repurchase agreements. An MRA also permits offsetting with collateral to create one single net payment in the event of default or similar events, including the bankruptcy or insolvency of a counterparty.
If the seller defaults, a Fund could suffer a loss to the extent that the proceeds from the sale of the underlying securities and other collateral held by the Fund are less than the repurchase price and the Fund’s costs associated with delay and enforcement of the repurchase agreement. In addition, in the event of default or insolvency of the seller, a court could determine that a Fund’s interest in the collateral is not enforceable, resulting in additional losses to the Fund.
Pursuant to exemptive relief granted by the Securities and Exchange Commission (“SEC”) and terms and conditions contained therein, the Funds, together with other funds of the Trust and registered investment companies having management agreements with GSAM or its affiliates, may transfer uninvested cash into joint accounts, the daily aggregate balance of which is invested in one or more repurchase agreements. Under these joint accounts, the Funds maintain pro-rata credit exposure to the underlying repurchase agreements’ counterparties. With the exception of certain transaction fees, the Funds are not subject to any expenses in relation to these investments.
29
GOLDMAN SACHS FUNDS — INVESTOR FUNDS
Notes to Financial Statements (continued)
August 31, 2017
|
| 3. INVESTMENTS AND FAIR VALUE MEASUREMENTS |
U.S. GAAP defines the fair value of a financial instrument as the amount that would be received to sell an asset or paid to transfer a liability in an orderly transaction between market participants at the measurement date (i.e., the exit price); the Funds’ policy is to use the market approach. GAAP establishes a fair value hierarchy that prioritizes the inputs to valuation techniques used to measure fair value. The hierarchy gives the highest priority to unadjusted quoted prices in active markets for identical assets or liabilities (Level 1 measurements) and the lowest priority to unobservable inputs (Level 3 measurements). The levels used for classifying investments are not necessarily an indication of the risk associated with investing in these investments. The three levels of the fair value hierarchy are described below:
Level 1 — Unadjusted quoted prices in active markets that are accessible at the measurement date for identical, unrestricted assets or liabilities;
Level 2 — Quoted prices in markets that are not active or financial instruments for which significant inputs are observable (including, but not limited to, quoted prices for similar investments, interest rates, foreign exchange rates, volatility and credit spreads), either directly or indirectly;
Level 3 — Prices or valuations that require significant unobservable inputs (including GSAM’s assumptions in determining fair value measurement).
The Trustees have approved Valuation Procedures that govern the valuation of the portfolio investments held by the Funds, including investments for which market quotations are not readily available. The Trustees have delegated to GSAM day-to-day responsibility for implementing and maintaining internal controls and procedures related to the valuation (including both the amortized cost and market-based methods of valuation) of the Funds’ investments. To assess the continuing appropriateness of pricing sources and methodologies related to the market-based method of valuation, GSAM regularly performs price verification procedures and issues challenges as necessary to third party pricing vendors or brokers, and any differences are reviewed in accordance with the Valuation Procedures.
As of August 31, 2017, all investments are classified as Level 2 of the fair value hierarchy. Please refer to the Schedules of Investments for further detail.
|
| 4. AGREEMENTS AND AFFILIATED TRANSACTIONS |
A. Management Agreements — Under the Agreements, GSAM manages the Funds, subject to the general supervision of the Trustees.
As compensation for the services rendered pursuant to the Agreements, the assumption of the expenses related thereto and administration of the Funds’ business affairs, including providing facilities, GSAM is entitled to a management fee, accrued daily and paid monthly, equal to an annual percentage rate of each Fund’s average daily net assets. GSAM has agreed to not impose a portion of the management fee equal annually to 0.045% of each Fund’s average daily net assets. These arrangements will remain in effect through at least December 29, 2017, and prior to such date, GSAM may not terminate the arrangements without the approval of the Trustees.
B. Administration, Service and/or Shareholder Administration Plans — The Trust, on behalf of each applicable Fund, has adopted Administration, Service and/or Shareholder Administration Plans (the “Plans”) to allow Class C, Select, Preferred, Capital, Administration, Premier, Service, Resource and Cash Management Shares to compensate service organizations (including Goldman Sachs) for providing varying levels of account administration and/or personal and account maintenance services to their customers who are beneficial owners of such shares. The Plans provide for compensation to the service organizations equal to an annual percentage rate of the average daily net assets of such shares.
C. Distribution and/or Service (12b-1) Plans — The Trust, on behalf of the Class A Shares of each applicable Fund, has adopted a Distribution and Service Plan subject to Rule 12b-1 under the Act. Under the Distribution and Service Plan, Goldman Sachs, which serves as distributor (the “Distributor”), is entitled to a fee accrued daily and paid monthly for distribution services and personal and account maintenance services, which may then be paid by Goldman Sachs to authorized dealers. These fees are equal to an annual percentage rate of the average daily net assets attributable to Class A Shares of the Funds, as set forth below.
30
GOLDMAN SACHS FUNDS — INVESTOR FUNDS
|
| 4. AGREEMENTS AND AFFILIATED TRANSACTIONS (continued) |
The Trust, on behalf of Class C, Resource and Cash Management Shares of each applicable Fund, has adopted Distribution Plans subject to Rule 12b-1 under the Act. Under the Distribution Plans, Goldman Sachs as Distributor is entitled to a fee accrued daily and paid monthly for distribution services, which may then be paid by Goldman Sachs to authorized dealers. These fees are equal to an annual percentage rate of the average daily net assets attributable to Class C, Resource and Cash Management Shares of the Funds, as set forth below.
The Trust, on behalf of the Service Shares of each applicable Fund, has adopted a Service Plan subject to Rule 12b-1 under the Act to allow Service Shares to compensate service organizations (including Goldman Sachs) for providing personal and account maintenance services to their customers who are beneficial owners of such shares. The Service Plan provides for compensation to the service organizations equal to an annual percentage rate of the average daily net assets attributable to Service Shares of the Funds, as set forth below.
D. Distribution Agreement — Goldman Sachs, as Distributor of the shares of the Funds pursuant to a Distribution Agreement, may retain a portion of the Class C Shares’ CDSC. During the fiscal year ended August 31, 2017, Goldman Sachs has advised that it did not retain any CDSCs with respect to Class C Shares of the Funds.
E. Transfer Agency Agreement — Goldman Sachs also serves as the transfer agent of the Funds for a fee pursuant to a Transfer Agency Agreement. The fee charged for such transfer agency services is accrued daily and paid monthly and is equal to an annual percentage rate of each Fund’s average daily net assets.
F. Other Agreements — GSAM has agreed to limit certain “Other Expenses” of the Funds (excluding transfer agency fees and expenses, administration fees (as applicable), service fees (as applicable), shareholder administration fees (as applicable), taxes, interest, brokerage fees, expenses of shareholder meetings, litigation and indemnification, and extraordinary expenses) to the extent such expenses exceed, on an annual basis, 0.014% of the average daily net assets of each Fund. Such Other Expense reimbursements, if any, are accrued daily and paid monthly. These Other Expense limitations will remain in place through at least December 29, 2017, and prior to such date GSAM may not terminate the arrangements without the approval of the Trustees.
In addition, the Funds have entered into certain offset arrangements with the custodian and the transfer agent, which may result in a reduction of the Funds’ expenses and are received irrespective of the application of the “Other Expense” limitations described above.
G. Total Fund Expenses
Fund Contractual Fees
The contractual annualized rates for each of the Funds are as follows:
| | | | | | | | | | | | | | | | | | | | | | | | | | | | | | | | | | | | | | | | | | | | |
| | | Class I
Shares | | | Select
Shares(a) | | | Preferred
Shares(a) | | | Capital
Shares(a) | | | Administration
Shares | | | Premier
Shares(a) | | | Service
Shares | | | Resource
Shares | | | Cash
Management
Shares | | | Class A
Shares | | | Class C
Shares | |
Management Fee | | | 0.205 | % | | | 0.205 | % | | | 0.205 | % | | | 0.205 | % | | | 0.205 | % | | | 0.205 | % | | | 0.205 | % | | | 0.205 | % | | | 0.205 | % | | | 0.205 | % | | | 0.205 | % |
Administration, Service and/or Shareholder Administration Fees | | | N/A | | | | 0.03 | | | | 0.10 | | | | 0.15 | | | | 0.25 | | | | 0.35 | | | | 0.25 | | | | 0.50 | | | | 0.50 | | | | N/A | | | | 0.25 | |
Distribution and/or Service (12b-1) Fees | | | N/A | | | | N/A | | | | N/A | | | | N/A | | | | N/A | | | | N/A | | | | 0.25 | (b) | | | 0.15 | (c) | | | 0.30 | (c) | | | 0.25 | | | | 0.75 | (c) |
Transfer Agency Fee | | | 0.01 | | | | 0.01 | | | | 0.01 | | | | 0.01 | | | | 0.01 | | | | 0.01 | | | | 0.01 | | | | 0.01 | | | | 0.01 | | | | 0.01 | | | | 0.01 | |
N/A—Fees not applicable to respective share class
| (a) | | Tax-Exempt Money Market Fund only. |
| (b) | | Service (12b-1) fee only. |
| (c) | | Distribution (12b-1) fee only. |
31
GOLDMAN SACHS FUNDS — INVESTOR FUNDS
Notes to Financial Statements (continued)
August 31, 2017
|
| 4. AGREEMENTS AND AFFILIATED TRANSACTIONS (continued) |
Fund Effective Net Expenses (After Waivers and Reimbursements)
In addition to the contractual fee waivers and expense limitations discussed above, during the fiscal year ended August 31, 2017, GSAM and Goldman Sachs (as applicable) voluntarily agreed to waive all or a portion of the management fees and respective class-specific fees described above attributable to the Funds. The Funds are not obligated to reimburse GSAM or Goldman Sachs for prior fiscal year fee waivers and/or expense reimbursements, if any.
For the fiscal year ended August 31, 2017, expense reductions including any fee waivers and Other Expense reimbursements were as follows (in thousands):
| | | | | | | | | | | | | | | | | | |
| Fund | | | | Management
Fee Waivers | | | Distribution,
Administration,
Service and/or
Shareholder,
Administration
Plans Fee Waivers | | | Other Expense Reimbursements | | | Total
Expense
Reductions | |
Investor Money Market | | | | $ | 93 | | | $ | — | * | | $ | 578 | | | $ | 671 | |
Investor Tax-Exempt Money Market | | | | | 430 | | | | 10 | | | | 608 | | | | 1,048 | |
| * | | Amount less than one thousand. |
H. Other Transactions with Affiliates — A Fund may purchase securities from, or sell securities to, an affiliated fund provided the affiliation is solely due to having a common investment adviser, common officers, or common Trustees. For the fiscal year ended August 31, 2017, the purchase and sale transactions and related net realized gain (loss) for the Funds with affiliated funds in compliance with Rule 17a-7 under the Act were as follows:
| | | | | | | | | | | | | | |
| Fund | | | | Purchases | | | Sales | | | Net Realized
Gain (Loss) | |
Investor Money Market | | | | $ | 69,778,710 | | | $ | 23,471,734 | | | $ | — | |
Investor Tax-Exempt Money Market | | | | | 282,955,869 | | | | 796,142,336 | | | | — | |
As of August 31, 2017, the Goldman Sachs Group (“GSG”), Inc. was the beneficial owner of 5% or more of the outstanding share classes of the following Funds:
| | | | | | | | | | | | | | | | | | | | | | | | | | | | | | | | | | | | | | | | | | | | |
| Fund | | Class I
Shares | | | Select
Shares | | | Preferred
Shares | | | Capital
Shares | | | Administration
Shares | | | Premier
Shares | | | Service
Shares | | | Resource
Shares | | | Cash
Management
Shares | | | Class A
Shares | | | Class C
Shares | |
Investor Money Market | | | — | % | | | N/A | | | | N/A | | | | N/A | | | | — | % | | | N/A | | | | 100 | % | | | 100 | % | | | 55 | % | | | 9 | % | | | 79 | % |
Investor Tax-Exempt Money Market | | | — | | | | — | % | | | — | % | | | 100 | % | | | — | | | | 100 | % | | | — | | | | — | | | | — | | | | — | | | | 100 | |
I. Line of Credit Facility — As of August 31, 2017, the Funds participated in a $1,100,000,000 committed, unsecured revolving line of credit facility (the “facility”) together with other funds of the Trust and registered investment companies having management agreements with GSAM or its affiliates. This facility is to be used for temporary emergency purposes, or to allow for an orderly liquidation of securities to meet redemption requests. The interest rate on borrowings is based on the federal funds rate. The facility also requires a fee to be paid by the Funds based on the amount of the commitment that has not been utilized. For the fiscal year ended August 31, 2017, the Funds did not have any borrowings under the facility.
32
GOLDMAN SACHS FUNDS — INVESTOR FUNDS
The tax character of distributions paid during the fiscal year ended August 31, 2017 was as follows:
| | | | | | | | |
| | | Investor
Money
Market | | | Investor
Tax-Exempt
Money
Market | |
Distribution paid from: | | | | | | | | |
Ordinary income | | $ | 1,768,551 | | | $ | 179,707 | |
Net long-term capital gains | | | — | | | | 423,093 | |
Tax-Exempt income | | | — | | | | 5,304,012 | |
Total distributions | | $ | 1,768,551 | | | $ | 5,906,812 | |
The tax character of distributions paid during the fiscal year ended August 31, 2016 was as follows:
| | | | | | | | |
| | | Investor Money Market(a) | | | Investor
Tax-Exempt
Money
Market | |
Distribution paid from: | | | | | | | | |
Ordinary income | | $ | 24,484 | | | $ | 432,553 | |
Net long-term capital gains | | | — | | | | 172,835 | |
Tax-Exempt income | | | — | | | | 2,435,014 | |
Total distributions | | $ | 24,484 | | | $ | 3,040,402 | |
| (a) | | Commenced operations on January 29, 2016. |
As of August 31, 2017, the components of accumulated earnings (losses) on a tax basis were as follows:
| | | | | | | | |
| | | Investor
Money
Market | | | Investor
Tax-Exempt
Money
Market | |
Undistributed ordinary income — net | | $ | 135,693 | | | $ | 582 | |
Undistributed Tax-Exempt income — net | | | — | | | | 435,036 | |
Total undistributed earnings | | $ | 135,693 | | | $ | 435,618 | |
Timing differences (Distribution Payable) | | | (121,563 | ) | | | (435,065 | ) |
Total accumulated earnings (losses) — net | | $ | 14,130 | | | $ | 553 | |
The aggregate cost for each Fund stated in the accompanying Statements of Assets and Liabilities also represents aggregate cost for U.S. federal income tax purposes.
In order to present certain components of the Funds’ capital accounts on a tax basis, certain reclassifications have been recorded to the Funds’ accounts. These reclassifications have no impact on the NAV of the Funds and result primarily from non-deductible expenses.
| | | | | | | | | | |
| Fund | | | | Accumulated
Undistributed
Net Investment
Income (Loss) | | | Paid in
Capital | |
Investor Money Market | | | | $ | 12,644 | | | $ | (12,644 | ) |
33
GOLDMAN SACHS FUNDS — INVESTOR FUNDS
Notes to Financial Statements (continued)
August 31, 2017
|
| 5. TAX INFORMATION (continued) |
GSAM has reviewed the Funds’ tax positions for all open tax years (the current and prior three tax years, as applicable) and has concluded that no provision for income tax is required in the Funds’ financial statements. Such open tax years remain subject to examination and adjustment by tax authorities.
The Funds’ risks include, but are not limited to, the following:
Large Shareholder Transactions Risk — A Fund may experience adverse effects when certain large shareholders, such as financial intermediaries (who may make investment decisions on behalf of underlying clients) and individuals, purchase or redeem large amounts of shares of a Fund. Such large shareholder redemptions may cause a Fund to sell portfolio securities at times when it would not otherwise do so, which may negatively impact the Fund’s NAV and liquidity. Similarly, large Fund share purchases may adversely affect a Fund’s performance to the extent that the Fund is delayed in investing new cash and is required to maintain a larger cash position than it ordinarily would. These transactions may also accelerate the realization of taxable income to shareholders if such sales of investments resulted in gains, and may also increase transaction costs. In addition, a large redemption could result in a Fund’s current expenses being allocated over a smaller asset base, leading to an increase in the Fund’s expense ratio.
Interest Rate Risk — When interest rates increase, a Fund’s yield will tend to be lower than prevailing market rates, and the market value of its securities or instruments may also be adversely affected. A low interest rate environment poses additional risks to a Fund, because low yields on the Fund’s portfolio holdings may have an adverse impact on the Fund’s ability to provide a positive yield to its shareholders, pay expenses out of Fund assets, or, at times, maintain a stable $1.00 share price. The risks associated with increasing interest rates are heightened given that interest rates are near historic lows, but may be expected to increase in the future with unpredictable effects on the markets and a Fund’s investments. Fluctuations in interest rates may also affect the liquidity of fixed income securities and instruments held by the Funds.
Market and Credit Risks — In the normal course of business, the Funds trade financial instruments and enter into financial transactions where risk of potential loss exists due to changes in the market (market risk). Additionally, a Fund may also be exposed to credit risk in the event that an issuer or guarantor fails to perform or that an institution or entity with which a Fund has unsettled or open transactions defaults.
Geographic and Sector Risk — The Investor Tax-Exempt Money Market Fund may invest a significant portion of its total assets in certain issuers within the same state, geographic region or economic sector which may subject the value of the Fund’s investments to risks associated with an adverse economic, business, political or environmental development affecting that state, region or sector.
Under the Trust’s organizational documents, its Trustees, officers, employees and agents are indemnified, to the extent permitted by the Act and state law, against certain liabilities that may arise out of performance of their duties to the Funds. Additionally, in the course of business, the Funds enter into contracts that contain a variety of indemnification clauses. The Funds’ maximum exposure under these arrangements is unknown, as this would involve future claims that may be made against the Funds that have not yet occurred. However, GSAM believes the risk of loss under these arrangements to be remote.
Exemptive Orders — Pursuant to SEC exemptive orders, the Funds may enter into certain principal transactions, including repurchase agreements, with Goldman Sachs.
34
GOLDMAN SACHS FUNDS — INVESTOR FUNDS
Subsequent events after the Statements of Assets and Liabilities date have been evaluated and GSAM has concluded that there is no impact requiring adjustment or disclosure in the financial statements.
|
| 10. SUMMARY OF SHARE TRANSACTIONS (AT $1.00 PER SHARE) |
Share activity is as follows:
| | | | | | | | |
| | | Investor Money Market Fund | |
| | | For the Fiscal Year Ended
August 31, 2017 | | | For the Period Ended
August 31, 2016* | |
| | | | |
| Class I Shares | | | | | | | | |
Shares sold | | | 498,952,302 | | | | 11,253,024 | |
Reinvestment of distributions | | | 408,136 | | | | 23,471 | |
Shares redeemed | | | (293,596,890 | ) | | | (598,009 | ) |
| | | | 205,763,548 | | | | 10,678,486 | |
| Administration Shares | | | | | | | | |
Shares sold | | | 133,622,121 | | | | 50,005 | |
Reinvestment of distributions | | | 431,344 | | | | 47 | |
Shares redeemed | | | (33,753,107 | ) | | | — | |
| | | | 100,300,358 | | | | 50,052 | |
| Service Shares(a) | | | | | | | | |
Shares sold | | | — | | | | 50,000 | |
Reinvestment of distributions | | | 195 | | | | 24 | |
Shares redeemed | | | — | | | | — | |
| | | | 195 | | | | 50,024 | |
| Resource Shares(a) | | | | | | | | |
Shares sold | | | — | | | | 50,000 | |
Reinvestment of distributions | | | 128 | | | | 23 | |
Shares redeemed | | | — | | | | — | |
| | | | 128 | | | | 50,023 | |
| Cash Management Shares(a) | | | | | | | | |
Shares sold | | | 389,929 | | | | 50,000 | |
Reinvestment of distributions | | | 124 | | | | 23 | |
Shares redeemed | | | (348,708 | ) | | | — | |
| | | | 41,345 | | | | 50,023 | |
| Class A Shares | | | | | | | | |
Shares sold | | | 5,154,530 | | | | 50,007 | |
Reinvestment of distributions | | | 7,081 | | | | 45 | |
Shares redeemed | | | (4,648,247 | ) | | | — | |
| | | | 513,364 | | | | 50,052 | |
| Class C Shares | | | | | | | | |
Shares sold | | | 24,219 | | | | 50,005 | |
Reinvestment of distributions | | | 34 | | | | 24 | |
Shares redeemed | | | (10,663 | ) | | | — | |
| | | | 13,590 | | | | 50,029 | |
NET INCREASE IN SHARES | | | 306,632,528 | | | | 10,978,689 | |
| * | | Commenced operations on January 29, 2016. |
| (a) | | Commenced operations on May 31, 2016. |
35
GOLDMAN SACHS FUNDS — INVESTOR FUNDS
Notes to Financial Statements (continued)
August 31, 2017
|
| 10. SUMMARY OF SHARE TRANSACTIONS (AT $1.00 PER SHARE) (continued) |
Share activity is as follows:
| | | | | | | | |
| | | Investor Tax-Exempt Money Market Fund | |
| | | For the Fiscal Year Ended
August 31, 2017 | | | For the Fiscal Year Ended
August 31, 2016 | |
| | | | |
| Class I Shares | | | | | | | | |
Shares sold | | | 1,225,526,857 | | | | 13,183,639,707 | |
Reinvestment of distributions | | | 662,201 | | | | 1,703,962 | |
Shares redeemed | | | (1,688,955,547 | ) | | | (16,754,080,268 | ) |
| | | | (462,766,489 | ) | | | (3,568,736,599 | ) |
| Select Shares | | | | | | | | |
Shares sold | | | 20,001,000 | | | | 86,955,362 | |
Reinvestment of distributions | | | 7,166 | | | | 13,672 | |
Shares redeemed | | | (14,607,772 | ) | | | (280,470,486 | ) |
| | | | 5,400,394 | | | | (193,501,452 | ) |
| Preferred Shares | | | | | | | | |
Shares sold | | | 21,815 | | | | 10,822,209 | |
Reinvestment of distributions | | | 8 | | | | 558 | |
Shares redeemed | | | (30,953 | ) | | | (17,690,231 | ) |
| | | | (9,130 | ) | | | (6,867,464 | ) |
| Capital Shares | | | | | | | | |
Shares sold | | | 1,000 | | | | 233,070,268 | |
Reinvestment of distributions | | | 4 | | | | 17,029 | |
Shares redeemed | | | (885,172 | ) | | | (254,989,902 | ) |
| | | | (884,168 | ) | | | (21,902,605 | ) |
| Administration Shares | | | | | | | | |
Shares sold | | | 12,585,227 | | | | 532,705,799 | |
Reinvestment of distributions | | | 2,624 | | | | 4,725 | |
Shares redeemed | | | (22,049,174 | ) | | | (627,348,583 | ) |
| | | | (9,461,323 | ) | | | (94,638,059 | ) |
| Premier Shares | | | | | | | | |
Shares sold | | | — | | | | 1 | |
Reinvestment of distributions | | | 3 | | | | — | |
Shares redeemed | | | — | | | | (1 | ) |
| | | | 3 | | | | — | |
| Service Shares | | | | | | | | |
Shares sold | | | 5,380,517 | | | | 161,062,699 | |
Reinvestment of distributions | | | 963 | | | | 508 | |
Shares redeemed | | | (62,689,231 | ) | | | (174,915,864 | ) |
| | | | (57,307,751 | ) | | | (13,852,657 | ) |
| Resource Shares | | | | | | | | |
Shares sold | | | 13,759,611 | | | | 17,005,387 | |
Reinvestment of distributions | | | 4,221 | | | | 718 | |
Shares redeemed | | | (16,499,097 | ) | | | (18,807,597 | ) |
| | | | (2,735,265 | ) | | | (1,801,492 | ) |
| Cash Management Shares | | | | | | | | |
Shares sold | | | 225,518 | | | | 1 | |
Reinvestment of distributions | | | 12 | | | | — | |
Shares redeemed | | | (172,241 | ) | | | (1 | ) |
| | | | 53,289 | | | | — | |
| Class A Shares(a) | | | | | | | | |
Shares sold | | | 666,890 | | | | 10,000 | |
Reinvestment of distributions | | | 2,078 | | | | 1 | |
Shares redeemed | | | (36,243 | ) | | | — | |
| | | | 632,725 | | | | 10,001 | |
| Class C Shares(a) | | | | | | | | |
Shares sold | | | — | | | | 10,000 | |
Reinvestment of distributions | | | 5 | | | | 1 | |
Shares redeemed | | | (1,010 | ) | | | — | |
| | | | (1,005 | ) | | | 10,001 | |
NET DECREASE IN SHARES | | | (527,078,720 | ) | | | (3,901,280,326 | ) |
| (a) | | Commenced operations on March 31, 2016. |
36
Report of Independent Registered Public
Accounting Firm
To the Board of Trustees of Goldman Sachs Trust and Shareholders of the Goldman Sachs Investor Money Market Fund and Goldman Sachs Investor Tax-Exempt Money Market Fund:
In our opinion, the accompanying statements of assets and liabilities, including the schedules of investments, and the related statements of operations and of changes in net assets and the financial highlights present fairly, in all material respects, the financial position of the Goldman Sachs Investor Money Market Fund and Goldman Sachs Investor Tax-Exempt Money Market Fund (collectively the “Funds”), funds of the Goldman Sachs Trust, as of August 31, 2017, and the results of each of their operations for the year then ended, the changes in each of their net assets for each of the two years in the period then ended (or for the Goldman Sachs Investor Money Market Fund, for the year then ended and for the period from January 29, 2016 (the commencement of operations) through August 31, 2016) and the financial highlights for each of the periods presented therein, in conformity with accounting principles generally accepted in the United States of America. These financial statements and financial highlights (hereafter referred to as “financial statements”) are the responsibility of the Fund’s management. Our responsibility is to express an opinion on these financial statements based on our audits. We conducted our audits of these financial statements in accordance with the standards of the Public Company Accounting Oversight Board (United States). Those standards require that we plan and perform the audit to obtain reasonable assurance about whether the financial statements are free of material misstatement. An audit includes examining, on a test basis, evidence supporting the amounts and disclosures in the financial statements, assessing the accounting principles used and significant estimates made by management, and evaluating the overall financial statement presentation. We believe that our audits, which included confirmation of securities as of August 31, 2017 by correspondence with the custodian, brokers, and the application of alternative auditing procedures where securities purchased confirmations had not been received, provide a reasonable basis for our opinion.
PricewaterhouseCoopers LLP
Boston, Massachusetts
October 24, 2017
37
GOLDMAN SACHS FUNDS — INVESTOR FUNDS
| | |
| Fund Expenses — Six Month Period Ended August 31, 2017 (Unaudited) | | |
As a shareholder of Class I Shares, Select Shares, Preferred Shares, Capital Shares, Administration Shares, Premier Shares, Service Shares, Resource Shares, Cash Management Shares, Class A Shares, or Class C Shares of a Fund you incur two types of costs: (1) transaction costs, including contingent deferred sales charges (with respect to Class C Shares); and (2) ongoing costs, including management fees and distribution, service, administration and/or shareholder administration fees (with respect to all share classes except Class I Shares) and other Fund expenses. This Example is intended to help you understand your ongoing costs (in dollars) of investing in Class I Shares, Select Shares, Preferred Shares, Capital Shares, Administration Shares, Premier Shares, Service Shares, Resource Shares, Cash Management Shares, Class A Shares, or Class C Shares of the Funds and to compare these costs with the ongoing costs of investing in other mutual funds.
The Example is based on an investment of $1,000 invested at the beginning of the period and held for the entire period from March 1, 2017 through August 31, 2017, which represents a period of 184 days in a 365-day year.
Actual Expenses — The first line under each Share class in the table below provides information about actual account values and actual expenses. You may use the information in this line, together with the amount you invested, to estimate the expenses that you paid over the period. Simply divide your account value by $1,000 (for example, an $8,600 account value divided by $1,000=8.6), then multiply the result by the number in the first line under the heading entitled “Expenses Paid” to estimate the expenses you paid on your account during this period.
Hypothetical Example for Comparison Purposes — The second line under each Share class in the table below provides information about hypothetical account values and hypothetical expenses based on the Funds’ actual net expense ratios and an assumed rate of return of 5% per year before expenses, which is not the Funds’ actual return. The hypothetical account values and expenses may not be used to estimate the actual ending account balance or expenses you paid for the period. You may use this information to compare the ongoing costs of investing in the Funds and other funds. To do so, compare this 5% hypothetical example with the 5% hypothetical examples that appear in the shareholder reports of the other funds.
Please note that the expenses shown in the table are meant to highlight your ongoing costs only and do not reflect any transactional costs, such as sales charges, redemption fees, or exchange fees. Therefore, the second line of the table is useful in comparing ongoing costs only, and will not help you determine the relative total costs of owning different funds. In addition, if these transactional costs were included, your costs would have been higher.
| | | | | | | | | | | | |
| | | Investor Money Market Fund | |
| Share Class | | Beginning Account Value 3/1/17 | | | Ending Account Value 8/31/17 | | | Expenses Paid for the 6 months ended 8/31/17* | |
| Class I Shares | | | | | | | | | | | | |
Actual | | $ | 1,000.00 | | | $ | 1,005.10 | | | $ | 0.91 | |
Hypothetical (5% return before expenses) | | | 1,000.00 | | | | 1,024.30 | + | | | 0.92 | |
| Administration Shares | | | | | | | | | | | | |
Actual | | | 1,000.00 | | | | 1,003.90 | | | | 2.17 | |
Hypothetical (5% return before expenses) | | | 1,000.00 | | | | 1,023.04 | + | | | 2.19 | |
| Service Shares | | | | | | | | | | | | |
Actual | | | 1,000.00 | | | | 1,002.60 | | | | 3.48 | |
Hypothetical (5% return before expenses) | | | 1,000.00 | | | | 1,021.73 | + | | | 3.52 | |
| Resource Shares | | | | | | | | | | | | |
Actual | | | 1,000.00 | | | | 1,001.90 | | | | 4.24 | |
Hypothetical (5% return before expenses) | | | 1,000.00 | | | | 1,020.97 | + | | | 4.28 | |
| Cash Management Shares | | | | | | | | | | | | |
Actual | | | 1,000.00 | | | | 1,001.10 | | | | 4.94 | |
Hypothetical (5% return before expenses) | | | 1,000.00 | | | | 1,020.27 | + | | | 4.99 | |
| Class A Shares | | | | | | | | | | | | |
Actual | | | 1,000.00 | | | | 1,003.90 | | | | 2.17 | |
Hypothetical (5% return before expenses) | | | 1,000.00 | | | | 1,023.04 | + | | | 2.19 | |
| Class C Shares | | | | | | | | | | | | |
Actual | | | 1,000.00 | | | | 1,000.30 | | | | 5.70 | |
Hypothetical (5% return before expenses) | | | 1,000.00 | | | | 1,019.51 | + | | | 5.75 | |
38
GOLDMAN SACHS FUNDS — INVESTOR FUNDS
| | |
| Fund Expenses — Six Month Period Ended August 31, 2017 (Unaudited) (continued) | | |
| | | | | | | | | | | | |
| | | Investor Tax-Exempt Money Market | |
| Share Class | | Beginning Account Value 3/1/17 | | | Ending Account Value 8/31/17 | | | Expenses Paid for the 6 months ended 8/31/17* | |
| Class I Shares | | | | | | | | | | | | |
Actual | | $ | 1,000.00 | | | $ | 1,003.30 | | | $ | 0.91 | |
Hypothetical (5% return before expenses) | | | 1,000.00 | | | | 1,024.30 | + | | | 0.92 | |
| Select Shares | | | | | | | | | | | | |
Actual | | | 1,000.00 | | | | 1,003.10 | | | | 1.06 | |
Hypothetical (5% return before expenses) | | | 1,000.00 | | | | 1,024.15 | + | | | 1.07 | |
| Preferred Shares | | | | | | | | | | | | |
Actual | | | 1,000.00 | | | | 1,002.80 | | | | 1.41 | |
Hypothetical (5% return before expenses) | | | 1,000.00 | | | | 1,023.79 | + | | | 1.43 | |
| Capital Shares | | | | | | | | | | | | |
Actual | | | 1,000.00 | | | | 1,002.50 | | | | 0.91 | |
Hypothetical (5% return before expenses) | | | 1,000.00 | | | | 1,024.30 | + | | | 0.92 | |
| Administration Shares | | | | | | | | | | | | |
Actual | | | 1,000.00 | | | | 1,002.00 | | | | 2.17 | |
Hypothetical (5% return before expenses) | | | 1,000.00 | | | | 1,023.04 | + | | | 2.19 | |
| Premier Shares | | | | | | | | | | | | |
Actual | | | 1,000.00 | | | | 1,001.50 | | | | 1.82 | |
Hypothetical (5% return before expenses) | | | 1,000.00 | | | | 1,023.39 | + | | | 1.84 | |
| Service Shares | | | | | | | | | | | | |
Actual | | | 1,000.00 | | | | 1,000.80 | | | | 3.43 | |
Hypothetical (5% return before expenses) | | | 1,000.00 | | | | 1,021.78 | + | | | 3.47 | |
| Resource Shares | | | | | | | | | | | | |
Actual | | �� | 1,000.00 | | | | 1,000.10 | | | | 4.08 | |
Hypothetical (5% return before expenses) | | | 1,000.00 | | | | 1,021.12 | + | | | 4.13 | |
| Cash Management Shares | | | | | | | | | | | | |
Actual | | | 1,000.00 | | | | 1,000.00 | | | | 4.13 | |
Hypothetical (5% return before expenses) | | | 1,000.00 | | | | 1,021.07 | + | | | 4.18 | |
| Class A Shares | | | | | | | | | | | | |
Actual | | | 1,000.00 | | | | 1,002.00 | | | | 2.17 | |
Hypothetical (5% return before expenses) | | | 1,000.00 | | | | 1,023.04 | + | | | 2.19 | |
| Class C Shares | | | | | | | | | | | | |
Actual | | | 1,000.00 | | | | 1,000.00 | | | | 3.98 | |
Hypothetical (5% return before expenses) | | | 1,000.00 | | | | 1,021.22 | + | | | 4.02 | |
| | * | | Expenses for each share class are calculated using each Fund’s annualized net expense ratio for each class, which represents the ongoing expenses as a percentage of net assets for the six months ended August 31, 2017. Expenses are calculated by multiplying the annualized net expense ratio by the average account value for the period; then multiplying the result by the number of days in the most recent fiscal half year; and then dividing that result by the number of days in the fiscal year. The annualized net expense ratios for the period were as follows: | |
| | | | | | | | | | | | | | | | | | | | | | | | | | | | | | | | | | | | | | | | | | | | |
| Fund | | Class I
Shares | | | Select
Shares | | | Preferred
Shares | | | Capital
Shares | | | Administration
Shares | | | Premier
Shares | | | Service
Shares | | | Resource
Shares | | | Cash
Management
Shares | | | Class A
Shares | | | Class C
Shares | |
Investor Money Market | | | 0.18 | % | | | N/A | | | | N/A | | | | N/A | | | | 0.43 | % | | | N/A | | | | 0.69 | % | | | 0.84 | % | | | 0.98 | % | | | 0.43 | % | | | 1.13 | % |
Investor Tax-Exempt Money Market | | | 0.18 | | | | 0.21 | % | | | 0.28 | % | | | 0.18 | % | | | 0.43 | | | | 0.36 | % | | | 0.68 | | | | 0.81 | | | | 0.82 | | | | 0.43 | | | | 0.79 | |
| | + | | Hypothetical expenses are based on each Fund’s actual annualized net expense ratios and an assumed rate of return of 5% per year before expenses. | |
39
GOLDMAN SACHS FUNDS — INVESTOR FUNDS
Statement Regarding Basis for Approval of Management Agreement (Unaudited)
Background
The Goldman Sachs Investor Money Market Fund and Goldman Sachs Investor Tax-Exempt Money Market Fund (the “Funds”) are investment portfolios of Goldman Sachs Trust (the “Trust”). The Board of Trustees oversees the management of the Trust and reviews the investment performance and expenses of the Funds at regularly scheduled meetings held throughout the year. In addition, the Board of Trustees determines annually whether to approve the continuance of the Trust’s investment management agreement (the “Management Agreement”) with Goldman Sachs Asset Management, L.P. (the “Investment Adviser”) on behalf of the Funds.
The Management Agreement was most recently approved for continuation until June 30, 2018 by the Board of Trustees, including those Trustees who are not parties to the Management Agreement or “interested persons” (as defined in the Investment Company Act of 1940, as amended) of any party thereto (the “Independent Trustees”), at a meeting held on June 14-15, 2017 (the “Annual Meeting”).
The review process undertaken by the Trustees spans the course of the year and culminates with the Annual Meeting. To assist the Trustees in their deliberations, the Trustees have established a Contract Review Committee (the “Committee”), comprised of the Independent Trustees. The Committee held four meetings over the course of the year since the Management Agreement was last approved. At those Committee meetings, regularly scheduled Board or other committee meetings, and/or the Annual Meeting, matters relevant to the renewal of the Management Agreement were considered by the Board, or the Independent Trustees, as applicable. With respect to each Fund, such matters included:
| | (a) | | the nature and quality of the advisory, administrative, and other services provided to the Fund by the Investment Adviser and its affiliates, including information about: |
| | (i) | | the structure, staff, and capabilities of the Investment Adviser and its portfolio management teams; |
| | (ii) | | the groups within the Investment Adviser and its affiliates that support the portfolio management teams or provide other types of necessary services, including fund services groups (e.g., accounting and financial reporting, tax, shareholder services, and operations); controls and risk management groups (e.g., legal, compliance, valuation oversight, credit risk management, internal audit, compliance testing, market risk analysis, finance, and central funding); sales and distribution support groups, and others (e.g., information technology and training); |
| | (iii) | | trends in employee headcount; |
| | (iv) | | the Investment Adviser’s financial resources and ability to hire and retain talented personnel and strengthen its operations; and |
| | (v) | | the parent company’s support of the Investment Adviser and its mutual fund business, as expressed by the firm’s senior management; |
| | (b) | | information on the investment performance of the Fund, including comparisons to the performance of similar mutual funds, as provided by a third-party mutual fund data provider engaged as part of the contract review process (the “Outside Data Provider”); and information on general investment outlooks in the markets in which the Fund invests; |
| | (c) | | information provided by the Investment Adviser indicating the Investment Adviser’s views on whether the Fund’s peer group and/or benchmark index had high, medium, or low relevance given the Fund’s particular investment strategy; |
| | (d) | | the terms of the Management Agreement and other agreements with affiliated service providers entered into by the Trust on behalf of the Fund; |
| | (e) | | fee and expense information for the Fund, including: |
| | (i) | | the relative management fee and expense levels of the Fund as compared to those of comparable funds managed by other advisers, as provided by the Outside Data Provider; |
| | (ii) | | the Fund’s expense trends over time (except for the Investor Money Market Fund, which commenced operations on January 29, 2016); and |
| | (iii) | | to the extent the Investment Adviser manages other types of accounts (such as bank collective trusts, private wealth management accounts, institutional separate accounts, sub-advised mutual funds, and non-U.S. funds) having investment objectives and policies similar to those of the Fund, comparative information on the advisory fees charged and services provided to those accounts by the Investment Adviser; |
| | (f) | | with respect to the extensive investment performance and expense comparison data provided by the Outside Data Provider, its processes in producing that data for the Fund; |
| | (g) | | the undertakings of the Investment Adviser and its affiliates to implement fee waivers and/or expense limitations; |
| | (h) | | information relating to the profitability of the Management Agreement and the transfer agency and distribution and service arrangements of the Fund to the Investment Adviser and its affiliates; |
| | (i) | | whether the Fund’s existing management fee schedule adequately addressed any economies of scale; |
40
GOLDMAN SACHS FUNDS — INVESTOR FUNDS
Statement Regarding Basis for Approval of Management Agreement (Unaudited) (continued)
| | (j) | | a summary of the “fall-out” benefits derived by the Investment Adviser and its affiliates from their relationships with the Fund, including the fees received by the Investment Adviser’s affiliates from the Fund for transfer agency, distribution and other services; |
| | (k) | | a summary of potential benefits derived by the Fund as a result of its relationship with the Investment Adviser; |
| | (l) | | information regarding portfolio trading and how the Investment Adviser carries out its duty to seek best execution; |
| | (m) | | the nature and quality of the services provided to the Fund by its unaffiliated service providers, and the Investment Adviser’s general oversight and evaluation (including reports on due diligence) of those service providers as part of the administrative services provided under the Management Agreement; |
| | (n) | | the Investment Adviser’s processes and policies addressing various types of potential conflicts of interest; its approach to risk management; the annual review of the effectiveness of the Fund’s compliance program; and periodic compliance reports; and |
| | (o) | | the efforts of the Investment Adviser to respond to amendments to the regulatory framework for money market funds, including (with respect to the Investor Tax-Exempt Money Market Fund) implementation of the final set of reforms as of October 11, 2016. |
The Trustees also received an overview of the Funds’ distribution arrangements. They received information regarding the Funds’ assets, share purchase and redemption activity, and payment of distribution, service, and shareholder administration fees, as applicable. Information was also provided to the Trustees relating to revenue sharing payments made by and services provided by the Investment Adviser and its affiliates to intermediaries that promote the sale, distribution, and/or servicing of Fund shares. The Independent Trustees also discussed the broad range of other investment choices that are available to Fund investors, including the availability of comparable funds managed by other advisers.
The presentations made at the Board and Committee meetings and at the Annual Meeting encompassed the Funds and other mutual funds for which the Board of Trustees has responsibility. In evaluating the Management Agreement at the Annual Meeting, the Trustees relied upon their knowledge, resulting from their meetings and other interactions throughout the year, of the Investment Adviser and its affiliates, their services, and the Funds. In conjunction with these meetings, the Trustees received written materials and oral presentations on the topics covered, and the Investment Adviser addressed the questions and concerns of the Trustees, including concerns regarding the investment performance of certain of the funds they oversee. The Independent Trustees were advised by their independent legal counsel regarding their responsibilities and other regulatory requirements related to the approval and continuation of mutual fund investment management agreements under applicable law. In addition, the Investment Adviser and its affiliates provided the Independent Trustees with a written response to a formal request for information sent on behalf of the Independent Trustees by their independent legal counsel. During the course of their deliberations, the Independent Trustees met in executive sessions with their independent legal counsel, without representatives of the Investment Adviser or its affiliates present.
Nature, Extent, and Quality of the Services Provided Under the Management Agreement
As part of their review, the Trustees considered the nature, extent, and quality of the services provided to the Funds by the Investment Adviser. In this regard, the Trustees considered both the investment advisory services and non-advisory services that are provided by the Investment Adviser and its affiliates. The Trustees noted the transition in the leadership and changes in personnel of various of the Investment Adviser’s portfolio management teams that had occurred in recent periods, and the ongoing recruitment efforts aimed at bringing high quality investment talent to the Investment Adviser. They also noted the Investment Adviser’s commitment to maintaining high quality systems and expending substantial resources to respond to ongoing changes to the regulatory and control environment in which the Funds and their service providers operate, as well as the efforts of the Investment Adviser and its affiliates to combat cyber security risks. The Trustees concluded that the Investment Adviser continued to commit substantial financial and operational resources to the Funds and expressed confidence that the Investment Adviser would continue to do so in the future. The Trustees also recognized that the Investment Adviser had made significant commitments to address regulatory compliance requirements applicable to the Funds and the Investment Adviser and its affiliates.
Investment Performance
The Trustees also considered the investment performance of the Investor Tax-Exempt Money Market Fund. The Trustees noted that the Investor Money Market Fund had launched on January 29, 2016 and did not yet have a meaningful performance history. In this regard, they compared the investment performance of the Investor Tax-Exempt Money Market Fund to its peers using rankings compiled by the Outside Data Provider as of December 31, 2016. The information on the Fund’s investment performance was provided for the one-, three-, five-, and ten-year periods ending on the applicable dates.
41
GOLDMAN SACHS FUNDS — INVESTOR FUNDS
Statement Regarding Basis for Approval of Management Agreement (Unaudited) (continued)
In addition, the Trustees considered materials prepared and presentations made by the Investment Adviser’s senior management and portfolio management personnel in which Fund performance was assessed. The Trustees also considered the Investment Adviser’s periodic reports with respect to the Fund’s risk profile, and how the Investment Adviser’s approach to risk monitoring and management influences portfolio management.
The Trustees considered the performance of the Investor Tax-Exempt Money Market Fund in light of its investment policies and strategies. They considered that the Investment Adviser had expended substantial resources to respond to amendments to the regulatory framework for money market funds. They noted that the Fund had implemented the final set of reforms as of October 11, 2016, including the requirements relating to the use of liquidity fees and redemption gates. They considered that the Fund had operated in a challenging yield environment since 2009 (although yields had begun to improve as a result of recent actions by the Federal Reserve), and that the Investment Adviser had been able to maintain a positive yield to meet the demand of the Fund’s investors, in many instances as the result of voluntary fee waivers and expense reimbursements. The Trustees also considered that the Fund had maintained a stable net asset value. In light of these considerations, the Trustees believed that the Fund was providing investment performance within a competitive range for investors.
Costs of Services Provided and Competitive Information
The Trustees considered the contractual terms of the Management Agreement and the fee rates payable by each Fund thereunder. In this regard, the Trustees considered information on the services rendered by the Investment Adviser to the Funds, which included both advisory and administrative services that were directed to the needs and operations of the Funds as registered mutual funds.
In particular, the Trustees reviewed analyses prepared by the Outside Data Provider regarding the expense rankings of the Funds. The analyses provided a comparison of each Fund’s management fee to those of a relevant peer group and category universe; an expense analysis which compared each Fund’s overall net and gross expenses to a peer group and a category universe; and data comparing each Fund’s net expenses to the peer and category medians. The analyses also compared each Fund’s transfer agency and custody fees, other expenses and fee waivers/reimbursements to those of the peer group and category medians. The Trustees concluded that the comparisons provided by the Outside Data Provider were useful in evaluating the reasonableness of the management fees and total expenses paid by the Funds.
In addition, the Trustees considered the Investment Adviser’s undertakings to implement fee waivers and/or expense limitations. They noted that the Investment Adviser and Goldman Sachs & Co. LLC (“Goldman Sachs”) had waived fees and reimbursed expenses for the Funds in order to maintain positive yields. They also observed that the Investment Adviser had expended substantial resources to respond to amendments to the regulatory framework for money market funds. They noted that the Funds had implemented the final set of reforms as of October 11, 2016, including the requirements relating to the use of liquidity fees and redemption gates. They also considered, to the extent that the Investment Adviser manages other types of accounts having investment objectives and policies similar to those of the Funds, comparative fee information for services provided by the Investment Adviser to those accounts, and information that indicated that services provided to the Funds differed in various significant respects from the services provided to other types of accounts which, in many cases, operated under less stringent legal and regulatory structures, required fewer services from the Investment Adviser to a smaller number of client contact points, and were less time-intensive.
In addition, the Trustees noted that shareholders are able to redeem their Fund shares at any time if shareholders believe that the Fund fees and expenses are too high or if they are dissatisfied with the performance of the Fund.
Profitability
The Trustees reviewed each Fund’s contribution to the Investment Adviser’s revenues and pre-tax profit margins. In this regard the Trustees noted that they had received, among other things, profitability analyses and summaries, revenue and expense schedules by Fund and by function (i.e., investment management, transfer agency and distribution and service), and information on the Investment Adviser’s expense allocation methodology. They observed that the profitability and expense figures are substantially similar to those used by the Investment Adviser for many internal purposes, including compensation decisions among various business groups, and are thus subject to a vigorous internal debate about how certain revenue and expenses should be allocated. The Trustees also noted that the internal audit group within the Goldman Sachs organization had audited the expense allocation methodology and that the internal audit group was satisfied with the reasonableness, consistency, and accuracy of the Investment Adviser’s expense allocation methodology and profitability analysis calculations. Profitability data for each Fund was provided for 2016 and 2015 (2016 only for the Investor Money Market Fund), and the Trustees considered this information in relation to the Investment Adviser’s overall profitability.
42
GOLDMAN SACHS FUNDS — INVESTOR FUNDS
Statement Regarding Basis for Approval of Management Agreement (Unaudited) (continued)
Economies of Scale
The Trustees considered the information that had been provided regarding the Investment Adviser’s profitability.
The Trustees noted that the Funds do not have management fee breakpoints. They considered the asset levels in the Funds; the Funds’ recent purchase and redemption activity; the information provided by the Investment Adviser relating to the costs of the services provided by the Investment Adviser and its affiliates and their realized profits; information comparing the contractual fee rates charged by the Investment Adviser with fee rates charged to other money market funds in the peer groups; the Investment Adviser’s undertaking to limit certain expenses of the Funds that exceed specified levels; and the willingness of the Investment Adviser and Goldman Sachs to waive certain fees on a temporary basis in order to maintain positive Fund yields. They considered a report prepared by the Outside Data Provider, which surveyed money market funds’ management fee arrangements and use of breakpoints. The Trustees also considered the competitive nature of the money market fund business and the competitiveness of the fees charged to the Funds by the Investment Adviser.
Other Benefits to the Investment Adviser and Its Affiliates
The Trustees also considered the other benefits derived by the Investment Adviser and its affiliates from their relationships with the Funds as stated above, including: (a) transfer agency fees received by Goldman Sachs; (b) trading efficiencies resulting from aggregation of orders of the Funds with those for other funds or accounts managed by the Investment Adviser; (c) the Investment Adviser’s ability to leverage the infrastructure designed to service the Funds on behalf of its other clients; (d) the Investment Adviser’s ability to cross-market other products and services to Fund shareholders; (e) Goldman Sachs’ retention of certain fees as Fund Distributor; (f) Goldman Sachs’ ability to engage in principal transactions with the Funds under exemptive orders from the U.S. Securities and Exchange Commission permitting such trades; (g) the Investment Adviser’s ability to negotiate better pricing with custodians on behalf of its other clients, as a result of the relationship with the Funds; and (h) the possibility that the working relationship between the Investment Adviser and the Funds’ third-party service providers may cause those service providers to be more likely to do business with other areas of Goldman Sachs. In the course of considering the foregoing, the Independent Trustees requested and received further information quantifying certain of these fall-out benefits.
Other Benefits to the Funds and Their Shareholders
The Trustees also noted that the Funds receive certain potential benefits as a result of their relationship with the Investment Adviser, including: (a) trading efficiencies resulting from aggregation of orders of the Funds with those of other funds or accounts managed by the Investment Adviser; (b) enhanced servicing from vendors because of the volume of business generated by the Investment Adviser and its affiliates; (c) enhanced servicing from broker-dealers because of the volume of business generated by the Investment Adviser and its affiliates; (d) the Investment Adviser’s knowledge and experience gained from managing other accounts and products; (e) the Investment Adviser’s ability to hire and retain qualified personnel to provide services to the Funds because of the reputation of the Goldman Sachs organization; (f) the Funds’ access, through the Investment Adviser, to certain firmwide resources (e.g., proprietary risk management systems and databases), subject to certain restrictions; and (g) the Funds’ access to certain affiliated distribution channels. In addition, the Trustees noted the competitive nature of the mutual fund marketplace, and considered that many of the Funds’ shareholders invested in the Funds in part because of the Funds’ relationship with the Investment Adviser and that those shareholders have a general expectation that the relationship will continue.
Conclusion
In connection with their consideration of the Management Agreement, the Trustees gave weight to each of the factors described above, but did not identify any particular factor as controlling their decision. After deliberation and consideration of all of the information provided, including the factors described above, the Trustees concluded, in the exercise of their business judgment, that the management fees paid by each of the Funds were reasonable in light of the services provided to it by the Investment Adviser, the Investment Adviser’s costs and each Fund’s current and reasonably foreseeable asset levels. The Trustees unanimously concluded that the Investment Adviser’s continued management likely would benefit each Fund and its shareholders and that the Management Agreement should be approved and continued with respect to each Fund until June 30, 2018.
43
GOLDMAN SACHS FUNDS — INVESTOR FUNDS
Trustees and Officers (Unaudited) Independent Trustees
| | | | | | | | | | |
Name, Address and Age1 | | Position(s) Held with the Trust | | Term of Office and Length of Time Served2 | | Principal Occupation(s) During Past 5 Years | | Number of Portfolios in Fund Complex Overseen by Trustee3 | | Other Directorships Held by Trustee4 |
Ashok N. Bakhru Age: 75 | | Chairman of the Board of Trustees | | Since 1996 (Trustee since 1991) | | Mr. Bakhru is retired. He was formerly Chairman of the Board of Trustees, Goldman Sachs Trust II (2012-2016), Goldman Sachs MLP Income Opportunities Fund (2013-2016), Goldman Sachs MLP and Energy Renaissance Fund (2014-2016), and Goldman Sachs ETF Trust (2014-2016); Director, Apollo Investment Corporation (a business development company) (2008-2013); President, ABN Associates (a management and financial consulting firm) (1994-1996 and 1998- 2012); Trustee, Scholarship America (1998-2005); Trustee, Institute for Higher Education Policy (2003-2008); Director, Private Equity Investors — III and IV (1998-2007), and Equity-Linked Investors II (April 2002-2007). Chairman of the Board of Trustees — Goldman Sachs Trust; Goldman Sachs Variable Insurance Trust; Goldman Sachs BDC, Inc.; and Goldman Sachs Private Middle Market Credit LLC. | | 106 | | None |
Kathryn A. Cassidy Age: 63 | | Trustee | | Since 2015 | | Ms. Cassidy is retired. Formerly, she was Advisor to the Chairman (May 2014-December 2014); and Senior Vice President and Treasurer (2008-2014), General Electric Company & General Electric Capital Corporation (technology and financial services companies). Trustee — Goldman Sachs Trust and Goldman Sachs Variable Insurance Trust. | | 104 | | None |
Diana M. Daniels Age: 68 | | Trustee | | Since 2007 | | Ms. Daniels is retired. Formerly, she was Vice President, General Counsel and Secretary, The Washington Post Company (1991-2006). Ms. Daniels is a Trustee Emeritus and serves as a Presidential Councillor of Cornell University (2013-Present); former Member of the Legal Advisory Board, New York Stock Exchange (2003- 2006) and of the Corporate Advisory Board, Standish Mellon Management Advisors (2006- 2007). Trustee — Goldman Sachs Trust and Goldman Sachs Variable Insurance Trust. | | 104 | | None |
Herbert J. Markley Age: 67 | | Trustee | | Since 2013 | | Mr. Markley is retired. Formerly, he was Executive Vice President, Deere & Company (an agricultural and construction equipment manufacturer) (2007- 2009); and President, Agricultural Division, Deere & Company (2001-2007). Previously, Mr. Markley served as an Advisory Board Member of Goldman Sachs Trust and Goldman Sachs Variable Insurance Trust (June 2013-October 2013). Trustee — Goldman Sachs Trust and Goldman Sachs Variable Insurance Trust. | | 104 | | None |
Jessica Palmer Age: 68 | | Trustee | | Since 2007 | | Ms. Palmer is retired. She is Director, Emerson Center for the Arts and Culture (2011-Present); and was formerly a Consultant, Citigroup Human Resources Department (2007-2008); Managing Director, Citigroup Corporate and Investment Banking (previously, Salomon Smith Barney/ Salomon Brothers) (1984-2006). Ms. Palmer was a Member of the Board of Trustees of Indian Mountain School (private elementary and secondary school) (2004-2009). Trustee — Goldman Sachs Trust and Goldman Sachs Variable Insurance Trust. | | 104 | | None |
| | | | | | | | | | |
44
GOLDMAN SACHS FUNDS — INVESTOR FUNDS
Trustees and Officers (Unaudited) (continued) Independent Trustees
| | | | | | | | | | |
Name, Address and Age1 | | Position(s) Held with the Trust | | Term of Office and Length of Time Served2 | | Principal Occupation(s) During Past 5 Years | | Number of Portfolios in Fund Complex Overseen by Trustee3 | | Other Directorships Held by Trustee4 |
Roy W. Templin Age: 57 | | Trustee | | Since 2013 | | Mr. Templin is retired. He is Director, Armstrong World Industries, Inc. (a designer and manufacturer of ceiling, wall and suspension system solutions) (2016-Present); and was formerly Chairman of the Board of Directors, Con-Way Incorporated (a transportation, logistics and supply chain management service company) (2014-2015); Executive Vice President and Chief Financial Officer, Whirlpool Corporation (an appliance manufacturer and marketer) (2004- 2012). Previously, Mr. Templin served as an Advisory Board Member of Goldman Sachs Trust and Goldman Sachs Variable Insurance Trust (June 2013-October 2013). Trustee — Goldman Sachs Trust and Goldman Sachs Variable Insurance Trust. | | 104 | | Armstrong World Industries, Inc. (a ceiling, wall and suspension system solutions manufacturer) |
Gregory G. Weaver Age: 65 | | Trustee | | Since 2015 | | Mr. Weaver is retired. He is Director, Verizon Communications Inc. (2015-Present); and was formerly Chairman and Chief Executive Officer, Deloitte & Touche LLP (a professional services firm) (2001-2005 and 2012-2014); and Member of the Board of Directors, Deloitte & Touche LLP (2006-2012). Trustee — Goldman Sachs Trust and Goldman Sachs Variable Insurance Trust. | | 104 | | Verizon Communications Inc. |
| | | | | | | | | | |
45
GOLDMAN SACHS FUNDS — INVESTOR FUNDS
Trustees and Officers (Unaudited) (continued) Interested Trustee*
| | | | | | | | | | |
Name, Address and Age1 | | Position(s) Held with the Trust | | Term of Office and Length of Time Served2 | | Principal Occupation(s) During Past 5 Years | | Number of Portfolios in Fund Complex Overseen by Trustee3 | | Other Directorships Held by Trustee4 |
James A. McNamara Age: 54 | | President and Trustee | | Since 2007 | | Managing Director, Goldman Sachs (December 1998-Present); Director of Institutional Fund Sales, GSAM (April 1998-December 2000); and Senior Vice President and Manager, Dreyfus Institutional Service Corporation (January 1993- April 1998). President and Trustee — Goldman Sachs Trust; Goldman Sachs Variable Insurance Trust; Goldman Sachs Trust II; Goldman Sachs MLP Income Opportunities Fund; Goldman Sachs MLP and Energy Renaissance Fund; and Goldman Sachs ETF Trust. | | 142 | | None |
| | | | | | | | | | |
| * | | Mr. McNamara is considered to be an “Interested Trustee” because he holds positions with Goldman Sachs and owns securities issued by The Goldman Sachs Group, Inc. Mr. McNamara holds comparable positions with certain other companies of which Goldman Sachs, GSAM or an affiliate thereof is the investment adviser, administrator and/or distributor. |
| 1 | | Each Trustee may be contacted by writing to the Trustee, c/o Goldman Sachs, 200 West Street, New York, New York, 10282, Attn: Caroline Kraus. Information is provided as of August 31, 2017. |
| 2 | | Subject to such policies as may be adopted by the Board from time-to-time, each Trustee holds office for an indefinite term, until the earliest of: (a) the election of his or her successor; (b) the date the Trustee resigns or is removed by the Board or shareholders, in accordance with the Trust’s Declaration of Trust; or (c) the termination of the Trust. The Board has adopted policies which provide that (a) no Trustee shall hold office for more than 15 years and (b) a Trustee shall retire as of December 31st of the calendar year in which he or she reaches his or her 74th birthday, unless a waiver of such requirement shall have been adopted by a majority of the other Trustees. These policies may be changed by the Trustees without shareholder vote. One Trustee has been granted a waiver from the foregoing policies which permits him to serve until December 31, 2017. |
| 3 | | The Goldman Sachs Fund Complex includes certain other companies listed above for each respective Trustee. As of August 31, 2017, Goldman Sachs Trust consisted of 90 portfolios (88 of which offered shares to the public); Goldman Sachs Variable Insurance Trust consisted of 14 portfolios; Goldman Sachs Trust II consisted of 17 portfolios (16 of which offered shares to the public); Goldman Sachs BDC, Inc., Goldman Sachs Private Middle Market Credit LLC, Goldman Sachs MLP Income Opportunities Fund, and Goldman Sachs MLP and Energy Renaissance Fund each consisted of one portfolio; and Goldman Sachs ETF Trust consisted of 19 portfolios (eight of which offered shares to the public). Goldman Sachs Private Middle Market Credit LLC does not offer shares to the public. |
| 4 | | This column includes only directorships of companies required to report to the Securities and Exchange Commission under the Securities Exchange Act of 1934 (i.e., “public companies”) or other investment companies registered under the Act. |
Additional information about the Trustees is available in the Funds’ Statement of Additional Information, which can be obtained from Goldman Sachs free of charge by calling this toll-free number (in the United States of America): 1-800-526-7384 (for shareholders of Class A Shares or Class C Shares) or 1-800-621-2550 (for shareholders of all other share classes of a Fund).
46
GOLDMAN SACHS FUNDS — INVESTOR FUNDS
Trustees and Officers (Unaudited) (continued)
Officers of the Trust*
| | | | | | |
Name, Address and Age1 | | Position(s) Held with the Trust | | Term of
Office and
Length of
Time Served2 | | Principal Occupation(s) During Past 5 Years |
James A. McNamara 200 West Street New York, NY 10282 Age: 54 | | Trustee and President | | Since 2007 | | Managing Director, Goldman Sachs (December 1998-Present); Director of Institutional Fund Sales, GSAM (April 1998-December 2000); and Senior Vice President and Manager, Dreyfus Institutional Service Corporation (January 1993-April 1998). President and Trustee — Goldman Sachs Trust; Goldman Sachs Variable Insurance Trust; Goldman Sachs Trust II; Goldman Sachs MLP Income Opportunities Fund; Goldman Sachs MLP and Energy Renaissance Fund; and Goldman Sachs ETF Trust. |
Caroline L. Kraus 200 West Street New York, NY 10282 Age: 40 | | Secretary | | Since 2012 | | Managing Director, Goldman Sachs (January 2016-Present); Vice President, Goldman Sachs (August 2006-December 2015); Associate General Counsel, Goldman Sachs (2012-Present); Assistant General Counsel, Goldman Sachs (August 2006-December 2011); and Associate, Weil, Gotshal & Manges, LLP (2002-2006). Secretary — Goldman Sachs Trust (previously Assistant Secretary (2012)); Goldman Sachs Variable Insurance Trust (previously Assistant Secretary (2012)); Goldman Sachs Trust II; Goldman Sachs BDC, Inc.; Goldman Sachs Private Middle Market Credit LLC; Goldman Sachs Middle Market Lending Corp.; Goldman Sachs MLP Income Opportunities Fund; Goldman Sachs MLP and Energy Renaissance Fund; and Goldman Sachs ETF Trust. |
Scott M. McHugh 200 West Street New York, NY 10282 Age: 45 | | Treasurer, Senior Vice President and Principal Financial Officer | | Since 2009 (Principal Financial Officer since 2013) | | Managing Director, Goldman Sachs (January 2016-Present); Vice President, Goldman Sachs (February 2007-December 2015); Assistant Treasurer of certain mutual funds administered by DWS Scudder (2005-2007); and Director (2005-2007), Vice President (2000-2005), and Assistant Vice President (1998-2000), Deutsche Asset Management or its predecessor (1998-2007). Treasurer, Senior Vice President and Principal Financial Officer — Goldman Sachs Trust; Goldman Sachs Variable Insurance Trust; Goldman Sachs Trust II; Goldman Sachs MLP Income Opportunities Fund; Goldman Sachs MLP and Energy Renaissance Fund; and Goldman Sachs ETF Trust. |
Joseph F. DiMaria 30 Hudson Street Jersey City, NJ 07302 Age: 49 | | Assistant Treasurer and Principal Accounting Officer | | Since 2016 (Principal Accounting Officer since 2017) | | Managing Director, Goldman Sachs (November 2015-Present) and Vice President — Mutual Fund Administration, Columbia Management Investment Advisers, LLC (May 2010-October 2015). Assistant Treasurer and Principal Accounting Officer — Goldman Sachs Trust; Goldman Sachs Variable Insurance Trust; Goldman Sachs Trust II; Goldman Sachs MLP Income Opportunities Fund; Goldman Sachs MLP and Energy Renaissance Fund; and Goldman Sachs ETF Trust. |
| | | | | | |
| * | | Represents a partial list of officers of the Trust. Additional information about all the officers is available in the Funds’ Statement of Additional Information, which can be obtained from Goldman Sachs free of charge by calling this toll-free number (in the United States): 1-800-526-7384. |
| 1 | | Information is provided as of August 31, 2017. |
| 2 | | Officers hold office at the pleasure of the Board of Trustees or until their successors are duly elected and qualified. Each officer holds comparable positions with certain other companies of which Goldman Sachs, GSAM or an affiliate thereof is the investment adviser, administrator and/or distributor. |
47
GOLDMAN SACHS FUNDS — INVESTOR FUNDS
Goldman Sachs Funds – Investor Money Market Funds – Tax Information (unaudited)
During the year ended August 31, 2017, 99.47% of the distributions from net investment income paid by the Investor Tax-Exempt Money Market Fund, were exempt-interest dividends and as such, are not subject to U.S. federal income tax.
Pursuant to Section 852 of the Internal Revenue Code, the Investor Tax-Exempt Money Market Fund designates $423,093 or, if different, the maximum amount allowable, as capital gain dividends paid during the taxable year ended August 31, 2017.
During the year ended August 31, 2017, 53.90% of the net investment company taxable income distributions paid by the Investor Money Market Fund was designated as either interest-related dividends or short-term capital gain dividends pursuant to Section 871(k) of the Internal Revenue Code.
48
FUNDS PROFILE
Goldman Sachs Funds
Goldman Sachs is a premier financial services firm, known since 1869 for creating thoughtful and customized investment solutions in complex global markets.
Today, the Investment Management Division of Goldman Sachs serves a diverse set of clients worldwide, including private institutions, public entities and individuals. With approximately $1.21 trillion in assets under supervision as of June 30, 2017, Goldman Sachs Asset Management (“GSAM”) has portfolio management teams located around the world and our investment professionals bring firsthand knowledge of local markets to every investment decision. Assets under supervision includes assets under management and other client assets for which Goldman Sachs does not have full discretion. GSAM leverages the resources of Goldman Sachs & Co. LLC subject to legal, internal and regulatory restrictions.
Money Market
Financial Square FundsSM
| ∎ | | Financial Square Treasury Solutions Fund1 |
| ∎ | | Financial Square Government Fund1 |
| ∎ | | Financial Square Money Market Fund2 |
| ∎ | | Financial Square Prime Obligations Fund2 |
| ∎ | | Financial Square Treasury Instruments Fund1 |
| ∎ | | Financial Square Treasury Obligations Fund1 |
| ∎ | | Financial Square Federal Instruments Fund1 |
| ∎ | | Financial Square Tax-Exempt Money Market Fund2 |
Investor FundsSM
| ∎ | | Investor Money Market Fund3 |
| ∎ | | Investor Tax-Exempt Money Market Fund3 |
Fixed Income
Short Duration and Government
| ∎ | | High Quality Floating Rate Fund |
| ∎ | | Short-Term Conservative Income Fund |
| ∎ | | Short Duration Government Fund |
| ∎ | | Short Duration Income Fund |
| ∎ | | Inflation Protected Securities Fund |
Multi-Sector
Municipal and Tax-Free
| ∎ | | High Yield Municipal Fund |
| ∎ | | Dynamic Municipal Income Fund |
| ∎ | | Short Duration Tax-Free Fund |
Single Sector
| ∎ | | Investment Grade Credit Fund |
| ∎ | | High Yield Floating Rate Fund |
| ∎ | | Emerging Markets Debt Fund |
| ∎ | | Local Emerging Markets Debt Fund |
| ∎ | | Dynamic Emerging Markets Debt Fund |
Fixed Income Alternatives
| ∎ | | Long Short Credit Strategies Fund |
Fundamental Equity
| ∎ | | Small/Mid Cap Value Fund |
| ∎ | | Small/Mid Cap Growth Fund |
| ∎ | | Concentrated Growth Fund7 |
| ∎ | | Technology Opportunities Fund |
| ∎ | | Growth Opportunities Fund |
| ∎ | | Rising Dividend Growth Fund |
Tax-Advantaged Equity
| ∎ | | U.S. Tax-Managed Equity Fund |
| ∎ | | International Tax-Managed Equity Fund |
| ∎ | | U.S. Equity Dividend and Premium Fund |
| ∎ | | International Equity Dividend and Premium Fund |
Equity Insights
| ∎ | | Small Cap Equity Insights Fund |
| ∎ | | U.S. Equity Insights Fund |
| ∎ | | Small Cap Growth Insights Fund |
| ∎ | | Large Cap Growth Insights Fund |
| ∎ | | Large Cap Value Insights Fund |
| ∎ | | Small Cap Value Insights Fund |
| ∎ | | International Small Cap Insights Fund |
| ∎ | | International Equity Insights Fund |
| ∎ | | Emerging Markets Equity Insights Fund |
Fundamental Equity International
| ∎ | | Strategic International Equity Fund |
| ∎ | | Focused International Equity Fund |
| ∎ | | Emerging Markets Equity Fund |
Select Satellite
| ∎ | | Real Estate Securities Fund |
| ∎ | | International Real Estate Securities Fund |
| ∎ | | Commodity Strategy Fund |
| ∎ | | Global Real Estate Securities Fund |
| ∎ | | Alternative Premia Fund9 |
| ∎ | | Absolute Return Tracker Fund |
| ∎ | | Managed Futures Strategy Fund |
| ∎ | | MLP Energy Infrastructure Fund |
| ∎ | | Multi-Manager Alternatives Fund |
| ∎ | | Absolute Return Multi-Asset Fund |
| ∎ | | Global Infrastructure Fund |
Total Portfolio Solutions
| ∎ | | Global Managed Beta Fund |
| ∎ | | Multi-Manager Non-Core Fixed Income Fund |
| ∎ | | Multi-Manager U.S. Dynamic Equity Fund |
| ∎ | | Multi-Manager Global Equity Fund |
| ∎ | | Multi-Manager International Equity Fund |
| ∎ | | Tactical Tilt Overlay Fund |
| ∎ | | Balanced Strategy Portfolio |
| ∎ | | Multi-Manager U.S. Small Cap Equity Fund |
| ∎ | | Multi-Manager Real Assets Strategy Fund |
| ∎ | | Growth and Income Strategy Portfolio |
| ∎ | | Growth Strategy Portfolio |
| ∎ | | Equity Growth Strategy Portfolio |
| ∎ | | Satellite Strategies Portfolio |
| ∎ | | Enhanced Dividend Global Equity Portfolio |
| ∎ | | Tax-Advantaged Global Equity Portfolio |
| ∎ | | Strategic Factor Allocation Fund |
| ∎ | | Target Date 2020 Portfolio |
| ∎ | | Target Date 2025 Portfolio |
| ∎ | | Target Date 2030 Portfolio |
| ∎ | | Target Date 2035 Portfolio |
| ∎ | | Target Date 2040 Portfolio |
| ∎ | | Target Date 2045 Portfolio |
| ∎ | | Target Date 2050 Portfolio |
| ∎ | | Target Date 2055 Portfolio |
| ∎ | | GQG Partners International Opportunities Fund |
| 1 | | You could lose money by investing in the Fund. Although the Fund seeks to preserve the value of your investment at $1.00 per share, it cannot guarantee it will do so. An investment in the Fund is not a deposit of a bank and is not insured or guaranteed by the Federal Deposit Insurance Corporation or any other government agency. The Fund’s sponsor has no legal obligation to provide financial support to the Fund, and you should not expect that the sponsor will provide financial support to the Fund at any time. |
| 2 | | You could lose money by investing in the Fund. Because the share price of the Fund will fluctuate, when you sell your shares they may be worth more or less than what you originally paid for them. The Fund may impose a fee upon sale of your shares or may temporarily suspend your ability to sell shares if the Fund’s liquidity falls below required minimums because of market conditions or other factors. An investment in the Fund is not a deposit of a bank and is not insured or guaranteed by the Federal Deposit Insurance Corporation or any other government agency. The Fund’s sponsor has no legal obligation to provide financial support to the Fund, and you should not expect that the sponsor will provide financial support to the Fund at any time. |
| 3 | | You could lose money by investing in the Fund. Although the Fund seeks to preserve the value of your investment at $1.00 per share, it cannot guarantee it will do so. The Fund may impose a fee upon sale of your shares or may temporarily suspend your ability to sell shares if the Fund’s liquidity falls below required minimums because of market conditions or other factors. An investment in the Fund is not a deposit of a bank and is not insured or guaranteed by the Federal Deposit Insurance Corporation or any other government agency. The Fund’s sponsor has no legal obligation to provide financial support to the Fund, and you should not expect that the sponsor will provide financial support to the Fund at any time. |
| 4 | | Effective on June 20, 2017, the Goldman Sachs Fixed Income Macro Strategies Fund was renamed the Goldman Sachs Strategic Macro Fund. |
| 5 | | Effective on June 20, 2017, the Goldman Sachs Growth and Income Fund was renamed the Goldman Sachs Equity Income Fund. |
| 6 | | Effective after the close of business on August 31, 2017, the Goldman Sachs Flexible Cap Growth Fund was renamed the Goldman Sachs Flexible Cap Fund. |
| 7 | | Effective on July 28, 2017, the Goldman Sachs Focused Growth Fund was reorganized with and into the Goldman Sachs Concentrated Growth Fund. |
| 8 | | Effective after the close of business on October 31, 2017, the Goldman Sachs Dynamic U.S. Equity Fund was renamed the Goldman Sachs Blue Chip Fund. |
| 9 | | Effective after the close of business on October 30, 2017, the Goldman Sachs Dynamic Allocation Fund was renamed the Goldman Sachs Alternative Premia Fund. |
Financial Square FundsSM and Investor FundsSM are registered service marks of Goldman Sachs & Co. LLC.
| * | | This list covers open-end funds only. Please visit our website at www.GSAMFUNDS.com to learn about our closed-end funds and exchange-traded funds. |
| | |
TRUSTEES Ashok N. Bakhru, Chairman Kathryn A. Cassidy Diana M. Daniels Herbert J. Markley James A. McNamara Jessica Palmer Roy W. Templin Gregory G. Weaver | | OFFICERS James A. McNamara, President Scott M. McHugh, Treasurer, Senior Vice President and Principal Financial Officer Joseph F. DiMaria, Assistant Treasurer and Principal Accounting Officer Caroline L. Kraus, Secretary |
| |
GOLDMAN, SACHS & CO. LLC Distributor and Transfer Agent | | GOLDMAN SACHS ASSET MANAGEMENT, L.P. Investment Adviser |
Visit our Web site at www.GSAMFUNDS.com to obtain the most recent month-end returns.
Goldman Sachs Asset Management, L.P. 200 West Street, New York, New York 10282
The reports concerning the Funds included in this shareholder report may contain certain forward-looking statements about the factors that may affect the performance of the Funds in the future. These statements are based on Fund management’s predictions and expectations concerning certain future events and their expected impact on the Funds, such as performance of the economy as a whole and of specific industry sectors, changes in the levels of interest rates, the impact of developing world events, and other factors that may influence the future performance of the Funds. Management believes these forward-looking statements to be reasonable, although they are inherently uncertain and difficult to predict. Actual events may cause adjustments in portfolio management strategies from those currently expected to be employed.
A description of the policies and procedures that the Funds use to determine how to vote proxies relating to portfolio securities and information regarding how a Fund voted proxies relating to portfolio securities during the most recent 12-month period ended June 30 is available (i) without charge, upon request by calling 1-800-526-7384 (for shareholders of Class A Shares or Class C Shares of a Fund) or 1-800-621-2550 (for shareholders of all other share classes of a Fund); and (ii) on the Securities and Exchange Commission (“SEC”) web site at http://www.sec.gov.
The Funds file their complete schedule of portfolio holdings with the SEC for the first and third quarters of each fiscal year on Form N-Qs. The Funds’ Form N-Qs are available on the SEC’s web site at http://www.sec.gov within 60 days after the Funds’ first and third fiscal quarters. The Funds’ Form N-Qs may be reviewed and copied at the SEC’s Public Reference Room in Washington, D.C. and information on the operation of the Public Reference Room may also be obtained by calling 1-800-SEC-0330. Form N-Qs may be obtained upon request and without charge by calling 1-800-526-7384 (for shareholders of Class A Shares or Class C Shares of a Fund) or 1-800-621-2550 (for shareholders of all other share classes of a Fund).
Goldman Sachs & Co. LLC (‘‘Goldman Sachs’’) does not provide legal, tax or accounting advice. Any statement contained in this communication (including any attachments) concerning U.S. tax matters was not intended or written to be used, and cannot be used, for the purpose of avoiding penalties under the Internal Revenue Code, and was written to support the promotion or marketing of the transaction(s) or matter(s) addressed. Clients of Goldman Sachs should obtain their own independent tax advice based on their particular circumstances.
Fund holdings and allocations shown are as of August 31, 2017 and may not be representative of future investments. Fund holdings should not be relied on in making investment decisions and should not be construed as research or investment advice regarding particular securities. Current and future holdings are subject to risk.
Goldman Sachs Investor FundsSM is a service mark of Goldman Sachs.
The portfolio risk management process includes an effort to monitor and manage risk, but does not imply low risk.
THIS MATERIAL IS FOR INFORMATIONAL PURPOSES ONLY AND IS PROVIDED SOLELY ON THE BASIS THAT IT WILL NOT CONSTITUTE INVESTMENT OR OTHER ADVICE OR A RECOMMENDATION RELATING TO ANY PERSON’S OR PLAN’S INVESTMENT OR OTHER DECISIONS, AND GOLDMAN SACHS IS NOT A FIDUCIARY OR ADVISOR WITH RESPECT TO ANY PERSON OR PLAN BY REASON OF PROVIDING THE MATERIAL OR CONTENT HEREIN INCLUDING UNDER THE EMPLOYEE RETIREMENT INCOME SECURITY ACT OF 1974 OR DEPARTMENT OF LABOR REGULATIONS. PLAN SPONSORS AND OTHER FIDUCIARIES SHOULD CONSIDER THEIR OWN CIRCUMSTANCES IN ASSESSING ANY POTENTIAL COURSE OF ACTION.
This material is not authorized for distribution to prospective investors unless preceded or accompanied by a current Prospectus or summary prospectus, if applicable. Investors should consider a Fund’s objective, risks, and charges and expenses, and read the summary prospectus, if available, and/or the Prospectus carefully before investing or sending money. The summary prospectus, if available, and the Prospectus contain this and other information about a Fund and may be obtained from your Intermediary or from Goldman Sachs by calling (Class A Shares or Class C Shares – 1-800-526-7384) (all other share classes – 1-800-621-2550).
© 2017 Goldman Sachs. All rights reserved. 107209-TMPL-10/2017-630983 IMMITEMMAR-17/2.3k
Goldman Sachs Funds

| | | | |
| | |
| Annual Report | | | | August 31, 2017 |
| | |
| | | | Strategic Factor Allocation Fund |

Goldman Sachs Strategic Factor Allocation Fund
| | | | |
| | | |
| NOT FDIC-INSURED | | May Lose Value | | No Bank Guarantee |
PORTFOLIO RESULTS
Goldman Sachs Strategic Factor Allocation Fund
Investment Objective and Principal Strategy
The Portfolio seeks long-term total return.
Portfolio Management Discussion and Analysis
Below, the Goldman Sachs Quantitative Investment Strategies Team (“QIS Team”) discusses the Goldman Sachs Strategic Factor Allocation Fund’s (the “Portfolio”) performance and positioning for the 12-month period ended August 31, 2017 (the “Reporting Period”).
| Q | | How did the Portfolio perform during the Reporting Period? |
| A | | During the Reporting Period, the Portfolio’s Institutional Shares generated an average annual total return of 6.88%. This compares to the 8.16% average annual total return of the Portfolio’s blended benchmark, the Strategic Factor Allocation Composite Index (the “Index”), which is composed 50% of the S&P 500® Index and 50% of the Bloomberg Barclays U.S. Aggregate Bond Index, during the same period. |
| | | The components of the Portfolio’s blended benchmark, the S&P 500® Index and the Bloomberg Barclays U.S. Aggregate Bond Index, generated average annual total returns of 16.23% and 0.49%, respectively, during the Reporting Period. |
| Q | | What economic and market factors most influenced the Portfolio as a whole during the Reporting Period? |
| A | | During the Reporting Period, unexpected political events in the U.S. and abroad, as well as shifting global central bank monetary policy, influenced the performance of the financial markets and the Portfolio. U.S. and international equities posted strong gains overall, while spread, or non-government bond, sectors generally produced positive, albeit more modest, returns. |
| | | When the Reporting Period began in early September 2016, U.S. and international equities alike fell as the European Central Bank (“ECB”) disappointed markets with its lack of commitment to extend quantitative easing. Later in the month, the Federal Reserve (the “Fed”) left its monetary policy unchanged, and the Bank of Japan (“BoJ”) introduced a 0% target for its 10-year government bond yield to exercise “yield curve control.” (The yield curve control framework is designed to steepen Japan’s government bond yield curve and alleviate the impact on financial institutions of low longer-term rates. Yield curve is a spectrum of maturities.) U.S. and international equities rebounded following the Fed and BoJ decisions, which the markets appeared to view as generally benign. In October 2016, a combination of hawkish Fed commentary and mounting strong U.S. economic data led to increased market pricing for a December 2016 interest rate hike. (Hawkish tends to suggest higher interest rates; opposite of dovish.) The U.S. Department of Commerce announced the U.S. Gross Domestic Product (“GDP”) increased by 3.5% on an annualized basis for the third quarter of 2016, above consensus expectations and the strongest growth rate in two years. Meanwhile, ECB minutes stressed a commitment to ongoing monthly bond-buying of 80 billion euros through at least March 2017, helping to dispel market concerns about potential tapering. The U.K.’s first official GDP growth figure since the Brexit referendum, the U.K.’s June 2016 vote to leave the European Union, was more robust than consensus expected at 0.5%. Japanese equities enjoyed strong performance owing to weakness in the Japanese yen, as BoJ governor Haruhiko Kuroda stated there was room for further easing if necessary to achieve the BoJ’s 2% inflation target. Following the unexpected results of the November 2016 U.S. elections, U.S. and international equities rallied on anticipation of a pro-growth effect of the incoming Administration’s fiscal stimulus plan, though international equities recorded a modest decline for the month overall. The Fed raised rates 25 basis points in December 2016, for the first time in a year but as had largely been anticipated, and set a more hawkish rate hike path for 2017. (A basis point is 1/100th of a percentage point.) Although U.S. equities declined modestly after the announcement, they advanced for December 2016 overall. International equities also posted solid gains during the month, which was highlighted by the resignation of Italy’s prime minister after Italian voters’ rejection of that nation’s |
1
PORTFOLIO RESULTS
| | constitutional reform referendum and the ECB’s decision to slow its monthly pace of quantitative easing while extending the program to the end of 2017. |
| | | U.S. and international equities rallied significantly in January 2017 on the prospect of U.S. deregulation following presidential executive orders on oil pipelines and on optimism around infrastructure spending after a $1 trillion proposal from Senate Democrats. Despite political uncertainty and protectionism concerns, U.S. and international equities continued to rally in February 2017 driven by “risk on” sentiment, or increased risk appetite, owing to potential U.S. tax reform and deregulation as well as by stronger economic data. In March 2017, the Fed raised interest rates for the third time since the 2007-2009 global financial crisis and maintained projections for three additional interest rate increases before the end of 2017. However, a seemingly cautious stance on the future path of monetary tightening from Fed Chair Janet Yellen and the presence of a dissenter on the Fed committee led to a dovish market reaction and the appreciation of the Japanese yen, despite the BoJ maintaining its policy rate. Meanwhile, the ECB kept monetary policy unchanged at its March 2017 meeting but revised its economic growth and inflation forecasts upward. International equity markets interpreted the positive economic assessment as hawkish, sparking concerns around the sequencing of the ECB’s policy steps — namely, whether interest rates might rise before quantitative easing ends. |
| | | U.S. equities declined in April 2017, as Fed minutes suggested stocks were overvalued, but then rebounded on strong first quarter 2017 earnings reports and receding European political risk following the French presidential election. Although the U.S. labor market remained strong, economic activity and inflation data appeared to be moderating during the second quarter of 2017. Core inflation softened to 1.7% year-over-year in May 2017, marking a third consecutive month of weakness, while core personal consumption expenditures (“PCE”) remained below the Fed’s 2% target at just 1.4% year over year (PCE measures consumer spending on goods and services within the U.S. economy). In addition, market expectations for pro-growth U.S. fiscal policy were dampened by domestic political developments. Nonetheless, the Fed proceeded to raise the targeted federal funds rate by 25 basis points in June 2017, citing ongoing strength in the labor market and a pickup in household spending and business fixed investment. The results of the Fed’s 2017 Comprehensive Capital Analysis and Review (“CCAR”) stress test for banks were encouraging, with improving payout ratios. As for international equities, the markets were buoyed during the second calendar quarter by receding political risk, as the centrist candidate defeated the nationalist candidate in the French election and successfully secured a parliamentary majority. Political risk also declined in Italy, as the anti-establishment Five Star Movement saw a setback in local elections, and expectations for parliamentary elections this year declined. However, market optimism for pro-growth U.S. fiscal policy was dampened by political developments. Strong first quarter 2017 corporate earnings results, with double-digit growth across virtually all major developed market regions, were supportive for international equity markets. In June 2017, European markets reacted hawkishly to ECB President Mario Draghi’s optimistic outlook for recovering inflation and his cautious reference to tapering of asset purchases. Japanese equities saw a temporary pull-back in June 2017, as market sentiment deteriorated and as the Japanese yen strengthened immediately after the Fed’s June rate hike. |
| | | U.S. and international equities gained in July 2017. At the beginning of the month, the Institute for Supply Management (“ISM”) reported its manufacturing index had risen to 57.8% during June 2017, the highest level in nearly three years. However, inflation dynamics remained weak. The core consumer price index (“CPI”) stayed soft in June 2017, rising 1.7% year over year and 0.1% month over month. Fed Chair Yellen’s assessment during her Congressional testimony that the federal funds rate was close to its neutral policy rate was interpreted dovishly by markets. The Fed kept its monetary policy unchanged in July 2017, as had been widely expected. The Fed’s statement included an upgrade to its assessment of job growth as well as an acknowledgment that inflation was “below” target. This compares with its prior view, which noted inflation was “somewhat below” its 2% target, a shift that resulted in a mildly dovish market reaction. The Fed also stated it expected its balance sheet normalization to begin “relatively soon.” (Balance sheet normalization refers to the steps the Fed will take to reverse quantitative easing and remove the substantial monetary accommodation it has provided to the economy since the financial crisis began in 2007.) The dovish market reaction, combined with ongoing political turmoil in Washington, D.C., added to U.S. dollar weakness. At the same time, market expectations of asset purchase tapering by the ECB continued to support the euro, despite ECB President Draghi’s cautious and mildly dovish tone at its July 2017 policy meeting. The BoJ maintained its monetary policy during the month, pushing back the |
2
PORTFOLIO RESULTS
| | timeframe for achieving its 2% inflation target from 2018 to 2019, as slow wage growth continued to cloud the inflation outlook. |
| | | U.S. and international equities were roughly flat in August 2017. U.S. economic activity continued to be strong, with several surveys on consumer sentiment and manufacturing surprising positively. This was in contrast to subdued inflation. Minutes from the Fed’s July policy meeting suggested increased concerns on inflation, highlighting that “many participants” saw “some likelihood that inflation may remain below 2 percent for longer than expected.” Hurricane Harvey caused extensive flooding and damage in Texas and Louisiana and significantly impacted refinery operations, resulting in a surge in gasoline prices. In Europe, economic growth picked up to an annualized rate of 2.1% in the second calendar quarter from 1.9% in the first calendar quarter. However, economic activity indicators appeared to be moderating, though at relatively robust levels. The Japanese yen strengthened as risk sentiment deteriorated amid escalating geopolitical tensions between the U.S. and North Korea, creating headwinds for Japanese equities. Contrary to the expectations of some market participants, the Fed’s Jackson Hole Economic Policy Symposium toward the end of August provided no indication of the monetary policy outlooks of either Fed Chair Yellen or ECB President Draghi. This buoyed Japanese equities, as did moderating geopolitical risks and encouraging U.S. economic data. |
| | | In the fixed income markets during September 2016, spread sectors outperformed U.S. Treasury securities. The Fed kept the target range for the federal funds rate unchanged at its September 2016 policy meeting after a summer of speeches by Fed officials that fluctuated between dovish and hawkish tones. The ECB also left its monetary policy unchanged during the month, while the BoJ extended its quantitative and qualitative monetary easing framework to include “yield curve control.” |
| | | In the fourth quarter of 2016, spread sectors advanced, generally outpacing U.S. Treasury securities. In early November 2016, the results of the U.S. Presidential elections led to a change in investor expectations for future monetary, fiscal and regulatory policy. More specifically, investors appeared to anticipate fiscal stimulus, a looser regulatory agenda and a faster pace of Fed monetary policy tightening. After the U.S. elections, global interest rates rose and the U.S. dollar strengthened versus other developed markets and emerging markets currencies. Meanwhile, the U.S. economy continued to strengthen, with strong jobs growth and increased consumer spending reported. In December 2016, the Fed raised the targeted federal funds rate 25 basis points to a range of between 0.50% and 0.75%. The rate hike resulted in a further rise in U.S. Treasury yields, with a notable increase in shorter-term yields, and additional appreciation in the U.S. dollar. In Europe, the ECB announced it would reduce its monthly pace of asset purchases starting in April 2017 but stated it would extend its quantitative easing program to the end of 2017. On the political front, Italy voted to reject constitutional reforms, while the outcome of Austria’s election defied the populist tide that had claimed victories in the U.K. and U.S. during 2016. Crude oil prices rose following an agreement by the Organization of the Petroleum Exporting Countries (“OPEC”) and non-OPEC producers to cut production, which provided support for energy issuers within the corporate credit market as well as for oil-exporting emerging economies. |
| | | During the first quarter of 2017, spread sectors provided mixed results versus U.S. Treasuries, but posted gains overall. Investors focused on the prospect of pro-growth policies from the new U.S. Administration, which we believe helped boost business and consumer sentiment to near record levels. Investors also evaluated the positive impact of earlier fiscal stimulus in China. Global purchasing managers’ indices pointed to solid and synchronized global expansion, led by developed markets, most notably the U.S. In Europe, economic data strengthened and political risk remained contained, as markets weathered the official start of Brexit negotiations. Monetary policy presented few surprises during the first calendar quarter, as the ECB, BoJ and Bank of England (“BoE”) kept their respective monetary policies unchanged. In March 2017, the ECB raised its economic growth and inflation forecast, while the Fed raised its target range for the federal funds rate by 25 basis points. Minutes from the meeting raised expectations that Fed balance sheet normalization would begin in 2017. Despite the Fed’s monetary policy tightening, U.S. financial conditions eased and the U.S. dollar weakened versus both developed and emerging markets currencies during the first calendar quarter. |
| | | In the second quarter of 2017, spread sectors generally recorded positive returns, though with mixed results relative to U.S. Treasuries. Political developments led to temporary bouts of volatility early in the quarter, driving weakness in Brazilian, U.S. and U.K. fixed income assets as well as a credit rating downgrade of South Africa’s sovereign debt. Political risks receded in May 2017 on the centrist |
3
PORTFOLIO RESULTS
| | candidate’s victory in the French presidential election, which was supportive of French and European peripheral bonds broadly. On the economic front, U.S. core inflation weakened for the third consecutive month in May 2017, casting uncertainty over the pace of Fed monetary tightening. Nonetheless, comments included in minutes from the Fed’s May and June 2017 policy meetings suggested an announcement about how and when the Fed would begin reducing the size of its balance sheet would be made sooner than the markets had previously anticipated. In Europe, economic data continued to surprise to the upside. At its June 2017 policy meeting, the ECB provided an optimistic assessment of the risks to growth, but revised downward its medium-term inflation forecasts. The ECB, BoJ and BoE left their respective monetary policies unchanged during the second calendar quarter, while the Fed raised interest rates for the second time in 2017 and the fourth time in a decade at its June 2017 policy meeting. As the quarter came to an end, a string of comments from global central bankers triggered a hawkish market reaction. Global interest rates rose as the market anticipated a faster than consensus expected pace of monetary policy tightening by the BoE, ECB and Bank of Canada. During the second quarter of 2017, the U.S. dollar continued to weaken versus many global currencies. |
| | | In July 2017, spread sectors broadly advanced, outperforming U.S. Treasury securities. The Fed kept its monetary policy unchanged, though policymakers noted that balance sheet normalization would begin “relatively soon.” U.S. financial conditions continued to ease despite previous Fed rate hikes, while European financial conditions tightened on raised expectations for the potential withdrawal of the ECB’s accommodative monetary policy. In the U.S., second quarter 2017 GDP increased at an annualized rate of 2.6%, contrasting with inflation, which was subdued. In Europe, economic data continued to strengthen, but inflation remained below the ECB’s target and forecast. The U.S. dollar weakened relative to many global currencies. |
| | | During August 2017, spread sectors generally lagged U.S. Treasuries due to bouts of “risk off” sentiment, or increased risk aversion, amid rising geopolitical risks. In the U.S., limited progress on the Administration’s pro-growth fiscal policy measures, concerns about September 2017 debt limit and spending bill deadlines, and geopolitical uncertainty pushed down U.S. government bond yields. Second quarter 2017 U.S. GDP was revised up to an annualized rate 3.0%, and the ISM manufacturing index rose to a six-year high in August 2017. In Europe, economic data was generally positive, driving appreciation of the euro against the U.S. dollar. In Japan, second quarter 2017 GDP was revised down sharply from a preliminary annualized reading of 4% to 2.8%. |
| Q | | What were the primary contributors to and detractors from the Portfolio’s performance during the Reporting Period? |
| A | | The Portfolio seeks to achieve its investment objective through the implementation of the Goldman Sachs Strategic Factor Allocation process (“Strategic Allocation”), which is derived from the Goldman Sachs Investment Strategy Group’s (“ISG”) market views on a variety of asset classes and instruments. The Strategic Allocation was developed to provide exposure to “factors,” which are academically derived drivers of investment returns that the Goldman Sachs ISG believes offer the potential for greater and more consistent returns in various market environments. These factors include, but are not limited to, Equity, Term, Flow and Volatility. The Equity factor seeks to capture the premium associated with equity risk. The Term factor seeks to capture the premium associated with interest rate and inflation risk. The Flow factor seeks to systematically capitalize on flows within and across asset classes. The Volatility factor seeks to capture the “fear premium” associated with equity risk. (The fear premium is the amount investors tend to overpay to preserve capital during periods of financial market volatility.) The QIS Team implements the Strategic Allocation by investing primarily in derivatives; pooled investment vehicles, such as exchange-traded funds (“ETFs”), exchange-traded notes (“ETNs”) and underlying funds; and equities, fixed income and currencies. |
| | | During the Reporting Period, the Strategic Allocation overall detracted from the Portfolio’s performance relative to the Index. The Flow factor hurt the Portfolio’s results, while the Equity, Volatility and Term factors contributed positively. |
| | | In terms of underlying asset classes and instruments, the Portfolio’s positions in developed markets currencies, accomplished through foreign currency exchange forward contracts, detracted overall from performance. More specifically, the Portfolio was hurt by its positions in the New Zealand dollar, Australian dollar, Japanese yen and British pound. It benefited from its positions in the Canadian dollar and Swiss franc. The impact of the Portfolio’s position in the euro did not have a meaningful impact on results. Allocations to listed U.S. equity index options and U.S. bond futures added to performance. In addition, an allocation to U.S. equities contributed positively. |
4
PORTFOLIO RESULTS
| Q | | How was the Portfolio positioned at the beginning of the Reporting Period? |
| A | | In terms of its Strategic Allocation at the start of the Reporting Period, the Portfolio had relatively equal weightings in the Equity, Flow and Volatility factors. It had a relatively smaller weighting in the Term factor. |
| | | In terms of underlying asset classes and instruments, the Portfolio maintained positions in U.S. equities, listed U.S. equity index options and U.S. fixed income. In terms of currencies, it held long positions versus the U.S. dollar in the Canadian dollar and the British pound. It held short positions versus the U.S. dollar in the Japanese yen and the Swiss franc. |
| Q | | How did the Portfolio use derivatives and similar instruments during the Reporting Period? |
| A | | The Portfolio uses derivatives for both hedging and non-hedging purposes in the implementation of the Strategic Allocation. During the Reporting Period, the Portfolio employed listed equity index options to implement views on the U.S. equity market, which added to performance. It used bond futures to express views on the U.S. fixed income market. The bond futures position also contributed positively to performance. In addition, the Portfolio utilized foreign currency exchange forward contracts to take long and short positions in select developed markets currencies. Foreign currency exchange forward contracts had a slightly negative impact on the Portfolio’s results during the Reporting Period. |
| Q | | How was the Portfolio positioned at the end of the Reporting Period? |
| A | | In terms of its Strategic Allocation at the end of the Reporting Period, the Portfolio maintained equal weightings in the Equity, Flow and Volatility factors. It continued to have a relatively smaller weighting in the Term factor. |
| | | In terms of underlying asset classes and instruments, the Portfolio maintained positions in U.S. equities, listed U.S. equity index options and U.S. fixed income. In terms of currencies, it held long positions versus the U.S. dollar in the Canadian dollar, British pound and Japanese yen. It held short positions versus the U.S. dollar in the Swiss franc, euro and New Zealand dollar. |
| Q | | Were there any changes to the Portfolio’s portfolio management team during the Reporting Period? |
| A | | Effective July 14, 2017, Alex Chung no longer served as a portfolio manager for the Portfolio. At the same time, Christian Morgenstern became a lead portfolio manager of the Portfolio, joining Amna Qaiser. By design, all investment decisions for the Portfolio are performed within a co-lead or team structure, with multiple subject matter experts. This strategic decision making has been the cornerstone of our approach and ensures continuity in the Portfolio. |
| Q | | What was the Portfolio’s strategy at the end of the Reporting Period? |
| A | | Going forward, the QIS Team plans to continue implementing the Goldman Sachs Strategic Factor Allocation process as it seeks long-term total return. |
5
FUND BASICS
Strategic Factor Allocation Fund
as of August 31, 2017
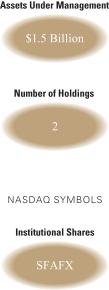
| | | | | | | | | | | | | | | | | | |
| | PERFORMANCE REVIEW | |
| | | September 1, 2016–
August 31, 2017 | | Portfolio Total
Return
(based on NAV)1 | | | Strategic Factor
Allocation Composite
Index2 | | | S&P 500®
Index3 | | | Bloomberg Barclays U.S.
Aggregate Bond
Index4 | |
| | | Institutional | | | 6.88 | % | | | 8.16 | % | | | 16.23 | % | | | 0.49 | % |
| | 1 | | The net asset value (“NAV”) represents the net assets of the class of the Portfolio (ex-dividend) divided by the total number of shares of the class outstanding. The Portfolio’s performance assumes the reinvestment of dividends and other distributions. The Portfolio’s performance does not reflect the deduction of any applicable sales charges. |
| | 2 | | The Strategic Factor Composite Index is a blend of 50% the S&P 500® Index and 50% the Bloomberg Barclays U.S. Aggregate Bond Index. It is not possible to invest in an unmanaged index. |
| | 3 | | The S&P 500® Index is the Standard & Poor’s Composite Index of 500 stocks, an unmanaged index of common stock prices. The index figure do not reflect any deduction for fees, expenses or taxes. It is not possible to invest directly in an index. |
| | 4 | | The Bloomberg Barclays U.S. Aggregate Bond Index represents an unmanaged diversified portfolio of fixed income securities, including U.S. Treasuries, investment-grade corporate bonds and mortgage-backed and asset-backed securities. The index figure does not reflect any deduction for fees, expenses or taxes. It is not possible to invest directly in an index. |
| | | | | | | | | | | | |
| | STANDARDIZED TOTAL RETURNS5 |
| | | For the period ended 6/30/17 | | One Year | | | Since Inception | | | Inception Date |
| | | Institutional | | | 6.98 | % | | | 8.18 | % | | 5/31/16 |
| | 5 | | The Standardized Total Returns are average annual total returns or cumulative total returns (only if the performance period is one year or less) as of the most recent calendar quarter-end. They assume reinvestment of all distributions at NAV. Because Institutional Shares do not involve a sales charge, such a charge is not applied to their Standardized Total Returns. |
The returns set forth in the tables above represent past performance. Past performance does not guarantee future results. The Portfolio’s investment return and principal value will fluctuate so that an investor’s shares, when redeemed, may be worth more or less than their original cost. Current performance may be lower or higher than the performance quoted above. Please visit our web site at www.GSAMFUNDS.com to obtain the most recent month-end returns. Performance reflects applicable fee waivers and/or expense limitations in effect during the periods shown. In their absence, performance would be reduced. Returns do not reflect the deduction of taxes that a shareholder would pay on Portfolio distributions or the redemption of Portfolio shares.
6
FUND BASICS
| | | | | | | | | | |
| | EXPENSE RATIOS6 | |
| | | | | Net Expense Ratio (Current) | | | Gross Expense Ratio (Before Waivers) | |
| | | Institutional | | | 0.95 | % | | | 1.21 | % |
| | 6The | | expense ratios of the Portfolio, both current (net of applicable fee waivers and/or expense limitations) and before waivers (gross of applicable fee waivers and/or expense limitations) are as set forth above according to the most recent publicly available Prospectus for the Portfolio and may differ from the expense ratios disclosed in the Financial Highlights in this report. Pursuant to a contractual arrangement, the Portfolio’s waivers and/or expense limitations will remain in place through at least December 29, 2017, and prior to such date the Investment Adviser may not terminate the arrangements without the approval of the Portfolio’s Board of Trustees. If these arrangements are discontinued in the future, the expense ratios may change without shareholder approval. |
| | | | | | | | | | |
| | HOLDINGS AS OF 8/31/177 | |
| | | Holding | | % of Net Assets | | | Line of Business | |
| | Goldman Sachs Financial Square | | | 52.3 | % | | | Investment Companies | |
| | Government Fund – Institutional Shares | | | | | | | | |
| | | SPDR S&P 500® ETF Trust | | | 29.7 | | | | Exchange Traded Funds | |
| | 7The | | holdings may not be representative of the Portfolio’s future investments. Figures in the table above may not sum to 100% due to the exclusion of other assets and liabilities. |
7
GOLDMAN SACHS STRATEGIC FACTOR ALLOCATION FUND
Performance Summary
August 31, 2017
The following graph shows the value, as of August 31, 2017, of a $1,000,000 investment made on May 31, 2016 (commencement of operations) in Institutional Shares at NAV. For comparative purposes, the performance of the Portfolio’s benchmark, the Strategic Factor Allocation Composite Index (the “Index”), which is composed 50% of the S&P 500® Index and 50% of the Bloomberg Barclays U.S. Aggregate Bond Index is shown. This performance data represents past performance and should not be considered indicative of future performance, which will fluctuate with changes in market conditions. These performance fluctuations will cause an investor’s shares, when redeemed, to be worth more or less than their original cost. Performance reflects applicable fee waivers and/or expense limitations in effect during the periods shown and in their absence, performance would be reduced. Returns do not reflect the deduction of taxes that a shareholder would pay on Portfolio distributions or the redemption of Portfolio shares. In addition to the Investment Adviser’s decisions regarding issuer/industry investment selection and allocation, other factors may affect Portfolio performance. These factors include, but are not limited to, Portfolio operating fees and expenses, portfolio turnover and subscription and redemption cash flows affecting the Portfolio.
|
| Strategic Factor Allocation Fund Lifetime Performance |
Performance of a $1,000,000 Investment, including any applicable sales charges, with distributions reinvested, from May 31, 2016 through August 31, 2017.
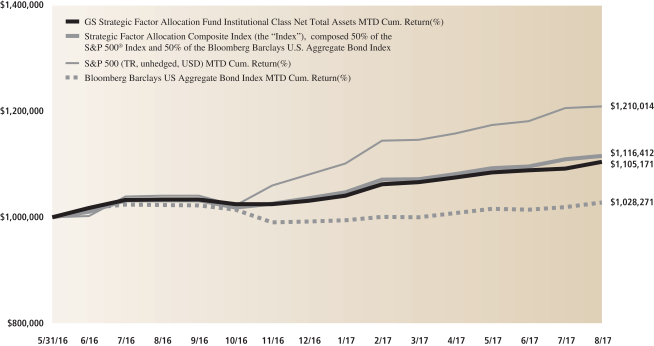
| | | | | | |
| Average Annual Total Return through August 31, 2017 | | | One Year | | | Since Inception |
Institutional Shares (Commenced May 31, 2016) | | | 6.88% | | | 8.30% |
|
8
GOLDMAN SACHS STRATEGIC FACTOR ALLOCATION FUND
Schedule of Investments
August 31, 2017
| | | | | | | | |
| Shares | | | Description | | Value | |
| Exchange Traded Fund – 29.7% | | | |
| | 1,752,400 | | | SPDR S&P 500 ETF Trust
(Cost $409,443,175) | | $ | 433,701,476 | |
| | |
| | | | | | | | |
| Shares | | Distribution Rate | | | Value | |
| Investment Company(a) – 52.3% | | | | |
| Goldman Sachs Financial Square Government Fund – Institutional Shares | |
| 762,872,567 | | | 0.927 | % | | $ | 762,872,567 | |
| (Cost $762,872,567) | | | | | | | | |
| |
| TOTAL INVESTMENTS – 82.0% | | | | | |
| (Cost $1,172,315,742) | | | $ | 1,196,574,043 | |
| |
OTHER ASSETS IN EXCESS OF
LIABILITIES – 18.0% | | | | 262,659,594 | |
| |
| NET ASSETS – 100.0% | | | $ | 1,459,233,637 | |
| |
| | |
| The percentage shown for each investment category reflects the value of investments in that category as a percentage of net assets. |
(a) | | Represents an Affiliated fund. |
| | |
|
Curreny Legend |
AUD | | —Australian Dollar |
CAD | | —Canadian Dollar |
CHF | | —Swiss Franc |
EUR | | —Euro |
GBP | | —British Pound |
JPY | | —Japanese Yen |
NZD | | —New Zealand Dollar |
USD | | —United States Dollar |
|
Investment Abbreviations: |
ETF | | —Exchange Traded Fund |
PLC | | —Public Limited Company |
|
|
| ADDITIONAL INVESTMENT INFORMATION |
FORWARD FOREIGN CURRENCY EXCHANGE CONTRACTS — At August 31, 2017, the Portfolio had the following forward foreign currency exchange contracts:
FORWARD FOREIGN CURRENCY EXCHANGE CONTRACTS WITH UNREALIZED GAIN
| | | | | | | | | | | | | | | | | | | | | | | | | | | | |
| Counterparty | | Currency
Purchased | | | Currency
Sold | | | Current
Value | | | Settlement
Date | | | Unrealized
Gain | |
Morgan Stanley & Co. International PLC | | | AUD | | | | 107,270,000 | | | | USD | | | | 85,202,255 | | | $ | 85,248,524 | | | | 09/25/17 | | | $ | 46,269 | |
| | | CAD | | | | 33,170,000 | | | | USD | | | | 26,527,189 | | | | 26,569,547 | | | | 09/25/17 | | | | 42,358 | |
| | | CHF | | | | 37,470,000 | | | | USD | | | | 39,089,824 | | | | 39,139,042 | | | | 09/25/17 | | | | 49,218 | |
| | | | GBP | | | | 36,840,000 | | | | USD | | | | 47,524,318 | | | | 47,679,564 | | | | 09/25/17 | | | | 155,246 | |
| TOTAL | | | | | | | | | | | | | | | | | | | | | | | | | | $ | 293,091 | |
FORWARD FOREIGN CURRENCY EXCHANGE CONTRACTS WITH UNREALIZED LOSS
| | | | | | | | | | | | | | | | | | | | | | | | | | | | |
| Counterparty | | Currency
Purchased | | | Currency
Sold | | | Current
Value | | | Settlement
Date | | | Unrealized
Loss | |
Morgan Stanley & Co. International PLC | | | USD | | | | 82,561,075 | | | | CHF | | | | 79,450,000 | | | $ | 82,988,975 | | | | 09/25/17 | | | $ | (427,900 | ) |
| | | JPY | | | | 5,453,970,000 | | | | USD | | | | 50,210,787 | | | | 49,669,181 | | | | 09/25/17 | | | | (541,606 | ) |
| | | USD | | | | 43,744,033 | | | | EUR | | | | 36,740,000 | | | | 43,796,201 | | | | 09/25/17 | | | | (52,168 | ) |
| | | USD | | | | 21,326,093 | | | | GBP | | | | 16,500,000 | | | | 21,354,854 | | | | 09/25/17 | | | | (28,761 | ) |
| | | USD | | | | 23,262,994 | | | | JPY | | | | 2,558,180,000 | | | | 23,297,287 | | | | 09/25/17 | | | | (34,293 | ) |
| | | USD | | | | 43,654,447 | | | | NZD | | | | 60,850,000 | | | | 43,669,917 | | | | 09/25/17 | | | | (15,470 | ) |
| | | | USD | | | | 85,184,445 | | | | AUD | | | | 107,270,000 | | | | 85,248,523 | | | | 09/25/17 | | | | (64,078 | ) |
| TOTAL | | | | | | | | | | | | | | | | | | | | | | | | | | $ | (1,164,276 | ) |
| | |
| The accompanying notes are an integral part of these financial statements. | | 9 |
GOLDMAN SACHS STRATEGIC FACTOR ALLOCATION FUND
|
| ADDITIONAL INVESTMENT INFORMATION (continued) |
FUTURES CONTRACTS — At August 31, 2017, the Portfolio had the following futures contracts:
| | | | | | | | | | | | | | |
| Description | | Number of
Contracts | | Expiration
Date | | | Notional
Amount | | | Unrealized
Appreciation/ (Depreciation) | |
Long position contracts: | | | | | | | | | | |
20 Year U.S. Treasury Bonds | | 2,587 | | | 12/19/17 | | | $ | 403,814,531 | | | $ | 2,218,234 | |
WRITTEN OPTIONS CONTRACTS — At August 31, 2017, the Portfolio had the following written options:
OPTIONS ON EQUITIES CONTRACTS
| | | | | | | | | | | | | | | | | | | | | | | | | | | | | | |
| Description | | Counterparty | | Exercise Price | | | Expiration
Date | | | Number of
Contracts | | | Notional
Amount | | | Market
Value | | | Premiums Paid
(Received) by Portfolio | | | Unrealized
Appreciation/
(Depreciation) | |
Written option contracts: | | | | | | | | | | | | | | | | | |
Puts | | | | | | | | | | | | | | | | | | | | | | | | | | | | | | |
S&P 500 Index | | Morgan Stanley &
Co. International
PLC | | | 2,360.00 USD | | | | 10/20/17 | | | | (2,550,482) | | | | (112,400 | ) | | | (1,320,700 | ) | | | (1,277,426 | ) | | $ | (43,274 | ) |
S&P 500 Index | | Morgan Stanley &
Co. International
PLC | | | 2,395.00 USD | | | | 10/20/17 | | | | (267,728) | | | | (222,600 | ) | | | (3,568,278 | ) | | | (3,446,961 | ) | | | (121,317 | ) |
S&P 500 Index | | Morgan Stanley &
Co. International
PLC | | | 2,395.00 USD | | | | 09/15/17 | | | | (2,479,555) | | | | (110,200 | ) | | | (292,030 | ) | | | (1,212,125 | ) | | | 920,095 | |
| Total written option contracts | | | | | | | | (5,297,765) | | | | | | | | (5,181,008 | ) | | | (5,936,512 | ) | | $ | 755,504 | |
| | |
| 10 | | The accompanying notes are an integral part of these financial statements. |
GOLDMAN SACHS STRATEGIC FACTOR ALLOCATION FUND
Statement of Assets and Liabilities
August 31, 2017
| | | | | | |
| | | | | | |
| | Assets: | |
| | Investments of unaffiliated issuers, at value (cost $409,443,175) | | $ | 433,701,476 | |
| | Investments of affiliated issuers, at value (cost $762,872,567) | | | 762,872,567 | |
| | Cash | | | 259,391,345 | |
| | Unrealized gain on forward foreign currency exchange contracts | | | 293,091 | |
| | Variation margin on certain derivative contracts | | | 1,829,669 | |
| | Receivables: | | | | |
| | Collateral on certain derivative contracts(a) | | | 151,473,844 | |
| | Investments sold | | | 66,766,045 | |
| | Portfolio shares sold | | | 22,223,407 | |
| | Dividends and interest | | | 655,478 | |
| | Other assets | | | 1,274 | |
| | Total assets | | | 1,699,208,196 | |
| | | | | | |
| | Liabilities: | |
| | Written option contracts, at value (premium received $5,936,512) | | | 5,181,008 | |
| | Unrealized loss on forward foreign currency exchange contracts | | | 1,164,276 | |
| | Payables: | | | | |
| | Investments purchased | | | 232,448,689 | |
| | Management fees | | | 753,613 | |
| | Portfolio shares redeemed | | | 282,251 | |
| | Transfer Agency fees | | | 46,366 | |
| | Accrued expenses | | | 98,356 | |
| | Total liabilities | | | 239,974,559 | |
| | | | | | |
| | Net Assets: | | | | |
| | Paid-in capital | | | 1,399,707,656 | |
| | Distributions in excess of net investment income | | | 871,185 | |
| | Accumulated net realized gain | | | 32,293,942 | |
| | Net unrealized gain | | | 26,360,854 | |
| | NET ASSETS | | $ | 1,459,233,637 | |
| | Shares Outstanding $0.001 par value (unlimited number of shares authorized): | | | 133,160,218 | |
| | Net asset value, offering and redemption price per share: | | | $10.96 | |
| | (a) | | Includes amounts segregated for initial margin requirements and/or collateral on, (i) futures, (ii) options and (iii) forward foreign currency exchange contract transactions of $8,537,100, $137,126,744 and $5,810,000, respectively. |
| | |
| The accompanying notes are an integral part of these financial statements. | | 11 |
GOLDMAN SACHS STRATEGIC FACTOR ALLOCATION FUND
Statement of Operations
For the Fiscal Year Ended August 31, 2017
| | | | | | |
| | | | | | |
| | Investment income: | | | | |
| | Dividends — unaffiliated issuers | | $ | 2,865,962 | |
| | Dividends — affiliated issuers | | | 2,952,734 | |
| | Interest | | | 22,669 | |
| | Total investment income | | | 5,841,365 | |
| | | | | | |
| | Expenses: | |
| | Management fees | | | 5,761,366 | |
| | Transfer Agency fees | | | 307,273 | |
| | Custody, accounting and administrative services | | | 94,184 | |
| | Professional fees | | | 86,259 | |
| | Registration fees | | | 79,369 | |
| | Amortization of offering costs | | | 78,399 | |
| | Printing and mailing costs | | | 32,955 | |
| | Trustee fees | | | 19,438 | |
| | Prime Broker Fees | | | 9,374 | |
| | Other | | | 12,310 | |
| | Total expenses | | | 6,480,927 | |
| | Less — expense reductions | | | (746,761 | ) |
| | Net expenses | | | 5,734,166 | |
| | NET INVESTMENT INCOME | | | 107,199 | |
| | | | | | |
| | Realized and unrealized gain (loss): | | | | |
| | Net realized gain (loss) from: | | | | |
| | Investments — unaffiliated issuers | | | (295,719 | ) |
| | Futures contracts | | | 9,060,262 | |
| | Written options | | | 32,054,358 | |
| | Forward foreign currency exchange contracts | | | (7,813,258 | ) |
| | Foreign currency transactions | | | 2,107,181 | |
| | Net change in unrealized gain (loss) on: | | | | |
| | Investments — unaffiliated issuers | | | 23,070,900 | |
| | Futures contracts | | | 2,187,524 | |
| | Written options | | | 755,504 | |
| | Forward foreign currency exchange contracts | | | (1,601,429 | ) |
| | Net realized and unrealized gain | | | 59,525,323 | |
| | NET INCREASE IN NET ASSETS RESULTING FROM OPERATIONS | | $ | 59,632,522 | |
| | |
| 12 | | The accompanying notes are an integral part of these financial statements. |
GOLDMAN SACHS STRATEGIC FACTOR ALLOCATION FUND
Statements of Changes in Net Assets
| | | | | | | | | | |
| | | | | For the Fiscal
Year Ended
August 31, 2017 | | | For the
Period Ended
August 31, 2016(a) | |
| | From operations: | |
| | Net investment income (loss) | | $ | 107,199 | | | $ | (237,259 | ) |
| | Net realized gain | | | 35,112,824 | | | | 2,566,252 | |
| | Net change in unrealized gain | | | 24,412,499 | | | | 1,948,355 | |
| | Net increase in net assets resulting from operations | | | 59,632,522 | | | | 4,277,348 | |
| | | | | | | | | | |
| | Distributions to shareholders: | | | | | | | | |
| | From net investment income | | | (120,094 | ) | | | — | |
| | From net realized gains | | | (4,375,157 | ) | | | — | |
| | Total distributions to shareholders | | | (4,495,251 | ) | | | — | |
| | | | | | | | | | |
| | From share transactions: | | | | | | | | |
| | Proceeds from sales of shares | | | 1,117,562,980 | | | | 337,652,314 | |
| | Reinvestment of distributions | | | 4,495,251 | | | | — | |
| | Cost of shares redeemed | | | (56,553,609 | ) | | | (3,337,918 | ) |
| | Net increase in net assets resulting from share transactions | | | 1,065,504,622 | | | | 334,314,396 | |
| | TOTAL INCREASE | | | 1,120,641,893 | | | | 338,591,744 | |
| | | | | | | | | | |
| | Net assets: | | | | | | | | |
| | Beginning of year | | | 338,591,744 | | | | — | |
| | End of year | | $ | 1,459,233,637 | | | $ | 338,591,744 | |
| | Distributions in excess of net investment income/(loss) | | $ | 871,185 | | | $ | (615,459 | ) |
| | (a) | | The Portfolio commenced operations on May 31, 2016. |
| | |
| The accompanying notes are an integral part of these financial statements. | | 13 |
GOLDMAN SACHS STRATEGIC FACTOR ALLOCATION FUND
Financial Highlights
Selected Data for a Share Outstanding Throughout Each Year
| | | | | | | | | | | | | | | | | | | | | | | | | | | | | | |
| | | | | | | | Income (loss) from
Investment operations | | | Distributions
to shareholders | |
| | | Year - Share Class | |
Net asset
value,
beginning
of year | | | Net
investment
income (loss)(a) | | | Net realized
and unrealized
gain | | | Total from
investment
operations | | | From net
investment
income | | | From net
realized
gains | | | Total
distributions | |
| | FOR THE FISCAL YEARS ENDED AUGUST 31, | |
| | 2017 - Institutional Shares | | $ | 10.34 | | | $ | — | (d) | | $ | 0.70 | | | $ | 0.70 | | | $ | — | (d) | | $ | (0.08 | ) | | $ | (0.08 | ) |
| | | | | | | | | | | | | | | | | | | | | | | | | | | | | | |
| | FOR THE PERIOD ENDED AUGUST 31, | |
| | 2016 - Institutional Shares (Commenced May 31, 2016) | | | 10.00 | | | | (0.01 | ) | | | 0.35 | | | | 0.34 | | | | — | | | | — | | | | — | |
| | (a) | | Calculated based on the average shares outstanding methodology. |
| | (b) | | Assumes investment at the NAV at the beginning of the period, reinvestment of all dividends and distributions, a complete redemption of the investment at the NAV at the end of the period and no sales or redemption charges. Total returns would be reduced if a sales or redemption charge was taken into account. Returns do not reflect the impact of taxes to shareholders relating to Portfolio distributions or the redemption of Portfolio shares. Total returns for periods less than one full year are not annualized. |
| | (c) | | The Portfolio’s portfolio turnover rate is calculated in accordance with regulatory requirements, without regard to transactions involving short term investments and certain derivatives. If such transactions were included, the Portfolio’s portfolio turnover rate may be higher. |
| | (d) | | Amount is less than $0.005 per share. |
| | |
| 14 | | The accompanying notes are an integral part of these financial statements. |
GOLDMAN SACHS STRATEGIC FACTOR ALLOCATION FUND
| | | | | | | | | | | | | | | | | | | | | | | | | | | | | | | | | | | | | | | | |
| | | | | | | | | | | | | | | | | | | | | | | | | | | | | | | | | | |
| | | Net asset
value, end
of year | | | | | Total
return(b) | | | | | Net assets,
end of
year
(in 000s) | | | | | Ratio of
net expenses
to average
net assets | | | | | Ratio of
total expenses
to average
net assets | | | | | Ratio of
net investment
income (loss)
to average
net assets | | | | | Portfolio
turnover
rate(c) | |
| | | | | | | | | | | | | | | | | | | | | | | | | | | | | | | | | | | | | | | | |
| | $ | 10.96 | | | | | | 6.88 | % | | | | $ | 1,459,234 | | | | | | 0.74 | % | | | | | 0.84 | % | | | | | 0.01 | % | | | | | 589 | % |
| | | | | | | | | | | | | | | | | | | | | | | | | | | | | | | | | | | | | | | | |
| | | | | | | | | | | | | | | | | | | | | | | | | | | | | | | | | | | | | | | | |
| | | 10.34 | | | | | | 3.40 | | | | | | 338,592 | | | | | | 0.87 | (e) | | | | | 1.07 | (e) | | | | | 0.51 | (e) | | | | | 86 | |
| | |
| The accompanying notes are an integral part of these financial statements. | | 15 |
GOLDMAN SACHS STRATEGIC FACTOR ALLOCATION FUND
Notes to Financial Statements
August 31, 2017
Goldman Sachs Trust (the “Trust”) is a Delaware statutory trust registered under the Investment Company Act of 1940, as amended (the “Act”), as an open-end management investment company. Goldman Sachs Strategic Factor Allocation Fund (the “Portfolio”) is a non-diversified portfolio and currently offers one class of shares — Institutional Shares. Goldman Sachs Asset Management, L.P. (“GSAM”), an affiliate of Goldman Sachs & Co. LLC (formerly, Goldman, Sachs & Co.) (“Goldman Sachs”), serves as investment adviser to the Portfolio pursuant to a management agreement (the “Agreement”) with the Trust.
|
| 2. SIGNIFICANT ACCOUNTING POLICIES |
The financial statements have been prepared in accordance with accounting principles generally accepted in the United States of America (“GAAP”) and require management to make estimates and assumptions that may affect the reported amounts and disclosures. Actual results may differ from those estimates and assumptions.
A. Investment Valuation — The Portfolio’s valuation policy is to value investments at fair value.
B. Investment Income and Investments — Investment income includes interest income, dividend income, and securities lending income. Interest income is accrued daily and adjusted for amortization of premiums and accretion of discounts. Dividend income is recognized on ex-dividend date or, for certain foreign securities, as soon as such information is obtained subsequent to the ex-dividend date. Investment transactions are reflected on trade date. Realized gains and losses are calculated using identified cost. Investment transactions are recorded on the following business day for daily net asset value (“NAV”) calculations. Investment income is recorded net of any foreign withholding taxes, less any amounts reclaimable. The Portfolio may file withholding tax reclaims in certain jurisdictions to recover a portion of amounts previously withheld. Any foreign capital gains tax is accrued daily based upon net unrealized gains, and is payable upon sale of such investments. For derivative contracts, realized gains and losses are recorded upon settlement of the contract.
C. Expenses — Expenses incurred directly by the Portfolio are charged to the Portfolio, and certain expenses incurred by the Trust that may not solely relate to the Portfolio are allocated to the Portfolio and the other applicable funds of the Trust on a straight-line and/or pro-rata basis, depending upon the nature of the expenses, and are accrued daily.
D. Offering Costs — Offering costs paid in connection with the offering of shares were amortized on a straight-line basis over 12 months from the date of commencement of operations.
E. Federal Taxes and Distributions to Shareholders — It is the Portfolio’s policy to comply with the requirements of the Internal Revenue Code of 1986, as amended (the “Code”), applicable to regulated investment companies (mutual funds) and to distribute each year substantially all of its investment company taxable income and capital gains to its shareholders. Accordingly, the Portfolio is not required to make any provisions for the payment of federal income tax. Distributions to shareholders are recorded on the ex-dividend date. Income and capital gains distributions, if any, are declared and paid annually.
Net capital losses, if any, are carried forward to future fiscal years and may be used to the extent allowed by the Code to offset any future capital gains. Losses that are carried forward will retain their character as either short-term or long-term capital losses. Utilization of capital loss carryforwards will reduce the requirement of future capital gains distributions.
The characterization of distributions to shareholders for financial reporting purposes is determined in accordance with federal income tax rules, which may differ from GAAP. The source of the Portfolio’s distributions may be shown in the accompanying financial statements as either from net investment income, net realized gain or capital. Certain components of the Portfolio’s net assets on the Statement of Assets and Liabilities reflect permanent GAAP/tax differences based on the appropriate tax character.
F. Foreign Currency Translation — The accounting records and reporting currency of the Portfolio are maintained in U.S. dollars. Assets and liabilities denominated in foreign currencies are translated into U.S. dollars using the current exchange rates at the close of each business day. The effect of changes in foreign currency exchange rates on investments is included within net realized and unrealized gain (loss) on investments. Changes in the value of other assets and liabilities as a result of fluctuations in foreign exchange rates are included in the Statement of Operations within net change in unrealized gain (loss) on foreign currency translations. Transactions denominated in foreign currencies are translated into U.S. dollars on the date the transaction occurred, the effects of which are included within net realized gain (loss) on foreign currency transactions.
16
GOLDMAN SACHS STRATEGIC FACTOR ALLOCATION FUND
|
| 3. INVESTMENTS AND FAIR VALUE MEASUREMENTS |
U.S. GAAP defines the fair value of a financial instrument as the amount that would be received to sell an asset or paid to transfer a liability in an orderly transaction between market participants at the measurement date (i.e., the exit price); the Portfolio’s policy is to use the market approach. GAAP establishes a fair value hierarchy that prioritizes the inputs to valuation techniques used to measure fair value. The hierarchy gives the highest priority to unadjusted quoted prices in active markets for identical assets or liabilities (Level 1 measurements) and the lowest priority to unobservable inputs (Level 3 measurements). The levels used for classifying investments are not necessarily an indication of the risk associated with investing in these investments. The three levels of the fair value hierarchy are described below:
Level 1 — Unadjusted quoted prices in active markets that are accessible at the measurement date for identical, unrestricted assets or liabilities;
Level 2 — Quoted prices in markets that are not active or financial instruments for which significant inputs are observable (including, but not limited to, quoted prices for similar investments, interest rates, foreign exchange rates, volatility and credit spreads), either directly or indirectly;
Level 3 — Prices or valuations that require significant unobservable inputs (including GSAM’s assumptions in determining fair value measurement).
Changes in valuation techniques may result in transfers into or out of an assigned level within the hierarchy. In accordance with the Portfolio’s policy, transfers between different levels of the fair value hierarchy resulting from such changes are deemed to have occurred as of the beginning of the reporting period.
The Board of Trustees (“Trustees”) has approved Valuation Procedures that govern the valuation of the portfolio investments held by the Portfolio, including investments for which market quotations are not readily available. The Trustees have delegated to GSAM day-to-day responsibility for implementing and maintaining internal controls and procedures related to the valuation of the Portfolio’s investments. To assess the continuing appropriateness of pricing sources and methodologies, GSAM regularly performs price verification procedures and issues challenges as necessary to third party pricing vendors or brokers, and any differences are reviewed in accordance with the Valuation Procedures.
A. Level 1 and Level 2 Fair Value Investments — The valuation techniques and significant inputs used in determining the fair values for investments classified as Level 1 and Level 2 are as follows:
Equity Securities — Equity securities traded on a United States (“U.S.”) securities exchange or the NASDAQ system, or those located on certain foreign exchanges, including but not limited to the Americas, are valued daily at their last sale price or official closing price on the principal exchange or system on which they are traded. If there is no sale or official closing price or such price is believed by GSAM to not represent fair value, equity securities are valued at the last bid price for long positions and at the last ask price for short positions. To the extent these investments are actively traded, they are classified as Level 1 of the fair value hierarchy, otherwise they are generally classified as Level 2.
Unlisted equity securities for which market quotations are available are valued at the last sale price on the valuation date, or if no sale occurs, at the last bid price. Securities traded on certain foreign securities exchanges are valued daily at fair value determined by an independent fair value service (if available) under Valuation Procedures approved by the Trustees and consistent with applicable regulatory guidance. The independent fair value service takes into account multiple factors including, but not limited to, movements in the securities markets, certain depositary receipts, futures contracts and foreign currency exchange rates that have occurred subsequent to the close of the foreign securities exchange. These investments are generally classified as Level 2 of the fair value hierarchy.
Underlying Funds (including Money Market Funds) — Underlying Funds (“Underlying Funds”) include other investment companies and exchange-traded funds (“ETFs”). Investments in the Underlying Funds (except ETFs) are valued at the NAV per share of the Institutional Share class on the day of valuation. ETFs are valued daily at the last sale price or official closing price on the principal exchange or system on which the investment is traded. Because the Portfolio invests in Underlying Funds that fluctuate in value, the Portfolio’s shares will correspondingly fluctuate in value. To the extent these investments are actively traded, they are classified as Level 1 of the fair value hierarchy, otherwise they are generally classified as Level 2. For information regarding an Underlying Fund’s accounting policies and investment holdings, please see the Underlying Fund’s shareholder report.
17
GOLDMAN SACHS STRATEGIC FACTOR ALLOCATION FUND
Notes to Financial Statements (continued)
August 31, 2017
|
| 3. INVESTMENTS AND FAIR VALUE MEASUREMENTS (continued) |
Derivative Contracts — A derivative is an instrument whose value is derived from underlying assets, indices, reference rates or a combination of these factors. The Portfolio enters into derivative transactions to hedge against changes in interest rates, securities prices, and/or currency exchange rates, to increase total return, or to gain access to certain markets or attain exposure to other underliers.
Exchange-traded derivatives, including futures and options contracts, are valued at the last sale or settlement price and typically fall within Level 1 of the fair value hierarchy. Over-the-counter (“OTC”) and centrally cleared derivatives are valued using market transactions and other market evidence, including market-based inputs to models, calibration to market-clearing transactions, broker or dealer quotations, or other alternative pricing sources. Where models are used, the selection of a particular model to value OTC and centrally cleared derivatives depends upon the contractual terms of, and specific risks inherent in, the instrument, as well as the availability of pricing information in the market. Valuation models require a variety of inputs, including contractual terms, market prices, yield curves, credit curves, measures of volatility, voluntary and involuntary prepayment rates, loss severity rates and correlations of such inputs. For OTC and centrally cleared derivatives that trade in liquid markets, model inputs can generally be verified and model selection does not involve significant management judgment. OTC and centrally cleared derivatives are classified within Level 2 of the fair value hierarchy when significant inputs are corroborated by market evidence.
i. Forward Contracts — A forward contract is a contract between two parties to buy or sell an asset at a specified price on a future date. A forward contract settlement can occur on a cash or delivery basis. Forward contracts are marked-to-market daily using independent vendor prices, and the change in value, if any, is recorded as an unrealized gain or loss. Cash and certain investments may be used to collateralize forward contracts.
A forward foreign currency exchange contract is a forward contract in which the Portfolio agrees to receive or deliver a fixed quantity of one currency for another, at a pre-determined price at a future date. All forward foreign currency exchange contracts are marked-to-market daily at the applicable forward rate. Non-deliverable forward foreign currency exchange contracts are settled with the counterparty in cash without the delivery of foreign currency.
ii. Futures Contracts — Futures contracts are contracts to buy or sell a standardized quantity of a specified commodity or security and are valued based on exchanged settlement prices or independent market quotes. Futures contracts are valued at the last settlement price, or in the absence of a sale, the last bid price for long positions and at the last ask price for short positions, at the end of each day on the board of trade or exchange upon which they are traded. Upon entering into a futures contract, the Portfolio deposits cash or securities in an account on behalf of the broker in an amount sufficient to meet the initial margin requirement. Subsequent payments are made or received by the Portfolio equal to the daily change in the contract value and are recorded as variation margin receivable or payable with a corresponding offset to unrealized gains or losses. For financial reporting purposes, cash collateral that has been pledged to cover obligations of the Portfolio and cash collateral received, if any is reported separately on the Statement of Assets and Liabilities as receivables/payables for collateral on certain derivative contracts. Non-cash collateral pledged by the Portfolio, if any, is noted in the Schedule of Investments.
iii. Options — When the Portfolio writes call or put options, an amount equal to the premium received is recorded as a liability and is subsequently marked-to-market to reflect the current value of the option written. Swaptions are options on interest rate swap contracts.
Upon the purchase of a call option or a put option by the Portfolio, the premium paid is recorded as an investment and subsequently marked-to-market to reflect the current value of the option. Certain options may be purchased with premiums to be determined on a future date. The premiums for these options are based upon implied volatility parameters at specified terms.
B. Level 3 Fair Value Investments — To the extent that significant inputs to valuation models and other alternative pricing sources are unobservable, or if quotations are not readily available, or if GSAM believes that such quotations do not accurately reflect fair value, the fair value of the Portfolio’s investments may be determined under Valuation Procedures approved by the Trustees. GSAM, consistent with its procedures and applicable regulatory guidance, may make an adjustment to the most recent valuation prices of either domestic or foreign securities in light of significant events to reflect what it believes to be the fair value of the securities at the time of determining the Portfolio’s NAV. Significant events which could affect a large number of securities
18
GOLDMAN SACHS STRATEGIC FACTOR ALLOCATION FUND
|
| 3. INVESTMENTS AND FAIR VALUE MEASUREMENTS (continued) |
in a particular market may include, but are not limited to: significant fluctuations in U.S. or foreign markets; market dislocations; market disruptions; or unscheduled market closings. Significant events which could also affect a single issuer may include, but are not limited to: corporate actions such as reorganizations, mergers and buy-outs; ratings downgrades; and bankruptcies.
C. Fair Value Hierarchy — The following is a summary of the Portfolio’s investments and derivatives classified in the fair value hierarchy as of August 31, 2017:
| | | | | | | | | | | | |
|
| STRATEGIC FACTOR ALLOCATION | |
| | | |
| Investment Type | | Level 1 | | | Level 2 | | | Level 3 | |
| Assets | | | | | | | | | | | | |
Exchange Traded Funds | | $ | 433,701,476 | | | $ | — | | | $ | — | |
Investment Company | | | 762,872,567 | | | | — | | | | — | |
| Total | | $ | 1,196,574,043 | | | $ | — | | | $ | — | |
| | | |
| Derivative Type | | | | | | | | | |
| Assets(a) | | | | | | | | | | | | |
Forward Foreign Currency Exchange Contracts | | $ | — | | | $ | 293,091 | | | $ | — | |
Futures Contracts | | | 2,218,234 | | | | — | | | | — | |
| Total | | $ | 2,218,234 | | | $ | 293,091 | | | $ | — | |
| Liabilities | | | | | | | | | | | | |
Forward Foreign Currency Exchange Contracts(a) | | $ | — | | | $ | (1,164,276 | ) | | $ | — | |
Written Options Contracts | | | (5,181,008 | ) | | | — | | | | — | |
| Total | | $ | (5,181,008 | ) | | $ | (1,164,276 | ) | | $ | — | |
| (a) | | Amount shown represents unrealized gain (loss) at fiscal year end. |
For further information regarding security characteristics, see the Schedule of Investments.
|
| 4. INVESTMENTS IN DERIVATIVES |
The following table sets forth, by certain risk types, the gross value of derivative contracts as of August 31, 2017. These instruments were used as part of the Portfolio’s investment strategies and to obtain and/or manage exposure related to the risks below. The values in the tables below exclude the effects of cash collateral received or posted pursuant to these derivative contracts, and therefore are not representative of the Portfolio’s net exposure.
| | | | | | | | | | | | |
| Risk | | Statement of Assets and Liabilities | | Assets | | | Statement of Assets and Liabilities | | Liabilities | |
Interest rate | | Variation margin on certain derivative contracts | | $ | 2,218,234 | (a) | | — | | $ | — | |
Currency | | Receivable for unrealized gain on forward foreign currency exchange contracts | | | 293,091 | | | Payable for unrealized loss on forward foreign currency exchange contracts | | | (1,164,276) | |
Equity | | — | | | — | | | Written options, at value | | | (5,181,008) | |
| Total | | | | $ | 2,511,325 | | | | | $ | (6,345,284) | |
| (a) | | Includes unrealized gain (loss) on futures contracts described in the Additional Investment Information sections of the Schedule of Investments. Only the current day’s variation margin is reported within the Statement of Assets and Liabilities. |
19
GOLDMAN SACHS STRATEGIC FACTOR ALLOCATION FUND
Notes to Financial Statements (continued)
August 31, 2017
|
| 4. INVESTMENTS IN DERIVATIVES (continued) |
The following table sets forth, by certain risk types, the Portfolio’s gains (losses) related to these derivatives and their indicative volumes for the fiscal year ended August 31, 2017. These gains (losses) should be considered in the context that these derivative contracts may have been executed to create investment opportunities and/or economically hedge certain investments, and accordingly, certain gains (losses) on such derivative contracts may offset certain (losses) gains attributable to investments. These gains (losses) are included in “Net realized gain (loss)” or “Net change in unrealized gain (loss)” on the Statement of Operations:
| | | | | | | | | | | | | | |
| Risk | | Statement of Operations | | Net Realized Gain (Loss) | | | Net Change in Unrealized Gain (Loss) | | | Average
Number of
Contracts(a) | |
| Interest rate | | Net realized gain (loss) from futures contracts and written options/Net change in unrealized gain (loss) on futures contracts | | $ | 9,060,262 | | | | 2,187,524 | | | | 1,572 | |
| Currency | | Net realized gain (loss) from forward foreign currency exchange contracts/Net change in unrealized gain (loss) on forward foreign currency exchange contracts | | | (7,813,258 | ) | | | (1,601,429 | ) | | | 14 | |
| Equity | | Net realized gain (loss) from written options contracts | | | 32,054,358 | | | | 755,504 | | | | 1 | |
| Total | | | | $ | 33,301,362 | | | $ | 1,341,599 | | | | 1,587 | |
| (a) | | Average number of contracts is based on the average of month end balances for the fiscal year ended August 31, 2017. |
In order to better define its contractual rights and to secure rights that will help the Portfolio mitigate its counterparty risk, the Portfolio may enter into an International Swaps and Derivatives Association, Inc. Master Agreement (“ISDA Master Agreement”) or similar agreement with its derivatives counterparties. An ISDA Master Agreement is a bilateral agreement between the Portfolio and a counterparty that governs OTC derivatives (including forward foreign currency exchange contracts, and certain options and swaps), and typically contains, among other things, collateral posting terms and netting provisions in the event of a default and/or termination event. The provisions of the ISDA Master Agreement typically permit a single net payment in the event of a default (close-out netting) or similar event, including the bankruptcy or insolvency of the counterparty.
Collateral and margin requirements differ between exchange traded derivatives and OTC derivatives. Margin requirements are established by the broker or clearing house for exchange-traded and centrally cleared derivatives (financial futures contracts, options and centrally cleared swaps) pursuant to governing agreements for those instrument types. Brokers can ask for margin in excess of the minimum in certain circumstances. Collateral terms are contract-specific for OTC derivatives. For derivatives traded under an ISDA Master Agreement, the collateral requirements are typically calculated by netting the marked to market amount for each transaction under such agreement and comparing that amount to the value of any collateral currently pledged by the Portfolio and the counterparty. Additionally, the Portfolio may be required to post initial margin to the counterparty, the terms of which would be outlined in the confirmation of the OTC transaction.
For financial reporting purposes, cash collateral that has been pledged to cover obligations of the Portfolio and cash collateral received from the counterparty, if any, is reported separately on the Statement of Assets and Liabilities as receivables/payables for collateral on certain derivative contracts. Non-cash collateral pledged by the Portfolio, if any, is noted in the Schedule of Investments. Generally, the amount of collateral due from or to a counterparty must exceed a minimum transfer amount threshold before a transfer is required to be made. To the extent amounts due to the Portfolio from its counterparties are not fully collateralized, contractually or otherwise, the Portfolio bears the risk of loss from counterparty nonperformance. The Portfolio attempts to mitigate counterparty risk by only entering into agreements with counterparties that the Investment Adviser believes to be of good standing and by monitoring the financial stability of those counterparties.
Additionally, the netting of assets and liabilities and the offsetting of collateral pledged or received are based on contractual netting/set-off provisions in the ISDA Master Agreement or similar agreements. However, in the event of a default or insolvency of a counterparty, a court could determine that such rights are not enforceable due to the restrictions or prohibitions against the right of setoff that may be imposed in accordance with a particular jurisdiction’s bankruptcy or insolvency laws.
20
GOLDMAN SACHS STRATEGIC FACTOR ALLOCATION FUND
|
| 5. AGREEMENTS AND AFFILIATED TRANSACTIONS |
A. Management Agreement — Under the Agreement, GSAM manages the Portfolio, subject to the general supervision of the Trustees.
As compensation for the services rendered pursuant to the Agreement, the assumption of the expenses related thereto and administration of the Portfolio’s business affairs, including providing facilities, GSAM is entitled to a management fee, accrued daily and paid monthly, equal to an annual percentage rate of the Portfolio’s average daily net assets.
For the fiscal year ended August 31, 2017, contractual and effective net management fees with GSAM were at the following rates:
| | | | | | | | | | | | | | | | | | | | | | |
| Contractual Management Rate | | | | |
First $2 Billion | | | Next $3 Billion | | | Next $3 Billion | | | Over $8 Billion | | | Effective
Rate | | | Effective Net
Management
Rate*^ | |
| | 0.75% | | | | 0.68% | | | | 0.64% | | | | 0.62% | | | | 0.75% | | | | 0.65% | |
| * | | GSAM has agreed to waive a portion of its management fee payable by the Portfolio in an amount equal to any management fee it earns as an investment adviser to any of the affiliated funds in which the Portfolio invests through at least December 29, 2017. Prior to such date GSAM may not terminate the arrangement without the approval of the Trustees. |
| ^ | | Effective Net Management Rate includes the impact of management fee waivers of affiliated Underlying Funds, if any. |
The Portfolio invests in Institutional Shares of the Goldman Sachs Financial Square Government Fund (“Government Money Market Fund”), which is an affiliated Underlying Portfolio. GSAM has agreed to waive a portion of its management fee payable by the Portfolio in an amount equal to the management fee it earns as an investment adviser to the affiliated Underlying Portfolio in which the Portfolio invests, except those management fees it earns from the Portfolio’s investment of cash collateral received in connection with securities lending transactions in the Government Money Market Fund. For the fiscal year ended August 31, 2017, GSAM waived $746,761 of the Portfolio’s management fee.
B. Transfer Agency Agreement — Goldman Sachs also serves as the transfer agent of the Portfolio for a fee pursuant to the Transfer Agency Agreement. The fees charged for such transfer agency services are accrued daily and paid monthly at annual rates as follows: 0.04% of the average daily net assets of Institutional Shares.
C. Other Expense Agreements and Affiliated Transactions — GSAM has agreed to limit certain “Other Expenses” of the Portfolio (excluding acquired fund fees and expenses, transfer agency fees and expenses, service fees and shareholder administration fees (as applicable), taxes, interest, brokerage fees, expenses of shareholder meetings, litigation, indemnification and extraordinary expenses) to the extent such expenses exceed, on an annual basis, a percentage rate of the average daily net assets of the Portfolio. Such Other Expense reimbursements, if any, are accrued daily and paid monthly. In addition, the Portfolio is not obligated to reimburse GSAM for prior fiscal year expense reimbursements, if any. The Other Expense limitations as an annual percentage rate of average daily net assets for the Portfolio are 0.164%. These Other Expense limitations will remain in place through at least December 29, 2017, and prior to such date GSAM may not terminate the arrangements without the approval of the Trustees. In addition, the Portfolio has entered into certain offset arrangements with the transfer agent, which may result in a reduction of the Portfolio’s expenses and are received irrespective of the application of the “Other Expense” limitations described above.
D. Line of Credit Facility — As of August 31, 2017, the Portfolio participated in a $1,100,000,000 committed, unsecured revolving line of credit facility (the “facility”) together with other funds of the Trust and certain registered investment companies having management agreements with GSAM or its affiliates. This facility is to be used for temporary emergency purposes, or to allow for an orderly liquidation of securities to meet redemption requests. The interest rate on borrowings is based on the federal funds rate. The facility also requires a fee to be paid by the Portfolio based on the amount of the commitment that has not been utilized. For the period ended August 31, 2017, the Portfolio did not have any borrowings under the facility.
E. Other Transactions with Affiliates — For the fiscal year ended August 31, 2017 , Goldman Sachs did not earn any brokerage commissions from portfolio transactions, including futures transactions executed with Goldman Sachs as the Futures Commission Merchant, on behalf of the Portfolio.
21
GOLDMAN SACHS STRATEGIC FACTOR ALLOCATION FUND
Notes to Financial Statements (continued)
August 31, 2017
|
| 5. AGREEMENTS AND AFFILIATED TRANSACTIONS (continued) |
The table below shows the transactions in and earnings from investments in the Goldman Sachs Financial Square Government Fund for the fiscal year ended August 31, 2017:
| | | | | | | | | | | | | | | | | | | | | | | | |
Affiliated Investment Company | | Beginning
Value as of
August 31,
2016 | | | Purchases
at Cost | | | Proceeds from Sales | | | Ending
Value as of
August 31,
2017 | | | Shares as of
August 31,
2017 | | | Dividend
Income from
Affiliated
Investment
Companies | |
Goldman Sachs Financial Square Government Fund — Institutional Shares | | $ | 184,645,717 | | | $ | 2,152,312,843 | | | $ | (1,574,085,993 | ) | | $ | 762,872,567 | | | | 762,872,567 | | | $ | 2,952,734 | |
|
| 6. PORTFOLIO SECURITIES TRANSACTIONS |
The cost of purchases and proceeds from sales and maturities of long-term securities for the fiscal year ended August 31, 2017, were $1,887,805,277 and $ 1,587,621,175 respectively.
The tax character of distributions paid during the fiscal year ended August 31, 2017 was as follows:
| | | | |
Distribution paid from: | | | | |
Ordinary income | | $ | 1,874,359 | |
Net long-term capital gains | | | 2,620,892 | |
Total taxable distributions | | $ | 4,495,251 | |
There were no distributions paid during the period ended August 31, 2016.
As of August 31, 2017, the components of accumulated earnings (losses) on a tax basis were as follows:
| | | | |
Undistributed ordinary income — net | | $ | 13,972,817 | |
Undistributed long-term capital gains | | | 25,774,595 | |
Total undistributed earnings | | $ | 39,747,412 | |
Unrealized gains (losses) — net | | | 19,778,569 | |
Total accumulated earnings (losses) net | | $ | 59,525,981 | |
As of August 31, 2017, the Portfolio’s aggregate security unrealized gains and losses based on cost for U.S. federal income tax purposes were as follows:
| | |
Tax Cost | | $1,178,898,027 |
Gross unrealized gain | | 19,778,569 |
Gross unrealized loss | | — |
Net unrealized gains (losses) | | $ 19,778,569 |
The difference between GAAP-basis and tax basis unrealized gains (losses) is attributable primarily to wash sales and net mark to market gains (losses) on regulated futures contracts, options contracts and foreign currency contracts.
22
GOLDMAN SACHS STRATEGIC FACTOR ALLOCATION FUND
|
| 7. TAX INFORMATION (continued) |
In order to present certain components of the Portfolio’s capital accounts on a tax-basis, certain reclassifications have been recorded to the Portfolio’s accounts. These reclassifications have no impact on the net asset value of the Portfolio and result primarily from dividend redesignations, net operating losses, certain non-deductible expenses, and differences in the tax treatment of foreign currency transactions.
| | | | | | | | | | |
| Paid-in-Capital | | | Accumulated
Net Realized
Gain (Loss) | | | Undistributed
Net Investment Income (Loss) | |
| $ | (78,399 | ) | | $ | (1,421,140 | ) | | $ | 1,499,539 | |
GSAM has reviewed the Portfolio’s tax positions for all open tax years (the current and prior year as applicable) and has concluded that no provision for income tax is required in the Portfolio’s financial statements. Such open tax years remain subject to examination and adjustment by tax authorities.
The Portfolio’s risks include, but are not limited to, the following:
Derivatives Risk — The Portfolio’s use of derivatives may result in loss. Derivative instruments, which may pose risks in addition to and greater than those associated with investing directly in securities, currencies or other instruments, may be illiquid or less liquid, volatile, difficult to price and leveraged so that small changes in the value of the underlying instruments may produce disproportionate losses to the Portfolio. Derivatives are also subject to counterparty risk, which is the risk that the other party in the transaction will not fulfill its contractual obligation. The use of derivatives is a highly specialized activity that involves investment techniques and risks different from those associated with investments in more traditional securities and instruments. Losses from derivatives can also result from a lack of correlation between changes in the value of derivative instruments and the portfolio assets (if any) being hedged.
Foreign Countries Risk — Investing in foreign markets may involve special risks and considerations not typically associated with investing in the United States. Foreign securities may be subject to risk of loss because of more or less foreign government regulation, less public information and less economic, political and social stability in the countries in which the Portfolio invests. The imposition of exchange controls, confiscations, trade restrictions (including tariffs) and other government restrictions by the United States or other governments, or from problems in share registration, settlement or custody, may also result in losses. Foreign risk also involves the risk of negative foreign currency rate fluctuations, which may cause the value of securities denominated in such foreign currency (or other instruments through which the Portfolio has exposure to foreign currencies) to decline in value. Currency exchange rates may fluctuate significantly over short periods of time.
Foreign Custody Risk — If the Portfolio invests in foreign securities, the Portfolio may hold such securities and cash with foreign banks, agents, and securities depositories appointed by the Portfolio’s custodian (each a “Foreign Custodian”). Some foreign custodians may be recently organized or new to the foreign custody business. In some countries, Foreign Custodians may be subject to little or no regulatory oversight over, or independent evaluation of, their operations. Further, the laws of certain countries may place limitations on the Portfolio’s ability to recover its assets if a Foreign Custodian enters bankruptcy.
Geographic Risk — If the Portfolio focuses its investments in securities of issuers located in a particular country or geographic region, the Portfolio may be subjected, to a greater extent than if its investments were less focused, to the risks of volatile economic cycles and/or conditions and developments that may be particular to that country or region, such as: adverse securities markets; adverse exchange rates; adverse social, political, regulatory, economic, business, environmental or other developments; or natural disasters.
23
GOLDMAN SACHS STRATEGIC FACTOR ALLOCATION FUND
Notes to Financial Statements (continued)
August 31, 2017
|
| 8. OTHER RISKS (continued) |
Interest Rate Risk— When interest rates increase, fixed income securities or instruments held by the Portfolio will generally decline in value. Long-term fixed income securities or instruments will normally have more price volatility because of this risk than short-term fixed income securities or instruments. The risks associated with increasing rates are heightened given that interest rates are near historic lows, but may be expected to increase in the future with unpredictable effects on the markets and the Portfolio’s investments. Fluctuations in interest rates may also affect the liquidity of fixed income securities and instruments held by the Portfolio.
Investments in Other Investment Companies — As a shareholder of another investment company, including an ETF, the Portfolio will indirectly bear its proportionate share of any net management fees and other expenses paid by such other investment companies, in addition to the fees and expenses regularly borne by the Portfolio. ETFs are subject to risks that do not apply to conventional mutual funds, including but not limited to the following: (i) the market price of the ETF’s shares may trade at a premium or a discount to their NAV; and (ii) an active trading market for an ETF’s shares may not develop or be maintained.
Large Shareholder Transactions Risk — The Portfolio may experience adverse effects when certain large shareholders, such as other funds, institutional investors (including those trading by use of non-discretionary mathematical formulas), financial intermediaries (who may make investment decisions on behalf of underlying clients and/or include the Portfolio in their investment model), individuals, accounts and Goldman Sachs affiliates, purchase or redeem large amounts of shares of a Portfolio. Such large shareholder redemptions may cause the Portfolio to sell portfolio securities at times when it would not otherwise do so, which may negatively impact the Portfolio’s NAV and liquidity. These transactions may also accelerate the realization of taxable income to shareholders if such sales of investments resulted in gains, and may also increase transaction costs. In addition, a large redemption could result in the Portfolio’s current expenses being allocated over a smaller asset base, leading to an increase in the Portfolio’s expense ratio. Similarly, large Portfolio share purchases may adversely affect the Portfolio’s performance to the extent that the Portfolio is delayed in investing new cash and is required to maintain a larger cash position than it ordinarily would.
Liquidity Risk — The Portfolio may make investments that are illiquid or that may become less liquid in response to market developments or adverse investor perceptions. Illiquid investments may be more difficult to value. Liquidity risk may also refer to the risk that the Portfolio will not be able to pay redemption proceeds within the allowable time period because of unusual market conditions, an unusually high volume of redemption requests, or other reasons. To meet redemption requests, the Portfolio may be forced to sell investments at an unfavorable time and/or under unfavorable conditions.
Market and Credit Risks — In the normal course of business, the Portfolio trades financial instruments and enters into financial transactions where risk of potential loss exists due to changes in the market (market risk). Additionally, the Portfolio may also be exposed to credit risk in the event that an issuer or guarantor fails to perform or that an institution or entity with which the Portfolio has unsettled or open transactions defaults.
Non-Diversification Risk— The Portfolio is non-diversified, meaning that it is permitted to invest a larger percentage of its assets in fewer issuers than diversified mutual funds. Thus, the Portfolio may be more susceptible to adverse developments affecting any single issuer held in its portfolio, and may be more susceptible to greater losses because of these developments.
Under the Trust’s organizational documents, its Trustees, officers, employees and agents are indemnified, to the extent permitted by the Act and state law, against certain liabilities that may arise out of performance of their duties to the Portfolio. Additionally, in the course of business, the Portfolio enters into contracts that contain a variety of indemnification clauses. The Portfolio’s maximum exposure under these arrangements is unknown, as this would involve future claims that may be made against the Portfolio that have not yet occurred. However, GSAM believes the risk of loss under these arrangements to be remote.
24
GOLDMAN SACHS STRATEGIC FACTOR ALLOCATION FUND
Subsequent events after the Statement of Assets and Liabilities date have been evaluated and GSAM has concluded that there is no impact requiring adjustment or disclosure in the financial statements.
|
| 11. SUMMARY OF SHARE TRANSACTIONS |
Share activity is as follows:
| | | | | | | | | | | | | | | | |
| | | Strategic Factor Allocation Fund | |
| | | | |
| | | For the Fiscal Year Ended August 31, 2017 | | | For the Period Ended August 31, 2016(a) | |
| | | | |
| | | Shares | | | Dollars | | | Shares | | | Dollars | |
| | | | |
| Institutional Shares | | | | | | | | | | | | | | | | |
Shares sold | | | 105,328,746 | | | | 1,117,562,980 | | | | 33,081,728 | | | | 337,652,314 | |
Reinvestment of distributions | | | 439,814 | | | | 4,495,251 | | | | — | | | | — | |
Shares redeemed | | | (5,361,153 | ) | | | (56,553,609 | ) | | | (328,917 | ) | | | (3,337,918 | ) |
| | | | 100,407,407 | | | | 1,065,504,622 | | | | 32,752,811 | | | | 334,314,396 | |
NET INCREASE | | | 100,407,407 | | | $ | 1,065,504,622 | | | | 32,752,811 | | | $ | 334,314,396 | |
| (a) | | The Portfolio commenced operations on May 31, 2016. |
25
Report of Independent Registered Public
Accounting Firm
To the Board of Trustees of
Goldman Sachs Trust and Shareholders of the Goldman Sachs Strategic Factor Allocation Fund:
In our opinion, the accompanying statement of assets and liabilities, including the schedule of investments, and the related statements of operations and of changes in net assets and the financial highlights present fairly, in all material respects, the financial position of the Goldman Sachs Strategic Factor Allocation Fund (the “Portfolio”), a portfolio of the Goldman Sachs Trust, as of August 31, 2017, and the results of its operations for the year then ended, the changes in its net assets for the year then ended and the period May 31, 2016 (commencement of operations) to August 31, 2016 and the financial highlights for each of the periods presented therein, in conformity with accounting principles generally accepted in the United States of America. These financial statements and financial highlights (hereafter referred to as “financial statements”) are the responsibility of the Portfolio’s management. Our responsibility is to express an opinion on these financial statements based on our audits. We conducted our audits of these financial statements in accordance with the standards of the Public Company Accounting Oversight Board (United States). Those standards require that we plan and perform the audit to obtain reasonable assurance about whether the financial statements are free of material misstatement. An audit includes examining, on a test basis, evidence supporting the amounts and disclosures in the financial statements, assessing the accounting principles used and significant estimates made by management, and evaluating the overall financial statement presentation. We believe that our audits, which included confirmation of securities as of August 31, 2017 by correspondence with the custodian, brokers, transfer agent of the underlying funds and the application of alternative auditing procedures where securities purchased confirmations had not been received, provide a reasonable basis for our opinion.
PricewaterhouseCoopers LLP
Boston, Massachusetts
October 24, 2017
26
GOLDMAN SACHS STRATEGIC FACTOR ALLOCATION FUND
|
Portfolio Expenses — Period Ended August 31, 2017 (Unaudited) |
As a shareholder of Institutional Shares of the Portfolio, you incur two types of costs: you incur ongoing costs, including management fees; and other Portfolio expenses. This Example is intended to help you understand your ongoing costs (in dollars) of investing in the Portfolio and to compare these costs with the ongoing costs of investing in other mutual funds.
The Example is based on an investment of $1,000 invested at the beginning of the period and held for the entire period from March 1, 2017 through August 31, 2017, which represents a period of 184 days in a 365-day year.
Actual Expenses — The first line in the table below provides information about actual account values and actual expenses. You may use the information in this line, together with the amount you invested, to estimate the expenses that you paid over the period. Simply divide your account value by $1,000 (for example, an $8,600 account value divided by $1,000=8.6), then multiply the result by the number in the first line under the heading entitled “Expenses Paid” to estimate the expenses you paid on your account during this period.
Hypothetical Example for Comparison Purposes — The second line in the table below provides information about hypothetical account values and hypothetical expenses based on the Portfolio’s actual net expense ratios and an assumed rate of return of 5% per year before expenses, which is not the Portfolio’s actual return. The hypothetical account values and expenses may not be used to estimate the actual ending account balance or expenses you paid for the period. You may use this information to compare the ongoing costs of investing in the Portfolio and other funds. To do so, compare this 5% hypothetical example with the 5% hypothetical examples that appear in the shareholder reports of the other funds.
Please note that the expenses shown in the table are meant to highlight your ongoing costs only and do not reflect any transactional costs, such as sales charges, redemption fees, or exchange fees. Therefore, the second line of the table is useful in comparing ongoing costs only, and will not help you determine the relative total costs of owning different funds. In addition, if these transactional costs were included, your costs would have been higher.
| | | | | | | | | | | | |
| | | Strategic Factor Allocation Fund | |
| Share Class | | Beginning
Account Value
3/1/17 | | | Ending
Account Value
8/31/17 | | | Expenses Paid for the
6 months ended
8/31/17* | |
| Institutional | | | | | | | | | | | | |
Actual | | $ | 1,000.00 | | | $ | 1,039.80 | | | $ | 3.70 | |
Hypothetical 5% return | | | 1,000.00 | | | | 1,021.58 | + | | | 3.67 | |
| | + | | Hypothetical expenses are based on the Portfolio’s actual annualized net expense ratios and an assumed rate of return of 5% per year before expenses. | |
| | * | | Expenses are calculated using the Portfolio’s annualized net expense ratio, which represents the ongoing expenses as a percentage of net assets for the six months ended August 31, 2017. Expenses are calculated by multiplying the annualized net expense ratio by the average account value for the period; then multiplying the result by the number of days in the most recent fiscal half year; and then dividing that result by the number of days in the fiscal year. | |
| | | | The annualized net expense ratios for the period was 0.72%. | |
27
GOLDMAN SACHS STRATEGIC FACTOR ALLOCATION FUND
Statement Regarding Basis for Approval of Management Agreement (Unaudited)
Background
The Goldman Sachs Strategic Factor Allocation Fund (the “Portfolio”) is an investment portfolio of Goldman Sachs Trust (the “Trust”). The Board of Trustees oversees the management of the Trust and reviews the investment performance and expenses of the Portfolio at regularly scheduled meetings held throughout the year. In addition, the Board of Trustees determines annually whether to approve the continuance of the Trust’s investment management agreement (the “Management Agreement”) with Goldman Sachs Asset Management, L.P. (the “Investment Adviser”) on behalf of the Portfolio.
The Management Agreement was most recently approved for continuation until June 30, 2018 by the Board of Trustees, including those Trustees who are not parties to the Management Agreement or “interested persons” (as defined in the Investment Company Act of 1940, as amended) of any party thereto (the “Independent Trustees”), at a meeting held on June 14-15, 2017 (the “Annual Meeting”).
The review process undertaken by the Trustees spans the course of the year and culminates with the Annual Meeting. To assist the Trustees in their deliberations, the Trustees have established a Contract Review Committee (the “Committee”), comprised of the Independent Trustees. The Committee held four meetings over the course of the year since the Management Agreement was last approved. At those Committee meetings, regularly scheduled Board or other committee meetings, and/or the Annual Meeting, matters relevant to the renewal of the Management Agreement were considered by the Board, or the Independent Trustees, as applicable. With respect to the Portfolio, such matters included:
| | (a) | | the nature and quality of the advisory, administrative, and other services provided to the Portfolio by the Investment Adviser and its affiliates, including information about: |
| | (i) | | the structure, staff, and capabilities of the Investment Adviser and its portfolio management teams; |
| | (ii) | | the groups within the Investment Adviser and its affiliates that support the portfolio management teams or provide other types of necessary services, including fund services groups (e.g., accounting and financial reporting, tax, shareholder services, and operations); controls and risk management groups (e.g., legal, compliance, valuation oversight, credit risk management, internal audit, compliance testing, market risk analysis, finance, and central funding); sales and distribution support groups, and others (e.g., information technology and training); |
| | (iii) | | trends in employee headcount; |
| | (iv) | | the Investment Adviser’s financial resources and ability to hire and retain talented personnel and strengthen its operations; and |
| | (v) | | the parent company’s support of the Investment Adviser and its mutual fund business, as expressed by the firm’s senior management; |
| | (b) | | information on the investment performance of the Portfolio, including comparisons to the performance of similar mutual funds, as provided by a third-party mutual fund data provider engaged as part of the contract review process (the “Outside Data Provider”), and a benchmark performance index; and information on general investment outlooks in the markets in which the Portfolio invests; |
| | (c) | | information provided by the Investment Adviser indicating the Investment Adviser’s views on whether the Portfolio’s peer group and/or benchmark index had high, medium, or low relevance given the Portfolio’s particular investment strategy; |
| | (d) | | the terms of the Management Agreement and other agreements with affiliated service providers entered into by the Trust on behalf of the Portfolio; |
| | (e) | | fee and expense information for the Portfolio, including: |
| | (i) | | the relative management fee and expense levels of the Portfolio as compared to those of comparable funds managed by other advisers, as provided by the Outside Data Provider; and |
| | (ii) | | to the extent the Investment Adviser manages other types of accounts (such as bank collective trusts, private wealth management accounts, institutional separate accounts, sub-advised mutual funds, and non-U.S. funds) having investment objectives and policies similar to those of the Portfolio, comparative information on the advisory fees charged and services provided to those accounts by the Investment Adviser; |
28
GOLDMAN SACHS STRATEGIC FACTOR ALLOCATION FUND
Statement Regarding Basis for Approval of Management Agreement (Unaudited) (continued)
| | (f) | | with respect to the investment performance and expense comparison data provided by the Outside Data Provider, its processes in producing that data for the Portfolio; |
| | (g) | | the undertakings of the Investment Adviser and its affiliates to implement fee waivers and/or expense limitations; |
| | (h) | | information relating to the profitability of the Management Agreement and the transfer agency and distribution and service arrangements of the Portfolio to the Investment Adviser and its affiliates; |
| | (i) | | whether the Portfolio’s existing management fee schedule adequately addressed any economies of scale; |
| | (j) | | a summary of the “fall-out” benefits derived by the Investment Adviser and its affiliates from their relationships with the Portfolio, including the fees received by the Investment Adviser’s affiliates from the Portfolio for transfer agency, portfolio trading, distribution and other services; |
| | (k) | | a summary of potential benefits derived by the Portfolio as a result of its relationship with the Investment Adviser; |
| | (l) | | information regarding commissions paid by the Portfolio and broker oversight, other information regarding portfolio trading, and how the Investment Adviser carries out its duty to seek best execution; |
| | (m) | | portfolio manager ownership of Portfolio shares; the manner in which portfolio manager compensation is determined; and the number and types of accounts managed by the portfolio managers; |
| | (n) | | the nature and quality of the services provided to the Portfolio by its unaffiliated service providers, and the Investment Adviser’s general oversight and evaluation (including reports on due diligence) of those service providers as part of the administrative services provided under the Management Agreement; and |
| | (o) | | the Investment Adviser’s processes and policies addressing various types of potential conflicts of interest; its approach to risk management; the annual review of the effectiveness of the Portfolio’s compliance program; and periodic compliance reports. |
The Trustees also received an overview of the Portfolio’s distribution arrangements. They received information regarding the Portfolio’s assets and share purchase and redemption activity. Information was also provided to the Trustees relating to revenue sharing payments made by and services provided by the Investment Adviser and its affiliates to intermediaries that promote the sale, distribution, and/or servicing of Portfolio shares. The Independent Trustees also discussed the broad range of other investment choices that are available to Portfolio investors, including the availability of comparable funds managed by other advisers.
The presentations made at the Board and Committee meetings and at the Annual Meeting encompassed the Portfolio and other mutual funds for which the Board of Trustees has responsibility. In evaluating the Management Agreement at the Annual Meeting, the Trustees relied upon their knowledge, resulting from their meetings and other interactions throughout the year, of the Investment Adviser and its affiliates, their services, and the Portfolio. In conjunction with these meetings, the Trustees received written materials and oral presentations on the topics covered, and the Investment Adviser addressed the questions and concerns of the Trustees, including concerns regarding the investment performance of certain of the funds they oversee. The Independent Trustees were advised by their independent legal counsel regarding their responsibilities and other regulatory requirements related to the approval and continuation of mutual fund investment management agreements under applicable law. In addition, the Investment Adviser and its affiliates provided the Independent Trustees with a written response to a formal request for information sent on behalf of the Independent Trustees by their independent legal counsel. During the course of their deliberations, the Independent Trustees met in executive sessions with their independent legal counsel, without representatives of the Investment Adviser or its affiliates present.
29
GOLDMAN SACHS STRATEGIC FACTOR ALLOCATION FUND
Statement Regarding Basis for Approval of Management Agreement (Unaudited) (continued)
Nature, Extent, and Quality of the Services Provided Under the Management Agreement
As part of their review, the Trustees considered the nature, extent, and quality of the services provided to the Portfolio by the Investment Adviser. In this regard, the Trustees considered both the investment advisory services and non-advisory services that are provided by the Investment Adviser and its affiliates. The Trustees noted the transition in the leadership and changes in personnel of various of the Investment Adviser’s portfolio management teams that had occurred in recent periods, and the ongoing recruitment efforts aimed at bringing high quality investment talent to the Investment Adviser. They also noted the Investment Adviser’s commitment to maintaining high quality systems and expending substantial resources to respond to ongoing changes to the regulatory and control environment in which the Portfolio and its service providers operate, as well as the efforts of the Investment Adviser and its affiliates to combat cyber security risks. The Trustees concluded that the Investment Adviser continued to commit substantial financial and operational resources to the Portfolio and expressed confidence that the Investment Adviser would continue to do so in the future. The Trustees also recognized that the Investment Adviser had made significant commitments to address regulatory compliance requirements applicable to the Portfolio and the Investment Adviser and its affiliates.
Investment Performance
The Trustees noted that the Portfolio had launched on May 31, 2016 and did not yet have a meaningful performance history.
Costs of Services Provided and Competitive Information
The Trustees considered the contractual terms of the Management Agreement and the fee rates payable by the Portfolio thereunder. In this regard, the Trustees considered information on the services rendered by the Investment Adviser to the Portfolio, which included both advisory and administrative services that were directed to the needs and operations of the Portfolio as a registered mutual fund.
In particular, the Trustees reviewed analyses prepared by the Outside Data Provider regarding the expense rankings of the Portfolio. The analyses provided a comparison of the Portfolio’s management fee and breakpoints to those of a relevant peer group and category universe; an expense analysis which compared the Portfolio’s overall net and gross expenses to a peer group and a category universe; and data comparing the Portfolio’s net expenses to the peer and category medians. The analyses also compared the Portfolio’s transfer agency and custody fees, other expenses and fee waivers/reimbursements to those of the peer group and category medians. The Trustees concluded that the comparisons provided by the Outside Data Provider were useful in evaluating the reasonableness of the management fees and total expenses paid by the Portfolio.
In addition, the Trustees considered the Investment Adviser’s undertakings to implement fee waivers and/or expense limitations. They also considered, to the extent that the Investment Adviser manages other types of accounts having investment objectives and policies similar to those of the Portfolio, comparative fee information for services provided by the Investment Adviser to those accounts, and information that indicated that services provided to the Portfolio differed in various significant respects from the services provided to other types of accounts which, in many cases, operated under less stringent legal and regulatory structures, required fewer services from the Investment Adviser to a smaller number of client contact points, and were less time-intensive.
In addition, the Trustees noted that shareholders are able to redeem their Portfolio shares at any time if shareholders believe that the Portfolio fees and expenses are too high or if they are dissatisfied with the performance of the Portfolio.
30
GOLDMAN SACHS STRATEGIC FACTOR ALLOCATION FUND
Statement Regarding Basis for Approval of Management Agreement (Unaudited) (continued)
Profitability
The Trustees reviewed the Portfolio’s contribution to the Investment Adviser’s revenues and pre-tax profit margins. In this regard the Trustees noted that they had received, among other things, profitability analyses and summaries, revenue and expense schedules by Portfolio and by function (i.e., investment management, transfer agency and distribution and service), and information on the Investment Adviser’s expense allocation methodology. They observed that the profitability and expense figures are substantially similar to those used by the Investment Adviser for many internal purposes, including compensation decisions among various business groups, and are thus subject to a vigorous internal debate about how certain revenue and expenses should be allocated. The Trustees also noted that the internal audit group within the Goldman Sachs organization had audited the expense allocation methodology and that the internal audit group was satisfied with the reasonableness, consistency, and accuracy of the Investment Adviser’s expense allocation methodology and profitability analysis calculations. Profitability data for the Portfolio was provided for 2016, and the Trustees considered this information in relation to the Investment Adviser’s overall profitability.
Economies of Scale
The Trustees considered the information that had been provided regarding the Investment Adviser’s profitability. The Trustees also considered the breakpoints in the fee rate payable under the Management Agreement for the Portfolio at the following annual percentage rates of the average daily net assets of the Portfolio:
| | | | |
First $2 billion | | | 0.75 | % |
Next $3 billion | | | 0.68 | |
Next $3 billion | | | 0.64 | |
Over $8 billion | | | 0.62 | |
The Trustees noted that the breakpoints were designed to share potential economies of scale, if any, with the Portfolio and its shareholders as assets under management reach those asset levels. The Trustees considered the amounts of assets in the Portfolio; the Portfolio’s recent share purchase and redemption activity; the information provided by the Investment Adviser relating to the costs of the services provided by the Investment Adviser and its affiliates and their realized profits; information comparing fee rates charged by the Investment Adviser with fee rates charged to other funds in the peer group; and the Investment Adviser’s undertaking to limit certain expenses of the Portfolio that exceed specified levels. Upon reviewing these matters at the Annual Meeting, the Trustees concluded that the fee breakpoints represented a means of assuring that benefits of scalability, if any, would be passed along to shareholders at the specified asset levels.
Other Benefits to the Investment Adviser and Its Affiliates
The Trustees also considered the other benefits derived by the Investment Adviser and its affiliates from their relationships with the Portfolio as stated above, including: (a) transfer agency fees received by Goldman Sachs & Co. LLC (“Goldman Sachs”); (b) brokerage and futures commissions earned by Goldman Sachs for executing securities and futures transactions on behalf of the Portfolio; (c) trading efficiencies resulting from aggregation of orders of the Portfolio with those for other funds or accounts managed by the Investment Adviser; (d) the Investment Adviser’s ability to leverage the infrastructure designed to service the Portfolio on behalf of its other clients; (e) the Investment Adviser’s ability to cross-market other products and services to Portfolio shareholders; (f) Goldman Sachs’ retention of certain fees as Portfolio Distributor; (g) the Investment Adviser’s ability to negotiate better pricing with custodians on behalf of its other clients, as a result of the relationship with the Portfolio; and (h) the possibility that the working relationship between the Investment Adviser and the Portfolio’s third-party service providers may cause those service providers to be more likely to do business with other areas of Goldman Sachs. In the course of considering the foregoing, the Independent Trustees requested and received further information quantifying certain of these fall-out benefits.
31
GOLDMAN SACHS STRATEGIC FACTOR ALLOCATION FUND
Statement Regarding Basis for Approval of Management Agreement (Unaudited) (continued)
Other Benefits to the Portfolio and Its Shareholders
The Trustees also noted that the Portfolio receives certain potential benefits as a result of its relationship with the Investment Adviser, including: (a) trading efficiencies resulting from aggregation of orders of the Portfolio with those of other funds or accounts managed by the Investment Adviser; (b) enhanced servicing from vendors because of the volume of business generated by the Investment Adviser and its affiliates; (c) enhanced servicing from broker-dealers because of the volume of business generated by the Investment Adviser and its affiliates; (d) the Investment Adviser’s ability to negotiate favorable terms with derivatives counterparties on behalf of the Portfolio as a result of the size and reputation of the Goldman Sachs organization; (e) the Investment Adviser’s knowledge and experience gained from managing other accounts and products; (f) the Investment Adviser’s ability to hire and retain qualified personnel to provide services to the Portfolio because of the reputation of the Goldman Sachs organization; (g) the Portfolio’s access, through the Investment Adviser, to certain firmwide resources (e.g., proprietary risk management systems and databases), subject to certain restrictions; and (h) the Portfolio’s access to certain affiliated distribution channels. In addition, the Trustees noted the competitive nature of the mutual fund marketplace, and considered that many of the Portfolio’s shareholders invested in the Portfolio in part because of the Portfolio’s relationship with the Investment Adviser and that those shareholders have a general expectation that the relationship will continue.
Conclusion
In connection with their consideration of the Management Agreement, the Trustees gave weight to each of the factors described above, but did not identify any particular factor as controlling their decision. After deliberation and consideration of all of the information provided, including the factors described above, the Trustees concluded, in the exercise of their business judgment, that the management fees paid by the Portfolio were reasonable in light of the services provided to it by the Investment Adviser, the Investment Adviser’s costs and the Portfolio’s current and reasonably foreseeable asset levels. The Trustees unanimously concluded that the Investment Adviser’s continued management likely would benefit the Portfolio and its shareholders and that the Management Agreement should be approved and continued with respect to the Portfolio until June 30, 2018.
32
GOLDMAN SACHS STRATEGIC FACTOR ALLOCATION FUND
Trustees and Officers (Unaudited)
Independent Trustees
| | | | | | | | | | |
Name, Address and Age1 | | Position(s) Held with the Trust | | Term of Office and Length of Time Served2 | | Principal Occupation(s) During Past 5 Years | | Number of Portfolios in Fund Complex Overseen by Trustee3 | | Other Directorships Held by Trustee4 |
Ashok N. Bakhru Age: 75 | | Chairman of the Board of Trustees | | Since 1996 (Trustee since 1991) | | Mr. Bakhru is retired. He was formerly Chairman of the Board of Trustees, Goldman Sachs Trust II (2012-2016), Goldman Sachs MLP Income Opportunities Fund (2013-2016), Goldman Sachs MLP and Energy Renaissance Fund (2014-2016), and Goldman Sachs ETF Trust (2014-2016); Director, Apollo Investment Corporation (a business development company) (2008-2013); President, ABN Associates (a management and financial consulting firm) (1994-1996 and 1998- 2012); Trustee, Scholarship America (1998-2005); Trustee, Institute for Higher Education Policy (2003-2008); Director, Private Equity Investors — III and IV (1998-2007), and Equity-Linked Investors II (April 2002-2007). Chairman of the Board of Trustees — Goldman Sachs Trust; Goldman Sachs Variable Insurance Trust; Goldman Sachs BDC, Inc.; and Goldman Sachs Private Middle Market Credit LLC. | | 106 | | None |
Kathryn A. Cassidy Age: 63 | | Trustee | | Since 2015 | | Ms. Cassidy is retired. Formerly, she was Advisor to the Chairman (May 2014-December 2014); and Senior Vice President and Treasurer (2008-2014), General Electric Company & General Electric Capital Corporation (technology and financial services companies). Trustee — Goldman Sachs Trust and Goldman Sachs Variable Insurance Trust. | | 104 | | None |
Diana M. Daniels Age: 68 | | Trustee | | Since 2007 | | Ms. Daniels is retired. Formerly, she was Vice President, General Counsel and Secretary, The Washington Post Company (1991-2006). Ms. Daniels is a Trustee Emeritus and serves as a Presidential Councillor of Cornell University (2013-Present); former Member of the Legal Advisory Board, New York Stock Exchange (2003- 2006) and of the Corporate Advisory Board, Standish Mellon Management Advisors (2006-2007). Trustee — Goldman Sachs Trust and Goldman Sachs Variable Insurance Trust. | | 104 | | None |
Herbert J. Markley Age: 67 | | Trustee | | Since 2013 | | Mr. Markley is retired. Formerly, he was Executive Vice President, Deere & Company (an agricultural and construction equipment manufacturer) (2007- 2009); and President, Agricultural Division, Deere & Company (2001-2007). Previously, Mr. Markley served as an Advisory Board Member of Goldman Sachs Trust and Goldman Sachs Variable Insurance Trust (June 2013-October 2013). Trustee — Goldman Sachs Trust and Goldman Sachs Variable Insurance Trust. | | 104 | | None |
Jessica Palmer Age: 68 | | Trustee | | Since 2007 | | Ms. Palmer is retired. She is Director, Emerson Center for the Arts and Culture (2011-Present); and was formerly a Consultant, Citigroup Human Resources Department (2007-2008); Managing Director, Citigroup Corporate and Investment Banking (previously, Salomon Smith Barney/ Salomon Brothers) (1984-2006). Ms. Palmer was a Member of the Board of Trustees of Indian Mountain School (private elementary and secondary school) (2004-2009). Trustee — Goldman Sachs Trust and Goldman Sachs Variable Insurance Trust. | | 104 | | None |
| | | | | | | | | | |
33
GOLDMAN SACHS STRATEGIC FACTOR ALLOCATION FUND
Trustees and Officers (Unaudited) (continued)
Independent Trustees
| | | | | | | | | | |
Name, Address and Age1 | | Position(s) Held with the Trust | | Term of Office and Length of Time Served2 | | Principal Occupation(s) During Past 5 Years | | Number of Portfolios in Fund Complex Overseen by Trustee3 | | Other Directorships Held by Trustee4 |
Roy W. Templin Age: 57 | | Trustee | | Since 2013 | | Mr. Templin is retired. He is Director, Armstrong World Industries, Inc. (a designer and manufacturer of ceiling, wall and suspension system solutions) (2016-Present); and was formerly Chairman of the Board of Directors, Con-Way Incorporated (a transportation, logistics and supply chain management service company) (2014-2015); Executive Vice President and Chief Financial Officer, Whirlpool Corporation (an appliance manufacturer and marketer) (2004- 2012). Previously, Mr. Templin served as an Advisory Board Member of Goldman Sachs Trust and Goldman Sachs Variable Insurance Trust (June 2013-October 2013). Trustee — Goldman Sachs Trust and Goldman Sachs Variable Insurance Trust. | | 104 | | Armstrong World Industries, Inc. (a ceiling, wall and suspension system solutions manufacturer) |
Gregory G. Weaver Age: 65 | | Trustee | | Since 2015 | | Mr. Weaver is retired. He is Director, Verizon Communications Inc. (2015-Present); and was formerly Chairman and Chief Executive Officer, Deloitte & Touche LLP (a professional services firm) (2001-2005 and 2012-2014); and Member of the Board of Directors, Deloitte & Touche LLP (2006-2012). Trustee — Goldman Sachs Trust and Goldman Sachs Variable Insurance Trust. | | 104 | | Verizon Communications Inc. |
34
GOLDMAN SACHS STRATEGIC FACTOR ALLOCATION FUND
Trustees and Officers (Unaudited) (continued)
Interested Trustee*
| | | | | | | | | | |
Name, Address and Age1 | | Position(s) Held with the Trust | | Term of Office and Length of Time Served2 | | Principal Occupation(s) During Past 5 Years | | Number of Portfolios in Fund Complex Overseen by Trustee3 | | Other Directorships Held by Trustee4 |
James A. McNamara Age: 54 | | President and Trustee | | Since 2007 | | Managing Director, Goldman Sachs (December 1998-Present); Director of Institutional Fund Sales, GSAM (April 1998-December 2000); and Senior Vice President and Manager, Dreyfus Institutional Service Corporation (January 1993- April 1998). President and Trustee — Goldman Sachs Trust; Goldman Sachs Variable Insurance Trust; Goldman Sachs Trust II; Goldman Sachs MLP Income Opportunities Fund; Goldman Sachs MLP and Energy Renaissance Fund; and Goldman Sachs ETF Trust. | | 142 | | None |
| | | | | | | | | | |
| * | | Mr. McNamara is considered to be an “Interested Trustee” because he holds positions with Goldman Sachs and owns securities issued by The Goldman Sachs Group, Inc. Mr. McNamara holds comparable positions with certain other companies of which Goldman Sachs, GSAM or an affiliate thereof is the investment adviser, administrator and/or distributor. |
| 1 | | Each Trustee may be contacted by writing to the Trustee, c/o Goldman Sachs, 200 West Street, New York, New York, 10282, Attn: Caroline Kraus. Information is provided as of August 31, 2017. |
| 2 | | Subject to such policies as may be adopted by the Board from time-to-time, each Trustee holds office for an indefinite term, until the earliest of: (a) the election of his or her successor; (b) the date the Trustee resigns or is removed by the Board or shareholders, in accordance with the Trust’s Declaration of Trust; or (c) the termination of the Trust. The Board has adopted policies which provide that (a) no Trustee shall hold office for more than 15 years and (b) a Trustee shall retire as of December 31st of the calendar year in which he or she reaches his or her 74th birthday, unless a waiver of such requirement shall have been adopted by a majority of the other Trustees. These policies may be changed by the Trustees without shareholder vote. One Trustee has been granted a waiver from the foregoing policies which permits him to serve until December 31, 2017. |
| 3 | | The Goldman Sachs Fund Complex includes certain other companies listed above for each respective Trustee. As of August 31, 2017, Goldman Sachs Trust consisted of 90 portfolios (88 of which offered shares to the public); Goldman Sachs Variable Insurance Trust consisted of 14 portfolios; Goldman Sachs Trust II consisted of 17 portfolios (16 of which offered shares to the public); Goldman Sachs BDC, Inc., Goldman Sachs Private Middle Market Credit LLC, Goldman Sachs MLP Income Opportunities Fund, and Goldman Sachs MLP and Energy Renaissance Fund each consisted of one portfolio; and Goldman Sachs ETF Trust consisted of 19 portfolios (eight of which offered shares to the public). Goldman Sachs Private Middle Market Credit LLC does not offer shares to the public. |
| 4 | | This column includes only directorships of companies required to report to the Securities and Exchange Commission under the Securities Exchange Act of 1934 (i.e., “public companies”) or other investment companies registered under the Act. |
Additional information about the Trustees is available in the Portfolio’s Statement of Additional Information, which can be obtained from Goldman Sachs free of charge by calling this toll-free number (in the United States of America): 1-800-526-7384.
35
GOLDMAN SACHS STRATEGIC FACTOR ALLOCATION FUND
Trustees and Officers (Unaudited) (continued)
Officers of the Trust*
| | | | | | |
Name, Address and Age1 | | Position(s) Held with the Trust | | Term of
Office and
Length of
Time Served2 | | Principal Occupation(s) During Past 5 Years |
James A. McNamara 200 West Street New York, NY 10282 Age: 54 | | Trustee and President | | Since 2007 | | Managing Director, Goldman Sachs (December 1998-Present); Director of Institutional Fund Sales, GSAM (April 1998-December 2000); and Senior Vice President and Manager, Dreyfus Institutional Service Corporation (January 1993-April 1998). President and Trustee — Goldman Sachs Trust; Goldman Sachs Variable Insurance Trust; Goldman Sachs Trust II; Goldman Sachs MLP Income Opportunities Fund; Goldman Sachs MLP and Energy Renaissance Fund; and Goldman Sachs ETF Trust. |
Caroline L. Kraus 200 West Street New York, NY 10282 Age: 40 | | Secretary | | Since 2012 | | Managing Director, Goldman Sachs (January 2016-Present); Vice President, Goldman Sachs (August 2006-December 2015); Associate General Counsel, Goldman Sachs (2012-Present); Assistant General Counsel, Goldman Sachs (August 2006-December 2011); and Associate, Weil, Gotshal & Manges, LLP (2002-2006). Secretary — Goldman Sachs Trust (previously Assistant Secretary (2012)); Goldman Sachs Variable Insurance Trust (previously Assistant Secretary (2012)); Goldman Sachs Trust II; Goldman Sachs BDC, Inc.; Goldman Sachs Private Middle Market Credit LLC; Goldman Sachs Middle Market Lending Corp.; Goldman Sachs MLP Income Opportunities Fund; Goldman Sachs MLP and Energy Renaissance Fund; and Goldman Sachs ETF Trust. |
Scott M. McHugh 200 West Street New York, NY 10282 Age: 45 | | Treasurer, Senior Vice President and Principal Financial Officer | | Since 2009 (Principal Financial Officer since 2013) | | Managing Director, Goldman Sachs (January 2016-Present); Vice President, Goldman Sachs (February 2007-December 2015); Assistant Treasurer of certain mutual funds administered by DWS Scudder (2005-2007); and Director (2005-2007), Vice President (2000-2005), and Assistant Vice President (1998-2000), Deutsche Asset Management or its predecessor (1998-2007). Treasurer, Senior Vice President and Principal Financial Officer — Goldman Sachs Trust; Goldman Sachs Variable Insurance Trust; Goldman Sachs Trust II; Goldman Sachs MLP Income Opportunities Fund; Goldman Sachs MLP and Energy Renaissance Fund; and Goldman Sachs ETF Trust. |
Joseph F. DiMaria 30 Hudson Street Jersey City, NJ 07302 Age: 49 | | Assistant Treasurer and Principal Accounting Officer | | Since 2016 (Principal Accounting Officer since 2017) | | Managing Director, Goldman Sachs (November 2015-Present) and Vice President — Mutual Fund Administration, Columbia Management Investment Advisers, LLC (May 2010-October 2015). Assistant Treasurer and Principal Accounting Officer — Goldman Sachs Trust; Goldman Sachs Variable Insurance Trust; Goldman Sachs Trust II; Goldman Sachs MLP Income Opportunities Fund; Goldman Sachs MLP and Energy Renaissance Fund; and Goldman Sachs ETF Trust. |
| | | | | | |
| * | | Represents a partial list of officers of the Trust. Additional information about all the officers is available in the Funds’ Statement of Additional Information, which can be obtained from Goldman Sachs free of charge by calling this toll-free number (in the United States): 1-800-526-7384. |
| 1 | | Information is provided as of August 31, 2017. |
| 2 | | Officers hold office at the pleasure of the Board of Trustees or until their successors are duly elected and qualified. Each officer holds comparable positions with certain other companies of which Goldman Sachs, GSAM or an affiliate thereof is the investment adviser, administrator and/or distributor. |
Goldman Sachs Trust — Strategic Factor Allocation Fund — Tax Information (Unaudited)
For the year ended August 31, 2017, 1.18% of the dividends paid from net investment company taxable income by the Strategic Factor Allocation Fund qualify for the dividends received deduction available to corporations.
Pursuant to Section 852 of the Internal Revenue Code, the Strategic Factor Allocation Fund designates $2,620,892, or if different, the maximum amount allowable, as capital gain dividends paid during the fiscal year ended August 31, 2017.
For the year ended August 31, 2017, the Strategic Factor Allocation Fund designates 1.10%, of the dividends paid from net investment company taxable income as qualifying for the reduced tax rate under the Jobs and Growth Tax Relief and Reconciliation Act of 2003.
During the year ended August 31, 2017, the Strategic Factor Allocation Fund designates $1,759,574, as short-term capital gain dividends pursuant to Section 871(k) of the Internal Revenue Code.
36
FUND PROFILE
Goldman Sachs Funds
Goldman Sachs is a premier financial services firm, known since 1869 for creating thoughtful and customized investment solutions in complex global markets.
Today, the Investment Management Division of Goldman Sachs serves a diverse set of clients worldwide, including private institutions, public entities and individuals. With approximately $1.21 trillion in assets under supervision as of June 30, 2017, Goldman Sachs Asset Management (“GSAM”) has portfolio management teams located around the world and our investment professionals bring firsthand knowledge of local markets to every investment decision. Assets under supervision includes assets under management and other client assets for which Goldman Sachs does not have full discretion. GSAM leverages the resources of Goldman Sachs & Co. LLC subject to legal, internal and regulatory restrictions.
Money Market
Financial Square FundsSM
| ∎ | | Financial Square Treasury Solutions Fund1 |
| ∎ | | Financial Square Government Fund1 |
| ∎ | | Financial Square Money Market Fund2 |
| ∎ | | Financial Square Prime Obligations Fund2 |
| ∎ | | Financial Square Treasury Instruments Fund1 |
| ∎ | | Financial Square Treasury Obligations Fund1 |
| ∎ | | Financial Square Federal Instruments Fund1 |
| ∎ | | Financial Square Tax-Exempt Money Market Fund2 |
Investor FundsSM
| ∎ | | Investor Money Market Fund3 |
| ∎ | | Investor Tax-Exempt Money Market Fund3 |
Fixed Income
Short Duration and Government
| ∎ | | High Quality Floating Rate Fund |
| ∎ | | Short-Term Conservative Income Fund |
| ∎ | | Short Duration Government Fund |
| ∎ | | Short Duration Income Fund |
| ∎ | | Inflation Protected Securities Fund |
Multi-Sector
Municipal and Tax-Free
| ∎ | | High Yield Municipal Fund |
| ∎ | | Dynamic Municipal Income Fund |
| ∎ | | Short Duration Tax-Free Fund |
Single Sector
| ∎ | | Investment Grade Credit Fund |
| ∎ | | High Yield Floating Rate Fund |
| ∎ | | Emerging Markets Debt Fund |
| ∎ | | Local Emerging Markets Debt Fund |
| ∎ | | Dynamic Emerging Markets Debt Fund |
Fixed Income Alternatives
| ∎ | | Long Short Credit Strategies Fund |
Fundamental Equity
| ∎ | | Small/Mid Cap Value Fund |
| ∎ | | Small/Mid Cap Growth Fund |
| ∎ | | Concentrated Growth Fund7 |
| ∎ | | Technology Opportunities Fund |
| ∎ | | Growth Opportunities Fund |
| ∎ | | Rising Dividend Growth Fund |
Tax-Advantaged Equity
| ∎ | | U.S. Tax-Managed Equity Fund |
| ∎ | | International Tax-Managed Equity Fund |
| ∎ | | U.S. Equity Dividend and Premium Fund |
| ∎ | | International Equity Dividend and Premium Fund |
Equity Insights
| ∎ | | Small Cap Equity Insights Fund |
| ∎ | | U.S. Equity Insights Fund |
| ∎ | | Small Cap Growth Insights Fund |
| ∎ | | Large Cap Growth Insights Fund |
| ∎ | | Large Cap Value Insights Fund |
| ∎ | | Small Cap Value Insights Fund |
| ∎ | | International Small Cap Insights Fund |
| ∎ | | International Equity Insights Fund |
| ∎ | | Emerging Markets Equity Insights Fund |
Fundamental Equity International
| ∎ | | Strategic International Equity Fund |
| ∎ | | Focused International Equity Fund |
| ∎ | | Emerging Markets Equity Fund |
Select Satellite
| ∎ | | Real Estate Securities Fund |
| ∎ | | International Real Estate Securities Fund |
| ∎ | | Commodity Strategy Fund |
| ∎ | | Global Real Estate Securities Fund |
| ∎ | | Alternative Premia Fund9 |
| ∎ | | Absolute Return Tracker Fund |
| ∎ | | Managed Futures Strategy Fund |
| ∎ | | MLP Energy Infrastructure Fund |
| ∎ | | Multi-Manager Alternatives Fund |
| ∎ | | Absolute Return Multi-Asset Fund |
| ∎ | | Global Infrastructure Fund |
Total Portfolio Solutions
| ∎ | | Global Managed Beta Fund |
| ∎ | | Multi-Manager Non-Core Fixed Income Fund |
| ∎ | | Multi-Manager U.S. Dynamic Equity Fund |
| ∎ | | Multi-Manager Global Equity Fund |
| ∎ | | Multi-Manager International Equity Fund |
| ∎ | | Tactical Tilt Overlay Fund |
| ∎ | | Balanced Strategy Portfolio |
| ∎ | | Multi-Manager U.S. Small Cap Equity Fund |
| ∎ | | Multi-Manager Real Assets Strategy Fund |
| ∎ | | Growth and Income Strategy Portfolio |
| ∎ | | Growth Strategy Portfolio |
| ∎ | | Equity Growth Strategy Portfolio |
| ∎ | | Satellite Strategies Portfolio |
| ∎ | | Enhanced Dividend Global Equity Portfolio |
| ∎ | | Tax-Advantaged Global Equity Portfolio |
| ∎ | | Strategic Factor Allocation Fund |
| ∎ | | Target Date 2020 Portfolio |
| ∎ | | Target Date 2025 Portfolio |
| ∎ | | Target Date 2030 Portfolio |
| ∎ | | Target Date 2035 Portfolio |
| ∎ | | Target Date 2040 Portfolio |
| ∎ | | Target Date 2045 Portfolio |
| ∎ | | Target Date 2050 Portfolio |
| ∎ | | Target Date 2055 Portfolio |
| ∎ | | GQG Partners International Opportunities Fund |
| 1 | | You could lose money by investing in the Fund. Although the Fund seeks to preserve the value of your investment at $1.00 per share, it cannot guarantee it will do so. An investment in the Fund is not a deposit of a bank and is not insured or guaranteed by the Federal Deposit Insurance Corporation or any other government agency. The Fund’s sponsor has no legal obligation to provide financial support to the Fund, and you should not expect that the sponsor will provide financial support to the Fund at any time. |
| 2 | | You could lose money by investing in the Fund. Because the share price of the Fund will fluctuate, when you sell your shares they may be worth more or less than what you originally paid for them. The Fund may impose a fee upon sale of your shares or may temporarily suspend your ability to sell shares if the Fund’s liquidity falls below required minimums because of market conditions or other factors. An investment in the Fund is not a deposit of a bank and is not insured or guaranteed by the Federal Deposit Insurance Corporation or any other government agency. The Fund’s sponsor has no legal obligation to provide financial support to the Fund, and you should not expect that the sponsor will provide financial support to the Fund at any time. |
| 3 | | You could lose money by investing in the Fund. Although the Fund seeks to preserve the value of your investment at $1.00 per share, it cannot guarantee it will do so. The Fund may impose a fee upon sale of your shares or may temporarily suspend your ability to sell shares if the Fund’s liquidity falls below required minimums because of market conditions or other factors. An investment in the Fund is not a deposit of a bank and is not insured or guaranteed by the Federal Deposit Insurance Corporation or any other government agency. The Fund’s sponsor has no legal obligation to provide financial support to the Fund, and you should not expect that the sponsor will provide financial support to the Fund at any time. |
| 4 | | Effective on June 20, 2017, the Goldman Sachs Fixed Income Macro Strategies Fund was renamed the Goldman Sachs Strategic Macro Fund. |
| 5 | | Effective on June 20, 2017, the Goldman Sachs Growth and Income Fund was renamed the Goldman Sachs Equity Income Fund. |
| 6 | | Effective after the close of business on August 31, 2017, the Goldman Sachs Flexible Cap Growth Fund was renamed the Goldman Sachs Flexible Cap Fund. |
| 7 | | Effective on July 28, 2017, the Goldman Sachs Focused Growth Fund was reorganized with and into the Goldman Sachs Concentrated Growth Fund. |
| 8 | | Effective after the close of business on October 31, 2017, the Goldman Sachs Dynamic U.S. Equity Fund was renamed the Goldman Sachs Blue Chip Fund. |
| 9 | | Effective after the close of business on October 30, 2017, the Goldman Sachs Dynamic Allocation Fund was renamed the Goldman Sachs Alternative Premia Fund. |
Financial Square FundsSM and Investor FundsSM are registered service marks of Goldman Sachs & Co. LLC.
| * | | This list covers open-end funds only. Please visit our website at www.GSAMFUNDS.com to learn about our closed-end funds and exchange-traded funds. |
| | |
TRUSTEES Ashok N. Bakhru, Chairman Kathryn A. Cassidy Diana M. Daniels Herbert J. Markley James A. McNamara Jessica Palmer Roy W. Templin Gregory G. Weaver | | OFFICERS James A. McNamara, President Scott M. McHugh, Treasurer, Senior Vice President and Principal Financial Officer Joseph F. DiMaria, Assistant Treasurer and Principal Accounting Officer Caroline L. Kraus, Secretary |
| |
GOLDMAN SACHS & CO. LLC Distributor and Transfer Agent | | GOLDMAN SACHS ASSET MANAGEMENT, L.P. Investment Adviser |
Visit our web site at www.GSAMFUNDS.com to obtain the most recent month-end returns.
Goldman Sachs Asset Management, L.P. 200 West Street, New York, New York 10282
The reports concerning the Portfolio included in this shareholder report may contain certain forward-looking statements about the factors that may affect the performance of the Portfolio in the future. These statements are based on Portfolio management’s predictions and expectations concerning certain future events and their expected impact on the Portfolio, such as performance of the economy as a whole and of specific industry sectors, changes in the levels of interest rates, the impact of developing world events, and other factors that may influence the future performance of the Portfolio. Management believes these forward-looking statements to be reasonable, although they are inherently uncertain and difficult to predict. Actual events may cause adjustments in portfolio management strategies from those currently expected to be employed.
A description of the policies and procedures that the Portfolio uses to determine how to vote proxies relating to portfolio securities and information regarding how the Portfolio voted proxies relating to portfolio securities for the most recent 12-month period ended June 30, are available (I) without charge, upon request by calling 1-800-526-7384; and (II) on the Securities and Exchange Commission (“SEC’’) web site at http://www.sec.gov.
The Portfolio files its complete schedule of portfolio holdings with the SEC for the first and third quarters of each fiscal year on Form N-Qs. The Portfolio’s Form N-Qs are available on the SEC’s web site at http://www.sec.gov within 60 days after the Portfolio’s first and third fiscal quarters. The Portfolio’s Form N-Qs may be reviewed and copied at the SEC’s Public Reference Room in Washington, D.C. and information on the operation of the Public Reference Room may also be obtained by calling 1-800-SEC-0330. Form N-Qs may be obtained upon request and without charge by calling 1-800-621-2550.
Portfolio holdings and allocations shown are as of August 31, 2017 and may not be representative of future investments. Portfolio holdings should not be relied on in making investment decisions and should not be construed as research or investment advice regarding particular securities. Current and future holdings are subject to risk.
The portfolio risk management process includes an effort to monitor and manage risk, but does not imply low risk.
Goldman Sachs & Co. LLC (“Goldman Sachs”) does not provide legal, tax or accounting advice. Any statement contained in this communication (including any attachments) concerning U.S. tax matters was not intended or written to be used, and cannot be used, for the purpose of avoiding penalties under the Internal Revenue Code, and was written to support the promotion or marketing of the transaction(s) or matter(s) addressed. Clients of Goldman Sachs should obtain their own independent tax advice based on their particular circumstances.
THIS MATERIAL IS FOR INFORMATIONAL PURPOSES ONLY AND IS PROVIDED SOLELY ON THE BASIS THAT IT WILL NOT CONSTITUTE INVESTMENT OR OTHER ADVICE OR A RECOMMENDATION RELATING TO ANY PERSON’S OR PLAN’S INVESTMENT OR OTHER DECISIONS, AND GOLDMAN SACHS IS NOT A FIDUCIARY OR ADVISOR WITH RESPECT TO ANY PERSON OR PLAN BY REASON OF PROVIDING THE MATERIAL OR CONTENT HEREIN INCLUDING UNDER THE EMPLOYEE RETIREMENT INCOME SECURITY ACT OF 1974 OR DEPARTMENT OF LABOR REGULATIONS. PLAN SPONSORS AND OTHER FIDUCIARIES SHOULD CONSIDER THEIR OWN CIRCUMSTANCES IN ASSESSING ANY POTENTIAL COURSE OF ACTION.
This material is not authorized for distribution to prospective investors unless preceded or accompanied by a current Prospectus or summary prospectus, if applicable. Investors should consider a portfolio’s objective, risks, and charges and expenses, and read the summary prospectus, if available, and/or the Prospectus carefully before investing or sending money. The summary prospectus, if available, and the Prospectus contain this and other information about a fund and may be obtained from your authorized dealer or from Goldman Sachs & Co. LLC by calling 1-800-621-2550.
© 2017 Goldman Sachs. All rights reserved. 107533-TMPL-10/2017-630687 STRATFACALAR-17/675
Goldman Sachs Funds

| | | | |
| | |
| Annual Report | | | | August 31, 2017 |
| | |
| | | | Tactical Tilt Overlay Fund |

Goldman Sachs Tactical Tilt Overlay Fund
| | | | |
| | | |
| NOT FDIC-INSURED | | May Lose Value | | No Bank Guarantee |
PORTFOLIO RESULTS
Goldman Sachs Tactical Tilt Overlay Fund
Investment Objective and Principal Strategy
The Portfolio seeks long-term total return.
Portfolio Management Discussion and Analysis
The Board of Trustees of Goldman Sachs Trust has approved a change to the fiscal year end of the Goldman Sachs Tactical Tilt Overlay Fund (the “Portfolio”). Effective August 25, 2017, the Portfolio’s fiscal year end changed from October 31 to August 31. Below, the Goldman Sachs Global Portfolio Solutions Team discusses the Portfolio’s performance and positioning for the period from November 1, 2016 through August 31, 2017 (the “Reporting Period”).
| Q | | How did the Portfolio perform during the Reporting Period? |
| A | | During the Reporting Period, the Portfolio’s Institutional Shares generated a cumulative total return, without sales charges, of 0.82%. This return compares to the 0.85% cumulative total return of the Portfolio’s benchmark, the Bank of America Merrill Lynch U.S. Dollar Three-Month LIBOR Constant Maturity Index (the “Index”), during the same time period. |
| | | References to the Portfolio’s benchmark and to other indices mentioned herein are for informational purposes only, and unless otherwise noted, are not indications of how the Portfolio is managed. The use of the Index as the Portfolio’s benchmark does not imply the Portfolio is being managed like cash and does not imply low risk or low volatility. |
| Q | | What economic and market factors most influenced the Portfolio during the Reporting Period? |
| A | | Investor sentiment was dominated during the Reporting Period by global central bank monetary policy, geopolitical events and uncertainty about the ability of the new U.S. Administration to enact policy. |
| | | During the first part of the Reporting Period, investors were focused largely on the November 2016 U.S. presidential election and the unexpected outcome. Markets reacted positively following the results, as the potential of significant infrastructure spending, lower taxes and lighter regulation increased expectations for economic growth and inflation. Reflecting market optimism about a continued upward trend in U.S. economic growth, the CBOE Volatility Index® (“VIX®”) approached its post financial crisis low after the elections. U.S. banks and small-cap equities were among the chief beneficiaries of the “risk on” sentiment, or increased risk appetite, that emerged following the election. In contrast, emerging markets assets (specifically, equities and currencies) struggled on market concerns about new U.S. policies that could have protectionist implications. With regards to commodities, the Organization of the Petroleum Exporting Countries (“OPEC”) announced the most comprehensive supply cut in a decade, leading to a sharp recovery in crude oil prices. The currencies of oil-exporting countries, as well as energy-related high yield corporate bonds, responded positively to the recovery in crude oil prices, recording significant gains near the end of 2016. |
| | | The “risk on” rally, which continued into the first part of 2017, was further supported by a stream of better than consensus expected U.S. economic data, reflected in non-farm payroll numbers, purchasing managers’ indices, and consumer- and producer-sentiment gauges — which together reinforced opinions about a more positive macroeconomic picture. In addition, the U.S. inflation rate rose higher than the Federal Reserve’s (“Fed”) stated 2.0% target. These factors, along with positive survey data, led Fed policymakers, who had previously raised short-term interest rates in December 2016, to guide market expectations toward another rate hike in March 2017. As a result, the March rate increase caused minimal market disruption. Fed officials also said that several interest rate hikes could occur during 2017, and the minutes from the Fed’s March policy meeting indicated that balance sheet normalization might begin by the end of the calendar year. (Balance sheet normalization refers to the steps the Fed will take to reverse quantitative easing and remove the substantial monetary accommodation it has provided to the economy since the financial crisis began in 2007.) However, economic data at the end of the first quarter of 2017 failed to keep up with lofty survey data. Additionally, the U.S. Administration was unsuccessful in its first attempt to pass a health care bill, raising concern about its ability to enact |
1
PORTFOLIO RESULTS
| | legislation related to taxes and infrastructure. In this environment, global stocks gave up some of their gains, with cyclical stocks generally underperforming defensive stocks. Yields fell, driving a rally in the U.S. Treasury market, and the U.S. dollar weakened. Sharp rallies followed in emerging markets assets, particularly emerging markets currencies. In Europe, optimism about the European Central Bank’s (“ECB”) tapering of its asset purchases, as well as positive purchasing managers’ data, was well received by investors, who nevertheless remained cautious given political uncertainties surrounding the then-upcoming presidential election in France. |
| | | Investor sentiment in Europe remained pro-risk during the second calendar quarter, driven by the outcome of the French election, broadly improving global economic growth and robust corporate earnings reports. In France, the victory of the centrist candidate was viewed as positive by many market participants, leading to strong rallies in European equities and the euro. In the U.S., Fed policymakers noted the fundamentals underpinning consumption growth remained solid despite data showing lackluster first quarter 2017 economic growth. At its June 2017 policy meeting, the Fed raised interest rates for the second time during the calendar year. Meanwhile, the U.S. dollar continued to weaken. The U.S. Dollar Index hit 15-month lows during the final months of the Reporting Period on the possibility the Fed might not deliver a third interest rate hike in 2017. Falling expectations about successful tax reform also put pressure on the U.S. dollar. In contrast, the euro reached its highest level since the start of 2015, as markets anticipated adjustments to the ECB’s quantitative easing program toward the end of 2017. Commodities, specifically crude oil, struggled due to oversupply concerns even though OPEC announced extended output cuts. The continued weakness of the U.S. dollar, easier financial conditions and a more stable macro environment pushed emerging markets assets higher, led by Chinese equities. |
| Q | | What key factors were responsible for the Portfolio’s performance during the Reporting Period? |
| A | | The Portfolio seeks to achieve its investment objective through the implementation of investment ideas that are generally derived from short-term or medium-term market views on a variety of asset classes and instruments. |
| | | Within equities during the Reporting Period, the Portfolio’s exposure to European equities contributed positively, highlighted by long positions in Spanish equities and EURO STOXX 50® 2018 dividend futures. Spain’s equity market advanced on the strong performance of bank stocks as well as on positive sentiment about the country’s economic recovery. In addition, the Portfolio benefited from its exposure to U.S. equities, broadly led by long positions in large-cap banks. U.S. bank stocks performed well due, in part, to the new U.S. Administration’s push for less banking regulation in the future. Conversely, the Portfolio was hurt by its holdings of U.S. equity index options, specifically those used to gain exposure to U.S. energy stocks and those used to hedge U.S. stock market exposure. |
| | | Within fixed income, the Portfolio was helped by its long position in energy-related high yield corporate bonds. Energy companies’ fundamentals had improved in recent years, and as a result, energy-related high yield corporate bonds were less sensitive to the decline in oil prices toward the end of the Reporting Period. Additionally, the Portfolio’s long position in high yield loans contributed positively, as spreads (or yield differentials versus other bonds of comparable duration) compressed and high yield issuers experienced fewer defaults between January 2017 and August 2017 than they had during the same period in 2016. However, a short position in five-year German government bonds detracted from the Portfolio’s performance. German bund yields, which had risen early in the Reporting Period, fell in the first quarter of 2017 amid a broad-based flight to quality and due to concerns about the then-upcoming French presidential election. |
| | | Regarding its currency exposures, the Portfolio benefited from a long position in the British pound versus a short position in the U.S. dollar. The British pound appreciated after the U.K. prime minister called for early elections as she sought more parliamentary support for Brexit. (Brexit refers to the U.K.’s decision to exit the European Union.) Also, as mentioned previously, the U.S. Dollar Index hit 15-month lows on speculation the Fed might not raise interest rates a third time during 2017. On the other hand, a long position in the U.S. dollar versus a short position in the Japanese yen detracted from Portfolio returns, as the U.S. President struggled to unite the Republican Party behind his agenda. Also, the Japanese yen strengthened as market sentiment shifted after the U.S. military launched a missile strike on a Syrian government airbase. Elsewhere, a short position in the Chinese renminbi hurt the Portfolio’s results during the Reporting Period. |
2
PORTFOLIO RESULTS
| | | Within commodities, the Portfolio’s position in natural gas futures contributed positively during the first half of the Reporting Period, as U.S. natural gas exports to Mexico increased and natural gas inventories fell as a result. However, the Portfolio was hurt by this positioning during the Reporting Period overall amid cooler than expected summer temperatures across the U.S. |
| Q | | How was the Portfolio positioned at the beginning of the Reporting Period? |
| A | | At the beginning of the Reporting Period, the Portfolio had approximately 12.85% of its total net assets invested in long equity-related investments; approximately 18.94% of its total net assets invested in long fixed income-related investments; and approximately 12.23% of its total net assets invested in long currency-related investments. The Portfolio did not have any of its total net assets invested in commodity-related investments at the start of the Reporting Period. It had short positions of approximately -0.49% of its total net assets in equity-related investments and approximately -6.24% of its total net assets in fixed income-related investments. |
| | | The above sector breakout is inclusive of derivative exposure across all asset classes, but it does not necessarily include the cash held to support those positions. Derivatives positions are mostly supported by cash held in the Portfolio specifically to cover its exposure and any potential margin calls or future losses experienced. Given the line-up of positions held, most of them were derivatives-based, so the cash allocation at the beginning of the Reporting Period was high. |
| Q | | How did you tactically manage the Portfolio’s allocations during the Reporting Period? |
| A | | During the Reporting Period, in response to shifting macroeconomic and market dynamics, we made a number of changes to the Portfolio’s exposures. Broadly speaking, we increased the Portfolio’s exposure to risk by expanding its allocation to currencies and reintroducing an allocation to commodities. |
| | | In terms of equity-related exposures, we first modulated and then, by the middle of the Reporting Period, eliminated the Portfolio’s hedging positions on U.S. equities, which had been implemented using put options on the S&P 500® Index as we sought to provide potential downside protection against unexpected risks. (A put option is an option contract giving the owner the right, but not the obligation, to sell a specified amount of an underlying asset at a specified price within a specified time.) Near the end of the Reporting Period, we reintroduced these hedging positions as we believed both that S&P 500® Index put options were attractively priced and that risks had increased due to U.S. debt ceiling negotiations and 2018 budget resolutions. Also, we initiated and subsequently increased a short position in S&P 500® Energy Index put options, which could provide the Portfolio with premium income or allow it to gain exposure to the U.S. energy sector at what we considered attractive valuations. Toward the end of the Reporting Period, we reduced this short position due to uncertainty about oil prices. |
| | | In addition, we decreased the Portfolio’s long position in large-cap U.S. banking stocks early in the Reporting Period to capture some profits. We also reduced the Portfolio’s long position in Spanish equities during the Reporting Period. Furthermore, we initiated a long position in EURO STOXX 50® 2018 dividend futures to take advantage of what we expected to be accelerating European economic growth as well as increased 2017 corporate earnings, which could help push dividends higher in 2018. |
| | | In fixed income, we increased the Portfolio’s short position in five-year German government bonds early in the Reporting Period, as the ECB’s expected monetary policy stance had been turning more neutral with the potential for modest hawkishness in the future. (Hawkish implies higher interest rates; opposite of dovish.) Subsequently, we reduced this position as market prices moved closer to our expectations and started to reflect the possible end of ECB asset purchases and perhaps the beginning of a rate hiking cycle in 2018. In addition, we reduced the Portfolio’s long position in energy-related high yield corporate bonds, as we sought to take advantage of what we considered attractive prices and capture profits heading into year-end 2016. In the first quarter of 2017, we eliminated the Portfolio’s allocation to U.S. high yield corporate bonds in order to capture profits and to increase its allocation to U.S. high yield loans. Also, during the Reporting Period, we initiated a long position in New Zealand interest rate swaps, which had the potential, we believed, to generate additional yield for the Portfolio. In our view, the fixed income market might have overpriced the path of rate hikes by the New Zealand central bank. In the latter part of the Reporting Period, we removed this position as market prices appeared to move into line with our expectations, reducing the risk/reward potential, in our view. |
| | | Regarding currency-related exposures, the Portfolio maintained a short position in the Chinese renminbi for most of the Reporting Period, which we reduced and then |
3
PORTFOLIO RESULTS
| | eliminated at the end of the Reporting Period. The U.S. dollar weakened in 2017 year-to-date through the end of August, and Chinese officials had demonstrated their willingness to maintain currency stability. In addition, we adopted and subsequently increased a long position in the U.S. dollar versus a short position in the Japanese yen, as we sought to take advantage of the diverging monetary policy of the Fed and Bank of Japan. We also initiated and increased a long position in the British pound versus a short position in the U.S. dollar due in part to what we saw as attractive U.K. economic data and in part to purchases of U.K.-domiciled assets by foreign investors. In addition, we eliminated the Portfolio’s short position in the euro versus its long position in the U.S. dollar, as the currency markets provided us with what we felt were attractive risk/reward opportunities to scale back the position. We reintroduced this positioning toward the end of the Reporting Period because of diminishing investment flows into euro-denominated assets as well as softer U.S. economic data, which could lead, in our opinion, to positive surprises in the future. |
| | | Separately, we increased the Portfolio’s allocation to master limited partnerships during the Reporting Period. We also initiated a position in natural gas futures to take advantage of potential price increases following a mild winter and a rebound in natural gas production. |
| | | In addition, as part of our ongoing efforts to manage free cash with the Portfolio, we moved some cash holdings from the Goldman Sachs Financial Square Government Fund to a separate account composed of highly rated short duration fixed income securities. |
| Q | | How did the Portfolio use derivatives and similar instruments during the Reporting Period? |
| A | | The Portfolio used derivatives and similar instruments as part of its investment strategy to express views implemented in the Portfolio. Positions were supported predominantly by cash held in the Portfolio specifically to cover its exposure to derivative instruments and any potential margin calls or future losses experienced. |
| | | During the Reporting Period, the Portfolio employed equity and commodity futures, currency forwards and options to express active investment views with greater versatility across regional equity markets, global market sectors, commodities markets and currency markets. The Portfolio’s use of equity futures, especially those used to gain exposure to select European equity markets, such as Spain, had a positive impact on performance. Commodities futures, employed to express our views on natural gas prices, detracted from results. The use of currency forwards, driven primarily by the Portfolio’s short position in the Chinese renminbi, detracted from performance. To afford greater risk management precision, options on equity indices were also utilized to tactically adjust the amount of equity risk and downside risk in the Portfolio. The Portfolio’s use of equity options, led by put options on the S&P 500® Index, had a negative impact on performance. In addition, interest rate swaps and German bund futures were employed to express our views on the direction of interest rates. The use of German bund futures had a negative impact on the Portfolio’s performance, while the use of interest rate swaps to gain exposure to New Zealand interest rates had a slightly positive impact on performance during the Reporting Period. |
| Q | | How was the Portfolio positioned at the end of the Reporting Period? |
| A | | At the end of the Reporting Period, the Portfolio had approximately 13.11% of its total net assets invested in long equity-related investments; approximately 22.90% of its total net assets invested in long fixed income-related investments; approximately 25.48% of its total net assets invested in long currency-related investments; and approximately 3.42% of its total net assets invested in long commodity-related investments. It had short positions of approximately -0.13% of its total net assets in equity-related investments and approximately -6.45% of its total net assets in fixed income-related investments. As mentioned previously, we moved some of the Portfolio’s cash holdings from the Goldman Sachs Financial Square Government Fund to a separate account composed of highly rated short duration fixed income securities during the Reporting Period. |
| | | The above sector breakout is inclusive of derivative exposure across all asset classes, but it does not necessarily include the cash held to support those positions. Derivatives positions are mostly supported by cash held in the Portfolio specifically to cover its exposure and any potential margin calls or future losses experienced. Given the line-up of positions held, most of them were derivatives-based, so the cash allocation at the end of the Reporting Period was lower than at the beginning of the Reporting Period but still high. |
| Q | | What is the Portfolio’s tactical asset allocation view and strategy for the months ahead? |
| A | | At the end of the Reporting Period, the Portfolio remained positioned for potential improvement in global economic growth, with modest improvement in economic growth rates |
4
PORTFOLIO RESULTS
| | possible in the U.S., Europe and many emerging markets economies, in our view. More specifically, we believed the “longer-than-normal” U.S. economic recovery was likely to support equity returns, which could exceed those of bonds and cash equivalents in the months ahead. In addition, we expected continued stabilization in crude oil prices and energy prices overall to provide opportunities for our energy-related tactical positions to recoup some recent losses. We expected Fed policymakers to maintain accommodative monetary policy, as evidenced by the slow and steady pace at which they are raising the federal funds target rate. However, we do not exclude the possibility of another rate hike in December 2017. Overall, we remained positive on the U.S. dollar. That said, we saw a number of potential risks, including growing geopolitical concerns, the spread of terrorism and the increase in cyberattacks. We intend to continue to be vigilant about these risks as we seek to take advantage of tactical opportunities going forward. At the end of the Reporting Period, we favored U.S. and European equities and were monitoring the Portfolio’s allocations to high yield loans. |
5
PORTFOLIO RESULTS
Index Definitions
The Bank of America Merrill Lynch U.S. Dollar Three-Month LIBOR Constant Maturity Index is based on the assumed purchase of a synthetic instrument having three months to maturity and with a coupon equal to the closing quote for three-month LIBOR. That issue is sold the following day (priced at a yield equal to the current day closing three-month LIBOR rate) and is rolled into a new three-month instrument. The index, therefore, will always have a constant maturity equal to exactly three months.
The CBOE Volatility Index® (VIX®) is a key measure of market expectations of near-term volatility conveyed by S&P 500® stock index option prices. Since its introduction in 1993, VIX has been considered by many to be the world’s premier barometer of investor sentiment and market volatility.
The S&P 500® Index is a U.S. stock market index based on the market capitalizations of 500 large companies having common stock listed on the New York Stock Exchange or NASDAQ. The S&P 500® Index components and their weightings are determined by S&P Dow Jones Indices.
The S&P 500® Energy Index comprises those companies included in the S&P 500 that are classified as members of the GICS® energy sector.
The EURO STOXX 50® provides a blue-chip representation of super-sector leaders in the Eurozone. The index covers 50 stocks from 12 Eurozone countries: Austria, Belgium, Finland, France, Germany, Greece, Ireland, Italy, Luxembourg, the Netherlands, Portugal and Spain.
The U.S. Dollar Index measures the value of the U.S. dollar relative to a basket of foreign currencies, often referred to as a basket of U.S. trade partners’ currencies.
6
PORTFOLIO BASICS
Tactical Tilt Overlay Fund
as of August 31, 2017
| | | | | | | | | | |
| | PERFORMANCE REVIEW | | | | | |
| | | November 1, 2016–August 31, 2017 | | Portfolio Total Return
(based on NAV)1 | | | The Bank of America
Merrill Lynch U.S. Dollar
Three-Month LIBOR
Constant Maturity Index2 | |
| | | Institutional Shares | | | 0.82 | % | | | 0.85 | % |
| | 1 | | The net asset value (“NAV”) represents the net assets of the class of the Portfolio (ex-dividend) divided by the total number of shares of the class outstanding. The Portfolio’s performance assumes the reinvestment of dividends and other distributions. The Portfolio’s performance does not reflect the deduction of any applicable sales charges. |
| | 2 | | The Bank of America Merrill Lynch U.S. Dollar Three-Month LIBOR Constant Maturity Index (the “Index”) tracks the performance of a synthetic asset paying LIBOR to a stated maturity. The Index is based on the assumed purchase at par of a synthetic instrument having exactly its stated maturity and with a coupon equal to that day’s fixing rate. That issue is assumed to be sold the following day (priced at a yield equal to the current day fixing rate) and rolled into a new instrument. The Index figure does not reflect any deductions for fees, expenses or taxes. It is not possible to invest directly in an index. |
| | | | | | | | | | | | | | |
| | STANDARDIZED TOTAL RETURNS3 | | | | | | | | | |
| | | For the period ended 6/30/17 | | One Year | | | Since Inception | | | Inception Date | |
| | | Institutional Shares | | | 4.62 | % | | | 2.01 | % | | | 7/31/14 | |
| | 3 | | The Standardized Total Returns are average annual total returns or cumulative total returns (only if the performance period is one year or less) as of the most recent calendar quarter-end. They assume reinvestment of all distributions at NAV. Because Institutional Shares do not involve a sales charge, such a charge is not applied to their Standardized Total Returns. |
The returns set forth in the tables above represent past performance. Past performance does not guarantee future results. The Portfolio’s investment return and principal value will fluctuate so that an investor’s shares, when redeemed, may be worth more or less than their original cost. Current performance may be lower or higher than the performance quoted above. Please visit our web site at www.GSAMFUNDS.com to obtain the most recent month-end returns. Performance reflects applicable fee waivers and/or expense limitations in effect during the periods shown. In their absence, performance would be reduced. Returns do not reflect the deduction of taxes that a shareholder would pay on Portfolio distributions or the redemption of Portfolio shares.
7
PORTFOLIO BASICS
| | | | | | | | | | |
| | EXPENSE RATIOS4 | | | | | | | | |
| | | | | Net Expense Ratio (Current) | | | Gross Expense Ratio (Before Waivers) | |
| | | Institutional Shares | | | 0.84 | % | | | 1.02 | % |
| | 4 | | The expense ratios of the Portfolio, both current (net of applicable fee waivers and/or expense limitations) and before waivers (gross of applicable fee waivers and/or expense limitations) are as set forth above according to the most recent publicly available Prospectus for the Portfolio and may differ from the expense ratios disclosed in the Consolidated Financial Highlights in this report. Pursuant to a contractual arrangement, the Portfolio’s waivers and/or expense limitations will remain in place through at least February 28, 2018, and prior to such date the Investment Adviser may not terminate the arrangements without the approval of the Portfolio’s Board of Trustees. If these arrangements are discontinued in the future, the expense ratios may change without shareholder approval. |
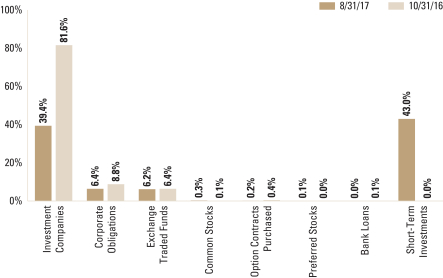
| | 5 | | The percentage shown for each investment category reflects the value of investments in that category as a percentage of net assets. Short-term investments represent certificates of deposits and commercial papers. Figures in the graph may not sum to 100% due to the exclusion of other assets and liabilities. The graph does not depict the investment in the securities lending reinvestment vehicle. The Investment in the securities lending reinvestment vehicle represented 3.0% and 0.0% of the Portfolio’s net assets as of August 31, 2017 and October 31, 2016. The graph depicts the Portfolio’s investments but may not represent the Portfolio’s market exposure due to the exclusion of certain derivatives, if any, as listed in the Additional Investment Information section of the Consolidated Schedule of Investments. |
8
GOLDMAN SACHS TACTICAL TILT OVERLAY FUND
Performance Summary
August 31, 2017
The following graph shows the value, as of August 31, 2017, of a $1,000,000 investment made on July 31, 2014 (commencement of operations) in Institutional Shares at NAV. For comparative purposes, the performance of the Portfolio’s benchmark, the Bank of America Merrill Lynch U.S. Dollar Three-Month LIBOR Constant Maturity Index is shown. This performance data represents past performance and should not be considered indicative of future performance, which will fluctuate with changes in market conditions. These performance fluctuations may cause an investor’s shares, when redeemed, to be worth more or less than their original cost. Performance reflects applicable fee waivers and/or expense limitations in effect during the periods shown and in their absence, performance would be reduced. Returns do not reflect the deduction of taxes that a shareholder would pay on Portfolio distributions or the redemption of Portfolio shares. In addition to the Investment Adviser’s decisions regarding issuer/industry investment selection and allocation, other factors may affect Portfolio performance. These factors include, but are not limited to, Portfolio operating fees and expenses, portfolio turnover and subscription and redemption cash flows affecting the Portfolio.
|
| Tactical Tilt Overlay Fund’s Lifetime Performance |
Performance of a $1,000,000 Investment, with distributions reinvested, from July 31, 2014 through August 31, 2017.
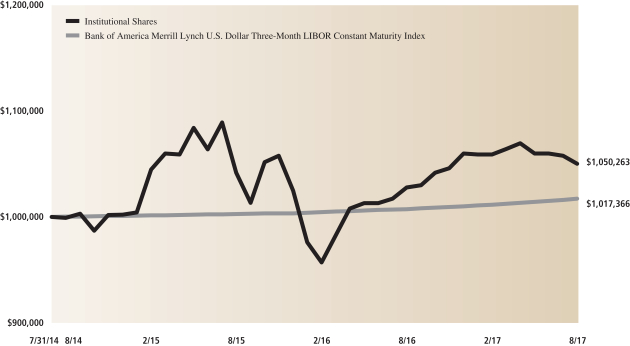
| | | | | | | | |
| Average Annual Total Return through August 31, 2017 | | | One Year | | | | Since Inception | |
Institutional Shares (Commenced July 31, 2014) | | | 2.17% | | | | 1.60% | |
| | | | | | | | |
9
GOLDMAN SACHS TACTICAL TILT OVERLAY FUND
Consolidated Schedule of Investments
August 31, 2017
| | | | | | | | | | | | | | |
Principal
Amount | | | Interest
Rate | | | Maturity
Date | | | Value | |
| Corporate Obligations – 6.4% | |
| Distributor(a) – 0.1% | |
| | AmeriGas Partners LP/AmeriGas Finance Corp. | |
| $ | 5,850,000 | | | | 5.875 | % | | | 08/20/26 | | | $ | 5,967,000 | |
| | |
| Energy – Exploration & Production – 3.3% | |
| | Alta Mesa Holdings LP/Alta Mesa Finance Services Corp.(a)(b) | |
| | 5,550,000 | | | | 7.875 | | | | 12/15/24 | | | | 5,952,375 | |
| | Antero Resources Corp.(a) | |
| | 4,700,000 | | | | 5.375 | | | | 11/01/21 | | | | 4,770,500 | |
| | 3,800,000 | | | | 5.125 | | | | 12/01/22 | | | | 3,819,000 | |
| | Berry Petroleum Co. LLC(a)(c)(d) | |
| | 1,200,000 | | | | 6.750 | | | | 11/01/20 | | | | — | |
| | 18,124,000 | | | | 6.375 | | | | 09/15/22 | | | | — | |
| | California Resources Corp.(a) | |
| | 10,279,000 | | | | 8.000 | (b) | | | 12/15/22 | | | | 5,653,450 | |
| | 413,000 | | | | 6.000 | | | | 11/15/24 | | | | 167,265 | |
| | Carrizo Oil & Gas, Inc.(a) | |
| | 7,150,000 | | | | 7.500 | | | | 09/15/20 | | | | 7,257,250 | |
| | Chesapeake Energy Corp. | |
| | 1,950,000 | | | | 5.375 | (a) | | | 06/15/21 | | | | 1,784,250 | |
| | 2,310,000 | | | | 8.000 | (a)(b) | | | 12/15/22 | | | | 2,390,850 | |
| | 6,700,000 | | | | 5.750 | | | | 03/15/23 | | | | 5,896,000 | |
| | 1,475,000 | | | | 8.000 | (a)(b) | | | 01/15/25 | | | | 1,419,688 | |
| | Concho Resources, Inc.(a) | |
| | 6,650,000 | | | | 4.375 | | | | 01/15/25 | | | | 6,916,000 | |
| | Continental Resources, Inc.(a) | |
| | 9,950,000 | | | | 3.800 | | | | 06/01/24 | | | | 9,303,250 | |
| | CrownRock LP/CrownRock Finance, Inc.(a)(b) | |
| | 4,850,000 | | | | 7.750 | | | | 02/15/23 | | | | 5,141,000 | |
| | Denbury Resources, Inc.(a) | |
| | 3,252,000 | | | | 9.000 | (b) | | | 05/15/21 | | | | 2,910,540 | |
| | 4,750,000 | | | | 5.500 | | | | 05/01/22 | | | | 2,161,250 | |
| | 2,900,000 | | | | 4.625 | | | | 07/15/23 | | | | 1,261,500 | |
| | Gulfport Energy Corp.(a)(b) | |
| | 7,900,000 | | | | 6.000 | | | | 10/15/24 | | | | 7,742,000 | |
| | Halcon Resources Corp.(a)(b) | |
| | 2,099,000 | | | | 12.000 | | | | 02/15/22 | | | | 2,518,800 | |
| | 6,850,000 | | | | 6.750 | | | | 02/15/25 | | | | 6,918,500 | |
| | Jones Energy Holdings LLC/Jones Energy Finance Corp.(a) | |
| | 7,250,000 | | | | 6.750 | | | | 04/01/22 | | | | 5,038,750 | |
| | Laredo Petroleum, Inc.(a) | |
| | 4,700,000 | | | | 7.375 | | | | 05/01/22 | | | | 4,841,000 | |
| | 1,750,000 | | | | 6.250 | | | | 03/15/23 | | | | 1,793,750 | |
| | Matador Resources Co.(a) | |
| | 3,150,000 | | | | 6.875 | | | | 04/15/23 | | | | 3,268,125 | |
| | MEG Energy Corp.(a)(b) | |
| | 12,250,000 | | | | 7.000 | | | | 03/31/24 | | | | 9,738,750 | |
| | Nabors Industries, Inc.(b) | |
| | 3,750,000 | | | | 0.750 | | | | 01/15/24 | | | | 2,718,750 | |
| | Newfield Exploration Co.(a) | |
| | 4,350,000 | | | | 5.375 | | | | 01/01/26 | | | | 4,545,750 | |
| | Oasis Petroleum, Inc.(a) | |
| | 10,700,000 | | | | 6.875 | | | | 03/15/22 | | | | 10,405,750 | |
| | Range Resources Corp.(a) | |
| | 4,000,000 | | | | 5.000 | (b) | | | 08/15/22 | | | | 3,930,000 | |
| | 2,500,000 | | | | 4.875 | | | | 05/15/25 | | | | 2,393,750 | |
| | Rice Energy, Inc.(a) | |
| | 5,200,000 | | | | 6.250 | | | | 05/01/22 | | | | 5,395,000 | |
| | |
| Corporate Obligations – (continued) | |
| Energy – Exploration & Production – (continued) | |
| | Sanchez Energy Corp.(a) | |
| 7,550,000 | | | | 6.125 | | | | 01/15/23 | | | | 5,738,000 | |
| | Seven Generations Energy Ltd.(a)(b) | |
| | 4,850,000 | | | | 6.875 | | | | 06/30/23 | | | | 5,044,000 | |
| | SM Energy Co.(a) | |
| | 2,450,000 | | | | 6.500 | | | | 11/15/21 | | | | 2,376,500 | |
| | 2,400,000 | | | | 6.125 | | | | 11/15/22 | | | | 2,268,000 | |
| | 2,000,000 | | | | 6.500 | | | | 01/01/23 | | | | 1,905,000 | |
| | 2,950,000 | | | | 6.750 | | | | 09/15/26 | | | | 2,795,125 | |
| | Whiting Petroleum Corp. | |
| | 2,100,000 | | | | 1.250 | | | | 04/01/20 | | | | 1,782,375 | |
| | 5,400,000 | | | | 5.750 | (a) | | | 03/15/21 | | | | 5,076,000 | |
| | WPX Energy, Inc.(a) | |
| | 7,700,000 | | | | 6.000 | | | | 01/15/22 | | | | 7,931,000 | |
| | | | | | | | | | | | | | |
| | | | | | | | | | | | | 172,968,843 | |
| | |
| Energy – Services – 1.5% | |
| | CVR Refining LLC/Coffeyville Finance, Inc.(a) | |
| | 4,086,000 | | | | 6.500 | | | | 11/01/22 | | | | 4,137,075 | |
| | Ensco PLC(a) | |
| | 3,800,000 | | | | 4.500 | | | | 10/01/24 | | | | 2,774,000 | |
| | 250,000 | | | | 5.200 | | | | 03/15/25 | | | | 186,250 | |
| | Noble Holding International Ltd. | |
| | 3,629,000 | | | | 4.625 | | | | 03/01/21 | | | | 3,052,896 | |
| | 6,100,000 | | | | 7.750 | (a) | | | 01/15/24 | | | | 4,628,375 | |
| | 350,000 | | | | 5.250 | | | | 03/15/42 | | | | 195,125 | |
| | Precision Drilling Corp.(a) | |
| | 2,800,000 | | | | 6.500 | | | | 12/15/21 | | | | 2,716,000 | |
| | Pride International LLC | |
| | 3,550,000 | | | | 8.500 | | | | 06/15/19 | | | | 3,763,000 | |
| | 1,750,000 | | | | 6.875 | | | | 08/15/20 | | | | 1,754,375 | |
| | Rowan Cos., Inc.(a) | |
| | 3,900,000 | | | | 7.375 | | | | 06/15/25 | | | | 3,529,500 | |
| | 5,250,000 | | | | 5.400 | | | | 12/01/42 | | | | 3,727,500 | |
| | SESI LLC(a)(b) | |
| | 5,550,000 | | | | 7.750 | | | | 09/15/24 | | | | 5,605,500 | |
| | Sunoco LP/Sunoco Finance Corp.(a) | |
| | 1,800,000 | | | | 5.500 | | | | 08/01/20 | | | | 1,849,500 | |
| | 6,750,000 | | | | 6.375 | | | | 04/01/23 | | | | 7,112,813 | |
| | Transocean, Inc. | |
| | 2,650,000 | | | | 9.000 | (a)(b) | | | 07/15/23 | | | | 2,815,625 | |
| | 6,100,000 | | | | 7.500 | | | | 04/15/31 | | | | 5,139,250 | |
| | 5,900,000 | | | | 6.800 | | | | 03/15/38 | | | | 4,513,500 | |
| | Trinidad Drilling Ltd.(a)(b) | |
| | 5,700,000 | | | | 6.625 | | | | 02/15/25 | | | | 5,279,625 | |
| | Weatherford International Ltd. | |
| | 4,700,000 | | | | 4.500 | (a) | | | 04/15/22 | | | | 4,194,750 | |
| | 3,000,000 | | | | 8.250 | (a) | | | 06/15/23 | | | | 2,955,000 | |
| | 6,150,000 | | | | 6.500 | | | | 08/01/36 | | | | 5,104,500 | |
| | | | | | | | | | | | | | |
| | | | | | | | | | | | | 75,034,159 | |
| | |
| Pipelines – 1.5% | |
| | Andeavor Logistics LP/Tesoro Logistics Finance Corp.(a) | |
| | 350,000 | | | | 5.500 | | | | 10/15/19 | | | | 368,375 | |
| | Blue Racer Midstream LLC/Blue Racer Finance Corp.(a)(b) | |
| | 7,650,000 | | | | 6.125 | | | | 11/15/22 | | | | 7,879,500 | |
| | |
| | |
| 10 | | The accompanying notes are an integral part of these financial statements. |
GOLDMAN SACHS TACTICAL TILT OVERLAY FUND
| | | | | | | | | | | | | | |
Principal
Amount | | | Interest
Rate | | | Maturity
Date | | | Value | |
| Corporate Obligations – (continued) | |
| Pipelines – (continued) | |
| | Cheniere Corpus Christi Holdings LLC(a) | |
| $ | 4,650,000 | | | | 7.000 | % | | | 06/30/24 | | | $ | 5,289,375 | |
| | 4,000,000 | | | | 5.125 | (b) | | | 06/30/27 | | | | 4,130,000 | |
| | DCP Midstream Operating LP | |
| | 3,900,000 | | | | 2.500 | (a) | | | 12/01/17 | | | | 3,890,250 | |
| | 1,700,000 | | | | 9.750 | (b) | | | 03/15/19 | | | | 1,865,750 | |
| | 4,510,000 | | | | 5.350 | (b) | | | 03/15/20 | | | | 4,735,500 | |
| | 250,000 | | | | 6.750 | (b) | | | 09/15/37 | | | | 265,000 | |
| | Energy Transfer Equity LP | |
| | 1,400,000 | | | | 7.500 | | | | 10/15/20 | | | | 1,578,500 | |
| | 3,050,000 | | | | 5.875 | (a) | | | 01/15/24 | | | | 3,286,375 | |
| | 2,500,000 | | | | 5.500 | (a) | | | 06/01/27 | | | | 2,656,250 | |
| | Genesis Energy LP/Genesis Energy Finance Corp.(a) | |
| | 9,350,000 | | | | 6.000 | | | | 05/15/23 | | | | 9,209,750 | |
| | NGPL PipeCo LLC(a)(b) | |
| | 320,000 | | | | 4.375 | | | | 08/15/22 | | | | 328,000 | |
| | 1,085,000 | | | | 4.875 | | | | 08/15/27 | | | | 1,117,550 | |
| Summit Midstream Holdings LLC/Summit Midstream Finance
Corp.(a) |
|
| | 8,750,000 | | | | 5.750 | | | | 04/15/25 | | | | 8,771,875 | |
| Targa Resources Partners LP/Targa Resources Partners Finance
Corp.(a) |
|
| | 9,350,000 | | | | 5.250 | | | | 05/01/23 | | | | 9,560,375 | |
| | 3,900,000 | | | | 6.750 | | | | 03/15/24 | | | | 4,221,750 | |
| | The Williams Cos., Inc. | |
| | 3,393,000 | | | | 3.700 | (a) | | | 01/15/23 | | | | 3,383,594 | |
| | 2,700,000 | | | | 7.500 | | | | 01/15/31 | | | | 3,262,610 | |
| | 850,000 | | | | 7.750 | | | | 06/15/31 | | | | 1,022,125 | |
| | 2,500,000 | | | | 5.750 | (a) | | | 06/24/44 | | | | 2,600,000 | |
| | | | | | | | | | | | | | |
| | | | | | | | | | | | | 79,422,504 | |
| | |
| TOTAL CORPORATE OBLIGATIONS
(Cost $319,361,132) |
| | $ | 333,392,506 | |
| | |
| | | | | | | | | | | | | | |
| Bank Loans(d)(e) – 0.0% | |
| Energy – 0.0% | |
| | American Energy – Marcellus LLC | |
| $ | 1,723,828 | | | | 5.481 | % | | | 08/04/20 | | | $ | 1,142,898 | |
| | 7,775,000 | | | | 8.731 | | | | 08/04/21 | | | | 622,000 | |
| | Blue Ridge Mountain Resources, Inc. | |
| | 318,959 | | | | 8.312 | | | | 05/06/19 | | | | 318,959 | |
| | |
| TOTAL BANK LOANS
(Cost $4,743,267) |
| | $ | 2,083,857 | |
| | |
| | | | | | | | |
| Shares | | | Description | | Value | |
| Common Stocks – 0.3% | |
| Oil, Gas & Consumable Fuels – 0.3% | |
| | 758,151 | | | Berry Petroleum Corp.(c)(f) | | $ | 7,391,972 | |
| | 200,259 | | | Blue Ridge Mountain Resources, Inc.(c)(f) | | | 1,802,331 | |
| | 79,709 | | | Chaparral Energy, Inc. | | | 1,594,180 | |
| | 247,033 | | | Chaparral Energy, Inc. Class A(c) | | | 4,940,660 | |
| | |
| | TOTAL COMMON STOCKS | | | | |
| | (Cost $7,366,492) | | $ | 15,729,143 | |
| | |
Shares | | Rate | | |
Value | |
| Preferred Stocks(c) – 0.1% | |
| Energy – Exploration & Production – 0.1% | |
Berry Petroleum Corp. | |
| 14,849 | | | 0.000 | % | | $ | 157,771 | |
| 718,233 | | | 0.000 | | | | 7,631,225 | |
| |
| TOTAL PREFERRED STOCKS – 0.1% | | | | | |
| (Cost $7,330,820) | | | $ | 7,788,996 | |
| |
| | | | | | | | |
| Shares | | | Description | | Value | |
| Exchange Traded Funds – 6.2% | |
| | 20,486,933 | | | Alerian MLP ETF(g) | | $ | 229,453,649 | |
| | 2,274,365 | | | SPDR S&P Bank ETF | | | 94,886,508 | |
| | |
| TOTAL EXCHANGE TRADED FUNDS
(Cost $302,659,330) | | $ | 324,340,157 | |
| | |
| | | | | | | | |
| Shares | | Distribution
Rate | | | Value | |
| Investment Companies(h) – 39.4% | |
Goldman Sachs Financial Square Government Fund – Institutional Shares | |
| 1,695,818,753 | | | 0.927 | % | | $ | 1,695,818,753 | |
Goldman Sachs High Yield Floating Rate Fund – Institutional Shares | |
| 38,033,584 | | | 3.405 | | | | 368,545,426 | |
Goldman Sachs Local Emerging Markets Debt Fund – Institutional Shares | |
| 136,281 | | | 3.295 | | | | 911,722 | |
| |
TOTAL INVESTMENT COMPANIES (Cost $2,068,672,866) | | | $ | 2,065,275,901 | |
| |
| | | | | | | | | | | | | | |
Principal
Amount | | | Interest
Rate | | | Maturity
Date | | | Value | |
| Short-term Investments – 43.0% | |
| Certificates of Deposit – 18.4% | |
| | Abbey National Treasury Services PLC | |
| $ | 10,000,000 | | | | 1.461 | % | | | 09/19/17 | | | $ | 10,001,489 | |
| | 14,000,000 | | | | 1.407 | | | | 12/15/17 | | | | 14,004,386 | |
| | Banco Del Estado De Chile | |
| | 22,000,000 | | | | 1.468 | | | | 09/18/17 | | | | 22,003,209 | |
| | 20,000,000 | | | | 1.380 | | | | 09/26/17 | | | | 20,001,983 | |
| | 11,000,000 | | | | 1.482 | | | | 08/02/18 | | | | 11,007,051 | |
| | Bank of Montreal | |
| | 25,700,000 | | | | 1.399 | | | | 09/13/17 | | | | 25,702,128 | |
| | Bank of Nova Scotia | |
| | 22,000,000 | | | | 1.381 | | | | 03/09/18 | | | | 22,010,632 | |
| | Barclays Bank PLC | |
| | 22,000,000 | | | | 1.910 | | | | 03/09/18 | | | | 22,031,781 | |
| | 5,000,000 | | | | 1.706 | | | | 03/29/18 | | | | 5,001,350 | |
| | Bayerische Landesbank (Quarterly EURIBOR + 0.130%)(i) | |
| | 21,125,000 | | | | 0.010 | | | | 03/23/18 | | | | 21,130,493 | |
| | |
| | |
| The accompanying notes are an integral part of these financial statements. | | 11 |
GOLDMAN SACHS TACTICAL TILT OVERLAY FUND
Consolidated Schedule of Investments (continued)
August 31, 2017
| | | | | | | | | | | | | | |
Principal
Amount | | | Interest
Rate | | | Maturity
Date | | | Value | |
| Short-term Investments – (continued) | |
| Certificates of Deposit – (continued) | |
| | BNP Paribas New York | |
| $ | 26,500,000 | | | | 1.377 | % | | | 09/22/17 | | | $ | 26,503,113 | |
| | 26,500,000 | | | | 1.490 | | | | 10/06/17 | | | | 26,507,726 | |
| | China Construction Banking Corp. | |
| | 11,000,000 | | | | 1.750 | | | | 09/07/17 | | | | 11,000,669 | |
| | Cooperatieve Rabobank UA | |
| | 11,000,000 | | | | 1.411 | | | | 07/20/18 | | | | 11,002,135 | |
| | Credit Agricole SA | |
| | 22,000,000 | | | | 1.560 | | | | 07/20/18 | | | | 22,007,264 | |
| | Credit Industriel et Commercial NY | |
| | 22,000,000 | | | | 1.400 | | | | 01/19/18 | | | | 22,006,248 | |
| | Credit Suisse New York | |
| | 21,000,000 | | | | 1.329 | | | | 11/20/17 | | | | 21,012,275 | |
| | 15,000,000 | | | | 1.601 | | | | 05/02/18 | | | | 15,012,189 | |
| | 4,000,000 | | | | 1.556 | | | | 09/20/18 | | | | 4,000,000 | |
| | Dexia Credit Local SA | |
| | 22,000,000 | | | | 1.581 | | | | 12/20/17 | | | | 22,017,957 | |
| | DG Bank NY | |
| | 9,000,000 | | | | 1.320 | | | | 11/20/17 | | | | 9,000,456 | |
| | 20,000,000 | | | | 1.330 | | | | 12/01/17 | | | | 20,001,251 | |
| | DnB NOR Bank ASA | |
| | 30,800,000 | | | | 1.541 | | | | 03/20/18 | | | | 30,834,677 | |
| | HSBC Bank PLC | |
| | 11,000,000 | | | | 1.434 | | | | 07/25/18 | | | | 11,000,863 | |
| | Industrial & Commercial Bank of China Ltd. | |
| | 11,000,000 | | | | 1.750 | | | | 09/08/17 | | | | 11,000,856 | |
| | Landesbank Baden-Wuerttemberg | |
| | 28,000,000 | | | | 0.010 | | | | 03/23/18 | | | | 28,040,318 | |
| | 22,000,000 | | | | 0.010 | | | | 04/24/18 | | | | 22,029,335 | |
| | Landesbank Hessen-Thuringen | |
| | 6,400,000 | | | | 1.330 | | | | 09/11/17 | | | | 6,400,246 | |
| | Mizuho Bank Ltd. | |
| | 21,925,000 | | | | 2.154 | | | | 10/12/17 | | | | 21,948,971 | |
| | 25,000,000 | | | | 1.954 | | | | 10/16/17 | | | | 25,023,362 | |
| | National Bank of Canada | |
| | 22,500,000 | | | | 1.707 | | | | 10/20/17 | | | | 22,515,306 | |
| | 11,000,000 | | | | 1.466 | | | | 09/21/18 | | | | 11,000,000 | |
| | National Bank of Kuwait SAKP | |
| | 11,000,000 | | | | 1.530 | | | | 12/22/17 | | | | 11,001,735 | |
| | 15,000,000 | | | | 1.700 | | | | 01/12/18 | | | | 15,010,387 | |
| | Natixis NY | |
| | 26,500,000 | | | | 1.480 | �� | | | 12/21/17 | | | | 26,514,072 | |
| | Norinchukin Bank NY | |
| | 21,950,000 | | | | 1.370 | | | | 09/11/17 | | | | 21,951,370 | |
| | 3,600,000 | | | | 2.019 | | | | 10/10/17 | | | | 3,603,223 | |
| | 25,000,000 | | | | 1.720 | | | | 03/22/18 | | | | 25,038,320 | |
| | Royal Bank of Canada | |
| | 16,000,000 | | | | 1.428 | | | | 07/16/18 | | | | 15,999,499 | |
| | Skandinaviska Enskilda Banken AB | |
| | 30,800,000 | | | | 1.531 | | | | 03/20/18 | | | | 30,832,451 | |
| | Standard Chartered Bank | |
| | 25,000,000 | | | | 1.668 | | | | 12/19/17 | | | | 25,025,070 | |
| | Sumitomo Mitsui Banking Corp. | |
| | 22,000,000 | | | | 1.946 | | | | 09/15/17 | | | | 22,006,597 | |
| | Sumitomo Trust & Banking Corp. | |
| | 30,000,000 | | | | 1.561 | | | | 09/11/17 | | | | 30,003,151 | |
| | |
| Short-term Investments – (continued) | |
| Certificates of Deposit – (continued) | |
| | Sumitomo Trust & Banking Corp. – (continued) | |
| 7,000,000 | | | | 1.534 | | | | 09/25/17 | | | | 7,001,358 | |
| | 6,000,000 | | | | 1.993 | | | | 09/27/17 | | | | 6,003,380 | |
| | 2,000,000 | | | | 1.521 | | | | 08/06/18 | | | | 1,997,473 | |
| | The Bank of Tokyo-Mitsubishi UFJ Ltd. | |
| | 24,000,000 | | | | 1.520 | | | | 10/31/17 | | | | 24,010,935 | |
| | 21,950,000 | | | | 1.720 | | | | 03/07/18 | | | | 21,981,628 | |
| | Toronto-Dominion Bank | |
| | 17,600,000 | | | | 1.464 | | | | 10/27/17 | | | | 17,606,335 | |
| | 26,400,000 | | | | 1.569 | | | | 03/13/18 | | | | 26,432,648 | |
| | 5,000,000 | | | | 1.600 | | | | 08/22/18 | | | | 5,001,234 | |
| | UBS AG Stamford | |
| | 6,000,000 | | | | 1.731 | | | | 11/06/17 | | | | 6,005,312 | |
| | 21,950,000 | | | | 1.631 | | | | 03/07/18 | | | | 21,974,493 | |
| | Wells Fargo Bank NA | |
| | 29,500,000 | | | | 1.446 | | | | 04/03/18 | | | | 29,515,673 | |
| | | | | | | | | | | | | | |
| | | | | | | | | | | | | 967,276,063 | |
| | |
| Commercial Paper – 24.6% | |
| | ABN AMRO Funding USA LLC | |
| | 8,000,000 | | | | 0.000 | (j) | | | 12/15/17 | | | | 7,968,883 | |
| | 12,200,000 | | | | 0.000 | (j) | | | 01/05/18 | | | | 12,141,811 | |
| | 18,000,000 | | | | 0.000 | (j) | | | 02/22/18 | | | | 17,874,700 | |
| | 4,000,000 | | | | 1.000 | | | | 04/23/18 | | | | 3,960,964 | |
| | Alpine Securitization Ltd. | |
| | 10,600,000 | | | | 1.456 | | | | 11/17/17 | | | | 10,604,444 | |
| | 18,000,000 | | | | 1.532 | | | | 12/04/17 | | | | 18,011,307 | |
| | Atlantic Asset Securitization Corp. | |
| | 24,000,000 | | | | 1.567 | | | | 12/15/17 | | | | 24,014,160 | |
| | Australia & New Zealand Banking Group Ltd. | |
| | 14,400,000 | | | | 1.369 | | | | 09/12/17 | | | | 14,400,961 | |
| | 22,000,000 | | | | 1.410 | | | | 08/23/18 | | | | 21,989,164 | |
| | Bank of China Ltd. (j) | |
| | 10,000,000 | | | | 0.000 | | | | 09/19/17 | | | | 9,992,379 | |
| | Bank of Nova Scotia(j) | |
| | 6,900,000 | | | | 0.000 | | | | 07/06/18 | | | | 6,812,051 | |
| | Bedford Row Funding Corp. | |
| | 10,000,000 | | | | 1.358 | | | | 01/17/18 | | | | 9,999,672 | |
| | 11,000,000 | | | | 1.381 | | | | 02/20/18 | | | | 11,000,500 | |
| | 8,750,000 | | | | 1.591 | | | | 03/05/18 | | | | 8,759,888 | |
| | 24,000,000 | | | | 1.440 | | | | 03/16/18 | | | | 24,016,862 | |
| | Cafco LLC(j) | |
| | 11,000,000 | | | | 0.000 | | | | 02/02/18 | | | | 10,934,784 | |
| | Caisse d’Amortissement de la Dette Sociale(j) | |
| | 4,900,000 | | | | 0.000 | | | | 10/02/17 | | | | 4,894,882 | |
| | Canadian Imperial Bank of Commerce | |
| | 21,950,000 | | | | 1.556 | | | | 03/07/18 | | | | 21,950,568 | |
| | 22,000,000 | | | | 1.556 | | | | 03/16/18 | | | | 22,022,695 | |
| | CBS Corp.(j) | |
| | 8,000,000 | | | | 0.000 | | | | 09/12/17 | | | | 7,996,109 | |
| | 12,000,000 | | | | 0.000 | | | | 09/28/17 | | | | 11,986,121 | |
| | Chariot Funding LLC(j) | |
| | 17,250,000 | | | | 0.000 | | | | 01/02/18 | | | | 17,166,995 | |
| | China Construction Banking Corp.(j) | |
| | 10,000,000 | | | | 0.000 | | | | 09/18/17 | | | | 9,992,680 | |
| | |
| | |
| 12 | | The accompanying notes are an integral part of these financial statements. |
GOLDMAN SACHS TACTICAL TILT OVERLAY FUND
| | | | | | | | | | | | | | |
Principal
Amount | | | Interest
Rate | | | Maturity
Date | | | Value | |
| Short-term Investments – (continued) | |
| Commercial Paper – (continued) | |
| | Collateralized Commercial Paper Co. Ltd. | |
| $ | 35,200,000 | | | | 1.494 | % | | | 09/08/17 | | | $ | 35,202,629 | |
| | 5,000,000 | | | | 1.428 | | | | 12/12/17 | | | | 5,002,880 | |
| | Commonwealth Bank of Australia | |
| | 25,500,000 | | | | 1.546 | | | | 03/16/18 | | | | 25,531,183 | |
| | Corpoerative Centrale(j) | |
| | 33,310,000 | | | | 0.000 | | | | 11/01/17 | | | | 33,239,840 | |
| | CRC Funding LLC(j) | |
| | 22,000,000 | | | | 0.000 | | | | 12/06/17 | | | | 21,920,746 | |
| | Danske Corp.(j) | |
| | 20,000,000 | | | | 0.000 | | | | 02/20/18 | | | | 19,843,531 | |
| | Dominion Energy, Inc. | |
| | 11,000,000 | | | | 0.010 | | | | 10/12/17 | | | | 10,980,206 | |
| | Dominion Resources, Inc.(j) | |
| | 7,000,000 | | | | 0.000 | | | | 09/19/17 | | | | 6,994,551 | |
| | Eastman Chemical Co.(j) | |
| | 15,000,000 | | | | 0.000 | | | | 09/06/17 | | | | 14,996,410 | |
| | Ei Dupont(j) | |
| | 2,000,000 | | | | 0.000 | | | | 10/12/17 | | | | 1,996,607 | |
| | Erste Abwicklungsanstalt(j) | |
| | 20,000,000 | | | | 0.000 | | | | 10/19/17 | | | | 19,967,170 | |
| | Erste Bank der oesterreichischen Sparkassen AG | |
| | 45,000,000 | | | | 1.453 | | | | 10/27/17 | | | | 45,015,693 | |
| | Fairway Finance Corp. | |
| | 20,250,000 | | | | 1.328 | | | | 12/20/17 | | | | 20,251,264 | |
| | Ford Motor Credit Co. LLC(j) | |
| | 5,800,000 | | | | 0.000 | | | | 01/19/18 | | | | 5,761,950 | |
| | 5,000,000 | | | �� | 0.000 | | | | 05/02/18 | | | | 4,937,916 | |
| | 11,700,000 | | | | 0.000 | | | | 05/11/18 | | | | 11,548,295 | |
| | 3,650,000 | | | | 0.000 | | | | 07/10/18 | | | | 3,588,657 | |
| | HSBC Bank PLC | |
| | 23,900,000 | | | | 1.506 | | | | 04/18/18 | | | | 23,924,216 | |
| | ING Funding LLC | |
| | 18,000,000 | | | | 1.325 | | | | 01/26/18 | | | | 18,017,113 | |
| | 23,000,000 | | | | 1.448 | | | | 05/11/18 | | | | 22,992,363 | |
| | J.P. Morgan Securities, Inc. | |
| | 7,500,000 | | | | 1.478 | | | | 09/20/17 | | | | 7,501,254 | |
| | Jupiter Securitization Co. LLC(j) | |
| | 20,000,000 | | | | 0.000 | | | | 01/03/18 | | | | 19,902,917 | |
| | Liberty Funding LLC(j) | |
| | 8,850,000 | | | | 0.000 | | | | 10/18/17 | | | | 8,834,920 | |
| | LMA SA LMA Americas | |
| | 12,000,000 | | | | 0.000 | (j) | | | 12/21/17 | | | | 11,948,592 | |
| | 9,250,000 | | | | 0.010 | | | | 01/05/18 | | | | 9,201,437 | |
| | 5,000,000 | | | | 0.000 | (j) | | | 01/24/18 | | | | 4,970,942 | |
| | Macquarie Bank Ltd. | |
| | 26,400,000 | | | | 1.576 | | | | 12/11/17 | | | | 26,420,767 | |
| | 10,000,000 | | | | 1.577 | | | | 12/15/17 | | | | 10,007,471 | |
| | 9,000,000 | | | | 1.436 | | | | 02/15/18 | | | | 9,003,731 | |
| | 19,500,000 | | | | 1.526 | | | | 06/29/18 | | | | 19,516,066 | |
| | Matchpoint Finance PLC | |
| | 25,000,000 | | | | 1.000 | | | | 11/20/17 | | | | 24,920,969 | |
| | 20,000,000 | | | | 0.000 | (j) | | | 11/21/17 | | | | 19,935,903 | |
| | 7,000,000 | | | | 0.000 | (j) | | | 12/12/17 | | | | 6,971,120 | |
| | MetLife, Inc.(j) | |
| | 4,000,000 | | | | 0.000 | | | | 03/27/18 | | | | 3,965,819 | |
| | |
| Short-term Investments – (continued) | |
| Commercial Paper – (continued) | |
| | Mondelez International, Inc.(j) | |
| 11,650,000 | | | | 0.000 | | | | 09/08/17 | | | | 11,646,262 | |
| | 4,150,000 | | | | 0.000 | | | | 09/27/17 | | | | 4,145,375 | |
| | National Australia Bank Ltd. | |
| | 21,250,000 | | | | 1.564 | | | | 03/08/18 | | | | 21,273,979 | |
| | National Bank of Canada | |
| | 22,000,000 | | | | 1.548 | | | | 03/20/18 | | | | 22,023,789 | |
| | Nieuw Amsterdam Receivables Corp.(j) | |
| | 3,000,000 | | | | 0.000 | | | | 11/10/17 | | | | 2,992,143 | |
| | Nordea Bank AB(j) | |
| | 10,000,000 | | | | 0.000 | | | | 10/24/17 | | | | 9,982,407 | |
| | Old Line Funding LLC | |
| | 2,000,000 | | | | 0.000 | (j) | | | 10/16/17 | | | | 1,996,739 | |
| | 11,000,000 | | | | 1.369 | | | | 11/08/17 | | | | 11,000,117 | |
| | 23,000,000 | | | | 0.000 | (j) | | | 11/17/17 | | | | 22,934,220 | |
| | Omnicom Capital, Inc.(j) | |
| | 9,500,000 | | | | 0.000 | | | | 09/25/17 | | | | 9,490,216 | |
| | Oversea-Chinese Banking Corp. Ltd. | |
| | 22,000,000 | | | | 1.426 | | | | 09/11/17 | | | | 22,001,762 | |
| | 21,125,000 | | | | 1.426 | | | | 09/25/17 | | | | 21,128,771 | |
| | Private Export Funding Corp. | |
| | 2,000,000 | | | | 1.611 | | | | 02/01/18 | | | | 2,002,303 | |
| | 43,700,000 | | | | 1.495 | | | | 03/28/18 | | | | 43,718,627 | |
| | Schlumberger Holdings Corp.(j) | |
| | 9,600,000 | | | | 0.000 | | | | 10/19/17 | | | | 9,580,753 | |
| | 11,500,000 | | | | 0.000 | | | | 10/27/17 | | | | 11,473,088 | |
| | Societe Generale SA | |
| | 22,375,000 | | | | 1.597 | | | | 03/19/18 | | | | 22,405,995 | |
| | Svenska Handelsbanken AB(j) | |
| | 22,000,000 | | | | 0.000 | | | | 10/25/17 | | | | 21,959,398 | |
| | Toronto Dominion Bank(j) | |
| | 5,000,000 | | | | 0.000 | | | | 11/03/17 | | | | 4,988,764 | |
| | UBS AG London | |
| | 20,000,000 | | | | 1.526 | | | | 06/15/18 | | | | 20,007,064 | |
| | Victory Receivables Corp.(j) | |
| | 22,000,000 | | | | 0.000 | | | | 11/13/17 | | | | 21,940,623 | |
| | VW Cr, Inc.(j) | |
| | 5,234,000 | | | | 0.000 | | | | 09/05/17 | | | | 5,232,959 | |
| | 13,000,000 | | | | 0.000 | | | | 09/21/17 | | | | 12,988,792 | |
| | Westpac Banking Corp. | |
| | 32,500,000 | | | | 1.552 | | | | 03/02/18 | | | | 32,533,018 | |
| | 20,000,000 | | | | 1.549 | | | | 03/12/18 | | | | 20,021,190 | |
| | 9,000,000 | | | | 1.378 | | | | 07/13/18 | | | | 8,997,609 | |
| | 11,500,000 | | | | 1.408 | | | | 08/13/18 | | | | 11,500,058 | |
| | 14,803,000 | | | | 1.424 | | | | 08/20/18 | | | | 14,804,562 | |
| | Westpac Securities NZ Ltd. | |
| | 9,150,000 | | | | 1.320 | | | | 05/10/18 | | | | 9,154,787 | |
| | 11,000,000 | | | | 1.434 | | | | 07/30/18 | | | | 11,000,416 | |
| | | | | | | | | | | | | | |
| | | | | | | | | | | | | 1,288,233,494 | |
| | |
| TOTAL SHORT-TERM INVESTMENTS
(Cost $2,254,577,485) |
| | $ | 2,255,509,557 | |
| | |
| TOTAL INVESTMENTS BEFORE SECURITIES
LENDING REINVESTMENT
(Cost $4,964,711,392) |
| | $ | 5,004,120,117 | |
| | |
| | |
| The accompanying notes are an integral part of these financial statements. | | 13 |
GOLDMAN SACHS TACTICAL TILT OVERLAY FUND
Consolidated Schedule of Investments (continued)
August 31, 2017
| | | | | | | | |
| Shares | | Rate
| | | Value | |
| Securities Lending Reinvestment Vehicle(h) – 3.0% | |
Goldman Sachs Financial Square Government Fund – Institutional Shares | |
| 155,454,690 | | | 0.927 | % | | $ | 155,454,690 | |
| (Cost $155,454,690) | | | | | |
| |
| TOTAL INVESTMENTS – 98.4% (Cost $5,120,166,082) | | | $ | 5,159,574,807 | |
| |
| OTHER ASSETS IN EXCESS OF LIABILITIES – 1.6% | | | | 83,353,260 | |
| |
| NET ASSETS – 100.0% | | | $ | 5,242,928,067 | |
| |
| | |
| The percentage shown for each investment category reflects the value of investments in that category as a percentage of net assets. |
(a) | | Security with “Call” features with resetting interest rates. Maturity dates disclosed are the final maturity dates. |
(b) | | Exempt from registration under Rule 144A of the Securities Act of 1933. Such securities may be deemed liquid by the investment adviser and may be resold, normally to qualified institutional buyers in transactions exempt from registration. Total market value of Rule 144A securities amounts to $96,100,753, which represents approximately 1.8% of net assets as of August 31, 2017. |
(c) | | Security is currently in default and/or non-income producing. |
(d) | | Significant unobservable inputs were used in the valuation of this portfolio security; i.e. Level 3. |
(e) | | Bank Loans often require prepayments from excess cash flows or permit the borrower to repay at its election. The degree to which borrowers repay, whether as a contractual requirement or at their election, cannot be predicted with accuracy. As a result, the actual remaining maturity may be substantially less than the stated maturities shown. The stated interest rate represents the weighted average interest rate of all contracts within the bank loan facility on August 31, 2017. Bank Loans typically have rates of interest which are predetermined either daily, monthly, quarterly or semi-annually by reference to a base |
| | lending rate, plus a premium. These base lending rates are primarily the London-Interbank Offered Rate (“LIBOR”), and secondarily the prime rate offered by one or more major United States banks (the “Prime Rate”) and the certificate of deposit (“CD”) rate or other base lending rates used by commercial lenders. |
(f) | | Restricted securities are not registered under the Securities Act of 1933 and are subject to legal restrictions on resale. These securities generally may be resold in transactions exempt from registration or to the public if the securities are subsequently registered and the registration statement is effective. Disposal of these securities may involve time consuming negotiations and prompt sale at an acceptable price may be difficult. Total market value of restricted securities amounts to $9,194,303, which represents approximately 0.2% of net assets as of August 31, 2017. See additional details below: |
| | | | | | | | | | |
| | | Restricted Security | | Acquisition
Date | | | Cost | |
| | Berry Petroleum Corp. | | | 03/01/17 | | | $ | 8,718,737 | |
| | Blue Ridge Mountain Resources, Inc. | | | 05/06/16-03/14/17 | | | $ | 1,998,250 | |
| | |
(g) | | All or a portion of security is on loan. |
(h) | | Represents affiliated funds/issuers. |
(i) | | Variable rate security. Interest rate or distribution rate disclosed is that which is in effect on August 31, 2017. |
(j) | | Issued with a zero coupon. Income is recognized through the accretion of discount. |
| | |
|
Currency Abbreviations: |
CNH | | —Chinese Yuan Renminbi Offshore |
EUR | | —Euro |
GBP | | —British Pound |
JPY | | —Japanese Yen |
USD | | —U.S. Dollar |
| | |
Investment Abbreviations: |
ETF | | —Exchange Traded Fund |
LLC | | —Limited Liability Company |
LP | | —Limited Partnership |
PLC | | —Public Limited Company |
|
|
| ADDITIONAL INVESTMENT INFORMATION |
FORWARD FOREIGN CURRENCY EXCHANGE CONTRACTS — At August 31, 2017, the Portfolio had the following forward foreign currency exchange contracts:
FORWARD FOREIGN CURRENCY EXCHANGE CONTRACTS WITH UNREALIZED GAIN
| | | | | | | | | | | | | | | | | | | | | | | | |
| Counterparty | | Currency
Purchased | | | Currency
Sold | | | Current
Value | | | Settlement
Date | | | Unrealized
Gain | |
Morgan Stanley & Co. International PLC | | CNH | | | 2,361,748,000 | | | USD | | | 347,573,565 | | | $ | 356,737,099 | | | | 11/14/17 | | | $ | 9,163,535 | |
| | CNH | | | 2,521,290,000 | | | USD | | | 373,894,310 | | | | 378,695,700 | | | | 02/14/18 | | | | 4,801,391 | |
| | CNH | | | 1,156,710,000 | | | USD | | | 172,288,649 | | | | 172,747,301 | | | | 05/16/18 | | | | 458,653 | |
| | JPY | | | 2,556,000,000 | | | USD | | | 23,108,490 | | | | 23,271,666 | | | | 09/20/17 | | | | 163,176 | |
| | USD | | | 37,915,093 | | | GBP | | | 29,065,000 | | | | 37,610,009 | | | | 09/20/17 | | | | 305,084 | |
| | | USD | | | 694,793,831 | | | JPY | | | 76,230,000,000 | | | | 694,052,848 | | | | 09/20/17 | | | | 740,983 | |
| TOTAL | | | | | | | | | | | | | | | | | | | | | | $ | 15,632,822 | |
| | |
| 14 | | The accompanying notes are an integral part of these financial statements. |
GOLDMAN SACHS TACTICAL TILT OVERLAY FUND
|
| ADDITIONAL INVESTMENT INFORMATION (continued) |
FORWARD FOREIGN CURRENCY EXCHANGE CONTRACTS WITH UNREALIZED LOSS
| | | | | | | | | | | | | | | | | | | | | | | | |
| Counterparty | | Currency
Purchased | | | Currency
Sold | | | Current
Value | | | Settlement
Date | | | Unrealized
Loss | |
Morgan Stanley & Co. International PLC | | GBP | | | 411,265,000 | | | USD | | | 533,891,885 | | | $ | 532,175,480 | | | | 09/20/17 | | | $ | (1,716,405 | ) |
| | USD | | | 335,570,584 | | | CNH | | | 2,361,748,000 | | | | 356,737,100 | | | | 11/14/17 | | | | (21,166,515 | ) |
| | USD | | | 357,925,419 | | | CNH | | | 2,521,290,000 | | | | 378,695,701 | | | | 02/14/18 | | | | (20,770,283 | ) |
| | USD | | | 162,573,436 | | | CNH | | | 1,156,710,000 | | | | 172,747,302 | | | | 05/16/18 | | | | (10,173,865 | ) |
| | | USD | | | 170,493,912 | | | EUR | | | 147,170,000 | | | | 175,386,165 | | | | 09/20/17 | | | | (4,892,254 | ) |
| TOTAL | | | | | | | | | | | | | | | | | | | | | | $ | (58,719,322 | ) |
FUTURES CONTRACTS — At August 31, 2017, the Portfolio had the following futures contracts:
| | | | | | | | | | | | | | |
| Description | | Number of
Contracts | | Expiration
Date | | | Notional Amount | | | Unrealized
Appreciation/ (Depreciation) | |
Long position contracts: | | | | | | | | | | |
Euro Stoxx 50 Index | | 11,566 | | | 12/21/18 | | | $ | 168,942,594 | | | $ | 6,106,345 | |
IBEX 35 Index | | 1,421 | | | 09/15/17 | | | | 174,288,682 | | | | (3,336,572 | ) |
Natural Gas | | 5,905 | | | 09/27/17 | | | | 179,512,000 | | | | (3,973,810 | ) |
2 Year U.S. Treasury Notes | | 731 | | | 09/29/17 | | | | 158,124,438 | | | | 67,733 | |
5 Year U.S. Treasury Notes | | 461 | | | 09/29/17 | | | | 54,628,500 | | | | 143,792 | |
10 Year U.S. Treasury Notes | | 889 | | | 09/19/17 | | | | 112,889,109 | | | | 502,342 | |
| Total | | | $ | (490,170 | ) |
Short position contracts: | | | | | | | | | | |
5 Year German Euro-Bobl | | 2,136 | | | 09/07/17 | | | | (338,548,745 | ) | | $ | (479,182 | ) |
| Total Futures Contracts | | | $ | (969,352 | ) |
CENTRALLY CLEARED CREDIT DEFAULT SWAP CONTRACT
| | | | | | | | | | | | | | | | | | | | | | |
| Referenced Obligation/Index | | Financing Rate
Received by the Portfolio(%) | | Credit
Spread at
August 31,
2017(a) | | | Termination
Date | | | Notional Amount | | | Value ($) | | | Unrealized
Appreciation/
(Depreciation)* | |
Protection Sold: | | | | | | | | | | | | | | | | | | | | | | |
| | | | | | |
CDX North America High Yield Index 28 | | 5.000% | | | 3.264 | % | | | 06/20/22 | | | | USD 123,930,000 | | | $ | 10,253,920 | | | $ | 2,084,255 | |
| | * | | There are no upfront payments on the swap contract(s), therefore the unrealized gain (loss) on the swap contracts is equal to their market value. |
| | (a) | | Credit spread on the Referenced Obligation, together with the term of the swap contract, are indicators of payment/performance risk. The likelihood of a credit event occurring which would require a portfolio or its counterparty to make a payment or otherwise be required to perform under the swap contract is generally greater as the credit spread and the term of the swap contract increase. |
| | |
| The accompanying notes are an integral part of these financial statements. | | 15 |
GOLDMAN SACHS TACTICAL TILT OVERLAY FUND
Consolidated Schedule of Investments (continued)
August 31, 2017
|
| ADDITIONAL INVESTMENT INFORMATION (continued) |
PURCHASED AND WRITTEN OPTIONS CONTRACTS — At August 31, 2017, the Portfolio had the following purchased and written options:
OPTIONS ON EQUITIES CONTRACTS
| | | | | | | | | | | | | | | | | | | | | | | | | | | | |
| Description | | Counterparty | | Exercise Price | | | Expiration
Date | | Number of
Contracts | | | Notional Amount | | | Market Value | | | Premiums
Paid (Received)
by Portfolio | | | Unrealized
Appreciation/ (Depreciation) | |
Purchased option contracts: | |
Puts | |
EQO SPX Index | | Morgan Stanley & Co. International PLC | | | 2,452.24 USD | | | 11/17/17 | | USD | 267,728 | | | | 267,728 | | | | 11,205,324 | | | | 14,758,319 | | | $ | (3,552,995 | ) |
Written option contracts: | |
Puts | |
EQO XLE Index | | JPMorgan Securities, Inc. | | | 64.51 USD | | | 02/23/18 | | USD | (2,550,482) | | | | (2,550,482 | ) | | | (10,812,276 | ) | | | (8,683,116 | ) | | $ | (2,129,160 | ) |
EQO SPX Index | | Morgan Stanley & Co. International PLC | | | 2,305.10 USD | | | 11/17/17 | | USD | (267,728) | | | | (267,728 | ) | | | (4,219,594 | ) | | | (6,157,744 | ) | | | 1,938,150 | |
EQQ XLE Index | | Morgan Stanley & Co. International PLC | | | 62.94 USD | | | 03/16/18 | | USD | (2,479,555) | | | | (2,479,555 | ) | | | (9,403,913 | ) | | | (8,878,046 | ) | | | (525,867 | ) |
| Total written option contracts | | | | | | (5,297,765) | | | | | | | | (24,435,783 | ) | | | (23,718,906 | ) | | $ | (716,877 | ) |
| | |
| 16 | | The accompanying notes are an integral part of these financial statements. |
GOLDMAN SACHS TACTICAL TILT OVERLAY FUND
Consolidated Statement of Assets and Liabilities(a)
August 31, 2017
| | | | | | |
| | | | | | |
| | Assets: | | | | |
| | Investments of unaffiliated issuers, at value (cost $2,896,038,526)(b) | | $ | 2,938,844,216 | |
| | Investments of affiliated issuers, at value (cost $2,068,672,866) | | | 2,065,275,901 | |
| | Investments in securities lending reinvestment vehicle — affiliated issuer, at value which equals cost | | | 155,454,690 | |
| | Purchased Options, at value (cost $14,758,319) | | | 11,205,324 | |
| | Cash | | | 90,983,097 | |
| | Foreign currencies, at value (cost $2,490,379) | | | 2,511,204 | |
| | Unrealized gain on forward foreign currency exchange contracts | | | 15,632,822 | |
| | Variation margin on certain derivative contracts | | | 6,189,576 | |
| | Receivables: | | | | |
| | Collateral on certain derivative contracts(c) | | | 170,701,915 | |
| | Portfolio shares sold | | | 31,986,775 | |
| | Dividends and interest | | | 12,403,287 | |
| | Due from broker | | | 1,050,000 | |
| | Securities lending income | | | 124,272 | |
| | Foreign tax reclaims | | | 90,844 | |
| | Investments sold | | | 9,995 | |
| | Other assets | | | 105,578 | |
| | Total assets | | | 5,502,569,496 | |
| | | | | | |
| | Liabilities: | | | | |
| | Unrealized loss on forward foreign currency exchange contracts | | | 58,719,322 | |
| | Written option contracts, at value (premium received $23,718,906) | | | 24,435,783 | |
| | Payables: | | | | |
| | Payable upon return of securities loaned | | | 155,454,690 | |
| | Portfolio shares redeemed | | | 14,648,731 | |
| | Management fees | | | 2,737,027 | |
| | Investments purchased | | | 2,652,999 | |
| | Collateral on certain derivative contracts(d) | | | 470,000 | |
| | Transfer Agency fees | | | 178,695 | |
| | Accrued expenses | | | 344,182 | |
| | Total liabilities | | | 259,641,429 | |
| | | | | | |
| | Net Assets: | | | | |
| | Paid-in capital | | | 5,442,119,866 | |
| | Undistributed net investment income | | | 33,867,197 | |
| | Accumulated net realized loss | | | (226,254,706 | ) |
| | Net unrealized gain | | | (6,804,290 | ) |
| | NET ASSETS | | $ | 5,242,928,067 | |
| | Shares Outstanding $0.001 par value (unlimited number of shares authorized): | | | 538,999,551 | |
| | Net asset value, offering and redemption price per share: | | | 9.73 | |
| | (a) | | Statement of Assets and Liabilities for the Portfolio is consolidated and includes the balances of a wholly owned subsidiary, Cayman Commodity-TTIF, Ltd. Accordingly, all interfund balances and transactions have been eliminated. |
| | (b) | | Includes loaned securities having a market value of $150,470,520. |
| | (c) | | Includes amounts segregated for initial margin requirements and/or collateral on futures contracts, forward foreign currency exchange contracts and swaps of $42,391,899, $68,670,000 and $59,640,016, respectively. |
| | (d) | | Includes amounts segregated for initial margin requirements and/or collateral on swaps of $470,000. |
| | |
| The accompanying notes are an integral part of these financial statements. | | 17 |
GOLDMAN SACHS TACTICAL TILT OVERLAY FUND
Consolidated Statement of Operations(a)
| | | | | | | | | | |
| | | | | For the Period
November 1, 2016 –
August 31, 2017(b) | | | For the Fiscal
Year Ended
October 31, 2016 | |
| | Investment income: | | | | | | | | |
| | Dividends — unaffiliated issuers | | $ | 9,398,573 | | | $ | 2,840,825 | |
| | Interest | | | 39,131,253 | | | | 44,270,338 | |
| | Dividends — affiliated issuers | | | 28,887,051 | | | | 39,403,195 | |
| | Securities lending income — affiliated issuer | | | 688,940 | | | | — | |
| | Total investment income | | | 78,105,817 | | | | 86,514,358 | |
| | | | | | | | | | |
| | Expenses: | | | | | | | | |
| | Management fees | | | 31,553,340 | | | | 35,129,354 | |
| | Transfer Agency fees | | | 1,795,097 | | | | 1,986,151 | |
| | Custody, accounting and administrative services | | | 307,174 | | | | 423,494 | |
| | Registration fees | | | 58,648 | | | | 309,359 | |
| | Professional fees | | | 133,250 | | | | 215,789 | |
| | Printing and mailing costs | | | 52,708 | | | | 49,562 | |
| | Trustee fees | | | 20,462 | | | | 36,665 | |
| | Other | | | 120,983 | | | | 186,893 | |
| | Total expenses | | | 34,041,662 | | | | 38,337,267 | |
| | Less — expense reductions | | | (5,846,705 | ) | | | (9,164,155 | ) |
| | Net expenses | | | 28,194,957 | | | | 29,173,112 | |
| | NET INVESTMENT INCOME | | | 49,910,860 | | | | 57,341,246 | |
| | | | | | | | | | |
| | Realized and unrealized gain (loss): | | | | | | | | |
| | Net realized gain (loss) from: | | | | | | | | |
| | Investments — unaffiliated issuers | | | 39,955,215 | | | | (138,837,272 | ) |
| | Investment — affiliated issuers | | | (2,714,329 | ) | | | (38,357,451 | ) |
| | Purchased options | | | (31,348,656 | ) | | | (23,786,773 | ) |
| | Futures contracts | | | 67,082,296 | | | | (40,582,064 | ) |
| | Written options | | | 12,555,321 | | | | (58,107,460 | ) |
| | Swap contracts | | | 1,280,200 | | | | 8,469,553 | |
| | Forward foreign currency exchange contracts | | | 13,881,818 | | | | 8,240,885 | |
| | Foreign currency transactions | | | 57,632 | | | | (440,083 | ) |
| | Net change in unrealized gain (loss) on: | | | | | | | | |
| | Investments — unaffiliated issuers | | | (30,638,148 | ) | | | 164,812,056 | |
| | Investments — affiliated issuers | | | 3,849,387 | | | | 24,854,770 | |
| | Purchased options | | | (4,907,947 | ) | | | 5,241,570 | |
| | Futures contracts | | | (20,198,885 | ) | | | 14,606,190 | |
| | Written options | | | (5,494,403 | ) | | | (7,874,468 | ) |
| | Swap contracts | | | 2,084,255 | | | | 2,063,578 | |
| | Forward foreign currency exchange contracts | | | (53,507,243 | ) | | | 2,869,498 | |
| | Foreign currency translation | | | 26,463 | | | | 147,021 | |
| | Net realized and unrealized gain (loss) | | | (8,037,024 | ) | | | (76,680,450 | ) |
| | NET INCREASE (DECREASE) IN NET ASSETS RESULTING FROM OPERATIONS | | $ | 41,873,836 | | | $ | (19,339,204 | ) |
| | (a) | | Statement of Operations for the Portfolio is consolidated and includes the balances of a wholly owned subsidiary, Cayman Commodity-TTIF, Ltd. Accordingly, all interfund balances and transactions have been eliminated. |
| | (b) | | The Portfolio changed its fiscal year end from October 31 to August 31. |
| | |
| 18 | | The accompanying notes are an integral part of these financial statements. |
GOLDMAN SACHS TACTICAL TILT OVERLAY FUND
Consolidated Statements of Changes in Net Assets(a)
| | | | | | | | | | | | | | |
| | | | | For the Period
November 1, 2016 –
August 31, 2017(b) | | | For the Fiscal
Year Ended
October 31, 2016 | | | For the Fiscal
Year Ended
October 31, 2015 | |
| | From operations: | | | | | | | | | | | | |
| | Net investment income | | $ | 49,910,860 | | | $ | 57,341,246 | | | $ | 56,995,143 | |
| | Net realized gain (loss) | | | 100,749,497 | | | | (283,400,665 | ) | | | 170,768,120 | |
| | Net change in unrealized gain (loss) | | | (108,786,521 | ) | | | 206,720,215 | | | | (108,783,001 | ) |
| | Net increase (decrease) in net assets resulting from operations | | | 41,873,836 | | | | (19,339,204 | ) | | | 118,980,262 | |
| | | | | | | | | | | | | | |
| | Distributions to shareholders: | | | | | | | | | | | | |
| | From net investment income | | | (94,407,307 | ) | | | (216,014,287 | ) | | | (21,152,095 | ) |
| | | | | | | | | | | | | | |
| | From share transactions: | | | | | | | | | | | | |
| | Proceeds from sales of shares | | | 1,091,408,140 | | | | 1,527,879,564 | | | | 3,261,513,640 | |
| | Reinvestment of distributions | | | 94,407,307 | | | | 216,014,287 | | | | 21,045,722 | |
| | Cost of shares redeemed | | | (1,105,199,452 | ) | | | (958,354,546 | ) | | | (238,278,749 | ) |
| | Net increase in net assets resulting from share transactions | | | 80,615,995 | | | | 785,539,305 | | | | 3,044,280,613 | |
| | TOTAL INCREASE | | | 28,082,524 | | | | 550,185,814 | | | | 3,142,108,780 | |
| | | | | | | | | | | | | | |
| | Net assets: | | | | | | | | | | | | |
| | Beginning of period | | | 5,214,845,543 | | | | 4,664,659,729 | | | | 1,522,550,949 | |
| | End of period | | $ | 5,242,928,067 | | | $ | 5,214,845,543 | | | $ | 4,664,659,729 | |
| | Undistributed net investment income | | $ | 33,867,197 | | | $ | 74,789,723 | | | $ | 200,441,707 | |
| | (a) | | Statement of Changes in Net Assets for the Portfolio is consolidated and includes the balances of a wholly owned subsidiary, Cayman Commodity-TTIF, Ltd. Accordingly, all interfund balances and transactions have been eliminated. |
| | (b) | | The Portfolio changed its fiscal year end from October 31 to August 31. |
| | |
| The accompanying notes are an integral part of these financial statements. | | 19 |
GOLDMAN SACHS TACTICAL TILT OVERLAY FUND
Consolidated Financial Highlights
Selected Data for a Share Outstanding Throughout Each Period
| | | | | | | | | | | | | | | | | | | | | | |
| | | | | | | | From
Investment Operations | | | | |
| | | Year - Share Class | | Net asset
value,
beginning
of period | | | Net
investment
income(a) | | | Net realized
and unrealized
gain (loss) | | | Total from
investment
operations | | | Distributions
from net
investment
income | |
| | FOR THE PERIOD NOVEMBER 1, 2016 – AUGUST 31,* | | | | | | | | | | | | | | | | | | | | |
| | 2017 - Institutional | | $ | 9.83 | | | $ | 0.09 | | | $ | (0.01 | ) | | $ | 0.08 | | | $ | (0.18 | ) |
| | | | | | | | | | | | | | | | | | | | | | |
| | FOR THE FISCAL YEARS ENDED OCTOBER 31, | | | | | | | | | | | | | | | | | | | | |
| | 2016 - Institutional | | | 10.40 | | | | 0.11 | | | | (0.22 | ) | | | (0.11 | ) | | | (0.46 | ) |
| | 2015 - Institutional | | | 9.87 | | | | 0.18 | | | | 0.46 | | | | 0.64 | | | | (0.11 | ) |
| | | | | | | | | | | | | | | | | | | | | | |
| | FOR THE PERIOD ENDED OCTOBER 31, | | | | | | | | | | | | | | | | | | | | |
| | 2014 - Institutional | | | 10.00 | | | | 0.04 | | | | (0.17 | ) | | | (0.13 | ) | | | — | |
| | * | | The Portfolio changed its fiscal year end from October 31 to August 31. |
| | (a) | | Calculated based on the average shares outstanding methodology. |
| | (b) | | Assumes investment at the NAV at the beginning of the period, reinvestment of all dividends and distributions, a complete redemption of the investment at the NAV at the end of the period and no sales or redemption charges. Total returns would be reduced if a sales or redemption charge was taken into account. Returns do not reflect the impact of taxes to shareholders relating to Portfolio distributions or the redemption of Portfolio shares. Total returns for periods less than one full year are not annualized. |
| | (c) | | Expense ratios exclude the expenses of the Underlying Funds in which the Portfolio invests. |
| | (d) | | The Portfolio’s portfolio turnover rate is calculated in accordance with regulatory requirements, without regard to transactions involving short term investments and certain derivatives. If such transactions were included, the Portfolio’s portfolio turnover rate may be higher. |
| | |
| 20 | | The accompanying notes are an integral part of these financial statements. |
GOLDMAN SACHS TACTICAL TILT OVERLAY FUND
| | | | | | | | | | | | | | | | | | | | | | | | | | | | | | | | | | | | | | | | |
| | | | | | | | | | | | | | | | | | | | | | | | | | | | | | | | | | |
| | | Net asset
value, end
of period | | | | | Total
return(b) | | | | | Net assets,
end of
year
(in 000s) | | | | | Ratio of
net expenses
to average
net assets(c) | | | | | Ratio of
total expenses
to average
net assets(c) | | | | | Ratio of
net investment
income
to average
net assets | | | | | Portfolio
turnover
rate(d) | |
| | | | | | | | | | | | | | | | | | | | | | | | | | | | | | | | | | | | | | | | |
| | $ | 9.73 | | | | | | 0.82 | % | | | | $ | 5,242,928 | | | | | | 0.62 | %(e) | | | | | 0.75 | %(e) | | | | | 1.10 | %(e) | | | | | 28 | % |
| | | | | | | | | | | | | | | | | | | | | | | | | | | | | | | | | | | | | | | | |
| | | | | | | | | | | | | | | | | | | | | | | | | | | | | | | | | | | | | | | | |
| | | 9.83 | | | | | | (0.96 | ) | | | | | 5,214,846 | | | | | | 0.59 | | | | | | 0.77 | | | | | | 1.15 | | | | | | 48 | |
| | | 10.40 | | | | | | 6.57 | | | | | | 4,664,660 | | | | | | 0.52 | | | | | | 0.79 | | | | | | 1.77 | | | | | | 81 | |
| | | | | | | | | | | | | | | | | | | | | | | | | | | | | | | | | | | | | | | | |
| | | | | | | | | | | | | | | | | | | | | | | | | | | | | | | | | | | | | | | | |
| | | 9.87 | | | | | | (1.30 | ) | | | | | 1,522,551 | | | | | | 0.63 | (e) | | | | | 0.86 | (e) | | | | | 1.63 | (e) | | | | | 45 | |
| | |
| The accompanying notes are an integral part of these financial statements. | | 21 |
GOLDMAN SACHS TACTICAL TILT OVERLAY FUND
Notes to Financial Statements
August 31, 2017
Goldman Sachs Trust (the “Trust”) is a Delaware statutory trust registered under the Investment Company Act of 1940, as amended (the “Act”), as an open-end management investment company. Goldman Sachs Tactical Tilt Overlay Fund (the “Portfolio”) is a non-diversified fund and currently offers one class of shares — Institutional Shares. The Portfolio commenced operations on July 31, 2014. Effective August 25, 2017, the Portfolio changed its fiscal year end from October 31 to August 31. Goldman Sachs Asset Management, L.P. (“GSAM”), an affiliate of Goldman Sachs & Co. LLC (formerly, Goldman, Sachs & Co.) (“Goldman Sachs”), serves as investment adviser to the Portfolio pursuant to a management agreement (the “Agreement”) with the Trust.
|
| 2. SIGNIFICANT ACCOUNTING POLICIES |
The financial statements have been prepared in accordance with accounting principles generally accepted in the United States of America (“GAAP”) and require management to make estimates and assumptions that may affect the reported amounts and disclosures. Actual results may differ from those estimates and assumptions.
A. Basis of Consolidation for Goldman Sachs Tactical Tilt Overlay Fund — The Cayman Commodity-TTIF, Ltd. (the “Subsidiary”), a Cayman Islands exempted company, was incorporated on July 31, 2014 and is currently a wholly-owned subsidiary of the Portfolio. The Subsidiary acts as an investment vehicle for the Portfolio to enable the Portfolio to gain exposure to certain types of commodity-linked derivative instruments. The Portfolio is the sole shareholder of the Subsidiary pursuant to a subscription agreement dated as of July 31, 2014, and it is intended that the Portfolio will remain the sole shareholder and will continue to control the Subsidiary. Under the Memorandum and Articles of Association of the Subsidiary, shares issued by the Subsidiary confer upon a shareholder the right to vote at general meetings of the Subsidiary and certain rights in connection with any winding-up or repayment of capital, as well as the right to participate in the profits or assets of the Subsidiary. All interfund balances and transactions have been eliminated in consolidation. As of August 31, 2017, the Portfolio’s net assets were $5,242,928,067, of which, $356,506,213, or 6.8%, represented the Subsidiary’s net assets.
B. Investment Valuation — The Portfolio’s valuation policy is to value investments at fair value.
C. Investment Income and Investments — Investment income includes interest income, dividend income and securities lending income. Interest income is accrued daily and adjusted for amortization of premiums and accretion of discounts. Dividend income is recognized on ex-dividend date or, for certain foreign securities, as soon as such information is obtained subsequent to the ex-dividend date. Investment transactions are reflected on trade date. Realized gains and losses are calculated using identified cost. Investment transactions are recorded on the following business day for daily net asset value (“NAV”) calculations. Investment income is recorded net of any foreign withholding taxes, less any amounts reclaimable. The Portfolio may file withholding tax reclaims in certain jurisdictions to recover a portion of amounts previously withheld. Any foreign capital gains tax is accrued daily based upon net unrealized gains, and is payable upon sale of such investments. Distributions from master limited partnerships (“MLPs”) are generally recorded based on the characterization reported on the MLP’s tax return. The Portfolio records its pro-rata share of the income/loss and capital gains/losses, allocated from the underlying partnerships and adjusts the cost basis of the underlying partnerships accordingly.
For derivative contracts, realized gains and losses are recorded upon settlement of the contract. Upfront payments, if any, are made or received upon entering into a swap agreement and are reflected in the Conslidated Statement of Assets and Liabilities. Upfront payments are recognized over the contract’s term/event as realized gains or losses, with the exception of forward starting interest rate swaps whose realized gains or losses are recognized from the effective start date.
D. Expenses — Expenses incurred directly by the Portfolio are charged to the Portfolio, and certain expenses incurred by the Trust that may not solely relate to the Portfolio are allocated to the Portfolio and the other applicable funds of the Trust on a straight-line and/or pro-rata basis, depending upon the nature of the expenses, and are accrued daily.
E. Federal Taxes and Distributions to Shareholders — It is the Portfolio’s policy to comply with the requirements of the Internal Revenue Code of 1986, as amended (the “Code”), applicable to regulated investment companies (mutual funds) and to
22
GOLDMAN SACHS TACTICAL TILT OVERLAY FUND
|
| 2. SIGNIFICANT ACCOUNTING POLICIES (continued) |
distribute each year substantially all of its investment company taxable income and capital gains to its shareholders. Accordingly, the Portfolio is not required to make any provisions for the payment of federal income tax. Distributions to shareholders are recorded on the ex-dividend date. Income and capital gains distributions, if any, are declared and paid annually.
The Subsidiary is classified as a controlled foreign corporation under the Code. Therefore, the Portfolio is required to increase its taxable income by its share of the Subsidiary’s income. Net losses of the Subsidiary cannot be deducted by the Portfolio in the current period nor carried forward to offset taxable income in future periods.
Net capital losses, if any, are carried forward to future fiscal years and may be used to the extent allowed by the Code to offset any future capital gains. Losses that are carried forward will retain their character as either short-term or long-term capital losses. Utilization of capital loss carryforwards will reduce the requirement of future capital gains distributions.
The characterization of distributions to shareholders for financial reporting purposes is determined in accordance with federal income tax rules, which may differ from GAAP. The source of the Portfolio’s distributions may be shown in the accompanying financial statements as either from net investment income, net realized gain or capital. Certain components of the Portfolio’s net assets on the Consolidated Statement of Assets and Liabilities reflect permanent GAAP/tax differences based on the appropriate tax character.
F. Foreign Currency Translation — The accounting records and reporting currency of the Portfolio are maintained in U.S. dollars. Assets and liabilities denominated in foreign currencies are translated into U.S. dollars using the current exchange rates at the close of each business day. The effect of changes in foreign currency exchange rates on investments is included within net realized and unrealized gain (loss) on investments. Changes in the value of other assets and liabilities as a result of fluctuations in foreign exchange rates are included in the Consolidated Statement of Operations within net change in unrealized gain (loss) on foreign currency translations. Transactions denominated in foreign currencies are translated into U.S. dollars on the date the transaction occurred, the effects of which are included within net realized gain (loss) on foreign currency transactions.
|
| 3. INVESTMENTS AND FAIR VALUE MEASUREMENTS |
U.S. GAAP defines the fair value of a financial instrument as the amount that would be received to sell an asset or paid to transfer a liability in an orderly transaction between market participants at the measurement date (i.e., the exit price); the Portfolio’s policy is to use the market approach. GAAP establishes a fair value hierarchy that prioritizes the inputs to valuation techniques used to measure fair value. The hierarchy gives the highest priority to unadjusted quoted prices in active markets for identical assets or liabilities (Level 1 measurements) and the lowest priority to unobservable inputs (Level 3 measurements). The levels used for classifying investments are not necessarily an indication of the risk associated with investing in these investments. The three levels of the fair value hierarchy are described below:
Level 1 — Unadjusted quoted prices in active markets that are accessible at the measurement date for identical, unrestricted assets or liabilities;
Level 2 — Quoted prices in markets that are not active or financial instruments for which significant inputs are observable (including, but not limited to, quoted prices for similar investments, interest rates, foreign exchange rates, volatility and credit spreads), either directly or indirectly;
Level 3 — Prices or valuations that require significant unobservable inputs (including GSAM’s assumptions in determining fair value measurement).
Changes in valuation techniques may result in transfers into or out of an assigned level within the hierarchy. In accordance with the Portfolio’s policy, transfers between different levels of the fair value hierarchy resulting from such changes are deemed to have occurred as of the beginning of the reporting period.
The Board of Trustees (“Trustees”) has approved Valuation Procedures that govern the valuation of the portfolio investments held by the Portfolio, including investments for which market quotations are not readily available. The Trustees have delegated to GSAM day-to-day responsibility for implementing and maintaining internal controls and procedures related to the valuation of the
23
GOLDMAN SACHS TACTICAL TILT OVERLAY FUND
Notes to Financial Statements (continued)
August 31, 2017
|
| 3. INVESTMENTS AND FAIR VALUE MEASUREMENTS (continued) |
Portfolio’s portfolio investments. To assess the continuing appropriateness of pricing sources and methodologies, GSAM regularly performs price verification procedures and issues challenges as necessary to third party pricing vendors or brokers, and any differences are reviewed in accordance with the Valuation Procedures.
A. Level 1 and Level 2 Fair Value Investments — The valuation techniques and significant inputs used in determining the fair values for investments classified as Level 1 and Level 2 are as follows:
Equity Securities — Equity securities traded on a United States (“U.S.”) securities exchange or the NASDAQ system, or those located on certain foreign exchanges, including but not limited to the Americas, are valued daily at their last sale price or official closing price on the principal exchange or system on which they are traded. If there is no sale or official closing price or such price is believed by GSAM to not represent fair value, equity securities are valued at the last bid price for long positions and at the last ask price for short positions. To the extent these investments are actively traded, they are classified as Level 1 of the fair value hierarchy, otherwise they are generally classified as Level 2.
Unlisted equity securities for which market quotations are available are valued at the last sale price on the valuation date, or if no sale occurs, at the last bid price. Securities traded on certain foreign securities exchanges are valued daily at fair value determined by an independent fair value service (if available) under Valuation Procedures approved by the Trustees and consistent with applicable regulatory guidance. The independent fair value service takes into account multiple factors including, but not limited to, movements in the securities markets, certain depositary receipts, futures contracts and foreign currency exchange rates that have occurred subsequent to the close of the foreign securities exchange. These investments are generally classified as Level 2 of the fair value hierarchy.
Private Investments — Private investments may include, but are not limited to, investments in private equity or debt instruments. The investment manager estimates the fair value of private investments based upon various factors, including, but not limited to, transactions in similar instruments, completed or pending third-party transactions in underlying investments or comparable entities, subsequent rounds of financing, recapitalizations, and other transactions across the capital structure, offerings in equity or debt capital markets, and changes in current and projected financial ratios or cash flows.
Underlying Funds (including Money Market Funds) — Underlying Funds (“Underlying Funds”) include other investment companies and exchange-traded funds (“ETFs”). Investments in the Underlying Funds (except ETFs) are valued at the NAV per share of the Institutional Share class on the day of valuation. ETFs are valued daily at the last sale price or official closing price on the principal exchange or system on which the investment is traded. Because the Portfolio invests in Underlying Funds that fluctuate in value, the Portfolio’s shares will correspondingly fluctuate in value. To the extent these investments are actively traded, they are classified as Level 1 of the fair value hierarchy, otherwise they are generally classified as Level 2. For information regarding an Underlying Fund’s accounting policies and investment holdings, please see the Underlying Fund’s shareholder report.
Debt Securities — Debt securities for which market quotations are readily available are valued daily on the basis of quotations supplied by dealers or an independent pricing service approved by the Trustees. The pricing services may use valuation models or matrix pricing, which consider: (i) yield or price with respect to bonds that are considered comparable in characteristics such as rating, interest rate and maturity date or (ii) quotations from securities dealers to determine current value. With the exception of treasury securities of G8 countries, which are generally classified as Level 1, these investments are generally classified as Level 2 of the fair value hierarchy.
i. Bank Loans — Bank loans (“Loans”) are interests in amounts owed by corporate, governmental, or other borrowers to lenders or lending syndicates. Loans are arranged through private negotiations between the borrower and one or more financial institutions (“Lenders”). The Portfolio’s investments in Loans are in the form of either participations in Loans (“Participations”) or assignments of all or a portion of Loans from third parties (“Assignments”). With respect to Participations, the Portfolio has the right to receive payments of principal, interest and any fees to which it is entitled from the Lender selling the Participations and only upon receipt by the Lender of the payments from the borrower. The Portfolio generally has no right to enforce compliance by the borrower with the terms of the loan agreement with respect to
24
GOLDMAN SACHS TACTICAL TILT OVERLAY FUND
|
| 3. INVESTMENTS AND FAIR VALUE MEASUREMENTS (continued) |
Participations. Conversely, assignments result in the Portfolio having a direct contractual relationship with the borrower, and the Portfolio may be permitted to enforce compliance by the borrower with the terms of the loan agreement.
Derivative Contracts — A derivative is an instrument whose value is derived from underlying assets, indices, reference rates or a combination of these factors. The Portfolio enters into derivative transactions to hedge against changes in interest rates, securities prices, and/or currency exchange rates, to increase total return, or to gain access to certain markets or attain exposure to other underliers.
Exchange-traded derivatives, including futures and options contracts, are valued at the last sale or settlement price and typically fall within Level 1 of the fair value hierarchy. Over-the-counter (“OTC”) and centrally cleared derivatives are valued using market transactions and other market evidence, including market-based inputs to models, calibration to market-clearing transactions, broker or dealer quotations, or other alternative pricing sources. Where models are used, the selection of a particular model to value OTC and centrally cleared derivatives depends upon the contractual terms of, and specific risks inherent in, the instrument, as well as the availability of pricing information in the market. Valuation models require a variety of inputs, including contractual terms, market prices, yield curves, credit curves, measures of volatility, voluntary and involuntary prepayment rates, loss severity rates and correlations of such inputs. For OTC and centrally cleared derivatives that trade in liquid markets, model inputs can generally be verified and model selection does not involve significant management judgment. OTC and centrally cleared derivatives are classified within Level 2 of the fair value hierarchy when significant inputs are corroborated by market evidence.
i. Forward Contracts — A forward contract is a contract between two parties to buy or sell an asset at a specified price on a future date. A forward contract settlement can occur on a cash or delivery basis. Forward contracts are marked-to-market daily using independent vendor prices, and the change in value, if any, is recorded as an unrealized gain or loss. Cash and certain investments may be used to collateralize forward contracts.
A forward foreign currency contract is a forward contract in which the Portfolio agrees to receive or deliver a fixed quantity of one currency for another, at a pre-determined price at a future date. All forward foreign currency exchange contracts are marked-to-market daily at the applicable forward rate. Non-deliverable forward foreign currency exchange contracts are settled with the counterparty in cash without the delivery of foreign currency.
ii. Futures Contracts — Futures contracts are contracts to buy or sell a standardized quantity of a specified commodity or security and are valued based on exchanged settlement prices or independent market quotes. Futures contracts are valued at the last settlement price, or in the absence of a sale, the last bid price for long positions and at the last ask price for short positions, at the end of each day on the board of trade or exchange upon which they are traded. Upon entering into a futures contract, the Portfolio deposits cash or securities in an account on behalf of the broker in an amount sufficient to meet the initial margin requirement. Subsequent payments are made or received by the Portfolio equal to the daily change in the contract value and are recorded as variation margin receivable or payable with a corresponding offset to unrealized gains or losses. For financial reporting purposes, cash collateral that has been pledged to cover obligations of the Portfolio and cash collateral received, if any, is reported separately on the Consolidated Statement of Assets and Liabilities as receivables/payables for collateral on certain derivative contracts. Non-cash collateral pledged by the Portfolio, if any, is noted in the Consolidated Schedule of Investments.
iii. Options — When the Portfolio writes call or put options, an amount equal to the premium received is recorded as a liability and is subsequently marked-to-market to reflect the current value of the option written. Swaptions are options on interest rate swap contracts.
Upon the purchase of a call option or a put option by the Portfolio, the premium paid is recorded as an investment and subsequently marked-to-market to reflect the current value of the option. Certain options may be purchased with premiums to be determined on a future date. The premiums for these options are based upon implied volatility parameters at specified terms.
iv. Swap Contracts — Bilateral swap contracts are agreements in which the Portfolio and a counterparty agree to exchange periodic payments on a specified notional amount or make a net payment upon termination. Bilateral swap transactions are
25
GOLDMAN SACHS TACTICAL TILT OVERLAY FUND
Notes to Financial Statements (continued)
August 31, 2017
|
| 3. INVESTMENTS AND FAIR VALUE MEASUREMENTS (continued) |
privately negotiated in the OTC market and payments are settled through direct payments between the Portfolio and the counterparty. By contrast, certain swap transactions are subject to mandatory central clearing. These swaps are executed through a derivatives clearing member (“DCM”), acting in an agency capacity, and submitted to a central counterparty (“CCP”)(“centrally cleared swaps”), in which case all payments are settled with the CCP through the DCM. Swaps are marked-to-market daily using pricing vendor quotations, counterparty or clearinghouse prices or model prices, and the change in value, if any, is recorded as an unrealized gain or loss. Upon entering into a swap contract, the Portfolio is required to satisfy an initial margin requirement by delivering cash or securities to the counterparty (or in some cases, segregated in a triparty account on behalf of the counterparty), which can be adjusted by any mark-to-market gains or losses pursuant to bilateral or centrally cleared arrangements. For centrally cleared swaps the daily change in valuation, if any, is recorded as a receivable or payable for variation margin.
An interest rate swap is an agreement that obligates two parties to exchange a series of cash flows at specified intervals, based upon or calculated by reference to changes in interest rates on a specified notional principal amount. The payment flows are usually netted against each other, with the difference being paid by one party to the other.
A credit default swap is an agreement that involves one party (the buyer of protection) making a stream of payments to another party (the seller of protection) in exchange for the right to receive protection on a reference security or obligation, including a group of assets or exposure to the performance of an index. The Portfolio’s investment in credit default swaps may involve greater risks than if the Portfolio had invested in the referenced obligation directly. Credit events are contract specific but may include bankruptcy, failure to pay, restructuring and obligation acceleration. If the Portfolio buys protection through a credit default swap and no credit event occurs, its payments are limited to the periodic payments previously made to the counterparty. Upon the occurrence of a specified credit event, the Portfolio, as a buyer of credit protection, is entitled to receive an amount equal to the notional amount of the swap and deliver to the seller the defaulted referenced obligation in a physically settled trade. The Portfolio may also receive a net settlement amount in the form of cash or securities equal to the notional amount of the swap reduced by the recovery value of the referenced obligation in a cash settled trade.
As a seller of protection, the Portfolio generally receives a payment stream throughout the term of the swap, provided that there is no credit event. In addition, if the Portfolio sells protection through a credit default swap, the Portfolio could suffer a loss because the value of the referenced obligation and the premium payments received may be less than the notional amount of the swap paid to the buyer of protection. Upon the occurrence of a specified credit event, the Portfolio, as a seller of credit protection, may be required to take possession of the defaulted referenced obligation and pay the buyer an amount equal to the notional amount of the swap in a physically settled trade. The Portfolio may also pay a net settlement amount in the form of cash or securities equal to the notional amount of the swap reduced by the recovery value of the referenced obligation in a cash settled trade. Recovery values are at times established through the credit event auction process in which market participants are ensured that a transparent price has been set for the defaulted security or obligation. In addition, the Portfolio is entitled to a return of any assets, which have been pledged as collateral to the counterparty upon settlement.
The maximum potential amount of future payments (undiscounted) that the Portfolio as seller of protection could be required to make under a credit default swap would be an amount equal to the notional amount of the agreement. These potential amounts would be partially offset by any recovery values of the respective referenced obligations or net amounts received from a settlement of a credit default swap for the same referenced security or obligation where the Portfolio bought credit protection.
Short Term Investments — Short-term investments having a maturity of 60 days or less are valued using available market quotations as provided by a third party pricing vendor or broker. These investments are classified as Level 2 of the fair value hierarchy.
B. Level 3 Fair Value Investments — To the extent that significant inputs to valuation models and other alternative pricing sources are unobservable, or if quotations are not readily available, or if GSAM believes that such quotations do not accurately reflect fair value, the fair value of the Portfolio’s investments may be determined under Valuation Procedures approved by the Trustees. GSAM, consistent with its procedures and applicable regulatory guidance, may make an adjustment to the most recent valuation prices of either domestic or foreign securities in light of significant events to reflect what it believes to be the fair value
26
GOLDMAN SACHS TACTICAL TILT OVERLAY FUND
|
| 3. INVESTMENTS AND FAIR VALUE MEASUREMENTS (continued) |
of the securities at the time of determining the Portfolio’s NAV. Significant events which could affect a large number of securities in a particular market may include, but are not limited to: significant fluctuations in U.S. or foreign markets; market dislocations; market disruptions; or unscheduled market closings. Significant events which could also affect a single issuer may include, but are not limited to: corporate actions such as reorganizations, mergers and buy-outs; ratings downgrades; and bankruptcies.
C. Fair Value Hierarchy — The following is a summary of the Portfolio’s investments and derivatives classified in the fair value hierarchy as of August 31, 2017:
| | | | | | | | | | | | |
| | | |
| Investment Type | | Level 1 | | | Level 2 | | | Level 3 | |
| Assets | | | | | | | | | | | | |
Fixed Income | | | | | | | | | | | | |
Corporate Obligations | | $ | — | | | $ | 333,392,506 | | | $ | — | |
Bank Loans | | | — | | | | — | | | | 2,083,857 | |
Common Stock and/or Other Equity Investments(a) | | | | | | | | | | | | |
North America | | | — | | | | 23,518,139 | | | | — | |
Exchange Traded Funds | | | 324,340,157 | | | | — | | | | — | |
Investment Companies | | | 2,065,275,901 | | | | — | | | | — | |
Short-term Investments | | | — | | | | 2,255,509,557 | | | | — | |
Securities Lending Reinvestment Vehicle | | | 155,454,690 | | | | — | | | | — | |
| Total | | $ | 2,545,070,748 | | | $ | 2,612,420,202 | | | $ | 2,083,857 | |
| | | |
| Derivative Type | | | | | | | | | |
| Assets | | | | | | | | | | | | |
Options Purchased | | $ | — | | | $ | 11,205,324 | | | $ | — | |
Forward Foreign Currency Exchange Contracts(b) | | | — | | | | 15,632,822 | | | | — | |
Futures Contracts(b) | | | 6,820,212 | | | | — | | | | — | |
Credit Default Swap Contracts(b) | | | — | | | | 2,084,255 | | | | — | |
| Total | | $ | 6,820,212 | | | $ | 28,922,401 | | | $ | — | |
| Liabilities | | | | | | | | | | | | |
Forward Foreign Currency Exchange Contracts(b) | | $ | — | | | $ | (58,719,322 | ) | | $ | — | |
Futures Contracts(b) | | | (7,789,564 | ) | | | — | | | | — | |
Written Options Contracts | | | — | | | | (24,435,784 | ) | | | — | |
| Total | | $ | (7,789,564 | ) | | $ | (83,155,106 | ) | | $ | — | |
| (a) | | Amounts are disclosed by continent to highlight the impact of time zone differences between local market close and the calculation of net asset value. Security valuations are based on the principle exchange or system on which they are traded, which may differ from country of domicile. The Portfolio utilizes fair value model prices provided by an independent fair value service for international equities, resulting in a Level 2 classification. |
| (b) | | Amount shown represents unrealized gain (loss) at period end. |
For further information regarding security characteristics, see the Consolidated Schedule of Investments.
|
| 4. INVESTMENTS IN DERIVATIVES |
The following table sets forth, by certain risk types, the gross value of derivative contracts as of August 31, 2017. These instruments were used as part of the Portfolio’s investment strategies and to obtain and/or manage exposure related to the risks
27
GOLDMAN SACHS TACTICAL TILT OVERLAY FUND
Notes to Financial Statements (continued)
August 31, 2017
|
| 4. INVESTMENTS IN DERIVATIVES (continued) |
below. The values in the table below exclude the effects of cash collateral received or posted pursuant to these derivative contracts, and therefore are not representative of the Portfolio’s net exposure.
| | | | | | | | | | | | |
| Risk | | Consolidated Statement of Assets and Liabilities | | Assets | | | Consolidated Statement of Assets and Liabilities | | Liabilities | |
Interest rate | | Variation margin on certain derivative contracts | | $ | 713,867 | (a) | | Variation margin on certain derivative contracts | | $ | (479,182) | (a) |
Credit | | Receivable for unrealized gain on swap contracts | | | 2,084,255 | (a) | | — | | | — | |
Currency | | Receivable for unrealized gain on forward foreign currency exchange contracts | | | 15,632,822 | | | Payable for unrealized loss on forward foreign currency exchange contracts | | | (58,719,322) | |
Commodity | | — | | | — | | | Variation margin on certain derivative contracts | | | (3,973,810) | (a) |
Equity | | Variation margin on certain derivative contracts; Purchased Options, at value | | | 17,311,669 | (a) | | Variation margin on certain derivative contracts; Written options, at value | | | (27,772,356) | (a) |
| Total | | | | $ | 35,742,613 | | | | | $ | (90,944,670) | |
| (a) | | Includes unrealized gain (loss) on futures contracts and centrally cleared swaps described in the Additional Investment Information sections of the Consolidated Schedule of Investments. Only current day’s variation margin is reported within the Consolidated Statement of Assets and Liabilities. |
The following table sets forth, by certain risk types, the Portfolio’s gains (losses) related to these derivatives and their indicative volumes for the period ended August 31, 2017. These gains (losses) should be considered in the context that these derivative contracts may have been executed to create investment opportunities and/or economically hedge certain investments, and accordingly, certain gains (losses) on such derivative contracts may offset certain (losses) gains attributable to investments. These gains (losses) are included in “Net realized gain (loss)” or “Net change in unrealized gain (loss)” on the Consolidated Statement of Operations:
| | | | | | | | | | | | | | |
| Risk | | Consolidated Statement of Operations | | Net Realized
Gain (Loss) | | | Net Change in
Unrealized
Gain (Loss) | | | Average
Number of
Contracts(a) | |
| Interest rate | | Net realized gain (loss) from futures contracts and swap contracts /Net change in unrealized gain (loss) on futures contracts | | $ | 1,804,254 | | | $ | (1,162,503 | ) | | | 6,004 | |
| Credit | | Net realized gain (loss) from swap contracts/Net change in unrealized gain (loss) on swap contracts | | | 646,642 | | | | 2,084,255 | | | | 1 | |
| Commodity | | Net change in unrealized gain (loss) on futures contracts | | | — | | | | (3,973,810 | ) | | | 3,321 | |
| Currency | | Net realized gain (loss) from forward foreign currency exchange contracts/Net change in unrealized gain (loss) on forward foreign currency exchange contracts | | | 13,881,818 | | | | (53,507,243 | ) | | | 17 | |
| Equity | | Net realized gain (loss) from futures contracts, purchased options and written options/Net change in unrealized gain (loss) on futures contracts, purchased options and written options | | | 47,118,267 | | | | (25,464,922 | ) | | | 10,760 | |
| Total | | | | $ | 63,450,981 | | | $ | (82,024,223 | ) | | | 20,103 | |
| (a) | | Average number of contracts is based on the average of month end balances for the period August 31, 2017. |
28
GOLDMAN SACHS TACTICAL TILT OVERLAY FUND
|
| 4. INVESTMENTS IN DERIVATIVES (continued) |
In order to better define its contractual rights and to secure rights that will help the Portfolio mitigate its counterparty risk, the Portfolio may enter into an International Swaps and Derivatives Association, Inc. Master Agreement (“ISDA Master Agreement”) or similar agreement with its derivatives counterparties. An ISDA Master Agreement is a bilateral agreement between the Portfolio and a counterparty that governs OTC derivatives (including forward foreign currency exchange contracts, and certain options and swaps), and typically contains, among other things, collateral posting terms and netting provisions in the event of a default and/or termination event. The provisions of the ISDA Master Agreement typically permit a single net payment in the event of a default (close-out netting) or similar event, including the bankruptcy or insolvency of the counterparty.
Collateral and margin requirements differ between exchange traded derivatives and OTC derivatives. Margin requirements are established by the broker or clearing house for exchange-traded and centrally cleared derivatives (financial futures contracts, options and centrally cleared swaps) pursuant to governing agreements for those instrument types. Brokers can ask for margin in excess of the minimum in certain circumstances. Collateral terms are contract-specific for OTC derivatives. For derivatives traded under an ISDA Master Agreement, the collateral requirements are typically calculated by netting the marked to market amount for each transaction under such agreement and comparing that amount to the value of any collateral currently pledged by the Portfolio and the counterparty. Additionally, the Portfolio may be required to post initial margin to the counterparty, the terms of which would be outlined in the confirmation of the OTC transaction.
For financial reporting purposes, cash collateral that has been pledged to cover obligations of the Portfolio and cash collateral received from the counterparty, if any, is reported separately on the Consolidated Statement of Assets and Liabilities as receivables/payables for collateral on certain derivative contracts. Non-cash collateral pledged by the Portfolio, if any, is noted in the Consolidated Schedule of Investments. Generally, the amount of collateral due from or to a counterparty must exceed a minimum transfer amount threshold before a transfer is required to be made. To the extent amounts due to the Portfolio from its counterparties are not fully collateralized, contractually or otherwise, the Portfolio bears the risk of loss from counterparty nonperformance. The Portfolio attempts to mitigate counterparty risk by only entering into agreements with counterparties that the Investment Adviser believes to be of good standing and by monitoring the financial stability of those counterparties.
Additionally, the netting of assets and liabilities and the offsetting of collateral pledged or received are based on contractual netting/set-off provisions in the ISDA Master Agreement or similar agreements. However, in the event of a default or insolvency of a counterparty, a court could determine that such rights are not enforceable due to the restrictions or prohibitions against the right of setoff that may be imposed in accordance with a particular jurisdiction’s bankruptcy or insolvency laws.
The following tables set forth the Portfolio’s net exposure for derivative instruments that are subject to enforceable master netting arrangements or similar agreements as of August 31, 2017:
| | | | | | | | | | | | | | | | | | | | | | | | | | | | | | | | | | | | |
| | | Derivative Assets(a) | | | Derivative Liabilities(a) | | | Net Derivative
Asset
(Liabilities) | | | Collateral
(Received)
Pledged(a) | | | Net
Amount(b) | |
| Counterparty | | Options Purchased | | | Forward
Currency
Contracts | | | Total | | | Forward
Currency
Contracts | | | Options
Written | | | Total | | | | |
JPMorgan Securities, Inc. | | $ | — | | | $ | — | | | $ | — | | | $ | — | | | $ | (10,812,276 | ) | | $ | (10,812,276 | ) | | $ | (10,812,276 | ) | | $ | 10,812,276 | | | $ | — | |
Morgan Stanley & Co. International PLC | | | 11,205,324 | | | | 15,632,822 | | | | 26,838,146 | | | | (58,719,322 | ) | | | (13,623,508 | ) | | | (72,342,830 | ) | | | (45,504,684 | ) | | | 45,504,684 | | | | — | |
Total | | $ | 11,205,324 | | | $ | 15,632,822 | | | $ | 26,838,146 | | | $ | (58,719,322 | ) | | $ | (24,435,784 | ) | | $ | (83,155,106 | ) | | $ | (56,316,960 | ) | | $ | 56,316,960 | | | $ | — | |
| (a) | | Gross amounts available for offset but not netted in the Consolidated Statement of Assets and Liabilities. |
| (b) | | Net amount represents the net amount due (to) from counterparty in the event of a default based on the contractual set-off rights under the agreement. Net amount excludes any over-collateralized amounts. |
|
| 5. AGREEMENTS AND AFFILIATED TRANSACTIONS |
A. Management Agreement — Under the Agreement, GSAM manages the Portfolio, subject to the general supervision of the Trustees.
29
GOLDMAN SACHS TACTICAL TILT OVERLAY FUND
Notes to Financial Statements (continued)
August 31, 2017
|
| 5. AGREEMENTS AND AFFILIATED TRANSACTIONS (continued) |
As compensation for the services rendered pursuant to the Agreement, the assumption of the expenses related thereto and administration of the Portfolio’s business affairs, including providing facilities, GSAM is entitled to a management fee, accrued daily and paid monthly, equal to an annual percentage rate of the Portfolio’s average daily net assets.
For the period ended August 31, 2017, contractual and effective net management fees with GSAM were at the following rates:
| | | | | | | | | | | | | | | | | | | | | | |
| Contractual Management Rate | | | Effective Net
Management
Fee Rate*^(a) | |
First $2 billion | | | Next $3 billion | | | Next $3 billion | | | Over $8 billion | | | Effective Management Fee Rate | | |
| | 0.75% | | | | 0.68% | | | | 0.64% | | | | 0.62% | | | | 0.70% | | | | 0.62% | |
| * | | GSAM has agreed to waive a portion of its management fee payable by the Portfolio in an amount equal to the management fee it earns as an investment adviser to any of the affiliated Underlying Funds in which the Portfolio invests through at least February 28, 2018. Prior to such date GSAM may not terminate the arrangement without the approval of the Trustees. |
| ^ | | Effective Net Management Rate includes the impact of management fee waivers of affiliated underlying funds, if any. |
| (a) | | Reflects combined management fees paid to GSAM under the Agreement and the Subsidiary Agreement as defined below after waivers. |
The Portfolio invests in Institutional Shares of the Goldman Sachs Financial Square Government Fund (“Government Money Market Fund”), the Goldman Sachs High Yield Fund, the Goldman Sachs High Yield Floating Rate Fund and the Goldman Sachs Local Emerging Markets Debt Fund, which are affiliated Underlying Funds. GSAM has agreed to waive a portion of its management fee payable by the Portfolio in an amount equal to the management fee it earns as an investment adviser to any of the affiliated Underlying Funds in which the Portfolio invests, except those management fees it earns from the Portfolio’s investment of cash collateral received in connection with securities lending transactions in the Government Money Market Fund. For the period ended August 31, 2017, GSAM waived $5,846,624 of the Portfolio’s management fee.
GSAM also provides management services to the Subsidiary pursuant to a Subsidiary Management Agreement (the “Subsidiary Agreement”) and is entitled to a management fee accrued daily and paid monthly, equal to an annual percentage rate of 0.42% of the Subsidiary’s average daily net assets. In consideration of the Subsidiary’s management fee, and for as long as the Subsidiary Agreement remains in effect, GSAM has contractually agreed to waive irrevocably a portion of the Portfolio’s management fee in an amount equal to the management fee accrued and paid to GSAM by the Subsidiary under the Subsidiary Agreement. For the period ended August 31, 2017, GSAM waived $1,261,525 of the Portfolio’s management fee. This waiver represents an inter-fund transaction and, accordingly, has been eliminated in consolidation.
B. Transfer Agency Agreement — Goldman Sachs also serves as the transfer agent of the Portfolio for a fee pursuant to the Transfer Agency Agreement. The fees charged for such transfer agency services are accrued daily and paid monthly at an annual rate of 0.04% of the average daily net assets of Institutional Shares.
C. Other Expense Agreements and Affiliated Transactions — GSAM has agreed to limit certain “Other Expenses” of the Portfolio (excluding acquired fund fees and expenses, transfer agency fees and expenses, taxes, interest, brokerage fees, shareholder meeting, litigation, indemnification and extraordinary expenses) to the extent such expenses exceed, on an annual basis, a percentage rate of the average daily net assets of the Portfolio. Such Other Expense reimbursements, if any, are accrued daily and paid monthly. In addition, the Portfolio is not obligated to reimburse GSAM for prior fiscal year expense reimbursements, if any. The Other Expense limitation as an annual percentage rate of average daily net assets for the Portfolio is 0.164%. The Other Expense limitation will remain in place through at least February 28, 2018, and prior to such date GSAM may not terminate the arrangement without the approval of the Trustees. In addition, the Portfolio has entered into certain offset arrangements with the transfer agent, which may result in a reduction of the Portfolio’s expenses and are received irrespective of the application of the “Other Expense” limitation described above.
For the period ended August 31, 2017, these expense reductions, including any fee waivers and Other Expense reimbursements, were as follows:
| | | | | | | | | | |
Management
Fee Waiver | | | Other Expense
Reimbursements | | | Total Expense
Reductions | |
| $ | 5,846,624 | | | $ | 81 | | | $ | 5,846,705 | |
30
GOLDMAN SACHS TACTICAL TILT OVERLAY FUND
|
| 5. AGREEMENTS AND AFFILIATED TRANSACTIONS (continued) |
D. Line of Credit Facility — As of August 31, 2017, the Portfolio participated in a $1,100,000,000 committed, unsecured revolving line of credit facility (the “facility”) together with other funds of the Trust and certain registered investment companies having management agreements with GSAM or its affiliates. This facility is to be used for temporary emergency purposes, or to allow for an orderly liquidation of securities to meet redemption requests. The interest rate on borrowings is based on the federal funds rate. The facility also requires a fee to be paid by the Portfolio based on the amount of the commitment that has not been utilized. For the period ended August 31, 2017, the Portfolio did not have any borrowings under the facility.
E. Other Transactions with Affiliates — For the period ended August 31, 2017 , Goldman Sachs earned $138,505, in brokerage commissions from portfolio transactions, including futures transactions executed with Goldman Sachs as the Futures Commission Merchant, on behalf of the Portfolio.
The Portfolio may purchase securities from, or sell securities to, an affiliated fund provided the affiliation is solely due to having a common investment adviser, common officers, or common trustees. For the period ended August 31, 2017, the purchases at cost with an affiliated fund in compliance with Rule 17a-7 for the Portfolio were $3,850,000.
The table below shows the transactions in and earnings from investments in the Underlying Funds for the period ended August 31, 2017:
| | | | | | | | | | | | | | | | | | | | | | | | | | | | | | | | |
Affiliated Investment
Companies | | Beginning Value as of October 31, 2016 | | | Purchases
at Cost | | | Proceeds
from Sales | | | Net Realized
Gain (Loss)
on Sales of
Affiliated
Investment
Companies | | | Change in
Unrealized
Appreciation/
(Depreciation) | | | Ending Value as of
August 31, 2017 | | | Shares as of
August 31, 2017 | | | Dividend
Income from
Affiliated
Investment
Companies | |
Goldman Sachs Financial Square Government Fund | | $ | 3,756,204,294 | | | $ | 2,034,967,733 | | | $ | (4,095,353,274 | ) | | $ | — | | | $ | — | | | $ | 1,695,818,753 | | | | 1,695,818,753 | | | $ | 12,690,569 | |
Goldman Sachs High Yield Floating Rate Fund | | | 329,739,084 | | | | 71,843,444 | | | | (31,507,253 | ) | | | (616,756 | ) | | | (913,093 | ) | | | 368,545,426 | | | | 38,033,584 | | | | 12,164,009 | |
Goldman Sachs High Yield Fund | | | 171,842,238 | | | | 3,896,854 | | | | (178,812,843 | ) | | | (2,097,573 | ) | | | 5,171,324 | | | | — | | | | — | | | | 4,032,473 | |
Goldman Sachs Local Emerging Markets Debt Fund | | | — | | | | 1,320,566 | | | | — | | | | — | | | | (408,844 | ) | | | 911,722 | | | | 136,281 | | | | — | |
Total | | $ | 4,257,785,616 | | | $ | 2,112,030,597 | | | $ | (4,305,673,370 | ) | | $ | (2,714,329 | ) | | $ | 3,849,387 | | | $ | 2,065,275,901 | | | | | | | $ | 28,887,051 | |
An investment by the Portfolio representing greater than 5% of the voting securities of an issuer makes that issuer an “affiliated person” (as defined by the Act) of such issuer. The following table provides information about the investment in shares of issuers of which the Portfolio is an affiliate as of and for the period ended August 31, 2017:
| | | | | | | | | | | | | | | | | | | | | | | | |
| Affiliated Issuers | | Beginning
Value as of
October 31, 2016 | | | Purchases at Cost | | | Proceeds
from Sales | | | Net Realized
Gain (Loss)
on Sales of
Affiliated
Issuers | | | Change in
Unrealized
Appreciation/
(Depreciation) | | | Ending
Value as of
August 31, 2017 | |
Blue Ridge Mountain Resources, Inc.* — Bank Loans | | $ | 285,364 | | | $ | 24,769 | | | $ | — | | | $ | — | | | $ | — | | | $ | 318,959 | |
Blue Ridge Mountain Resources, Inc.* — Common Stock | | | 2,453,108 | | | | 6,571 | | | | — | | | | — | | | | (657,348 | ) | | | 1,802,331 | |
Total | | $ | 2,738,472 | | | $ | 31,340 | | | $ | — | | | $ | — | | | $ | (657,348 | ) | | $ | 2,121,290 | |
| * | | Security held was no longer affiliated as of August 31, 2017. |
31
GOLDMAN SACHS TACTICAL TILT OVERLAY FUND
Notes to Financial Statements (continued)
August 31, 2017
|
| 6. PORTFOLIO SECURITIES TRANSACTIONS |
The cost of purchases and proceeds from sales and maturities of long-term securities for the period ended August 31, 2017, were $339,269,345 and $587,512,470, respectively.
The Portfolio may lend its securities through a securities lending agent, the Bank of New York Mellon (“BNYM”), to certain qualified borrowers. In accordance with the Portfolio’s securities lending procedures, the Portfolio receives cash collateral at least equal to the market value of the securities on loan. The market value of the loaned securities is determined at the close of business of the Portfolio, at their last sale price or official closing price on the principal exchange or system on which they are traded, and any additional required collateral is delivered to the Portfolio on the next business day. As with other extensions of credit, the Portfolio may experience delay in the recovery of its securities or incur a loss should the borrower of the securities breach its agreement with the Portfolio or become insolvent at a time when the collateral is insufficient to cover the cost of repurchasing securities on loan. Dividend income received from securities on loan may not be subject to withholding taxes and therefore withholding taxes paid may differ from the amounts listed in the Consolidated Statement of Operations. Loans of securities are terminable at any time and as such 1) the remaining contractual maturities of the outstanding securities lending transactions are considered to be overnight and continuous and 2) the borrower, after notice, is required to return borrowed securities within the standard time period for settlement of securities transactions.
The Portfolio invests the cash collateral received in connection with securities lending transactions in the Government Money Market Fund, an affiliated series of the Trust. The Government Money Market Fund is registered under the Act as an open end investment company, is subject to Rule 2a-7 under the Act, and is managed by GSAM, for which GSAM may receive a management fee of up to 0.205% on an annualized basis of the average daily net assets of the Government Money Market Fund.
In the event of a default by a borrower with respect to any loan, BNYM may exercise any and all remedies provided under the applicable borrower agreement to make the Portfolio whole. These remedies include purchasing replacement securities by applying the collateral held from the defaulting broker against the purchase cost of the replacement securities. If BNYM is unable to purchase replacement securities, BNYM will indemnify the Portfolio by paying the Portfolio an amount equal to the market value of the securities loaned minus the value of cash collateral received from the borrower for the loan, subject to an exclusion for any shortfalls resulting from a loss of value in such cash collateral due to reinvestment risk. The amounts of the Portfolio’s overnight and continuous agreements represent the gross amounts of recognized liabilities for securities lending transactions outstanding as of August 31, 2017 are disclosed as “Payable upon return of securities loaned” on the Consolidated Statement of Assets and Liabilities.
Both the Portfolio and BNYM received compensation relating to the lending of the Portfolio’s securities. The amounts earned, if any, by the Portfolio’s for the period ended August 31, 2017, are reported under Investment Income on the Consolidated Statement of Operations.
The following table provides information about the Portfolio’s investment in the Government Money Market Fund for the period ended August 31, 2017.
| | | | | | | | | | | | | | | | | | | | | | |
Beginning Value
as of
October 31, 2016 | | | Purchases
at Cost | | | Proceeds
from Sales | | | Ending Value
as of
August 31, 2017 | | | Shares as of
August 31, 2017 | | | Dividend
Income from
Affiliated
Securities
Lending
Reinvestment
Vehicle | |
| $ | — | | | $ | 1,042,973,043 | | | $ | (887,518,353 | ) | | $ | 155,454,690 | | | | 155,454,690 | | | $ | 688,940 | |
32
GOLDMAN SACHS TACTICAL TILT OVERLAY FUND
The tax character of distributions paid during the period ended August 31, 2017, in the amount of $94,407,307, was from ordinary income.
The tax character of distributions paid during the fiscal year ended October 31, 2016, in the amount of $216,014,287, was from ordinary income.
The tax character of distributions paid during the fiscal year ended October 31, 2015, in the amount of $21,152,095, was from ordinary income.
As of August 31, 2017, the components of accumulated earnings (losses) on a tax basis were as follows:
| | | | |
Undistributed ordinary income — net | | $ | 28,296,800 | |
Capital loss carryforwards:(1) | | | | |
Perpetual Short-Term | | $ | (195,779,673 | ) |
Perpetual Long-Term | | | (60,213,884 | ) |
Total capital loss carryforwards | | $ | (255,993,557 | ) |
Unrealized gains (losses) — net | | | 28,504,958 | |
Total accumulated earnings (losses) net | | $ | (199,191,799 | ) |
| (1) | | The Portfolio utilized $44,372,987 of capital losses in the current fiscal year. |
As of August 31, 2017, the Portfolio’s aggregate security unrealized gains and losses based on cost for U.S. federal income tax purposes were as follows:
| | | | |
Tax Cost | | $ | 5,083,618,821 | |
Gross unrealized gain | | | 44,548,913 | |
Gross unrealized loss | | | (16,043,955 | ) |
Net unrealized gains on investments | | $ | 28,504,958 | |
The difference between GAAP-basis and tax basis unrealized gains (losses) is attributable primarily to wash sales, net mark to market gains/(losses) on regulated futures, net mark to market gains/(losses) on foreign currency contracts, differences in the tax treatment of swap transactions, underlying fund investments and consent fees.
In order to present certain components of the Portfolio’s capital accounts on a tax-basis, certain reclassifications have been recorded to the Portfolio’s accounts. These reclassifications have no impact on the net asset value of the Portfolio and result primarily from differences in the tax treatment of swap transactions, foreign currency transactions, underlying fund investments, consent fees, and eliminating entries to cayman subsidiary.
| | | | | | | | | | |
Paid-in
Capital | | | Accumulated
Net Realized
Gain (Loss) | | | Undistributed
Net Investment
Income (Loss) | |
| $ | (2,834,260 | ) | | $ | (739,661 | ) | | $ | 3,573,921 | |
GSAM has reviewed the Portfolio’s tax positions for all open tax years (the current and prior three years, as applicable) and has concluded that no provision for income tax is required in the Portfolio’s financial statements. Such open tax years remain subject to examination and adjustment by tax authorities.
33
GOLDMAN SACHS TACTICAL TILT OVERLAY FUND
Notes to Financial Statements (continued)
August 31, 2017
The Portfolio’s risks include, but are not limited to, the following:
Derivatives Risk — The Portfolio’s use of derivatives may result in loss. Derivative instruments, which may pose risks in addition to and greater than those associated with investing directly in securities, currencies or other instruments, may be illiquid or less liquid, volatile, difficult to price and leveraged so that small changes in the value of the underlying instruments may produce disproportionate losses to the Portfolio. Derivatives are also subject to counterparty risk, which is the risk that the other party in the transaction will not fulfill its contractual obligation. The use of derivatives is a highly specialized activity that involves investment techniques and risks different from those associated with investments in more traditional securities and instruments. Losses from derivatives can also result from a lack of correlation between changes in the value of derivative instruments and the portfolio assets (if any) being hedged.
Foreign and Emerging Countries Risk — Investing in foreign markets may involve special risks and considerations not typically associated with investing in the United States. Foreign securities may be subject to risk of loss because of more or less foreign government regulation, less public information and less economic, political and social stability in the countries in which the Portfolio invests. The imposition of exchange controls, confiscations, trade restrictions (including tariffs) and other government restrictions by the United States or other governments, or from problems in share registration, settlement or custody, may also result in losses. Foreign risk also involves the risk of negative foreign currency rate fluctuations, which may cause the value of securities denominated in such foreign currency (or other instruments through which the Portfolio has exposure to foreign currencies) to decline in value. Currency exchange rates may fluctuate significantly over short periods of time. To the extent that the Portfolio also invests in securities of issuers located in emerging markets, these risks may be more pronounced.
Foreign Custody Risk — If the Portfolio invests in foreign securities may hold such securities and cash with foreign banks, agents, and securities depositories appointed by the Portfolio’s custodian (each a “Foreign Custodian”). Some foreign custodians may be recently organized or new to the foreign custody business. In some countries, Foreign Custodians may be subject to little or no regulatory oversight over, or independent evaluation of, their operations. Further, the laws of certain countries may place limitations on the Portfolio’s ability to recover its assets if a Foreign Custodian enters bankruptcy. Investments in emerging markets may be subject to even greater custody risks than investments in more developed markets. Custody services in emerging market countries are very often undeveloped and may be considerably less well regulated than in more developed countries, and thus may not afford the same level of investor protection as would apply in developed countries.
Geographic Risk — If the Portfolio focuses its investments in securities of issuers located in a particular country or geographic region, it will subject the Portfolio, to a greater extent than if its investments were less focused, to the risks of volatile economic cycles and/or conditions and developments that may be particular to that country or region, such as: adverse securities markets; adverse exchange rates; adverse social, political, regulatory, economic, business, environmental or other developments; or natural disasters.
Interest Rate Risk — When interest rates increase, fixed income securities or instruments held by the Portfolio will generally decline in value. Long-term fixed income securities or instruments will normally have more price volatility because of this risk than short-term fixed income securities or instruments. The risks associated with increasing rates are heightened given that interest rates are near historic lows, but may be expected to increase in the future with unpredictable effects on the markets and the Portfolio’s investments. Fluctuations in interest rates may also affect the liquidity of fixed income securities and instruments held by the Portfolio.
Investments in Other Investment Companies — As a shareholder of another investment company, including an exchange-traded fund (“ETF”), the Portfolio will indirectly bear its proportionate share of any net management fees and other expenses paid by such other investment companies, in addition to the fees and expenses regularly borne by the Portfolio. ETFs are subject to risks that do not apply to conventional mutual funds, including but not limited to the following: (i) the market price of the ETF’s shares may trade at a premium or a discount to their NAV; and (ii) an active trading market for an ETF’s shares may not develop or be maintained.
34
GOLDMAN SACHS TACTICAL TILT OVERLAY FUND
|
| 9. OTHER RISKS (continued) |
Investments in the Underlying Funds — The investments of the Portfolio are concentrated in the Underlying Funds, and the Portfolio’s investment performance is directly related to the investment performance of the Underlying Funds it holds. The Portfolio is subject to the risk factors associated with the investments of the Underlying Funds in direct proportion to the amount of assets allocated to each. The Portfolio that has a relative concentration of its portfolio in a single Underlying Fund may be more susceptible to adverse developments affecting that Underlying Fund, and may be more susceptible to losses because of these developments.
Large Shareholder Transactions Risk — The Portfolio may experience adverse effects when certain large shareholders, such as other funds, institutional investors (including those trading by use of non-discretionary mathematical formulas), financial intermediaries (who may make investment decisions on behalf of underlying clients and/or include the Portfolio in their investment model), individuals, accounts and Goldman Sachs affiliates, purchase or redeem large amounts of shares of the Portfolio. Such large shareholder redemptions may cause the Portfolio to sell portfolio securities at times when it would not otherwise do so, which may negatively impact the Portfolio’s NAV and liquidity. These transactions may also accelerate the realization of taxable income to shareholders if such sales of investments resulted in gains, and may also increase transaction costs. In addition, a large redemption could result in the Portfolio’s current expenses being allocated over a smaller asset base, leading to an increase in the Portfolio’s expense ratio. Similarly, large Portfolio share purchases may adversely affect the Portfolio’s performance to the extent that the Portfolio is delayed in investing new cash and is required to maintain a larger cash position than it ordinarily would.
Liquidity Risk — The Portfolio may make investments that are illiquid or that may become less liquid in response to market developments or adverse investor perceptions. Illiquid investments may be more difficult to value. Liquidity risk may also refer to the risk that the Portfolio will not be able to pay redemption proceeds within the allowable time period because of unusual market conditions, an unusually high volume of redemption requests, or other reasons. To meet redemption requests, the Portfolio may be forced to sell investments at an unfavorable time and/or under unfavorable conditions. Liquidity risk may be the result of, among other things, the reduced number and capacity of traditional market participants to make a market in fixed income securities or the lack of an active market. The potential for liquidity risk may be magnified by a rising interest rate environment or other circumstances where investor redemptions from fixed income mutual funds may be higher than normal, potentially causing increased supply in the market due to selling activity.
Market and Credit Risks — In the normal course of business, the Portfolio trades financial instruments and enters into financial transactions where risk of potential loss exists due to changes in the market (market risk). Additionally, the Portfolio may also be exposed to credit risk in the event that an issuer or guarantor fails to perform or that an institution or entity with which the Portfolio has unsettled or open transactions defaults.
Non-Diversification Risk — The Portfolio is non-diversified, meaning that it is permitted to invest a larger percentage of its assets in fewer issuers than diversified mutual funds. Thus, the Portfolio may be more susceptible to adverse developments affecting any single issuer held in its portfolio, and may be more susceptible to greater losses because of these developments.
Sector Risk — To the extent the Portfolio focuses its investments in securities of issuers in one or more sectors (such as the financial services or telecommunications sectors), the Portfolio may be subjected, to a greater extent than if its investments were diversified across different sectors, to the risks of volatile economic cycles and/or conditions and developments that may be particular to that sector, such as: adverse economic, business, political, environmental or other developments.
Tax Risk — The Portfolio will seek to gain exposure to the commodity markets primarily through investments in the Subsidiary and/or commodity index-linked structured notes, as applicable. Historically, the Internal Revenue Service (“IRS”) has issued private letter rulings (“PLRs”) in which the IRS specifically concluded that income and gains from investments in commodity index-linked structured notes or a wholly-owned foreign subsidiary that invests in commodity-linked instruments are “qualifying income” for purposes of compliance with Subchapter M of the Code. However, the Portfolio has not received a PLR, and is not able to rely on PLRs issued to other taxpayers. Additionally, the IRS has suspended the granting of such PLRs, pending review of its position on this matter. The IRS also recently issued proposed regulations that, if finalized, would generally treat the Portfolio’s income inclusion with respect to a subsidiary as qualifying income only if there is a distribution out of the earnings and profits of a
35
GOLDMAN SACHS TACTICAL TILT OVERLAY FUND
Notes to Financial Statements (continued)
August 31, 2017
|
| 9. OTHER RISKS (continued) |
subsidiary that are attributable to such income inclusion. The proposed regulations, if adopted, would apply to taxable years beginning on or after 90 days after the regulations are published as final.
The IRS also recently issued a revenue procedure, which states that the IRS will not in the future issue PLRs that would require a determination of whether an asset (such as a commodity index-linked note) is a “security” under the Investment Company Act of 1940. The Portfolio has obtained an opinion of counsel that the Portfolio��s income from such investments should constitute “qualifying income.” However, no assurances can be provided that the IRS would not be able to successfully assert that the Portfolio’s income from such investments was not “qualifying income,” in which case the Portfolio would fail to qualify as a regulated investment company (“RIC”) under Subchapter M of the Code if over 10% of its gross income were derived from these investments. If the Portfolio failed to qualify as a RIC, it would be subject to federal and state income tax on all of its taxable income at regular corporate tax rates. This would significantly adversely affect the returns to, and could cause substantial losses for Portfolio shareholders.
Under the Trust’s organizational documents, its Trustees, officers, employees and agents are indemnified, to the extent permitted by the Act and state law, against certain liabilities that may arise out of performance of their duties to the Portfolio. Additionally, in the course of business, the Portfolio enters into contracts that contain a variety of indemnification clauses. The Portfolio’s maximum exposure under these arrangements is unknown, as this would involve future claims that may be made against the Portfolio that have not yet occurred. However, GSAM believes the risk of loss under these arrangements to be remote.
Subsequent events after the Consolidated Statement of Assets and Liabilities date have been evaluated, and GSAM has concluded that there is no impact requiring adjustment or disclosure in the financial statements.
| | |
| 12. SUMMARY OF SHARE TRANSACTIONS | | |
Share activity is as follows:
| | | | | | | | | | | | | | | | | | | | | | | | |
| | | For the Period Ended
August 31, 2017(a) | | | For the Fiscal Year Ended
October 31, 2016
| | | For the Fiscal Year Ended
October 31, 2015
| |
| | | Shares | | | Dollars | | | Shares | | | Dollars | | | Shares | | | Dollars | |
| | | | |
Shares sold | | | 111,043,563 | | | $ | 1,091,408,140 | | | | 159,963,476 | | | $ | 1,527,879,564 | | | | 315,239,101 | | | $ | 3,261,513,640 | |
Reinvestment of distributions | | | 9,613,779 | | | | 94,407,307 | | | | 22,361,727 | | | | 216,014,287 | | | | 2,125,831 | | | | 21,045,722 | |
Shares redeemed | | | (112,301,237 | ) | | | (1,105,199,452 | ) | | | (100,184,535 | ) | | | (958,354,546 | ) | | | (23,128,874 | ) | | | (238,278,749 | ) |
NET INCREASE | | | 8,356,105 | | | $ | 80,615,995 | | | | 82,140,668 | | | $ | 785,539,305 | | | | 294,236,058 | | | $ | 3,044,280,613 | |
| (a) | | The Portfolio changed its fiscal year end from October 31 to August 31. |
36
Report of Independent Registered Public Accounting Firm
To the Board of Trustees of Goldman Sachs Trust and Shareholders of the Goldman Sachs Tactical Tilt Overlay Fund:
In our opinion, the accompanying consolidated statement of assets and liabilities, including the consolidated schedule of investments, and the related consolidated statements of operations and of changes in net assets and the consolidated financial highlights present fairly, in all material respects, the financial position of the Goldman Sachs Tactical Tilt Overlay Fund (the “Portfolio”), a portfolio of the Goldman Sachs Trust, as of August 31, 2017, and the results of its operations for the periods November 1, 2016 to August 31, 2017 and November 1, 2015 to October 31, 2016, the changes in its net assets for the periods November 1, 2016 to August 31, 2017, November 1, 2015 to October 31, 2016, and November 1, 2014 to October 31, 2015 and the financial highlights for each of the periods presented therein, in conformity with accounting principles generally accepted in the United States of America. These consolidated financial statements and financial highlights (hereafter referred to as “financial statements”) are the responsibility of the Portfolio’s management. Our responsibility is to express an opinion on these financial statements based on our audits. We conducted our audits of these financial statements in accordance with the standards of the Public Company Accounting Oversight Board (United States). Those standards require that we plan and perform the audit to obtain reasonable assurance about whether the financial statements are free of material misstatement. An audit includes examining, on a test basis, evidence supporting the amounts and disclosures in the financial statements, assessing the accounting principles used and significant estimates made by management, and evaluating the overall financial statement presentation. We believe that our audits, which included confirmation of securities as of August 31, 2017 by correspondence with the custodian, brokers, transfer agent of the underlying funds and the application of alternative auditing procedures where securities purchased confirmations had not been received, provide a reasonable basis for our opinion.
PricewaterhouseCoopers LLP
Boston, Massachusetts
October 24, 2017
37
GOLDMAN SACHS TACTICAL TILT OVERLAY FUND
| | |
Portfolio Expenses — Six Month Period Ended August 31, 2017 (Unaudited) | | |
As a shareholder of Institutional Shares of the Portfolio, you incur ongoing costs, including management fees and other Portfolio expenses. This Example is intended to help you understand your ongoing costs (in dollars) of investing in the Portfolio and to compare these costs with the ongoing costs of investing in other mutual funds.
The Example is based on an investment of $1,000 invested at the beginning of the period and held for the entire period from March 1, 2017 through August 31, 2017, which represents a period of 184 days in a 365 day year.
Actual Expenses — The first line in the table below provides information about actual account values and actual expenses. You may use the information in this line, together with the amount you invested, to estimate the expenses that you paid over the period. Simply divide your account value by $1,000 (for example, an $8,600 account value divided by $1,000=8.6), then multiply the result by the number in the first line under the heading entitled “Expenses Paid” to estimate the expenses you paid on your account during this period.
Hypothetical Example for Comparison Purposes — The second line in the table below provides information about hypothetical account values and hypothetical expenses based on the Portfolio’s actual net expense ratios and an assumed rate of return of 5% per year before expenses, which is not the Portfolio’s actual return. The hypothetical account values and expenses may not be used to estimate the actual ending account balance or expenses you paid for the period. You may use this information to compare the ongoing costs of investing in the Portfolio and other funds. To do so, compare this 5% hypothetical example with the 5% hypothetical examples that appear in the shareholder reports of the other funds.
Please note that the expenses shown in the table are meant to highlight your ongoing costs only and do not reflect any transactional costs, such as sales charges, redemption fees, or exchange fees. Therefore, the second line of the table is useful in comparing ongoing costs only, and will not help you determine the relative total costs of owning different funds. In addition, if these transactional costs were included, your costs
| | | | | | | | | | | | |
| Share Class | | Beginning
Account Value
3/1/17 | | | Ending
Account Value
8/31/17 | | | Expenses Paid for the
6 months ended
8/31/17* | |
| Institutional Shares | | | | | | | | | | | | |
Actual | | $ | 1,000.00 | | | $ | 991.80 | | | $ | 3.26 | |
Hypothetical 5% return | | | 1,000.00 | | | | 1,021.93 | + | | | 3.31 | |
| | * | | Expenses are calculated using the Portfolio’s annualized net expense ratio, which represents the ongoing expenses as a percentage of net assets for the six months ended August 31, 2017. Expenses are calculated by multiplying the annualized net expense ratio by the average account value for the period; then multiplying the result by the number of days in the most recent fiscal period; and then dividing that result by the number of days in the fiscal year. The annualized net expense ratios for the period was 0.65%. | |
| | + | | Hypothetical expenses are based on the Portfolio’s actual annualized net expense ratios and an assumed rate of return of 5% per year before expenses. | |
38
GOLDMAN SACHS TACTICAL TILT OVERLAY FUND
Statement Regarding Basis for Approval of Management Agreement (Unaudited)
Background
The Goldman Sachs Tactical Tilt Overlay Fund (the “Portfolio”) is an investment portfolio of Goldman Sachs Trust (the “Trust”). The Board of Trustees oversees the management of the Trust and reviews the investment performance and expenses of the Portfolio at regularly scheduled meetings held throughout the year. In addition, the Board of Trustees determines annually whether to approve the continuance of the Trust’s investment management agreement (the “Management Agreement”) with Goldman Sachs Asset Management, L.P. (the “Investment Adviser”) on behalf of the Portfolio.
The Management Agreement was most recently approved for continuation until June 30, 2018 by the Board of Trustees, including those Trustees who are not parties to the Management Agreement or “interested persons” (as defined in the Investment Company Act of 1940, as amended) of any party thereto (the “Independent Trustees”), at a meeting held on June 14-15, 2017 (the “Annual Meeting”).
The review process undertaken by the Trustees spans the course of the year and culminates with the Annual Meeting. To assist the Trustees in their deliberations, the Trustees have established a Contract Review Committee (the “Committee”), comprised of the Independent Trustees. The Committee held four meetings over the course of the year since the Management Agreement was last approved. At those Committee meetings, regularly scheduled Board or other committee meetings, and/or the Annual Meeting, matters relevant to the renewal of the Management Agreement were considered by the Board, or the Independent Trustees, as applicable. With respect to the Portfolio, such matters included:
| | (a) | | the nature and quality of the advisory, administrative, and other services provided to the Portfolio and the underlying funds in which it invests (the “Underlying Funds”) by the Investment Adviser and its affiliates, including information about: |
| | (i) | | the structure, staff, and capabilities of the Investment Adviser and its portfolio management teams; |
| | (ii) | | the groups within the Investment Adviser and its affiliates that support the portfolio management teams or provide other types of necessary services, including fund services groups (e.g., accounting and financial reporting, tax, shareholder services, and operations); controls and risk management groups (e.g., legal, compliance, valuation oversight, credit risk management, internal audit, compliance testing, market risk analysis, finance, and central funding); sales and distribution support groups, and others (e.g., information technology and training); |
| | (iii) | | trends in employee headcount; |
| | (iv) | | the Investment Adviser’s financial resources and ability to hire and retain talented personnel and strengthen its operations; and |
| | (v) | | the parent company’s support of the Investment Adviser and its mutual fund business, as expressed by the firm’s senior management; |
| | (b) | | information on the investment performance of the Portfolio and the Underlying Funds, including comparisons to the performance of similar mutual funds, as provided by a third-party mutual fund data provider engaged as part of the contract review process (the “Outside Data Provider”), and a benchmark performance index; and information on general investment outlooks in the markets in which the Portfolio and the Underlying Funds invest; |
| | (c) | | information provided by the Investment Adviser indicating the Investment Adviser’s views on whether the Portfolio’s peer group and/or benchmark index had high, medium, or low relevance given the Portfolio’s particular investment strategy; |
| | (d) | | the terms of the Management Agreement and other agreements with affiliated service providers entered into by the Trust on behalf of the Portfolio; |
| | (e) | | fee and expense information for the Portfolio, including: |
| | (i) | | the relative management fee and expense levels of the Portfolio as compared to those of comparable funds managed by other advisers, as provided by the Outside Data Provider; |
| | (ii) | | the Portfolio’s expense trends over time; and |
| | (iii) | | to the extent the Investment Adviser manages other types of accounts (such as bank collective trusts, private wealth management accounts, institutional separate accounts, sub-advised mutual funds, and non-U.S. funds) having investment objectives and policies similar to those of the Portfolio, comparative information on the advisory fees charged and services provided to those accounts by the Investment Adviser; |
| | (f) | | with respect to the extensive investment performance and expense comparison data provided by the Outside Data Provider, its processes in producing that data for the Portfolio; |
| | (g) | | the undertakings of the Investment Adviser and its affiliates to implement fee waivers and/or expense limitations; |
| | (h) | | information relating to the profitability of the Management Agreement and the transfer agency and distribution and service arrangements of the Portfolio to the Investment Adviser and its affiliates; |
39
GOLDMAN SACHS TACTICAL TILT OVERLAY FUND
Statement Regarding Basis for Approval of Management Agreement (Unaudited) (continued)
| | (i) | | whether the Portfolio’s existing management fee schedule, together with the management fee schedules for the Underlying Funds, adequately addressed any economies of scale; |
| | (j) | | a summary of the “fall-out” benefits derived by the Investment Adviser and its affiliates from their relationships with the Portfolio and/or the Underlying Funds, including the fees received by the Investment Adviser’s affiliates from the Portfolio and/or the Underlying Funds for transfer agency, portfolio trading, distribution and other services; |
| | (k) | | a summary of potential benefits derived by the Portfolio and/or the Underlying Funds as a result of their relationship with the Investment Adviser; |
| | (l) | | information regarding commissions paid by the Portfolio and the Underlying Funds and broker oversight, an update on the Investment Adviser’s soft dollars practices, other information regarding portfolio trading, and how the Investment Adviser carries out its duty to seek best execution; |
| | (m) | | portfolio manager ownership of Portfolio shares; the manner in which portfolio manager compensation is determined; and the number and types of accounts managed by the portfolio managers; |
| | (n) | | the nature and quality of the services provided to the Portfolio and the Underlying Funds by their unaffiliated service providers, and the Investment Adviser’s general oversight and evaluation (including reports on due diligence) of those service providers as part of the administrative services provided under the Management Agreement; and |
| | (o) | | the Investment Adviser’s processes and policies addressing various types of potential conflicts of interest; its approach to risk management; the annual review of the effectiveness of the Portfolio’s compliance program; and periodic compliance reports. |
The Trustees also received an overview of the Portfolio’s distribution arrangements. They received information regarding the Portfolio’s assets and share purchase and redemption activity. Information was also provided to the Trustees relating to revenue sharing payments made by and services provided by the Investment Adviser and its affiliates to intermediaries that promote the sale, distribution, and/or servicing of Portfolio shares. The Independent Trustees also discussed the broad range of other investment choices that are available to Portfolio investors, including the availability of comparable funds managed by other advisers.
The presentations made at the Board and Committee meetings and at the Annual Meeting encompassed the Portfolio and other mutual funds for which the Board of Trustees has responsibility. In evaluating the Management Agreement at the Annual Meeting, the Trustees relied upon their knowledge, resulting from their meetings and other interactions throughout the year, of the Investment Adviser and its affiliates, their services, and the Portfolio. In conjunction with these meetings, the Trustees received written materials and oral presentations on the topics covered, and the Investment Adviser addressed the questions and concerns of the Trustees, including concerns regarding the investment performance of certain of the funds they oversee. The Independent Trustees were advised by their independent legal counsel regarding their responsibilities and other regulatory requirements related to the approval and continuation of mutual fund investment management agreements under applicable law. In addition, the Investment Adviser and its affiliates provided the Independent Trustees with a written response to a formal request for information sent on behalf of the Independent Trustees by their independent legal counsel. During the course of their deliberations, the Independent Trustees met in executive sessions with their independent legal counsel, without representatives of the Investment Adviser or its affiliates present.
Nature, Extent, and Quality of the Services Provided Under the Management Agreement
As part of their review, the Trustees considered the nature, extent, and quality of the services provided to the Portfolio and the Underlying Funds by the Investment Adviser. In this regard, the Trustees considered both the investment advisory services and non-advisory services that are provided by the Investment Adviser and its affiliates. The Trustees noted the transition in the leadership and changes in personnel of various of the Investment Adviser’s portfolio management teams that had occurred in recent periods, and the ongoing recruitment efforts aimed at bringing high quality investment talent to the Investment Adviser. They also noted the Investment Adviser’s commitment to maintaining high quality systems and expending substantial resources to respond to ongoing changes to the regulatory and control environment in which the Portfolio and its service providers operate, as well as the efforts of the Investment Adviser and its affiliates to combat cyber security risks. The Trustees concluded that the Investment Adviser continued to commit substantial financial and operational resources to the Portfolio and the Underlying Funds and expressed confidence that the Investment Adviser would continue to do so in the future. The Trustees also recognized that the Investment Adviser had made significant commitments to address regulatory compliance requirements applicable to the Portfolio, the Underlying Funds, and the Investment Adviser and its affiliates.
Investment Performance
The Trustees also considered the investment performance of the Portfolio and the Underlying Funds. In this regard, they compared the investment performance of each Underlying Fund to its peers using rankings and ratings compiled by the Outside
40
GOLDMAN SACHS TACTICAL TILT OVERLAY FUND
Statement Regarding Basis for Approval of Management Agreement (Unaudited) (continued)
Data Provider as of December 31, 2016, and updated performance information prepared by the Investment Adviser using the peer groups identified by the Outside Data Provider as of March 31, 2017. The information on each Underlying Fund’s investment performance was provided for the one-, three-, five-, and ten-year periods ending on the applicable dates, to the extent that each Underlying Fund had been in existence for those periods. The Trustees also reviewed the Portfolio’s and each Underlying Fund’s investment performance relative to its performance benchmark. They observed that the Portfolio had outperformed its LIBOR-based benchmark index by 7.60% for the one-year period ended March 31, 2017. The Trustees also noted that the Portfolio had experienced certain portfolio management changes in 2016.
As part of this review, the Trustees considered the investment performance trends of the Portfolio and the Underlying Funds over time, and reviewed the investment performance of the Portfolio and each Underlying Fund in light of its investment objective and policies and market conditions. With respect to certain Underlying Funds, the Trustees also received information comparing the Funds’ performance to that of composites of accounts with comparable investment strategies managed by the Investment Adviser.
In addition, the Trustees considered materials prepared and presentations made by the Investment Adviser’s senior management and portfolio management personnel in which Portfolio and Underlying Fund performance was assessed. The Trustees also considered the Investment Adviser’s periodic reports with respect to the Portfolio’s and Underlying Funds’ risk profiles, and how the Investment Adviser’s approach to risk monitoring and management influences portfolio management.
Costs of Services Provided and Competitive Information
The Trustees considered the contractual terms of the Management Agreement and the fee rates payable by the Portfolio thereunder. In this regard, the Trustees considered information on the services rendered by the Investment Adviser to the Portfolio, which included both advisory and administrative services that were directed to the needs and operations of the Portfolio as a registered mutual fund.
In particular, the Trustees reviewed analyses prepared by the Outside Data Provider regarding the expense rankings of the Portfolio. The analyses provided a comparison of the Portfolio’s management fee and breakpoints to those of a relevant peer group and category universe; an expense analysis which compared the Portfolio’s overall net and gross expenses to a peer group and a category universe; and data comparing the Portfolio’s net expenses to the peer and category medians. The analyses also compared the Portfolio’s transfer agency and custody fees, other expenses and fee waivers/reimbursements to those of the peer group and category medians. The Trustees concluded that the comparisons provided by the Outside Data Provider were useful in evaluating the reasonableness of the management fees and total expenses paid by the Portfolio.
In addition, the Trustees considered the Investment Adviser’s undertakings to implement fee waivers and/or expense limitations. The Trustees noted that the Investment Adviser had agreed to waive a portion of its management fee in an amount equal to the entire management fee paid to the Investment Adviser as the investment adviser to the Portfolio’s wholly-owned subsidiary. They also considered, to the extent that the Investment Adviser manages other types of accounts having investment objectives and policies similar to those of the Portfolio, comparative fee information for services provided by the Investment Adviser to those accounts, and information that indicated that services provided to the Portfolio differed in various significant respects from the services provided to other types of accounts which, in many cases, operated under less stringent legal and regulatory structures, required fewer services from the Investment Adviser to a smaller number of client contact points, and were less time-intensive.
In addition, the Trustees noted that shareholders are able to redeem their Portfolio shares at any time if shareholders believe that the Portfolio fees and expenses are too high or if they are dissatisfied with the performance of the Portfolio.
Profitability
The Trustees reviewed the Portfolio’s contribution to the Investment Adviser’s revenues and pre-tax profit margins. In this regard the Trustees noted that they had received, among other things, profitability analyses and summaries, revenue and expense schedules by Portfolio and by function (i.e., investment management, transfer agency and distribution and service), and information on the Investment Adviser’s expense allocation methodology. They observed that the profitability and expense figures are substantially similar to those used by the Investment Adviser for many internal purposes, including compensation decisions among various business groups, and are thus subject to a vigorous internal debate about how certain revenue and expenses should be allocated. The Trustees also noted that the internal audit group within the Goldman Sachs organization had audited the expense allocation methodology and that the internal audit group was satisfied with the reasonableness, consistency, and accuracy of the Investment Adviser’s expense allocation methodology and profitability analysis calculations. Profitability data for the Portfolio was provided for 2016 and 2015, and the Trustees considered this information in relation to the Investment Adviser’s overall profitability.
41
GOLDMAN SACHS TACTICAL TILT OVERLAY FUND
Statement Regarding Basis for Approval of Management Agreement (Unaudited) (continued)
Economies of Scale
The Trustees considered the information that had been provided regarding the Investment Adviser’s profitability. The Trustees also considered the breakpoints in the fee rate payable under the Management Agreement for the Portfolio at the following annual percentage rates of the average daily net assets of the Portfolio:
| | | | |
First $2 billion | | | 0.75 | % |
Next $3 billion | | | 0.68 | |
Next $3 billion | | | 0.64 | |
Over $8 billion | | | 0.62 | |
The Trustees noted that the breakpoints were designed to share potential economies of scale, if any, with the Portfolio and its shareholders as assets under management reach those asset levels. The Trustees considered the amount of assets in the Portfolio; the Portfolio’s recent share purchase and redemption activity; the information provided by the Investment Adviser relating to the costs of the services provided by the Investment Adviser and its affiliates and their realized profits; information comparing fee rates charged by the Investment Adviser with fee rates charged to other funds in the peer group; and the Investment Adviser’s undertaking to limit certain expenses of the Portfolio that exceed specified levels. Upon reviewing these matters at the Annual Meeting, the Trustees concluded that the fee breakpoints represented a means of assuring that benefits of scalability, if any, would be passed along to shareholders at the specified asset levels. They also noted that the Investment Adviser had passed along savings to shareholders of the Portfolio, which had asset levels above at least the first breakpoint during the prior fiscal year.
Other Benefits to the Investment Adviser and Its Affiliates
The Trustees also considered the other benefits derived by the Investment Adviser and its affiliates from their relationships with the Portfolio and/or the Underlying Funds as stated above, including: (a) transfer agency fees received by Goldman Sachs & Co. LLC (“Goldman Sachs”); (b) brokerage and futures commissions earned by Goldman Sachs for executing securities and futures transactions on behalf of the Portfolio and/or the Underlying Funds; (c) research received by the Investment Adviser from broker-dealers in exchange for executing certain transactions on behalf of the Portfolio and/or the Underlying Funds; (d) trading efficiencies resulting from aggregation of orders of the Portfolio and/or the Underlying Funds with those for other funds or accounts managed by the Investment Adviser; (e) the Investment Adviser’s ability to leverage the infrastructure designed to service the Portfolio and the Underlying Funds on behalf of its other clients; (f) the Investment Adviser’s ability to cross-market other products and services to Portfolio shareholders; (g) Goldman Sachs’ retention of certain fees as Portfolio Distributor; (h) the Investment Adviser’s ability to negotiate better pricing with custodians on behalf of its other clients, as a result of the relationship with the Portfolio and Underlying Funds; and (i) the possibility that the working relationship between the Investment Adviser and the Portfolio’s and Underlying Funds’ third-party service providers may cause those service providers to be more likely to do business with other areas of Goldman Sachs. In the course of considering the foregoing, the Independent Trustees requested and received further information quantifying certain of these fall-out benefits.
Other Benefits to the Portfolio and Its Shareholders
The Trustees also noted that the Portfolio and/or the Underlying Funds receive certain potential benefits as a result of their relationship with the Investment Adviser, including: (a) trading efficiencies resulting from aggregation of orders of the Portfolio and/or the Underlying Funds with those of other funds or accounts managed by the Investment Adviser; (b) enhanced servicing from vendors because of the volume of business generated by the Investment Adviser and its affiliates; (c) enhanced servicing from broker-dealers because of the volume of business generated by the Investment Adviser and its affiliates; (d) the Investment Adviser’s ability to negotiate favorable terms with derivatives counterparties on behalf of the Portfolio and/or the Underlying Funds as a result of the size and reputation of the Goldman Sachs organization; (e) the Investment Adviser’s knowledge and experience gained from managing other accounts and products; (f) the Investment Adviser’s ability to hire and retain qualified personnel to provide services to the Portfolio and Underlying Funds because of the reputation of the Goldman Sachs organization; (g) the Portfolio’s and Underlying Funds’ access, through the Investment Adviser, to certain firmwide resources (e.g., proprietary risk management systems and databases), subject to certain restrictions; and (h) the Portfolio’s and Underlying Funds’ access to certain affiliated distribution channels. In addition, the Trustees noted the competitive nature of the mutual fund marketplace, and considered that many of the Portfolio’s shareholders invested in the Portfolio in part because of the Portfolio’s relationship with the Investment Adviser and that those shareholders have a general expectation that the relationship will continue.
42
GOLDMAN SACHS TACTICAL TILT OVERLAY FUND
Statement Regarding Basis for Approval of Management Agreement (Unaudited) (continued)
Conclusion
In connection with their consideration of the Management Agreement, the Trustees gave weight to each of the factors described above, but did not identify any particular factor as controlling their decision. After deliberation and consideration of all of the information provided, including the factors described above, the Trustees concluded, in the exercise of their business judgment, that the management fees paid by the Portfolio were reasonable in light of the services provided to it by the Investment Adviser, the Investment Adviser’s costs and the Portfolio’s current and reasonably foreseeable asset levels. The Trustees unanimously concluded that the Investment Adviser’s continued management likely would benefit the Portfolio and its shareholders and that the Management Agreement should be approved and continued with respect to the Portfolio until June 30, 2018.
43
GOLDMAN SACHS TACTICAL TILT OVERLAY FUND
Trustees and Officers (Unaudited) Independent Trustees
| | | | | | | | | | |
Name, Address and Age1 | | Position(s) Held with the Trust | | Term of Office and Length of Time Served2 | | Principal Occupation(s) During Past 5 Years | | Number of Portfolios in Fund Complex Overseen by Trustee3 | | Other Directorships Held by Trustee4 |
Ashok N. Bakhru Age: 75 | | Chairman of the Board of Trustees | | Since 1996 (Trustee since 1991) | | Mr. Bakhru is retired. He was formerly Chairman of the Board of Trustees, Goldman Sachs Trust II (2012-2016), Goldman Sachs MLP Income Opportunities Fund (2013-2016), Goldman Sachs MLP and Energy Renaissance Fund (2014-2016), and Goldman Sachs ETF Trust (2014-2016); Director, Apollo Investment Corporation (a business development company) (2008-2013); President, ABN Associates (a management and financial consulting firm) (1994-1996 and 1998- 2012); Trustee, Scholarship America (1998-2005); Trustee, Institute for Higher Education Policy (2003-2008); Director, Private Equity Investors — III and IV (1998-2007), and Equity-Linked Investors II (April 2002-2007). Chairman of the Board of Trustees — Goldman Sachs Trust; Goldman Sachs Variable Insurance Trust; Goldman Sachs BDC, Inc.; and Goldman Sachs Private Middle Market Credit LLC. | | 106 | | None |
Kathryn A. Cassidy Age: 63 | | Trustee | | Since 2015 | | Ms. Cassidy is retired. Formerly, she was Advisor to the Chairman (May 2014-December 2014); and Senior Vice President and Treasurer (2008-2014), General Electric Company & General Electric Capital Corporation (technology and financial services companies). Trustee — Goldman Sachs Trust and Goldman Sachs Variable Insurance Trust. | | 104 | | None |
Diana M. Daniels Age: 68 | | Trustee | | Since 2007 | | Ms. Daniels is retired. Formerly, she was Vice President, General Counsel and Secretary, The Washington Post Company (1991-2006). Ms. Daniels is a Trustee Emeritus and serves as a Presidential Councillor of Cornell University (2013-Present); former Member of the Legal Advisory Board, New York Stock Exchange (2003- 2006) and of the Corporate Advisory Board, Standish Mellon Management Advisors (2006- 2007). Trustee — Goldman Sachs Trust and Goldman Sachs Variable Insurance Trust. | | 104 | | None |
Herbert J. Markley Age: 67 | | Trustee | | Since 2013 | | Mr. Markley is retired. Formerly, he was Executive Vice President, Deere & Company (an agricultural and construction equipment manufacturer) (2007- 2009); and President, Agricultural Division, Deere & Company (2001-2007). Previously, Mr. Markley served as an Advisory Board Member of Goldman Sachs Trust and Goldman Sachs Variable Insurance Trust (June 2013-October 2013). Trustee — Goldman Sachs Trust and Goldman Sachs Variable Insurance Trust. | | 104 | | None |
Jessica Palmer Age: 68 | | Trustee | | Since 2007 | | Ms. Palmer is retired. She is Director, Emerson Center for the Arts and Culture (2011-Present); and was formerly a Consultant, Citigroup Human Resources Department (2007-2008); Managing Director, Citigroup Corporate and Investment Banking (previously, Salomon Smith Barney/ Salomon Brothers) (1984-2006). Ms. Palmer was a Member of the Board of Trustees of Indian Mountain School (private elementary and secondary school) (2004-2009). Trustee — Goldman Sachs Trust and Goldman Sachs Variable Insurance Trust. | | 104 | | None |
| | | | | | | | | | |
44
GOLDMAN SACHS TACTICAL TILT OVERLAY FUND
Trustees and Officers (Unaudited) (continued) Independent Trustees
| | | | | | | | | | |
Name, Address and Age1 | | Position(s) Held with the Trust | | Term of Office and Length of Time Served2 | | Principal Occupation(s) During Past 5 Years | | Number of Portfolios in Fund Complex Overseen by Trustee3 | | Other Directorships Held by Trustee4 |
Roy W. Templin Age: 57 | | Trustee | | Since 2013 | | Mr. Templin is retired. He is Director, Armstrong World Industries, Inc. (a designer and manufacturer of ceiling, wall and suspension system solutions) (2016-Present); and was formerly Chairman of the Board of Directors, Con-Way Incorporated (a transportation, logistics and supply chain management service company) (2014-2015); Executive Vice President and Chief Financial Officer, Whirlpool Corporation (an appliance manufacturer and marketer) (2004- 2012). Previously, Mr. Templin served as an Advisory Board Member of Goldman Sachs Trust and Goldman Sachs Variable Insurance Trust (June 2013-October 2013). Trustee — Goldman Sachs Trust and Goldman Sachs Variable Insurance Trust. | | 104 | | Armstrong World Industries, Inc. (a ceiling, wall and suspension system solutions) |
Gregory G. Weaver Age: 65 | | Trustee | | Since 2015 | | Mr. Weaver is retired. He is Director, Verizon Communications Inc. (2015-Present); and was formerly Chairman and Chief Executive Officer, Deloitte & Touche LLP (a professional services firm) (2001-2005 and 2012-2014); and Member of the Board of Directors, Deloitte & Touche LLP (2006-2012). Trustee — Goldman Sachs Trust and Goldman Sachs Variable Insurance Trust. | | 104 | | Verizon Communications Inc. |
| | | | | | | | | | |
45
GOLDMAN SACHS TACTICAL TILT OVERLAY FUND
Trustees and Officers (Unaudited) (continued) Interested Trustee*
| | | | | | | | | | |
Name, Address and Age1 | | Position(s) Held with the Trust | | Term of Office and Length of Time Served2 | | Principal Occupation(s) During Past 5 Years | | Number of Portfolios in Fund Complex Overseen by Trustee3 | | Other Directorships Held by Trustee4 |
James A. McNamara Age: 54 | | President and Trustee | | Since 2007 | | Managing Director, Goldman Sachs (December 1998-Present); Director of Institutional Fund Sales, GSAM (April 1998-December 2000); and Senior Vice President and Manager, Dreyfus Institutional Service Corporation (January 1993- April 1998). President and Trustee — Goldman Sachs Trust; Goldman Sachs Variable Insurance Trust; Goldman Sachs Trust II; Goldman Sachs MLP Income Opportunities Fund; Goldman Sachs MLP and Energy Renaissance Fund; and Goldman Sachs ETF Trust. | | 142 | | None |
| | | | | | | | | | |
| * | | Mr. McNamara is considered to be an “Interested Trustee” because he holds positions with Goldman Sachs and owns securities issued by The Goldman Sachs Group, Inc. Mr. McNamara holds comparable positions with certain other companies of which Goldman Sachs, GSAM or an affiliate thereof is the investment adviser, administrator and/or distributor. |
| 1 | | Each Trustee may be contacted by writing to the Trustee, c/o Goldman Sachs, 200 West Street, New York, New York, 10282, Attn: Caroline Kraus. Information is provided as of August 31, 2017. |
| 2 | | Subject to such policies as may be adopted by the Board from time-to-time, each Trustee holds office for an indefinite term, until the earliest of: (a) the election of his or her successor; (b) the date the Trustee resigns or is removed by the Board or shareholders, in accordance with the Trust’s Declaration of Trust; or (c) the termination of the Trust. The Board has adopted policies which provide that (a) no Trustee shall hold office for more than 15 years and (b) a Trustee shall retire as of December 31st of the calendar year in which he or she reaches his or her 74th birthday, unless a waiver of such requirement shall have been adopted by a majority of the other Trustees. These policies may be changed by the Trustees without shareholder vote. One Trustee has been granted a waiver from the foregoing policies which permits him to serve until December 31, 2017. |
| 3 | | The Goldman Sachs Fund Complex includes certain other companies listed above for each respective Trustee. As of August 31, 2017, Goldman Sachs Trust consisted of 90 portfolios (89 of which offered shares to the public); Goldman Sachs Variable Insurance Trust consisted of 14 portfolios; Goldman Sachs Trust II consisted of 17 portfolios (16 of which offered shares to the public); Goldman Sachs BDC, Inc., Goldman Sachs Private Middle Market Credit LLC, Goldman Sachs MLP Income Opportunities Fund, and Goldman Sachs MLP and Energy Renaissance Fund each consisted of one portfolio; and Goldman Sachs ETF Trust consisted of 19 portfolios (eight of which offered shares to the public). Goldman Sachs Private Middle Market Credit LLC does not offer shares to the public. |
| 4 | | This column includes only directorships of companies required to report to the Securities and Exchange Commission under the Securities Exchange Act of 1934 (i.e., “public companies”) or other investment companies registered under the Act. |
Additional information about the Trustees is available in the Funds’ Statement of Additional Information, which can be obtained from Goldman Sachs free of charge by calling this toll-free number (in the United States of America): 1-800-526-7384.
46
GOLDMAN SACHS TACTICAL TILT OVERLAY FUND
Trustees and Officers (Unaudited) (continued)
Officers of the Trust*
| | | | | | |
Name, Address and Age1 | | Position(s) Held with the Trust | | Term of
Office and
Length of
Time Served2 | | Principal Occupation(s) During Past 5 Years |
James A. McNamara 200 West Street New York, NY 10282 Age: 54 | | Trustee and President | | Since 2007 | | Managing Director, Goldman Sachs (December 1998-Present); Director of Institutional Fund Sales, GSAM (April 1998-December 2000); and Senior Vice President and Manager, Dreyfus Institutional Service Corporation (January 1993-April 1998). President and Trustee — Goldman Sachs Trust; Goldman Sachs Variable Insurance Trust; Goldman Sachs Trust II; Goldman Sachs MLP Income Opportunities Fund; Goldman Sachs MLP and Energy Renaissance Fund; and Goldman Sachs ETF Trust. |
Caroline L. Kraus 200 West Street New York, NY 10282 Age: 40 | | Secretary | | Since 2012 | | Managing Director, Goldman Sachs (January 2016-Present); Vice President, Goldman Sachs (August 2006-December 2015); Associate General Counsel, Goldman Sachs (2012-Present); Assistant General Counsel, Goldman Sachs (August 2006-December 2011); and Associate, Weil, Gotshal & Manges, LLP (2002-2006). Secretary — Goldman Sachs Trust (previously Assistant Secretary (2012)); Goldman Sachs Variable Insurance Trust (previously Assistant Secretary (2012)); Goldman Sachs Trust II; Goldman Sachs BDC, Inc.; Goldman Sachs Private Middle Market Credit LLC; Goldman Sachs Middle Market Lending Corp.; Goldman Sachs MLP Income Opportunities Fund; Goldman Sachs MLP and Energy Renaissance Fund; and Goldman Sachs ETF Trust. |
Scott M. McHugh 200 West Street New York, NY 10282 Age: 45 | | Treasurer, Senior Vice President and Principal Financial Officer | | Since 2009 (Principal Financial Officer since 2013) | | Managing Director, Goldman Sachs (January 2016-Present); Vice President, Goldman Sachs (February 2007-December 2015); Assistant Treasurer of certain mutual funds administered by DWS Scudder (2005-2007); and Director (2005-2007), Vice President (2000-2005), and Assistant Vice President (1998-2000), Deutsche Asset Management or its predecessor (1998-2007). Treasurer, Senior Vice President and Principal Financial Officer — Goldman Sachs Trust; Goldman Sachs Variable Insurance Trust; Goldman Sachs Trust II; Goldman Sachs MLP Income Opportunities Fund; Goldman Sachs MLP and Energy Renaissance Fund; and Goldman Sachs ETF Trust. |
Joseph F. DiMaria 30 Hudson Street Jersey City, NJ 07302 Age: 49 | | Assistant Treasurer and Principal Accounting Officer | | Since 2016 (Principal Accounting Officer since 2017) | | Managing Director, Goldman Sachs (November 2015-Present) and Vice President — Mutual Fund Administration, Columbia Management Investment Advisers, LLC (May 2010-October 2015). Assistant Treasurer and Principal Accounting Officer — Goldman Sachs Trust; Goldman Sachs Variable Insurance Trust; Goldman Sachs Trust II; Goldman Sachs MLP Income Opportunities Fund; Goldman Sachs MLP and Energy Renaissance Fund; and Goldman Sachs ETF Trust. |
| | | | | | |
| * | | Represents a partial list of officers of the Trust. Additional information about all the officers is available in the Funds’ Statement of Additional Information, which can be obtained from Goldman Sachs free of charge by calling this toll-free number (in the United States): 1-800-526-7384. |
| 1 | | Information is provided as of August 31, 2017. |
| 2 | | Officers hold office at the pleasure of the Board of Trustees or until their successors are duly elected and qualified. Each officer holds comparable positions with certain other companies of which Goldman Sachs, GSAM or an affiliate thereof is the investment adviser, administrator and/or distributor. |
47
GOLDMAN SACHS TACTICAL TILT OVERLAY FUND
Goldman Sachs Tactical Tilt Overlay Fund - Tax Information (Unaudited)
For the year ended August 31, 2017, 12.96% of the dividends paid from net investment company taxable income by the Goldman Sachs Tactical Tilt Overlay Fund qualify for the dividends received deduction available to corporations.
For the year ended August 31, 2017, 2.71% of the dividends paid from net investment company taxable income by the Goldman Sachs Tactical Tilt Overlay Fund qualify for the reduced tax rate under the Jobs and Growth Tax Relief and Reconciliation Act of 2003.
48
FUNDS PROFILE
Goldman Sachs Funds
Goldman Sachs is a premier financial services firm, known since 1869 for creating thoughtful and customized investment solutions in complex global markets.
Today, the Investment Management Division of Goldman Sachs serves a diverse set of clients worldwide, including private institutions, public entities and individuals. With approximately $1.21 trillion in assets under supervision as of June 30, 2017, Goldman Sachs Asset Management (“GSAM”) has portfolio management teams located around the world and our investment professionals bring firsthand knowledge of local markets to every investment decision. Assets under supervision includes assets under management and other client assets for which Goldman Sachs does not have full discretion. GSAM leverages the resources of Goldman Sachs & Co. LLC subject to legal, internal and regulatory restrictions.
Money Market
Financial Square FundsSM
| ∎ | | Financial Square Treasury Solutions Fund1 |
| ∎ | | Financial Square Government Fund1 |
| ∎ | | Financial Square Money Market Fund2 |
| ∎ | | Financial Square Prime Obligations Fund2 |
| ∎ | | Financial Square Treasury Instruments Fund1 |
| ∎ | | Financial Square Treasury Obligations Fund1 |
| ∎ | | Financial Square Federal Instruments Fund1 |
| ∎ | | Financial Square Tax-Exempt Money Market Fund2 |
Investor FundsSM
| ∎ | | Investor Money Market Fund3 |
| ∎ | | Investor Tax-Exempt Money Market Fund3 |
Fixed Income
Short Duration and Government
| ∎ | | High Quality Floating Rate Fund |
| ∎ | | Short-Term Conservative Income Fund |
| ∎ | | Short Duration Government Fund |
| ∎ | | Short Duration Income Fund |
| ∎ | | Inflation Protected Securities Fund |
Multi-Sector
Municipal and Tax-Free
| ∎ | | High Yield Municipal Fund |
| ∎ | | Dynamic Municipal Income Fund |
| ∎ | | Short Duration Tax-Free Fund |
Single Sector
| ∎ | | Investment Grade Credit Fund |
| ∎ | | High Yield Floating Rate Fund |
| ∎ | | Emerging Markets Debt Fund |
| ∎ | | Local Emerging Markets Debt Fund |
| ∎ | | Dynamic Emerging Markets Debt Fund |
Fixed Income Alternatives
| ∎ | | Long Short Credit Strategies Fund |
Fundamental Equity
| ∎ | | Small/Mid Cap Value Fund |
| ∎ | | Small/Mid Cap Growth Fund |
| ∎ | | Concentrated Growth Fund7 |
| ∎ | | Technology Opportunities Fund |
| ∎ | | Growth Opportunities Fund |
| ∎ | | Rising Dividend Growth Fund |
Tax-Advantaged Equity
| ∎ | | U.S. Tax-Managed Equity Fund |
| ∎ | | International Tax-Managed Equity Fund |
| ∎ | | U.S. Equity Dividend and Premium Fund |
| ∎ | | International Equity Dividend and Premium Fund |
Equity Insights
| ∎ | | Small Cap Equity Insights Fund |
| ∎ | | U.S. Equity Insights Fund |
| ∎ | | Small Cap Growth Insights Fund |
| ∎ | | Large Cap Growth Insights Fund |
| ∎ | | Large Cap Value Insights Fund |
| ∎ | | Small Cap Value Insights Fund |
| ∎ | | International Small Cap Insights Fund |
| ∎ | | International Equity Insights Fund |
| ∎ | | Emerging Markets Equity Insights Fund |
Fundamental Equity International
| ∎ | | Strategic International Equity Fund |
| ∎ | | Focused International Equity Fund |
| ∎ | | Emerging Markets Equity Fund |
Select Satellite
| ∎ | | Real Estate Securities Fund |
| ∎ | | International Real Estate Securities Fund |
| ∎ | | Commodity Strategy Fund |
| ∎ | | Global Real Estate Securities Fund |
| ∎ | | Alternative Premia Fund9 |
| ∎ | | Absolute Return Tracker Fund |
| ∎ | | Managed Futures Strategy Fund |
| ∎ | | MLP Energy Infrastructure Fund |
| ∎ | | Multi-Manager Alternatives Fund |
| ∎ | | Absolute Return Multi-Asset Fund |
| ∎ | | Global Infrastructure Fund |
Total Portfolio Solutions
| ∎ | | Global Managed Beta Fund |
| ∎ | | Multi-Manager Non-Core Fixed Income Fund |
| ∎ | | Multi-Manager U.S. Dynamic Equity Fund |
| ∎ | | Multi-Manager Global Equity Fund |
| ∎ | | Multi-Manager International Equity Fund |
| ∎ | | Tactical Tilt Overlay Fund |
| ∎ | | Balanced Strategy Portfolio |
| ∎ | | Multi-Manager U.S. Small Cap Equity Fund |
| ∎ | | Multi-Manager Real Assets Strategy Fund |
| ∎ | | Growth and Income Strategy Portfolio |
| ∎ | | Growth Strategy Portfolio |
| ∎ | | Equity Growth Strategy Portfolio |
| ∎ | | Satellite Strategies Portfolio |
| ∎ | | Enhanced Dividend Global Equity Portfolio |
| ∎ | | Tax-Advantaged Global Equity Portfolio |
| ∎ | | Strategic Factor Allocation Fund |
| ∎ | | Target Date 2020 Portfolio |
| ∎ | | Target Date 2025 Portfolio |
| ∎ | | Target Date 2030 Portfolio |
| ∎ | | Target Date 2035 Portfolio |
| ∎ | | Target Date 2040 Portfolio |
| ∎ | | Target Date 2045 Portfolio |
| ∎ | | Target Date 2050 Portfolio |
| ∎ | | Target Date 2055 Portfolio |
| ∎ | | GQG Partners International Opportunities Fund |
| 1 | | You could lose money by investing in the Fund. Although the Fund seeks to preserve the value of your investment at $1.00 per share, it cannot guarantee it will do so. An investment in the Fund is not a deposit of a bank and is not insured or guaranteed by the Federal Deposit Insurance Corporation or any other government agency. The Fund’s sponsor has no legal obligation to provide financial support to the Fund, and you should not expect that the sponsor will provide financial support to the Fund at any time. |
| 2 | | You could lose money by investing in the Fund. Because the share price of the Fund will fluctuate, when you sell your shares they may be worth more or less than what you originally paid for them. The Fund may impose a fee upon sale of your shares or may temporarily suspend your ability to sell shares if the Fund’s liquidity falls below required minimums because of market conditions or other factors. An investment in the Fund is not a deposit of a bank and is not insured or guaranteed by the Federal Deposit Insurance Corporation or any other government agency. The Fund’s sponsor has no legal obligation to provide financial support to the Fund, and you should not expect that the sponsor will provide financial support to the Fund at any time. |
| 3 | | You could lose money by investing in the Fund. Although the Fund seeks to preserve the value of your investment at $1.00 per share, it cannot guarantee it will do so. The Fund may impose a fee upon sale of your shares or may temporarily suspend your ability to sell shares if the Fund’s liquidity falls below required minimums because of market conditions or other factors. An investment in the Fund is not a deposit of a bank and is not insured or guaranteed by the Federal Deposit Insurance Corporation or any other government agency. The Fund’s sponsor has no legal obligation to provide financial support to the Fund, and you should not expect that the sponsor will provide financial support to the Fund at any time. |
| 4 | | Effective on June 20, 2017, the Goldman Sachs Fixed Income Macro Strategies Fund was renamed the Goldman Sachs Strategic Macro Fund. |
| 5 | | Effective on June 20, 2017, the Goldman Sachs Growth and Income Fund was renamed the Goldman Sachs Equity Income Fund. |
| 6 | | Effective after the close of business on August 31, 2017, the Goldman Sachs Flexible Cap Growth Fund was renamed the Goldman Sachs Flexible Cap Fund. |
| 7 | | Effective on July 28, 2017, the Goldman Sachs Focused Growth Fund was reorganized with and into the Goldman Sachs Concentrated Growth Fund. |
| 8 | | Effective after the close of business on October 31, 2017, the Goldman Sachs Dynamic U.S. Equity Fund was renamed the Goldman Sachs Blue Chip Fund. |
| 9 | | Effective after the close of business on October 30, 2017, the Goldman Sachs Dynamic Allocation Fund was renamed the Goldman Sachs Alternative Premia Fund. |
Financial Square FundsSM and Investor FundsSM are registered service marks of Goldman Sachs & Co. LLC.
| * | | This list covers open-end funds only. Please visit our website at www.GSAMFUNDS.com to learn about our closed-end funds and exchange-traded funds. |
| | |
TRUSTEES Ashok N. Bakhru, Chairman Kathryn A. Cassidy Diana M. Daniels Herbert J. Markley James A. McNamara Jessica Palmer Roy W. Templin Gregory G. Weaver | | OFFICERS James A. McNamara, President Scott M. McHugh, Treasurer, Senior Vice President and Principal Financial Officer Joseph F. DiMaria, Assistant Treasurer and Principal Accounting Officer Caroline L. Kraus, Secretary |
| |
GOLDMAN SACHS & CO. LLC Distributor and Transfer Agent | | GOLDMAN SACHS ASSET MANAGEMENT, L.P. Investment Adviser |
Visit our web site at www.GSAMFUNDS.com to obtain the most recent month-end returns.
Goldman Sachs Asset Management, L.P. 200 West Street, New York, New York 10282
The reports concerning the Portfolio included in this shareholder report may contain certain forward-looking statements about the factors that may affect the performance of the Portfolio in the future. These statements are based on Portfolio management’s predictions and expectations concerning certain future events and their expected impact on the Portfolio, such as performance of the economy as a whole and of specific industry sectors, changes in the levels of interest rates, the impact of developing world events, and other factors that may influence the future performance of the Portfolio. Management believes these forward-looking statements to be reasonable, although they are inherently uncertain and difficult to predict. Actual events may cause adjustments in portfolio management strategies from those currently expected to be employed.
A description of the policies and procedures that the Portfolio uses to determine how to vote proxies relating to portfolio securities and information regarding how the Portfolio voted proxies relating to portfolio securities for the most recent 12-month period ended June 30, are available (I) without charge, upon request by calling 1-800-526-7384; and (II) on the Securities and Exchange Commission (“SEC’’) web site at http://www.sec.gov.
The Portfolio files its complete schedule of portfolio holdings with the SEC for the first and third quarters of each fiscal year on Forms N-Q. The Portfolio’s Forms N-Q are available on the SEC’s web site at http://www.sec.gov within 60 days after the Portfolio’s first and third fiscal quarters. The Portfolio’s Forms N-Q may be reviewed and copied at the SEC’s Public Reference Room in Washington, D.C. and information on the operation of the Public Reference Room may also be obtained by calling 1-800-SEC-0330. Form N-Qs may be obtained upon request and without charge by calling 1-800-621-2550 (for Institutional Shareholders).
Portfolio holdings and allocations shown are as of August 31, 2017 and may not be representative of future investments. Portfolio holdings should not be relied on in making investment decisions and should not be construed as research or investment advice regarding particular securities. Current and future holdings are subject to risk.
Economic and market forecasts presented herein reflect a series of assumptions and judgments as of the date of this presentation and are subject to change without notice. These forecasts do not take into account the specific investment objectives, restrictions, tax and financial situation or other needs of any specific client. Actual data will vary and may not be reflected here. These forecasts are subject to high levels of uncertainty that may affect actual performance. Accordingly, these forecasts should be viewed as merely representative of a broad range of possible outcomes. These forecasts are estimated, based on assumptions, and are subject to significant revision and may change materially as economic and market conditions change. Goldman Sachs has no obligation to provide updates or changes to these forecasts. Case studies and examples are for illustrative purposes only.
The portfolio risk management process includes an effort to monitor and manage risk, but does not imply low risk.
THIS MATERIAL IS FOR INFORMATIONAL PURPOSES ONLY AND IS PROVIDED SOLELY ON THE BASIS THAT IT WILL NOT CONSTITUTE INVESTMENT OR OTHER ADVICE OR A RECOMMENDATION RELATING TO ANY PERSON’S OR PLAN’S INVESTMENT OR OTHER DECISIONS, AND GOLDMAN SACHS IS NOT A FIDUCIARY OR ADVISOR WITH RESPECT TO ANY PERSON OR PLAN BY REASON OF PROVIDING THE MATERIAL OR CONTENT HEREIN INCLUDING UNDER THE EMPLOYEE RETIREMENT INCOME SECURITY ACT OF 1974 OR DEPARTMENT OF LABOR REGULATIONS. PLAN SPONSORS AND OTHER FIDUCIARIES SHOULD CONSIDER THEIR OWN CIRCUMSTANCES IN ASSESSING ANY POTENTIAL COURSE OF ACTION.
This material is not authorized for distribution to prospective investors unless preceded or accompanied by a current prospectus or summary prospectus, if applicable. Investors should consider the Portfolio’s objective, risks, and charges and expenses, and read the summary prospectus, if available, and/or the prospectus carefully before investing or sending money. The summary prospectus, if available, and the prospectus contain this and other information about the Portfolio and may be obtained from your authorized dealer or from Goldman Sachs & Co. LLC by calling 1-800-621-2550.
© 2017 Goldman Sachs. All rights reserved. 107540-OTU-630803 TACTAR-17/K/1506
(a) As of the end of the period covered by this report, the registrant has adopted a code of ethics that applies to the registrant’s principal executive officer, principal financial officer, principal accounting officer or controller, or persons performing similar functions, regardless of whether these individuals are employed by the registrant or a third party (the “Code of Ethics”).
(b) During the period covered by this report, no amendments were made to the provisions of the Code of Ethics.
(c) During the period covered by this report, the registrant did not grant any waivers, including an implicit waiver, from any provision of the Code of Ethics.
(d) A copy of the Code of Ethics is available as provided in Item 12(a)(1) of this report.
| ITEM 3. | AUDIT COMMITTEE FINANCIAL EXPERT. |
The registrant’s board of trustees has determined that the registrant has at least one “audit committee financial expert” (as defined in Item 3 of Form N-CSR) serving on its audit committee. Gregory G. Weaver is the “audit committee financial expert” and is “independent” (as each term is defined in Item 3 of Form N-CSR).
| ITEM 4. | PRINCIPAL ACCOUNTANT FEES AND SERVICES. |
Table 1 — Items 4(a) - 4(d). The accountant fees below reflect the aggregate fees billed by all of the Funds of the Goldman Sachs Trust and includes the Goldman Sachs Funds to which this certified shareholder report relates.
| | | | | | | | | | | | |
| | | 2017 | | 2016 | | Description of Services Rendered |
| | | |
| | | | | | | | | | | | |
| | | |
Audit Fees: | | | | | | | | | | | | |
| | | |
• PricewaterhouseCoopers LLP
(“PwC”) | | | $ | 3,705,901 | | | | $ | 3,808,795 | | | Financial Statement audits. |
| | | |
Audit-Related Fees: | | | | | | | | | | | | |
| | | |
• PwC | | | $ | 159,263 | | | | $ | 248,706 | | | Other attest services. |
| | | |
Tax Fees: | | | | | | | | | | | | |
| | | |
• PwC | | | $ | 1,066,799 | | | | $ | 921,001 | | | Tax compliance services provided in connection with the preparation and review of registrant’s tax returns. |
Table 2 — Items 4(b)(c) & (d). Non-Audit Services to the Goldman Sachs Trust’s service affiliates * that were pre-approved by the Audit Committee of the Goldman Sachs Trust pursuant to Rule 2-01(c)(7)(ii) of Regulation S-X.
| | | | | | | | | | | | |
| | | 2017 | | 2016 | | Description of Services Rendered |
| | | |
| | | | | | | | | | | | |
| | | |
Audit-Related Fees: | | | | | | | | | | | | |
| | | |
• PwC | | | $ | 1,860,429 | | | | $ | 1,653,616 | | | Internal control review performed in accordance with Statement on Standards for Attestation Engagements No. 16 and Semi-Annual Updates related to withholding tax accrual for non-US Jurisdictions. These fees are borne by the Funds’ Adviser. |
| * | These include the advisor (excluding sub-advisors) and any entity controlling, controlled by or under common control with the advisor that provides ongoing services to the registrant (hereinafter referred to as “service affiliates”). |
Item 4(e)(1) — Audit Committee Pre-Approval Policies and Procedures
Pre-Approval of Audit and Non-Audit Services Provided to the Funds of the Goldman Sachs Trust. The Audit and Non-Audit Services Pre-Approval Policy (the “Policy”) adopted by the Audit Committee of Goldman Sachs Trust (“GST”) sets forth the procedures and the conditions pursuant to which services performed by an independent auditor for GST may be pre-approved. Services may be pre-approved specifically by the Audit Committee as a whole or, in certain circumstances, by the Audit Committee Chairman or the person designated as the Audit Committee Financial Expert. In addition, subject to specified cost limitations, certain services may be pre-approved under the provisions of the Policy. The Policy provides that the Audit Committee will consider whether the services provided by an independent auditor are consistent with the Securities and Exchange Commission’s rules on auditor independence. The Policy provides for periodic review and pre-approval by the Audit Committee of the services that may be provided by the independent auditor.
De Minimis Waiver. The pre-approval requirements of the Policy may be waived with respect to the provision of non-audit services that are permissible for an independent auditor to perform, provided (1) the aggregate amount of all such services provided constitutes no more than five percent of the total amount of revenues subject to pre-approval that was paid to the independent auditors during the fiscal year in which the services are provided; (2) such services were not recognized by GST at the time of the engagement to be non-audit services; and (3) such services are promptly brought to the attention of the Audit Committee and approved prior to the completion of the audit by the Audit Committee or by one or more members of the Audit Committee to whom authority to grant such approvals has been delegated by the Audit Committee, pursuant to the pre-approval provisions of the Policy.
Pre-Approval of Non-Audit Services Provided to GST’s Investment Advisers. The Policy provides that, in addition to requiring pre-approval of audit and non-audit services provided to GST, the Audit Committee will pre-approve those non-audit services provided to GST’s investment advisers (and entities controlling, controlled by or under common control with the investment advisers that provide ongoing services to GST) where the engagement relates directly to the operations or financial reporting of GST.
Item 4(e)(2) – 0% of the audit-related fees, tax fees and other fees listed in Table 1 were approved by GST’s Audit Committee pursuant to the “de minimis” exception of Rule 2-01(c)(7)(i)(C) of Regulation S-X. In addition, 0% of the non-audit services to the GST’s service affiliates listed in Table 2 were approved by GST’s Audit Committee pursuant to the “de minimis” exception of Rule 2-01(c)(7)(i)(C) of Regulation S-X.
Item 4(f) – Not applicable.
Item 4(g) Aggregate Non-Audit Fees Disclosure
The aggregate non-audit fees billed to GST by PwC for the twelve months ended August 31, 2017 and August 31, 2016 were approximately $1,226,062 and $1,169,707 respectively. The aggregate non-audit fees billed to GST’s adviser and service affiliates by PwC for non-audit services for the twelve months ended December 31, 2016 and December 31, 2015 were approximately $11.4 million and $14.4 million respectively. With regard to the aggregate non-audit fees billed to GST’s adviser and service affiliates, the 2016 and 2015 amounts include fees for non-audit services required to be pre-approved [see Table 2] and fees for non-audit services that did not require pre-approval since they did not directly relate to GST’s operations or financial reporting.
Item 4(h) — GST’s Audit Committee has considered whether the provision of non-audit services to GST’s investment adviser and service affiliates that did not require pre-approval pursuant to paragraph (c)(7)(ii) of Rule 2-01 of Regulation S-X is compatible with maintaining the auditors’ independence.
| ITEM 5. | AUDIT COMMITTEE OF LISTED REGISTRANTS. |
| ITEM 6. | SCHEDULE OF INVESTMENTS. |
| | Schedule of Investments is included as part of the Report to Shareholders filed under Item 1. |
| ITEM 7. | DISCLOSURE OF PROXY VOTING POLICIES AND PROCEDURES FOR CLOSED-END MANAGEMENT INVESTMENT COMPANIES. |
| ITEM 8. | PORTFOLIO MANAGERS OF CLOSED-END MANAGEMENT INVESTMENT COMPANIES. |
| ITEM 9. | PURCHASES OF EQUITY SECURITIES BY CLOSED-END MANAGEMENT INVESTMENT COMPANY AND AFFILIATED PURCHASERS. |
| ITEM 10. | SUBMISSION OF MATTERS TO A VOTE OF SECURITY HOLDERS. |
| | There have been no material changes to the procedures by which shareholders may recommend nominees to the registrant’s board of trustees. |
| ITEM 11. | CONTROLS AND PROCEDURES. |
| | (a) | The registrant’s principal executive and principal financial officers, or persons performing similar functions have concluded that the registrant’s disclosure controls and procedures (as defined in Rule 30a-3(c) under the Investment Company Act of 1940, as amended (the “1940 Act”)) are effective as of a date within 90 days of the filing of this report that includes the disclosure required by this paragraph, based on the evaluation of these controls and procedures required by Rule 30a-3(b) under the 1940 Act and 15d-15(b) under the Securities Exchange Act of 1934, as amended. |
| | (b) | There were no changes in the registrant’s internal control over financial reporting (as defined in Rule 30a-3(d) under the 1940 Act) that occurred during the registrant’s second fiscal quarter of the period covered by this report that have materially affected, or are reasonably likely to materially affect, the registrant’s internal control over financial reporting. |
| | | | |
| (a)(1) | | Goldman Sachs Trust’s Code of Ethics for Principal Executive and Senior Financial Officers is incorporated by reference to Exhibit 12(a)(1) of the registrant’s Form N-CSR filed on July 8, 2015 for its International Equity Insights Funds. |
| | |
| (a)(2) | | Exhibit 99.CERT | | Certifications pursuant to Section 302 of the Sarbanes-Oxley Act of 2002 filed herewith. |
| | |
| (b) | | Exhibit 99.906CERT | | Certifications pursuant to Section 906 of the Sarbanes-Oxley Act of 2002 filed herewith. |
SIGNATURES
Pursuant to the requirements of the Securities Exchange Act of 1934 and the Investment Company Act of 1940, the registrant has duly caused this report to be signed on its behalf by the undersigned, thereunto duly authorized.
| | |
| | | Goldman Sachs Trust |
| |
| By: | | /s/ James A. McNamara |
| |
| | |
| | James A. McNamara |
| | President/Chief Executive Officer |
| | Goldman Sachs Trust |
| |
| Date: | | October 31, 2017 |
Pursuant to the requirements of the Securities Exchange Act of 1934 and the Investment Company Act of 1940, this report has been signed below by the following persons on behalf of the registrant and in the capacities and on the dates indicated.
| | |
| By: | | /s/ James A. McNamara |
| |
| | |
| | James A. McNamara |
| | President/Chief Executive Officer |
| | Goldman Sachs Trust |
| |
| Date: | | October 31, 2017 |
| |
| By: | | /s/ Scott McHugh |
| |
| | |
| | Scott McHugh |
| | Principal Financial Officer |
| | Goldman Sachs Trust |
| |
| Date: | | October 31, 2017 |