UNITED STATES
SECURITIES AND EXCHANGE COMMISSION
Washington, D.C. 20549
FORM N-CSR
CERTIFIED SHAREHOLDER REPORT OF REGISTERED
MANAGEMENT INVESTMENT COMPANIES
Investment Company Act file number 811-05349
Goldman Sachs Trust
(Exact name of registrant as specified in charter)
71 South Wacker Drive,
Chicago, Illinois 60606
(Address of principal executive offices) (Zip code)
Copies to: | ||
Caroline Kraus, Esq. | Geoffrey R.T. Kenyon, Esq. | |
Goldman Sachs & Co. LLC | Dechert LLP | |
200 West Street | One International Place, 40th Floor | |
New York, New York 10282 | 100 Oliver Street | |
| Boston, MA 02110 | ||
(Name and address of agents for service)
Registrant’s telephone number, including area code: (312) 655-4400
Date of fiscal year end: November 30
Date of reporting period: May 31, 2020
| ITEM 1. | REPORTS TO STOCKHOLDERS. |
The Semi-Annual Report to Shareholders is filed herewith. |
Goldman Sachs Funds

| Semi-Annual Report | May 31, 2020 | |||
MLP Energy Infrastructure Fund | ||||
It is our intention that beginning on January 1, 2021, paper copies of the Fund’s annual and semi-annual shareholder reports will no longer be sent by mail, unless you specifically request paper copies of the reports from the Fund or from your financial intermediary. Instead, the reports will be made available on a website, and you will be notified by mail each time a report is posted and provided with a website link to access the report.
If you already elected to receive shareholder reports electronically, you will not be affected by this change and you need not take any action. At any time, you may elect to receive reports and certain communications from the Fund electronically by calling the applicable toll-free number below or by contacting your financial intermediary.
You may elect to receive all future shareholder reports in paper free of charge. If you hold shares of the Fund directly with the Fund’s transfer agent, you can inform the transfer agent that you wish to receive paper copies of reports by calling toll-free 800-621-2550 for Institutional, Class R6 and Class P shareholders or 800-526-7384 for all other shareholders. If you hold shares of the Fund through a financial intermediary, please contact your financial intermediary to make this election. Your election to receive reports in paper will apply to all Goldman Sachs Funds held in your account if you invest through your financial intermediary or all Goldman Sachs Funds held with the Fund’s transfer agent if you invest directly with the transfer agent.

Goldman Sachs MLP Energy Infrastructure Fund
| 1 | ||||
| 3 | ||||
| 5 | ||||
| 6 | ||||
| 9 | ||||
| 16 | ||||
| 29 | ||||
| NOT FDIC-INSURED | May Lose Value | No Bank Guarantee | ||
Goldman Sachs MLP Energy Infrastructure Fund
Recent Market Events related to COVID-19
An outbreak of a novel strain of coronavirus (COVID-19) has emerged globally. The outbreak of COVID-19 has prompted a number of measures to limit the spread, including travel and border restrictions, quarantines, curfews and restrictions on large gatherings. In turn, these resulted in lower consumer activity, diminished demand for a wide range of products and services, and disruption in manufacturing and supply chains. While governments have already taken unprecedented action to limit disruption to the financial system, global financial markets have experienced and may continue to experience significant volatility resulting from the spread of and subsequent intervening measures intended to limit the spread of COVID-19. The Fund could be negatively impacted if the value of a portfolio holding were harmed by such political or economic conditions, events, or actions. The full extent of the impact of COVID-19 on the Fund’s performance cannot be determined at this time and will depend on future developments, including the duration and the continued spread of the outbreak. Goldman Sachs Asset Management’s long-term commitment to you, our Fund shareholders, remains unchanged. We encourage you to maintain perspective and stay current with timely commentary and investment insights by visiting gsam.com.
1
Goldman Sachs MLP Energy Infrastructure Fund
At a meeting on April 14-15, 2020, the Board of Trustees of the Goldman Sachs Trust (the “Board”) approved changes to the Goldman Sachs MLP Energy Infrastructure Fund’s (the “Fund”) principal investment strategy. The Fund’s current investment objective, to seek total return through current income and capital appreciation, did not change. After the close of business on June 26, 2020, the Fund will invest, under normal circumstances, at least 80% of its net assets plus borrowings for investment purposes (measured at the time of purchase) in U.S. and non-U.S. equity or fixed income securities issued by energy infrastructure companies, including master limited partnerships (“MLPs”) and “C” corporations (“C-Corps”). The Fund’s investments in MLPs will constitute at least 25% of its total assets as measured at the time of purchase. The Fund’s benchmark and portfolio managers did not change.
2
FUND BASICS
Goldman Sachs MLP Energy Infrastructure Fund
as of May 31, 2020
| 1 | The net asset value (“NAV”) represents the net assets of the class of the Fund (ex-dividend) divided by the total number of shares of the class outstanding. The Fund’s performance assumes the reinvestment of dividends and other distributions. The Fund’s performance does not reflect the deduction of any applicable sales charges. |
| 2 | The Alerian MLP Index (Total Return, Unhedged, USD) is a composite of the 50 most prominent energy master limited partnerships calculated by Standard & Poor’s using a float-adjusted market capitalization methodology. The Alerian MLP Index is disseminated by the New York Stock Exchange real-time on a price return basis (NYSE: AMZ). The corresponding total return index is calculated and disseminated daily through ticker AMZX. The Alerian MLP Index figures do not reflect any deduction for fees, expenses or taxes. It is not possible to invest directly in an index. |
The returns set forth in the tables above represent past performance. Past performance does not guarantee future results. The Fund’s investment return and principal value will fluctuate so that an investor’s shares, when redeemed, may be worth more or less than their original cost. Current performance may be lower or higher than the performance quoted above. Please visit our web site at www.GSAMFUNDS.com to obtain the most recent month-end returns. Performance reflects applicable fee waivers and/or expense limitations in effect during the periods shown. In their absence, performance would be reduced. Returns do not reflect the deduction of taxes that a shareholder would pay on Fund distributions or the redemption of Fund shares.
| TOP TEN HOLDINGS AS OF 5/31/203 | ||||||||
| Holding | % of Net Assets | Line of Business | ||||||
| MPLX LP | 12.3 | % | Gathering + Processing | |||||
| Enterprise Products Partners LP | 11.1 | Pipeline Transportation | Natural Gas | ||||||
| Plains All American Pipeline LP | 11.0 | Pipeline Transportation | Petroleum | ||||||
| Magellan Midstream Partners LP | 10.6 | Pipeline Transportation | Petroleum | ||||||
| Energy Transfer LP | 10.0 | Pipeline Transportation | Natural Gas | ||||||
| Phillips 66 Partners LP | 6.1 | Pipeline Transportation | Petroleum | ||||||
| The Williams Cos., Inc. | 5.8 | Gathering + Processing | ||||||
| TC Energy Corp. | 4.6 | Pipeline Transportation | Natural Gas | ||||||
| Enbridge, Inc. | 3.9 | Pipeline Transportation | Petroleum | ||||||
| TC PipeLines LP | 3.3 | Pipeline Transportation | Natural Gas | ||||||
| 3 | The top 10 holdings may not be representative of the Fund’s future investments. |
3
FUND BASICS
| FUND SECTOR ALLOCATIONS4 |
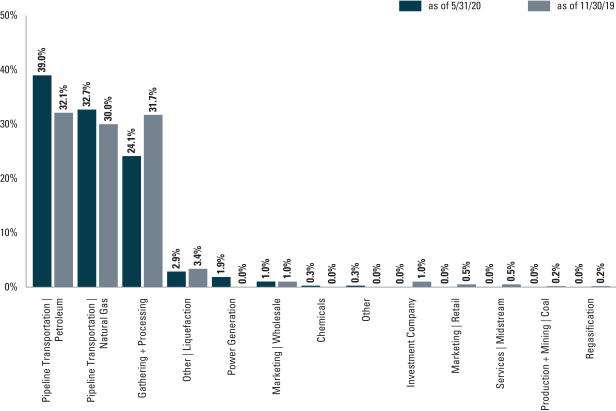
| 4 | The Fund is actively managed and, as such, its composition may differ over time. Consequently, the Fund’s overall sector allocations may differ from the percentages contained in the graph above. The percentage shown for each investment category reflects the value of investments in that category as a percentage of total net assets. The figures in the graph may not sum to 100% due to exclusion of other assets and liabilities. |
For more information about your Fund, please refer to www.GSAMFUNDS.com. There, you can learn more about your Fund’s investment strategies, holdings, and performance.
4
GOLDMAN SACHS MLP ENERGY INFRASTRUCTURE FUND
May 31, 2020 (Unaudited)
| Shares | Description | Value | ||||||
| Common Stocks – 102.0% | ||||||||
| Chemicals – 0.3% | ||||||||
| 12,927 | Linde PLC | $ | 2,615,649 | |||||
|
| |||||||
| Gathering + Processing – 24.1% | ||||||||
| 325,000 | Crestwood Equity Partners LP | 4,618,250 | ||||||
| 412,500 | DCP Midstream LP | 4,537,500 | ||||||
| 6,400,000 | MPLX LP | 121,536,000 | ||||||
| 425,000 | ONEOK, Inc. | 15,593,250 | ||||||
| 1,700,000 | Targa Resources Corp. | 30,413,000 | ||||||
| 2,825,000 | The Williams Cos., Inc. | 57,714,750 | ||||||
| 475,000 | Western Midstream Partners LP | 4,436,500 | ||||||
|
| |||||||
| 238,849,250 | ||||||||
|
| |||||||
| Marketing | Wholesale – 1.0% | ||||||||
| 400,000 | Sunoco LP | 10,320,000 | ||||||
|
| |||||||
| Other – 0.3% | ||||||||
| 10,490 | Air Products & Chemicals, Inc. | 2,534,909 | ||||||
|
| |||||||
| Other | Liquefaction* – 2.8% | ||||||||
| 637,500 | Cheniere Energy, Inc. | 28,273,125 | ||||||
|
| |||||||
| Pipeline Transportation | Natural Gas – 32.6% | ||||||||
| 12,200,000 | Energy Transfer LP | 99,552,000 | ||||||
| 5,787,500 | Enterprise Products Partners LP | 110,541,250 | ||||||
| 393,750 | EQM Midstream Partners LP | 7,737,188 | ||||||
| 246,000 | Equitrans Midstream Corp. | 1,990,140 | ||||||
| 400,000 | Keyera Corp. | 6,339,107 | ||||||
| 1,200,000 | Kinder Morgan, Inc. | 18,960,000 | ||||||
| 1,024,071 | TC Energy Corp. | 46,093,436 | ||||||
| 927,455 | TC PipeLines LP | 32,600,043 | ||||||
|
| |||||||
| 323,813,164 | ||||||||
|
| |||||||
| Pipeline Transportation | Petroleum – 39.0% | ||||||||
| 1,200,000 | Enbridge, Inc. | 38,940,000 | ||||||
| 612,500 | Holly Energy Partners LP | 9,898,000 | ||||||
| 2,312,500 | Magellan Midstream Partners LP | 104,848,750 | ||||||
| 1,044,733 | NuStar Energy LP | 18,147,012 | ||||||
| 264,775 | PBF Logistics LP | 2,753,660 | ||||||
| 865,328 | Pembina Pipeline Corp. | 21,659,160 | ||||||
| 1,350,000 | Phillips 66 Partners LP | 60,318,000 | ||||||
| 11,262,500 | Plains All American Pipeline LP | 109,246,250 | ||||||
| 1,550,000 | Shell Midstream Partners LP | 20,909,500 | ||||||
|
| |||||||
| 386,720,332 | ||||||||
|
| |||||||
| Power Generation – 1.9% | ||||||||
| 60,565 | Emera, Inc. | 2,407,908 | ||||||
| 29,052 | Eversource Energy | 2,431,652 | ||||||
| 40,560 | National Grid PLC ADR | 2,316,787 | ||||||
| 15,339 | NextEra Energy, Inc. | 3,920,035 | ||||||
| 33,660 | Orsted A/S(a) | 3,958,574 | ||||||
| Common Stocks – (continued) | ||||||||
| Power Generation – (continued) | ||||||||
| 10,177 | Sempra Energy | 1,285,457 | ||||||
| 27,563 | WEC Energy Group, Inc. | 2,528,354 | ||||||
|
| |||||||
| 18,848,767 | ||||||||
|
| |||||||
| TOTAL COMMON STOCKS – 102.0% | ||||||||
| (Cost $1,485,635,648) | $ | 1,011,975,196 | ||||||
|
| |||||||
| | LIABILITIES IN EXCESS OF OTHER | (20,279,143 | ) | |||||
|
| |||||||
| NET ASSETS – 100.0% | $ | 991,696,053 | ||||||
|
| |||||||
| The percentage shown for each investment category reflects the value of investments in that category as a percentage of net assets. | ||
* | Non-income producing security. | |
(a) | Exempt from registration under Rule 144A of the Securities Act of 1933. | |
| ||
Investment Abbreviations: | ||
ADR | —American Depositary Receipt | |
LP | —Limited Partnership | |
PLC | —Public Limited Company | |
| ||
| The accompanying notes are an integral part of these financial statements. | 5 |
GOLDMAN SACHS MLP ENERGY INFRASTRUCTURE FUND
Statement of Assets and Liabilities
May 31, 2020 (Unaudited)
| Assets: |
| |||||
Investments, at value (cost $1,485,635,648) | $ | 1,011,975,196 | ||||
Foreign currencies, at value (cost $12,652) | 12,795 | |||||
Receivables: | ||||||
Investments sold | 24,033,532 | |||||
Fund shares sold | 2,141,031 | |||||
Dividends | 894,177 | |||||
Current taxes | 602,095 | |||||
Prepaid state and local income taxes | 6,750 | |||||
Other assets | 82,069 | |||||
| Total assets | 1,039,747,645 | |||||
| Liabilities: |
| |||||
Payables: | ||||||
Investments purchased | 22,356,634 | |||||
Fund shares redeemed | 1,863,786 | |||||
Management fees | 811,273 | |||||
Due to custodian | 436,155 | |||||
Distribution and service fees and transfer agent fees | 73,234 | |||||
Deferred taxes, net | 22,107,645 | |||||
Accrued expenses | 402,865 | |||||
| Total liabilities | 48,051,592 | |||||
| Net Assets: | ||||||
Paid-in capital | 2,538,993,581 | |||||
Total distributable earnings (loss) | (1,547,297,528 | ) | ||||
| NET ASSETS | $ | 991,696,053 | ||||
Net Assets: | ||||||
Class A | $ | 38,953,210 | ||||
Class C | 31,341,173 | |||||
Institutional | 192,425,075 | |||||
Investor | 43,280,704 | |||||
Class R6 | 200,164,978 | |||||
Class R | 932,201 | |||||
Class P | 484,598,712 | |||||
Total Net Assets | $ | 991,696,053 | ||||
Shares Outstanding $0.001 par value (unlimited shares authorized): | ||||||
Class A | 10,806,796 | |||||
Class C | 9,322,261 | |||||
Institutional | 51,492,488 | |||||
Investor | 11,725,751 | |||||
Class R6 | 53,508,519 | |||||
Class R | 264,615 | |||||
Class P | 129,234,847 | |||||
Net asset value, offering and redemption price per share:(a) | ||||||
Class A | $3.60 | |||||
Class C | 3.36 | |||||
Institutional | 3.74 | |||||
Investor | 3.69 | |||||
Class R6 | 3.74 | |||||
Class R | 3.52 | |||||
Class P | 3.75 | |||||
| (a) | Maximum public offering price per share for Class A Shares is $3.81. At redemption, Class C Shares may be subject to a contingent deferred sales charge, assessed on the amount equal to the lesser of the current net asset value or the original purchase price of the shares. |
| 6 | The accompanying notes are an integral part of these financial statements. |
GOLDMAN SACHS MLP ENERGY INFRASTRUCTURE FUND
Statement of Operations
For the Six Months Ended May 31, 2020 (Unaudited)
| Investment income: |
| |||||
Dividends (net of tax withholding of $332,148) | $ | 59,279,447 | ||||
Dividends — affiliated issuers | 38,920 | |||||
Less: Return of Capital on Dividends | (52,910,498 | ) | ||||
| Total investment income | 6,407,869 | |||||
| Expenses: |
| |||||
Management fees | 6,264,423 | |||||
Transfer Agency fees(a) | 321,781 | |||||
Distribution and Service fees(a) | 277,072 | |||||
Professional fees | 137,211 | |||||
Custody, accounting and administrative services | 92,011 | |||||
Registration fees | 78,520 | |||||
Franchise Expense | 71,158 | |||||
Printing and mailing costs | 70,057 | |||||
Trustee fees | 10,406 | |||||
Other | 16,886 | |||||
| Total operating expenses, before taxes | 7,339,525 | |||||
Less — expense reductions | (6,849 | ) | ||||
| Net operating expenses, before taxes | 7,332,676 | |||||
| NET INVESTMENT LOSS, BEFORE TAXES | (924,807 | ) | ||||
| Current and deferred tax expense | (14,303 | ) | ||||
| NET INVESTMENT LOSS, NET OF TAXES | (939,110 | ) | ||||
| Realized and unrealized gain (loss): |
| |||||
Net realized gain (loss) from: | ||||||
Investments — unaffiliated issuers | (391,727,554 | ) | ||||
Foreign currency transactions | 67,652 | |||||
Current and deferred tax expense | (6,057,420 | ) | ||||
Net change in unrealized gain (loss) on: | ||||||
Investments — unaffiliated issuers | (70,779,141 | ) | ||||
Foreign currency translation | 17,896 | |||||
Deferred tax expense | (1,094,395 | ) | ||||
| Net realized and unrealized loss, net of taxes | (469,572,962 | ) | ||||
| NET DECREASE IN NET ASSETS RESULTING FROM OPERATIONS | $ | (470,512,072 | ) | |||
| (a) | Class specific Distribution and/or Service, and Transfer Agency fees were as follows: |
| Distribution and/or Service Fees | Transfer Agency Fees | |||||||||||||||||||||||||||||||||||||
Class A | Class C | Class R | Class A | Class C | Institutional | Investor | Class R6 | Class R | Class P | |||||||||||||||||||||||||||||
| $ | 59,637 | $ | 215,120 | $ | 2,315 | $ | 40,553 | $ | 36,570 | $ | 66,470 | $ | 57,841 | $ | 24,504 | $ | 787 | $ | 95,057 | |||||||||||||||||||
| The accompanying notes are an integral part of these financial statements. | 7 |
GOLDMAN SACHS MLP ENERGY INFRASTRUCTURE FUND
Statements of Changes in Net Assets
| For the Six Months Ended May 31, 2020 (Unaudited) | For the Fiscal Year Ended November 30, 2019 | |||||||||
| From operations: |
| |||||||||
Net investment loss, net of taxes | $ | (939,110 | ) | $ | (14,172,362 | ) | ||||
Net realized loss, net of taxes | (397,717,322 | ) | (32,745,401 | ) | ||||||
Net change in unrealized loss, net of taxes | (71,855,640 | ) | (188,225,976 | ) | ||||||
| Net decrease in net assets resulting from operations | (470,512,072 | ) | (235,143,739 | ) | ||||||
| Distributions to shareholders: |
| |||||||||
From total distributable earnings | ||||||||||
Class A Shares | — | (381,978 | ) | |||||||
Class C Shares | — | (390,185 | ) | |||||||
Institutional Shares | — | (2,761,431 | ) | |||||||
Investor Shares | — | (581,787 | ) | |||||||
Class R6 Shares | — | (751,716 | ) | |||||||
Class R Shares | — | (10,186 | ) | |||||||
Class P Shares | — | (4,774,138 | ) | |||||||
From return of capital | ||||||||||
Class A Shares | (2,273,924 | ) | (5,911,900 | ) | ||||||
Class C Shares | (2,081,041 | ) | (6,038,926 | ) | ||||||
Institutional Shares | (14,314,699 | ) | (42,738,912 | ) | ||||||
Investor Shares | (2,923,045 | ) | (9,004,374 | ) | ||||||
Class R6 Shares | (8,329,490 | ) | (11,634,374 | ) | ||||||
Class R Shares | (46,762 | ) | (157,655 | ) | ||||||
Class P Shares | (29,756,220 | ) | (73,889,763 | ) | ||||||
| Total distributions to shareholders | (59,725,181 | ) | (159,027,325 | ) | ||||||
| From share transactions: |
| |||||||||
Proceeds from sales of shares | 766,158,126 | 917,467,591 | ||||||||
Reinvestment of distributions | 56,140,745 | 150,234,567 | ||||||||
Cost of shares redeemed | (1,029,372,404 | ) | (1,206,522,397 | ) | ||||||
| Net decrease in net assets resulting from share transactions | (207,073,533 | ) | (138,820,239 | ) | ||||||
| TOTAL DECREASE | (737,310,786 | ) | (532,991,303 | ) | ||||||
| Net assets: |
| |||||||||
Beginning of period | 1,729,006,839 | 2,261,998,142 | ||||||||
End of period | $ | 991,696,053 | $ | 1,729,006,839 | ||||||
| 8 | The accompanying notes are an integral part of these financial statements. |
GOLDMAN SACHS MLP ENERGY INFRASTRUCTURE FUND
Selected Share Data for a Share Outstanding Throughout Each Period
| Goldman Sachs MLP Energy Infrastructure Fund | ||||||||||||||||||||||||||
| Class A Shares | ||||||||||||||||||||||||||
| Six Months Ended May 31, 2020 (Unaudited) | Year Ended November 30, | |||||||||||||||||||||||||
| 2019 | 2018 | 2017 | 2016 | 2015 | ||||||||||||||||||||||
| Per Share Data | ||||||||||||||||||||||||||
Net asset value, beginning of period | $ | 5.22 | $ | 6.38 | $ | 6.80 | $ | 7.88 | $ | 7.62 | $ | 11.98 | ||||||||||||||
Net investment loss(a) | (0.01 | ) | (0.06 | ) | (0.02 | ) | (0.07 | ) | (0.06 | ) | (0.05 | ) | ||||||||||||||
Net realized and unrealized gain (loss) | (1.40 | ) | (0.60 | ) | 0.07 | (0.57 | ) | 0.80 | (3.82 | ) | ||||||||||||||||
Total from investment operations | (1.41 | ) | (0.66 | ) | 0.05 | (0.64 | ) | 0.74 | (3.87 | ) | ||||||||||||||||
Distributions to shareholders from net investment income | — | (0.03 | ) | (0.16 | ) | (0.05 | ) | — | — | |||||||||||||||||
Distributions to shareholders from return of capital | (0.21 | ) | (0.47 | ) | (0.31 | ) | (0.39 | ) | (0.48 | ) | (0.49 | ) | ||||||||||||||
Total distributions | (0.21 | ) | (0.50 | ) | (0.47 | ) | (0.44 | ) | (0.48 | ) | (0.49 | ) | ||||||||||||||
Net asset value, end of period | $ | 3.60 | $ | 5.22 | $ | 6.38 | $ | 6.80 | $ | 7.88 | $ | 7.62 | ||||||||||||||
| Total return(b) | (27.45 | )% | (11.06 | )% | 0.23 | % | (8.35 | )% | 10.23 | % | (33.27 | )% | ||||||||||||||
Net assets, end of period (in 000s) | $ | 38,953 | $ | 60,112 | $ | 95,120 | $ | 115,467 | $ | 289,689 | $ | 292,686 | ||||||||||||||
Ratio of net expenses to average net assets after tax (benefit)/expense(c) | 2.03 | %(d) | 1.67 | % | 1.67 | % | 1.52 | % | 1.45 | % | (0.38 | )% | ||||||||||||||
Ratio of net expenses to average net assets before tax (benefit)/expense | 1.47 | %(d) | 1.44 | % | 1.40 | % | 1.42 | % | 1.45 | % | 1.42 | % | ||||||||||||||
Ratio of net investment loss to average net assets(e) | (0.47 | )%(d) | (1.02 | )% | (0.34 | )% | (0.85 | )% | (0.87 | )% | (0.57 | )% | ||||||||||||||
Portfolio turnover rate(f) | 71 | % | 51 | % | 68 | % | 42 | % | 104 | % | 96 | % | ||||||||||||||
| (a) | Calculated based on the average shares outstanding methodology. |
| (b) | Assumes investment at the NAV at the beginning of the period, reinvestment of all dividends and distributions, a complete redemption of the investment at the NAV at the end of the period and no sales or redemption charges (if any). Total returns would be reduced if a sales or redemption charge was taken into account. Returns do not reflect the impact of taxes to shareholders relating to Fund distributions or the redemption of Fund shares. Total returns for periods less than one full year are not annualized. |
| (c) | Current and deferred tax expense/benefit for the ratio calculation is derived from the net investment income (loss), and realized and unrealized gains (losses). |
| (d) | Annualized with the exception of tax expenses. |
| (e) | Current and deferred tax benefit for the ratio calculation is derived from net investment income (loss) only. |
| (f) | The Fund’s portfolio turnover rate is calculated in accordance with regulatory requirements, without regard to transactions involving short term investments. If such transactions were included, the Fund’s portfolio turnover rate may be higher. |
| The accompanying notes are an integral part of these financial statements. | 9 |
GOLDMAN SACHS MLP ENERGY INFRASTRUCTURE FUND
Financial Highlights (continued)
Selected Share Data for a Share Outstanding Throughout Each Period
| Goldman Sachs MLP Energy Infrastructure Fund | ||||||||||||||||||||||||||
| Class C Shares | ||||||||||||||||||||||||||
| Six Months Ended May 31, 2020 (Unaudited) | Year Ended November 30, | |||||||||||||||||||||||||
| 2019 | 2018 | 2017 | 2016 | 2015 | ||||||||||||||||||||||
| Per Share Data | ||||||||||||||||||||||||||
Net asset value, beginning of period | $ | 4.91 | $ | 6.07 | $ | 6.54 | $ | 7.65 | $ | 7.46 | $ | 11.83 | ||||||||||||||
Net investment loss(a) | (0.03 | ) | (0.10 | ) | (0.07 | ) | (0.12 | ) | (0.12 | ) | (0.12 | ) | ||||||||||||||
Net realized and unrealized gain (loss) | (1.31 | ) | (0.56 | ) | 0.07 | (0.55 | ) | 0.79 | (3.76 | ) | ||||||||||||||||
Total from investment operations | (1.34 | ) | (0.66 | ) | — | (0.67 | ) | 0.67 | (3.88 | ) | ||||||||||||||||
Distributions to shareholders from net investment income | — | (0.03 | ) | (0.16 | ) | (0.05 | ) | — | — | |||||||||||||||||
Distributions to shareholders from return of capital | (0.21 | ) | (0.47 | ) | (0.31 | ) | (0.39 | ) | (0.48 | ) | (0.49 | ) | ||||||||||||||
Total distributions | (0.21 | ) | (0.50 | ) | (0.47 | ) | (0.44 | ) | (0.48 | ) | (0.49 | ) | ||||||||||||||
Net asset value, end of period | $ | 3.36 | $ | 4.91 | $ | 6.07 | $ | 6.54 | $ | 7.65 | $ | 7.46 | ||||||||||||||
| Total return(b) | (27.76 | )% | (11.64 | )% | (0.38 | )% | (9.15 | )% | 9.49 | % | (33.79 | )% | ||||||||||||||
Net assets, end of period (in 000s) | $ | 31,341 | $ | 58,044 | $ | 92,201 | $ | 124,291 | $ | 170,575 | $ | 173,427 | ||||||||||||||
Ratio of net expenses to average net assets after tax (benefit)/expense(c) | 2.78 | %(d) | 2.42 | % | 2.44 | % | 2.28 | % | 2.20 | % | 0.37 | % | ||||||||||||||
Ratio of net expenses to average net assets before tax (benefit)/expense | 2.21 | %(d) | 2.19 | % | 2.15 | % | 2.17 | % | 2.21 | % | 2.18 | % | ||||||||||||||
Ratio of net investment loss to average net assets(e) | (1.23 | )%(d) | (1.77 | )% | (1.06 | )% | (1.60 | )% | (1.63 | )% | (1.27 | )% | ||||||||||||||
Portfolio turnover rate(f) | 71 | % | 51 | % | 68 | % | 42 | % | 104 | % | 96 | % | ||||||||||||||
| (a) | Calculated based on the average shares outstanding methodology. |
| (b) | Assumes investment at the NAV at the beginning of the period, reinvestment of all dividends and distributions, a complete redemption of the investment at the NAV at the end of the period and no sales or redemption charges (if any). Total returns would be reduced if a sales or redemption charge was taken into account. Returns do not reflect the impact of taxes to shareholders relating to Fund distributions or the redemption of Fund shares. Total returns for periods less than one full year are not annualized. |
| (c) | Current and deferred tax expense/benefit for the ratio calculation is derived from the net investment income (loss), and realized and unrealized gains (losses). |
| (d) | Annualized with the exception of tax expenses. |
| (e) | Current and deferred tax benefit for the ratio calculation is derived from net investment income (loss) only. |
| (f) | The Fund’s portfolio turnover rate is calculated in accordance with regulatory requirements, without regard to transactions involving short term investments. If such transactions were included, the Fund’s portfolio turnover rate may be higher. |
| 10 | The accompanying notes are an integral part of these financial statements. |
GOLDMAN SACHS MLP ENERGY INFRASTRUCTURE FUND
Financial Highlights (continued)
Selected Share Data for a Share Outstanding Throughout Each Period
| Goldman Sachs MLP Energy Infrastructure Fund | ||||||||||||||||||||||||||
| Institutional Shares | ||||||||||||||||||||||||||
| Six Months Ended May 31, 2020 (Unaudited) | Year Ended November 30, | |||||||||||||||||||||||||
| 2019 | 2018 | 2017 | 2016 | 2015 | ||||||||||||||||||||||
| Per Share Data | ||||||||||||||||||||||||||
Net asset value, beginning of period | $ | 5.39 | $ | 6.55 | $ | 6.95 | $ | 8.02 | $ | 7.70 | $ | 12.06 | ||||||||||||||
Net investment income (loss)(a) | — | (b) | (0.04 | ) | 0.02 | (0.03 | ) | (0.05 | ) | (0.01 | ) | |||||||||||||||
Net realized and unrealized gain (loss) | (1.44 | ) | (0.62 | ) | 0.05 | (0.60 | ) | 0.85 | (3.86 | ) | ||||||||||||||||
Total from investment operations | (1.44 | ) | (0.66 | ) | 0.07 | (0.63 | ) | 0.80 | (3.87 | ) | ||||||||||||||||
Distributions to shareholders from net investment income | — | (0.03 | ) | (0.16 | ) | (0.05 | ) | — | — | |||||||||||||||||
Distributions to shareholders from return of capital | (0.21 | ) | (0.47 | ) | (0.31 | ) | (0.39 | ) | (0.48 | ) | (0.49 | ) | ||||||||||||||
Total distributions | (0.21 | ) | (0.50 | ) | (0.47 | ) | (0.44 | ) | (0.48 | ) | (0.49 | ) | ||||||||||||||
Net asset value, end of period | $ | 3.74 | $ | 5.39 | $ | 6.55 | $ | 6.95 | $ | 8.02 | $ | 7.70 | ||||||||||||||
| Total return(c) | (27.13 | )% | (10.77 | )% | 0.67 | % | (8.21 | )% | 10.92 | % | (33.05 | )% | ||||||||||||||
Net assets, end of period (in 000s) | $ | 192,425 | $ | 502,633 | $ | 651,132 | $ | 1,711,829 | $ | 1,830,614 | $ | 1,225,024 | ||||||||||||||
Ratio of net expenses to average net assets after tax (benefit)/expense(d) | 1.63 | %(e) | 1.28 | % | 1.43 | % | 1.14 | % | 1.05 | % | (0.78 | )% | ||||||||||||||
Ratio of net expenses to average net assets before tax (benefit)/expense | 1.08 | %(e) | 1.05 | % | 1.01 | % | 1.03 | % | 1.05 | % | 1.02 | % | ||||||||||||||
Ratio of net investment loss to average net assets(f) | (0.13 | )%(e) | (0.61 | )% | 0.34 | % | (0.42 | )% | (0.69 | )% | (0.10 | )% | ||||||||||||||
Portfolio turnover rate(g) | 71 | % | 51 | % | 68 | % | 42 | % | 104 | % | 96 | % | ||||||||||||||
| (a) | Calculated based on the average shares outstanding methodology. |
| (b) | Less than $0.005 per share. |
| (c) | Assumes investment at the NAV at the beginning of the period, reinvestment of all dividends and distributions, a complete redemption of the investment at the NAV at the end of the period and no sales or redemption charges (if any). Total returns would be reduced if a sales or redemption charge was taken into account. Returns do not reflect the impact of taxes to shareholders relating to Fund distributions or the redemption of Fund shares. Total returns for periods less than one full year are not annualized. |
| (d) | Current and deferred tax expense/benefit for the ratio calculation is derived from the net investment income (loss), and realized and unrealized gains (losses). |
| (e) | Annualized with the exception of tax expenses. |
| (f) | Current and deferred tax benefit for the ratio calculation is derived from net investment income (loss) only. |
| (g) | The Fund’s portfolio turnover rate is calculated in accordance with regulatory requirements, without regard to transactions involving short term investments. If such transactions were included, the Fund’s portfolio turnover rate may be higher. |
| The accompanying notes are an integral part of these financial statements. | 11 |
GOLDMAN SACHS MLP ENERGY INFRASTRUCTURE FUND
Financial Highlights (continued)
Selected Share Data for a Share Outstanding Throughout Each Period
| Goldman Sachs MLP Energy Infrastructure Fund | ||||||||||||||||||||||||||
| Investor Shares | ||||||||||||||||||||||||||
| Six Months Ended May 31, 2020 (Unaudited) | Year Ended November 30, | |||||||||||||||||||||||||
| 2019 | 2018 | 2017 | 2016 | 2015 | ||||||||||||||||||||||
| Per Share Data | ||||||||||||||||||||||||||
Net asset value, beginning of period | $ | 5.33 | $ | 6.50 | $ | 6.90 | $ | 7.97 | $ | 7.67 | $ | 12.04 | ||||||||||||||
Net investment loss(a) | (0.01 | ) | (0.05 | ) | (0.01 | ) | (0.05 | ) | (0.04 | ) | (0.03 | ) | ||||||||||||||
Net realized and unrealized gain (loss) | (1.42 | ) | (0.62 | ) | 0.08 | (0.58 | ) | 0.82 | (3.85 | ) | ||||||||||||||||
Total from investment operations | (1.43 | ) | (0.67 | ) | 0.07 | (0.63 | ) | 0.78 | (3.88 | ) | ||||||||||||||||
Distributions to shareholders from net investment income | — | (0.03 | ) | (0.16 | ) | (0.05 | ) | — | — | |||||||||||||||||
Distributions to shareholders from return of capital | (0.21 | ) | (0.47 | ) | (0.31 | ) | (0.39 | ) | (0.48 | ) | (0.49 | ) | ||||||||||||||
Total distributions | (0.21 | ) | (0.50 | ) | (0.47 | ) | (0.44 | ) | (0.48 | ) | (0.49 | ) | ||||||||||||||
Net asset value, end of period | $ | 3.69 | $ | 5.33 | $ | 6.50 | $ | 6.90 | $ | 7.97 | $ | 7.67 | ||||||||||||||
| Total return(b) | (27.25 | )% | (11.01 | )% | 0.68 | % | (8.26 | )% | 10.69 | % | (33.13 | )% | ||||||||||||||
Net assets, end of period (in 000s) | $ | 43,281 | $ | 98,506 | $ | 142,664 | $ | 156,974 | $ | 121,705 | $ | 95,825 | ||||||||||||||
Ratio of net expenses to average net assets after tax (benefit)/expense(c) | 1.77 | %(d) | 1.42 | % | 1.43 | % | 1.29 | % | 1.20 | % | (0.63 | )% | ||||||||||||||
Ratio of net expenses to average net assets before tax (benefit)/expense | 1.21 | %(d) | 1.19 | % | 1.15 | % | 1.17 | % | 1.20 | % | 1.17 | % | ||||||||||||||
Ratio of net investment loss to average net assets(e) | (0.27 | )%(d) | (0.77 | )% | (0.07 | )% | (0.63 | )% | (0.60 | )% | (0.32 | )% | ||||||||||||||
Portfolio turnover rate(f) | 71 | % | 51 | % | 68 | % | 42 | % | 104 | % | 96 | % | ||||||||||||||
| (a) | Calculated based on the average shares outstanding methodology. |
| (b) | Assumes investment at the NAV at the beginning of the period, reinvestment of all dividends and distributions, a complete redemption of the investment at the NAV at the end of the period and no sales or redemption charges (if any). Total returns would be reduced if a sales or redemption charge was taken into account. Returns do not reflect the impact of taxes to shareholders relating to Fund distributions or the redemption of Fund shares. Total returns for periods less than one full year are not annualized. |
| (c) | Current and deferred tax expense/benefit for the ratio calculation is derived from the net investment income (loss), and realized and unrealized gains (losses). |
| (d) | Annualized with the exception of tax expenses. |
| (e) | Current and deferred tax benefit for the ratio calculation is derived from net investment income (loss) only. |
| (f) | The Fund’s portfolio turnover rate is calculated in accordance with regulatory requirements, without regard to transactions involving short term investments. If such transactions were included, the Fund’s portfolio turnover rate may be higher. |
| 12 | The accompanying notes are an integral part of these financial statements. |
GOLDMAN SACHS MLP ENERGY INFRASTRUCTURE FUND
Financial Highlights (continued)
Selected Share Data for a Share Outstanding Throughout Each Period
| Goldman Sachs MLP Energy Infrastructure Fund | ||||||||||||||
| Class R6 Shares | ||||||||||||||
| Six Months Ended May 31, 2020 (Unaudited) | Year Ended November 30, 2019 | Period Ended November 30, 2018(a) | ||||||||||||
| Per Share Data | ||||||||||||||
Net asset value, beginning of period | $ | 5.40 | $ | 6.55 | $ | 6.43 | ||||||||
Net investment income (loss)(b) | — | (c) | (0.04 | ) | (0.02 | ) | ||||||||
Net realized and unrealized gain (loss) | (1.45 | ) | (0.61 | ) | 0.50 | |||||||||
Total from investment operations | (1.45 | ) | (0.65 | ) | 0.48 | |||||||||
Distributions to shareholders from net investment income | — | (0.03 | ) | (0.13 | ) | |||||||||
Distributions to shareholders from return of capital | (0.21 | ) | (0.47 | ) | (0.23 | ) | ||||||||
Total Distributions | (0.21 | ) | (0.50 | ) | (0.36 | ) | ||||||||
Net asset value, end of period | $ | 3.74 | $ | 5.40 | $ | 6.55 | ||||||||
| Total return(d) | (27.27 | )% | (10.60 | )% | 7.15 | % | ||||||||
Net assets, end of period (in 000s) | $ | 200,165 | $ | 165,252 | $ | 205,470 | ||||||||
Ratio of net expenses to average net assets after tax (benefit)/expense(e) | 1.64 | %(f) | 1.26 | % | 1.11 | %(f) | ||||||||
Ratio of net expenses to average net assets before tax (benefit)/expense | 1.09 | %(f) | 1.04 | % | 1.00 | %(f) | ||||||||
Ratio of net investment loss to average net assets(g) | (0.01 | )%(f) | (0.66 | )% | (0.46 | )%(f) | ||||||||
Portfolio turnover rate(h) | 71 | % | 51 | % | 68 | % | ||||||||
| (a) | Commenced operations on April 2, 2018. |
| (b) | Calculated based on the average shares outstanding methodology. |
| (c) | Less than $0.005 per share. |
| (d) | Assumes investment at the NAV at the beginning of the period, reinvestment of all dividends and distributions, a complete redemption of the investment at the NAV at the end of the period and no sales or redemption charges (if any). Total returns would be reduced if a sales or redemption charge was taken into account. Returns do not reflect the impact of taxes to shareholders relating to Fund distributions or the redemption of Fund shares. Total returns for periods less than one full year are not annualized. |
| (e) | Current and deferred tax expense/benefit for the ratio calculation is derived from the net investment income (loss), and realized and unrealized gains (losses). |
| (f) | Annualized with the exception of tax expenses. |
| (g) | Current and deferred tax benefit for the ratio calculation is derived from net investment income (loss) only. |
| (h) | The Fund’s portfolio turnover rate is calculated in accordance with regulatory requirements, without regard to transactions involving short term investments. If such transactions were included, the Fund’s portfolio turnover rate may be higher. |
| The accompanying notes are an integral part of these financial statements. | 13 |
GOLDMAN SACHS MLP ENERGY INFRASTRUCTURE FUND
Financial Highlights (continued)
Selected Share Data for a Share Outstanding Throughout Each Period
| Goldman Sachs MLP Energy Infrastructure Fund | ||||||||||||||||||||||||||
| Class R Shares | ||||||||||||||||||||||||||
| Six Months Ended May 31, 2020 (Unaudited) | Year Ended November 30, | |||||||||||||||||||||||||
| 2019 | 2018 | 2017 | 2016 | 2015 | ||||||||||||||||||||||
| Per Share Data | ||||||||||||||||||||||||||
Net asset value, beginning of period | $ | 5.12 | $ | 6.28 | $ | 6.71 | $ | 7.81 | $ | 7.56 | $ | 11.93 | ||||||||||||||
Net investment income (loss)(a) | (0.01 | ) | (0.08 | ) | (0.04 | ) | (0.08 | ) | (0.09 | ) | 0.18 | |||||||||||||||
Net realized and unrealized gain (loss) | (1.38 | ) | (0.58 | ) | 0.08 | (0.58 | ) | 0.82 | (4.06 | ) | ||||||||||||||||
Total from investment operations | (1.39 | ) | (0.66 | ) | 0.04 | (0.66 | ) | 0.73 | (3.88 | ) | ||||||||||||||||
Distributions to shareholders from net investment income | — | (0.03 | ) | (0.16 | ) | (0.05 | ) | — | — | |||||||||||||||||
Distributions to shareholders from return of capital | (0.21 | ) | (0.47 | ) | (0.31 | ) | (0.39 | ) | (0.48 | ) | (0.49 | ) | ||||||||||||||
Total distributions | (0.21 | ) | (0.50 | ) | (0.47 | ) | (0.44 | ) | (0.48 | ) | (0.49 | ) | ||||||||||||||
Net asset value, end of period | $ | 3.52 | $ | 5.12 | $ | 6.28 | $ | 6.71 | $ | 7.81 | $ | 7.56 | ||||||||||||||
| Total return(b) | (27.59 | )% | (11.24 | )% | 0.24 | % | (8.83 | )% | 10.18 | % | (33.50 | )% | ||||||||||||||
Net assets, end of period (in 000s) | $ | 932 | $ | 1,012 | $ | 2,254 | $ | 2,009 | $ | 2,026 | $ | 1,376 | ||||||||||||||
Ratio of net expenses to average net assets after tax (benefit)/expense(c) | 2.27 | %(d) | 1.92 | % | 1.93 | % | 1.77 | % | 1.70 | % | (0.11 | )% | ||||||||||||||
Ratio of net expenses to average net assets before tax (benefit)/expense | 1.72 | %(d) | 1.69 | % | 1.65 | % | 1.68 | % | 1.70 | % | 1.69 | % | ||||||||||||||
Ratio of net investment loss to average net assets(e) | (0.66 | )%(d) | (1.31 | )% | (0.59 | )% | (1.06 | )% | (1.23 | )% | 1.97 | % | ||||||||||||||
Portfolio turnover rate(f) | 71 | % | 51 | % | 68 | % | 42 | % | 104 | % | 96 | % | ||||||||||||||
| (a) | Calculated based on the average shares outstanding methodology. |
| (b) | Assumes investment at the NAV at the beginning of the period, reinvestment of all dividends and distributions, a complete redemption of the investment at the NAV at the end of the period and no sales or redemption charges (if any). Total returns would be reduced if a sales or redemption charge was taken into account. Returns do not reflect the impact of taxes to shareholders relating to Fund distributions or the redemption of Fund shares. Total returns for periods less than one full year are not annualized. |
| (c) | Current and deferred tax expense/benefit for the ratio calculation is derived from the net investment income (loss), and realized and unrealized gains (losses). |
| (d) | Annualized with the exception of tax expenses. |
| (e) | Current and deferred tax benefit for the ratio calculation is derived from net investment income (loss) only. |
| (f) | The Fund’s portfolio turnover rate is calculated in accordance with regulatory requirements, without regard to transactions involving short term investments. If such transactions were included, the Fund’s portfolio turnover rate may be higher. |
| 14 | The accompanying notes are an integral part of these financial statements. |
GOLDMAN SACHS MLP ENERGY INFRASTRUCTURE FUND
Financial Highlights (continued)
Selected Share Data for a Share Outstanding Throughout Each Period
| Goldman Sachs MLP Energy Infrastructure Fund | ||||||||||||||
| Class P Shares | ||||||||||||||
| Six Months Ended May 31, 2020 (Unaudited) | Year Ended November 30, 2019 | Period Ended November 30, 2018(a) | ||||||||||||
| Per Share Data | ||||||||||||||
Net asset value, beginning of period | $ | 5.41 | $ | 6.57 | $ | 6.96 | ||||||||
Net investment income (loss)(b) | — | (c) | (0.04 | ) | (0.03 | ) | ||||||||
Net realized and unrealized gain (loss) | (1.45 | ) | (0.62 | ) | — | (c) | ||||||||
Total from investment operations | (1.45 | ) | (0.66 | ) | (0.03 | ) | ||||||||
Distributions to shareholders from net investment income | — | (0.03 | ) | (0.13 | ) | |||||||||
Distributions to shareholders from return of capital | (0.21 | ) | (0.47 | ) | (0.23 | ) | ||||||||
Total Distributions | (0.21 | ) | (0.50 | ) | (0.36 | ) | ||||||||
Net asset value, end of period | $ | 3.75 | $ | 5.41 | $ | 6.57 | ||||||||
| Total return(d) | (27.22 | )% | (10.73 | )% | (0.72 | )% | ||||||||
Net assets, end of period (in 000s) | $ | 484,599 | $ | 843,448 | $ | 1,073,157 | ||||||||
Ratio of net expenses to average net assets after tax (benefit)/expense(e) | 1.64 | %(f) | 1.27 | % | 1.05 | %(f) | ||||||||
Ratio of net expenses to average net assets before tax (benefit)/expense | 1.07 | %(f) | 1.04 | % | 1.00 | %(f) | ||||||||
Ratio of net investment loss to average net assets(g) | (0.07 | )%(f) | (0.61 | )% | (0.68 | )%(f) | ||||||||
Portfolio turnover rate(h) | 71 | % | 51 | % | 68 | % | ||||||||
| (a) | Commenced operations on April 16, 2018. |
| (b) | Calculated based on the average shares outstanding methodology. |
| (c) | Less than $0.005 per share. |
| (d) | Assumes investment at the NAV at the beginning of the period, reinvestment of all dividends and distributions, a complete redemption of the investment at the NAV at the end of the period and no sales or redemption charges (if any). Total returns would be reduced if a sales or redemption charge was taken into account. Returns do not reflect the impact of taxes to shareholders relating to Fund distributions or the redemption of Fund shares. Total returns for periods less than one full year are not annualized. |
| (e) | Current and deferred tax expense/benefit for the ratio calculation is derived from the net investment income (loss), and realized and unrealized gains (losses). |
| (f) | Annualized with the exception of tax expenses. |
| (g) | Current and deferred tax benefit for the ratio calculation is derived from net investment income (loss) only. |
| (h) | The Fund’s portfolio turnover rate is calculated in accordance with regulatory requirements, without regard to transactions involving short term investments. If such transactions were included, the Fund’s portfolio turnover rate may be higher. |
| The accompanying notes are an integral part of these financial statements. | 15 |
GOLDMAN SACHS MLP ENERGY INFRASTRUCTURE FUND
May 31, 2020 (Unaudited)
| 1. ORGANIZATION |
Goldman Sachs Trust (the “Trust”) is a Delaware statutory trust registered under the Investment Company Act of 1940, as amended (the “Act”), as an open-end management investment company. The Trust includes the Goldman Sachs MLP Energy Infrastructure Fund (the “Fund”). The Fund is a non-diversified portfolio under the Act offering seven classes of shares — Class A, Class C, Institutional, Investor, Class R6, Class R and Class P Shares.
Class A Shares are sold with a front-end sales charge of up to 5.50%. Class C Shares are sold with a contingent deferred sales charge (“CDSC”) of 1.00%, which is imposed on redemptions made within 12 months of purchase. Institutional, Investor, Class R6, Class R and Class P Shares are not subject to a sales charge.
Goldman Sachs Asset Management, L.P. (“GSAM”), an affiliate of Goldman Sachs & Co. LLC (“Goldman Sachs”), serves as investment adviser to the Fund pursuant to a management agreement (the “Agreement”) with the Trust.
| 2. SIGNIFICANT ACCOUNTING POLICIES |
The financial statements have been prepared in accordance with accounting principles generally accepted in the United States of America (“GAAP”) and require management to make estimates and assumptions that may affect the reported amounts and disclosures. Actual results may differ from those estimates and assumptions. Each Fund is an investment company under GAAP and follows the accounting and reporting guidance applicable to investment companies.
A. Investment Valuation — The Fund’s valuation policy is to value investments at fair value.
B. Investment Income and Investments — Investment income includes interest income, dividend income, net of any foreign withholding taxes, and less any amounts reclaimable. Interest income is accrued daily and adjusted for amortization of premiums and accretion of discounts. Dividend income is recognized on ex-dividend date or, for certain foreign securities, as soon as such information is obtained subsequent to the ex-dividend date. Non-cash dividends, if any, are recorded at the fair market value of the securities received. Investment transactions are reflected on trade date. Realized gains and losses are calculated using identified cost. Investment transactions are recorded on the following business day for daily net asset value (“NAV”) calculations. Distributions from master limited partnerships (“MLPs”) are generally recorded based on the characterization reported on the Fund’s schedule K-1 received from the MLPs. The Fund records its pro-rata share of the income/loss and capital gains/losses, allocated from the underlying partnerships and adjusts the cost basis of the underlying partnerships accordingly.
C. Class Allocations and Expenses — Investment income, realized and unrealized gain (loss), if any, and non-class specific expenses of the Fund are allocated daily based upon the proportion of net assets of each class. Non-class specific expenses directly incurred by the Fund are charged to the Fund, while such expenses incurred by the Trust are allocated across the applicable Funds on a straight-line and/or pro-rata basis depending upon the nature of the expenses. Class specific expenses, where applicable, are borne by the respective share classes and include Distribution and Service, Transfer Agency and Service fees.
D. Distributions to Shareholders — Over the long term, the Fund makes distributions to its shareholders each fiscal quarter at a rate that is approximately equal to the distributions the Fund receives from the MLPs and other securities in which it invests. To permit the Fund to maintain more stable quarterly distributions, the distribution for any particular quarterly period may be more or less than the amount of total distributable earnings actually earned by the Fund. The Fund estimates that only a portion of the distributions paid to shareholders will be treated as income. The remaining portion of the Fund’s distribution, which may be significant, is expected to be a return of capital. These estimates are based on the Fund’s operating results during the period, and their final federal income tax characterization may differ.
The characterization of distributions to shareholders for financial reporting purposes is determined in accordance with federal income tax rules, which may differ from GAAP. Certain components of the Fund’s net assets on the Statement of Assets and Liabilities reflect permanent GAAP/Tax differences based on the appropriate tax character.
E. Income Taxes — The Fund does not intend to qualify as a regulated investment company pursuant to Subchapter M of the Internal Revenue Code of 1986, as amended, but will rather be taxed as a corporation. As a result, the Fund is obligated to pay
16
GOLDMAN SACHS MLP ENERGY INFRASTRUCTURE FUND
| 2. SIGNIFICANT ACCOUNTING POLICIES (continued) |
federal, state and local income tax on its taxable income. The Fund invests primarily in MLPs, which generally are treated as partnerships for federal income tax purposes. As a limited partner in the MLPs, the Fund must report its allocable share of the MLPs’ taxable income or loss in computing its own taxable income or loss. The Fund’s tax expense or benefit is included in the Statement of Operations based on the component of income or gains/losses to which such expense or benefit relates. Deferred income taxes reflect the net tax effects of temporary differences between the carrying amounts of assets and liabilities for financial reporting purposes and the amounts used for income tax purposes. Such temporary differences are principally: (i) taxes on unrealized gains/losses, which are attributable to the temporary difference between fair market value and tax basis, (ii) the net tax effects of temporary differences between the carrying amounts of assets and liabilities for financial reporting and income tax purposes, and (iii) the net tax benefit of accumulated net operating losses and capital loss carryforwards. The Fund will accrue a deferred income tax liability balance, at the currently effective statutory United States (“U.S.”) federal income tax rate plus an estimated state and local income tax rate, for its future tax liability associated with the capital appreciation of its investments and the distributions received by the Fund on interests of MLPs considered to be return of capital and for any net operating gains. The Fund may also record a deferred tax asset balance, which reflects an estimate of the Fund’s future tax benefit associated with net operating losses, capital loss carryforwards, and/or unrealized losses.
To the extent the Fund has a deferred tax asset, consideration is given to whether or not a valuation allowance, which would offset the value of some or all of the deferred tax asset balance, is required. A valuation allowance is required if based on the evaluation criterion provided by Accounting Standards Codification (“ASC”) 740, Income Taxes (ASC 740) it is more likely than not that some portion, or all, of the deferred tax asset will not be realized. The factors considered in assessing the Fund’s valuation allowance include: the nature, frequency and severity of current and cumulative losses, the duration of the statutory carryforward periods and the associated risks that operating and capital loss carryforwards may expire unutilized. From time to time, as new information becomes available, the Fund will modify its estimates or assumptions regarding the deferred tax liability or asset. Unexpected significant decreases in cash distributions from the Fund’s MLP investments or significant declines in the fair value of its investments may change the Fund’s assessment regarding the recoverability of their deferred tax assets and may result in a valuation allowance. If a valuation allowance is required to reduce any deferred tax asset in the future, it could have a material impact on the Fund’s NAV and results of operations in the period it is recorded. The Fund will rely to some extent on information provided by MLPs, which may not be provided to the Fund on a timely basis, to estimate operating income/loss and gains/losses and current taxes and deferred tax liabilities and/or asset balances for purposes of daily reporting of NAVs and financial statement reporting.
It is the Fund’s policy to classify interest and penalties associated with underpayment of federal and state income taxes, if any, as income tax expense on its Statement of Operations. The Fund anticipates filing income tax returns in the U.S. federal jurisdiction and various states, and such returns are subject to examination by the tax jurisdictions. The Fund has reviewed all major jurisdictions and concluded that there is no significant impact on its net assets and no tax liability resulting from unrecognized tax benefits or expenses relating to uncertain tax positions expected to be taken on its tax returns.
Return of Capital Estimates — Distributions received from the Fund’s investments in MLPs generally are comprised of income and return of capital. The Fund records investment income and return of capital based on estimates made at the time such distributions are received. Such estimates are based on historical information available from each MLP and other industry sources. These estimates may subsequently be revised based on information received from MLPs after their tax reporting periods are concluded.
F. Foreign Currency Translation — The accounting records and reporting currency of the Fund are maintained in U.S. dollars. Assets and liabilities denominated in foreign currencies are translated into U.S. dollars using the current exchange rates at the close of each business day. The effect of changes in foreign currency exchange rates on investments is included within net realized and unrealized gain (loss) on investments. Changes in the value of other assets and liabilities as a result of fluctuations in foreign exchange rates are included in the Statement of Operations within net change in unrealized gain (loss) on foreign currency translations. Transactions denominated in foreign currencies are translated into U.S. dollars on the date the transaction occurred, the effects of which are included within net realized gain (loss) on foreign currency transactions.
17
GOLDMAN SACHS MLP ENERGY INFRASTRUCTURE FUND
Notes to Financial Statements (continued)
May 31, 2020 (Unaudited)
| 3. INVESTMENTS AND FAIR VALUE MEASUREMENTS |
The fair value of a financial instrument is the amount that would be received to sell an asset or paid to transfer a liability in an orderly transaction between market participants at the measurement date (i.e., the exit price); the Fund’s policy is to use the market approach. GAAP establishes a fair value hierarchy that prioritizes the inputs to valuation techniques used to measure fair value. The hierarchy gives the highest priority to unadjusted quoted prices in active markets for identical assets or liabilities (Level 1 measurements) and the lowest priority to unobservable inputs (Level 3 measurements). The levels used for classifying investments are not necessarily an indication of the risk associated with investing in these investments. The three levels of the fair value hierarchy are described below:
Level 1 — Unadjusted quoted prices in active markets that are accessible at the measurement date for identical, unrestricted assets or liabilities;
Level 2 — Quoted prices in markets that are not active or financial instruments for which significant inputs are observable (including, but not limited to, quoted prices for similar investments, interest rates, foreign exchange rates, volatility and credit spreads), either directly or indirectly;
Level 3 — Prices or valuations that require significant unobservable inputs (including GSAM’s assumptions in determining fair value measurement).
The Board of Trustees (“Trustees”) has approved Valuation Procedures that govern the valuation of the portfolio investments held by the Fund, including investments for which market quotations are not readily available. The Trustees have delegated to GSAM day-to-day responsibility for implementing and maintaining internal controls and procedures related to the valuation of the Fund’s portfolio investments. To assess the continuing appropriateness of pricing sources and methodologies, GSAM regularly performs price verification procedures and issues challenges as necessary to third party pricing vendors or brokers, and any differences are reviewed in accordance with the Valuation Procedures.
A. Level 1 and Level 2 Fair Value Investments — The valuation techniques and significant inputs used in determining the fair values for investments classified as Level 1 and Level 2 are as follows:
Equity Securities — Equity securities traded on a United States (“U.S.”) securities exchange or the NASDAQ system, or those located on certain foreign exchanges, including but not limited to the Americas, are valued daily at their last sale price or official closing price on the principal exchange or system on which they are traded. If there is no sale or official closing price or such price is believed by GSAM to not represent fair value, equity securities may be valued at the last bid price for long positions and at the last ask price for short positions. To the extent these investments are actively traded, they are classified as Level 1 of the fair value hierarchy, otherwise they are generally classified as Level 2. Certain equity securities containing unique attributes may be classified as Level 2.
Unlisted equity securities for which market quotations are available are valued at the last sale price on the valuation date, or if no sale occurs, at the last bid price, and are generally classified as Level 2. Securities traded on certain foreign securities exchanges are valued daily at fair value determined by an independent fair value service (if available) under Valuation Procedures approved by the Trustees and consistent with applicable regulatory guidance. The independent fair value service takes into account multiple factors including, but not limited to, movements in the securities markets, certain depositary receipts, futures contracts and foreign currency exchange rates that have occurred subsequent to the close of the foreign securities exchange. These investments are generally classified as Level 2 of the fair value hierarchy.
Money Market Funds — Investments in the Goldman Sachs Financial Square Government Fund (“Underlying Fund”) are valued at the NAV per share of the Institutional Share class on the day of valuation. These investments are generally classified as Level 1 of the fair value hierarchy. For information regarding an Underlying Fund’s accounting policies and investment holdings, please see the Underlying Fund’s shareholder report.
18
GOLDMAN SACHS MLP ENERGY INFRASTRUCTURE FUND
| 3. INVESTMENTS AND FAIR VALUE MEASUREMENTS (continued) |
B. Level 3 Fair Value Investments — To the extent that significant inputs to valuation models and other alternative pricing sources are unobservable, or if quotations are not readily available, or if GSAM believes that such quotations do not accurately reflect fair value, the fair value of the Fund’s investments may be determined under Valuation Procedures approved by the Trustees. GSAM, consistent with its procedures and applicable regulatory guidance, may make an adjustment to the most recent valuation prices of either domestic or foreign securities in light of significant events to reflect what it believes to be the fair value of the securities at the time of determining the Fund’s NAV. To the extent investments are valued using single source broker quotations obtained directly from the broker or passed through from third party pricing vendors, such investments are classified as Level 3 investments.
C. Fair Value Hierarchy — The following is a summary of the Fund’s investments classified in the fair value hierarchy as of May 31, 2020:
| MLP ENERGY INFRASTRUCTURE | ||||||||||||
| Investment Type | Level 1 | Level 2 | Level 3 | |||||||||
| Assets |
| |||||||||||
Common Stock(a) | ||||||||||||
Europe | $ | 4,932,436 | $ | 3,958,574 | $ | — | ||||||
North America | 1,003,084,186 | — | — | |||||||||
| Total | $ | 1,008,016,622 | $ | 3,958,574 | $ | — | ||||||
| (a) | Amounts are disclosed by continent to highlight the impact of time zone differences between local market close and the calculation of net asset value. Security valuations are based on the principal exchange or system on which they are traded, which may differ from country of domicile. The Fund utilizes fair value model prices provided by an independent fair value service for international equities, resulting in a Level 2 classification. |
For further information regarding security characteristics, see the Schedule of Investments.
| 4. TAXATION |
Total income taxes are computed by applying the federal statutory rate plus a blended state income tax rate. During the six months ended May 31, 2020, the Fund reevaluated its blended state income tax rate, decreasing the rate from 1.80% to 1.64% due to anticipated change in state apportionment of income and gains. The reconciliation between the federal statutory income tax rate of 21% and the effective tax rate on net investment income/loss and realized and unrealized gain/loss is as follows:
Application of statutory income tax rate | $ | (97,302,650 | ) | 21.00 | % | |||
State income taxes, net of federal benefit | (7,598,874 | ) | 1.64 | |||||
Change in estimated deferred tax rate | 1,698,298 | (0.37 | ) | |||||
Effect of permanent differences | (780,094 | ) | 0.17 | |||||
Change in valuation allowance | 111,149,438 | (23.99 | ) | |||||
Total current and deferred income tax expense, net | $ | 7,166,118 | (1.55 | )% |
19
GOLDMAN SACHS MLP ENERGY INFRASTRUCTURE FUND
Notes to Financial Statements (continued)
May 31, 2020 (Unaudited)
| 4. TAXATION (continued) |
Deferred tax assets and liabilities are measured using effective tax rates expected to apply to taxable income in the years such temporary differences are realized or otherwise settled. At May 31, 2020, components of the Fund’s deferred tax assets and liabilities were as follows:
| Deferred tax assets: | ||||
Net unrealized losses on investment securities (tax basis) | $ | 62,367,717 | ||
Net operating loss carryforward | 11,120,344 | |||
Capital loss carryforward (tax basis) | 291,512,975 | |||
Other tax assets | 827,040 | |||
Valuation Allowance | (355,096,092 | ) | ||
Total Deferred Tax Assets | $ | 10,731,984 | ||
| Deferred tax liabilities: | ||||
Book vs tax partnership income to be recognized | $ | (32,839,629 | ) | |
Total Deferred Tax Liabilities | $ | (32,839,629 | ) | |
Net Deferred Tax Asset/(Liability) | $ | (22,107,645 | ) | |
At May 31, 2020, the Fund had net operating loss carryforwards, subject to expiration and limitation based on the fiscal year generated, as follows:
| For Fiscal Year Ended: | Amount | Expiration | ||||||
November 30, 2017 | $ | 21,330,028 | November 30, 2037 | |||||
November 30, 2018 | $ | 26,633,832 | November 30, 2038 | |||||
November 30, 2019 | $ | 1,154,268 | Indefinite | |||||
The Tax Cuts and Jobs Act (“TCJA”) was signed into law on December 22, 2017. The TCJA made modifications to the net operating loss (“NOL”) deduction. The TCJA eliminated the NOL carryback ability and replaced the 20 year carryforward period with an indefinite carryforward period for any NOLs arising in tax years beginning after December 31, 2017. The TCJA also established a limitation for any NOLs generated in tax years beginning after December 31, 2017 to the lesser of the aggregate of available NOLs or 80% of taxable income before any NOL utilization. The Coronavirus Aid, Relief, and Economic Stability Act (CARES Act) was signed into law on March 27, 2020. The CARES Act delays the application of the 80% net operating loss limitation, established under the TCJA, to tax years ending November 30, 2022 and beyond.
At May 31, 2020, the Fund had capital loss carryforwards, subject to expiration and limitation based on the fiscal year generated, as follows:
| For Fiscal Year Ended: | Amount | Expiration | ||||||
November 30, 2015 | $ | 390,717,276 | November 30, 2020 | |||||
November 30, 2016 | $ | 288,032,916 | November 30, 2021 | |||||
November 30, 2019 | $ | 127,456,046 | November 30, 2024 | |||||
November 30, 2020 | $ | 481,395,243 | November 30, 2025 | |||||
The Fund reviews the recoverability of its deferred tax assets based upon the weight of the available evidence. When assessing, the Fund’s management considers available carrybacks, reversing temporary taxable differences, and tax planning, if any. As a result of its analysis of the recoverability of its deferred tax assets, the Fund recorded $355,096,092 of valuation allowances as of May 31, 2020.
20
GOLDMAN SACHS MLP ENERGY INFRASTRUCTURE FUND
| 4. TAXATION (continued) |
For the six months ended May 31, 2020, components of the Fund’s current and deferred tax expense/(benefit) were as follows:
| Current | Deferred | Total | ||||||||||
Federal | $ | — | $ | (97,976,889 | ) | $ | (97,976,889 | ) | ||||
State | $ | 40,354 | $ | (6,046,785 | ) | $ | (6,006,431 | ) | ||||
Valuation Allowance | $ | — | $ | 111,149,438 | $ | 111,149,438 | ||||||
Total | $ | 40,354 | $ | 7,125,764 | $ | 7,166,118 | ||||||
For the six months ended May 31, 2020, the Fund does not have any interest or penalties associated with the underpayment of any income taxes. At May 31, 2020, gross unrealized appreciation and depreciation of investments, based on cost, for federal income tax purposes was as follows:
Tax Cost | $ | 1,142,454,812 | ||
Gross unrealized gain | 68,043,837 | |||
Gross unrealized loss | (198,523,453 | ) | ||
Net unrealized security gain | $ | (130,479,616 | ) |
Any difference between cost amounts for financial statement and federal income tax purposes is due primarily to wash sales and differences related to the tax treatment of partnership investments.
For the six months ended May 31, 2020, the Fund distributions are estimated to be comprised of 0% from taxable income and 100% return of capital. Shareholders will be informed of the final tax characterization of the distributions in February 2021. The Fund’s tax years ended November 30, 2017 through November 30, 2019 remain open for examination by U.S. and state tax authorities. Management of the Fund is not aware of any tax positions for which it is reasonably possible that the total amounts of unrecognized tax benefits or expenses will significantly change in the next 12 months.
| 5. AGREEMENTS AND AFFILIATED TRANSACTIONS |
A. Management Agreement — Under the Agreement, GSAM manages the Fund, subject to the general supervision of the Trustees.
As compensation for the services rendered pursuant to the Agreement, the assumption of the expenses related thereto and administration of the Fund’s business affairs, including providing facilities, GSAM is entitled to a management fee, accrued daily and paid monthly, equal to an annual percentage rate of the Fund’s average daily net assets.
For the six months ended May 31, 2020, contractual and effective net management fees with GSAM were at the following rates:
| Contractual Management Rate | ||||||||||||||||||||||
First $1 billion | Next $1 billion | Next $3 billion | Next $3 billion | Over $8 billion | Effective Net Management Rate^ | |||||||||||||||||
| 1.00% | 0.90% | 0.86% | 0.84% | 0.82% | 0.97% | |||||||||||||||||
| ^ | Effective Net Management Rate includes the impact of management fee waivers of affiliated Underlying Funds, if any. The Effective Net Management Rate may not correlate to the Contractual Management Rate as a result of management fee waivers that may be in effect from time to time. |
The Fund invests in Institutional Shares of the Goldman Sachs Financial Square Government Fund, which is an affiliated Underlying Fund. GSAM has agreed to waive a portion of its management fee payable by the Fund in an amount equal to the management fee it earns as an investment adviser to the affiliated Underlying Fund in which the Fund invests. For the six months ended May 31, 2020, GSAM waived $6,495 of the Fund’s management fee.
21
GOLDMAN SACHS MLP ENERGY INFRASTRUCTURE FUND
Notes to Financial Statements (continued)
May 31, 2020 (Unaudited)
| 5. AGREEMENTS AND AFFILIATED TRANSACTIONS (continued) |
B. Distribution and/or Service (12b-1) Plans — The Trust, on behalf of Class A and Class R Shares of the Fund, has adopted Distribution and Service Plans subject to Rule 12b-1 under the Act. Under the Distribution and Service Plans, Goldman Sachs, which serves as distributor (the “Distributor”), is entitled to a fee accrued daily and paid monthly for distribution services and personal and account maintenance services, which may then be paid by Goldman Sachs to authorized dealers. These fees are equal to an annual percentage rate of the average daily net assets attributable to Class A or Class R Shares of the Fund, as set forth below.
The Trust, on behalf of Class C Shares of the Fund, has adopted a Distribution Plan subject to Rule 12b-1 under the Act. Under the Distribution Plan, Goldman Sachs as Distributor is entitled to a fee accrued daily and paid monthly for distribution services, which may then be paid by Goldman Sachs to authorized dealers. These fees are equal to an annual percentage rate of the average daily net assets attributable to Class C Shares of the Fund, as set forth below:
| Distribution and/or Service Plan Rates | ||||||||||||
| Class A* | Class C | Class R* | ||||||||||
Distribution and/or Service Plan | 0.25 | % | 0.75 | % | 0.50 | % | ||||||
| * | With respect to Class A and Class R Shares, the Distributor at its discretion may use compensation for distribution services paid under the Distribution Plan to compensate service organizations for personal and account maintenance services and expenses as long as such total compensation does not exceed the maximum cap on “service fees” imposed by the Financial Industry Regulatory Authority. |
C. Distribution Agreement — Goldman Sachs, as Distributor of the shares of the Fund pursuant to a Distribution Agreement, may retain a portion of the Class A Shares’ front end sales charge and Class C Shares’ CDSC. For the six months ended May 31, 2020 , Goldman Sachs advised that it retained $10,832 and $0 of the sales charges applicable to Class A and Class C Shares, respectively.
D. Service Plan — The Trust, on behalf of the Fund, has adopted a Service Plan to allow Class C Shares to compensate service organizations (including Goldman Sachs) for providing varying levels of personal and account maintenance services to its customers who are beneficial owners of such shares. The Service Plan provides for compensation to the service organizations equal to an annual percentage rate of 0.25% of the average daily net assets attributable to Class C Shares of the Fund.
E. Transfer Agency Agreement — Goldman Sachs also serves as the transfer agent of the Fund for a fee pursuant to the Transfer Agency Agreement. The fees charged for such transfer agency services are accrued daily and paid monthly at annual rates as follows: 0.17% of the average daily net assets of Class A, Class C, Investor and Class R Shares; 0.03% of the average daily net assets of Class R6 and Class P Shares; and 0.04% of the average daily net assets of Institutional Shares.
F. Other Expense Agreements and Affiliated Transactions — GSAM has agreed to reduce or limit certain “Other Expenses” of the Fund (excluding acquired fund fees and expenses, transfer agency fees and expenses, service fees and shareholder administration fees (as applicable), taxes, interest, brokerage fees, shareholder meeting, litigation, indemnification and extraordinary expenses) to the extent such expenses exceed, on an annual basis, a percentage rate of the average daily net assets of the Fund. Such Other Expense reimbursements, if any, are accrued daily and paid monthly. In addition, the Fund is not obligated to reimburse GSAM for prior fiscal year expense reimbursements, if any. The Other Expense limitations as an annual percentage rate of average daily net assets for the Fund is 0.064%. These Other Expense limitations will remain in place through at least March 27, 2021, and prior to such date GSAM may not terminate the arrangements without the approval of the Trustees. In addition, the Fund has entered into certain offset arrangements with the transfer agent, which may result in a reduction of the Fund’s expenses and are received irrespective of the application of the “Other Expense” limitations described above. Such Other Expense reimbursements,
22
GOLDMAN SACHS MLP ENERGY INFRASTRUCTURE FUND
| 5. AGREEMENTS AND AFFILIATED TRANSACTIONS (continued) |
if any, are accrued daily and paid monthly and are disclosed in the Statement of Operations for the six months ended May 31, 2020. For the six months ended May 31, 2020, these expense reductions, including any fee waivers and Other Expense reimbursements, were as follows:
Management Fee Waiver | Transfer Agency | Total Expense Reductions | ||||||||
| $ | 6,495 | $ | 354 | $ | 6,849 | |||||
G. Other Transactions with Affiliates — For the six months ended May 31, 2020, Goldman Sachs earned $70,836 brokerage commissions from portfolio transactions on behalf of the Fund.
The table below shows the transactions in and earnings from investments in all affiliated funds as of and for the six months ended May 31, 2020:
| Underlying Fund | Beginning Value as of November 30, 2019 | Purchases at Cost | Proceeds from Sales | Ending Value as of May 31, 2020 | Shares as of May 31, 2020 | Dividend Income | ||||||||||||||||||
Goldman Sachs Financial Square Government Fund — Institutional Shares | $ | 17,556,028 | $ | 251,828,868 | $ | (269,384,896 | ) | $ | — | — | $ | 38,920 | ||||||||||||
H. Line of Credit Facility — As of May 31, 2020, the Fund participated in a $700,000,000 committed, unsecured revolving line of credit facility (the “facility”) together with other funds of the Trust and registered investment companies having management agreements with GSAM or its affiliates. This facility is to be used for temporary or emergency purposes, or to allow for an orderly liquidation of securities to meet redemption requests. The interest rate on borrowings is based on the federal funds rate. The facility also requires a fee to be paid by the Fund based on the amount of the commitment that has not been utilized. For the six months ended May 31, 2020, the Fund did not have any borrowings under the facility. Prior to April 28, 2020, the facility was $580,000,000.
| 6. PORTFOLIO SECURITIES TRANSACTIONS |
The cost of purchases and proceeds from sales and maturities of long-term securities for the six months ended May 31, 2020, were $933,715,909 and $1,127,579,369, respectively.
| 7. OTHER RISKS |
The Fund’s risks include, but are not limited to, the following:
Geographic and Sector Risk — The Fund focuses its investments in the energy sector, and will therefore be susceptible to adverse economic, environmental, business, regulatory or other occurrences affecting that sector. The energy sector has historically experienced substantial price volatility. MLPs and other companies operating in the energy sector are subject to specific risks, including, among others, fluctuations in commodity prices; reduced consumer demand for commodities such as oil, natural gas or petroleum products; reduced availability of natural gas or other commodities for transporting, processing, storing or delivering; slowdowns in new construction; extreme weather or other natural disasters; and threats of attack by terrorists on energy assets. Additionally, changes in the regulatory environment for energy companies may adversely impact their profitability. Over time, depletion of natural gas reserves and other energy reserves may also affect the profitability of energy companies.
Investments in Other Investment Companies — As a shareholder of another investment company, the Fund will indirectly bear its proportionate share of any net management fees and other expenses paid by such other investment companies, in addition to the fees and expenses regularly borne by the Fund.
23
GOLDMAN SACHS MLP ENERGY INFRASTRUCTURE FUND
Notes to Financial Statements (continued)
May 31, 2020 (Unaudited)
| 7. OTHER RISKS (continued) |
Large Shareholder Transactions Risk — The Fund may experience adverse effects when certain large shareholders, such as other funds, institutional investors (including those trading by use of non-discretionary mathematical formulas), financial intermediaries (who may make investment decisions on behalf of underlying clients and/or include the Fund in their investment model), individuals, accounts and Goldman Sachs affiliates, purchase or redeem large amounts of shares of the Fund. Such large shareholder redemptions, which may occur rapidly or unexpectedly, may cause the Fund to sell portfolio securities at times when it would not otherwise do so, which may negatively impact the Fund’s NAV and liquidity. These transactions may also accelerate the realization of taxable income to shareholders if such sales of investments resulted in gains, and may also increase transaction costs. In addition, a large redemption could result in the Fund’s current expenses being allocated over a smaller asset base, leading to an increase in the Fund’s expense ratio. Similarly, large Fund share purchases may adversely affect the Fund’s performance to the extent that the Fund is delayed in investing new cash or otherwise maintains a larger cash position than it ordinarily would.
Liquidity Risk — The Fund may make investments that are illiquid or that may become less liquid in response to market developments or adverse investor perceptions. Illiquid investments may be more difficult to value. Liquidity risk may also refer to the risk that the Fund will not be able to pay redemption proceeds within the allowable time period or without significant dilution to remaining investors’ interests because of unusual market conditions, an unusually high volume of redemption requests, or other reasons. To meet redemption requests, the Fund may be forced to sell investments at an unfavorable time and/or under unfavorable conditions. If the Fund is forced to sell securities at an unfavorable time and/or under unfavorable conditions, such sales may adversely affect the Fund’s NAV and dilute remaining investors’ interests. Redemptions by large shareholders may have a negative impact on the Fund’s liquidity.
Market and Credit Risks — In the normal course of business, the Fund trades financial instruments and enters into financial transactions where risk of potential loss exists due to changes in the market (market risk). The value of the securities in which the Fund invests may go up or down in response to the prospectus of individual companies, particular sectors or governments and/or general economic conditions throughout the world due to increasingly interconnected global economies and financial markets. Events such as war, acts of terrorism, social unrest, natural disasters, the spread of infectious illness or other public health threats could also significantly impact the Fund and its investments. Additionally, the Fund may also be exposed to credit risk in the event that an issuer or guarantor fails to perform or that an institution or entity with which the Fund has unsettled or open transactions defaults.
Master Limited Partnership Risk — Investments in securities of MLPs involve risks that differ from investments in common stocks, including risks related to limited control and limited rights to vote on matters affecting the MLP, risks related to potential conflicts of interest between the MLP and the MLP’s general partner, cash flow risks, dilution risks, limited liquidity and risks related to the general partner’s right to require unit-holders to sell their common units at an undesirable time or price.
Non-Diversification Risk — The Fund is non-diversified, meaning that it is permitted to invest a larger percentage of its assets in fewer issuers than diversified mutual funds. Thus, the Fund may be more susceptible to adverse developments affecting any single issuer held in its portfolio, and may be more susceptible to greater losses because of these developments.
Strategy Risk — The Fund’s strategy of investing primarily in MLPs, resulting in its being taxed as a corporation, or a “C” corporation, rather than as a regulated investment company for U.S. federal income tax purposes, is a relatively new investment strategy for funds. This strategy involves complicated accounting, tax and valuation issues. Volatility in the NAV may be experienced because of the use of estimates at various times during a given year that may result in unexpected and potentially significant consequences for the Fund and its shareholders.
Tax Risks — Tax risks associated with investments in the Fund include but are not limited to the following:
Fund Structure Risk. Unlike traditional mutual funds that are structured as regulated investment companies for U.S. federal income tax purposes, the Fund will be taxable as a regular corporation, or “C” corporation, for U.S. federal income tax purposes. This means the Fund generally will be subject to U.S. federal income tax on its taxable income at the rates applicable to corporations, and will also be subject to state and local income taxes.
24
GOLDMAN SACHS MLP ENERGY INFRASTRUCTURE FUND
| 7. OTHER RISKS (continued) |
MLP Tax Risk. MLPs are generally treated as partnerships for U.S. federal income tax purposes. Partnerships do not pay U.S. federal income tax at the partnership level. Rather, each partner is allocated a share of the partnership’s income, gains, losses, deductions and expenses. A change in current tax law or a change in the underlying business mix of a given MLP could result in an MLP being treated as a corporation for U.S. federal income tax purposes, which would result in the MLP being required to pay U.S. federal income tax (as well as state and local income taxes) on its taxable income. This would have the effect of reducing the amount of cash available for distribution by the MLP and could result in a reduction in the value of the Fund’s investment in the MLP and lower income to the Fund.
To the extent a distribution received by the Fund from an MLP is treated as a return of capital, the Fund’s adjusted tax basis in the interests of the MLP will be reduced, which may increase the Fund’s tax liability upon the sale of the interests in the MLP or upon subsequent distributions in respect of such interests.
Tax Estimation/NAV Risk. In calculating the Fund’s daily NAV, the Fund will, among other things, include its current taxes and deferred tax liability and/or asset balances and related valuation balances, if any. The Fund may accrue a deferred income tax liability balance, at the currently effective statutory U.S. federal income tax rate (currently 21%) plus an estimated state and local income tax rate, for its future tax liability associated with the capital appreciation of its investments and the distributions received by the Fund on interests of MLPs considered to be return of capital and for any net operating gains. Any deferred tax liability balance will reduce the Fund’s NAV which could have an effect on the market price of the shares. The Fund may also record a deferred tax asset balance, which reflects an estimate of the Fund’s future tax benefit associated with net operating losses, capital loss carryforwards, and/or unrealized losses. Any deferred tax asset balance will increase the Fund’s NAV to the extent it exceeds any valuation allowance which could have an effect on the market price of the shares. The Fund will rely to some extent on information provided by MLPs, which may not be provided to the Fund on a timely basis, to estimate current taxes and deferred tax liability and/or asset balances for purposes of financial statement reporting and determining its NAV. The daily estimate of the Fund’s current taxes and deferred tax liability and/or asset balances used to calculate the Fund’s NAV could vary significantly from the Fund’s actual tax liability or benefit, and, as a result, the determination of the Fund’s actual tax liability or benefit may have a material impact on the Fund’s NAV. From time to time, the Fund may modify its estimates or assumptions regarding its current taxes and deferred tax liability and/or asset balances as new information becomes available, which modifications in estimates or assumptions may have a material impact on the Fund’s NAV.
| 8. INDEMNIFICATIONS |
Under the Trust’s organizational documents, its Trustees, officers, employees and agents are indemnified, to the extent permitted by the Act and state law, against certain liabilities that may arise out of performance of their duties to the Fund. Additionally, in the course of business, the Fund enters into contracts that contain a variety of indemnification clauses. The Fund’s maximum exposure under these arrangements is unknown, as this would involve future claims that may be made against the Funds that have not yet occurred. However, GSAM believes the risk of loss under these arrangements to be remote.
| 9. OTHER MATTERS |
On April 15, 2020 the Trustees approved a 5 for 1 reverse stock split effective at the close of business on June 5, 2020. The stock split will have no impact on the overall value of a shareholder’s investment of the Fund.
| 10. SUBSEQUENT EVENTS |
Subsequent events after the Statement of Assets and Liabilities date, other than above have been evaluated, and GSAM has concluded that there is no impact requiring adjustment or disclosure in the financial statements.
25
GOLDMAN SACHS MLP ENERGY INFRASTRUCTURE FUND
Notes to Financial Statements (continued)
May 31, 2020 (Unaudited)
| 11. SUMMARY OF SHARE TRANSACTIONS |
Share activity is as follows:
| MLP Energy Infrastructure Fund | ||||||||||||||||
| ||||||||||||||||
| For the Six Months Ended May 31, 2020 (Unaudited) | For the Fiscal Year Ended November 30, 2019 | |||||||||||||||
| ||||||||||||||||
| Shares | Dollars | Shares | Dollars | |||||||||||||
| ||||||||||||||||
| Class A Shares |
| |||||||||||||||
Shares sold | 2,194,114 | $ | 8,337,505 | 2,569,578 | $ | 16,195,173 | ||||||||||
Reinvestment of distributions | 555,501 | 2,251,518 | 1,031,577 | 6,171,703 | ||||||||||||
Shares redeemed | (3,454,411 | ) | (13,786,007 | ) | (6,989,024 | ) | (43,318,436 | ) | ||||||||
| (704,796 | ) | (3,196,984 | ) | (3,387,869 | ) | (20,951,560 | ) | |||||||||
| Class C Shares |
| |||||||||||||||
Shares sold | 577,255 | 2,470,162 | 977,782 | 5,653,584 | ||||||||||||
Reinvestment of distributions | 543,177 | 2,069,378 | 1,132,713 | 6,396,585 | ||||||||||||
Shares redeemed | (3,630,382 | ) | (14,005,462 | ) | (5,462,008 | ) | (31,631,218 | ) | ||||||||
| (2,509,950 | ) | (9,465,922 | ) | (3,351,513 | ) | (19,581,049 | ) | |||||||||
| Institutional Shares |
| |||||||||||||||
Shares sold | 34,664,443 | 143,406,637 | 45,682,735 | 292,520,825 | ||||||||||||
Reinvestment of distributions | 2,501,361 | 10,764,332 | 6,000,078 | 36,862,569 | ||||||||||||
Shares redeemed | (78,844,770 | ) | (300,671,896 | ) | (57,864,269 | ) | (361,372,991 | ) | ||||||||
| (41,678,966 | ) | (146,500,927 | ) | (6,181,456 | ) | (31,989,597 | ) | |||||||||
| Investor Shares |
| |||||||||||||||
Shares sold | 4,450,977 | 19,631,925 | 8,448,853 | 52,657,289 | ||||||||||||
Reinvestment of distributions | 695,786 | 2,923,045 | 1,572,291 | 9,585,878 | ||||||||||||
Shares redeemed | (11,887,696 | ) | (52,522,245 | ) | (13,519,706 | ) | (85,555,997 | ) | ||||||||
| (6,740,933 | ) | (29,967,275 | ) | (3,498,562 | ) | (23,312,830 | ) | |||||||||
| Class R6 Shares |
| |||||||||||||||
Shares sold | 24,294,835 | 67,876,666 | 12,452,892 | 75,808,866 | ||||||||||||
Reinvestment of distributions | 2,039,210 | 8,329,490 | 2,033,495 | 12,386,090 | ||||||||||||
Shares redeemed | (3,453,629 | ) | (11,658,161 | ) | (15,206,078 | ) | (101,828,358 | ) | ||||||||
| 22,880,416 | 64,547,995 | (719,691 | ) | (13,633,402 | ) | |||||||||||
| Class R Shares |
| |||||||||||||||
Shares sold | 105,759 | 348,482 | 83,201 | 511,762 | ||||||||||||
Reinvestment of distributions | 11,972 | 46,762 | 28,205 | 167,841 | ||||||||||||
Shares redeemed | (50,882 | ) | (193,528 | ) | (272,734 | ) | (1,663,168 | ) | ||||||||
| 66,849 | 201,716 | (161,328 | ) | (983,565 | ) | |||||||||||
| Class P Shares |
| |||||||||||||||
Shares sold | 122,443,740 | 524,086,749 | 75,175,811 | 474,120,092 | ||||||||||||
Reinvestment of distributions | 7,006,196 | 29,756,220 | 12,778,086 | 78,663,901 | ||||||||||||
Shares redeemed | (156,089,965 | ) | (636,535,105 | ) | (95,395,447 | ) | (581,152,229 | ) | ||||||||
| (26,640,029 | ) | (82,692,136 | ) | (7,441,550 | ) | (28,368,236 | ) | |||||||||
NET DECREASE | (55,327,409 | ) | $ | (207,073,533 | ) | (24,741,969 | ) | $ | (138,820,239 | ) | ||||||
26
GOLDMAN SACHS MLP ENERGY INFRASTRUCTURE FUND
Voting Results of Special Meeting of Shareholders
A Special Meeting (the “Meeting”) of the Goldman Sachs Trust (“GST”) was held on January 23, 2020 to consider and act upon the proposals below. The Fund has amortized its respective share of the proxy, shareholder meeting and other related costs and GSAM has agreed to reimburse the Fund to the extent such expenses exceed a specified percentage of the Fund’s net assets.
At the Meeting, Dwight L. Bush, Kathryn A. Cassidy, Joaquin Delgado and Gregory G. Weaver were elected to the Trust’s Board of Trustees. In electing trustees, the Trust’s shareholders voted as follows:
Proposal 1. Election of Trustees | For | Against | Withheld | Broker Non-Votes | ||||||||||||
Dwight L. Bush | 94,278,961,728.065 | 0 | 349,026,343.365 | 0 | ||||||||||||
Kathryn A. Cassidy | 94,310,850,789.164 | 0 | 317,137,282.266 | 0 | ||||||||||||
Joaquin Delgado | 94,282,646,444.727 | 0 | 345,341,626.703 | 0 | ||||||||||||
Gregory G. Weaver | 94,306,589,873.348 | 0 | 321,398,198.082 | 0 | ||||||||||||
27
GOLDMAN SACHS MLP ENERGY INFRASTRUCTURE FUND
Liquidity Risk Management Program
The Fund has adopted and implemented a liquidity risk management program (the “Program”) in accordance with Rule 22e-4 under the 1940 Act. The Program seeks to assess and manage the Fund’s liquidity risk, i.e., the risk that a Fund is unable to satisfy redemption requests without significantly diluting remaining investors’ interests in the Fund. The Board of Trustees of the Trust has designated GSAM, the Fund’s investment adviser, to administer the Program. Certain aspects of the Program rely on third parties to perform certain functions, including the provision of market data and application of models.
The Program is comprised of various components designed to support the assessment and/or management of liquidity risk, including: (1) the periodic assessment (no less frequently than annually) of certain factors that influence a Fund’s liquidity risk; (2) the periodic classification (no less frequently than monthly) of a Fund’s investments into one of four liquidity categories that reflect an estimate of their liquidity under current market conditions; (3) a 15% limit on the acquisition of “illiquid investments” (as defined under Rule 22e-4); (4) for a Fund that does not invest primarily in “highly liquid investments” (as defined under Rule 22e-4), the determination of a minimum percentage of the Fund’s assets that will generally be invested in highly liquid investments (a “Highly Liquid Investment Minimum”); and (5) periodic reporting to the Board of Trustees.
At a meeting of the Board of Trustees on February 11-12, 2020, GSAM provided a written report to the Board addressing the operation, and the adequacy and effectiveness of the implementation, of the Program, including, as applicable, the operation of any Highly Liquid Investment Minimum and any material changes to the Program, for the initial period from December 1, 2018 through December 31, 2019 (the “Reporting Period”). Among other things, the annual report discussed: (1) the results of stress tests designed to assess liquidity under a hypothetical stressed scenario involving elevated redemptions; and (2) an assessment of the methodologies used to classify investments into one of four liquidity categories. The report concluded that the Program was reasonably designed to assess and manage liquidity risk and was adequately and effectively implemented during the Reporting Period.
There can be no assurance that the Program will achieve its objectives under all circumstances in the future. Please refer to your Fund’s prospectus for more information regarding the Fund’s exposure to liquidity risk and other risks to which it may be subject.
28
GOLDMAN SACHS MLP ENERGY INFRASTRUCTURE FUND
Fund Expenses — Six Month Period Ended May 31, 2020 (Unaudited) | ||
As a shareholder of Class A, Class C, Institutional, Investor, Class R6, Class R and Class P Shares of the Fund, you incur two types of costs: (1) transaction costs, including sales charges on purchase payments (with respect to Class A Shares), contingent deferred sales charges on redemptions (with respect to Class C Shares), and (2) ongoing costs, including management fees; distribution and service (12b-1) fees (with respect to Class A, Class C and Class R Shares); and other Fund expenses. This example is intended to help you understand your ongoing costs (in dollars) of investing in Class A, Class C, Institutional, Investor, Class R6, Class R and Class P Shares of the Fund and to compare these costs with the ongoing costs of investing in other mutual funds.
The example is based on an investment of $1,000 invested at the beginning of the period and held for the entire period from December 1, 2019 through May 31, 2020, which represents a period of 183 days in a 366 day year.
Actual Expenses — The first line under each share class in the table below provides information about actual account values and actual expenses. You may use the information in this line, together with the amount you invested, to estimate the expenses that you paid over the period. Simply divide your account value by $1,000 (for example, an $8,600 account value divided by $1,000=8.6), then multiply the result by the number in the first line under the heading entitled “Expenses Paid” to estimate the expenses you paid on your account during this period.
Hypothetical Example for Comparison Purposes — The second line under each share class in the table below provides information about hypothetical account values and hypothetical expenses based on the Funds’ actual net expense ratios and an assumed rate of return of 5% per year before expenses, which is not the Funds’ actual return. The hypothetical account values and expenses may not be used to estimate the actual ending account balance or expenses you paid for the period. You may use this information to compare the ongoing costs of investing in the Funds and other funds. To do so, compare this 5% hypothetical example with the 5% hypothetical examples that appear in the shareholder reports of the other funds.
Please note that the expenses shown in the table are meant to highlight your ongoing costs only and do not reflect any transactional costs, such as sales charges, redemption fees, or exchange fees. Therefore, the second line of the table is useful in comparing ongoing costs only, and will not help you determine the relative total costs of owning different funds. In addition, if these transactional costs were included, your costs would have been higher.
| MLP Energy Infrastructure Fund | ||||||||||||
| Share Class | Beginning Account Value 12/1/19 | Ending Account Value 5/31/20 | Expenses Paid for the 6 months ended 5/31/20* | |||||||||
| Class A | ||||||||||||
Actual | $ | 1,000.00 | $ | 725.50 | $ | 6.34 | ||||||
Hypothetical 5% return | 1,000.00 | 1,017.65 | + | 7.41 | ||||||||
| Class C | ||||||||||||
Actual | 1,000.00 | 722.40 | 9.52 | |||||||||
Hypothetical 5% return | 1,000.00 | 1,013.95 | + | 11.13 | ||||||||
| Institutional | ||||||||||||
Actual | 1,000.00 | 728.70 | 4.67 | |||||||||
Hypothetical 5% return | 1,000.00 | 1,019.60 | + | 5.45 | ||||||||
| Investor | ||||||||||||
Actual | 1,000.00 | 727.50 | 5.23 | |||||||||
Hypothetical 5% return | 1,000.00 | 1,018.95 | + | 6.11 | ||||||||
| Class R6 | ||||||||||||
Actual | 1,000.00 | 727.30 | 4.71 | |||||||||
Hypothetical 5% return | 1,000.00 | 1,019.55 | + | 5.50 | ||||||||
| Class R | ||||||||||||
Actual | 1,000.00 | 724.10 | 7.41 | |||||||||
Hypothetical 5% return | 1,000.00 | 1,016.40 | + | 8.67 | ||||||||
| Class P | ||||||||||||
Actual | 1,000.00 | 727.80 | 4.62 | |||||||||
Hypothetical 5% return | 1,000.00 | 1,019.65 | + | 5.40 | ||||||||
| + | Hypothetical expenses are based on the Fund’s actual annualized net expense ratio and an assumed rate of return of 5% per year before expenses. |
| * | Expenses for each share class are calculated using the Fund’s annualized net expense ratio for each class, which represents the ongoing expenses as a percentage of net assets for the six months ended May 31, 2020. Deferred tax benefit (expense) is not included in the ratio calculation. Expenses are calculated by multiplying the annualized net expense ratio by the average account value for the period; then multiplying the result by the number of days in the most recent fiscal half year; and then dividing that result by the number of days in the fiscal year. The annualized net expense ratios for the period were as follows: |
| Fund | Class A | Class C | Institutional | Investor | Class R6 | Class R | Class P | |||||||||||||||||||||
MLP Energy Infrastructure | 1.47 | % | 2.21 | % | 1.08 | % | 1.21 | % | 1.09 | % | 1.72 | % | 1.06 | % | ||||||||||||||
29
FUNDS PROFILE
Goldman Sachs Funds
Goldman Sachs is a premier financial services firm, known since 1869 for creating thoughtful and customized investment solutions in complex global markets.
Today, the Consumer and Investment Management Division of Goldman Sachs serves a diverse set of clients worldwide, including private institutions, public entities and individuals. With approximately $1.66 trillion in assets under supervision as of March 31, 2020, Goldman Sachs Asset Management (“GSAM”) has portfolio management teams located around the world and our investment professionals bring firsthand knowledge of local markets to every investment decision. Assets under supervision includes assets under management and other client assets for which Goldman Sachs does not have full discretion. GSAM leverages the resources of Goldman Sachs & Co. LLC subject to legal, internal and regulatory restrictions.
Money Market
Financial Square FundsSM
| ∎ | Financial Square Treasury Solutions Fund1 |
| ∎ | Financial Square Government Fund1 |
| ∎ | Financial Square Money Market Fund2 |
| ∎ | Financial Square Prime Obligations Fund2 |
| ∎ | Financial Square Treasury Instruments Fund1 |
| ∎ | Financial Square Treasury Obligations Fund1 |
| ∎ | Financial Square Federal Instruments Fund1 |
Investor FundsSM
| ∎ | Investor Money Market Fund3 |
| ∎ | Investor Tax-Exempt Money Market Fund3 |
Fixed Income
Short Duration and Government
| ∎ | Enhanced Income Fund |
| ∎ | High Quality Floating Rate Fund |
| ∎ | Short-Term Conservative Income Fund |
| ∎ | Short Duration Government Fund |
| ∎ | Short Duration Income Fund |
| ∎ | Government Income Fund |
| ∎ | Inflation Protected Securities Fund |
Multi-Sector
| ∎ | Bond Fund |
| ∎ | Core Fixed Income Fund |
| ∎ | Global Core Fixed Income Fund4 |
| ∎ | Strategic Income Fund |
| ∎ | Income Fund |
Municipal and Tax-Free
| ∎ | High Yield Municipal Fund |
| ∎ | Dynamic Municipal Income Fund |
| ∎ | Short Duration Tax-Free Fund |
| ∎ | Municipal Income Completion Fund |
Single Sector
| ∎ | Investment Grade Credit Fund |
| ∎ | U.S. Mortgages Fund |
| ∎ | High Yield Fund |
| ∎ | High Yield Floating Rate Fund |
| ∎ | Emerging Markets Debt Fund |
| ∎ | Local Emerging Markets Debt Fund |
Fixed Income Alternatives
| ∎ | Long Short Credit Strategies Fund |
Fundamental Equity
| ∎ | Equity Income Fund |
| ∎ | Small Cap Growth Fund |
| ∎ | Small Cap Value Fund |
| ∎ | Small/Mid Cap Value Fund |
| ∎ | Mid Cap Value Fund |
| ∎ | Large Cap Value Fund |
| ∎ | Focused Value Fund |
| ∎ | Capital Growth Fund |
| ∎ | Strategic Growth Fund |
| ∎ | Small/Mid Cap Growth Fund |
| ∎ | Flexible Cap Fund |
| ∎ | Concentrated Growth Fund |
| ∎ | Technology Opportunities Fund |
| ∎ | Growth Opportunities Fund |
| ∎ | Rising Dividend Growth Fund |
| ∎ | Blue Chip Fund |
| ∎ | Income Builder Fund |
Tax-Advantaged Equity
| ∎ | U.S. Tax-Managed Equity Fund |
| ∎ | International Tax-Managed Equity Fund |
| ∎ | U.S. Equity Dividend and Premium Fund |
| ∎ | International Equity Dividend and Premium Fund |
Equity Insights
| ∎ | Small Cap Equity Insights Fund |
| ∎ | U.S. Equity Insights Fund |
| ∎ | Small Cap Growth Insights Fund |
| ∎ | Large Cap Growth Insights Fund |
| ∎ | Large Cap Value Insights Fund |
| ∎ | Small Cap Value Insights Fund |
| ∎ | International Small Cap Insights Fund |
| ∎ | International Equity Insights Fund |
| ∎ | Emerging Markets Equity Insights Fund |
| ∎ | Clean Energy Income Fund |
Fundamental Equity International
| ∎ | International Equity Income Fund |
| ∎ | International Equity ESG Fund |
| ∎ | China Equity Fund5 |
| ∎ | Emerging Markets Equity Fund |
| ∎ | Imprint Emerging Markets Opportunities Fund6 |
| ∎ | ESG Emerging Markets Equity Fund |
Alternative
| ∎ | Real Estate Securities Fund |
| ∎ | International Real Estate Securities Fund |
| ∎ | Commodity Strategy Fund |
| ∎ | Global Real Estate Securities Fund |
| ∎ | Alternative Premia Fund |
| ∎ | Absolute Return Tracker Fund |
| ∎ | Managed Futures Strategy Fund |
| ∎ | MLP Energy Infrastructure Fund |
| ∎ | Energy Infrastructure Fund7 |
| ∎ | Multi-Manager Alternatives Fund |
| ∎ | Global Infrastructure Fund |
Total Portfolio Solutions
| ∎ | Global Managed Beta Fund |
| ∎ | Multi-Manager Non-Core Fixed Income Fund |
| ∎ | Multi-Manager U.S. Dynamic Equity Fund |
| ∎ | Multi-Manager Global Equity Fund |
| ∎ | Multi-Manager International Equity Fund |
| ∎ | Tactical Tilt Overlay Fund |
| ∎ | Balanced Strategy Portfolio |
| ∎ | Multi-Manager U.S. Small Cap Equity Fund |
| ∎ | Multi-Manager Real Assets Strategy Fund |
| ∎ | Growth and Income Strategy Portfolio |
| ∎ | Growth Strategy Portfolio |
| ∎ | Dynamic Global Equity Fund |
| ∎ | Satellite Strategies Portfolio |
| ∎ | Enhanced Dividend Global Equity Portfolio |
| ∎ | Tax-Advantaged Global Equity Portfolio |
| ∎ | Strategic Factor Allocation Fund |
| ∎ | Target Date Retirement Portfolio8 |
| ∎ | Target Date 2025 Portfolio |
| ∎ | Target Date 2030 Portfolio |
| ∎ | Target Date 2035 Portfolio |
| ∎ | Target Date 2040 Portfolio |
| ∎ | Target Date 2045 Portfolio |
| ∎ | Target Date 2050 Portfolio |
| ∎ | Target Date 2055 Portfolio |
| ∎ | Target Date 2060 Portfolio |
| ∎ | GQG Partners International Opportunities Fund |
| 1 | You could lose money by investing in the Fund. Although the Fund seeks to preserve the value of your investment at $1.00 per share, it cannot guarantee it will do so. An investment in the Fund is not a deposit of a bank and is not insured or guaranteed by the Federal Deposit Insurance Corporation or any other government agency. The Fund’s sponsor has no legal obligation to provide financial support to the Fund, and you should not expect that the sponsor will provide financial support to the Fund at any time. |
| 2 | You could lose money by investing in the Fund. Because the share price of the Fund will fluctuate, when you sell your shares they may be worth more or less than what you originally paid for them. The Fund may impose a fee upon sale of your shares or may temporarily suspend your ability to sell shares if the Fund’s liquidity falls below required minimums because of market conditions or other factors. An investment in the Fund is not a deposit of a bank and is not insured or guaranteed by the Federal Deposit Insurance Corporation or any other government agency. The Fund’s sponsor has no legal obligation to provide financial support to the Fund, and you should not expect that the sponsor will provide financial support to the Fund at any time. |
| 3 | You could lose money by investing in the Fund. Although the Fund seeks to preserve the value of your investment at $1.00 per share, it cannot guarantee it will do so. The Fund may impose a fee upon sale of your shares or may temporarily suspend your ability to sell shares if the Fund’s liquidity falls below required minimums because of market conditions or other factors. An investment in the Fund is not a deposit of a bank and is not insured or guaranteed by the Federal Deposit Insurance Corporation or any other government agency. The Fund’s sponsor has no legal obligation to provide financial support to the Fund, and you should not expect that the sponsor will provide financial support to the Fund at any time. |
| 4 | Effective after the close of business on April 30, 2020, the Goldman Sachs Global Income Fund was renamed the Goldman Sachs Global Core Fixed Income Fund. |
| 5Effective | after the close of business of November 20, 2019, the Goldman Sachs Asia Equity Fund was renamed the Goldman Sachs China Equity Fund. |
| 6Effective | after the close of business on August 30, 2019, the Goldman Sachs N-11 Equity Fund was renamed the Goldman Sachs Imprint Emerging Markets Opportunities Fund. |
| 7 | Effective after the close of business on June 26, 2020, the Goldman Sachs MLP & Energy Fund was renamed the Goldman Sachs Energy Infrastructure Fund. |
| 8Effective | December 27, 2019, the Goldman Sachs Target Date 2020 Portfolio was renamed the Goldman Sachs Target Date Retirement Portfolio. |
| Financial Square FundsSM and Investor FundsSM are registered service marks of Goldman Sachs & Co. LLC. |
| * | This list covers open-end funds only. Please visit our website at www.GSAMFUNDS.com to learn about our closed-end funds and exchange-traded funds. |
TRUSTEES Jessica Palmer, Chair Dwight L. Bush Kathryn A. Cassidy Diana M. Daniels Joaquin Delgado James A. McNamara Roy W. Templin Gregory G. Weaver | OFFICERS James A. McNamara, President Joseph F. DiMaria, Principal Financial Officer, Caroline L. Kraus, Secretary | |
GOLDMAN SACHS & CO. LLC Distributor and Transfer Agent | GOLDMAN SACHS ASSET MANAGEMENT, L.P. Investment Adviser | |
Visit our website at www.GSAMFUNDS.com to obtain the most recent month-end returns.
Goldman Sachs Asset Management, L.P., 200 West Street, New York, New York 10282
Goldman Sachs does not provide legal, tax or accounting advice, unless explicitly agreed between you and Goldman Sachs (generally through certain services offered only to clients of Private Wealth Management). Any statement contained in this presentation concerning U.S. tax matters is not intended or written to be used and cannot be used for the purpose of avoiding penalties imposed on the relevant taxpayer. Notwithstanding anything in this document to the contrary, and except as required to enable compliance with applicable securities law, you may disclose to any person the US federal and state income tax treatment and tax structure of the transaction and all materials of any kind (including tax opinions and other tax analyses) that are provided to you relating to such tax treatment and tax structure, without Goldman Sachs imposing any limitation of any kind. Investors should be aware that a determination of the tax consequences to them should take into account their specific circumstances and that the tax law is subject to change in the future or retroactively and investors are strongly urged to consult with their own tax advisor regarding any potential strategy, investment or transaction.
The reports concerning the Fund included in this shareholder report may contain certain forward-looking statements about the factors that may affect the performance of the Fund in the future. These statements are based on Fund management’s predictions and expectations concerning certain future events and their expected impact on the Fund, such as performance of the economy as a whole and of specific industry sectors, changes in the levels of interest rates, the impact of developing world events, and other factors that may influence the future performance of the Fund. Management believes these forward-looking statements to be reasonable, although they are inherently uncertain and difficult to predict. Actual events may cause adjustments in portfolio management strategies from those currently expected to be employed.
A description of the policies and procedures that the Fund uses to determine how to vote proxies relating to portfolio securities and information regarding how the Fund voted proxies relating to portfolio securities for the most recent 12-month period ended June 30, are available (I) without charge, upon request by calling 1-800-526-7384 (for Retail Shareholders) or 1-800-621-2550 (for Institutional Shareholders); and (II) on the Securities and Exchange Commission (“SEC’’) web site at http://www.sec.gov.
The Fund will file its portfolio holdings for each month in a fiscal quarter within 60 days after the end of the relevant fiscal quarter on Form N-PORT. Portfolio holdings information for the third month of each fiscal quarter will be made available on the SEC’s web site at http://www.sec.gov. Portfolio holdings information may be obtained upon request and without charge by calling 1-800-526-7384 (for Retail Shareholders) or 1-800-621-2550 (for Institutional Shareholders).
Fund holdings and allocations shown are as of May 31, 2020 and may not be representative of future investments. Fund holdings should not be relied on in making investment decisions and should not be construed as research or investment advice regarding particular securities. Current and future holdings are subject to risk.
Economic and market forecasts presented herein reflect our judgment as of the date of this presentation and are subject to change without notice. These forecasts do not take into account the specific investment objectives, restrictions, tax and financial situation or other needs of any specific client. Actual data will vary and may not be reflected here. These forecasts are subject to high levels of uncertainty that may affect actual performance. Accordingly, these forecasts should be viewed as merely representative of a broad range of possible outcomes. These forecasts are estimated, based on assumptions, and are subject to significant revision and may change materially as economic and market conditions change. Goldman Sachs has no obligation to provide updates or changes to these forecasts. Case studies and examples are for illustrative purposes only.
“Alerian MLP Index”, “Alerian MLP Total Return Index”, “AMZ” and “AMZX” are trademarks of Alerian and their use is granted under a license from Alerian.
The portfolio risk management process includes an effort to monitor and manage risk, but does not imply low risk.
This material is not authorized for distribution to prospective investors unless preceded or accompanied by a current Prospectus or summary prospectus, if applicable. Investors should consider the Fund’s objective, risks, and charges and expenses, and read the summary prospectus, if available, and/or the Prospectus carefully before investing or sending money. The summary prospectus, if available, and the Prospectus contain this and other information about the Fund and may be obtained from your authorized dealer or from Goldman Sachs & Co. LLC by calling (retail – 1-800-526-7384) (institutional – 1-800-621-2550).
© 2019 Goldman Sachs. All rights reserved. 209136-OTU-1231045 MLPEISAR-20
Goldman Sachs Funds

| Semi-Annual Report | May 31, 2020 | |||
Energy Infrastructure Fund* | ||||
It is our intention that beginning on January 1, 2021, paper copies of the Fund’s annual and semi-annual shareholder reports will no longer be sent by mail, unless you specifically request paper copies of the reports from the Fund or from your financial intermediary. Instead, the reports will be made available on a website, and you will be notified by mail each time a report is posted and provided with a website link to access the report.
If you already elected to receive shareholder reports electronically, you will not be affected by this change and you need not take any action. At any time, you may elect to receive reports and certain communications from the Fund electronically by calling the applicable toll-free number below or by contacting your financial intermediary.
You may elect to receive all future shareholder reports in paper free of charge. If you hold shares of the Fund directly with the Fund’s transfer agent, you can inform the transfer agent that you wish to receive paper copies of reports by calling toll-free 800-621-2550 for Institutional, Class R6 and Class P shareholders or 800-526-7384 for all other shareholders. If you hold shares of the Fund through a financial intermediary, please contact your financial intermediary to make this election. Your election to receive reports in paper will apply to all Goldman Sachs Funds held in your account if you invest through your financial intermediary or all Goldman Sachs Funds held with the Fund’s transfer agent if you invest directly with the transfer agent.
| * | Effective after the close of business on June 26, 2020, the Goldman Sachs MLP & Energy Fund was renamed the Goldman Sachs Energy Infrastructure Fund. |

Goldman Sachs Energy Infrastructure Fund
| 1 | ||||
| 3 | ||||
| 5 | ||||
| 6 | ||||
| 9 | ||||
| 16 | ||||
| 27 | ||||
| NOT FDIC-INSURED | May Lose Value | No Bank Guarantee | ||
Goldman Sachs Energy Infrastructure Fund
Recent Market Events related to COVID-19
An outbreak of a novel strain of coronavirus (COVID-19) has emerged globally. The outbreak of COVID-19 has prompted a number of measures to limit the spread, including travel and border restrictions, quarantines, curfews and restrictions on large gatherings. In turn, these resulted in lower consumer activity, diminished demand for a wide range of products and services, and disruption in manufacturing and supply chains. While governments have already taken unprecedented action to limit disruption to the financial system, global financial markets have experienced and may continue to experience significant volatility resulting from the spread of and subsequent intervening measures intended to limit the spread of COVID-19. The Fund could be negatively impacted if the value of a portfolio holding were harmed by such political or economic conditions, events, or actions. The full extent of the impact of COVID-19 on the Fund’s performance cannot be determined at this time and will depend on future developments, including the duration and the continued spread of the outbreak. Goldman Sachs Asset Management’s long-term commitment to you, our Fund shareholders, remains unchanged. We encourage you to maintain perspective and stay current with timely commentary and investment insights by visiting gsam.com.
1
Goldman Sachs Energy Infrastructure Fund
At a Meeting on April 14-15, 2020, the Board of Trustees of the Goldman Sachs Trust (the “Board”) approved changes to the Goldman Sachs MLP & Energy Fund’s (the “Fund”) name and principal investment strategy. The Fund’s current investment objective, to seek total return through current income and capital appreciation, will not change. After the close of business on June 26, 2020 (the “Effective Date”), the Fund’s name changed to the “Goldman Sachs Energy Infrastructure Fund.” Additionally, after the Effective Date, the Fund will invest, under normal circumstances, at least 80% of its net assets plus borrowings for investment purposes (measured at the time of purchase) in U.S. and non-U.S. equity or fixed income securities issued by energy infrastructure companies, including master limited partnerships (“MLPs”) and “C” corporations (“C-Corps”). The Fund’s investments in MLPs will not exceed 25% of its total assets as measured at the time of purchase. The Fund’s benchmark and portfolio managers will not change.
2
Goldman Sachs Energy Infrastructure Fund
as of May 31, 2020
| PERFORMANCE REVIEW |
| |||||||||
| December 1, 2019–May 31, 2020 | Fund Total Return (based on NAV)1 | Alerian Midstream Energy Select Index2 | ||||||||
| Class A | (16.90) | % | (22.16) | % | ||||||
| Class C | (17.25) | (22.16) | ||||||||
| Institutional | (16.76) | (22.16) | ||||||||
| Investor | (16.88) | (22.16) | ||||||||
| Class R6 | (16.88) | (22.16) | ||||||||
| Class R | (17.11) | (22.16) | ||||||||
| Class P | (16.78) | (22.16) | ||||||||
| 1 | The net asset value (“NAV”) represents the net assets of the class of the Fund (ex-dividend) divided by the total number of shares of the class outstanding. The Fund’s performance assumes the reinvestment of dividends and other distributions. The Fund’s performance does not reflect the deduction of any applicable sales charges. |
| 2 | The Alerian Midstream Energy Select Index is a composite of North American energy infrastructure companies. The capped, float-adjusted, capitalization-weighted index, whose constituents are engaged in midstream activities involving energy commodities, is disseminated real-time on a price-return basis (AMEI) and on a total-return basis (AMEIX). It is not possible to invest directly in an index. |
The returns set forth in the tables above represent past performance. Past performance does not guarantee future results. The Fund’s investment return and principal value will fluctuate so that an investor’s shares, when redeemed, may be worth more or less than their original cost. Current performance may be lower or higher than the performance quoted above. Please visit our web site at www.GSAMFUNDS.com to obtain the most recent month-end returns. Performance reflects applicable fee waivers and/or expense limitations in effect during the periods shown. In their absence, performance would be reduced. Returns do not reflect the deduction of taxes that a shareholder would pay on Fund distributions or the redemption of Fund shares.
3
GOLDMAN SACHS ENERGY INFRASTRUCTURE FUND
| TOP TEN HOLDINGS AS OF 5/31/20‡ | ||||||||
| Holding | % of Net Assets | Line of Business | ||||||
| The Williams Cos., Inc. | 8.7 | % | Gathering + Processing | |||||
| Enbridge, Inc. | 8.4 | Pipeline Transportation | Petroleum | ||||||
| Enterprise Products Partners LP | 8.4 | Pipeline Transportation | Natural Gas | ||||||
| TC Energy Corp. | 8.1 | Pipeline Transportation | Natural Gas | ||||||
| Kinder Morgan, Inc. | 7.0 | Pipeline Transportation | Natural Gas | ||||||
| Cheniere Energy, Inc. | 5.1 | Other | Liquefaction | ||||||
| Plains GP Holdings LP Class A | 4.8 | Pipeline Transportation | Petroleum | ||||||
| Targa Resources Corp. | 4.8 | Gathering + Processing | ||||||
| Pembina Pipeline Corp. | 4.7 | Pipeline Transportation | Petroleum | ||||||
| Magellan Midstream Partners LP | 4.3 | Pipeline Transportation | Petroleum | ||||||
| ‡ | The top 10 holdings may not be representative of the Fund’s future investments. |
| FUND SECTOR ALLOCATIONS† |
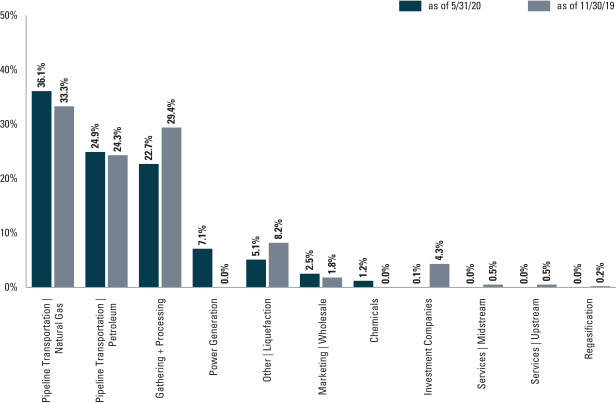
| † | The Fund is actively managed and, as such, its composition may differ over time. Consequently, the Fund’s overall sector allocations may differ from the percentages contained in the graph above. The percentage shown for each investment category reflects the value of investments in that category as a percentage of total net assets. The figures in the graph may not sum to 100% due to exclusion of other assets and liabilities. |
| For more information about the Fund, please refer to www.GSAMFUNDS.com. There, you can learn more about the Fund’s investment strategies, holdings, and performance. |
4
GOLDMAN SACHS ENERGY INFRASTRUCTURE FUND
May 31, 2020 (Unaudited)
| Shares | Description | Value | ||||||
| Common Stocks – 99.6% | ||||||||
| Chemicals – 1.2% | ||||||||
| 32,128 | Ameren Corp. | $ | 2,400,926 | |||||
|
| |||||||
| Gathering + Processing – 22.7% | ||||||||
| 428,692 | Antero Midstream Corp. | 2,049,148 | ||||||
| 437,685 | MPLX LP | 8,311,638 | ||||||
| 232,396 | ONEOK, Inc. | 8,526,609 | ||||||
| 546,239 | Targa Resources Corp. | 9,772,216 | ||||||
| 868,107 | The Williams Cos., Inc. | 17,735,426 | ||||||
|
| |||||||
| 46,395,037 | ||||||||
|
| |||||||
| Marketing | Wholesale – 2.5% | ||||||||
| 295,947 | Gibson Energy, Inc. | 4,578,328 | ||||||
| 60,176 | Global Partners LP | 613,795 | ||||||
|
| |||||||
| 5,192,123 | ||||||||
|
| |||||||
| Other | Liquefaction* – 5.1% | ||||||||
| 236,873 | Cheniere Energy, Inc. | 10,505,318 | ||||||
|
| |||||||
| Pipeline Transportation | Natural Gas – 36.1% | ||||||||
| 1,051,384 | Energy Transfer LP | 8,579,293 | ||||||
| 894,675 | Enterprise Products Partners LP | 17,088,292 | ||||||
| 640,144 | Equitrans Midstream Corp. | 5,178,765 | ||||||
| 430,759 | Inter Pipeline Ltd. | 3,945,144 | ||||||
| 485,886 | Keyera Corp. | 7,700,209 | ||||||
| 907,738 | Kinder Morgan, Inc. | 14,342,260 | ||||||
| 365,440 | TC Energy Corp. | 16,469,152 | ||||||
| 14,597 | TC PipeLines LP | 513,085 | ||||||
|
| |||||||
| 73,816,200 | ||||||||
|
| |||||||
| Pipeline Transportation | Petroleum – 24.9% | ||||||||
| 123,998 | BP Midstream Partners LP | 1,551,215 | ||||||
| 527,354 | Enbridge, Inc. | 17,151,405 | ||||||
| 97,558 | Holly Energy Partners LP | 1,576,537 | ||||||
| 192,985 | Magellan Midstream Partners LP | 8,749,940 | ||||||
| 385,554 | Pembina Pipeline Corp. | 9,632,900 | ||||||
| 33,763 | Phillips 66 Partners LP | 1,508,531 | ||||||
| 988,006 | Plains GP Holdings LP Class A* | 9,870,180 | ||||||
| 61,770 | Shell Midstream Partners LP | 833,277 | ||||||
|
| |||||||
| 50,873,985 | ||||||||
|
| |||||||
| Power Generation – 7.1% | ||||||||
| 28,326 | Dominion Energy, Inc. | 2,407,993 | ||||||
| 52,628 | Emera, Inc. | 2,092,353 | ||||||
| 28,261 | Eversource Energy | 2,365,446 | ||||||
| 19,830 | NextEra Energy Partners LP | 1,013,511 | ||||||
| 17,285 | NextEra Energy, Inc. | 4,417,355 | ||||||
| 18,126 | Sempra Energy | 2,289,495 | ||||||
|
| |||||||
| 14,586,153 | ||||||||
|
| |||||||
| TOTAL COMMON STOCKS | ||||||||
| (Cost $163,145,346) | $ | 203,769,742 | ||||||
|
| |||||||
| Shares | Dividend Rate | Value | ||||||
| Investment Company(a) – 0.1% | ||||||||
| | Goldman Sachs Financial Square Government Fund - | | ||||||
| 93,911 | 0.151% | $ | 93,911 | |||||
| (Cost $93,911) | ||||||||
|
| |||||||
| TOTAL INVESTMENTS – 99.7% | $ | 203,863,653 | ||||||
| (Cost $163,239,257) | ||||||||
|
| |||||||
| | OTHER ASSETS IN EXCESS OF LIABILITIES – 0.3% | 712,282 | ||||||
|
| |||||||
| NET ASSETS – 100.0% | $ | 204,575,935 | ||||||
|
| |||||||
| The percentage shown for each investment category reflects the value of investments in that category as a percentage of net assets. | ||
* | Non-income producing security. | |
(a) | Represents an affiliated fund. | |
| ||
Investment Abbreviations: | ||
GP | —General Partnership | |
LP | —Limited Partnership | |
| ||
| The accompanying notes are an integral part of these financial statements. | 5 |
GOLDMAN SACHS ENERGY INFRASTRUCTURE FUND
Statement of Assets and Liabilities
May 31, 2020 (Unaudited)
| ||||||
| Assets: |
| |||||
Investments of unaffiliated issuers, at value (cost $163,145,346) | $ | 203,769,742 | ||||
Investments of affiliated issuers, at value (cost $93,911) | 93,911 | |||||
Cash | 1,019,197 | |||||
Foreign currencies, at value (cost $294,113) | 294,989 | |||||
Receivables: | ||||||
Fund shares sold | 4,583,577 | |||||
Investments sold | 455,362 | |||||
Dividends | 357,025 | |||||
Reimbursement from investment adviser | 26,109 | |||||
Other assets | 48,471 | |||||
| Total assets | 210,648,383 | |||||
| Liabilities: | ||||||
Payables: | ||||||
Investments purchased | 5,782,487 | |||||
Management fees | 154,271 | |||||
Distribution and Service fees and Transfer Agency fees | 4,849 | |||||
Accrued expenses | 130,841 | |||||
| Total liabilities | 6,072,448 | |||||
| Net Assets: | ||||||
Paid-in capital | 200,527,891 | |||||
Total distributable earnings | 4,048,044 | |||||
| NET ASSETS | $ | 204,575,935 | ||||
Net Assets: | ||||||
Class A | $ | 55,807 | ||||
Class C | 167,066 | |||||
Institutional | 2,307,950 | |||||
Investor | 38,971 | |||||
Class R6 | 57,399,493 | |||||
Class R | 44,468 | |||||
Class P | 144,562,180 | |||||
Total Net Assets | $ | 204,575,935 | ||||
Shares Outstanding $0.001 par value (unlimited number of shares authorized): | ||||||
Class A | 7,816 | |||||
Class C | 23,483 | |||||
Institutional | 322,486 | |||||
Investor | 5,449 | |||||
Class R6 | 8,026,061 | |||||
Class R | 6,234 | |||||
Class P | 20,209,678 | |||||
Net asset value, offering and redemption price per share:(a) | ||||||
Class A | $7.14 | |||||
Class C | 7.11 | |||||
Institutional | 7.16 | |||||
Investor | 7.15 | |||||
Class R6 | 7.15 | |||||
Class R | 7.13 | |||||
Class P | 7.15 | |||||
| (a) | Maximum public offering price per share for Class A Shares is $7.56. At redemption, Class C Shares may be subject to a contingent deferred sales charge, assessed on the amount equal to the lesser of the current net asset value or the original purchase price of the shares. |
| 6 | The accompanying notes are an integral part of these financial statements. |
GOLDMAN SACHS ENERGY INFRASTRUCTURE FUND
Statement of Operations
For the Six Months Ended May 31, 2020 (Unaudited)
| ||||||
| Investment income: |
| |||||
Dividends — unaffiliated issuers (net of foreign withholding taxes of $175,971) | $ | 2,022,290 | ||||
Dividends — affiliated issuers | 11,805 | |||||
| Total investment income | 2,034,095 | |||||
| Expenses: | ||||||
Management fees | 600,992 | |||||
Professional fees | 70,498 | |||||
Registration fees | 55,933 | |||||
Custody, accounting and administrative services | 45,915 | |||||
Printing and mailing costs | 18,883 | |||||
Transfer Agency fees(a) | 18,362 | |||||
Trustee fees | 8,933 | |||||
Distribution and Service fees(a) | 1,027 | |||||
Other | 4,491 | |||||
| Total expenses | 825,034 | |||||
Less — expense reductions | (168,237 | ) | ||||
| Net expenses | 656,797 | |||||
| NET INVESTMENT INCOME | 1,377,298 | |||||
| Realized and unrealized gain (loss): |
| |||||
Net realized gain (loss) from: | ||||||
Investments — unaffiliated issuers | (36,258,806 | ) | ||||
Foreign currency transactions | 45,299 | |||||
Net change in unrealized gain on: | ||||||
Investments — unaffiliated issuers | 39,503,138 | |||||
Foreign currency translation | 7,739 | |||||
| Net realized and unrealized gain | 3,297,370 | |||||
| NET INCREASE IN NET ASSETS RESULTING FROM OPERATIONS | $ | 4,674,668 | ||||
| (a) | Class specific Distribution and/or Service and Transfer Agency fees were as follows: |
| Distribution and/or Service Fees | Transfer Agency Fees | |||||||||||||||||||||||||||||||||||||
Class A | Class C | Class R | Class A | Class C | Institutional | Investor | Class R6 | Class R | Class P | |||||||||||||||||||||||||||||
| $ | 66 | $ | 852 | $ | 109 | $ | 45 | $ | 145 | $ | 468 | $ | 35 | $ | 2,834 | $ | 37 | $ | 14,798 | |||||||||||||||||||
| The accompanying notes are an integral part of these financial statements. | 7 |
GOLDMAN SACHS ENERGY INFRASTRUCTURE FUND
Statements of Changes in Net Assets
For the Six Months Ended May 31, 2020 (Unaudited) | For the Fiscal Year Ended November 30, 2019 | |||||||||
| From operations: | ||||||||||
Net investment income | $ | 1,377,298 | $ | 931,598 | ||||||
Net realized loss | (36,213,507 | ) | (466,134 | ) | ||||||
Net change in unrealized gain | 39,510,877 | 1,297,993 | ||||||||
| Net increase in net assets resulting from operations | 4,674,668 | 1,763,457 | ||||||||
| Distributions to shareholders: | ||||||||||
From distributable earnings: | ||||||||||
Class A Shares | (315 | ) | (1,399 | ) | ||||||
Class C Shares | (886 | ) | (2,166 | ) | ||||||
Institutional Shares | (14,948 | ) | (71,875 | ) | ||||||
Investor Shares | (269 | ) | (1,258 | ) | ||||||
Class R6 Shares | (270 | ) | (1,304 | ) | ||||||
Class R Shares | (282 | ) | (1,161 | ) | ||||||
Class P Shares | (450,132 | ) | (1,574,896 | ) | ||||||
From return of capital: | ||||||||||
Class A Shares | — | (922 | ) | |||||||
Class C Shares | — | (1,428 | ) | |||||||
Institutional Shares | — | (47,362 | ) | |||||||
Investor Shares | — | (829 | ) | |||||||
Class R6 Shares | — | (860 | ) | |||||||
Class R Shares | — | (765 | ) | |||||||
Class P Shares | — | (1,037,780 | ) | |||||||
| Total distributions to shareholders | (467,102 | ) | (2,744,005 | ) | ||||||
| From share transactions: | ||||||||||
Proceeds from sales of shares | 237,159,966 | 76,258,028 | ||||||||
Reinvestment of distributions | 467,102 | 2,744,005 | ||||||||
Cost of shares redeemed | (105,186,336 | ) | (15,624,549 | ) | ||||||
| Net increase in net assets resulting from share transactions | 132,440,732 | 63,377,484 | ||||||||
| TOTAL INCREASE | 136,648,298 | 62,396,936 | ||||||||
| Net assets: | ||||||||||
Beginning of period | 67,927,637 | 5,530,701 | ||||||||
End of period | $ | 204,575,935 | $ | 67,927,637 | ||||||
| 8 | The accompanying notes are an integral part of these financial statements. |
GOLDMAN SACHS ENERGY INFRASTRUCTURE FUND
Selected Share Data for a Share Outstanding Throughout Each Period
| Goldman Sachs Energy Infrastructure Fund | ||||||||||||||||||
| Class A Shares | ||||||||||||||||||
| Six Months Ended May 31, 2020 (Unaudited) | Year Ended November 30, | Period Ended November 30, 2017(a) | ||||||||||||||||
| 2019 | 2018 | |||||||||||||||||
| Per Share Data | ||||||||||||||||||
Net asset value, beginning of period | $ | 8.64 | $ | 9.26 | $ | 9.54 | $ | 10.00 | ||||||||||
Net investment income(b) | 0.07 | 0.12 | 0.11 | 0.01 | ||||||||||||||
Net realized and unrealized loss | (1.52 | )(c) | (0.36 | )(c) | (0.12 | ) | (0.40 | ) | ||||||||||
Total from investment operations | (1.45 | ) | (0.24 | ) | (0.01 | ) | (0.39 | ) | ||||||||||
Distributions to shareholders from net investment income | — | (0.23 | ) | (0.11 | ) | (0.03 | ) | |||||||||||
Distributions to shareholders from net realized gains | (0.05 | ) | — | — | — | |||||||||||||
Distributions to shareholders from return of capital | — | (0.15 | ) | (0.16 | ) | (0.04 | ) | |||||||||||
Total distributions | (0.05 | ) | (0.38 | ) | (0.27 | ) | (0.07 | ) | ||||||||||
Net asset value, end of period | $ | 7.14 | $ | 8.64 | $ | 9.26 | $ | 9.54 | ||||||||||
| Total return(d) | (16.90 | )% | (2.82 | )% | (0.21 | )% | (3.93 | )% | ||||||||||
Net assets, end of period (in 000s) | $ | 56 | $ | 55 | $ | 48 | $ | 48 | ||||||||||
Ratio of net expenses to average net assets | 1.48 | %(e) | 1.50 | % | 1.49 | % | 1.49 | %(e) | ||||||||||
Ratio of total expenses to average net assets | 1.78 | %(e) | 2.47 | % | 15.71 | %(f) | 20.57 | %(e) | ||||||||||
Ratio of net investment income to average net assets | 1.74 | %(e) | 1.24 | % | 1.14 | % | 0.64 | %(e) | ||||||||||
Portfolio turnover rate(g) | 101 | % | 59 | % | 67 | % | 11 | % | ||||||||||
| (a) | Commenced operations on September 29, 2017. |
| (b) | Calculated based on the average shares outstanding methodology. |
| (c) | Calculation of the net gain (loss) per share (both realized and unrealized) does not correlate to the aggregate realized and unrealized gain (loss) presented in the Statement of Operations due to the timing of subscriptions and redemptions of Fund shares in relation to fluctuations in the market value of the portfolio. |
| (d) | Assumes investment at the NAV at the beginning of the period, reinvestment of all dividends and distributions, a complete redemption of the investment at the NAV at the end of the period and no sales or redemption charges (if any). Total returns would be reduced if a sales or redemption charge was taken into account. Returns do not reflect the impact of taxes to shareholders relating to Fund distributions or the redemption of Fund shares. Total returns for periods less than one full year are not annualized. |
| (e) | Annualized. |
| (f) | The amount reflects certain expense reallocations between the classes due to the timing of sales and redemptions of Fund class shares. |
| (g) | The Fund’s portfolio turnover rate is calculated in accordance with regulatory requirements, without regard to transactions involving short term investments. If such transactions were included, the Fund’s portfolio turnover rate may be higher. |
| The accompanying notes are an integral part of these financial statements. | 9 |
GOLDMAN SACHS ENERGY INFRASTRUCTURE FUND
Financial Highlights (continued)
Selected Share Data for a Share Outstanding Throughout Each Period
| Goldman Sachs Energy Infrastructure Fund | ||||||||||||||||||
| Class C Shares | ||||||||||||||||||
Six Months Ended (Unaudited) | Year Ended November 30, | Period Ended November 30, 2017(a) | ||||||||||||||||
| 2019 | 2018 | |||||||||||||||||
| Per Share Data |
| |||||||||||||||||
Net asset value, beginning of period | $ | 8.64 | $ | 9.26 | $ | 9.54 | $ | 10.00 | ||||||||||
Net investment income(b) | 0.04 | 0.08 | 0.04 | — | (c) | |||||||||||||
Net realized and unrealized loss | (1.52 | )(d) | (0.39 | )(d) | (0.12 | ) | (0.41 | ) | ||||||||||
Total from investment operations | (1.48 | ) | (0.31 | ) | (0.08 | ) | (0.41 | ) | ||||||||||
Distributions to shareholders from net investment income | — | (0.19 | ) | (0.08 | ) | (0.02 | ) | |||||||||||
Distributions to shareholders from net realized gains | (0.05 | ) | — | — | — | |||||||||||||
Distributions to shareholders from return of capital | — | (0.12 | ) | (0.12 | ) | (0.03 | ) | |||||||||||
Total distributions | (0.05 | ) | (0.31 | ) | (0.20 | ) | (0.05 | ) | ||||||||||
Net asset value, end of period | $ | 7.11 | $ | 8.64 | $ | 9.26 | $ | 9.54 | ||||||||||
| Total return(e) | (17.25 | )% | (3.63 | )% | (0.86 | )% | (4.04 | )% | ||||||||||
Net assets, end of period (in 000s) | $ | 167 | $ | 154 | $ | 48 | $ | 48 | ||||||||||
Ratio of net expenses to average net assets | 2.23 | %(f) | 2.25 | % | 2.24 | % | 2.24 | %(f) | ||||||||||
Ratio of total expenses to average net assets | 2.53 | %(f) | 3.17 | % | 16.47 | %(g) | 21.32 | %(f) | ||||||||||
Ratio of net investment income (loss) to average net assets | 1.00 | %(f) | 0.89 | % | 0.39 | % | (0.11 | )%(f) | ||||||||||
Portfolio turnover rate(h) | 101 | % | 59 | % | 67 | % | 11 | % | ||||||||||
| (a) | Commenced operations on September 29, 2017. |
| (b) | Calculated based on the average shares outstanding methodology. |
| (c) | Amount is less than $0.005 per share. |
| (d) | Calculation of the net gain (loss) per share (both realized and unrealized) does not correlate to the aggregate realized and unrealized gain (loss) presented in the Statement of Operations due to the timing of subscriptions and redemptions of Fund shares in relation to fluctuations in the market value of the portfolio. |
| (e) | Assumes investment at the NAV at the beginning of the period, reinvestment of all dividends and distributions, a complete redemption of the investment at the NAV at the end of the period and no sales or redemption charges (if any). Total returns would be reduced if a sales or redemption charge was taken into account. Returns do not reflect the impact of taxes to shareholders relating to Fund distributions or the redemption of Fund shares. Total returns for periods less than one full year are not annualized. |
| (f) | Annualized. |
| (g) | The amount reflects certain expense reallocations between the classes due to the timing of sales and redemptions of Fund class shares. |
| (h) | The Fund’s portfolio turnover rate is calculated in accordance with regulatory requirements, without regard to transactions involving short term investments. If such transactions were included, the Fund’s portfolio turnover rate may be higher. |
| 10 | The accompanying notes are an integral part of these financial statements. |
GOLDMAN SACHS ENERGY INFRASTRUCTURE FUND
Financial Highlights (continued)
Selected Share Data for a Share Outstanding Throughout Each Period
| Goldman Sachs Energy Infrastructure Fund | ||||||||||||||||||
| Institutional Shares | ||||||||||||||||||
Six Months Ended (Unaudited) | Year Ended November 30, | Period Ended November 30, 2017(a) | ||||||||||||||||
| 2019 | 2018 | |||||||||||||||||
| Per Share Data |
| |||||||||||||||||
Net asset value, beginning of period | $ | 8.65 | $ | 9.26 | $ | 9.54 | $ | 10.00 | ||||||||||
Net investment income(b) | 0.08 | 0.15 | 0.15 | 0.02 | ||||||||||||||
Net realized and unrealized loss | (1.52 | )(c) | (0.35 | )(c) | (0.12 | ) | (0.41 | ) | ||||||||||
Total from investment operations | (1.44 | ) | (0.20 | ) | 0.03 | (0.39 | ) | |||||||||||
Distributions to shareholders from net investment income | — | (0.25 | ) | (0.12 | ) | (0.03 | ) | |||||||||||
Distributions to shareholders from net realized gains | (0.05 | ) | — | — | — | |||||||||||||
Distributions to shareholders from return of capital | — | (0.16 | ) | (0.19 | ) | (0.04 | ) | |||||||||||
Total distributions | (0.05 | ) | (0.41 | ) | (0.31 | ) | (0.07 | ) | ||||||||||
Net asset value, end of period | $ | 7.16 | $ | 8.65 | $ | 9.26 | $ | 9.54 | ||||||||||
| Total return(d) | (16.76 | )% | (2.36 | )% | 0.18 | % | (3.87 | )% | ||||||||||
Net assets, end of period (in 000s) | $ | 2,308 | $ | 2,606 | $ | 2,650 | $ | 2,644 | ||||||||||
Ratio of net expenses to average net assets | 1.10 | %(e) | 1.11 | % | 1.10 | % | 1.10 | %(e) | ||||||||||
Ratio of total expenses to average net assets | 1.41 | %(e) | 2.09 | % | 15.32 | %(f) | 20.18 | %(e) | ||||||||||
Ratio of net investment income to average net assets | 2.08 | %(e) | 1.62 | % | 1.53 | % | 1.03 | %(e) | ||||||||||
Portfolio turnover rate(g) | 101 | % | 59 | % | 67 | % | 11 | % | ||||||||||
| (a) | Commenced operations on September 29, 2017. |
| (b) | Calculated based on the average shares outstanding methodology. |
| (c) | Calculation of the net gain (loss) per share (both realized and unrealized) does not correlate to the aggregate realized and unrealized gain (loss) presented in the Statement of Operations due to the timing of subscriptions and redemptions of Fund shares in relation to fluctuations in the market value of the portfolio. |
| (d) | Assumes investment at the NAV at the beginning of the period, reinvestment of all dividends and distributions, a complete redemption of the investment at the NAV at the end of the period and no sales or redemption charges (if any). Total returns would be reduced if a sales or redemption charge was taken into account. Returns do not reflect the impact of taxes to shareholders relating to Fund distributions or the redemption of Fund shares. Total returns for periods less than one full year are not annualized. |
| (e) | Annualized. |
| (f) | The amount reflects certain expense reallocations between the classes due to the timing of sales and redemptions of Fund class shares. |
| (g) | The Fund’s portfolio turnover rate is calculated in accordance with regulatory requirements, without regard to transactions involving short term investments. If such transactions were included, the Fund’s portfolio turnover rate may be higher. |
| The accompanying notes are an integral part of these financial statements. | 11 |
GOLDMAN SACHS ENERGY INFRASTRUCTURE FUND
Financial Highlights (continued)
Selected Share Data for a Share Outstanding Throughout Each Period
| Goldman Sachs Energy Infrastructure Fund | ||||||||||||||||||
| Investor Shares | ||||||||||||||||||
| Six Months Ended May 31, 2020 (Unaudited) | Year Ended November 30, | Period Ended November 30, 2017(a) | ||||||||||||||||
| 2019 | 2018 | |||||||||||||||||
| Per Share Data |
| |||||||||||||||||
Net asset value, beginning of period | $ | 8.65 | $ | 9.26 | $ | 9.54 | $ | 10.00 | ||||||||||
Net investment income(b) | 0.07 | 0.14 | 0.14 | 0.01 | ||||||||||||||
Net realized and unrealized loss | (1.52 | )(c) | (0.35 | )(c) | (0.13 | ) | (0.40 | ) | ||||||||||
Total from investment operations | (1.45 | ) | (0.21 | ) | 0.01 | (0.39 | ) | |||||||||||
Distributions to shareholders from net investment income | — | (0.24 | ) | (0.11 | ) | (0.03 | ) | |||||||||||
Distributions to shareholders from net realized gains | (0.05 | ) | — | — | — | |||||||||||||
Distributions to shareholders from return of capital | — | (0.16 | ) | (0.18 | ) | (0.04 | ) | |||||||||||
Total distributions | (0.05 | ) | (0.40 | ) | (0.29 | ) | (0.07 | ) | ||||||||||
Net asset value, end of period | $ | 7.15 | $ | 8.65 | $ | 9.26 | $ | 9.54 | ||||||||||
| Total return(d) | (16.88 | )% | (2.50 | )% | 0.04 | % | (3.90 | )% | ||||||||||
Net assets, end of period (in 000s) | $ | 39 | $ | 47 | $ | 48 | $ | 48 | ||||||||||
Ratio of net expenses to average net assets | 1.23 | %(e) | 1.25 | % | 1.24 | % | 1.24 | %(e) | ||||||||||
Ratio of total expenses to average net assets | 1.54 | %(e) | 2.23 | % | 15.46 | %(f) | 20.32 | %(e) | ||||||||||
Ratio of net investment income to average net assets | 1.94 | %(e) | 1.49 | % | 1.39 | % | 0.89 | %(e) | ||||||||||
Portfolio turnover rate(g) | 101 | % | 59 | % | 67 | % | 11 | % | ||||||||||
| (a) | Commenced operations on September 29, 2017. |
| (b) | Calculated based on the average shares outstanding methodology. |
| (c) | Calculation of the net gain (loss) per share (both realized and unrealized) does not correlate to the aggregate realized and unrealized gain (loss) presented in the Statement of Operations due to the timing of subscriptions and redemptions of Fund shares in relation to fluctuations in the market value of the portfolio. |
| (d) | Assumes investment at the NAV at the beginning of the period, reinvestment of all dividends and distributions, a complete redemption of the investment at the NAV at the end of the period and no sales or redemption charges (if any). Total returns would be reduced if a sales or redemption charge was taken into account. Returns do not reflect the impact of taxes to shareholders relating to Fund distributions or the redemption of Fund shares. Total returns for periods less than one full year are not annualized. |
| (e) | Annualized. |
| (f) | The amount reflects certain expense reallocations between the classes due to the timing of sales and redemptions of Fund class shares. |
| (g) | The Fund’s portfolio turnover rate is calculated in accordance with regulatory requirements, without regard to transactions involving short term investments. If such transactions were included, the Fund’s portfolio turnover rate may be higher. |
| 12 | The accompanying notes are an integral part of these financial statements. |
GOLDMAN SACHS ENERGY INFRASTRUCTURE FUND
Financial Highlights (continued)
Selected Share Data for a Share Outstanding Throughout Each Period
| Goldman Sachs Energy Infrastructure Fund | ||||||||||||||||||
| Class R6 Shares | ||||||||||||||||||
Six Months Ended (Unaudited) | Year Ended November 30, | Period Ended | ||||||||||||||||
| 2019 | 2018 | |||||||||||||||||
| Per Share Data |
| |||||||||||||||||
Net asset value, beginning of period | $ | 8.65 | $ | 9.26 | $ | 9.54 | $ | 10.00 | ||||||||||
Net investment income(b) | 0.08 | 0.16 | 0.15 | 0.02 | ||||||||||||||
Net realized and unrealized loss | (1.53 | )(c) | (0.36 | )(c) | (0.12 | ) | (0.41 | ) | ||||||||||
Total from investment operations | (1.45 | ) | (0.20 | ) | 0.03 | (0.39 | ) | |||||||||||
Distributions to shareholders from net investment income | — | (0.25 | ) | (0.12 | ) | (0.03 | ) | |||||||||||
Distributions to shareholders from net realized gains | (0.05 | ) | — | — | — | |||||||||||||
Distributions to shareholders from return of capital | — | (0.16 | ) | (0.19 | ) | (0.04 | ) | |||||||||||
Total distributions | (0.05 | ) | (0.41 | ) | (0.31 | ) | (0.07 | ) | ||||||||||
Net asset value, end of period | $ | 7.15 | $ | 8.65 | $ | 9.26 | $ | 9.54 | ||||||||||
| Total return(d) | (16.88 | )% | (2.35 | )% | 0.19 | % | (3.87 | )% | ||||||||||
Net assets, end of period (in 000s) | $ | 57,399 | $ | 47 | $ | 48 | $ | 48 | ||||||||||
Ratio of net expenses to average net assets | 1.09 | %(e) | 1.10 | % | 1.09 | % | 1.09 | %(e) | ||||||||||
Ratio of total expenses to average net assets | 1.31 | %(e) | 2.08 | % | 15.31 | %(f) | 20.17 | %(e) | ||||||||||
Ratio of net investment income to average net assets | 2.56 | %(e) | 1.64 | % | 1.54 | % | 1.04 | %(e) | ||||||||||
Portfolio turnover rate(g) | 101 | % | 59 | % | 67 | % | 11 | % | ||||||||||
| (a) | Commenced operations on September 29, 2017. |
| (b) | Calculated based on the average shares outstanding methodology. |
| (c) | Calculation of the net gain (loss) per share (both realized and unrealized) does not correlate to the aggregate realized and unrealized gain (loss) presented in the Statement of Operations due to the timing of subscriptions and redemptions of Fund shares in relation to fluctuations in the market value of the portfolio. |
| (d) | Assumes investment at the NAV at the beginning of the period, reinvestment of all dividends and distributions, a complete redemption of the investment at the NAV at the end of the period and no sales or redemption charges (if any). Total returns would be reduced if a sales or redemption charge was taken into account. Returns do not reflect the impact of taxes to shareholders relating to Fund distributions or the redemption of Fund shares. Total returns for periods less than one full year are not annualized. |
| (e) | Annualized. |
| (f) | The amount reflects certain expense reallocations between the classes due to the timing of sales and redemptions of Fund class shares. |
| (g) | The Fund’s portfolio turnover rate is calculated in accordance with regulatory requirements, without regard to transactions involving short term investments. If such transactions were included, the Fund’s portfolio turnover rate may be higher. |
| The accompanying notes are an integral part of these financial statements. | 13 |
GOLDMAN SACHS ENERGY INFRASTRUCTURE FUND
Financial Highlights (continued)
Selected Share Data for a Share Outstanding Throughout Each Period
| Goldman Sachs Energy Infrastructure Fund | ||||||||||||||||||
| Class R Shares | ||||||||||||||||||
| Six Months Ended May 31, 2020 (Unaudited) | Year Ended November 30, | Period Ended November 30, 2017(a) | ||||||||||||||||
| 2019 | 2018 | |||||||||||||||||
| Per Share Data |
| |||||||||||||||||
Net asset value, beginning of period | $ | 8.65 | $ | 9.26 | $ | 9.54 | $ | 10.00 | ||||||||||
Net investment income(b) | 0.05 | 0.09 | 0.09 | 0.01 | ||||||||||||||
Net realized and unrealized loss | (1.52 | )(c) | (0.35 | )(c) | (0.12 | ) | (0.41 | ) | ||||||||||
Total from investment operations | (1.47 | ) | (0.26 | ) | (0.03 | ) | (0.40 | ) | ||||||||||
Distributions to shareholders from net investment income | — | (0.21 | ) | (0.10 | ) | (0.02 | ) | |||||||||||
Distributions to shareholders from net realized gains | (0.05 | ) | — | — | — | |||||||||||||
Distributions to shareholders from return of capital | — | (0.14 | ) | (0.15 | ) | (0.04 | ) | |||||||||||
Total distributions | (0.05 | ) | (0.35 | ) | (0.25 | ) | (0.06 | ) | ||||||||||
Net asset value, end of period | $ | 7.13 | $ | 8.65 | $ | 9.26 | $ | 9.54 | ||||||||||
| Total return(d) | (17.11 | )% | (2.98 | )% | (0.46 | )% | (3.97 | )% | ||||||||||
Net assets, end of period (in 000s) | $ | 44 | $ | 49 | $ | 49 | $ | 48 | ||||||||||
Ratio of net expenses to average net assets | 1.73 | %(e) | 1.75 | % | 1.74 | % | 1.74 | %(e) | ||||||||||
Ratio of total expenses to average net assets | 2.04 | %(e) | 2.73 | % | 15.94 | %(f) | 20.82 | %(e) | ||||||||||
Ratio of net investment income to average net assets | 1.44 | %(e) | 0.99 | % | 0.89 | % | 0.39 | %(e) | ||||||||||
Portfolio turnover rate(g) | 101 | % | 59 | % | 67 | % | 11 | % | ||||||||||
| (a) | Commenced operations on September 29, 2017. |
| (b) | Calculated based on the average shares outstanding methodology. |
| (c) | Calculation of the net gain (loss) per share (both realized and unrealized) does not correlate to the aggregate realized and unrealized gain (loss) presented in the Statement of Operations due to the timing of subscriptions and redemptions of Fund shares in relation to fluctuations in the market value of the portfolio. |
| (d) | Assumes investment at the NAV at the beginning of the period, reinvestment of all dividends and distributions, a complete redemption of the investment at the NAV at the end of the period and no sales or redemption charges (if any). Total returns would be reduced if a sales or redemption charge was taken into account. Returns do not reflect the impact of taxes to shareholders relating to Fund distributions or the redemption of Fund shares. Total returns for periods less than one full year are not annualized. |
| (e) | Annualized. |
| (f) | The amount reflects certain expense reallocations between the classes due to the timing of sales and redemptions of Fund class shares. |
| (g) | The Fund’s portfolio turnover rate is calculated in accordance with regulatory requirements, without regard to transactions involving short term investments. If such transactions were included, the Fund’s portfolio turnover rate may be higher. |
| 14 | The accompanying notes are an integral part of these financial statements. |
GOLDMAN SACHS ENERGY INFRASTRUCTURE FUND
Financial Highlights (continued)
Selected Share Data for a Share Outstanding Throughout Each Period
| Goldman Sachs Energy Infrastructure Fund | ||||||||||||||||||
| Class P Shares | ||||||||||||||||||
Six Months Ended May 31, 2020
| Year Ended November 30, 2019 | Period Ended November 30, 2018(a) | ||||||||||||||||
| Per Share Data | ||||||||||||||||||
Net asset value, beginning of period | $ | 8.64 | $ | 9.26 | $ | 9.52 | ||||||||||||
Net investment income(b) | 0.08 | 0.17 | 0.14 | |||||||||||||||
Net realized and unrealized gain (loss) | (1.52 | )(c) | (0.38 | )(c) | (0.09 | ) | ||||||||||||
Total from investment operations | (1.44 | ) | (0.21 | ) | 0.05 | |||||||||||||
Distributions to shareholders from net investment income | — | (0.25 | ) | (0.12 | ) | |||||||||||||
Distributions to shareholders from net realized gains | (0.05 | ) | — | — | ||||||||||||||
Distributions to shareholders from return of capital | — | (0.16 | ) | (0.19 | ) | |||||||||||||
Total distributions | (0.05 | ) | (0.41 | ) | (0.31 | ) | ||||||||||||
Net asset value, end of period | $ | 7.15 | $ | 8.64 | $ | 9.26 | ||||||||||||
| Total return(d) | (16.78 | )% | (2.46 | )% | 0.42 | % | ||||||||||||
Net assets, end of period (in 000s) | $ | 144,562 | $ | 64,970 | $ | 2,640 | ||||||||||||
Ratio of net expenses to average net assets | 1.09 | %(e) | 1.10 | % | 1.09 | %(e) | ||||||||||||
Ratio of total expenses to average net assets | 1.38 | %(e) | 1.92 | % | 4.04 | %(e)(f) | ||||||||||||
Ratio of net investment income to average net assets | 2.25 | %(e) | 1.78 | % | 2.37 | %(e) | ||||||||||||
Portfolio turnover rate(g) | 101 | % | 59 | % | 67 | % | ||||||||||||
| (a) | Commenced operations on April 16, 2018. |
| (b) | Calculated based on the average shares outstanding methodology. |
| (c) | Calculation of the net gain (loss) per share (both realized and unrealized) does not correlate to the aggregate realized and unrealized gain (loss) presented in the Statement of Operations due to the timing of subscriptions and redemptions of Fund shares in relation to fluctuations in the market value of the portfolio. |
| (d) | Assumes investment at the NAV at the beginning of the period, reinvestment of all dividends and distributions, a complete redemption of the investment at the NAV at the end of the period and no sales or redemption charges (if any). Total returns would be reduced if a sales or redemption charge was taken into account. Returns do not reflect the impact of taxes to shareholders relating to Fund distributions or the redemption of Fund shares. Total returns for periods less than one full year are not annualized. |
| (e) | Annualized. |
| (f) | The amount reflects certain expense reallocations between the classes due to the timing of sales and redemptions of Fund class shares. |
| (g) | The Fund’s portfolio turnover rate is calculated in accordance with regulatory requirements, without regard to transactions involving short term investments. If such transactions were included, the Fund’s portfolio turnover rate may be higher. |
| The accompanying notes are an integral part of these financial statements. | 15 |
GOLDMAN SACHS ENERGY INFRASTRUCTURE FUND
May 31, 2020 (Unaudited)
| 1. ORGANIZATION |
Goldman Sachs Trust (the “Trust”) is a Delaware statutory trust registered under the Investment Company Act of 1940, as amended (the “Act”), as an open-end management investment company. The Trust includes the Goldman Sachs Energy Infrastructure Fund (the “Fund”). The Fund is a non-diversified portfolio under the Act offering seven classes of shares — Class A, Class C, Institutional, Investor, Class R6, Class R and Class P Shares.
Class A Shares are sold with a front end sales charge of up to 5.50%. Class C Shares are sold with a contingent deferred sales charge (“CDSC”) of 1.00%, which is imposed on redemptions made within 12 months of purchase. Institutional, Investor, Class R6, Class R and Class P Shares are not subject to a sales charge.
Goldman Sachs Asset Management, L.P. (“GSAM”), an affiliate of Goldman Sachs & Co. LLC (“Goldman Sachs”), serves as investment adviser to the Fund pursuant to a management agreement (the “Agreement”) with the Trust.
| 2. SIGNIFICANT ACCOUNTING POLICIES |
The financial statements have been prepared in accordance with accounting principles generally accepted in the United States of America (“GAAP”) and require management to make estimates and assumptions that may affect the reported amounts and disclosures. Actual results may differ from those estimates and assumptions. The Fund is an investment company under GAAP and follows the accounting and reporting guidance applicable to investment companies.
A. Investment Valuation — The Fund’s valuation policy is to value investments at fair value.
B. Investment Income and Investments — Investment income includes interest income, dividend income, and securities lending income, if any. Interest income is accrued daily and adjusted for amortization of premiums and accretion of discounts. Dividend income is recognized on ex-dividend date or, for certain foreign securities, as soon as such information is obtained subsequent to the ex-dividend date. Non-cash dividends, if any, are recorded at fair market value of the securities received. Investment transactions are reflected on trade date. Realized gains and losses are calculated using identified cost. Investment transactions are recorded on the following business day for daily net asset value (“NAV”) calculations. Investment income is recorded net of any foreign withholding taxes, less any amounts reclaimable. The Fund may file withholding tax reclaims in certain jurisdictions to recover a portion of amounts previously withheld. Any foreign capital gains tax is accrued daily based upon net unrealized gains, and is payable upon sale of such investments. Distributions from master limited partnerships (“MLPs”) are generally recorded based on the characterization reported on the MLP’s tax return. The Fund records its pro-rata share of the income/loss and capital gains/losses, allocated from the underlying partnerships and adjusts the cost basis of the underlying partnerships accordingly.
C. Class Allocations and Expenses — Investment income, realized and unrealized gain (loss), if any, and non-class specific expenses of the Fund are allocated daily based upon the proportion of net assets of each class. Non-class specific expenses directly incurred by the Fund are charged to the Fund, while such expenses incurred by the Trust are allocated across the Fund on a straight-line and/or pro-rata basis depending upon the nature of the expenses. Class specific expenses, where applicable, are borne by the respective share classes and include Distribution and Service, Transfer Agency and Service fees.
D. Federal Taxes and Distributions to Shareholders — It is the Fund’s policy to comply with the requirements of the Internal Revenue Code of 1986, as amended (the “Code”), applicable to regulated investment companies and to distribute each year substantially all of its investment company taxable income and capital gains to its shareholders. Accordingly, the Fund is not required to make any provisions for the payment of federal income tax. Distributions to shareholders are recorded on the ex-dividend date. Investment income distributions, if any, are declared and paid at least semi-annually. Capital gains distributions, if any, are declared and paid annually.
Net capital losses, if any, are carried forward to future fiscal years and may be used to the extent allowed by the Code to offset any future capital gains. Losses that are carried forward will retain their character as either short-term or long-term capital losses. Utilization of capital loss carryforwards will reduce the requirement of future capital gains distributions.
16
GOLDMAN SACHS ENERGY INFRASTRUCTURE FUND
| 2. SIGNIFICANT ACCOUNTING POLICIES (continued) |
The characterization of distributions to shareholders for financial reporting purposes is determined in accordance with federal income tax rules, which may differ from GAAP. The source of the Fund’s distributions may be shown in the accompanying financial statements as either from distributable earnings or capital. Certain components of the Fund’s net assets on the Statement of Assets and Liabilities reflect permanent GAAP/tax differences based on the appropriate tax character.
E. Foreign Currency Translation — The accounting records and reporting currency of the Fund are maintained in U.S. dollars. Assets and liabilities denominated in foreign currencies are translated into U.S. dollars using the current exchange rates at the close of each business day. The effect of changes in foreign currency exchange rates on investments is included within net realized and unrealized gain (loss) on investments. Changes in the value of other assets and liabilities as a result of fluctuations in foreign exchange rates are included in the Statement of Operations within net change in unrealized gain (loss) on foreign currency translation. Transactions denominated in foreign currencies are translated into U.S. dollars on the date the transaction occurred, the effects of which are included within net realized gain (loss) on foreign currency transactions.
| 3. INVESTMENTS AND FAIR VALUE MEASUREMENTS |
U.S. GAAP defines the fair value of a financial instrument as the amount that would be received to sell an asset or paid to transfer a liability in an orderly transaction between market participants at the measurement date (i.e., the exit price); the Fund’s policy is to use the market approach. GAAP establishes a fair value hierarchy that prioritizes the inputs to valuation techniques used to measure fair value. The hierarchy gives the highest priority to unadjusted quoted prices in active markets for identical assets or liabilities (Level 1 measurements) and the lowest priority to unobservable inputs (Level 3 measurements). The levels used for classifying investments are not necessarily an indication of the risk associated with investing in these investments. The three levels of the fair value hierarchy are described below:
Level 1 — Unadjusted quoted prices in active markets that are accessible at the measurement date for identical, unrestricted assets or liabilities;
Level 2 — Quoted prices in markets that are not active or financial instruments for which significant inputs are observable (including, but not limited to, quoted prices for similar investments, interest rates, foreign exchange rates, volatility and credit spreads), either directly or indirectly;
Level 3 — Prices or valuations that require significant unobservable inputs (including GSAM’s assumptions in determining fair value measurement).
The Board of Trustees (“Trustees”) has approved Valuation Procedures that govern the valuation of the portfolio investments held by the Fund, including investments for which market quotations are not readily available. The Trustees have delegated to GSAM day-to-day responsibility for implementing and maintaining internal controls and procedures related to the valuation of the Fund’s investments. To assess the continuing appropriateness of pricing sources and methodologies, GSAM regularly performs price verification procedures and issues challenges as necessary to third party pricing vendors or brokers, and any differences are reviewed in accordance with the Valuation Procedures.
A. Level 1 and Level 2 Fair Value Investments — The valuation techniques and significant inputs used in determining the fair values for investments classified as Level 1 and Level 2 are as follows:
Equity Securities — Equity securities traded on a United States (“U.S.”) securities exchange or the NASDAQ system, or those located on certain foreign exchanges, including but not limited to the Americas, are valued daily at their last sale price or official closing price on the principal exchange or system on which they are traded. If there is no sale or official closing price or such price is believed by GSAM to not represent fair value, equity securities may be valued at the closing bid price for long positions and at the closing ask price for short positions. To the extent these investments are actively traded, they are classified as Level 1 of the fair value hierarchy, otherwise they are generally classified as Level 2. Certain equity securities containing unique attributes may be classified as Level 2.
17
GOLDMAN SACHS ENERGY INFRASTRUCTURE FUND
Notes to Financial Statements (continued)
May 31, 2020 (Unaudited)
| 3. INVESTMENTS AND FAIR VALUE MEASUREMENTS (continued) |
Unlisted equity securities for which market quotations are available are valued at the last sale price on the valuation date, or if no sale occurs, at the last bid price for long positions or the last ask price for short positions, and are generally classified as Level 2. Securities traded on certain foreign securities exchanges are valued daily at fair value determined by an independent fair value service (if available) under Valuation Procedures approved by the Trustees and consistent with applicable regulatory guidance. The independent fair value service takes into account multiple factors including, but not limited to, movements in the securities markets, certain depositary receipts, futures contracts and foreign currency exchange rates that have occurred subsequent to the close of the foreign securities exchange. These investments are generally classified as Level 2 of the fair value hierarchy.
Underlying Funds (including Money Market Funds) — Underlying Funds (“Underlying Funds”) include other investment companies. Investments in the Underlying Funds are valued at the NAV per share on the day of valuation. Because the Fund invests in Underlying Funds that fluctuate in value, the Fund’s shares will correspondingly fluctuate in value. To the extent these investments are actively traded, they are classified as Level 1 of the fair value hierarchy, otherwise they are generally classified as Level 2. For information regarding an Underlying Fund’s accounting policies and investment holdings, please see the Underlying Fund’s shareholder report.
B. Level 3 Fair Value Investments — To the extent that significant inputs to valuation models and other alternative pricing sources are unobservable, or if quotations are not readily available, or if GSAM believes that such quotations do not accurately reflect fair value, the fair value of the Fund’s investments may be determined under Valuation Procedures approved by the Trustees. GSAM, consistent with its procedures and applicable regulatory guidance, may make an adjustment to the most recent valuation prices of either domestic or foreign securities in light of significant events to reflect what it believes to be the fair value of the securities at the time of determining the Fund’s NAV. To the extent investments are valued using single source broker quotations obtained directly from the broker or passed through from third party pricing vendors, such investments are classified as Level 3 investments.
C. Fair Value Hierarchy — The following is a summary of the Fund’s investments classified in the fair value hierarchy as of May 31, 2020:
| ENERGY INFRASTRUCTURE |
| |||||||||||
| Investment Type | Level 1 | Level 2 | Level 3 | |||||||||
| Assets | ||||||||||||
Common Stock and/or Other Equity Investments(a) | ||||||||||||
North America | $ | 203,769,742 | $ | — | $ | — | ||||||
Investment Company | 93,911 | — | — | |||||||||
| Total | $ | 203,863,653 | $ | — | $ | — | ||||||
| (a) | Amounts are disclosed by continent to highlight the impact of time zone differences between local market close and the calculation of net asset value. Security valuations are based on the principal exchange or system on which they are traded, which may differ from country of domicile. |
For further information regarding security characteristics, see the Schedule of Investments.
18
GOLDMAN SACHS ENERGY INFRASTRUCTURE FUND
| 4. AGREEMENTS AND AFFILIATED TRANSACTIONS |
A. Management Agreement — Under the Agreement, GSAM manages the Fund, subject to the general supervision of the Trustees.
As compensation for the services rendered pursuant to the Agreement, the assumption of the expenses related thereto and administration of the Fund’s business affairs, including providing facilities, GSAM is entitled to a management fee, accrued daily and paid monthly, equal to an annual percentage rate of the Fund’s average daily net assets.
For the six months ended May 31, 2020, contractual and effective net management fees with GSAM were at the following rates:
| Contractual Management Rate | ||||||||||||||||||||||
| First $1 billion | Next $1 billion | Next $3 billion | Next $3 billion | Over $8 billion | Effective Net Management Rate^ | |||||||||||||||||
| 1.00% | 0.90% | 0.86% | 0.84% | 0.82% | 1.00% | |||||||||||||||||
| ^ | Effective Net Management Rate includes impact of management fee waivers of underlying funds, if any. |
The Fund invests in Institutional Shares of the Goldman Sachs Financial Square Government Fund, which is an affiliated Underlying Fund. GSAM has agreed to waive a portion of its management fee payable by the Fund in an amount equal to the management fee it earns as an investment adviser to the affiliated Underlying Fund in which the Fund invests. For the six months ended May 31, 2020, GSAM waived $2,046 of the Fund’s management fee.
B. Distribution and/or Service (12b-1) Plans — The Trust, on behalf of Class A and Class R Shares of the Fund, has adopted Distribution and Service Plans subject to Rule 12b-1 under the Act. Under the Distribution and Service Plans, Goldman Sachs, which serves as distributor (the “Distributor”), is entitled to a fee accrued daily and paid monthly for distribution services and personal and account maintenance services, which may then be paid by Goldman Sachs to authorized dealers. These fees are equal to an annual percentage rate of the average daily net assets attributable to Class A or Class R Shares of the Fund, as set forth below.
The Trust, on behalf of Class C Shares of the Fund, has adopted a Distribution Plan subject to Rule 12b-1 under the Act. Under the Distribution Plan, Goldman Sachs as Distributor is entitled to a fee accrued daily and paid monthly for distribution services, which may then be paid by Goldman Sachs to authorized dealers. These fees are equal to an annual percentage rate of the average daily net assets attributable to Class C Shares of the Fund, as set forth below.
| Distribution and/or Service Plan Rates | ||||||||||||
| Class A* | Class C | Class R* | ||||||||||
Distribution Plan and/or Service Plan | 0.25 | % | 0.75 | % | 0.50 | % | ||||||
| * | With respect to Class A and Class R Shares, the Distributor at its discretion may use compensation for distribution services paid under the Distribution and Service Plans to compensate service organizations for personal and account maintenance services and expenses as long as such total compensation does not exceed the maximum cap on “service fees” imposed by the Financial Industry Regulatory Authority. |
C. Distribution Agreement — Goldman Sachs, as Distributor of the shares of the Fund pursuant to a Distribution Agreement, may retain a portion of the Class A Shares’ front end sales charge and Class C Shares’ CDSC. For the six months ended May 31, 2020, Goldman Sachs did not retain any portion of the sales charges or CDSC for the Fund.
D. Service Plan — The Trust, on behalf of the Fund, has adopted a Service Plan to allow Class C Shares to compensate service organizations (including Goldman Sachs) for providing varying levels of personal and account maintenance services to their customers who are beneficial owners of such shares. The Service Plan provides for compensation to the service organizations equal to an annual percentage rate of 0.25% of the average daily net assets attributable to Class C Shares of the Fund.
19
GOLDMAN SACHS ENERGY INFRASTRUCTURE FUND
Notes to Financial Statements (continued)
May 31, 2020 (Unaudited)
| 4. AGREEMENTS AND AFFILIATED TRANSACTIONS (continued) |
E. Transfer Agency Agreement — Goldman Sachs also serves as the transfer agent of the Fund for a fee pursuant to the Transfer Agency Agreement. The fees charged for such transfer agency services are accrued daily and paid monthly at annual rates as follows: 0.17% of the average daily net assets of Class A, Class C, Investor and Class R Shares; 0.03% of the average daily net assets of Class R6 and Class P Shares; and 0.04% of the average daily net assets of Institutional Shares.
F. Other Expense Agreements and Affiliated Transactions — GSAM has agreed to reduce or limit certain “Other Expenses” of the Fund (excluding acquired fund fees and expenses, transfer agency fees and expenses, service fees and shareholder administration fees (as applicable), taxes, interest, brokerage fees, expenses of shareholder meetings, litigation and indemnification, and extraordinary expenses) to the extent such expenses exceed, on an annual basis, a percentage rate of the average daily net assets of the Fund. Such Other Expense reimbursements, if any, are accrued daily and paid monthly. In addition, the Fund is not obligated to reimburse GSAM for prior fiscal year expense reimbursements, if any. The Other Expense limitation as an annual percentage rate of average daily net assets for the Fund is 0.064%. These Other Expense limitations will remain in place through at least March 27, 2021, and prior to such date GSAM may not terminate the arrangements without the approval of the Trustees. In addition, the Fund has entered into certain offset arrangements with the transfer agent, which may result in a reduction of the Fund’s expenses and are received irrespective of the application of the “Other Expense” limitations described above. Such Other Expense reimbursements, if any, are accrued daily and paid monthly and are disclosed in the Statement of Operations for the six months ended May 31, 2020.
For the six months ended May 31, 2020, these expense reductions, including any fee waivers and Other Expense reimbursements, were as follows:
| Management Fee Waiver | Other Expense Reimbursements | Total Expense Reductions | ||||||||
| $ | 2,046 | $ | 166,191 | $ | 168,237 | |||||
G. Line of Credit Facility — As of May 31, 2020, the Fund participated in a $700,000,000 committed, unsecured revolving line of credit facility (the “facility”) together with other funds of the Trust and certain registered investment companies having management agreements with GSAM or its affiliates. This facility is to be used for temporary emergency purposes, or to allow for an orderly liquidation of securities to meet redemption requests. The interest rate on borrowings is based on the federal funds rate. The facility also requires a fee to be paid by the Fund based on the amount of the commitment that has not been utilized. For the six months ended May 31, 2020, the Fund did not have any borrowings under the facility. Prior to April 28, 2020, the facility was $580,000,000.
H. Other Transactions with Affiliates — For the six months ended May 31, 2020, Goldman Sachs earned $14,404 brokerage commissions from portfolio transactions on behalf of the Fund.
The table below shows the transactions in and earnings from investments in the Goldman Sachs Financial Square Government Fund for the six months ended May 31, 2020:
| Underlying Fund | Beginning value as of November 30, 2019 | Purchases at Cost | Proceeds from Sales | Ending value as of May 31, 2020 | Shares as of May 31, 2020 | Dividend Income | ||||||||||||||||||
Goldman Sachs Financial Square Government Fund — Institutional Shares | $ | 342,982 | $ | 119,281,393 | $ | (119,530,464 | ) | $ | 93,911 | 93,911 | $ | 11,805 | ||||||||||||
20
GOLDMAN SACHS ENERGY INFRASTRUCTURE FUND
| 5. PORTFOLIO SECURITIES TRANSACTIONS |
The cost of purchases and proceeds from sales and maturities of long-term securities for the six months ended May 31, 2020, were $257,787,739 and $124,196,450, respectively.
| 6. TAX INFORMATION |
As of May 31, 2020, the Fund’s aggregate security unrealized gains and losses based on cost for U.S. federal income tax purposes were as follows:
Tax Cost | $ | 164,519,937 | ||
Gross unrealized gain | 40,461,362 | |||
Gross unrealized loss | (1,117,646 | ) | ||
Net unrealized security gain (loss) | $ | 39,343,716 |
The difference between GAAP-basis and tax basis unrealized gains (losses) is attributable primarily to wash sales, differences in the tax treatment of underlying fund investments and partnership investments.
GSAM has reviewed the Fund’s tax positions for all open tax years (the current and prior three years, as applicable) and has concluded that no provision for income tax is required in the Fund’s financial statements. Such open tax years remain subject to examination and adjustment by tax authorities.
| 7. OTHER RISKS |
The Fund’s risks include, but are not limited to, the following:
Geographic and Sector Risk — The Fund focuses its investments in the energy sector, and will therefore be susceptible to adverse economic, environmental, business, regulatory or other occurrences affecting that sector. The energy sector has historically experienced substantial price volatility. MLPs and other companies operating in the energy sector are subject to specific risks, including, among others, fluctuations in commodity prices; reduced consumer demand for commodities such as oil, natural gas or petroleum products; reduced availability of natural gas or other commodities for transporting, processing, storing or delivering; slowdowns in new construction; extreme weather or other natural disasters; and threats of attack by terrorists on energy assets. Additionally, changes in the regulatory environment for energy companies may adversely impact their profitability. Over time, depletion of natural gas reserves and other energy reserves may also affect the profitability of energy companies.
Investments in Other Investment Companies Risk — As a shareholder of another investment company, the Fund will indirectly bear its proportionate share of any net management fees and other expenses paid by such other investment companies, in addition to the fees and expenses regularly borne by the Fund.
Large Shareholder Transactions Risk — The Fund may experience adverse effects when certain large shareholders, such as other funds, institutional investors (including those trading by use of non-discretionary mathematical formulas), financial intermediaries (who may make investment decisions on behalf of underlying clients and/or include the Fund in their investment model), individuals, accounts and Goldman Sachs affiliates, purchase or redeem large amounts of shares of the Fund. Such large shareholder redemptions, which may occur rapidly or unexpectedly, may cause the Fund to sell portfolio securities at times when it would not otherwise do so, which may negatively impact the Fund’s NAV and liquidity. These transactions may also accelerate the realization of taxable income to shareholders if such sales of investments resulted in gains, and may also increase transaction costs. In addition, a large redemption could result in the Fund’s current expenses being allocated over a smaller asset base, leading to an increase in the Fund’s expense ratio. Similarly, large Fund share purchases may adversely affect the Fund’s performance to the
extent that the Fund is delayed in investing new cash or otherwise maintains a larger cash position than it ordinarily would.
21
GOLDMAN SACHS ENERGY INFRASTRUCTURE FUND
Notes to Financial Statements (continued)
May 31, 2020 (Unaudited)
| 7. OTHER RISKS (continued) |
Liquidity Risk — The Fund may make investments that are illiquid or that may become less liquid in response to market developments or adverse investor perceptions. Illiquid investments may be more difficult to value. Liquidity risk may also refer to the risk that the Fund will not be able to pay redemption proceeds within the allowable time period or without significant dilution to remaining investors’ interests because of unusual market conditions, an unusually high volume of redemption requests, or other reasons. To meet redemption requests, the Fund may be forced to sell investments at an unfavorable time and/or under unfavorable conditions. If the Fund is forced to sell securities at an unfavorable time and/or under unfavorable conditions, such sales may adversely affect the Fund’s NAV and dilute remaining investors’ interests. Redemptions by large shareholders may have a negative impact on the Fund’s liquidity.
Market and Credit Risks — In the normal course of business, the Fund trades financial instruments and enters into financial transactions where risk of potential loss exists due to changes in the market (market risk). The value of the securities in which the Fund invests may go up or down in response to the prospects of individual companies, particular sectors or governments and/or general economic conditions throughout the world due to increasingly interconnected global economies and financial markets. Events such as war, acts of terrorism, social unrest, natural disasters, the spread of infectious illness or other public health threats could also significantly impact the Fund and its investments. Additionally, the Fund may also be exposed to credit risk in the event that an issuer or guarantor fails to perform or that an institution or entity with which the Fund has unsettled or open transactions defaults.
Master Limited Partnership Risk — Investments in securities of MLPs involve risks that differ from investments in common stocks, including risks related to limited control and limited rights to vote on matters affecting the MLP, risks related to potential conflicts of interest between the MLP and the MLP’s general partner, cash flow risks, dilution risks, limited liquidity and risks related to the general partner’s right to require unit-holders to sell their common units at an undesirable time or price.
Non-Diversification Risk — The Fund is non-diversified, meaning that it is permitted to invest a larger percentage of its assets in fewer issuers than diversified mutual funds. Thus, the Fund may be more susceptible to adverse developments affecting any single issuer held in its portfolio, and may be more susceptible to greater losses because of these developments.
Tax Risks — Tax risks associated with investments in the Fund include but are not limited to the following:
MLP Tax Risk. MLPs are generally treated as partnerships for U.S. federal income tax purposes. Partnerships do not pay U.S. federal income tax at the partnership level. Rather, each partner is allocated a share of the partnership’s income, gains, losses, deductions and expenses. A change in current tax law or a change in the underlying business mix of a given MLP could result in an MLP being treated as a corporation for U.S. federal income tax purposes, which would result in the MLP being required to pay U.S. federal income tax (as well as state and local income taxes) on its taxable income. This would have the effect of reducing the amount of cash available for distribution by the MLP and could result in a reduction in the value of the Fund’s investment in the MLP and lower income to the Fund.
To the extent a distribution received by the Fund from an MLP is treated as a return of capital, the Fund’s adjusted tax basis in the interests of the MLP will be reduced, which may increase the Fund’s tax liability upon the sale of the interests in the MLP or upon subsequent distributions in respect of such interests.
| 8. INDEMNIFICATIONS |
Under the Trust’s organizational documents, its Trustees, officers, employees and agents are indemnified, to the extent permitted by the Act and state law, against certain liabilities that may arise out of performance of their duties to the Fund. Additionally, in the course of business, the Fund enters into contracts that contain a variety of indemnification clauses. The Fund’s maximum exposure under these arrangements is unknown, as this would involve future claims that may be made against the Fund that have not yet occurred. However, GSAM believes the risk of loss under these arrangements to be remote.
22
GOLDMAN SACHS ENERGY INFRASTRUCTURE FUND
| 9. SUBSEQUENT EVENTS |
Effective after the close of business on June 26, 2020 (the “Effective Date”), the Fund’s name changed to the “Goldman Sachs Energy Infrastructure Fund.” Additionally, after the Effective Date, the Fund will invest, under normal circumstances, at least 80% of its net assets plus borrowings for investment purposes (measured at the time of purchase) in U.S. and non-U.S. equity or fixed income securities issued by energy infrastructure companies, including MLPs and “C” corporations (“C-Corps”). The Fund’s investments in MLPs will not exceed 25% of its total assets as measured at the time of purchase.
Other than noted above, subsequent events after the Statement of Assets and Liabilities date have been evaluated, and GSAM has concluded that there is no impact requiring adjustment or disclosure in the financial statements.
| 10. SUMMARY OF SHARE TRANSACTIONS |
Share activity is as follows:
| Goldman Sachs Energy Infrastructure Fund | ||||||||||||||||
|
| |||||||||||||||
| For the Six Months Ended May 31, 2020 (Unaudited) | For the Fiscal Year Ended November 30, 2019 | |||||||||||||||
|
| |||||||||||||||
| Shares | Dollars | Shares | Dollars | |||||||||||||
|
| |||||||||||||||
| Class A Shares |
| |||||||||||||||
Shares sold | 1,436 | $ | 9,976 | 927 | $ | 9,158 | ||||||||||
Reinvestment of distributions | 35 | 315 | 253 | 2,321 | ||||||||||||
Shares redeemed | — | — | (11 | ) | (104 | ) | ||||||||||
| 1,471 | 10,291 | 1,169 | 11,375 | |||||||||||||
| Class C Shares |
| |||||||||||||||
Shares sold | 5,520 | 51,500 | 12,328 | 125,000 | ||||||||||||
Reinvestment of distributions | 100 | 886 | 404 | 3,594 | ||||||||||||
| 5,620 | 52,386 | 12,732 | 128,594 | |||||||||||||
| Institutional Shares |
| |||||||||||||||
Shares sold | 20,671 | 110,023 | 2,390 | 21,407 | ||||||||||||
Reinvestment of distributions | 1,687 | 14,948 | 12,989 | 119,237 | ||||||||||||
Shares redeemed | (1,239 | ) | (6,273 | ) | (1 | ) | (7 | ) | ||||||||
| 21,119 | 118,698 | 15,378 | 140,637 | |||||||||||||
| Investor Shares |
| |||||||||||||||
Reinvestment of distributions | 30 | 269 | 228 | 2,087 | ||||||||||||
| 30 | 269 | 228 | 2,087 | |||||||||||||
| Class R6 Shares |
| |||||||||||||||
Shares sold | 8,020,595 | 40,600,000 | — | — | ||||||||||||
Reinvestment of distributions | 30 | 270 | 236 | 2,164 | ||||||||||||
| 8,020,625 | 40,600,270 | 236 | 2,164 | |||||||||||||
23
GOLDMAN SACHS ENERGY INFRASTRUCTURE FUND
Notes to Financial Statements (continued)
May 31, 2020 (Unaudited)
| 10. SUMMARY OF SHARE TRANSACTIONS (continued) |
| Goldman Sachs Energy Infrastructure Fund | ||||||||||||||||
| For the Six Months Ended May 31, 2020 (Unaudited) | For the Fiscal Year Ended November 30, 2019 | |||||||||||||||
| Shares | Dollars | Shares | Dollars | |||||||||||||
| Class R Shares |
| |||||||||||||||
Shares sold | 522 | $ | 3,775 | 239 | $ | 2,217 | ||||||||||
Reinvestment of distributions | 32 | 282 | 210 | 1,926 | ||||||||||||
Shares redeemed | — | (2 | ) | (64 | ) | (584 | ) | |||||||||
| 554 | 4,055 | 385 | 3,559 | |||||||||||||
| Class P Shares |
| |||||||||||||||
Shares sold | 28,473,037 | 196,384,692 | 8,665,705 | 76,100,246 | ||||||||||||
Reinvestment of distributions | 50,863 | 450,132 | 287,400 | 2,612,676 | ||||||||||||
Shares redeemed | (15,832,474 | ) | (105,180,061 | ) | (1,719,933 | ) | (15,623,854 | ) | ||||||||
| 12,691,426 | 91,654,763 | 7,233,172 | 63,089,068 | |||||||||||||
NET INCREASE | 20,740,845 | $ | 132,440,732 | 7,263,300 | $ | 63,377,484 | ||||||||||
24
GOLDMAN SACHS ENERGY INFRASTRUCTURE FUND
Voting Results of Special Meeting of Shareholders
A Special Meeting (the “Meeting”) of the Goldman Sachs Trust (“GST”) was held on January 23, 2020 to consider and act upon the proposals below. The Fund has amortized its respective share of the proxy, shareholder meeting and other related costs and GSAM has agreed to reimburse the Fund to the extent such expenses exceed a specified percentage of the Fund’s net assets.
At the Meeting, Dwight L. Bush, Kathryn A. Cassidy, Joaquin Delgado and Gregory G. Weaver were elected to the Trust’s Board of Trustees. In electing trustees, the Trust’s shareholders voted as follows:
Proposal 1. Election of Trustees | For | Against | Withheld | Broker Non-Votes | ||||||||||||
Dwight L. Bush | 94,278,961,728.065 | 0 | 349,026,343.365 | 0 | ||||||||||||
Kathryn A. Cassidy | 94,310,850,789.164 | 0 | 317,137,282.266 | 0 | ||||||||||||
Joaquin Delgado | 94,282,646,444.727 | 0 | 345,341,626.703 | 0 | ||||||||||||
Gregory G. Weaver | 94,306,589,873.348 | 0 | 321,398,198.082 | 0 | ||||||||||||
25
GOLDMAN SACHS ENERGY INFRASTRUCTURE FUND
Liquidity Risk Management Program
The Fund has adopted and implemented a liquidity risk management program (the “Program”) in accordance with Rule 22e-4 under the 1940 Act. The Program seeks to assess and manage the Fund’s liquidity risk, i.e., the risk that a Fund is unable to satisfy redemption requests without significantly diluting remaining investors’ interests in the Fund. The Board of Trustees of the Trust has designated GSAM, the Fund’s investment adviser, to administer the Program. Certain aspects of the Program rely on third parties to perform certain functions, including the provision of market data and application of models.
The Program is comprised of various components designed to support the assessment and/or management of liquidity risk, including: (1) the periodic assessment (no less frequently than annually) of certain factors that influence a Fund’s liquidity risk; (2) the periodic classification (no less frequently than monthly) of a Fund’s investments into one of four liquidity categories that reflect an estimate of their liquidity under current market conditions; (3) a 15% limit on the acquisition of “illiquid investments” (as defined under Rule 22e-4); (4) for a Fund that does not invest primarily in “highly liquid investments” (as defined under Rule 22e-4), the determination of a minimum percentage of the Fund’s assets that will generally be invested in highly liquid investments (a “Highly Liquid Investment Minimum”); and (5) periodic reporting to the Board of Trustees.
At a meeting of the Board of Trustees on February 11-12, 2020, GSAM provided a written report to the Board addressing the operation, and the adequacy and effectiveness of the implementation, of the Program, including, as applicable, the operation of any Highly Liquid Investment Minimum and any material changes to the Program, for the initial period from December 1, 2018 through December 31, 2019 (the “Reporting Period”). Among other things, the annual report discussed: (1) the results of stress tests designed to assess liquidity under a hypothetical stressed scenario involving elevated redemptions; and (2) an assessment of the methodologies used to classify investments into one of four liquidity categories. The report concluded that the Program was reasonably designed to assess and manage liquidity risk and was adequately and effectively implemented during the Reporting Period.
There can be no assurance that the Program will achieve its objectives under all circumstances in the future. Please refer to your Fund’s prospectus for more information regarding the Fund’s exposure to liquidity risk and other risks to which it may be subject.
26
GOLDMAN SACHS ENERGY INFRASTRUCTURE FUND
Fund Expenses — Six Months Period Ended May 31, 2020 (Unaudited) | ||
As a shareholder of Class A, Class C, Institutional, Investor, Class R6, Class R and Class P Shares of the Fund, you incur two types of costs: (1) transaction costs, including sales charges on purchase payments (with respect to Class A Shares) and contingent deferred sales charges on redemptions (with respect to Class C Shares); and (2) ongoing costs, including management fees; distribution and/or service (12b-1) fees (with respect to Class A, Class C and Class R Shares); and other Fund expenses. This example is intended to help you understand your ongoing costs (in dollars) of investing in Class A, Class C, Institutional, Investor, Class R6, Class R, and Class P Shares of the Fund and to compare these costs with the ongoing costs of investing in other mutual funds.
The example is based on an investment of $1,000 invested at the beginning of the period and held for the entire period from December 1, 2019 through May 31, 2020, which represents a period of 183 days in a 366 day year.
Actual Expenses — The first line under each share class in the table below provides information about actual account values and actual expenses. You may use the information in this line, together with the amount you invested, to estimate the expenses that you paid over the period. Simply divide your account value by $1,000 (for example, an $8,600 account value divided by $1,000=8.6), then multiply the result by the number in the first line under the heading entitled “Expenses Paid” to estimate the expenses you paid on your account during this period.
Hypothetical Example for Comparison Purposes — The second line under each share class in the table below provides information about hypothetical account values and hypothetical expenses based on the Fund’s actual net expense ratios and an assumed rate of return of 5% per year before expenses, which is not the Fund’s actual return. The hypothetical account values and expenses may not be used to estimate the actual ending account balance or expenses you paid for the period. You may use this information to compare the ongoing costs of investing in the Fund and other funds. To do so, compare this 5% hypothetical example with the 5% hypothetical examples that appear in the shareholder reports of the other funds.
Please note that the expenses shown in the table are meant to highlight your ongoing costs only and do not reflect any transactional costs, such as sales charges, redemption fees, or exchange fees. Therefore, the second line of the table is useful in comparing ongoing costs only, and will not help you determine the relative total costs of owning different funds. In addition, if these transactional costs were included, your costs would have been higher.
| Energy Infrastructure Fund | ||||||||||||
| Share Class | Beginning Account Value 12/1/19 | Ending Account Value 5/31/20 | Expenses Paid for the 6 months ended 5/31/20* | |||||||||
| Class A | ||||||||||||
Actual | $ | 1,000.00 | $ | 831.00 | $ | 6.77 | ||||||
Hypothetical 5% return | 1,000.00 | 1,017.60 | + | 7.47 | ||||||||
| Class C | ||||||||||||
Actual | 1,000.00 | 827.50 | 10.19 | |||||||||
Hypothetical 5% return | 1,000.00 | 1,013.85 | + | 11.23 | ||||||||
| Institutional | ||||||||||||
Actual | 1,000.00 | 832.40 | 5.04 | |||||||||
Hypothetical 5% return | 1,000.00 | 1,019.50 | + | 5.55 | ||||||||
| Investor | ||||||||||||
Actual | 1,000.00 | 831.20 | 5.63 | |||||||||
Hypothetical 5% return | 1,000.00 | 1,018.85 | + | 6.21 | ||||||||
| Class R6 | ||||||||||||
Actual | 1,000.00 | 831.20 | 4.99 | |||||||||
Hypothetical 5% return | 1,000.00 | 1,019.55 | + | 5.50 | ||||||||
| Class R | ||||||||||||
Actual | 1,000.00 | 828.90 | 7.91 | |||||||||
Hypothetical 5% return | 1,000.00 | 1,016.35 | + | 8.72 | ||||||||
| Class P | ||||||||||||
Actual | 1,000.00 | 832.20 | 4.99 | |||||||||
Hypothetical 5% return | 1,000.00 | 1,019.55 | + | 5.50 | ||||||||
| * | Expenses for each share class are calculated using the Fund’s annualized net expense ratio for each class, which represents the ongoing expenses as a percentage of net assets for the six months ended May 31, 2020. Expenses are calculated by multiplying the annualized net expense ratio by the average account value for the period; then multiplying the result by the number of days in the most recent fiscal half year; and then dividing that result by the number of days in the fiscal year. The annualized net expense ratios for the period were as follows: |
| Class A | Class C | Institutional | Investor | Class R6 | Class R | Class P | ||||||||||||||||||
| 1.48% | 2.23 | % | 1.10 | % | 1.23 | % | 1.09 | % | 1.73 | % | 1.09 | % | ||||||||||||
| + | Hypothetical expenses are based on the Fund’s actual annualized net expense ratios and an assumed rate of return of 5% per year before expenses. |
27
FUNDS PROFILE
Goldman Sachs Funds
Goldman Sachs is a premier financial services firm, known since 1869 for creating thoughtful and customized investment solutions in complex global markets.
Today, the Consumer and Investment Management Division of Goldman Sachs serves a diverse set of clients worldwide, including private institutions, public entities and individuals. With approximately $1.66 trillion in assets under supervision as of March 31, 2020, Goldman Sachs Asset Management (“GSAM”) has portfolio management teams located around the world and our investment professionals bring firsthand knowledge of local markets to every investment decision. Assets under supervision includes assets under management and other client assets for which Goldman Sachs does not have full discretion. GSAM leverages the resources of Goldman Sachs & Co. LLC subject to legal, internal and regulatory restrictions.
Money Market
Financial Square FundsSM
| ∎ | Financial Square Treasury Solutions Fund1 |
| ∎ | Financial Square Government Fund1 |
| ∎ | Financial Square Money Market Fund2 |
| ∎ | Financial Square Prime Obligations Fund2 |
| ∎ | Financial Square Treasury Instruments Fund1 |
| ∎ | Financial Square Treasury Obligations Fund1 |
| ∎ | Financial Square Federal Instruments Fund1 |
Investor FundsSM
| ∎ | Investor Money Market Fund3 |
| ∎ | Investor Tax-Exempt Money Market Fund3 |
Fixed Income
Short Duration and Government
| ∎ | Enhanced Income Fund |
| ∎ | High Quality Floating Rate Fund |
| ∎ | Short-Term Conservative Income Fund |
| ∎ | Short Duration Government Fund |
| ∎ | Short Duration Income Fund |
| ∎ | Government Income Fund |
| ∎ | Inflation Protected Securities Fund |
Multi-Sector
| ∎ | Bond Fund |
| ∎ | Core Fixed Income Fund |
| ∎ | Global Core Fixed Income Fund4 |
| ∎ | Strategic Income Fund |
| ∎ | Income Fund |
Municipal and Tax-Free
| ∎ | High Yield Municipal Fund |
| ∎ | Dynamic Municipal Income Fund |
| ∎ | Short Duration Tax-Free Fund |
| ∎ | Municipal Income Completion Fund |
Single Sector
| ∎ | Investment Grade Credit Fund |
| ∎ | U.S. Mortgages Fund |
| ∎ | High Yield Fund |
| ∎ | High Yield Floating Rate Fund |
| ∎ | Emerging Markets Debt Fund |
| ∎ | Local Emerging Markets Debt Fund |
Fixed Income Alternatives
| ∎ | Long Short Credit Strategies Fund |
Fundamental Equity
| ∎ | Equity Income Fund |
| ∎ | Small Cap Growth Fund |
| ∎ | Small Cap Value Fund |
| ∎ | Small/Mid Cap Value Fund |
| ∎ | Mid Cap Value Fund |
| ∎ | Large Cap Value Fund |
| ∎ | Focused Value Fund |
| ∎ | Capital Growth Fund |
| ∎ | Strategic Growth Fund |
| ∎ | Small/Mid Cap Growth Fund |
| ∎ | Flexible Cap Fund |
| ∎ | Concentrated Growth Fund |
| ∎ | Technology Opportunities Fund |
| ∎ | Growth Opportunities Fund |
| ∎ | Rising Dividend Growth Fund |
| ∎ | Blue Chip Fund |
| ∎ | Income Builder Fund |
Tax-Advantaged Equity
| ∎ | U.S. Tax-Managed Equity Fund |
| ∎ | International Tax-Managed Equity Fund |
| ∎ | U.S. Equity Dividend and Premium Fund |
| ∎ | International Equity Dividend and Premium Fund |
Equity Insights
| ∎ | Small Cap Equity Insights Fund |
| ∎ | U.S. Equity Insights Fund |
| ∎ | Small Cap Growth Insights Fund |
| ∎ | Large Cap Growth Insights Fund |
| ∎ | Large Cap Value Insights Fund |
| ∎ | Small Cap Value Insights Fund |
| ∎ | International Small Cap Insights Fund |
| ∎ | International Equity Insights Fund |
| ∎ | Emerging Markets Equity Insights Fund |
| ∎ | Clean Energy Income Fund |
Fundamental Equity International
| ∎ | International Equity Income Fund |
| ∎ | International Equity ESG Fund |
| ∎ | China Equity Fund5 |
| ∎ | Emerging Markets Equity Fund |
| ∎ | Imprint Emerging Markets Opportunities Fund6 |
| ∎ | ESG Emerging Markets Equity Fund |
Alternative
| ∎ | Real Estate Securities Fund |
| ∎ | International Real Estate Securities Fund |
| ∎ | Commodity Strategy Fund |
| ∎ | Global Real Estate Securities Fund |
| ∎ | Alternative Premia Fund |
| ∎ | Absolute Return Tracker Fund |
| ∎ | Managed Futures Strategy Fund |
| ∎ | MLP Energy Infrastructure Fund |
| ∎ | Energy Infrastructure Fund7 |
| ∎ | Multi-Manager Alternatives Fund |
| ∎ | Global Infrastructure Fund |
Total Portfolio Solutions
| ∎ | Global Managed Beta Fund |
| ∎ | Multi-Manager Non-Core Fixed Income Fund |
| ∎ | Multi-Manager U.S. Dynamic Equity Fund |
| ∎ | Multi-Manager Global Equity Fund |
| ∎ | Multi-Manager International Equity Fund |
| ∎ | Tactical Tilt Overlay Fund |
| ∎ | Balanced Strategy Portfolio |
| ∎ | Multi-Manager U.S. Small Cap Equity Fund |
| ∎ | Multi-Manager Real Assets Strategy Fund |
| ∎ | Growth and Income Strategy Portfolio |
| ∎ | Growth Strategy Portfolio |
| ∎ | Dynamic Global Equity Fund |
| ∎ | Satellite Strategies Portfolio |
| ∎ | Enhanced Dividend Global Equity Portfolio |
| ∎ | Tax-Advantaged Global Equity Portfolio |
| ∎ | Strategic Factor Allocation Fund |
| ∎ | Target Date Retirement Portfolio8 |
| ∎ | Target Date 2025 Portfolio |
| ∎ | Target Date 2030 Portfolio |
| ∎ | Target Date 2035 Portfolio |
| ∎ | Target Date 2040 Portfolio |
| ∎ | Target Date 2045 Portfolio |
| ∎ | Target Date 2050 Portfolio |
| ∎ | Target Date 2055 Portfolio |
| ∎ | Target Date 2060 Portfolio |
| ∎ | GQG Partners International Opportunities Fund |
| 1 | You could lose money by investing in the Fund. Although the Fund seeks to preserve the value of your investment at $1.00 per share, it cannot guarantee it will do so. An investment in the Fund is not a deposit of a bank and is not insured or guaranteed by the Federal Deposit Insurance Corporation or any other government agency. The Fund’s sponsor has no legal obligation to provide financial support to the Fund, and you should not expect that the sponsor will provide financial support to the Fund at any time. |
| 2 | You could lose money by investing in the Fund. Because the share price of the Fund will fluctuate, when you sell your shares they may be worth more or less than what you originally paid for them. The Fund may impose a fee upon sale of your shares or may temporarily suspend your ability to sell shares if the Fund’s liquidity falls below required minimums because of market conditions or other factors. An investment in the Fund is not a deposit of a bank and is not insured or guaranteed by the Federal Deposit Insurance Corporation or any other government agency. The Fund’s sponsor has no legal obligation to provide financial support to the Fund, and you should not expect that the sponsor will provide financial support to the Fund at any time. |
| 3 | You could lose money by investing in the Fund. Although the Fund seeks to preserve the value of your investment at $1.00 per share, it cannot guarantee it will do so. The Fund may impose a fee upon sale of your shares or may temporarily suspend your ability to sell shares if the Fund’s liquidity falls below required minimums because of market conditions or other factors. An investment in the Fund is not a deposit of a bank and is not insured or guaranteed by the Federal Deposit Insurance Corporation or any other government agency. The Fund’s sponsor has no legal obligation to provide financial support to the Fund, and you should not expect that the sponsor will provide financial support to the Fund at any time. |
| 4 | Effective after the close of business on April 30, 2020, the Goldman Sachs Global Income Fund was renamed the Goldman Sachs Global Core Fixed Income Fund. |
| 5 | Effective after the close of business of November 20, 2019, the Goldman Sachs Asia Equity Fund was renamed the Goldman Sachs China Equity Fund. |
| 6 | Effective after the close of business on August 30, 2019, the Goldman Sachs N-11 Equity Fund was renamed the Goldman Sachs Imprint Emerging Markets Opportunities Fund. |
| 7 | Effective after the close of business on June 26, 2020, the Goldman Sachs MLP & Energy Fund was renamed the Goldman Sachs Energy Infrastructure Fund. |
| 8 | Effective December 27, 2019, the Goldman Sachs Target Date 2020 Portfolio was renamed the Goldman Sachs Target Date Retirement Portfolio. |
| Financial Square FundsSM and Investor FundsSM are registered service marks of Goldman Sachs & Co. LLC. |
| * | This list covers open-end funds only. Please visit our website at www.GSAMFUNDS.com to learn about our closed-end funds and exchange-traded funds. |
TRUSTEES Jessica Palmer, Chair Dwight L. Bush Kathryn A. Cassidy Diana M. Daniels Joaquin Delgado James A. McNamara Roy W. Templin Gregory G. Weaver | OFFICERS James A. McNamara, President Joseph F. DiMaria, Principal Financial Officer, Caroline L. Kraus, Secretary | |
GOLDMAN SACHS & CO. LLC Distributor and Transfer Agent | GOLDMAN SACHS ASSET MANAGEMENT, L.P. Investment Adviser | |
Visit our website at www.GSAMFUNDS.com to obtain the most recent month-end returns.
Goldman Sachs Asset Management, L.P., 200 West Street, New York, New York 10282
Goldman Sachs does not provide legal, tax or accounting advice, unless explicitly agreed between you and Goldman Sachs (generally through certain services offered only to clients of Private Wealth Management). Any statement contained in this presentation concerning U.S. tax matters is not intended or written to be used and cannot be used for the purpose of avoiding penalties imposed on the relevant taxpayer. Notwithstanding anything in this document to the contrary, and except as required to enable compliance with applicable securities law, you may disclose to any person the US federal and state income tax treatment and tax structure of the transaction and all materials of any kind (including tax opinions and other tax analyses) that are provided to you relating to such tax treatment and tax structure, without Goldman Sachs imposing any limitation of any kind. Investors should be aware that a determination of the tax consequences to them should take into account their specific circumstances and that the tax law is subject to change in the future or retroactively and investors are strongly urged to consult with their own tax advisor regarding any potential strategy, investment or transaction.
The reports concerning the Fund included in this shareholder report may contain certain forward-looking statements about the factors that may affect the performance of the Fund in the future. These statements are based on Fund management’s predictions and expectations concerning certain future events and their expected impact on the Fund, such as performance of the economy as a whole and of specific industry sectors, changes in the levels of interest rates, the impact of developing world events, and other factors that may influence the future performance of the Fund. Management believes these forward-looking statements to be reasonable, although they are inherently uncertain and difficult to predict. Actual events may cause adjustments in portfolio management strategies from those currently expected to be employed.
A description of the policies and procedures that the Fund uses to determine how to vote proxies relating to portfolio securities and information regarding how the Fund voted proxies relating to portfolio securities for the most recent 12-month period ended June 30, are available (I) without charge, upon request by calling 1-800-526-7384 (for Retail Shareholders) or 1-800-621-2550 (for Institutional Shareholders); and (II) on the Securities and Exchange Commission (“SEC’’) web site at http://www.sec.gov.
The Fund will file its portfolio holdings for each month in a fiscal quarter within 60 days after the end of the relevant fiscal quarter on Form N-PORT. Portfolio holdings information for the third month of each fiscal quarter will be made available on the SEC’s web site at http://www.sec.gov. Portfolio holdings information may be obtained upon request and without charge by calling 1-800-526-7384 (for Retail Shareholders) or 1-800-621-2550 (for Institutional Shareholders).
Fund holdings and allocations shown are as of May 31, 2020 and may not be representative of future investments. Fund holdings should not be relied on in making investment decisions and should not be construed as research or investment advice regarding particular securities. Current and future holdings are subject to risk.
Economic and market forecasts presented herein reflect our judgment as of the date of this presentation and are subject to change without notice. These forecasts do not take into account the specific investment objectives, restrictions, tax and financial situation or other needs of any specific client. Actual data will vary and may not be reflected here. These forecasts are subject to high levels of uncertainty that may affect actual performance. Accordingly, these forecasts should be viewed as merely representative of a broad range of possible outcomes. These forecasts are estimated, based on assumptions, and are subject to significant revision and may change materially as economic and market conditions change. Goldman Sachs has no obligation to provide updates or changes to these forecasts. Case studies and examples are for illustrative purposes only.
“Alerian Midstream Energy Select Index”, “Alerian MLP Index”, “Alerian MLP Total Return Index”, “AMEI”, “AMEIX”, “AMZ” and “AMZX” are trademarks of Alerian and their use is granted under a license from Alerian.
The portfolio risk management process includes an effort to monitor and manage risk, but does not imply low risk.
This material is not authorized for distribution to prospective investors unless preceded or accompanied by a current Prospectus or summary prospectus, if applicable. Investors should consider the Fund’s objective, risks, and charges and expenses, and read the summary prospectus, if available, and/or the Prospectus carefully before investing or sending money. The summary prospectus, if available, and the Prospectus contain this and other information about the Fund and may be obtained from your authorized dealer or from Goldman Sachs & Co. LLC by calling (retail – 1-800-526-7384) (institutional – 1-800-621-2550).
© 2020 Goldman Sachs. All rights reserved. 209007-OTU-1231038 MLPANDESAR-20
| ITEM 2. | CODE OF ETHICS. |
| (a) | As of the end of the period covered by this report, the registrant has adopted a code of ethics that applies to the registrant’s principal executive officer, principal financial officer, principal accounting officer or controller, or persons performing similar functions, regardless of whether these individuals are employed by the registrant or a third party (the “Code of Ethics”). |
| (b) | During the period covered by this report, no amendments were made to the provisions of the Code of Ethics. |
| (c) | During the period covered by this report, the registrant did not grant any waivers, including an implicit waiver, from any provision of the Code of Ethics. |
| (d) | A copy of the Code of Ethics is available as provided in Item 13(a)(1) of this report. |
| ITEM 3. | AUDIT COMMITTEE FINANCIAL EXPERT. |
The registrant’s board of trustees has determined that the registrant has at least one “audit committee financial expert” (as defined in Item 3 of Form N-CSR) serving on its audit committee. Gregory G. Weaver is the “audit committee financial expert” and is “independent” (as each term is defined in Item 3 of Form N-CSR). |
| ITEM 4. | PRINCIPAL ACCOUNTANT FEES AND SERVICES. |
The information required by this Item is only required in an annual report on this Form N-CSR. |
| ITEM 5. | AUDIT COMMITTEE OF LISTED REGISTRANTS. |
Not applicable. |
| ITEM 6. | SCHEDULE OF INVESTMENTS. |
Schedule of Investments is included as part of the Report to Shareholders filed under Item 1. |
| ITEM 7. | DISCLOSURE OF PROXY VOTING POLICIES AND PROCEDURES FOR CLOSED-END MANAGEMENT INVESTMENT COMPANIES. |
Not applicable. |
| ITEM 8. | PORTFOLIO MANAGERS OF CLOSED-END MANAGEMENT INVESTMENT COMPANIES. |
Not applicable. |
| ITEM 9. | PURCHASES OF EQUITY SECURITIES BY CLOSED-END MANAGEMENT INVESTMENT COMPANY AND AFFILIATED PURCHASERS. |
Not applicable. |
| ITEM 10. | SUBMISSION OF MATTERS TO A VOTE OF SECURITY HOLDERS. |
There have been no material changes to the procedures by which shareholders may recommend nominees to the registrant’s board of trustees. |
| ITEM 11. | CONTROLS AND PROCEDURES. |
| (a) | The registrant’s principal executive and principal financial officers, or persons performing similar functions have concluded that the registrant’s disclosure controls and procedures (as defined in Rule 30a-3(c) under the Investment Company Act of 1940, as amended (the “1940 Act”)) are effective as of a date within 90 days of the filing of this report that includes the disclosure required by this paragraph, based on the evaluation of these controls and procedures required by Rule 30a-3(b) under the 1940 Act and 15d-15(b) under the Securities Exchange Act of 1934, as amended. |
| (b) | There were no changes in the registrant’s internal control over financial reporting (as defined in Rule 30a-3(d) under the 1940 Act) that occurred during the period covered by this report that have materially affected, or are reasonably likely to materially affect, the registrant’s internal control over financial reporting. |
| ITEM 12. | DISCLOSURE OF SECURITIES LENDING ACTIVITIES FOR CLOSED-END MANAGEMENT INVESTMENT COMPANIES |
Not applicable. |
| ITEM 13. | EXHIBITS. |
| (a)(1) | Goldman Sachs Trust’s Code of Ethics for Principal Executive and Senior Financial Officers is incorporated by reference to Exhibit 13(a)(1) of the registrant’s Form N-CSR filed on May 5, 2020. | |||
| (a)(2) | Exhibit 99.CERT | Certifications pursuant to Section 302 of the Sarbanes-Oxley Act of 2002 filed herewith. | ||
| (a)(3) | Not applicable to open-end investment companies. | |||
| (a)(4) | There was no change in the registrant’s independent public accountant for the period covered by this report. | |||
| (b) | Exhibit 99.906CERT | Certifications pursuant to Section 906 of the Sarbanes-Oxley Act of 2002 filed herewith. | ||
SIGNATURES
Pursuant to the requirements of the Securities Exchange Act of 1934 and the Investment Company Act of 1940, the registrant has duly caused this report to be signed on its behalf by the undersigned, thereunto duly authorized.
| Goldman Sachs Trust | ||||
| By: | /s/ James A. McNamara | |||
| James A. McNamara | ||||
| President/Chief Executive Officer | ||||
| Goldman Sachs Trust | ||||
| Date: | July 30, 2020 | |||
Pursuant to the requirements of the Securities Exchange Act of 1934 and the Investment Company Act of 1940, this report has been signed below by the following persons on behalf of the registrant and in the capacities and on the dates indicated.
| By: | /s/ James A. McNamara | |||
| James A. McNamara | ||||
| President/Chief Executive Officer | ||||
| Goldman Sachs Trust | ||||
| Date: | July 30, 2020 | |||
| By: | /s/ Joseph F. DiMaria | |||
Joseph F. DiMaria | ||||
| Principal Financial Officer | ||||
| Goldman Sachs Trust | ||||
| Date: | July 30, 2020 | |||