UNITED STATES
SECURITIES AND EXCHANGE COMMISSION
Washington, D.C. 20549
FORM N-CSR
CERTIFIED SHAREHOLDER REPORT OF REGISTERED
MANAGEMENT INVESTMENT COMPANIES
Investment Company Act file number 811-05349
Goldman Sachs Trust
(Exact name of registrant as specified in charter)
71 South Wacker Drive, Chicago, Illinois 60606
(Address of principal executive offices) (Zip code)
| Caroline Kraus, Esq. | Copies to: | |
| Goldman Sachs & Co. LLC | Geoffrey R.T. Kenyon, Esq. | |
| 200 West Street | Dechert LLP | |
| New York, New York 10282 | 100 Oliver Street | |
| 40th Floor | ||
| Boston, MA 02110-2605 |
(Name and address of agents for service)
Registrant’s telephone number, including area code: (312) 655-4400
Date of fiscal year end: October 31
Date of reporting period: October 31, 2020
| ITEM 1. | REPORTS TO STOCKHOLDERS. |
The Annual Report to Shareholders is filed herewith. |
Goldman Sachs Funds

| Annual Report | October 31, 2020 | |||
Dividend Focus Funds | ||||
Income Builder | ||||
Rising Dividend Growth | ||||
It is our intention that beginning on January 1, 2021, paper copies of the Funds’ annual and semi-annual shareholder reports will no longer be sent by mail, unless you specifically request paper copies of the reports from a Fund or from your financial intermediary. Instead, the reports will be made available on a website, and you will be notified by mail each time a report is posted and provided with a website link to access the report.
If you already elected to receive shareholder reports electronically, you will not be affected by this change and you need not take any action. At any time, you may elect to receive reports and certain communications from a Fund electronically by calling the applicable toll-free number below or by contacting your financial intermediary.
You may elect to receive all future shareholder reports in paper free of charge. If you hold shares of a Fund directly with the Fund’s transfer agent, you can inform the transfer agent that you wish to receive paper copies of reports by calling toll-free 800-621-2550 for Institutional, Class R6 and Class P shareholders or 800-526-7384 for all other shareholders. If you hold shares of a Fund through a financial intermediary, please contact your financial intermediary to make this election. Your election to receive reports in paper will apply to all Goldman Sachs Funds held in your account if you invest through your financial intermediary or all Goldman Sachs Funds held with the Funds’ transfer agent if you invest directly with the transfer agent.

Goldman Sachs Dividend Focus Funds
| ∎ | INCOME BUILDER |
| ∎ | RISING DIVIDEND GROWTH |
Portfolio Management Discussion and Performance Summary — Income Builder | 1 | |||
Portfolio Management Discussion and Performance Summary — Rising Dividend Growth | 10 | |||
| 20 | ||||
| 38 | ||||
| 41 | ||||
| 41 | ||||
| 47 | ||||
| 54 | ||||
| 74 | ||||
| 76 | ||||
| NOT FDIC-INSURED | May Lose Value | No Bank Guarantee | ||
FUND RESULTS
Goldman Sachs Income Builder Fund
Investment Objective
The Fund seeks to provide income and capital appreciation.
Portfolio Management Discussion and Analysis
Below, the Goldman Sachs Fundamental Equity Team, the Goldman Sachs Fixed Income Investment Management Team, and the Goldman Sachs Global Portfolio Solutions Team, collectively the Goldman Sachs Income Builder Team (the “Income Builder Team”), discuss the Goldman Sachs Income Builder Fund’s (the “Fund”) performance and positioning for the 12-month period ended October 31, 2020 (the “Reporting Period”).
| Q | How did the Fund perform during the Reporting Period? |
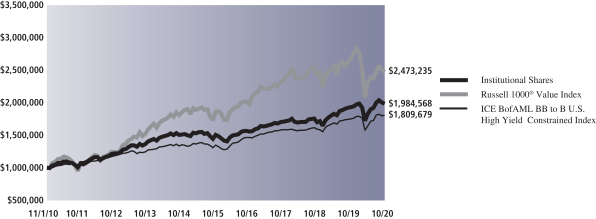
| A | During the Reporting Period, the Fund’s Class A, Class C, Institutional, Investor, Class R6 and Class P Shares generated average annual total returns, without sales charges, of 2.29%, 1.57%, 2.68%, 2.53%, 2.70% and 2.70%, respectively. These returns compare to the -7.55% and 3.28% average annual total returns of the Russell 1000® Value Index (with dividends reinvested) (the “Russell Index”) and the ICE BofAML BB to B U.S. High Yield Constrained Index (the “ICE BofAML Index”), respectively, during the same period. |
| Q | What economic and market factors most influenced the Fund during the Reporting Period? |
| A | During the Reporting Period, the spread of COVID-19, contraction in global economic growth and historic financial stimulus by central banks and governments around the world most influenced the financial markets and the Fund. |
In November and December 2019, when the Reporting Period began, U.S. equity market returns accelerated with an uptick of U.S. manufacturing and service sector business surveys as well as a consistently strong labor market, as evidenced by the U.S. adding more than 200,000 jobs in November, double the break-even pace of long-term job growth. These developments helped restore market confidence, while fundamentals of low core inflation and reduced trade war tensions fended off imminent recession risk. As for fixed income markets, performance was bolstered by accommodative central bank policy, improved investor sentiment toward risk assets and the announcement of an agreement in principle for a “Phase One” trade deal between the U.S. and China. In this environment, U.S. high yield corporate bonds posted gains. |
During the first quarter of 2020, U.S. equities sold off as the emergence and rapid spread of COVID-19 caused non-essential businesses to close. Jobless claims increased to 6.6 million and nonfarm payrolls decreased by 701,000 for the month of March, leading the U.S. government and the U.S. Federal Reserve (“Fed”) to respond with aggressive financial stimulus. In addition, crude oil prices fell as supply increased and demand declined. Regarding fixed income, market sentiment was challenged by concerns that global economic growth could slow due to the outbreak of COVID-19. Risk-off investor sentiment, or reduced risk appetite, intensified during March as governments around the world initiated shutdowns and quarantines to stem what had by then become a pandemic. As for U.S. high yield corporate bonds, investor perceptions of slowing global economic growth alongside sharp equity market drawdowns and declining crude oil prices, as well as investment outflows from the asset class, drove a steep sell-off. Stressed liquidity conditions and growing market concerns about the possible downgrades of investment grade corporate bonds into the high yield corporate bond market also contributed to the sell-off. |
U.S. equities rebounded during the second calendar quarter. The market appreciated despite a surge in COVID-19 cases in regional pockets of the U.S., causing local governments to pause reopening plans and revisit previous lockdown measures. Positive market sentiment was buoyed by better than consensus expected economic data, such as nonfarm payrolls increasing 7.3 million over May and June, driving the unemployment rate down to 11.1% from a high of more than 14% in the prior quarter. For similar reasons, the broad fixed income market generated gains, with U.S. high yield corporate bonds benefiting from increased Fed stimulus, stabilizing crude oil prices, rising investor demand and improvement in U.S. economic activity. |
1
FUND RESULTS
During the third quarter of 2020, the U.S. equity markets continued to rally in spite of pressure from the COVID-19 pandemic. Market strength was supported by a sharp cyclical recovery in economic data, with the Institute for Supply Management’s Purchasing Managers’ Index increasing to 56.0 in August, a reading that was firmly in expansionary territory. Optimism around a potential COVID-19 vaccine also helped support equity markets. Within fixed income, U.S. high yield corporate bonds extended their positive momentum at the start of the quarter, benefiting from accommodative monetary and fiscal policies globally, a worldwide search for yield and an improvement in perceived quality of the asset class. However, increasing concerns of a potential second wave of COVID-19 infections, crude oil price volatility, and uncertainty around the then-upcoming U.S. elections tempered investor risk sentiment in the latter part of the quarter. |
In October 2020, the majority of third quarter earnings results for U.S. companies came in better than consensus expected, but U.S. equity prices declined against a backdrop of heightened market expectations. Political uncertainty surrounding the then-upcoming U.S. elections and a lack of further fiscal stimulus were also sources of volatility during the month. Despite these headwinds, some support for U.S. equities was provided by a 33.1% increase in U.S. Gross Domestic Product (“GDP”) in the third quarter of 2020, as businesses resumed some activity that was postponed or restricted as a result of COVID-19. Within fixed income, market conditions were volatile for similar reasons. That said, U.S. high yield corporate bonds remained resilient due to healthy investor demand despite heightened volatility caused by political and COVID-19-related headwinds. |
For the Reporting Period overall, U.S. large-cap equities, as measured by the S&P 500® Index, generated positive returns. However, value stocks, as measured by the Russell Index, produced negative returns. The fixed income markets, including high yield corporate bonds, produced positive returns during the Reporting Period overall. |
| Q | What was the Fund’s asset allocation positioning during the Reporting Period? |
| A | As part of its principal investment strategies, the Fund has a baseline allocation of 60% to fixed income securities and 40% to equity securities, though in seeking to meet its investment objective, the Fund has the flexibility to opportunistically tilt the allocation to fixed income and equity securities up to 15% above or below that baseline allocation, measured at the time of investment. The Fund seeks to provide a high and stable income stream plus capital appreciation, with lower volatility than the equity market. The percentage of the portfolio invested in equity and fixed income securities will vary from time to time as the Income Builder Team evaluates such securities’ relative attractiveness based on, among other factors, income opportunities, market valuations, economic growth and inflation prospects. Because of these stated goals of the Fund, the Income Builder Team believes the returns of the Russell Index and the ICE BofAML Index should be considered for reference only. |
At the beginning of the Reporting Period, the Fund was invested 37.5% in equities and 57.0% in fixed income, with the balance of 5.5% in cash and cash equivalents. The Fund’s exposure to equities increased during the first three months of the Reporting Period, due to the appreciation of stock prices. During February and into March, as the stock market sold off, the Fund’s exposure to equities drifted lower. We decided to rebalance the Fund, increasing its exposure to equities, because we thought equity prices were attractive from a longer-term perspective. That said, the Fund was underweight equities relative to its baseline allocation at the end of March. During August 2020, as equity valuations remained attractive, in our view, and stocks rallied, we allowed the Fund’s equity allocation to drift higher while also actively adding to its holdings. In addition, during the Reporting Period overall, we used equity call options in an effort to generate additional cash flow and mitigate potential downside risk for the Fund. (A call option is an option that gives the holder the right to buy a certain quantity of an underlying security at an agreed-upon price at the time of expiry.) After maintaining the Fund’s existing positions in sold call options during the opening weeks of the Reporting Period, we allowed its sold call options on European large-cap stocks to expire in December 2019. In February 2020, we sold call options on U.S. large-cap stocks and European large-cap stocks, as we saw attractive levels of implied volatility (i.e., expectations of future volatility). In April, amid a significant equity rally, we allowed all of the Fund’s sold call positions to expire, and we did not write new calls for the rest of the Reporting Period. |
Regarding the Fund’s duration position, we extended it, using interest rate swaps, to nearly five years in February 2020, as we sought to mitigate potential risk within equities and high yield corporate credit and because we believed interest rate swaps could potentially generate attractive returns. (Duration is a measure of the Fund’s sensitivity to changes in interest rates.) As interest rates declined |
2
FUND RESULTS
| substantially during the spring, we reduced the Fund’s duration position so that it was just over three years by the end of the Reporting Period. In our view, interest rates swaps had become less effective as a hedge, and we considered them less attractive from a potential return standpoint. |
In October 2020, the Fund changed the way it gained exposure to energy master limited partnerships (“MLPs”), shifting from direct investments in energy MLPs to an investment in the Goldman Sachs MLP Energy Infrastructure Fund. The Fund maintained a small allocation to energy MLPs, given what we considered to be their attractive valuations following a decline in the early part of the Reporting Period. |
At the end of the Reporting Period, the Fund was invested 40.9% in equities and 63.4% in fixed income. This breakout is inclusive of derivatives exposure in both asset classes but does not necessarily include the cash to support those positions. Derivatives positions are mostly supported by cash held in the Fund specifically to cover its exposure and any potential margin calls or future losses experienced. |
| Q | What was the Fund’s 12-month distribution rate and what was its 30-Day SEC yield during the Reporting Period? |
| A | During the Reporting Period, the Fund’s Class A, Class C, Institutional, Investor, Class R6 and Class P Shares provided 12-month distribution rates of 3.39%%, 2.70%, 3.66%, 3.56%, 3.67% and 3.67%, respectively. (The 12-month distribution rate is calculated by taking the sum of all cash distributions to shareholders over the past 12 months and dividing this sum by the Fund’s month-end net asset value (“NAV”) for the last month of the period. This rate includes capital gain/loss distributions, if any. This is not an SEC yield.) On October 31, 2020, the Fund’s 30-Day Standardized Subsidized SEC yields for its Class A, Class C, Institutional, Investor, Class R6 and Class P Shares were 2.79%, 2.19%, 3.28%, 3.20%, 3.29% and 3.29%, respectively. (The 30-Day Standardized Subsidized SEC Yield is calculated in accordance with SEC regulations and is determined by dividing the Fund’s net investment income per share earned over the 30-day period by the Fund’s maximum public offering price per share on the last day of such period, which figure is then annualized. The 30-Day Standardized Subsidized SEC Yield may differ from the distribution rate because of the exclusion of distributed capital gains. The 30-Day Standardized Subsidized SEC Yield reflects any fee waivers and/or expense reimbursements in effect during the period, without which the yield would be reduced.) |
| Q | What key factors had the greatest impact on the performance of the Fund’s equity allocation during the Reporting Period? |
| A | Relative to the Russell Index, stock selection had the greatest negative impact on the Fund’s equity allocation during the Reporting Period. The Fund’s call writing strategy, which seeks to generate additional cash flow and potentially reduce volatility by sales of call options on the S&P 500® Index or other regional stock market indices (or related ETFs), also detracted from its performance during the Reporting Period. |
| Q | Which equity market sectors most significantly affected Fund performance during the Reporting Period? |
| A | During the Reporting Period, the Fund’s overweight positions compared to the Russell Index in the health care and energy sectors detracted from its returns. An underweight in consumer staples further hurt performance. Stock selection in all three sectors also had a negative impact on returns. On the positive side, the Fund benefited from overweight positions in information technology, industrials and utilities. Stock selection in all three sectors also added to performance. |
| Q | Which stocks detracted significantly from the Fund’s relative performance during the Reporting Period? |
| A | During the Reporting Period, the largest detractors from the Fund’s performance relative to the Russell Index were Royal Dutch Shell, Klépierre and Energy Transfer, L.P. |
The top detractor was Royal Dutch Shell, a multinational oil and gas company headquartered in the Netherlands and incorporated in the U.K. In addition to its core businesses of oil and gas production, refining and marketing, and petrochemicals manufacturing, Royal Dutch Shell has some exposure to alternative fuels and other renewable energies. The company’s stock price declined along with the broader energy sector during the Reporting Period, as the spread of COVID-19 depressed demand for oil and gas. Its shares were also hurt by the news of a dividend cut. At the end of the Reporting Period, we remained positive about Royal Dutch Shell given its cash flow generation and our belief that the company should be able to grow its dividend in 2021. |
Klépierre, a French real estate investment trust (“REIT”) that owns shopping centers across Europe and office properties in Paris, also hampered performance as the company suffered along with the broader retail and office sectors during the |
3
FUND RESULTS
| Reporting Period. All of Klépierre’s business segments had been hurt by the COVID-19 pandemic. We eliminated the Fund’s position during March 2020 because of our concerns about the lasting effects of COVID-19 on the retail and office sectors. |
We considered Energy Transfer, L.P. to be a high quality pipeline asset that could potentially generate predictable cash flow and provide the Fund with exposure to energy MLPs. Unfortunately, the underlying commodity environment deteriorated more sharply than we anticipated, stressing the entire energy MLP market segment. We eliminated the Fund’s investment in Energy Transfer, L.P. during the Reporting Period to allocate capital to stocks with what we believed were greater risk/reward profiles. |
| Q | Which stocks contributed significantly to the Fund’s relative performance during the Reporting Period? |
| A | Compared to the Russell Index, the Fund’s positioning in Apple, Microsoft and Schneider Electric contributed positively to relative returns during the Reporting Period. |
Apple, which designs and manufactures mobile communication and media devices, personal computers and portable digital music players, added most to the Fund’s performance. In the final months of 2019, Apple’s shares advanced on market optimism about the company’s 2020 and 2021 outlook. Indeed, during the first three quarters of 2020, the company consistently beat consensus expectations for both its revenue and profit growth. Apple’s smartphone business, in particular, performed much better than market expected. Additionally, sales of iPads and Mac models benefited from work-from-home spending. At the end of the Reporting Period, we maintained our favorable view of Apple because of what we saw as its continued innovation and earnings growth. |
Microsoft, the giant developer and marketer of software and hardware services, benefited from sharp increases in demand for cloud-based computing and storage services. Microsoft has been successful in migrating enterprise customers to its cloud platform and remains a major player in the public cloud market. At the end of the Reporting Period, we remained positive on Microsoft and continued to believe it is a well-diversified, high quality company led by an excellent management team. |
Schneider Electric, a France-headquartered provider of energy and automation digital solutions, benefited from broad-based industrial recovery during the Reporting Period. In our view, the market has not fully appreciated the company’s strong portfolio of energy technologies, real-time automation, software and services, which resulted in—and could potentially continue to fuel—accelerating revenue growth and impressive margin leverage. |
| Q | Were any significant purchases or sales made within the equity allocation of the Fund during the Reporting Period? |
| A | During the Reporting Period, the Fund initiated a position in Bristol-Myers Squibb, which engages in the discovery, development, licensing, manufacture, marketing, distribution and sale of biopharmaceutical products. In our view, the market under-appreciated the pipeline opportunity from the company’s acquisition of biopharmaceutical company Celgene early in the Reporting Period. We believed Bristol-Myers Squibb was priced very attractively, and we saw potential benefits in new U.S. Food and Drug Administration approvals for different treatment options. |
The Fund also established a position in Eaton, a multinational power management company. We believe its chief executive officer has done a good job of reshaping Eaton’s portfolio of businesses and driving operational changes. The company has also been able to reliably generate attractive free cash flow, in our view. We see value in Eaton’s end-market exposure to certain recovering sectors, such as commercial aerospace, and we believe it is well positioned to benefit from incremental government stimulus focused on infrastructure. |
Among sales completed during the Reporting Period was the Fund’s position in Northern Trust. We had a less positive view than the market on the financial holding company’s operational efficiency in the near term, and we had concerns about continued growth in its operating expenses. As a result, we chose to exit the position and allocate the capital to higher conviction ideas. |
We also eliminated the Fund’s position in British-Dutch international consumer goods company Unilever NV during the Reporting Period in favor of what we considered to be greater risk/reward opportunities. |
| Q | What changes were made to the Fund’s equity market sector weightings during the Reporting Period? |
| A | During the Reporting Period, we increased the Fund’s exposures to the utilities and health care sectors. We reduced the Fund’s exposures to the energy and financials sectors. At |
4
FUND RESULTS
| the end of the Reporting Period, the Fund was overweight relative to the Russell Index in the information technology, health care, utilities, industrials and materials sectors. The Fund was underweight compared to the Russell Index in the financials, communication services, and consumer discretionary sectors. Relative to the Russell Index, the Fund was rather neutrally weighted in the energy, consumer staples and real estate sectors at the end of the Reporting Period. |
| Q | Which fixed income market segments significantly affected the Fund’s performance during the Reporting Period? |
| A | Relative to the ICE BofAML Index, specific bottom-up selection of industrial-related high yield corporate bonds and investment grade corporate bonds detracted from the Fund’s returns. Conversely, the Fund benefited from its underweight position in the energy and industrial manufacturing high yield market segments. |
| Q | How did the Fund’s tactical duration strategy and yield curve positioning affect performance during the Reporting Period? |
| A | During the Reporting Period, the Fund’s tactical duration strategy had a positive impact on performance. As mentioned previously, we extended the Fund’s duration position, using interest rate swaps, as we sought to mitigate potential risk within equities and high yield corporate credit and because we believed interest rate swaps could potentially generate attractive returns. This positioning added to the Fund’s performance during the Reporting Period. We do not actively manage the Fund’s yield curve positioning as part of our investment process. (Yield curve is a spectrum of interest rates based on maturities of varying lengths.) However, during the Reporting Period, we made decisions that affected the Fund’s yield curve position. Specifically, we adjusted the tenor of the interest rate swaps used as part of the Fund’s tactical duration strategy, which had a positive impact on performance. (Tenor refers to the length of time remaining before a financial contract expires.) |
| Q | What changes were made to the Fund’s fixed income weightings during the Reporting Period? |
| A | During the Reporting Period, we increased the Fund’s exposures to the banking, technology and diversified industrials market segments. We decreased its exposures to the telecommunications, cable media, and metals and mining market segments. At the end of the Reporting Period, the Fund’s largest overweights relative to the ICE BofAML Index were in the technology, financials and non-cable media market segments, while its largest underweight positions were in the electric utilities, retail and apparel, and transportation market segments. |
| Q | How did the Fund use derivatives and similar instruments during the Reporting Period? |
| A | As mentioned previously, the Income Builder Team wrote equity index options on a portion of the Fund’s equity allocation in an effort to generate additional cash flow and potentially reduce volatility (negative impact on performance). In addition, equity futures were employed to gain passive exposure to the equity markets (positive impact on performance). Within the Fund’s fixed income allocation, the Income Builder Team used interest rates swaps and U.S. Treasury futures as cost-efficient instruments to provide greater precision and versatility in the management of duration (both had a positive impact on performance). To hedge against currency risk (that is, the risk that certain currencies might fluctuate in value), the Fund employed currency forwards (neutral impact) during the Reporting Period. |
| Q | What is the Income Builder Team’s tactical view and strategy for the months ahead? |
| A | At the end of the Reporting Period, the Income Builder Team believed the key headwinds to global economic growth were more stringent COVID-19 control measures, low employment growth, weak corporate profits and continued softness in services sector activity. The factors supportive of economic growth, in our view, were high household savings rates; the rebuilding of inventories, which should support manufacturing output; accommodative financial conditions (particularly in the U.S.); and strong housing markets. In the near term, we expected central banks to keep interest rates low and for fiscal policy to be a key driver of changes in the macro and market environments. |
Regarding equities, we thought low interest rates, slow economic growth and continued uncertainty were an excellent backdrop for higher yielding stocks. Although they underperformed the broad equity and fixed income markets during the Reporting Period, higher yielding stocks are likely to do better in the near term, we believe. First, market leadership was narrow during the Reporting Period, but we expected it to expand going forward. Second, investors have been fearful about dividend cuts, but we believed these concerns were largely in the past, as dividends have stabilized since the uptick in cuts and suspensions stemming |
5
FUND RESULTS
| from the COVID-19 global pandemic. In the 2020 calendar year through October, dividend payments for the S&P 500® Index totaled $361 billion, which was on pace to equal 2019 pre-COVID-19 pandemic levels. During September, there were no cuts or suspensions, while there were 11 dividend increases and two dividend initiations. Third, higher yielding stocks have an affiliation with value stocks, which were out of favor during the Reporting Period. Value stocks, especially those perceived as defensive by investors, were likely to become more attractive, in our view. Overall, we expected the macro backdrop to provide a tailwind for higher yielding stocks, especially relative to bonds. At the end of the Reporting Period, more than 75% of U.S. equities and 81% of non-U.S. equities were yielding more than a 10-year U.S. Treasury security. Additionally, in our opinion, higher yielding equities have lower risk than many other equities due to their higher and more predictable cash flows. Furthermore, we believed higher yielding equities have less exposure to U.S. government risk because the underlying businesses generate significant domestic revenues and may not be significantly affected by higher corporate taxes since many of them do not pay taxes and some (e.g., REITs, MLPs, and utilities) pass through taxes to investors. In addition, we believed select sectors, including utilities and transportation infrastructure, may benefit from increased fiscal spending. Lastly, while equities remained more volatile than fixed income at the end of the Reporting Period, we believed it was possible to mitigate risk using call writing, and many investors have taken on more duration and credit risk than they had previously, in our view, narrowing the difference in risk between the two assets. |
Within fixed income, we maintained the Fund’s overweight in high yield corporate bonds at the end of the Reporting Period, as we believed they were well-supported by market technicals (supply and demand conditions) and remained attractive given low global interest rates and hedging costs as investors moved down the risk spectrum in search of yield. Additionally, the high yield corporate bond market saw approximately $200 billion in “fallen angels” (or investment grade corporate bonds downgraded to high yield status) during the Reporting Period, which has improved the quality of the investable universe and provided investors with more investment opportunities, in our opinion. That said, we recognized that investor risk sentiment may remain challenged in the near term due to high volatility around the COVID-19 trends and the resulting impact on the economy and a possible re-escalation of geopolitical tensions. Accordingly, at the end of the Reporting Period, we were focused on identifying issuers with what we considered to be diversified product profiles, strong liquidity levels, efficient cost management and the ability to survive regardless of re-opening outcomes. From a market segment standpoint, we favored building materials due to these companies’ cost controls and margin resilience. The sector also benefits from positive new construction and repair and remodel trends. We maintained a focus on specialty chemicals, where profit margins were stronger than within commodity chemicals. We increased the Fund’s positioning in financials and banking, as Initial Public Offerings within these market segments were well received owing to attractive enterprise values, strong cash flows and compelling new home mortgage interest rates. The Fund remained underweight sectors facing secular challenges and government policy uncertainty. In particular, it was underweight high yield corporate bonds in the energy sector, which remained challenged by volatile crude oil prices, and in the health care sector, which faced idiosyncratic issues including litigation, pricing legislation and heightened regulatory scrutiny. The Fund was also underweight consumer cyclical market segments, such as retail and apparel and gaming and leisure, at the end of the Reporting Period. From a credit ratings perspective, we continued to favor higher quality bonds that offer good convexity and/or greater spread compression. (Convexity is a measure of the curvature in the relationship between bond prices and bond yields that demonstrates how the duration of a bond changes as the interest rate changes. Spreads are yield differentials between bonds of similar maturity.) |
6
FUND BASICS
Income Builder Fund
as of October 31, 2020
| TOP TEN EQUITY HOLDINGS AS OF 10/31/201 | ||||||||
| Holding | % of Net Assets | Line of Business | ||||||
| Johnson & Johnson | 1.0 | % | Pharmaceuticals | |||||
| The Home Depot, Inc. | 0.9 | Specialty Retail | ||||||
| Bristol-Myers Squibb Co. | 0.9 | Pharmaceuticals | ||||||
| Verizon Communications, Inc. | 0.8 | Diversified Telecommunication Services | ||||||
| Linde PLC | 0.8 | Chemicals | ||||||
| Comcast Corp. Class A | 0.8 | Media | ||||||
| Schneider Electric SE ADR | 0.8 | Electrical Equipment | ||||||
| The Coca-Cola Co. | 0.8 | Beverages | ||||||
| Honeywell International, Inc. | 0.8 | Industrial Conglomerates | ||||||
| Cisco Systems, Inc. | 0.7 | Communications Equipment | ||||||
| 1 | The top 10 holdings may not be representative of the Fund’s future investments. |
| FUND’S EQUITY SECTOR ALLOCATIONS VS. BENCHMARK2 | ||||||
| As of October 31, 2020 | ||||||
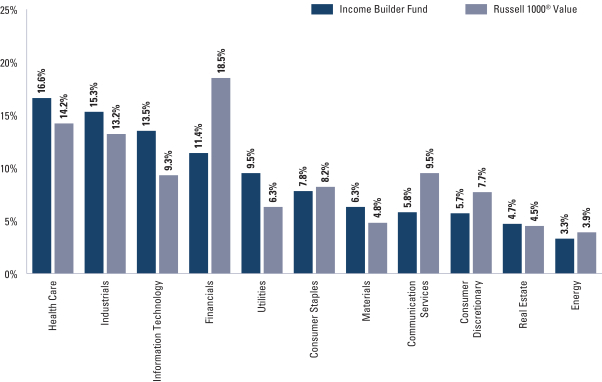
| 2 | The Fund is actively managed and, as such, its composition may differ over time. Consequently, the Fund’s overall sector allocations may differ from the percentages contained in the graph above. The graph categorizes investments using the Global Industry Classification Standard (“GICS”), however, the sector classifications used by the portfolio management team may differ from GICS. The percentage shown for each investment category reflects the value of investments in that category as a percentage of the total value of the Fund’s Equity investments. The graph depicts the Fund’s investments but may not represent the Fund’s market exposure due to the exclusion of certain derivatives, if any, as listed in the Additional Investment Information section of the Schedule of Investments. |
7
FUND BASICS
| FUND’S FIXED INCOME COMPOSITION3 |
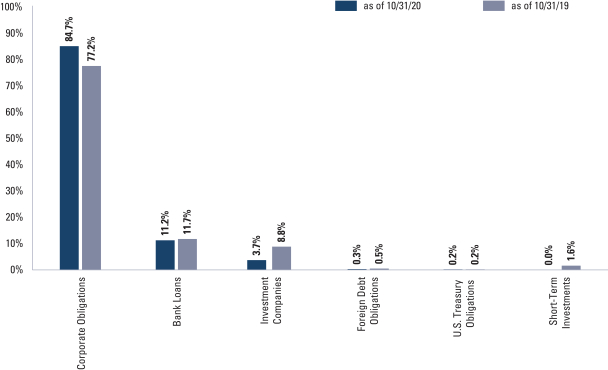
| 3 | The percentage shown for each investment category reflects the value of investments in that category as a percentage of the Fund’s Fixed Income investments. The graph depicts the Fund’s investments but may not represent the Fund’s market exposure due to the exclusion of certain derivatives, if any, as listed in the Additional Investment Information section of the Schedule of Investments. |
For more information about your Fund, please refer to www.GSAMFUNDS.com. There, you can learn more about your Fund’s investment strategies, holdings, and performance.
8
GOLDMAN SACHS INCOME BUILDER FUND
Performance Summary
October 31, 2020
The following graph shows the value, as of October 31, 2020, of a $1,000,000 investment made on November 1, 2010 in Institutional Shares. For comparative purposes, the performance of the Fund’s current benchmarks, the Russell 1000® Value Index and the ICE BofAML BB to B U.S. High Yield Constrained Index, are shown. Performance reflects applicable fee waivers and/or expense limitations in effect during the periods shown and in their absence, performance would be reduced. Returns do not reflect the deduction of taxes that a shareholder would pay on Fund distributions or the redemption of Fund shares. The returns set forth below represent past performance. Past performance does not guarantee future results. The Fund’s investment return and principal value will fluctuate so that an investor’s shares, when redeemed, may be worth more or less than their original cost. Current performance may be lower or higher than the performance quoted below. Please visit our web site at www.GSAMFUNDS.com to obtain the most recent month-end returns.
| Income Builder Fund’s 10 Year Performance |
Performance of a $1,000,000 Investment, with distributions reinvested, from November 1, 2010 through October 31, 2020.
| Average Annual Total Return through October 31, 2020* | One Year | Five Years | Ten Years | Since Inception | ||||||||||
Class A | ||||||||||||||
Excluding sales charges | 2.29% | 5.24% | 6.67% | — | ||||||||||
Including sales charges | -3.33% | 4.06% | 6.07% | — | ||||||||||
| ||||||||||||||
Class C | ||||||||||||||
Excluding contingent deferred sales charges | 1.57% | 4.46% | 5.87% | — | ||||||||||
Including contingent deferred sales charges | 0.55% | 4.46% | 5.87% | — | ||||||||||
| ||||||||||||||
Institutional Class | 2.68% | 5.65% | 7.09% | — | ||||||||||
| ||||||||||||||
Investor | 2.53% | 5.50% | 6.92% | — | ||||||||||
| ||||||||||||||
Class R6 (Commenced July 31, 2015) | 2.70% | 5.65% | N/A | 5.04% | ||||||||||
| ||||||||||||||
Class P (Commenced April 16, 2018) | 2.70% | N/A | N/A | 5.81% | ||||||||||
| ||||||||||||||
| * | These returns assume reinvestment of all distributions at NAV and reflect a maximum initial sales charge of 5.50% for Class A and the assumed contingent deferred sales charge for Class C Shares (1% if redeemed within 12 months of purchase). Because Institutional, Investor, Class R6 and Class P Shares do not involve a sales charge, such a charge is not applied to their Average Annual Total Return. |
9
FUND RESULTS
Goldman Sachs Rising Dividend Growth Fund
Investment Objective
The Fund seeks long-term growth of capital and current income.
Portfolio Management Discussion and Analysis
Effective at the close of business on June 30, 2020 (the “Effective Date”), Dividend Assets Capital, LLC (“DAC”) no longer served as sub-adviser to the Fund and no longer managed the Fund’s investments in master limited partnerships (“MLPs”) and energy infrastructure companies (the “MLP & Energy Infrastructure Sleeve”). Beginning at the close of business on the Effective Date, Goldman Sachs Asset Management, L.P.’s (“GSAM”) Energy & Infrastructure Team (“E&I Team”) manages the MLP & Energy Infrastructure Sleeve. Below, the Quantitative Investment Strategies (“QIS”) portfolio management team, the Goldman Sachs Global Portfolio Solutions Group and the E&I Team discuss the Goldman Sachs Rising Dividend Growth Fund’s (the “Fund”) performance and positioning for the 12-month period ended October 31, 2020 (the “Reporting Period”).
| Q | How did the Fund perform during the Reporting Period? |
| A | During the Reporting Period, the Fund’s Class A, Class C, Institutional, Investor, Class R6, Class R and Class P Shares generated average annual total returns, without sales charges, of -1.80%, -2.50%, -1.47%, -1.55%, -1.47%, -2.01% and -1.46%, respectively. These returns compare to the 9.68% average annual total return of the Fund’s benchmark, the Standard & Poor’s® 500 Index (with dividends reinvested) (the “S&P 500 Index”), during the same time period. |
| Q | What economic and market factors most influenced the U.S. equity markets as a whole during the Reporting Period? |
| A | The S&P 500 Index gained 3.63% in November 2019 and 3.02% in December 2019. Stock returns accelerated with an uptick of U.S. manufacturing and service sector business surveys as well as a consistently strong labor market, as evidenced by the U.S. adding more than 200,000 jobs in November, double the break-even pace of long-term job growth. These developments helped restore market confidence, while fundamentals of low core inflation and reduced trade war tensions fended off imminent recession risk. |
The S&P 500 Index fell 19.60% in the first quarter of 2020. The U.S. equity market sold off as the emergence and rapid spread of COVID-19 caused non-essential businesses to close. Jobless claims increased to 6.6 million and nonfarm payrolls decreased by 701,000 for the month of March, leading the U.S. government and the U.S. Federal Reserve (“Fed”) to respond with aggressive economic stimulus. In addition, oil prices fell as supply increased and demand declined. |
The S&P 500 Index gained 20.54% in the second quarter of 2020. The U.S. equity market appreciated despite a surge in COVID-19 cases in regional pockets of the country, causing local governments to pause reopening plans and revisit previous lockdown measures. Positive market sentiment was buoyed by better than consensus expected economic data, such as nonfarm payrolls increasing 7.3 million over May and June, driving the unemployment rate down to 11.1% from a high of more than 14% in the prior quarter. |
The S&P 500 Index increased 8.93% in the third quarter of 2020. The U.S. equity markets continued to rally despite pressure from the pandemic. Market strength was supported by a sharp cyclical recovery in economic data, with the Institute for Supply Management’s Purchasing Managers’ Index increasing to 56.0 in August, a reading that was firmly in expansionary territory. Optimism around a potential COVID-19 vaccine also helped support equity markets during the quarter. |
In a sharp reversal, the S&P 500 Index decreased in October 2020, returning -2.66% for the month. While the majority of third calendar quarter earnings results for U.S. companies that reported in October came in above consensus expectations, equity prices declined against a backdrop of |
10
FUND RESULTS
| heightened market expectations. Political uncertainty surrounding then-upcoming U.S. elections and a lack of further fiscal stimulus were also sources of volatility during the month. Despite these headwinds, some support for equities was provided by a 33.1% increase in U.S. Gross Domestic Product (“GDP”) in the third quarter of 2020, as businesses resumed some activity that was postponed or restricted as a result of COVID-19. |
For the Reporting Period overall, information technology, consumer discretionary and communication services were the best performing sectors in the S&P 500 Index. The weakest performing sector in the S&P 500 Index was energy, followed at some distance by financials and real estate. |
Within the U.S. equity market, large-cap stocks, as measured by the Russell 1000® Index, performed best, followed by mid-cap stocks, as measured by the Russell Midcap® Index, each capitalization segment posting positive absolute returns. Small-cap stocks, as measured by the Russell 2000® Index, were weakest, posting negative absolute returns during the Reporting Period as a whole. From a style perspective, growth-oriented stocks significantly outpaced value-oriented stocks across the capitalization spectrum. (All as measured by the FTSE Russell indices.) |
| Q | What economic and market factors most influenced energy MLPs as a whole during the Reporting Period? |
| A | Energy-related assets broadly sold off during the Reporting Period. Energy infrastructure master limited partnerships (“MLPs”) generally, as measured by the Alerian MLP Index,1 produced a total return of -42.43%, while the broader midstream2 sector, as measured by the Alerian Midstream Energy Index3 (which includes both energy MLPs and “C” corporations), generated a total return of -32.59%. |
| In the last two months of 2019, when the Reporting Period began, the growth outlooks for the U.S. shale industry and the global economy were positive and stable overall. Conditions abruptly changed in early 2020 with the emergence and spread of COVID-19 and the start of a crude oil producer price war, which together created a more challenging and uncertain global environment for the energy markets and energy-related equities. |
| During the first quarter of 2020, the energy markets experienced unprecedented weakness, driven by two factors. The first was a demand-side shock, as quarantine efforts and travel restrictions implemented to reduce the spread of COVID-19 led to a sharp drop in demand. The second was a supply-side shock, as the Organization of the Petroleum Exporting Countries (“OPEC”) and Russia failed to reach an agreement on production cuts and entered into a crude oil price war, which ultimately added supply to an already oversupplied market. Crude oil prices fell, with the prices of West Texas Intermediate (“WTI”) and Brent crude oil declining approximately 25% and 24%, respectively, on March 9th, the first trading day after the OPEC-Russia talks collapsed. Crude oil prices then continued to trend down amid significant volatility, fueled by market concerns around demand given the global economic impact of COVID-19 as well as by shorter-term uncertainty around U.S. storage constraints. |
| As for energy-related equities, they sold off during the first quarter of 2020 on investor uncertainty about the ultimate impact on the U.S. shale industry of the simultaneous demand-side and supply-side shocks. We believe the sell-off was exacerbated in the midstream sector by technical selling, as closed-end funds de-levered to reduce volatility and, in some cases, to maintain compliance with leverage covenants. We estimate more than $3 billion in holdings were sold by closed-end funds during the first 15 trading days of March. To put that in context, $3 billion represented 16% of the total dollars traded across all of the Alerian Index’s constituents for the last 15 trading days in February. Midstream equities |
| 1 | Source: Alerian. The Alerian MLP Index is the leading gauge of energy infrastructure MLPs. The capped, float-adjusted, capitalization-weighted index, whose constituents earn the majority of their cash flow from midstream activities involving energy commodities, is disseminated real-time on a price-return basis (AMZ) and on a total-return basis (AMZX). It is not possible to invest directly in an unmanaged index. |
| 2 | The midstream component of the energy industry is usually defined as those companies providing products or services that help link the supply side (i.e., energy producers) and the demand side (i.e., energy end-users for any type of energy commodity. Such midstream businesses can include, but are not limited to, those that process, store, market and transport various energy commodities. |
| 3 | Source: Alerian. The Alerian Midstream Energy Index is a broad-based composite of North American energy infrastructure companies. The capped, float-adjusted, capitalization-weighted index, whose constituents earn the majority of their cash flow from midstream activities involving energy commodities, is disseminated real-time on a price-return basis (AMNA), total-return basis (AMNAX), net total-return (AMNAN), and adjusted net total return (AMNTR) basis. It is not possible to invest directly in an unmanaged index. |
11
FUND RESULTS
| were also pressured during the first calendar quarter by the magnitude of uncertainty within the equities and energy markets broadly, even though midstream cash flows remained predominantly volume based, rather than commodity price sensitive. This was due to contractual agreements, which, in our opinion, helped manage one-to-one exposure between midstream cash flows and volume declines. Furthermore, in response to severe commodity price weakness during the first calendar quarter, a number of midstream companies announced plans to strengthen their balance sheets, with some keeping their distributions flat, some cutting distribution payout levels, and many reducing their expected capital expenditures for 2020. In most cases, these defensive actions were rewarded by investors. |
| In April 2020, the energy market and energy-related equities experienced some relief, as the crude oil price war appeared to reach a resolution. OPEC+ members met, starting on April 9th, and proposed their largest ever production cut of 9.7 million barrels per day on April 12th. (OPEC+ is composed of OPEC countries and non-OPEC oil producing countries, most notably Russia.) Saudi Arabia subsequently deepened its commitment to the production cut, reducing output by an additional one million barrels per day. Meanwhile, several other countries announced voluntary production cuts. Despite the April OPEC+ production agreement, significant crude oil oversupply led to logistical issues and storage capacity constraints in the U.S., resulting in unprecedentedly low and even negative WTI futures contracts for the first time in history. Midstream equities remained relatively resilient during the month, as we believe many investors looked past transient supply-side issues and instead valued equities on longer-dated commodity price expectations. |
| In May 2020, market expectations about the supply-demand gap started to narrow, as crude oil demand improved relative to the troughs seen in early April and global supply levels began to react to lower prices in the marketplace. In particular, production cuts from OPEC+ members, as well as market-driven reductions in U.S. production, slowed inventory builds. Meanwhile, future production activity indicators, such as rig counts and 2020 capital expenditure expectations for exploration and production companies, fell substantially. As a result, the crude oil market started to show signs of tightening in May, allowing prices to rebound off their April lows. Energy-related equities, particularly midstream equities, experienced a meaningful recovery, with the Alerian MLP Index and the Alerian Midstream Energy Index rising 136% and 98%, respectively, from their lows on March 18th through the beginning of June. |
| Crude oil prices were volatile but traded around $40 per barrel during the last four months or so of the Reporting Period. While midstream markets, as measured by the Alerian MLP Index and Alerian Midstream Energy Index, rallied off of their lows through early June, both indices subsequently traded lower and were down 28% and 21%, respectively, from mid-June through the end of the Reporting Period. |
| Since June, we believe midstream equity price performance was largely driven by weak sentiment, rather than fundamentals. In our view, weak sentiment was a function of a few factors. These included the then-upcoming U.S. election-related uncertainty, given the seemingly unfavorable oil and gas policy views from Democrats. We believe midstream equity price performance was also hurt by Environmental, Social and Governance (“ESG”)-related capital allocation headwinds and terminal value concerns for oil and gas assets given the increased interest in renewable energy. And lastly, continued equity price pressure resulting from the sector’s transition from “growth” to “value” not only compressed multiples to some of the lowest levels on record but also impacted equity prices, as “growth” has outperformed “value” in recent years. |
Although sentiment weighed on midstream equity price performance, the fundamental backdrop meaningfully improved over the last four months or so of the Reporting Period, in our view. First, oil demand picked up steam. We track traffic data across the world, and within the largest cities in Asia and Europe, traffic congestion grew to close to pre-COVID levels. Although the U.S. recovery in traffic congestion has been slower, we also started to see improvements domestically. Second, on the supply side, we saw production discipline from OPEC+ countries as well as from the U.S. shale producers, which narrowed the supply/demand gap and provided upside support for crude oil prices. Further, capital expenditures have been significantly reduced, a welcomed and appropriate change, in our view. Finally, even with the dramatic decline in demand during the second quarter of 2020, midstream cash flows were rather resilient. If one were to look at a list of the most prominent midstream companies, earnings before interest, taxes, depreciation and amortization (“EBITDA”) on midstream companies was only down an average of approximately 11% year-over-year during the second calendar quarter. During the same period, these companies fell an average of 44% on a price basis, |
12
FUND RESULTS
| which is a clear disconnect between equity price performance and the sector’s fundamentals, in our view. |
| Q | What key factors were responsible for the Fund’s performance during the Reporting Period? |
| A | The Fund underperformed the S&P 500 Index on a relative basis for the Reporting Period. |
During the Reporting Period, the Fund’s dividend-paying investments underperformed the S&P 500 ex-Energy Index, the benchmark used for the dividend-paying growers portion of the Fund. Stock selection detracted most from relative results within this portion of the Fund. Sector allocation also detracted, albeit modestly. |
The MLP & Energy Infrastructure Sleeve is providing attribution in this shareholder report for the period from August 1, 2020 through October 31, 2020 (the “MLP & Energy Attribution Period”). Although the E&I Team took over management of the MLP & Energy Infrastructure Sleeve at the close of business on June 30, 2020, GSAM gave the E&I Team the month of July to transition the MLP & Energy Infrastructure Sleeve to its model portfolio, and, as a result, the official performance track record for the MLP & Energy Infrastructure Sleeve under its new management started on August 1, 2020. During the MLP & Energy Attribution Period, the MLP & Energy Infrastructure Sleeve posted disappointing negative absolute returns but outperformed the Alerian MLP Index, the benchmark used for the MLP & Energy Infrastructure Sleeve of the Fund, on a relative basis. In managing the MLP & Energy Infrastructure Sleeve, the E&I Team remained focused on high quality midstream companies with strong dividend and distribution coverage, cash flow growth potential and what it considered to be a robust outlook for free cash flow generation and healthy balance sheets. The E&I Team believes this focus contributed positively to the MLP & Energy Infrastructure Sleeve’s outperformance relative to the Alerian MLP Index. More specifically, such outperformance was driven by effective allocation positioning and, to a lesser degree, by favorable stock selection. |
| Q | Which equity market sectors most significantly affected Fund performance during the Reporting Period? |
| A | The dividend-paying growers portion of the Fund does not take explicit sector bets relative to the S&P 500 ex-Energy Index but rather allocations are the result of stock selection. That said, the sectors that detracted most on a relative basis to the S&P 500 ex-Energy Index during the Reporting Period were information technology, communication services and consumer discretionary. Partially offsetting these detractors were financials, industrials and health care, which contributed positively to this portion of the Fund’s relative results. |
| Q | Which stocks detracted significantly from the Fund’s performance during the Reporting Period? |
| A | Detracting most from the Fund’s results relative to the S&P 500 ex-Energy Index during the Reporting Period were underweight positions in information technology giant Apple, e-commerce retailing leader Amazon.com, software behemoth Microsoft and three-dimensional (“3D”) graphics processors developer NVIDIA and an overweight position in advertising, marketing and corporate communications services provider Omnicom Group. Apple, Amazon.com, Microsoft and NVIDIA outperformed the S&P 500 ex-Energy Index and Omnicom Group underperformed the S&P 500 ex-Energy Index during the Reporting Period. |
| Q | What were some of the Fund’s best-performing individual stocks during the Reporting Period? |
| A | The top individual contributors to the Fund’s relative performance during the Reporting Period were overweight positions in health care products manufacturer Danaher and interactive entertainment software developer Activision Blizzard and underweight positions in diversified financial services companies Wells Fargo & Co., aerospace and defense company Boeing and global financial services and retail banking institution JPMorgan Chase. Danaher and Activision Blizzard outperformed the S&P 500 ex-Energy Index, and Wells Fargo & Co., Boeing and JPMorgan Chase underperformed the S&P 500 ex-Energy Index during the Reporting Period. |
| Q | Which industries within the Alerian MLP Index most significantly affected Fund performance during the MLP & Energy Attribution Period? |
| A | As measured by the Alerian MLP Index, the sub-industries that contributed most positively on a relative basis during the MLP & Energy Attribution Period were petroleum pipeline transportation, power generation, marketing/wholesale and natural gas pipeline transportation. Having an underweight to petroleum pipeline transportation, which underperformed the Alerian MLP Index during the MLP & Energy Attribution Period, and having exposure to power generation and marketing/wholesale, which are not constituents of the Alerian MLP Index but which posted positive absolute returns during the MLP & Energy Attribution Period, helped |
13
FUND RESULTS
| most. Effective security selection helped most within the petroleum pipeline transportation and natural gas pipeline transportation sub-industries. |
A closer look at the power generation industry is worthwhile, in our view, as it proved to be a relatively defensive segment amid the volatility in the energy markets. In addition, within the power generation industry, exposure to renewable power generation, an industry which has experienced increased investor interest as well as supportive corporate and regulatory announcements, contributed positively to relative performance during the MLP & Energy Attribution Period. |
The sub-industries that detracted most from the MLP & Energy Infrastructure Sleeve of the Fund during the MLP & Energy Attribution Period were gathering & processing and other/liquefaction. Having an underweight to each hurt most, as each outpaced the Alerian MLP Index during the MLP & Energy Attribution Period. Weak stock selection in gathering & processing also detracted. |
| Q | What were some of the Fund’s best-performing MLPs during the MLP & Energy Attribution Period? |
| A | Relative to the Alerian MLP Index, among those MLPs that contributed most to the Fund’s performance during the MLP & Energy Attribution Period were NGL Energy Partners LP, Williams Cos. Inc. and Genesis Energy LP. |
NGL Energy Partners LP (NGL) is a diversified midstream MLP that provides multiple services, including transportation, storage, blending and marketing of crude oil, natural gas liquids, refined products/renewables and water solutions. Having no exposure to this weakly-performing MLP during the MLP & Energy Attribution Period contributed most positively to results relative to the Alerian MLP Index. NGL was negatively affected during the MLP & Energy Attribution Period, as one of the largest customers on its premier asset—Grand Mesa, a crude oil pipeline—entered into bankruptcy and fought to have its contracts with NGL rejected. In addition, NGL cut its distribution during the MLP & Energy Attribution Period, which was its second distribution reduction since the start of calendar year 2020. The announcement of an additional distribution cut weighed on NGL’s equity price performance. |
Williams Cos Inc. (WMB) is a C-corporation-structured energy infrastructure company primarily focused on gathering, processing, interstate transportation and storage of natural gas and natural gas liquids. Having exposure to WMB, an out-of-benchmark position that outperformed the Alerian MLP Index during the MLP & Energy Attribution Period, contributed positively to performance. We believe WMB’s better than market expected second quarter earnings results, announced in August 2020, and high quality asset base, which delivered rather steady operating results through the pandemic, made it a somewhat defensive holding amid the volatility experienced during the MLP & Energy Attribution Period. |
Genesis Energy LP (GEL) is a midstream MLP that provides energy infrastructure and logistics services. An underweight position in GEL relative to the Alerian MLP Index contributed positively, as GEL underperformed the Alerian MLP Index during the MLP & Energy Attribution Period. GEL remained more highly levered than many of its peers and a substantial portion of its EBITDA is derived from its sodium minerals and sulfur services segment, which is generally not underpinned by long-term contracts and which was negatively impacted by ripple effects of the COVID-19 pandemic. Given the variability in cash flows contributed by GEL’s soda ash business, the market expected it may be some time before GEL has a clear line of sight on sustainably reducing its leverage, a view that weighed negatively on GEL’s equity price performance. |
| Q | Which MLPs detracted significantly from the Fund’s performance during the MLP & Energy Attribution Period? |
| A | Among those MLPs detracting most from the Fund’s results relative to the Alerian MLP Index were EnLink Midstream LLC, DCP Midstream LP and CNX Midstream Partners LP, each of which outperformed the Alerian MLP Index during the MLP & Energy Attribution Period but in which the MLP & Energy Infrastructure Sleeve held either no position or an underweight position. |
The MLP & Energy Infrastructure Sleeve of the Fund had no exposure to EnLink Midstream LLC (ENLC), a provider of integrated midstream services, during the MLP & Energy Attribution Period. We believe ENLC’s better than consensus expected second quarter 2020 earnings results, announced in August 2020, along with its efforts to rein in spending and increase free cash flow, drove its share price improvement during the MLP & Energy Attribution Period. Additionally, ENLC may have experienced some amount of rebound after material underperformance versus the Alerian MLP Index during the first seven months of 2020. |
The MLP & Energy Infrastructure Sleeve of the Fund had an underweight position relative to the Alerian MLP Index in DCP Midstream LP (DCP), one of the largest natural gas |
14
FUND RESULTS
| gatherers in North America and a top producer and primary marketer of natural gas liquids. During the MLP & Energy Attribution Period, DCP reported strong second quarter 2020 earnings that significantly beat consensus earnings estimates and reaffirmed original pre-COVID guidance for the full calendar year. In the week following the positive earnings announcement, average analyst consensus’ next 12-month price target increased significantly. DCP may also have benefited from announced producer consolidation, which may create better capitalized and more rational counterparties. (A counterparty is the other party that participates in a financial transaction.) |
The MLP & Energy Infrastructure Sleeve of the Fund had no exposure to CNX Midstream Partners LP (CNXM), a midstream natural gas service provider that owns, operates and develops gathering and other midstream energy assets to service natural gas production in the Marcellus Shale in Pennsylvania and West Virginia. On July 27, 2020, CNX Resources Corporation (CNX), the parent of CNXM, announced it would acquire CNXM in an all-stock transaction, which subsequently closed on September 28, 2020. As a result, CNXM traded higher to converge with CNX’s equity price, which had experienced strong relative performance underpinned by an improvement in natural gas supply/demand dynamics. |
| Q | How did the Fund use derivatives during the Reporting Period? |
| A | The MLP portion of the Fund did not use derivatives during the Reporting Period. The dividend-paying equity investments portion of the Fund used equity index futures on an opportunistic basis during the Reporting Period to equitize its modest cash position. In other words, we put the Fund’s excess cash holdings to work by using them as collateral for the purchase of equity index futures. The use of these derivatives did not have a material impact on Fund results during the Reporting Period. |
| Q | Did the Fund make any significant equity purchases or sales during the Reporting Period? |
| A | The dividend-paying growers portion of the Fund uses a systematic, rules-based approach and thus equity purchases and sales are based solely on that quantitative process. |
| Q | Did the Fund make any significant purchases or sales of MLPs during the MLP & Energy Attribution Period? |
| A | Given the change in management of the MLP & Energy Infrastructure Sleeve, there were a number of purchases made in the month prior to and during the MLP & Energy Attribution Period. While several positions were trimmed, there were no sales of MLPs during the MLP & Energy Attribution Period. |
We established a position in Suburban Propane Partners, L.P., a retail propane gas marketer, due to what we saw as its relatively low volatility characteristics coupled with our constructive view on propane demand. In addition, the company had recently cut its distribution, and we felt this proactive step to protect its balance sheet was prudent and created an attractive entry point. |
During the MLP & Energy Attribution Period, COVID-19-related demand destruction and a lower production outlook weighed on energy equity markets. As a result, we established a position in Enbridge, which provides energy transportation, distribution and related services in North America, as we viewed the company’s size, scale, investment grade rating and overall defensive position as a compelling investment. |
Among those positions trimmed were those in Enterprise Products Partners, MPLX LP and Magellan Midstream Partners. |
| Q | Were there any notable changes in the Fund’s equity sector weightings during the Reporting Period? |
| A | As mentioned earlier, under the QIS team’s investment approach, the dividend-paying growers portion of the Fund does not take sector bets by design. Therefore, the dividend-paying investments portion of the Fund, using a quantitative process, strove to be similar to the S&P 500 ex-Energy Index in terms of sector allocation. We seek to provide exposure to high quality, dividend-paying growers within each sector. |
| Q | Were there any notable changes in the Fund’s MLP weightings during the MLP & Energy Attribution Period? |
| A | There were no notable changes in the Fund’s MLP weightings during the MLP & Energy Attribution Period. At the end of the Reporting Period, the MLP & Energy Infrastructure Sleeve had its largest allocations in the petroleum pipeline transportation, natural gas pipeline transportation and gathering & processing segments of the Alerian MLP Index. |
15
FUND RESULTS
| Q | How was the dividend-paying investments portion of the Fund positioned relative to the S&P 500 ex-Energy Index at the end of the Reporting Period? |
| A | As mentioned earlier, it is not part of the dividend-paying investments portion of the Fund’s approach to take sector bets. Thus, at the end of October 2020, the dividend-paying investments portion of the Fund had rather neutral positions in each sector of the S&P 500 ex-Energy Index, with the exception of communication services, wherein an underweighted position was held. |
| Q | Were there any changes to the Fund’s portfolio management team during the Reporting Period? |
| A | There were no changes in the dividend-paying investments portion of the Fund during the Reporting Period. As mentioned earlier, GSAM’s E&I Team assumed management of the Fund’s MLP & Energy Infrastructure Sleeve effective after the close of business on June 30, 2020. The lead portfolio manager on GSAM’s E&I Team is Kyri Loupis, a Managing Director at GSAM with 21 years of investment experience. |
| Q | What is the Fund’s tactical view and strategy for the months ahead? |
| A | The Fund seeks long-term growth of capital and current income. Within the dividend-paying growers sleeve, we maintained confidence at the end of the Reporting Period in high quality business models that have demonstrated commitment to grow their dividend in a rather stable manner. |
As for MLPs, we had an overall positive view ahead for 2021 at the end of the Reporting Period. From a macro perspective, crude oil demand had improved toward the end of the Reporting Period, not only internationally, but also in the U.S., and the possibility of a COVID-19 vaccine should only accelerate this improvement, in our opinion. At the same time, U.S. producers were showing unprecedented supply-side discipline, and the OPEC+ group was also showing solidarity. Assuming global production remains disciplined and demand increases on the back of rapid testing and a vaccine, Goldman Sachs Investment Research (“GIR”) is calling for Brent oil to hit $63 per barrel in 2021. Lower upstream drilling activity in the U.S. has reduced the need for more pipeline projects, which has resulted in midstream companies shifting their focus from new project spending to debt reduction and possible share buyback programs. Also, midstream capital expenditure (“CAPEX”) expectations into 2021 were down more than 50% at the end of the Reporting Period compared to 2019 year-end estimates. We believe this, coupled with lower distribution payouts for some midstream companies, has paved a path to strong free cash flow into 2021. This shift in capital allocation is long overdue, in our view, and more free cash flow-centric business models may well be a key factor for the long-term sustainability of the midstream market. In our opinion, the sector’s free cash flow potential has additionally created a significant opportunity for share repurchase programs, which we believe could be a meaningful catalyst for a recovery in equity prices given depressed valuations seen at the end of the Reporting Period. |
Looking through to 2025, we believe the midstream sector has the potential to generate $35-45 billion of excess cash after distributions and CAPEX. This equates to nearly 15% of the current market capitalization of companies generating positive free cash flow. To contextualize this more, in 2021 alone, Wells Fargo expected the sector to generate nearly $7 billion of excess cash. If even 50% of that was used for share buyback programs, that would reverse almost all of the outflows experienced through the end of October 2020. We have finally seen some midstream companies announce these programs in 2020, and we anticipate more buyback programs may well be announced from management teams in coming quarters. We feel this should not only be accretive to shareholder value but may also prove to be a strong technical tailwind for equity prices in the sector. |
While there are certainly still risks, such as further waves of COVID-19, we believe the risk/reward profile for the midstream sector at the end of the Reporting Period had skewed meaningfully positive at then-current levels. In managing the MLP & Energy Infrastructure Sleeve, we intend to remain focused on high quality companies with strong dividend/distribution coverage, cash flow growth potential and what we see as a robust outlook for free cash flow generation and healthy balance sheets. At the end of the Reporting Period, we believed the MLP & Energy Infrastructure Sleeve was well positioned to benefit from improvements in supply/demand dynamics. As always, we continue to monitor domestic and global economies, geopolitical factors, interest rates and equity market fundamentals as we actively manage the Fund. |
16
FUND BASICS
Rising Dividend Growth Fund
as of October 31, 2020
| . | TOP TEN HOLDINGS AS OF 10/31/201 | |||||||
| Holding | % of Net Assets | Line of Business | ||||||
| Comcast Corp. Class A | 2.4 | % | Media | |||||
| Activision Blizzard, Inc. | 2.2 | Entertainment | ||||||
| Danaher Corp. | 1.8 | Health Care Equipment & Supplies | ||||||
| UnitedHealth Group, Inc. | 1.7 | Health Care Providers & Services | ||||||
| MPLX LP | 1.7 | Oil, Gas & Consumable Fuels | ||||||
| ViacomCBS, Inc. Class B | 1.7 | Media | ||||||
| Medtronic PLC | 1.7 | Health Care Equipment & Supplies | ||||||
| Enterprise Products Partners LP | 1.6 | Oil, Gas & Consumable Fuels | ||||||
| CVS Health Corp. | 1.6 | Health Care Providers & Services | ||||||
| Stryker Corp. | 1.5 | Health Care Equipment & Supplies | ||||||
| 1 | The top 10 holdings may not be representative of the Portfolio’s future investments. The top 10 holdings exclude investments in money market funds. |
| FUND VS. BENCHMARK SECTOR ALLOCATION2 |
| As of October 31, 2020 |
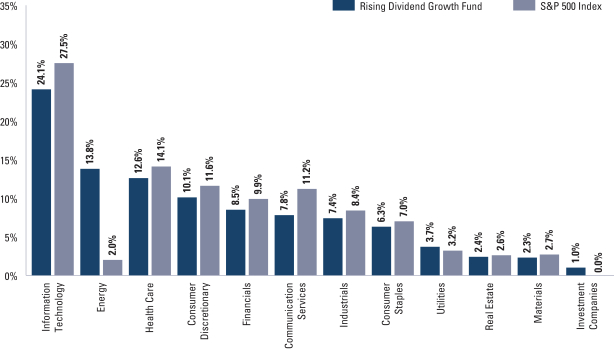
| 2 | The Fund is actively managed and, as such, its composition may differ over time. Consequently, the Fund’s overall sector allocations may differ from the percentages contained in the graph above. The graph categorizes investments using the Global Industry Classification Standard (“GICS”), however, the sector classifications used by the portfolio management team may differ from GICS. The percentage shown for each investment category reflects the value of investments in that category as a percentage of market value. Investments in the securities lending reinvestment vehicle represented 0.3% of the Fund’s net assets as of October 31, 2020. The graph depicts the Fund’s investments but may not represent the Fund’s market exposure due to the exclusion of certain derivatives, if any, as listed in the Additional Investment Information section of the Schedule of Investments. |
For more information about your Fund, please refer to www.GSAMFUNDS.com. There, you can learn more about your Fund’s investment strategies, holdings, and performance.
17
GOLDMAN SACHS RISING DIVIDEND GROWTH FUND
Performance Summary
October 31, 2020
The following graph shows the value, as of October 31, 2020, of a $10,000 investment made on November 1, 2010 in Class A Shares. For comparative purposes, the performance of the Fund’s benchmark, the S&P 500 Index (with dividends reinvested), is shown. Performance reflects applicable fee waivers and/or expense limitations in effect during the periods shown and in their absence, performance would be reduced. Returns do not reflect the deduction of taxes that a shareholder would pay on Fund distributions or the redemption of Fund shares. The returns set forth below represent past performance. Past performance does not guarantee future results. The Fund’s investment return and principal value will fluctuate so that an investor’s shares, when redeemed, may be worth more or less than their original cost. Current performance may be lower or higher than the performance quoted below. Please visit our web site at www.GSAMFUNDS.com to obtain the most recent month-end returns.
| Rising Dividend Growth Fund’s 10 Year Performance |
Performance of a $10,000 Investment, with distributions reinvested, from November 1, 2010 through October 31, 2020.
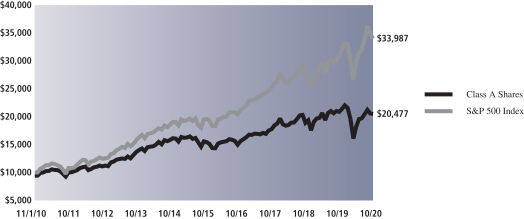
| Average Annual Total Return through October 31, 2020* | One Year | Five Years | Ten Years | Since Inception | ||||||||||
Class A | ||||||||||||||
Excluding sales charges | -1.80% | 5.63% | 8.03% | — | ||||||||||
Including sales charges | -7.18% | 4.45% | 7.42% | — | ||||||||||
| ||||||||||||||
Class C | ||||||||||||||
Excluding contingent deferred sales charges | -2.50% | 4.84% | 7.27% | — | ||||||||||
Including contingent deferred sales charges | -3.48% | 4.84% | 7.27% | — | ||||||||||
|
|
|
|
|
|
|
| |||||||
Institutional Class | -1.47% | 6.03% | 8.48% | — | ||||||||||
|
|
|
|
|
|
|
| |||||||
Investor (Commenced February 27, 2012) | -1.55% | 5.91% | N/A | 7.86% | ||||||||||
| ||||||||||||||
Class R6 (Commenced February 28, 2018) | -1.47% | N/A | N/A | 3.92% | ||||||||||
| ||||||||||||||
Class R (Commenced February 27, 2012) | -2.01% | 5.37% | N/A | 7.32% | ||||||||||
| ||||||||||||||
Class P (Commenced April 23, 2018) | -1.46% | N/A | N/A | 3.95% | ||||||||||
| ||||||||||||||
| * | Effective February 27, 2012, the Rising Dividend Growth Fund, a series of Dividend Growth Trust (the “Predecessor Fund”), was reorganized into the Fund. As accounting successor to the Predecessor Fund, the Fund has assumed the Predecessor Fund’s historical performance. These returns assume reinvestment of all distributions at NAV and reflect a maximum initial sales charge of 5.50% for Class A and the assumed contingent deferred sales charge for Class C Shares (1% if redeemed within 12 months of purchase). Because Institutional, Investor, Class R6, Class R and Class P Shares do not involve a sales charge, such a charge is not applied to their Average Annual Total Return. |
18
FUND RESULTS
Index Definitions
The Alerian MLP Index (AMZ) is a widely recognized, unmanaged index that includes a composite of the 50 most prominent energy MLPs. The Index returns do not reflect the deduction of expenses, which have been deducted from net returns. The Index return assumes reinvestment of all distributions and does not reflect the deduction of taxes and fees.
The Alerian Midstream Energy Index is a broad-based composite of North American energy infrastructure companies. The capped, float-adjusted, capitalization-weighted index, whose constituents earn the majority of their cash flow from midstream activities involving energy commodities, is disseminated real-time on a price-return (AMNA), total return (AMNAX), net total-return (AMNAN) and adjusted net total-return (AMNTR) basis.
The S&P 500 Index is the Standard & Poor’s 500 Composite Index of 500 stocks, an unmanaged market capitalization weighted index of common stock prices. The Index figures do not reflect any deduction for fees, expenses or taxes. It is not possible to invest directly in an index.
The S&P 500 Ex-Energy is designed to provide broad market exposure except for members of the energy sector.
The Russell 1000® Value Index measures the performance of the large-cap value segment of the U.S. equity universe. It includes those Russell 1000® Index companies with lower price-to-book ratios and lower expected growth values. This index is constructed to provide a comprehensive and unbiased barometer for the large-cap value segment. The Index is completely reconstituted annually to ensure new and growing equities are included and that the represented companies continue to reflect value characteristics. It is not possible to invest directly in an unmanaged index.
The ICE BofAML BB to B U.S. High Yield Constrained Index contains all securities in the ICE BofAML U.S. High Yield Index rated BB1 through B3, based on an average of Moody’s, S&P and Fitch, but caps issuer exposure at 2%. Index constituents are capitalization-weighted, based on their current amount outstanding, provided the total allocation to an individual issuer does not exceed 2%. Issuers that exceed the limit are reduced to 2% and the face value of each of their bonds is adjusted on a pro-rata basis. Similarly, the face values of bonds of all other issuers that fall below the 2% cap are increased on a pro-rata basis. It is not possible to invest directly in an unmanaged index.
19
GOLDMAN SACHS INCOME BUILDER FUND
October 31, 2020
| Shares | Description | Value | ||||||
| Common Stocks – 35.8% | ||||||||
| Aerospace & Defense – 0.5% | ||||||||
| 27,002 | Northrop Grumman Corp. | $ | 7,825,720 | |||||
|
| |||||||
| Banks – 2.1% | ||||||||
| 390,724 | BNP Paribas SA ADR | 6,814,227 | ||||||
| 107,576 | JPMorgan Chase & Co. | 10,546,751 | ||||||
| 87,013 | M&T Bank Corp. | 9,012,806 | ||||||
| 240,368 | Truist Financial Corp. | 10,124,300 | ||||||
|
| |||||||
| 36,498,084 | ||||||||
|
| |||||||
| Beverages – 0.8% | ||||||||
| 271,287 | The Coca-Cola Co. | 13,038,053 | ||||||
|
| |||||||
| Biotechnology – 0.4% | ||||||||
| 30,337 | Amgen, Inc. | 6,581,309 | ||||||
|
| |||||||
| Capital Markets – 0.7% | ||||||||
| 11,747 | BlackRock, Inc. | 7,038,920 | ||||||
| 53,387 | Singapore Exchange Ltd. ADR | 4,964,991 | ||||||
|
| |||||||
| 12,003,911 | ||||||||
|
| |||||||
| Chemicals – 1.1% | ||||||||
| 21,718 | Ecolab, Inc. | 3,987,208 | ||||||
| 65,719 | Linde PLC | 14,480,524 | ||||||
|
| |||||||
| 18,467,732 | ||||||||
|
| |||||||
| Commercial Services & Supplies – 0.5% | ||||||||
| 92,182 | Republic Services, Inc. | 8,127,687 | ||||||
|
| |||||||
| Communications Equipment – 0.9% | ||||||||
| 359,330 | Cisco Systems, Inc. | 12,899,947 | ||||||
| 140,244 | Juniper Networks, Inc. | 2,765,612 | ||||||
|
| |||||||
| 15,665,559 | ||||||||
|
| |||||||
| Construction & Engineering – 0.3% | ||||||||
| 255,691 | Vinci SA ADR | 5,049,897 | ||||||
|
| |||||||
| Consumer Finance – 0.2% | ||||||||
| 34,549 | American Express Co. | 3,152,251 | ||||||
|
| |||||||
| Containers & Packaging – 0.6% | ||||||||
| 255,304 | International Paper Co. | 11,169,550 | ||||||
|
| |||||||
| Diversified Telecommunication Services – 0.8% | ||||||||
| 256,027 | Verizon Communications, Inc. | 14,590,979 | ||||||
|
| |||||||
| Electric Utilities – 1.2% | ||||||||
| 899,715 | Enel SpA ADR | 7,134,740 | ||||||
| 125,004 | NextEra Energy, Inc. | 9,151,543 | ||||||
| 66,708 | Xcel Energy, Inc. | 4,671,561 | ||||||
|
| |||||||
| 20,957,844 | ||||||||
|
| |||||||
| Electrical Equipment – 1.5% | ||||||||
| 107,644 | Eaton Corp. PLC | 11,172,371 | ||||||
| 566,854 | Schneider Electric SE ADR | 13,814,232 | ||||||
|
| |||||||
| 24,986,603 | ||||||||
|
| |||||||
| Electronic Equipment, Instruments & Components – 0.3% | ||||||||
| 58,127 | TE Connectivity Ltd. | 5,631,344 | ||||||
|
| |||||||
| Common Stocks – (continued) | ||||||||
| Entertainment – 0.4% | ||||||||
| 51,559 | The Walt Disney Co. | 6,251,529 | ||||||
|
| |||||||
| Equity Real Estate Investment Trusts (REITs) – 1.7% | ||||||||
| 17,005 | Alexandria Real Estate Equities, Inc. | 2,576,598 | ||||||
| 33,498 | American Tower Corp. | 7,692,816 | ||||||
| 31,086 | AvalonBay Communities, Inc. | 4,324,995 | ||||||
| 51,640 | Camden Property Trust | 4,763,273 | ||||||
| 162,846 | Hudson Pacific Properties, Inc. | 3,136,414 | ||||||
| 156,463 | Ventas, Inc. | 6,175,595 | ||||||
|
| |||||||
| 28,669,691 | ||||||||
|
| |||||||
| Food & Staples Retailing – 0.2% | ||||||||
| 131,719 | The Kroger Co. | 4,242,669 | ||||||
|
| |||||||
| Food Products – 0.9% | ||||||||
| 91,816 | Mondelez International, Inc. Class A | 4,877,266 | ||||||
| 95,579 | Nestle SA ADR | 10,730,654 | ||||||
|
| |||||||
| 15,607,920 | ||||||||
|
| |||||||
| Health Care Equipment & Supplies – 1.2% | ||||||||
| 127,904 | Medtronic PLC | 12,863,305 | ||||||
| 57,506 | Zimmer Biomet Holdings, Inc. | 7,596,543 | ||||||
|
| |||||||
| 20,459,848 | ||||||||
|
| |||||||
| Health Care Providers & Services – 1.1% | ||||||||
| 185,337 | CVS Health Corp. | 10,395,552 | ||||||
| 26,610 | UnitedHealth Group, Inc. | 8,119,776 | ||||||
|
| |||||||
| 18,515,328 | ||||||||
|
| |||||||
| Hotels, Restaurants & Leisure – 1.1% | ||||||||
| 248,531 | Aramark | 6,894,250 | ||||||
| 58,199 | McDonald’s Corp. | 12,396,387 | ||||||
|
| |||||||
| 19,290,637 | ||||||||
|
| |||||||
| Household Products – 0.9% | ||||||||
| 46,279 | Kimberly-Clark Corp. | 6,136,132 | ||||||
| 67,109 | The Procter & Gamble Co. | 9,200,644 | ||||||
|
| |||||||
| 15,336,776 | ||||||||
|
| |||||||
| Industrial Conglomerates – 0.7% | ||||||||
| 78,397 | Honeywell International, Inc. | 12,931,585 | ||||||
|
| |||||||
| Insurance – 1.1% | ||||||||
| 67,521 | Chubb Ltd. | 8,771,653 | ||||||
| 34,169 | The Travelers Cos., Inc. | 4,124,540 | ||||||
| 172,599 | Zurich Insurance Group AG ADR | 5,744,095 | ||||||
|
| |||||||
| 18,640,288 | ||||||||
|
| |||||||
| IT Services – 1.2% | ||||||||
| 46,483 | Accenture PLC Class A | 10,082,628 | ||||||
| 39,231 | Fidelity National Information Services, Inc. | 4,887,790 | ||||||
|
| |||||||
| 20 | The accompanying notes are an integral part of these financial statements. |
GOLDMAN SACHS INCOME BUILDER FUND
| Shares | Description | Value | ||||||
| Common Stocks – (continued) | ||||||||
| IT Services – (continued) | ||||||||
| 50,675 | International Business Machines Corp. | $ | 5,658,370 | |||||
|
| |||||||
| 20,628,788 | ||||||||
|
| |||||||
| Machinery – 1.3% | ||||||||
| 48,250 | Deere & Co. | 10,900,157 | ||||||
| 55,400 | Illinois Tool Works, Inc. | 10,851,752 | ||||||
|
| |||||||
| 21,751,909 | ||||||||
|
| |||||||
| Media – 0.8% | ||||||||
| 194,739 | Bright Pattern Holding Co. | 244,397 | ||||||
| 337,822 | Comcast Corp. Class A | 14,269,601 | ||||||
|
| |||||||
| 14,513,998 | ||||||||
|
| |||||||
| Metals & Mining – 0.5% | ||||||||
| 162,275 | Rio Tinto PLC ADR | 9,212,352 | ||||||
|
| |||||||
| Multi-Utilities – 1.5% | ||||||||
| 91,359 | Ameren Corp. | 7,411,042 | ||||||
| 62,253 | CMS Energy Corp. | 3,942,482 | ||||||
| 108,648 | National Grid PLC ADR | 6,459,124 | ||||||
| 66,102 | Public Service Enterprise Group, Inc. | 3,843,831 | ||||||
| 28,389 | Sempra Energy | 3,558,845 | ||||||
|
| |||||||
| 25,215,324 | ||||||||
|
| |||||||
| Oil, Gas & Consumable Fuels – 1.2% | ||||||||
| 137,856 | Chevron Corp. | 9,580,992 | ||||||
| 96,738 | ConocoPhillips | 2,768,642 | ||||||
| 312,420 | Royal Dutch Shell PLC ADR Class A | 7,982,331 | ||||||
|
| |||||||
| 20,331,965 | ||||||||
|
| |||||||
| Pharmaceuticals – 3.3% | ||||||||
| 98,298 | AstraZeneca PLC ADR | 4,930,628 | ||||||
| 251,691 | Bristol-Myers Squibb Co. | 14,711,339 | ||||||
| 84,973 | Eli Lilly & Co. | 11,085,578 | ||||||
| 122,296 | Johnson & Johnson | 16,768,004 | ||||||
| 117,035 | Novartis AG ADR | 9,138,093 | ||||||
|
| |||||||
| 56,633,642 | ||||||||
|
| |||||||
| Road & Rail – 0.8% | ||||||||
| 34,219 | Norfolk Southern Corp. | 7,155,877 | ||||||
| 36,788 | Union Pacific Corp. | 6,518,466 | ||||||
|
| |||||||
| 13,674,343 | ||||||||
|
| |||||||
| Semiconductors & Semiconductor Equipment – 1.5% | ||||||||
| 24,404 | Analog Devices, Inc. | 2,892,606 | ||||||
| 104,811 | Intel Corp. | 4,641,031 | ||||||
| 55,016 | QUALCOMM, Inc. | 6,786,774 | ||||||
| 75,921 | Texas Instruments, Inc. | 10,977,417 | ||||||
|
| |||||||
| 25,297,828 | ||||||||
|
| |||||||
| Software – 0.6% | ||||||||
| 48,694 | Microsoft Corp. | 9,859,074 | ||||||
|
| |||||||
| Common Stocks – (continued) | ||||||||
| Specialty Retail – 0.9% | ||||||||
| 58,516 | The Home Depot, Inc. | 15,606,802 | ||||||
|
| |||||||
| Technology Hardware, Storage & Peripherals – 0.3% | ||||||||
| 55,795 | Apple, Inc. | 6,073,844 | ||||||
|
| |||||||
| Technology – Software/Services(a)(b) – 0.0% | ||||||||
| 194,739 | Aspect Software, Inc. Class B | 48,685 | ||||||
|
| |||||||
| Water Utilities – 0.7% | ||||||||
| 80,836 | American Water Works Co., Inc. | 12,166,626 | ||||||
|
| |||||||
| | TOTAL COMMON STOCKS (Cost $544,111,040) | $ | 614,707,974 | |||||
|
| |||||||
| Shares | Dividend Rate | Value | ||||||
| Preferred Stocks(c) – 0.5% | ||||||||
| Capital Markets(a)(d) – 0.3% | ||||||||
Morgan Stanley (3M USD LIBOR + 3.708%) | ||||||||
| 183,597 | 6.375% | $ | 5,188,451 | |||||
|
| |||||||
| Diversified Telecommunication Services(a) – 0.1% | ||||||||
Qwest Corp. | ||||||||
| 43,276 | 6.500 | 1,099,643 | ||||||
|
| |||||||
| Insurance(a)(d) – 0.1% | ||||||||
Delphi Financial Group, Inc.(3M USD LIBOR + 3.190%) | ||||||||
| 143,849 | 3.470 | 3,020,829 | ||||||
|
| |||||||
| | TOTAL PREFERRED STOCKS (Cost $8,780,987) | $ | 9,308,923 | |||||
|
| |||||||
| Principal Amount | Interest Rate | Maturity Date | Value | |||||||||||
| Corporate Obligations – 51.6% | ||||||||||||||
| Advertising(c) – 0.4% | ||||||||||||||
Lamar Media Corp. | ||||||||||||||
| $ | 600,000 | 3.750 | % | 02/15/28 | $ | 598,500 | ||||||||
Outfront Media Capital LLC/Outfront Media Capital Corp.(e) | ||||||||||||||
| 2,250,000 | 6.250 | 06/15/25 | 2,289,375 | |||||||||||
| 360,000 | 5.000 | 08/15/27 | 342,000 | |||||||||||
Terrier Media Buyer, Inc.(e) | ||||||||||||||
| 2,850,000 | 8.875 | 12/15/27 | 2,914,125 | |||||||||||
|
| |||||||||||||
| 6,144,000 | ||||||||||||||
|
| |||||||||||||
| Aerospace & Defense(c) – 0.7% | ||||||||||||||
Bombardier, Inc.(e) | ||||||||||||||
| 1,125,000 | 7.500 | 12/01/24 | 843,750 | |||||||||||
| 3,301,000 | 7.500 | 03/15/25 | 2,393,225 | |||||||||||
The Boeing Co. | ||||||||||||||
| 3,432,000 | 5.150 | 05/01/30 | 3,797,611 | |||||||||||
| 1,652,000 | 5.805 | 05/01/50 | 1,937,251 | |||||||||||
TransDigm, Inc. | ||||||||||||||
| 365,000 | 6.500 | 05/15/25 | 365,000 | |||||||||||
|
| |||||||||||||
| The accompanying notes are an integral part of these financial statements. | 21 |
GOLDMAN SACHS INCOME BUILDER FUND
Schedule of Investments (continued)
October 31, 2020
| Principal Amount | Interest Rate | Maturity Date | Value | |||||||||||
| Corporate Obligations – (continued) | ||||||||||||||
| Aerospace & Defense(c) – (continued) | ||||||||||||||
TransDigm, Inc. – (continued) | ||||||||||||||
| $ | 3,300,000 | 5.500 | % | 11/15/27 | $ | 3,221,625 | ||||||||
|
| |||||||||||||
| 12,558,462 | ||||||||||||||
|
| |||||||||||||
| Agriculture – 0.6% | ||||||||||||||
BAT Capital Corp.(c) | ||||||||||||||
| 10,000,000 | 4.390 | 08/15/37 | 10,679,800 | |||||||||||
| MHP SE | ||||||||||||||
| 330,000 | 7.750 | 05/10/24 | 343,509 | |||||||||||
|
| |||||||||||||
| 11,023,309 | ||||||||||||||
|
| |||||||||||||
| Airlines(e) – 0.1% | ||||||||||||||
Air Canada Pass Through Trust Series 2013-1, Class B | ||||||||||||||
| 1,501,905 | 5.375 | 05/15/21 | 1,355,890 | |||||||||||
|
| |||||||||||||
| Automotive – 1.4% | ||||||||||||||
American Axle & Manufacturing, Inc.(c) | ||||||||||||||
| 1,000 | 6.250 | 04/01/25 | 1,015 | |||||||||||
BorgWarner, Inc.(e) | ||||||||||||||
| 4,100,000 | 5.000 | 10/01/25 | 4,761,061 | |||||||||||
Clarios Global LP/Clarios US Finance Co.(c)(e) | ||||||||||||||
| 1,850,000 | 8.500 | 05/15/27 | 1,928,625 | |||||||||||
Dealer Tire LLC/DT Issuer LLC(c)(e) | ||||||||||||||
| 2,934,000 | 8.000 | 02/01/28 | 3,000,015 | |||||||||||
Ford Motor Co. | ||||||||||||||
| 1,464,000 | 8.500 | 04/21/23 | 1,614,442 | |||||||||||
Ford Motor Credit Co. LLC | ||||||||||||||
| 2,500,000 | 5.875 | 08/02/21 | 2,552,910 | |||||||||||
| 1,600,000 | 4.140 | (c) | 02/15/23 | 1,615,787 | ||||||||||
| 400,000 | 4.687 | (c) | 06/09/25 | 409,176 | ||||||||||
| 1,543,000 | 5.125 | (c) | 06/16/25 | 1,602,421 | ||||||||||
General Motors Co.(c) | ||||||||||||||
| 3,000,000 | 6.600 | 04/01/36 | 3,759,300 | |||||||||||
Meritor, Inc.(c)(e) | ||||||||||||||
| 450,000 | 6.250 | 06/01/25 | 472,500 | |||||||||||
Nissan Motor Co. Ltd.(c)(e) | ||||||||||||||
| 2,150,000 | 3.522 | 09/17/25 | 2,165,867 | |||||||||||
|
| |||||||||||||
| 23,883,119 | ||||||||||||||
|
| |||||||||||||
| Banks – 4.3% | ||||||||||||||
Akbank T.A.S.(c)(d) (5 Year USD Swap + 5.026%) | ||||||||||||||
| 320,000 | 7.200 | 03/16/27 | 290,200 | |||||||||||
Banco do Brasil SA(c)(d) (10 Year CMT + 4.398%) | ||||||||||||||
| 560,000 | 6.250 | 04/15/49 | 537,600 | |||||||||||
Banco Mercantil del Norte SA(c)(d)(e) (5 Year CMT + 4.967%) | ||||||||||||||
| 680,000 | 6.750 | 09/27/49 | 677,450 | |||||||||||
| | Banco Santander Mexico SA Institucion de Banca Multiple Grupo | | ||||||||||||
| 250,000 | 5.375 | 04/17/25 | 279,688 | |||||||||||
Banco Santander SA | ||||||||||||||
| 2,000,000 | 3.490 | 05/28/30 | 2,165,380 | |||||||||||
Bank of America Corp.(c)(d) (3M USD LIBOR + 3.898%) | ||||||||||||||
| 4,000,000 | 6.100 | 03/17/49 | 4,418,520 | |||||||||||
BBVA Bancomer SA(c)(d) (5 Year CMT + 2.650%) | ||||||||||||||
| 530,000 | 5.125 | 01/18/33 | 522,050 | |||||||||||
BNP Paribas SA(e) | ||||||||||||||
| 2,700,000 | 4.375 | 05/12/26 | 3,036,042 | |||||||||||
|
| |||||||||||||
| Corporate Obligations – (continued) | ||||||||||||||
| Banks – (continued) | ||||||||||||||
CIT Group, Inc.(c) | ||||||||||||||
| 4,025,000 | 5.250 | 03/07/25 | 4,492,906 | |||||||||||
Citigroup, Inc.(c)(d) | ||||||||||||||
(3M USD LIBOR + 4.517%) | ||||||||||||||
| 1,890,000 | 6.250 | 08/15/49 | 2,107,350 | |||||||||||
(SOFR + 3.914%) | ||||||||||||||
| 900,000 | 4.412 | 03/31/31 | 1,067,382 | |||||||||||
Credit Bank of Moscow Via CBOM Finance PLC(e) | ||||||||||||||
| 260,000 | 4.700 | 01/29/25 | 260,975 | |||||||||||
Credit Suisse Group AG(c)(d)(e) | ||||||||||||||
(5 Year CMT + 4.889%) | ||||||||||||||
| 3,050,000 | 5.250 | 02/11/49 | 3,072,875 | |||||||||||
(5 Year USD Swap + 4.598%) | ||||||||||||||
| 4,025,000 | 7.500 | 12/11/49 | 4,367,125 | |||||||||||
Deutsche Bank AG(c)(d) | ||||||||||||||
(5 Year CMT + 4.524%) | ||||||||||||||
| 800,000 | 6.000 | 10/30/49 | 712,000 | |||||||||||
(5 Year USD Swap + 2.248%) | ||||||||||||||
| 2,000,000 | 4.296 | 05/24/28 | 1,930,000 | |||||||||||
FirstRand Bank Ltd.(c)(d) (5 Year USD Swap + 3.561%) | ||||||||||||||
| 320,000 | 6.250 | 04/23/28 | 328,000 | |||||||||||
Freedom Mortgage Corp.(c)(e) | ||||||||||||||
| 3,225,000 | 7.625 | 05/01/26 | 3,192,750 | |||||||||||
Grupo Aval Ltd.(c)(e) | ||||||||||||||
| 340,000 | 4.375 | 02/04/30 | 330,225 | |||||||||||
ING Groep NV(c)(d) (5 Year USD Swap + 4.446%) | ||||||||||||||
| 5,000,000 | 6.500 | 04/16/49 | 5,275,000 | |||||||||||
Intesa Sanpaolo SpA(e) | ||||||||||||||
| 8,000,000 | 5.017 | 06/26/24 | 8,430,000 | |||||||||||
Itau Unibanco Holding SA(c)(d) (5 Year CMT + 3.981%) | ||||||||||||||
| 500,000 | 6.125 | 12/12/49 | 476,938 | |||||||||||
JPMorgan Chase & Co.(c)(d) | ||||||||||||||
(3M USD LIBOR + 3.330%) | ||||||||||||||
| 4,000,000 | 6.125 | 04/30/49 | 4,174,360 | |||||||||||
(3M USD LIBOR + 3.800%) | ||||||||||||||
| 2,700,000 | 4.014 | 02/01/49 | 2,661,363 | |||||||||||
(SOFR + 2.515%) | ||||||||||||||
| 441,000 | 2.956 | 05/13/31 | 471,685 | |||||||||||
Morgan Stanley, Inc.(c)(d) (3M USD LIBOR + 3.610%) | ||||||||||||||
| 2,731,000 | 3.847 | 01/15/49 | 2,614,932 | |||||||||||
Natwest Group PLC | ||||||||||||||
| 2,675,000 | 3.875 | 09/12/23 | 2,886,860 | |||||||||||
| 2,975,000 | 6.000 | 12/19/23 | 3,330,994 | |||||||||||
OTP Bank Nyrt(c)(d) (-1X 5M EURIBOR ICE Swap + 3.200%) | ||||||||||||||
| EUR | 390,000 | 2.875 | 07/15/29 | 443,284 | ||||||||||
Truist Financial Corp.(c)(d)(10 Year CMT + 4.349%) | ||||||||||||||
| $ | 2,237,000 | 5.100 | 03/01/49 | 2,444,773 | ||||||||||
Turkiye Vakiflar Bankasi TAO | ||||||||||||||
| 200,000 | 6.000 | 11/01/22 | 192,125 | |||||||||||
UBS Group AG(c)(d) (5 Year USD Swap + 4.590%) | ||||||||||||||
| 4,000,000 | 6.875 | 08/07/49 | 4,400,000 | |||||||||||
UniCredit SpA(c)(d)(e) (5 Year CMT + 4.750%) | ||||||||||||||
| 1,525,000 | 5.459 | 06/30/35 | 1,563,261 | |||||||||||
United Bank for Africa PLC | ||||||||||||||
| 470,000 | 7.750 | 06/08/22 | 467,209 | |||||||||||
|
| |||||||||||||
| 73,621,302 | ||||||||||||||
|
| |||||||||||||
| 22 | The accompanying notes are an integral part of these financial statements. |
GOLDMAN SACHS INCOME BUILDER FUND
| Principal Amount | Interest Rate | Maturity Date | Value | |||||||||||
| Corporate Obligations – (continued) | ||||||||||||||
| Beverages – 0.9% | ||||||||||||||
Anadolu Efes Biracilik Ve Malt Sanayii A/S | ||||||||||||||
| $ | 350,000 | 3.375 | % | 11/01/22 | $ | 349,344 | ||||||||
| | Anheuser-Busch Cos. LLC/Anheuser-Busch InBev Worldwide, | | ||||||||||||
| 8,050,000 | 4.700 | 02/01/36 | 9,864,872 | |||||||||||
Central American Bottling Corp.(c) | ||||||||||||||
| 480,000 | 5.750 | 01/31/27 | 501,300 | |||||||||||
Constellation Brands, Inc.(c) | ||||||||||||||
| 2,275,000 | 2.875 | 05/01/30 | 2,447,308 | |||||||||||
Keurig Dr Pepper, Inc.(c) | ||||||||||||||
| 1,055,000 | 3.200 | 05/01/30 | 1,173,519 | |||||||||||
| 308,000 | 3.800 | 05/01/50 | 348,850 | |||||||||||
|
| |||||||||||||
| 14,685,193 | ||||||||||||||
|
| |||||||||||||
| Building Materials(c) – 0.8% | ||||||||||||||
Builders FirstSource, Inc.(e) | ||||||||||||||
| 1,507,000 | 6.750 | 06/01/27 | 1,616,257 | |||||||||||
| 940,000 | 5.000 | 03/01/30 | 987,000 | |||||||||||
Cemex SAB de CV | ||||||||||||||
| 490,000 | 5.700 | 01/11/25 | 500,872 | |||||||||||
| 230,000 | 7.750 | 04/16/26 | 243,340 | |||||||||||
Cornerstone Building Brands, Inc.(e) | ||||||||||||||
| 2,780,000 | 8.000 | 04/15/26 | 2,884,250 | |||||||||||
| 1,226,000 | 6.125 | 01/15/29 | 1,250,520 | |||||||||||
Griffon Corp. | ||||||||||||||
| 2,168,000 | 5.750 | 03/01/28 | 2,265,560 | |||||||||||
Masonite International Corp.(e) | ||||||||||||||
| 2,075,000 | 5.375 | 02/01/28 | 2,209,875 | |||||||||||
Summit Materials LLC/Summit Materials Finance Corp.(e) | ||||||||||||||
| 1,213,000 | 5.250 | 01/15/29 | 1,249,390 | |||||||||||
|
| |||||||||||||
| 13,207,064 | ||||||||||||||
|
| |||||||||||||
| Chemicals(c) – 0.8% | ||||||||||||||
Air Products & Chemicals, Inc. | ||||||||||||||
| 200,000 | 2.800 | 05/15/50 | 207,359 | |||||||||||
Element Solutions, Inc.(e) | ||||||||||||||
| 651,000 | 3.875 | 09/01/28 | 647,745 | |||||||||||
HB Fuller Co | ||||||||||||||
| 1,060,000 | 4.250 | 10/15/28 | 1,078,550 | |||||||||||
Ingevity Corp.(e) | ||||||||||||||
| 2,775,000 | 4.500 | 02/01/26 | 2,827,031 | |||||||||||
| 1,305,000 | 3.875 | 11/01/28 | 1,327,838 | |||||||||||
Kraton Polymers LLC/Kraton Polymers Capital Corp.(e) | ||||||||||||||
| 1,900,000 | 7.000 | 04/15/25 | 1,952,250 | |||||||||||
Minerals Technologies, Inc.(e) | ||||||||||||||
| 1,695,000 | 5.000 | 07/01/28 | 1,741,612 | |||||||||||
OCI NV(e) | ||||||||||||||
| 1,250,000 | 5.250 | 11/01/24 | 1,278,125 | |||||||||||
Sasol Financing USA LLC | ||||||||||||||
| 200,000 | 6.500 | 09/27/28 | 191,500 | |||||||||||
WR Grace & Co-Conn(e) | ||||||||||||||
| 2,938,000 | 4.875 | 06/15/27 | 3,055,520 | |||||||||||
|
| |||||||||||||
| 14,307,530 | ||||||||||||||
|
| |||||||||||||
| Coal(c) – 0.0% | ||||||||||||||
Mongolian Mining Corp./Energy Resources LLC | ||||||||||||||
| 330,000 | 9.250 | 04/15/24 | 263,175 | |||||||||||
|
| |||||||||||||
| Corporate Obligations – (continued) | ||||||||||||||
| Commercial Services – 1.6% | ||||||||||||||
Allied Universal Holdco LLC/Allied Universal Finance Corp.(c)(e) | ||||||||||||||
| 2,557,000 | 6.625 | 07/15/26 | 2,675,261 | |||||||||||
| 3,020,000 | 9.750 | 07/15/27 | 3,216,300 | |||||||||||
Global Liman Isletmeleri A/S(c) | ||||||||||||||
| 200,000 | 8.125 | 11/14/21 | 140,500 | |||||||||||
IHS Markit Ltd.(c)(e) | ||||||||||||||
| 5,675,000 | 4.750 | 02/15/25 | 6,400,038 | |||||||||||
Jaguar Holding Co. II/PPD Development LP(c)(e) | ||||||||||||||
| 2,350,000 | 5.000 | 06/15/28 | 2,444,000 | |||||||||||
MPH Acquisition Holdings LLC(c)(e) | ||||||||||||||
| 3,585,000 | 5.750 | 11/01/28 | 3,522,262 | |||||||||||
Prime Security Services Borrower LLC/Prime Finance, Inc.(c)(e) | ||||||||||||||
| 1,480,000 | 3.375 | 08/31/27 | 1,439,300 | |||||||||||
Refinitiv US Holdings, Inc.(c)(e) | ||||||||||||||
| 3,000,000 | 8.250 | 11/15/26 | 3,255,000 | |||||||||||
Shift4 Payments LLC / Shift4 Payments Finance Sub, Inc.(c)(e) | ||||||||||||||
| 735,000 | 4.625 | 11/01/26 | 746,025 | |||||||||||
Techem Verwaltungsgesellschaft 674 MBH(c) | ||||||||||||||
| EUR | 760,000 | 6.000 | 07/30/26 | 897,960 | ||||||||||
The ADT Security Corp. | ||||||||||||||
| $ | 1,850,000 | 4.125 | 06/15/23 | 1,919,375 | ||||||||||
|
| |||||||||||||
| 26,656,021 | ||||||||||||||
|
| |||||||||||||
| Computers(c) – 1.2% | ||||||||||||||
Banff Merger Sub, Inc.(e) | ||||||||||||||
| 1,000,000 | 9.750 | 09/01/26 | 1,050,000 | |||||||||||
Booz Allen Hamilton, Inc.(e) | ||||||||||||||
| 2,513,000 | 3.875 | 09/01/28 | 2,563,260 | |||||||||||
Dell International LLC/EMC Corp.(e) | ||||||||||||||
| 5,000,000 | 8.100 | 07/15/36 | 6,761,850 | |||||||||||
Hewlett Packard Enterprise Co. | ||||||||||||||
| 3,000,000 | 6.200 | 10/15/35 | 3,710,190 | |||||||||||
Presidio Holdings, Inc.(e) | ||||||||||||||
| 2,095,000 | 8.250 | 02/01/28 | 2,223,319 | |||||||||||
Unisys Corp.(e) | ||||||||||||||
| 1,060,000 | 6.875 | 11/01/27 | 1,094,450 | |||||||||||
Western Digital Corp. | ||||||||||||||
| 3,000,000 | 4.750 | 02/15/26 | 3,232,500 | |||||||||||
|
| |||||||||||||
| 20,635,569 | ||||||||||||||
|
| |||||||||||||
| Distribution & Wholesale(c)(e) – 0.9% | ||||||||||||||
Avient Corp. | ||||||||||||||
| 1,953,000 | 5.750 | 05/15/25 | 2,055,533 | |||||||||||
Core & Main Holdings LP(f) (PIK 9.375%, Cash 8.625%) | ||||||||||||||
| 3,000,000 | 8.625 | 09/15/24 | 3,026,250 | |||||||||||
IAA, Inc. | ||||||||||||||
| 750,000 | 5.500 | 06/15/27 | 785,625 | |||||||||||
Performance Food Group, Inc. | ||||||||||||||
| 2,150,000 | 5.500 | 06/01/24 | 2,158,062 | |||||||||||
| 1,150,000 | 5.500 | 10/15/27 | 1,181,625 | |||||||||||
Resideo Funding, Inc. | ||||||||||||||
| 3,282,000 | 6.125 | 11/01/26 | 3,178,722 | |||||||||||
Univar Solutions USA, Inc. | ||||||||||||||
| 3,200,000 | 5.125 | 12/01/27 | 3,316,000 | |||||||||||
|
| |||||||||||||
| 15,701,817 | ||||||||||||||
|
| |||||||||||||
| The accompanying notes are an integral part of these financial statements. | 23 |
GOLDMAN SACHS INCOME BUILDER FUND
Schedule of Investments (continued)
October 31, 2020
| Principal Amount | Interest Rate | Maturity Date | Value | |||||||||||
| Corporate Obligations – (continued) | ||||||||||||||
| Diversified Financial Services – 3.2% | ||||||||||||||
AerCap Holdings NV(c)(d) (5 Year CMT + 4.535%) | ||||||||||||||
| $ | 1,825,000 | 5.875 | % | 10/10/79 | $ | 1,441,750 | ||||||||
Air Lease Corp.(c) | ||||||||||||||
| 2,750,000 | 3.750 | 06/01/26 | 2,813,662 | |||||||||||
Ally Financial, Inc. | ||||||||||||||
| 4,000,000 | 8.000 | 11/01/31 | 5,533,200 | |||||||||||
Avolon Holdings Funding Ltd.(c)(e) | ||||||||||||||
| 3,450,000 | 5.250 | 05/15/24 | 3,513,480 | |||||||||||
CoBank ACB(c)(d) (3M USD LIBOR + 4.660%) | ||||||||||||||
| 5,350,000 | 6.250 | 10/01/49 | 5,618,302 | |||||||||||
Curo Group Holdings Corp.(c)(e) | ||||||||||||||
| 2,125,000 | 8.250 | 09/01/25 | 1,753,125 | |||||||||||
GE Capital Funding LLC(c)(e) | ||||||||||||||
| 2,350,000 | 3.450 | 05/15/25 | 2,511,327 | |||||||||||
| | Global Aircraft Leasing Co. Ltd.(c)(e)(f) (PIK 7.250%, Cash | | ||||||||||||
| 1,813,437 | 6.500 | 09/15/24 | 1,215,003 | |||||||||||
LD Holdings Group LLC(c)(e) | ||||||||||||||
| 1,910,000 | 6.500 | 11/01/25 | 1,933,875 | |||||||||||
LPL Holdings, Inc.(c)(e) | ||||||||||||||
| 487,000 | 5.750 | 09/15/25 | 504,045 | |||||||||||
| 1,350,000 | 4.625 | 11/15/27 | 1,383,750 | |||||||||||
Nationstar Mortgage Holdings, Inc.(c)(e) | ||||||||||||||
| 2,651,000 | 5.500 | 08/15/28 | 2,664,255 | |||||||||||
Navient Corp. | ||||||||||||||
| 3,000,000 | 5.500 | 01/25/23 | 2,992,500 | |||||||||||
NFP Corp.(c)(e) | ||||||||||||||
| 3,400,000 | 6.875 | 08/15/28 | 3,289,500 | |||||||||||
Oilflow SPV 1 DAC | ||||||||||||||
| 496,942 | 12.000 | 01/13/22 | 483,276 | |||||||||||
OneMain Finance Corp. | ||||||||||||||
| 3,500,000 | 7.125 | 03/15/26 | 3,880,625 | |||||||||||
OneMain Finance Corp. | ||||||||||||||
| 2,600,000 | 6.125 | 05/15/22 | 2,704,000 | |||||||||||
| 1,800,000 | 5.375 | (c) | 11/15/29 | 1,849,500 | ||||||||||
Park Aerospace Holdings Ltd.(c)(e) | ||||||||||||||
| 2,235,000 | 5.250 | 08/15/22 | 2,302,050 | |||||||||||
Quicken Loans LLC/Quicken Loans Co-Issuer, Inc.(c)(e) | ||||||||||||||
| 1,717,000 | 3.875 | 03/01/31 | 1,690,936 | |||||||||||
Raymond James Financial, Inc.(c) | ||||||||||||||
| 900,000 | 4.650 | 04/01/30 | 1,085,841 | |||||||||||
The Charles Schwab Corp.(c)(d) | ||||||||||||||
(3M USD LIBOR + 3.315%) | ||||||||||||||
| 2,195,000 | 4.625 | 03/01/49 | 2,195,220 | |||||||||||
(5 Year CMT + 4.971%) | ||||||||||||||
| 1,250,000 | 5.375 | 06/01/49 | 1,369,463 | |||||||||||
Visa, Inc.(c) | ||||||||||||||
| 450,000 | 2.700 | 04/15/40 | 478,454 | |||||||||||
|
| |||||||||||||
| 55,207,139 | ||||||||||||||
|
| |||||||||||||
| Electrical – 0.8% | ||||||||||||||
Eskom Holdings SOC Ltd. | ||||||||||||||
| 200,000 | 5.750 | 01/26/21 | 196,062 | |||||||||||
| 630,000 | 6.350 | (g) | 08/10/28 | 649,491 | ||||||||||
Listrindo Capital B.V.(c) | ||||||||||||||
| 520,000 | 4.950 | 09/14/26 | 532,350 | |||||||||||
|
| |||||||||||||
| Corporate Obligations – (continued) | ||||||||||||||
| Electrical – (continued) | ||||||||||||||
LLPL Capital Pte Ltd. | ||||||||||||||
| 431,940 | 6.875 | 02/04/39 | 495,786 | |||||||||||
Minejesa Capital B.V. | ||||||||||||||
| 260,000 | 4.625 | 08/10/30 | 267,699 | |||||||||||
NRG Energy, Inc.(c) | ||||||||||||||
| 2,800,000 | 3.750 | (e) | 06/15/24 | 3,013,108 | ||||||||||
| 115,000 | 5.750 | 01/15/28 | 123,769 | |||||||||||
Pacific Gas & Electric Co.(c) | ||||||||||||||
| 1,470,000 | 3.500 | 08/01/50 | 1,324,690 | |||||||||||
| Pike Corp.(c)(e) | ||||||||||||||
| 4,245,000 | 5.500 | 09/01/28 | 4,340,512 | |||||||||||
Sempra Energy(c)(d) (5 Year CMT + 4.550%) | ||||||||||||||
| 3,335,000 | 4.875 | 10/15/49 | 3,474,170 | |||||||||||
|
| |||||||||||||
| 14,417,637 | ||||||||||||||
|
| |||||||||||||
| Electrical Components & Equipment(c)(e) – 0.1% | ||||||||||||||
Wesco Distribution, Inc. | ||||||||||||||
| 1,473,000 | 7.250 | 06/15/28 | 1,605,570 | |||||||||||
|
| |||||||||||||
| Electronics(c)(e) – 0.1% | ||||||||||||||
Sensata Technologies, Inc. | ||||||||||||||
| 1,923,000 | 3.750 | 02/15/31 | 1,898,963 | |||||||||||
|
| |||||||||||||
| Energy-Alternate Sources(c) – 0.1% | ||||||||||||||
Enviva Partners LP/Enviva Partners Finance Corp.(e) | ||||||||||||||
| 1,400,000 | 6.500 | 01/15/26 | 1,477,000 | |||||||||||
Greenko Dutch B.V. | ||||||||||||||
| 690,000 | 5.250 | 07/24/24 | 706,819 | |||||||||||
|
| |||||||||||||
| 2,183,819 | ||||||||||||||
|
| |||||||||||||
| Engineering & Construction(c) – 0.2% | ||||||||||||||
Aeropuertos Dominicanos Siglo XXI SA | ||||||||||||||
| 630,000 | 6.750 | 03/30/29 | 572,513 | |||||||||||
IHS Netherlands Holdco B.V.(e) | ||||||||||||||
| 200,000 | 7.125 | 03/18/25 | 201,938 | |||||||||||
International Airport Finance SA | ||||||||||||||
| 199,537 | 12.000 | 03/15/33 | 178,585 | |||||||||||
KBR, Inc.(e) | ||||||||||||||
| 1,161,000 | 4.750 | 09/30/28 | 1,175,512 | |||||||||||
Mexico City Airport Trust | ||||||||||||||
| 520,000 | 5.500 | 10/31/46 | 445,949 | |||||||||||
|
| |||||||||||||
| 2,574,497 | ||||||||||||||
|
| |||||||||||||
| Entertainment(c)(e) – 0.6% | ||||||||||||||
Banijay Entertainment SASU | ||||||||||||||
| 1,800,000 | 5.375 | 03/01/25 | 1,824,750 | |||||||||||
Live Nation Entertainment, Inc. | ||||||||||||||
| 1,250,000 | 6.500 | 05/15/27 | 1,343,750 | |||||||||||
Motion Bondco DAC | ||||||||||||||
| 3,250,000 | 6.625 | 11/15/27 | 2,738,125 | |||||||||||
Scientific Games International, Inc. | ||||||||||||||
| 1,000,000 | 5.000 | 10/15/25 | 1,000,000 | |||||||||||
| 500,000 | 7.000 | 05/15/28 | 493,125 | |||||||||||
Six Flags Entertainment Corp. | ||||||||||||||
| 3,780,000 | 5.500 | 04/15/27 | 3,496,500 | |||||||||||
|
| |||||||||||||
| 10,896,250 | ||||||||||||||
|
| |||||||||||||
| 24 | The accompanying notes are an integral part of these financial statements. |
GOLDMAN SACHS INCOME BUILDER FUND
| Principal Amount | Interest Rate | Maturity Date | Value | |||||||||||
| Corporate Obligations – (continued) | ||||||||||||||
| Environmental(c) – 0.3% | ||||||||||||||
Covanta Holding Corp. | ||||||||||||||
| $ | 670,000 | 5.000 | % | 09/01/30 | $ | 685,075 | ||||||||
GFL Environmental, Inc.(e) | ||||||||||||||
| 570,000 | 7.000 | 06/01/26 | 595,650 | |||||||||||
| 730,000 | 5.125 | 12/15/26 | 763,762 | |||||||||||
| 858,000 | 8.500 | 05/01/27 | 937,408 | |||||||||||
Stericycle, Inc.(e) | ||||||||||||||
| 1,950,000 | 5.375 | 07/15/24 | 2,028,000 | |||||||||||
|
| |||||||||||||
| 5,009,895 | ||||||||||||||
|
| |||||||||||||
| Food & Drug Retailing(c) – 1.4% | ||||||||||||||
| | Albertsons Cos., Inc./Safeway, Inc./New Albertsons | | ||||||||||||
| 550,000 | 3.500 | 02/15/23 | 558,938 | |||||||||||
| 2,595,000 | 4.625 | 01/15/27 | 2,692,312 | |||||||||||
| 1,995,000 | 5.875 | 02/15/28 | 2,119,688 | |||||||||||
| 502,000 | 4.875 | 02/15/30 | 533,375 | |||||||||||
Arcor SAIC | ||||||||||||||
| 110,000 | 6.000 | 07/06/23 | 102,128 | |||||||||||
B&G Foods, Inc. | ||||||||||||||
| 4,020,000 | 5.250 | 04/01/25 | 4,125,525 | |||||||||||
Kraft Heinz Foods Co. | ||||||||||||||
| 3,198,000 | 5.000 | 07/15/35 | 3,673,098 | |||||||||||
| 2,592,000 | 4.375 | 06/01/46 | 2,636,805 | |||||||||||
Post Holdings, Inc.(e) | ||||||||||||||
| 5,984,000 | 4.625 | 04/15/30 | 6,141,080 | |||||||||||
United Natural Foods, Inc.(e) | ||||||||||||||
| 1,455,000 | 6.750 | 10/15/28 | 1,478,644 | |||||||||||
|
| |||||||||||||
| 24,061,593 | ||||||||||||||
|
| |||||||||||||
| Food Service(c)(e) – 0.0% | ||||||||||||||
Aramark Services, Inc. | ||||||||||||||
| 620,000 | 6.375 | 05/01/25 | 647,900 | |||||||||||
|
| |||||||||||||
| Forest Products&Paper(c) – 0.1% | ||||||||||||||
Mercer International, Inc. | ||||||||||||||
| 1,850,000 | 7.375 | 01/15/25 | 1,877,750 | |||||||||||
|
| |||||||||||||
| Gaming(c) – 0.5% | ||||||||||||||
Boyd Gaming Corp. | ||||||||||||||
| 2,950,000 | 4.750 | 12/01/27 | 2,883,625 | |||||||||||
MGM Resorts International | ||||||||||||||
| 1,832,000 | 4.750 | 10/15/28 | 1,790,780 | |||||||||||
Station Casinos LLC(e) | ||||||||||||||
| 3,273,000 | 4.500 | 02/15/28 | 3,068,438 | |||||||||||
Wynn Macau Ltd.(e) | ||||||||||||||
| 550,000 | 5.125 | 12/15/29 | 508,750 | |||||||||||
|
| |||||||||||||
| 8,251,593 | ||||||||||||||
|
| |||||||||||||
| Gas(c) – 0.3% | ||||||||||||||
AmeriGas Partners LP/AmeriGas Finance Corp. | ||||||||||||||
| 4,125,000 | 5.875 | 08/20/26 | 4,516,875 | |||||||||||
|
| |||||||||||||
| Healthcare Providers & Services – 1.8% | ||||||||||||||
Acadia Healthcare Co., Inc.(c) | ||||||||||||||
| 2,732,000 | 6.500 | 03/01/24 | 2,793,470 | |||||||||||
Centene Corp.(c) | ||||||||||||||
| 2,840,000 | 4.250 | 12/15/27 | 2,989,810 | |||||||||||
|
| |||||||||||||
| Corporate Obligations – (continued) | ||||||||||||||
| Healthcare Providers & Services – (continued) | ||||||||||||||
CHS/Community Health Systems, Inc.(c) | ||||||||||||||
| 1,990,000 | 6.250 | 03/31/23 | 1,970,100 | |||||||||||
DaVita, Inc.(c)(e) | ||||||||||||||
| 3,800,000 | 3.750 | 02/15/31 | 3,657,500 | |||||||||||
Encompass Health Corp.(c) | ||||||||||||||
| 1,200,000 | 4.500 | 02/01/28 | 1,228,500 | |||||||||||
HCA, Inc. | ||||||||||||||
| 8,870,000 | 5.000 | 03/15/24 | 9,926,772 | |||||||||||
| 250,000 | 5.875 | (c) | 02/15/26 | 282,188 | ||||||||||
Hill-Rom Holdings, Inc.(c)(e) | ||||||||||||||
| 400,000 | 4.375 | 09/15/27 | 414,000 | |||||||||||
Rede D’or Finance S.a.r.l.(c) | ||||||||||||||
| 200,000 | 4.500 | 01/22/30 | 195,360 | |||||||||||
Select Medical Corp.(c)(e) | ||||||||||||||
| 1,700,000 | 6.250 | 08/15/26 | 1,793,500 | |||||||||||
Tenet Healthcare Corp.(c)(e) | ||||||||||||||
| 2,000,000 | 6.250 | 02/01/27 | 2,075,000 | |||||||||||
The Providence Service Corp.(c)(e) | ||||||||||||||
| 751,000 | 5.875 | 11/15/25 | 766,959 | |||||||||||
Universal Health Services, Inc.(c)(e) | ||||||||||||||
| 2,650,000 | 5.000 | 06/01/26 | 2,748,659 | |||||||||||
|
| |||||||||||||
| 30,841,818 | ||||||||||||||
|
| |||||||||||||
| Holding Companies-Diversified(c) – 0.0% | ||||||||||||||
KOC Holding A/S | ||||||||||||||
| 700,000 | 6.500 | 03/11/25 | 705,250 | |||||||||||
|
| |||||||||||||
| Home Builders – 0.8% | ||||||||||||||
| | Brookfield Residential Properties, Inc./Brookfield Residential US | | ||||||||||||
| 1,642,000 | 4.875 | 02/15/30 | 1,559,900 | |||||||||||
Installed Building Products, Inc.(c)(e) | ||||||||||||||
| 800,000 | 5.750 | 02/01/28 | 841,000 | |||||||||||
Lennar Corp.(c) | ||||||||||||||
| 1,825,000 | 4.125 | 01/15/22 | 1,870,625 | |||||||||||
M/I Homes, Inc.(c) | ||||||||||||||
| 1,378,000 | 4.950 | 02/01/28 | 1,426,230 | |||||||||||
PulteGroup, Inc. | ||||||||||||||
| 3,000,000 | 7.875 | 06/15/32 | 4,192,500 | |||||||||||
Taylor Morrison Communities, Inc.(c)(e) | ||||||||||||||
| 1,301,000 | 5.125 | 08/01/30 | 1,408,332 | |||||||||||
TRI Pointe Group, Inc.(c) | ||||||||||||||
| 1,850,000 | 5.250 | 06/01/27 | 1,991,062 | |||||||||||
| 413,000 | 5.700 | 06/15/28 | 457,398 | |||||||||||
|
| |||||||||||||
| 13,747,047 | ||||||||||||||
|
| |||||||||||||
| Household Products(c) – 0.2% | ||||||||||||||
Central Garden & Pet Co | ||||||||||||||
| 1,380,000 | 4.125 | 10/15/30 | 1,393,800 | |||||||||||
Spectrum Brands, Inc. | ||||||||||||||
| 1,800,000 | 5.750 | 07/15/25 | 1,851,750 | |||||||||||
|
| |||||||||||||
| 3,245,550 | ||||||||||||||
|
| |||||||||||||
| Housewares(c) – 0.0% | ||||||||||||||
Turkiye Sise ve Cam Fabrikalari A/S | ||||||||||||||
| 530,000 | 6.950 | 03/14/26 | 533,809 | |||||||||||
|
| |||||||||||||
| The accompanying notes are an integral part of these financial statements. | 25 |
GOLDMAN SACHS INCOME BUILDER FUND
Schedule of Investments (continued)
October 31, 2020
| Principal Amount | Interest Rate | Maturity Date | Value | |||||||||||
| Corporate Obligations – (continued) | ||||||||||||||
| Insurance – 0.8% | ||||||||||||||
Acrisure LLC/Acrisure Finance, Inc.(c)(e) | ||||||||||||||
| $ | 1,550,000 | 10.125 | % | 08/01/26 | $ | 1,716,625 | ||||||||
| | Alliant Holdings Intermediate LLC/Alliant Holdings | | ||||||||||||
| 1,666,000 | 6.750 | 10/15/27 | 1,749,300 | |||||||||||
American International Group, Inc.(c) | ||||||||||||||
| 2,250,000 | 3.400 | 06/30/30 | 2,500,717 | |||||||||||
Fidelity & Guaranty Life Holdings, Inc.(c)(e) | ||||||||||||||
| 2,850,000 | 5.500 | 05/01/25 | 3,268,009 | |||||||||||
HUB International Ltd.(c)(e) | ||||||||||||||
| 1,760,000 | 7.000 | 05/01/26 | 1,804,000 | |||||||||||
Transatlantic Holdings, Inc. | ||||||||||||||
| 75,000 | 8.000 | 11/30/39 | 115,589 | |||||||||||
USI, Inc.(c)(e) | ||||||||||||||
| 1,850,000 | 6.875 | 05/01/25 | 1,884,688 | |||||||||||
|
| |||||||||||||
| 13,038,928 | ||||||||||||||
|
| |||||||||||||
| Internet – 1.8% | ||||||||||||||
21Vianet Group, Inc. | ||||||||||||||
| 400,000 | 7.875 | 10/15/21 | 408,625 | |||||||||||
ANGI Group LLC(c)(e) | ||||||||||||||
| 1,485,000 | 3.875 | 08/15/28 | 1,460,869 | |||||||||||
Booking Holdings, Inc.(c) | ||||||||||||||
| 2,850,000 | 4.625 | 04/13/30 | 3,371,407 | |||||||||||
Cablevision Lightpath LLC(c)(e) | ||||||||||||||
| 200,000 | 5.625 | 09/15/28 | 202,000 | |||||||||||
Expedia Group, Inc.(c)(e) | ||||||||||||||
| 1,160,000 | 6.250 | 05/01/25 | 1,275,142 | |||||||||||
| 1,382,000 | 4.625 | 08/01/27 | 1,444,522 | |||||||||||
Getty Images, Inc.(c)(e) | ||||||||||||||
| 250,000 | 9.750 | 03/01/27 | 252,500 | |||||||||||
Go Daddy Operating Co. LLC/GD Finance Co., Inc.(c)(e) | ||||||||||||||
| 1,305,000 | 5.250 | 12/01/27 | 1,365,356 | |||||||||||
GrubHub Holdings, Inc.(c)(e) | ||||||||||||||
| 3,400,000 | 5.500 | 07/01/27 | 3,536,000 | |||||||||||
NortonLifeLock, Inc.(c)(e) | ||||||||||||||
| 4,000,000 | 5.000 | 04/15/25 | 4,060,000 | |||||||||||
Twitter, Inc.(c)(e) | ||||||||||||||
| 4,305,000 | 3.875 | 12/15/27 | 4,514,869 | |||||||||||
Uber Technologies, Inc.(c)(e) | ||||||||||||||
| 3,200,000 | 7.500 | 05/15/25 | 3,360,000 | |||||||||||
| 1,800,000 | 6.250 | 01/15/28 | 1,827,000 | |||||||||||
VeriSign, Inc.(c) | ||||||||||||||
| 4,000,000 | 5.250 | 04/01/25 | 4,485,200 | |||||||||||
|
| |||||||||||||
| 31,563,490 | ||||||||||||||
|
| |||||||||||||
| Iron/Steel – 0.3% | ||||||||||||||
ABJA Investment Co. Pte Ltd. | ||||||||||||||
| 650,000 | 5.950 | 07/31/24 | 676,609 | |||||||||||
Cleveland-Cliffs, Inc.(c) | ||||||||||||||
| 1,038,000 | 5.750 | 03/01/25 | 1,001,670 | |||||||||||
| 2,250,000 | 5.875 | 06/01/27 | 2,182,500 | |||||||||||
Vale Overseas Ltd. | ||||||||||||||
| 300,000 | 6.250 | 08/10/26 | 356,128 | |||||||||||
| 110,000 | 3.750 | (c) | 07/08/30 | 115,004 | ||||||||||
|
| |||||||||||||
| 4,331,911 | ||||||||||||||
|
| |||||||||||||
| Corporate Obligations – (continued) | ||||||||||||||
| Leisure Time – 0.3% | ||||||||||||||
Sabre GLBL, Inc.(c)(e) | ||||||||||||||
| 2,405,000 | 9.250 | 04/15/25 | 2,651,513 | |||||||||||
SRM Escrow Issuer LLC | ||||||||||||||
| 2,839,000 | 6.000 | 11/01/28 | 2,839,000 | |||||||||||
|
| |||||||||||||
| 5,490,513 | ||||||||||||||
|
| |||||||||||||
| Lodging(c) – 0.2% | ||||||||||||||
Fortune Star BVI Ltd. | ||||||||||||||
| 340,000 | 5.250 | 03/23/22 | 341,275 | |||||||||||
Marriott International, Inc. | ||||||||||||||
| 1,664,000 | 4.625 | 06/15/30 | 1,774,523 | |||||||||||
Wyndham Destinations, Inc.(e) | ||||||||||||||
| 598,000 | 6.625 | 07/31/26 | 636,122 | |||||||||||
|
| |||||||||||||
| 2,751,920 | ||||||||||||||
|
| |||||||||||||
| Machinery – Construction & Mining(c)(e) – 0.1% | ||||||||||||||
BWX Technologies, Inc. | ||||||||||||||
| 1,023,000 | 4.125 | 06/30/28 | 1,040,903 | |||||||||||
|
| |||||||||||||
| Machinery-Diversified(c)(e) – 0.0% | ||||||||||||||
Titan Acquisition Ltd./Titan Co-Borrower LLC | ||||||||||||||
| 588,000 | 7.750 | 04/15/26 | 588,000 | |||||||||||
|
| |||||||||||||
| Media – 4.6% | ||||||||||||||
Altice Financing SA(c) | ||||||||||||||
| 200,000 | 7.500 | 05/15/26 | 208,750 | |||||||||||
AMC Networks, Inc.(c) | ||||||||||||||
| 1,800,000 | 4.750 | 08/01/25 | 1,800,000 | |||||||||||
CCO Holdings LLC/CCO Holdings Capital Corp.(c)(e) | ||||||||||||||
| 3,000,000 | 5.875 | 05/01/27 | 3,123,750 | |||||||||||
| 4,980,000 | 4.750 | 03/01/30 | 5,235,225 | |||||||||||
| | Charter Communications Operating LLC/Charter | | ||||||||||||
| 12,000,000 | 6.384 | 10/23/35 | 16,231,920 | |||||||||||
Comcast Corp.(c) | ||||||||||||||
| 2,827,000 | 2.800 | 01/15/51 | 2,794,970 | |||||||||||
CSC Holdings LLC | ||||||||||||||
| 985,000 | 5.250 | 06/01/24 | 1,051,488 | |||||||||||
| 5,450,000 | 5.500 | (c)(e) | 05/15/26 | 5,661,187 | ||||||||||
| 2,298,000 | 4.625 | (c)(e) | 12/01/30 | 2,292,255 | ||||||||||
Cumulus Media New Holdings, Inc.(c)(e) | ||||||||||||||
| 2,680,000 | 6.750 | 07/01/26 | 2,479,000 | |||||||||||
Diamond Sports Group LLC/Diamond Sports Finance Co.(c)(e) | ||||||||||||||
| 1,590,000 | 5.375 | 08/15/26 | 922,200 | |||||||||||
| 3,345,000 | 6.625 | 08/15/27 | 1,388,175 | |||||||||||
DISH DBS Corp. | ||||||||||||||
| 6,300,000 | 5.875 | 07/15/22 | 6,481,125 | |||||||||||
Entercom Media Corp.(c)(e) | ||||||||||||||
| 2,300,000 | 7.250 | 11/01/24 | 1,920,500 | |||||||||||
| 4,250,000 | 6.500 | 05/01/27 | 3,676,250 | |||||||||||
Gray Television, Inc.(c)(e) | ||||||||||||||
| 2,125,000 | 7.000 | 05/15/27 | 2,279,063 | |||||||||||
iHeartCommunications, Inc.(c)(e) | ||||||||||||||
| 1,450,000 | 5.250 | 08/15/27 | 1,433,688 | |||||||||||
| 550,000 | 4.750 | 01/15/28 | 525,250 | |||||||||||
Nexstar Broadcasting, Inc.(c)(e) | ||||||||||||||
| 1,500,000 | 5.625 | 07/15/27 | 1,563,750 | |||||||||||
|
| |||||||||||||
| 26 | The accompanying notes are an integral part of these financial statements. |
GOLDMAN SACHS INCOME BUILDER FUND
| Principal Amount | Interest Rate | Maturity Date | Value | |||||||||||
| Corporate Obligations – (continued) | ||||||||||||||
| Media – (continued) | ||||||||||||||
Radiate Holdco LLC/Radiate Finance, Inc.(c)(e) | ||||||||||||||
| $ | 1,211,000 | 6.500 | % | 09/15/28 | $ | 1,247,330 | ||||||||
Scripps Escrow, Inc.(c)(e) | ||||||||||||||
| 1,050,000 | 5.875 | 07/15/27 | 1,021,125 | |||||||||||
Sinclair Television Group, Inc.(c)(e) | ||||||||||||||
| 2,100,000 | 5.875 | 03/15/26 | 2,079,000 | |||||||||||
Sirius XM Radio, Inc.(c)(e) | ||||||||||||||
| 1,085,000 | 4.625 | 07/15/24 | 1,117,550 | |||||||||||
TEGNA, Inc.(c)(e) | ||||||||||||||
| 2,300,000 | 4.625 | 03/15/28 | 2,265,500 | |||||||||||
The E.W. Scripps Co.(c)(e) | ||||||||||||||
| 1,875,000 | 5.125 | 05/15/25 | 1,785,938 | |||||||||||
Videotron Ltd.(c)(e) | ||||||||||||||
| 5,125,000 | 5.375 | 06/15/24 | 5,573,437 | |||||||||||
Virgin Media Vendor Financing Notes III DAC(c)(e) | ||||||||||||||
| GBP | 1,650,000 | 4.875 | 07/15/28 | 2,127,570 | ||||||||||
Ziggo Bond Co. B.V.(c)(e) | ||||||||||||||
| EUR | 675,000 | 3.375 | 02/28/30 | 746,706 | ||||||||||
| $ | 500,000 | 5.125 | 02/28/30 | 513,125 | ||||||||||
|
| |||||||||||||
| 79,545,827 | ||||||||||||||
|
| |||||||||||||
| Mining – 1.0% | ||||||||||||||
Constellium SE(c)(e) | ||||||||||||||
| 2,100,000 | 5.875 | 02/15/26 | 2,128,875 | |||||||||||
First Quantum Minerals Ltd.(c)(e) | ||||||||||||||
| 4,000,000 | 7.250 | 04/01/23 | 4,021,250 | |||||||||||
Freeport-McMoRan, Inc.(c) | ||||||||||||||
| 2,000,000 | 5.400 | 11/14/34 | 2,280,000 | |||||||||||
Glencore Finance Canada Ltd.(e) | ||||||||||||||
| 3,000,000 | 5.550 | 10/25/42 | 3,426,690 | |||||||||||
Novelis Corp.(c)(e) | ||||||||||||||
| 2,100,000 | 5.875 | 09/30/26 | 2,170,875 | |||||||||||
| 2,400,000 | 4.750 | 01/30/30 | 2,433,000 | |||||||||||
Vedanta Resources Finance II PLC(c)(e) | ||||||||||||||
| 200,000 | 9.250 | 04/23/26 | 125,250 | |||||||||||
|
| |||||||||||||
| 16,585,940 | ||||||||||||||
|
| |||||||||||||
| Miscellaneous Manufacturing(c)(d) – 0.2% | ||||||||||||||
General Electric Co (3M USD LIBOR + 3.330%) | ||||||||||||||
| 4,477,000 | 5.000 | 01/21/49 | 3,658,739 | |||||||||||
|
| |||||||||||||
| Office & Business Equipment(c) – 0.1% | ||||||||||||||
CDW LLC/CDW Finance Corp. | ||||||||||||||
| 1,440,000 | 4.125 | 05/01/25 | 1,495,800 | |||||||||||
Xerox Holdings Corp.(e) | ||||||||||||||
| 1,055,000 | 5.000 | 08/15/25 | 1,044,450 | |||||||||||
|
| |||||||||||||
| 2,540,250 | ||||||||||||||
|
| |||||||||||||
| Oil Field Services – 1.7% | ||||||||||||||
Antero Resources Corp.(c) | ||||||||||||||
| 6,500,000 | 5.125 | 12/01/22 | 5,996,250 | |||||||||||
Cenovus Energy, Inc.(c) | ||||||||||||||
| 153,000 | 3.000 | 08/15/22 | 151,637 | |||||||||||
| 1,412,000 | 3.800 | 09/15/23 | 1,433,053 | |||||||||||
| 1,780,000 | 5.375 | 07/15/25 | 1,876,351 | |||||||||||
Chesapeake Energy Corp.(a) | ||||||||||||||
| 2,000,000 | 5.500 | 09/15/26 | 91,250 | |||||||||||
|
| |||||||||||||
| Corporate Obligations – (continued) | ||||||||||||||
| Oil Field Services – (continued) | ||||||||||||||
Cia General de Combustibles SA(e) | ||||||||||||||
| 560,000 | 9.500 | 03/08/25 | 380,800 | |||||||||||
Diamondback Energy, Inc.(c) | ||||||||||||||
| 1,022,000 | 4.750 | 05/31/25 | 1,109,749 | |||||||||||
DNO ASA(c)(e) | ||||||||||||||
| 420,000 | 8.375 | 05/29/24 | 363,300 | |||||||||||
Ensign Drilling, Inc.(c)(e) | ||||||||||||||
| 1,400,000 | 9.250 | 04/15/24 | 483,000 | |||||||||||
Geopark Ltd.(c)(e) | ||||||||||||||
| 200,000 | 5.500 | 01/17/27 | 174,188 | |||||||||||
Kosmos Energy Ltd.(c) | ||||||||||||||
| 500,000 | 7.125 | 04/04/26 | 429,375 | |||||||||||
Laredo Petroleum, Inc.(c) | ||||||||||||||
| 2,213,000 | 9.500 | 01/15/25 | 1,017,980 | |||||||||||
Leviathan Bond Ltd.(c)(e) | ||||||||||||||
| 3,080,000 | 5.750 | 06/30/23 | 3,142,562 | |||||||||||
Lukoil Securities B.V.(e) | ||||||||||||||
| 500,000 | 3.875 | 05/06/30 | 530,185 | |||||||||||
MEG Energy Corp.(c)(e) | ||||||||||||||
| 2,480,000 | 7.125 | 02/01/27 | 2,221,460 | |||||||||||
Nabors Industries Ltd.(c)(e) | ||||||||||||||
| 840,000 | 7.250 | 01/15/26 | 343,350 | |||||||||||
Nexen, Inc. | ||||||||||||||
| 5,000 | 6.400 | 05/15/37 | 7,256 | |||||||||||
| 50,000 | 7.500 | 07/30/39 | 81,828 | |||||||||||
Noble Holding International Ltd.(a)(c) | ||||||||||||||
| 840,000 | 7.750 | 01/15/24 | 5,250 | |||||||||||
| 1,975,000 | 7.875 | (e) | 02/01/26 | 483,875 | ||||||||||
Occidental Petroleum Corp.(c) | ||||||||||||||
| 2,180,000 | 8.000 | 07/15/25 | 2,120,050 | |||||||||||
| 2,550,000 | 6.625 | 09/01/30 | 2,231,250 | |||||||||||
Petrobras Global Finance B.V.(h) | ||||||||||||||
| 500,000 | 6.850 | 06/05/15 | 536,406 | |||||||||||
Petroleos Mexicanos | ||||||||||||||
| EUR | 220,000 | 2.500 | 08/21/21 | 253,741 | ||||||||||
Sunoco LP/Sunoco Finance Corp.(c) | ||||||||||||||
| $ | 545,000 | 5.500 | 02/15/26 | 547,725 | ||||||||||
Tecpetrol SA(c) | ||||||||||||||
| 770,000 | 4.875 | 12/12/22 | 705,272 | |||||||||||
Transocean, Inc.(c)(e) | ||||||||||||||
| 2,070,000 | 8.000 | 02/01/27 | 558,900 | |||||||||||
| | USA Compression Partners LP/USA Compression Finance | | ||||||||||||
| 1,300,000 | 6.875 | 04/01/26 | 1,300,000 | |||||||||||
|
| |||||||||||||
| 28,576,043 | ||||||||||||||
|
| |||||||||||||
| Packaging – 1.4% | ||||||||||||||
ARD Finance SA(c)(f) | ||||||||||||||
(PIK 5.750%, Cash 5.000%) | ||||||||||||||
| EUR | 1,850,000 | 5.000 | 06/30/27 | 2,081,045 | ||||||||||
(PIK 7.250%, Cash 6.500%) | ||||||||||||||
| $ | 3,950,000 | 6.500 | (e) | 06/30/27 | 4,004,312 | |||||||||
Berry Global, Inc.(c)(e) | ||||||||||||||
| 2,200,000 | 4.500 | 02/15/26 | 2,230,250 | |||||||||||
| 2,000,000 | 5.625 | 07/15/27 | 2,090,000 | |||||||||||
Graphic Packaging International LLC(e) | ||||||||||||||
| 646,000 | 3.500 | 03/15/28 | 646,000 | |||||||||||
|
| |||||||||||||
| The accompanying notes are an integral part of these financial statements. | 27 |
GOLDMAN SACHS INCOME BUILDER FUND
Schedule of Investments (continued)
October 31, 2020
| Principal Amount | Interest Rate | Maturity Date | Value | |||||||||||
| Corporate Obligations – (continued) | ||||||||||||||
| Packaging – (continued) | ||||||||||||||
LABL Escrow Issuer LLC(c)(e) | ||||||||||||||
| $ | 1,750,000 | 6.750 | % | 07/15/26 | $ | 1,837,500 | ||||||||
Mauser Packaging Solutions Holding Co.(c)(e) | ||||||||||||||
| 2,150,000 | 5.500 | 04/15/24 | 2,150,000 | |||||||||||
| 965,000 | 7.250 | 04/15/25 | 931,225 | |||||||||||
Owens-Brockway Glass Container, Inc.(e) | ||||||||||||||
| 1,750,000 | 5.875 | 08/15/23 | 1,837,500 | |||||||||||
| | Reynolds Group Issuer, Inc./Reynolds Group Issuer | | ||||||||||||
| 1,410,000 | 4.000 | 10/15/27 | 1,424,100 | |||||||||||
Sealed Air Corp.(e) | ||||||||||||||
| 1,843,000 | 6.875 | 07/15/33 | 2,382,077 | |||||||||||
Trivium Packaging Finance B.V.(c)(e) | ||||||||||||||
| 1,075,000 | 5.500 | 08/15/26 | 1,123,375 | |||||||||||
| 1,300,000 | 8.500 | 08/15/27 | 1,387,750 | |||||||||||
|
| |||||||||||||
| 24,125,134 | ||||||||||||||
|
| |||||||||||||
| Pharmaceuticals(c) – 2.0% | ||||||||||||||
AbbVie, Inc.(e) | ||||||||||||||
| 6,650,000 | 3.200 | 11/21/29 | 7,314,933 | |||||||||||
AdaptHealth LLC(e) | ||||||||||||||
| 1,445,000 | 6.125 | 08/01/28 | 1,510,025 | |||||||||||
Bausch Health Cos., Inc.(e) | ||||||||||||||
| 32,000 | 5.875 | 05/15/23 | 32,000 | |||||||||||
| 4,000,000 | 9.000 | 12/15/25 | 4,360,000 | |||||||||||
| 1,350,000 | 5.000 | 01/30/28 | 1,331,438 | |||||||||||
| 1,350,000 | 5.250 | 01/30/30 | 1,329,750 | |||||||||||
Becton Dickinson & Co. | ||||||||||||||
| 3,200,000 | 2.823 | 05/20/30 | 3,413,536 | |||||||||||
Cheplapharm Arzneimittel GmbH(e) | ||||||||||||||
| 1,268,000 | 5.500 | 01/15/28 | 1,283,850 | |||||||||||
CVS Health Corp. | ||||||||||||||
| 4,715,000 | 3.750 | 04/01/30 | 5,352,657 | |||||||||||
Herbalife Nutrition Ltd./HLF Financing, Inc.(e) | ||||||||||||||
| 1,312,000 | 7.875 | 09/01/25 | 1,387,440 | |||||||||||
HLF Financing S.a.r.l. LLC/Herbalife International, Inc.(e) | ||||||||||||||
| 2,745,000 | 7.250 | 08/15/26 | 2,820,487 | |||||||||||
Mylan NV | ||||||||||||||
| 3,000,000 | 3.950 | 06/15/26 | 3,380,670 | |||||||||||
Vizient, Inc.(e) | ||||||||||||||
| 580,000 | 6.250 | 05/15/27 | 614,075 | |||||||||||
|
| |||||||||||||
| 34,130,861 | ||||||||||||||
|
| |||||||||||||
| Pipelines – 4.0% | ||||||||||||||
Buckeye Partners LP(c) | ||||||||||||||
| 2,100,000 | 4.350 | 10/15/24 | 2,055,375 | |||||||||||
| 1,835,000 | 4.125 | (e) | 03/01/25 | 1,747,837 | ||||||||||
| 2,801,000 | 3.950 | 12/01/26 | 2,597,927 | |||||||||||
| 929,000 | 4.125 | 12/01/27 | 870,938 | |||||||||||
| 1,217,000 | 4.500 | (e) | 03/01/28 | 1,151,586 | ||||||||||
Cheniere Energy Partners LP(c) | ||||||||||||||
| 1,800,000 | 4.500 | 10/01/29 | 1,833,750 | |||||||||||
DCP Midstream Operating LP(e) | ||||||||||||||
| 4,000,000 | 6.750 | 09/15/37 | 3,820,000 | |||||||||||
Energy Transfer Operating LP | ||||||||||||||
| 4,000,000 | 4.250 | (c) | 03/15/23 | 4,164,760 | ||||||||||
| 2,985,000 | 6.625 | 10/15/36 | 3,232,845 | |||||||||||
|
| |||||||||||||
| Corporate Obligations – (continued) | ||||||||||||||
| Pipelines – (continued) | ||||||||||||||
| | Enterprise Products Operating LLC(c)(d) (3M USD LIBOR + | | ||||||||||||
| 1,000,000 | 3.024 | 06/01/67 | 766,210 | |||||||||||
Genesis Energy LP/Genesis Energy Finance Corp.(c) | ||||||||||||||
| 3,500,000 | 6.000 | 05/15/23 | 3,185,000 | |||||||||||
| 2,010,000 | 7.750 | 02/01/28 | 1,668,300 | |||||||||||
Global Partners LP/GLP Finance Corp.(c)(e) | ||||||||||||||
| 2,055,000 | 6.875 | 01/15/29 | 2,114,081 | |||||||||||
Kinder Morgan Energy Partners LP | ||||||||||||||
| 7,000,000 | 7.300 | 08/15/33 | 9,414,300 | |||||||||||
NGPL PipeCo LLC(c)(e) | ||||||||||||||
| 1,315,000 | 4.375 | 08/15/22 | 1,364,931 | |||||||||||
NuStar Logistics LP(c) | ||||||||||||||
| 3,225,000 | 6.375 | 10/01/30 | 3,241,125 | |||||||||||
Plains All American Pipeline LP/PAA Finance Corp.(c) | ||||||||||||||
| 3,000,000 | 3.600 | 11/01/24 | 3,084,870 | |||||||||||
Sabine Pass Liquefaction LLC(c) | ||||||||||||||
| 2,275,000 | 4.200 | 03/15/28 | 2,464,849 | |||||||||||
Tallgrass Energy Partners LP/Tallgrass Energy Finance Corp.(c)(e) | ||||||||||||||
| 935,000 | 4.750 | 10/01/23 | 888,250 | |||||||||||
| 2,430,000 | 5.500 | 09/15/24 | 2,308,500 | |||||||||||
| | Targa Resources Partners LP/Targa Resources Partners Finance | | ||||||||||||
| 5,000,000 | 5.125 | 02/01/25 | 5,012,500 | |||||||||||
| 1,910,000 | 4.875 | (e) | 02/01/31 | 1,862,250 | ||||||||||
The Williams Cos., Inc. | ||||||||||||||
| 7,000,000 | 7.500 | 01/15/31 | 9,082,570 | |||||||||||
|
| |||||||||||||
| 67,932,754 | ||||||||||||||
|
| |||||||||||||
| Real Estate Investment Trust – 1.8% | ||||||||||||||
American Tower Corp.(c) | ||||||||||||||
| 2,125,000 | 3.950 | 03/15/29 | 2,425,220 | |||||||||||
| | Brookfield Property REIT, Inc./BPR Cumulus LLC/BPR Nimbus | | ||||||||||||
| 600,000 | 5.750 | 05/15/26 | 501,593 | |||||||||||
Country Garden Holdings Co. Ltd.(c) | ||||||||||||||
| 650,000 | 6.500 | 04/08/24 | 699,969 | |||||||||||
Crown Castle International Corp.(c) | ||||||||||||||
| 300,000 | 4.150 | 07/01/50 | 340,563 | |||||||||||
Growthpoint Properties International Pty Ltd. | ||||||||||||||
| 270,000 | 5.872 | 05/02/23 | 279,619 | |||||||||||
IRSA Propiedades Comerciales SA(c) | ||||||||||||||
| 540,000 | 8.750 | 03/23/23 | 401,625 | |||||||||||
Kaisa Group Holdings Ltd. | ||||||||||||||
| 320,000 | 11.750 | 02/26/21 | 324,200 | |||||||||||
| | MGM Growth Properties Operating Partnership LP/MGP Finance | | ||||||||||||
| 1,306,000 | 4.625 | 06/15/25 | 1,325,590 | |||||||||||
MPT Operating Partnership LP/MPT Finance Corp.(c) | ||||||||||||||
| 4,000,000 | 6.375 | 03/01/24 | 4,093,760 | |||||||||||
| 3,000,000 | 5.000 | 10/15/27 | 3,138,720 | |||||||||||
NE Property B.V.(c) | ||||||||||||||
| EUR | 470,000 | 1.750 | 11/23/24 | 530,622 | ||||||||||
Realogy Group LLC/Realogy Co-Issuer Corp.(c)(e) | ||||||||||||||
| $ | 1,600,000 | 4.875 | 06/01/23 | 1,598,000 | ||||||||||
| 1,950,000 | 9.375 | 04/01/27 | 2,062,125 | |||||||||||
|
| |||||||||||||
| 28 | The accompanying notes are an integral part of these financial statements. |
GOLDMAN SACHS INCOME BUILDER FUND
| Principal Amount | Interest Rate | Maturity Date | Value | |||||||||||
| Corporate Obligations – (continued) | ||||||||||||||
| Real Estate Investment Trust – (continued) | ||||||||||||||
Realogy Group LLC/Realogy Co.-Issuer Corp.(c)(e) | ||||||||||||||
| $ | 748,000 | 7.625 | % | 06/15/25 | $ | 790,075 | ||||||||
SBA Communications Corp.(c)(e) | ||||||||||||||
| 2,637,000 | 3.875 | 02/15/27 | 2,676,555 | |||||||||||
Scenery Journey Ltd.(c) | ||||||||||||||
| 310,000 | 13.000 | 11/06/22 | 267,956 | |||||||||||
Service Properties Trust(c) | ||||||||||||||
| 623,000 | 7.500 | 09/15/25 | 652,358 | |||||||||||
| 2,201,000 | 4.750 | 10/01/26 | 1,848,631 | |||||||||||
| 1,318,000 | 4.950 | 10/01/29 | 1,079,787 | |||||||||||
Starwood Property Trust, Inc.(c) | ||||||||||||||
| 2,700,000 | 4.750 | 03/15/25 | 2,625,750 | |||||||||||
The Howard Hughes Corp.(c)(e) | ||||||||||||||
| 1,474,000 | 5.375 | 08/01/28 | 1,481,370 | |||||||||||
VICI Properties LP/VICI Note Co., Inc.(c)(e) | ||||||||||||||
| 1,526,000 | 3.500 | 02/15/25 | 1,533,630 | |||||||||||
|
| |||||||||||||
| 30,677,718 | ||||||||||||||
|
| |||||||||||||
| Retailing – 1.6% | ||||||||||||||
1011778 BC ULC/New Red Finance, Inc.(c)(e) | ||||||||||||||
| 1,551,000 | 5.000 | 10/15/25 | 1,589,775 | |||||||||||
AutoNation, Inc.(c) | ||||||||||||||
| 961,000 | 4.750 | 06/01/30 | 1,126,321 | |||||||||||
Beacon Roofing Supply, Inc.(c)(e) | ||||||||||||||
| 2,907,000 | 4.875 | 11/01/25 | 2,852,494 | |||||||||||
Burlington Coat Factory Warehouse Corp.(c)(e) | ||||||||||||||
| 684,000 | 6.250 | 04/15/25 | 718,200 | |||||||||||
eG Global Finance PLC(c)(e) | ||||||||||||||
| 3,800,000 | 6.750 | 02/07/25 | 3,738,250 | |||||||||||
Eurotorg LLC Via Bonitron DAC(e) | ||||||||||||||
| 560,000 | 9.000 | 10/22/25 | 560,000 | |||||||||||
IRB Holding Corp.(c)(e) | ||||||||||||||
| 1,099,000 | 7.000 | 06/15/25 | 1,167,687 | |||||||||||
| 2,710,000 | 6.750 | 02/15/26 | 2,716,775 | |||||||||||
JSM Global Sarl(c)(e) | ||||||||||||||
| 200,000 | 4.750 | 10/20/30 | 202,500 | |||||||||||
L Brands, Inc.(c)(e) | ||||||||||||||
| 715,000 | 6.875 | 07/01/25 | 766,838 | |||||||||||
PetSmart, Inc.(c)(e) | ||||||||||||||
| 2,800,000 | 5.875 | 06/01/25 | 2,842,000 | |||||||||||
| | Specialty Building Products Holdings LLC/SBP Finance | | ||||||||||||
| 3,446,000 | 6.375 | 09/30/26 | 3,514,920 | |||||||||||
Suburban Propane Partners LP/Suburban Energy Finance Corp.(c) | ||||||||||||||
| 550,000 | 5.500 | 06/01/24 | 555,500 | |||||||||||
The Home Depot, Inc.(c) | ||||||||||||||
| 1,170,000 | 3.350 | 04/15/50 | 1,319,818 | |||||||||||
Yum! Brands, Inc.(c)(e) | ||||||||||||||
| 63,000 | 7.750 | 04/01/25 | 68,985 | |||||||||||
| 3,064,000 | 4.750 | 01/15/30 | 3,286,140 | |||||||||||
|
| |||||||||||||
| 27,026,203 | ||||||||||||||
|
| |||||||||||||
| Semiconductors – 1.1% | ||||||||||||||
Amkor Technology, Inc.(c)(e) | ||||||||||||||
| 1,398,000 | 6.625 | 09/15/27 | 1,495,860 | |||||||||||
AMS AG(c)(e) | ||||||||||||||
| 1,682,000 | 7.000 | 07/31/25 | 1,780,818 | |||||||||||
|
| |||||||||||||
| Corporate Obligations – (continued) | ||||||||||||||
| Semiconductors – (continued) | ||||||||||||||
Broadcom Corp./Broadcom Cayman Finance Ltd.(c) | ||||||||||||||
| 3,925,000 | 3.875 | 01/15/27 | 4,333,592 | |||||||||||
Broadcom, Inc.(c) | ||||||||||||||
| 3,117,000 | 5.000 | 04/15/30 | 3,673,010 | |||||||||||
| 3,925,000 | 4.150 | 11/15/30 | 4,393,645 | |||||||||||
Microchip Technology, Inc. | ||||||||||||||
| 2,000,000 | 3.922 | 06/01/21 | 2,038,026 | |||||||||||
NXP B.V./NXP Funding LLC/NXP USA, Inc.(c)(e) | ||||||||||||||
| 982,000 | 3.400 | 05/01/30 | 1,079,876 | |||||||||||
Qorvo, Inc.(c) | ||||||||||||||
| 750,000 | 4.375 | 10/15/29 | 802,500 | |||||||||||
|
| |||||||||||||
| 19,597,327 | ||||||||||||||
|
| |||||||||||||
| Software(c) – 0.8% | ||||||||||||||
Black Knight InfoServ LLC(e) | ||||||||||||||
| 1,765,000 | 3.625 | 09/01/28 | 1,782,650 | |||||||||||
Castle US Holding Corp.(e) | ||||||||||||||
| 2,824,000 | 9.500 | 02/15/28 | 2,668,680 | |||||||||||
J2 Global, Inc.(e) | ||||||||||||||
| 2,920,000 | 4.625 | 10/15/30 | 2,949,200 | |||||||||||
Nuance Communications, Inc. | ||||||||||||||
| 3,000,000 | 5.625 | 12/15/26 | 3,150,000 | |||||||||||
Oracle Corp. | ||||||||||||||
| 1,405,000 | 3.600 | 04/01/50 | 1,533,726 | |||||||||||
PTC, Inc.(e) | ||||||||||||||
| 4,000 | 3.625 | 02/15/25 | 4,050 | |||||||||||
SS&C Technologies, Inc.(e) | ||||||||||||||
| 850,000 | 5.500 | 09/30/27 | 903,125 | |||||||||||
|
| |||||||||||||
| 12,991,431 | ||||||||||||||
|
| |||||||||||||
| Telecommunication Services – 3.5% | ||||||||||||||
Altice France SA(c)(e) | ||||||||||||||
| 5,000,000 | 7.375 | 05/01/26 | 5,218,750 | |||||||||||
AT&T, Inc.(c) | ||||||||||||||
| 3,000,000 | 5.250 | 03/01/37 | 3,735,060 | |||||||||||
Avaya, Inc.(c)(e) | ||||||||||||||
| 3,575,000 | 6.125 | 09/15/28 | 3,691,187 | |||||||||||
CenturyLink, Inc. | ||||||||||||||
| 1,450,000 | 5.125 | (c)(e) | 12/15/26 | 1,482,625 | ||||||||||
| 2,870,000 | 7.650 | 03/15/42 | 3,200,050 | |||||||||||
Cincinnati Bell, Inc.(c)(e) | ||||||||||||||
| 2,000,000 | 7.000 | 07/15/24 | 2,062,500 | |||||||||||
CommScope, Inc.(c)(e) | ||||||||||||||
| 1,100,000 | 6.000 | 03/01/26 | 1,138,500 | |||||||||||
| 1,430,000 | 7.125 | 07/01/28 | 1,433,575 | |||||||||||
Digicel Group 0.5 Ltd.(c)(e)(f) | ||||||||||||||
| 99,648 | 7.000 | 11/16/49 | 12,207 | |||||||||||
(PIK 3.000%, Cash 5.000%) | ||||||||||||||
| 603,257 | 8.000 | 04/01/25 | 205,296 | |||||||||||
Intelsat Jackson Holdings SA(c)(e) | ||||||||||||||
| 4,800,000 | 8.000 | 02/15/24 | 4,872,000 | |||||||||||
| 3,000,000 | 8.500 | (a) | 10/15/24 | 1,856,250 | ||||||||||
Millicom International Cellular SA(c)(e) | ||||||||||||||
| 410,000 | 4.500 | 04/27/31 | 415,638 | |||||||||||
MTN Mauritius Investments Ltd. | ||||||||||||||
| 420,000 | 6.500 | 10/13/26 | 466,725 | |||||||||||
|
| |||||||||||||
| The accompanying notes are an integral part of these financial statements. | 29 |
GOLDMAN SACHS INCOME BUILDER FUND
Schedule of Investments (continued)
October 31, 2020
| Principal Amount | Interest Rate | Maturity Date | Value | |||||||||||
| Corporate Obligations – (continued) | ||||||||||||||
| Telecommunication Services – (continued) | ||||||||||||||
Nokia of America Corp. | ||||||||||||||
| $ | 3,000,000 | 6.450 | % | 03/15/29 | $ | 3,240,000 | ||||||||
Sprint Capital Corp. | ||||||||||||||
| 1,150,000 | 8.750 | 03/15/32 | 1,720,687 | |||||||||||
Sprint Corp. | ||||||||||||||
| 4,269,000 | 7.875 | 09/15/23 | 4,866,660 | |||||||||||
T-Mobile USA, Inc.(c) | ||||||||||||||
| 3,000,000 | 4.000 | 04/15/22 | 3,090,000 | |||||||||||
| 6,000,000 | 6.500 | 01/15/26 | 6,202,500 | |||||||||||
| 1,896,000 | 4.500 | (e) | 04/15/50 | 2,212,196 | ||||||||||
Telecom Argentina SA(e) | ||||||||||||||
| 238,000 | 8.500 | 08/06/25 | 194,785 | |||||||||||
| 270,000 | 8.000 | (c) | 07/18/26 | 222,750 | ||||||||||
Telecom Italia Capital SA | ||||||||||||||
| 3,025,000 | 7.200 | 07/18/36 | 3,807,719 | |||||||||||
| 1,000,000 | 7.721 | 06/04/38 | 1,361,250 | |||||||||||
Verizon Communications, Inc. | ||||||||||||||
| 3,000,000 | 5.250 | 03/16/37 | 4,069,440 | |||||||||||
|
| |||||||||||||
| 60,778,350 | ||||||||||||||
|
| |||||||||||||
| Toys/Games/Hobbies(c) – 0.1% | ||||||||||||||
Mattel, Inc. | ||||||||||||||
| 2,475,000 | 3.150 | 03/15/23 | 2,462,625 | |||||||||||
|
| |||||||||||||
| Transportation – 0.0% | ||||||||||||||
MV24 Capital B.V.(e) | ||||||||||||||
| 331,548 | 6.748 | 06/01/34 | 334,034 | |||||||||||
Rumo Luxembourg S.a.r.l.(c) | ||||||||||||||
| 240,000 | 5.875 | 01/18/25 | 251,100 | |||||||||||
|
| |||||||||||||
| 585,134 | ||||||||||||||
|
| |||||||||||||
| | TOTAL CORPORATE OBLIGATIONS (Cost $868,026,999) | | $ | 886,285,407 | ||||||||||
|
| |||||||||||||
| Mortgage-Backed Obligations(d) – 0.0% | ||||||||||||||
| Collateralized Mortgage Obligation – 0.0% | ||||||||||||||
| Sequential Floating Rate – 0.0% | ||||||||||||||
| | Merrill Lynch Alternative Note Asset Trust Series 2007-OAR3, | | ||||||||||||
| $ | 206,956 | 0.338 | % | 07/25/47 | $ | 183,272 | ||||||||
| (Cost $80,195) | ||||||||||||||
|
| |||||||||||||
| TOTAL MORTGAGE-BACKED OBLIGATIONS | ||||||||||||||
| (Cost $80,195) | $ | 183,272 | ||||||||||||
|
| |||||||||||||
| Foreign Debt Obligations – 0.2% | ||||||||||||||
| Sovereign – 0.2% | ||||||||||||||
Republic of Ecuador(e) | ||||||||||||||
| $ | 57,283 | 0.000 | %(i) | 07/31/30 | $ | 25,795 | ||||||||
| 196,146 | 0.500 | (j) | 07/31/35 | 107,880 | ||||||||||
| 95,120 | 0.500 | (j) | 07/31/40 | 47,114 | ||||||||||
Republic of Egypt | ||||||||||||||
| EUR | 590,000 | 4.750 | 04/11/25 | 675,548 | ||||||||||
Republic of Nigeria | ||||||||||||||
| $ | 690,000 | 6.500 | 11/28/27 | 667,575 | ||||||||||
|
| |||||||||||||
| Foreign Debt Obligations – (continued) | ||||||||||||||
| Sovereign – (continued) | ||||||||||||||
Republic of Sri Lanka(e) | ||||||||||||||
| 630,000 | 6.350 | 06/28/24 | 356,344 | |||||||||||
Republic of Turkey | ||||||||||||||
| 760,000 | 6.125 | 10/24/28 | 710,363 | |||||||||||
Ukraine Government International Bond | ||||||||||||||
| 680,000 | 7.750 | 09/01/23 | 706,180 | |||||||||||
|
| |||||||||||||
| TOTAL FOREIGN DEBT OBLIGATIONS | ||||||||||||||
| (Cost $3,501,217) | $ | 3,296,799 | ||||||||||||
|
| |||||||||||||
| Bank Loans(k) – 6.8% | ||||||||||||||
| Aerospace & Defense(d) – 0.2% | ||||||||||||||
TransDigm, Inc. (1M LIBOR + 2.250%) | ||||||||||||||
| $ | 4,240,150 | 2.398 | % | 12/09/25 | $ | 3,982,561 | ||||||||
|
| |||||||||||||
| Automotive – Parts(d) – 0.2% | ||||||||||||||
Adient US LLC (1M LIBOR + 4.250%) | ||||||||||||||
| 1,945,437 | 4.398 | 05/06/24 | 1,915,283 | |||||||||||
Tenneco, Inc. (1M LIBOR + 3.000%) | ||||||||||||||
| 2,471,111 | 3.148 | 10/01/25 | 2,274,040 | |||||||||||
|
| |||||||||||||
| 4,189,323 | ||||||||||||||
|
| |||||||||||||
| Chemicals(d) – 0.3% | ||||||||||||||
Momentive Performance Materials, Inc. (1M LIBOR + 3.250%) | ||||||||||||||
| 2,123,125 | 3.400 | 05/15/24 | 2,007,691 | |||||||||||
Starfruit Finco B.V. (1M LIBOR + 3.000%) | ||||||||||||||
| 2,878,963 | 3.145 | 10/01/25 | 2,783,957 | |||||||||||
|
| |||||||||||||
| 4,791,648 | ||||||||||||||
|
| |||||||||||||
| Computers(d) – 0.2% | ||||||||||||||
Redstone Buyer LLC (3M LIBOR + 5.000%) | ||||||||||||||
| 2,850,000 | 6.000 | 09/01/27 | 2,823,865 | |||||||||||
|
| |||||||||||||
| Diversified Financial Services(d) – 0.0% | ||||||||||||||
Fiserv Investment Solutions, Inc. (3M LIBOR + 4.750%) | ||||||||||||||
| 648,375 | 5.020 | 02/18/27 | 642,164 | |||||||||||
|
| |||||||||||||
| Diversified Manufacturing(d) – 0.1% | ||||||||||||||
Camelot U.S. Acquisition 1 Co. (1M LIBOR + 3.000%) | ||||||||||||||
| 2,000,000 | 4.000 | 10/30/26 | 1,975,840 | |||||||||||
|
| |||||||||||||
| Entertainment(l) – 0.1% | ||||||||||||||
AMC Entertainment Holdings, Inc. (3M LIBOR + 3.000%) | ||||||||||||||
| 2,942,532 | 0.000 | 04/22/26 | 1,639,049 | |||||||||||
|
| |||||||||||||
| Food & Drug Retailers(d) – 0.0% | ||||||||||||||
B&G Foods, Inc. (1M LIBOR + 2.500%) | ||||||||||||||
| 619,375 | 2.648 | 10/10/26 | 614,885 | |||||||||||
|
| |||||||||||||
| Health Care – Pharmaceuticals(d) – 0.4% | ||||||||||||||
Bausch Health Co., Inc. (1M LIBOR + 3.000%) | ||||||||||||||
| 6,616,683 | 3.149 | 06/02/25 | 6,454,045 | |||||||||||
|
| |||||||||||||
| Health Care – Services(d) – 0.4% | ||||||||||||||
MPH Acquisition Holdings LLC (3M LIBOR + 2.750%) | ||||||||||||||
| 1,666,192 | 3.750 | 06/07/23 | 1,642,982 | |||||||||||
Sotera Health Holdings LLC (3M LIBOR + 4.500%) | ||||||||||||||
| 1,974,809 | 5.500 | 12/11/26 | 1,966,574 | |||||||||||
U.S. Renal Care, Inc. (1M LIBOR + 5.000%) | ||||||||||||||
| 2,178,000 | 5.188 | 06/26/26 | 2,090,205 | |||||||||||
|
| |||||||||||||
| 30 | The accompanying notes are an integral part of these financial statements. |
GOLDMAN SACHS INCOME BUILDER FUND
| Principal Amount | Interest Rate | Maturity Date | Value | |||||||||||
| Bank Loans(k) – (continued) | ||||||||||||||
| Health Care – Services(d) – (continued) | ||||||||||||||
Verscend Holding Corp.(1M LIBOR + 4.500%) | ||||||||||||||
| $ | 1,371,994 | 4.648 | % | 08/27/25 | $ | 1,344,128 | ||||||||
|
| |||||||||||||
| 7,043,889 | ||||||||||||||
|
| |||||||||||||
| Media – Broadcasting & Radio(d) – 0.2% | ||||||||||||||
Cumulus Media New Holdings, Inc. (3M LIBOR + 3.750%) | ||||||||||||||
| 829,371 | 4.750 | 03/31/26 | 783,755 | |||||||||||
Getty Images, Inc. (1M LIBOR + 4.500%) | ||||||||||||||
| 1,943,846 | 4.645 | 02/19/26 | 1,808,477 | |||||||||||
|
| |||||||||||||
| 2,592,232 | ||||||||||||||
|
| |||||||||||||
| Media – Cable(d) – 0.3% | ||||||||||||||
CSC Holdings LLC | ||||||||||||||
(1M LIBOR + 2.250%) | ||||||||||||||
| 1,694,027 | 2.398 | 07/17/25 | 1,632,009 | |||||||||||
(1M LIBOR + 2.500%) | ||||||||||||||
| 3,773,361 | 2.648 | 04/15/27 | 3,647,897 | |||||||||||
|
| |||||||||||||
| 5,279,906 | ||||||||||||||
|
| |||||||||||||
| Media – Non Cable(d) – 0.1% | ||||||||||||||
Terrier Media Buyer, Inc. (1M LIBOR + 4.250%) | ||||||||||||||
| 1,191,000 | 4.398 | 12/17/26 | 1,157,509 | |||||||||||
|
| |||||||||||||
| Packaging(d) – 0.3% | ||||||||||||||
Flex Acquisition Co., Inc. (3M LIBOR + 3.250%) | ||||||||||||||
| 2,796,980 | 3.475 | 06/29/25 | 2,685,968 | |||||||||||
Reynolds Group Holdings, Inc. | ||||||||||||||
(1M LIBOR + 2.750%) | ||||||||||||||
| 1,115,652 | 2.898 | 02/05/23 | 1,093,495 | |||||||||||
(1M LIBOR + 3.250%) | ||||||||||||||
| 1,075,000 | 3.398 | 02/05/26 | 1,048,125 | |||||||||||
|
| |||||||||||||
| 4,827,588 | ||||||||||||||
|
| |||||||||||||
| Pharmaceuticals(d) – 0.3% | ||||||||||||||
Alphabet Holding Co., Inc. (1M LIBOR + 7.750%) | ||||||||||||||
| 5,000,000 | 7.898 | 09/26/25 | 4,803,550 | |||||||||||
|
| |||||||||||||
| Real Estate Investment Trust(d) – 0.1% | ||||||||||||||
Brookfield Property REIT, Inc. (1M LIBOR + 3.000%) | ||||||||||||||
| 2,037,890 | 3.148 | 08/28/23 | 1,781,462 | |||||||||||
|
| |||||||||||||
| Restaurants(d) – 0.0% | ||||||||||||||
1011778 B.C. Unlimited Liability Co. (1M LIBOR + 1.750%) | ||||||||||||||
| 450,301 | 1.898 | 11/19/26 | 431,352 | |||||||||||
|
| |||||||||||||
| Retailers(d) – 0.1% | ||||||||||||||
OEConnection LLC (1M LIBOR + 4.000%) | ||||||||||||||
| 2,119,877 | 4.148 | 09/25/26 | 2,050,981 | |||||||||||
|
| |||||||||||||
| Semiconductors(b)(d) – 0.1% | ||||||||||||||
Allegro Microsystems, Inc. (1M LIBOR + 4.250%) | ||||||||||||||
| 950,000 | 4.750 | 09/30/27 | 945,250 | |||||||||||
|
| |||||||||||||
| Services Cyclical – Business Services(d) – 0.3% | ||||||||||||||
EVO Payments International LLC (1M LIBOR + 3.250%) | ||||||||||||||
| 2,711,041 | 3.400 | 12/22/23 | 2,675,120 | |||||||||||
Travelport Finance (Luxembourg) S.a.r.l. | ||||||||||||||
| 1,661,971 | 9.000 | 02/28/25 | 1,564,629 | |||||||||||
(3M LIBOR + 5.000%) | ||||||||||||||
| 1,814,494 | 5.225 | 02/28/25 | 947,565 | |||||||||||
|
| |||||||||||||
| 5,187,314 | ||||||||||||||
|
| |||||||||||||
| Bank Loans(k) – (continued) | ||||||||||||||
| Services Cyclical – Consumer Services(d) – 0.2% | ||||||||||||||
Asurion LLC (1M LIBOR + 3.000%) | ||||||||||||||
| 3,325,137 | 3.148 | 08/04/22 | 3,269,308 | |||||||||||
|
| |||||||||||||
| Technology – Software/Services(d) – 2.2% | ||||||||||||||
Banff Merger Sub, Inc. (1M LIBOR + 4.250%) | ||||||||||||||
| 4,924,098 | 4.398 | 10/02/25 | 4,778,148 | |||||||||||
Ceridian HCM Holding, Inc. (1 Week LIBOR + 2.500%) | ||||||||||||||
| 2,940,000 | 2.594 | 04/30/25 | 2,838,011 | |||||||||||
DCert Buyer, Inc. (1M LIBOR + 4.000%) | ||||||||||||||
| 1,766,125 | 4.148 | 10/16/26 | 1,727,765 | |||||||||||
Epicor Software Corp. | ||||||||||||||
(1M LIBOR + 4.250%) | ||||||||||||||
| 4,100,000 | 5.250 | 07/30/27 | 4,080,525 | |||||||||||
(1M LIBOR + 7.750%) | ||||||||||||||
| 1,275,000 | 8.750 | 07/31/28 | 1,302,094 | |||||||||||
Ion Trading Technologies S.a.r.l. (3M LIBOR + 4.000%) | ||||||||||||||
| 1,978,337 | 5.000 | 11/21/24 | 1,938,038 | |||||||||||
Milano Acquisition Corp. (3M LIBOR + 4.000%) | ||||||||||||||
| 4,200,000 | 4.750 | 10/01/27 | 4,123,014 | |||||||||||
Mitchell International, Inc. (1M LIBOR + 4.250%) | ||||||||||||||
| 5,050,000 | 4.750 | 11/29/24 | 4,883,350 | |||||||||||
Refinitiv US Holdings, Inc. (1M LIBOR + 3.250%) | ||||||||||||||
| 4,077,375 | 3.398 | 10/01/25 | 4,011,770 | |||||||||||
SS&C Holdings Europe S.a.r.l. (1M LIBOR + 1.750%) | ||||||||||||||
| 1,194,310 | 1.898 | 04/16/25 | 1,159,233 | |||||||||||
SS&C Technologies, Inc. (1M LIBOR + 1.750%) | ||||||||||||||
| 1,699,917 | 1.898 | 04/16/25 | 1,649,990 | |||||||||||
The Dun & Bradstreet Corp. (1M LIBOR + 3.750%) | ||||||||||||||
| 3,084,500 | 3.906 | 02/06/26 | 3,033,729 | |||||||||||
The Ultimate Software Group, Inc. | ||||||||||||||
(1M LIBOR + 3.750%) | ||||||||||||||
| 1,633,500 | 3.895 | 05/04/26 | 1,603,100 | |||||||||||
(3M LIBOR + 4.000%) | ||||||||||||||
| 175,000 | 4.750 | 05/04/26 | 173,798 | |||||||||||
(3M LIBOR + 6.750%) | ||||||||||||||
| 100,000 | 7.500 | 05/03/27 | 101,500 | |||||||||||
|
| |||||||||||||
| 37,404,065 | ||||||||||||||
|
| |||||||||||||
| Telecommunication Services(d) – 0.5% | ||||||||||||||
Hoya Midco LLC (6M LIBOR + 3.500%) | ||||||||||||||
| 7,582,423 | 4.500 | 06/30/24 | 6,356,573 | |||||||||||
Level 3 Financing, Inc. (1M LIBOR + 1.750%) | ||||||||||||||
| 2,023,967 | 1.898 | 03/01/27 | 1,950,092 | |||||||||||
|
| |||||||||||||
| 8,306,665 | ||||||||||||||
|
| |||||||||||||
| Textiles(d) – 0.0% | ||||||||||||||
Canada Goose, Inc. (3M LIBOR + 4.250%) | ||||||||||||||
| 850,000 | 5.000 | 10/01/27 | 842,562 | |||||||||||
|
| |||||||||||||
| Wireless Telecommunications(d) – 0.2% | ||||||||||||||
Intelsat Jackson Holdings SA | ||||||||||||||
(1M LIBOR + 4.750%) | ||||||||||||||
| 3,000,000 | 8.000 | 11/27/23 | 3,010,830 | |||||||||||
(3M LIBOR + 5.500%) | ||||||||||||||
| 741,223 | 6.500 | 07/13/22 | 752,341 | |||||||||||
|
| |||||||||||||
| 3,763,171 | ||||||||||||||
|
| |||||||||||||
| | TOTAL BANK LOANS (Cost $120,691,231) | | $ | 116,800,184 | ||||||||||
|
| |||||||||||||
| The accompanying notes are an integral part of these financial statements. | 31 |
GOLDMAN SACHS INCOME BUILDER FUND
Schedule of Investments (continued)
October 31, 2020
| Principal Amount | Interest Rate | Maturity Date | Value | |||||||||||
| U.S. Treasury Obligation(m) – 0.1% | ||||||||||||||
United States Treasury Note | ||||||||||||||
| $ | 1,730,000 | 1.875 | % | 12/15/20 | $ | 1,733,514 | ||||||||
| (Cost $1,729,766) | ||||||||||||||
|
| |||||||||||||
| Shares | Dividend Rate | Value | ||||||||||||
| Investment Companies(n) – 2.2% | ||||||||||||||
Goldman Sachs Emerging Markets Equity Fund – Class R6 | ||||||||||||||
| $ | 2,516 | 0.982% | $ | 64,528 | ||||||||||
Goldman Sachs Financial Square Government Fund – Class R6 | ||||||||||||||
| 20,500,074 | 0.028 | 20,500,074 | ||||||||||||
| | Goldman Sachs Financial Square Government Fund – | | ||||||||||||
| 6,480,207 | 0.028 | 6,480,207 | ||||||||||||
Goldman Sachs High Yield Fund – Class R6 | ||||||||||||||
| 8,839 | 5.615 | 54,358 | ||||||||||||
Goldman Sachs MLP Energy Infrastructure Fund – Class R6 | ||||||||||||||
| 748,130 | 13.550 | 11,446,384 | ||||||||||||
|
| |||||||||||||
| | TOTAL INVESTMENT COMPANIES (Cost $39,082,457) | | $ | 38,545,551 | ||||||||||
|
| |||||||||||||
| TOTAL INVESTMENTS – 97.3% | ||||||||||||||
| (Cost $1,586,003,892) | $ | 1,670,861,624 | ||||||||||||
|
| |||||||||||||
| | OTHER ASSETS IN EXCESS OF LIABILITIES – 2.7% | 46,231,173 | ||||||||||||
|
| |||||||||||||
| NET ASSETS – 100.0% | $ | 1,717,092,797 | ||||||||||||
|
| |||||||||||||
| The percentage shown for each investment category reflects the value of investments in that category as a percentage of net assets. | ||
(a) | Security is currently in default and/or non-income producing. | |
(b) | Significant unobservable inputs were used in the valuation of this portfolio security; i.e., Level 3. | |
(c) | Security with “Call” features with resetting interest rates. Maturity dates disclosed are the final maturity dates. | |
(d) | Variable rate security. Except for floating rate notes (for which final maturity is disclosed), maturity date disclosed is the next interest reset date. Interest rate disclosed is that which is in effect on October 31, 2020. | |
(e) | Exempt from registration under Rule 144A of the Securities Act of 1933. | |
(f) | Pay-in-kind securities. | |
(g) | Guaranteed by a foreign government until maturity. Total market value of these securities amounts to $649,491, which represents approximately 0.0% of the Fund’s net assets as of October 31, 2020. | |
(h) | Actual maturity date is June 5, 2115. | |
(i) | Issued with a zero coupon. Income is recognized through the accretion of discount. | |
(j) | Coupon changes periodically based upon a predetermined schedule. Interest rate disclosed is that which is in effect on October 31, 2020. | |
(k) | Bank Loans often require prepayments from excess cash flows or permit the borrower to repay at its election. The degree to which borrowers repay, whether as a contractual requirement or at their election, cannot be predicted with accuracy. As a result, the actual remaining maturity may be substantially less than the stated maturities shown. As bank loan positions may involve multiple underlying tranches for which the aggregate position is presented, the stated interest rate represents the weighted average interest rate of all contracts on October 31, 2020. Bank Loans typically have rates of interest which are predetermined either daily, monthly, quarterly or semi-annually by reference to a base lending rate, plus a premium. These base lending rates are primarily the London-Interbank Offered Rate (“LIBOR”), and secondarily the prime rate offered by one or more major United States banks (the “Prime Rate”) and the certificate of deposit (“CD”) rate or other base lending rates used by commercial lenders. | |
(l) | This position represents an unsettled loan commitment at period end. Certain details associated with this purchase are not known prior to the settlement date, including coupon rate. | |
(m) | All or a portion of security is segregated as collateral for initial margin requirements on futures transactions. | |
(n) | Represents an affiliated issuer. | |
| ||
Currency Abbreviations: | ||
EUR | —Euro | |
GBP | —British Pound | |
USD | —U.S. Dollar | |
Investment Abbreviations: | ||
ADR | —American Depositary Receipt | |
CMT | —Constant Maturity Treasury Indexes | |
EURO | —Euro Offered Rate | |
LIBOR | —London Interbank Offered Rate | |
LLC | —Limited Liability Company | |
LP | —Limited Partnership | |
MTN | —Medium Term Note | |
PLC | —Public Limited Company | |
REIT | —Real Estate Investment Trust | |
SOFR | —Secured Overnight Funding Rate | |
WR | —Withdrawn Rating | |
| ||
| 32 | The accompanying notes are an integral part of these financial statements. |
GOLDMAN SACHS INCOME BUILDER FUND
| ADDITIONAL INVESTMENT INFORMATION |
UNFUNDED LOAN COMMITMENTS — At October 31, 2020, the Fund had unfunded loan commitments which could be extended at the option of the borrowers, pursuant to the following loan agreements:
| Borrower | Principal Amount | Current Value | Unrealized Gain (Loss) | |||||||||
Intelsat Jackson Holdings SA due 07/13/20 | $ | 741,223 | $ | 752,341 | $11,118 | |||||||
OEConnection LLC due 09/25/26 | 134,186 | 129,825 | (3,806 | ) | ||||||||
| TOTAL | $ | 7,312 | ||||||||||
FORWARD FOREIGN CURRENCY EXCHANGE CONTRACTS — At October 31, 2020, the Fund had the following forward foreign currency exchange contracts:
FORWARD FOREIGN CURRENCY EXCHANGE CONTRACTS WITH UNREALIZED GAIN
| Counterparty | Currency Purchased | Currency Sold | Settlement Date | Unrealized Gain | ||||||||||||||||
MS & Co. Int. PLC | USD | 4,889,406 | EUR | 4,153,507 | 11/09/20 | $ | 51,062 | |||||||||||||
FORWARD FOREIGN CURRENCY EXCHANGE CONTRACTS WITH UNREALIZED LOSS
| Counterparty | Currency Purchased | Currency Sold | Settlement Date | Unrealized Gain | ||||||||||||||||
MS & Co. Int. PLC | USD | 2,239,858 | GBP | 1,738,875 | 01/13/21 | $ | (14,181 | ) | ||||||||||||
FUTURES CONTRACTS — At October 31, 2020, the Fund had the following futures contracts:
| Description | Number of Contracts | Expiration Date | Notional Amount | Unrealized Appreciation/ (Depreciation) | ||||||||||||
Long position contracts: | ||||||||||||||||
S&P 500 E-Mini Index | 417 | 12/18/20 | $ | 68,068,995 | $ | (2,020,606 | ) | |||||||||
Ultra Long U.S. Treasury Bonds | 308 | 12/21/20 | 66,220,000 | (2,062,777 | ) | |||||||||||
Ultra 10 Year U.S. Treasury Notes | 7 | 12/21/20 | 1,100,969 | (14,261 | ) | |||||||||||
2 Year U.S. Treasury Notes | 59 | 12/31/20 | 13,029,781 | (762 | ) | |||||||||||
5 Year U.S. Treasury Notes | 35 | 12/31/20 | 4,396,055 | (10,699 | ) | |||||||||||
10 Year U.S. Treasury Notes | 67 | 12/21/20 | 9,260,656 | (57,620 | ) | |||||||||||
20 Year U.S. Treasury Bonds | 11 | 12/21/20 | 1,897,156 | (25,469 | ) | |||||||||||
| Total | $ | (4,192,194 | ) | |||||||||||||
Short position contracts: | ||||||||||||||||
Ultra 10 Year U.S. Treasury Notes | (223 | ) | 12/21/20 | (35,073,719 | ) | 576,106 | ||||||||||
5 Year U.S. Treasury Notes | (319 | ) | 12/31/20 | (40,066,899 | ) | 74,683 | ||||||||||
20 Year U.S. Treasury Bonds | (49 | ) | 12/21/20 | (8,450,969 | ) | 123,185 | ||||||||||
| Total | $ | 773,974 | ||||||||||||||
| TOTAL FUTURES CONTRACTS | $ | (3,418,220 | ) | |||||||||||||
| The accompanying notes are an integral part of these financial statements. | 33 |
GOLDMAN SACHS INCOME BUILDER FUND
Schedule of Investments (continued)
October 31, 2020
| ADDITIONAL INVESTMENT INFORMATION |
SWAP CONTRACTS — At October 31, 2020, the Fund had the following swap contracts:
CENTRALLY CLEARED INTEREST RATE SWAP CONTRACTS
| Payments Made by the Fund | Payments Received by Fund | Termination Date | Notional Amount (000s)(a) | Market Value | Upfront Premium (Received) Paid | Unrealized Appreciation/ (Depreciation) | ||||||||||||||
(0.250)%(b) | 6M EURO(c) | 12/16/25 | EUR | 710 | $ | (9,806 | ) | $ | (6,570 | ) | $ | (3,236 | ) | |||||||
(0.500) (b) | 6M EURO(c) | 12/16/23 | 530 | (664 | ) | 782 | (1,446 | ) | ||||||||||||
1.250(c) | 3M LIBOR(d) | 12/16/40 | $ | 180 | 240 | (7,704 | ) | 7,944 | ||||||||||||
1.250(c) | 3M LIBOR(d) | 12/16/50 | 10 | 191 | (466 | ) | 657 | |||||||||||||
3M LIBOR(d) | 0.750%(c) | 12/16/22 | 3,620 | 36,377 | 38,027 | (1,650 | ) | |||||||||||||
3M LIBOR(d) | 0.750(c) | 12/16/23 | 1,030 | 14,092 | 15,563 | (1,471 | ) | |||||||||||||
3M LIBOR(d) | 1.000(c) | 12/16/25 | 25,100 | 667,226 | 800,543 | (133,317 | ) | |||||||||||||
3M LIBOR(d) | 1.000(c) | 12/16/27 | 3,870 | 89,084 | 128,009 | (38,925 | ) | |||||||||||||
3M LIBOR(d) | 1.000(c) | 12/16/30 | 33,670 | 292,188 | 917,129 | (624,941 | ) | |||||||||||||
| TOTAL | $ | 1,088,928 | $ | 1,885,313 | $ | (796,385 | ) | |||||||||||||
| (a) | Represents forward starting interest rate swaps whose effective dates of commencement of accruals and cash flows occur subsequent to October 31, 2020. |
| (b) | Payments made annually. |
| (c) | Payments made semi-annually. |
| (d) | Payments made quarterly. |
| ||
Abbreviations: | ||
MS & Co. Int. PLC—Morgan Stanley & Co. International PLC | ||
| ||
| 34 | The accompanying notes are an integral part of these financial statements. |
GOLDMAN SACHS RISING DIVIDEND GROWTH FUND
Schedule of Investments
October 31, 2020
| Shares | Description | Value | ||||||
| Common Stocks – 97.7% | ||||||||
| Building Products – 1.2% | ||||||||
| 48,430 | A.O. Smith Corp. | $ | 2,503,347 | |||||
| 10,360 | Lennox International, Inc. | 2,814,397 | ||||||
|
| |||||||
| 5,317,744 | ||||||||
|
| |||||||
| Capital Markets – 5.5% | ||||||||
| 22,845 | Ameriprise Financial, Inc. | 3,674,161 | ||||||
| 8,780 | BlackRock, Inc. | 5,261,064 | ||||||
| 22,227 | Evercore, Inc. Class A | 1,767,936 | ||||||
| 10,315 | FactSet Research Systems, Inc. | 3,161,548 | ||||||
| 16,475 | Moody’s Corp. | 4,331,277 | ||||||
| 50,105 | SEI Investments Co. | 2,462,661 | ||||||
| 33,614 | T. Rowe Price Group, Inc. | 4,257,549 | ||||||
|
| |||||||
| 24,916,196 | ||||||||
|
| |||||||
| Chemicals – 2.3% | ||||||||
| 22,300 | Ecolab, Inc. | 4,094,057 | ||||||
| 5,000 | NewMarket Corp. | 1,788,450 | ||||||
| 6,602 | The Sherwin-Williams Co. | 4,542,044 | ||||||
|
| |||||||
| 10,424,551 | ||||||||
|
| |||||||
| Commercial Services & Supplies – 0.8% | ||||||||
| 62,595 | Rollins, Inc. | 3,621,121 | ||||||
|
| |||||||
| Consumer Finance – 0.9% | ||||||||
| 60,044 | Discover Financial Services | 3,903,460 | ||||||
|
| |||||||
| Distributors – 0.8% | ||||||||
| 10,100 | Pool Corp. | 3,533,283 | ||||||
|
| |||||||
| Electric Utilities – 1.0% | ||||||||
| 63,525 | NextEra Energy, Inc. | 4,650,665 | ||||||
|
| |||||||
| Electrical Equipment – 0.9% | ||||||||
| 16,280 | Rockwell Automation, Inc. | 3,860,314 | ||||||
|
| |||||||
| Electronic Equipment, Instruments & Components – 3.8% | ||||||||
| 44,090 | Amphenol Corp. Class A | 4,975,116 | ||||||
| 19,930 | Badger Meter, Inc. | 1,461,666 | ||||||
| 129,060 | Corning, Inc. | 4,126,048 | ||||||
| 63,602 | National Instruments Corp. | 1,989,471 | ||||||
| 46,913 | TE Connectivity Ltd. | 4,544,931 | ||||||
|
| |||||||
| 17,097,232 | ||||||||
|
| |||||||
| Entertainment – 2.2% | ||||||||
| 130,690 | Activision Blizzard, Inc. | 9,897,275 | ||||||
|
| |||||||
| Equity Real Estate Investment Trusts (REITs) – 2.3% | ||||||||
| 51,865 | Equity LifeStyle Properties, Inc. | 3,069,889 | ||||||
| 102,300 | Iron Mountain, Inc. | 2,665,938 | ||||||
| 20,655 | Public Storage | 4,731,441 | ||||||
|
| |||||||
| 10,467,268 | ||||||||
|
| |||||||
| Food & Staples Retailing – 3.4% | ||||||||
| 12,960 | Casey’s General Stores, Inc. | 2,184,667 | ||||||
| 14,705 | Costco Wholesale Corp. | 5,258,802 | ||||||
| 114,190 | The Kroger Co. | 3,678,060 | ||||||
| 117,470 | Walgreens Boots Alliance, Inc. | 3,998,679 | ||||||
|
| |||||||
| 15,120,208 | ||||||||
|
| |||||||
| Common Stocks – (continued) | ||||||||
| Food Products – 2.5% | ||||||||
| 80,585 | Hormel Foods Corp. | 3,923,684 | ||||||
| 26,825 | Ingredion, Inc. | 1,901,624 | ||||||
| 11,015 | J&J Snack Foods Corp. | 1,493,304 | ||||||
| 66,345 | Tyson Foods, Inc. Class A | 3,796,924 | ||||||
|
| |||||||
| 11,115,536 | ||||||||
|
| |||||||
| Gas Utilities – 0.1% | ||||||||
| 19,081 | Suburban Propane Partners LP | 313,692 | ||||||
|
| |||||||
| Health Care Equipment & Supplies – 5.0% | ||||||||
| 35,830 | Danaher Corp. | 8,224,418 | ||||||
| 73,865 | Medtronic PLC | 7,428,603 | ||||||
| 33,790 | Stryker Corp. | 6,825,918 | ||||||
|
| |||||||
| 22,478,939 | ||||||||
|
| |||||||
| Health Care Providers & Services – 6.7% | ||||||||
| 55,995 | AmerisourceBergen Corp. | 5,379,440 | ||||||
| 126,721 | CVS Health Corp. | 7,107,781 | ||||||
| 79,030 | Patterson Cos., Inc. | 1,965,871 | ||||||
| 45,190 | Quest Diagnostics, Inc. | 5,519,507 | ||||||
| 40,351 | The Ensign Group, Inc. | 2,374,253 | ||||||
| 25,325 | UnitedHealth Group, Inc. | 7,727,684 | ||||||
|
| |||||||
| 30,074,536 | ||||||||
|
| |||||||
| Hotels, Restaurants & Leisure – 1.2% | ||||||||
| 46,510 | Wyndham Destinations, Inc. | 1,517,621 | ||||||
| 43,855 | Yum! Brands, Inc. | 4,092,987 | ||||||
|
| |||||||
| 5,610,608 | ||||||||
|
| |||||||
| Household Products – 0.4% | ||||||||
| 6,945 | WD-40 Co. | 1,690,274 | ||||||
|
| |||||||
| Independent Power and Renewable Electricity Producers – 0.8% | ||||||||
| 37,609 | Atlantica Sustainable Infrastructure PLC | 1,109,090 | ||||||
| 8,382 | Brookfield Renewable Corp. Class A | 559,666 | ||||||
| 31,700 | Clearway Energy, Inc. Class A | 830,857 | ||||||
| 18,609 | NextEra Energy Partners LP | 1,168,645 | ||||||
|
| |||||||
| 3,668,258 | ||||||||
|
| |||||||
| Industrial Conglomerates – 1.1% | ||||||||
| 30,465 | 3M Co. | 4,873,181 | ||||||
|
| |||||||
| Insurance – 2.0% | ||||||||
| 22,950 | Aon PLC Class A | 4,223,029 | ||||||
| 75,730 | Principal Financial Group, Inc. | 2,970,131 | ||||||
| 18,215 | The Hanover Insurance Group, Inc. | 1,742,447 | ||||||
|
| |||||||
| 8,935,607 | ||||||||
|
| |||||||
| IT Services – 10.0% | ||||||||
| 27,247 | Accenture PLC Class A | 5,910,147 | ||||||
| 37,620 | Automatic Data Processing, Inc. | 5,942,455 | ||||||
| 28,482 | Broadridge Financial Solutions, Inc. | 3,919,123 | ||||||
| 39,325 | Fidelity National Information Services, Inc. | 4,899,502 | ||||||
| 46,565 | International Business Machines Corp. | 5,199,448 | ||||||
| 23,300 | Jack Henry & Associates, Inc. | 3,454,225 | ||||||
| 18,355 | Mastercard, Inc. Class A | 5,297,987 | ||||||
| 30,270 | MAXIMUS, Inc. | 2,045,647 | ||||||
|
| |||||||
| The accompanying notes are an integral part of these financial statements. | 35 |
GOLDMAN SACHS RISING DIVIDEND GROWTH FUND
Schedule of Investments (continued)
October 31, 2020
| Shares | Description | Value | ||||||
| Common Stocks – (continued) | ||||||||
| IT Services – (continued) | ||||||||
| 144,405 | The Western Union Co. | $ | 2,807,233 | |||||
| 30,980 | Visa, Inc. Class A | 5,629,376 | ||||||
|
| |||||||
| 45,105,143 | ||||||||
|
| |||||||
| Leisure Products – 0.5% | ||||||||
| 23,024 | Polaris, Inc. | 2,091,961 | ||||||
|
| |||||||
| Machinery – 0.5% | ||||||||
| 43,195 | Donaldson Co., Inc. | 2,051,762 | ||||||
|
| |||||||
| Media – 5.5% | ||||||||
| 260,000 | Comcast Corp. Class A | 10,982,400 | ||||||
| 1 | Fox Corp. Class A | 27 | ||||||
| 125,415 | Omnicom Group, Inc. | 5,919,588 | ||||||
| 266,444 | ViacomCBS, Inc. Class B | 7,612,305 | ||||||
|
| |||||||
| 24,514,320 | ||||||||
|
| |||||||
| Multi-Utilities – 1.7% | ||||||||
| 31,735 | Sempra Energy | 3,978,300 | ||||||
| 37,460 | WEC Energy Group, Inc. | 3,766,603 | ||||||
|
| |||||||
| 7,744,903 | ||||||||
|
| |||||||
| Multiline Retail – 1.4% | ||||||||
| 27,915 | Dillard’s, Inc. Class A(a) | 1,248,638 | ||||||
| 31,865 | Target Corp. | 4,850,490 | ||||||
|
| |||||||
| 6,099,128 | ||||||||
|
| |||||||
| Oil, Gas & Consumable Fuels – 13.6% | ||||||||
| 144,559 | Antero Midstream Corp. | 828,323 | ||||||
| 55,825 | BP Midstream Partners LP | 541,503 | ||||||
| 77,371 | Cheniere Energy Partners LP | 2,789,225 | ||||||
| 77,284 | Crestwood Equity Partners LP | 1,157,714 | ||||||
| 152,693 | DCP Midstream LP | 1,949,890 | ||||||
| 4,426 | Delek Logistics Partners LP | 117,378 | ||||||
| 118,376 | Enable Midstream Partners LP | 526,773 | ||||||
| 11,671 | Enbridge, Inc. | 321,653 | ||||||
| 957,862 | Energy Transfer LP | 4,932,989 | ||||||
| 444,326 | Enterprise Products Partners LP | 7,362,482 | ||||||
| 17,189 | Enviva Partners LP | 736,549 | ||||||
| 105,000 | Genesis Energy LP | 441,000 | ||||||
| 31,200 | Hess Midstream LP Class A | 532,896 | ||||||
| 123,707 | Holly Energy Partners LP | 1,417,682 | ||||||
| 184,299 | Magellan Midstream Partners LP | 6,549,986 | ||||||
| 448,462 | MPLX LP | 7,718,031 | ||||||
| 199,849 | NuStar Energy LP | 1,976,507 | ||||||
| 15,416 | ONEOK, Inc. | 447,064 | ||||||
| 28,800 | Pembina Pipeline Corp. | 602,784 | ||||||
| 143,402 | Phillips 66 Partners LP | 3,365,645 | ||||||
| 867,905 | Plains All American Pipeline LP | 5,424,406 | ||||||
| 125,982 | Shell Midstream Partners LP | 1,102,342 | ||||||
| 47,884 | Sunoco LP | 1,205,240 | ||||||
| 44,865 | Targa Resources Corp. | 720,083 | ||||||
| 13,171 | TC Energy Corp. | 519,728 | ||||||
| 120,090 | TC PipeLines LP | 3,380,533 | ||||||
| 104,867 | The Williams Cos., Inc. | 2,012,398 | ||||||
| 285,789 | Western Midstream Partners LP | 2,329,180 | ||||||
|
| |||||||
| 61,009,984 | ||||||||
|
| |||||||
| Pharmaceuticals – 0.7% | ||||||||
| 74,070 | Perrigo Co. PLC | 3,249,451 | ||||||
|
| |||||||
| Common Stocks – (continued) | ||||||||
| Professional Services – 0.3% | ||||||||
| 19,825 | Insperity, Inc. | 1,518,199 | ||||||
|
| |||||||
| Semiconductors & Semiconductor Equipment – 6.3% | ||||||||
| 42,160 | Analog Devices, Inc. | 4,997,225 | ||||||
| 84,890 | Applied Materials, Inc. | 5,028,035 | ||||||
| 23,390 | KLA Corp. | 4,612,040 | ||||||
| 32,522 | Power Integrations, Inc. | 1,958,149 | ||||||
| 49,215 | QUALCOMM, Inc. | 6,071,162 | ||||||
| 40,235 | Texas Instruments, Inc. | 5,817,579 | ||||||
|
| |||||||
| 28,484,190 | ||||||||
|
| |||||||
| Software – 2.6% | ||||||||
| 30,045 | Microsoft Corp. | 6,083,211 | ||||||
| 101,965 | Oracle Corp. | 5,721,256 | ||||||
|
| |||||||
| 11,804,467 | ||||||||
|
| |||||||
| Specialty Retail – 4.2% | ||||||||
| 32,979 | Aaron’s Holdings Co., Inc. | 1,723,483 | ||||||
| 36,665 | Best Buy Co., Inc. | 4,089,981 | ||||||
| 31,895 | Lowe’s Cos., Inc. | 5,042,599 | ||||||
| 19,985 | The Home Depot, Inc. | 5,330,199 | ||||||
| 26,895 | Williams-Sonoma, Inc. | 2,453,093 | ||||||
|
| |||||||
| 18,639,355 | ||||||||
|
| |||||||
| Technology Hardware, Storage & Peripherals – 0.9% | ||||||||
| 233,190 | HP, Inc. | 4,188,092 | ||||||
|
| |||||||
| Textiles, Apparel & Luxury Goods – 2.0% | ||||||||
| 43,650 | NIKE, Inc. Class B | 5,241,525 | ||||||
| 55,128 | VF Corp. | 3,704,601 | ||||||
|
| |||||||
| 8,946,126 | ||||||||
|
| |||||||
| Trading Companies & Distributors – 2.6% | ||||||||
| 85,565 | Fastenal Co. | 3,698,975 | ||||||
| 27,018 | MSC Industrial Direct Co., Inc. Class A | 1,882,074 | ||||||
| 9,659 | W.W. Grainger, Inc. | 3,380,843 | ||||||
| 11,569 | Watsco, Inc. | 2,593,076 | ||||||
|
| |||||||
| 11,554,968 | ||||||||
|
| |||||||
| | TOTAL COMMON STOCKS (Cost $362,087,531) | $ | 438,571,997 | |||||
|
| |||||||
| Shares | Dividend Rate | Value | ||||||
| Investment Companies(b) – 1.0% | ||||||||
Goldman Sachs Financial Square Government Fund – Class R6 | ||||||||
| 4,494,394 | 0.028% | $ | 4,494,394 | |||||
| | Goldman Sachs Financial Square Government Fund – | | ||||||
| 151,784 | 0.028 | 151,784 | ||||||
|
| |||||||
| | TOTAL INVESTMENT COMPANIES (Cost $4,646,178) | $ | 4,646,178 | |||||
|
| |||||||
| | TOTAL INVESTMENTS BEFORE SECURITIES LENDING REINVESTMENT VEHICLE | | ||||||
| (Cost $366,733,709) | $ | 443,218,175 | ||||||
|
| |||||||
| 36 | The accompanying notes are an integral part of these financial statements. |
GOLDMAN SACHS RISING DIVIDEND GROWTH FUND
| Shares | Dividend Rate | Value | ||||||
| Securities Lending Reinvestment Vehicle(b) – 0.3% | ||||||||
| | Goldman Sachs Financial Square Government Fund – Institutional | | ||||||
| 1,243,550 | 0.028% | $ | 1,243,550 | |||||
| (Cost 1,243,550) | ||||||||
|
| |||||||
| | TOTAL INVESTMENTS — 99.0% (Cost $367,977,259) | $ | 444,461,725 | |||||
|
| |||||||
| | OTHER ASSETS IN EXCESS OF LIABILITIES — 1.0% | 4,619,707 | ||||||
|
| |||||||
| NET ASSETS — 100.0% | $ | 449,081,432 | ||||||
|
| |||||||
| The percentage shown for each investment category reflects the value of investments in that category as a percentage of net assets. | ||
* | Non-income producing security. | |
(a) | All or a portion of the security is on loan. | |
(b) | Represents affiliated funds. | |
| ||
Investment Abbreviations: | ||
LP | —Limited Partnership | |
PLC | —Public Limited Company | |
| ||
| ADDITIONAL INVESTMENT INFORMATION |
FUTURES CONTRACTS — At October 31, 2020, the Fund had the following futures contracts:
| Description | Number of Contracts | Expiration Date | Notional Amount | Unrealized Appreciation/ (Depreciation) | ||||||||||
S&P 500 E-Mini Index | 59 | 12/18/20 | $ | 9,630,865 | $ | (327,134 | ) | |||||||
| The accompanying notes are an integral part of these financial statements. | 37 |
GOLDMAN SACHS DIVIDEND FOCUS FUNDS
Statements of Assets and Liabilities
October 31, 2020
| Income Builder Fund | Rising Dividend Growth Fund | |||||||||
| Assets: | ||||||||||
Investments, at value (cost $1,546,921,435 and $362,087,531, respectively)(a) | $ | 1,632,316,073 | $ | 438,571,997 | ||||||
Foreign currencies, at value (cost $436,583 and $0, respectively) | 470,565 | — | ||||||||
Investments of affiliated issuers, at value (cost $39,082,457 and $4,646,178, respectively) | 38,545,551 | 4,646,178 | ||||||||
Investments in securities lending reinvestment vehicle — affiliated issuer, at value (identified cost $0 and $1,243,550, respectively) | — | 1,243,550 | ||||||||
Cash | 29,743,035 | 909,469 | ||||||||
Unrealized gain on forward foreign currency exchange contracts | 51,062 | — | ||||||||
Unrealized gain on unfunded loan commitment | 7,312 | — | ||||||||
Variation margin on futures contracts | 25,020 | 46,290 | ||||||||
Receivables: | ||||||||||
Dividends and interest | 13,090,130 | 1,104,052 | ||||||||
Collateral on certain derivative contracts(b) | 9,151,713 | 778,800 | ||||||||
Investments sold | 3,571,361 | 4,965,152 | ||||||||
Fund shares sold | 1,941,683 | 37,161 | ||||||||
Investments sold on an extended settlement basis | 744,858 | — | ||||||||
Foreign tax reclaims | 247,411 | 423,230 | ||||||||
Reimbursement from investment adviser | 140,612 | 85,093 | ||||||||
Securities lending income | — | 70,361 | ||||||||
Other assets | 56,173 | 25,288 | ||||||||
| Total assets | 1,730,102,559 | 452,906,621 | ||||||||
| Liabilities: | ||||||||||
Unrealized loss on forward foreign currency exchange contracts | 14,181 | — | ||||||||
Variation margin on swaps contracts | 131,909 | — | ||||||||
Variation margin on futures contracts | 74,366 | 67,692 | ||||||||
Payables: | ||||||||||
Investments purchased on an extended settlement basis | 4,700,020 | — | ||||||||
Fund shares redeemed | 3,297,273 | 1,158,714 | ||||||||
Investments purchased | 3,124,108 | 606,999 | ||||||||
Management fees | 651,466 | 267,958 | ||||||||
Distribution and service fees and transfer agency fees | 527,034 | 187,188 | ||||||||
Payable upon return of securities loaned | — | 1,243,550 | ||||||||
Accrued expenses | 489,405 | 293,088 | ||||||||
| Total liabilities | 13,009,762 | 3,825,189 | ||||||||
| Net Assets: | ||||||||||
Paid-in capital | 1,656,599,579 | 394,419,898 | ||||||||
Total distributable earnings | 60,493,218 | 54,661,534 | ||||||||
| NET ASSETS | $ | 1,717,092,797 | $ | 449,081,432 | ||||||
Net Assets: | ||||||||||
Class A | $ | 328,039,108 | $ | 167,765,477 | ||||||
Class C | 380,590,365 | 108,840,125 | ||||||||
Institutional | 669,847,812 | 97,357,626 | ||||||||
Investor | 256,919,276 | 64,327,925 | ||||||||
Class R6 | 65,292,602 | 1,867,905 | ||||||||
Class R | — | 1,131,337 | ||||||||
Class P | 16,403,634 | 7,791,037 | ||||||||
Total Net Assets | $ | 1,717,092,797 | $ | 449,081,432 | ||||||
Shares Outstanding $0.001 par value (unlimited number of shares authorized): | ||||||||||
Class A | 14,017,029 | 17,110,160 | ||||||||
Class C | 16,561,237 | 10,891,406 | ||||||||
Institutional | 27,955,637 | 9,383,370 | ||||||||
Investor | 10,755,666 | 6,209,792 | ||||||||
Class R6 | 2,726,181 | 180,081 | ||||||||
Class R | — | 115,891 | ||||||||
Class P | 684,607 | 750,810 | ||||||||
Net asset value, offering and redemption price per share:(c) | ||||||||||
Class A | $23.40 | $9.81 | ||||||||
Class C | 22.98 | 9.99 | ||||||||
Institutional | 23.96 | 10.38 | ||||||||
Investor | 23.89 | 10.36 | ||||||||
Class R6 | 23.95 | 10.37 | ||||||||
Class R | — | 9.76 | ||||||||
Class P | 23.96 | 10.38 | ||||||||
| (a) | Includes loaned securities having a market value of $0 and $1,189,818, respectively. |
| (b) | Segregated for initial margin and/or collateral as follows: |
| Fund | Futures | Swaps | Forwards | |||||||||
Income Builder | $ | 6,668,429 | $ | 2,473,284 | $ | 10,000 | ||||||
Rising Dividend Growth | 778,800 | — | — | |||||||||
| (c) | Maximum public offering price per share for Class A Shares of the Income Builder and the Rising Dividend Growth Funds is $24.76 and $10.38, respectively. At redemption, Class C Shares may be subject to a contingent deferred sales charge, assessed on the amount equal to the lesser of the current net asset value or the original purchase price of the shares. |
| 38 | The accompanying notes are an integral part of these financial statements. |
GOLDMAN SACHS DIVIDEND FOCUS FUNDS
Statements of Operations
For the Fiscal Year Ended October 31, 2020
| Income Builder Fund | Rising Dividend Growth Fund | |||||||||
| Investment income: | ||||||||||
Interest | $ | 52,687,856 | $ | 5,561 | ||||||
Dividends — unaffiliated issuers (net of foreign withholding taxes of $433,340 and $48,208, respectively) | 17,066,993 | 10,405,474 | ||||||||
Dividends — affiliated issuers | 731,430 | 97,373 | ||||||||
Securities lending income — affiliated issuer | — | 108,643 | ||||||||
Securities lending income — unaffiliated issuer | 73,748 | — | ||||||||
| Total investment income | 70,560,027 | 10,617,051 | ||||||||
| Expenses: |
| |||||||||
Management fees | 8,982,125 | 4,228,186 | ||||||||
Distribution and Service (12b-1) fees(a) | 3,979,564 | 1,562,560 | ||||||||
Transfer Agency fees(a) | 1,842,778 | 741,929 | ||||||||
Service fees — Class C | 1,065,354 | 369,779 | ||||||||
Custody, accounting and administrative services | 303,113 | 112,739 | ||||||||
Printing and mailing costs | 247,497 | 131,461 | ||||||||
Professional fees | 191,178 | 212,414 | ||||||||
Registration fees | 145,164 | 121,698 | ||||||||
Shareholder meeting expense | 65,797 | — | ||||||||
Trustee fees | 22,561 | 20,731 | ||||||||
Other | 34,566 | 60,722 | ||||||||
| Total expenses | 16,879,697 | 7,562,219 | ||||||||
Less — expense reductions | (1,041,427 | ) | (975,355 | ) | ||||||
| Net expenses | 15,838,270 | 6,586,864 | ||||||||
| NET INVESTMENT INCOME | 54,721,757 | 4,030,187 | ||||||||
| Realized and unrealized gain (loss): | ||||||||||
Net realized gain (loss) from: | ||||||||||
Investments — unaffiliated issuers | (42,177,571 | ) | 8,358,709 | |||||||
Purchased options | (1,751,579 | ) | — | |||||||
Futures contracts | 13,778,704 | 1,433,709 | ||||||||
Written options | (7,324,650 | ) | — | |||||||
Swap contracts | 40,625,268 | — | ||||||||
Forward foreign currency exchange contracts | (406,580 | ) | — | |||||||
Foreign currency transactions | 178,828 | 1,405 | ||||||||
Net change in unrealized gain (loss) on: | ||||||||||
Investments — unaffiliated issuers | (31,127,546 | ) | (34,555,927 | ) | ||||||
Investments — affiliated issuers | (546,380 | ) | — | |||||||
Futures contracts | (1,152,650 | ) | (562,067 | ) | ||||||
Unfunded loan commitments | 8,310 | — | ||||||||
Written options | 202,150 | — | ||||||||
Swap contracts | (3,187,136 | ) | — | |||||||
Forward foreign currency exchange contracts | 265,733 | — | ||||||||
Foreign currency translation | 15,103 | 16 | ||||||||
| Net realized and unrealized loss | (32,599,996 | ) | (25,324,155 | ) | ||||||
| NET INCREASE (DECREASE) IN NET ASSETS RESULTING FROM OPERATIONS | $ | 22,121,761 | $ | (21,293,968 | ) | |||||
| (a) | Class specific Distribution and Service (12b-1) and Transfer Agency fees were as follows: |
| Distribution and Service Fees | Transfer Agent Fees | |||||||||||||||||||||||||||||||||||||||
| Fund | Class A | Class C | Class R | Class A | Class C | Institutional | Investor | Class R6 | Class R | Class P | ||||||||||||||||||||||||||||||
Income Builder | $ | 775,396 | $ | 3,204,168 | $ | — | $ | 478,593 | $ | 667,141 | $ | 263,340 | $ | 412,881 | $ | 16,166 | $ | — | 4,657 | |||||||||||||||||||||
Rising Dividend Growth | 442,484 | 1,111,741 | 8,335 | 295,088 | 247,865 | 56,666 | 135,241 | 651 | 2,790 | 3,628 | ||||||||||||||||||||||||||||||
| The accompanying notes are an integral part of these financial statements. | 39 |
GOLDMAN SACHS DIVIDEND FOCUS FUNDS
Statements of Changes in Net Assets
| Income Builder Fund | Rising Dividend Growth Fund | |||||||||||||||||||||
| For the Fiscal Year Ended October 31, 2020 | For the Fiscal Year Ended October 31, 2019 | For the Fiscal Year Ended October 31, 2020 | For the Fiscal Year Ended October 31, 2019 | |||||||||||||||||||
| From operations: |
| |||||||||||||||||||||
Net investment income | $ | 54,721,757 | $ | 59,120,070 | $ | 4,030,187 | $ | 7,250,499 | ||||||||||||||
Net realized gain (loss) | 2,922,420 | 42,470,279 | 9,793,823 | 69,754,135 | ||||||||||||||||||
Net change in unrealized gain (loss) | (35,522,416 | ) | 100,543,196 | (35,117,978 | ) | 451,466 | ||||||||||||||||
| Net increase (decrease) in net assets resulting from operations | 22,121,761 | 202,133,545 | (21,293,968 | ) | 77,456,100 | |||||||||||||||||
| Distributions to shareholders: | ||||||||||||||||||||||
From distributable earnings | ||||||||||||||||||||||
Class A Shares | (10,209,770 | ) | (11,236,076 | ) | (22,041,864 | ) | (122,698,079 | ) | ||||||||||||||
Class C Shares | (11,069,448 | ) | (13,981,530 | ) | (18,275,200 | ) | (142,610,726 | ) | ||||||||||||||
Institutional Shares | (23,450,042 | ) | (24,548,602 | ) | (18,751,099 | ) | (164,809,422 | ) | ||||||||||||||
Investor Shares | (9,135,582 | ) | (8,998,284 | ) | (10,452,379 | ) | (83,957,904 | ) | ||||||||||||||
Class R6 Shares | (1,888,374 | ) | (325,169 | ) | (239,578 | ) | (57,671 | ) | ||||||||||||||
Class R Shares | — | — | (237,072 | ) | (1,522,397 | ) | ||||||||||||||||
Class P Shares | (555,182 | ) | (523,868 | ) | (1,854,725 | ) | (16,342,234 | ) | ||||||||||||||
From return of capital | ||||||||||||||||||||||
Class A Shares | (376,178 | ) | — | — | — | |||||||||||||||||
Class C Shares | (407,853 | ) | — | — | — | |||||||||||||||||
Institutional Shares | (864,015 | ) | — | — | — | |||||||||||||||||
Investor Shares | (336,600 | ) | — | — | — | |||||||||||||||||
Class R6 Shares | (69,577 | ) | — | — | — | |||||||||||||||||
Class P Shares | (20,455 | ) | — | — | — | |||||||||||||||||
| Total distributions to shareholders | (58,383,076 | ) | (59,613,529 | ) | (71,851,917 | ) | (531,998,433 | ) | ||||||||||||||
| From share transactions: | ||||||||||||||||||||||
Proceeds from sales of shares | 598,390,032 | 385,979,825 | 61,008,232 | 177,494,764 | ||||||||||||||||||
Reinvestment of distributions | 51,956,624 | 53,137,972 | 65,123,455 | 475,127,949 | ||||||||||||||||||
Cost of shares redeemed | (572,473,130 | ) | (627,911,281 | ) | (309,614,281 | ) | (815,636,639 | ) | ||||||||||||||
| Net increase (decrease) in net assets resulting from share transactions | 77,873,526 | (188,793,484 | ) | (183,482,594 | ) | (163,013,926 | ) | |||||||||||||||
| TOTAL INCREASE (DECREASE) | 41,612,211 | (46,273,468 | ) | (276,628,479 | ) | (617,556,259 | ) | |||||||||||||||
| Net assets: | ||||||||||||||||||||||
Beginning of year | 1,675,480,586 | 1,721,754,054 | 725,709,911 | 1,343,266,170 | ||||||||||||||||||
End of year | $ | 1,717,092,797 | $ | 1,675,480,586 | $ | 449,081,432 | $ | 725,709,911 | ||||||||||||||
| 40 | The accompanying notes are an integral part of these financial statements. |
GOLDMAN SACHS INCOME BUILDER FUND
Selected Share Data for a Share Outstanding Throughout Each Year
| Goldman Sachs Income Builder Fund | ||||||||||||||||||||||
| Class A Shares | ||||||||||||||||||||||
| Year Ended October 31, | ||||||||||||||||||||||
| 2020 | 2019 | 2018 | 2017 | 2016 | ||||||||||||||||||
| Per Share Data |
| |||||||||||||||||||||
Net asset value, beginning of year | $ | 23.67 | $ | 21.67 | $ | 22.72 | $ | 21.60 | $ | 21.77 | ||||||||||||
Net investment income(a) | 0.73 | 0.82 | 0.80 | 0.79 | 0.79 | |||||||||||||||||
Net realized and unrealized gain (loss) | (0.21 | ) | 2.02 | (1.02 | ) | 1.17 | (0.16 | ) | ||||||||||||||
Total from investment operations | 0.52 | 2.84 | (0.22 | ) | 1.96 | 0.63 | ||||||||||||||||
Distributions to shareholders from net investment income | (0.76 | ) | (0.84 | ) | (0.80 | ) | (0.80 | ) | (0.80 | ) | ||||||||||||
Distributions to shareholders from return of capital | (0.03 | ) | — | (0.03 | ) | (0.04 | ) | — | ||||||||||||||
Total distributions | (0.79 | ) | (0.84 | ) | (0.83 | ) | (0.84 | ) | (0.80 | ) | ||||||||||||
Net asset value, end of year | $ | 23.40 | $ | 23.67 | $ | 21.67 | $ | 22.72 | $ | 21.60 | ||||||||||||
| Total return(b) | 2.29 | % | 13.34 | % | (1.03 | ) % | 9.21 | % | 3.04 | % | ||||||||||||
Net assets, end of year (in 000s) | $ | 328,039 | $ | 314,951 | $ | 309,719 | $ | 387,349 | $ | 574,574 | ||||||||||||
Ratio of net expenses to average net assets | 0.92 | % | 0.95 | % | 0.97 | % | 0.98 | % | 0.98 | % | ||||||||||||
Ratio of total expenses to average net assets | 0.98 | % | 1.00 | % | 1.02 | % | 1.10 | % | 1.10 | % | ||||||||||||
Ratio of net investment income (loss) to average net assets | 3.15 | % | 3.63 | % | 3.54 | % | 3.55 | % | 3.75 | % | ||||||||||||
Portfolio turnover rate(c) | 46 | % | 47 | % | 42 | % | 51 | % | 80 | % | ||||||||||||
| (a) | Calculated based on the average shares outstanding methodology. |
| (b) | Assumes investment at the NAV at the beginning of the year, reinvestment of all dividends and distributions, a complete redemption of the investment at the NAV at the end of the year and no sales or redemption charges (if any). Total returns would be reduced if a sales or redemption charge was taken into account. Returns do not reflect the impact of taxes to shareholders relating to Fund distributions or the redemption of Fund shares. |
| (c) | The Fund’s portfolio turnover rate is calculated in accordance with regulatory requirements, without regard to transactions involving short term investments and certain derivatives. If such transactions were included, the Fund’s portfolio turnover rate may be higher. |
| The accompanying notes are an integral part of these financial statements. | 41 |
GOLDMAN SACHS INCOME BUILDER FUND
Financial Highlights (continued)
Selected Share Data for a Share Outstanding Throughout Each Year
| Goldman Sachs Income Builder Fund | ||||||||||||||||||||||
| Class C Shares | ||||||||||||||||||||||
| Year Ended October 31, | ||||||||||||||||||||||
| 2020 | 2019 | 2018 | 2017 | 2016 | ||||||||||||||||||
| Per Share Data |
| |||||||||||||||||||||
Net asset value, beginning of year | $ | 23.26 | $ | 21.31 | $ | 22.35 | $ | 21.26 | $ | 21.45 | ||||||||||||
Net investment income(a) | 0.55 | 0.64 | 0.62 | 0.61 | 0.62 | |||||||||||||||||
Net realized and unrealized gain (loss) | (0.21 | ) | 1.98 | (1.00 | ) | 1.16 | (0.16 | ) | ||||||||||||||
Total from investment operations | 0.34 | 2.62 | (0.38 | ) | 1.77 | 0.46 | ||||||||||||||||
Distributions to shareholders from net investment income | (0.60 | ) | (0.67 | ) | (0.64 | ) | (0.65 | ) | (0.65 | ) | ||||||||||||
Distributions to shareholders from return of capital | (0.02 | ) | — | (0.02 | ) | (0.03 | ) | — | ||||||||||||||
Total distributions | (0.62 | ) | (0.67 | ) | (0.66 | ) | (0.68 | ) | (0.65 | ) | ||||||||||||
Net asset value, end of year | $ | 22.98 | $ | 23.26 | $ | 21.31 | $ | 22.35 | $ | 21.26 | ||||||||||||
| Total return(b) | 1.57 | % | 12.44 | % | (1.74 | )% | 8.41 | % | 2.25 | % | ||||||||||||
Net assets, end of year (in 000s) | $ | 380,590 | $ | 463,483 | $ | 475,897 | $ | 619,357 | $ | 682,819 | ||||||||||||
Ratio of net expenses to average net assets | 1.67 | % | 1.70 | % | 1.72 | % | 1.73 | % | 1.73 | % | ||||||||||||
Ratio of total expenses to average net assets | 1.73 | % | 1.75 | % | 1.77 | % | 1.85 | % | 1.85 | % | ||||||||||||
Ratio of net investment income to average net assets | 2.41 | % | 2.88 | % | 2.79 | % | 2.79 | % | 2.98 | % | ||||||||||||
Portfolio turnover rate(c) | 46 | % | 47 | % | 42 | % | 51 | % | 80 | % | ||||||||||||
| (a) | Calculated based on the average shares outstanding methodology. |
| (b) | Assumes investment at the NAV at the beginning of the year, reinvestment of all dividends and distributions, a complete redemption of the investment at the NAV at the end of the year and no sales or redemption charges (if any). Total returns would be reduced if a sales or redemption charge was taken into account. Returns do not reflect the impact of taxes to shareholders relating to Fund distributions or the redemption of Fund shares. |
| (c) | The Fund’s portfolio turnover rate is calculated in accordance with regulatory requirements, without regard to transactions involving short term investments and certain derivatives. If such transactions were included, the Fund’s portfolio turnover rate may be higher. |
| 42 | The accompanying notes are an integral part of these financial statements. |
GOLDMAN SACHS INCOME BUILDER FUND
Financial Highlights (continued)
Selected Share Data for a Share Outstanding Throughout Each Year
| Goldman Sachs Income Builder Fund | ||||||||||||||||||||||
| Institutional Shares | ||||||||||||||||||||||
| Year Ended October 31, | ||||||||||||||||||||||
| 2020 | 2019 | 2018 | 2017 | 2016 | ||||||||||||||||||
| Per Share Data | ||||||||||||||||||||||
Net asset value, beginning of year | $ | 24.21 | $ | 22.15 | $ | 23.20 | $ | 22.04 | $ | 22.20 | ||||||||||||
Net investment income(a) | 0.84 | 0.93 | 0.90 | 0.90 | 0.89 | |||||||||||||||||
Net realized and unrealized gain (loss) | (0.21 | ) | 2.06 | (1.03 | ) | 1.19 | (0.17 | ) | ||||||||||||||
Total from investment operations | 0.63 | 2.99 | (0.13 | ) | 2.09 | 0.72 | ||||||||||||||||
Distributions to shareholders from net investment income | (0.85 | ) | (0.93 | ) | (0.89 | ) | (0.88 | ) | (0.88 | ) | ||||||||||||
Distributions to shareholders from return of capital | (0.03 | ) | — | (0.03 | ) | (0.05 | ) | — | ||||||||||||||
Total distributions | (0.88 | ) | (0.93 | ) | (0.92 | ) | (0.93 | ) | (0.88 | ) | ||||||||||||
Net asset value, end of year | $ | 23.96 | $ | 24.21 | $ | 22.15 | $ | 23.20 | $ | 22.04 | ||||||||||||
| Total return(b) | 2.68 | % | 13.76 | % | (0.63 | )% | 9.64 | % | 3.42 | % | ||||||||||||
Net assets, end of year (in 000s) | $ | 669,848 | $ | 609,414 | $ | 680,661 | $ | 818,309 | $ | 740,182 | ||||||||||||
Ratio of net expenses to average net assets | 0.56 | % | 0.57 | % | 0.58 | % | 0.58 | % | 0.58 | % | ||||||||||||
Ratio of total expenses to average net assets | 0.62 | % | 0.61 | % | 0.63 | % | 0.70 | % | 0.70 | % | ||||||||||||
Ratio of net investment income to average net assets | 3.52 | % | 4.03 | % | 3.93 | % | 3.93 | % | 4.13 | % | ||||||||||||
Portfolio turnover rate(c) | 46 | % | 47 | % | 42 | % | 51 | % | 80 | % | ||||||||||||
| (a) | Calculated based on the average shares outstanding methodology. |
| (b) | Assumes investment at the NAV at the beginning of the year, reinvestment of all dividends and distributions, a complete redemption of the investment at the NAV at the end of the year and no sales or redemption charges (if any). Total returns would be reduced if a sales or redemption charge was taken into account. Returns do not reflect the impact of taxes to shareholders relating to Fund distributions or the redemption of Fund shares. |
| (c) | The Fund’s portfolio turnover rate is calculated in accordance with regulatory requirements, without regard to transactions involving short term investments and certain derivatives. If such transactions were included, the Fund’s portfolio turnover rate may be higher. |
| The accompanying notes are an integral part of these financial statements. | 43 |
GOLDMAN SACHS INCOME BUILDER FUND
Financial Highlights (continued)
Selected Share Data for a Share Outstanding Throughout Each Year
| Goldman Sachs Income Builder Fund | ||||||||||||||||||||||
| Investor Shares | ||||||||||||||||||||||
| Year Ended October 31, | ||||||||||||||||||||||
| 2020 | 2019 | 2018 | 2017 | 2016 | ||||||||||||||||||
| Per Share Data | ||||||||||||||||||||||
Net asset value, beginning of year | $ | 24.14 | $ | 22.09 | $ | 23.14 | $ | 21.98 | $ | 22.14 | ||||||||||||
Net investment income(a) | 0.81 | 0.89 | 0.87 | 0.86 | 0.85 | |||||||||||||||||
Net realized and unrealized gain (loss) | (0.21 | ) | 2.05 | (1.03 | ) | 1.20 | (0.16 | ) | ||||||||||||||
Total from investment operations | 0.60 | 2.94 | (0.16 | ) | 2.06 | 0.69 | ||||||||||||||||
Distributions to shareholders from net investment income | (0.82 | ) | (0.89 | ) | (0.86 | ) | (0.85 | ) | (0.85 | ) | ||||||||||||
Distributions to shareholders from return of capital | (0.03 | ) | — | (0.03 | ) | (0.05 | ) | — | ||||||||||||||
Total distributions | (0.85 | ) | (0.89 | ) | (0.89 | ) | (0.90 | ) | (0.85 | ) | ||||||||||||
Net asset value, end of year | $ | 23.89 | $ | 24.14 | $ | 22.09 | $ | 23.14 | $ | 21.98 | ||||||||||||
| Total return(b) | 2.53 | % | 13.59 | % | (0.77 | )% | 9.51 | % | 3.28 | % | ||||||||||||
Net assets, end of year (in 000s) | $ | 256,919 | $ | 263,228 | $ | 239,226 | $ | 302,778 | $ | 142,813 | ||||||||||||
Ratio of net expenses to average net assets | 0.67 | % | 0.70 | % | 0.72 | % | 0.73 | % | 0.73 | % | ||||||||||||
Ratio of total expenses to average net assets | 0.73 | % | 0.75 | % | 0.77 | % | 0.85 | % | 0.85 | % | ||||||||||||
Ratio of net investment income to average net assets | 3.40 | % | 3.87 | % | 3.79 | % | 3.77 | % | 3.96 | % | ||||||||||||
Portfolio turnover rate(c) | 46 | % | 47 | % | 42 | % | 51 | % | 80 | % | ||||||||||||
| (a) | Calculated based on the average shares outstanding methodology. |
| (b) | Assumes investment at the NAV at the beginning of the year, reinvestment of all dividends and distributions, a complete redemption of the investment at the NAV at the end of the year and no sales or redemption charges (if any). Total returns would be reduced if a sales or redemption charge was taken into account. Returns do not reflect the impact of taxes to shareholders relating to Fund distributions or the redemption of Fund shares. |
| (c) | The Fund’s portfolio turnover rate is calculated in accordance with regulatory requirements, without regard to transactions involving short term investments and certain derivatives. If such transactions were included, the Fund’s portfolio turnover rate may be higher. |
| 44 | The accompanying notes are an integral part of these financial statements. |
GOLDMAN SACHS INCOME BUILDER FUND
Financial Highlights (continued)
Selected Share Data for a Share Outstanding Throughout Each Year
| Goldman Sachs Income Builder Fund | ||||||||||||||||||||||
| Class R6 Shares | ||||||||||||||||||||||
| Year Ended October 31, | ||||||||||||||||||||||
| 2020 | 2019 | 2018 | 2017 | 2016 | ||||||||||||||||||
| Per Share Data |
| |||||||||||||||||||||
Net asset value, beginning of year | $ | 24.21 | $ | 22.15 | $ | 23.20 | $ | 22.04 | $ | 22.20 | ||||||||||||
Net investment income(a) | 0.83 | 0.93 | 0.85 | 0.90 | 0.89 | |||||||||||||||||
Net realized and unrealized gain (loss) | (0.21 | ) | 2.06 | (0.98 | ) | 1.19 | (0.17 | ) | ||||||||||||||
Total from investment operations | 0.62 | 2.99 | (0.13 | ) | 2.09 | 0.72 | ||||||||||||||||
Distributions to shareholders from net investment income | (0.85 | ) | (0.93 | ) | (0.89 | ) | (0.88 | ) | (0.88 | ) | ||||||||||||
Distributions to shareholders from return of capital | (0.03 | ) | — | (0.03 | ) | (0.05 | ) | — | ||||||||||||||
Total distributions | (0.88 | ) | (0.93 | ) | (0.92 | ) | (0.93 | ) | (0.88 | ) | ||||||||||||
Net asset value, end of year | $ | 23.95 | $ | 24.21 | $ | 22.15 | $ | 23.20 | $ | 22.04 | ||||||||||||
| Total return(b) | 2.70 | % | 13.72 | % | (0.62 | )% | 9.69 | % | 3.38 | % | ||||||||||||
Net assets, end of year (in 000s) | $ | 65,293 | $ | 10,486 | $ | 130 | $ | 11 | $ | 10 | ||||||||||||
Ratio of net expenses to average net assets | 0.54 | % | 0.56 | % | 0.57 | % | 0.57 | % | 0.58 | % | ||||||||||||
Ratio of total expenses to average net assets | 0.61 | % | 0.61 | % | 0.61 | % | 0.69 | % | 0.70 | % | ||||||||||||
Ratio of net investment income to average net assets | 3.51 | % | 3.96 | % | 3.72 | % | 3.93 | % | 4.12 | % | ||||||||||||
Portfolio turnover rate(c) | 46 | % | 47 | % | 42 | % | 51 | % | 80 | % | ||||||||||||
| (a) | Calculated based on the average shares outstanding methodology. |
| (b) | Assumes investment at the NAV at the beginning of the year, reinvestment of all dividends and distributions, a complete redemption of the investment at the NAV at the end of the year and no sales or redemption charges (if any). Total returns would be reduced if a sales or redemption charge was taken into account. Returns do not reflect the impact of taxes to shareholders relating to Fund distributions or the redemption of Fund shares. |
| (c) | The Fund’s portfolio turnover rate is calculated in accordance with regulatory requirements, without regard to transactions involving short term investments and certain derivatives. If such transactions were included, the Fund’s portfolio turnover rate may be higher. |
| The accompanying notes are an integral part of these financial statements. | 45 |
GOLDMAN SACHS INCOME BUILDER FUND
Financial Highlights (continued)
Selected Share Data for a Share Outstanding Throughout Each Period
| Goldman Sachs Income Builder Fund | ||||||||||||||||||
| Class P Shares | ||||||||||||||||||
| Year Ended October 31, | Period Ended October 31, | |||||||||||||||||
| 2020 | 2019 | 2018(a) | ||||||||||||||||
| Per Share Data |
| |||||||||||||||||
Net asset value, beginning of year | $ | 24.21 | $ | 22.15 | $ | 22.95 | ||||||||||||
Net investment income(b) | 0.84 | 0.94 | 0.45 | |||||||||||||||
Net realized and unrealized gain (loss) | (0.21 | ) | 2.05 | (0.71 | ) | |||||||||||||
Total from investment operations | 0.63 | 2.99 | (0.26 | ) | ||||||||||||||
Distributions to shareholders from net investment income | (0.85 | ) | (0.93 | ) | (0.51 | ) | ||||||||||||
Distributions to shareholders from return of capital | (0.03 | ) | — | (0.03 | ) | |||||||||||||
Total distributions | (0.88 | ) | (0.93 | ) | (0.54 | ) | ||||||||||||
Net asset value, end of year | $ | 23.96 | $ | 24.21 | $ | 22.15 | ||||||||||||
| Total return(c) | 2.70 | % | 13.77 | % | (1.18 | )% | ||||||||||||
Net assets, end of year (in 000s) | $ | 16,404 | $ | 13,919 | $ | 16,122 | ||||||||||||
Ratio of net expenses to average net assets | 0.55 | % | 0.56 | % | 0.58 | %(d) | ||||||||||||
Ratio of total expenses to average net assets | 0.61 | % | 0.61 | % | 0.58 | %(d) | ||||||||||||
Ratio of net investment income to average net assets | 3.51 | % | 4.04 | % | 3.60 | %(d) | ||||||||||||
Portfolio turnover rate(e) | 46 | % | 47 | % | 42 | % | ||||||||||||
| (a) | Commenced operations on April 16, 2018. |
| (b) | Calculated based on the average shares outstanding methodology. |
| (c) | Assumes investment at the NAV at the beginning of the period, reinvestment of all dividends and distributions, a complete redemption of the investment at the NAV at the end of the period and no sales or redemption charges (if any). Total returns would be reduced if a sales or redemption charge was taken into account. Returns do not reflect the impact of taxes to shareholders relating to Fund distributions or the redemption of Fund shares. Total returns for periods less than one full year are not annualized. |
| (d) | Annualized. |
| (e) | The Fund’s portfolio turnover rate is calculated in accordance with regulatory requirements, without regard to transactions involving short term investments and certain derivatives. If such transactions were included, the Fund’s portfolio turnover rate may be higher. |
| 46 | The accompanying notes are an integral part of these financial statements. |
GOLDMAN SACHS RISING DIVIDEND GROWTH FUND
Financial Highlights (continued)
Selected Share Data for a Share Outstanding Throughout Each Year
| Goldman Sachs Rising Dividend Growth Fund | ||||||||||||||||||||||
| Class A Shares | ||||||||||||||||||||||
| Year Ended October 31, | ||||||||||||||||||||||
| 2020 | 2019 | 2018 | 2017 | 2016 | ||||||||||||||||||
| Per Share Data |
| |||||||||||||||||||||
Net asset value, beginning of year | $ | 11.18 | $ | 19.56 | $ | 22.54 | $ | 19.66 | $ | 20.68 | ||||||||||||
Net investment income(a) | 0.08 | 0.10 | 0.09 | 0.11 | 0.07 | |||||||||||||||||
Net realized and unrealized gain (loss) | (0.23 | ) | 0.78 | 1.25 | 3.48 | (0.83 | ) | |||||||||||||||
Total from investment operations | (0.15 | ) | 0.88 | 1.34 | 3.59 | (0.76 | ) | |||||||||||||||
Distributions to shareholders from net investment income | (0.24 | ) | (0.22 | ) | (0.28 | ) | (0.25 | ) | (0.12 | ) | ||||||||||||
Distributions to shareholders from net realized gains | (0.98 | ) | (9.04 | ) | (4.04 | ) | (0.46 | ) | (0.14 | ) | ||||||||||||
Total distributions | (1.22 | ) | (9.26 | ) | (4.32 | ) | (0.71 | ) | (0.26 | ) | ||||||||||||
Net asset value, end of year | $ | 9.81 | $ | 11.18 | $ | 19.56 | $ | 22.54 | $ | 19.66 | ||||||||||||
| Total return(b) | (1.80 | )% | 10.41 | % | 6.27 | % | 18.59 | % | (3.71 | )% | ||||||||||||
Net assets, end of year (in 000s) | $ | 167,765 | $ | 208,416 | $ | 297,772 | $ | 370,204 | $ | 697,430 | ||||||||||||
Ratio of net expenses to average net assets | 1.09 | % | 1.15 | % | 1.17 | % | 1.16 | % | 1.14 | % | ||||||||||||
Ratio of total expenses to average net assets | 1.29 | % | 1.27 | % | 1.20 | % | 1.19 | % | 1.16 | % | ||||||||||||
Ratio of net investment income (loss) to average net assets | 0.81 | % | 0.86 | % | 0.42 | % | 0.52 | % | 0.35 | % | ||||||||||||
Portfolio turnover rate(c) | 43 | % | 45 | % | 101 | % | 45 | % | 16 | % | ||||||||||||
| (a) | Calculated based on the average shares outstanding methodology. |
| (b) | Assumes investment at the NAV at the beginning of the year, reinvestment of all dividends and distributions, a complete redemption of the investment at the NAV at the end of the year and no sales or redemption charges (if any). Total returns would be reduced if a sales or redemption charge was taken into account. Returns do not reflect the impact of taxes to shareholders relating to Fund distributions or the redemption of Fund shares. |
| (c) | The Fund’s portfolio turnover rate is calculated in accordance with regulatory requirements, without regard to transactions involving short term investments and certain derivatives. If such transactions were included, the Fund’s portfolio turnover rate may be higher. |
| The accompanying notes are an integral part of these financial statements. | 47 |
GOLDMAN SACHS RISING DIVIDEND GROWTH FUND
Financial Highlights (continued)
Selected Share Data for a Share Outstanding Throughout Each Year
| Goldman Sachs Rising Dividend Growth Fund | ||||||||||||||||||||||
| Class C Shares | ||||||||||||||||||||||
| Year Ended October 31, | ||||||||||||||||||||||
| 2020 | 2019 | 2018 | 2017 | 2016 | ||||||||||||||||||
| Per Share Data | ||||||||||||||||||||||
Net asset value, beginning of year | $ | 11.36 | $ | 19.71 | $ | 22.69 | $ | 19.79 | $ | 20.84 | ||||||||||||
Net investment income (loss)(a) | — | (b) | 0.01 | (0.07 | ) | (0.05 | ) | (0.08 | ) | |||||||||||||
Net realized and unrealized gain (loss) | (0.23 | ) | 0.80 | 1.26 | 3.50 | (0.84 | ) | |||||||||||||||
Total from investment operations | (0.23 | ) | 0.81 | 1.19 | 3.45 | (0.92 | ) | |||||||||||||||
Distributions to shareholders from net investment income | (0.16 | ) | (0.12 | ) | (0.13 | ) | (0.13 | ) | (0.06 | ) | ||||||||||||
Distributions to shareholders from net realized gains | (0.98 | ) | (9.04 | ) | (4.04 | ) | (0.42 | ) | (0.07 | ) | ||||||||||||
Total distributions | (1.14 | ) | (9.16 | ) | (4.17 | ) | (0.55 | ) | (0.13 | ) | ||||||||||||
Net asset value, end of year | $ | 9.99 | $ | 11.36 | $ | 19.71 | $ | 22.69 | $ | 19.79 | ||||||||||||
| Total return(c) | (2.50 | )% | 9.55 | % | 5.49 | % | 17.68 | % | (4.43 | )% | ||||||||||||
Net assets, end of year (in 000s) | $ | 108,840 | $ | 194,302 | $ | 348,220 | $ | 463,110 | $ | 571,438 | ||||||||||||
Ratio of net expenses to average net assets | 1.84 | % | 1.90 | % | 1.92 | % | 1.91 | % | 1.89 | % | ||||||||||||
Ratio of total expenses to average net assets | 2.03 | % | 2.02 | % | 1.95 | % | 1.94 | % | 1.91 | % | ||||||||||||
Ratio of net investment income (loss) to average net assets | 0.03 | % | 0.12 | % | (0.33 | )% | (0.23 | )% | (0.40 | )% | ||||||||||||
Portfolio turnover rate(d) | 43 | % | 45 | % | 101 | % | 45 | % | 16 | % | ||||||||||||
| (a) | Calculated based on the average shares outstanding methodology. |
| (b) | Amount is less than $0.005 per share. |
| (c) | Assumes investment at the NAV at the beginning of the year, reinvestment of all dividends and distributions, a complete redemption of the investment at the NAV at the end of the year and no sales or redemption charges (if any). Total returns would be reduced if a sales or redemption charge was taken into account. Returns do not reflect the impact of taxes to shareholders relating to Fund distributions or the redemption of Fund shares. |
| (d) | The Fund’s portfolio turnover rate is calculated in accordance with regulatory requirements, without regard to transactions involving short term investments and certain derivatives. If such transactions were included, the Fund’s portfolio turnover rate may be higher. |
| 48 | The accompanying notes are an integral part of these financial statements. |
GOLDMAN SACHS RISING DIVIDEND GROWTH FUND
Financial Highlights (continued)
Selected Share Data for a Share Outstanding Throughout Each Year
| Goldman Sachs Rising Dividend Growth Fund | ||||||||||||||||||||||
| Institutional Shares | ||||||||||||||||||||||
| Year Ended October 31, | ||||||||||||||||||||||
| 2020 | 2019 | 2018 | 2017 | 2016 | ||||||||||||||||||
| Per Share Data |
| |||||||||||||||||||||
Net asset value, beginning of year | $ | 11.76 | $ | 20.08 | $ | 23.02 | $ | 20.08 | $ | 21.12 | ||||||||||||
Net investment income(a) | 0.12 | 0.15 | 0.18 | 0.20 | 0.15 | |||||||||||||||||
Net realized and unrealized gain (loss) | (0.24 | ) | 0.83 | 1.28 | 3.55 | (0.85 | ) | |||||||||||||||
Total from investment operations | (0.12 | ) | 0.98 | 1.46 | 3.75 | (0.70 | ) | |||||||||||||||
Distributions to shareholders from net investment income | (0.28 | ) | (0.26 | ) | (0.36 | ) | (0.31 | ) | (0.15 | ) | ||||||||||||
Distributions to shareholders from net realized gains | (0.98 | ) | (9.04 | ) | (4.04 | ) | (0.50 | ) | (0.19 | ) | ||||||||||||
Total distributions | (1.26 | ) | (9.30 | ) | (4.40 | ) | (0.81 | ) | (0.34 | ) | ||||||||||||
Net asset value, end of year | $ | 10.38 | $ | 11.76 | $ | 20.08 | $ | 23.02 | $ | 20.08 | ||||||||||||
| Total return(b) | (1.47 | )% | 10.85 | % | 6.75 | % | 19.01 | % | (3.35 | )% | ||||||||||||
Net assets, end of year (in 000s) | $ | 97,358 | $ | 191,509 | $ | 425,555 | $ | 759,274 | $ | 958,317 | ||||||||||||
Ratio of net expenses to average net assets | 0.78 | % | 0.80 | % | 0.78 | % | 0.76 | % | 0.74 | % | ||||||||||||
Ratio of total expenses to average net assets | 0.90 | % | 0.88 | % | 0.81 | % | 0.79 | % | 0.76 | % | ||||||||||||
Ratio of net investment income to average net assets | 1.10 | % | 1.25 | % | 0.83 | % | 0.92 | % | 0.74 | % | ||||||||||||
Portfolio turnover rate(c) | 43 | % | 45 | % | 101 | % | 45 | % | 16 | % | ||||||||||||
| (a) | Calculated based on the average shares outstanding methodology. |
| (b) | Assumes investment at the NAV at the beginning of the year, reinvestment of all dividends and distributions, a complete redemption of the investment at the NAV at the end of the year and no sales or redemption charges (if any). Total returns would be reduced if a sales or redemption charge was taken into account. Returns do not reflect the impact of taxes to shareholders relating to Fund distributions or the redemption of Fund shares. |
| (c) | The Fund’s portfolio turnover rate is calculated in accordance with regulatory requirements, without regard to transactions involving short term investments and certain derivatives. If such transactions were included, the Fund’s portfolio turnover rate may be higher. |
| The accompanying notes are an integral part of these financial statements. | 49 |
GOLDMAN SACHS RISING DIVIDEND GROWTH FUND
Financial Highlights (continued)
Selected Share Data for a Share Outstanding Throughout Each Year
| Goldman Sachs Rising Dividend Growth Fund | ||||||||||||||||||||||
| Investor Shares | ||||||||||||||||||||||
| Year Ended October 31, | ||||||||||||||||||||||
| 2020 | 2019 | 2018 | 2017 | 2016 | ||||||||||||||||||
| Per Share Data |
| |||||||||||||||||||||
Net asset value, beginning of year | $ | 11.75 | $ | 20.07 | $ | 23.01 | $ | 20.07 | $ | 21.10 | ||||||||||||
Net investment income(a) | 0.11 | 0.14 | 0.14 | 0.17 | 0.12 | |||||||||||||||||
Net realized and unrealized gain (loss) | (0.25 | ) | 0.83 | 1.29 | 3.54 | (0.84 | ) | |||||||||||||||
Total from investment operations | (0.14 | ) | 0.97 | 1.43 | 3.71 | (0.72 | ) | |||||||||||||||
Distributions to shareholders from net investment income | (0.27 | ) | (0.25 | ) | (0.33 | ) | (0.27 | ) | (0.14 | ) | ||||||||||||
Distributions to shareholders from net realized gains | (0.98 | ) | (9.04 | ) | (4.04 | ) | (0.50 | ) | (0.17 | ) | ||||||||||||
Total distributions | (1.25 | ) | (9.29 | ) | (4.37 | ) | (0.77 | ) | (0.31 | ) | ||||||||||||
Net asset value, end of year | $ | 10.36 | $ | 11.75 | $ | 20.07 | $ | 23.01 | $ | 20.07 | ||||||||||||
| Total return(b) | (1.55 | )% | 10.73 | % | 6.56 | % | 18.85 | % | (3.45 | )% | ||||||||||||
Net assets, end of year (in 000s) | $ | 64,328 | $ | 105,498 | $ | 227,158 | $ | 362,752 | $ | 272,442 | ||||||||||||
Ratio of net expenses to average net assets | 0.84 | % | 0.90 | % | 0.92 | % | 0.91 | % | 0.89 | % | ||||||||||||
Ratio of total expenses to average net assets | 1.03 | % | 1.02 | % | 0.95 | % | 0.94 | % | 0.91 | % | ||||||||||||
Ratio of net investment income to average net assets | 1.04 | % | 1.13 | % | 0.68 | % | 0.79 | % | 0.59 | % | ||||||||||||
Portfolio turnover rate(c) | 43 | % | 45 | % | 101 | % | 45 | % | 16 | % | ||||||||||||
| (a) | Calculated based on the average shares outstanding methodology. |
| (b) | Assumes investment at the NAV at the beginning of the year, reinvestment of all dividends and distributions, a complete redemption of the investment at the NAV at the end of the year and no sales or redemption charges (if any). Total returns would be reduced if a sales or redemption charge was taken into account. Returns do not reflect the impact of taxes to shareholders relating to Fund distributions or the redemption of Fund shares. |
| (c) | The Fund’s portfolio turnover rate is calculated in accordance with regulatory requirements, without regard to transactions involving short term investments and certain derivatives. If such transactions were included, the Fund’s portfolio turnover rate may be higher. |
| 50 | The accompanying notes are an integral part of these financial statements. |
GOLDMAN SACHS RISING DIVIDEND GROWTH FUND
Financial Highlights (continued)
Selected Share Data for a Share Outstanding Throughout Each Year
| Goldman Sachs Rising Dividend Growth Fund | ||||||||||||||||||
| Class R6 Shares | ||||||||||||||||||
| Year Ended October 31, | Period Ended October 31, | |||||||||||||||||
| 2020 | 2019 | 2018(a) | ||||||||||||||||
| Per Share Data | ||||||||||||||||||
Net asset value, beginning of period | $ | 11.76 | $ | 20.08 | $ | 20.18 | ||||||||||||
Net investment income(b) | 0.12 | 0.14 | 0.02 | |||||||||||||||
Net realized and unrealized gain (loss) | (0.25 | ) | 0.85 | 0.29 | ||||||||||||||
Total from investment operations | (0.13 | ) | 0.99 | 0.31 | ||||||||||||||
Distributions to shareholders from net investment income | (0.28 | ) | (0.27 | ) | (0.28 | ) | ||||||||||||
Distributions to shareholders from net realized gains | (0.98 | ) | (9.04 | ) | (0.13 | ) | ||||||||||||
Total distributions | (1.26 | ) | (9.31 | ) | (0.41 | ) | ||||||||||||
Net asset value, end of period | $ | 10.37 | $ | 11.76 | $ | 20.08 | ||||||||||||
| Total return(c) | (1.47 | )% | 10.78 | % | 1.54 | % | ||||||||||||
Net assets, end of period (in 000s) | $ | 1,868 | $ | 2,240 | $ | 10 | ||||||||||||
Ratio of net expenses to average net assets | 0.76 | % | 0.80 | % | 0.77 | %(d) | ||||||||||||
Ratio of total expenses to average net assets | 0.90 | % | 0.89 | % | 0.80 | %(d) | ||||||||||||
Ratio of net investment income to average net assets | 1.11 | % | 1.19 | % | 0.16 | %(d) | ||||||||||||
Portfolio turnover rate(e) | 43 | % | 45 | % | 101 | % | ||||||||||||
| (a) | Commenced operations on February 28, 2018. |
| (b) | Calculated based on the average shares outstanding methodology. |
| (c) | Assumes investment at the NAV at the beginning of the period, reinvestment of all dividends and distributions, a complete redemption of the investment at the NAV at the end of the period and no sales or redemption charges (if any). Total returns would be reduced if a sales or redemption charge was taken into account. Returns do not reflect the impact of taxes to shareholders relating to Fund distributions or the redemption of Fund shares. Total returns for periods less than one full year are not annualized. |
| (d) | Annualized. |
| (e) | The Fund’s portfolio turnover rate is calculated in accordance with regulatory requirements, without regard to transactions involving short term investments and certain derivatives. If such transactions were included, the Fund’s portfolio turnover rate may be higher. |
| The accompanying notes are an integral part of these financial statements. | 51 |
GOLDMAN SACHS RISING DIVIDEND GROWTH FUND
Financial Highlights (continued)
Selected Share Data for a Share Outstanding Throughout Each Year
| Goldman Sachs Rising Dividend Growth Fund | ||||||||||||||||||||||
| Class R Shares | ||||||||||||||||||||||
| Year Ended October 31, | ||||||||||||||||||||||
| 2020 | 2019 | 2018 | 2017 | 2016 | ||||||||||||||||||
| Per Share Data |
| |||||||||||||||||||||
Net asset value, beginning of year | $ | 11.13 | $ | 19.51 | $ | 22.49 | $ | 19.63 | $ | 20.66 | ||||||||||||
Net investment income(a) | 0.06 | 0.07 | 0.04 | 0.06 | 0.02 | |||||||||||||||||
Net realized and unrealized gain (loss) | (0.24 | ) | 0.78 | 1.25 | 3.47 | (0.84 | ) | |||||||||||||||
Total from investment operations | (0.18 | ) | 0.85 | 1.29 | 3.53 | (0.82 | ) | |||||||||||||||
Distributions to shareholders from net investment income | (0.21 | ) | (0.19 | ) | (0.23 | ) | (0.21 | ) | (0.08 | ) | ||||||||||||
Distributions to shareholders from net realized gains | (0.98 | ) | (9.04 | ) | (4.04 | ) | (0.46 | ) | (0.13 | ) | ||||||||||||
Total distributions | (1.19 | ) | (9.23 | ) | (4.27 | ) | (0.67 | ) | (0.21 | ) | ||||||||||||
Net asset value, end of year | $ | 9.76 | $ | 11.13 | $ | 19.51 | $ | 22.49 | $ | 19.63 | ||||||||||||
| Total return(b) | (2.01 | )% | 10.08 | % | 6.07 | % | 18.27 | % | (3.96 | )% | ||||||||||||
Net assets, end of year (in 000s) | $ | 1,131 | $ | 2,575 | $ | 3,484 | $ | 4,506 | $ | 4,749 | ||||||||||||
Ratio of net expenses to average net assets | 1.35 | % | 1.40 | % | 1.42 | % | 1.41 | % | 1.39 | % | ||||||||||||
Ratio of total expenses to average net assets | 1.53 | % | 1.52 | % | 1.45 | % | 1.44 | % | 1.41 | % | ||||||||||||
Ratio of net investment income to average net assets | 0.57 | % | 0.61 | % | 0.18 | % | 0.27 | % | 0.10 | % | ||||||||||||
Portfolio turnover rate(c) | 43 | % | 45 | % | 101 | % | 45 | % | 16 | % | ||||||||||||
| (a) | Calculated based on the average shares outstanding methodology. |
| (b) | Assumes investment at the NAV at the beginning of the year, reinvestment of all dividends and distributions, a complete redemption of the investment at the NAV at the end of the year and no sales or redemption charges (if any). Total returns would be reduced if a sales or redemption charge was taken into account. Returns do not reflect the impact of taxes to shareholders relating to Fund distributions or the redemption of Fund shares. |
| (c) | The Fund’s portfolio turnover rate is calculated in accordance with regulatory requirements, without regard to transactions involving short term investments and certain derivatives. If such transactions were included, the Fund’s portfolio turnover rate may be higher. |
| 52 | The accompanying notes are an integral part of these financial statements. |
GOLDMAN SACHS RISING DIVIDEND GROWTH FUND
Financial Highlights (continued)
Selected Share Data for a Share Outstanding Throughout Each Period
| Goldman Sachs Rising Dividend Growth Fund | ||||||||||||||||||
| Class P Shares | ||||||||||||||||||
| Year Ended October 31, | Period Ended October 31, | |||||||||||||||||
| 2020 | 2019 | 2018(a) | ||||||||||||||||
| Per Share Data | ||||||||||||||||||
Net asset value, beginning of period | $ | 11.76 | $ | 20.08 | $ | 20.21 | ||||||||||||
Net investment income (loss)(b) | 0.12 | 0.15 | (0.04 | ) | ||||||||||||||
Net realized and unrealized gain (loss) | (0.24 | ) | 0.84 | 0.25 | ||||||||||||||
Total from investment operations | (0.12 | ) | 0.99 | 0.21 | ||||||||||||||
Distributions to shareholders from net investment income | (0.28 | ) | (0.27 | ) | (0.21 | ) | ||||||||||||
Distributions to shareholders from net realized gains | (0.98 | ) | (9.04 | ) | (0.13 | ) | ||||||||||||
Total distributions | (1.26 | ) | (9.31 | ) | (0.34 | ) | ||||||||||||
Net asset value, end of period | $ | 10.38 | $ | 11.76 | $ | 20.08 | ||||||||||||
| Total return(c) | (1.46 | )% | 10.86 | % | 1.03 | % | ||||||||||||
Net assets, end of period (in 000s) | $ | 7,791 | $ | 21,171 | $ | 41,067 | ||||||||||||
Ratio of net expenses to average net assets | 0.77 | % | 0.79 | % | 0.77 | %(d) | ||||||||||||
Ratio of total expenses to average net assets | 0.89 | % | 0.87 | % | 0.81 | %(d) | ||||||||||||
Ratio of net investment income to average net assets | 1.10 | % | 1.24 | % | (0.37 | )%(d) | ||||||||||||
Portfolio turnover rate(e) | 43 | % | 45 | % | 101 | % | ||||||||||||
| (a) | Commenced operations on April 16, 2018. |
| (b) | Calculated based on the average shares outstanding methodology. |
| (c) | Assumes investment at the NAV at the beginning of the period, reinvestment of all dividends and distributions, a complete redemption of the investment at the NAV at the end of the period and no sales or redemption charges (if any). Total returns would be reduced if a sales or redemption charge was taken into account. Returns do not reflect the impact of taxes to shareholders relating to Fund distributions or the redemption of Fund shares. Total returns for periods less than one full year are not annualized. |
| (d) | Annualized. |
| (e) | The Fund’s portfolio turnover rate is calculated in accordance with regulatory requirements, without regard to transactions involving short term investments and certain derivatives. If such transactions were included, the Fund’s portfolio turnover rate may be higher. |
| The accompanying notes are an integral part of these financial statements. | 53 |
GOLDMAN SACHS DIVIDEND FOCUS FUNDS
October 31, 2020
| 1. ORGANIZATION |
Goldman Sachs Trust (the “Trust”) is a Delaware statutory trust registered under the Investment Company Act of 1940, as amended (the “Act”), as an open-end management investment company. The following table lists those series of the Trust that are included in this report (collectively, the “Funds” or individually a “Fund”), along with their corresponding share classes and respective diversification status under the Act:
| Fund | Share Classes Offered | Diversified/ Non-diversified | ||
Income Builder | A, C, Institutional, Investor, R6 and P | Diversified | ||
| Rising Dividend Growth | A, C, Institutional, Investor, R6, R and P | Diversified |
Class A Shares are sold with a front-end sales charge of up to 5.50%. Class C Shares are sold with contingent deferred sales charge (“CDSC”) of 1.00% which is imposed on redemptions made within 12 months of purchase. Institutional, Investor, Class R6, Class R and Class P Shares are not subject to a sales charge.
Goldman Sachs Asset Management, L.P. (“GSAM”), an affiliate of Goldman Sachs & Co. LLC (“Goldman Sachs”), serves as investment adviser to the Funds pursuant to a management agreement (the “Agreement”) with the Trust. Prior to July 1, 2020, Dividend Assets Capital, LLC (“DAC” or the “Sub Adviser”) served as the sub-adviser to the Rising Dividend Growth Fund. GSAM compensated the Sub-Adviser directly in accordance with the terms of the Sub-Advisory Agreement. The Fund was not charged any separate or additional investment advisory fees by the Sub-Adviser.
| 2. SIGNIFICANT ACCOUNTING POLICIES |
The financial statements have been prepared in accordance with accounting principles generally accepted in the United States of America (“GAAP”) and require management to make estimates and assumptions that may affect the reported amounts and disclosures. Actual results may differ from those estimates and assumptions. Each Fund is an investment company under GAAP and follows the accounting and reporting guidance applicable to investment companies.
A. Investment Valuation — The Funds’ valuation policy is to value investments at fair value.
B. Investment Income and Investments — Investment income includes interest income, dividend income and securities lending income, if any. Interest income is accrued daily and adjusted for amortization of premiums and accretion of discounts. Dividend income is recognized on ex-dividend date or, for certain foreign securities, as soon as such information is obtained subsequent to the ex-dividend date. Non-cash dividends, if any, are recorded at the fair market value of the securities received. Investment transactions are reflected on trade date. Realized gains and losses are calculated using identified cost. Investment transactions are recorded on the following business day for daily net asset value (“NAV”) calculations. Investment income is recorded net of any foreign withholding taxes, less any amounts reclaimable. The Funds may file withholding tax reclaims in certain jurisdictions to recover a portion of amounts previously withheld. Any foreign capital gains tax is accrued daily based upon net unrealized gains, and is payable upon sale of such investments. Distributions received from the Funds’ investments in U.S. real estate investment trusts (“REITs”) may be characterized as ordinary income, net capital gain and/or a return of capital. A return of capital is recorded by the Funds as a reduction to the cost basis of the REIT. Distributions from master limited partnerships (“MLPs”) are generally recorded based on the characterization reported on the MLP’s tax return. A Fund records its pro-rata share of the income/loss and capital gains/losses, allocated from the underlying partnerships and adjusts the cost basis of the underlying partnerships accordingly. For derivative contracts, realized gains and losses are recorded upon settlement of the contract. Upfront payments, if any, are made or received upon entering into a swap agreement and are reflected in the Statements of Assets and Liabilities. Upfront payments are recognized over the contract’s term/event as realized gains or losses, with the exception of forward starting swap contracts whose realized gains or losses are recognized from the effective start date. For securities with paydown provisions, principal payments received are treated as a proportionate reduction to the cost basis of the securities, and excess or shortfall amounts are recorded as income.
54
GOLDMAN SACHS DIVIDEND FOCUS FUNDS
| 2. SIGNIFICANT ACCOUNTING POLICIES (continued) |
C. Class Allocations and Expenses — Investment income, realized and unrealized gain (loss), if any, and non-class specific expenses of each Fund are allocated daily based upon the proportion of net assets of each class. Non-class specific expenses directly incurred by a Fund are charged to that Fund, while such expenses incurred by the Trust are allocated across the applicable Funds on a straight-line and/or pro-rata basis depending upon the nature of the expenses. Class specific expenses, where applicable, are borne by the respective share classes and include Distribution and Service, Transfer Agency and Service fees.
D. Federal Taxes and Distributions to Shareholders — It is each Fund’s policy to comply with the requirements of the Internal Revenue Code of 1986, as amended (the “Code”), applicable to regulated investment companies and to distribute each year substantially all of its investment company taxable income and capital gains to its shareholders. Accordingly, each Fund is not required to make any provisions for the payment of federal income tax. Distributions to shareholders are recorded on the ex-dividend date. Income and capital gains distributions, if any, are declared according to the following schedule:
| Fund | Income Distributions Declared/Paid | Capital Gains Distributions Declared/Paid | ||||
Income Builder | Monthly | Annually | ||||
Rising Dividend Growth | Quarterly | Annually |
Net capital losses, if any, are carried forward to future fiscal years and may be used to the extent allowed by the Code to offset any future capital gains. Losses that are carried forward will retain their character as either short-term or long-term capital losses. Utilization of capital loss carryforwards will reduce the requirement of future capital gains distributions.
The characterization of distributions to shareholders for financial reporting purposes is determined in accordance with federal income tax rules, which may differ from GAAP. The source of each Fund’s distributions may be shown in the accompanying financial statements as either from distributable earnings or capital. Certain components of the Funds’ net assets on the Statements of Assets and Liabilities reflect permanent GAAP/tax differences based on the appropriate tax character.
E. Foreign Currency Translation — The accounting records and reporting currency of the Funds are maintained in U.S. dollars. Assets and liabilities denominated in foreign currencies are translated into U.S. dollars using the current exchange rates at the close of each business day. The effect of changes in foreign currency exchange rates on investments is included within net realized and unrealized gain (loss) on investments. Changes in the value of other assets and liabilities as a result of fluctuations in foreign exchange rates are included in the Statements of Operations within net change in unrealized gain (loss) on foreign currency translation. Transactions denominated in foreign currencies are translated into U.S. dollars on the date the transaction occurred, the effects of which are included within net realized gain (loss) on foreign currency transactions.
| 3. INVESTMENTS AND FAIR VALUE MEASUREMENTS |
U.S. GAAP defines the fair value of a financial instrument as the amount that would be received to sell an asset or paid to transfer a liability in an orderly transaction between market participants at the measurement date (i.e., the exit price); the Funds’ policy is to use the market approach. GAAP establishes a fair value hierarchy that prioritizes the inputs to valuation techniques used to measure fair value. The hierarchy gives the highest priority to unadjusted quoted prices in active markets for identical assets or liabilities (Level 1 measurements) and the lowest priority to unobservable inputs (Level 3 measurements). The level in the fair value hierarchy within which the fair value measurement in its entirety falls shall be determined based on the lowest level input that is significant to the fair value measurement in its entirety. The levels used for classifying investments are not necessarily an indication of the risk associated with investing in these investments. The three levels of the fair value hierarchy are described below:
Level 1 — Unadjusted quoted prices in active markets that are accessible at the measurement date for identical, unrestricted assets or liabilities;
55
GOLDMAN SACHS DIVIDEND FOCUS FUNDS
Notes to Financial Statements (continued)
October 31, 2020
| 3. INVESTMENTS AND FAIR VALUE MEASUREMENTS (continued) |
Level 2 — Quoted prices in markets that are not active or financial instruments for which significant inputs are observable (including, but not limited to, quoted prices for similar investments, interest rates, foreign exchange rates, volatility and credit spreads), either directly or indirectly;
Level 3 — Prices or valuations that require significant unobservable inputs (including GSAM’s assumptions in determining fair value measurement).
The Board of Trustees (“Trustees”) has approved Valuation Procedures that govern the valuation of the portfolio investments held by the Funds, including investments for which market quotations are not readily available. The Trustees have delegated to GSAM day-to-day responsibility for implementing and maintaining internal controls and procedures related to the valuation of the Funds’ investments. To assess the continuing appropriateness of pricing sources and methodologies, GSAM regularly performs price verification procedures and issues challenges as necessary to third party pricing vendors or brokers, and any differences are reviewed in accordance with the Valuation Procedures.
A. Level 1 and Level 2 Fair Value Investments — The valuation techniques and significant inputs used in determining the fair values for investments classified as Level 1 and Level 2 are as follows:
Equity Securities — Equity securities traded on a United States (“U.S.”) securities exchange or the NASDAQ system, or those located on certain foreign exchanges, including but not limited to the Americas, are valued daily at their last sale price or official closing price on the principal exchange or system on which they are traded. If there is no sale or official closing price or such price is believed by GSAM to not represent fair value, equity securities will be valued at the valid closing bid price for long positions and at the valid closing ask price for short positions (i.e. where there is sufficient volume, during normal exchange trading hours). If no valid bid/ask price is available, the equity security will be valued pursuant to the Valuation Procedures approved by the Trustees and consistent with applicable regulatory guidance. To the extent these investments are actively traded, they are classified as Level 1 of the fair value hierarchy, otherwise they are generally classified as Level 2. Certain equity securities containing unique attributes may be classified as Level 2.
Unlisted equity securities for which market quotations are available are valued at the last sale price on the valuation date, or if no sale occurs, at the last bid price for long positions or the last ask price for short positions, and are generally classified as Level 2. Securities traded on certain foreign securities exchanges are valued daily at fair value determined by an independent fair value service (if available) under Fair Valuation Procedures approved by the Trustees and consistent with applicable regulatory guidance. The independent fair value service takes into account multiple factors including, but not limited to, movements in the securities markets, certain depositary receipts, futures contracts and foreign currency exchange rates that have occurred subsequent to the close of the foreign securities exchange. These investments are generally classified as Level 2 of the fair value hierarchy.
Underlying Funds (including Money Market Funds) — Underlying funds (“Underlying Funds”) include other investment companies and exchange-traded funds (“ETFs”). Investments in the Underlying Funds (except ETFs) are valued at the NAV per share on the day of valuation. ETFs are valued daily at the last sale price or official closing price on the principal exchange or system on which the investment is traded. Because the Funds invest in Underlying Funds that fluctuate in value, the Funds’ shares will correspondingly fluctuate in value. To the extent these investments are actively traded, they are classified as Level 1 of the fair value hierarchy, otherwise they are generally classified as Level 2. For information regarding an Underlying Fund’s accounting policies and investment holdings, please see the Underlying Fund’s shareholder report.
Debt Securities — Debt securities for which market quotations are readily available are valued daily on the basis of quotations supplied by dealers or an independent pricing service approved by the Trustees. The pricing services may use valuation models or matrix pricing, which consider: (i) yield or price with respect to bonds that are considered comparable in characteristics such as rating, interest rate and maturity date or (ii) quotations from securities dealers to determine current value. With the exception of treasury securities of G7 countries, which are generally classified as Level 1, these investments are generally classified as Level 2 of the fair value hierarchy.
i. Bank Loans — Bank loans (“Loans”) are interests in amounts owed by corporate, governmental, or other borrowers to lenders or lending syndicates. Loans are arranged through private negotiations between the borrower and one or more
56
GOLDMAN SACHS DIVIDEND FOCUS FUNDS
| 3. INVESTMENTS AND FAIR VALUE MEASUREMENTS (continued) |
financial institutions (“Lenders”). A Fund’s investments in Loans are in the form of either participations in Loans (“Participations”) or assignments of all or a portion of Loans from third parties (“Assignments”). With respect to Participations, a Fund has the right to receive payments of principal, interest and any fees to which it is entitled from the Lender selling the Participations and only upon receipt by the Lender of the payments from the borrower. A Fund generally has no right to enforce compliance by the borrower with the terms of the loan agreement with respect to Participations. Conversely, assignments result in a Fund having a direct contractual relationship with the borrower, and the Fund may be permitted to enforce compliance by the borrower with the terms of the loan agreement.
ii. Commercial Paper — Commercial paper normally represents short-term unsecured promissory notes issued in bearer form by banks or bank holding companies, corporations, finance companies and other issuers. Commercial paper consists of direct U.S. dollar-denominated obligations of domestic or foreign issuers. Asset-backed commercial paper is issued by a special purpose entity that is organized to issue the commercial paper and to purchase trade receivables or other financial assets.
iii. Mortgage-Backed and Asset-Backed Securities — Mortgage-backed securities represent direct or indirect participations in, or are collateralized by and payable from, mortgage loans secured by residential and/or commercial real estate property. Asset-backed securities include securities whose principal and interest payments are collateralized by pools of other assets or receivables. The value of certain mortgage-backed and asset-backed securities (including adjustable rate mortgage loans) may be particularly sensitive to changes in prevailing interest rates. The value of these securities may also fluctuate in response to the market’s perception of the creditworthiness of the issuers.
Asset-backed securities may present credit risks that are not presented by mortgage-backed securities because they generally do not have the benefit of a security interest in collateral that is comparable to mortgage assets. Some asset-backed securities may only have a subordinated claim on collateral.
Stripped mortgage-backed securities are usually structured with two different classes: one that receives substantially all interest payments (interest-only, or “IO” and/or high coupon rate with relatively low principal amount, or “IOette”), and the other that receives substantially all principal payments (principal-only, or “PO”) from a pool of mortgage loans. Little to no principal will be received at the maturity of an IO; as a result, periodic adjustments are recorded to reduce the cost of the security until maturity. These adjustments are included in interest income.
Derivative Contracts — A derivative is an instrument whose value is derived from underlying assets, indices, reference rates or a combination of these factors. A Fund enters into derivative transactions to hedge against changes in interest rates, securities prices, and/or currency exchange rates, to increase total return, or to gain access to certain markets or attain exposure to other underliers. For financial reporting purposes, cash collateral that has been pledged to cover obligations of a Fund and cash collateral received, if any, is reported separately on the Statements of Assets and Liabilities as receivables/payables for collateral on certain derivatives contracts. Non-cash collateral pledged by a Fund, if any, is noted in the Schedules of Investments.
Exchange-traded derivatives, including futures and options contracts, are generally valued at the last sale or settlement price on the exchange where they are principally traded. Exchange-traded options without settlement prices are generally valued at the last bid price for long positions and the last ask price for short positions on the exchange where they are principally traded. Exchange-traded derivatives typically fall within Level 1 of the fair value hierarchy. Exchange-traded derivatives, including futures and options contracts, are generally valued at the last sale or settlement price on the exchange where they are principally traded. Exchange-traded options without settlement prices are generally valued at the midpoint of the bid and ask prices on the exchange where they are principally traded (or, in the absence of two-way trading, at the last bid price for long positions and the last ask price for short positions). Exchange-traded derivatives typically fall within Level 1 of the fair value hierarchy. Over-the-counter (“OTC”) and centrally cleared derivatives are valued using market transactions and other market evidence, including market-based inputs to models, calibration to market-clearing transactions, broker or dealer quotations, or other alternative pricing sources. Where models are used, the selection of a particular model to value OTC and centrally cleared derivatives depends upon the contractual terms of, and specific risks inherent in, the instrument, as well as the availability of pricing information in the market. Valuation models require a variety of inputs, including contractual terms, market prices, yield curves, credit curves, measures of volatility, voluntary and involuntary prepayment rates, loss severity rates and correlations of
57
GOLDMAN SACHS DIVIDEND FOCUS FUNDS
Notes to Financial Statements (continued)
October 31, 2020
| 3. INVESTMENTS AND FAIR VALUE MEASUREMENTS (continued) |
such inputs. For OTC and centrally cleared derivatives that trade in liquid markets, model inputs can generally be verified and model selection does not involve significant management judgment. OTC and centrally cleared derivatives are classified within Level 2 of the fair value hierarchy when significant inputs are corroborated by market evidence.
i. Forward Contracts — A forward contract is a contract between two parties to buy or sell an asset at a specified price on a future date. A forward contract settlement can occur on a cash or delivery basis. Forward contracts are marked-to-market daily using independent vendor prices, and the change in value, if any, is recorded as an unrealized gain or loss. Cash and certain investments may be used to collateralize forward contracts.
A forward foreign currency exchange contract is a forward contract in which a Fund agrees to receive or deliver a fixed quantity of one currency for another, at a pre-determined price at a future date. All forward foreign currency exchange contracts are marked-to-market daily by using the outright forward rates or interpolating based upon maturity dates, where available. Non-deliverable forward foreign currency exchange contracts are settled with the counterparty in cash without the delivery of foreign currency.
ii. Futures Contracts — Futures contracts are contracts to buy or sell a standardized quantity of a specified commodity or security. Upon entering into a futures contract, a Fund deposits cash or securities in an account on behalf of the broker in an amount sufficient to meet the initial margin requirement. Subsequent payments are made or received by a Fund equal to the daily change in the contract value and are recorded as variation margin receivable or payable with a corresponding offset to unrealized gains or losses.
iii. Options — When a Fund writes call or put options, an amount equal to the premium received is recorded as a liability and is subsequently marked-to-market to reflect the current value of the option written. Swaptions are options on swap contracts.
Upon the purchase of a call option or a put option by a Fund, the premium paid is recorded as an investment and subsequently marked-to-market to reflect the current value of the option. Certain options may be purchased with premiums to be determined on a future date. The premiums for these options are based upon implied volatility parameters at specified terms.
iv. Swap Contracts — Bilateral swap contracts are agreements in which a Fund and a counterparty agree to exchange periodic payments on a specified notional amount or make a net payment upon termination. Bilateral swap transactions are privately negotiated in the OTC market and payments are settled through direct payments between a Fund and the counterparty. By contrast, certain swap transactions are subject to mandatory central clearing. These swaps are executed through a derivatives clearing member (“DCM”), acting in an agency capacity, and submitted to a central counterparty (“CCP”) (“centrally cleared swaps”), in which case all payments are settled with the CCP through the DCM. Swaps are marked-to-market daily using pricing vendor quotations, counterparty or clearinghouse prices or model prices, and the change in value, if any, is recorded as an unrealized gain or loss. Upon entering into a swap contract, a Fund is required to satisfy an initial margin requirement by delivering cash or securities to the counterparty (or in some cases, segregated in a triparty account on behalf of the counterparty), which can be adjusted by any mark-to-market gains or losses pursuant to bilateral or centrally cleared arrangements. For centrally cleared swaps the daily change in valuation, if any, is recorded as a receivable or payable for variation margin.
An interest rate swap is an agreement that obligates two parties to exchange a series of cash flows at specified intervals, based upon or calculated by reference to changes in interest rates on a specified notional principal amount. The payment flows are usually netted against each other, with the difference being paid by one party to the other.
A total return swap is an agreement that gives a Fund the right to receive or pay the appreciation or depreciation, as applicable, in the value of a specified security, an index, a basket of securities or indices or other instrument in return for a fee paid to the counterparty, which will typically be an agreed upon interest rate. If the underlying asset declines in value over the term of the swap, a Fund may also be required to pay the dollar value of that decline to the counterparty.
B. Level 3 Fair Value Investments — To the extent that significant inputs to valuation models and other alternative pricing sources are unobservable, or if quotations are not readily available, or if GSAM believes that such quotations do not accurately reflect fair value, the fair value of a Fund’s investments may be determined under Valuation Procedures approved by the Trustees.
58
GOLDMAN SACHS DIVIDEND FOCUS FUNDS
| 3. INVESTMENTS AND FAIR VALUE MEASUREMENTS (continued) |
GSAM, consistent with its procedures and applicable regulatory guidance, may make an adjustment to the most recent valuation prices of either domestic or foreign securities in light of significant events to reflect what it believes to be the fair value of the securities at the time of determining a Fund’s NAV. To the extent investments are valued using single source broker quotations obtained directly from the broker or passed through from third party pricing vendors, such investments are classified as Level 3 investments.
C. Fair Value Hierarchy — The following is a summary of the Funds’ investments and derivatives classified in the fair value hierarchy as of October 31, 2020:
| INCOME BUILDER |
| |||||||||||
| Investment Type | Level 1 | Level 2 | Level 3 | |||||||||
| Assets | ||||||||||||
Common Stock and/or Other Equity Investments(a) | ||||||||||||
Asia | $ | 4,964,991 | $ | — | $ | — | ||||||
Europe | 138,839,827 | — | — | |||||||||
North America | 470,610,074 | 9,542,202 | 48,685 | |||||||||
Fixed Income | ||||||||||||
Corporate Obligations | — | 886,285,407 | — | |||||||||
Mortgage-Backed Obligations | — | 183,272 | — | |||||||||
Foreign Debt Obligations | — | 3,296,799 | — | |||||||||
Bank Loans | — | 115,854,934 | 945,250 | |||||||||
U.S. Treasury Obligations | 1,733,514 | — | — | |||||||||
Unfunded Loan Commitment | — | 11,118 | — | |||||||||
Investment Companies | 38,545,551 | — | — | |||||||||
| Total | $ | 654,693,957 | $ | 1,015,173,732 | $ | 993,935 | ||||||
| Liabilities |
| |||||||||||
Fixed Income |
| |||||||||||
Unfunded Loan Commitment | $ | — | $ | — | $ | (3,806 | ) | |||||
| Total | $ | — | $ | — | $ | (3,806 | ) | |||||
| Derivative Type | ||||||||||||
| Assets(b) | ||||||||||||
Forward Foreign Currency Exchange Contracts | $ | — | $ | 51,062 | $ | — | ||||||
Futures Contracts | 773,974 | — | — | |||||||||
Interest Rate Swap Contracts | — | 8,601 | — | |||||||||
| Total | $ | 773,974 | $ | 59,663 | $ | — | ||||||
| Liabilities(b) | ||||||||||||
Forward Foreign Currency Exchange Contracts | $ | — | $ | (14,181 | ) | $ | — | |||||
Futures Contracts | (4,192,194 | ) | — | — | ||||||||
Interest Rate Swap Contracts | — | (804,986 | ) | — | ||||||||
| Total | $ | (4,192,194 | ) | $ | (819,167 | ) | $ | — | ||||
| (a) | Amounts are disclosed by continent to highlight the impact of time zone differences between local market close and the calculation of net asset value. Security valuations are based on the principal exchange or system on which they are traded, which may differ from country of domicile. The Funds utilize fair value model prices provided by an independent fair value service for international equities, resulting in a Level 2 classification. |
| (b) | Amount shown represents unrealized gain (loss) at period end. |
59
GOLDMAN SACHS DIVIDEND FOCUS FUNDS
Notes to Financial Statements (continued)
October 31, 2020
| 3. INVESTMENTS AND FAIR VALUE MEASUREMENTS (continued) |
| RISING DIVIDEND GROWTH | ||||||||||||
| Investment Type | Level 1 | Level 2 | Level 3 | |||||||||
| Assets |
| |||||||||||
Common Stock and/or Other Equity Investments(a) | ||||||||||||
Europe | $ | 26,465,251 | $ | — | $ | — | ||||||
North America | 412,106,746 | — | — | |||||||||
Investment Companies | 4,646,178 | — | — | |||||||||
Securities Lending Reinvestment Vehicle | 1,243,550 | — | — | |||||||||
| Total | $ | 444,461,725 | $ | — | $ | — | ||||||
| Derivative Type | ||||||||||||
| Liabilities(b) | ||||||||||||
Futures Contracts | $ | (327,134 | ) | $ | — | $ | — | |||||
| (a) | Amounts are disclosed by continent to highlight the impact of time zone differences between local market close and the calculation of net asset value. Security valuations are based on the principal exchange or system on which they are traded, which may differ from country of domicile. The Funds utilize fair value model prices provided by an independent fair value service for international equities, resulting in a Level 2 classification. |
| (b) | Amount shown represents unrealized gain (loss) at period end. |
For further information regarding security characteristics, see the Schedules of Investments.
| 4. INVESTMENTS IN DERIVATIVES |
The following tables set forth, by certain risk types, the gross value of derivative contracts (not considered to be hedging instruments for accounting disclosure purposes) as of October 31, 2020. These instruments were used as part of the Funds’ investment strategies and to obtain and/or manage exposure related to the risks below. The values in the tables below exclude the effects of cash collateral received or posted pursuant to these derivative contracts, and therefore are not representative of the Funds’ net exposure.
| Income Builder | ||||||||||||
| Risk | Statements of Assets and Liabilities | Assets | Statements of Assets and Liabilities | Liabilities | ||||||||
Interest rate | Variation margin on swap contracts; Variation margin on futures contracts | $ | 782,575 | (a) | Variation margin on swap contracts; Variation margin on futures contracts | $ | (2,976,574) | (a) | ||||
Equity | — | — | Variation margin on futures contracts | (2,020,606) | (a) | |||||||
Currency | Receivable for unrealized gain on forward foreign currency exchange contracts | 51,062 | Payable for unrealized gain on forward foreign currency exchange contracts | (14,181) | ||||||||
| Total | $ | 833,637 | $ | (5,011,361) | ||||||||
| Rising Dividend Growth | ||||||||||||
| Risk | Statements of Assets and Liabilities | Assets | Statements of Assets and Liabilities | Liabilities | ||||||||
| Equity | — | $ | — | Variation margin on futures contracts | $ | (327,134) | (a) | |||||
| (a) | Includes unrealized gain (loss) on futures contracts described in the Additional Investment Information sections of the Schedules of Investments. Only current day’s variation margin is reported within the Statements of Assets and Liabilities. |
60
GOLDMAN SACHS DIVIDEND FOCUS FUNDS
| 4. INVESTMENTS IN DERIVATIVES (continued) |
The following tables set forth, by certain risk types, the Funds’ gains (losses) related to these derivatives and their indicative volumes for the fiscal year ended October 31, 2020. These gains (losses) should be considered in the context that these derivative contracts may have been executed to create investment opportunities and/or economically hedge certain investments, and accordingly, certain gains (losses) on such derivative contracts may offset certain (losses) gains attributable to investments. These gains (losses) are included in “Net realized gain (loss)” or “Net change in unrealized gain (loss)” on the Statements of Operations:
| Income Builder | ||||||||||||||
| Risk | Statements of Operations | Net Realized Gain (Loss) | Net Change in Unrealized Gain (Loss) | Average Number of Contracts(a) | ||||||||||
| Interest rate | Net realized gain from futures contracts and swap contracts/Net change in unrealized gain (loss) on futures contracts and swap contracts | $ | 48,215,628 | $ | (1,768,496 | ) | 1,303 | |||||||
| Equity | Net realized gain (loss) from futures contracts, purchased options and written options/Net change in unrealized gain (loss) futures contracts and written options | (2,887,885 | ) | (2,369,140 | ) | 405 | ||||||||
| Currency | Net realized (loss) from forward foreign currency exchange contracts/Net change in unrealized gain on forward foreign currency exchange contracts | (406,580 | ) | 265,733 | 3 | |||||||||
| Total | $ | 44,921,163 | $ | (3,871,903 | ) | 1,711 | ||||||||
| Rising Dividend Growth | ||||||||||||||
| Risk | Statements of Operations | Net Realized Gain (Loss) | Net Change in Unrealized Gain (Loss) | Average Number of Contracts(a) | ||||||||||
| Equity | Net realized gain (loss) from futures contracts/Net unrealized gain(loss) on futures contracts | $ | 1,433,709 | $ | (562,067 | ) | 91 | |||||||
| (a) | Average number of contracts is based on the average of month end balances for the fiscal year ended October 31, 2020. |
| 5. AGREEMENTS AND AFFILIATED TRANSACTIONS |
A. Management Agreement — Under the Agreement, GSAM manages the Funds, subject to the general supervision of the Trustees.
As compensation for the services rendered pursuant to the Agreement, the assumption of the expenses related thereto and administration of the Funds’ business affairs, including providing facilities, GSAM is entitled to a management fee, accrued daily and paid monthly, equal to an annual percentage rate of each Fund’s average daily net assets.
For the fiscal year ended October 31, 2020, contractual and effective net management fees with GSAM were at the following rates:
| Contractual Management Rate | Effective Net Management Rate^ | |||||||||||||||||||||||||||||
| Fund | First $1 billion | Next $1 billion | Next $3 billion | Next $3 billion | Over $8 billion | Effective Rate | ||||||||||||||||||||||||
Income Builder | 0.54 | % | 0.49 | % | 0.46 | % | 0.45 | % | 0.44 | % | 0.52 | % | 0.49 | %* | ||||||||||||||||
Rising Dividend Growth | 0.75 | 0.68 | 0.64 | 0.63 | 0.62 | 0.75 | 0.72 | ** | ||||||||||||||||||||||
| ^ | Effective Net Management Rate includes impact of management fee waivers of underlying funds, if any. |
| * | Effective July 20, 2020, the Investment Adviser agreed to waive a portion of the Management Fee so that the net management fee will not exceed 0.44% as an annual percentage rate of the Fund’s average net assets. This management fee waiver arrangement will remain in effect through at least July 20, 2021, and prior to such date, GSAM may not terminate the arrangement without the approval of the Trustees. |
| ** | Effective July 1, 2020, the Investment Adviser agreed to waive a portion of the Management Fee so that the net management fee will not exceed 0.67% as an annual percentage rate of the Fund’s average net assets. This management fee waiver arrangement will remain in effect through at least June 30, 2021, and prior to such date, GSAM may not terminate the arrangement without the approval of the Trustees. |
61
GOLDMAN SACHS DIVIDEND FOCUS FUNDS
Notes to Financial Statements (continued)
October 31, 2020
| 5. AGREEMENTS AND AFFILIATED TRANSACTIONS (continued) |
Certain Funds invest in Institutional Shares of the Goldman Sachs Financial Square Government Fund and Class R6 Shares of the Goldman Sachs Emerging Markets Equity Fund, Goldman Sachs Financial Square Government Fund, Goldman Sachs High Yield Fund and Goldman Sachs MLP Energy Infrastructure Fund, which are affiliated Underlying Funds. GSAM has agreed to waive a portion of its management fee payable by the Funds in an amount equal to the management fee it earns as an investment adviser to any of the affiliated Underlying Funds in which the Funds invest. For the fiscal year ended October 31, 2020, the management fee waived by GSAM was for each Fund as follows:
| Fund | Management Fee Waived | |||||||||
Income Builder | $ | 140,632 | ||||||||
Rising Dividend Growth | 19,765 | |||||||||
B. Distribution and/or Service (12b-1) Plans — The Trust, on behalf of Class A and Class R Shares of each applicable Fund, has adopted Distribution and Service Plans subject to Rule 12b-1 under the Act. Under the Distribution and Service Plans, Goldman Sachs, which serves as distributor (the “Distributor”), is entitled to a fee accrued daily and paid monthly, for distribution services and personal and account maintenance services, which may then be paid by Goldman Sachs to authorized dealers. These fees are equal to an annual percentage rate of the average daily net assets attributable to Class A or Class R Shares of the Funds, as applicable, as set forth below.
The Trust, on behalf of Class C Shares of each applicable Fund, has adopted a Distribution Plan subject to Rule 12b-1 under the Act. Under the Distribution Plan, Goldman Sachs as Distributor is entitled to a fee accrued daily and paid monthly for distribution services, which may then be paid by Goldman Sachs to authorized dealers. These fees are equal to an annual percentage rate of the average daily net assets attributable to Class C Shares of the Funds, as set forth below.
| Distribution and/or Service Plan Rates | ||||||||||||
| Class A* | Class C | Class R* | ||||||||||
Distribution and/or Service Plan | 0.25 | % | 0.75 | % | 0.50 | % | ||||||
| * | With respect to Class A and Class R Shares, the Distributor at its discretion may use compensation for distribution services paid under the Distribution and/or Service Plan to compensate service organizations for personal and account maintenance services and expenses as long as such total compensation does not exceed the maximum cap on “service fees” imposed by the Financial Industry Regulatory Authority. |
C. Distribution Agreement — Goldman Sachs, as Distributor of the shares of the Funds pursuant to a Distribution Agreement, may retain a portion of the Class A Shares’ front end sales charge and Class C Shares’ CDSC. During the fiscal year ended October 31, 2020, Goldman Sachs retained the following amounts:
| Front End Sales Charge | Contingent Deferred Sales Charge | |||||||||
| Class A | Class C | |||||||||
Income Builder | $ | 65,397 | $ | — | ||||||
Rising Dividend Growth | 12,253 | 23 | ||||||||
D. Service Plan —The Trust, on behalf of each applicable Fund, has adopted a Service Plan to allow Class C Shares to compensate service organizations (including Goldman Sachs) for providing varying levels of personal and account maintenance services to their customers who are beneficial owners of such shares. The Service Plan provides for compensation to the service organizations equal to an annual percentage rate of the average daily net assets attributable to Class C Shares of the Funds.
E. Transfer Agency Agreement — Goldman Sachs also serves as the transfer agent of the Funds for a fee pursuant to the Transfer Agency Agreement. The fees charged for such transfer agency services are accrued daily and paid monthly at annual rates
62
GOLDMAN SACHS DIVIDEND FOCUS FUNDS
| 5. AGREEMENTS AND AFFILIATED TRANSACTIONS (continued) |
as follows: 0.12% of the average daily net assets of Class A, Class C, Investor and Class R Shares of the Income Builder Fund; 0.16% of the average daily net assets of Class A, Class C, Investor and Class R Shares of the Rising Dividend Growth Fund; 0.03% of the average daily net assets of Class R6 and P Shares of each Fund; and 0.04% of the average daily net assets of Institutional Shares of each Fund. Prior to July 1 2020, Goldman Sachs had charged 0.17% of the average daily net assets of Class A, Class C, Investor and Class R Shares of both Funds. From July 1, 2020 until July 20, 2020, Goldman Sachs had charged 0.16% of the average daily net assets of Class A, Class C, Investor and Class R Shares of the Income Builder Fund.
Goldman Sachs has agreed to waive a portion of its transfer agency fee (a component of “Other Expenses”) equal to 0.06% as an annual percentage rate of the average daily net assets attributable to Class A, Class C, Investor and Class R Shares of the Rising Dividend Growth Fund. This arrangement will remain in effect through at least June 30, 2021, and prior to such date Goldman Sachs may not terminate the arrangement without the approval of the Trustees.
F. Other Expense Agreements and Affiliated Transactions — GSAM has agreed to reduce or limit certain “Other Expenses” of the Funds (excluding acquired fund fees and expenses, transfer agency fees and expenses, service fees and shareholder administration fees (as applicable), taxes, interest, brokerage fees, expenses of shareholder meetings, litigation and indemnification, and extraordinary expenses) to the extent such expenses exceed, on an annual basis, a percentage rate of the average daily net assets of each Funds. Such Other Expense reimbursements, if any, are accrued daily and paid monthly. In addition, the Funds are not obligated to reimburse GSAM for prior fiscal year expense reimbursements, if any. The Other Expense limitations as an annual percentage rate of average daily net assets for the Income Builder and Rising Dividend Growth Funds are 0.004% and 0.014%, respectively. Prior to July 20, 2020, the other expense limitation as an annual percentage rate of average daily net assets for the Income Builder Fund was 0.034%. The Income Builder Fund’s arrangement will remain in effect through at least July 20, 2021, and the Rising Dividend Growth Fund’s arrangement will remain in effect through at least June 30, 2021, and prior to such dates, GSAM may not terminate the arrangements without the approval of the Trustees. In addition, the Funds have entered into certain offset arrangements with the transfer agent, which may result in a reduction of the Funds’ expenses and are received irrespective of the application of the “Other Expense” limitations described above.
For the fiscal year ended October 31, 2020, these expense reductions, including any fee waivers and Other Expense reimbursements, were as follows:
| Fund | Management Fee Waiver | Transfer Agency Waivers/Credits | Other Expense Reimbursements | Total Expense Reductions | ||||||||||||||
Income Builder | $ | 533,162 | $ | 2,549 | $ | 505,716 | $ | 1,041,427 | ||||||||||
Rising Dividend Growth | 150,466 | 244,051 | 580,838 | 975,355 | ||||||||||||||
G. Line of Credit Facility — As of October 31, 2020, the Funds participated in a $700,000,000 committed, unsecured revolving line of credit facility (the “facility”) together with other funds of the Trust and certain registered investment companies having management agreements with GSAM or its affiliates. This facility is to be used for temporary emergency purposes, or to allow for an orderly liquidation of securities to meet redemption requests. The interest rate on borrowings is based on the federal funds rate. The facility also requires a fee to be paid by the Funds based on the amount of the commitment that has not been utilized. For the fiscal year ended October 31, 2020, the Funds did not have any borrowings under the facility. Prior to April 28, 2020, the facility was $580,000,000.
H. Other Transactions with Affiliates — For the fiscal year ended October 31, 2020, Goldman Sachs earned $30,810 in brokerage commissions from portfolio transactions, on behalf of the Income Builder Fund.
63
GOLDMAN SACHS DIVIDEND FOCUS FUNDS
Notes to Financial Statements (continued)
October 31, 2020
| 5. AGREEMENTS AND AFFILIATED TRANSACTIONS (continued) |
The table below shows the transactions in and earnings from investments in the Underlying funds fiscal year ended October 31, 2020:
| Fund | Underlying Fund | Beginning Value as of October 31, 2019 | Purchases at Cost | Proceeds from Sales | Change in Unrealized Gain/(Loss) | Ending Value as of October 31, 2020 | Shares as of October 31, 2020 | Dividend Income | ||||||||||||||||||||||
Income Builder | Goldman Sachs Emerging Markets Equity Fund — Class R6 | $ | 54,599 | $ | 626 | $ | — | $ | 9,303 | $ | 64,528 | 2,516 | $ | 627 | ||||||||||||||||
| Goldman Sachs Financial Square Government Fund — Institutional Shares | 42,020,144 | 520,521,396 | (556,061,333 | ) | — | 6,480,207 | 6,480,207 | 551,194 | ||||||||||||||||||||||
| Goldman Sachs Financial Square Government Fund — Class R6 | 47,167,247 | 409,039,220 | (435,706,393 | ) | — | 20,500,074 | 20,500,074 | 176,537 | ||||||||||||||||||||||
| Goldman Sachs High Yield Fund — Class R6 | 53,353 | 3,072 | — | (2,067 | ) | 54,358 | 8,839 | 3,072 | ||||||||||||||||||||||
| Goldman Sachs MLP Energy Infrastructure Fund — Class R6 | — | 12,000,000 | — | (553,616 | ) | 11,446,384 | 748,130 | — | ||||||||||||||||||||||
Total | $ | 89,295,343 | $ | 941,564,314 | $ | (991,767,726 | ) | $ | (546,380 | ) | $ | 38,545,551 | $ | 731,430 | ||||||||||||||||
| Rising Dividend Growth | Goldman Sachs Financial Square Government Fund — Institutional Shares | $ | 117,787 | $ | 21,999,056 | $ | (21,965,059 | ) | $ | — | $ | 151,784 | 151,784 | $ | 7,236 | |||||||||||||||
| Goldman Sachs Financial Square Government Fund — Class R6 | 16,595,220 | 298,408,458 | (310,509,284 | ) | — | 4,494,394 | 4,494,394 | 90,137 | ||||||||||||||||||||||
Total | $ | 16,713,007 | $ | 320,407,514 | $ | (332,474,343 | ) | $ | — | $ | 4,646,178 | $ | 97,373 | |||||||||||||||||
| 6. PORTFOLIO SECURITIES TRANSACTIONS |
The cost of purchases and proceeds from sales and maturities of long-term securities for the fiscal year ended October 31, 2020, were:
| Fund | Purchases | Sales and Maturities | ||||||||
Income Builder | $ | 936,801,640 | $ | 731,758,656 | ||||||
Rising Dividend Growth | 233,733,771 | 466,534,718 | ||||||||
| 7. SECURITIES LENDING |
The Income Builder Fund may lend its securities through a securities lending agent, the Bank of New York Mellon (“BNYM”), to certain qualified borrowers. Pursuant to exemptive relief granted by the SEC and the terms and conditions contained therein, the Rising Dividend Growth Fund may lend its securities through a securities lending agent, Goldman Sachs Agency Lending (“GSAL”), a wholly-owned subsidiary of Goldman Sachs, to certain qualified borrowers including Goldman Sachs and affiliates. In accordance with the Funds’ securities lending procedures, the Funds receive cash collateral at least equal to the market value of the securities on loan. The market value of the loaned securities is determined at the close of business of the Funds, at their last sale
64
GOLDMAN SACHS DIVIDEND FOCUS FUNDS
| 7. SECURITIES LENDING (continued) |
price or official closing price on the principal exchange or system on which they are traded, and any additional required collateral is delivered to the Funds on the next business day. As with other extensions of credit, the Funds may experience delay in the recovery of their securities or incur a loss should the borrower of the securities breach its agreement with the Funds or become insolvent at a time when the collateral is insufficient to cover the cost of repurchasing securities on loan. Dividend income received from securities on loan may not be subject to withholding taxes and therefore withholding taxes paid may differ from the amounts listed in the Statements of Operations. Loans of securities are terminable at any time and as such 1) the remaining contractual maturities of the outstanding securities lending transactions are considered to be overnight and continuous and 2) the borrower, after notice, is required to return borrowed securities within the standard time period for settlement of securities transactions.
The Funds invest the cash collateral received in connection with securities lending transactions in the Goldman Sachs Financial Square Government Fund (“Government Money Market Fund”), an affiliated series of the Goldman Sachs Trust. The Government Money Market Fund is registered under the Act as an open end investment company, is subject to Rule 2a-7 under the Act, and is managed by GSAM, for which GSAM may receive a management fee of up to 0.16% on an annualized basis of the average daily net assets of the Government Money Market Fund.
In the event of a default by a borrower with respect to any loan, GSAL will and BNYM may exercise any and all remedies provided under the applicable borrower agreement to make the Funds whole. These remedies include purchasing replacement securities by applying the collateral held from the defaulting broker against the purchase cost of the replacement securities. If GSAL or BNYM are unable to purchase replacement securities, GSAL and/or BNYM will indemnify the Funds by paying the Funds an amount equal to the market value of the securities loaned minus the value of cash collateral received from the borrower for the loan, subject to an exclusion for any shortfalls resulting from a loss of value in such cash collateral due to reinvestment risk. The Funds’ master netting agreements with certain borrowers provide the right, in the event of a default (including bankruptcy or insolvency), for the non-defaulting party to liquidate the collateral and calculate net exposure to the defaulting party or request additional collateral. However, in the event of a default by a borrower, a resolution authority could determine that such rights are not enforceable due to the restrictions or prohibitions against the right of set-off that may be imposed in accordance with a particular jurisdiction’s bankruptcy or insolvency laws. The Funds’ loaned securities were all subject to enforceable Securities Lending Agreements and the value of the collateral was at least equal to the value of the cash received. The amounts of the Funds’ overnight and continuous agreements, which represent the gross amounts of recognized liabilities for securities lending transactions outstanding as of October 31, 2020, are disclosed as “Payable upon return of securities loaned” on the Statements of Assets and Liabilities, where applicable.
The Funds, GSAL and BNYM received compensation relating to the lending of the Funds’ securities. The amounts earned, if any, by the Funds’ for the fiscal year ended October 31, 2020, are reported under Investment Income on the Statements of Operations.
The table below details securities lending activity with affiliates of Goldman Sachs:
| For the Fiscal Year Ended October 31, 2020 | Amounts Payable to | |||||||||||||
| Fund | Earnings of GSAL Relating to Securities Loaned | Amounts Received by the Funds from Lending to Goldman Sachs | ||||||||||||
Rising Dividend Growth | $ | 12,071 | $ | — | $ | — | ||||||||
65
GOLDMAN SACHS DIVIDEND FOCUS FUNDS
Notes to Financial Statements (continued)
October 31, 2020
| 7. SECURITIES LENDING (continued) |
The following table provides information about the Funds’ investment in the Government Money Market Fund for the fiscal year ended October 31, 2020.
| Fund | Beginning value as of October 31, 2019 | Purchases at Cost | Proceeds from Sales | Ending value as of October 31, 2020 | Shares as of October 31, 2020 | |||||||||||||||||
Income Builder | $ | 92,000 | $ | 127,875,251 | $ | (127,967,251 | ) | $ | — | — | ||||||||||||
Rising Dividend Growth | — | 38,337,272 | (37,093,722 | ) | 1,243,550 | 1,243,550 | ||||||||||||||||
| 8. TAX INFORMATION |
The tax character of distributions paid during the fiscal year ended October 31, 2020 was as follows:
| Income Builder | Rising Dividend Growth | |||||||
Distributions paid from: | ||||||||
Ordinary income | $ | 56,308,398 | $ | 19,418,952 | ||||
Net long-term capital gains | — | 52,432,965 | ||||||
Total Taxable Distributions | $ | 56,308,398 | $ | 71,851,917 | ||||
Tax Return of Capital | $ | 2,074,678 | $ | — | ||||
The tax character of distributions paid during the fiscal year ended October 31, 2019 was as follows:
| Income Builder | Rising Dividend Growth | |||||||
Distributions paid from: | ||||||||
Ordinary income | $ | 59,613,529 | $ | 15,524,354 | ||||
Net long-term capital gains | — | 516,474,079 | ||||||
Total Taxable Distributions | $ | 59,613,529 | $ | 531,998,433 | ||||
Tax Return of Capital | $ | — | $ | — | ||||
66
GOLDMAN SACHS DIVIDEND FOCUS FUNDS
| 8. TAX INFORMATION (continued) |
As of October 31, 2020, the components of accumulated earnings (losses) on a tax basis were as follows:
| Income Builder | Rising Dividend Growth | |||||||
Undistributed ordinary income — net | $ | — | $ | 9,267,339 | ||||
Undistributed long-term capital gains | — | 1,822,049 | ||||||
Total undistributed earnings | $ | — | $ | 11,089,388 | ||||
Capital loss carryforwards:(1) | ||||||||
Perpetual Short-Term | $ | (597,071 | ) | $ | — | |||
Perpetual Long-Term | (20,303,770 | ) | — | |||||
Total capital loss carryforwards | $ | (20,900,841 | ) | $ | — | |||
Timing differences (Straddle Loss Deferral and Defaulted Bonds) | $ | (170,593 | ) | $ | (12,450,322 | ) | ||
Unrealized gains — net | 81,564,652 | 56,022,468 | ||||||
Total accumulated earnings net | $ | 60,493,218 | $ | 54,661,534 | ||||
| (1) | The Income Builder Fund utilized $3,061,184 of capital losses. |
As of October 31, 2020, the Funds’ aggregate security unrealized gains and losses based on cost for U.S. federal income tax purposes were as follows:
| Income Builder | Rising Dividend Growth | |||||||||
Tax Cost | $ | 1,585,156,690 | $ | 388,112,067 | ||||||
Gross unrealized gain | 137,007,234 | 89,277,902 | ||||||||
Gross unrealized loss | (55,442,582 | ) | (33,255,434 | ) | ||||||
Net unrealized gains (losses) | $ | 81,564,652 | $ | 56,022,468 | ||||||
The difference between GAAP-basis and tax basis unrealized gains (losses) is attributable primarily to wash sales, net mark to market gains (losses) on regulated futures contracts and foreign currency contracts, and differences to the tax treatment of underlying fund investments, partnership investments, and material modification of debt securities.
The Rising Dividend Growth Fund reclassed $267,349 from paid in capital to distributable earnings, for the year ending October 31, 2020. In order to present certain components of the Funds’ capital accounts on a tax-basis, certain reclassifications have been recorded to the Funds’ accounts. These reclassifications have no impact on the net asset value of the Funds’ and result primarily from differences in the tax treatment of partnership investments.
GSAM has reviewed the Funds’ tax positions for all open tax years (the current and prior three years, as applicable) and has concluded that no provision for income tax is required in the Funds’ financial statements. Such open tax years remain subject to examination and adjustment by tax authorities.
| 9. OTHER RISKS |
The Funds’ risks include, but are not limited to, the following:
Derivatives Risk — The Funds’ use of derivatives may result in loss. Derivative instruments, which may pose risks in addition to and greater than those associated with investing directly in securities, currencies or other instruments, may be illiquid or less liquid, volatile, difficult to price and leveraged so that small changes in the value of the underlying instruments may produce
67
GOLDMAN SACHS DIVIDEND FOCUS FUNDS
Notes to Financial Statements (continued)
October 31, 2020
| 9. OTHER RISKS (continued) |
disproportionate losses to the Funds. Derivatives are also subject to counterparty risk, which is the risk that the other party in the transaction will not fulfill its contractual obligation. The use of derivatives is a highly specialized activity that involves investment techniques and risks different from those associated with investments in more traditional securities and instruments. Losses from derivatives can also result from a lack of correlation between changes in the value of derivative instruments and the portfolio assets (if any) being hedged.
Dividend-Paying Investments Risk — A Fund’s investments in dividend-paying securities could cause a Fund to underperform other funds. Securities that pay dividends, as a group, can fall out of favor with the market, causing such securities to underperform securities that do not pay dividends. Depending upon market conditions and political and legislative responses to such conditions, dividend-paying securities that meet a Fund’s investment criteria may not be widely available and/or may be highly concentrated in only a few market sectors. In addition, issuers that have paid regular dividends or distributions to shareholders may not continue to do so at the same level or at all in the future. This may limit the ability of a Fund to produce current income
Floating and Variable Rate Obligations Risk — Floating rate and variable rate obligations are debt instruments issued by companies or other entities with interest rates that reset periodically (typically, daily, monthly, quarterly, or semiannually) in response to changes in the market rate of interest on which the interest rate is based. For floating and variable rate obligations, there may be a lag between an actual change in the underlying interest rate benchmark and the reset time for an interest payment of such an obligation, which could harm or benefit the Income Builder Fund, depending on the interest rate environment or other circumstances. In a rising interest rate environment, for example, a floating or variable rate obligation that does not reset immediately would prevent the Fund from taking full advantage of rising interest rates in a timely manner. However, in a declining interest rate environment, the Fund may benefit from a lag due to an obligation’s interest rate payment not being immediately impacted by a decline in interest rates.
In 2017, the United Kingdom’s Financial Conduct Authority (“FCA”) warned that LIBOR may cease to be available or appropriate for use by 2021. The unavailability or replacement of LIBOR may affect the value, liquidity or return on certain Fund investments and may result in costs incurred in connection with closing out positions and entering into new trades. Any pricing adjustments to the Fund’s investments resulting from a substitute reference rate may also adversely affect the Fund’s performance and/or NAV.
Foreign Countries Risk — Investing in foreign markets may involve special risks and considerations not typically associated with investing in the United States. Foreign securities may be subject to risk of loss because of more or less foreign government regulation, less public information and less economic, political and social stability in the countries in which a Fund invests. The imposition of exchange controls (including repatriation restrictions), confiscation of assets and property, trade restrictions (including tariffs) and other government restrictions by the United States or other governments, or from problems in share registration, settlement or custody, may also result in losses. Foreign risk also involves the risk of negative foreign currency rate fluctuations, which may cause the value of securities denominated in such foreign currency (or other instruments through which a Fund has exposure to foreign currencies) to decline in value. Currency exchange rates may fluctuate significantly over short periods of time.
Foreign Custody Risk — If a Fund invests in foreign securities, the Fund may hold such securities and cash with foreign banks, agents, and securities depositories appointed by the Fund’s custodian (each a “Foreign Custodian”). Some foreign custodians may be recently organized or new to the foreign custody business. In some countries, Foreign Custodians may be subject to little or no regulatory oversight over, or independent evaluation of, their operations. Further, the laws of certain countries may place limitations on a Fund’s ability to recover its assets if a Foreign Custodian enters bankruptcy.
Interest Rate Risk — When interest rates increase, fixed income securities or instruments held by a Fund will generally decline in value. Long-term fixed income securities or instruments will normally have more price volatility because of this risk than short-term fixed income securities or instruments. The risks associated with changing interest rates may have unpredictable effects on the markets and a Fund’s investments. Fluctuations in interest rates may also affect the liquidity of fixed income securities and instruments held by the Funds.
68
GOLDMAN SACHS DIVIDEND FOCUS FUNDS
| 9. OTHER RISKS (continued) |
Investments in Other Investment Companies Risk — As a shareholder of another investment company, a Fund will indirectly bear its proportionate share of any net management fees and other expenses paid by such other investment companies, in addition to the fees and expenses regularly borne by the Fund.
Large Shareholder Transactions Risk — A Fund may experience adverse effects when certain large shareholders, such as other funds, institutional investors (including those trading by use of non-discretionary mathematical formulas), financial intermediaries (who may make investment decisions on behalf of underlying clients and/or include a Fund in their investment model), individuals, accounts and Goldman Sachs affiliates, purchase or redeem large amounts of shares of a Fund. Such large shareholder redemptions, which may occur rapidly or unexpectedly, may cause a Fund to sell portfolio securities at times when it would not otherwise do so, which may negatively impact a Fund’s NAV and liquidity. These transactions may also accelerate the realization of taxable income to shareholders if such sales of investments resulted in gains, and may also increase transaction costs. In addition, a large redemption could result in a Fund’s current expenses being allocated over a smaller asset base, leading to an increase in the Fund’s expense ratio. Similarly, large Fund share purchases may adversely affect a Fund’s performance to the extent that the Fund is delayed in investing new cash or otherwise maintains a larger cash position than it ordinarily would.
Liquidity Risk — A Fund may make investments that are illiquid or that may become less liquid in response to market developments or adverse investor perceptions. Illiquid investments may be more difficult to value. Liquidity risk may also refer to the risk that a Fund will not be able to pay redemption proceeds within the allowable time period or without significant dilution to remaining investors’ interests because of unusual market conditions, an unusually high volume of redemption requests, or other reasons. To meet redemption requests, a Fund may be forced to sell investments at an unfavorable time and/or under unfavorable conditions. If a Fund is forced to sell securities at an unfavorable time and/or under unfavorable conditions, such sales may adversely affect the Fund’s NAV and dilute remaining investors’ interests. Liquidity risk may be the result of, among other things, the reduced number and capacity of traditional market participants to make a market in fixed income securities or the lack of an active market. The potential for liquidity risk may be magnified by a rising interest rate environment or other circumstances where investor redemptions from fixed income mutual funds may be higher than normal, potentially causing increased supply in the market due to selling activity. These risks may be more pronounced in connection with a Fund’s investments in securities of issuers located in emerging market countries. Redemptions by large shareholders may have a negative impact on a Fund’s liquidity.
Loan-Related Investments Risk — In addition to risks generally associated with debt investments (e.g., interest rate risk and default risk), loan-related investments such as loan participations and assignments are subject to other risks. Although a loan obligation may be fully collateralized at the time of acquisition, the collateral may decline in value, be or become illiquid or less liquid, or lose all or substantially all of its value subsequent to investment. Many loan investments are subject to legal or contractual restrictions on resale and certain loan investments may be or become illiquid or less liquid and more difficult to value, particularly in the event of a downgrade of the loan or the borrower. There is less readily available, reliable information about most loan investments than is the case for many other types of securities. Substantial increases in interest rates may cause an increase in loan obligation defaults. With respect to loan participations, the Fund may not always have direct recourse against a borrower if the borrower fails to pay scheduled principal and/or interest; may be subject to greater delays, expenses and risks than if the Fund had purchased a direct obligation of the borrower; and may be regarded as the creditor of the agent lender (rather than the borrower), subjecting the Fund to the creditworthiness of that lender as well. Investors in loans, such as the Fund, may not be entitled to rely on the anti-fraud protections of the federal securities laws, although they may be entitled to certain contractual remedies. The market for loan obligations may be subject to irregular trading activity, wide bid/ask spreads and extended trade settlement periods. Because transactions in many loans are subject to extended trade settlement periods, the Fund may not receive the proceeds from the sale of a loan for a period after the sale. As a result, sale proceeds related to the sale of loans may not be available to make additional investments or to meet the Fund’s redemption obligations for a period after the sale of the loans, and, as a result, the Fund may have to sell other investments or engage in borrowing transactions, such as borrowing from its credit facility, if necessary to raise cash to meet its obligations.
69
GOLDMAN SACHS DIVIDEND FOCUS FUNDS
Notes to Financial Statements (continued)
October 31, 2020
| 9. OTHER RISKS (continued) |
Senior Loans hold the most senior position in the capital structure of a business entity, and are typically secured with specific collateral, but are nevertheless usually rated below investment grade. Because Second Lien Loans are subordinated or unsecured and thus lower in priority of payment to Senior Loans, they are subject to the additional risk that the cash flow of the borrower and property securing the loan or debt, if any, may be insufficient to meet scheduled payments after giving effect to the senior secured obligations of the borrower. Second Lien Loans generally have greater price volatility than Senior Loans and may be less liquid.
Market and Credit Risks — In the normal course of business, a Fund trades financial instruments and enters into financial transactions where risk of potential loss exists due to changes in the market (market risk). The value of the securities in which a Fund invests may go up or down in response to the prospects of individual companies, particular sectors or governments and/or general economic conditions throughout the world due to increasingly interconnected global economies and financial markets. Events such as war, acts of terrorism, social unrest, natural disasters, the spread of infectious illness or other public health threats could also significantly impact a Fund and its investments Additionally, a Fund may also be exposed to credit risk in the event that an issuer or guarantor fails to perform or that an institution or entity with which the Fund has unsettled or open transactions defaults.
Master Limited Partnership Risk — Investments in securities of MLPs involve risks that differ from investments in common stock, including risks related to limited control and limited rights to vote on matters affecting the MLP, risks related to potential conflicts of interest between the MLP and the MLP’s general partner, cash flow risks, dilution risks, limited liquidity and risks related to the general partner’s right to require unit-holders to sell their common units at an undesirable time or price.
Short Position Risk — The Funds may enter into a short position through a futures contract, an option or swap agreement or through short sales of any instrument that the Funds may purchase for investment. Taking short positions involves leverage of the Funds’ assets and presents various risks, including counterparty risk. If the value of the underlying instrument or market in which the Funds have taken a short position increases, then the Funds will incur a loss equal to the increase in value from the time that the short position was entered into plus any related interest payments or other fees. Taking short positions involves the risk that losses may be disproportionate, may exceed the amount invested, and may be unlimited. To the extent that the Funds use the proceeds they receive from a short position to take additional long positions, the risks associated with the short position, including leverage risks, may be heightened, because doing so increases the exposure of the Funds to the markets and therefore could magnify changes to the Funds’ NAV.
| 10. INDEMNIFICATIONS |
Under the Trust’s organizational documents, its Trustees, officers, employees and agents are indemnified, to the extent permitted by the Act and state law, against certain liabilities that may arise out of performance of their duties to the Funds. Additionally, in the course of business, the Funds enter into contracts that contain a variety of indemnification clauses. The Funds’ maximum exposure under these arrangements is unknown, as this would involve future claims that may be made against the Funds that have not yet occurred. However, GSAM believes the risk of loss under these arrangements to be remote.
| 11. OTHER MATTERS |
The Income Builder Fund has adopted Financial Accounting Standards Board Accounting Standards Update 2017-08 to amend the amortization period for certain purchased callable debt securities held at a premium. Under the new standard, the Fund has changed the amortization period for the premium on certain purchased callable debt securities with non-contingent call features to the earliest call date. In accordance with the transition provisions of the standard, the Funds applied the amendments on a modified retrospective basis beginning with the fiscal year ended October 31, 2020. This change in accounting policy has been made to comply with the newly issued accounting standard and had no impact on total distributable earnings (loss) or the net asset value of the Fund. Upon evaluation, GSAM has concluded that the change in accounting principle does not materially impact the financial statement amounts.
70
GOLDMAN SACHS DIVIDEND FOCUS FUNDS
| 11. OTHER MATTERS (continued) |
In March 2020, the FASB issued Accounting Standard Update (“ASU”) No. 2020-04, “Reference Rate Reform (Topic 848): Facilitation of the Effects of Reference Rate Reform on Financial Reporting.” This ASU provides optional exceptions for applying GAAP to contract modifications, hedging relationships and other transactions affected reference rate reform if certain criteria are met. ASU 2020-04 is elective and is effective on March 12, 2020 through December 31, 2022. As of the financial reporting date, GSAM is currently evaluating the impact, if any, of applying ASU 2020-04.
On October 22, 2020, Goldman Sachs announced a settlement of matters involving 1Malaysia Development Bhd. (1MDB), a Malaysian sovereign wealth fund, with the United States Department of Justice as well as criminal and civil authorities in the UK, Singapore and Hong Kong. Further information regarding the 1MDB settlement can be found at https://www.goldmansachs.com/media-relations/press-releases/current/goldman-sachs-2020-10-22.html. The 1MDB settlement will not materially adversely affect GSAM’s ability to serve as investment manager.
| 12. SUBSEQUENT EVENTS |
Subsequent events after the Statements of Assets and Liabilities date have been evaluated, and GSAM has concluded that there is no impact requiring adjustment or disclosure in the financial statements.
71
GOLDMAN SACHS DIVIDEND FOCUS FUNDS
Notes to Financial Statements (continued)
October 31, 2020
| 13. SUMMARY OF SHARE TRANSACTIONS |
Share activity is as follows:
| Income Builder Fund | ||||||||||||||||
|
| |||||||||||||||
| For the Fiscal Year Ended October 31, 2020 | For the Fiscal Year Ended October 31, 2019 | |||||||||||||||
|
| |||||||||||||||
| Shares | Dollars | Shares | Dollars | |||||||||||||
|
| |||||||||||||||
| Class A Shares |
| |||||||||||||||
Shares sold | 3,444,417 | $ | 81,075,795 | 1,799,656 | $ | 40,853,964 | ||||||||||
Reinvestment of distributions | 425,053 | 9,849,705 | 473,912 | 10,712,396 | ||||||||||||
Shares redeemed | (3,157,946 | ) | (72,889,213 | ) | (3,259,093 | ) | (72,590,615 | ) | ||||||||
| 711,524 | 18,036,287 | (985,525 | ) | (21,024,255 | ) | |||||||||||
| Class C Shares | ||||||||||||||||
Shares sold | 1,789,841 | 41,157,194 | 2,010,857 | 44,464,284 | ||||||||||||
Reinvestment of distributions | 465,379 | 10,575,196 | 569,398 | 12,640,806 | ||||||||||||
Shares redeemed | (5,623,116 | ) | (127,931,312 | ) | (4,986,655 | ) | (109,946,008 | ) | ||||||||
| (3,367,896 | ) | (76,198,922 | ) | (2,406,400 | ) | (52,840,918 | ) | |||||||||
| Institutional Shares | ||||||||||||||||
Shares sold | 12,873,547 | 308,323,535 | 7,470,375 | 173,813,483 | ||||||||||||
Reinvestment of distributions | 825,771 | 19,554,766 | 865,254 | 19,941,926 | ||||||||||||
Shares redeemed | (10,911,901 | ) | (251,978,866 | ) | (13,897,580 | ) | (318,459,334 | ) | ||||||||
| 2,787,417 | 75,899,435 | (5,561,951 | ) | (124,703,925 | ) | |||||||||||
| Investor Shares | ||||||||||||||||
Shares sold | 4,058,729 | 96,589,681 | 4,827,414 | 111,049,360 | ||||||||||||
Reinvestment of distributions | 400,544 | 9,472,182 | 390,392 | 8,998,199 | ||||||||||||
Shares redeemed | (4,607,546 | ) | (105,650,306 | ) | (5,145,695 | ) | (116,297,027 | ) | ||||||||
| (148,273 | ) | 411,557 | 72,111 | 3,750,532 | ||||||||||||
| Class R6 Shares | ||||||||||||||||
Shares sold | 2,479,595 | 60,768,260 | 611,262 | 13,568,669 | ||||||||||||
Reinvestment of distributions | 81,840 | 1,929,138 | 13,716 | 320,777 | ||||||||||||
Shares redeemed | (268,437 | ) | (5,872,640 | ) | (197,660 | ) | (4,529,061 | ) | ||||||||
| 2,292,998 | 56,824,758 | 427,318 | 9,360,385 | |||||||||||||
| Class P Shares | ||||||||||||||||
Shares sold | 432,334 | 10,475,567 | 95,414 | 2,230,065 | ||||||||||||
Reinvestment of distributions | 24,175 | 575,637 | 22,699 | 523,868 | ||||||||||||
Shares redeemed | (346,748 | ) | (8,150,793 | ) | (271,094 | ) | (6,089,236 | ) | ||||||||
| 109,761 | 2,900,411 | (152,981 | ) | (3,335,303 | ) | |||||||||||
NET INCREASE (DECREASE) | 2,385,531 | $ | 77,873,526 | (8,607,428 | ) | $ | (188,793,484 | ) | ||||||||
72
GOLDMAN SACHS DIVIDEND FOCUS FUNDS
| 13. SUMMARY OF SHARE TRANSACTIONS (continued) |
| Rising Dividend Growth Fund | ||||||||||||||||
|
| |||||||||||||||
| For the Fiscal Year Ended October 31, 2020 | For the Fiscal Year Ended October 31, 2019 | |||||||||||||||
|
| |||||||||||||||
| Shares | Dollars | Shares | Dollars | |||||||||||||
|
| |||||||||||||||
| Class A Shares | ||||||||||||||||
Shares sold | 3,175,610 | $ | 31,136,025 | 3,875,656 | $ | 41,704,284 | ||||||||||
Reinvestment of distributions | 2,003,644 | 20,863,785 | 11,404,340 | 115,817,078 | ||||||||||||
Shares redeemed | (6,706,465 | ) | (64,982,419 | ) | (11,867,123 | ) | (144,815,996 | ) | ||||||||
| (1,527,211 | ) | (12,982,609 | ) | 3,412,873 | 12,705,366 | |||||||||||
| Class C Shares | ||||||||||||||||
Shares sold | 382,059 | 3,978,768 | 1,990,737 | 21,306,015 | ||||||||||||
Reinvestment of distributions | 1,518,795 | 16,217,447 | 12,146,115 | 124,900,331 | ||||||||||||
Shares redeemed | (8,109,150 | ) | (81,750,482 | ) | (14,700,253 | ) | (176,996,871 | ) | ||||||||
| (6,208,296 | ) | (61,554,267 | ) | (563,401 | ) | (30,790,525 | ) | |||||||||
| Institutional Shares | ||||||||||||||||
Shares sold | 1,544,449 | 16,238,584 | 6,366,869 | 88,407,748 | ||||||||||||
Reinvestment of distributions | 1,387,802 | 15,267,883 | 12,457,809 | 132,953,032 | ||||||||||||
Shares redeemed | (9,828,045 | ) | (100,369,325 | ) | (23,734,594 | ) | (312,316,042 | ) | ||||||||
| (6,895,794 | ) | (68,862,858 | ) | (4,909,916 | ) | (90,955,262 | ) | |||||||||
| Investor Shares | ||||||||||||||||
Shares sold | 762,746 | 8,117,415 | 1,916,994 | 22,095,019 | ||||||||||||
Reinvestment of distributions | 951,261 | 10,450,296 | 7,878,882 | 83,943,748 | ||||||||||||
Shares redeemed | (4,485,749 | ) | (46,586,109 | ) | (12,134,679 | ) | (156,756,382 | ) | ||||||||
| (2,771,742 | ) | (28,018,398 | ) | (2,338,803 | ) | (50,717,615 | ) | |||||||||
| Class R6 Shares | ||||||||||||||||
Shares sold | 68,556 | 711,516 | 260,151 | 2,816,993 | ||||||||||||
Reinvestment of distributions | 21,891 | 239,578 | 5,071 | 57,671 | ||||||||||||
Shares redeemed | (100,789 | ) | (1,045,464 | ) | (75,304 | ) | (862,540 | ) | ||||||||
| (10,342 | ) | (94,370 | ) | 189,918 | 2,012,124 | |||||||||||
| Class R Shares | ||||||||||||||||
Shares sold | 18,344 | 182,661 | 89,215 | 955,086 | ||||||||||||
Reinvestment of distributions | 22,024 | 229,741 | 110,225 | 1,113,855 | ||||||||||||
Shares redeemed | (155,750 | ) | (1,592,357 | ) | (146,729 | ) | (1,739,234 | ) | ||||||||
| (115,382 | ) | (1,179,955 | ) | 52,711 | 329,707 | |||||||||||
| Class P Shares | ||||||||||||||||
Shares sold | 64,197 | 643,263 | 17,063 | 209,619 | ||||||||||||
Reinvestment of distributions | 167,433 | 1,854,725 | 1,531,128 | 16,342,234 | ||||||||||||
Shares redeemed | (1,280,451 | ) | (13,288,125 | ) | (1,793,344 | ) | (22,149,574 | ) | ||||||||
| (1,048,821 | ) | (10,790,137 | ) | (245,153 | ) | (5,597,721 | ) | |||||||||
NET DECREASE | (18,577,588 | ) | $ | (183,482,594 | ) | (4,401,771 | ) | $ | (163,013,926 | ) | ||||||
73
Report of Independent Registered Public
Accounting Firm
To the Board of Trustees of Goldman Sachs Trust and Shareholders of Goldman Sachs Income Builder Fund and Goldman Sachs Rising Dividend Growth Fund
Opinions on the Financial Statements
We have audited the accompanying statements of assets and liabilities, including the schedules of investments, of Goldman Sachs Income Builder Fund and Goldman Sachs Rising Dividend Growth Fund (two of the funds constituting Goldman Sachs Trust, hereafter collectively referred to as the “Funds”) as of October 31, 2020, the related statements of operations for the year ended October 31, 2020, the statements of changes in net assets for each of the two years in the period ended October 31, 2020, including the related notes, and the financial highlights for each of the periods indicated therein (collectively referred to as the “financial statements”). In our opinion, the financial statements present fairly, in all material respects, the financial position of each of the Funds as of October 31, 2020, the results of each of their operations for the year then ended, the changes in each of their net assets for each of the two years in the period ended October 31, 2020 and each of the financial highlights for each of the periods indicated therein in conformity with accounting principles generally accepted in the United States of America.
Basis for Opinions
These financial statements are the responsibility of the Funds’ management. Our responsibility is to express an opinion on the Funds’ financial statements based on our audits. We are a public accounting firm registered with the Public Company Accounting Oversight Board (United States) (PCAOB) and are required to be independent with respect to the Funds in accordance with the U.S. federal securities laws and the applicable rules and regulations of the Securities and Exchange Commission and the PCAOB.
We conducted our audits of these financial statements in accordance with the standards of the PCAOB. Those standards require that we plan and perform the audit to obtain reasonable assurance about whether the financial statements are free of material misstatement, whether due to error or fraud.
Our audits included performing procedures to assess the risks of material misstatement of the financial statements, whether due to error or fraud, and performing procedures that respond to those risks. Such procedures included examining, on a test basis, evidence regarding the amounts and disclosures in the financial statements. Our audits also included evaluating the accounting principles used and significant estimates made by management, as well as evaluating the overall presentation of the financial statements. Our procedures included confirmation of securities owned as of October 31, 2020 by correspondence with the custodian, transfer agent and brokers; when replies were not received from brokers, we performed other auditing procedures. We believe that our audits provide a reasonable basis for our opinions.
/s/PricewaterhouseCoopers LLP
Boston, Massachusetts
December 23, 2020
We have served as the auditor of one or more investment companies in the Goldman Sachs fund complex since 2000.
74
GOLDMAN SACHS DIVIDEND FOCUS FUNDS
Voting Results of Special Meeting of Shareholders (Unaudited)
A Special Meeting (the “Meeting”) of the Goldman Sachs Trust (“GST”) was held on January 23, 2020 to consider and act upon the proposals below. The Funds have amortized their respective share of the proxy, shareholder meeting and other related costs and GSAM has agreed to reimburse the Funds to the extent such expenses exceed a specified percentage of the Funds’ net assets.
At the Meeting, Dwight L. Bush, Kathryn A. Cassidy, Joaquin Delgado and Gregory G. Weaver were elected to the Trust’s Board of Trustees. In electing trustees, the Trust’s shareholders voted as follows:
Proposal 1. Election of Trustees | For | Against | Withheld | Broker Non-Votes | ||||||||||||
Dwight L. Bush | 94,278,961,728.065 | 0 | 349,026,343.365 | 0 | ||||||||||||
Kathryn A. Cassidy | 94,310,850,789.164 | 0 | 317,137,282.266 | 0 | ||||||||||||
Joaquin Delgado | 94,282,646,444.727 | 0 | 345,341,626.703 | 0 | ||||||||||||
Gregory G. Weaver | 94,306,589,873.348 | 0 | 321,398,198.082 | 0 | ||||||||||||
75
GOLDMAN SACHS DIVIDEND FOCUS FUNDS
As a shareholder of Class A, Class C, Institutional, Investor, Class R6, Class R and Class P Shares of a Fund, you incur two types of costs: (1) transaction costs, including sales charges on purchase payments (with respect to Class A Shares), contingent deferred sales charges on redemptions (with respect to Class C Shares), and (2) ongoing costs, including management fees; distribution and/or service (12b-1) fees (with respect to Class A, Class C and Class R Shares); and other Fund expenses. This Example is intended to help you understand your ongoing costs (in dollars) of investing in Class A, Class C, Institutional, Investor, Class R6, Class R or Class P Shares of the Funds and to compare these costs with the ongoing costs of investing in other mutual funds.
The Example is based on an investment of $1,000 invested at the beginning of the period and held for the entire period from May 1, 2020 through October 31, 2020, which represents a period of 184 days in a 365 day year.
Actual Expenses — The first line under each share class in the table below provides information about actual account values and actual expenses. You may use the information in this line, together with the amount you invested, to estimate the expenses that you paid over the period. Simply divide your account value by $1,000 (for example, an $8,600 account value divided by $1,000=8.6), then multiply the result by the number in the first line under the heading entitled “Expenses Paid” to estimate the expenses you paid on your account during this period.
Hypothetical Example for Comparison Purposes — The second line under each share class in the table below provides information about hypothetical account values and hypothetical expenses based on the Funds’ actual net expense ratios and an assumed rate of return of 5% per year before expenses, which is not the Funds’ actual return. The hypothetical account values and expenses may not be used to estimate the actual ending account balance or expenses you paid for the period. You may use this information to compare the ongoing costs of investing in the Funds and other funds. To do so, compare this 5% hypothetical example with the 5% hypothetical examples that appear in the shareholder reports of the other funds.
Please note that the expenses shown in the table are meant to highlight your ongoing costs only and do not reflect any transactional costs, such as sales charges, redemption fees, or exchange fees. Therefore, the second line of the table is useful in comparing ongoing costs only, and will not help you determine the relative total costs of owning different funds. In addition, if these transactional costs were included, your costs would have been higher:
| Income Builder Fund | Rising Dividend Growth Fund | |||||||||||||||||||||||
| Share Class | Beginning Account Value 5/1/20 | Ending Account Value 10/31/20 | Expenses Paid for the 6 months ended 10/31/20* | Beginning Account Value 5/1/20 | Ending Account Value 10/31/20 | Expenses Paid for the 6 months ended 10/31/20* | ||||||||||||||||||
| Class A | ||||||||||||||||||||||||
Actual | $ | 1,000.00 | $ | 1,084.80 | $ | 4.51 | $ | 1,000.00 | $ | 1,122.70 | $ | 5.66 | ||||||||||||
Hypothetical 5% return | 1,000.00 | 1,020.81 | + | 4.37 | 1,000.00 | 1,019.81 | + | 5.38 | ||||||||||||||||
| Class C | ||||||||||||||||||||||||
Actual | 1,000.00 | 1,081.30 | 8.48 | 1,000.00 | 1,119.20 | 9.64 | ||||||||||||||||||
Hypothetical 5% return | 1,000.00 | 1,016.99 | + | 8.21 | 1,000.00 | 1,016.04 | + | 9.17 | ||||||||||||||||
| Institutional | ||||||||||||||||||||||||
Actual | 1,000.00 | 1,086.90 | 2.73 | 1,000.00 | 1,125.10 | 4.01 | ||||||||||||||||||
Hypothetical 5% return | 1,000.00 | 1,022.52 | + | 2.64 | 1,000.00 | 1,021.37 | + | 3.81 | ||||||||||||||||
| Investor | ||||||||||||||||||||||||
Actual | 1,000.00 | 1,086.20 | 3.25 | 1,000.00 | 1,125.00 | 4.33 | ||||||||||||||||||
Hypothetical 5% return | 1,000.00 | 1,022.02 | + | 3.15 | 1,000.00 | 1,021.06 | + | 4.12 | ||||||||||||||||
| Class R6 | ||||||||||||||||||||||||
Actual | 1,000.00 | 1,087.00 | 2.68 | 1,000.00 | 1,125.30 | 3.95 | ||||||||||||||||||
Hypothetical 5% return | 1,000.00 | 1,022.57 | + | 2.59 | 1,000.00 | 1,021.42 | + | 3.76 | ||||||||||||||||
| Class R | ||||||||||||||||||||||||
Actual | N/A | N/A | N/A | 1,000.00 | 1,121.70 | 6.99 | ||||||||||||||||||
Hypothetical 5% return | N/A | N/A | N/A | 1,000.00 | 1,018.55 | + | 6.65 | |||||||||||||||||
| Class P | ||||||||||||||||||||||||
Actual | 1,000.00 | 1,087.00 | 2.68 | 1,000.00 | 1,125.20 | 3.95 | ||||||||||||||||||
Hypothetical 5% return | 1,000.00 | 1,022.57 | + | 2.59 | 1,000.00 | 1,021.42 | + | 3.76 | ||||||||||||||||
| * | Expenses for each share class are calculated using each Fund’s annualized net expense ratio for each class, which represents the ongoing expenses as a percentage of net assets for the six months ended October 31, 2020. Expenses are calculated by multiplying the annualized net expense ratio by the average account value for the period; then multiplying the result by the number of days in the most recent fiscal half year; and then dividing that result by the number of days in the fiscal year. The annualized net expense ratios for the period were as follows: |
| Fund | Class A | Class C | Institutional | Investor | Class R6 | Class R | Class P | |||||||||||||||||||||
Income Builder | 0.86 | % | 1.62 | % | 0.52 | % | 0.62 | % | 0.51 | % | N/A | 0.51 | % | |||||||||||||||
Rising Dividend Growth | 1.06 | 1.81 | 0.75 | 0.81 | 0.74 | 1.31 | % | 0.74 | ||||||||||||||||||||
| + | Hypothetical expenses are based on each Fund’s actual annualized net expense ratios and an assumed rate of return of 5% per year before expenses. |
76
GOLDMAN SACHS DIVIDEND FOCUS FUNDS
Statement Regarding Basis for Approval of Management Agreement (Unaudited)
Background
The Goldman Sachs Income Builder Fund and Goldman Sachs Rising Dividend Growth Fund (the “Funds”) are investment portfolios of Goldman Sachs Trust (the “Trust”). The Board of Trustees oversees the management of the Trust and reviews the investment performance and expenses of the Funds at regularly scheduled meetings held throughout the year. In addition, the Board of Trustees determines annually whether to approve the continuance of the Trust’s investment management agreement (the “Management Agreement”) with Goldman Sachs Asset Management, L.P. (the “Investment Adviser”) on behalf of the Funds.
The Management Agreement was most recently approved for continuation until June 30, 2021 by the Board of Trustees, including those Trustees who are not parties to the Management Agreement or “interested persons” (as defined in the Investment Company Act of 1940, as amended) of any party thereto (the “Independent Trustees”), at a meeting held on June 16-17, 2020 (the “Annual Meeting”).
The review process undertaken by the Trustees spans the course of the year and culminates with the Annual Meeting. To assist the Trustees in their deliberations, the Trustees have established a Contract Review Committee (the “Committee”), comprised of the Independent Trustees. The Committee held two meetings over the course of the year since the Management Agreement was last approved. At those Committee meetings, regularly scheduled Board or other committee meetings, and/or the Annual Meeting, matters relevant to the renewal of the Management Agreement were considered by the Board, or the Independent Trustees, as applicable. With respect to each Fund, such matters included:
| (a) | the nature and quality of the advisory, administrative, and other services provided to the Fund by the Investment Adviser and its affiliates, including information about: |
| (i) | the structure, staff, and capabilities of the Investment Adviser and its portfolio management teams; |
| (ii) | the groups within the Investment Adviser and its affiliates that support the portfolio management teams or provide other types of necessary services, including fund services groups (e.g., accounting and financial reporting, tax, shareholder services, and operations); controls and risk management groups (e.g., legal, compliance, valuation oversight, credit risk management, internal audit, compliance testing, market risk analysis, finance, and central funding); sales and distribution support groups, and others (e.g., information technology and training); |
| (iii) | trends in employee headcount; |
| (iv) | the Investment Adviser’s financial resources and ability to hire and retain talented personnel and strengthen its operations; and |
| (v) | the parent company’s support of the Investment Adviser and its mutual fund business, as expressed by the firm’s senior management; |
| (b) | information on the investment performance of the Fund, including comparisons to the performance of similar mutual funds, as provided by a third-party mutual fund data provider engaged as part of the contract review process (the “Outside Data Provider”), a benchmark performance index; and information on general investment outlooks in the markets in which the Fund invests; |
| (c) | information provided by the Investment Adviser indicating the Investment Adviser’s views on whether the Fund’s peer group and/or benchmark index had high, medium, or low relevance given the Fund’s particular investment strategy; |
| (d) | the terms of the Management Agreement and other agreements with affiliated service providers entered into by the Trust on behalf of the Fund; |
| (e) | fee and expense information for the Fund, including: |
| (i) | the relative management fee and expense levels of the Fund as compared to those of comparable funds managed by other advisers, as provided by the Outside Data Provider; |
| (ii) | the Fund’s expense trends over time; and |
| (iii) | to the extent the Investment Adviser manages other types of accounts (such as bank collective trusts, private wealth management accounts, institutional separate accounts, sub-advised mutual funds, and non-U.S. funds) having investment objectives and policies similar to those of the Fund, comparative information on the advisory fees charged and services provided to those accounts by the Investment Adviser; |
| (f) | with respect to the extensive investment performance and expense comparison data provided by the Outside Data Provider, its processes in producing that data for the Fund; |
| (g) | the undertakings of the Investment Adviser and its affiliates to implement fee waivers and/or expense limitations; |
| (h) | information relating to the profitability of the Management Agreement and the transfer agency and distribution and service arrangements of the Fund to the Investment Adviser and its affiliates; |
| (i) | whether the Fund’s existing management fee schedule adequately addressed any economies of scale; |
77
GOLDMAN SACHS DIVIDEND FOCUS FUNDS
Statement Regarding Basis for Approval of Management Agreement (Unaudited) (continued)
| (j) | a summary of the “fall-out” benefits derived by the Investment Adviser and its affiliates from their relationships with the Fund, including the fees received by the Investment Adviser’s affiliates from the Fund for transfer agency, securities lending (with respect to the Rising Dividend Growth Fund), portfolio trading, distribution and other services; |
| (k) | a summary of potential benefits derived by the Fund as a result of its relationship with the Investment Adviser; |
| (l) | information regarding commissions paid by the Fund and broker oversight, an update on the Investment Adviser’s soft dollars practices (with respect to the Income Builder Fund), other information regarding portfolio trading, and how the Investment Adviser carries out its duty to seek best execution; |
| (m) | portfolio manager ownership of Fund shares; the manner in which portfolio manager compensation is determined; and the number and types of accounts managed by the portfolio managers; |
| (n) | the nature and quality of the services provided to the Fund by its unaffiliated service providers, and the Investment Adviser’s general oversight and evaluation (including reports on due diligence) of those service providers as part of the administrative services provided under the Management Agreement; and |
| (o) | the Investment Adviser’s processes and policies addressing various types of potential conflicts of interest; its approach to risk management; the annual review of the effectiveness of the Fund’s compliance program; and periodic compliance reports. |
The Trustees also received an overview of the Funds’ distribution arrangements. They received information regarding the Funds’ assets, share purchase and redemption activity, and payment of distribution and service fees. Information was also provided to the Trustees relating to revenue sharing payments made by and services provided by the Investment Adviser and its affiliates to intermediaries that promote the sale, distribution, and/or servicing of Fund shares. The Independent Trustees also discussed the broad range of other investment choices that are available to Fund investors, including the availability of comparable funds managed by other advisers.
The presentations made at the Board and Committee meetings and at the Annual Meeting encompassed the Funds and other mutual funds for which the Board of Trustees has responsibility. In evaluating the Management Agreement at the Annual Meeting, the Trustees relied upon their knowledge, resulting from their meetings and other interactions throughout the year, of the Investment Adviser and its affiliates, their services, and the Funds. In conjunction with these meetings, the Trustees received written materials and oral presentations on the topics covered, and the Investment Adviser addressed the questions and concerns of the Trustees, including concerns regarding the investment performance of certain of the funds they oversee. The Independent Trustees were advised by their independent legal counsel regarding their responsibilities and other regulatory requirements related to the approval and continuation of mutual fund investment management agreements under applicable law. In addition, the Investment Adviser and its affiliates provided the Independent Trustees with a written response to a formal request for information sent on behalf of the Independent Trustees by their independent legal counsel. During the course of their deliberations, the Independent Trustees met in executive sessions with their independent legal counsel, without representatives of the Investment Adviser or its affiliates present.
Nature, Extent, and Quality of the Services Provided Under the Management Agreement
As part of their review, the Trustees considered the nature, extent, and quality of the services provided to the Funds by the Investment Adviser. In this regard, the Trustees considered both the investment advisory services and non-advisory services that are provided by the Investment Adviser and its affiliates. The Trustees noted the transition in the leadership and changes in personnel of various of the Investment Adviser’s portfolio management teams that had occurred in recent periods, and the ongoing recruitment efforts aimed at bringing high quality investment talent to the Investment Adviser. They also noted the Investment Adviser’s commitment to maintaining high quality systems and expending substantial resources to respond to ongoing changes to the market, regulatory and control environment in which the Funds and their service providers operate, including changes associated with the COVID-19 pandemic, as well as the efforts of the Investment Adviser and its affiliates to combat cyber security risks. The Trustees also considered information regarding the Investment Adviser’s business continuity planning and remote operations in the current environment. The Trustees concluded that the Investment Adviser continued to commit substantial financial and operational resources to the Funds and expressed confidence that the Investment Adviser would continue to do so in the future. The Trustees also recognized that the Investment Adviser had made significant commitments to address regulatory compliance requirements applicable to the Funds and the Investment Adviser and its affiliates.
78
GOLDMAN SACHS DIVIDEND FOCUS FUNDS
Statement Regarding Basis for Approval of Management Agreement (Unaudited) (continued)
Investment Performance
The Trustees also considered the investment performance of the Funds. In this regard, they compared the investment performance of each Fund to its peers using rankings and ratings compiled by the Outside Data Provider as of December 31, 2019, and updated performance information prepared by the Investment Adviser using the peer group identified by the Outside Data Provider as of March 31, 2020. The information on each Fund’s investment performance was provided for the one-, three-, five-, and ten-year periods ending on the applicable dates. The Trustees also reviewed each Fund’s investment performance relative to its performance benchmark. As part of this review, they considered the investment performance trends of the Funds over time, and reviewed the investment performance of each Fund in light of its investment objective and policies and market conditions.
In addition, the Trustees considered materials prepared and presentations made by the Investment Adviser’s senior management and portfolio management personnel in which Fund performance was assessed. The Trustees also considered the Investment Adviser’s periodic reports with respect to the Funds’ risk profiles, and how the Investment Adviser’s approach to risk monitoring and management influences portfolio management. They noted the efforts of the Rising Dividend Growth Fund’s portfolio management team to continue to enhance the investment models used in managing the Funds.
The Trustees observed that the Rising Dividend Growth Fund’s Institutional Shares had placed in the fourth quartile of the Fund’s peer group and underperformed the Fund’s benchmark index for the one-, three-, five-, and ten-year periods ended March 31, 2020. The Trustees noted that the Investment Adviser’s Quantitative Investment Strategies Team manages a portion of the Fund’s portfolio (the “10/10 Strategy”) and that the Fund’s sub-adviser, Dividend Assets Capital, LLC (“DAC”), had managed the portion of the Fund’s portfolio that invests in energy infrastructure companies (the “Energy Infrastructure Strategy”). They considered that the Investment Adviser had recommended that the sub-advisory agreement between the Investment Adviser and DAC with respect to the Rising Dividend Growth Fund not be renewed upon its expiration on June 30, 2020, and that they had approved the re-assignment of management of the Energy Infrastructure Strategy to the Investment Adviser’s Energy and Infrastructure Team, effective on that date. The Trustees noted that GPS manages allocations between the “10/10 Strategy” and the Energy Infrastructure Strategy. They noted that the Rising Dividend Growth Fund’s peer group (Large Growth) and benchmark (the S&P 500 Index) were broad-based, whereas the Fund focused on dividend-paying stocks. The Trustees recalled that the Rising Dividend Growth Fund’s predecessor, which was advised by an affiliate of DAC, had commenced operations in March 2004 and had been reorganized into the Fund as a series of GST in February 2012. The Trustees observed that the Income Builder Fund’s Institutional Shares had placed in the top half of the Fund’s peer group for the one-, three-, five-, and ten-year periods, and had outperformed the Fund’s benchmark index for the one- and three-year periods and underperformed for the five and ten-year periods ended March 31, 2020. They recalled that the Income Builder Fund had been repositioned from the Goldman Sachs Balanced Fund in 2012, which involved changes to the Fund’s investment objective and principal investment strategy. The Trustees also noted that the Income Builder Fund and Rising Dividend Growth Fund had experienced certain portfolio management changes in 2019.
Costs of Services Provided and Competitive Information
The Trustees considered the contractual terms of the Management Agreement and the fee rates payable by each Fund thereunder. In this regard, the Trustees considered information on the services rendered by the Investment Adviser to the Funds, which included both advisory and administrative services that were directed to the needs and operations of the Funds as registered mutual funds.
In particular, the Trustees reviewed analyses prepared by the Outside Data Provider regarding the expense rankings of the Funds. The analyses provided a comparison of each Fund’s management fee and breakpoints to those of a relevant peer group and category universe; an expense analysis which compared each Fund’s overall net and gross expenses to a peer group and a category universe; and data comparing each Fund’s net expenses to the peer and category medians. The analyses also compared each Fund’s other expenses and fee waivers/reimbursements to those of the peer group and category medians. The Trustees concluded that the comparisons provided by the Outside Data Provider were useful in evaluating the reasonableness of the management fees and total expenses paid by the Funds.
In addition, the Trustees considered the Investment Adviser’s undertakings to implement fee waivers and/or expense limitations. They also considered, to the extent that the Investment Adviser manages other types of accounts having investment objectives and policies similar to those of the Funds, comparative fee information for services provided by the Investment Adviser to those accounts, and information that indicated that services provided to the Funds differed in various significant respects from the services provided to other types of accounts which, in many cases, operated under less stringent legal and regulatory structures, required fewer services from the Investment Adviser to a smaller number of client contact points, and were less time-intensive.
79
GOLDMAN SACHS DIVIDEND FOCUS FUNDS
Statement Regarding Basis for Approval of Management Agreement (Unaudited) (continued)
In addition, the Trustees noted that shareholders are able to redeem their Fund shares at any time if shareholders believe that the Fund fees and expenses are too high or if they are dissatisfied with the performance of the Fund.
Profitability
The Trustees reviewed each Fund’s contribution to the Investment Adviser’s revenues and pre-tax profit margins. In this regard the Trustees noted that they had received, among other things, profitability analyses and summaries, revenue and expense schedules by Fund and by function (i.e., investment management, transfer agency and distribution and service), and information on the Investment Adviser’s expense allocation methodology. They observed that the profitability and expense figures are substantially similar to those used by the Investment Adviser for many internal purposes, including compensation decisions among various business groups, and are thus subject to a vigorous internal debate about how certain revenue and expenses should be allocated. The Trustees also noted that the internal audit group within the Goldman Sachs organization periodically audits the expense allocation methodology and that the internal audit group was satisfied with the reasonableness, consistency, and accuracy of the Investment Adviser’s expense allocation methodology. Profitability data for each Fund was provided for 2019 and 2018, and the Trustees considered this information in relation to the Investment Adviser’s overall profitability.
Economies of Scale
The Trustees considered the information that had been provided regarding whether there have been economies of scale with respect to the management of the Funds. The Trustees also considered the breakpoints in the fee rate payable under the Management Agreement for each of the Funds at the following annual percentage rates of the average daily net assets of the Funds:
| Income Builder Fund | Rising Dividend Growth Fund | |||||||
| First $1 billion | 0.54 | % | 0.75 | % | ||||
| Next $1 billion | 0.49 | 0.68 | ||||||
| Next $3 billion | 0.46 | 0.64 | ||||||
| Next $3 billion | 0.45 | 0.63 | ||||||
| Over $8 billion | 0.44 | 0.62 | ||||||
The Trustees noted that the breakpoints were designed to share potential economies of scale, if any, with the Funds and their shareholders as assets under management reach those asset levels. The Trustees considered the amounts of assets in the Funds; the Funds’ recent share purchase and redemption activity; the information provided by the Investment Adviser relating to the costs of the services provided by the Investment Adviser and its affiliates and their realized profits; information comparing fee rates charged by the Investment Adviser with fee rates charged to other funds in the peer groups; and the Investment Adviser’s undertakings to limit certain expenses of the Funds that exceed specified levels, as well as Goldman Sachs & Co. LLC’s (“Goldman Sachs”) undertaking to waive a portion of the transfer agency fees paid by the Rising Dividend Growth Fund’s Class A, Class C, Investor and Class R Shares. Upon reviewing these matters at the Annual Meeting, the Trustees concluded that the fee breakpoints represented a means of assuring that benefits of scalability, if any, would be passed along to shareholders at the specified asset levels. They also noted that the Investment Adviser had passed along savings to shareholders of the Income Builder Fund, which had asset levels above at least the first breakpoint during the prior fiscal year.
Other Benefits to the Investment Adviser and Its Affiliates
The Trustees also considered the other benefits derived by the Investment Adviser and its affiliates from their relationships with the Funds as stated above, including: (a) transfer agency fees received by Goldman Sachs & Co. LLC (“Goldman Sachs”); (b) brokerage and futures commissions earned by Goldman Sachs for executing securities and futures transactions on behalf of the Funds; (c) research received by the Investment Adviser from broker-dealers in exchange for executing certain transactions on behalf of the Income Builder Fund; (d) trading efficiencies resulting from aggregation of orders of the Funds with those for other funds or accounts managed by the Investment Adviser; (e) fees earned by Goldman Sachs Agency Lending (“GSAL”), an affiliate of the Investment Adviser, as securities lending agent for the Rising Dividend Growth Fund (and fees earned by the Investment Adviser for managing the fund in which the Funds’ cash collateral is invested); (f) the Investment Adviser’s ability to leverage the infrastructure designed to service the Funds on behalf of its other clients; (g) the Investment Adviser’s ability to cross-market other products and services to Fund shareholders; (h) Goldman Sachs’ retention of certain fees as Fund Distributor; (i) the Investment Adviser’s ability to negotiate better pricing with custodians on behalf of its other clients, as a result of the relationship with the Funds; (j) the investment of cash and cash collateral in money market funds managed by the Investment Adviser that will result in increased assets under management for those money market funds; (k) the investment in exchange-traded funds (“ETFs”) managed
80
GOLDMAN SACHS DIVIDEND FOCUS FUNDS
Statement Regarding Basis for Approval of Management Agreement (Unaudited) (continued)
by the Investment Adviser that will result in increased assets under management for those ETFs and may facilitate the development of the Investment Adviser’s ETF advisory business; and (l) the possibility that the working relationship between the Investment Adviser and the Funds’ third-party service providers may cause those service providers to be more likely to do business with other areas of Goldman Sachs. In the course of considering the foregoing, the Independent Trustees requested and received further information quantifying certain of these fall-out benefits.
Other Benefits to the Funds and Their Shareholders
The Trustees also noted that the Funds receive certain other potential benefits as a result of their relationship with the Investment Adviser, including: (a) trading efficiencies resulting from aggregation of orders of the Funds with those of other funds or accounts managed by the Investment Adviser; (b) enhanced servicing from vendors due to the volume of business generated by the Investment Adviser and its affiliates; (c) enhanced servicing from broker-dealers due to the volume of business generated by the Investment Adviser and its affiliates; (d) the Investment Adviser’s ability to negotiate favorable terms with derivatives counterparties on behalf of the Funds as a result of the size and reputation of the Goldman Sachs organization; (e) the advantages received from the Investment Adviser’s knowledge and experience gained from managing other accounts and products; (f) the Investment Adviser’s ability to hire and retain qualified personnel to provide services to the Funds because of the reputation of the Goldman Sachs organization; (g) the Funds’ access, through the Investment Adviser, to certain firm-wide resources (e.g., proprietary risk management systems and databases), subject to certain restrictions; (h) the Rising Dividend Growth Fund’s ability to participate in the securities lending program administered by GSAL, as measured by the revenue received by the Funds in connection with the program; and (i) the Funds’ access to certain affiliated distribution channels. In addition, the Trustees noted the competitive nature of the mutual fund marketplace, and considered that many of the Funds’ shareholders invested in the Funds in part because of the Funds’ relationship with the Investment Adviser and that those shareholders have a general expectation that the relationship will continue.
Conclusion
In connection with their consideration of the Management Agreement, the Trustees gave weight to each of the factors described above, but did not identify any particular factor as controlling their decision. After deliberation and consideration of all of the information provided, including the factors described above, the Trustees concluded, in the exercise of their business judgment, that the management fees paid by each of the Funds were reasonable in light of the services provided to it by the Investment Adviser, the Investment Adviser’s costs and each Fund’s current and reasonably foreseeable asset levels. The Trustees unanimously concluded that the Investment Adviser’s continued management likely would benefit each Fund and its shareholders and that the Management Agreement should be approved and continued with respect to each Fund until June 30, 2021.
81
GOLDMAN SACHS DIVIDEND FOCUS FUNDS
Trustees and Officers (Unaudited)
Independent Trustees
Name, Address and Age1 | Position(s) Held with the Trust | Term of Office and Length of Time Served2 | Principal Occupation(s) During Past 5 Years | Number of Portfolios in Fund Complex Overseen by Trustee3 | Other Directorships Held by Trustee4 | |||||
Jessica Palmer Age: 71 | Chair of the Board of Trustees | Since 2018 (Trustee since 2007) | Ms. Palmer is retired. She was formerly Consultant, Citigroup Human Resources Department (2007-2008); Managing Director, Citigroup Corporate and Investment Banking (previously, Salomon Smith Barney/Salomon Brothers) (1984-2006). Ms. Palmer was a Member of the Board of Trustees of Indian Mountain School (private elementary and secondary school) (2004-2009).
Chair of the Board of Trustees — Goldman Sachs Trust and Goldman Sachs Variable Insurance Trust. | 105 | None | |||||
Dwight L. Bush Age: 63 | Trustee | Since 2020 | Ambassador Bush is President and CEO of D.L. Bush & Associates (a financial advisory and private investment firm) (2002-2014 and 2017-present); and was formerly U.S. Ambassador to the Kingdom of Morocco (2014-2017) and a Member of the Board of Directors of Santander Bank, N.A. (2018-2019). Previously, Ambassador Bush served as an Advisory Board Member of Goldman Sachs Trust and Goldman Sachs Variable Insurance Trust (October 2019-January 2020).
Trustee — Goldman Sachs Trust and Goldman Sachs Variable Insurance Trust. | 105 | None | |||||
Kathryn A. Cassidy Age: 66 | Trustee | Since 2015 | Ms. Cassidy is retired. Formerly, she was Advisor to the Chairman (May 2014-December 2014); and Senior Vice President and Treasurer (2008-2014), General Electric Company & General Electric Capital Corporation (technology and financial services companies).
Trustee — Goldman Sachs Trust and Goldman Sachs Variable Insurance Trust. | 105 | None | |||||
Diana M. Daniels Age: 71 | Trustee | Since 2007 | Ms. Daniels is retired. Formerly, she was Vice President, General Counsel and Secretary, The Washington Post Company (1991-2006). Ms. Daniels is a Trustee Emeritus and serves as a Presidential Councillor of Cornell University (2013-Present); former Member of the Legal Advisory Board, New York Stock Exchange (2003-2006) and of the Corporate Advisory Board, Standish Mellon Management Advisors (2006- 2007).
Trustee — Goldman Sachs Trust and Goldman Sachs Variable Insurance Trust. | 105 | None | |||||
Joaquin Delgado Age: 60 | Trustee | Since 2020 | Dr. Delgado is retired. He is Director, Hexion Inc. (a specialty chemical manufacturer) (2019-present); and Director, Stepan Company (a specialty chemical manufacturer) (2011-present); and was formerly Executive Vice President, Consumer Business Group of 3M Company (July 2016-July 2019); and Executive Vice President, Health Care Business Group of 3M Company (October 2012-July 2016). Previously, Dr. Delgado served as an Advisory Board Member of Goldman Sachs Trust and Goldman Sachs Variable Insurance Trust (October 2019-January 2020).
Trustee — Goldman Sachs Trust and Goldman Sachs Variable Insurance Trust. | 105 | Stepan Company (a specialty chemical manufacturer) | |||||
82
GOLDMAN SACHS DIVIDEND FOCUS FUNDS
Trustees and Officers (Unaudited) (continued)
Independent Trustees (continued)
Name, Address and Age1 | Position(s) Held with the Trust | Term of Office and Length of Time Served2 | Principal Occupation(s) During Past 5 Years | Number of Portfolios in Fund Complex Overseen by Trustee3 | Other Directorships Held by Trustee4 | |||||
Roy W. Templin Age: 60 | Trustee | Since 2013 | Mr. Templin is retired. He is Director, Armstrong World Industries, Inc. (a designer and manufacturer of ceiling, wall and suspension system solutions) (2016-Present); and was formerly Chairman of the Board of Directors, Con-Way Incorporated (a transportation, logistics and supply chain management service company) (2014-2015); Executive Vice President and Chief Financial Officer, Whirlpool Corporation (an appliance manufacturer and marketer) (2004- 2012).
Trustee — Goldman Sachs Trust and Goldman Sachs Variable Insurance Trust. | 105 | Armstrong World Industries, Inc. (a ceiling, wall and suspension systems solutions manufacturer) | |||||
Gregory G. Weaver Age: 69 | Trustee | Since 2015 | Mr. Weaver is retired. He is Director, Verizon Communications Inc. (2015-Present); and was formerly Chairman and Chief Executive Officer, Deloitte & Touche LLP (a professional services firm) (2001-2005 and 2012-2014); and Member of the Board of Directors, Deloitte & Touche LLP (2006-2012).
Trustee — Goldman Sachs Trust and Goldman Sachs Variable Insurance Trust. | 105 | Verizon Communications Inc. | |||||
Interested Trustee*
Name, Address and Age1 | Position(s) Held with the Trust | Term of Office and Length of Time Served2 | Principal Occupation(s) During Past 5 Years | Number of Portfolios in Fund Complex Overseen by Trustee3 | Other Directorships Held by Trustee4 | |||||
James A. McNamara Age: 58 | Trustee and President | Since 2007 | Advisory Director, Goldman Sachs (January 2018-Present); Managing Director, Goldman Sachs (January 2000-December 2017); Director of Institutional Fund Sales, GSAM (April 1998-December 2000); and Senior Vice President and Manager, Dreyfus Institutional Service Corporation (January 1993-April 1998).
President and Trustee — Goldman Sachs Trust; Goldman Sachs Variable Insurance Trust; Goldman Sachs Trust II; Goldman Sachs MLP and Energy Renaissance Fund; Goldman Sachs ETF Trust; Goldman Sachs Credit Income Fund; and Goldman Sachs Real Estate Diversified Income Fund.
| 170 | None | |||||
| * | Mr. McNamara is considered to be an “Interested Trustee” because he holds positions with Goldman Sachs and owns securities issued by The Goldman Sachs Group, Inc. Mr. McNamara holds comparable positions with certain other companies of which Goldman Sachs, GSAM or an affiliate thereof is the investment adviser, administrator and/or distributor. |
| 1 | Each Trustee may be contacted by writing to the Trustee, c/o Goldman Sachs, 200 West Street, New York, New York, 10282, Attn: Caroline Kraus. Information is provided as of October 31, 2020. |
| 2 | Subject to such policies as may be adopted by the Board from time-to-time, each Trustee holds office for an indefinite term, until the earliest of: (a) the election of his or her successor; (b) the date the Trustee resigns or is removed by the Board or shareholders, in accordance with the Trust’s Declaration of Trust; or (c) the termination of the Trust. The Board has adopted policies which provide that each Independent Trustee shall retire as of December 31st of the calendar year in which he or she reaches (a) his or her 75th birthday or (b) the 15th anniversary of the date he or she became a Trustee, whichever is earlier, unless a waiver of such requirements shall have been adopted by a majority of the other Trustees. These policies may be changed by the Trustees without shareholder vote. |
| 3 | The Goldman Sachs Fund Complex includes certain other companies listed above for each respective Trustee. As of October 31, 2020, Goldman Sachs Trust consisted of 92 portfolios (90 of which offered shares to the public); Goldman Sachs Variable Insurance Trust consisted of 13 portfolios; Goldman Sachs Trust II consisted of 19 portfolios (17 of which offered shares to the public); Goldman Sachs ETF Trust consisted of 42 portfolios (24 of which offered shares to the public); and Goldman Sachs MLP and Energy Renaissance Fund, Goldman Sachs Credit Income Fund and Goldman Sachs Real Estate Diversified Income Fund each consisted of one portfolio. Goldman Sachs Credit Income Fund did not offer shares to the public. |
| 4 | This column includes only directorships of companies required to report to the Securities and Exchange Commission under the Securities Exchange Act of 1934 (i.e., “public companies”) or other investment companies registered under the Act. |
Additional information about the Trustees is available in the Funds’ Statement of Additional Information, which can be obtained from Goldman Sachs free of charge by calling this toll-free number (in the United States of America): 1-800-526-7384.
83
GOLDMAN SACHS DIVIDEND FOCUS FUNDS
Trustees and Officers (Unaudited) (continued)
Officers of the Trust*
Name, Address and Age1 | Position(s) Held with the Trust | Term of Office and | Principal Occupation(s) During Past 5 Years | |||
James A. McNamara 200 West Street New York, NY 10282 Age: 58 | Trustee and President | Since 2007 | Advisory Director, Goldman Sachs (January 2018-Present); Managing Director, Goldman Sachs (January 2000-December 2017); Director of Institutional Fund Sales, GSAM (April 1998-December 2000); and Senior Vice President and Manager, Dreyfus Institutional Service Corporation (January 1993-April 1998).
President and Trustee — Goldman Sachs Trust; Goldman Sachs Variable Insurance Trust; Goldman Sachs Trust II; Goldman Sachs MLP and Energy Renaissance Fund; Goldman Sachs ETF Trust; Goldman Sachs Credit Income Fund; and Goldman Sachs Real Estate Diversified Income Fund. | |||
Caroline L. Kraus 200 West Street New York, NY 10282 Age: 43 | Secretary | Since 2012 | Managing Director, Goldman Sachs (January 2016-Present); Vice President, Goldman Sachs (August 2006-December 2015); Senior Counsel, Goldman Sachs (January 2020-Present); Associate General Counsel, Goldman Sachs (2012-December 2019); Assistant General Counsel, Goldman Sachs (August 2006-December 2011); and Associate, Weil, Gotshal & Manges, LLP (2002-2006).
Secretary — Goldman Sachs Trust (previously Assistant Secretary (2012)); Goldman Sachs Variable Insurance Trust (previously Assistant Secretary (2012)); Goldman Sachs Trust II; Goldman Sachs BDC, Inc.; Goldman Sachs Private Middle Market Credit LLC; Goldman Sachs Private Middle Market Credit II LLC; Goldman Sachs Middle Market Lending Corp.; Goldman Sachs MLP and Energy Renaissance Fund; Goldman Sachs ETF Trust; Goldman Sachs Credit Income Fund; and Goldman Sachs Real Estate Diversified Income Fund. | |||
Joseph F. DiMaria 30 Hudson Street Jersey City, NJ 07302 Age: 52 | Treasurer, Principal Financial Officer and Principal Accounting Officer | Since 2017 (Treasurer and Principal Financial Officer since 2019) | Managing Director, Goldman Sachs (November 2015-Present) and Vice President — Mutual Fund Administration, Columbia Management Investment Advisers, LLC (May 2010-October 2015).
Treasurer, Principal Financial Officer and Principal Accounting Officer — Goldman Sachs Trust (previously Assistant Treasurer (2016)); Goldman Sachs Variable Insurance Trust (previously Assistant Treasurer (2016)); Goldman Sachs Trust II (previously Assistant Treasurer (2017)); Goldman Sachs MLP and Energy Renaissance Fund (previously Assistant Treasurer (2017)); Goldman Sachs ETF Trust (previously Assistant Treasurer (2017)); Goldman Sachs Credit Income Fund; and Goldman Sachs Real Estate Diversified Income Fund. | |||
| * | Represents a partial list of officers of the Trust. Additional information about all the officers is available in the Funds’ Statement of Additional Information, which can be obtained from Goldman Sachs free of charge by calling this toll-free number (in the United States): 1-800-526-7384. |
| 1 | Information is provided as of October 31, 2020. |
| 2 | Officers hold office at the pleasure of the Board of Trustees or until their successors are duly elected and qualified. Each officer holds comparable positions with certain other companies of which Goldman Sachs, GSAM or an affiliate thereof is the investment adviser, administrator and/or distributor. |
Goldman Sachs Trust — Dividend Focus Fund — Tax Information (Unaudited)
For the year ended October 31, 2020, 21.63% and 59.30% of the dividends paid from net investment company taxable income by the Income Builder and Rising Dividend Growth Funds, respectively, qualify for the dividends received deduction available to corporations.
For the year ended October 31, 2020, 30.37% and 73.02% of the dividends paid from net investment company taxable income by the Income Builder and Rising Dividend Growth Funds, respectively, qualify for the reduced tax rate under the Jobs and Growth Tax Relief and Reconciliation Act of 2003.
Pursuant to Section 852 of the Internal Revenue Code, the Rising Dividend Growth Fund designates $52,432,965, or if different, the maximum amount allowable, as capital gain dividends paid during the fiscal year ended October 31, 2020.
During the fiscal year ended October 31, 2020, the Rising Dividend Growth Fund, designate $11,037,886 as short-term capital gain dividends pursuant to Section 871(k) of the Internal Revenue Code.
84
FUNDS PROFILE
Goldman Sachs Funds
Goldman Sachs is a premier financial services firm, known since 1869 for creating thoughtful and customized investment solutions in complex global markets.
Today, the Consumer and Investment Management Division of Goldman Sachs serves a diverse set of clients worldwide, including private institutions, public entities and individuals. With approximately $1.86 trillion in assets under supervision as of September 30, 2020, Goldman Sachs Asset Management (“GSAM”) has portfolio management teams located around the world and our investment professionals bring firsthand knowledge of local markets to every investment decision. Assets under supervision includes assets under management and other client assets for which Goldman Sachs does not have full discretion. GSAM leverages the resources of Goldman Sachs & Co. LLC subject to legal, internal and regulatory restrictions.
Money Market
Financial Square FundsSM
| ∎ | Financial Square Treasury Solutions Fund1 |
| ∎ | Financial Square Government Fund1 |
| ∎ | Financial Square Money Market Fund2 |
| ∎ | Financial Square Prime Obligations Fund2 |
| ∎ | Financial Square Treasury Instruments Fund1 |
| ∎ | Financial Square Treasury Obligations Fund1 |
| ∎ | Financial Square Federal Instruments Fund1 |
Investor FundsSM
| ∎ | Investor Money Market Fund3 |
| ∎ | Investor Tax-Exempt Money Market Fund3 |
Fixed Income
Short Duration and Government
| ∎ | Enhanced Income Fund |
| ∎ | High Quality Floating Rate Fund |
| ∎ | Short-Term Conservative Income Fund |
| ∎ | Short Duration Government Fund |
| ∎ | Short Duration Income Fund |
| ∎ | Government Income Fund |
| ∎ | Inflation Protected Securities Fund |
Multi-Sector
| ∎ | Bond Fund |
| ∎ | Core Fixed Income Fund |
| ∎ | Global Core Fixed Income Fund4 |
| ∎ | Strategic Income Fund |
Municipal and Tax-Free
| ∎ | High Yield Municipal Fund |
| ∎ | Dynamic Municipal Income Fund |
| ∎ | Municipal Income Completion Fund |
| ∎ | Short Duration Tax-Free Fund |
Single Sector
| ∎ | Investment Grade Credit Fund |
| ∎ | U.S. Mortgages Fund |
| ∎ | High Yield Fund |
| ∎ | High Yield Floating Rate Fund |
| ∎ | Emerging Markets Debt Fund |
| ∎ | Local Emerging Markets Debt Fund |
Fixed Income Alternatives
| ∎ | Long Short Credit Strategies Fund |
Fundamental Equity
| ∎ | Equity Income Fund |
| ∎ | Small Cap Growth Fund |
| ∎ | Small Cap Value Fund |
| ∎ | Small/Mid Cap Value Fund |
| ∎ | Mid Cap Value Fund |
| ∎ | Large Cap Value Fund |
| ∎ | Focused Value Fund |
| ∎ | Capital Growth Fund |
| ∎ | Strategic Growth Fund |
| ∎ | Small/Mid Cap Growth Fund |
| ∎ | Flexible Cap Fund |
| ∎ | Concentrated Growth Fund |
| ∎ | Technology Opportunities Fund |
| ∎ | Growth Opportunities Fund |
| ∎ | Rising Dividend Growth Fund |
| ∎ | U.S. Equity ESG Fund5 |
| ∎ | Income Builder Fund |
| ∎ | Defensive Equity Fund |
Tax-Advantaged Equity
| ∎ | U.S. Tax-Managed Equity Fund |
| ∎ | International Tax-Managed Equity Fund |
| ∎ | U.S. Equity Dividend and Premium Fund |
| ∎ | International Equity Dividend and Premium Fund |
Equity Insights
| ∎ | Small Cap Equity Insights Fund |
| ∎ | U.S. Equity Insights Fund |
| ∎ | Small Cap Growth Insights Fund |
| ∎ | Large Cap Growth Insights Fund |
| ∎ | Large Cap Value Insights Fund |
| ∎ | Small Cap Value Insights Fund |
| ∎ | International Small Cap Insights Fund |
| ∎ | International Equity Insights Fund |
| ∎ | Emerging Markets Equity Insights Fund |
Fundamental Equity International
| ∎ | International Equity Income Fund |
| ∎ | International Equity ESG Fund |
| ∎ | China Equity Fund6 |
| ∎ | Emerging Markets Equity Fund |
| ∎ | Imprint Emerging Markets Opportunities Fund |
| ∎ | ESG Emerging Markets Equity Fund |
Alternative
| ∎ | Clean Energy Income Fund |
| ∎ | Real Estate Securities Fund |
| ∎ | International Real Estate Securities Fund |
| ∎ | Commodity Strategy Fund |
| ∎ | Global Real Estate Securities Fund |
| ∎ | Alternative Premia Fund |
| ∎ | Absolute Return Tracker Fund |
| ∎ | Managed Futures Strategy Fund |
| ∎ | MLP Energy Infrastructure Fund |
| ∎ | Energy Infrastructure Fund7 |
| ∎ | Multi-Manager Alternatives Fund |
| ∎ | Global Infrastructure Fund |
Total Portfolio Solutions
| ∎ | Global Managed Beta Fund |
| ∎ | Multi-Manager Non-Core Fixed Income Fund |
| ∎ | Multi-Manager U.S. Dynamic Equity Fund |
| ∎ | Multi-Manager Global Equity Fund |
| ∎ | Multi-Manager International Equity Fund |
| ∎ | Tactical Tilt Overlay Fund |
| ∎ | Balanced Strategy Portfolio |
| ∎ | Multi-Manager U.S. Small Cap Equity Fund |
| ∎ | Multi-Manager Real Assets Strategy Fund |
| ∎ | Growth and Income Strategy Portfolio |
| ∎ | Growth Strategy Portfolio |
| ∎ | Dynamic Global Equity Fund |
| ∎ | Satellite Strategies Portfolio |
| ∎ | Enhanced Dividend Global Equity Portfolio |
| ∎ | Tax-Advantaged Global Equity Portfolio |
| ∎ | Strategic Factor Allocation Fund |
| ∎ | Target Date Retirement Portfolio8 |
| ∎ | Target Date 2025 Portfolio |
| ∎ | Target Date 2030 Portfolio |
| ∎ | Target Date 2035 Portfolio |
| ∎ | Target Date 2040 Portfolio |
| ∎ | Target Date 2045 Portfolio |
| ∎ | Target Date 2050 Portfolio |
| ∎ | Target Date 2055 Portfolio |
| ∎ | Target Date 2060 Portfolio |
| ∎ | GQG Partners International Opportunities Fund |
| 1 | You could lose money by investing in the Fund. Although the Fund seeks to preserve the value of your investment at $1.00 per share, it cannot guarantee it will do so. An investment in the Fund is not a deposit of a bank and is not insured or guaranteed by the Federal Deposit Insurance Corporation or any other government agency. The Fund’s sponsor has no legal obligation to provide financial support to the Fund, and you should not expect that the sponsor will provide financial support to the Fund at any time. |
| 2 | You could lose money by investing in the Fund. Because the share price of the Fund will fluctuate, when you sell your shares they may be worth more or less than what you originally paid for them. The Fund may impose a fee upon sale of your shares or may temporarily suspend your ability to sell shares if the Fund’s liquidity falls below required minimums because of market conditions or other factors. An investment in the Fund is not a deposit of a bank and is not insured or guaranteed by the Federal Deposit Insurance Corporation or any other government agency. The Fund’s sponsor has no legal obligation to provide financial support to the Fund, and you should not expect that the sponsor will provide financial support to the Fund at any time. |
| 3 | You could lose money by investing in the Fund. Although the Fund seeks to preserve the value of your investment at $1.00 per share, it cannot guarantee it will do so. The Fund may impose a fee upon sale of your shares or may temporarily suspend your ability to sell shares if the Fund’s liquidity falls below required minimums because of market conditions or other factors. An investment in the Fund is not a deposit of a bank and is not insured or guaranteed by the Federal Deposit Insurance Corporation or any other government agency. The Fund’s sponsor has no legal obligation to provide financial support to the Fund, and you should not expect that the sponsor will provide financial support to the Fund at any time. |
| 4 | Effective after the close of business on April 30, 2020, the Goldman Sachs Global Income Fund was renamed the Goldman Sachs Global Core Fixed Income Fund. |
| 5 | Effective after the close of business on August 30, 2020, the Goldman Sachs Blue Chip Fund was renamed the Goldman Sachs U.S. Equity ESG Fund. |
| 6 | Effective after the close of business on November 20, 2019, the Goldman Sachs Asia Equity Fund was renamed the Goldman Sachs China Equity Fund. |
| 7 | Effective after the close of business on June 26, 2020, the Goldman Sachs MLP & Energy Fund was renamed the Goldman Sachs Energy Infrastructure Fund. |
| 8 | Effective December 27, 2019, the Goldman Sachs Target Date 2020 Portfolio was renamed the Goldman Sachs Target Date Retirement Portfolio. Financial Square FundsSM and Investor FundsSM are registered service marks of Goldman Sachs & Co. LLC. |
| * | This list covers open-end funds only. Please visit our website at www.GSAMFUNDS.com to learn about our closed-end funds and exchange-traded funds. |
TRUSTEES Jessica Palmer, Chair Dwight L. Bush Kathryn A. Cassidy Diana M. Daniels Joaquin Delgado James A. McNamara Roy W. Templin Gregory G. Weaver | OFFICERS James A. McNamara, President Joseph F. DiMaria, Principal Financial Officer, Principal Accounting Officer and Treasurer Caroline L. Kraus, Secretary | |
GOLDMAN SACHS & CO. LLC Distributor and Transfer Agent | GOLDMAN SACHS ASSET MANAGEMENT, L.P. Investment Adviser | |
Visit our website at www.GSAMFUNDS.com to obtain the most recent month-end returns.
Goldman Sachs Asset Management, L.P., 200 West Street, New York, New York 10282
The reports concerning the Funds included in this shareholder report may contain certain forward-looking statements about the factors that may affect the performance of the Funds in the future. These statements are based on Fund management’s predictions and expectations concerning certain future events and their expected impact on the Funds, such as performance of the economy as a whole and of specific industry sectors, changes in the levels of interest rates, the impact of developing world events, and other factors that may influence the future performance of the Funds. Management believes these forward-looking statements to be reasonable, although they are inherently uncertain and difficult to predict. Actual events may cause adjustments in portfolio management strategies from those currently expected to be employed.
A description of the policies and procedures that the Funds use to determine how to vote proxies relating to portfolio securities and information regarding how the Funds voted proxies relating to portfolio securities during the most recent 12-month period ended June 30 is available (i) without charge, upon request by calling 1-800-526-7384 (for Retail Shareholders) or 1-800-621-2550 (for Institutional Shareholders); and (ii) on the Securities and Exchange Commission (“SEC”) web site at http://www.sec.gov.
The Funds will file their portfolio holdings for each month in a fiscal quarter within 60 days after the end of the relevant fiscal quarter on Form N-PORT. Portfolio holdings information for the third month of each fiscal quarter will be made available on the SEC’s web site at http://www.sec.gov. Portfolio holdings information may be obtained upon request and without charge by calling 1-800-526-7384 (for Retail Shareholders) or 1-800-621-2550 (for Institutional Shareholders).
All or a portion of the Funds’ distributions may be treated for tax purposes as a return of capital, however, the final characterization of such distributions will be reported annually on Form 1099-DIV. The final tax status of the distributions may differ substantially from the above dividend information.
Fund holdings and allocations shown are unaudited, and may not be representative of current or future investments. Fund holdings and allocations may not include the Funds’ entire investment portfolio, which may change at any time. Fund holdings should not be relied on in making investment decisions and should not be construed as research or investment advice regarding particular securities. Current and future holdings are subject to risk.
Economic and market forecasts presented herein reflect our judgment as of the date of this presentation and are subject to change without notice. These forecasts do not take into account the specific investment objectives, restrictions, tax and financial situation or other needs of any specific client. Actual data will vary and may not be reflected here. These forecasts are subject to high levels of uncertainty that may affect actual performance. Accordingly, these forecasts should be viewed as merely representative of a broad range of possible outcomes. These forecasts are estimated, based on assumptions, and are subject to significant revision and may change materially as economic and market conditions change. Goldman Sachs has no obligation to provide updates or changes to these forecasts. Case studies and examples are for illustrative purposes only.
The Global Industry Classification Standard (GICS) was developed by and is the exclusive property and a service mark of Morgan Stanley Capital International Inc. (MSCI) and Standard & Poor’s, a division of The McGraw-Hill Companies, Inc. (S&P) and is licensed for use by Goldman Sachs. Neither MSCI, S&P nor any other party involved in making or compiling the GICS or any GICS classifications makes any express or implied warranties or representations with respect to such standard or classification (or the results to be obtained by the use thereof), and all such parties hereby expressly disclaim all warranties of originality, accuracy, completeness, merchantability or fitness for a particular purpose with respect to any of such standard or classification. Without limiting any of the foregoing, in no event shall MSCI, S&P, any of their affiliates or any third party involved in making or compiling the GICS or any GICS classifications have any liability for any direct, indirect, special, punitive, consequential or any other damages (including lost profits) even if notified of the possibility of such damages.
The portfolio risk management process includes an effort to monitor and manage risk, but does not imply low risk.
This material is not authorized for distribution to prospective investors unless preceded or accompanied by a current Prospectus or summary prospectus, if applicable. Investors should consider a Fund’s objective, risks, and charges and expenses, and read the summary prospectus, if available, and/or the Prospectus carefully before investing or sending money. The summary prospectus, if available, and the Prospectus contain this and other information about a Fund and may be obtained from your authorized dealer or from Goldman Sachs & Co. LLC by calling (retail – 1-800-526-7384) (institutional – 1-800-621-2550).
© 2020 Goldman Sachs. All rights reserved. 224112-OTU-1321557 DIVFOAR-20
Goldman Sachs Funds

| Annual Report | October 31, 2020 | |||
Domestic Equity Insights Funds | ||||
Large Cap Growth Insights | ||||
Large Cap Value Insights | ||||
Small Cap Equity Insights | ||||
Small Cap Growth Insights | ||||
Small Cap Value Insights | ||||
U.S. Equity Insights | ||||
It is our intention that beginning on January 1, 2021, paper copies of the Funds’ annual and semi-annual shareholder reports will no longer be sent by mail, unless you specifically request paper copies of the reports from a Fund or from your financial intermediary. Instead, the reports will be made available on a website, and you will be notified by mail each time a report is posted and provided with a website link to access the report.
If you already elected to receive shareholder reports electronically, you will not be affected by this change and you need not take any action. At any time, you may elect to receive reports and certain communications from a Fund electronically by calling the applicable toll-free number below or by contacting your financial intermediary.
You may elect to receive all future shareholder reports in paper free of charge. If you hold shares of a Fund directly with the Fund’s transfer agent, you can inform the transfer agent that you wish to receive paper copies of reports by calling toll-free 800-621-2550 for Institutional, Service, Class R6 and Class P shareholders or 800-526-7384 for all other shareholders. If you hold shares of a Fund through a financial intermediary, please contact your financial intermediary to make this election. Your election to receive reports in paper will apply to all Goldman Sachs Funds held in your account if you invest through your financial intermediary or all Goldman Sachs Funds held with the Funds’ transfer agent if you invest directly with the transfer agent.

Goldman Sachs Domestic Equity Insights Funds
| ∎ | LARGE CAP GROWTH INSIGHTS |
| ∎ | LARGE CAP VALUE INSIGHTS |
| ∎ | SMALL CAP EQUITY INSIGHTS |
| ∎ | SMALL CAP GROWTH INSIGHTS |
| ∎ | SMALL CAP VALUE INSIGHTS |
| ∎ | U.S. EQUITY INSIGHTS |
| 1 | ||||
| 2 | ||||
| 3 | ||||
| 27 | ||||
| 28 | ||||
| 53 | ||||
| 60 | ||||
| 60 | ||||
| 68 | ||||
| 76 | ||||
| 84 | ||||
| 91 | ||||
| 98 | ||||
| 106 | ||||
| 127 | ||||
| 129 | ||||
| NOT FDIC-INSURED | May Lose Value | No Bank Guarantee | ||
GOLDMAN SACHS DOMESTIC EQUITY INSIGHTS FUNDS
Enhancements Made to Proprietary Quantitative Model during the 12-Month Period Ended October 31, 2020
We continuously look for ways to improve our investment process. Accordingly, we introduced a number of enhancements to our proprietary quantitative model during the 12-month period ended October 31, 2020 (the “Reporting Period”).
During the last months of 2019, we added a number of new metrics within our High-Quality Business Models investment theme. The first metric identifies companies with longer executive management tenure, as we believe this is indicative of sustainable, high-quality business models. Second, we began leveraging data from a large web search engine provider to help quantify changes in consumer attention. Third, we introduced a signal that uses import and export data to help quantify demand growth for a company’s products, complementing our suite of consumer demand signals. Finally, we added a signal focused on health care companies that helps us measure the value of a pharmaceutical company’s drug pipeline. Within our Market Themes & Trends investment theme, we introduced a signal that helps us find connections between companies based upon import and export data.
During the first half of 2020, we introduced new signals within our High Quality Business Models investment theme. First, we added a signal that uses machine learning and natural language processing techniques to capture the linguistic complexity of a company’s earnings call transcript, as we believe that companies using simple language are expected to perform better over the long term. Second, we implemented a signal that uses machine learning techniques to gauge the management quality of a company by assessing employee satisfaction and firm culture through employee reviews and ratings for companies. In our Fundamental Mispricings investment theme, we introduced a signal that seeks to test investors’ under-reaction to a company’s short-term deviation in its fundamentals by simultaneously looking at a set of key profitability metrics that could point to a company’s long-term growth prospects.
1
MARKET REVIEW
Goldman Sachs Domestic Equity Insights Funds
U.S. equities generated a solid gain during the 12-month period ended October 31, 2020 (the “Reporting Period”), with the major influences being the spread of COVID-19, contraction in global economic growth and historic financial stimulus by central banks and governments around the world.
In November and December 2019, when the Reporting Period began, U.S. equity market returns accelerated with an uptick of U.S. manufacturing and service sector business surveys as well as a consistently strong labor market, as evidenced by the U.S. adding more than 200,000 jobs in November, double the break-even pace of long-term job growth. These developments helped restore market confidence, while fundamentals of low core inflation and reduced trade war tensions fended off imminent recession risk.
During the first quarter of 2020, U.S. equities sold off as the emergence and rapid spread of COVID-19 caused non-essential businesses to close. Jobless claims increased to 6.6 million and nonfarm payrolls decreased by 701,000 for the month of March, leading the U.S. government and the U.S. Federal Reserve (“Fed”) to respond with aggressive financial stimulus. In addition, crude oil prices fell as supply increased and demand declined.
U.S. equities rebounded during the second calendar quarter. The market appreciated despite a surge in COVID-19 cases in regional pockets of the U.S., causing local governments to pause reopening plans and revisit previous lockdown measures. Positive market sentiment was buoyed by better than consensus expected economic data, such as nonfarm payrolls increasing 7.3 million over May and June, driving the unemployment rate down to 11.1% from a high of more than 14% in the prior quarter.
During the third quarter of 2020, the U.S. equity markets continued to rally in spite of pressure from the COVID-19 pandemic. Market strength was supported by a sharp cyclical recovery in economic data, with the Institute for Supply Management’s Purchasing Managers’ Index increasing to 56.0 in August, a reading that was firmly in expansionary territory. Optimism around a potential COVID-19 vaccine also helped support equity markets during the quarter.
In October 2020, the majority of third quarter earnings results for U.S. companies came in better than consensus expected, but U.S. equity prices declined against a backdrop of heightened market expectations. Political uncertainty surrounding the then-upcoming U.S. elections and a lack of further fiscal stimulus were also sources of volatility during the month. Despite these headwinds, some support for equities was provided by a 33.1% increase in U.S. Gross Domestic Product (“GDP”) in the third quarter of 2020, as businesses resumed some activity that was postponed or restricted as a result of COVID-19.
For the Reporting Period overall, the S&P 500® Index (with dividends reinvested) returned 9.68%, with seven of its 11 sectors generating positive absolute returns. Information technology, consumer discretionary and communication services were the best performing sectors in the S&P 500® Index. The weakest performing sector in the S&P 500® Index was energy, followed at some distance by financials and real estate.
In terms of market capitalization, large-cap stocks, as measured by the Russell 1000® Index, performed best, followed by mid-cap stocks, as measured by the Russell Midcap® Index, with each capitalization segment posting positive absolute returns. Small-cap stocks, as measured by the Russell 2000® Index, were weakest, posting negative absolute returns during the Reporting Period as a whole. From a style perspective, growth-oriented stocks significantly outpaced value-oriented stocks across the capitalization spectrum. (All as measured by the FTSE Russell indices.)
Looking Ahead
At the end of the Reporting Period, we continued to believe that less expensive stocks should outpace more expensive stocks. In addition, we expected stocks with good momentum to outperform those with poor momentum. We plan to focus on seeking companies about which fundamental research analysts are becoming more positive as well as profitable companies with sustainable earnings and a track record of using their capital to enhance shareholder value. As such, we anticipate remaining fully invested, with long-term performance likely to be the result of stock selection rather than sector or capitalization allocations.
We stand behind our investment philosophy that sound economic investment principles, coupled with a disciplined quantitative approach, can provide strong, uncorrelated returns over the long term. Our research agenda is robust, and we continue to enhance our existing models, add new proprietary forecasting signals and improve our trading execution as we seek to provide the most value to our shareholders.
2
Goldman Sachs Large Cap Growth Insights Fund
Investment Objective
The Fund seeks long-term growth of capital, with dividend income as a secondary consideration.
Portfolio Management Discussion and Analysis
Below, the Goldman Sachs Quantitative Investment Strategies Team discusses the Goldman Sachs Large Cap Growth Insights Fund’s (the “Fund”) performance and positioning for the 12-month period ended October 31, 2020 (the “Reporting Period”).
| Q | How did the Fund perform during the Reporting Period? |
| A | During the Reporting Period, the Fund’s Class A, Class C, Institutional, Service, Investor, Class R6, Class R, and Class P Shares generated average annual total returns, without sales charges, of 23.84%, 22.97%, 24.33%, 23.68%, 24.17%, 24.36%, 23.55% and 24.34%, respectively. These returns compare to the 29.13% average annual total return of the Fund’s benchmark, the Russell 1000® Growth Index (with dividends reinvested) (the “Index”), during the same period. |
| Q | What key factors were most responsible for the Fund’s performance during the Reporting Period? |
| A | The Fund uses a quantitative style of management, in combination with a qualitative overlay, that emphasizes fundamentally-based stock selection, careful portfolio construction and efficient implementation. The Fund’s investments are selected using fundamental research and a variety of quantitative techniques based on certain investment themes, including Fundamental Mispricings, High Quality Business Models, Sentiment Analysis and Market Themes & Trends. |
During the Reporting Period, the Fund underperformed the Index, with three of our quantitative model’s four investment themes detracting from performance. Stock selection driven by these investment themes hurt relative returns. |
| Q | What impact did the Fund’s investment themes have on performance during the Reporting Period? |
| A | In keeping with our investment approach, we use our quantitative model and four investment themes to take a long-term view of market patterns and look for inefficiencies, selecting stocks for the Fund and overweighting or underweighting the ones chosen by the model. Over time and by design, the performance of any one of the model’s investment themes tends to have a low correlation with the model’s other themes, demonstrating the diversification benefit of the Fund’s theme-driven quantitative model. The variance in performance supports our research indicating that the diversification provided by our different investment themes is a significant investment advantage over the long term, even though the Fund may experience underperformance in the short term. Of course, diversification does not protect an investor from market risk nor does it ensure a profit. |
During the Reporting Period, three of our four investment themes detracted from the Fund’s relative performance. High Quality Business Models was the Fund’s worst-performing investment theme, followed by Sentiment Analysis. Fundamental Mispricings also detracted from results, albeit to a lesser extent. High Quality Business Models seeks to identify companies that are generating high quality revenues with sustainable business models and aligned management incentives. Sentiment Analysis seeks to identify stocks experiencing improvements in their overall market sentiment. Fundamental Mispricings seeks to identify high quality businesses trading at a fair price, which we believe may lead to strong performance over the long run. |
Our Market Themes & Trends investment theme added to the Fund’s performance during the Reporting Period. Market Themes & Trends seeks to identify companies positively positioned to benefit from themes and trends in the market and macroeconomic environment. |
| Q | How did the Fund’s sector allocations affect relative performance? |
| A | In constructing the Fund’s portfolio, we focus on picking stocks rather than on making sector or industry bets. Consequently, the Fund is similar to the Index in terms of its |
3
PORTFOLIO RESULTS
sector and industry allocations and style. Changes in its sector or industry weights generally do not have a meaningful impact on relative performance. |
| Q | Did stock selection help or hurt Fund performance during the Reporting Period? |
| A | We seek to outpace the Index by overweighting stocks we expect to outperform and underweighting those we think may lag. At the same time, we strive to maintain a risk profile similar to the Index. The Fund’s investments are selected using fundamental research and a variety of quantitative techniques based on our investment themes. For example, the Fund aims to hold a basket of stocks with better Fundamental Mispricings characteristics than the Index. |
During the Reporting Period, stock selection hurt the Fund’s relative performance, led by investments in the financials, real estate and health care sectors. The Fund’s stock selection contributed positively to performance in the information technology, industrials and energy sectors. |
| Q | Which individual stock positions detracted most from the Fund’s results during the Reporting Period? |
| A | In terms of individual stock positions, the Fund was challenged during the Reporting Period by its underweight position relative to the Index in electric vehicle and clean energy company Tesla. Overweights in Synchrony Financial, a consumer financial services company, and Costco Wholesale, which operates a chain of membership-only warehouse clubs, also detracted from performance. The Fund’s underweight in Tesla was primarily due to our High Quality Business Models investment theme and, to a lesser extent, our Fundamental Mispricings and Sentiment Analysis investment themes. We chose to overweight Synchrony Financial largely because of our Fundamental Mispricings and High Quality Business Models investment themes, while the overweight in Costco Wholesale was mainly the result of our High Quality Business Models investment theme. |
| Q | Which individual stock positions contributed most to the Fund’s relative returns during the Reporting Period? |
| A | During the Reporting Period, the Fund was helped by an underweight position in aerospace and defense company Boeing. Overweight positions in Regeneron Pharmaceuticals and Amazon.com also added to relative returns. The underweight in Boeing was driven by all four of our investment themes, led by High Quality Business Models. Our Fundamental Mispricings and Sentiment Analysis investment themes were largely responsible for the Fund’s overweight position in biotechnology company Regeneron Pharmaceuticals. We assumed the overweight in Amazon.com, which focuses on e-commerce, cloud computing, digital streaming and artificial intelligence, primarily because of our Sentiment Analysis investment theme. |
| Q | How did the Fund use derivatives and similar instruments during the Reporting Period? |
| A | During the Reporting Period, we used futures contracts to equitize the Fund’s cash holdings. In other words, we put the Fund’s cash holdings to work by using them as collateral for the purchase of futures contracts. The use of these derivatives did not have a material impact on Fund results during the Reporting Period. |
| Q | What was the Fund’s sector positioning relative to the Index at the end of the Reporting Period? |
| A | At the end of the Reporting Period, the Fund was overweight the real estate and financials sectors relative to the Index. Compared to the Index, the Fund was underweight the information technology, health care and consumer staples sectors. The Fund was relatively neutral compared to the Index in the materials, communication services, industrials, consumer discretionary and energy sectors at the end of the Reporting Period. |
4
FUND BASICS
Large Cap Growth Insights Fund
as of October 31, 2020
| TOP TEN HOLDINGS AS OF 10/31/201 | ||||||||
| Holding | % of Net Assets | Line of Business | ||||||
Apple, Inc. | 10.1 | % | Technology Hardware, Storage & Peripherals | |||||
Microsoft Corp. | 9.1 | Software | ||||||
Amazon.com, Inc. | 8.6 | Internet & Direct Marketing Retail | ||||||
Facebook, Inc., Class A | 4.2 | Interactive Media & Services | ||||||
Alphabet, Inc., Class C | 3.7 | Interactive Media & Services | ||||||
Adobe, Inc. | 2.3 | Software | ||||||
PayPal Holdings, Inc. | 2.0 | IT Services | ||||||
Visa, Inc., Class A | 1.9 | IT Services | ||||||
Costco Wholesale Corp. | 1.9 | Food & Staples Retailing | ||||||
Netflix, Inc. | 1.9 | Entertainment | ||||||
| 1 | The top 10 holdings may not be representative of the Fund’s future investments. |
| FUND VS. BENCHMARK SECTOR ALLOCATIONS2 |
| As of October 31, 2020 |
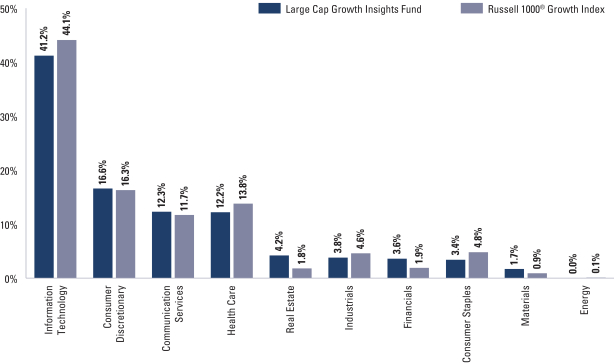
| 2 | The Fund is actively managed and, as such, its composition may differ over time. Consequently, the Fund’s overall sector allocations may differ from the percentages contained in the graph above. The graph categorizes investments using the Global Industry Classification Standard (“GICS”); however, the sector classifications used by the portfolio management team may differ from GICS. The percentage shown for each investment category reflects the value of investments in that category as a percentage of market value (excluding investments in the securities lending reinvestment vehicle, if any). The graph depicts the Fund’s investments but may not represent the Fund’s market exposure due to the exclusion of certain derivatives, if any, as listed in the Additional Investment Information section of the Schedule of Investments. |
For more information about your Fund, please refer to www.GSAMFUNDS.com. There, you can learn more about your Fund’s investment strategies, holdings, and performance.
5
GOLDMAN SACHS LARGE CAP GROWTH INSIGHTS FUND
Performance Summary
October 31, 2020
The following graph shows the value, as of October 31, 2020, of a $1,000,000 investment made on November 1, 2010 in Institutional Shares at NAV. For comparative purposes, the performance of the Fund’s benchmark, the Russell 1000® Growth Index (with dividends reinvested), is shown. Performance reflects applicable fee waivers and/or expense limitations in effect during the periods shown and in their absence, performance would be reduced. Returns do not reflect the deduction of taxes that a shareholder would pay on Fund distributions or the redemption of Fund shares. The returns set forth below represent past performance. Past performance does not guarantee future results. The Fund’s investment return and principal value will fluctuate so that an investor’s shares, when redeemed, may be worth more or less than their original cost. Current performance may be lower or higher than the performance quoted below. Please visit our web site at www.GSAMFUNDS.com to obtain the most recent month-end returns.
| Large Cap Growth Insights Fund’s 10 Year Performance |
Performance of a $1,000,000 investment, including any applicable sales charges, with distributions reinvested, from November 1, 2010 through October 31, 2020.
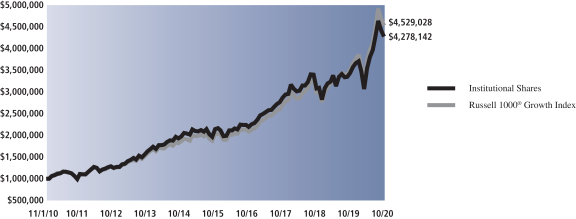
| Average Annual Total Return through October 31, 2020* | One Year | Five Years | Ten Years | Since Inception | ||||||||||
Class A | ||||||||||||||
Excluding sales charges | 23.84% | 14.34% | 15.17% | — | ||||||||||
Including sales charges | 17.03% | 13.05% | 14.52% | — | ||||||||||
| ||||||||||||||
Class C | ||||||||||||||
Excluding contingent deferred sales charges | 22.97% | 13.50% | 14.32% | — | ||||||||||
Including contingent deferred sales charges | 21.93% | 13.50% | 14.32% | — | ||||||||||
| ||||||||||||||
Institutional | 24.33% | 14.80% | 15.63% | — | ||||||||||
| ||||||||||||||
Service | 23.68% | 14.22% | 15.05% | — | ||||||||||
| ||||||||||||||
Investor | 24.17% | 14.63% | 15.45% | — | ||||||||||
| ||||||||||||||
Class R6 (Commenced July 31, 2015) | 24.36% | 14.81% | N/A | 14.01% | ||||||||||
| ||||||||||||||
Class R | 23.55% | 14.06% | 14.88% | — | ||||||||||
| ||||||||||||||
Class P (Commenced April 16, 2018) | 24.34% | N/A | N/A | 13.90% | ||||||||||
| ||||||||||||||
| * | These returns assume reinvestment of all distributions at NAV and reflect a maximum initial sales charge of 5.50% for Class A Shares and the assumed contingent deferred sales charge for Class C Shares (1% if redeemed within 12 months of purchase). Because Institutional, Service, Investor, Class R6, Class R and Class P Shares do not involve a sales charge, such a charge is not applied to their Average Annual Total Return. |
6
PORTFOLIO RESULTS
Goldman Sachs Large Cap Value Insights Fund
Investment Objective
The Fund seeks long-term growth of capital and dividend income.
Portfolio Management Discussion and Analysis
Below, the Goldman Sachs Quantitative Investment Strategies Team discusses the Goldman Sachs Large Cap Value Insights Fund’s (the “Fund”) performance and positioning for the 12-month period ended October 31, 2020 (the “Reporting Period”).
| Q | How did the Fund perform during the Reporting Period? |
| A | During the Reporting Period, the Fund’s Class A, Class C, Institutional, Service, Investor, Class R6, Class R, and Class P Shares generated average annual total returns, without sales charges, of -8.34%, -9.02%, -7.98%, -8.44%, -8.09%, -7.97%, -8.58% and -7.97%, respectively. These returns compare to the -7.55% average annual total return of the Fund’s benchmark, the Russell 1000® Value Index (with dividends reinvested) (the “Index”), during the same period. |
| Q | What key factors were most responsible for the Fund’s performance during the Reporting Period? |
| A | The Fund uses a quantitative style of management, in combination with a qualitative overlay, that emphasizes fundamentally-based stock selection, careful portfolio construction and efficient implementation. The Fund’s investments are selected using fundamental research and a variety of quantitative techniques based on certain investment themes, including Fundamental Mispricings, High Quality Business Models, Sentiment Analysis and Market Themes & Trends. |
During the Reporting Period, the Fund underperformed the Index, with two of our quantitative model’s four investment themes detracting from returns. Stock selection driven by these investment themes dampened relative returns. |
| Q | What impact did the Fund’s investment themes have on performance during the Reporting Period? |
| A | In keeping with our investment approach, we use our quantitative model and four investment themes to take a long-term view of market patterns and look for inefficiencies, selecting stocks for the Fund and overweighting or underweighting the ones chosen by the model. Over time and by design, the performance of any one of the model’s investment themes tends to have a low correlation with the model’s other themes, demonstrating the diversification benefit of the Fund’s theme-driven quantitative model. The variance in performance supports our research indicating that the diversification provided by our different investment themes is a significant investment advantage over the long term, even though the Fund may experience underperformance in the short term. Of course, diversification does not protect an investor from market risk nor does it ensure a profit. |
During the Reporting Period, two of our investment themes — Sentiment Analysis and High Quality Business Models — detracted from the Fund’s relative performance. Sentiment Analysis seeks to identify stocks experiencing improvements in their overall market sentiment. High Quality Business Models seeks to identify companies that are generating high quality revenues with sustainable business models and aligned management incentives. |
Our Fundamental Mispricings and Market Themes & Trends investment themes contributed positively to relative returns during the Reporting Period. Fundamental Mispricings seeks to identify high quality businesses trading at a fair price, which we believe may lead to strong performance over the long run. Market Themes & Trends seeks to identify companies positively positioned to benefit from themes and trends in the market and macroeconomic environment. |
| Q | How did the Fund’s sector allocations affect relative performance? |
| A | In constructing the Fund’s portfolio, we focus on picking stocks rather than on making sector or industry bets. Consequently, the Fund is similar to the Index in terms of its sector and industry allocations and style. Changes in its sector or industry weights generally do not have a meaningful impact on relative performance. |
7
PORTFOLIO RESULTS
| Q | Did stock selection help or hurt Fund performance during the Reporting Period? |
| A | We seek to outpace the Index by overweighting stocks we expect to outperform and underweighting those we think may lag. At the same time, we strive to maintain a risk profile similar to the Index. The Fund’s investments are selected using fundamental research and a variety of quantitative techniques based on our investment themes. For example, the Fund aims to hold a basket of stocks with better Fundamental Mispricings characteristics than the Index. |
During the Reporting Period, stock selection within the industrials, financials and materials sectors detracted from results. Stock selection in information technology, energy and communication services sectors added to relative returns. |
| Q | Which individual stock positions detracted most from the Fund’s results during the Reporting Period? |
| A | In terms of individual stock positions, the Fund was hurt by its underweight positions relative to the Index in Danaher and Berkshire Hathaway and by its overweight position in Reinsurance Group of America. We chose to underweight Danaher, which designs and manufactures professional, medical, industrial and commercial products and services, largely because of our High Quality Business Models and Sentiment Analysis investment themes. Our Sentiment Analysis and Market Themes & Trends investment themes led to the Fund’s underweight in conglomerate holding company Berkshire Hathaway. The overweight in life and health reinsurance company Reinsurance Group of America was mainly the result our Fundamental Mispricings investment theme. |
| Q | Which individual stock positions contributed most to the Fund’s relative returns during the Reporting Period? |
| A | During the Reporting Period, an underweight position in energy company Exxon Mobil bolstered the Fund’s relative results. The Fund also benefited from overweights in Amazon.com, which focuses on e-commerce, cloud computing, digital streaming and artificial intelligence, and in Pinterest, an image sharing and social media service. We adopted the underweight in Exxon Mobil mostly because of our Sentiment Analysis investment theme. The overweights in Amazon.com and Pinterest were based largely on our Sentiment Analysis and Market Themes & Trends investment themes. |
| Q | How did the Fund use derivatives and similar instruments during the Reporting Period? |
| A | During the Reporting Period, we used futures contracts to equitize the Fund’s cash holdings. In other words, we put the Fund’s cash holdings to work by using them as collateral for the purchase of futures contracts. The use of these derivatives did not have a material impact on Fund results during the Reporting Period. |
| Q | What was the Fund’s sector positioning relative to the Index at the end of the Reporting Period? |
| A | At the end of the Reporting Period, the Fund was overweight the health care, real estate, financials and materials sectors relative to the Index. Compared to the Index, the Fund was underweight the utilities, industrials, consumer staples, energy and communication services sectors. The Fund was relatively neutral in the information technology and consumer discretionary sectors at the end of the Reporting Period. |
8
FUND BASICS
Large Cap Value Insights Fund
as of October 31, 2020
| TOP TEN HOLDINGS AS OF 10/31/201 | ||||||||
| Holding | % of Net Assets | Line of Business | ||||||
| Alphabet, Inc., Class A | 2.5 | % | Interactive Media & Services | |||||
| Walmart, Inc. | 2.3 | Food & Staples Retailing | ||||||
| Johnson & Johnson | 2.3 | Pharmaceuticals | ||||||
| Berkshire Hathaway, Inc., Class B | 1.7 | Diversified Financial Services | ||||||
| Linde PLC | 1.6 | Chemicals | ||||||
| Prologis, Inc. REIT | 1.5 | Equity Real Estate Investment Trusts (REITs) | ||||||
| Target Corp. | 1.5 | Multiline Retail | ||||||
| Texas Instruments, Inc. | 1.5 | Semiconductors & Semiconductor Equipment | ||||||
| Fidelity National Information Services, Inc. | 1.5 | IT Services | ||||||
| Bank of America Corp. | 1.5 | Banks | ||||||
| 1 | The top 10 holdings may not be representative of the Fund’s future investments. The top 10 holdings exclude investments in money market funds. |
| FUND VS. BENCHMARK SECTOR ALLOCATIONS2 |
| As of October 31, 2020 |
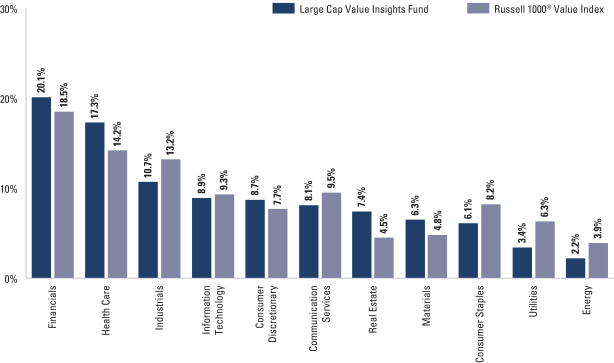
| 2 | The Fund is actively managed and, as such, its composition may differ over time. Consequently, the Fund’s overall sector allocations may differ from the percentages contained in the graph above. The graph categorizes investments using the Global Industry Classification Standard (“GICS”); however, the sector classifications used by the portfolio management team may differ from GICS. The percentage shown for each investment category reflects the value of investments in that category as a percentage of market value. The graph depicts the Fund’s investments but may not represent the Fund’s market exposure due to the exclusion of certain derivatives, if any, as listed in the Additional Investment Information section of the Schedule of Investments. |
For more information about your Fund, please refer to www.GSAMFUNDS.com. There, you can learn more about your Fund’s investment strategies, holdings, and performance.
9
GOLDMAN SACHS LARGE CAP VALUE INSIGHTS FUND
Performance Summary
October 31, 2020
The following graph shows the value, as of October 31, 2020, of a $1,000,000 investment made on November 1, 2010 in Institutional Shares at NAV. For comparative purposes, the performance of the Fund’s benchmark, the Russell 1000® Value Index (with dividends reinvested), is shown. Performance reflects applicable fee waivers and/or expense limitations in effect during the periods shown and in their absence, performance would be reduced. Returns do not reflect the deduction of taxes that a shareholder would pay on Fund distributions or the redemption of Fund shares. The returns set forth below represent past performance. Past performance does not guarantee future results. The Fund’s investment return and principal value will fluctuate so that an investor’s shares, when redeemed, may be worth more or less than their original cost. Current performance may be lower or higher than the performance quoted below. Please visit our web site at www.GSAMFUNDS.com to obtain the most recent month-end returns.
| Large Cap Value Insights Fund’s 10 Year Performance |
Performance of a $1,000,000 investment, including any applicable sales charges, with distributions reinvested, from November 1, 2010 through October 31, 2020.
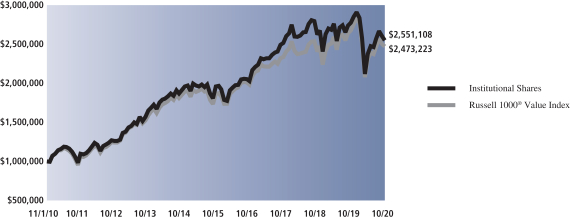
| Average Annual Total Return through October 31, 2020* | One Year | Five Years | Ten Years | Since Inception | ||||||||||
Class A | ||||||||||||||
Excluding sales charges | -8.34% | 5.04% | 9.37% | — | ||||||||||
Including sales charges | -13.38% | 3.86% | 8.76% | — | ||||||||||
| ||||||||||||||
Class C | ||||||||||||||
Excluding contingent deferred sales charges | -9.02% | 4.25% | 8.56% | — | ||||||||||
Including contingent deferred sales charges | -9.93% | 4.25% | 8.56% | — | ||||||||||
| ||||||||||||||
Institutional | -7.98% | 5.43% | 9.81% | — | ||||||||||
| ||||||||||||||
Service | -8.44% | 4.92% | 9.26% | — | ||||||||||
| ||||||||||||||
Investor | -8.09% | 5.29% | 9.65% | — | ||||||||||
| ||||||||||||||
Class R6 (Commenced July 31, 2015) | -7.97% | 5.46% | N/A | 4.91% | ||||||||||
| ||||||||||||||
Class R | -8.58% | 4.76% | 9.10% | — | ||||||||||
| ||||||||||||||
Class P (Commenced April 16, 2018) | -7.97% | N/A | N/A | -1.38% | ||||||||||
| ||||||||||||||
| * | These returns assume reinvestment of all distributions at NAV and reflect a maximum initial sales charge of 5.50% for Class A Shares and the assumed contingent deferred sales charge for Class C Shares (1% if redeemed within 12 months of purchase). Because Institutional, Service, Investor, Class R6, Class R and Class P Shares do not involve a sales charge, such a charge is not applied to their Average Annual Total Return. |
10
PORTFOLIO RESULTS
Goldman Sachs Small Cap Equity Insights Fund
Investment Objective
The Fund seeks long-term growth of capital.
Portfolio Management Discussion and Analysis
Below, the Goldman Sachs Quantitative Investment Strategies Team discusses the Goldman Sachs Small Cap Equity Insights Fund’s (the “Fund”) performance and positioning for the 12-month period ended October 31, 2020 (the “Reporting Period”).
| Q | How did the Fund perform during the Reporting Period? |
| A | During the Reporting Period, the Fund’s Class A, Class C, Institutional, Service, Investor, Class R6, Class R, and Class P Shares generated average annual total returns, without sales charges, of -10.18%, -10.82%, -9.82%, -10.29%, -9.95%, -9.81%, -10.39% and -9.81%, respectively. These returns compare to the -0.14% average annual total return of the Fund’s benchmark, the Russell 2000® Index (with dividends reinvested) (the “Index”), during the same period. |
| Q | What key factors were most responsible for the Fund’s performance during the Reporting Period? |
| A | The Fund uses a quantitative style of management, in combination with a qualitative overlay, that emphasizes fundamentally-based stock selection, careful portfolio construction and efficient implementation. The Fund’s investments are selected using fundamental research and a variety of quantitative techniques based on certain investment themes, including Fundamental Mispricings, High Quality Business Models, Sentiment Analysis and Market Themes & Trends. |
| During the Reporting Period, the Fund underperformed the Index, with three of our quantitative model’s four investment themes detracting from performance. Stock selection driven by these investment themes also hurt relative returns. |
| Q | What impact did the Fund’s investment themes have on performance during the Reporting Period? |
| A | In keeping with our investment approach, we use our quantitative model and four investment themes to take a long-term view of market patterns and look for inefficiencies, selecting stocks for the Fund and overweighting or underweighting the ones chosen by the model. Over time and by design, the performance of any one of the model’s investment themes tends to have a low correlation with the model’s other themes, demonstrating the diversification benefit of the Fund’s theme-driven quantitative model. The variance in performance supports our research indicating that the diversification provided by our different investment themes is a significant investment advantage over the long term, even though the Fund may experience underperformance in the short term. Of course, diversification does not protect an investor from market risk nor does it ensure a profit. |
| During the Reporting Period, three of our investment themes detracted from the Fund’s relative returns. Our Sentiment Analysis and High Quality Business Models investment themes were the most challenged. Fundamental Mispricings also hampered results, albeit to a lesser extent. Sentiment Analysis seeks to identify stocks experiencing improvements in their overall market sentiment. High Quality Business Models seeks to identify companies that are generating high quality revenues with sustainable business models and aligned management incentives. Fundamental Mispricings seeks to identify high quality businesses trading at a fair price, which we believe may lead to strong performance over the long run. |
| The Market Themes & Trends investment theme added slightly to performance during the Reporting Period. Market Themes & Trends seeks to identify companies positively positioned to benefit from themes and trends in the market and macroeconomic environment. |
| Q | How did the Fund’s sector allocations affect relative performance? |
| A | In constructing the Fund’s portfolio, we focus on picking stocks rather than on making sector or industry bets. Consequently, the Fund is similar to the Index in terms of its sector and industry allocations and style. Changes in its |
11
PORTFOLIO RESULTS
sector or industry weights generally do not have a meaningful impact on relative performance. |
| Q | Did stock selection help or hurt Fund performance during the Reporting Period? |
| A | We seek to outpace the Index by overweighting stocks we expect to outperform and underweighting those we think may lag. At the same time, we strive to maintain a risk profile similar to the Index. The Fund’s investments are selected using fundamental research and a variety of quantitative techniques based on our investment themes. For example, the Fund aims to hold a basket of stocks with better Fundamental Mispricings characteristics than the Index. |
| During the Reporting Period, the Fund’s stock selection within the health care, industrials and consumer discretionary sectors detracted from relative returns. On the positive side, stock selection in the financials, real estate and energy sectors added to the Fund’s performance. |
| Q | Which individual stock positions detracted most from the Fund’s results during the Reporting Period? |
| A | In terms of individual stock positions, the Fund was hurt by its overweight position compared to the Index in ANI Pharmaceuticals. Underweight positions in MyoKardia and Penn National Gaming also detracted from the Fund’s relative performance. Our High Quality Business Models and Sentiment Analysis investment themes drove the Fund’s overweight in ANI Pharmaceuticals, an integrated specialty pharmaceutical company. The underweight in MyoKardia, a clinical stage biopharmaceutical company, was largely due to our Sentiment Analysis and Fundamental Mispricings investment themes. We chose to underweight Penn National Gaming, which operates casinos and racetracks, mainly because of our High Quality Business Models and Fundamental Mispricings investment themes. |
| Q | Which individual stock positions contributed most to the Fund’s relative returns during the Reporting Period? |
| A | During the Reporting Period, the Fund benefited from its overweight positions in Goosehead Insurance, a personal lines insurance agency; Darling Ingredients, a developer and producer of sustainable natural ingredients from edible and inedible bio-nutrients; and Inphi, a provider of high-speed data movement interconnects. The overweight in Goosehead Insurance was primarily due to our Fundamental Mispricings and Market Themes & Trends investment themes. Our High Quality Business Models and Sentiment Analysis investment themes led to the overweights in Darling Ingredients and Inphi. |
| Q | How did the Fund use derivatives and similar instruments during the Reporting Period? |
| A | During the Reporting Period, we used futures contracts to equitize the Fund’s cash holdings. In other words, we put the Fund’s cash holdings to work by using them as collateral for the purchase of futures contracts. The use of these derivatives did not have a material impact on Fund results during the Reporting Period. |
| Q | What was the Fund’s sector positioning relative to the Index at the end of the Reporting Period? |
| A | At the end of the Reporting Period, the Fund was overweight the consumer discretionary, materials, communication services and real estate sectors relative to the Index. Compared to the Index, the Fund was underweight the health care, information technology, utilities and industrials sectors. The Fund was relatively neutral versus the Index in the financials, consumer staples and energy sectors at the end of the Reporting Period. |
12
FUND BASICS
Small Cap Equity Insights Fund
as of October 31, 2020
| TOP TEN HOLDINGS AS OF 10/31/201 | ||||||||
| Holding | % of Net Assets | Line of Business | ||||||
| BJ’s Wholesale Club Holdings, Inc. | 0.8 | % | Food & Staples Retailing | |||||
| Simpson Manufacturing Co., Inc. | 0.8 | Building Products | ||||||
| Rexnord Corp. | 0.8 | Machinery | ||||||
| Louisiana-Pacific Corp. | 0.8 | Paper & Forest Products | ||||||
| Rush Enterprises, Inc., Class A | 0.7 | Trading Companies & Distributors | ||||||
| Mirati Therapeutics, Inc. | 0.7 | Biotechnology | ||||||
| NorthWestern Corp. | 0.7 | Multi-Utilities | ||||||
| PotlatchDeltic Corp. REIT | 0.7 | Equity Real Estate Investment Trusts (REITs) | ||||||
| Emergent BioSolutions, Inc. | 0.7 | Biotechnology | ||||||
| Xencor, Inc. | 0.7 | Biotechnology | ||||||
| 1 | The top 10 holdings may not be representative of the Fund’s future investments. The top 10 holdings exclude investments in money market funds. |
FUND VS. BENCHMARK SECTOR ALLOCATIONS2 | ||||
| As of October 31, 2020 | ||||
| 2 | The Fund is actively managed and, as such, its composition may differ over time. Consequently, the Fund’s overall sector allocations may differ from the percentages contained in the graph above. The graph categorizes investments using the Global Industry Classification Standard (“GICS”); however, the sector classifications used by the portfolio management team may differ from GICS. The percentage shown for each investment category reflects the value of investments in that category as a percentage of market value (excluding investments in the securities lending reinvestment vehicle, if any). Investments in the securities lending reinvestment vehicle represented 0.9% of the Fund’s net assets as of October 31, 2020. The graph depicts the Fund’s investments but may not represent the Fund’s market exposure due to the exclusion of certain derivatives, if any, as listed in the Additional Investment Information section of the Schedule of Investments. |
For more information about your Fund, please refer to www.GSAMFUNDS.com. There, you can learn more about your Fund’s investment strategies, holdings, and performance.
13
GOLDMAN SACHS SMALL CAP EQUITY INSIGHTS FUND
Performance Summary
October 31, 2020
The following graph shows the value, as of October 31, 2020, of a $1,000,000 investment made on November 1, 2010 in Institutional Shares at NAV. For comparative purposes, the performance of the Fund’s benchmark, the Russell 2000® Index (with dividends reinvested), is shown. Performance reflects applicable fee waivers and/or expense limitations in effect during the periods shown and in their absence, performance would be reduced. Returns do not reflect the deduction of taxes that a shareholder would pay on Fund distributions or the redemption of Fund shares. The returns set forth below represent past performance. Past performance does not guarantee future results. The Fund’s investment return and principal value will fluctuate so that an investor’s shares, when redeemed, may be worth more or less than their original cost. Current performance may be lower or higher than the performance quoted below. Please visit our web site at www.GSAMFUNDS.com to obtain the most recent month-end returns.
| Small Cap Equity Insights Fund’s 10 Year Performance |
Performance of a $1,000,000 investment, including any applicable sales charges, with distributions reinvested, from November 1, 2010 through October 31, 2020.
| Average Annual Total Return through October 31, 2020* | One Year | Five Years | Ten Years | Since Inception | ||||||||||
Class A | ||||||||||||||
Excluding sales charges | -10.18% | 5.11% | 8.67% | — | ||||||||||
Including sales charges | -15.11% | 3.93% | 8.06% | — | ||||||||||
| ||||||||||||||
Class C | ||||||||||||||
Excluding contingent deferred sales charges | -10.82% | 4.33% | 7.86% | — | ||||||||||
Including contingent deferred sales charges | -11.71% | 4.33% | 7.86% | — | ||||||||||
| ||||||||||||||
Institutional | -9.82% | 5.52% | 9.11% | — | ||||||||||
| ||||||||||||||
Service | -10.29% | 4.99% | 8.55% | — | ||||||||||
| ||||||||||||||
Investor | -9.95% | 5.37% | 8.95% | — | ||||||||||
| ||||||||||||||
Class R6 (Commenced July 31, 2015) | -9.81% | 5.54% | N/A | 4.89% | ||||||||||
| ||||||||||||||
Class R | -10.39% | 4.84% | 8.41% | — | ||||||||||
| ||||||||||||||
Class P (Commenced April 16, 2018) | -9.81% | N/A | N/A | -2.37% | ||||||||||
| ||||||||||||||
| * | These returns assume reinvestment of all distributions at NAV and reflect a maximum initial sales charge of 5.50% for Class A Shares and the assumed contingent deferred sales charge for Class C Shares (1% if redeemed within 12 months of purchase). Because Institutional, Service, Investor, Class R6, Class R and Class P Shares do not involve a sales charge, such a charge is not applied to their Average Annual Total Return. |
14
PORTFOLIO RESULTS
Goldman Sachs Small Cap Growth Insights Fund
Investment Objective
The Fund seeks long-term growth of capital.
Portfolio Management Discussion and Analysis
Below, the Goldman Sachs Quantitative Investment Strategies Team discusses the Goldman Sachs Small Cap Growth Insights Fund’s (the “Fund”) performance and positioning for the 12-month period ended October 31, 2020 (the “Reporting Period”).
| Q | How did the Fund perform during the Reporting Period? |
| A | During the Reporting Period, the Fund’s Class A, Class C, Institutional, Investor, Class R6, Class R, and Class P Shares generated average annual total returns, without sales charges, of -0.95%, -1.70%, -0.57%, -0.72%, -0.57%, -1.23% and -0.57%, respectively. These returns compare to the 13.33% average annual total return of the Fund’s benchmark, the Russell 2000® Growth Index (with dividends reinvested) (the “Index”), during the same period. |
| Q | What key factors were most responsible for the Fund’s performance during the Reporting Period? |
| A | The Fund uses a quantitative style of management, in combination with a qualitative overlay, that emphasizes fundamentally-based stock selection, careful portfolio construction and efficient implementation. The Fund’s investments are selected using fundamental research and a variety of quantitative techniques based on certain investment themes, including Fundamental Mispricings, High Quality Business Models, Sentiment Analysis and Market Themes & Trends. |
| During the Reporting Period, the Fund underperformed the Index, with all four of our quantitative model’s investment themes detracting from returns. Stock selection driven by these investment themes also hindered relative returns. |
| Q | What impact did the Fund’s investment themes have on performance during the Reporting Period? |
| A | In keeping with our investment approach, we use our quantitative model and four investment themes to take a long-term view of market patterns and look for inefficiencies, selecting stocks for the Fund and overweighting or underweighting the ones chosen by the model. Over time and by design, the performance of any one of the model’s investment themes tends to have a low correlation with the model’s other themes, demonstrating the diversification benefit of the Fund’s theme-driven quantitative model. The variance in performance supports our research indicating that the diversification provided by our different investment themes is a significant investment advantage over the long term, even though the Fund may experience underperformance in the short term. Of course, diversification does not protect an investor from market risk nor does it ensure a profit. |
| During the Reporting Period, all four of our investment themes detracted from the Fund’s relative performance. Our Sentiment Analysis and High Quality Business Models investment themes were the most challenged, followed by our Fundamental Mispricings and Market Themes & Trends investment themes. Sentiment Analysis seeks to identify stocks experiencing improvements in their overall market sentiment. High Quality Business Models seeks to identify companies that are generating high quality revenues with sustainable business models and aligned management incentives. Fundamental Mispricings seeks to identify high quality businesses trading at a fair price, which we believe may lead to strong performance over the long run. Market Themes & Trends seeks to identify companies positively positioned to benefit from themes and trends in the market and macroeconomic environment. |
| Q | How did the Fund’s sector allocations affect relative performance? |
| A | In constructing the Fund’s portfolio, we focus on picking stocks rather than on making sector or industry bets. Consequently, the Fund is similar to the Index in terms of its sector and industry allocations and style. Changes in its sector or industry weights generally do not have a meaningful impact on relative performance. |
15
PORTFOLIO RESULTS
| Q | Did stock selection help or hurt Fund performance during the Reporting Period? |
| A | We seek to outpace the Index by overweighting stocks we expect to outperform and underweighting those we think may lag. At the same time, we strive to maintain a risk profile similar to the Index. The Fund’s investments are selected using fundamental research and a variety of quantitative techniques based on our investment themes. For example, the Fund aims to hold a basket of stocks with better Fundamental Mispricings characteristics than the Index. |
| During the Reporting Period, the Fund was hurt by stock selection in the health care, industrials and consumer discretionary sectors. Stock selection in the utilities sector contributed positively to relative performance. |
| Q | Which individual stock positions detracted most from the Fund’s results during the Reporting Period? |
| A | In terms of individual stock positions, an overweight relative to the Index in ANI Pharmaceuticals detracted from performance. Underweight positions in iRhythm Technologies and Plug Power also hampered results. Our High Quality Business Models and Sentiment Analysis investment themes drove the Fund’s overweight in ANI Pharmaceuticals, an integrated specialty pharmaceutical company. The Fund’s underweight in iRhythm Technologies, which provides diagnostic monitoring solutions that facilitate the early diagnosis and treatment of cardiac arrhythmia, was largely due to our High Quality Business Models and Sentiment Analysis investment themes. We adopted the underweight in Plug Power, which is engaged in the development of hydrogen fuel cell systems, mainly because of our High Quality Business Models investment theme. |
| Q | Which individual stock positions contributed most to the Fund’s relative returns during the Reporting Period? |
| A | During the Reporting Period, the Fund benefited from its overweight positions in personal lines insurance agency Goosehead Insurance; software company Five9; and pet insurance provider Trupanion. We chose to overweight Goosehead Insurance primarily because of our Fundamental Mispricings and Market Themes & Trends investment themes. Our High Quality Business Models and Market Themes & Trends investment themes led to the overweight in Five9. The overweight in Trupanion was mostly because of our Market Themes & Trends and Fundamental Mispricings investment themes. |
| Q | How did the Fund use derivatives and similar instruments during the Reporting Period? |
| A | During the Reporting Period, we used futures contracts to equitize the Fund’s cash holdings. In other words, we put the Fund’s cash holdings to work by using them as collateral for the purchase of futures contracts. The use of these derivatives did not have a material impact to the Fund’s relative results during the Reporting Period. |
| Q | What was the Fund’s sector positioning relative to the Index at the end of the Reporting Period? |
| A | At the end of the Reporting Period, the Fund was overweight the financials, communication services, materials and real estate sectors relative to the Index. Compared to the Index, the Fund was underweight the information technology, health care and utilities sectors. The Fund was relatively neutral compared to the Index in the consumer staples, consumer discretionary, energy and industrials sectors at the end of the Reporting Period. |
16
FUND BASICS
Small Cap Growth Insights Fund
as of October 31, 2020
| TOP TEN HOLDINGS AS OF 10/31/201 | ||||||||
| Holding | % of Net Assets | Line of Business | ||||||
| Mirati Therapeutics, Inc. | 1.2 | % | Biotechnology | |||||
| BJ’s Wholesale Club Holdings, Inc. | 1.1 | Food & Staples Retailing | ||||||
| Natera, Inc. | 1.0 | Biotechnology | ||||||
| Simpson Manufacturing Co., Inc. | 1.0 | Building Products | ||||||
| Louisiana-Pacific Corp. | 0.9 | Paper & Forest Products | ||||||
| Emergent BioSolutions, Inc. | 0.9 | Biotechnology | ||||||
| Neogen Corp. | 0.9 | Health Care Equipment & Supplies | ||||||
| Power Integrations, Inc. | 0.9 | Semiconductors & Semiconductor Equipment | ||||||
| Wingstop, Inc. | 0.9 | Hotels, Restaurants & Leisure | ||||||
| Novanta, Inc. | 0.9 | Electronic Equipment, Instruments & Components | ||||||
| 1 | The top 10 holdings may not be representative of the Fund’s future investments. The top 10 holdings exclude investments in money market funds. |
| FUND VS. BENCHMARK SECTOR ALLOCATIONS2 | ||||
| As of October 31, 2020 | ||||
| 2 | The Fund is actively managed and, as such, its composition may differ over time. Consequently, the Fund’s overall sector allocations may differ from the percentages contained in the graph above. The graph categorizes investments using the Global Industry Classification Standard (“GICS”); however, the sector classifications used by the portfolio management team may differ from GICS. The percentage shown for each investment category reflects the value of investments in that category as a percentage of market value (excluding investments in the securities lending reinvestment vehicle, if any). Investments in the securities lending reinvestment vehicle represented 1.1% of the Fund’s net assets as of October 31, 2020. The graph depicts the Fund’s investments but may not represent the Fund’s market exposure due to the exclusion of certain derivatives, if any, as listed in the Additional Investment Information section of the Schedule of Investments. Percentages may not sum to 100% due to rounding. |
For more information about your Fund, please refer to www.GSAMFUNDS.com. There, you can learn more about your Fund’s investment strategies, holdings, and performance.
17
GOLDMAN SACHS SMALL CAP GROWTH INSIGHTS FUND
Performance Summary
October 31, 2020
The following graph shows the value, as of October 31, 2020, of a $1,000,000 investment made on November 1, 2010 in Institutional Shares at NAV. For comparative purposes, the performance of the Fund’s benchmark, the Russell 2000® Growth Index (with dividends reinvested), is shown. Performance reflects applicable fee waivers and/or expense limitations in effect during the periods shown and in their absence, performance would be reduced. Returns do not reflect the deduction of taxes that a shareholder would pay on Fund distributions or the redemption of Fund shares. The returns set forth below represent past performance. Past performance does not guarantee future results. The Fund’s investment return and principal value will fluctuate so that an investor’s shares, when redeemed, may be worth more or less than their original cost. Current performance may be lower or higher than the performance quoted below. Please visit our web site at www.GSAMFUNDS.com to obtain the most recent month-end returns.
| Small Cap Growth Insights Fund’s 10 Year Performance |
Performance of a $1,000,000 investment, including any applicable sales charges, with distributions reinvested, from November 1, 2010, through October 31, 2020.
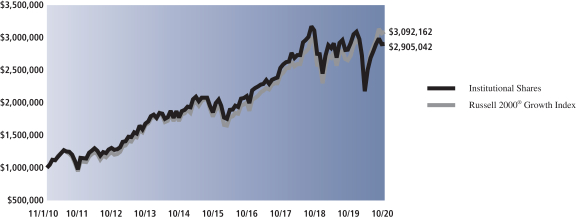
| Average Annual Total Return through October 31, 2020* | One Year | Five Years | Ten Years | Since Inception | ||||||||||
Class A | ||||||||||||||
Excluding sales charges | -0.95% | 7.40% | 10.81% | — | ||||||||||
Including sales charges | -6.37% | 6.20% | 10.18% | — | ||||||||||
| ||||||||||||||
Class C | ||||||||||||||
Excluding contingent deferred sales charges | -1.70% | 6.60% | 9.98% | — | ||||||||||
Including contingent deferred sales charges | -2.68% | 6.60% | 9.98% | — | ||||||||||
| ||||||||||||||
Institutional | -0.57% | 7.82% | 11.24% | — | ||||||||||
| ||||||||||||||
Investor | -0.72% | 7.66% | 11.08% | — | ||||||||||
| ||||||||||||||
Class R6 (Commenced July 31, 2015) | -0.57% | 7.83% | N/A | 6.60% | ||||||||||
| ||||||||||||||
Class R | -1.23% | 7.13% | 10.53% | — | ||||||||||
| ||||||||||||||
Class P (Commenced April 16, 2018) | -0.57% | N/A | N/A | 1.43% | ||||||||||
| ||||||||||||||
| * | These returns assume reinvestment of all distributions at NAV and reflect a maximum initial sales charge of 5.50% for Class A Shares and the assumed contingent deferred sales charge for Class C Shares (1% if redeemed within 12 months of purchase). Because Institutional, Investor, Class R6, Class R and Class P Shares do not involve a sales charge, such a charge is not applied to their Average Annual Total Return. |
18
PORTFOLIO RESULTS
Goldman Sachs Small Cap Value Insights Fund
Investment Objective
The Fund seeks long-term growth of capital.
Portfolio Management Discussion and Analysis
Below, the Goldman Sachs Quantitative Investment Strategies Team discusses the Goldman Sachs Small Cap Value Insights Fund’s (the “Fund”) performance and positioning for the 12-month period ended October 31, 2020 (the “Reporting Period”).
| Q | How did the Fund perform during the Reporting Period? |
| A | During the Reporting Period, the Fund’s Class A, Class C, Institutional, Investor, Class R6, Class R, and Class P Shares generated average annual total returns, without sales charges, of -16.49%, -17.11%, -16.19%, -16.32%, -16.17%, -16.70% and -16.18%, respectively. These returns compare to the -13.89% average annual total return of the Fund’s benchmark, the Russell 2000® Value Index (with dividends reinvested) (the “Index”), during the same period. |
| Q | What key factors were most responsible for the Fund’s performance during the Reporting Period? |
| A | The Fund uses a quantitative style of management, in combination with a qualitative overlay, that emphasizes fundamentally-based stock selection, careful portfolio construction and efficient implementation. The Fund’s investments are selected using fundamental research and a variety of quantitative techniques based on certain investment themes, including Fundamental Mispricings, High Quality Business Models, Sentiment Analysis and Market Themes & Trends. |
| During the Reporting Period, the Fund underperformed the Index, with two of our quantitative model’s four investment themes detracting from returns. Stock selection driven by these investment themes also hurt relative returns. |
| Q | What impact did the Fund’s investment themes have on performance during the Reporting Period? |
| A | In keeping with our investment approach, we use our quantitative model and four investment themes to take a long-term view of market patterns and look for inefficiencies, selecting stocks for the Fund and overweighting or underweighting the ones chosen by the model. Over time and by design, the performance of any one of the model’s investment themes tends to have a low correlation with the model’s other themes, demonstrating the diversification benefit of the Fund’s theme-driven quantitative model. The variance in performance supports our research indicating that the diversification provided by our different investment themes is a significant investment advantage over the long term, even though the Fund may experience underperformance in the short term. Of course, diversification does not protect an investor from market risk nor does it ensure a profit. |
| During the Reporting Period, two of our investment themes — Sentiment Analysis and High Quality Business Models — detracted from the Fund’s relative performance. Sentiment Analysis seeks to identify stocks experiencing improvements in their overall market sentiment. High Quality Business Models seeks to identify companies that are generating high quality revenues with sustainable business models and aligned management incentives. |
| Our Fundamental Mispricings and Market Themes & Trends investment themes contributed positively to relative returns during the Reporting Period. Fundamental Mispricings seeks to identify high quality businesses trading at a fair price, which we believe may lead to strong performance over the long run. Market Themes & Trends seeks to identify companies positively positioned to benefit from themes and trends in the market and macroeconomic environment. |
| Q | How did the Fund’s sector allocations affect relative performance? |
| A | In constructing the Fund’s portfolio, we focus on picking stocks rather than on making sector or industry bets. Consequently, the Fund is similar to the Index in terms of its sector and industry allocations and style. Changes in its |
19
PORTFOLIO RESULTS
sector or industry weights generally do not have a meaningful impact on relative performance. |
| Q | Did stock selection help or hurt Fund performance during the Reporting Period? |
| A | We seek to outpace the Index by overweighting stocks we expect to outperform and underweighting those we think may lag. At the same time, we strive to maintain a risk profile similar to the Index. The Fund’s investments are selected using fundamental research and a variety of quantitative techniques based on our investment themes. For example, the Fund aims to hold a basket of stocks with better Fundamental Mispricings characteristics than the Index. |
| During the Reporting Period, the Fund was hurt by stock selection in the health care, industrials and consumer discretionary sectors. Stock selection within the energy, real estate and financials sectors added to relative performance. |
| Q | Which individual stock positions detracted most from the Fund’s results during the Reporting Period? |
| A | In terms of individual positions, an underweight relative to the Index in Penn National Gaming detracted from returns. Overweight positions in MRC Global and Retail Value also hindered the Fund’s performance. Our High Quality Business Models and Fundamental Mispricings investment themes led to the underweight in Penn National Gaming, which operates casinos and racetracks. The Fund’s overweight in industrial supplies company MRC Global was the result of our Sentiment Analysis, High Quality Business Models and Fundamental Mispricings investment themes. We adopted the overweight in Retail Value, a real estate investment trust focused on retail shopping centers, mainly because of our Fundamental Mispricings and Sentiment Analysis investment themes. |
| Q | Which individual stock positions contributed most to the Fund’s relative returns during the Reporting Period? |
| A | The Fund was helped during the Reporting Period by its overweight positions in Darling Ingredients, a developer and producer of sustainable natural ingredients from edible and inedible bio-nutrients; Goosehead Insurance, a personal lines insurance agency; and Collectors Universe, which provides grading and authentication services for high-value collectibles. We decided to overweight Darling Ingredients based on our High Quality Business Models, Sentiment Analysis and Market Themes & Trends investment themes. The overweight in Goosehead Insurance was largely driven by our Fundamental Mispricings and Market Themes & Trends investment themes. Our High Quality Business Models and Sentiment Analysis investment themes led to the Fund’s overweight in Collectors Universe. |
| Q | How did the Fund use derivatives and similar instruments during the Reporting Period? |
| A | During the Reporting Period, we used futures contracts to equitize the Fund’s cash holdings. In other words, we put the Fund’s cash holdings to work by using them as collateral for the purchase of futures contracts. The use of these derivatives did not have a material impact on Fund results during the Reporting Period. |
| Q | What was the Fund’s sector positioning relative to the Index at the end of the Reporting Period? |
| A | At the end of the Reporting Period, the Fund was overweight the consumer discretionary and materials sectors relative to the Index. Compared to the Index, the Fund was underweight the utilities, financials and industrials sectors. The Fund was relatively neutral in the information technology, energy, consumer staples, real estate, health care and communication services sectors at the end of the Reporting Period. |
20
FUND BASICS
Small Cap Value Insights Fund
as of October 31, 2020
| TOP TEN HOLDINGS AS OF 10/31/201 | ||||||||
| Holding | % of Net Assets | Line of Business | ||||||
| Rexnord Corp. | 0.9 | % | Machinery | |||||
| NorthWestern Corp. | 0.8 | Multi-Utilities | ||||||
| Alcoa Corp. | 0.8 | Metals & Mining | ||||||
| PotlatchDeltic Corp. REIT | 0.8 | Equity Real Estate Investment Trusts (REITs) | ||||||
| CVB Financial Corp. | 0.8 | Banks | ||||||
| Hilltop Holdings, Inc. | 0.8 | Banks | ||||||
| Summit Materials, Inc., Class A | 0.8 | Construction Materials | ||||||
| Sabra Health Care REIT, Inc. REIT | 0.8 | Equity Real Estate Investment Trusts (REITs) | ||||||
| Darling Ingredients, Inc. | 0.8 | Food Products | ||||||
| Rush Enterprises, Inc., Class A | 0.8 | Trading Companies & Distributors | ||||||
| 1 | The top 10 holdings may not be representative of the Fund’s future investments. The top 10 holdings exclude investments in money market funds. |
| FUND VS. BENCHMARK SECTOR ALLOCATIONS2 |
| As of October 31, 2020 |
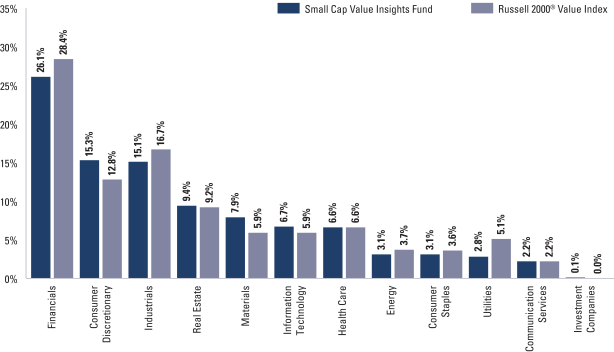
| 2 | The Fund is actively managed and, as such, its composition may differ over time. Consequently, the Fund’s overall sector allocations may differ from the percentages contained in the graph above. The graph categorizes investments using the Global Industry Classification Standard (“GICS”); however, the sector classifications used by the portfolio management team may differ from GICS. The percentage shown for each investment category reflects the value of investments in that category as a percentage of market value (excluding investments in the securities lending reinvestment vehicle, if any). Investments in the securities lending reinvestment vehicle represented 0.4% of the Fund’s net assets as of October 31, 2020. The graph depicts the Fund’s investments but may not represent the Fund’s market exposure due to the exclusion of certain derivatives, if any, as listed in the Additional Investment Information section of the Schedule of Investments. |
For more information about your Fund, please refer to www.GSAMFUNDS.com. There, you can learn more about your Fund’s investment strategies, holdings, and performance.
21
GOLDMAN SACHS SMALL CAP VALUE INSIGHTS FUND
Performance Summary
October 31, 2020
The following graph shows the value, as of October 31, 2020, of a $1,000,000 investment made on November 1, 2010 in Institutional Shares. For comparative purposes, the performance of the Fund’s benchmark, the Russell 2000® Value Index (with dividends reinvested), is shown. Performance reflects applicable fee waivers and/or expense limitations in effect during the periods shown and in their absence, performance would be reduced. Returns do not reflect the deduction of taxes that a shareholder would pay on Fund distributions or the redemption of Fund shares. The returns set forth below represent past performance. Past performance does not guarantee future results. The Fund’s investment return and principal value will fluctuate so that an investor’s shares, when redeemed, may be worth more or less than their original cost. Current performance may be lower or higher than the performance quoted below. Please visit our web site at www.GSAMFUNDS.com to obtain the most recent month-end returns.
| Small Cap Value Insights Fund’s 10 Year Performance |
Performance of a $1,000,000 investment, including any applicable sales charges, with distributions reinvested, from November 1, 2010 through October 31, 2020.
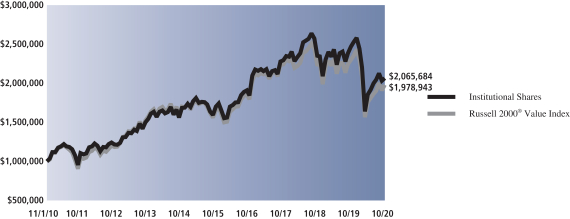
| Average Annual Total Return through October 31, 2020* | One Year | Five Years | Ten Years | Since Inception | ||||||||||
Class A | ||||||||||||||
Excluding sales charges | -16.49% | 3.56% | 7.10% | — | ||||||||||
Including sales charges | -21.07% | 2.40% | 6.50% | — | ||||||||||
| ||||||||||||||
Class C | ||||||||||||||
Excluding contingent deferred sales charges | -17.11% | 2.79% | 6.30% | — | ||||||||||
Including contingent deferred sales charges | -17.94% | 2.79% | 6.30% | — | ||||||||||
| ||||||||||||||
Institutional | -16.19% | 3.96% | 7.52% | — | ||||||||||
| ||||||||||||||
Investor | -16.32% | 3.81% | 7.36% | — | ||||||||||
| ||||||||||||||
Class R6 (Commenced July 31, 2015) | -16.17% | 3.97% | N/A | 3.45% | ||||||||||
| ||||||||||||||
Class R | -16.70% | 3.30% | 6.83% | — | ||||||||||
| ||||||||||||||
Class P (Commenced April 16, 2018) | -16.18% | N/A | N/A | -5.86% | ||||||||||
| ||||||||||||||
| * | These returns assume reinvestment of all distributions at NAV and reflect a maximum initial sales charge of 5.50% for Class A Shares and the assumed contingent deferred sales charge for Class C Shares (1% if redeemed within 12 months of purchase). Because Institutional, Investor, Class R6, Class R and Class P Shares do not involve a sales charge, such a charge is not applied to their Average Annual Total Return. |
22
PORTFOLIO RESULTS
Goldman Sachs U.S. Equity Insights Fund
Investment Objective
The Fund seeks long-term growth of capital and dividend income.
Portfolio Management Discussion and Analysis
Below, the Goldman Sachs Quantitative Investment Strategies Team discusses the Goldman Sachs U.S. Equity Insights Fund’s (the “Fund”) performance and positioning for the 12-month period ended October 31, 2020 (the “Reporting Period”).
| Q | How did the Fund perform during the Reporting Period? |
| A | During the Reporting Period, the Fund’s Class A, Class C, Institutional, Service, Investor, Class R6, Class R, and Class P Shares generated average annual total returns, without sales charges, of 10.04%, 9.25%, 10.47%, 9.93%, 10.33%, 10.49%, 9.79% and 10.49%, respectively. These returns compare to the 9.68% average annual total return of the Fund’s benchmark, the S&P 500® Index (with dividends reinvested) (the “Index”), during the same period. |
| Q | What key factors were most responsible for the Fund’s performance during the Reporting Period? |
| A | The Fund uses a quantitative style of management, in combination with a qualitative overlay, that emphasizes fundamentally-based stock selection, careful portfolio construction and efficient implementation. The Fund’s investments are selected using fundamental research and a variety of quantitative techniques based on certain investment themes, including Fundamental Mispricings, High Quality Business Models, Sentiment Analysis and Market Themes & Trends. |
| During the Reporting Period, the Fund generally outperformed the Index, with three of our quantitative model’s four investment themes adding to returns. Stock selection driven by these investment themes further bolstered relative performance. |
| Q | What impact did the Fund’s investment themes have on performance during the Reporting Period? |
| A | In keeping with our investment approach, we use our quantitative model and four investment themes to take a long-term view of market patterns and look for inefficiencies, selecting stocks for the Fund and overweighting or underweighting the ones chosen by the model. Over time and by design, the performance of any one of the model’s investment themes tends to have a low correlation with the model’s other themes, demonstrating the diversification benefit of the Fund’s theme-driven quantitative model. The variance in performance supports our research indicating that the diversification provided by our different investment themes is a significant investment advantage over the long term, even though the Fund may experience underperformance in the short term. Of course, diversification does not protect an investor from market risk nor does it ensure a profit. |
| During the Reporting Period, three of our investment themes contributed positively to the Fund’s relative performance. Market Themes & Trends was our best-performing investment theme, followed by our Fundamental Mispricings and High Quality Business Models investment themes. Market Themes & Trends seeks to identify companies positively positioned to benefit from themes and trends in the market and macroeconomic environment. Fundamental Mispricings seeks to identify high quality businesses trading at a fair price, which we believe may lead to strong performance over the long run. High Quality Business Models seeks to identify companies that are generating high quality revenues with sustainable business models and aligned management incentives. |
| Our Sentiment Analysis investment theme detracted marginally from relative returns during the Reporting Period. Sentiment Analysis seeks to identify stocks experiencing improvements in their overall market sentiment. |
| Q | How did the Fund’s sector allocations affect relative performance? |
| A | In constructing the Fund’s portfolio, we focus on picking stocks rather than on making sector or industry bets. |
23
PORTFOLIO RESULTS
Consequently, the Fund is similar to the Index in terms of its sector and industry allocations and style. Changes in its sector or industry weights generally do not have a meaningful impact on relative performance. |
| Q | Did stock selection help or hurt Fund performance during the Reporting Period? |
| A | We seek to outpace the Index by overweighting stocks we expect to outperform and underweighting those we think may lag. At the same time, we strive to maintain a risk profile similar to the Index. The Fund’s investments are selected using fundamental research and a variety of quantitative techniques based on our investment themes. For example, the Fund aims to hold a basket of stocks with better Fundamental Mispricings characteristics than the Index. |
| During the Reporting Period, stock selection within the information technology, energy and consumer discretionary sectors contributed positively to the Fund’s relative performance. Stock selection in the financials, real estate and utilities sectors detracted from relative results. |
| Q | Which individual stock positions contributed most to the Fund’s relative returns during the Reporting Period? |
| A | In terms of individual stock positions, the Fund benefited from an underweight compared to the Index in energy company Exxon Mobil. Overweights in Amazon.com, which focuses on e-commerce, cloud computing, digital streaming and artificial intelligence, and in PayPal Holdings, a digital payment company, also boosted relative returns. The Fund’s underweight in Exxon Mobil was largely the result of our Sentiment Analysis investment theme. We chose to overweight Amazon.com and PayPal Holdings mainly because of our Sentiment Analysis and Market Themes & Trends investment themes. |
| Q | Which individual stock positions detracted most from the Fund’s results during the Reporting Period? |
| A | The Fund’s overweight positions in Costco Wholesale, Raytheon and CME Group detracted from relative performance. Our decision to overweight Costco Wholesale, which operates a chain of membership-only warehouse clubs, was based primarily on our High Quality Business Models investment theme. We adopted the overweight in defense contractor Raytheon largely because of our Sentiment Analysis investment theme. The Fund’s overweight in CME Group, a collection of exchanges that focuses primarily on financial derivatives, was driven by our High Quality Business Models and Sentiment Analysis investment themes. |
| Q | How did the Fund use derivatives and similar instruments during the Reporting Period? |
| A | During the Reporting Period, we used futures contracts to equitize the Fund’s cash holdings. In other words, we put the Fund’s cash holdings to work by using them as collateral for the purchase of futures contracts. The use of these derivatives did not have a material impact on Fund results during the Reporting Period. |
| Q | What was the Fund’s sector positioning relative to the Index at the end of the Reporting Period? |
| A | At the end of the Reporting Period, the Fund was overweight the real estate, consumer discretionary, health care and financials sectors relative to the Index. Compared to the Index, the Fund was underweight the utilities, information technology, consumer staples, energy and industrials sectors. The Fund was relatively neutral compared to the Index in the materials and communication services sectors at the end of the Reporting Period. |
24
FUND BASICS
U.S. Equity Insights Fund
as of October 31, 2020
| TOP TEN HOLDINGS AS OF 10/31/201 | ||||||||
| Holding | % of Net Assets | Line of Business | ||||||
| Microsoft Corp. | 6.3 | % | Software | |||||
| Amazon.com, Inc. | 5.8 | Internet & Direct Marketing Retail | ||||||
| Apple, Inc. | 5.5 | Technology Hardware, Storage & Peripherals | ||||||
| Facebook, Inc., Class A | 3.1 | Interactive Media & Services | ||||||
| Alphabet, Inc., Class C | 2.7 | Interactive Media & Services | ||||||
| PayPal Holdings, Inc. | 1.8 | IT Services | ||||||
| Adobe, Inc. | 1.8 | Software | ||||||
| Netflix, Inc. | 1.7 | Entertainment | ||||||
| Walmart, Inc. | 1.7 | Food & Staples Retailing | ||||||
| Costco Wholesale Corp. | 1.6 | Food & Staples Retailing | ||||||
| 1 | The top 10 holdings may not be representative of the Fund’s future investments. |
| FUND VS. BENCHMARK SECTOR ALLOCATIONS2 |
| As of October 31, 2020 |
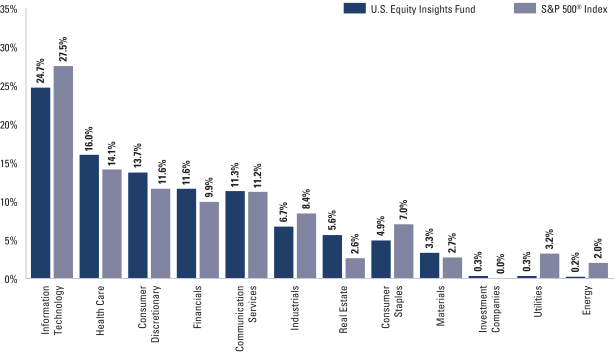
| 2 | The Fund is actively managed and, as such, its composition may differ over time. Consequently, the Fund’s overall sector allocations may differ from the percentages contained in the graph above. The graph categorizes investments using the Global Industry Classification Standard (“GICS”); however, the sector classifications used by the portfolio management team may differ from GICS. The percentage shown for each investment category reflects the value of investments in that category as a percentage of market value (excluding investments in the securities lending reinvestment vehicle, if any). The graph depicts the Fund’s investments but may not represent the Fund’s market exposure due to the exclusion of certain derivatives, if any, as listed in the Additional Investment Information section of the Schedule of Investments. |
For more information about your Fund, please refer to www.GSAMFUNDS.com. There, you can learn more about your Fund’s investment strategies, holdings, and performance.
25
GOLDMAN SACHS U.S. EQUITY INSIGHTS FUND
Performance Summary
October 31, 2020
The following graph shows the value, as of October 31, 2020, of a $1,000,000 investment made on November 1, 2010 in Institutional Shares. For comparative purposes, the performance of the Fund’s benchmark, the Standard and Poor’s 500 Index (with dividends reinvested) (“S&P 500® Index”), is shown. Performance reflects applicable fee waivers and/or expense limitations in effect during the periods shown and in their absence, performance would be reduced. Returns do not reflect the deduction of taxes that a shareholder would pay on Fund distributions or the redemption of Fund shares. The returns set forth below represent past performance. Past performance does not guarantee future results. The Fund’s investment return and principal value will fluctuate so that an investor’s shares, when redeemed, may be worth more or less than their original cost. Current performance may be lower or higher than the performance quoted below. Please visit our web site at www.GSAMFUNDS.com to obtain the most recent month-end returns.
| U.S. Equity Insights Fund’s 10 Year Performance |
Performance of a $1,000,000 investment, including any applicable sales charges, with distributions reinvested, from November 1, 2010 through October 31, 2020.
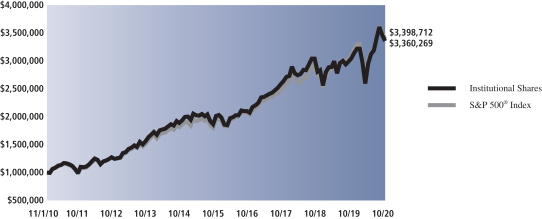
| Average Annual Total Return through October 31, 2020* | One Year | Five Years | Ten Years | Since Inception | ||||||||||
Class A | ||||||||||||||
Excluding sales charges | 10.04% | 10.30% | 12.44% | — | ||||||||||
Including sales charges | 4.01% | 9.07% | 11.80% | — | ||||||||||
| ||||||||||||||
Class C | ||||||||||||||
Excluding contingent deferred sales charges | 9.25% | 9.49% | 11.60% | — | ||||||||||
Including contingent deferred sales charges | 8.24% | 9.49% | 11.60% | — | ||||||||||
| ||||||||||||||
Institutional | 10.47% | 10.73% | 12.87% | — | ||||||||||
| ||||||||||||||
Service | 9.93% | 10.18% | 12.32% | — | ||||||||||
| ||||||||||||||
Investor | 10.33% | 10.58% | 12.71% | — | ||||||||||
| ||||||||||||||
Class R6 (Commenced July 31, 2015) | 10.49% | 10.74% | N/A | 9.91% | ||||||||||
| ||||||||||||||
Class R | 9.79% | 10.03% | 12.16% | — | ||||||||||
| ||||||||||||||
Class P (Commenced April 16, 2018) | 10.49% | N/A | N/A | 7.51% | ||||||||||
| ||||||||||||||
| * | These returns assume reinvestment of all distributions at NAV and reflect a maximum initial sales charge of 5.50% for Class A Shares and the assumed contingent deferred sales charge for Class C Shares (1% if redeemed within 12 months of purchase). Because Institutional, Service, Investor, Class R6, Class R and Class P Shares do not involve a sales charge, such a charge is not applied to their Average Annual Total Return. |
26
FUND BASICS
Russell Midcap® Index measures the performance of the mid-cap segment of the U.S. equity universe. The Russell Midcap® Index is a subset of the Russell 1000® Index. The Russell Midcap® Index includes approximately 800 of the smallest securities based on a combination of their market cap and current index membership. The Russell Midcap® Index represents approximately 31% of the total market capitalization of the Russell 1000® Index companies. The Russell Midcap® Index is constructed to provide a comprehensive and unbiased barometer for the mid-cap segment. The Russell Midcap® Index is completely reconstituted annually to ensure larger stocks do not distort the performance and characteristics of the true mid-cap opportunity set.
Russell 1000® Index measures the performance of the large-cap segment of the U.S. equity universe. The Russell 1000® Index is a subset of the Russell 3000® Index and includes approximately 1000 of the largest securities based on a combination of their market cap and current index membership. The Russell 1000® Index represents approximately 92% of the U.S. market. The Russell 1000® Index is constructed to provide a comprehensive and unbiased barometer for the large-cap segment and is completely reconstituted annually to ensure new and growing equities are reflected.
Russell 2000® Index measures the performance of the small-cap segment of the U.S. equity universe. The Russell 2000® Index is a subset of the Russell 3000® Index representing approximately 10% of the total market capitalization of that index. The Russell 2000® Index includes approximately 2000 of the smallest securities based on a combination of their market cap and current index membership. The Russell 2000® Index is constructed to provide a comprehensive and unbiased small-cap barometer and is completely reconstituted annually to ensure larger stocks do not distort the performance and characteristics of the true small-cap opportunity set.
S&P 500® Index is a U.S. stock market index based on the market capitalizations of 500 large companies having common stock listed on the New York Stock Exchange or NASDAQ. The S&P 500® Index components and their weightings are determined by S&P Dow Jones Indices.
The Russell 1000® Growth Index (with dividends reinvested) is an unmanaged market capitalization weighted index of the 1000 largest U.S. companies with higher price-to-book ratios and higher forecasted growth values. The figures for the Russell 1000® Growth Index do not include any deduction for fees, expenses or taxes.
The Russell 1000® Value Index (with dividends reinvested) is an unmanaged market capitalization weighted index of the 1000 largest U.S. companies with lower price-to-book ratios and lower forecasted growth values. The figures for the Russell 1000® Value Index do not include any deduction for fees, expenses or taxes.
The Russell 2000® Growth Index (with dividends reinvested) is an unmanaged index of common stock prices that measures the performance of those Russell 2000 companies with higher price-to-book ratios and higher forecasted growth values. The Russell 2000®
Growth Index figures do not reflect any deduction for fees, expenses or taxes. It is not possible to invest directly in an index.
The Russell 2000® Value Index (with dividends reinvested) is an unmanaged index of common stock prices that measures the performance of those Russell 2000 companies with lower price-to-book ratios and lower forecasted growth values. The Russell 2000® Value Index figures do not reflect any deduction for fees, expenses or taxes.
It is not possible to invest directly in an unmanaged index.
27
GOLDMAN SACHS LARGE CAP GROWTH INSIGHTS FUND
October 31, 2020
| Shares | Description | Value | ||||||
| Common Stocks – 99.1% | ||||||||
| Air Freight & Logistics – 1.6% | ||||||||
| 169,536 | United Parcel Service, Inc., Class B | $ | 26,635,801 | |||||
| 49,182 | XPO Logistics, Inc.* | 4,426,380 | ||||||
|
| |||||||
| 31,062,181 | ||||||||
|
| |||||||
| Auto Components – 0.2% | ||||||||
| 111,250 | Gentex Corp. | 3,078,288 | ||||||
|
| |||||||
| Automobiles – 1.6% | ||||||||
| 75,699 | Tesla, Inc.* | 29,374,240 | ||||||
|
| |||||||
| Beverages – 1.2% | ||||||||
| 384 | Boston Beer Co., Inc. (The), Class A* | 399,045 | ||||||
| 299,766 | Monster Beverage Corp.* | 22,953,083 | ||||||
|
| |||||||
| 23,352,128 | ||||||||
|
| |||||||
| Biotechnology – 2.3% | ||||||||
| 224,548 | AbbVie, Inc. | 19,109,035 | ||||||
| 10,172 | Exact Sciences Corp.* | 1,259,599 | ||||||
| 7,426 | Incyte Corp.* | 643,388 | ||||||
| 106,258 | Vertex Pharmaceuticals, Inc.* | 22,139,917 | ||||||
|
| |||||||
| 43,151,939 | ||||||||
|
| |||||||
| Building Products – 1.0% | ||||||||
| 5,406 | Allegion PLC | 532,491 | ||||||
| 4,368 | Lennox International, Inc. | 1,186,611 | ||||||
| 333,657 | Masco Corp. | 17,884,015 | ||||||
|
| |||||||
| 19,603,117 | ||||||||
|
| |||||||
| Capital Markets – 2.5% | ||||||||
| 61,311 | CME Group, Inc. | 9,240,794 | ||||||
| 25,193 | MarketAxess Holdings, Inc. | 13,575,248 | ||||||
| 75,329 | S&P Global, Inc. | 24,310,928 | ||||||
|
| |||||||
| 47,126,970 | ||||||||
|
| |||||||
| Chemicals – 1.7% | ||||||||
| 196,067 | Axalta Coating Systems Ltd.* | 4,923,242 | ||||||
| 8,017 | RPM International, Inc. | 678,799 | ||||||
| 37,771 | Sherwin-Williams Co. (The) | 25,985,693 | ||||||
|
| |||||||
| 31,587,734 | ||||||||
|
| |||||||
| Communications Equipment – 0.7% | ||||||||
| 25,928 | Arista Networks, Inc.* | 5,416,359 | ||||||
| 85,412 | Lumentum Holdings, Inc.* | 7,062,718 | ||||||
|
| |||||||
| 12,479,077 | ||||||||
|
| |||||||
| Diversified Consumer Services – 0.6% | ||||||||
| 91,528 | Chegg, Inc.* | 6,721,816 | ||||||
| 50,152 | frontdoor, Inc.* | 1,987,022 | ||||||
| 196,506 | H&R Block, Inc. | 3,391,694 | ||||||
|
| |||||||
| 12,100,532 | ||||||||
|
| |||||||
| Diversified Financial Services – 0.6% | ||||||||
| 232,393 | Voya Financial, Inc. | 11,138,597 | ||||||
|
| |||||||
| Electronic Equipment, Instruments & Components – 0.4% | ||||||||
| 227,709 | Jabil, Inc. | 7,546,276 | ||||||
|
| |||||||
| Entertainment – 3.1% | ||||||||
| 74,621 | Netflix, Inc.* | 35,500,195 | ||||||
| 19,868 | Roku, Inc.* | 4,021,283 | ||||||
|
| |||||||
| Common Stocks – (continued) | ||||||||
| Entertainment – (continued) | ||||||||
| 7,136 | Spotify Technology SA* | 1,711,855 | ||||||
| 59,681 | Take-Two Interactive Software, Inc.* | 9,245,780 | ||||||
| 849,521 | Zynga, Inc., Class A* | 7,637,194 | ||||||
|
| |||||||
| 58,116,307 | ||||||||
|
| |||||||
| Equity Real Estate Investment Trusts (REITs) – 4.2% | ||||||||
| 112,998 | American Tower Corp. REIT | 25,949,991 | ||||||
| 93,244 | CoreSite Realty Corp. REIT | 11,129,604 | ||||||
| 175,954 | Equity LifeStyle Properties, Inc. REIT | 10,414,717 | ||||||
| 58,659 | First Industrial Realty Trust, Inc. REIT | 2,335,215 | ||||||
| 389,401 | Invitation Homes, Inc. REIT | 10,615,071 | ||||||
| 67,400 | SBA Communications Corp. REIT | 19,570,938 | ||||||
|
| |||||||
| 80,015,536 | ||||||||
|
| |||||||
| Food & Staples Retailing – 1.9% | ||||||||
| 99,575 | Costco Wholesale Corp. | 35,610,012 | ||||||
|
| |||||||
| Health Care Equipment & Supplies – 3.7% | ||||||||
| 13,345 | ABIOMED, Inc.* | 3,361,339 | ||||||
| 9,993 | Align Technology, Inc.* | 4,257,817 | ||||||
| 6,557 | DexCom, Inc.* | 2,095,486 | ||||||
| 273,924 | Hologic, Inc.* | 18,851,450 | ||||||
| 30,686 | Insulet Corp.* | 6,819,963 | ||||||
| 23,385 | Quidel Corp.* | 6,273,962 | ||||||
| 28,956 | STERIS PLC | 5,130,714 | ||||||
| 7,753 | Tandem Diabetes Care, Inc.* | 845,077 | ||||||
| 78,242 | West Pharmaceutical Services, Inc. | 21,287,301 | ||||||
|
| |||||||
| 68,923,109 | ||||||||
|
| |||||||
| Health Care Providers & Services – 2.2% | ||||||||
| 41,416 | Anthem, Inc. | 11,298,285 | ||||||
| 1,462 | Chemed Corp. | 699,304 | ||||||
| 171,013 | HCA Healthcare, Inc. | 21,195,351 | ||||||
| 29,338 | UnitedHealth Group, Inc. | 8,952,197 | ||||||
|
| |||||||
| 42,145,137 | ||||||||
|
| |||||||
| Hotels, Restaurants & Leisure – 1.7% | ||||||||
| 17,920 | Chipotle Mexican Grill, Inc.* | 21,530,521 | ||||||
| 20,055 | Domino’s Pizza, Inc. | 7,587,208 | ||||||
| 91,022 | Wendy’s Co. (The) | 1,988,831 | ||||||
|
| |||||||
| 31,106,560 | ||||||||
|
| |||||||
| Insurance – 0.5% | ||||||||
| 29,704 | Aon PLC, Class A | 5,465,833 | ||||||
| 48,452 | Old Republic International Corp. | 788,798 | ||||||
| 28,994 | Primerica, Inc. | 3,196,299 | ||||||
|
| |||||||
| 9,450,930 | ||||||||
|
| |||||||
| Interactive Media & Services – 9.3% | ||||||||
| 9,746 | Alphabet, Inc., Class A* | 15,750,608 | ||||||
| 42,572 | Alphabet, Inc., Class C* | 69,009,638 | ||||||
| 298,501 | Facebook, Inc., Class A* | 78,538,598 | ||||||
| 112,119 | Pinterest, Inc., Class A* | 6,609,415 | ||||||
| 53,203 | Zillow Group, Inc., Class C* | 4,714,850 | ||||||
|
| |||||||
| 174,623,109 | ||||||||
|
| |||||||
| Internet & Direct Marketing Retail – 10.3% | ||||||||
| 53,352 | Amazon.com, Inc.* | 161,984,675 | ||||||
|
| |||||||
| 28 | The accompanying notes are an integral part of these financial statements. |
GOLDMAN SACHS LARGE CAP GROWTH INSIGHTS FUND
| Shares | Description | Value | ||||||
| Common Stocks – (continued) | ||||||||
| Internet & Direct Marketing Retail – (continued) | ||||||||
| 220,813 | eBay, Inc. | $ | 10,517,323 | |||||
| 81,089 | Etsy, Inc.* | 9,859,612 | ||||||
| 47,946 | Wayfair, Inc., Class A* | 11,892,046 | ||||||
|
| |||||||
| 194,253,656 | ||||||||
|
| |||||||
| IT Services – 8.6% | ||||||||
| 200,088 | Black Knight, Inc.* | 17,597,740 | ||||||
| 28,642 | CACI International, Inc., Class A* | 5,972,716 | ||||||
| 35,082 | EPAM Systems, Inc.* | 10,838,584 | ||||||
| 60,894 | Gartner, Inc.* | 7,313,369 | ||||||
| 38,532 | Mastercard, Inc., Class A | 11,121,876 | ||||||
| 10,807 | Okta, Inc.* | 2,267,633 | ||||||
| 197,771 | PayPal Holdings, Inc.* | 36,811,116 | ||||||
| 19,349 | Square, Inc., Class A* | 2,996,773 | ||||||
| 26,138 | Twilio, Inc., Class A* | 7,291,718 | ||||||
| 91,371 | VeriSign, Inc.* | 17,424,450 | ||||||
| 201,327 | Visa, Inc., Class A | 36,583,129 | ||||||
| 337,774 | Western Union Co. (The) | 6,566,327 | ||||||
|
| |||||||
| 162,785,431 | ||||||||
|
| |||||||
| Life Sciences Tools & Services – 2.3% | ||||||||
| 8,310 | Illumina, Inc.* | 2,432,337 | ||||||
| 21,520 | Mettler-Toledo International, Inc.* | 21,475,023 | ||||||
| 106,371 | PerkinElmer, Inc. | 13,780,363 | ||||||
| 13,857 | Thermo Fisher Scientific, Inc. | 6,556,024 | ||||||
|
| |||||||
| 44,243,747 | ||||||||
|
| |||||||
| Personal Products – 0.3% | ||||||||
| 116,258 | Herbalife Nutrition Ltd.* | 5,247,886 | ||||||
|
| |||||||
| Pharmaceuticals – 1.7% | ||||||||
| 56,112 | Horizon Therapeutics PLC* | 4,204,472 | ||||||
| 5,599 | Merck & Co., Inc. | 421,101 | ||||||
| 174,475 | Zoetis, Inc. | 27,663,011 | ||||||
|
| |||||||
| 32,288,584 | ||||||||
|
| |||||||
| Road & Rail – 1.1% | ||||||||
| 109,498 | Old Dominion Freight Line, Inc. | 20,845,134 | ||||||
|
| |||||||
| Semiconductors & Semiconductor Equipment – 5.1% | ||||||||
| 106,779 | Advanced Micro Devices, Inc.* | 8,039,391 | ||||||
| 184,985 | Applied Materials, Inc. | 10,956,661 | ||||||
| 55,989 | KLA Corp. | 11,039,911 | ||||||
| 64,309 | Lam Research Corp. | 21,998,823 | ||||||
| 32,397 | NVIDIA Corp. | 16,242,560 | ||||||
| 48,038 | NXP Semiconductors NV (Netherlands) | 6,490,894 | ||||||
|
| |||||||
| Common Stocks – (continued) | ||||||||
| Semiconductors & Semiconductor Equipment – (continued) | ||||||||
| 145,057 | Texas Instruments, Inc. | 20,973,792 | ||||||
|
| |||||||
| 95,742,032 | ||||||||
|
| |||||||
| Software – 16.3% | ||||||||
| 98,584 | Adobe, Inc.* | 44,076,907 | ||||||
| 20,756 | Cadence Design Systems, Inc.* | 2,270,084 | ||||||
| 5,537 | Coupa Software, Inc.* | 1,482,255 | ||||||
| 64,853 | DocuSign, Inc.* | 13,116,519 | ||||||
| 704,122 | Dropbox, Inc., Class A* | 12,857,268 | ||||||
| 26,997 | Intuit, Inc. | 8,495,416 | ||||||
| 843,507 | Microsoft Corp. | 170,784,862 | ||||||
| 8,665 | New Relic, Inc.* | 525,619 | ||||||
| 15,180 | RingCentral, Inc., Class A* | 3,921,601 | ||||||
| 17,901 | salesforce.com, Inc.* | 4,157,865 | ||||||
| 28,962 | ServiceNow, Inc.* | 14,410,622 | ||||||
| 56,183 | Workday, Inc., Class A* | 11,805,172 | ||||||
| 43,124 | Zoom Video Communications, Inc., Class A* | 19,876,283 | ||||||
|
| |||||||
| 307,780,473 | ||||||||
|
| |||||||
| Specialty Retail – 2.2% | ||||||||
| 221,440 | Dick’s Sporting Goods, Inc. | 12,544,576 | ||||||
| 185,561 | Lowe’s Cos., Inc. | 29,337,194 | ||||||
|
| |||||||
| 41,881,770 | ||||||||
|
| |||||||
| Technology Hardware, Storage & Peripherals – 10.1% | ||||||||
| 1,742,709 | Apple, Inc. | 189,711,302 | ||||||
|
| |||||||
| Textiles, Apparel & Luxury Goods – 0.1% | ||||||||
| 5,374 | Lululemon Athletica, Inc.* | 1,715,864 | ||||||
|
| |||||||
| TOTAL INVESTMENTS – 99.1% | ||||||||
| (Cost $1,302,882,306) | $ | 1,868,087,658 | ||||||
|
| |||||||
| | OTHER ASSETS IN EXCESS OF LIABILITIES – 0.9% | 17,553,345 | ||||||
|
| |||||||
| NET ASSETS – 100.0% | $ | 1,885,641,003 | ||||||
|
| |||||||
| The percentage shown for each investment category reflects the value of investments in that category as a percentage of net assets. | ||
* | Non-income producing security. | |
| ||
Investment Abbreviations: | ||
PLC | —Public Limited Company | |
REIT | —Real Estate Investment Trust | |
| ||
| ADDITIONAL INVESTMENT INFORMATION |
FUTURES CONTRACTS — At October 31, 2020, the Fund had the following futures contracts:
| Description | Number of Contracts | Expiration Date | Notional Amount | Unrealized Appreciation/ (Depreciation) | ||||||||||||
S&P 500 E-Mini Index | 3 | 12/18/20 | $ | 483,060 | $ | 6,645 | ||||||||||
| The accompanying notes are an integral part of these financial statements. | 29 |
GOLDMAN SACHS LARGE CAP VALUE INSIGHTS FUND
Schedule of Investments
October 31, 2020
| Shares | Description | Value | ||||||
| Common Stocks – 99.0% | ||||||||
| Aerospace & Defense – 1.7% | ||||||||
| 7,123 | Curtiss-Wright Corp. | $ | 600,896 | |||||
| 4,521 | General Dynamics Corp. | 593,743 | ||||||
| 44,360 | Raytheon Technologies Corp. | 2,409,635 | ||||||
| 6,359 | Teledyne Technologies, Inc.* | 1,965,885 | ||||||
|
| |||||||
| 5,570,159 | ||||||||
|
| |||||||
| Air Freight & Logistics – 2.9% | ||||||||
| 17,302 | FedEx Corp. | 4,489,350 | ||||||
| 24,897 | United Parcel Service, Inc., Class B | 3,911,568 | ||||||
| 8,754 | XPO Logistics, Inc.* | 787,860 | ||||||
|
| |||||||
| 9,188,778 | ||||||||
|
| |||||||
| Auto Components – 0.7% | ||||||||
| 76,398 | Gentex Corp. | 2,113,933 | ||||||
|
| |||||||
| Automobiles – 0.2% | ||||||||
| 8,821 | Thor Industries, Inc. | 746,080 | ||||||
|
| |||||||
| Banks – 6.1% | ||||||||
| 198,521 | Bank of America Corp. | 4,704,948 | ||||||
| 84,222 | Citigroup, Inc. | 3,488,475 | ||||||
| 33,582 | JPMorgan Chase & Co. | 3,292,379 | ||||||
| 8,280 | Popular, Inc. (Puerto Rico) | 349,416 | ||||||
| 14,688 | Signature Bank | 1,185,909 | ||||||
| 212,277 | Wells Fargo & Co. | 4,553,342 | ||||||
| 46,526 | Western Alliance Bancorp | 1,916,871 | ||||||
|
| |||||||
| 19,491,340 | ||||||||
|
| |||||||
| Beverages – 1.7% | ||||||||
| 13,563 | Constellation Brands, Inc., Class A | 2,241,015 | ||||||
| 41,258 | Monster Beverage Corp.* | 3,159,125 | ||||||
|
| |||||||
| 5,400,140 | ||||||||
|
| |||||||
| Biotechnology – 1.8% | ||||||||
| 26,853 | AbbVie, Inc. | 2,285,190 | ||||||
| 6,810 | Biogen, Inc.* | 1,716,597 | ||||||
| 8,146 | Vertex Pharmaceuticals, Inc.* | 1,697,301 | ||||||
|
| |||||||
| 5,699,088 | ||||||||
|
| |||||||
| Building Products – 1.9% | ||||||||
| 2,957 | Allegion PLC | 291,265 | ||||||
| 5,721 | Johnson Controls International PLC | 241,483 | ||||||
| 6,329 | Lennox International, Inc. | 1,719,336 | ||||||
| 65,716 | Masco Corp. | 3,522,378 | ||||||
| 1,151 | Trane Technologies PLC | 152,795 | ||||||
|
| |||||||
| 5,927,257 | ||||||||
|
| |||||||
| Capital Markets – 3.8% | ||||||||
| 33,665 | Bank of New York Mellon Corp. (The) | 1,156,730 | ||||||
| 28,495 | CME Group, Inc. | 4,294,767 | ||||||
| 6,820 | Franklin Resources, Inc. | 127,875 | ||||||
| 2,285 | MarketAxess Holdings, Inc. | 1,231,272 | ||||||
| 14,890 | Northern Trust Corp. | 1,165,440 | ||||||
| 4,619 | Raymond James Financial, Inc. | 353,076 | ||||||
| 11,914 | S&P Global, Inc. | 3,845,005 | ||||||
|
| |||||||
| 12,174,165 | ||||||||
|
| |||||||
| Common Stocks – (continued) | ||||||||
| Chemicals – 5.8% | ||||||||
| 131,453 | Axalta Coating Systems Ltd.* | 3,300,785 | ||||||
| 78,094 | CF Industries Holdings, Inc. | 2,156,175 | ||||||
| 59,145 | Corteva, Inc. | 1,950,602 | ||||||
| 53,698 | Dow, Inc. | 2,442,722 | ||||||
| 1,953 | DuPont de Nemours, Inc. | 111,087 | ||||||
| 22,853 | Linde PLC (United Kingdom) | 5,035,430 | ||||||
| 1,193 | RPM International, Inc. | 101,011 | ||||||
| 4,842 | Sherwin-Williams Co. (The) | 3,331,199 | ||||||
|
| |||||||
| 18,429,011 | ||||||||
|
| |||||||
| Communications Equipment – 0.0% | ||||||||
| 4,137 | Cisco Systems, Inc. | 148,518 | ||||||
|
| |||||||
| Construction Materials – 0.3% | ||||||||
| 1,592 | Martin Marietta Materials, Inc. | 424,029 | ||||||
| 3,753 | Vulcan Materials Co. | 543,585 | ||||||
|
| |||||||
| 967,614 | ||||||||
|
| |||||||
| Consumer Finance – 1.5% | ||||||||
| 19,997 | Ally Financial, Inc. | 533,520 | ||||||
| 14,072 | Capital One Financial Corp. | 1,028,382 | ||||||
| 128,817 | Synchrony Financial | 3,223,001 | ||||||
|
| |||||||
| 4,784,903 | ||||||||
|
| |||||||
| Diversified Consumer Services – 0.3% | ||||||||
| 13,844 | frontdoor, Inc.* | 548,499 | ||||||
| 29,687 | H&R Block, Inc. | 512,398 | ||||||
|
| |||||||
| 1,060,897 | ||||||||
|
| |||||||
| Diversified Financial Services – 3.0% | ||||||||
| 26,685 | Berkshire Hathaway, Inc., Class B* | 5,387,702 | ||||||
| 51,984 | Jefferies Financial Group, Inc. | 1,014,208 | ||||||
| 67,408 | Voya Financial, Inc. | 3,230,865 | ||||||
|
| |||||||
| 9,632,775 | ||||||||
|
| |||||||
| Diversified Telecommunication Services – 0.9% | ||||||||
| 36,518 | AT&T, Inc. | 986,716 | ||||||
| 33,781 | Verizon Communications, Inc. | 1,925,179 | ||||||
|
| |||||||
| 2,911,895 | ||||||||
|
| |||||||
| Electric Utilities – 1.4% | ||||||||
| 35,008 | Entergy Corp. | 3,543,510 | ||||||
| 16,132 | Evergy, Inc. | 890,486 | ||||||
|
| |||||||
| 4,433,996 | ||||||||
|
| |||||||
| Electrical Equipment – 0.6% | ||||||||
| 15,983 | AMETEK, Inc. | 1,569,531 | ||||||
| 1,809 | Hubbell, Inc. | 263,227 | ||||||
|
| |||||||
| 1,832,758 | ||||||||
|
| |||||||
| Electronic Equipment, Instruments & Components – 0.4% | ||||||||
| 6,492 | Arrow Electronics, Inc.* | 505,662 | ||||||
| 22,353 | Jabil, Inc. | 740,778 | ||||||
| 1,157 | SYNNEX Corp. | 152,308 | ||||||
|
| |||||||
| 1,398,748 | ||||||||
|
| |||||||
| 30 | The accompanying notes are an integral part of these financial statements. |
GOLDMAN SACHS LARGE CAP VALUE INSIGHTS FUND
| Shares | Description | Value | ||||||
| Common Stocks – (continued) | ||||||||
| Energy Equipment & Services – 0.6% | ||||||||
| 123,020 | Schlumberger NV | $ | 1,837,919 | |||||
|
| |||||||
| Entertainment – 2.4% | ||||||||
| 3,798 | Activision Blizzard, Inc. | 287,623 | ||||||
| 5,449 | Electronic Arts, Inc.* | 652,954 | ||||||
| 3,233 | Netflix, Inc.* | 1,538,067 | ||||||
| 1,617 | Spotify Technology SA* | 387,902 | ||||||
| 12,463 | Take-Two Interactive Software, Inc.* | 1,930,768 | ||||||
| 12,869 | Walt Disney Co. (The) | 1,560,366 | ||||||
| 158,977 | Zynga, Inc., Class A* | 1,429,203 | ||||||
|
| |||||||
| 7,786,883 | ||||||||
|
| |||||||
| Equity Real Estate Investment Trusts (REITs) – 7.3% | ||||||||
| 1,443 | American Tower Corp. REIT | 331,385 | ||||||
| 25,086 | Apartment Investment and Management Co., Class A REIT | 800,244 | ||||||
| 5,318 | Camden Property Trust REIT | 490,532 | ||||||
| 25,536 | Equity LifeStyle Properties, Inc. REIT | 1,511,476 | ||||||
| 71,954 | First Industrial Realty Trust, Inc. REIT | 2,864,489 | ||||||
| 132,407 | Invitation Homes, Inc. REIT | 3,609,415 | ||||||
| 1,654 | Life Storage, Inc. REIT | 188,804 | ||||||
| 13,959 | Mid-America Apartment Communities, Inc. REIT | 1,628,038 | ||||||
| 49,380 | Prologis, Inc. REIT | 4,898,496 | ||||||
| 12,787 | SBA Communications Corp. REIT | 3,712,961 | ||||||
| 12,557 | Sun Communities, Inc. REIT | 1,728,220 | ||||||
| 4,563 | UDR, Inc. REIT | 142,548 | ||||||
| 229,785 | VEREIT, Inc. REIT | 1,424,667 | ||||||
|
| |||||||
| 23,331,275 | ||||||||
|
| |||||||
| Food & Staples Retailing – 3.5% | ||||||||
| 10,178 | Costco Wholesale Corp. | 3,639,856 | ||||||
| 53,684 | Walmart, Inc. | 7,448,655 | ||||||
|
| |||||||
| 11,088,511 | ||||||||
|
| |||||||
| Food Products – 0.4% | ||||||||
| 21,240 | Tyson Foods, Inc., Class A | 1,215,565 | ||||||
|
| |||||||
| Health Care Equipment & Supplies – 3.3% | ||||||||
| 7,743 | Cooper Cos., Inc. (The) | 2,470,404 | ||||||
| 40,024 | Hologic, Inc.* | 2,754,452 | ||||||
| 11,953 | Medtronic PLC | 1,202,113 | ||||||
| 5,616 | STERIS PLC | 995,099 | ||||||
| 11,581 | West Pharmaceutical Services, Inc. | 3,150,843 | ||||||
|
| |||||||
| 10,572,911 | ||||||||
|
| |||||||
| Health Care Providers & Services – 4.9% | ||||||||
| 15,175 | Anthem, Inc. | 4,139,740 | ||||||
| 15,303 | Cigna Corp. | 2,555,142 | ||||||
| 28,528 | HCA Healthcare, Inc. | 3,535,760 | ||||||
| 5,125 | Humana, Inc. | 2,046,310 | ||||||
| 30,834 | Universal Health Services, Inc., Class B | 3,377,865 | ||||||
|
| |||||||
| 15,654,817 | ||||||||
|
| |||||||
| Hotels, Restaurants & Leisure – 1.0% | ||||||||
| 2,512 | Chipotle Mexican Grill, Inc.* | 3,018,118 | ||||||
| 2,986 | Darden Restaurants, Inc. | 274,473 | ||||||
|
| |||||||
| 3,292,591 | ||||||||
|
| |||||||
| Common Stocks – (continued) | ||||||||
| Household Durables – 1.3% | ||||||||
| 30,725 | D.R. Horton, Inc. | 2,052,737 | ||||||
| 55,228 | PulteGroup, Inc. | 2,251,093 | ||||||
|
| |||||||
| 4,303,830 | ||||||||
|
| |||||||
| Household Products – 0.3% | ||||||||
| 6,523 | Procter & Gamble Co. (The) | 894,303 | ||||||
|
| |||||||
| Insurance – 5.1% | ||||||||
| 42,977 | Allstate Corp. (The) | 3,814,209 | ||||||
| 22,922 | American Financial Group, Inc. | 1,717,775 | ||||||
| 36,375 | Arch Capital Group Ltd.* | 1,098,889 | ||||||
| 56,291 | Athene Holding Ltd., Class A* | 1,805,815 | ||||||
| 34,063 | Brighthouse Financial, Inc.* | 1,127,485 | ||||||
| 3,854 | Chubb Ltd. | 500,673 | ||||||
| 23,408 | First American Financial Corp. | 1,043,763 | ||||||
| 34,072 | Globe Life, Inc. | 2,762,898 | ||||||
| 71,664 | Old Republic International Corp. | 1,166,690 | ||||||
| 3,693 | Primerica, Inc. | 407,116 | ||||||
| 46,844 | Unum Group | 827,265 | ||||||
|
| |||||||
| 16,272,578 | ||||||||
|
| |||||||
| Interactive Media & Services – 3.2% | ||||||||
| 5,027 | Alphabet, Inc., Class A* | 8,124,185 | ||||||
| 28,981 | Pinterest, Inc., Class A* | 1,708,430 | ||||||
| 3,357 | Zillow Group, Inc., Class C* | 297,497 | ||||||
|
| |||||||
| 10,130,112 | ||||||||
|
| |||||||
| Internet & Direct Marketing Retail – 1.6% | ||||||||
| 186 | Amazon.com, Inc.* | 564,724 | ||||||
| 62,218 | eBay, Inc. | 2,963,443 | ||||||
| 6,718 | Wayfair, Inc., Class A* | 1,666,266 | ||||||
|
| |||||||
| 5,194,433 | ||||||||
|
| |||||||
| IT Services – 4.5% | ||||||||
| 37,785 | Fidelity National Information Services, Inc. | 4,707,633 | ||||||
| 27,064 | International Business Machines Corp. | 3,021,966 | ||||||
| 13,194 | PayPal Holdings, Inc.* | 2,455,799 | ||||||
| 1,988 | Twilio, Inc., Class A* | 554,593 | ||||||
| 15,397 | VeriSign, Inc.* | 2,936,208 | ||||||
| 34,477 | Western Union Co. (The) | 670,233 | ||||||
|
| |||||||
| 14,346,432 | ||||||||
|
| |||||||
| Life Sciences Tools & Services – 2.9% | ||||||||
| 3,209 | Mettler-Toledo International, Inc.* | 3,202,293 | ||||||
| 14,041 | PerkinElmer, Inc. | 1,819,012 | ||||||
| 8,774 | Thermo Fisher Scientific, Inc. | 4,151,155 | ||||||
|
| |||||||
| 9,172,460 | ||||||||
|
| |||||||
| Machinery – 1.7% | ||||||||
| 4,688 | AGCO Corp. | 361,117 | ||||||
| 13,138 | Dover Corp. | 1,454,508 | ||||||
| 32,057 | PACCAR, Inc. | 2,737,027 | ||||||
| 4,732 | Parker-Hannifin Corp. | 985,959 | ||||||
|
| |||||||
| 5,538,611 | ||||||||
|
| |||||||
| The accompanying notes are an integral part of these financial statements. | 31 |
GOLDMAN SACHS LARGE CAP VALUE INSIGHTS FUND
Schedule of Investments (continued)
October 31, 2020
| Shares | Description | Value | ||||||
| Common Stocks – (continued) | ||||||||
| Media – 1.6% | ||||||||
| 26,063 | Comcast Corp., Class A | $ | 1,100,901 | |||||
| 19,008 | Liberty Broadband Corp., Class C* | 2,693,624 | ||||||
| 26,210 | Omnicom Group, Inc. | 1,237,112 | ||||||
|
| |||||||
| 5,031,637 | ||||||||
|
| |||||||
| Metals & Mining – 0.3% | ||||||||
| 34,122 | Freeport-McMoRan, Inc. | 591,676 | ||||||
| 2,087 | Reliance Steel & Aluminum Co. | 227,462 | ||||||
| 1,166 | Southern Copper Corp. (Peru) | 61,028 | ||||||
|
| |||||||
| 880,166 | ||||||||
|
| |||||||
| Mortgage Real Estate Investment Trusts (REITs) – 0.6% | ||||||||
| 141,450 | Starwood Property Trust, Inc. REIT | 1,976,056 | ||||||
|
| |||||||
| Multiline Retail – 1.5% | ||||||||
| 31,947 | Target Corp. | 4,862,972 | ||||||
|
| |||||||
| Multi-Utilities – 2.0% | ||||||||
| 4,854 | CMS Energy Corp. | 307,404 | ||||||
| 9,863 | MDU Resources Group, Inc. | 234,345 | ||||||
| 66,556 | Public Service Enterprise Group, Inc. | 3,870,231 | ||||||
| 8,718 | Sempra Energy | 1,092,889 | ||||||
| 8,768 | WEC Energy Group, Inc. | 881,622 | ||||||
|
| |||||||
| 6,386,491 | ||||||||
|
| |||||||
| Oil, Gas & Consumable Fuels – 1.6% | ||||||||
| 21,621 | Chevron Corp. | 1,502,660 | ||||||
| 141,273 | Kinder Morgan, Inc. | 1,681,149 | ||||||
| 12,636 | Marathon Petroleum Corp. | 372,762 | ||||||
| 14,402 | ONEOK, Inc. | 417,658 | ||||||
| 7,494 | Phillips 66 | 349,670 | ||||||
| 21,681 | Valero Energy Corp. | 837,103 | ||||||
|
| |||||||
| 5,161,002 | ||||||||
|
| |||||||
| Personal Products – 0.3% | ||||||||
| 22,018 | Herbalife Nutrition Ltd.* | 993,892 | ||||||
|
| |||||||
| Pharmaceuticals – 4.4% | ||||||||
| 7,528 | Jazz Pharmaceuticals PLC* | 1,084,785 | ||||||
| 54,175 | Johnson & Johnson | 7,427,934 | ||||||
| 78,432 | Mylan NV* | 1,140,401 | ||||||
| 34,386 | Pfizer, Inc. | 1,220,016 | ||||||
| 21,249 | Zoetis, Inc. | 3,369,029 | ||||||
|
| |||||||
| 14,242,165 | ||||||||
|
| |||||||
| Professional Services – 0.3% | ||||||||
| 11,914 | TransUnion | 949,069 | ||||||
|
| |||||||
| Real Estate Management & Development – 0.1% | ||||||||
| 6,962 | CBRE Group, Inc., Class A* | 350,885 | ||||||
|
| |||||||
| Road & Rail – 1.6% | ||||||||
| 3,088 | CSX Corp. | 243,767 | ||||||
| 17,526 | Old Dominion Freight Line, Inc. | 3,336,425 | ||||||
| 1,401 | Ryder System, Inc. | 69,013 | ||||||
| 8,781 | Union Pacific Corp. | 1,555,905 | ||||||
|
| |||||||
| 5,205,110 | ||||||||
|
| |||||||
| Common Stocks – (continued) | ||||||||
| Semiconductors & Semiconductor Equipment – 2.7% | ||||||||
| 4,754 | Advanced Micro Devices, Inc.* | 357,929 | ||||||
| 26,962 | Intel Corp. | 1,193,877 | ||||||
| 2,150 | Lam Research Corp. | 735,472 | ||||||
| 5,076 | Micron Technology, Inc.* | 255,526 | ||||||
| 10,781 | NXP Semiconductors NV (Netherlands) | 1,456,729 | ||||||
| 33,058 | Texas Instruments, Inc. | 4,779,856 | ||||||
|
| |||||||
| 8,779,389 | ||||||||
|
| |||||||
| Software – 0.9% | ||||||||
| 5,658 | Adobe, Inc.* | 2,529,692 | ||||||
| 1,097 | Zoom Video Communications, Inc., Class A* | 505,618 | ||||||
|
| |||||||
| 3,035,310 | ||||||||
|
| |||||||
| Specialty Retail – 1.9% | ||||||||
| 56,495 | Dick’s Sporting Goods, Inc. | 3,200,442 | ||||||
| 19,251 | Lowe’s Cos., Inc. | 3,043,583 | ||||||
|
| |||||||
| 6,244,025 | ||||||||
|
| |||||||
| Technology Hardware, Storage & Peripherals – 0.2% | ||||||||
| 18,291 | Western Digital Corp. | 690,119 | ||||||
|
| |||||||
| TOTAL INVESTMENTS – 99.0% | ||||||||
| (Cost $309,676,390) | $ | 317,333,574 | ||||||
|
| |||||||
| | OTHER ASSETS IN EXCESS OF LIABILITIES – 1.0% | 3,231,972 | ||||||
|
| |||||||
| NET ASSETS – 100.0% | $ | 320,565,546 | ||||||
|
| |||||||
| The percentage shown for each investment category reflects the value of investments in that category as a percentage of net assets. | ||
* | Non-income producing security. | |
| ||
Investment Abbreviations: | ||
PLC | —Public Limited Company | |
REIT | —Real Estate Investment Trust | |
| ||
| 32 | The accompanying notes are an integral part of these financial statements. |
GOLDMAN SACHS SMALL CAP EQUITY INSIGHTS FUND
Schedule of Investments
October 31, 2020
| Shares | Description | Value | ||||||
| Common Stocks – 99.0% | ||||||||
| Aerospace & Defense – 0.5% | ||||||||
| 27,727 | Aerojet Rocketdyne Holdings, Inc.* | $ | 898,909 | |||||
| 14,541 | AeroVironment, Inc.* | 1,110,351 | ||||||
| 28,950 | Astronics Corp.* | 185,280 | ||||||
| 8,467 | Maxar Technologies, Inc. | 218,195 | ||||||
| 3,446 | Moog, Inc., Class A | 214,996 | ||||||
|
| |||||||
| 2,627,731 | ||||||||
|
| |||||||
| Air Freight & Logistics – 0.9% | ||||||||
| 4,929 | Atlas Air Worldwide Holdings, Inc.* | 291,600 | ||||||
| 93,718 | Echo Global Logistics, Inc.* | 2,527,574 | ||||||
| 33,567 | Hub Group, Inc., Class A* | 1,682,714 | ||||||
| 33,708 | Radiant Logistics, Inc.* | 173,259 | ||||||
|
| |||||||
| 4,675,147 | ||||||||
|
| |||||||
| Airlines – 0.2% | ||||||||
| 33,903 | SkyWest, Inc. | 984,204 | ||||||
|
| |||||||
| Auto Components – 1.9% | ||||||||
| 98,816 | American Axle & Manufacturing Holdings, Inc.* | 664,044 | ||||||
| 15,585 | Cooper Tire & Rubber Co. | 535,968 | ||||||
| 7,453 | Fox Factory Holding Corp.* | 626,648 | ||||||
| 186,491 | Goodyear Tire & Rubber Co. (The) | 1,544,146 | ||||||
| 6,175 | Patrick Industries, Inc. | 344,256 | ||||||
| 64,304 | Standard Motor Products, Inc. | 2,945,123 | ||||||
| 41,272 | Visteon Corp.* | 3,700,035 | ||||||
|
| |||||||
| 10,360,220 | ||||||||
|
| |||||||
| Banks – 7.6% | ||||||||
| 71,536 | 1st Source Corp. | 2,395,741 | ||||||
| 47,786 | Amalgamated Bank, Class A | 530,425 | ||||||
| 68,229 | Atlantic Capital Bancshares, Inc.* | 947,019 | ||||||
| 152,050 | Bancorp, Inc. (The)* | 1,459,680 | ||||||
| 4,789 | Banner Corp. | 176,570 | ||||||
| 99,849 | Boston Private Financial Holdings, Inc. | 617,067 | ||||||
| 116,824 | Cadence BanCorp | 1,310,765 | ||||||
| 80,545 | Cathay General Bancorp | 1,895,224 | ||||||
| 131,099 | Central Pacific Financial Corp. | 1,805,233 | ||||||
| 216,179 | CVB Financial Corp. | 3,783,133 | ||||||
| 4,893 | Equity Bancshares, Inc., Class A* | 89,933 | ||||||
| 98,576 | First BanCorp. (Puerto Rico) | 639,758 | ||||||
| 77,394 | First BankCorp | 1,864,421 | ||||||
| 219,984 | First Commonwealth Financial Corp. | 1,896,262 | ||||||
| 148,243 | First Foundation, Inc. | 2,204,373 | ||||||
| 48,787 | First Internet Bancorp | 1,049,896 | ||||||
| 25,346 | Glacier Bancorp, Inc. | 907,387 | ||||||
| 46,224 | Hanmi Financial Corp. | 415,554 | ||||||
| 78,229 | Heartland Financial USA, Inc. | 2,576,863 | ||||||
| 117,934 | Hilltop Holdings, Inc. | 2,690,075 | ||||||
| 50,628 | Hope Bancorp, Inc. | 408,568 | ||||||
| 119,383 | International Bancshares Corp. | 3,304,521 | ||||||
| 13,487 | Investors Bancorp, Inc. | 114,100 | ||||||
| 12,469 | Metropolitan Bank Holding Corp.* | 373,447 | ||||||
| 37,364 | National Bank Holdings Corp., Class A | 1,126,525 | ||||||
| 23,862 | Preferred Bank | 807,251 | ||||||
| 20,768 | Sierra Bancorp | 412,037 | ||||||
|
| |||||||
| Common Stocks – (continued) | ||||||||
| Banks – (continued) | ||||||||
| 87,811 | TriCo Bancshares | 2,540,372 | ||||||
| 59,090 | TriState Capital Holdings, Inc.* | 743,943 | ||||||
| 22,525 | Trustmark Corp. | 526,860 | ||||||
| 38,110 | Westamerica BanCorp | 1,995,821 | ||||||
|
| |||||||
| 41,608,824 | ||||||||
|
| |||||||
| Biotechnology – 10.8% | ||||||||
| 92,855 | Akebia Therapeutics, Inc.* | 206,138 | ||||||
| 1,655 | Allakos, Inc.* | 157,440 | ||||||
| 94,183 | Amicus Therapeutics, Inc.* | 1,679,283 | ||||||
| 136,073 | Ardelyx, Inc.* | 695,333 | ||||||
| 18,863 | Arena Pharmaceuticals, Inc.* | 1,616,936 | ||||||
| 26,304 | Arrowhead Pharmaceuticals, Inc.* | 1,507,219 | ||||||
| 98,885 | Atara Biotherapeutics, Inc.* | 1,276,605 | ||||||
| 8,235 | Bioxcel Therapeutics, Inc.* | 376,257 | ||||||
| 301,276 | Catalyst Pharmaceuticals, Inc.* | 894,790 | ||||||
| 17,708 | ChemoCentryx, Inc.* | 849,984 | ||||||
| 3,166 | Cortexyme, Inc.*(a) | 151,556 | ||||||
| 11,466 | CytomX Therapeutics, Inc.* | 75,905 | ||||||
| 4,758 | Denali Therapeutics, Inc.* | 203,547 | ||||||
| 54,873 | Dicerna Pharmaceuticals, Inc.* | 1,151,784 | ||||||
| 13,036 | Eagle Pharmaceuticals, Inc.* | 606,435 | ||||||
| 7,246 | Editas Medicine, Inc.* | 224,191 | ||||||
| 108,757 | Eiger BioPharmaceuticals, Inc.* | 965,762 | ||||||
| 42,998 | Emergent BioSolutions, Inc.* | 3,868,530 | ||||||
| 24,909 | Enanta Pharmaceuticals, Inc.* | 1,086,780 | ||||||
| 25,550 | Fate Therapeutics, Inc.* | 1,134,420 | ||||||
| 33,450 | FibroGen, Inc.* | 1,283,811 | ||||||
| 44,748 | G1 Therapeutics, Inc.* | 491,781 | ||||||
| 7,439 | Harpoon Therapeutics, Inc.* | 107,642 | ||||||
| 34,337 | Immunovant, Inc.* | 1,497,780 | ||||||
| 20,739 | Insmed, Inc.* | 683,143 | ||||||
| 49,133 | Intellia Therapeutics, Inc.*(a) | 1,176,244 | ||||||
| 17,687 | Intercept Pharmaceuticals, Inc.* | 491,522 | ||||||
| 6,913 | Invitae Corp.*(a) | 271,059 | ||||||
| 65,699 | Ironwood Pharmaceuticals, Inc.* | 649,106 | ||||||
| 296,981 | Kadmon Holdings, Inc.* | 1,009,735 | ||||||
| 11,805 | Karyopharm Therapeutics, Inc.* | 174,950 | ||||||
| 62,066 | Kura Oncology, Inc.* | 1,939,563 | ||||||
| 23,518 | MacroGenics, Inc.* | 456,484 | ||||||
| 178,129 | Minerva Neurosciences, Inc.* | 571,794 | ||||||
| 18,431 | Mirati Therapeutics, Inc.* | 4,002,107 | ||||||
| 68,223 | Mustang Bio, Inc.* | 181,814 | ||||||
| 86,326 | Myriad Genetics, Inc.* | 1,073,032 | ||||||
| 44,392 | Natera, Inc.* | 2,985,806 | ||||||
| 19,206 | Novavax, Inc.* | 1,550,116 | ||||||
| 618,276 | OPKO Health, Inc.*(a) | 2,176,332 | ||||||
| 8,649 | Protagonist Therapeutics, Inc.* | 163,899 | ||||||
| 86,332 | Prothena Corp. PLC (Ireland)* | 941,882 | ||||||
| 27,858 | Puma Biotechnology, Inc.* | 233,171 | ||||||
| 19,627 | REGENXBIO, Inc.* | 564,473 | ||||||
| 9,951 | REVOLUTION Medicines, Inc.* | 300,421 | ||||||
| 81,842 | Sangamo Therapeutics, Inc.* | 846,246 | ||||||
| 117,284 | Sorrento Therapeutics, Inc.*(a) | 813,951 | ||||||
| 3,400 | SpringWorks Therapeutics, Inc.* | 197,166 | ||||||
| 36,805 | TG Therapeutics, Inc.* | 930,062 | ||||||
|
| |||||||
| The accompanying notes are an integral part of these financial statements. | 33 |
GOLDMAN SACHS SMALL CAP EQUITY INSIGHTS FUND
Schedule of Investments (continued)
October 31, 2020
| Shares | Description | Value | ||||||
| Common Stocks – (continued) | ||||||||
| Biotechnology – (continued) | ||||||||
| 11,326 | Turning Point Therapeutics, Inc.* | $ | 1,044,144 | |||||
| 34,205 | Twist Bioscience Corp.* | 2,621,471 | ||||||
| 7,901 | Ultragenyx Pharmaceutical, Inc.* | 794,051 | ||||||
| 35,351 | Veracyte, Inc.* | 1,225,266 | ||||||
| 43,140 | Vericel Corp.* | 799,384 | ||||||
| 119,514 | Viking Therapeutics, Inc.* | 672,864 | ||||||
| 9,292 | Vir Biotechnology, Inc.* | 292,140 | ||||||
| 100,241 | Xencor, Inc.* | 3,847,250 | ||||||
| 27,721 | Y-mAbs Therapeutics, Inc.* | 1,184,796 | ||||||
|
| |||||||
| 58,975,353 | ||||||||
|
| |||||||
| Building Products – 2.0% | ||||||||
| 8,388 | Apogee Enterprises, Inc. | 200,389 | ||||||
| 19,709 | Masonite International Corp.* | 1,734,392 | ||||||
| 72,748 | Quanex Building Products Corp. | 1,324,014 | ||||||
| 49,216 | Simpson Manufacturing Co., Inc. | 4,366,444 | ||||||
| 68,329 | UFP Industries, Inc. | 3,410,300 | ||||||
|
| |||||||
| 11,035,539 | ||||||||
|
| |||||||
| Capital Markets – 1.9% | ||||||||
| 20,520 | Artisan Partners Asset Management, Inc., Class A | 822,031 | ||||||
| 12,163 | Cohen & Steers, Inc. | 684,899 | ||||||
| 66,386 | Cowen, Inc., Class A | 1,424,644 | ||||||
| 30,267 | Donnelley Financial Solutions, Inc.* | 382,272 | ||||||
| 60,659 | Federated Hermes, Inc. | 1,449,750 | ||||||
| 2,307 | Hamilton Lane, Inc., Class A | 160,798 | ||||||
| 49,273 | Oppenheimer Holdings, Inc., Class A | 1,234,781 | ||||||
| 50,921 | PJT Partners, Inc., Class A | 3,445,315 | ||||||
| 3,628 | Virtus Investment Partners, Inc. | 578,847 | ||||||
|
| |||||||
| 10,183,337 | ||||||||
|
| |||||||
| Chemicals – 2.5% | ||||||||
| 16,526 | Balchem Corp. | 1,651,774 | ||||||
| 1,080 | Chase Corp. | 102,773 | ||||||
| 194,410 | Ferro Corp.* | 2,500,113 | ||||||
| 60,774 | Ingevity Corp.* | 3,335,277 | ||||||
| 38,278 | Koppers Holdings, Inc.* | 858,575 | ||||||
| 26,686 | Kraton Corp.* | 755,214 | ||||||
| 65,739 | Minerals Technologies, Inc. | 3,595,266 | ||||||
| 24,520 | Orion Engineered Carbons SA (Germany) | 359,708 | ||||||
| 22,251 | Tronox Holdings PLC, Class A | 217,392 | ||||||
|
| |||||||
| 13,376,092 | ||||||||
|
| |||||||
| Commercial Services & Supplies – 1.7% | ||||||||
| 11,428 | BrightView Holdings, Inc.* | 139,765 | ||||||
| 7,515 | Ennis, Inc. | 114,529 | ||||||
| 65,004 | HNI Corp. | 2,115,880 | ||||||
| 132,597 | KAR Auction Services, Inc. | 1,930,612 | ||||||
| 9,039 | Matthews International Corp., Class A | 197,321 | ||||||
| 48,783 | McGrath RentCorp | 2,784,534 | ||||||
| 51,769 | Steelcase, Inc., Class A | 540,468 | ||||||
| 25,737 | Team, Inc.* | 137,950 | ||||||
| 8,038 | UniFirst Corp. | 1,316,705 | ||||||
|
| |||||||
| 9,277,764 | ||||||||
|
| |||||||
| Common Stocks – (continued) | ||||||||
| Communications Equipment – 0.7% | ||||||||
| 181,356 | Harmonic, Inc.* | 1,077,255 | ||||||
| 84,867 | NETGEAR, Inc.* | 2,615,601 | ||||||
|
| |||||||
| 3,692,856 | ||||||||
|
| |||||||
| Construction & Engineering – 0.7% | ||||||||
| 44,373 | Aegion Corp.* | 626,103 | ||||||
| 14,107 | EMCOR Group, Inc. | 961,956 | ||||||
| 123,840 | Great Lakes Dredge & Dock Corp.* | 1,279,267 | ||||||
| 46,116 | Primoris Services Corp. | 870,209 | ||||||
|
| |||||||
| 3,737,535 | ||||||||
|
| |||||||
| Construction Materials – 0.7% | ||||||||
| 20,917 | Forterra, Inc.* | 272,967 | ||||||
| 195,868 | Summit Materials, Inc., Class A* | 3,464,905 | ||||||
|
| |||||||
| 3,737,872 | ||||||||
|
| |||||||
| Consumer Finance – 1.0% | ||||||||
| 11,329 | Curo Group Holdings Corp. | 84,854 | ||||||
| 116,623 | Enova International, Inc.* | 1,790,163 | ||||||
| 28,762 | FirstCash, Inc. | 1,496,775 | ||||||
| 235,085 | Navient Corp. | 1,883,031 | ||||||
|
| |||||||
| 5,254,823 | ||||||||
|
| |||||||
| Containers & Packaging – 0.2% | ||||||||
| 21,429 | Myers Industries, Inc. | 307,292 | ||||||
| 84,171 | O-I Glass, Inc. | 793,732 | ||||||
|
| |||||||
| 1,101,024 | ||||||||
|
| |||||||
| Diversified Consumer Services – 0.9% | ||||||||
| 31,472 | American Public Education, Inc.* | 889,714 | ||||||
| 3,215 | Carriage Services, Inc. | 82,979 | ||||||
| 26,108 | Collectors Universe, Inc. | 1,434,112 | ||||||
| 28,451 | K12, Inc.* | 679,125 | ||||||
| 120,438 | Perdoceo Education Corp.* | 1,359,745 | ||||||
| 6,548 | Strategic Education, Inc. | 543,877 | ||||||
|
| |||||||
| 4,989,552 | ||||||||
|
| |||||||
| Diversified Financial Services – 0.3% | ||||||||
| 116,065 | Banco Latinoamericano de Comercio Exterior SA, Class E (Panama) | 1,484,471 | ||||||
|
| |||||||
| Diversified Telecommunication Services – 1.6% | ||||||||
| 51,427 | Cogent Communications Holdings, Inc. | 2,869,627 | ||||||
| 129,649 | Consolidated Communications Holdings, Inc.* | 605,461 | ||||||
| 79,861 | Iridium Communications, Inc.* | 2,109,129 | ||||||
| 24,568 | Ooma, Inc.* | 346,654 | ||||||
| 400,966 | ORBCOMM, Inc.* | 1,724,154 | ||||||
| 94,788 | Vonage Holdings Corp.* | 1,002,857 | ||||||
|
| |||||||
| 8,657,882 | ||||||||
|
| |||||||
| Electric Utilities – 0.3% | ||||||||
| 44,943 | Portland General Electric Co. | 1,766,260 | ||||||
|
| |||||||
| Electrical Equipment – 1.0% | ||||||||
| 63,538 | Atkore International Group, Inc.* | 1,314,601 | ||||||
| 26,798 | Encore Wire Corp. | 1,238,336 | ||||||
|
| |||||||
| 34 | The accompanying notes are an integral part of these financial statements. |
GOLDMAN SACHS SMALL CAP EQUITY INSIGHTS FUND
| Shares | Description | Value | ||||||
| Common Stocks – (continued) | ||||||||
| Electrical Equipment – (continued) | ||||||||
| 21,632 | Powell Industries, Inc. | $ | 511,164 | |||||
| 14,902 | Sunrun, Inc.* | 775,202 | ||||||
| 22,837 | Vicor Corp.* | 1,781,286 | ||||||
|
| |||||||
| 5,620,589 | ||||||||
|
| |||||||
| Electronic Equipment, Instruments & Components – 3.2% | ||||||||
| 65,917 | Belden, Inc. | 2,035,517 | ||||||
| 46,663 | Benchmark Electronics, Inc. | 971,990 | ||||||
| 13,989 | CTS Corp. | 386,656 | ||||||
| 8,913 | Fabrinet (Thailand)* | 534,958 | ||||||
| 195,712 | Knowles Corp.* | 2,788,896 | ||||||
| 21,477 | Novanta, Inc.* | 2,334,980 | ||||||
| 8,958 | Plexus Corp.* | 622,939 | ||||||
| 1,279 | Rogers Corp.* | 155,041 | ||||||
| 278,174 | TTM Technologies, Inc.* | 3,301,925 | ||||||
| 208,396 | Vishay Intertechnology, Inc. | 3,380,183 | ||||||
| 49,142 | Vishay Precision Group, Inc.* | 1,174,002 | ||||||
|
| |||||||
| 17,687,087 | ||||||||
|
| |||||||
| Energy Equipment & Services – 0.7% | ||||||||
| 41,984 | Cactus, Inc., Class A | 713,728 | ||||||
| 85,991 | Matrix Service Co.* | 653,532 | ||||||
| 42,506 | Oil States International, Inc.* | 105,840 | ||||||
| 70,918 | SEACOR Holdings, Inc.* | 2,172,218 | ||||||
| 17,585 | Solaris Oilfield Infrastructure, Inc., Class A | 104,279 | ||||||
|
| |||||||
| 3,749,597 | ||||||||
|
| |||||||
| Entertainment – 0.5% | ||||||||
| 381,614 | Glu Mobile, Inc.* | 2,732,356 | ||||||
|
| |||||||
| Equity Real Estate Investment Trusts (REITs) – 6.9% | ||||||||
| 88,210 | American Assets Trust, Inc. REIT | 1,846,235 | ||||||
| 195,471 | CareTrust REIT, Inc. REIT | 3,342,554 | ||||||
| 160,304 | City Office REIT, Inc. REIT | 1,013,121 | ||||||
| 33,989 | Community Healthcare Trust, Inc. REIT | 1,573,691 | ||||||
| 21,187 | EastGroup Properties, Inc. REIT | 2,819,566 | ||||||
| 114,296 | Four Corners Property Trust, Inc. REIT | 2,896,261 | ||||||
| 28,805 | Gladstone Commercial Corp. REIT | 468,081 | ||||||
| 116,349 | Independence Realty Trust, Inc. REIT | 1,413,640 | ||||||
| 55,216 | Industrial Logistics Properties Trust REIT | 1,059,043 | ||||||
| 274,855 | Lexington Realty Trust REIT | 2,729,310 | ||||||
| 104,921 | National Storage Affiliates Trust REIT | 3,555,773 | ||||||
| 78,773 | NexPoint Residential Trust, Inc. REIT | 3,491,219 | ||||||
| 55,137 | Physicians Realty Trust REIT | 929,610 | ||||||
| 93,898 | PotlatchDeltic Corp. REIT | 3,901,462 | ||||||
| 25,774 | Retail Opportunity Investments Corp. REIT | 250,781 | ||||||
| 65,018 | Retail Value, Inc. REIT | 812,725 | ||||||
| 287,900 | Sabra Health Care REIT, Inc. REIT | 3,788,764 | ||||||
| 23,574 | Terreno Realty Corp. REIT | 1,326,745 | ||||||
| 5,859 | Universal Health Realty Income Trust REIT | 313,281 | ||||||
|
| |||||||
| 37,531,862 | ||||||||
|
| |||||||
| Common Stocks – (continued) | ||||||||
| Food & Staples Retailing – 1.4% | ||||||||
| 114,231 | BJ’s Wholesale Club Holdings, Inc.* | 4,373,905 | ||||||
| 51,993 | Ingles Markets, Inc., Class A | 1,864,469 | ||||||
| 25,913 | Natural Grocers by Vitamin Cottage, Inc. | 275,714 | ||||||
| 21,294 | SpartanNash Co. | 392,023 | ||||||
| 17,568 | Weis Markets, Inc. | 797,763 | ||||||
|
| |||||||
| 7,703,874 | ||||||||
|
| |||||||
| Food Products – 1.0% | ||||||||
| 76,655 | Darling Ingredients, Inc.* | 3,296,165 | ||||||
| 21,650 | John B. Sanfilippo & Son, Inc. | 1,575,254 | ||||||
| 18,433 | Seneca Foods Corp., Class A* | 679,256 | ||||||
|
| |||||||
| 5,550,675 | ||||||||
|
| |||||||
| Gas Utilities – 0.3% | ||||||||
| 27,806 | Northwest Natural Holding Co. | 1,235,699 | ||||||
| 4,877 | Southwest Gas Holdings, Inc. | 320,516 | ||||||
| 6,120 | Spire, Inc. | 342,965 | ||||||
|
| |||||||
| 1,899,180 | ||||||||
|
| |||||||
| Health Care Equipment & Supplies – 2.6% | ||||||||
| 23,736 | Antares Pharma, Inc.* | 64,799 | ||||||
| 8,516 | CONMED Corp. | 663,992 | ||||||
| 55,857 | GenMark Diagnostics, Inc.* | 682,573 | ||||||
| 20,546 | Inogen, Inc.* | 600,149 | ||||||
| 57,346 | Integer Holdings Corp.* | 3,351,874 | ||||||
| 45,838 | Invacare Corp. | 371,746 | ||||||
| 31,574 | Meridian Bioscience, Inc.* | 541,494 | ||||||
| 108,904 | Natus Medical, Inc.* | 1,983,142 | ||||||
| 52,449 | Neogen Corp.* | 3,657,793 | ||||||
| 9,156 | Shockwave Medical, Inc.* | 625,538 | ||||||
| 30,832 | Surmodics, Inc.* | 1,133,076 | ||||||
| 3,644 | Utah Medical Products, Inc. | 302,452 | ||||||
|
| |||||||
| 13,978,628 | ||||||||
|
| |||||||
| Health Care Providers & Services – 1.9% | ||||||||
| 28,952 | Castle Biosciences, Inc.* | 1,344,241 | ||||||
| 11,780 | Covetrus, Inc.* | 290,848 | ||||||
| 32,314 | Cross Country Healthcare, Inc.* | 253,665 | ||||||
| 19,165 | Hanger, Inc.* | 334,813 | ||||||
| 2,774 | LHC Group, Inc.* | 600,710 | ||||||
| 7,589 | National HealthCare Corp. | 480,384 | ||||||
| 14,081 | Option Care Health, Inc.* | 187,700 | ||||||
| 169,136 | Select Medical Holdings Corp.* | 3,548,473 | ||||||
| 123,412 | Tenet Healthcare Corp.* | 3,028,530 | ||||||
| 1,560 | US Physical Therapy, Inc. | 123,755 | ||||||
|
| |||||||
| 10,193,119 | ||||||||
|
| |||||||
| Health Care Technology – 0.5% | ||||||||
| 2,873 | Computer Programs and Systems, Inc. | 80,128 | ||||||
| 48,810 | Inovalon Holdings, Inc., Class A* | 926,902 | ||||||
| 10,916 | NextGen Healthcare, Inc.* | 148,457 | ||||||
| 10,060 | Schrodinger, Inc.* | 490,727 | ||||||
| 14,027 | Simulations Plus, Inc. | 909,230 | ||||||
|
| |||||||
| 2,555,444 | ||||||||
|
| |||||||
| The accompanying notes are an integral part of these financial statements. | 35 |
GOLDMAN SACHS SMALL CAP EQUITY INSIGHTS FUND
Schedule of Investments (continued)
October 31, 2020
| Shares | Description | Value | ||||||
| Common Stocks – (continued) | ||||||||
| Hotels, Restaurants & Leisure – 4.1% | ||||||||
| 55,636 | Bloomin’ Brands, Inc. | $ | 777,791 | |||||
| 33,427 | Caesars Entertainment, Inc.* | 1,498,198 | ||||||
| 9,973 | Carrols Restaurant Group, Inc.* | 58,342 | ||||||
| 14,719 | Chuy’s Holdings, Inc.* | 308,952 | ||||||
| 1,165 | Cracker Barrel Old Country Store, Inc. | 132,600 | ||||||
| 17,373 | Del Taco Restaurants, Inc.* | 128,821 | ||||||
| 28,388 | Dine Brands Global, Inc. | 1,460,563 | ||||||
| 73,856 | El Pollo Loco Holdings, Inc.* | 1,042,847 | ||||||
| 45,567 | Everi Holdings, Inc.* | 392,332 | ||||||
| 55,316 | Fiesta Restaurant Group, Inc.* | 477,930 | ||||||
| 103,544 | International Game Technology PLC | 850,096 | ||||||
| 5,949 | Jack in the Box, Inc. | 476,277 | ||||||
| 11,445 | Noodles & Co.* | 73,935 | ||||||
| 20,269 | Papa John’s International, Inc. | 1,552,605 | ||||||
| 54,695 | Penn National Gaming, Inc.* | 2,952,436 | ||||||
| 172,119 | Red Rock Resorts, Inc., Class A | 3,290,915 | ||||||
| 44,816 | Texas Roadhouse, Inc. | 3,138,465 | ||||||
| 31,911 | Wingstop, Inc. | 3,712,207 | ||||||
|
| |||||||
| 22,325,312 | ||||||||
|
| |||||||
| Household Durables – 1.9% | ||||||||
| 10,259 | Century Communities, Inc.* | 398,460 | ||||||
| 22,133 | KB Home | 713,789 | ||||||
| 61,817 | M/I Homes, Inc.* | 2,529,552 | ||||||
| 13,337 | MDC Holdings, Inc. | 580,426 | ||||||
| 16,515 | Meritage Homes Corp.* | 1,438,291 | ||||||
| 19,989 | Sonos, Inc.* | 291,839 | ||||||
| 37,420 | Taylor Morrison Home Corp.* | 808,272 | ||||||
| 212,062 | TRI Pointe Group, Inc.* | 3,484,179 | ||||||
|
| |||||||
| 10,244,808 | ||||||||
|
| |||||||
| Household Products – 0.1% | ||||||||
| 22,092 | Central Garden & Pet Co., Class A* | 781,836 | ||||||
|
| |||||||
| Insurance – 3.4% | ||||||||
| 91,656 | American Equity Investment Life Holding Co. | 2,274,902 | ||||||
| 28,378 | AMERISAFE, Inc. | 1,673,735 | ||||||
| 35,071 | Argo Group International Holdings Ltd. | 1,251,333 | ||||||
| 1,213 | Enstar Group Ltd.* | 208,478 | ||||||
| 241,867 | Genworth Financial, Inc., Class A* | 950,538 | ||||||
| 27,556 | Goosehead Insurance, Inc., Class A | 3,376,712 | ||||||
| 4,152 | HCI Group, Inc. | 195,061 | ||||||
| 11,862 | Kinsale Capital Group, Inc. | 2,223,769 | ||||||
| 1,889 | National Western Life Group, Inc., Class A | 320,431 | ||||||
| 76,157 | Stewart Information Services Corp. | 3,228,295 | ||||||
| 37,781 | Trupanion, Inc.* | 2,702,853 | ||||||
|
| |||||||
| 18,406,107 | ||||||||
|
| |||||||
| Interactive Media & Services – 0.6% | ||||||||
| 56,000 | Cargurus, Inc.* | 1,116,080 | ||||||
| 130,107 | Cars.com, Inc.* | 961,491 | ||||||
| 20,988 | EverQuote, Inc., Class A* | 702,888 | ||||||
| 26,226 | QuinStreet, Inc.* | 419,747 | ||||||
|
| |||||||
| 3,200,206 | ||||||||
|
| |||||||
| Common Stocks – (continued) | ||||||||
| Internet & Direct Marketing Retail – 0.5% | ||||||||
| 12,292 | Stamps.com, Inc.* | 2,744,066 | ||||||
|
| |||||||
| IT Services – 1.6% | ||||||||
| 52,678 | Brightcove, Inc.* | 666,377 | ||||||
| 233,707 | Conduent, Inc.* | 814,469 | ||||||
| 71,257 | Perficient, Inc.* | 2,790,424 | ||||||
| 122,746 | Perspecta, Inc. | 2,200,836 | ||||||
| 58,281 | Sykes Enterprises, Inc.* | 1,995,541 | ||||||
| 5,439 | TTEC Holdings, Inc. | 297,948 | ||||||
|
| |||||||
| 8,765,595 | ||||||||
|
| |||||||
| Leisure Products – 1.3% | ||||||||
| 19,700 | Nautilus, Inc.* | 427,293 | ||||||
| 31,108 | Smith & Wesson Brands, Inc. | 516,082 | ||||||
| 38,746 | Sturm Ruger & Co., Inc. | 2,590,558 | ||||||
| 63,768 | Vista Outdoor, Inc.* | 1,260,693 | ||||||
| 47,578 | YETI Holdings, Inc.* | 2,354,159 | ||||||
|
| |||||||
| 7,148,785 | ||||||||
|
| |||||||
| Machinery – 2.8% | ||||||||
| 32,902 | Albany International Corp., Class A | 1,676,028 | ||||||
| 35,326 | Columbus McKinnon Corp. | 1,197,198 | ||||||
| 31,309 | Federal Signal Corp. | 897,942 | ||||||
| 54,144 | Franklin Electric Co., Inc. | 3,234,021 | ||||||
| 12,062 | Miller Industries, Inc. | 361,136 | ||||||
| 44,272 | Mueller Industries, Inc. | 1,280,789 | ||||||
| 4,537 | Navistar International Corp.* | 195,590 | ||||||
| 17,621 | RBC Bearings, Inc.* | 2,097,780 | ||||||
| 127,743 | Rexnord Corp. | 4,097,996 | ||||||
|
| |||||||
| 15,038,480 | ||||||||
|
| |||||||
| Marine – 0.1% | ||||||||
| 55,201 | Costamare, Inc. (Monaco) | 314,094 | ||||||
|
| |||||||
| Media – 1.0% | ||||||||
| 4,468 | Cardlytics, Inc.* | 329,828 | ||||||
| 89,819 | Gray Television, Inc.* | 1,138,905 | ||||||
| 3,617 | Loral Space & Communications, Inc. | 62,972 | ||||||
| 95,371 | MSG Networks, Inc., Class A* | 852,617 | ||||||
| 69,208 | TechTarget, Inc.* | 3,031,310 | ||||||
|
| |||||||
| 5,415,632 | ||||||||
|
| |||||||
| Metals & Mining – 1.1% | ||||||||
| 196,763 | Alcoa Corp.* | 2,542,178 | ||||||
| 19,106 | Commercial Metals Co. | 394,539 | ||||||
| 38,497 | Haynes International, Inc. | 624,036 | ||||||
| 276,992 | Hecla Mining Co. | 1,268,623 | ||||||
| 3,848 | Kaiser Aluminum Corp. | 242,155 | ||||||
| 22,505 | Worthington Industries, Inc. | 1,107,471 | ||||||
|
| |||||||
| 6,179,002 | ||||||||
|
| |||||||
| Mortgage Real Estate Investment Trusts (REITs) – 1.0% | ||||||||
| 370,175 | Anworth Mortgage Asset Corp. REIT | 607,087 | ||||||
| 45,120 | ARMOUR Residential REIT, Inc. REIT | 430,445 | ||||||
| 103,356 | Capstead Mortgage Corp. REIT | 528,149 | ||||||
| 131,465 | Ladder Capital Corp. REIT | 985,988 | ||||||
|
| |||||||
| 36 | The accompanying notes are an integral part of these financial statements. |
GOLDMAN SACHS SMALL CAP EQUITY INSIGHTS FUND
| Shares | Description | Value | ||||||
| Common Stocks – (continued) | ||||||||
| Mortgage Real Estate Investment Trusts (REITs) – (continued) | ||||||||
| 207,651 | PennyMac Mortgage Investment Trust REIT | $ | 3,108,535 | |||||
|
| |||||||
| 5,660,204 | ||||||||
|
| |||||||
| Multiline Retail – 0.6% | ||||||||
| 73,251 | Big Lots, Inc. | 3,486,748 | ||||||
|
| |||||||
| Multi-Utilities – 0.8% | ||||||||
| 6,566 | Black Hills Corp. | 372,030 | ||||||
| 75,909 | NorthWestern Corp. | 3,957,136 | ||||||
|
| |||||||
| 4,329,166 | ||||||||
|
| |||||||
| Oil, Gas & Consumable Fuels – 1.3% | ||||||||
| 110,737 | Ardmore Shipping Corp. (Ireland) | 310,064 | ||||||
| 104,574 | Clean Energy Fuels Corp.* | 259,343 | ||||||
| 290,724 | DHT Holdings, Inc. | 1,398,382 | ||||||
| 13,298 | Diamond S Shipping, Inc.* | 75,267 | ||||||
| 33,165 | Dorian LPG Ltd.* | 271,953 | ||||||
| 124,377 | Green Plains, Inc.* | 1,878,093 | ||||||
| 12,485 | International Seaways, Inc. | 169,047 | ||||||
| 9,957 | Renewable Energy Group, Inc.* | 561,575 | ||||||
| 59,157 | Scorpio Tankers, Inc. (Monaco) | 521,765 | ||||||
| 88,646 | World Fuel Services Corp. | 1,865,998 | ||||||
|
| |||||||
| 7,311,487 | ||||||||
|
| |||||||
| Paper & Forest Products – 1.7% | ||||||||
| 84,161 | Boise Cascade Co. | 3,230,099 | ||||||
| 10,271 | Clearwater Paper Corp.* | 381,568 | ||||||
| 94,673 | Glatfelter Corp. | 1,350,984 | ||||||
| 143,171 | Louisiana-Pacific Corp. | 4,091,827 | ||||||
|
| |||||||
| 9,054,478 | ||||||||
|
| |||||||
| Personal Products – 0.3% | ||||||||
| 3,793 | Medifast, Inc. | 532,878 | ||||||
| 16,043 | USANA Health Sciences, Inc.* | 1,213,653 | ||||||
|
| |||||||
| 1,746,531 | ||||||||
|
| |||||||
| Pharmaceuticals – 2.5% | ||||||||
| 52,372 | Amneal Pharmaceuticals, Inc.* | 217,868 | ||||||
| 84,915 | Amphastar Pharmaceuticals, Inc.* | 1,663,485 | ||||||
| 51,738 | ANI Pharmaceuticals, Inc.* | 1,318,802 | ||||||
| 15,498 | Axsome Therapeutics, Inc.* | 1,027,672 | ||||||
| 262,622 | BioDelivery Sciences International, Inc.* | 829,886 | ||||||
| 49,494 | Corcept Therapeutics, Inc.* | 830,509 | ||||||
| 76,453 | Endo International PLC* | 349,390 | ||||||
| 212,282 | Innoviva, Inc.* | 2,294,768 | ||||||
| 2,512 | MyoKardia, Inc.* | 561,507 | ||||||
| 3,855 | Pacira BioSciences, Inc.* | 201,616 | ||||||
| 63,308 | Phibro Animal Health Corp., Class A | 1,040,784 | ||||||
| 99,932 | Prestige Consumer Healthcare, Inc.* | 3,300,754 | ||||||
|
| |||||||
| 13,637,041 | ||||||||
|
| |||||||
| Professional Services – 0.4% | ||||||||
| 19,903 | Huron Consulting Group, Inc.* | 753,527 | ||||||
| 1,921 | Insperity, Inc. | 147,110 | ||||||
| 32,214 | Kforce, Inc. | 1,117,826 | ||||||
|
| |||||||
| 2,018,463 | ||||||||
|
| |||||||
| Common Stocks – (continued) | ||||||||
| Real Estate Management & Development – 0.5% | ||||||||
| 60,358 | Redfin Corp.* | 2,521,154 | ||||||
|
| |||||||
| Road & Rail – 1.2% | ||||||||
| 198,486 | Marten Transport Ltd. | 3,045,768 | ||||||
| 1,473 | Saia, Inc.* | 217,503 | ||||||
| 93,923 | Werner Enterprises, Inc. | 3,570,952 | ||||||
|
| |||||||
| 6,834,223 | ||||||||
|
| |||||||
| Semiconductors & Semiconductor Equipment – 2.2% | ||||||||
| 36,152 | Ambarella, Inc.* | 1,976,430 | ||||||
| 57,217 | Amkor Technology, Inc.* | 678,021 | ||||||
| 91,175 | Axcelis Technologies, Inc.* | 2,012,232 | ||||||
| 12,785 | Lattice Semiconductor Corp.* | 446,197 | ||||||
| 44,059 | MACOM Technology Solutions Holdings, Inc.* | 1,608,154 | ||||||
| 171,662 | NeoPhotonics Corp.* | 1,169,018 | ||||||
| 33,656 | Power Integrations, Inc. | 2,026,428 | ||||||
| 113,453 | Rambus, Inc.* | 1,564,517 | ||||||
| 1,790 | SiTime Corp.* | 149,447 | ||||||
| 5,525 | Ultra Clean Holdings, Inc.* | 117,627 | ||||||
|
| |||||||
| 11,748,071 | ||||||||
|
| |||||||
| Software – 3.8% | ||||||||
| 18,307 | ACI Worldwide, Inc.* | 534,015 | ||||||
| 2,175 | Blackline, Inc.* | 212,454 | ||||||
| 232,106 | Box, Inc., Class A* | 3,597,643 | ||||||
| 103,520 | ChannelAdvisor Corp.* | 1,677,024 | ||||||
| 249,056 | Cloudera, Inc.* | 2,420,824 | ||||||
| 40,182 | Domo, Inc., Class B* | 1,276,582 | ||||||
| 12,763 | J2 Global, Inc.* | 866,353 | ||||||
| 5,544 | MicroStrategy, Inc., Class A* | 926,236 | ||||||
| 8,349 | Model N, Inc.* | 294,135 | ||||||
| 14,500 | Sailpoint Technologies Holdings, Inc.* | 601,895 | ||||||
| 147,635 | SVMK, Inc.* | 3,090,001 | ||||||
| 42,512 | Tenable Holdings, Inc.* | 1,450,084 | ||||||
| 13,853 | Varonis Systems, Inc.* | 1,600,991 | ||||||
| 24,719 | Verint Systems, Inc.* | 1,199,366 | ||||||
| 79,495 | Zuora, Inc., Class A* | 764,742 | ||||||
|
| |||||||
| 20,512,345 | ||||||||
|
| |||||||
| Specialty Retail – 3.9% | ||||||||
| 211,363 | Abercrombie & Fitch Co., Class A | 3,005,582 | ||||||
| 926 | Asbury Automotive Group, Inc.* | 95,360 | ||||||
| 54,435 | At Home Group, Inc.* | 886,746 | ||||||
| 64,275 | Bed Bath & Beyond, Inc. | 1,272,645 | ||||||
| 12,096 | Buckle, Inc. (The) | 289,820 | ||||||
| 86,473 | Camping World Holdings, Inc., Class A | 2,286,346 | ||||||
| 19,908 | Haverty Furniture Cos., Inc. | 498,098 | ||||||
| 17,267 | Hibbett Sports, Inc.* | 652,865 | ||||||
| 15,431 | Lithia Motors, Inc., Class A | 3,542,495 | ||||||
| 75,716 | MarineMax, Inc.* | 2,269,966 | ||||||
| 18,946 | Rent-A-Center, Inc. | 585,431 | ||||||
| 5,071 | RH* | 1,699,951 | ||||||
| 12,213 | Sonic Automotive, Inc., Class A | 440,401 | ||||||
| 224,230 | Sportsman’s Warehouse Holdings, Inc.* | 2,919,475 | ||||||
| 27,346 | Zumiez, Inc.* | 765,688 | ||||||
|
| |||||||
| 21,210,869 | ||||||||
|
| |||||||
| The accompanying notes are an integral part of these financial statements. | 37 |
GOLDMAN SACHS SMALL CAP EQUITY INSIGHTS FUND
Schedule of Investments (continued)
October 31, 2020
| Shares | Description | Value | ||||||
| Common Stocks – (continued) | ||||||||
| Textiles, Apparel & Luxury Goods – 0.6% | ||||||||
| 13,030 | Crocs, Inc.* | $ | 681,860 | |||||
| 6,339 | Deckers Outdoor Corp.* | 1,606,112 | ||||||
| 54,405 | G-III Apparel Group Ltd.* | 733,379 | ||||||
| 9,674 | Wolverine World Wide, Inc. | 258,006 | ||||||
|
| |||||||
| 3,279,357 | ||||||||
|
| |||||||
| Thrifts & Mortgage Finance – 1.0% | ||||||||
| 14,558 | Mr. Cooper Group, Inc.* | 306,883 | ||||||
| 70,253 | PennyMac Financial Services, Inc. | 3,570,257 | ||||||
| 74,836 | Washington Federal, Inc. | 1,593,258 | ||||||
|
| |||||||
| 5,470,398 | ||||||||
|
| |||||||
| Tobacco – 0.1% | ||||||||
| 81,614 | Vector Group Ltd. | 750,033 | ||||||
|
| |||||||
| Trading Companies & Distributors – 2.2% | ||||||||
| 11,726 | Beacon Roofing Supply, Inc.* | 359,988 | ||||||
| 104,426 | Foundation Building Materials, Inc.* | 1,520,443 | ||||||
| 36,243 | GMS, Inc.* | 819,092 | ||||||
| 105,194 | H&E Equipment Services, Inc. | 2,213,282 | ||||||
| 270,653 | MRC Global, Inc.* | 1,152,982 | ||||||
| 112,735 | Rush Enterprises, Inc., Class A | 4,040,422 | ||||||
| 8,915 | SiteOne Landscape Supply, Inc.* | 1,065,253 | ||||||
| 30,021 | Triton International Ltd. (Bermuda) | 1,107,174 | ||||||
|
| |||||||
| 12,278,636 | ||||||||
|
| |||||||
| | TOTAL INVESTMENTS BEFORE SECURITIES LENDING REINVESTMENT VEHICLE | | ||||||
| (Cost $553,803,160) | $ | 539,142,024 | ||||||
|
| |||||||
| Shares | Dividend Rate | Value | ||||||
| Securities Lending Reinvestment Vehicle – 0.9%(b) | ||||||||
| | Goldman Sachs Financial Square Government Fund – | | ||||||
| 5,113,213 | 0.028% | $ | 5,113,213 | |||||
| (Cost $5,113,213) | ||||||||
|
| |||||||
| TOTAL INVESTMENTS – 99.9% | ||||||||
| (Cost $558,916,373) | $ | 544,255,237 | ||||||
|
| |||||||
| | OTHER ASSETS IN EXCESS OF LIABILITIES – 0.1% | 113,924 | ||||||
|
| |||||||
| NET ASSETS – 100.0% | $ | 544,369,161 | ||||||
|
| |||||||
| The percentage shown for each investment category reflects the value of investments in that category as a percentage of net assets. | ||
* | Non-income producing security. | |
(a) | All or a portion of security is on loan. | |
(b) | Represents an affiliated issuer. | |
| ||
Investment Abbreviations: | ||
PLC | —Public Limited Company | |
REIT | —Real Estate Investment Trust | |
| ||
| 38 | The accompanying notes are an integral part of these financial statements. |
GOLDMAN SACHS SMALL CAP GROWTH INSIGHTS FUND
Schedule of Investments
October 31, 2020
| Shares | Description | Value | ||||||
| Common Stocks – 99.6% | ||||||||
| Aerospace & Defense – 0.6% | ||||||||
| 41,683 | Aerojet Rocketdyne Holdings, Inc.* | $ | 1,351,363 | |||||
| 47,967 | AeroVironment, Inc.* | 3,662,760 | ||||||
| 97,317 | Astronics Corp.* | 622,829 | ||||||
|
| |||||||
| 5,636,952 | ||||||||
|
| |||||||
| Air Freight & Logistics – 0.3% | ||||||||
| 127,957 | Echo Global Logistics, Inc.* | 3,451,000 | ||||||
|
| |||||||
| Auto Components – 1.8% | ||||||||
| 55,452 | Fox Factory Holding Corp.* | 4,662,404 | ||||||
| 4,935 | Patrick Industries, Inc. | 275,126 | ||||||
| 101,102 | Standard Motor Products, Inc. | 4,630,472 | ||||||
| 87,156 | Visteon Corp.* | 7,813,535 | ||||||
|
| |||||||
| 17,381,537 | ||||||||
|
| |||||||
| Banks – 1.8% | ||||||||
| 61,171 | Amalgamated Bank, Class A | 678,998 | ||||||
| 45,994 | Atlantic Capital Bancshares, Inc.* | 638,397 | ||||||
| 178,206 | Central Pacific Financial Corp. | 2,453,897 | ||||||
| 314,569 | CVB Financial Corp. | 5,504,957 | ||||||
| 112,569 | First Foundation, Inc. | 1,673,901 | ||||||
| 17,220 | Hilltop Holdings, Inc. | 392,788 | ||||||
| 136,213 | International Bancshares Corp. | 3,770,376 | ||||||
| 60,003 | TriCo Bancshares | 1,735,887 | ||||||
| 14,462 | Westamerica BanCorp | 757,375 | ||||||
|
| |||||||
| 17,606,576 | ||||||||
|
| |||||||
| Biotechnology – 18.9% | ||||||||
| 179,502 | Akebia Therapeutics, Inc.* | 398,494 | ||||||
| 22,294 | Allakos, Inc.* | 2,120,828 | ||||||
| 358,043 | Amicus Therapeutics, Inc.* | 6,383,907 | ||||||
| 34,889 | Apellis Pharmaceuticals, Inc.* | 1,112,959 | ||||||
| 3,206 | Arcturus Therapeutics Holdings, Inc.* | 173,380 | ||||||
| 149,319 | Ardelyx, Inc.* | 763,020 | ||||||
| 15,896 | Arena Pharmaceuticals, Inc.* | 1,362,605 | ||||||
| 97,035 | Arrowhead Pharmaceuticals, Inc.* | 5,560,106 | ||||||
| 203,302 | Atara Biotherapeutics, Inc.* | 2,624,629 | ||||||
| 31,974 | Bioxcel Therapeutics, Inc.* | 1,460,892 | ||||||
| 30,532 | Blueprint Medicines Corp.* | 3,122,813 | ||||||
| 30,433 | Bridgebio Pharma, Inc.* | 1,168,019 | ||||||
| 24,692 | CareDx, Inc.* | 1,211,143 | ||||||
| 564,259 | Catalyst Pharmaceuticals, Inc.* | 1,675,849 | ||||||
| 54,313 | CEL-SCI Corp.*(a) | 653,385 | ||||||
| 65,360 | ChemoCentryx, Inc.* | 3,137,280 | ||||||
| 22,744 | Cortexyme, Inc.*(a) | 1,088,755 | ||||||
| 18,209 | Cytokinetics, Inc.* | 279,872 | ||||||
| 49,154 | CytomX Therapeutics, Inc.* | 325,399 | ||||||
| 65,764 | Denali Therapeutics, Inc.* | 2,813,384 | ||||||
| 180,186 | Dicerna Pharmaceuticals, Inc.* | 3,782,104 | ||||||
| 50,815 | Eagle Pharmaceuticals, Inc.* | 2,363,914 | ||||||
| 63,135 | Editas Medicine, Inc.* | 1,953,397 | ||||||
| 156,821 | Eiger BioPharmaceuticals, Inc.* | 1,392,570 | ||||||
| 101,471 | Emergent BioSolutions, Inc.* | 9,129,346 | ||||||
| 45,926 | Enanta Pharmaceuticals, Inc.* | 2,003,751 | ||||||
| 93,604 | Fate Therapeutics, Inc.* | 4,156,018 | ||||||
| 86,886 | FibroGen, Inc.* | 3,334,685 | ||||||
| 69,479 | G1 Therapeutics, Inc.* | 763,574 | ||||||
|
| |||||||
| Common Stocks – (continued) | ||||||||
| Biotechnology – (continued) | ||||||||
| 98,747 | Halozyme Therapeutics, Inc.* | 2,764,916 | ||||||
| 19,247 | Harpoon Therapeutics, Inc.* | 278,504 | ||||||
| 3,096 | IGM Biosciences, Inc.* | 163,438 | ||||||
| 93,451 | Immunovant, Inc.* | 4,076,333 | ||||||
| 108,258 | Insmed, Inc.* | 3,566,019 | ||||||
| 108,438 | Intellia Therapeutics, Inc.*(a) | 2,596,006 | ||||||
| 56,128 | Intercept Pharmaceuticals, Inc.* | 1,559,797 | ||||||
| 76,538 | Invitae Corp.*(a) | 3,001,055 | ||||||
| 268,941 | Ironwood Pharmaceuticals, Inc.* | 2,657,137 | ||||||
| 756,664 | Kadmon Holdings, Inc.* | 2,572,658 | ||||||
| 2,096 | Karuna Therapeutics, Inc.* | 170,174 | ||||||
| 120,286 | Karyopharm Therapeutics, Inc.* | 1,782,639 | ||||||
| 9,166 | Kiniksa Pharmaceuticals Ltd., Class A* | 143,540 | ||||||
| 24,320 | Krystal Biotech, Inc.* | 1,045,517 | ||||||
| 165,357 | Kura Oncology, Inc.* | 5,167,406 | ||||||
| 36,536 | MacroGenics, Inc.* | 709,164 | ||||||
| 41,468 | Mersana Therapeutics, Inc.* | 747,253 | ||||||
| 357,699 | Minerva Neurosciences, Inc.* | 1,148,214 | ||||||
| 56,237 | Mirati Therapeutics, Inc.* | 12,211,302 | ||||||
| 121,838 | Mustang Bio, Inc.* | 324,698 | ||||||
| 79,539 | Myriad Genetics, Inc.* | 988,670 | ||||||
| 146,034 | Natera, Inc.* | 9,822,247 | ||||||
| 20,844 | Novavax, Inc.* | 1,682,319 | ||||||
| 803,455 | OPKO Health, Inc.*(a) | 2,828,162 | ||||||
| 226,195 | Pieris Pharmaceuticals, Inc.* | 567,749 | ||||||
| 27,487 | Precision BioSciences, Inc.* | 173,443 | ||||||
| 46,480 | Protagonist Therapeutics, Inc.* | 880,796 | ||||||
| 67,401 | Prothena Corp. PLC (Ireland)* | 735,345 | ||||||
| 81,246 | Puma Biotechnology, Inc.* | 680,029 | ||||||
| 65,534 | REGENXBIO, Inc.* | 1,884,758 | ||||||
| 61,583 | REVOLUTION Medicines, Inc.* | 1,859,191 | ||||||
| 256,524 | Sangamo Therapeutics, Inc.* | 2,652,458 | ||||||
| 12,922 | Scholar Rock Holding Corp.* | 502,666 | ||||||
| 306,938 | Sorrento Therapeutics, Inc.*(a) | 2,130,150 | ||||||
| 27,993 | SpringWorks Therapeutics, Inc.* | 1,623,314 | ||||||
| 10,783 | Stoke Therapeutics, Inc.* | 413,959 | ||||||
| 100,277 | TG Therapeutics, Inc.* | 2,534,000 | ||||||
| 40,411 | Turning Point Therapeutics, Inc.* | 3,725,490 | ||||||
| 90,888 | Twist Bioscience Corp.* | 6,965,656 | ||||||
| 67,358 | Ultragenyx Pharmaceutical, Inc.* | 6,769,479 | ||||||
| 127,509 | Veracyte, Inc.* | 4,419,462 | ||||||
| 138,040 | Vericel Corp.* | 2,557,881 | ||||||
| 18,536 | Viela Bio, Inc.* | 591,484 | ||||||
| 239,185 | Viking Therapeutics, Inc.*(a) | 1,346,612 | ||||||
| 47,410 | Vir Biotechnology, Inc.* | 1,490,570 | ||||||
| 12,153 | Voyager Therapeutics, Inc.* | 129,186 | ||||||
| 220,596 | Xencor, Inc.* | 8,466,474 | ||||||
| 88,613 | Y-mAbs Therapeutics, Inc.* | 3,787,320 | ||||||
|
| |||||||
| 185,210,718 | ||||||||
|
| |||||||
| Building Products – 2.3% | ||||||||
| 39,675 | Builders FirstSource, Inc.* | 1,202,152 | ||||||
| 47,565 | Masonite International Corp.* | 4,185,720 | ||||||
| 105,744 | Simpson Manufacturing Co., Inc. | 9,381,608 | ||||||
| 148,242 | UFP Industries, Inc. | 7,398,758 | ||||||
|
| |||||||
| 22,168,238 | ||||||||
|
| |||||||
| The accompanying notes are an integral part of these financial statements. | 39 |
GOLDMAN SACHS SMALL CAP GROWTH INSIGHTS FUND
Schedule of Investments (continued)
October 31, 2020
| Shares | Description | Value | ||||||
| Common Stocks – (continued) | ||||||||
| Capital Markets – 1.5% | ||||||||
| 30,615 | Artisan Partners Asset Management, Inc., Class A | $ | 1,226,437 | |||||
| 16,228 | Cohen & Steers, Inc. | 913,798 | ||||||
| 61,245 | Cowen, Inc., Class A | 1,314,318 | ||||||
| 86,592 | Federated Hermes, Inc. | 2,069,549 | ||||||
| 20,947 | Hamilton Lane, Inc., Class A | 1,460,006 | ||||||
| 105,411 | PJT Partners, Inc., Class A | 7,132,108 | ||||||
| 2,562 | Virtus Investment Partners, Inc. | 408,767 | ||||||
|
| |||||||
| 14,524,983 | ||||||||
|
| |||||||
| Chemicals – 2.2% | ||||||||
| 64,681 | Balchem Corp. | 6,464,866 | ||||||
| 3,014 | Chase Corp. | 286,812 | ||||||
| 361,546 | Ferro Corp.* | 4,649,482 | ||||||
| 102,255 | Ingevity Corp.* | 5,611,754 | ||||||
| 55,542 | Koppers Holdings, Inc.* | 1,245,807 | ||||||
| 44,856 | Kraton Corp.* | 1,269,425 | ||||||
| 31,087 | Minerals Technologies, Inc. | 1,700,148 | ||||||
|
| |||||||
| 21,228,294 | ||||||||
|
| |||||||
| Commercial Services & Supplies – 1.1% | ||||||||
| 94,452 | HNI Corp. | 3,074,413 | ||||||
| 89,449 | McGrath RentCorp | 5,105,749 | ||||||
| 19,096 | Steelcase, Inc., Class A | 199,362 | ||||||
| 13,517 | UniFirst Corp. | 2,214,220 | ||||||
|
| |||||||
| 10,593,744 | ||||||||
|
| |||||||
| Communications Equipment – 0.7% | ||||||||
| 56,203 | Calix, Inc.* | 1,315,712 | ||||||
| 41,257 | Harmonic, Inc.* | 245,067 | ||||||
| 94,117 | NETGEAR, Inc.* | 2,900,686 | ||||||
| 195,981 | Viavi Solutions, Inc.* | 2,420,365 | ||||||
|
| |||||||
| 6,881,830 | ||||||||
|
| |||||||
| Construction & Engineering – 0.2% | ||||||||
| 25,294 | EMCOR Group, Inc. | 1,724,798 | ||||||
| 37,009 | Primoris Services Corp. | 698,360 | ||||||
|
| |||||||
| 2,423,158 | ||||||||
|
| |||||||
| Construction Materials – 0.4% | ||||||||
| 19,759 | Forterra, Inc.* | 257,855 | ||||||
| 209,684 | Summit Materials, Inc., Class A* | 3,709,310 | ||||||
|
| |||||||
| 3,967,165 | ||||||||
|
| |||||||
| Consumer Finance – 0.7% | ||||||||
| 153,975 | Enova International, Inc.* | 2,363,516 | ||||||
| 87,182 | FirstCash, Inc. | 4,536,952 | ||||||
|
| |||||||
| 6,900,468 | ||||||||
|
| |||||||
| Containers & Packaging – 0.1% | ||||||||
| 42,853 | Myers Industries, Inc. | 614,512 | ||||||
| 84,552 | O-I Glass, Inc. | 797,325 | ||||||
|
| |||||||
| 1,411,837 | ||||||||
|
| |||||||
| Diversified Consumer Services – 0.8% | ||||||||
| 64,663 | Collectors Universe, Inc. | 3,551,938 | ||||||
|
| |||||||
| Common Stocks – (continued) | ||||||||
| Diversified Consumer Services – (continued) | ||||||||
| 8,956 | K12, Inc.* | 213,780 | ||||||
| 305,389 | Perdoceo Education Corp.* | 3,447,842 | ||||||
| 12,948 | Strategic Education, Inc. | 1,075,461 | ||||||
|
| |||||||
| 8,289,021 | ||||||||
|
| |||||||
| Diversified Telecommunication Services – 1.9% | ||||||||
| 15,468 | Bandwidth, Inc., Class A* | 2,480,371 | ||||||
| 118,308 | Cogent Communications Holdings, Inc. | 6,601,586 | ||||||
| 168,029 | Iridium Communications, Inc.* | 4,437,646 | ||||||
| 51,361 | Ooma, Inc.* | 724,704 | ||||||
| 538,564 | ORBCOMM, Inc.* | 2,315,825 | ||||||
| 233,369 | Vonage Holdings Corp.* | 2,469,044 | ||||||
|
| |||||||
| 19,029,176 | ||||||||
|
| |||||||
| Electrical Equipment – 1.5% | ||||||||
| 138,773 | Atkore International Group, Inc.* | 2,871,213 | ||||||
| 9,683 | Encore Wire Corp. | 447,452 | ||||||
| 97,790 | Sunrun, Inc.* | 5,087,036 | ||||||
| 84,872 | Vicor Corp.* | 6,620,016 | ||||||
|
| |||||||
| 15,025,717 | ||||||||
|
| |||||||
| Electronic Equipment, Instruments & Components – 3.2% | ||||||||
| 39,648 | Belden, Inc. | 1,224,330 | ||||||
| 60,199 | Fabrinet (Thailand)* | 3,613,144 | ||||||
| 208,916 | Knowles Corp.* | 2,977,053 | ||||||
| 80,142 | Novanta, Inc.* | 8,713,038 | ||||||
| 35,609 | Plexus Corp.* | 2,476,250 | ||||||
| 2,830 | Rogers Corp.* | 343,053 | ||||||
| 447,276 | TTM Technologies, Inc.* | 5,309,166 | ||||||
| 267,437 | Vishay Intertechnology, Inc. | 4,337,828 | ||||||
| 88,995 | Vishay Precision Group, Inc.* | 2,126,091 | ||||||
|
| |||||||
| 31,119,953 | ||||||||
|
| |||||||
| Energy Equipment & Services – 0.4% | ||||||||
| 19,077 | Cactus, Inc., Class A | 324,309 | ||||||
| 82,277 | Matrix Service Co.* | 625,305 | ||||||
| 93,213 | SEACOR Holdings, Inc.* | 2,855,114 | ||||||
|
| |||||||
| 3,804,728 | ||||||||
|
| |||||||
| Entertainment – 0.6% | ||||||||
| 822,645 | Glu Mobile, Inc.* | 5,890,138 | ||||||
|
| |||||||
| Equity Real Estate Investment Trusts (REITs) – 4.4% | ||||||||
| 115,588 | American Assets Trust, Inc. REIT | 2,419,257 | ||||||
| 248,269 | CareTrust REIT, Inc. REIT | 4,245,400 | ||||||
| 20,329 | City Office REIT, Inc. REIT | 128,479 | ||||||
| 60,973 | Community Healthcare Trust, Inc. REIT | 2,823,050 | ||||||
| 35,845 | EastGroup Properties, Inc. REIT | 4,770,252 | ||||||
| 146,245 | Four Corners Property Trust, Inc. REIT | 3,705,848 | ||||||
| 228,583 | National Storage Affiliates Trust REIT | 7,746,678 | ||||||
| 151,134 | NexPoint Residential Trust, Inc. REIT | 6,698,259 | ||||||
| 114,829 | PotlatchDeltic Corp. REIT | 4,771,145 | ||||||
| 279,927 | Sabra Health Care REIT, Inc. REIT | 3,683,839 | ||||||
| 40,270 | Terreno Realty Corp. REIT | 2,266,396 | ||||||
|
| |||||||
| 43,258,603 | ||||||||
|
| |||||||
| 40 | The accompanying notes are an integral part of these financial statements. |
GOLDMAN SACHS SMALL CAP GROWTH INSIGHTS FUND
| Shares | Description | Value | ||||||
| Common Stocks – (continued) | ||||||||
| Food & Staples Retailing – 1.2% | ||||||||
| 278,859 | BJ’s Wholesale Club Holdings, Inc.* | $ | 10,677,511 | |||||
| 21,160 | Ingles Markets, Inc., Class A | 758,798 | ||||||
| 18,018 | Natural Grocers by Vitamin Cottage, Inc. | 191,711 | ||||||
|
| |||||||
| 11,628,020 | ||||||||
|
| |||||||
| Food Products – 0.5% | ||||||||
| 3,415 | Freshpet, Inc.* | 391,017 | ||||||
| 50,452 | John B. Sanfilippo & Son, Inc. | 3,670,888 | ||||||
| 3,607 | Lancaster Colony Corp. | 599,267 | ||||||
| 10,441 | Seneca Foods Corp., Class A* | 384,751 | ||||||
|
| |||||||
| 5,045,923 | ||||||||
|
| |||||||
| Gas Utilities – 0.1% | ||||||||
| 16,704 | Northwest Natural Holding Co. | 742,326 | ||||||
|
| |||||||
| Health Care Equipment & Supplies – 5.2% | ||||||||
| 367,715 | Antares Pharma, Inc.* | 1,003,862 | ||||||
| 18,824 | Axonics Modulation Technologies, Inc.* | 882,657 | ||||||
| 30,658 | Cantel Medical Corp. | 1,466,679 | ||||||
| 45,207 | CONMED Corp. | 3,524,790 | ||||||
| 101,027 | CytoSorbents Corp.* | 772,856 | ||||||
| 275,527 | GenMark Diagnostics, Inc.* | 3,366,940 | ||||||
| 65,459 | Inogen, Inc.* | 1,912,057 | ||||||
| 111,808 | Integer Holdings Corp.* | 6,535,178 | ||||||
| 15,196 | iRhythm Technologies, Inc.* | 3,213,194 | ||||||
| 99,342 | Meridian Bioscience, Inc.* | 1,703,715 | ||||||
| 66,429 | Merit Medical Systems, Inc.* | 3,324,771 | ||||||
| 233,899 | Natus Medical, Inc.* | 4,259,301 | ||||||
| 128,647 | Neogen Corp.* | 8,971,842 | ||||||
| 42,749 | Shockwave Medical, Inc.* | 2,920,612 | ||||||
| 39,760 | STAAR Surgical Co.* | 2,882,600 | ||||||
| 95,300 | Surmodics, Inc.* | 3,502,275 | ||||||
| 9,724 | Utah Medical Products, Inc. | 807,092 | ||||||
|
| |||||||
| 51,050,421 | ||||||||
|
| |||||||
| Health Care Providers & Services – 3.0% | ||||||||
| 25,070 | Addus HomeCare Corp.* | 2,446,080 | ||||||
| 15,755 | BioTelemetry, Inc.* | 670,848 | ||||||
| 76,525 | Castle Biosciences, Inc.* | 3,553,056 | ||||||
| 12,383 | Hanger, Inc.* | 216,331 | ||||||
| 11,030 | HealthEquity, Inc.* | 567,935 | ||||||
| 32,912 | LHC Group, Inc.* | 7,127,093 | ||||||
| 1,800 | National HealthCare Corp. | 113,940 | ||||||
| 16,350 | National Research Corp. | 846,930 | ||||||
| 34,297 | Option Care Health, Inc.* | 457,179 | ||||||
| 367,751 | Select Medical Holdings Corp.* | 7,715,416 | ||||||
| 198,015 | Tenet Healthcare Corp.* | 4,859,288 | ||||||
| 8,378 | US Physical Therapy, Inc. | 664,627 | ||||||
|
| |||||||
| 29,238,723 | ||||||||
|
| |||||||
| Health Care Technology – 0.9% | ||||||||
| 130,944 | Inovalon Holdings, Inc., Class A* | 2,486,627 | ||||||
| 125,230 | NextGen Healthcare, Inc.* | 1,703,128 | ||||||
| 8,668 | Phreesia, Inc.* | 320,456 | ||||||
| 26,059 | Schrodinger, Inc.* | 1,271,158 | ||||||
|
| |||||||
| Common Stocks – (continued) | ||||||||
| Health Care Technology – (continued) | ||||||||
| 51,022 | Simulations Plus, Inc. | 3,307,246 | ||||||
|
| |||||||
| 9,088,615 | ||||||||
|
| |||||||
| Hotels, Restaurants & Leisure – 4.3% | ||||||||
| 106,554 | Bloomin’ Brands, Inc. | 1,489,625 | ||||||
| 78,536 | Caesars Entertainment, Inc.* | 3,519,983 | ||||||
| 6,893 | Churchill Downs, Inc. | 1,028,091 | ||||||
| 24,489 | Dine Brands Global, Inc. | 1,259,959 | ||||||
| 57,243 | El Pollo Loco Holdings, Inc.* | 808,271 | ||||||
| 21,141 | Everi Holdings, Inc.* | 182,024 | ||||||
| 43,320 | Fiesta Restaurant Group, Inc.* | 374,285 | ||||||
| 76,233 | Papa John’s International, Inc. | 5,839,448 | ||||||
| 92,124 | Penn National Gaming, Inc.* | 4,972,854 | ||||||
| 301,641 | Red Rock Resorts, Inc., Class A | 5,767,376 | ||||||
| 115,037 | Texas Roadhouse, Inc. | 8,056,041 | ||||||
| 75,746 | Wingstop, Inc. | 8,811,532 | ||||||
|
| |||||||
| 42,109,489 | ||||||||
|
| |||||||
| Household Durables – 1.3% | ||||||||
| 28,889 | KB Home | 931,670 | ||||||
| 2,213 | LGI Homes, Inc.* | 236,525 | ||||||
| 57,856 | M/I Homes, Inc.* | 2,367,468 | ||||||
| 33,244 | Meritage Homes Corp.* | 2,895,220 | ||||||
| 106,451 | Sonos, Inc.* | 1,554,185 | ||||||
| 2,572 | TopBuild Corp.* | 394,056 | ||||||
| 190,997 | TRI Pointe Group, Inc.* | 3,138,081 | ||||||
| 37,134 | Universal Electronics, Inc.* | 1,376,186 | ||||||
|
| |||||||
| 12,893,391 | ||||||||
|
| |||||||
| Household Products – 0.1% | ||||||||
| 10,856 | Central Garden & Pet Co., Class A* | 384,194 | ||||||
| 3,200 | WD-40 Co. | 778,816 | ||||||
|
| |||||||
| 1,163,010 | ||||||||
|
| |||||||
| Insurance – 2.0% | ||||||||
| 106,287 | American Equity Investment Life Holding Co. | 2,638,043 | ||||||
| 36,190 | Goosehead Insurance, Inc., Class A | 4,434,723 | ||||||
| 3,481 | James River Group Holdings Ltd. | 162,667 | ||||||
| 36,595 | Kinsale Capital Group, Inc. | 6,860,465 | ||||||
| 24,224 | Stewart Information Services Corp. | 1,026,855 | ||||||
| 69,947 | Trupanion, Inc.* | 5,004,008 | ||||||
|
| |||||||
| 20,126,761 | ||||||||
|
| |||||||
| Interactive Media & Services – 0.7% | ||||||||
| 151,887 | Cargurus, Inc.* | 3,027,108 | ||||||
| 197,850 | Cars.com, Inc.* | 1,462,111 | ||||||
| 52,448 | EverQuote, Inc., Class A* | 1,756,484 | ||||||
| 34,943 | QuinStreet, Inc.* | 559,263 | ||||||
|
| |||||||
| 6,804,966 | ||||||||
|
| |||||||
| Internet & Direct Marketing Retail – 0.8% | ||||||||
| 33,685 | Stamps.com, Inc.* | 7,519,839 | ||||||
|
| |||||||
| IT Services – 1.9% | ||||||||
| 162,085 | Brightcove, Inc.* | 2,050,375 | ||||||
| 16,993 | Hackett Group, Inc. (The) | 219,550 | ||||||
|
| |||||||
| The accompanying notes are an integral part of these financial statements. | 41 |
GOLDMAN SACHS SMALL CAP GROWTH INSIGHTS FUND
Schedule of Investments (continued)
October 31, 2020
| Shares | Description | Value | ||||||
| Common Stocks – (continued) | ||||||||
| IT Services – (continued) | ||||||||
| 27,492 | I3 Verticals, Inc., Class A* | $ | 567,160 | |||||
| 83,599 | Limelight Networks, Inc.* | 295,105 | ||||||
| 13,916 | LiveRamp Holdings, Inc.* | 919,708 | ||||||
| 155,540 | Perficient, Inc.* | 6,090,946 | ||||||
| 220,455 | Perspecta, Inc. | 3,952,758 | ||||||
| 116,340 | Sykes Enterprises, Inc.* | 3,983,482 | ||||||
| 16,645 | TTEC Holdings, Inc. | 911,813 | ||||||
|
| |||||||
| 18,990,897 | ||||||||
|
| |||||||
| Leisure Products – 1.3% | ||||||||
| 99,011 | Sturm Ruger & Co., Inc. | 6,619,875 | ||||||
| 27,013 | Vista Outdoor, Inc.* | 534,047 | ||||||
| 106,189 | YETI Holdings, Inc.* | 5,254,232 | ||||||
|
| |||||||
| 12,408,154 | ||||||||
|
| |||||||
| Life Sciences Tools & Services – 0.2% | ||||||||
| 12,332 | Medpace Holdings, Inc.* | 1,368,112 | ||||||
| 9,419 | NanoString Technologies, Inc.* | 345,206 | ||||||
| 38,388 | Pacific Biosciences of California, Inc.* | 503,267 | ||||||
|
| |||||||
| 2,216,585 | ||||||||
|
| |||||||
| Machinery – 2.8% | ||||||||
| 34,416 | Albany International Corp., Class A | 1,753,151 | ||||||
| 52,743 | Columbus McKinnon Corp. | 1,787,460 | ||||||
| 100,395 | Federal Signal Corp. | 2,879,329 | ||||||
| 129,884 | Franklin Electric Co., Inc. | 7,757,971 | ||||||
| 63,359 | Mueller Industries, Inc. | 1,832,976 | ||||||
| 48,232 | RBC Bearings, Inc.* | 5,742,020 | ||||||
| 165,912 | Rexnord Corp. | 5,322,457 | ||||||
|
| |||||||
| 27,075,364 | ||||||||
|
| |||||||
| Media – 0.8% | ||||||||
| 11,277 | Cardlytics, Inc.* | 832,468 | ||||||
| 37,544 | Gray Television, Inc.* | 476,058 | ||||||
| 14,045 | Loral Space & Communications, Inc. | 244,524 | ||||||
| 149,780 | TechTarget, Inc.* | 6,560,364 | ||||||
|
| |||||||
| 8,113,414 | ||||||||
|
| |||||||
| Mortgage Real Estate Investment Trusts (REITs) – 0.2% | ||||||||
| 111,793 | PennyMac Mortgage Investment Trust REIT | 1,673,541 | ||||||
|
| |||||||
| Multiline Retail – 0.6% | ||||||||
| 118,658 | Big Lots, Inc. | 5,648,121 | ||||||
|
| |||||||
| Multi-Utilities – 0.3% | ||||||||
| 65,856 | �� | NorthWestern Corp. | 3,433,073 | |||||
|
| |||||||
| Oil, Gas & Consumable Fuels – 0.4% | ||||||||
| 146,904 | Ardmore Shipping Corp. (Ireland) | 411,331 | ||||||
| 262,482 | DHT Holdings, Inc. | 1,262,539 | ||||||
| 66,894 | Green Plains, Inc.* | 1,010,099 | ||||||
| 14,244 | Scorpio Tankers, Inc. (Monaco) | 125,632 | ||||||
| 64,182 | World Fuel Services Corp. | 1,351,031 | ||||||
|
| |||||||
| 4,160,632 | ||||||||
|
| |||||||
| Paper & Forest Products – 1.5% | ||||||||
| 138,960 | Boise Cascade Co. | 5,333,285 | ||||||
|
| |||||||
| Common Stocks – (continued) | ||||||||
| Paper & Forest Products – (continued) | ||||||||
| 321,877 | Louisiana-Pacific Corp. | 9,199,244 | ||||||
|
| |||||||
| 14,532,529 | ||||||||
|
| |||||||
| Personal Products – 0.3% | ||||||||
| 16,784 | Lifevantage Corp.* | 185,463 | ||||||
| 9,515 | Medifast, Inc. | 1,336,762 | ||||||
| 22,864 | USANA Health Sciences, Inc.* | 1,729,662 | ||||||
|
| |||||||
| 3,251,887 | ||||||||
|
| |||||||
| Pharmaceuticals – 3.6% | ||||||||
| 113,778 | Amneal Pharmaceuticals, Inc.* | 473,316 | ||||||
| 225,664 | Amphastar Pharmaceuticals, Inc.* | 4,420,758 | ||||||
| 92,204 | ANI Pharmaceuticals, Inc.* | 2,350,280 | ||||||
| 44,624 | Axsome Therapeutics, Inc.* | 2,959,017 | ||||||
| 471,004 | BioDelivery Sciences International, Inc.* | 1,488,373 | ||||||
| 166,686 | Corcept Therapeutics, Inc.* | 2,796,991 | ||||||
| 421,223 | Innoviva, Inc.* | 4,553,421 | ||||||
| 25,127 | MyoKardia, Inc.* | 5,616,638 | ||||||
| 53,624 | Pacira BioSciences, Inc.* | 2,804,535 | ||||||
| 153,256 | Phibro Animal Health Corp., Class A | 2,519,529 | ||||||
| 169,832 | Prestige Consumer Healthcare, Inc.* | 5,609,551 | ||||||
|
| |||||||
| 35,592,409 | ||||||||
|
| |||||||
| Professional Services – 0.8% | ||||||||
| 2,227 | ASGN, Inc.* | 148,497 | ||||||
| 46,997 | Exponent, Inc. | 3,270,521 | ||||||
| 35,324 | Huron Consulting Group, Inc.* | 1,337,367 | ||||||
| 11,935 | Insperity, Inc. | 913,982 | ||||||
| 61,273 | Kforce, Inc. | 2,126,173 | ||||||
|
| |||||||
| 7,796,540 | ||||||||
|
| |||||||
| Real Estate Management & Development – 0.6% | ||||||||
| 143,440 | Redfin Corp.* | 5,991,489 | ||||||
|
| |||||||
| Road & Rail – 1.7% | ||||||||
| 352,005 | Marten Transport Ltd. | 5,401,517 | ||||||
| 23,641 | Saia, Inc.* | 3,490,830 | ||||||
| 5,999 | Universal Logistics Holdings, Inc. | 118,360 | ||||||
| 198,592 | Werner Enterprises, Inc. | 7,550,468 | ||||||
|
| |||||||
| 16,561,175 | ||||||||
|
| |||||||
| Semiconductors & Semiconductor Equipment – 3.7% | ||||||||
| 75,460 | Ambarella, Inc.* | 4,125,398 | ||||||
| 77,765 | Amkor Technology, Inc.* | 921,515 | ||||||
| 210,276 | Axcelis Technologies, Inc.* | 4,640,791 | ||||||
| 17,869 | CEVA, Inc.* | 720,478 | ||||||
| 7,219 | Cohu, Inc. | 156,869 | ||||||
| 75,640 | FormFactor, Inc.* | 2,144,394 | ||||||
| 111,536 | Lattice Semiconductor Corp.* | 3,892,606 | ||||||
| 123,889 | MACOM Technology Solutions Holdings, Inc.* | 4,521,949 | ||||||
| 41,116 | MaxLinear, Inc.* | 1,087,107 | ||||||
| 370,908 | NeoPhotonics Corp.* | 2,525,884 | ||||||
| 146,422 | Power Integrations, Inc. | 8,816,069 | ||||||
| 4,767 | SiTime Corp.* | 397,997 | ||||||
| 24,937 | SunPower Corp.*(a) | 398,743 | ||||||
|
| |||||||
| 42 | The accompanying notes are an integral part of these financial statements. |
GOLDMAN SACHS SMALL CAP GROWTH INSIGHTS FUND
| Shares | Description | Value | ||||||
| Common Stocks – (continued) | ||||||||
| Semiconductors & Semiconductor Equipment – (continued) | ||||||||
| 2,212 | Synaptics, Inc.* | $ | 169,594 | |||||
| 70,212 | Ultra Clean Holdings, Inc.* | 1,494,813 | ||||||
|
| |||||||
| 36,014,207 | ||||||||
|
| |||||||
| Software – 7.9% | ||||||||
| 100,834 | ACI Worldwide, Inc.* | 2,941,328 | ||||||
| 41,575 | Avaya Holdings Corp.* | 715,090 | ||||||
| 59,006 | Blackline, Inc.* | 5,763,706 | ||||||
| 490,852 | Box, Inc., Class A* | 7,608,206 | ||||||
| 214,762 | ChannelAdvisor Corp.* | 3,479,145 | ||||||
| 601,398 | Cloudera, Inc.* | 5,845,589 | ||||||
| 123,655 | Domo, Inc., Class B* | 3,928,519 | ||||||
| 54,741 | J2 Global, Inc.* | 3,715,819 | ||||||
| 19,656 | MicroStrategy, Inc., Class A* | 3,283,928 | ||||||
| 58,062 | Model N, Inc.* | 2,045,524 | ||||||
| 71,210 | Sailpoint Technologies Holdings, Inc.* | 2,955,927 | ||||||
| 56,076 | SPS Commerce, Inc.* | 4,799,545 | ||||||
| 368,270 | SVMK, Inc.* | 7,707,891 | ||||||
| 114,388 | Telenav, Inc.* | 465,559 | ||||||
| 148,274 | Tenable Holdings, Inc.* | 5,057,626 | ||||||
| 25,092 | Upland Software, Inc.* | 1,046,838 | ||||||
| 69,290 | Varonis Systems, Inc.* | 8,007,845 | ||||||
| 70,727 | Verint Systems, Inc.* | 3,431,674 | ||||||
| 18,438 | Workiva, Inc.* | 1,019,806 | ||||||
| 368,222 | Zuora, Inc., Class A* | 3,542,296 | ||||||
|
| |||||||
| 77,361,861 | ||||||||
|
| |||||||
| Specialty Retail – 2.8% | ||||||||
| 329,815 | Abercrombie & Fitch Co., Class A | 4,689,970 | ||||||
| 12,007 | At Home Group, Inc.* | 195,594 | ||||||
| 143,248 | Camping World Holdings, Inc., Class A | 3,787,477 | ||||||
| 4,389 | Hibbett Sports, Inc.* | 165,948 | ||||||
| 20,166 | Lithia Motors, Inc., Class A | 4,629,509 | ||||||
| 52,486 | MarineMax, Inc.* | 1,573,530 | ||||||
| 37,189 | Rent-A-Center, Inc. | 1,149,140 | ||||||
| 17,174 | RH* | 5,757,240 | ||||||
| 419,161 | Sportsman’s Warehouse Holdings, Inc.* | 5,457,476 | ||||||
|
| |||||||
| 27,405,884 | ||||||||
|
| |||||||
| Textiles, Apparel & Luxury Goods – 0.8% | ||||||||
| 22,931 | Crocs, Inc.* | 1,199,979 | ||||||
| 27,643 | Deckers Outdoor Corp.* | 7,003,907 | ||||||
|
| |||||||
| 8,203,886 | ||||||||
|
| |||||||
| Thrifts & Mortgage Finance – 0.3% | ||||||||
| 57,745 | PennyMac Financial Services, Inc. | 2,934,601 | ||||||
|
| |||||||
| Tobacco – 0.2% | ||||||||
| 178,216 | Vector Group Ltd. | 1,637,805 | ||||||
|
| |||||||
| Trading Companies & Distributors – 1.4% | ||||||||
| 165,915 | Foundation Building Materials, Inc.* | 2,415,722 | ||||||
| 94,491 | H&E Equipment Services, Inc. | 1,988,091 | ||||||
| 275,311 | MRC Global, Inc.* | 1,172,825 | ||||||
|
| |||||||
| Common Stocks – (continued) | ||||||||
| Trading Companies & Distributors – (continued) | ||||||||
| 60,261 | Rush Enterprises, Inc., Class A | 2,159,754 | ||||||
| 48,439 | SiteOne Landscape Supply, Inc.* | 5,787,976 | ||||||
|
| |||||||
| 13,524,368 | ||||||||
|
| |||||||
| | TOTAL INVESTMENTS BEFORE SECURITIES LENDING REINVESTMENT VEHICLE | | ||||||
| (Cost $937,772,448) | $ | 977,743,742 | ||||||
|
| |||||||
| Shares | Dividend Rate | Value | ||||||
| Securities Lending Reinvestment Vehicle – 1.1%(b) | ||||||||
| | Goldman Sachs Financial Square Government Fund – | | ||||||
| 11,156,338 | 0.028% | $ | 11,156,338 | |||||
| (Cost $11,156,338) | ||||||||
|
| |||||||
| TOTAL INVESTMENTS – 100.7% | ||||||||
| (Cost $948,928,786) | $ | 988,900,080 | ||||||
|
| |||||||
| | LIABILITIES IN EXCESS OF OTHER ASSETS – (0.7)% | (7,303,921 | ) | |||||
|
| |||||||
| NET ASSETS – 100.0% | $ | 981,596,159 | ||||||
|
| |||||||
| The percentage shown for each investment category reflects the value of investments in that category as a percentage of net assets. | ||
* | Non-income producing security. | |
(a) | All or a portion of security is on loan. | |
(b) | Represents an affiliated issuer. | |
| ||
Investment Abbreviations: | ||
PLC | —Public Limited Company | |
REIT | —Real Estate Investment Trust | |
| ||
| The accompanying notes are an integral part of these financial statements. | 43 |
GOLDMAN SACHS SMALL CAP VALUE INSIGHTS FUND
Schedule of Investments
October 31, 2020
| Shares | Description | Value | ||||||
| Common Stocks – 98.3% | ||||||||
| Aerospace & Defense – 0.4% | ||||||||
| 5,095 | AAR Corp. | $ | 99,148 | |||||
| 86,440 | Astronics Corp.* | 553,216 | ||||||
| 30,070 | Maxar Technologies, Inc. | 774,904 | ||||||
| 32,428 | Moog, Inc., Class A | 2,023,183 | ||||||
|
| |||||||
| 3,450,451 | ||||||||
|
| |||||||
| Air Freight & Logistics – 0.9% | ||||||||
| 93,775 | Echo Global Logistics, Inc.* | 2,529,112 | ||||||
| 78,095 | Hub Group, Inc., Class A* | 3,914,902 | ||||||
| 34,604 | Radiant Logistics, Inc.* | 177,865 | ||||||
|
| |||||||
| 6,621,879 | ||||||||
|
| |||||||
| Airlines – 0.3% | ||||||||
| 89,284 | SkyWest, Inc. | 2,591,915 | ||||||
|
| |||||||
| Auto Components – 2.1% | ||||||||
| 323,769 | American Axle & Manufacturing Holdings, Inc.* | 2,175,728 | ||||||
| 37,313 | Cooper Tire & Rubber Co. | 1,283,194 | ||||||
| 445,882 | Goodyear Tire & Rubber Co. (The) | 3,691,903 | ||||||
| 18,952 | Patrick Industries, Inc. | 1,056,574 | ||||||
| 101,566 | Standard Motor Products, Inc. | 4,651,723 | ||||||
| 35,641 | Visteon Corp.* | 3,195,215 | ||||||
|
| |||||||
| 16,054,337 | ||||||||
|
| |||||||
| Banks – 14.2% | ||||||||
| 82,127 | 1st Source Corp. | 2,750,433 | ||||||
| 93,716 | Amalgamated Bank, Class A | 1,040,248 | ||||||
| 11,049 | Ameris Bancorp | 323,736 | ||||||
| 89,633 | Atlantic Capital Bancshares, Inc.* | 1,244,106 | ||||||
| 8,376 | Atlantic Union Bankshares Corp. | 211,829 | ||||||
| 283,915 | Bancorp, Inc. (The)* | 2,725,584 | ||||||
| 32,138 | Bank of Marin Bancorp | 968,639 | ||||||
| 15,300 | Banner Corp. | 564,111 | ||||||
| 9,857 | BayCom Corp.* | 109,413 | ||||||
| 387,572 | Boston Private Financial Holdings, Inc. | 2,395,195 | ||||||
| 15,644 | Bridge Bancorp, Inc. | 305,684 | ||||||
| 449,550 | Cadence BanCorp | 5,043,951 | ||||||
| 25,543 | Capital City Bank Group, Inc. | 544,321 | ||||||
| 239,191 | Cathay General Bancorp | 5,628,164 | ||||||
| 160,206 | Central Pacific Financial Corp. | 2,206,037 | ||||||
| 8,791 | Civista Bancshares, Inc. | 125,360 | ||||||
| 11,755 | Columbia Banking System, Inc. | 333,960 | ||||||
| 342,237 | CVB Financial Corp. | 5,989,147 | ||||||
| 19,936 | Eagle Bancorp, Inc. | 596,485 | ||||||
| 7,396 | Equity Bancshares, Inc., Class A* | 135,938 | ||||||
| 27,578 | Financial Institutions, Inc. | 488,958 | ||||||
| 585,452 | First BanCorp. (Puerto Rico) | 3,799,583 | ||||||
| 19,042 | First Bancshares, Inc. (The) | 453,961 | ||||||
| 90,484 | First BankCorp | 2,179,760 | ||||||
| 385,623 | First Commonwealth Financial Corp. | 3,324,070 | ||||||
| 203,322 | First Foundation, Inc. | 3,023,398 | ||||||
| 25,551 | First Internet Bancorp | 549,858 | ||||||
| 4,352 | First Mid Bancshares, Inc. | 120,812 | ||||||
| 13,140 | Flushing Financial Corp. | 168,061 | ||||||
| 14,837 | Fulton Financial Corp. | 163,059 | ||||||
| 137,251 | Glacier Bancorp, Inc. | 4,913,586 | ||||||
| 26,652 | Hancock Whitney Corp. | 609,531 | ||||||
|
| |||||||
| Common Stocks – (continued) | ||||||||
| Banks – (continued) | ||||||||
| 224,398 | Hanmi Financial Corp. | 2,017,338 | ||||||
| 22,100 | HBT Financial, Inc. | 272,714 | ||||||
| 110,178 | Heartland Financial USA, Inc. | 3,629,263 | ||||||
| 261,520 | Hilltop Holdings, Inc. | 5,965,271 | ||||||
| 55,405 | Home BancShares, Inc. | 919,723 | ||||||
| 537,110 | Hope Bancorp, Inc. | 4,334,478 | ||||||
| 48,468 | Independent Bank Corp. | 725,566 | ||||||
| 186,055 | International Bancshares Corp. | 5,150,002 | ||||||
| 215,533 | Investors Bancorp, Inc. | 1,823,409 | ||||||
| 94,856 | Lakeland Bancorp, Inc. | 1,055,747 | ||||||
| 14,805 | Mercantile Bank Corp. | 323,637 | ||||||
| 14,616 | Metropolitan Bank Holding Corp.* | 437,749 | ||||||
| 5,297 | MidWestOne Financial Group, Inc. | 106,735 | ||||||
| 135,789 | National Bank Holdings Corp., Class A | 4,094,038 | ||||||
| 12,115 | Northeast Bank | 232,487 | ||||||
| 49,023 | Old Second Bancorp, Inc. | 419,147 | ||||||
| 61,063 | Preferred Bank | 2,065,761 | ||||||
| 14,140 | QCR Holdings, Inc. | 438,764 | ||||||
| 7,938 | Republic Bancorp, Inc., Class A | 264,574 | ||||||
| 51,531 | Sierra Bancorp | 1,022,375 | ||||||
| 232,152 | Simmons First National Corp., Class A | 3,944,262 | ||||||
| 4,912 | Southside Bancshares, Inc. | 132,428 | ||||||
| 153,637 | TriCo Bancshares | 4,444,718 | ||||||
| 159,770 | TriState Capital Holdings, Inc.* | 2,011,504 | ||||||
| 156,271 | Trustmark Corp. | 3,655,179 | ||||||
| 20,479 | UMB Financial Corp. | 1,246,557 | ||||||
| 45,887 | United Bankshares, Inc. | 1,203,616 | ||||||
| 28,128 | Washington Trust Bancorp, Inc. | 949,883 | ||||||
| 62,998 | Westamerica BanCorp | 3,299,205 | ||||||
|
| |||||||
| 109,223,108 | ||||||||
|
| |||||||
| Biotechnology – 2.8% | ||||||||
| 38,075 | Akebia Therapeutics, Inc.* | 84,526 | ||||||
| 19,988 | Arena Pharmaceuticals, Inc.* | 1,713,371 | ||||||
| 59,535 | Atara Biotherapeutics, Inc.* | 768,597 | ||||||
| 81,913 | Catalyst Pharmaceuticals, Inc.* | 243,282 | ||||||
| 15,906 | Emergent BioSolutions, Inc.* | 1,431,063 | ||||||
| 13,932 | Enanta Pharmaceuticals, Inc.* | 607,853 | ||||||
| 36,506 | G1 Therapeutics, Inc.* | 401,201 | ||||||
| 9,664 | Immunovant, Inc.* | 421,544 | ||||||
| 8,423 | Kura Oncology, Inc.* | 263,219 | ||||||
| 12,796 | MacroGenics, Inc.* | 248,370 | ||||||
| 55,620 | Minerva Neurosciences, Inc.* | 178,540 | ||||||
| 1,652 | Mirati Therapeutics, Inc.* | 358,715 | ||||||
| 175,185 | Myriad Genetics, Inc.* | 2,177,550 | ||||||
| 16,068 | Natera, Inc.* | 1,080,734 | ||||||
| 31,010 | Novavax, Inc.* | 2,502,817 | ||||||
| 800,785 | OPKO Health, Inc.*(a) | 2,818,763 | ||||||
| 52,887 | Prothena Corp. PLC (Ireland)* | 576,997 | ||||||
| 12,273 | Sangamo Therapeutics, Inc.* | 126,903 | ||||||
| 14,704 | Twist Bioscience Corp.* | 1,126,915 | ||||||
| 11,782 | Vericel Corp.* | 218,320 | ||||||
| 107,111 | Xencor, Inc.* | 4,110,920 | ||||||
|
| |||||||
| 21,460,200 | ||||||||
|
| |||||||
| Building Products – 1.2% | ||||||||
| 61,472 | Apogee Enterprises, Inc. | 1,468,566 | ||||||
| 5,739 | Griffon Corp. | 123,044 | ||||||
|
| |||||||
| 44 | The accompanying notes are an integral part of these financial statements. |
GOLDMAN SACHS SMALL CAP VALUE INSIGHTS FUND
| Shares | Description | Value | ||||||
| Common Stocks – (continued) | ||||||||
| Building Products – (continued) | ||||||||
| 42,605 | JELD-WEN Holding, Inc.* | $ | 895,983 | |||||
| 148,329 | Quanex Building Products Corp. | 2,699,588 | ||||||
| 6,269 | Simpson Manufacturing Co., Inc. | 556,186 | ||||||
| 77,470 | UFP Industries, Inc. | 3,866,528 | ||||||
|
| |||||||
| 9,609,895 | ||||||||
|
| |||||||
| Capital Markets – 2.3% | ||||||||
| 24,999 | Artisan Partners Asset Management, Inc., Class A | 1,001,460 | ||||||
| 9,303 | Cohen & Steers, Inc. | 523,852 | ||||||
| 127,035 | Cowen, Inc., Class A | 2,726,171 | ||||||
| 159,235 | Donnelley Financial Solutions, Inc.* | 2,011,138 | ||||||
| 197,957 | Federated Hermes, Inc. | 4,731,172 | ||||||
| 73,417 | Oppenheimer Holdings, Inc., Class A | 1,839,830 | ||||||
| 2,183 | Piper Sandler Cos. | 182,171 | ||||||
| 29,658 | PJT Partners, Inc., Class A | 2,006,660 | ||||||
| 16,866 | Stifel Financial Corp. | 985,987 | ||||||
| 9,587 | Virtus Investment Partners, Inc. | 1,529,606 | ||||||
|
| |||||||
| 17,538,047 | ||||||||
|
| |||||||
| Chemicals – 2.5% | ||||||||
| 41,939 | Avient Corp. | 1,303,045 | ||||||
| 25,167 | Balchem Corp. | 2,515,442 | ||||||
| 194,974 | Ferro Corp.* | 2,507,366 | ||||||
| 28,003 | Ingevity Corp.* | 1,536,805 | ||||||
| 93,606 | Koppers Holdings, Inc.* | 2,099,582 | ||||||
| 91,371 | Kraton Corp.* | 2,585,799 | ||||||
| 18,545 | Kronos Worldwide, Inc. | 247,019 | ||||||
| 75,811 | Minerals Technologies, Inc. | 4,146,104 | ||||||
| 146,524 | Orion Engineered Carbons SA (Germany) | 2,149,507 | ||||||
| 31,990 | Tronox Holdings PLC, Class A | 312,542 | ||||||
|
| |||||||
| 19,403,211 | ||||||||
|
| |||||||
| Commercial Services & Supplies – 2.7% | ||||||||
| 100,733 | BrightView Holdings, Inc.* | 1,231,965 | ||||||
| 19,024 | Ennis, Inc. | 289,926 | ||||||
| 83,810 | HNI Corp. | 2,728,015 | ||||||
| 336,570 | KAR Auction Services, Inc. | 4,900,459 | ||||||
| 54,582 | Kimball International, Inc., Class B | 562,195 | ||||||
| 82,880 | Matthews International Corp., Class A | 1,809,270 | ||||||
| 71,682 | McGrath RentCorp | 4,091,608 | ||||||
| 163,788 | Steelcase, Inc., Class A | 1,709,947 | ||||||
| 109,544 | Team, Inc.* | 587,156 | ||||||
| 18,443 | UniFirst Corp. | 3,021,148 | ||||||
|
| |||||||
| 20,931,689 | ||||||||
|
| |||||||
| Communications Equipment – 0.8% | ||||||||
| 233,922 | Harmonic, Inc.* | 1,389,497 | ||||||
| 150,269 | NETGEAR, Inc.* | 4,631,290 | ||||||
|
| |||||||
| 6,020,787 | ||||||||
|
| |||||||
| Construction & Engineering – 1.5% | ||||||||
| 42,364 | Aegion Corp.* | 597,756 | ||||||
| 2,117 | Argan, Inc. | 87,199 | ||||||
| 68,347 | EMCOR Group, Inc. | 4,660,582 | ||||||
| 122,956 | Great Lakes Dredge & Dock Corp.* | 1,270,136 | ||||||
|
| |||||||
| Common Stocks – (continued) | ||||||||
| Construction & Engineering – (continued) | ||||||||
| 158,514 | Primoris Services Corp. | 2,991,159 | ||||||
| 126,042 | Tutor Perini Corp.* | 1,702,827 | ||||||
|
| |||||||
| 11,309,659 | ||||||||
|
| |||||||
| Construction Materials – 0.8% | ||||||||
| 334,168 | Summit Materials, Inc., Class A* | 5,911,432 | ||||||
|
| |||||||
| Consumer Finance – 1.4% | ||||||||
| 31,523 | Curo Group Holdings Corp. | 236,107 | ||||||
| 52,431 | Encore Capital Group, Inc.* | 1,674,122 | ||||||
| 113,453 | Enova International, Inc.* | 1,741,504 | ||||||
| 16,302 | FirstCash, Inc. | 848,356 | ||||||
| 618,690 | Navient Corp. | 4,955,707 | ||||||
| 18,614 | Oportun Financial Corp.* | 247,566 | ||||||
| 11,702 | PRA Group, Inc.* | 399,389 | ||||||
| 26,885 | Regional Management Corp.* | 546,303 | ||||||
|
| |||||||
| 10,649,054 | ||||||||
|
| |||||||
| Containers & Packaging – 0.3% | ||||||||
| 201,348 | O-I Glass, Inc. | 1,898,712 | ||||||
| 6,460 | UFP Technologies, Inc.* | 239,407 | ||||||
|
| |||||||
| 2,138,119 | ||||||||
|
| |||||||
| Diversified Consumer Services – 0.9% | ||||||||
| 58,001 | American Public Education, Inc.* | 1,639,688 | ||||||
| 11,460 | Carriage Services, Inc. | 295,783 | ||||||
| 53,239 | Collectors Universe, Inc. | 2,924,418 | ||||||
| 49,569 | K12, Inc.* | 1,183,212 | ||||||
| 88,461 | Perdoceo Education Corp.* | 998,725 | ||||||
|
| |||||||
| 7,041,826 | ||||||||
|
| |||||||
| Diversified Financial Services – 0.3% | ||||||||
| 166,444 | Banco Latinoamericano de Comercio Exterior SA, Class E (Panama) | 2,128,819 | ||||||
|
| |||||||
| Diversified Telecommunication Services – 0.8% | ||||||||
| 193,861 | Consolidated Communications Holdings, Inc.* | 905,331 | ||||||
| 70,626 | Iridium Communications, Inc.* | 1,865,233 | ||||||
| 465,254 | ORBCOMM, Inc.* | 2,000,592 | ||||||
| 105,359 | Vonage Holdings Corp.* | 1,114,698 | ||||||
|
| |||||||
| 5,885,854 | ||||||||
|
| |||||||
| Electric Utilities – 0.6% | ||||||||
| 114,931 | Portland General Electric Co. | 4,516,788 | ||||||
|
| |||||||
| Electrical Equipment – 0.6% | ||||||||
| 14,555 | Atkore International Group, Inc.* | 301,143 | ||||||
| 66,403 | Encore Wire Corp. | 3,068,483 | ||||||
| 43,235 | Powell Industries, Inc. | 1,021,643 | ||||||
|
| |||||||
| 4,391,269 | ||||||||
|
| |||||||
| Electronic Equipment, Instruments & Components – 3.0% | ||||||||
| 122,706 | Belden, Inc. | 3,789,161 | ||||||
| 77,700 | Benchmark Electronics, Inc. | 1,618,491 | ||||||
| 24,904 | CTS Corp. | 688,347 | ||||||
| 321,920 | Knowles Corp.* | 4,587,360 | ||||||
| 1,741 | Rogers Corp.* | 211,044 | ||||||
| 437,795 | TTM Technologies, Inc.* | 5,196,627 | ||||||
|
| |||||||
| The accompanying notes are an integral part of these financial statements. | 45 |
GOLDMAN SACHS SMALL CAP VALUE INSIGHTS FUND
Schedule of Investments (continued)
October 31, 2020
| Shares | Description | Value | ||||||
| Common Stocks – (continued) | ||||||||
| Electronic Equipment, Instruments & Components – (continued) | ||||||||
| 342,604 | Vishay Intertechnology, Inc. | $ | 5,557,037 | |||||
| 44,179 | Vishay Precision Group, Inc.* | 1,055,436 | ||||||
|
| |||||||
| 22,703,503 | ||||||||
|
| |||||||
| Energy Equipment & Services – 1.0% | ||||||||
| 95,940 | Cactus, Inc., Class A | 1,630,980 | ||||||
| 166,479 | ChampionX Corp.* | 1,453,362 | ||||||
| 90,954 | Matrix Service Co.* | 691,250 | ||||||
| 214,555 | Oil States International, Inc.* | 534,242 | ||||||
| 237,416 | Patterson-UTI Energy, Inc. | 607,785 | ||||||
| 57,211 | SEACOR Holdings, Inc.* | 1,752,373 | ||||||
| 97,014 | Solaris Oilfield Infrastructure, Inc., Class A | 575,293 | ||||||
| 78,812 | US Silica Holdings, Inc. | 214,369 | ||||||
|
| |||||||
| 7,459,654 | ||||||||
|
| |||||||
| Entertainment – 0.2% | ||||||||
| 42,754 | Gaia, Inc.* | 433,526 | ||||||
| 140,194 | Glu Mobile, Inc.* | 1,003,789 | ||||||
|
| |||||||
| 1,437,315 | ||||||||
|
| |||||||
| Equity Real Estate Investment Trusts (REITs) – 9.2% | ||||||||
| 157,053 | American Assets Trust, Inc. REIT | 3,287,119 | ||||||
| 12,452 | Armada Hoffler Properties, Inc. REIT | 112,193 | ||||||
| 289,419 | CareTrust REIT, Inc. REIT | 4,949,065 | ||||||
| 324,981 | City Office REIT, Inc. REIT | 2,053,880 | ||||||
| 47,853 | Community Healthcare Trust, Inc. REIT | 2,215,594 | ||||||
| 20,420 | EastGroup Properties, Inc. REIT | 2,717,494 | ||||||
| 6,723 | Essential Properties Realty Trust, Inc. REIT | 111,064 | ||||||
| 101,827 | Four Corners Property Trust, Inc. REIT | 2,580,296 | ||||||
| 57,884 | Franklin Street Properties Corp. REIT | 243,113 | ||||||
| 119,030 | Gladstone Commercial Corp. REIT | 1,934,237 | ||||||
| 16,847 | Gladstone Land Corp. REIT | 233,668 | ||||||
| 282,245 | Independence Realty Trust, Inc. REIT | 3,429,277 | ||||||
| 170,464 | Industrial Logistics Properties Trust REIT | 3,269,500 | ||||||
| 63,892 | Kite Realty Group Trust REIT | 661,921 | ||||||
| 468,511 | Lexington Realty Trust REIT | 4,652,314 | ||||||
| 112,925 | National Storage Affiliates Trust REIT | 3,827,028 | ||||||
| 66,175 | New Senior Investment Group, Inc. REIT | 258,744 | ||||||
| 126,132 | NexPoint Residential Trust, Inc. REIT | 5,590,170 | ||||||
| 12,942 | Office Properties Income Trust REIT | 238,262 | ||||||
| 333,789 | Physicians Realty Trust REIT | 5,627,683 | ||||||
| 147,712 | PotlatchDeltic Corp. REIT | 6,137,434 | ||||||
| 301,988 | Retail Opportunity Investments Corp. REIT | 2,938,343 | ||||||
| 187,006 | Retail Properties of America, Inc., Class A REIT | 979,911 | ||||||
| 127,470 | Retail Value, Inc. REIT | 1,593,375 | ||||||
| 164,732 | RPT Realty REIT | 805,539 | ||||||
| 447,851 | Sabra Health Care REIT, Inc. REIT | 5,893,719 | ||||||
| 19,625 | Terreno Realty Corp. REIT | 1,104,495 | ||||||
| 23,512 | Universal Health Realty Income Trust REIT | 1,257,187 | ||||||
|
| |||||||
| Common Stocks – (continued) | ||||||||
| Equity Real Estate Investment Trusts (REITs) – (continued) | ||||||||
| 147,412 | Urban Edge Properties REIT | 1,385,673 | ||||||
| 85,183 | Whitestone REIT | 507,691 | ||||||
|
| |||||||
| 70,595,989 | ||||||||
|
| |||||||
| Food & Staples Retailing – 1.6% | ||||||||
| 35,047 | Andersons, Inc. (The) | 760,170 | ||||||
| 88,604 | BJ’s Wholesale Club Holdings, Inc.* | 3,392,647 | ||||||
| 105,941 | Ingles Markets, Inc., Class A | 3,799,044 | ||||||
| 47,638 | Natural Grocers by Vitamin Cottage, Inc. | 506,868 | ||||||
| 64,202 | SpartanNash Co. | 1,181,959 | ||||||
| 50,692 | Weis Markets, Inc. | 2,301,924 | ||||||
|
| |||||||
| 11,942,612 | ||||||||
|
| |||||||
| Food Products – 1.1% | ||||||||
| 134,480 | Darling Ingredients, Inc.* | 5,782,640 | ||||||
| 50,053 | Fresh Del Monte Produce, Inc. | 1,077,641 | ||||||
| 4,991 | John B. Sanfilippo & Son, Inc. | 363,145 | ||||||
| 28,073 | Seneca Foods Corp., Class A* | 1,034,490 | ||||||
|
| |||||||
| 8,257,916 | ||||||||
|
| |||||||
| Gas Utilities – 1.2% | ||||||||
| 58,352 | Northwest Natural Holding Co. | 2,593,163 | ||||||
| 26,862 | Southwest Gas Holdings, Inc. | 1,765,371 | ||||||
| 85,202 | Spire, Inc. | 4,774,720 | ||||||
|
| |||||||
| 9,133,254 | ||||||||
|
| |||||||
| Health Care Equipment & Supplies – 1.2% | ||||||||
| 15,378 | Inogen, Inc.* | 449,192 | ||||||
| 74,822 | Integer Holdings Corp.* | 4,373,346 | ||||||
| 18,285 | Invacare Corp. | 148,291 | ||||||
| 130,363 | Natus Medical, Inc.* | 2,373,910 | ||||||
| 27,119 | Neogen Corp.* | 1,891,279 | ||||||
| 3,405 | Utah Medical Products, Inc. | 282,615 | ||||||
|
| |||||||
| 9,518,633 | ||||||||
|
| |||||||
| Health Care Providers & Services – 1.3% | ||||||||
| 44,728 | Covetrus, Inc.* | 1,104,334 | ||||||
| 29,698 | Hanger, Inc.* | 518,824 | ||||||
| 19,194 | National HealthCare Corp. | 1,214,980 | ||||||
| 3,742 | Owens & Minor, Inc. | 93,999 | ||||||
| 127,018 | Select Medical Holdings Corp.* | 2,664,838 | ||||||
| 192,622 | Tenet Healthcare Corp.* | 4,726,944 | ||||||
|
| |||||||
| 10,323,919 | ||||||||
|
| |||||||
| Health Care Technology – 0.1% | ||||||||
| 14,899 | Computer Programs and Systems, Inc. | 415,533 | ||||||
| 42,288 | NextGen Healthcare, Inc.* | 575,117 | ||||||
|
| |||||||
| 990,650 | ||||||||
|
| |||||||
| Hotels, Restaurants & Leisure – 3.2% | ||||||||
| 30,503 | Bloomin’ Brands, Inc. | 426,432 | ||||||
| 23,732 | Caesars Entertainment, Inc.* | 1,063,668 | ||||||
| 33,859 | Carrols Restaurant Group, Inc.* | 198,075 | ||||||
| 29,506 | Chuy’s Holdings, Inc.* | 619,331 | ||||||
| 92,764 | Del Taco Restaurants, Inc.* | 687,845 | ||||||
| 37,872 | Denny’s Corp.* | 339,333 | ||||||
| 54,864 | Dine Brands Global, Inc. | 2,822,753 | ||||||
| 69,374 | El Pollo Loco Holdings, Inc.* | 979,561 | ||||||
|
| |||||||
| 46 | The accompanying notes are an integral part of these financial statements. |
GOLDMAN SACHS SMALL CAP VALUE INSIGHTS FUND
| Shares | Description | Value | ||||||
| Common Stocks – (continued) | ||||||||
| Hotels, Restaurants & Leisure – (continued) | ||||||||
| 60,354 | Everi Holdings, Inc.* | $ | 519,648 | |||||
| 100,686 | Fiesta Restaurant Group, Inc.* | 869,927 | ||||||
| 168,519 | International Game Technology PLC | 1,383,541 | ||||||
| 24,145 | Jack in the Box, Inc. | 1,933,049 | ||||||
| 24,913 | Papa John’s International, Inc. | 1,908,336 | ||||||
| 60,306 | Penn National Gaming, Inc.* | 3,255,318 | ||||||
| 214,838 | Red Rock Resorts, Inc., Class A | 4,107,702 | ||||||
| 32,602 | Wingstop, Inc. | 3,792,591 | ||||||
|
| |||||||
| 24,907,110 | ||||||||
|
| |||||||
| Household Durables – 2.2% | ||||||||
| 16,513 | Century Communities, Inc.* | 641,365 | ||||||
| 42,750 | KB Home | 1,378,687 | ||||||
| 87,571 | M/I Homes, Inc.* | 3,583,405 | ||||||
| 12,132 | MDC Holdings, Inc. | 527,985 | ||||||
| 30,693 | Meritage Homes Corp.* | 2,673,053 | ||||||
| 64,303 | Taylor Morrison Home Corp.* | 1,388,945 | ||||||
| 327,621 | TRI Pointe Group, Inc.* | 5,382,813 | ||||||
| 33,894 | Universal Electronics, Inc.* | 1,256,112 | ||||||
|
| |||||||
| 16,832,365 | ||||||||
|
| |||||||
| Household Products – 0.2% | ||||||||
| 35,575 | Central Garden & Pet Co., Class A* | 1,258,999 | ||||||
|
| |||||||
| Independent Power and Renewable Electricity Producers – 0.1% | ||||||||
| 266,741 | Atlantic Power Corp.* | 530,815 | ||||||
|
| |||||||
| Insurance – 3.5% | ||||||||
| 177,363 | American Equity Investment Life Holding Co. | 4,402,150 | ||||||
| 21,950 | AMERISAFE, Inc. | 1,294,611 | ||||||
| 79,252 | Argo Group International Holdings Ltd. | 2,827,711 | ||||||
| 14,231 | Enstar Group Ltd.* | 2,445,882 | ||||||
| 697,156 | Genworth Financial, Inc., Class A* | 2,739,823 | ||||||
| 24,769 | Goosehead Insurance, Inc., Class A | 3,035,193 | ||||||
| 27,091 | HCI Group, Inc. | 1,272,735 | ||||||
| 1,728 | Investors Title Co. | 230,722 | ||||||
| 7,001 | National Western Life Group, Inc., Class A | 1,187,580 | ||||||
| 7,993 | State Auto Financial Corp. | 98,634 | ||||||
| 120,284 | Stewart Information Services Corp. | 5,098,839 | ||||||
| 19,833 | Trupanion, Inc.* | 1,418,853 | ||||||
| 51,070 | Universal Insurance Holdings, Inc. | 636,843 | ||||||
|
| |||||||
| 26,689,576 | ||||||||
|
| |||||||
| Interactive Media & Services – 0.3% | ||||||||
| 16,209 | Cargurus, Inc.* | 323,045 | ||||||
| 212,408 | Cars.com, Inc.* | 1,569,695 | ||||||
| 2,614 | EverQuote, Inc., Class A* | 87,543 | ||||||
| 17,029 | QuinStreet, Inc.* | 272,549 | ||||||
|
| |||||||
| 2,252,832 | ||||||||
|
| |||||||
| Internet & Direct Marketing Retail – 0.2% | ||||||||
| 5,518 | Stamps.com, Inc.* | 1,231,838 | ||||||
|
| |||||||
| IT Services – 1.1% | ||||||||
| 24,700 | Brightcove, Inc.* | 312,455 | ||||||
| 446,523 | Conduent, Inc.* | 1,556,133 | ||||||
| 60,361 | Hackett Group, Inc. (The) | 779,864 | ||||||
|
| |||||||
| Common Stocks – (continued) | ||||||||
| IT Services – (continued) | ||||||||
| 116,303 | Perspecta, Inc. | 2,085,313 | ||||||
| 103,819 | Sykes Enterprises, Inc.* | 3,554,762 | ||||||
|
| |||||||
| 8,288,527 | ||||||||
|
| |||||||
| Leisure Products – 0.8% | ||||||||
| 52,119 | Nautilus, Inc.* | 1,130,461 | ||||||
| 61,565 | Smith & Wesson Brands, Inc. | 1,021,363 | ||||||
| 38,859 | Sturm Ruger & Co., Inc. | 2,598,113 | ||||||
| 89,365 | Vista Outdoor, Inc.* | 1,766,746 | ||||||
|
| |||||||
| 6,516,683 | ||||||||
|
| |||||||
| Machinery – 2.9% | ||||||||
| 5,969 | Albany International Corp., Class A | 304,061 | ||||||
| 65,549 | Barnes Group, Inc. | 2,405,648 | ||||||
| 36,094 | Columbus McKinnon Corp. | 1,223,226 | ||||||
| 52,591 | Federal Signal Corp. | 1,508,310 | ||||||
| 64,221 | Franklin Electric Co., Inc. | 3,835,920 | ||||||
| 63,543 | Miller Industries, Inc. | 1,902,477 | ||||||
| 44,378 | Mueller Industries, Inc. | 1,283,856 | ||||||
| 35,674 | Navistar International Corp.* | 1,537,906 | ||||||
| 9,573 | RBC Bearings, Inc.* | 1,139,666 | ||||||
| 217,405 | Rexnord Corp. | 6,974,352 | ||||||
|
| |||||||
| 22,115,422 | ||||||||
|
| |||||||
| Marine – 0.1% | ||||||||
| 173,279 | Costamare, Inc. (Monaco) | 985,957 | ||||||
|
| |||||||
| Media – 1.0% | ||||||||
| 12,957 | EW Scripps Co. (The), Class A | 117,649 | ||||||
| 217,426 | Gray Television, Inc.* | 2,756,962 | ||||||
| 17,308 | Loral Space & Communications, Inc. | 301,332 | ||||||
| 149,738 | MSG Networks, Inc., Class A* | 1,338,658 | ||||||
| 110,474 | National CineMedia, Inc. | 219,291 | ||||||
| 25,390 | Scholastic Corp. | 501,706 | ||||||
| 41,486 | TechTarget, Inc.* | 1,817,087 | ||||||
| 124,726 | WideOpenWest, Inc.* | 622,383 | ||||||
|
| |||||||
| 7,675,068 | ||||||||
|
| |||||||
| Metals & Mining – 2.6% | ||||||||
| 483,832 | Alcoa Corp.* | 6,251,110 | ||||||
| 119,434 | Allegheny Technologies, Inc.* | 1,099,987 | ||||||
| 7,986 | Carpenter Technology Corp. | 139,595 | ||||||
| 13,062 | Century Aluminum Co.* | 85,948 | ||||||
| 207,018 | Coeur Mining, Inc.* | 1,463,617 | ||||||
| 128,539 | Commercial Metals Co. | 2,654,330 | ||||||
| 65,505 | Haynes International, Inc. | 1,061,836 | ||||||
| 659,349 | Hecla Mining Co. | 3,019,819 | ||||||
| 22,441 | Kaiser Aluminum Corp. | 1,412,212 | ||||||
| 26,846 | Ryerson Holding Corp.* | 211,278 | ||||||
| 34,214 | TimkenSteel Corp.* | 132,408 | ||||||
| 45,899 | Worthington Industries, Inc. | 2,258,690 | ||||||
|
| |||||||
| 19,790,830 | ||||||||
|
| |||||||
| Mortgage Real Estate Investment Trusts (REITs) – 2.2% | ||||||||
| 663,048 | Anworth Mortgage Asset Corp. REIT | 1,087,399 | ||||||
| 90,881 | Arlington Asset Investment Corp., Class A REIT | 223,567 | ||||||
| 180,159 | ARMOUR Residential REIT, Inc. REIT | 1,718,717 | ||||||
| 429,520 | Capstead Mortgage Corp. REIT | 2,194,847 | ||||||
|
| |||||||
| The accompanying notes are an integral part of these financial statements. | 47 |
GOLDMAN SACHS SMALL CAP VALUE INSIGHTS FUND
Schedule of Investments (continued)
October 31, 2020
| Shares | Description | Value | ||||||
| Common Stocks – (continued) | ||||||||
| Mortgage Real Estate Investment Trusts (REITs) – (continued) | ||||||||
| 11,742 | Cherry Hill Mortgage Investment Corp. REIT | $ | 107,557 | |||||
| 261,378 | Chimera Investment Corp. REIT | 2,182,506 | ||||||
| 86,152 | Great Ajax Corp. REIT | 661,647 | ||||||
| 377,132 | Ladder Capital Corp. REIT | 2,828,490 | ||||||
| 333,738 | PennyMac Mortgage Investment Trust REIT | 4,996,058 | ||||||
| 133,295 | TPG RE Finance Trust, Inc. REIT | 1,042,367 | ||||||
|
| |||||||
| 17,043,155 | ||||||||
|
| |||||||
| Multiline Retail – 0.7% | ||||||||
| 114,025 | Big Lots, Inc. | 5,427,590 | ||||||
|
| |||||||
| Multi-Utilities – 0.9% | ||||||||
| 17,377 | Black Hills Corp. | 984,581 | ||||||
| 121,021 | NorthWestern Corp. | 6,308,825 | ||||||
|
| |||||||
| 7,293,406 | ||||||||
|
| |||||||
| Oil, Gas & Consumable Fuels – 2.2% | ||||||||
| 266,972 | Ardmore Shipping Corp. (Ireland) | 747,522 | ||||||
| 93,904 | Brigham Minerals, Inc., Class A | 828,233 | ||||||
| 237,074 | Clean Energy Fuels Corp.* | 587,944 | ||||||
| 405,528 | DHT Holdings, Inc. | 1,950,590 | ||||||
| 78,060 | Diamond S Shipping, Inc.* | 441,820 | ||||||
| 98,552 | Dorian LPG Ltd.* | 808,126 | ||||||
| 25,266 | Frontline Ltd. (Norway)(a) | 136,689 | ||||||
| 17,588 | Golar LNG Ltd. (Cameroon)* | 132,789 | ||||||
| 172,942 | Green Plains, Inc.* | 2,611,424 | ||||||
| 57,937 | International Seaways, Inc. | 784,467 | ||||||
| 214,086 | Magnolia Oil & Gas Corp., Class A* | 929,133 | ||||||
| 10,456 | Ovintiv, Inc. | 96,195 | ||||||
| 18,757 | Renewable Energy Group, Inc.* | 1,057,895 | ||||||
| 188,317 | Scorpio Tankers, Inc. (Monaco) | 1,660,956 | ||||||
| 154,280 | SM Energy Co. | 248,391 | ||||||
| 169,641 | World Fuel Services Corp. | 3,570,943 | ||||||
|
| |||||||
| 16,593,117 | ||||||||
|
| |||||||
| Paper & Forest Products – 1.7% | ||||||||
| 125,391 | Boise Cascade Co. | 4,812,507 | ||||||
| 29,662 | Clearwater Paper Corp.* | 1,101,943 | ||||||
| 148,079 | Glatfelter Corp. | 2,113,087 | ||||||
| 158,190 | Louisiana-Pacific Corp. | 4,521,070 | ||||||
| 24,466 | Neenah, Inc. | 920,656 | ||||||
|
| |||||||
| 13,469,263 | ||||||||
|
| |||||||
| Pharmaceuticals – 1.1% | ||||||||
| 23,737 | Amneal Pharmaceuticals, Inc.* | 98,746 | ||||||
| 61,134 | ANI Pharmaceuticals, Inc.* | 1,558,305 | ||||||
| 77,661 | BioDelivery Sciences International, Inc.* | 245,409 | ||||||
| 57,233 | Endo International PLC* | 261,555 | ||||||
| 43,247 | Innoviva, Inc.* | 467,500 | ||||||
| 46,213 | Phibro Animal Health Corp., Class A | 759,742 | ||||||
| 143,314 | Prestige Consumer Healthcare, Inc.* | 4,733,661 | ||||||
|
| |||||||
| 8,124,918 | ||||||||
|
| |||||||
| Professional Services – 0.3% | ||||||||
| 12,985 | Franklin Covey Co.* | 219,706 | ||||||
|
| |||||||
| Common Stocks – (continued) | ||||||||
| Professional Services – (continued) | ||||||||
| 50,773 | Huron Consulting Group, Inc.* | 1,922,266 | ||||||
|
| |||||||
| 2,141,972 | ||||||||
|
| |||||||
| Real Estate Management & Development – 0.2% | ||||||||
| 5,845 | Forestar Group, Inc.* | 97,261 | ||||||
| 3,089 | FRP Holdings, Inc.* | 124,981 | ||||||
| 35,372 | Redfin Corp.* | 1,477,488 | ||||||
|
| |||||||
| 1,699,730 | ||||||||
|
| |||||||
| Road & Rail – 1.1% | ||||||||
| 10,940 | Heartland Express, Inc. | 200,312 | ||||||
| 279,513 | Marten Transport Ltd. | 4,289,127 | ||||||
| 10,714 | Universal Logistics Holdings, Inc. | 211,387 | ||||||
| 102,505 | Werner Enterprises, Inc. | 3,897,240 | ||||||
|
| |||||||
| 8,598,066 | ||||||||
|
| |||||||
| Semiconductors & Semiconductor Equipment – 0.8% | ||||||||
| 34,290 | Ambarella, Inc.* | 1,874,634 | ||||||
| 23,348 | Amkor Technology, Inc.* | 276,674 | ||||||
| 97,067 | Axcelis Technologies, Inc.* | 2,142,269 | ||||||
| 236,340 | NeoPhotonics Corp.* | 1,609,475 | ||||||
| 8,717 | Photronics, Inc.* | 84,991 | ||||||
| 38,062 | Rambus, Inc.* | 524,875 | ||||||
|
| |||||||
| 6,512,918 | ||||||||
|
| |||||||
| Software – 1.0% | ||||||||
| 228,361 | Box, Inc., Class A* | 3,539,595 | ||||||
| 112,479 | ChannelAdvisor Corp.* | 1,822,160 | ||||||
| 265,739 | Cloudera, Inc.* | 2,582,983 | ||||||
|
| |||||||
| 7,944,738 | ||||||||
|
| |||||||
| Specialty Retail – 4.6% | ||||||||
| 317,701 | Abercrombie & Fitch Co., Class A | 4,517,708 | ||||||
| 9,521 | Asbury Automotive Group, Inc.* | 980,473 | ||||||
| 126,839 | At Home Group, Inc.* | 2,066,207 | ||||||
| 164,610 | Bed Bath & Beyond, Inc. | 3,259,278 | ||||||
| 26,756 | Buckle, Inc. (The) | 641,074 | ||||||
| 87,304 | Caleres, Inc. | 670,495 | ||||||
| 86,074 | Camping World Holdings, Inc., Class A | 2,275,797 | ||||||
| 33,853 | Conn’s, Inc.* | 317,203 | ||||||
| 1,314 | Group 1 Automotive, Inc. | 139,389 | ||||||
| 84,262 | Haverty Furniture Cos., Inc. | 2,108,235 | ||||||
| 40,239 | Hibbett Sports, Inc.* | 1,521,437 | ||||||
| 22,914 | Lithia Motors, Inc., Class A | 5,260,367 | ||||||
| 18,954 | Lumber Liquidators Holdings, Inc.* | 419,262 | ||||||
| 109,171 | MarineMax, Inc.* | 3,272,947 | ||||||
| 19,050 | Rent-A-Center, Inc. | 588,645 | ||||||
| 7,062 | Sleep Number Corp.* | 447,448 | ||||||
| 36,840 | Sonic Automotive, Inc., Class A | 1,328,450 | ||||||
| 281,214 | Sportsman’s Warehouse Holdings, Inc.* | 3,661,406 | ||||||
| 69,661 | Zumiez, Inc.* | 1,950,508 | ||||||
|
| |||||||
| 35,426,329 | ||||||||
|
| |||||||
| Textiles, Apparel & Luxury Goods – 0.5% | ||||||||
| 4,217 | Crocs, Inc.* | 220,675 | ||||||
| 170,727 | G-III Apparel Group Ltd.* | 2,301,400 | ||||||
|
| |||||||
| 48 | The accompanying notes are an integral part of these financial statements. |
GOLDMAN SACHS SMALL CAP VALUE INSIGHTS FUND
| Shares | Description | Value | ||||||
| Common Stocks – (continued) | ||||||||
| Textiles, Apparel & Luxury Goods – (continued) | ||||||||
| 7,910 | Movado Group, Inc. | $ | 86,298 | |||||
| 59,552 | Wolverine World Wide, Inc. | 1,588,252 | ||||||
|
| |||||||
| 4,196,625 | ||||||||
|
| |||||||
| Thrifts & Mortgage Finance – 2.2% | ||||||||
| 11,648 | Essent Group Ltd. | 464,173 | ||||||
| 41,013 | Flagstar Bancorp, Inc. | 1,203,732 | ||||||
| 14,463 | HomeStreet, Inc. | 449,365 | ||||||
| 148,622 | Meridian Bancorp, Inc. | 1,850,344 | ||||||
| 83,228 | Mr. Cooper Group, Inc.* | 1,754,446 | ||||||
| 103,933 | PennyMac Financial Services, Inc. | 5,281,875 | ||||||
| 66,258 | Radian Group, Inc. | 1,189,331 | ||||||
| 238,090 | Washington Federal, Inc. | 5,068,936 | ||||||
|
| |||||||
| 17,262,202 | ||||||||
|
| |||||||
| Tobacco – 0.3% | ||||||||
| 242,458 | Vector Group Ltd. | 2,228,189 | ||||||
|
| |||||||
| Trading Companies & Distributors – 3.0% | ||||||||
| 55,112 | Beacon Roofing Supply, Inc.* | 1,691,938 | ||||||
| 6,360 | DXP Enterprises, Inc.* | 99,470 | ||||||
| 103,567 | Foundation Building Materials, Inc.* | 1,507,936 | ||||||
| 85,253 | GMS, Inc.* | 1,926,718 | ||||||
| 206,941 | H&E Equipment Services, Inc. | 4,354,039 | ||||||
| 32,240 | Herc Holdings, Inc.* | 1,430,166 | ||||||
| 401,091 | MRC Global, Inc.* | 1,708,648 | ||||||
| 227,299 | NOW, Inc.* | 925,107 | ||||||
| 159,861 | Rush Enterprises, Inc., Class A | 5,729,418 | ||||||
| 6,351 | Titan Machinery, Inc.* | 95,201 | ||||||
| 105,436 | Triton International Ltd. (Bermuda) | 3,888,480 | ||||||
|
| |||||||
| 23,357,121 | ||||||||
|
| |||||||
| TOTAL COMMON STOCKS | ||||||||
| (Cost $782,511,746) | $ | 755,637,145 | ||||||
|
| |||||||
| Shares | Dividend Rate | Value | ||||||
| Investment Company – 0.1%(b) | ||||||||
| | Goldman Sachs Financial Square Government Fund – | | ||||||
| 699,934 | 0.028% | $ | 699,934 | |||||
| (Cost $699,934) | ||||||||
|
| |||||||
| | TOTAL INVESTMENTS BEFORE SECURITIES LENDING REINVESTMENT VEHICLE |
| ||||||
| (Cost $783,211,680) | $ | 756,337,079 | ||||||
|
| |||||||
| Securities Lending Reinvestment Vehicle – 0.4%(b) | ||||||||
| | Goldman Sachs Financial Square Government Fund – | | ||||||
| 3,369,422 | 0.028% | $ | 3,369,422 | |||||
| (Cost $3,369,422) | ||||||||
|
| |||||||
| TOTAL INVESTMENTS – 98.8% | ||||||||
| (Cost $786,581,102) | $ | 759,706,501 | ||||||
|
| |||||||
| | OTHER ASSETS IN EXCESS OF LIABILITIES – 1.2% | 9,022,132 | ||||||
|
| |||||||
| NET ASSETS – 100.0% | $ | 768,728,633 | ||||||
|
| |||||||
| The percentage shown for each investment category reflects the value of investments in that category as a percentage of net assets. | ||
* | Non-income producing security. | |
(a) | All or a portion of security is on loan. | |
(b) | Represents an affiliated issuer. | |
| ||
Investment Abbreviations: | ||
PLC | —Public Limited Company | |
REIT | —Real Estate Investment Trust | |
| ||
| ADDITIONAL INVESTMENT INFORMATION |
FUTURES CONTRACTS — At October 31, 2020, the Fund had the following futures contracts:
| Description | Number of Contracts | Expiration Date | Notional Amount | Unrealized Appreciation/ (Depreciation) | ||||||||||||
E-mini Russell 2000 Index | 140 | 12/18/20 | $ | 11,085,044 | $ | (327,444 | ) | |||||||||
| The accompanying notes are an integral part of these financial statements. | 49 |
GOLDMAN SACHS U.S. EQUITY INSIGHTS FUND
Schedule of Investments
October 31, 2020
| Shares | Description | Value | ||||||
| Common Stocks – 98.2% | ||||||||
| Aerospace & Defense – 0.4% | ||||||||
| 860 | General Dynamics Corp. | $ | 112,944 | |||||
| 40,716 | Raytheon Technologies Corp. | 2,211,693 | ||||||
| 5,554 | Teledyne Technologies, Inc.* | 1,717,019 | ||||||
|
| |||||||
| 4,041,656 | ||||||||
|
| |||||||
| Air Freight & Logistics – 2.7% | ||||||||
| 43,973 | FedEx Corp. | 11,409,674 | ||||||
| 86,818 | United Parcel Service, Inc., Class B | 13,639,976 | ||||||
| 12,961 | XPO Logistics, Inc.* | 1,166,490 | ||||||
|
| |||||||
| 26,216,140 | ||||||||
|
| |||||||
| Auto Components – 0.2% | ||||||||
| 66,993 | Gentex Corp. | 1,853,696 | ||||||
|
| |||||||
| Automobiles – 0.1% | ||||||||
| 54,651 | Ford Motor Co. | 422,452 | ||||||
| 1,736 | Tesla, Inc.* | 673,638 | ||||||
|
| |||||||
| 1,096,090 | ||||||||
|
| |||||||
| Banks – 1.9% | ||||||||
| 207,455 | Bank of America Corp. | 4,916,683 | ||||||
| 58,709 | Citigroup, Inc. | 2,431,727 | ||||||
| 8,413 | JPMorgan Chase & Co. | 824,811 | ||||||
| 11,739 | Signature Bank | 947,807 | ||||||
| 402,573 | Wells Fargo & Co. | 8,635,191 | ||||||
|
| |||||||
| 17,756,219 | ||||||||
|
| |||||||
| Beverages – 1.1% | ||||||||
| 137,833 | Monster Beverage Corp.* | 10,553,873 | ||||||
|
| |||||||
| Biotechnology – 2.8% | ||||||||
| 170,072 | AbbVie, Inc. | 14,473,127 | ||||||
| 16,347 | Biogen, Inc.* | 4,120,588 | ||||||
| 40,294 | Vertex Pharmaceuticals, Inc.* | 8,395,658 | ||||||
|
| |||||||
| 26,989,373 | ||||||||
|
| |||||||
| Building Products – 1.5% | ||||||||
| 11,458 | Lennox International, Inc. | 3,112,680 | ||||||
| 187,579 | Masco Corp. | 10,054,234 | ||||||
| 8,062 | Trane Technologies PLC | 1,070,231 | ||||||
|
| |||||||
| 14,237,145 | ||||||||
|
| |||||||
| Capital Markets – 3.9% | ||||||||
| 174,900 | Bank of New York Mellon Corp. (The) | 6,009,564 | ||||||
| 77,031 | CME Group, Inc. | 11,610,112 | ||||||
| 10,444 | MarketAxess Holdings, Inc. | 5,627,749 | ||||||
| 19,492 | Northern Trust Corp. | 1,525,639 | ||||||
| 38,228 | S&P Global, Inc. | 12,337,323 | ||||||
|
| |||||||
| 37,110,387 | ||||||||
|
| |||||||
| Chemicals – 3.2% | ||||||||
| 251,144 | Axalta Coating Systems Ltd.* | 6,306,226 | ||||||
| 22,217 | CF Industries Holdings, Inc. | 613,411 | ||||||
| 38,667 | Corteva, Inc. | 1,275,238 | ||||||
| 111,911 | Dow, Inc. | 5,090,831 | ||||||
| 24,088 | Linde PLC (United Kingdom) | 5,307,550 | ||||||
|
| |||||||
| Common Stocks – (continued) | ||||||||
| Chemicals – (continued) | ||||||||
| 3,585 | RPM International, Inc. | 303,542 | ||||||
| 17,079 | Sherwin-Williams Co. (The) | 11,750,011 | ||||||
|
| |||||||
| 30,646,809 | ||||||||
|
| |||||||
| Commercial Services & Supplies – 0.1% | ||||||||
| 1,593 | Cintas Corp. | 501,078 | ||||||
|
| |||||||
| Communications Equipment – 0.0% | ||||||||
| 682 | Arista Networks, Inc.* | 142,470 | ||||||
|
| |||||||
| Construction Materials – 0.0% | ||||||||
| 548 | Martin Marietta Materials, Inc. | 145,960 | ||||||
|
| |||||||
| Consumer Finance – 1.1% | ||||||||
| 19,017 | Capital One Financial Corp. | 1,389,763 | ||||||
| 351,809 | Synchrony Financial | 8,802,261 | ||||||
|
| |||||||
| 10,192,024 | ||||||||
|
| |||||||
| Diversified Consumer Services – 0.3% | ||||||||
| 24,904 | Chegg, Inc.* | 1,828,949 | ||||||
| 2,869 | frontdoor, Inc.* | 113,670 | ||||||
| 57,388 | H&R Block, Inc. | 990,517 | ||||||
|
| |||||||
| 2,933,136 | ||||||||
|
| |||||||
| Diversified Financial Services – 1.5% | ||||||||
| 22,133 | Berkshire Hathaway, Inc., Class B* | 4,468,653 | ||||||
| 72,083 | Jefferies Financial Group, Inc. | 1,406,339 | ||||||
| 183,819 | Voya Financial, Inc. | 8,810,445 | ||||||
|
| |||||||
| 14,685,437 | ||||||||
|
| |||||||
| Electric Utilities – 0.3% | ||||||||
| 28,049 | Entergy Corp. | 2,839,120 | ||||||
|
| |||||||
| Electrical Equipment – 0.2% | ||||||||
| 21,305 | AMETEK, Inc. | 2,092,151 | ||||||
|
| |||||||
| Energy Equipment & Services – 0.2% | ||||||||
| 112,021 | Schlumberger NV | 1,673,594 | ||||||
|
| |||||||
| Entertainment – 2.7% | ||||||||
| 34,831 | Netflix, Inc.* | 16,570,500 | ||||||
| 5,658 | Roku, Inc.* | 1,145,179 | ||||||
| 11,490 | Spotify Technology SA* | 2,756,336 | ||||||
| 25,965 | Take-Two Interactive Software, Inc.* | 4,022,498 | ||||||
| 113,088 | Zynga, Inc., Class A* | 1,016,661 | ||||||
|
| |||||||
| 25,511,174 | ||||||||
|
| |||||||
| Equity Real Estate Investment Trusts (REITs) – 5.6% | ||||||||
| 57,133 | American Tower Corp. REIT | 13,120,593 | ||||||
| 84,978 | Equity LifeStyle Properties, Inc. REIT | 5,029,848 | ||||||
| 33,054 | First Industrial Realty Trust, Inc. REIT | 1,315,880 | ||||||
| 348,432 | Invitation Homes, Inc. REIT | 9,498,256 | ||||||
| 14,431 | Mid-America Apartment Communities, Inc. REIT | 1,683,088 | ||||||
| 96,291 | Prologis, Inc. REIT | 9,552,067 | ||||||
| 32,920 | SBA Communications Corp. REIT | 9,558,980 | ||||||
| 17,895 | Sun Communities, Inc. REIT | 2,462,889 | ||||||
| 266,269 | VEREIT, Inc. REIT | 1,650,868 | ||||||
|
| |||||||
| 53,872,469 | ||||||||
|
| |||||||
| 50 | The accompanying notes are an integral part of these financial statements. |
GOLDMAN SACHS U.S. EQUITY INSIGHTS FUND
| Shares | Description | Value | ||||||
| Common Stocks – (continued) | ||||||||
| Food & Staples Retailing – 3.3% | ||||||||
| 42,011 | Costco Wholesale Corp. | $ | 15,023,974 | |||||
| 117,919 | Walmart, Inc. | 16,361,261 | ||||||
|
| |||||||
| 31,385,235 | ||||||||
|
| |||||||
| Food Products – 0.1% | ||||||||
| 13,787 | Tyson Foods, Inc., Class A | 789,030 | ||||||
|
| |||||||
| Health Care Equipment & Supplies – 3.1% | ||||||||
| 3,264 | Align Technology, Inc.* | 1,390,725 | ||||||
| 13,025 | Cooper Cos., Inc. (The) | 4,155,626 | ||||||
| 12,513 | Danaher Corp. | 2,872,234 | ||||||
| 1,998 | DexCom, Inc.* | 638,521 | ||||||
| 15,154 | Edwards Lifesciences Corp.* | 1,086,390 | ||||||
| 124,321 | Hologic, Inc.* | 8,555,771 | ||||||
| 1,044 | Quidel Corp.* | 280,095 | ||||||
| 5,136 | STERIS PLC | 910,048 | ||||||
| 36,943 | West Pharmaceutical Services, Inc. | 10,051,082 | ||||||
|
| |||||||
| 29,940,492 | ||||||||
|
| |||||||
| Health Care Providers & Services – 4.3% | ||||||||
| 40,786 | Anthem, Inc. | 11,126,421 | ||||||
| 40,938 | Cigna Corp. | 6,835,418 | ||||||
| 85,359 | HCA Healthcare, Inc. | 10,579,394 | ||||||
| 11,815 | Humana, Inc. | 4,717,493 | ||||||
| 8,713 | UnitedHealth Group, Inc. | 2,658,685 | ||||||
| 49,358 | Universal Health Services, Inc., Class B | 5,407,169 | ||||||
|
| |||||||
| 41,324,580 | ||||||||
|
| |||||||
| Hotels, Restaurants & Leisure – 1.1% | ||||||||
| 8,482 | Chipotle Mexican Grill, Inc.* | 10,190,953 | ||||||
| 2,655 | Darden Restaurants, Inc. | 244,048 | ||||||
|
| |||||||
| 10,435,001 | ||||||||
|
| |||||||
| Household Durables – 0.5% | ||||||||
| 18,713 | D.R. Horton, Inc. | 1,250,216 | ||||||
| 84,494 | PulteGroup, Inc. | 3,443,975 | ||||||
|
| |||||||
| 4,694,191 | ||||||||
|
| |||||||
| Household Products – 0.3% | ||||||||
| 18,393 | Procter & Gamble Co. (The) | 2,521,680 | ||||||
|
| |||||||
| Insurance – 3.0% | ||||||||
| 95,002 | Allstate Corp. (The) | 8,431,428 | ||||||
| 27,728 | American Financial Group, Inc. | 2,077,936 | ||||||
| 36,649 | Aon PLC, Class A | 6,743,782 | ||||||
| 123,722 | Arch Capital Group Ltd.* | 3,737,642 | ||||||
| 48,963 | Athene Holding Ltd., Class A* | 1,570,733 | ||||||
| 4,379 | Chubb Ltd. | 568,876 | ||||||
| 40,268 | First American Financial Corp. | 1,795,550 | ||||||
| 31,843 | Globe Life, Inc. | 2,582,149 | ||||||
| 52,668 | Old Republic International Corp. | 857,435 | ||||||
| 2,797 | Primerica, Inc. | 308,341 | ||||||
|
| |||||||
| 28,673,872 | ||||||||
|
| |||||||
| Interactive Media & Services – 7.6% | ||||||||
| 8,542 | Alphabet, Inc., Class A* | 13,804,812 | ||||||
| 16,103 | Alphabet, Inc., Class C* | 26,103,124 | ||||||
|
| |||||||
| Common Stocks – (continued) | ||||||||
| Interactive Media & Services – (continued) | ||||||||
| 112,864 | Facebook, Inc., Class A* | �� | 29,695,647 | |||||
| 53,170 | Pinterest, Inc., Class A* | 3,134,371 | ||||||
|
| |||||||
| 72,737,954 | ||||||||
|
| |||||||
| Internet & Direct Marketing Retail – 7.2% | ||||||||
| 18,136 | Amazon.com, Inc.* | 55,063,616 | ||||||
| 139,732 | eBay, Inc. | 6,655,435 | ||||||
| 18,547 | Etsy, Inc.* | 2,255,130 | ||||||
| 17,826 | Wayfair, Inc., Class A* | 4,421,383 | ||||||
|
| |||||||
| 68,395,564 | ||||||||
|
| |||||||
| IT Services – 5.6% | ||||||||
| 1,172 | Black Knight, Inc.* | 103,078 | ||||||
| 92,553 | Fidelity National Information Services, Inc. | 11,531,178 | ||||||
| 73,799 | International Business Machines Corp. | 8,240,396 | ||||||
| 91,423 | PayPal Holdings, Inc.* | 17,016,563 | ||||||
| 19,150 | VeriSign, Inc.* | 3,651,905 | ||||||
| 70,682 | Visa, Inc., Class A | 12,843,626 | ||||||
| 27,909 | Western Union Co. (The) | 542,551 | ||||||
|
| |||||||
| 53,929,297 | ||||||||
|
| |||||||
| Life Sciences Tools & Services – 2.5% | ||||||||
| 2,011 | Illumina, Inc.* | 588,620 | ||||||
| 3,841 | IQVIA Holdings, Inc.* | 591,476 | ||||||
| 6,305 | Mettler-Toledo International, Inc.* | 6,291,823 | ||||||
| 28,744 | PerkinElmer, Inc. | 3,723,785 | ||||||
| 26,345 | Thermo Fisher Scientific, Inc. | 12,464,346 | ||||||
|
| |||||||
| 23,660,050 | ||||||||
|
| |||||||
| Machinery – 0.6% | ||||||||
| 2,316 | Dover Corp. | 256,404 | ||||||
| 8,360 | Illinois Tool Works, Inc. | 1,637,557 | ||||||
| 40,579 | PACCAR, Inc. | 3,464,635 | ||||||
| 3,419 | Parker-Hannifin Corp. | 712,383 | ||||||
|
| |||||||
| 6,070,979 | ||||||||
|
| |||||||
| Media – 1.0% | ||||||||
| 23,565 | Liberty Broadband Corp., Class C* | 3,339,396 | ||||||
| 132,822 | Omnicom Group, Inc. | 6,269,199 | ||||||
|
| |||||||
| 9,608,595 | ||||||||
|
| |||||||
| Metals & Mining – 0.1% | ||||||||
| 52,739 | Freeport-McMoRan, Inc. | 914,494 | ||||||
|
| |||||||
| Mortgage Real Estate Investment Trusts (REITs) – 0.2% | ||||||||
| 152,982 | Starwood Property Trust, Inc. REIT | 2,137,159 | ||||||
|
| |||||||
| Multiline Retail – 1.3% | ||||||||
| 79,724 | Target Corp. | 12,135,587 | ||||||
|
| |||||||
| Oil, Gas & Consumable Fuels – 0.1% | ||||||||
| 44,063 | Kinder Morgan, Inc. | 524,350 | ||||||
|
| |||||||
| Personal Products – 0.2% | ||||||||
| 31,780 | Herbalife Nutrition Ltd.* | 1,434,549 | ||||||
|
| |||||||
| The accompanying notes are an integral part of these financial statements. | 51 |
GOLDMAN SACHS U.S. EQUITY INSIGHTS FUND
Schedule of Investments (continued)
October 31, 2020
| Shares | Description | Value | ||||||
| Common Stocks – (continued) | ||||||||
| Pharmaceuticals – 3.2% | ||||||||
| 13,701 | Horizon Therapeutics PLC* | $ | 1,026,616 | |||||
| 8,960 | Jazz Pharmaceuticals PLC* | 1,291,136 | ||||||
| 101,381 | Johnson & Johnson | 13,900,349 | ||||||
| 149,770 | Mylan NV* | 2,177,656 | ||||||
| 77,462 | Zoetis, Inc. | 12,281,600 | ||||||
|
| |||||||
| 30,677,357 | ||||||||
|
| |||||||
| Road & Rail – 1.1% | ||||||||
| 54,944 | Old Dominion Freight Line, Inc. | 10,459,689 | ||||||
|
| |||||||
| Semiconductors & Semiconductor Equipment – 4.2% | ||||||||
| 56,490 | Advanced Micro Devices, Inc.* | 4,253,132 | ||||||
| 66,448 | Applied Materials, Inc. | 3,935,715 | ||||||
| 27,099 | Lam Research Corp. | 9,270,026 | ||||||
| 3,870 | NVIDIA Corp. | 1,940,263 | ||||||
| 52,884 | NXP Semiconductors NV (Netherlands) | 7,145,686 | ||||||
| 94,978 | Texas Instruments, Inc. | 13,732,869 | ||||||
|
| |||||||
| 40,277,691 | ||||||||
|
| |||||||
| Software – 9.3% | ||||||||
| 38,056 | Adobe, Inc.* | 17,014,837 | ||||||
| 32,874 | Dropbox, Inc., Class A* | 600,279 | ||||||
| 7,791 | Intuit, Inc. | 2,451,672 | ||||||
| 295,127 | Microsoft Corp. | 59,754,364 | ||||||
| 6,238 | ServiceNow, Inc.* | 3,103,842 | ||||||
| 11,958 | Workday, Inc., Class A* | 2,512,615 | ||||||
| 7,129 | Zoom Video Communications, Inc., Class A* | 3,285,827 | ||||||
|
| |||||||
| 88,723,436 | ||||||||
|
| |||||||
| Specialty Retail – 2.4% | ||||||||
| 155,345 | Dick’s Sporting Goods, Inc. | 8,800,294 | ||||||
| 2,523 | Home Depot, Inc. (The) | 672,909 | ||||||
| 86,385 | Lowe’s Cos., Inc. | 13,657,469 | ||||||
|
| |||||||
| 23,130,672 | ||||||||
|
| |||||||
| Technology Hardware, Storage & Peripherals – 5.5% | ||||||||
| 484,941 | Apple, Inc. | 52,790,677 | ||||||
| 5,880 | Western Digital Corp. | 221,853 | ||||||
|
| |||||||
| 53,012,530 | ||||||||
|
| |||||||
| Textiles, Apparel & Luxury Goods – 0.6% | ||||||||
| 1,685 | Lululemon Athletica, Inc.* | 538,004 | ||||||
| 46,991 | NIKE, Inc., Class B | 5,642,679 | ||||||
|
| |||||||
| 6,180,683 | ||||||||
|
| |||||||
| TOTAL COMMON STOCKS | ||||||||
| (Cost $773,377,234) | $ | 938,864,718 | ||||||
|
| |||||||
| Shares | Dividend Rate | Value | ||||||
| Investment Company – 0.3%(a) | ||||||||
| | Goldman Sachs Financial Square Government Fund – | | ||||||
| 2,919,683 | 0.028% | $ | 2,919,683 | |||||
| (Cost $2,919,683) | ||||||||
|
| |||||||
| TOTAL INVESTMENTS – 98.5% | ||||||||
| (Cost $776,296,917) | $ | 941,784,401 | ||||||
|
| |||||||
| | OTHER ASSETS IN EXCESS OF LIABILITIES – 1.5% | 14,400,826 | ||||||
|
| |||||||
| NET ASSETS – 100.0% | $ | 956,185,227 | ||||||
|
| |||||||
| The percentage shown for each investment category reflects the value of investments in that category as a percentage of net assets. | ||
* | Non-income producing security. | |
(a) | Represents an affiliated issuer. | |
| ||
Investment Abbreviations: | ||
PLC | —Public Limited Company | |
REIT | —Real Estate Investment Trust | |
| ||
| 52 | The accompanying notes are an integral part of these financial statements. |
GOLDMAN SACHS DOMESTIC EQUITY INSIGHTS FUNDS
Statements of Assets and Liabilities
October 31, 2020
| Large Cap Growth Insights Fund | Large Cap Value Insights Fund | Small Cap Equity Insights Fund | ||||||||||||
| Assets: |
| |||||||||||||
Investments in unaffiliated issuers, at value (cost $1,302,882,306, $309,676,390 and $553,803,160, respectively)(a) | $ | 1,868,087,658 | $ | 317,333,574 | $ | 539,142,024 | ||||||||
Investments in securities lending reinvestment vehicle — affiliated issuer, at value | — | — | 5,113,213 | |||||||||||
Cash | 15,290,089 | 3,093,097 | 4,873,506 | |||||||||||
Receivables: | ||||||||||||||
Investments sold | 54,235,968 | — | 9,244,269 | |||||||||||
Fund shares sold | 1,457,018 | 503,252 | 532,618 | |||||||||||
Dividends | 890,401 | 382,630 | 241,287 | |||||||||||
Reimbursement from investment adviser | 55,264 | 4,226 | 32,581 | |||||||||||
Collateral on certain derivative contracts(b) | 49,600 | — | — | |||||||||||
Foreign tax reclaims | 1,192 | — | — | |||||||||||
Securities lending income | 189 | — | 35,472 | |||||||||||
Other assets | 70,290 | 42,759 | 61,835 | |||||||||||
| Total assets | 1,940,137,669 | 321,359,538 | 559,276,805 | |||||||||||
| Liabilities: | ||||||||||||||
Variation margin on futures contracts | 5,640 | — | — | |||||||||||
Payables: | ||||||||||||||
Investments purchased | 49,377,207 | — | 8,738,695 | |||||||||||
Fund shares redeemed | 3,662,088 | 420,786 | 390,260 | |||||||||||
Management fees | 841,334 | 148,310 | 390,467 | |||||||||||
Distribution and Service fees and Transfer Agency fees | 270,298 | 47,468 | 51,101 | |||||||||||
Upon return of securities loaned | — | — | 5,113,213 | |||||||||||
Accrued expenses | 340,099 | 177,428 | 223,908 | |||||||||||
| Total liabilities | 54,496,666 | 793,992 | 14,907,644 | |||||||||||
| Net Assets: |
| |||||||||||||
Paid-in capital | 1,149,841,582 | 343,490,263 | 581,582,622 | |||||||||||
Total distributable earnings (loss) | 735,799,421 | (22,924,717 | ) | (37,213,461 | ) | |||||||||
| NET ASSETS | $ | 1,885,641,003 | $ | 320,565,546 | $ | 544,369,161 | ||||||||
Net Assets: | ||||||||||||||
Class A | $ | 286,777,421 | $ | 47,125,384 | $ | 34,070,793 | ||||||||
Class C | 41,838,252 | 8,773,416 | 5,951,379 | |||||||||||
Institutional | 741,893,138 | 88,472,050 | 216,274,151 | |||||||||||
Service | 47,346,128 | 5,230,227 | 2,866,755 | |||||||||||
Investor | 308,107,081 | 70,302,285 | 64,724,255 | |||||||||||
Class R6 | 373,079,365 | 65,691,598 | 119,495,526 | |||||||||||
Class R | 27,313,750 | 4,884,549 | 13,816,627 | |||||||||||
Class P | 59,285,868 | 30,086,037 | 87,169,675 | |||||||||||
Total Net Assets | $ | 1,885,641,003 | $ | 320,565,546 | $ | 544,369,161 | ||||||||
Shares Outstanding $0.001 par value (unlimited number of shares authorized): | ||||||||||||||
Class A | 7,620,723 | 2,450,761 | 1,483,634 | |||||||||||
Class C | 1,272,978 | 460,464 | 306,982 | |||||||||||
Institutional | 18,946,917 | 4,608,018 | 9,019,100 | |||||||||||
Service | 1,280,154 | 270,778 | 127,103 | |||||||||||
Investor | 8,300,292 | 3,671,034 | 2,832,072 | |||||||||||
Class R6 | 9,532,855 | 3,421,672 | 4,982,443 | |||||||||||
Class R | 746,633 | 255,805 | 617,809 | |||||||||||
Class P | 1,515,582 | 1,567,950 | 3,635,327 | |||||||||||
Net asset value, offering and redemption price per share:(c) | ||||||||||||||
Class A | $37.63 | $19.23 | $22.96 | |||||||||||
Class C | 32.87 | 19.05 | 19.39 | |||||||||||
Institutional | 39.16 | 19.20 | 23.98 | |||||||||||
Service | 36.98 | 19.32 | 22.55 | |||||||||||
Investor | 37.12 | 19.15 | 22.85 | |||||||||||
Class R6 | 39.14 | 19.20 | 23.98 | |||||||||||
Class R | 36.58 | 19.09 | 22.36 | |||||||||||
Class P | 39.12 | 19.19 | 23.98 | |||||||||||
| (a) | Includes loaned securities having a market value of $4,356,310 for the Small Cap Equity Insights Fund. |
| (b) | Segregated for initial margin and/or collateral as follows: |
| Fund | Futures | |||
Large Cap Growth Insights | $ | 49,600 | ||
| (c) | Maximum public offering price per share for Class A Shares of the Large Cap Growth Insights, Large Cap Value Insights and Small Cap Equity Insights Funds is $39.82, $20.35 and $24.30, respectively. At redemption, Class C Shares may be subject to a contingent deferred sales charge assessed on the amount equal to the lesser of the current net asset value (“NAV”) or the original purchase price of the shares. |
| The accompanying notes are an integral part of these financial statements. | 53 |
GOLDMAN SACHS DOMESTIC EQUITY INSIGHTS FUNDS
Statements of Assets and Liabilities (continued)
October 31, 2020
| Small Cap Growth Insights Fund | Small Cap Value Insights Fund | U.S. Equity Insights Fund | ||||||||||||
| Assets: |
| |||||||||||||
Investments in unaffiliated issuers, at value (cost $937,772,448, $782,511,746 and $773,377,234, respectively)(a) | $ | 977,743,742 | $ | 755,637,145 | $ | 938,864,718 | ||||||||
Investments in affiliated issuers, at value (cost $0, $699,934 and $2,919,683, respectively) | — | 699,934 | 2,919,683 | |||||||||||
Investments in securities lending reinvestment vehicle — affiliated issuer, at value (cost $11,156,338, $3,369,422 and $0, respectively) | 11,156,338 | 3,369,422 | — | |||||||||||
Cash | 158,421 | 12,191,260 | 14,610,034 | |||||||||||
Receivables: | ||||||||||||||
Investments sold | 7,090,437 | — | 26,661,245 | |||||||||||
Fund shares sold | 1,486,023 | 1,355,198 | 1,009,071 | |||||||||||
Dividends | 246,084 | 567,369 | 665,884 | |||||||||||
Securities lending income | 115,190 | 2,858 | — | |||||||||||
Reimbursement from investment adviser | 109,192 | 102,908 | 15,995 | |||||||||||
Collateral on certain derivative contracts(b) | — | 1,011,000 | — | |||||||||||
Foreign tax reclaims | — | — | 916 | |||||||||||
Other assets | 49,806 | 67,827 | 54,354 | |||||||||||
| Total assets | 998,155,233 | 775,004,921 | 984,801,900 | |||||||||||
| Liabilities: | ||||||||||||||
Variation margin on futures contracts | — | 151,200 | — | |||||||||||
Payables: | ||||||||||||||
Upon return of securities loaned | 11,156,338 | 3,369,422 | — | |||||||||||
Fund shares redeemed | 3,177,716 | 1,590,133 | 1,007,832 | |||||||||||
Investments purchased | 1,008,154 | 286,765 | 26,678,352 | |||||||||||
Management fees | 719,493 | 538,330 | 440,952 | |||||||||||
Distribution and Service fees and Transfer Agency fees | 108,867 | 97,549 | 179,591 | |||||||||||
Accrued expenses | 388,506 | 242,889 | 309,946 | |||||||||||
| Total liabilities | 16,559,074 | 6,276,288 | 28,616,673 | |||||||||||
| Net Assets: | ||||||||||||||
Paid-in capital | 910,954,044 | 814,350,403 | 757,788,943 | |||||||||||
Total distributable earnings (loss) | 70,642,115 | (45,621,770 | ) | 198,396,284 | ||||||||||
| NET ASSETS | $ | 981,596,159 | $ | 768,728,633 | $ | 956,185,227 | ||||||||
Net Assets: | ||||||||||||||
Class A | $ | 50,864,935 | $ | 98,493,328 | $ | 294,540,151 | ||||||||
Class C | 6,439,158 | 5,312,629 | 16,275,161 | |||||||||||
Institutional | 200,116,145 | 190,490,636 | 255,177,130 | |||||||||||
Service | — | — | 5,761,086 | |||||||||||
Investor | 442,743,243 | 273,560,338 | 88,924,423 | |||||||||||
Class R6 | 263,023,490 | 158,329,659 | 8,870,521 | |||||||||||
Class R | 8,167,952 | 14,038,263 | 41,005,196 | |||||||||||
Class P | 10,241,236 | 28,503,780 | 245,631,559 | |||||||||||
Total Net Assets | $ | 981,596,159 | $ | 768,728,633 | $ | 956,185,227 | ||||||||
Shares Outstanding $0.001 par value (unlimited number of shares authorized): | ||||||||||||||
Class A | 1,483,504 | 2,991,233 | 5,482,489 | |||||||||||
Class C | 254,944 | 236,370 | 341,115 | |||||||||||
Institutional | 4,855,404 | 4,261,324 | 4,589,153 | |||||||||||
Service | — | — | 107,927 | |||||||||||
Investor | 12,491,208 | 8,346,883 | 1,677,189 | |||||||||||
Class R6 | 6,377,583 | 3,542,433 | 159,660 | |||||||||||
Class R | 249,681 | 435,886 | �� | 779,170 | ||||||||||
Class P | 248,334 | 637,825 | 4,421,075 | |||||||||||
Net asset value, offering and redemption price per share:(c) | ||||||||||||||
Class A | $34.29 | $32.93 | $53.72 | |||||||||||
Class C | 25.26 | 22.48 | 47.71 | |||||||||||
Institutional | 41.22 | 44.70 | 55.60 | |||||||||||
Service | — | — | 53.38 | |||||||||||
Investor | 35.44 | 32.77 | 53.02 | |||||||||||
Class R6 | 41.24 | 44.70 | 55.56 | |||||||||||
Class R | 32.71 | 32.21 | 52.63 | |||||||||||
Class P | 41.24 | 44.69 | 55.56 | |||||||||||
| (a) | Includes loaned securities having a market value of $9,792,044 and $2,655,438 for the Small Cap Growth Insights Fund and Small Cap Value Insights Fund, respectively. |
| (b) | Segregated for initial margin and/or collateral as follows: |
| Fund | Futures | |||
Small Cap Value Insights | $ | 1,011,000 | ||
| (c) | Maximum public offering price per share for Class A Shares of the Small Cap Growth Insights, Small Cap Value Insights and U.S. Equity Insights Funds is $36.29, $34.85 and $56.85, respectively. At redemption, Class C Shares may be subject to a contingent deferred sales charge assessed on the amount equal to the lesser of the current NAV or the original purchase price of the shares. |
| 54 | The accompanying notes are an integral part of these financial statements. |
GOLDMAN SACHS DOMESTIC EQUITY INSIGHTS FUNDS
Statements of Operations
For the Fiscal Year Ended October 31, 2020
| Large Cap Growth Insights Fund | Large Cap Value Insights Fund | Small Cap Equity Insights Fund | ||||||||||||
| Investment income: |
| |||||||||||||
Dividends — unaffiliated issuer (net of foreign withholding taxes of $7,955, $9,345 and $18,065, respectively) | $ | 16,974,080 | $ | 8,382,949 | $ | 7,149,017 | ||||||||
Securities lending income — affiliated issuer | 60,951 | 1,794 | 205,240 | |||||||||||
Dividends — affiliated issuers | 1,262 | 1,558 | 41,763 | |||||||||||
| Total investment income | 17,036,293 | 8,386,301 | 7,396,020 | |||||||||||
| Expenses: |
| |||||||||||||
Management fees | 9,339,577 | 1,977,747 | 4,969,932 | |||||||||||
Transfer Agency fees(a) | 1,615,647 | 361,295 | 396,609 | |||||||||||
Distribution and Service (12b-1) fees(a) | 1,299,447 | 261,413 | 236,923 | |||||||||||
Printing and mailing costs | 289,872 | 106,525 | 144,996 | |||||||||||
Custody, accounting and administrative services | 258,843 | 82,913 | 116,917 | |||||||||||
Professional fees | 120,145 | 119,193 | 120,757 | |||||||||||
Shareholder Administration fees — Service Shares | 116,627 | 15,924 | 7,159 | |||||||||||
Service fees — Class C | 103,338 | 27,132 | 16,759 | |||||||||||
Trustee fees | 23,464 | 21,250 | 21,658 | |||||||||||
Registration fees | — | 72,047 | 71,204 | |||||||||||
Other | 52,555 | 14,432 | 34,964 | |||||||||||
| Total expenses | 13,219,515 | 3,059,871 | 6,137,878 | |||||||||||
Less — expense reductions | (672,657 | ) | (401,867 | ) | (491,039 | ) | ||||||||
| Net expenses | 12,546,858 | 2,658,004 | 5,646,839 | |||||||||||
| NET INVESTMENT INCOME | 4,489,435 | 5,728,297 | 1,749,181 | |||||||||||
| Realized and unrealized gain (loss): |
| |||||||||||||
Net realized gain (loss) from: | ||||||||||||||
Investments — unaffiliated issuers | 176,603,228 | (23,147,309 | ) | (12,187,726 | ) | |||||||||
Futures | 1,151,295 | 299,068 | (2,606,855 | ) | ||||||||||
Foreign currency transactions | 170 | 31 | — | |||||||||||
Net change in unrealized gain (loss) on: | ||||||||||||||
Investments | 209,194,579 | (18,638,685 | ) | (58,560,361 | ) | |||||||||
Futures | 6,645 | — | 141,112 | |||||||||||
Foreign currency translations | 51 | — | — | |||||||||||
| Net realized and unrealized gain (loss) | 386,955,968 | (41,486,895 | ) | (73,213,830 | ) | |||||||||
| NET INCREASE (DECREASE) IN NET ASSETS RESULTING FROM OPERATIONS | $ | 391,445,403 | $ | (35,758,598 | ) | $ | (71,464,649 | ) | ||||||
| (a) | Class specific Distribution and/or Service and Transfer Agency fees were as follows: |
| Distribution and/or Service (12b-1) Fees | Transfer Agency Fees | |||||||||||||||||||||||||||||||||||||||||||||||
Fund | Class A | Class C | Service | Class R | Class A | Class C | Institutional | Service | Investor | Class R6 | Class R | Class P | ||||||||||||||||||||||||||||||||||||
Large Cap Growth Insights | $ | 728,887 | $ | 310,013 | $ | 116,627 | $ | 143,920 | $ | 485,418 | $ | 68,803 | $ | 291,548 | $ | 18,661 | $ | 585,144 | $ | 101,541 | $ | 47,994 | $ | 16,538 | ||||||||||||||||||||||||
Large Cap Value Insights | 139,285 | 81,397 | 15,924 | 24,807 | 93,018 | 18,128 | 40,838 | 2,548 | 168,621 | 20,493 | 8,267 | 9,382 | ||||||||||||||||||||||||||||||||||||
Small Cap Equity Insights | 106,678 | 50,277 | 7,159 | 72,809 | 71,331 | 11,185 | 104,261 | 1,145 | 117,406 | 39,204 | 24,269 | 27,808 | ||||||||||||||||||||||||||||||||||||
| The accompanying notes are an integral part of these financial statements. | 55 |
GOLDMAN SACHS DOMESTIC EQUITY INSIGHTS FUNDS
Statements of Operations (continued)
For the Fiscal Year Ended October 31, 2020
| Small Cap Growth Insights Fund | Small Cap Value Insights Fund | U.S. Equity Insights Fund | ||||||||||||
| Investment income: |
| |||||||||||||
Dividends — unaffiliated issuer (net of foreign withholding taxes of $1,593, $29,411 and $16,108, respectively) | $ | 7,088,361 | $ | 11,495,779 | $ | 14,354,959 | ||||||||
Securities lending income — affiliated issuer | 538,882 | 119,174 | 4,607 | |||||||||||
Dividends — affiliated issuers | 31,922 | 71,062 | 7,986 | |||||||||||
| Total investment income | 7,659,165 | 11,686,015 | 14,367,552 | |||||||||||
| Expenses: |
| |||||||||||||
Management fees | 8,627,577 | 5,298,115 | 4,979,341 | |||||||||||
Transfer Agency fees(a) | 1,005,874 | 629,142 | 922,023 | |||||||||||
Printing and mailing costs | 490,362 | 182,002 | 178,705 | |||||||||||
Distribution and Service (12b-1) fees(a) | 264,466 | 360,494 | 1,076,254 | |||||||||||
Custody, accounting and administrative services | 168,969 | 121,624 | 174,317 | |||||||||||
Professional fees | 119,172 | 119,163 | 119,172 | |||||||||||
Registration fees | 24,147 | 137,244 | 37,346 | |||||||||||
Trustee fees | 22,333 | 21,713 | 22,097 | |||||||||||
Service fees — Class C | 18,455 | 15,981 | 39,622 | |||||||||||
Shareholder Administration fees — Service Shares | — | — | 15,414 | |||||||||||
Other | 70,466 | 46,147 | 42,206 | |||||||||||
| Total expenses | 10,811,821 | 6,931,625 | 7,606,497 | |||||||||||
Less — expense reductions | (857,613 | ) | (611,902 | ) | (537,643 | ) | ||||||||
| Net expenses | 9,954,208 | 6,319,723 | 7,068,854 | |||||||||||
| NET INVESTMENT INCOME (LOSS) | (2,295,043 | ) | 5,366,292 | 7,298,698 | ||||||||||
| Realized and unrealized gain (loss): |
| |||||||||||||
Net realized gain (loss) from: | ||||||||||||||
Investments — unaffiliated issuers | 31,697,603 | (17,367,764 | ) | 43,376,791 | ||||||||||
Futures | 4,724,182 | (1,174,911 | ) | 255,674 | ||||||||||
Foreign currency transactions | — | — | 130 | |||||||||||
Net change in unrealized gain (loss) on: | ||||||||||||||
Investments | (35,561,959 | ) | (59,093,357 | ) | 36,827,612 | |||||||||
Futures | 234,858 | (735,645 | ) | — | ||||||||||
Foreign currency translations | — | — | 40 | |||||||||||
| Net realized and unrealized gain (loss) | 1,094,684 | (78,371,677 | ) | 80,460,247 | ||||||||||
| NET INCREASE (DECREASE) IN NET ASSETS RESULTING FROM OPERATIONS | $ | (1,200,359 | ) | $ | (73,005,385 | ) | $ | 87,758,945 | ||||||
| (a) | Class specific Distribution and/or Service and Transfer Agency fees were as follows: |
| Distribution and/or Service (12b-1) Fees | Transfer Agency Fees | |||||||||||||||||||||||||||||||||||||||||||||||
Fund | Class A | Class C | Service | Class R | Class A | Class C | Institutional | Service | Investor | Class R6 | Class R | Class P | ||||||||||||||||||||||||||||||||||||
Small Cap Growth Insights | $ | 152,471 | $ | 55,365 | $ | — | $ | 56,630 | $ | 101,857 | $ | 12,313 | $ | 119,215 | $ | — | $ | 662,914 | $ | 87,253 | $ | 18,973 | $ | 3,349 | ||||||||||||||||||||||||
Small Cap Value Insights | 273,867 | 47,944 | — | 38,683 | 182,774 | 10,680 | 71,761 | — | 297,487 | 42,674 | 12,881 | 10,885 | ||||||||||||||||||||||||||||||||||||
U.S. Equity Insights | 732,541 | 118,867 | 15,414 | 209,432 | 487,805 | 26,378 | 106,000 | 2,466 | 156,656 | 2,493 | 69,773 | 70,452 | ||||||||||||||||||||||||||||||||||||
| 56 | The accompanying notes are an integral part of these financial statements. |
GOLDMAN SACHS DOMESTIC EQUITY INSIGHTS FUNDS
Statements of Changes in Net Assets
| Large Cap Growth Insights Fund | Large Cap Value Insights Fund | |||||||||||||||||||||
| For the Fiscal Year Ended October 31, 2020 | For the Fiscal Year Ended October 31, 2019 | For the Fiscal Year Ended October 31, 2020 | For the Fiscal Year Ended October 31, 2019 | |||||||||||||||||||
| From operations: |
| |||||||||||||||||||||
Net investment income | $ | 4,489,435 | $ | 12,022,707 | $ | 5,728,297 | $ | 8,266,546 | ||||||||||||||
Net realized gain (loss) | 177,754,693 | 67,769,530 | (22,848,210 | ) | (5,618,538 | ) | ||||||||||||||||
Net change in unrealized gain (loss) | 209,201,275 | 147,817,520 | (18,638,685 | ) | 24,942,599 | |||||||||||||||||
| Net increase (decrease) in net assets resulting from operations | 391,445,403 | 227,609,757 | (35,758,598 | ) | 27,590,607 | |||||||||||||||||
| Distributions to shareholders: |
| |||||||||||||||||||||
Total distributable earnings: | ||||||||||||||||||||||
Class A Shares | (11,437,017 | ) | (27,564,725 | ) | (721,696 | ) | (4,045,532 | ) | ||||||||||||||
Class C Shares | (1,652,223 | ) | (4,973,355 | ) | (57,654 | ) | (634,798 | ) | ||||||||||||||
Institutional Shares | (30,583,438 | ) | (67,332,090 | ) | (1,709,480 | ) | (8,978,283 | ) | ||||||||||||||
Service Shares | (1,907,093 | ) | (4,268,995 | ) | (72,282 | ) | (592,566 | ) | ||||||||||||||
Investor Shares | (16,644,105 | ) | (35,840,025 | ) | (1,570,378 | ) | (6,499,108 | ) | ||||||||||||||
Class R6 Shares | (12,792,716 | ) | (30,834,650 | ) | (1,156,248 | ) | (10,049,072 | ) | ||||||||||||||
Class R Shares | (1,215,415 | ) | (2,118,839 | ) | (52,688 | ) | (346,593 | ) | ||||||||||||||
Class P Shares | (2,075,071 | ) | (3,340,204 | ) | (534,539 | ) | (1,984,309 | ) | ||||||||||||||
| Total distributions to shareholders | (78,307,078 | ) | (176,272,883 | ) | (5,874,965 | ) | (33,130,261 | ) | ||||||||||||||
| From share transactions: |
| |||||||||||||||||||||
Proceeds from sales of shares | 499,794,164 | 674,755,517 | 87,609,068 | 313,186,552 | ||||||||||||||||||
Reinvestment of distributions | 69,749,290 | 159,092,941 | 5,573,203 | 30,462,643 | ||||||||||||||||||
Cost of shares redeemed | (949,944,612 | ) | (990,901,692 | ) | (184,044,568 | ) | (357,980,026 | ) | ||||||||||||||
| Net decrease in net assets resulting from share transactions | (380,401,158 | ) | (157,053,234 | ) | (90,862,297 | ) | (14,330,831 | ) | ||||||||||||||
| TOTAL DECREASE | (67,262,833 | ) | (105,716,360 | ) | (132,495,860 | ) | (19,870,485 | ) | ||||||||||||||
| Net assets: | ||||||||||||||||||||||
Beginning of year | 1,952,903,836 | 2,058,620,196 | 453,061,406 | 472,931,891 | ||||||||||||||||||
End of year | $ | 1,885,641,003 | $ | 1,952,903,836 | $ | 320,565,546 | $ | 453,061,406 | ||||||||||||||
| The accompanying notes are an integral part of these financial statements. | 57 |
GOLDMAN SACHS DOMESTIC EQUITY INSIGHTS FUNDS
Statements of Changes in Net Assets (continued)
| Small Cap Equity Insights Fund | Small Cap Growth Insights Fund | |||||||||||||||||||||
| For the Fiscal Year Ended October 31, 2020 | For the Fiscal Year Ended October 31, 2019 | For the Fiscal Year Ended October 31, 2020 | For the Fiscal Year Ended October 31, 2019 | |||||||||||||||||||
| From operations: |
| |||||||||||||||||||||
Net investment income (loss) | $ | 1,749,181 | $ | 3,000,138 | $ | (2,295,043 | ) | $ | (896,597 | ) | ||||||||||||
Net realized gain (loss) | (14,794,581 | ) | (8,624,564 | ) | 36,421,785 | 12,785,720 | ||||||||||||||||
Net change in unrealized gain (loss) | (58,419,249 | ) | 53,942,051 | (35,327,101 | ) | 61,026,644 | ||||||||||||||||
| Net increase (decrease) in net assets resulting from operations | (71,464,649 | ) | 48,317,625 | (1,200,359 | ) | 72,915,767 | ||||||||||||||||
| Distributions to shareholders: |
| |||||||||||||||||||||
Total distributable earnings: | ||||||||||||||||||||||
Class A Shares | (108,619 | ) | (2,973,498 | ) | (1,157,729 | ) | (8,979,679 | ) | ||||||||||||||
Class C Shares | — | (464,085 | ) | (152,869 | ) | (1,069,015 | ) | |||||||||||||||
Institutional Shares | (1,626,736 | ) | (11,437,346 | ) | (3,974,277 | ) | (27,575,852 | ) | ||||||||||||||
Service Shares | (3,071 | ) | (124,376 | ) | — | — | ||||||||||||||||
Investor Shares | (374,689 | ) | (2,425,323 | ) | (5,138,376 | ) | (31,017,003 | ) | ||||||||||||||
Class R6 Shares | (850,889 | ) | (9,476,064 | ) | (3,615,584 | ) | (14,097,427 | ) | ||||||||||||||
Class R Shares | — | (786,446 | ) | (284,681 | ) | (2,101,140 | ) | |||||||||||||||
Class P Shares | (596,984 | ) | (3,278,915 | ) | (145,698 | ) | (778,940 | ) | ||||||||||||||
| Total distributions to shareholders | (3,560,988 | ) | (30,966,053 | ) | (14,469,214 | ) | (85,619,056 | ) | ||||||||||||||
| From share transactions: |
| |||||||||||||||||||||
Proceeds from sales of shares | 198,765,373 | 382,161,015 | 346,717,657 | 549,336,651 | ||||||||||||||||||
Reinvestment of distributions | 3,490,560 | 30,650,153 | 14,049,097 | 84,301,544 | ||||||||||||||||||
Cost of shares redeemed | (288,552,551 | ) | (300,885,593 | ) | (524,576,347 | ) | (321,356,916 | ) | ||||||||||||||
| Net increase (decrease) in net assets resulting from share transactions | (86,296,618 | ) | 111,925,575 | (163,809,593 | ) | 312,281,279 | ||||||||||||||||
| TOTAL INCREASE (DECREASE) | (161,322,255 | ) | 129,277,147 | (179,479,166 | ) | 299,577,990 | ||||||||||||||||
| Net assets: | ||||||||||||||||||||||
Beginning of year | 705,691,416 | 576,414,269 | 1,161,075,325 | 861,497,335 | ||||||||||||||||||
End of year | $ | 544,369,161 | $ | 705,691,416 | $ | 981,596,159 | $ | 1,161,075,325 | ||||||||||||||
| 58 | The accompanying notes are an integral part of these financial statements. |
GOLDMAN SACHS DOMESTIC EQUITY INSIGHTS FUNDS
Statements of Changes in Net Assets (continued)
| Small Cap Value Insights Fund | U.S. Equity Insights Fund | |||||||||||||||||||||
| For the Fiscal Year Ended October 31, 2020 | For the Fiscal Year Ended October 31, 2019 | For the Fiscal Year Ended October 31, 2020 | For the Fiscal Year Ended October 31, 2019 | |||||||||||||||||||
| From operations: |
| |||||||||||||||||||||
Net investment income | $ | 5,366,292 | $ | 3,524,458 | $ | 7,298,698 | $ | 17,119,702 | ||||||||||||||
Net realized gain (loss) | (18,542,675 | ) | (3,519,243 | ) | 43,632,595 | (12,531,144 | ) | |||||||||||||||
Net change in unrealized gain (loss) | (59,829,002 | ) | 37,195,393 | 36,827,652 | 112,092,449 | |||||||||||||||||
| Net increase (decrease) in net assets resulting from operations | (73,005,385 | ) | 37,200,608 | 87,758,945 | 116,681,007 | |||||||||||||||||
| Distributions to shareholders: |
| |||||||||||||||||||||
Total distributable earnings: | ||||||||||||||||||||||
Class A Shares | (827,588 | ) | (10,543,077 | ) | (4,157,727 | ) | (11,514,034 | ) | ||||||||||||||
Class C Shares | (32,365 | ) | (844,101 | ) | (140,002 | ) | (572,348 | ) | ||||||||||||||
Institutional Shares | (1,458,393 | ) | (4,776,734 | ) | (4,700,529 | ) | (34,531,169 | ) | ||||||||||||||
Service Shares | — | — | (95,840 | ) | (218,665 | ) | ||||||||||||||||
Investor Shares | (694,092 | ) | (1,907,349 | ) | (1,879,914 | ) | (4,499,108 | ) | ||||||||||||||
Class R6 Shares | (897,586 | ) | (1,908,993 | ) | (169,754 | ) | (1,352,886 | ) | ||||||||||||||
Class R Shares | (61,450 | ) | (225,486 | ) | (507,892 | ) | (1,722,455 | ) | ||||||||||||||
Class P Shares | (358,606 | ) | (2,877,391 | ) | (4,032,946 | ) | (6,101,132 | ) | ||||||||||||||
| Total distributions to shareholders | (4,330,080 | ) | (23,083,131 | ) | (15,684,604 | ) | (60,511,797 | ) | ||||||||||||||
| From share transactions: |
| |||||||||||||||||||||
Proceeds from sales of shares | 543,633,517 | 372,978,518 | 166,576,705 | 475,796,540 | ||||||||||||||||||
Reinvestment of distributions | 4,217,944 | 22,702,592 | 15,415,026 | 59,440,795 | ||||||||||||||||||
Cost of shares redeemed | (270,076,116 | ) | (106,350,529 | ) | (314,438,554 | ) | (1,128,321,651 | ) | ||||||||||||||
| Net increase (decrease) in net assets resulting from share transactions | 277,775,345 | 289,330,581 | (132,446,823 | ) | (593,084,316 | ) | ||||||||||||||||
| TOTAL INCREASE (DECREASE) | 200,439,880 | 303,448,058 | (60,372,482 | ) | (536,915,106 | ) | ||||||||||||||||
| Net assets: | ||||||||||||||||||||||
Beginning of year | 568,288,753 | 264,840,695 | 1,016,557,709 | 1,553,472,815 | ||||||||||||||||||
End of year | $ | 768,728,633 | $ | 568,288,753 | $ | 956,185,227 | $ | 1,016,557,709 | ||||||||||||||
| The accompanying notes are an integral part of these financial statements. | 59 |
GOLDMAN SACHS LARGE CAP GROWTH INSIGHTS FUND
Selected Share Data for a Share Outstanding Throughout Each Year
| (a) | Calculated based on the average shares outstanding methodology. |
| (b) | Amount is less than $0.005 per share. |
| (c) | Assumes investment at the NAV at the beginning of the year, reinvestment of all dividends and distributions, a complete redemption of the investment at the NAV at the end of the year and no sales or redemption charges (if any). Total returns would be reduced if a sales or redemption charge was taken into account. Returns do not reflect the impact of taxes to shareholders relating to Fund distributions or the redemption of Fund shares. |
| (d) | Amount is less than 0.005% per share. |
| (e) | The Fund’s portfolio turnover rate is calculated in accordance with regulatory requirements, without regard to transactions involving short term investments and certain derivatives. If such transactions were included, the Fund’s portfolio turnover rate may be higher. |
| 60 | The accompanying notes are an integral part of these financial statements. |
GOLDMAN SACHS LARGE CAP GROWTH INSIGHTS FUND
Financial Highlights (continued)
Selected Share Data for a Share Outstanding Throughout Each Year
| Goldman Sachs Large Cap Growth Insights Fund | ||||||||||||||||||||||
| Class C Shares | ||||||||||||||||||||||
| Year Ended October 31, | ||||||||||||||||||||||
| 2020 | 2019 | 2018 | 2017 | 2016 | ||||||||||||||||||
| Per Share Data | ||||||||||||||||||||||
Net asset value, beginning of year | $ | 27.79 | $ | 27.78 | $ | 27.42 | $ | 21.23 | $ | 21.02 | ||||||||||||
Net investment loss(a) | (0.23 | ) | (0.10 | ) | (0.12 | ) | (0.09 | ) | (0.05 | ) | ||||||||||||
Net realized and unrealized gain | 6.43 | 2.63 | 1.77 | 6.28 | 0.30 | |||||||||||||||||
Total from investment operations | 6.20 | 2.53 | 1.65 | 6.19 | 0.25 | |||||||||||||||||
Distributions to shareholders from net investment income | — | — | — | — | (0.04 | ) | ||||||||||||||||
Distributions to shareholders from net realized gains | (1.12 | ) | (2.52 | ) | (1.29 | ) | — | — | ||||||||||||||
Total distributions | (1.12 | ) | (2.52 | ) | (1.29 | ) | — | (0.04 | ) | |||||||||||||
Net asset value, end of year | $ | 32.87 | $ | 27.79 | $ | 27.78 | $ | 27.42 | $ | 21.23 | ||||||||||||
| Total Return(b) | 22.97 | % | 10.42 | % | 6.18 | % | 29.16 | % | 1.18 | % | ||||||||||||
Net assets, end of year (in 000’s) | $ | 41,838 | $ | 42,004 | $ | 56,046 | $ | 63,500 | $ | 48,610 | ||||||||||||
Ratio of net expenses to average net assets | 1.67 | % | 1.68 | % | 1.67 | % | 1.70 | % | 1.71 | % | ||||||||||||
Ratio of total expenses to average net assets | 1.70 | % | 1.72 | % | 1.70 | % | 1.85 | % | 1.90 | % | ||||||||||||
Ratio of net investment loss to average net assets | (0.76 | )% | (0.40 | )% | (0.42 | )% | (0.37 | )% | (0.25 | )% | ||||||||||||
Portfolio turnover rate(c) | 218 | % | 192 | % | 188 | % | 196 | % | 254 | % | ||||||||||||
| (a) | Calculated based on the average shares outstanding methodology. |
| (b) | Assumes investment at the NAV at the beginning of the year, reinvestment of all dividends and distributions, a complete redemption of the investment at the NAV at the end of the year and no sales or redemption charges (if any). Total returns would be reduced if a sales or redemption charge was taken into account. Returns do not reflect the impact of taxes to shareholders relating to Fund distributions or the redemption of Fund shares. |
| (c) | The Fund’s portfolio turnover rate is calculated in accordance with regulatory requirements, without regard to transactions involving short term investments and certain derivatives. If such transactions were included, the Fund’s portfolio turnover rate may be higher. |
| The accompanying notes are an integral part of these financial statements. | 61 |
GOLDMAN SACHS LARGE CAP GROWTH INSIGHTS FUND
Financial Highlights (continued)
Selected Share Data for a Share Outstanding Throughout Each Year
| Goldman Sachs Large Cap Growth Insights Fund | ||||||||||||||||||||||
| Institutional Shares | ||||||||||||||||||||||
| Year Ended October 31, | ||||||||||||||||||||||
| 2020 | 2019 | 2018 | 2017 | 2016 | ||||||||||||||||||
| Per Share Data | ||||||||||||||||||||||
Net asset value, beginning of year | $ | 32.77 | $ | 32.17 | $ | 31.39 | $ | 24.21 | $ | 23.86 | ||||||||||||
Net investment income(a) | 0.13 | 0.23 | 0.23 | 0.22 | 0.21 | |||||||||||||||||
Net realized and unrealized gain | 7.61 | 3.09 | 2.02 | 7.15 | 0.34 | |||||||||||||||||
Total from investment operations | 7.74 | 3.32 | 2.25 | 7.37 | 0.55 | |||||||||||||||||
Distributions to shareholders from net investment income | (0.23 | ) | (0.20 | ) | (0.18 | ) | (0.19 | ) | (0.20 | ) | ||||||||||||
Distributions to shareholders from net realized gains | (1.12 | ) | (2.52 | ) | (1.29 | ) | — | — | ||||||||||||||
Total distributions | (1.35 | ) | (2.72 | ) | (1.47 | ) | (0.19 | ) | (0.20 | ) | ||||||||||||
Net asset value, end of year | $ | 39.16 | $ | 32.77 | $ | 32.17 | $ | 31.39 | $ | 24.21 | ||||||||||||
| Total Return(b) | 24.33 | % | 11.70 | % | 7.38 | % | 30.63 | % | 2.35 | % | ||||||||||||
Net assets, end of year (in 000’s) | $ | 741,893 | $ | 760,316 | $ | 806,091 | $ | 897,009 | $ | 448,961 | ||||||||||||
Ratio of net expenses to average net assets | 0.54 | % | 0.54 | % | 0.53 | % | 0.56 | % | 0.56 | % | ||||||||||||
Ratio of total expenses to average net assets | 0.58 | % | 0.58 | % | 0.56 | % | 0.70 | % | 0.75 | % | ||||||||||||
Ratio of net investment income to average net assets | 0.36 | % | 0.72 | % | 0.71 | % | 0.78 | % | 0.89 | % | ||||||||||||
Portfolio turnover rate(c) | 218 | % | 192 | % | 188 | % | 196 | % | 254 | % | ||||||||||||
| (a) | Calculated based on the average shares outstanding methodology. |
| (b) | Assumes investment at the NAV at the beginning of the year, reinvestment of all dividends and distributions, a complete redemption of the investment at the NAV at the end of the year and no sales or redemption charges (if any). Total returns would be reduced if a sales or redemption charge was taken into account. Returns do not reflect the impact of taxes to shareholders relating to Fund distributions or the redemption of Fund shares. |
| (c) | The Fund’s portfolio turnover rate is calculated in accordance with regulatory requirements, without regard to transactions involving short term investments and certain derivatives. If such transactions were included, the Fund’s portfolio turnover rate may be higher. |
| 62 | The accompanying notes are an integral part of these financial statements. |
GOLDMAN SACHS LARGE CAP GROWTH INSIGHTS FUND
Financial Highlights (continued)
Selected Share Data for a Share Outstanding Throughout Each Year
| Goldman Sachs Large Cap Growth Insights Fund | ||||||||||||||||||||||
| Service Shares | ||||||||||||||||||||||
| Year Ended October 31, | ||||||||||||||||||||||
| 2020 | 2019 | 2018 | 2017 | 2016 | ||||||||||||||||||
| Per Share Data | ||||||||||||||||||||||
Net asset value, beginning of year | $ | 31.02 | $ | 30.53 | $ | 29.94 | $ | 23.15 | $ | 22.89 | ||||||||||||
Net investment income (loss)(a) | (0.05 | ) | 0.07 | 0.07 | 0.04 | 0.08 | ||||||||||||||||
Net realized and unrealized gain | 7.20 | 2.95 | 1.92 | 6.88 | 0.33 | |||||||||||||||||
Total from investment operations | 7.15 | 3.02 | 1.99 | 6.92 | 0.41 | |||||||||||||||||
Distributions to shareholders from net investment income | (0.07 | ) | (0.01 | ) | (0.11 | ) | (0.13 | ) | (0.15 | ) | ||||||||||||
Distributions to shareholders from net realized gains | (1.12 | ) | (2.52 | ) | (1.29 | ) | — | — | ||||||||||||||
Total distributions | (1.19 | ) | (2.53 | ) | (1.40 | ) | (0.13 | ) | (0.15 | ) | ||||||||||||
Net asset value, end of year | $ | 36.98 | $ | 31.02 | $ | 30.53 | $ | 29.94 | $ | 23.15 | ||||||||||||
| Total Return(b) | 23.68 | % | 11.15 | % | 6.82 | % | 30.04 | % | 1.82 | % | ||||||||||||
Net assets, end of year (in 000’s) | $ | 47,346 | $ | 50,445 | $ | 53,347 | $ | 67,450 | $ | 12,517 | ||||||||||||
Ratio of net expenses to average net assets | 1.04 | % | 1.04 | % | 1.03 | % | 1.05 | % | 1.06 | % | ||||||||||||
Ratio of total expenses to average net assets | 1.08 | % | 1.08 | % | 1.06 | % | 1.19 | % | 1.26 | % | ||||||||||||
Ratio of net investment income (loss) to average net assets | (0.13 | )% | 0.22 | % | 0.21 | % | 0.17 | % | 0.34 | % | ||||||||||||
Portfolio turnover rate(c) | 218 | % | 192 | % | 188 | % | 196 | % | 254 | % | ||||||||||||
| (a) | Calculated based on the average shares outstanding methodology. |
| (b) | Assumes investment at the NAV at the beginning of the year, reinvestment of all dividends and distributions, a complete redemption of the investment at the NAV at the end of the year and no sales or redemption charges (if any). Total returns would be reduced if a sales or redemption charge was taken into account. Returns do not reflect the impact of taxes to shareholders relating to Fund distributions or the redemption of Fund shares. |
| (c) | The Fund’s portfolio turnover rate is calculated in accordance with regulatory requirements, without regard to transactions involving short term investments and certain derivatives. If such transactions were included, the Fund’s portfolio turnover rate may be higher. |
| The accompanying notes are an integral part of these financial statements. | 63 |
GOLDMAN SACHS LARGE CAP GROWTH INSIGHTS FUND
Financial Highlights (continued)
Selected Share Data for a Share Outstanding Throughout Each Year
| Goldman Sachs Large Cap Growth Insights Fund | ||||||||||||||||||||||
| Investor Shares | ||||||||||||||||||||||
| Year Ended October 31, | ||||||||||||||||||||||
| 2020 | 2019 | 2018 | 2017 | 2016 | ||||||||||||||||||
| Per Share Data | ||||||||||||||||||||||
Net asset value, beginning of year | $ | 31.13 | $ | 30.69 | $ | 30.03 | $ | 23.19 | $ | 22.88 | ||||||||||||
Net investment income(a) | 0.09 | 0.17 | 0.18 | 0.16 | 0.17 | |||||||||||||||||
Net realized and unrealized gain | 7.21 | 2.95 | 1.93 | 6.86 | 0.32 | |||||||||||||||||
Total from investment operations | 7.30 | 3.12 | 2.11 | 7.02 | 0.49 | |||||||||||||||||
Distributions to shareholders from net investment income | (0.19 | ) | (0.16 | ) | (0.16 | ) | (0.18 | ) | (0.18 | ) | ||||||||||||
Distributions to shareholders from net realized gains | (1.12 | ) | (2.52 | ) | (1.29 | ) | — | — | ||||||||||||||
Total distributions | (1.31 | ) | (2.68 | ) | (1.45 | ) | (0.18 | ) | (0.18 | ) | ||||||||||||
Net asset value, end of year | $ | 37.12 | $ | 31.13 | $ | 30.69 | $ | 30.03 | $ | 23.19 | ||||||||||||
| Total Return(b) | 24.17 | % | 11.56 | % | 7.23 | % | 30.43 | % | 2.18 | % | ||||||||||||
Net assets, end of year (in 000’s) | $ | 308,107 | $ | 401,677 | $ | 415,757 | $ | 365,836 | $ | 48,133 | ||||||||||||
Ratio of net expenses to average net assets | 0.67 | % | 0.68 | % | 0.67 | % | 0.70 | % | 0.71 | % | ||||||||||||
Ratio of total expenses to average net assets | 0.70 | % | 0.72 | % | 0.70 | % | 0.84 | % | 0.90 | % | ||||||||||||
Ratio of net investment income to average net assets | 0.26 | % | 0.58 | % | 0.56 | % | 0.59 | % | 0.74 | % | ||||||||||||
Portfolio turnover rate(c) | 218 | % | 192 | % | 188 | % | 196 | % | 254 | % | ||||||||||||
| (a) | Calculated based on the average shares outstanding methodology. |
| (b) | Assumes investment at the NAV at the beginning of the year, reinvestment of all dividends and distributions, a complete redemption of the investment at the NAV at the end of the year and no sales or redemption charges (if any). Total returns would be reduced if a sales or redemption charge was taken into account. Returns do not reflect the impact of taxes to shareholders relating to Fund distributions or the redemption of Fund shares. |
| (c) | The Fund’s portfolio turnover rate is calculated in accordance with regulatory requirements, without regard to transactions involving short term investments and certain derivatives. If such transactions were included, the Fund’s portfolio turnover rate may be higher. |
| 64 | The accompanying notes are an integral part of these financial statements. |
GOLDMAN SACHS LARGE CAP GROWTH INSIGHTS FUND
Financial Highlights (continued)
Selected Share Data for a Share Outstanding Throughout Each Year
| Goldman Sachs Large Cap Growth Insights Fund | ||||||||||||||||||||||
| Class R6 Shares | ||||||||||||||||||||||
| Year Ended October 31, | ||||||||||||||||||||||
| 2020 | 2019 | 2018 | 2017 | 2016 | ||||||||||||||||||
| Per Share Data | ||||||||||||||||||||||
Net asset value, beginning of year | $ | 32.75 | $ | 32.15 | $ | 31.38 | $ | 24.21 | $ | 23.86 | ||||||||||||
Net investment income(a) | 0.13 | 0.23 | 0.24 | 0.21 | 0.18 | |||||||||||||||||
Net realized and unrealized gain | 7.61 | 3.10 | 2.01 | 7.16 | 0.38 | |||||||||||||||||
Total from investment operations | 7.74 | 3.33 | 2.25 | 7.37 | 0.56 | |||||||||||||||||
Distributions to shareholders from net investment income | (0.23 | ) | (0.21 | ) | (0.19 | ) | (0.20 | ) | (0.21 | ) | ||||||||||||
Distributions to shareholders from net realized gains | (1.12 | ) | (2.52 | ) | (1.29 | ) | — | — | ||||||||||||||
Total distributions | (1.35 | ) | (2.73 | ) | (1.48 | ) | (0.20 | ) | (0.21 | ) | ||||||||||||
Net asset value, end of year | $ | 39.14 | $ | 32.75 | $ | 32.15 | $ | 31.38 | $ | 24.21 | ||||||||||||
| Total Return(b) | 24.36 | % | 11.72 | % | 7.37 | % | 30.64 | % | 2.38 | % | ||||||||||||
Net assets, end of year (in 000’s) | $ | 373,079 | $ | 313,461 | $ | 344,129 | $ | 133,877 | $ | 8,208 | ||||||||||||
Ratio of net expenses to average net assets | 0.53 | % | 0.53 | % | 0.52 | % | 0.54 | % | 0.54 | % | ||||||||||||
Ratio of total expenses to average net assets | 0.57 | % | 0.57 | % | 0.55 | % | 0.67 | % | 0.74 | % | ||||||||||||
Ratio of net investment income to average net assets | 0.36 | % | 0.75 | % | 0.71 | % | 0.74 | % | 0.72 | % | ||||||||||||
Portfolio turnover rate(c) | 218 | % | 192 | % | 188 | % | 196 | % | 254 | % | ||||||||||||
| (a) | Calculated based on the average shares outstanding methodology. |
| (b) | Assumes investment at the NAV at the beginning of the year, reinvestment of all dividends and distributions, a complete redemption of the investment at the NAV at the end of the year and no sales or redemption charges (if any). Total returns would be reduced if a sales or redemption charge was taken into account. Returns do not reflect the impact of taxes to shareholders relating to Fund distributions or the redemption of Fund shares. |
| (c) | The Fund’s portfolio turnover rate is calculated in accordance with regulatory requirements, without regard to transactions involving short term investments and certain derivatives. If such transactions were included, the Fund’s portfolio turnover rate may be higher. |
| The accompanying notes are an integral part of these financial statements. | 65 |
GOLDMAN SACHS LARGE CAP GROWTH INSIGHTS FUND
Financial Highlights (continued)
Selected Share Data for a Share Outstanding Throughout Each Year
| Goldman Sachs Large Cap Growth Insights Fund | ||||||||||||||||||||||
| Class R Shares | ||||||||||||||||||||||
| Year Ended October 31, | ||||||||||||||||||||||
| 2020 | 2019 | 2018 | 2017 | 2016 | ||||||||||||||||||
| Per Share Data | ||||||||||||||||||||||
Net asset value, beginning of year | $ | 30.73 | $ | 30.30 | $ | 29.67 | $ | 22.93 | $ | 22.71 | ||||||||||||
Net investment income (loss)(a) | (0.08 | ) | 0.02 | 0.02 | 0.04 | 0.05 | ||||||||||||||||
Net realized and unrealized gain | 7.12 | 2.93 | 1.92 | 6.78 | 0.32 | |||||||||||||||||
Total from investment operations | 7.04 | 2.95 | 1.94 | 6.82 | 0.37 | |||||||||||||||||
Distributions to shareholders from net investment income | (0.07 | ) | — | (0.02 | ) | (0.08 | ) | (0.15 | ) | |||||||||||||
Distributions to shareholders from net realized gains | (1.12 | ) | (2.52 | ) | (1.29 | ) | — | — | ||||||||||||||
Total distributions | (1.19 | ) | (2.52 | ) | (1.31 | ) | (0.08 | ) | (0.15 | ) | ||||||||||||
Net asset value, end of year | $ | 36.58 | $ | 30.73 | $ | 30.30 | $ | 29.67 | $ | 22.93 | ||||||||||||
| Total Return(b) | 23.55 | % | 10.98 | % | 6.69 | % | 29.81 | % | 1.66 | % | ||||||||||||
Net assets, end of year (in 000’s) | $ | 27,314 | $ | 34,397 | $ | 25,893 | $ | 29,734 | $ | 20,635 | ||||||||||||
Ratio of net expenses to average net assets | 1.17 | % | 1.18 | % | 1.17 | % | 1.20 | % | 1.21 | % | ||||||||||||
Ratio of total expenses to average net assets | 1.20 | % | 1.22 | % | 1.20 | % | 1.35 | % | 1.40 | % | ||||||||||||
Ratio of net investment income (loss) to average net assets | (0.25 | )% | 0.05 | % | 0.08 | % | 0.14 | % | 0.22 | % | ||||||||||||
Portfolio turnover rate(c) | 218 | % | 192 | % | 188 | % | 196 | % | 254 | % | ||||||||||||
| (a) | Calculated based on the average shares outstanding methodology. |
| (b) | Assumes investment at the NAV at the beginning of the year, reinvestment of all dividends and distributions, a complete redemption of the investment at the NAV at the end of the year and no sales or redemption charges (if any). Total returns would be reduced if a sales or redemption charge was taken into account. Returns do not reflect the impact of taxes to shareholders relating to Fund distributions or the redemption of Fund shares. |
| (c) | The Fund’s portfolio turnover rate is calculated in accordance with regulatory requirements, without regard to transactions involving short term investments and certain derivatives. If such transactions were included, the Fund’s portfolio turnover rate may be higher. |
| 66 | The accompanying notes are an integral part of these financial statements. |
GOLDMAN SACHS LARGE CAP GROWTH INSIGHTS FUND
Financial Highlights (continued)
Selected Share Data for a Share Outstanding Throughout Each Period
| Goldman Sachs Large Cap Growth Insights Fund | ||||||||||||||
| Class P Shares | ||||||||||||||
| Year Ended October 31, | Period Ended October 31, 2018(a) | |||||||||||||
| 2020 | 2019 | |||||||||||||
| Per Share Data | ||||||||||||||
Net asset value, beginning of period | $ | 32.74 | $ | 32.15 | $ | 32.07 | ||||||||
Net investment income(b) | 0.13 | 0.22 | 0.12 | |||||||||||
Net realized and unrealized gain (loss) | 7.61 | 3.10 | (0.04 | ) | ||||||||||
Total from investment operations | 7.74 | 3.32 | 0.08 | |||||||||||
Distributions to shareholders from net investment income | (0.24 | ) | (0.21 | ) | — | |||||||||
Distributions to shareholders from net realized gains | (1.12 | ) | (2.52 | ) | — | |||||||||
Total distributions | (1.36 | ) | (2.73 | ) | — | |||||||||
Net asset value, end of period | $ | 39.12 | $ | 32.74 | $ | 32.15 | ||||||||
| Total Return(c) | 24.34 | % | 11.71 | % | 0.25 | % | ||||||||
Net assets, end of period (in 000’s) | $ | 59,286 | $ | 49,099 | $ | 39,938 | ||||||||
Ratio of net expenses to average net assets | 0.53 | % | 0.53 | % | 0.52 | %(d) | ||||||||
Ratio of total expenses to average net assets | 0.57 | % | 0.57 | % | 0.56 | %(d) | ||||||||
Ratio of net investment income to average net assets | 0.36 | % | 0.71 | % | 0.66 | %(d) | ||||||||
Portfolio turnover rate(e) | 218 | % | 192 | % | 188 | % | ||||||||
| (a) | Commenced operations on April 16, 2018. |
| (b) | Calculated based on the average shares outstanding methodology. |
| (c) | Assumes investment at the NAV at the beginning of the period, reinvestment of all dividends and distributions, a complete redemption of the investment at the NAV at the end of the period and no sales or redemption charges (if any). Total returns would be reduced if a sales or redemption charge was taken into account. Returns do not reflect the impact of taxes to shareholders relating to Fund distributions or the redemption of Fund shares. Total returns for periods less than one full year are not annualized. |
| (d) | Annualized. |
| (e) | The Fund’s portfolio turnover rate is calculated in accordance with regulatory requirements, without regard to transactions involving short term investments and certain derivatives. If such transactions were included, the Fund’s portfolio turnover rate may be higher. |
| The accompanying notes are an integral part of these financial statements. | 67 |
GOLDMAN SACHS LARGE CAP VALUE INSIGHTS FUND
Financial Highlights (continued)
Selected Share Data for a Share Outstanding Throughout Each Year
| (a) | Calculated based on the average shares outstanding methodology. |
| (b) | Assumes investment at the NAV at the beginning of the year, reinvestment of all dividends and distributions, a complete redemption of the investment at the NAV at the end of the year and no sales or redemption charges (if any). Total returns would be reduced if a sales or redemption charge was taken into account. Returns do not reflect the impact of taxes to shareholders relating to Fund distributions or the redemption of Fund shares. |
| (c) | The Fund’s portfolio turnover rate is calculated in accordance with regulatory requirements, without regard to transactions involving short term investments and certain derivatives. If such transactions were included, the Fund’s portfolio turnover rate may be higher. |
| 68 | The accompanying notes are an integral part of these financial statements. |
GOLDMAN SACHS LARGE CAP VALUE INSIGHTS FUND
Financial Highlights (continued)
Selected Share Data for a Share Outstanding Throughout Each Year
| Goldman Sachs Large Cap Value Insights Fund | ||||||||||||||||||||||
| Class C Shares | ||||||||||||||||||||||
| Year Ended October 31, | ||||||||||||||||||||||
| 2020 | 2019 | 2018 | 2017 | 2016 | ||||||||||||||||||
| Per Share Data | ||||||||||||||||||||||
Net asset value, beginning of year | $ | 21.06 | $ | 21.39 | $ | 20.82 | $ | 17.12 | $ | 16.78 | ||||||||||||
Net investment income(a) | 0.10 | 0.12 | 0.08 | 0.11 | 0.10 | |||||||||||||||||
Net realized and unrealized gain (loss) | (2.01 | ) | 0.75 | 0.55 | 3.75 | 0.33 | ||||||||||||||||
Total from investment operations | (1.91 | ) | 0.87 | 0.63 | 3.86 | 0.43 | ||||||||||||||||
Distributions to shareholders from net investment income | (0.10 | ) | (0.14 | ) | (0.06 | ) | (0.16 | ) | (0.09 | ) | ||||||||||||
Distributions to shareholders from net realized gains | — | (1.06 | ) | — | — | — | ||||||||||||||||
Total distributions | (0.10 | ) | (1.20 | ) | (0.06 | ) | (0.16 | ) | (0.09 | ) | ||||||||||||
Net asset value, end of year | $ | 19.05 | $ | 21.06 | $ | 21.39 | $ | 20.82 | $ | 17.12 | ||||||||||||
| Total Return(b) | (9.02 | )% | 4.53 | % | 3.00 | % | 22.59 | % | 2.56 | % | ||||||||||||
Net assets, end of year (in 000’s) | $ | 8,773 | $ | 12,694 | $ | 10,058 | $ | 10,601 | $ | 13,437 | ||||||||||||
Ratio of net expenses to average net assets | 1.69 | % | 1.70 | % | 1.70 | % | 1.71 | % | 1.71 | % | ||||||||||||
Ratio of total expenses to average net assets | 1.80 | % | 1.82 | % | 1.78 | % | 1.85 | % | 1.90 | % | ||||||||||||
Ratio of net investment income to average net assets | 0.52 | % | 0.61 | % | 0.37 | % | 0.59 | % | 0.61 | % | ||||||||||||
Portfolio turnover rate(c) | 212 | % | 225 | % | 202 | % | 208 | % | 229 | % | ||||||||||||
| (a) | Calculated based on the average shares outstanding methodology. |
| (b) | Assumes investment at the NAV at the beginning of the year, reinvestment of all dividends and distributions, a complete redemption of the investment at the NAV at the end of the year and no sales or redemption charges (if any). Total returns would be reduced if a sales or redemption charge was taken into account. Returns do not reflect the impact of taxes to shareholders relating to Fund distributions or the redemption of Fund shares. |
| (c) | The Fund’s portfolio turnover rate is calculated in accordance with regulatory requirements, without regard to transactions involving short term investments and certain derivatives. If such transactions were included, the Fund’s portfolio turnover rate may be higher. |
| The accompanying notes are an integral part of these financial statements. | 69 |
GOLDMAN SACHS LARGE CAP VALUE INSIGHTS FUND
Financial Highlights (continued)
Selected Share Data for a Share Outstanding Throughout Each Year
| Goldman Sachs Large Cap Value Insights Fund | ||||||||||||||||||||||
| Institutional Shares | ||||||||||||||||||||||
| Year Ended October 31, | ||||||||||||||||||||||
| 2020 | 2019 | 2018 | 2017 | 2016 | ||||||||||||||||||
| Per Share Data | ||||||||||||||||||||||
Net asset value, beginning of year | $ | 21.24 | $ | 21.57 | $ | 20.99 | $ | 17.25 | $ | 16.91 | ||||||||||||
Net investment income(a) | 0.33 | 0.36 | 0.33 | 0.35 | 0.29 | |||||||||||||||||
Net realized and unrealized gain (loss) | (2.04 | ) | 0.74 | 0.56 | 3.77 | 0.32 | ||||||||||||||||
Total from investment operations | (1.71 | ) | 1.10 | 0.89 | 4.12 | 0.61 | ||||||||||||||||
Distributions to shareholders from net investment income | (0.33 | ) | (0.37 | ) | (0.31 | ) | (0.38 | ) | (0.27 | ) | ||||||||||||
Distributions to shareholders from net realized gains | — | (1.06 | ) | — | — | — | ||||||||||||||||
Total distributions | (0.33 | ) | (1.43 | ) | (0.31 | ) | (0.38 | ) | (0.27 | ) | ||||||||||||
Net asset value, end of year | $ | 19.20 | $ | 21.24 | $ | 21.57 | $ | 20.99 | $ | 17.25 | ||||||||||||
| Total Return(b) | (7.98 | )% | 5.68 | % | 4.22 | % | 24.02 | % | 3.69 | % | ||||||||||||
Net assets, end of year (in 000’s) | $ | 88,472 | $ | 120,417 | $ | 122,587 | $ | 261,684 | $ | 341,830 | ||||||||||||
Ratio of net expenses to average net assets | 0.56 | % | 0.57 | % | 0.56 | % | 0.56 | % | 0.56 | % | ||||||||||||
Ratio of total expenses to average net assets | 0.67 | % | 0.68 | % | 0.64 | % | 0.70 | % | 0.75 | % | ||||||||||||
Ratio of net investment income to average net assets | 1.64 | % | 1.74 | % | 1.52 | % | 1.78 | % | 1.73 | % | ||||||||||||
Portfolio turnover rate(c) | 212 | % | 225 | % | 202 | % | 208 | % | 229 | % | ||||||||||||
| (a) | Calculated based on the average shares outstanding methodology. |
| (b) | Assumes investment at the NAV at the beginning of the year, reinvestment of all dividends and distributions, a complete redemption of the investment at the NAV at the end of the year and no sales or redemption charges (if any). Total returns would be reduced if a sales or redemption charge was taken into account. Returns do not reflect the impact of taxes to shareholders relating to Fund distributions or the redemption of Fund shares. |
| (c) | The Fund’s portfolio turnover rate is calculated in accordance with regulatory requirements, without regard to transactions involving short term investments and certain derivatives. If such transactions were included, the Fund’s portfolio turnover rate may be higher. |
| 70 | The accompanying notes are an integral part of these financial statements. |
GOLDMAN SACHS LARGE CAP VALUE INSIGHTS FUND
Financial Highlights (continued)
Selected Share Data for a Share Outstanding Throughout Each Year
| Goldman Sachs Large Cap Value Insights Fund | ||||||||||||||||||||||
| Service Shares | ||||||||||||||||||||||
| Year Ended October 31, | ||||||||||||||||||||||
| 2020 | 2019 | 2018 | 2017 | 2016 | ||||||||||||||||||
| Per Share Data | ||||||||||||||||||||||
Net asset value, beginning of year | $ | 21.36 | $ | 21.67 | $ | 21.09 | $ | 17.34 | $ | 16.99 | ||||||||||||
Net investment income(a) | 0.23 | 0.27 | 0.22 | 0.25 | 0.21 | |||||||||||||||||
Net realized and unrealized gain (loss) | (2.04 | ) | 0.75 | 0.56 | 3.79 | 0.33 | ||||||||||||||||
Total from investment operations | (1.81 | ) | 1.02 | 0.78 | 4.04 | 0.54 | ||||||||||||||||
Distributions to shareholders from net investment income | (0.23 | ) | (0.27 | ) | (0.20 | ) | (0.29 | ) | (0.19 | ) | ||||||||||||
Distributions to shareholders from net realized gains | — | (1.06 | ) | — | — | — | ||||||||||||||||
Total distributions | (0.23 | ) | (1.33 | ) | (0.20 | ) | (0.29 | ) | (0.19 | ) | ||||||||||||
Net asset value, end of year | $ | 19.32 | $ | 21.36 | $ | 21.67 | $ | 21.09 | $ | 17.34 | ||||||||||||
| Total Return(b) | (8.44 | )% | 5.19 | % | 3.70 | % | 23.37 | % | 3.22 | % | ||||||||||||
Net assets, end of year (in 000’s) | $ | 5,230 | $ | 7,554 | $ | 10,199 | $ | 8,403 | $ | 6,014 | ||||||||||||
Ratio of net expenses to average net assets | 1.06 | % | 1.07 | % | 1.06 | % | 1.06 | % | 1.06 | % | ||||||||||||
Ratio of total expenses to average net assets | 1.17 | % | 1.18 | % | 1.14 | % | 1.20 | % | 1.24 | % | ||||||||||||
Ratio of net investment income to average net assets | 1.13 | % | 1.28 | % | 1.00 | % | 1.28 | % | 1.27 | % | ||||||||||||
Portfolio turnover rate(c) | 212 | % | 225 | % | 202 | % | 208 | % | 229 | % | ||||||||||||
| (a) | Calculated based on the average shares outstanding methodology. |
| (b) | Assumes investment at the NAV at the beginning of the year, reinvestment of all dividends and distributions, a complete redemption of the investment at the NAV at the end of the year and no sales or redemption charges (if any). Total returns would be reduced if a sales or redemption charge was taken into account. Returns do not reflect the impact of taxes to shareholders relating to Fund distributions or the redemption of Fund shares. |
| (c) | The Fund’s portfolio turnover rate is calculated in accordance with regulatory requirements, without regard to transactions involving short term investments and certain derivatives. If such transactions were included, the Fund’s portfolio turnover rate may be higher. |
| The accompanying notes are an integral part of these financial statements. | 71 |
GOLDMAN SACHS LARGE CAP VALUE INSIGHTS FUND
Financial Highlights (continued)
Selected Share Data for a Share Outstanding Throughout Each Year
| Goldman Sachs Large Cap Value Insights Fund | ||||||||||||||||||||||
| Investor Shares | ||||||||||||||||||||||
| Year Ended October 31, | ||||||||||||||||||||||
| 2020 | 2019 | 2018 | 2017 | 2016 | ||||||||||||||||||
| Per Share Data | ||||||||||||||||||||||
Net asset value, beginning of year | $ | 21.18 | $ | 21.51 | $ | 20.94 | $ | 17.22 | $ | 16.88 | ||||||||||||
Net investment income(a) | 0.31 | 0.32 | 0.29 | 0.34 | 0.26 | |||||||||||||||||
Net realized and unrealized gain (loss) | (2.03 | ) | 0.76 | 0.57 | 3.74 | 0.33 | ||||||||||||||||
Total from investment operations | (1.72 | ) | 1.08 | 0.86 | 4.08 | 0.59 | ||||||||||||||||
Distributions to shareholders from net investment income | (0.31 | ) | (0.35 | ) | (0.29 | ) | (0.36 | ) | (0.25 | ) | ||||||||||||
Distributions to shareholders from net realized gains | — | (1.06 | ) | — | — | — | ||||||||||||||||
Total distributions | (0.31 | ) | (1.41 | ) | (0.29 | ) | (0.36 | ) | (0.25 | ) | ||||||||||||
Net asset value, end of year | $ | 19.15 | $ | 21.18 | $ | 21.51 | $ | 20.94 | $ | 17.22 | ||||||||||||
| Total Return(b) | (8.09 | )% | 5.55 | % | 4.07 | % | 23.79 | % | 3.57 | % | ||||||||||||
Net assets, end of year (in 000’s) | $ | 70,302 | $ | 134,069 | $ | 84,895 | $ | 29,871 | $ | 9,947 | ||||||||||||
Ratio of net expenses to average net assets | 0.69 | % | 0.70 | % | 0.70 | % | 0.71 | % | 0.71 | % | ||||||||||||
Ratio of total expenses to average net assets | 0.80 | % | 0.82 | % | 0.78 | % | 0.84 | % | 0.90 | % | ||||||||||||
Ratio of net investment income to average net assets | 1.54 | % | 1.58 | % | 1.33 | % | 1.70 | % | 1.56 | % | ||||||||||||
Portfolio turnover rate(c) | 212 | % | 225 | % | 202 | % | 208 | % | 229 | % | ||||||||||||
| (a) | Calculated based on the average shares outstanding methodology. |
| (b) | Assumes investment at the NAV at the beginning of the year, reinvestment of all dividends and distributions, a complete redemption of the investment at the NAV at the end of the year and no sales or redemption charges (if any). Total returns would be reduced if a sales or redemption charge was taken into account. Returns do not reflect the impact of taxes to shareholders relating to Fund distributions or the redemption of Fund shares. |
| (c) | The Fund’s portfolio turnover rate is calculated in accordance with regulatory requirements, without regard to transactions involving short term investments and certain derivatives. If such transactions were included, the Fund’s portfolio turnover rate may be higher. |
| 72 | The accompanying notes are an integral part of these financial statements. |
GOLDMAN SACHS LARGE CAP VALUE INSIGHTS FUND
Financial Highlights (continued)
Selected Share Data for a Share Outstanding Throughout Each Year
| Goldman Sachs Large Cap Value Insights Fund | ||||||||||||||||||||||
| Class R6 Shares | ||||||||||||||||||||||
| Year Ended October 31, | ||||||||||||||||||||||
| 2020 | 2019 | 2018 | 2017 | 2016 | ||||||||||||||||||
| Per Share Data | ||||||||||||||||||||||
Net asset value, beginning of year | $ | 21.24 | $ | 21.56 | $ | 20.99 | $ | 17.25 | $ | 16.90 | ||||||||||||
Net investment income(a) | 0.32 | 0.40 | 0.33 | 0.36 | 0.29 | |||||||||||||||||
Net realized and unrealized gain (loss) | (2.02 | ) | 0.72 | 0.55 | 3.77 | 0.34 | ||||||||||||||||
Total from investment operations | (1.70 | ) | 1.12 | 0.88 | 4.13 | 0.63 | ||||||||||||||||
Distributions to shareholders from net investment income | (0.34 | ) | (0.38 | ) | (0.31 | ) | (0.39 | ) | (0.28 | ) | ||||||||||||
Distributions to shareholders from net realized gains | — | (1.06 | ) | — | — | — | ||||||||||||||||
Total distributions | (0.34 | ) | (1.44 | ) | (0.31 | ) | (0.39 | ) | (0.28 | ) | ||||||||||||
Net asset value, end of year | $ | 19.20 | $ | 21.24 | $ | 21.56 | $ | 20.99 | $ | 17.25 | ||||||||||||
| Total Return(b) | (7.97 | )% | 5.73 | % | 4.19 | % | 24.05 | % | 3.76 | % | ||||||||||||
Net assets, end of year (in 000’s) | $ | 65,692 | $ | 73,981 | $ | 149,225 | $ | 75 | $ | 10 | ||||||||||||
Ratio of net expenses to average net assets | 0.55 | % | 0.55 | % | 0.55 | % | 0.55 | % | 0.54 | % | ||||||||||||
Ratio of total expenses to average net assets | 0.66 | % | 0.66 | % | 0.62 | % | 0.67 | % | 0.74 | % | ||||||||||||
Ratio of net investment income to average net assets | 1.63 | % | 1.84 | % | 1.47 | % | 1.81 | % | 1.77 | % | ||||||||||||
Portfolio turnover rate(c) | 212 | % | 225 | % | 202 | % | 208 | % | 229 | % | ||||||||||||
| (a) | Calculated based on the average shares outstanding methodology. |
| (b) | Assumes investment at the NAV at the beginning of the year, reinvestment of all dividends and distributions, a complete redemption of the investment at the NAV at the end of the year and no sales or redemption charges (if any). Total returns would be reduced if a sales or redemption charge was taken into account. Returns do not reflect the impact of taxes to shareholders relating to Fund distributions or the redemption of Fund shares. |
| (c) | The Fund’s portfolio turnover rate is calculated in accordance with regulatory requirements, without regard to transactions involving short term investments and certain derivatives. If such transactions were included, the Fund’s portfolio turnover rate may be higher. |
| The accompanying notes are an integral part of these financial statements. | 73 |
GOLDMAN SACHS LARGE CAP VALUE INSIGHTS FUND
Financial Highlights (continued)
Selected Share Data for a Share Outstanding Throughout Each Year
| Goldman Sachs Large Cap Value Insights Fund | ||||||||||||||||||||||
| Class R Shares | ||||||||||||||||||||||
| Year Ended October 31, | ||||||||||||||||||||||
| 2020 | 2019 | 2018 | 2017 | 2016 | ||||||||||||||||||
| Per Share Data | ||||||||||||||||||||||
Net asset value, beginning of year | $ | 21.12 | $ | 21.45 | $ | 20.88 | $ | 17.18 | $ | 16.84 | ||||||||||||
Net investment income(a) | 0.19 | 0.23 | 0.19 | 0.24 | 0.18 | |||||||||||||||||
Net realized and unrealized gain (loss) | (2.01 | ) | 0.74 | 0.56 | 3.73 | 0.33 | ||||||||||||||||
Total from investment operations | (1.82 | ) | 0.97 | 0.75 | 3.97 | 0.51 | ||||||||||||||||
Distributions to shareholders from net investment income | (0.21 | ) | (0.24 | ) | (0.18 | ) | (0.27 | ) | (0.17 | ) | ||||||||||||
Distributions to shareholders from net realized gains | — | (1.06 | ) | — | — | — | ||||||||||||||||
Total distributions | (0.21 | ) | (1.30 | ) | (0.18 | ) | (0.27 | ) | (0.17 | ) | ||||||||||||
Net asset value, end of year | $ | 19.09 | $ | 21.12 | $ | 21.45 | $ | 20.88 | $ | 17.18 | ||||||||||||
| Total Return(b) | (8.58 | )% | 5.01 | % | 3.56 | % | 23.19 | % | 3.08 | % | ||||||||||||
Net assets, end of year (in 000’s) | $ | 4,885 | $ | 5,189 | $ | 5,651 | $ | 5,240 | $ | 1,877 | ||||||||||||
Ratio of net expenses to average net assets | 1.19 | % | 1.20 | % | 1.20 | % | 1.21 | % | 1.21 | % | ||||||||||||
Ratio of total expenses to average net assets | 1.30 | % | 1.32 | % | 1.28 | % | 1.34 | % | 1.40 | % | ||||||||||||
Ratio of net investment income to average net assets | 0.99 | % | 1.12 | % | 0.88 | % | 1.22 | % | 1.07 | % | ||||||||||||
Portfolio turnover rate(c) | 212 | % | 225 | % | 202 | % | 208 | % | 229 | % | ||||||||||||
| (a) | Calculated based on the average shares outstanding methodology. |
| (b) | Assumes investment at the NAV at the beginning of the year, reinvestment of all dividends and distributions, a complete redemption of the investment at the NAV at the end of the year and no sales or redemption charges (if any). Total returns would be reduced if a sales or redemption charge was taken into account. Returns do not reflect the impact of taxes to shareholders relating to Fund distributions or the redemption of Fund shares. |
| (c) | The Fund’s portfolio turnover rate is calculated in accordance with regulatory requirements, without regard to transactions involving short term investments and certain derivatives. If such transactions were included, the Fund’s portfolio turnover rate may be higher. |
| 74 | The accompanying notes are an integral part of these financial statements. |
GOLDMAN SACHS LARGE CAP VALUE INSIGHTS FUND
Financial Highlights (continued)
Selected Share Data for a Share Outstanding Throughout Each Period
| Goldman Sachs Large Cap Value Insights Fund | ||||||||||||||
| Class P Shares | ||||||||||||||
| Year Ended October 31, | Period Ended October 31, 2018(a) | |||||||||||||
| 2020 | 2019 | |||||||||||||
| Per Share Data | ||||||||||||||
Net asset value, beginning of period | $ | 21.23 | $ | 21.55 | $ | 21.87 | ||||||||
Net investment income(b) | 0.32 | 0.36 | 0.17 | |||||||||||
Net realized and unrealized gain (loss) | (2.02 | ) | 0.76 | (0.33 | ) | |||||||||
Total from investment operations | (1.70 | ) | 1.12 | (0.16 | ) | |||||||||
Distributions to shareholders from net investment income | (0.34 | ) | (0.38 | ) | (0.16 | ) | ||||||||
Distributions to shareholders from net realized gains | — | (1.06 | ) | — | ||||||||||
Total distributions | (0.34 | ) | (1.44 | ) | (0.16 | ) | ||||||||
Net asset value, end of period | $ | 19.19 | $ | 21.23 | $ | 21.55 | ||||||||
| Total Return(c) | (7.97 | )% | 5.74 | % | (0.77 | )% | ||||||||
Net assets, end of period (in 000’s) | $ | 30,086 | $ | 33,601 | $ | 27,967 | ||||||||
Ratio of net expenses to average net assets | 0.55 | % | 0.56 | % | 0.55 | %(d) | ||||||||
Ratio of total expenses to average net assets | 0.66 | % | 0.67 | % | 0.65 | %(d) | ||||||||
Ratio of net investment income to average net assets | 1.63 | % | 1.75 | % | 1.38 | %(d) | ||||||||
Portfolio turnover rate(e) | 212 | % | 225 | % | 202 | % | ||||||||
| (a) | Commenced operations on April 16, 2018. |
| (b) | Calculated based on the average shares outstanding methodology. |
| (c) | Assumes investment at the NAV at the beginning of the period, reinvestment of all dividends and distributions, a complete redemption of the investment at the NAV at the end of the period and no sales or redemption charges (if any). Total returns would be reduced if a sales or redemption charge was taken into account. Returns do not reflect the impact of taxes to shareholders relating to Fund distributions or the redemption of Fund shares. Total returns for periods less than one full year are not annualized. |
| (d) | Annualized. |
| (e) | The Fund’s portfolio turnover rate is calculated in accordance with regulatory requirements, without regard to transactions involving short term investments and certain derivatives. If such transactions were included, the Fund’s portfolio turnover rate may be higher. |
| The accompanying notes are an integral part of these financial statements. | 75 |
GOLDMAN SACHS SMALL CAP EQUITY INSIGHTS FUND
Financial Highlights (continued)
Selected Share Data for a Share Outstanding Throughout Each Year
| (a) | Calculated based on the average shares outstanding methodology. |
| (b) | Reflects income recognized from special dividends which amounted to $0.04 per share and 0.15% of average net assets. |
| (c) | Assumes investment at the NAV at the beginning of the year, reinvestment of all dividends and distributions, a complete redemption of the investment at the NAV at the end of the year and no sales or redemption charges (if any). Total returns would be reduced if a sales or redemption charge was taken into account. Returns do not reflect the impact of taxes to shareholders relating to Fund distributions or the redemption of Fund shares. |
| (d) | The Fund’s portfolio turnover rate is calculated in accordance with regulatory requirements, without regard to transactions involving short term investments and certain derivatives. If such transactions were included, the Fund’s portfolio turnover rate may be higher. |
| 76 | The accompanying notes are an integral part of these financial statements. |
GOLDMAN SACHS SMALL CAP EQUITY INSIGHTS FUND
Financial Highlights (continued)
Selected Share Data for a Share Outstanding Throughout Each Year
| Goldman Sachs Small Cap Equity Insights Fund | ||||||||||||||||||||||
| Class C Shares | ||||||||||||||||||||||
| Year Ended October 31, | ||||||||||||||||||||||
| 2020 | 2019 | 2018 | 2017 | 2016 | ||||||||||||||||||
| Per Share Data | ||||||||||||||||||||||
Net asset value, beginning of year | $ | 21.75 | $ | 22.23 | $ | 21.56 | $ | 17.25 | $ | 16.81 | ||||||||||||
Net investment loss(a) | (0.15 | ) | (0.12 | ) | (0.17 | )(b) | (0.11 | ) | (0.05 | ) | ||||||||||||
Net realized and unrealized gain (loss) | (2.21 | ) | 1.04 | 0.84 | 4.42 | 0.49 | ||||||||||||||||
Total from investment operations | (2.36 | ) | 0.92 | 0.67 | 4.31 | 0.44 | ||||||||||||||||
Distributions to shareholders from net realized gains | — | (1.40 | ) | — | — | — | ||||||||||||||||
Net asset value, end of year | $ | 19.39 | $ | 21.75 | $ | 22.23 | $ | 21.56 | $ | 17.25 | ||||||||||||
| Total Return(c) | (10.82 | )% | 4.86 | % | 3.16 | % | 24.93 | % | 2.61 | % | ||||||||||||
Net assets, end of year (in 000’s) | $ | 5,951 | $ | 7,785 | $ | 7,139 | $ | 9,439 | $ | 12,133 | ||||||||||||
Ratio of net expenses to average net assets | 1.97 | % | 1.98 | % | 1.98 | % | 1.99 | % | 2.00 | % | ||||||||||||
Ratio of total expenses to average net assets | 2.05 | % | 2.09 | % | 2.06 | % | 2.18 | % | 2.24 | % | ||||||||||||
Ratio of net investment loss to average net assets | (0.78 | )% | (0.57 | )% | (0.72 | )%(b) | (0.56 | )% | (0.32 | )% | ||||||||||||
Portfolio turnover rate(d) | 141 | % | 140 | % | 111 | % | 137 | % | 144 | % | ||||||||||||
| (a) | Calculated based on the average shares outstanding methodology. |
| (b) | Reflects income recognized from special dividends which amounted to $0.04 per share and 0.15% of average net assets. |
| (c) | Assumes investment at the NAV at the beginning of the year, reinvestment of all dividends and distributions, a complete redemption of the investment at the NAV at the end of the year and no sales or redemption charges (if any). Total returns would be reduced if a sales or redemption charge was taken into account. Returns do not reflect the impact of taxes to shareholders relating to Fund distributions or the redemption of Fund shares. |
| (d) | The Fund’s portfolio turnover rate is calculated in accordance with regulatory requirements, without regard to transactions involving short term investments and certain derivatives. If such transactions were included, the Fund’s portfolio turnover rate may be higher. |
| The accompanying notes are an integral part of these financial statements. | 77 |
GOLDMAN SACHS SMALL CAP EQUITY INSIGHTS FUND
Financial Highlights (continued)
Selected Share Data for a Share Outstanding Throughout Each Year
| Goldman Sachs Small Cap Equity Insights Fund | ||||||||||||||||||||||
| Institutional Shares | ||||||||||||||||||||||
| Year Ended October 31, | ||||||||||||||||||||||
| 2020 | 2019 | 2018 | 2017 | 2016 | ||||||||||||||||||
| Per Share Data | ||||||||||||||||||||||
Net asset value, beginning of year | $ | 26.74 | $ | 26.77 | $ | 25.73 | $ | 20.47 | $ | 19.84 | ||||||||||||
Net investment income(a) | 0.08 | 0.14 | 0.12 | (b) | 0.13 | 0.17 | ||||||||||||||||
Net realized and unrealized gain (loss) | (2.69 | ) | 1.29 | 0.99 | 5.27 | 0.57 | ||||||||||||||||
Total from investment operations | (2.61 | ) | 1.43 | 1.11 | 5.40 | 0.74 | ||||||||||||||||
Distributions to shareholders from net investment income | (0.15 | ) | (0.06 | ) | (0.07 | ) | (0.14 | ) | (0.11 | ) | ||||||||||||
Distributions to shareholders from net realized gains | — | (1.40 | ) | — | — | — | ||||||||||||||||
Total distributions | (0.15 | ) | (1.46 | ) | (0.07 | ) | (0.14 | ) | (0.11 | ) | ||||||||||||
Net asset value, end of year | $ | 23.98 | $ | 26.74 | $ | 26.77 | $ | 25.73 | $ | 20.47 | ||||||||||||
| Total Return(c) | (9.82 | )% | 6.03 | % | 4.32 | % | 26.44 | % | 3.77 | % | ||||||||||||
Net assets, end of year (in 000’s) | $ | 216,274 | $ | 290,652 | $ | 212,229 | $ | 231,226 | $ | 176,644 | ||||||||||||
Ratio of net expenses to average net assets | 0.84 | % | 0.85 | % | 0.84 | % | 0.84 | % | 0.85 | % | ||||||||||||
Ratio of total expenses to average net assets | 0.92 | % | 0.96 | % | 0.93 | % | 1.03 | % | 1.08 | % | ||||||||||||
Ratio of net investment income to average net assets | 0.34 | % | 0.54 | % | 0.43 | %(b) | 0.56 | % | 0.84 | % | ||||||||||||
Portfolio turnover rate(d) | 141 | % | 140 | % | 111 | % | 137 | % | 144 | % | ||||||||||||
| (a) | Calculated based on the average shares outstanding methodology. |
| (b) | Reflects income recognized from special dividends which amounted to $0.04 per share and 0.15% of average net assets. |
| (c) | Assumes investment at the NAV at the beginning of the year, reinvestment of all dividends and distributions, a complete redemption of the investment at the NAV at the end of the year and no sales or redemption charges (if any). Total returns would be reduced if a sales or redemption charge was taken into account. Returns do not reflect the impact of taxes to shareholders relating to Fund distributions or the redemption of Fund shares. |
| (d) | The Fund’s portfolio turnover rate is calculated in accordance with regulatory requirements, without regard to transactions involving short term investments and certain derivatives. If such transactions were included, the Fund’s portfolio turnover rate may be higher. |
| 78 | The accompanying notes are an integral part of these financial statements. |
GOLDMAN SACHS SMALL CAP EQUITY INSIGHTS FUND
Financial Highlights (continued)
Selected Share Data for a Share Outstanding Throughout Each Year
| Goldman Sachs Small Cap Equity Insights Fund | ||||||||||||||||||||||
| Service Shares | ||||||||||||||||||||||
| Year Ended October 31, | ||||||||||||||||||||||
| 2020 | 2019 | 2018 | 2017 | 2016 | ||||||||||||||||||
| Per Share Data | ||||||||||||||||||||||
Net asset value, beginning of year | $ | 25.17 | $ | 25.34 | $ | 24.41 | $ | 19.44 | $ | 18.82 | ||||||||||||
Net investment income (loss)(a) | (0.03 | ) | 0.01 | (0.02 | )(b) | 0.01 | 0.06 | |||||||||||||||
Net realized and unrealized gain (loss) | (2.56 | ) | 1.22 | 0.95 | 5.00 | 0.56 | ||||||||||||||||
Total from investment operations | (2.59 | ) | 1.23 | 0.93 | 5.01 | 0.62 | ||||||||||||||||
Distributions to shareholders from net investment income | (0.03 | ) | — | — | (0.04 | ) | — | |||||||||||||||
Distributions to shareholders from net realized gains | — | (1.40 | ) | — | — | — | ||||||||||||||||
Total distributions | (0.03 | ) | (1.40 | ) | — | (0.04 | ) | — | ||||||||||||||
Net asset value, end of year | $ | 22.55 | $ | 25.17 | $ | 25.34 | $ | 24.41 | $ | 19.44 | ||||||||||||
| Total Return(c) | (10.29 | )% | 5.52 | % | 3.81 | % | 25.77 | % | 3.29 | % | ||||||||||||
Net assets, end of year (in 000’s) | $ | 2,867 | $ | 3,141 | $ | 2,031 | $ | 769 | $ | 651 | ||||||||||||
Ratio of net expenses to average net assets | 1.34 | % | 1.35 | % | 1.34 | % | 1.34 | % | 1.35 | % | ||||||||||||
Ratio of total expenses to average net assets | 1.42 | % | 1.45 | % | 1.42 | % | 1.53 | % | 1.59 | % | ||||||||||||
Ratio of net investment income (loss) to average net assets | (0.15 | )% | 0.04 | % | (0.06 | )%(b) | 0.06 | % | 0.31 | % | ||||||||||||
Portfolio turnover rate(d) | 141 | % | 140 | % | 111 | % | 137 | % | 144 | % | ||||||||||||
| (a) | Calculated based on the average shares outstanding methodology. |
| (b) | Reflects income recognized from special dividends which amounted to $0.04 per share and 0.15% of average net assets. |
| (c) | Assumes investment at the NAV at the beginning of the year, reinvestment of all dividends and distributions, a complete redemption of the investment at the NAV at the end of the year and no sales or redemption charges (if any). Total returns would be reduced if a sales or redemption charge was taken into account. Returns do not reflect the impact of taxes to shareholders relating to Fund distributions or the redemption of Fund shares. |
| (d) | The Fund’s portfolio turnover rate is calculated in accordance with regulatory requirements, without regard to transactions involving short term investments and certain derivatives. If such transactions were included, the Fund’s portfolio turnover rate may be higher. |
| The accompanying notes are an integral part of these financial statements. | 79 |
GOLDMAN SACHS SMALL CAP EQUITY INSIGHTS FUND
Financial Highlights (continued)
Selected Share Data for a Share Outstanding Throughout Each Year
| Goldman Sachs Small Cap Equity Insights Fund | ||||||||||||||||||||||
| Investor Shares | ||||||||||||||||||||||
| Year Ended October 31, | ||||||||||||||||||||||
| 2020 | 2019 | 2018 | 2017 | 2016 | ||||||||||||||||||
| Per Share Data | ||||||||||||||||||||||
Net asset value, beginning of year | $ | 25.50 | $ | 25.62 | $ | 24.61 | $ | 19.61 | $ | 19.02 | ||||||||||||
Net investment income(a) | 0.05 | 0.09 | 0.08 | (b) | 0.14 | 0.09 | ||||||||||||||||
Net realized and unrealized gain (loss) | (2.58 | ) | 1.24 | 0.95 | 4.99 | 0.59 | ||||||||||||||||
Total from investment operations | (2.53 | ) | 1.33 | 1.03 | 5.13 | 0.68 | ||||||||||||||||
Distributions to shareholders from net investment income | (0.12 | ) | (0.05 | ) | (0.02 | ) | (0.13 | ) | (0.09 | ) | ||||||||||||
Distributions to shareholders from net realized gains | — | (1.40 | ) | — | — | — | ||||||||||||||||
Total distributions | (0.12 | ) | (1.45 | ) | (0.02 | ) | (0.13 | ) | (0.09 | ) | ||||||||||||
Net asset value, end of year | $ | 22.85 | $ | 25.50 | $ | 25.62 | $ | 24.61 | $ | 19.61 | ||||||||||||
| Total Return(c) | (9.95 | )% | 5.90 | % | 4.19 | % | 26.22 | % | 3.63 | % | ||||||||||||
Net assets, end of year (in 000’s) | $ | 64,724 | $ | 74,881 | $ | 44,984 | $ | 2,684 | $ | 7,462 | ||||||||||||
Ratio of net expenses to average net assets | 0.97 | % | 0.99 | % | 0.98 | % | 0.99 | % | 0.99 | % | ||||||||||||
Ratio of total expenses to average net assets | 1.05 | % | 1.09 | % | 1.06 | % | 1.17 | % | 1.22 | % | ||||||||||||
Ratio of net investment income to average net assets | 0.22 | % | 0.40 | % | 0.31 | %(b) | 0.60 | % | 0.45 | % | ||||||||||||
Portfolio turnover rate(d) | 141 | % | 140 | % | 111 | % | 137 | % | 144 | % | ||||||||||||
| (a) | Calculated based on the average shares outstanding methodology. |
| (b) | Reflects income recognized from special dividends which amounted to $0.04 per share and 0.15% of average net assets. |
| (c) | Assumes investment at the NAV at the beginning of the year, reinvestment of all dividends and distributions, a complete redemption of the investment at the NAV at the end of the year and no sales or redemption charges (if any). Total returns would be reduced if a sales or redemption charge was taken into account. Returns do not reflect the impact of taxes to shareholders relating to Fund distributions or the redemption of Fund shares. |
| (d) | The Fund’s portfolio turnover rate is calculated in accordance with regulatory requirements, without regard to transactions involving short term investments and certain derivatives. If such transactions were included, the Fund’s portfolio turnover rate may be higher. |
| 80 | The accompanying notes are an integral part of these financial statements. |
GOLDMAN SACHS SMALL CAP EQUITY INSIGHTS FUND
Financial Highlights (continued)
Selected Share Data for a Share Outstanding Throughout Each Year
| Goldman Sachs Small Cap Equity Insights Fund | ||||||||||||||||||||||
| Class R6 Shares | ||||||||||||||||||||||
| Year Ended October 31, | ||||||||||||||||||||||
| 2020 | 2019 | 2018 | 2017 | 2016 | ||||||||||||||||||
| Per Share Data | ||||||||||||||||||||||
Net asset value, beginning of year | $ | 26.74 | $ | 26.77 | $ | 25.73 | $ | 20.47 | $ | 19.84 | ||||||||||||
Net investment income(a) | 0.09 | 0.16 | 0.13 | (b) | 0.11 | 0.17 | ||||||||||||||||
Net realized and unrealized gain (loss) | (2.70 | ) | 1.27 | 0.99 | 5.29 | 0.58 | ||||||||||||||||
Total from investment operations | (2.61 | ) | 1.43 | 1.12 | 5.40 | 0.75 | ||||||||||||||||
Distributions to shareholders from net investment income | (0.15 | ) | (0.06 | ) | (0.08 | ) | (0.14 | ) | (0.12 | ) | ||||||||||||
Distributions to shareholders from net realized gains | — | (1.40 | ) | — | — | — | ||||||||||||||||
Total distributions | (0.15 | ) | (1.46 | ) | (0.08 | ) | (0.14 | ) | (0.12 | ) | ||||||||||||
Net asset value, end of year | $ | 23.98 | $ | 26.74 | $ | 26.77 | $ | 25.73 | $ | 20.47 | ||||||||||||
| Total Return(c) | (9.81 | )% | 6.05 | % | 4.35 | % | 26.45 | % | 3.81 | % | ||||||||||||
Net assets, end of year (in 000’s) | $ | 119,496 | $ | 153,129 | $ | 173,112 | $ | 337 | $ | 35 | ||||||||||||
Ratio of net expenses to average net assets | 0.83 | % | 0.84 | % | 0.83 | % | 0.83 | % | 0.83 | % | ||||||||||||
Ratio of total expenses to average net assets | 0.91 | % | 0.94 | % | 0.89 | % | 1.02 | % | 1.06 | % | ||||||||||||
Ratio of net investment income to average net assets | 0.36 | % | 0.63 | % | 0.45 | %(b) | 0.47 | % | 0.85 | % | ||||||||||||
Portfolio turnover rate(d) | 141 | % | 140 | % | 111 | % | 137 | % | 144 | % | ||||||||||||
| (a) | Calculated based on the average shares outstanding methodology. |
| (b) | Reflects income recognized from special dividends which amounted to $0.04 per share and 0.15% of average net assets. |
| (c) | Assumes investment at the NAV at the beginning of the year, reinvestment of all dividends and distributions, a complete redemption of the investment at the NAV at the end of the year and no sales or redemption charges (if any). Total returns would be reduced if a sales or redemption charge was taken into account. Returns do not reflect the impact of taxes to shareholders relating to Fund distributions or the redemption of Fund shares. |
| (d) | The Fund’s portfolio turnover rate is calculated in accordance with regulatory requirements, without regard to transactions involving short term investments and certain derivatives. If such transactions were included, the Fund’s portfolio turnover rate may be higher. |
| The accompanying notes are an integral part of these financial statements. | 81 |
GOLDMAN SACHS SMALL CAP EQUITY INSIGHTS FUND
Financial Highlights (continued)
Selected Share Data for a Share Outstanding Throughout Each Year
| Goldman Sachs Small Cap Equity Insights Fund | ||||||||||||||||||||||
| Class R Shares | ||||||||||||||||||||||
| Year Ended October 31, | ||||||||||||||||||||||
| 2020 | 2019 | 2018 | 2017 | 2016 | ||||||||||||||||||
| Per Share Data | ||||||||||||||||||||||
Net asset value, beginning of year | $ | 24.96 | $ | 25.18 | $ | 24.29 | $ | 19.36 | $ | 18.78 | ||||||||||||
Net investment income (loss)(a) | (0.06 | ) | (0.02 | ) | (0.06 | )(c) | (0.02 | ) | 0.03 | |||||||||||||
Net realized and unrealized gain (loss) | (2.54 | ) | 1.20 | 0.95 | 4.98 | 0.55 | ||||||||||||||||
Total from investment operations | (2.60 | ) | 1.18 | 0.89 | 4.96 | 0.58 | ||||||||||||||||
Distributions to shareholders from net investment income | — | — | — | (0.03 | ) | — | (b) | |||||||||||||||
Distributions to shareholders from net realized gains | — | (1.40 | ) | — | — | — | ||||||||||||||||
Total distributions | — | (1.40 | ) | — | (0.03 | ) | — | |||||||||||||||
Net asset value, end of year | $ | 22.36 | $ | 24.96 | $ | 25.18 | $ | 24.29 | $ | 19.36 | ||||||||||||
| Total Return(d) | (10.39 | )% | 5.35 | % | 3.66 | % | 25.60 | % | 3.11 | % | ||||||||||||
Net assets, end of year (in 000’s) | $ | 13,817 | $ | 16,562 | $ | 14,625 | $ | 15,284 | $ | 9,954 | ||||||||||||
Ratio of net expenses to average net assets | 1.47 | % | 1.48 | % | 1.48 | % | 1.49 | % | 1.50 | % | ||||||||||||
Ratio of total expenses to average net assets | 1.55 | % | 1.59 | % | 1.56 | % | 1.68 | % | 1.74 | % | ||||||||||||
Ratio of net investment income (loss) to average net assets | (0.28 | )% | (0.08 | )% | (0.22 | )%(c) | (0.10 | )% | 0.18 | % | ||||||||||||
Portfolio turnover rate(f) | 141 | % | 140 | % | 111 | % | 137 | % | 144 | % | ||||||||||||
| (a) | Calculated based on the average shares outstanding methodology. |
| (b) | Amount is less than $0.005 per share. |
| (c) | Reflects income recognized from special dividends which amounted to $0.04 per share and 0.15% of average net assets. |
| (d) | Assumes investment at the NAV at the beginning of the year, reinvestment of all dividends and distributions, a complete redemption of the investment at the NAV at the end of the year and no sales or redemption charges (if any). Total returns would be reduced if a sales or redemption charge was taken into account. Returns do not reflect the impact of taxes to shareholders relating to Fund distributions or the redemption of Fund shares. |
| (e) | Amount is less than 0.005% per share. |
| (f) | The Fund’s portfolio turnover rate is calculated in accordance with regulatory requirements, without regard to transactions involving short term investments and certain derivatives. If such transactions were included, the Fund’s portfolio turnover rate may be higher. |
| 82 | The accompanying notes are an integral part of these financial statements. |
GOLDMAN SACHS SMALL CAP EQUITY INSIGHTS FUND
Financial Highlights (continued)
Selected Share Data for a Share Outstanding Throughout Each Period
| Goldman Sachs Small Cap Equity Insights Fund | ||||||||||||||
| Class P Shares | ||||||||||||||
| Year Ended October 31, | Period Ended October 31, 2018(a) | |||||||||||||
| 2020 | 2019 | |||||||||||||
| Per Share Data | ||||||||||||||
Net asset value, beginning of period | $ | 26.74 | $ | 26.77 | $ | 27.21 | ||||||||
Net investment income(b) | 0.09 | 0.13 | 0.08 | (c) | ||||||||||
Net realized and unrealized gain (loss) | (2.70 | ) | 1.30 | (0.52 | ) | |||||||||
Total from investment operations | (2.61 | ) | 1.43 | (0.44 | ) | |||||||||
Distributions to shareholders from net investment income | (0.15 | ) | (0.06 | ) | — | |||||||||
Distributions to shareholders from net realized gains | — | (1.40 | ) | — | ||||||||||
Total distributions | (0.15 | ) | (1.46 | ) | — | |||||||||
Net asset value, end of period | $ | 23.98 | $ | 26.74 | $ | 26.77 | ||||||||
| Total Return(d) | (9.81 | )% | 6.06 | % | (1.62 | )% | ||||||||
Net assets, end of period (in 000’s) | $ | 87,170 | $ | 106,039 | $ | 66,823 | ||||||||
Ratio of net expenses to average net assets | 0.83 | % | 0.84 | % | 0.83 | %(e) | ||||||||
Ratio of total expenses to average net assets | 0.91 | % | 0.94 | % | 0.92 | %(e) | ||||||||
Ratio of net investment income to average net assets | 0.36 | % | 0.53 | % | 0.48 | %(c)(e) | ||||||||
Portfolio turnover rate(f) | 141 | % | 140 | % | 111 | % | ||||||||
| (a) | Commenced operations on April 16, 2018. |
| (b) | Calculated based on the average shares outstanding methodology. |
| (c) | Reflects income recognized from special dividends which amounted to $0.04 per share and 0.15% of average net assets. |
| (d) | Assumes investment at the NAV at the beginning of the period, reinvestment of all dividends and distributions, a complete redemption of the investment at the NAV at the end of the period and no sales or redemption charges (if any). Total returns would be reduced if a sales or redemption charge was taken into account. Returns do not reflect the impact of taxes to shareholders relating to Fund distributions or the redemption of Fund shares. Total returns for periods less than one full year are not annualized. |
| (e) | Annualized. |
| (f) | The Fund’s portfolio turnover rate is calculated in accordance with regulatory requirements, without regard to transactions involving short term investments and certain derivatives. If such transactions were included, the Fund’s portfolio turnover rate may be higher. |
| The accompanying notes are an integral part of these financial statements. | 83 |
GOLDMAN SACHS SMALL CAP GROWTH INSIGHTS FUND
Financial Highlights (continued)
Selected Share Data for a Share Outstanding Throughout Each Year
| (a) | Calculated based on the average shares outstanding methodology. |
| (b) | Reflects income recognized from special dividends which amounted to $0.05 per share and 0.12% of average net assets. |
| (c) | Amount is less than $0.005 per share. |
| (d) | The amount shown for a share outstanding does not correspond with the aggregate net gain on investments during the period due to the timing of sales and redemptions of Fund shares in relation to the fluctuating market values of the investments of the Fund. |
| (e) | Assumes investment at the NAV at the beginning of the year, reinvestment of all dividends and distributions, a complete redemption of the investment at the NAV at the end of the year and no sales or redemption charges (if any). Total returns would be reduced if a sales or redemption charge was taken into account. Returns do not reflect the impact of taxes to shareholders relating to Fund distributions or the redemption of Fund shares. |
| (f) | The Fund’s portfolio turnover rate is calculated in accordance with regulatory requirements, without regard to transactions involving short term investments and certain derivatives. If such transactions were included, the Fund’s portfolio turnover rate may be higher. |
| 84 | The accompanying notes are an integral part of these financial statements. |
GOLDMAN SACHS SMALL CAP GROWTH INSIGHTS FUND
Financial Highlights (continued)
Selected Share Data for a Share Outstanding Throughout Each Year
| Goldman Sachs Small Cap Growth Insights Fund | ||||||||||||||||||||||
| Class C Shares | ||||||||||||||||||||||
| Year Ended October 31, | ||||||||||||||||||||||
| 2020 | 2019 | 2018 | 2017 | 2016 | ||||||||||||||||||
| Per Share Data | ||||||||||||||||||||||
Net asset value, beginning of year | $ | 26.16 | $ | 28.98 | $ | 29.12 | $ | 22.64 | $ | 25.61 | ||||||||||||
Net investment loss(a) | (0.31 | ) | (0.28 | ) | (0.33 | )(b) | (0.25 | ) | (0.16 | ) | ||||||||||||
Net realized and unrealized gain (loss) | (0.10 | ) | 1.27 | 1.72 | 6.73 | (0.12 | )(c) | |||||||||||||||
Total from investment operations | (0.41 | ) | 0.99 | 1.39 | 6.48 | (0.28 | ) | |||||||||||||||
Distributions to shareholders from net investment income | — | (d) | — | — | — | — | ||||||||||||||||
Distributions to shareholders from net realized gains | (0.49 | ) | (3.81 | ) | (1.53 | ) | — | (2.69 | ) | |||||||||||||
Total distributions | (0.49 | ) | (3.81 | ) | (1.53 | ) | — | (2.69 | ) | |||||||||||||
Net asset value, end of year | $ | 25.26 | $ | 26.16 | $ | 28.98 | $ | 29.12 | $ | 22.64 | ||||||||||||
| Total Return(e) | (1.70 | )% | 4.92 | % | 5.03 | % | 28.62 | % | (1.14 | )% | ||||||||||||
Net assets, end of year (in 000’s) | $ | 6,439 | $ | 8,303 | $ | 8,179 | $ | 9,852 | $ | 7,420 | ||||||||||||
Ratio of net expenses to average net assets | 1.97 | % | 1.99 | % | 1.97 | % | 1.97 | % | 2.00 | % | ||||||||||||
Ratio of total expenses to average net assets | 2.05 | % | 2.07 | % | 2.07 | % | 2.15 | % | 2.26 | % | ||||||||||||
Ratio of net investment loss to average net assets | (1.26 | )% | (1.11 | )% | (1.09 | )%(b) | (0.95 | )% | (0.74 | )% | ||||||||||||
Portfolio turnover rate(f) | 144 | % | 140 | % | 127 | % | 136 | % | 139 | % | ||||||||||||
| (a) | Calculated based on the average shares outstanding methodology. |
| (b) | Reflects income recognized from special dividends which amounted to $0.05 per share and 0.12% of average net assets. |
| (c) | The amount shown for a share outstanding does not correspond with the aggregate net gain on investments during the period due to the timing of sales and redemptions of Fund shares in relation to the fluctuating market values of the investments of the Fund. |
| (d) | Amount is less than $0.005 per share. |
| (e) | Assumes investment at the NAV at the beginning of the year, reinvestment of all dividends and distributions, a complete redemption of the investment at the NAV at the end of the year and no sales or redemption charges (if any). Total returns would be reduced if a sales or redemption charge was taken into account. Returns do not reflect the impact of taxes to shareholders relating to Fund distributions or the redemption of Fund shares. |
| (f) | The Fund’s portfolio turnover rate is calculated in accordance with regulatory requirements, without regard to transactions involving short term investments and certain derivatives. If such transactions were included, the Fund’s portfolio turnover rate may be higher. |
| The accompanying notes are an integral part of these financial statements. | 85 |
GOLDMAN SACHS SMALL CAP GROWTH INSIGHTS FUND
Financial Highlights (continued)
Selected Share Data for a Share Outstanding Throughout Each Year
| Goldman Sachs Small Cap Growth Insights Fund | ||||||||||||||||||||||
| Institutional Shares | ||||||||||||||||||||||
| Year Ended October 31, | ||||||||||||||||||||||
| 2020 | 2019 | 2018 | 2017 | 2016 | ||||||||||||||||||
| Per Share Data | ||||||||||||||||||||||
Net asset value, beginning of year | $ | 41.92 | $ | 43.56 | $ | 42.53 | $ | 32.76 | $ | 35.46 | ||||||||||||
Net investment income (loss)(a) | (0.05 | ) | 0.01 | 0.02 | (b) | 0.05 | 0.13 | |||||||||||||||
Net realized and unrealized gain (loss) | (0.16 | ) | 2.16 | 2.54 | 9.79 | (0.14 | )(c) | |||||||||||||||
Total from investment operations | (0.21 | ) | 2.17 | 2.56 | 9.84 | (0.01 | ) | |||||||||||||||
Distributions to shareholders from net investment income | — | (d) | — | — | (0.07 | ) | — | |||||||||||||||
Distributions to shareholders from net realized gains | (0.49 | ) | (3.81 | ) | (1.53 | ) | — | (2.69 | ) | |||||||||||||
Total distributions | (0.49 | ) | (3.81 | ) | (1.53 | ) | (0.07 | ) | (2.69 | ) | ||||||||||||
Net asset value, end of year | $ | 41.22 | $ | 41.92 | $ | 43.56 | $ | 42.53 | $ | 32.76 | ||||||||||||
| Total Return(e) | (0.57 | )% | 6.08 | % | 6.26 | % | 30.04 | % | 0.01 | % | ||||||||||||
Net assets, end of year (in 000’s) | $ | 200,116 | $ | 349,348 | $ | 307,032 | $ | 265,199 | $ | 91,248 | ||||||||||||
Ratio of net expenses to average net assets | 0.84 | % | 0.85 | % | 0.84 | % | 0.85 | % | 0.85 | % | ||||||||||||
Ratio of total expenses to average net assets | 0.92 | % | 0.93 | % | 0.93 | % | 1.01 | % | 1.11 | % | ||||||||||||
Ratio of net investment income to average net assets | (0.13 | )% | 0.02 | % | 0.03 | %(b) | 0.13 | % | 0.40 | % | ||||||||||||
Portfolio turnover rate(f) | 144 | % | 140 | % | 127 | % | 136 | % | 139 | % | ||||||||||||
| (a) | Calculated based on the average shares outstanding methodology. |
| (b) | Reflects income recognized from special dividends which amounted to $0.05 per share and 0.12% of average net assets. |
| (c) | The amount shown for a share outstanding does not correspond with the aggregate net gain on investments during the period due to the timing of sales and redemptions of Fund shares in relation to the fluctuating market values of the investments of the Fund. |
| (d) | Amount is less than $0.005 per share. |
| (e) | Assumes investment at the NAV at the beginning of the year, reinvestment of all dividends and distributions, a complete redemption of the investment at the NAV at the end of the year and no sales or redemption charges (if any). Total returns would be reduced if a sales or redemption charge was taken into account. Returns do not reflect the impact of taxes to shareholders relating to Fund distributions or the redemption of Fund shares. |
| (f) | The Fund’s portfolio turnover rate is calculated in accordance with regulatory requirements, without regard to transactions involving short term investments and certain derivatives. If such transactions were included, the Fund’s portfolio turnover rate may be higher. |
| 86 | The accompanying notes are an integral part of these financial statements. |
GOLDMAN SACHS SMALL CAP GROWTH INSIGHTS FUND
Financial Highlights (continued)
Selected Share Data for a Share Outstanding Throughout Each Year
| Goldman Sachs Small Cap Growth Insights Fund | ||||||||||||||||||||||
| Investor Shares | ||||||||||||||||||||||
| Year Ended October 31, | ||||||||||||||||||||||
| 2020 | 2019 | 2018 | 2017 | 2016 | ||||||||||||||||||
| Per Share Data | ||||||||||||||||||||||
Net asset value, beginning of year | $ | 36.16 | $ | 38.18 | $ | 37.50 | $ | 28.93 | $ | 31.68 | ||||||||||||
Net investment income (loss)(a) | (0.09 | ) | (0.04 | ) | (0.04 | )(b) | — | (c) | 0.01 | |||||||||||||
Net realized and unrealized gain (loss) | (0.14 | ) | 1.83 | 2.25 | 8.63 | (0.07 | )(d) | |||||||||||||||
Total from investment operations | (0.23 | ) | 1.79 | 2.21 | 8.63 | (0.06 | ) | |||||||||||||||
Distributions to shareholders from net investment income | — | (c) | — | — | (0.06 | ) | — | |||||||||||||||
Distributions to shareholders from net realized gains | (0.49 | ) | (3.81 | ) | (1.53 | ) | — | (2.69 | ) | |||||||||||||
Total distributions | (0.49 | ) | (3.81 | ) | (1.53 | ) | (0.06 | ) | (2.69 | ) | ||||||||||||
Net asset value, end of year | $ | 35.44 | $ | 36.16 | $ | 38.18 | $ | 37.50 | $ | 28.93 | ||||||||||||
| Total Return(e) | (0.72 | )% | 5.93 | % | 6.13 | % | 29.87 | % | (0.15 | )% | ||||||||||||
Net assets, end of year (in 000’s) | $ | 442,743 | $ | 378,807 | $ | 308,366 | $ | 192,860 | $ | 47,826 | ||||||||||||
Ratio of net expenses to average net assets | 0.97 | % | 0.99 | % | 0.97 | % | 0.96 | % | 1.00 | % | ||||||||||||
Ratio of total expenses to average net assets | 1.05 | % | 1.07 | % | 1.07 | % | 1.16 | % | 1.23 | % | ||||||||||||
Ratio of net investment income (loss) to average net assets | (0.26 | )% | (0.12 | )% | (0.10 | )%(b) | 0.01 | % | 0.04 | % | ||||||||||||
Portfolio turnover rate(f) | 144 | % | 140 | % | 127 | % | 136 | % | 139 | % | ||||||||||||
| (a) | Calculated based on the average shares outstanding methodology. |
| (b) | Reflects income recognized from special dividends which amounted to $0.05 per share and 0.12% of average net assets. |
| (c) | Amount is less than $0.005 per share. |
| (d) | The amount shown for a share outstanding does not correspond with the aggregate net gain on investments during the period due to the timing of sales and redemptions of Fund shares in relation to the fluctuating market values of the investments of the Fund. |
| (e) | Assumes investment at the NAV at the beginning of the year, reinvestment of all dividends and distributions, a complete redemption of the investment at the NAV at the end of the year and no sales or redemption charges (if any). Total returns would be reduced if a sales or redemption charge was taken into account. Returns do not reflect the impact of taxes to shareholders relating to Fund distributions or the redemption of Fund shares. |
| (f) | The Fund’s portfolio turnover rate is calculated in accordance with regulatory requirements, without regard to transactions involving short term investments and certain derivatives. If such transactions were included, the Fund’s portfolio turnover rate may be higher. |
| The accompanying notes are an integral part of these financial statements. | 87 |
GOLDMAN SACHS SMALL CAP GROWTH INSIGHTS FUND
Financial Highlights (continued)
Selected Share Data for a Share Outstanding Throughout Each Year
| Goldman Sachs Small Cap Growth Insights Fund | ||||||||||||||||||||||
| Class R6 Shares | ||||||||||||||||||||||
| Year Ended October 31, | ||||||||||||||||||||||
| 2020 | 2019 | 2018 | 2017 | 2016 | ||||||||||||||||||
| Per Share Data | ||||||||||||||||||||||
Net asset value, beginning of year | $ | 41.95 | $ | 43.58 | $ | 42.54 | $ | 32.78 | $ | 35.46 | ||||||||||||
Net investment income (loss)(a) | (0.05 | ) | — | 0.02 | (b) | 0.04 | 0.13 | |||||||||||||||
Net realized and unrealized gain (loss) | (0.17 | ) | 2.18 | 2.55 | 9.80 | (0.12 | )(c) | |||||||||||||||
Total from investment operations | (0.22 | ) | 2.18 | 2.57 | 9.84 | 0.01 | ||||||||||||||||
Distributions to shareholders from net investment income | — | (d) | — | — | (0.08 | ) | — | |||||||||||||||
Distributions to shareholders from net realized gains | (0.49 | ) | (3.81 | ) | (1.53 | ) | — | (2.69 | ) | |||||||||||||
Total distributions | (0.49 | ) | (3.81 | ) | (1.53 | ) | (0.08 | ) | (2.69 | ) | ||||||||||||
Net asset value, end of year | $ | 41.24 | $ | 41.95 | $ | 43.58 | $ | 42.54 | $ | 32.78 | ||||||||||||
| Total Return(e) | (0.57 | )% | 6.08 | % | 6.25 | % | 30.05 | % | 0.07 | % | ||||||||||||
Net assets, end of year (in 000’s) | $ | 263,023 | $ | 307,820 | $ | 118,729 | $ | 42,042 | $ | 6,667 | ||||||||||||
Ratio of net expenses to average net assets | 0.83 | % | 0.84 | % | 0.83 | % | 0.83 | % | 0.83 | % | ||||||||||||
Ratio of total expenses to average net assets | 0.91 | % | 0.93 | % | 0.92 | % | 1.00 | % | 1.06 | % | ||||||||||||
Ratio of net investment income (loss) to average net assets | (0.12 | )% | (0.01 | )% | 0.04 | %(b) | 0.09 | % | 0.40 | % | ||||||||||||
Portfolio turnover rate(f) | 144 | % | 140 | % | 127 | % | 136 | % | 139 | % | ||||||||||||
| (a) | Calculated based on the average shares outstanding methodology. |
| (b) | Reflects income recognized from special dividends which amounted to $0.05 per share and 0.12% of average net assets. |
| (c) | The amount shown for a share outstanding does not correspond with the aggregate net gain on investments during the period due to the timing of sales and redemptions of Fund shares in relation to the fluctuating market values of the investments of the Fund. |
| (d) | Amount is less than $0.005 per share. |
| (e) | Assumes investment at the NAV at the beginning of the year, reinvestment of all dividends and distributions, a complete redemption of the investment at the NAV at the end of the year and no sales or redemption charges (if any). Total returns would be reduced if a sales or redemption charge was taken into account. Returns do not reflect the impact of taxes to shareholders relating to Fund distributions or the redemption of Fund shares. |
| (f) | The Fund’s portfolio turnover rate is calculated in accordance with regulatory requirements, without regard to transactions involving short term investments and certain derivatives. If such transactions were included, the Fund’s portfolio turnover rate may be higher. |
| 88 | The accompanying notes are an integral part of these financial statements. |
GOLDMAN SACHS SMALL CAP GROWTH INSIGHTS FUND
Financial Highlights (continued)
Selected Share Data for a Share Outstanding Throughout Each Year
| Goldman Sachs Small Cap Growth Insights Fund | ||||||||||||||||||||||
| Class R Shares | ||||||||||||||||||||||
| Year Ended October 31, | ||||||||||||||||||||||
| 2020 | 2019 | 2018 | 2017 | 2016 | ||||||||||||||||||
| Per Share Data | ||||||||||||||||||||||
Net asset value, beginning of year | $ | 33.58 | $ | 35.90 | $ | 35.53 | $ | 27.49 | $ | 30.37 | ||||||||||||
Net investment loss(a) | (0.25 | ) | (0.20 | ) | (0.22 | )(b) | (0.16 | ) | (0.06 | ) | ||||||||||||
Net realized and unrealized gain (loss) | (0.13 | ) | 1.69 | 2.12 | 8.20 | (0.13 | )(c) | |||||||||||||||
Total from investment operations | (0.38 | ) | 1.49 | 1.90 | 8.04 | (0.19 | ) | |||||||||||||||
Distributions to shareholders from net investment income | — | (d) | — | — | — | — | ||||||||||||||||
Distributions to shareholders from net realized gains | (0.49 | ) | (3.81 | ) | (1.53 | ) | — | (2.69 | ) | |||||||||||||
Total distributions | (0.49 | ) | (3.81 | ) | (1.53 | ) | — | (2.69 | ) | |||||||||||||
Net asset value, end of year | $ | 32.71 | $ | 33.58 | $ | 35.90 | $ | 35.53 | $ | 27.49 | ||||||||||||
| Total Return(e) | (1.23 | )% | 5.42 | % | 5.58 | % | 29.25 | % | (0.63 | )% | ||||||||||||
Net assets, end of year (in 000’s) | $ | 8,168 | $ | 19,707 | $ | 19,998 | $ | 12,113 | $ | 3,689 | ||||||||||||
Ratio of net expenses to average net assets | 1.47 | % | 1.49 | % | 1.47 | % | 1.46 | % | 1.50 | % | ||||||||||||
Ratio of total expenses to average net assets | 1.55 | % | 1.57 | % | 1.57 | % | 1.66 | % | 1.76 | % | ||||||||||||
Ratio of net investment loss to average net assets | (0.77 | )% | (0.61 | )% | (0.59 | )%(b) | (0.50 | )% | (0.21 | )% | ||||||||||||
Portfolio turnover rate(f) | 144 | % | 140 | % | 127 | % | 136 | % | 139 | % | ||||||||||||
| (a) | Calculated based on the average shares outstanding methodology. |
| (b) | Reflects income recognized from special dividends which amounted to $0.05 per share and 0.12% of average net assets. |
| (c) | The amount shown for a share outstanding does not correspond with the aggregate net gain on investments during the period due to the timing of sales and redemptions of Fund shares in relation to the fluctuating market values of the investments of the Fund. |
| (d) | Amount is less than $0.005 per share. |
| (e) | Assumes investment at the NAV at the beginning of the year, reinvestment of all dividends and distributions, a complete redemption of the investment at the NAV at the end of the year and no sales or redemption charges (if any). Total returns would be reduced if a sales or redemption charge was taken into account. Returns do not reflect the impact of taxes to shareholders relating to Fund distributions or the redemption of Fund shares. |
| (f) | The Fund’s portfolio turnover rate is calculated in accordance with regulatory requirements, without regard to transactions involving short term investments and certain derivatives. If such transactions were included, the Fund’s portfolio turnover rate may be higher. |
| The accompanying notes are an integral part of these financial statements. | 89 |
GOLDMAN SACHS SMALL CAP GROWTH INSIGHTS FUND
Financial Highlights (continued)
Selected Share Data for a Share Outstanding Throughout Each Period
| Goldman Sachs Small Cap Growth Insights Fund | ||||||||||||||
| Class P Shares | ||||||||||||||
| Year Ended October 31, | Period Ended October 31, 2018(a) | |||||||||||||
| 2020 | 2019 | |||||||||||||
| Per Share Data | ||||||||||||||
Net asset value, beginning of period | $ | 41.94 | $ | 43.58 | $ | 44.33 | ||||||||
Net investment income (loss)(b) | (0.05 | ) | 0.01 | 0.03 | (c) | |||||||||
Net realized and unrealized gain (loss) | (0.16 | ) | 2.16 | (0.78 | ) | |||||||||
Total from investment operations | (0.21 | ) | 2.17 | (0.75 | ) | |||||||||
Distributions to shareholders from net investment income | — | (d) | — | — | ||||||||||
Distributions to shareholders from net realized gains | (0.49 | ) | (3.81 | ) | — | |||||||||
Total distributions | (0.49 | ) | (3.81 | ) | — | |||||||||
Net asset value, end of period | $ | 41.24 | $ | 41.94 | $ | 43.58 | ||||||||
| Total Return(e) | (0.57 | )% | 6.08 | % | (1.69 | )% | ||||||||
Net assets, end of period (in 000’s) | $ | 10,241 | $ | 12,534 | $ | 10,878 | ||||||||
Ratio of net expenses to average net assets | 0.83 | % | 0.84 | % | 0.83 | %(f) | ||||||||
Ratio of total expenses to average net assets | 0.91 | % | 0.93 | % | 0.93 | %(f) | ||||||||
Ratio of net investment income (loss) to average net assets | (0.12 | )% | 0.02 | % | 0.12 | %(c)(f) | ||||||||
Portfolio turnover rate(g) | 144 | % | 140 | % | 127 | % | ||||||||
| (a) | Commenced operations on April 16, 2018. |
| (b) | Calculated based on the average shares outstanding methodology. |
| (c) | Reflects income recognized from special dividends which amounted to $0.05 per share and 0.12% of average net assets. |
| (d) | Amount is less than $0.005 per share. |
| (e) | Assumes investment at the NAV at the beginning of the period, reinvestment of all dividends and distributions, a complete redemption of the investment at the NAV at the end of the period and no sales or redemption charges (if any). Total returns would be reduced if a sales or redemption charge was taken into account. Returns do not reflect the impact of taxes to shareholders relating to Fund distributions or the redemption of Fund shares. Total returns for periods less than one full year are not annualized. |
| (f) | Annualized. |
| (g) | The Fund’s portfolio turnover rate is calculated in accordance with regulatory requirements, without regard to transactions involving short term investments and certain derivatives. If such transactions were included, the Fund’s portfolio turnover rate may be higher. |
| 90 | The accompanying notes are an integral part of these financial statements. |
GOLDMAN SACHS SMALL CAP VALUE INSIGHTS FUND
Financial Highlights (continued)
Selected Share Data for a Share Outstanding Throughout Each Year
| (a) | Calculated based on the average shares outstanding methodology. |
| (b) | Reflects income recognized from special dividends which amounted to $0.03 per share and 0.07% of average net assets. |
| (c) | Assumes investment at the NAV at the beginning of the year, reinvestment of all dividends and distributions, a complete redemption of the investment at the NAV at the end of the year and no sales or redemption charges (if any). Total returns would be reduced if a sales or redemption charge was taken into account. Returns do not reflect the impact of taxes to shareholders relating to Fund distributions or the redemption of Fund shares. |
| (d) | The Fund’s portfolio turnover rate is calculated in accordance with regulatory requirements, without regard to transactions involving short term investments and certain derivatives. If such transactions were included, the Fund’s portfolio turnover rate may be higher. |
| The accompanying notes are an integral part of these financial statements. | 91 |
GOLDMAN SACHS SMALL CAP VALUE INSIGHTS FUND
Financial Highlights (continued)
Selected Share Data for a Share Outstanding Throughout Each Year
| Goldman Sachs Small Cap Value Insights Fund | ||||||||||||||||||||||
| Class C Shares | ||||||||||||||||||||||
| Year Ended October 31, | ||||||||||||||||||||||
| 2020 | 2019 | 2018 | 2017 | 2016 | ||||||||||||||||||
| Per Share Data | ||||||||||||||||||||||
Net asset value, beginning of year | $ | 27.24 | $ | 30.35 | $ | 34.65 | $ | 29.53 | $ | 29.75 | ||||||||||||
Net investment income (loss)(a) | (0.04 | ) | (0.02 | ) | (0.10 | ) | (0.07 | )(b) | 0.01 | |||||||||||||
Net realized and unrealized gain (loss) | (4.61 | ) | 0.75 | 0.52 | 6.85 | 1.92 | ||||||||||||||||
Total from investment operations | (4.65 | ) | 0.73 | 0.42 | 6.78 | 1.93 | ||||||||||||||||
Distributions to shareholders from net investment income | (0.11 | ) | — | — | (0.07 | ) | (0.10 | ) | ||||||||||||||
Distributions to shareholders from net realized gains | — | (3.84 | ) | (4.72 | ) | (1.59 | ) | (2.05 | ) | |||||||||||||
Total distributions | (0.11 | ) | (3.84 | ) | (4.72 | ) | (1.66 | ) | (2.15 | ) | ||||||||||||
Net asset value, end of year | $ | 22.48 | $ | 27.24 | $ | 30.35 | $ | 34.65 | $ | 29.53 | ||||||||||||
| Total Return(c) | (17.11 | )% | 3.67 | % | 1.31 | % | 23.09 | % | 7.15 | % | ||||||||||||
Net assets, end of year (in 000’s) | $ | 5,313 | $ | 7,961 | $ | 6,903 | $ | 17,037 | $ | 15,224 | ||||||||||||
Ratio of net expenses to average net assets | 1.97 | % | 2.00 | % | 1.98 | % | 1.99 | % | 2.00 | % | ||||||||||||
Ratio of total expenses to average net assets | 2.06 | % | 2.14 | % | 2.14 | % | 2.24 | % | 2.29 | % | ||||||||||||
Ratio of net investment income (loss) to average net assets | (0.19 | )% | (0.07 | )% | (0.31 | )% | (0.22 | )%(b) | 0.03 | % | ||||||||||||
Portfolio turnover rate(d) | 153 | % | 142 | % | 130 | % | 138 | % | 129 | % | ||||||||||||
| (a) | Calculated based on the average shares outstanding methodology. |
| (b) | Reflects income recognized from special dividends which amounted to $0.03 per share and 0.07% of average net assets. |
| (c) | Assumes investment at the NAV at the beginning of the year, reinvestment of all dividends and distributions, a complete redemption of the investment at the NAV at the end of the year and no sales or redemption charges (if any). Total returns would be reduced if a sales or redemption charge was taken into account. Returns do not reflect the impact of taxes to shareholders relating to Fund distributions or the redemption of Fund shares. |
| (d) | The Fund’s portfolio turnover rate is calculated in accordance with regulatory requirements, without regard to transactions involving short term investments and certain derivatives. If such transactions were included, the Fund’s portfolio turnover rate may be higher. |
| 92 | The accompanying notes are an integral part of these financial statements. |
GOLDMAN SACHS SMALL CAP VALUE INSIGHTS FUND
Financial Highlights (continued)
Selected Share Data for a Share Outstanding Throughout Each Year
| Goldman Sachs Small Cap Value Insights Fund | ||||||||||||||||||||||
| Institutional Shares | ||||||||||||||||||||||
| Year Ended October 31, | ||||||||||||||||||||||
| 2020 | 2019 | 2018 | 2017 | 2016 | ||||||||||||||||||
| Per Share Data | ||||||||||||||||||||||
Net asset value, beginning of year | $ | 53.74 | $ | 55.71 | $ | 59.38 | $ | 49.35 | $ | 48.06 | ||||||||||||
Net investment income(a) | 0.43 | 0.47 | 0.48 | 0.50 | (b) | 0.55 | ||||||||||||||||
Net realized and unrealized gain (loss) | (9.07 | ) | 1.73 | 0.90 | 11.53 | 3.23 | ||||||||||||||||
Total from investment operations | (8.64 | ) | 2.20 | 1.38 | 12.03 | 3.78 | ||||||||||||||||
Distributions to shareholders from net investment income | (0.40 | ) | (0.33 | ) | (0.33 | ) | (0.41 | ) | (0.44 | ) | ||||||||||||
Distributions to shareholders from net realized gains | — | (3.84 | ) | (4.72 | ) | (1.59 | ) | (2.05 | ) | |||||||||||||
Total distributions | (0.40 | ) | (4.17 | ) | (5.05 | ) | (2.00 | ) | (2.49 | ) | ||||||||||||
Net asset value, end of year | $ | 44.70 | $ | 53.74 | $ | 55.71 | $ | 59.38 | $ | 49.35 | ||||||||||||
| Total Return(c) | (16.19 | )% | 4.81 | % | 2.47 | % | 24.49 | % | 8.41 | % | ||||||||||||
Net assets, end of year (in 000’s) | $ | 190,491 | $ | 192,820 | $ | 60,516 | $ | 56,191 | $ | 21,717 | ||||||||||||
Ratio of net expenses to average net assets | 0.84 | % | 0.87 | % | 0.84 | % | 0.84 | % | 0.85 | % | ||||||||||||
Ratio of total expenses to average net assets | 0.93 | % | 1.02 | % | 1.00 | % | 1.09 | % | 1.14 | % | ||||||||||||
Ratio of net investment income to average net assets | 0.93 | % | 0.96 | % | 0.82 | % | 0.90 | %(b) | 1.19 | % | ||||||||||||
Portfolio turnover rate(d) | 153 | % | 142 | % | 130 | % | 138 | % | 129 | % | ||||||||||||
| (a) | Calculated based on the average shares outstanding methodology. |
| (b) | Reflects income recognized from special dividends which amounted to $0.03 per share and 0.07% of average net assets. |
| (c) | Assumes investment at the NAV at the beginning of the year, reinvestment of all dividends and distributions, a complete redemption of the investment at the NAV at the end of the year and no sales or redemption charges (if any). Total returns would be reduced if a sales or redemption charge was taken into account. Returns do not reflect the impact of taxes to shareholders relating to Fund distributions or the redemption of Fund shares. |
| (d) | The Fund’s portfolio turnover rate is calculated in accordance with regulatory requirements, without regard to transactions involving short term investments and certain derivatives. If such transactions were included, the Fund’s portfolio turnover rate may be higher. |
| The accompanying notes are an integral part of these financial statements. | 93 |
GOLDMAN SACHS SMALL CAP VALUE INSIGHTS FUND
Financial Highlights (continued)
Selected Share Data for a Share Outstanding Throughout Each Year
| Goldman Sachs Small Cap Value Insights Fund | ||||||||||||||||||||||
| Investor Shares | ||||||||||||||||||||||
| Year Ended October 31, | ||||||||||||||||||||||
| 2020 | 2019 | 2018 | 2017 | 2016 | ||||||||||||||||||
| Per Share Data | ||||||||||||||||||||||
Net asset value, beginning of year | $ | 39.53 | $ | 42.18 | $ | 46.17 | $ | 38.78 | $ | 38.31 | ||||||||||||
Net investment income(a) | 0.25 | 0.30 | 0.31 | 0.31 | (b) | 0.37 | ||||||||||||||||
Net realized and unrealized gain (loss) | (6.64 | ) | 1.20 | 0.69 | 9.05 | 2.54 | ||||||||||||||||
Total from investment operations | (6.39 | ) | 1.50 | 1.00 | 9.36 | 2.91 | ||||||||||||||||
Distributions to shareholders from net investment income | (0.37 | ) | (0.31 | ) | (0.27 | ) | (0.38 | ) | (0.39 | ) | ||||||||||||
Distributions to shareholders from net realized gains | — | (3.84 | ) | (4.72 | ) | (1.59 | ) | (2.05 | ) | |||||||||||||
Total distributions | (0.37 | ) | (4.15 | ) | (4.99 | ) | (1.97 | ) | (2.44 | ) | ||||||||||||
Net asset value, end of year | $ | 32.77 | $ | 39.53 | $ | 42.18 | $ | 46.17 | $ | 38.78 | ||||||||||||
| Total Return(c) | (16.32 | )% | 4.69 | % | 2.33 | % | 24.30 | % | 8.26 | % | ||||||||||||
Net assets, end of year (in 000’s) | $ | 273,560 | $ | 59,800 | $ | 18,257 | $ | 5,695 | $ | 1,925 | ||||||||||||
Ratio of net expenses to average net assets | 0.97 | % | 1.01 | % | 0.98 | % | 0.99 | % | 1.00 | % | ||||||||||||
Ratio of total expenses to average net assets | 1.06 | % | 1.15 | % | 1.17 | % | 1.24 | % | 1.29 | % | ||||||||||||
Ratio of net investment income to average net assets | 0.77 | % | 0.83 | % | 0.70 | % | 0.72 | %(b) | 1.02 | % | ||||||||||||
Portfolio turnover rate(d) | 153 | % | 142 | % | 130 | % | 138 | % | 129 | % | ||||||||||||
| (a) | Calculated based on the average shares outstanding methodology. |
| (b) | Reflects income recognized from special dividends which amounted to $0.03 per share and 0.07% of average net assets. |
| (c) | Assumes investment at the NAV at the beginning of the year, reinvestment of all dividends and distributions, a complete redemption of the investment at the NAV at the end of the year and no sales or redemption charges (if any). Total returns would be reduced if a sales or redemption charge was taken into account. Returns do not reflect the impact of taxes to shareholders relating to Fund distributions or the redemption of Fund shares. |
| (d) | The Fund’s portfolio turnover rate is calculated in accordance with regulatory requirements, without regard to transactions involving short term investments and certain derivatives. If such transactions were included, the Fund’s portfolio turnover rate may be higher. |
| 94 | The accompanying notes are an integral part of these financial statements. |
GOLDMAN SACHS SMALL CAP VALUE INSIGHTS FUND
Financial Highlights (continued)
Selected Share Data for a Share Outstanding Throughout Each Year
| Goldman Sachs Small Cap Value Insights Fund | ||||||||||||||||||||||
| Class R6 Shares | ||||||||||||||||||||||
| Year Ended October 31, | ||||||||||||||||||||||
| 2020 | 2019 | 2018 | 2017 | 2016 | ||||||||||||||||||
| Per Share Data | ||||||||||||||||||||||
Net asset value, beginning of year | $ | 53.73 | $ | 55.71 | $ | 59.38 | $ | 49.35 | $ | 48.07 | ||||||||||||
Net investment income(a) | 0.43 | 0.45 | 0.50 | 0.46 | (b) | 0.55 | ||||||||||||||||
Net realized and unrealized gain (loss) | (9.06 | ) | 1.75 | 0.90 | 11.56 | 3.23 | ||||||||||||||||
Total from investment operations | (8.63 | ) | 2.20 | 1.40 | 12.02 | 3.78 | ||||||||||||||||
Distributions to shareholders from net investment income | (0.40 | ) | (0.34 | ) | (0.35 | ) | (0.40 | ) | (0.45 | ) | ||||||||||||
Distributions to shareholders from net realized gains | — | (3.84 | ) | (4.72 | ) | (1.59 | ) | (2.05 | ) | |||||||||||||
Total distributions | (0.40 | ) | (4.18 | ) | (5.07 | ) | (1.99 | ) | (2.50 | ) | ||||||||||||
Net asset value, end of year | $ | 44.70 | $ | 53.73 | $ | 55.71 | $ | 59.38 | $ | 49.35 | ||||||||||||
| Total Return(c) | (16.17 | )% | 4.83 | % | 2.49 | % | 24.49 | % | 8.41 | % | ||||||||||||
Net assets, end of year (in 000’s) | $ | 158,330 | $ | 118,331 | $ | 22,460 | $ | 4,542 | $ | 11 | ||||||||||||
Ratio of net expenses to average net assets | 0.83 | % | 0.86 | % | 0.83 | % | 0.83 | % | 0.84 | % | ||||||||||||
Ratio of total expenses to average net assets | 0.93 | % | 1.00 | % | 1.02 | % | 1.11 | % | 1.14 | % | ||||||||||||
Ratio of net investment income to average net assets | 0.94 | % | 0.91 | % | 0.85 | % | 0.83 | %(b) | 1.18 | % | ||||||||||||
Portfolio turnover rate(d) | 153 | % | 142 | % | 130 | % | 138 | % | 129 | % | ||||||||||||
| (a) | Calculated based on the average shares outstanding methodology. |
| (b) | Reflects income recognized from special dividends which amounted to $0.03 per share and 0.07% of average net assets. |
| (c) | Assumes investment at the NAV at the beginning of the year, reinvestment of all dividends and distributions, a complete redemption of the investment at the NAV at the end of the year and no sales or redemption charges (if any). Total returns would be reduced if a sales or redemption charge was taken into account. Returns do not reflect the impact of taxes to shareholders relating to Fund distributions or the redemption of Fund shares. |
| (d) | The Fund’s portfolio turnover rate is calculated in accordance with regulatory requirements, without regard to transactions involving short term investments and certain derivatives. If such transactions were included, the Fund’s portfolio turnover rate may be higher. |
| The accompanying notes are an integral part of these financial statements. | 95 |
GOLDMAN SACHS SMALL CAP VALUE INSIGHTS FUND
Financial Highlights (continued)
Selected Share Data for a Share Outstanding Throughout Each Year
| Goldman Sachs Small Cap Value Insights Fund | ||||||||||||||||||||||
| Class R Shares | ||||||||||||||||||||||
| Year Ended October 31, | ||||||||||||||||||||||
| 2020 | 2019 | 2018 | 2017 | 2016 | ||||||||||||||||||
| Per Share Data | ||||||||||||||||||||||
Net asset value, beginning of year | $ | 38.96 | $ | 41.63 | $ | 45.57 | $ | 38.32 | $ | 37.99 | ||||||||||||
Net investment income(a) | 0.10 | 0.08 | 0.09 | 0.14 | (b) | 0.20 | ||||||||||||||||
Net realized and unrealized gain (loss) | (6.56 | ) | 1.22 | 0.69 | 8.89 | 2.50 | ||||||||||||||||
Total from investment operations | (6.46 | ) | 1.30 | 0.78 | 9.03 | 2.70 | ||||||||||||||||
Distributions to shareholders from net investment income | (0.29 | ) | (0.13 | ) | — | (0.19 | ) | (0.32 | ) | |||||||||||||
Distributions to shareholders from net realized gains | — | (3.84 | ) | (4.72 | ) | (1.59 | ) | (2.05 | ) | |||||||||||||
Total distributions | (0.29 | ) | (3.97 | ) | (4.72 | ) | (1.78 | ) | (2.37 | ) | ||||||||||||
Net asset value, end of year | $ | 32.21 | $ | 38.96 | $ | 41.63 | $ | 45.57 | $ | 38.32 | ||||||||||||
| Total Return(c) | (16.70 | )% | 4.14 | % | 1.83 | % | 23.67 | % | 7.72 | % | ||||||||||||
Net assets, end of year (in 000’s) | $ | 14,038 | $ | 8,514 | $ | 2,320 | $ | 1,621 | $ | 5,762 | ||||||||||||
Ratio of net expenses to average net assets | 1.47 | % | 1.53 | % | 1.48 | % | 1.49 | % | 1.50 | % | ||||||||||||
Ratio of total expenses to average net assets | 1.56 | % | 1.69 | % | 1.66 | % | 1.73 | % | 1.79 | % | ||||||||||||
Ratio of net investment income to average net assets | 0.30 | % | 0.23 | % | 0.20 | % | 0.33 | %(b) | 0.55 | % | ||||||||||||
Portfolio turnover rate(d) | 153 | % | 142 | % | 130 | % | 138 | % | 129 | % | ||||||||||||
| (a) | Calculated based on the average shares outstanding methodology. |
| (b) | Reflects income recognized from special dividends which amounted to $0.03 per share and 0.07% of average net assets. |
| (c) | Assumes investment at the NAV at the beginning of the year, reinvestment of all dividends and distributions, a complete redemption of the investment at the NAV at the end of the year and no sales or redemption charges (if any). Total returns would be reduced if a sales or redemption charge was taken into account. Returns do not reflect the impact of taxes to shareholders relating to Fund distributions or the redemption of Fund shares. |
| (d) | The Fund’s portfolio turnover rate is calculated in accordance with regulatory requirements, without regard to transactions involving short term investments and certain derivatives. If such transactions were included, the Fund’s portfolio turnover rate may be higher. |
| 96 | The accompanying notes are an integral part of these financial statements. |
GOLDMAN SACHS SMALL CAP VALUE INSIGHTS FUND
Financial Highlights (continued)
Selected Share Data for a Share Outstanding Throughout Each Period
| Goldman Sachs Small Cap Value Insights Fund | ||||||||||||||
| Class P Shares | ||||||||||||||
| Year Ended October 31, | Period Ended October 31, 2018(a) | |||||||||||||
| 2020 | 2019 | |||||||||||||
| Per Share Data | ||||||||||||||
Net asset value, beginning of period | $ | 53.72 | $ | 55.70 | $ | 57.05 | ||||||||
Net investment income(b) | 0.44 | 0.54 | 0.30 | |||||||||||
Net realized and unrealized gain (loss) | (9.07 | ) | 1.66 | (1.65 | ) | |||||||||
Total from investment operations | (8.63 | ) | 2.20 | (1.35 | ) | |||||||||
Distributions to shareholders from net investment income | (0.40 | ) | (0.34 | ) | — | |||||||||
Distributions to shareholders from net realized gains | — | (3.84 | ) | — | ||||||||||
Total distributions | (0.40 | ) | (4.18 | ) | — | |||||||||
Net asset value, end of period | $ | 44.69 | $ | 53.72 | $ | 55.70 | ||||||||
| Total Return(c) | (16.18 | )% | 4.82 | % | (2.37 | )% | ||||||||
Net assets, end of period (in 000’s) | $ | 28,504 | $ | 47,977 | $ | 42,165 | ||||||||
Ratio of net expenses to average net assets | 0.83 | % | 0.85 | % | 0.83 | %(d) | ||||||||
Ratio of total expenses to average net assets | 0.92 | % | 0.99 | % | 1.06 | %(d) | ||||||||
Ratio of net investment income to average net assets | 0.94 | % | 1.07 | % | 0.93 | %(d) | ||||||||
Portfolio turnover rate(e) | 153 | % | 142 | % | 130 | % | ||||||||
| (a) | Commenced operations on April 16, 2018. |
| (b) | Calculated based on the average shares outstanding methodology. |
| (c) | Assumes investment at the NAV at the beginning of the period, reinvestment of all dividends and distributions, a complete redemption of the investment at the NAV at the end of the period and no sales or redemption charges (if any). Total returns would be reduced if a sales or redemption charge was taken into account. Returns do not reflect the impact of taxes to shareholders relating to Fund distributions or the redemption of Fund shares. Total returns for periods less than one full year are not annualized. |
| (d) | Annualized. |
| (e) | The Fund’s portfolio turnover rate is calculated in accordance with regulatory requirements, without regard to transactions involving short term investments and certain derivatives. If such transactions were included, the Fund’s portfolio turnover rate may be higher. |
| The accompanying notes are an integral part of these financial statements. | 97 |
GOLDMAN SACHS U.S. EQUITY INSIGHTS FUND
Financial Highlights (continued)
Selected Share Data for a Share Outstanding Throughout Each Year
| (a) | Calculated based on the average shares outstanding methodology. |
| (b) | Assumes investment at the NAV at the beginning of the year, reinvestment of all dividends and distributions, a complete redemption of the investment at the NAV at the end of the year and no sales or redemption charges (if any). Total returns would be reduced if a sales or redemption charge was taken into account. Returns do not reflect the impact of taxes to shareholders relating to Fund distributions or the redemption of Fund shares. |
| (c) | The Fund’s portfolio turnover rate is calculated in accordance with regulatory requirements, without regard to transactions involving short term investments and certain derivatives. If such transactions were included, the Fund’s portfolio turnover rate may be higher. |
| 98 | The accompanying notes are an integral part of these financial statements. |
GOLDMAN SACHS U.S. EQUITY INSIGHTS FUND
Financial Highlights (continued)
Selected Share Data for a Share Outstanding Throughout Each Year
| Goldman Sachs U.S. Equity Insights Fund | ||||||||||||||||||||||
| Class C Shares | ||||||||||||||||||||||
| Year Ended October 31, | ||||||||||||||||||||||
| 2020 | 2019 | 2018 | 2017 | 2016 | ||||||||||||||||||
| Per Share Data | ||||||||||||||||||||||
Net asset value, beginning of year | $ | 44.04 | $ | 42.80 | $ | 45.08 | $ | 37.10 | $ | 37.88 | ||||||||||||
Net investment income (loss)(a) | (0.09 | ) | 0.08 | 0.01 | 0.13 | 0.08 | ||||||||||||||||
Net realized and unrealized gain | 4.16 | 2.81 | 2.22 | 9.25 | 0.44 | |||||||||||||||||
Total from investment operations | 4.07 | 2.89 | 2.23 | 9.38 | 0.52 | |||||||||||||||||
Distributions to shareholders from net investment income | (0.40 | ) | — | (0.13 | ) | (0.02 | ) | (0.11 | ) | |||||||||||||
Distributions to shareholders from net realized gains | — | (1.65 | ) | (4.38 | ) | (1.38 | ) | (1.19 | ) | |||||||||||||
Total distributions | (0.40 | ) | (1.65 | ) | (4.51 | ) | (1.40 | ) | (1.30 | ) | ||||||||||||
Net asset value, end of year | $ | 47.71 | $ | 44.04 | $ | 42.80 | $ | 45.08 | $ | 37.10 | ||||||||||||
| Total Return(b) | 9.25 | % | 7.20 | % | 5.15 | % | 25.93 | % | 1.48 | % | ||||||||||||
Net assets, end of year (in 000’s) | $ | 16,275 | $ | 15,854 | $ | 14,277 | $ | 28,756 | $ | 31,377 | ||||||||||||
Ratio of net expenses to average net assets | 1.69 | % | 1.69 | % | 1.70 | % | 1.71 | % | 1.71 | % | ||||||||||||
Ratio of total expenses to average net assets | 1.75 | % | 1.76 | % | 1.75 | % | 1.89 | % | 1.93 | % | ||||||||||||
Ratio of net investment income (loss) to average net assets | (0.20 | )% | 0.18 | % | 0.01 | % | 0.31 | % | 0.21 | % | ||||||||||||
Portfolio turnover rate(c) | 213 | % | 199 | % | 168 | % | 193 | % | 213 | % | ||||||||||||
| (a) | Calculated based on the average shares outstanding methodology. |
| (b) | Assumes investment at the NAV at the beginning of the year, reinvestment of all dividends and distributions, a complete redemption of the investment at the NAV at the end of the year and no sales or redemption charges (if any). Total returns would be reduced if a sales or redemption charge was taken into account. Returns do not reflect the impact of taxes to shareholders relating to Fund distributions or the redemption of Fund shares. |
| (c) | The Fund’s portfolio turnover rate is calculated in accordance with regulatory requirements, without regard to transactions involving short term investments and certain derivatives. If such transactions were included, the Fund’s portfolio turnover rate may be higher. |
| The accompanying notes are an integral part of these financial statements. | 99 |
GOLDMAN SACHS U.S. EQUITY INSIGHTS FUND
Financial Highlights (continued)
Selected Share Data for a Share Outstanding Throughout Each Year
| Goldman Sachs U.S. Equity Insights Fund | ||||||||||||||||||||||
| Institutional Shares | ||||||||||||||||||||||
| Year Ended October 31, | ||||||||||||||||||||||
| 2020 | 2019 | 2018 | 2017 | 2016 | ||||||||||||||||||
| Per Share Data | ||||||||||||||||||||||
Net asset value, beginning of year | $ | 51.16 | $ | 49.30 | $ | 51.21 | $ | 41.92 | $ | 42.60 | ||||||||||||
Net investment income(a) | 0.50 | 0.72 | 0.54 | 0.70 | 0.54 | |||||||||||||||||
Net realized and unrealized gain | 4.82 | 3.14 | 2.56 | 10.45 | 0.52 | |||||||||||||||||
Total from investment operations | 5.32 | 3.86 | 3.10 | 11.15 | 1.06 | |||||||||||||||||
Distributions to shareholders from net investment income | (0.88 | ) | (0.35 | ) | (0.63 | ) | (0.48 | ) | (0.55 | ) | ||||||||||||
Distributions to shareholders from net realized gains | — | (1.65 | ) | (4.38 | ) | (1.38 | ) | (1.19 | ) | |||||||||||||
Total distributions | (0.88 | ) | (2.00 | ) | (5.01 | ) | (1.86 | ) | (1.74 | ) | ||||||||||||
Net asset value, end of year | $ | 55.60 | $ | 51.16 | $ | 49.30 | $ | 51.21 | $ | 41.92 | ||||||||||||
| Total Return(b) | 10.47 | % | 8.39 | % | 6.34 | % | 27.40 | % | 2.66 | % | ||||||||||||
Net assets, end of year (in 000’s) | $ | 255,177 | $ | 295,408 | $ | 842,673 | $ | 249,034 | $ | 177,412 | ||||||||||||
Ratio of net expenses to average net assets | 0.56 | % | 0.55 | % | 0.55 | % | 0.56 | % | 0.56 | % | ||||||||||||
Ratio of total expenses to average net assets | 0.62 | % | 0.60 | % | 0.62 | % | 0.74 | % | 0.78 | % | ||||||||||||
Ratio of net investment income to average net assets | 0.94 | % | 1.40 | % | 1.07 | % | 1.50 | % | 1.33 | % | ||||||||||||
Portfolio turnover rate(c) | 213 | % | 199 | % | 168 | % | 193 | % | 213 | % | ||||||||||||
| (a) | Calculated based on the average shares outstanding methodology. |
| (b) | Assumes investment at the NAV at the beginning of the year, reinvestment of all dividends and distributions, a complete redemption of the investment at the NAV at the end of the year and no sales or redemption charges (if any). Total returns would be reduced if a sales or redemption charge was taken into account. Returns do not reflect the impact of taxes to shareholders relating to Fund distributions or the redemption of Fund shares. |
| (c) | The Fund’s portfolio turnover rate is calculated in accordance with regulatory requirements, without regard to transactions involving short term investments and certain derivatives. If such transactions were included, the Fund’s portfolio turnover rate may be higher. |
| 100 | The accompanying notes are an integral part of these financial statements. |
GOLDMAN SACHS U.S. EQUITY INSIGHTS FUND
Financial Highlights (continued)
Selected Share Data for a Share Outstanding Throughout Each Year
| Goldman Sachs U.S. Equity Insights Fund | ||||||||||||||||||||||
| Service Shares | ||||||||||||||||||||||
| Year Ended October 31, | ||||||||||||||||||||||
| 2020 | 2019 | 2018 | 2017 | 2016 | ||||||||||||||||||
| Per Share Data | ||||||||||||||||||||||
Net asset value, beginning of year | $ | 49.19 | $ | 47.41 | $ | 49.47 | $ | 40.60 | $ | 41.37 | ||||||||||||
Net investment income(a) | 0.22 | 0.38 | 0.30 | 0.43 | 0.33 | |||||||||||||||||
Net realized and unrealized gain | 4.64 | 3.13 | 2.45 | 10.14 | 0.50 | |||||||||||||||||
Total from investment operations | 4.86 | 3.51 | 2.75 | 10.57 | 0.83 | |||||||||||||||||
Distributions to shareholders from net investment income | (0.67 | ) | (0.08 | ) | (0.43 | ) | (0.32 | ) | (0.41 | ) | ||||||||||||
Distributions to shareholders from net realized gains | — | (1.65 | ) | (4.38 | ) | (1.38 | ) | (1.19 | ) | |||||||||||||
Total distributions | (0.67 | ) | (1.73 | ) | (4.81 | ) | (1.70 | ) | (1.60 | ) | ||||||||||||
Net asset value, end of year | $ | 53.38 | $ | 49.19 | $ | 47.41 | $ | 49.47 | $ | 40.60 | ||||||||||||
| Total Return(b) | 9.93 | % | 7.86 | % | 5.81 | % | 26.76 | % | 2.15 | % | ||||||||||||
Net assets, end of year (in 000’s) | $ | 5,761 | $ | 6,700 | $ | 5,925 | $ | 6,739 | $ | 5,473 | ||||||||||||
Ratio of net expenses to average net assets | 1.06 | % | 1.05 | % | 1.06 | % | 1.06 | % | 1.06 | % | ||||||||||||
Ratio of total expenses to average net assets | 1.12 | % | 1.13 | % | 1.11 | % | 1.24 | % | 1.28 | % | ||||||||||||
Ratio of net investment income to average net assets | 0.44 | % | 0.81 | % | 0.61 | % | 0.96 | % | 0.83 | % | ||||||||||||
Portfolio turnover rate(c) | 213 | % | 199 | % | 168 | % | 193 | % | 213 | % | ||||||||||||
| (a) | Calculated based on the average shares outstanding methodology. |
| (b) | Assumes investment at the NAV at the beginning of the year, reinvestment of all dividends and distributions, a complete redemption of the investment at the NAV at the end of the year and no sales or redemption charges (if any). Total returns would be reduced if a sales or redemption charge was taken into account. Returns do not reflect the impact of taxes to shareholders relating to Fund distributions or the redemption of Fund shares. |
| (c) | The Fund’s portfolio turnover rate is calculated in accordance with regulatory requirements, without regard to transactions involving short term investments and certain derivatives. If such transactions were included, the Fund’s portfolio turnover rate may be higher. |
| The accompanying notes are an integral part of these financial statements. | 101 |
GOLDMAN SACHS U.S. EQUITY INSIGHTS FUND
Financial Highlights (continued)
Selected Share Data for a Share Outstanding Throughout Each Year
| Goldman Sachs U.S. Equity Insights Fund | ||||||||||||||||||||||
| Investor Shares | ||||||||||||||||||||||
| Year Ended October 31, | ||||||||||||||||||||||
| 2020 | 2019 | 2018 | 2017 | 2016 | ||||||||||||||||||
| Per Share Data | ||||||||||||||||||||||
Net asset value, beginning of year | $ | 48.84 | $ | 47.17 | $ | 49.22 | $ | 40.39 | $ | 41.13 | ||||||||||||
Net investment income(a) | 0.42 | 0.54 | 0.46 | 0.61 | 0.45 | |||||||||||||||||
Net realized and unrealized gain | 4.59 | 3.09 | 2.45 | 10.05 | 0.50 | |||||||||||||||||
Total from investment operations | 5.01 | 3.63 | 2.91 | 10.66 | 0.95 | |||||||||||||||||
Distributions to shareholders from net investment income | (0.83 | ) | (0.31 | ) | (0.58 | ) | (0.45 | ) | (0.50 | ) | ||||||||||||
Distributions to shareholders from net realized gains | — | (1.65 | ) | (4.38 | ) | (1.38 | ) | (1.19 | ) | |||||||||||||
Total distributions | (0.83 | ) | (1.96 | ) | (4.96 | ) | (1.83 | ) | (1.69 | ) | ||||||||||||
Net asset value, end of year | $ | 53.02 | $ | 48.84 | $ | 47.17 | $ | 49.22 | $ | 40.39 | ||||||||||||
| Total Return(b) | 10.33 | % | 8.25 | % | 6.20 | % | 27.21 | % | 2.48 | % | ||||||||||||
Net assets, end of year (in 000’s) | $ | 88,924 | $ | 116,633 | $ | 103,230 | $ | 43,290 | $ | 18,322 | ||||||||||||
Ratio of net expenses to average net assets | 0.69 | % | 0.69 | % | 0.70 | % | 0.71 | % | 0.71 | % | ||||||||||||
Ratio of total expenses to average net assets | 0.75 | % | 0.76 | % | 0.76 | % | 0.89 | % | 0.93 | % | ||||||||||||
Ratio of net investment income to average net assets | 0.84 | % | 1.17 | % | 0.95 | % | 1.36 | % | 1.13 | % | ||||||||||||
Portfolio turnover rate(c) | 213 | % | 199 | % | 168 | % | 193 | % | 213 | % | ||||||||||||
| (a) | Calculated based on the average shares outstanding methodology. |
| (b) | Assumes investment at the NAV at the beginning of the year, reinvestment of all dividends and distributions, a complete redemption of the investment at the NAV at the end of the year and no sales or redemption charges (if any). Total returns would be reduced if a sales or redemption charge was taken into account. Returns do not reflect the impact of taxes to shareholders relating to Fund distributions or the redemption of Fund shares. |
| (c) | The Fund’s portfolio turnover rate is calculated in accordance with regulatory requirements, without regard to transactions involving short term investments and certain derivatives. If such transactions were included, the Fund’s portfolio turnover rate may be higher. |
| 102 | The accompanying notes are an integral part of these financial statements. |
GOLDMAN SACHS U.S. EQUITY INSIGHTS FUND
Financial Highlights (continued)
Selected Share Data for a Share Outstanding Throughout Each Year
| Goldman Sachs U.S. Equity Insights Fund | ||||||||||||||||||||||
| Class R6 Shares | ||||||||||||||||||||||
| Year Ended October 31, | ||||||||||||||||||||||
| 2020 | 2019 | 2018 | 2017 | 2016 | ||||||||||||||||||
| Per Share Data | ||||||||||||||||||||||
Net asset value, beginning of year | $ | 51.13 | $ | 49.27 | $ | 51.19 | $ | 41.91 | $ | 42.60 | ||||||||||||
Net investment income(a) | 0.50 | 0.76 | 0.42 | 0.82 | 0.56 | |||||||||||||||||
Net realized and unrealized gain | 4.83 | 3.10 | 2.68 | 10.33 | 0.50 | |||||||||||||||||
Total from investment operations | 5.33 | 3.86 | 3.10 | 11.15 | 1.06 | |||||||||||||||||
Distributions to shareholders from net investment income | (0.90 | ) | (0.35 | ) | (0.64 | ) | (0.49 | ) | (0.56 | ) | ||||||||||||
Distributions to shareholders from net realized gains | — | (1.65 | ) | (4.38 | ) | (1.38 | ) | (1.19 | ) | |||||||||||||
Total distributions | (0.90 | ) | (2.00 | ) | (5.02 | ) | (1.87 | ) | (1.75 | ) | ||||||||||||
Net asset value, end of year | $ | 55.56 | $ | 51.13 | $ | 49.27 | $ | 51.19 | $ | 41.91 | ||||||||||||
| Total Return(b) | 10.49 | % | 8.38 | % | 6.37 | % | 27.41 | % | 2.66 | % | ||||||||||||
Net assets, end of year (in 000’s) | $ | 8,871 | $ | 12,068 | $ | 31,916 | $ | 2,557 | $ | 60 | ||||||||||||
Ratio of net expenses to average net assets | 0.55 | % | 0.54 | % | 0.54 | % | 0.55 | % | 0.55 | % | ||||||||||||
Ratio of total expenses to average net assets | 0.61 | % | 0.59 | % | 0.63 | % | 0.71 | % | 0.77 | % | ||||||||||||
Ratio of net investment income to average net assets | 0.95 | % | 1.49 | % | 0.82 | % | 1.70 | % | 1.36 | % | ||||||||||||
Portfolio turnover rate(c) | 213 | % | 199 | % | 168 | % | 193 | % | 213 | % | ||||||||||||
| (a) | Calculated based on the average shares outstanding methodology. |
| (b) | Assumes investment at the NAV at the beginning of the year, reinvestment of all dividends and distributions, a complete redemption of the investment at the NAV at the end of the year and no sales or redemption charges (if any). Total returns would be reduced if a sales or redemption charge was taken into account. Returns do not reflect the impact of taxes to shareholders relating to Fund distributions or the redemption of Fund shares. |
| (c) | The Fund’s portfolio turnover rate is calculated in accordance with regulatory requirements, without regard to transactions involving short term investments and certain derivatives. If such transactions were included, the Fund’s portfolio turnover rate may be higher. |
| The accompanying notes are an integral part of these financial statements. | 103 |
GOLDMAN SACHS U.S. EQUITY INSIGHTS FUND
Financial Highlights (continued)
Selected Share Data for a Share Outstanding Throughout Each Year
| Goldman Sachs U.S. Equity Insights Fund | ||||||||||||||||||||||
| Class R Shares | ||||||||||||||||||||||
| Year Ended October 31, | ||||||||||||||||||||||
| 2020 | 2019 | 2018 | 2017 | 2016 | ||||||||||||||||||
| Per Share Data | ||||||||||||||||||||||
Net asset value, beginning of year | $ | 48.47 | $ | 46.74 | $ | 48.89 | $ | 40.12 | $ | 40.91 | ||||||||||||
Net investment income(a) | 0.16 | 0.32 | 0.23 | 0.37 | 0.27 | |||||||||||||||||
Net realized and unrealized gain | 4.57 | 3.08 | 2.42 | 10.01 | 0.49 | |||||||||||||||||
Total from investment operations | 4.73 | 3.40 | 2.65 | 10.38 | 0.76 | |||||||||||||||||
Distributions to shareholders from net investment income | (0.57 | ) | (0.02 | ) | (0.42 | ) | (0.23 | ) | (0.36 | ) | ||||||||||||
Distributions to shareholders from net realized gains | — | (1.65 | ) | (4.38 | ) | (1.38 | ) | (1.19 | ) | |||||||||||||
Total distributions | (0.57 | ) | (1.67 | ) | (4.80 | ) | (1.61 | ) | (1.55 | ) | ||||||||||||
Net asset value, end of year | $ | 52.63 | $ | 48.47 | $ | 46.74 | $ | 48.89 | $ | 40.12 | ||||||||||||
| Total Return(b) | 9.79 | % | 7.72 | % | 5.65 | % | 26.58 | % | 1.99 | % | ||||||||||||
Net assets, end of year (in 000’s) | $ | 41,005 | $ | 44,555 | $ | 49,993 | $ | 51,263 | $ | 30,341 | ||||||||||||
Ratio of net expenses to average net assets | 1.19 | % | 1.19 | % | 1.20 | % | 1.21 | % | 1.21 | % | ||||||||||||
Ratio of total expenses to average net assets | 1.25 | % | 1.26 | % | 1.25 | % | 1.39 | % | 1.43 | % | ||||||||||||
Ratio of net investment income to average net assets | 0.31 | % | 0.69 | % | 0.48 | % | 0.84 | % | 0.70 | % | ||||||||||||
Portfolio turnover rate(c) | 213 | % | 199 | % | 168 | % | 193 | % | 213 | % | ||||||||||||
| (a) | Calculated based on the average shares outstanding methodology. |
| (b) | Assumes investment at the NAV at the beginning of the year, reinvestment of all dividends and distributions, a complete redemption of the investment at the NAV at the end of the year and no sales or redemption charges (if any). Total returns would be reduced if a sales or redemption charge was taken into account. Returns do not reflect the impact of taxes to shareholders relating to Fund distributions or the redemption of Fund shares. |
| (c) | The Fund’s portfolio turnover rate is calculated in accordance with regulatory requirements, without regard to transactions involving short term investments and certain derivatives. If such transactions were included, the Fund’s portfolio turnover rate may be higher. |
| 104 | The accompanying notes are an integral part of these financial statements. |
GOLDMAN SACHS U.S. EQUITY INSIGHTS FUND
Financial Highlights (continued)
Selected Share Data for a Share Outstanding Throughout Each Period
| Goldman Sachs U.S. Equity Insights Fund | ||||||||||||||
| Class P Shares | ||||||||||||||
| Year Ended October 31, | Period Ended October 31, 2018(a) | |||||||||||||
| 2020 | 2019 | |||||||||||||
| Per Share Data | ||||||||||||||
Net asset value, beginning of period | $ | 51.14 | $ | 49.28 | $ | 49.09 | ||||||||
Net investment income(b) | 0.50 | 0.65 | 0.26 | |||||||||||
Net realized and unrealized gain (loss) | 4.83 | 3.21 | (0.07 | ) | ||||||||||
Total from investment operations | 5.33 | 3.86 | 0.19 | |||||||||||
Distributions to shareholders from net investment income | (0.91 | ) | (0.35 | ) | — | |||||||||
Distributions to shareholders from net realized gains | — | (1.65 | ) | — | ||||||||||
Total distributions | (0.91 | ) | (2.00 | ) | — | |||||||||
Net asset value, end of period | $ | 55.56 | $ | 51.14 | $ | 49.28 | ||||||||
| Total Return(c) | 10.49 | % | 8.40 | % | 0.39 | % | ||||||||
Net assets, end of period (in 000’s) | $ | 245,632 | $ | 225,899 | $ | 203,525 | ||||||||
Ratio of net expenses to average net assets | 0.55 | % | 0.54 | % | 0.54 | %(d) | ||||||||
Ratio of total expenses to average net assets | 0.61 | % | 0.62 | % | 0.62 | %(d) | ||||||||
Ratio of net investment income to average net assets | 0.94 | % | 1.33 | % | 0.93 | %(d) | ||||||||
Portfolio turnover rate(e) | 213 | % | 199 | % | 168 | % | ||||||||
| (a) | Commenced operations on April 16, 2018. |
| (b) | Calculated based on the average shares outstanding methodology. |
| (c) | Assumes investment at the NAV at the beginning of the period, reinvestment of all dividends and distributions, a complete redemption of the investment at the NAV at the end of the period and no sales or redemption charges (if any). Total returns would be reduced if a sales or redemption charge was taken into account. Returns do not reflect the impact of taxes to shareholders relating to Fund distributions or the redemption of Fund shares. Total returns for periods less than one full year are not annualized. |
| (d) | Annualized. |
| (e) | The Fund’s portfolio turnover rate is calculated in accordance with regulatory requirements, without regard to transactions involving short term investments and certain derivatives. If such transactions were included, the Fund’s portfolio turnover rate may be higher. |
| The accompanying notes are an integral part of these financial statements. | 105 |
GOLDMAN SACHS DOMESTIC EQUITY INSIGHTS FUNDS
October 31, 2020
| 1. ORGANIZATION |
Goldman Sachs Trust (the “Trust”) is a Delaware statutory trust registered under the Investment Company Act of 1940, as amended (the “Act”), as an open-end management investment company. The following table lists those series of the Trust that are included in this report (collectively, the “Funds” or individually a “Fund”), along with their corresponding share classes and respective diversification status under the Act:
| Fund | Share Classes Offered | Diversified/ Non-diversified | ||
Large Cap Growth Insights | A, C, Institutional, Service, Investor, R6, R and P | Non-diversified | ||
| Large Cap Value Insights, Small Cap Equity Insights and U.S. Equity Insights | A, C, Institutional, Service, Investor, R6, R and P | Diversified | ||
| Small Cap Growth Insights and Small Cap Value Insights | A, C, Institutional, Investor, R6, R and P | Diversified |
Class A Shares are sold with a front-end sales charge of up to 5.50%. Class C Shares are sold with a contingent deferred sales charge (“CDSC”) of 1.00%, which is imposed on redemptions made within 12 months of purchase. Institutional, Service, Investor, Class R6, Class R and Class P Shares are not subject to a sales charge.
Goldman Sachs Asset Management, L.P. (“GSAM”), an affiliate of Goldman Sachs & Co. LLC (“Goldman Sachs”), serves as investment adviser to the Funds pursuant to a management agreement (the “Agreement”) with the Trust.
| 2. SIGNIFICANT ACCOUNTING POLICIES |
The financial statements have been prepared in accordance with accounting principles generally accepted in the United States of America (“GAAP”) and require management to make estimates and assumptions that may affect the reported amounts and disclosures. Actual results may differ from those estimates and assumptions. Each Fund is an investment company under GAAP and follows the accounting and reporting guidance applicable to investment companies.
A. Investment Valuation — The Funds’ valuation policy is to value investments at fair value.
B. Investment Income and Investments — Investment income includes interest income, dividend income, and securities lending income, if any. Interest income is accrued daily and adjusted for amortization of premiums and accretion of discounts. Dividend income is recognized on ex-dividend date or, for certain foreign securities, as soon as such information is obtained subsequent to the ex-dividend date. Non-cash dividends, if any, are recorded at the fair market value of the securities received. Investment transactions are reflected on trade date. Realized gains and losses are calculated using identified cost. Investment transactions are recorded on the following business day for daily net asset value (“NAV”) calculations. Investment income is recorded net of any foreign withholding taxes, less any amounts reclaimable. The Funds may file withholding tax reclaims in certain jurisdictions to recover a portion of amounts previously withheld. Any foreign capital gains tax is accrued daily based upon net unrealized gains, and is payable upon sale of such investments. Distributions received from the Funds’ investments in U.S. real estate investment trusts (“REITs”) may be characterized as ordinary income, net capital gain and/or a return of capital. A return of capital is recorded by the Funds as a reduction to the cost basis of the REIT.
For derivative contracts, realized gains and losses are recorded upon settlement of the contract.
C. Class Allocations and Expenses — Investment income, realized and unrealized gain (loss), if any, and non-class specific expenses of each Fund are allocated daily based upon the proportion of net assets of each class. Non-class specific expenses directly incurred by a Fund are charged to that Fund, while such expenses incurred by the Trust are allocated across the applicable Funds on a straight-line and/or pro-rata basis depending upon the nature of the expenses. Class specific expenses, where
106
GOLDMAN SACHS DOMESTIC EQUITY INSIGHTS FUNDS
| 2. SIGNIFICANT ACCOUNTING POLICIES (continued) |
applicable, are borne by the respective share classes and include Distribution and Service, Transfer Agency and Service and Shareholder Administration fees.
D. Federal Taxes and Distributions to Shareholders — It is each Fund’s policy to comply with the requirements of the Internal Revenue Code of 1986, as amended (the “Code”), applicable to regulated investment companies and to distribute each year substantially all of its investment company taxable income and capital gains to its shareholders. Accordingly, each Fund is not required to make any provisions for the payment of federal income tax. Distributions to shareholders are recorded on the ex-dividend date. Income and capital gains distributions, if any, are declared and paid according to the following schedule:
| Fund | Income Distributions Declared/Paid | Capital Gains Distributions Declared/Paid | ||||
Large Cap Value Insights | Quarterly | Annually | ||||
Large Cap Growth Insights, Small Cap Equity Insights, Small Cap Growth Insights, Small Cap Value Insights and U.S. Equity Insights | Annually | Annually |
Net capital losses, if any, are carried forward to future fiscal years and may be used to the extent allowed by the Code to offset any future capital gains. Losses that are carried forward will retain their character as either short-term or long-term capital losses. Utilization of capital loss carryforwards will reduce the requirement of future capital gains distributions.
The characterization of distributions to shareholders for financial reporting purposes is determined in accordance with federal income tax rules, which may differ from GAAP. The source of each Fund’s distributions may be shown in the accompanying financial statements as either from distributable earnings or capital. Certain components of the Funds’ net assets on the Statements of Assets and Liabilities reflect permanent GAAP/tax differences based on the appropriate tax character.
| 3. INVESTMENTS AND FAIR VALUE MEASUREMENTS |
U.S. GAAP defines the fair value of a financial instrument as the amount that would be received to sell an asset or paid to transfer a liability in an orderly transaction between market participants at the measurement date (i.e., the exit price); the Funds’ policy is to use the market approach. GAAP establishes a fair value hierarchy that prioritizes the inputs to valuation techniques used to measure fair value. The hierarchy gives the highest priority to unadjusted quoted prices in active markets for identical assets or liabilities (Level 1 measurements) and the lowest priority to unobservable inputs (Level 3 measurements). The level in the fair value hierarchy within which the fair value measurement in its entirety falls shall be determined based on the lowest level input that is significant to the fair value measurement in its entirety. The levels used for classifying investments are not necessarily an indication of the risk associated with investing in these investments. The three levels of the fair value hierarchy are described below:
Level 1 — Unadjusted quoted prices in active markets that are accessible at the measurement date for identical, unrestricted assets or liabilities;
Level 2 — Quoted prices in markets that are not active or financial instruments for which significant inputs are observable (including, but not limited to, quoted prices for similar investments, interest rates, foreign exchange rates, volatility and credit spreads), either directly or indirectly;
Level 3 — Prices or valuations that require significant unobservable inputs (including GSAM’s assumptions in determining fair value measurement).
The Board of Trustees (“Trustees”) has approved Valuation Procedures that govern the valuation of the portfolio investments held by the Funds, including investments for which market quotations are not readily available. The Trustees have delegated to GSAM day-to-day responsibility for implementing and maintaining internal controls and procedures related to the valuation of the Funds’ investments. To assess the continuing appropriateness of pricing sources and methodologies, GSAM regularly performs price
107
GOLDMAN SACHS DOMESTIC EQUITY INSIGHTS FUNDS
Notes to Financial Statements (continued)
October 31, 2020
| 3. INVESTMENTS AND FAIR VALUE MEASUREMENTS (continued) |
verification procedures and issues challenges as necessary to third party pricing vendors or brokers, and any differences are reviewed in accordance with the Valuation Procedures.
A. Level 1 and Level 2 Fair Value Investments — The valuation techniques and significant inputs used in determining the fair values for investments classified as Level 1 and Level 2 are as follows:
Equity Securities — Equity securities traded on a United States (“U.S.”) securities exchange or the NASDAQ system, or those located on certain foreign exchanges, including but not limited to the Americas, are valued daily at their last sale price or official closing price on the principal exchange or system on which they are traded. If there is no sale or official closing price or such price is believed by GSAM to not represent fair value, equity securities will be valued at the valid closing bid price for long positions and at the valid closing ask price for short positions (i.e. where there is sufficient volume, during normal exchange trading hours). If no valid bid/ask price is available, the equity security will be valued pursuant to the Valuation Procedures approved by the Trustees and consistent with applicable regulatory guidance. To the extent these investments are actively traded, they are classified as Level 1 of the fair value hierarchy, otherwise they are generally classified as Level 2. Certain equity securities containing unique attributes may be classified as Level 2.
Unlisted equity securities for which market quotations are available are valued at the last sale price on the valuation date, or if no sale occurs, at the last bid price for long positions or the last ask price for short positions, and are generally classified as Level 2. Securities traded on certain foreign securities exchanges are valued daily at fair value determined by an independent fair value service (if available) under Fair Valuation Procedures approved by the Trustees and consistent with applicable regulatory guidance. The independent fair value service takes into account multiple factors including, but not limited to, movements in the securities markets, certain depositary receipts, futures contracts and foreign currency exchange rates that have occurred subsequent to the close of the foreign securities exchange. These investments are generally classified as Level 2 of the fair value hierarchy.
Money Market Funds — Investments in the Goldman Sachs Financial Square Government Fund (“Underlying Fund”) are valued at the NAV per share of the Institutional Share class on the day of valuation. These investments are generally classified as Level 1 of the fair value hierarchy. For information regarding the Underlying Fund’s accounting policies and investment holdings, please see the Underlying Fund’s shareholder report.
Derivative Contracts — A derivative is an instrument whose value is derived from underlying assets, indices, reference rates or a combination of these factors. A Fund enters into derivative transactions to hedge against changes in interest rates, securities prices, and/or currency exchange rates, to increase total return, or to gain access to certain markets or attain exposure to other underliers. For financial reporting purposes, cash collateral that has been pledged to cover obligations of a Fund and cash collateral received, if any, is reported separately on the Statements of Assets and Liabilities as receivables/payables for collateral on certain derivatives contracts. Non-cash collateral pledged by a Fund, if any, is noted in the Schedules of Investments.
Exchange-traded derivatives, including futures and options contracts, are generally valued at the last sale or settlement price on the exchange where they are principally traded. Exchange-traded options without settlement prices are generally valued at the midpoint of the bid and ask prices on the exchange where they are principally traded (or, in the absence of two-way trading, at the last bid price for long positions and the last ask price for short positions). Exchange-traded derivatives typically fall within Level 1 of the fair value hierarchy. Over-the-counter (“OTC”) and centrally cleared derivatives are valued using market transactions and other market evidence, including market-based inputs to models, calibration to market-clearing transactions, broker or dealer quotations, or other alternative pricing sources. Where models are used, the selection of a particular model to value OTC and centrally cleared derivatives depends upon the contractual terms of, and specific risks inherent in, the instrument, as well as the availability of pricing information in the market. Valuation models require a variety of inputs, including contractual terms, market prices, yield curves, credit curves, measures of volatility, voluntary and involuntary prepayment rates, loss severity rates and correlations of such inputs. For OTC and centrally cleared derivatives that trade in liquid markets, model inputs can generally be verified and model selection does not involve significant management judgment. OTC and centrally cleared derivatives are classified within Level 2 of the fair value hierarchy when significant inputs are corroborated by market evidence.
i. Futures Contracts — Futures contracts are contracts to buy or sell a standardized quantity of a specified commodity or security. Upon entering into a futures contract, a Fund deposits cash or securities in an account on behalf of the broker in an
108
GOLDMAN SACHS DOMESTIC EQUITY INSIGHTS FUNDS
| 3. INVESTMENTS AND FAIR VALUE MEASUREMENTS (continued) |
amount sufficient to meet the initial margin requirement. Subsequent payments are made or received by a Fund equal to the daily change in the contract value and are recorded as variation margin receivable or payable with a corresponding offset to unrealized gains or losses.
B. Level 3 Fair Value Investments — To the extent that significant inputs to valuation models and other alternative pricing sources are unobservable, or if quotations are not readily available, or if GSAM believes that such quotations do not accurately reflect fair value, the fair value of a Fund’s investments may be determined under Valuation Procedures approved by the Trustees. GSAM, consistent with its procedures and applicable regulatory guidance, may make an adjustment to the most recent valuation prices of either domestic or foreign securities in light of significant events to reflect what it believes to be the fair value of the securities at the time of determining a Fund’s NAV. To the extent investments are valued using single source broker quotations obtained directly from the broker or passed through from third party pricing vendors, such investments are classified as Level 3 investments.
C. Fair Value Hierarchy — The following is a summary of the Funds’ investments and derivatives classified in the fair value hierarchy as of October 31, 2020:
| LARGE CAP GROWTH INSIGHTS FUND | ||||||||||||
| Investment Type | Level 1 | Level 2 | Level 3 | |||||||||
| Assets | ||||||||||||
Common Stock and/or Other Equity Investments(a) | ||||||||||||
Europe | $ | 6,490,894 | $ | — | $ | — | ||||||
North America | 1,861,596,764 | — | — | |||||||||
| Total | $ | 1,868,087,658 | $ | — | $ | — | ||||||
| Derivative Type | ||||||||||||
| Assets(b) | ||||||||||||
Futures Contracts | $ | 6,645 | $ | — | $ | — | ||||||
| LARGE CAP VALUE INSIGHTS FUND | ||||||||||||
| Investment Type | Level 1 | Level 2 | Level 3 | |||||||||
| Assets | ||||||||||||
Common Stock and/or Other Equity Investments(a) | ||||||||||||
Europe | $ | 6,492,159 | $ | — | $ | — | ||||||
North America | 310,780,387 | — | — | |||||||||
South America | 61,028 | — | — | |||||||||
| Total | $ | 317,333,574 | $ | — | $ | — | ||||||
| (a) | Amounts are disclosed by continent to highlight the impact of time zone differences between local market close and the calculation of NAV. Security valuations are based on the principal exchange or system on which they are traded, which may differ from country of domicile noted in table. |
| (b) | Amount shown represents unrealized gain (loss) at period end. |
109
GOLDMAN SACHS DOMESTIC EQUITY INSIGHTS FUNDS
Notes to Financial Statements (continued)
October 31, 2020
| 3. INVESTMENTS AND FAIR VALUE MEASUREMENTS (continued) |
| SMALL CAP EQUITY INSIGHTS FUND | ||||||||||||
| Investment Type | Level 1 | Level 2 | Level 3 | |||||||||
| Assets | ||||||||||||
Common Stock and/or Other Equity Investments(a) | ||||||||||||
Asia | $ | 534,958 | $ | — | $ | — | ||||||
Europe | 2,447,513 | — | — | |||||||||
North America | 536,159,553 | — | — | |||||||||
Securities Lending Reinvestment Vehicle | 5,113,213 | — | — | |||||||||
| Total | $ | 544,255,237 | $ | — | $ | — | ||||||
| SMALL CAP GROWTH INSIGHTS FUND | ||||||||||||
| Investment Type | Level 1 | Level 2 | Level 3 | |||||||||
| Assets | ||||||||||||
Common Stock and/or Other Equity Investments(a) | ||||||||||||
Asia | $ | 3,613,144 | $ | — | $ | — | ||||||
Europe | 1,272,308 | — | — | |||||||||
North America | 972,858,290 | — | — | |||||||||
Securities Lending Reinvestment Vehicle | 11,156,338 | — | — | |||||||||
| Total | $ | 988,900,080 | $ | — | $ | — | ||||||
| SMALL CAP VALUE INSIGHTS FUND | ||||||||||||
| Investment Type | Level 1 | Level 2 | Level 3 | |||||||||
| Assets | ||||||||||||
Common Stock and/or Other Equity Investments(a) | ||||||||||||
Africa | $ | 132,789 | $ | — | $ | — | ||||||
Europe | 6,257,628 | — | — | |||||||||
North America | 749,246,728 | — | — | |||||||||
Investment Company | 699,934 | — | — | |||||||||
Securities Lending Reinvestment Vehicle | 3,369,422 | — | — | |||||||||
| Total | $ | 759,706,501 | $ | — | $ | — | ||||||
| Derivative Type | ||||||||||||
| Liabilities(c) | ||||||||||||
Futures Contracts | $ | (327,444 | ) | $ | — | $ | — | |||||
| (a) | Amounts are disclosed by continent to highlight the impact of time zone differences between local market close and the calculation of NAV. Security valuations are based on the principal exchange or system on which they are traded, which may differ from country of domicile noted in table. |
| (c) | Amount shown represents unrealized loss at fiscal year end. |
110
GOLDMAN SACHS DOMESTIC EQUITY INSIGHTS FUNDS
| 3. INVESTMENTS AND FAIR VALUE MEASUREMENTS (continued) |
| U.S. EQUITY INSIGHTS FUND | ||||||||||||
| Investment Type | Level 1 | Level 2 | Level 3 | |||||||||
| Assets | ||||||||||||
Common Stock and/or Other Equity Investments(a) | ||||||||||||
Europe | $ | 12,453,236 | $ | — | $ | — | ||||||
North America | 926,411,482 | — | — | |||||||||
Investment Company | 2,919,683 | — | — | |||||||||
| Total | $ | 941,784,401 | $ | — | $ | — | ||||||
| (a) | Amounts are disclosed by continent to highlight the impact of time zone differences between local market close and the calculation of NAV. Security valuations are based on the principal exchange or system on which they are traded, which may differ from country of domicile noted in table. |
For further information regarding security characteristics, see the Schedules of Investments.
| 4. INVESTMENTS IN DERIVATIVES |
The following tables set forth, by certain risk types, the gross value of derivative contracts (not considered to be hedging instruments for accounting disclosure purposes) as of October 31, 2020. These instruments were used as part of the Funds’ investment strategies and to obtain and/or manage exposure related to the risks below. The values in the tables below exclude the effects of cash collateral received or posted pursuant to these derivative contracts, and therefore are not representative of the Funds’ net exposure.
| Risk | Fund | Statement of Assets and Liabilities | Assets (Liabilities)(a) | |||||||||||||||||
Equity | Large Cap Growth Insights | Variation Margin on Futures Contracts | $ | 6,645 | ||||||||||||||||
Equity | Small Cap Value Insights | Variation Margin on Futures Contracts | (327,444 | ) | ||||||||||||||||
| (a) | Includes unrealized gain (loss) on futures contracts described in the Additional Investment Information sections of the Schedules of Investments. Only the variation margin as of October 31, 2020 is reported within the Statements of Assets and Liabilities. |
The following tables set forth, by certain risk types, the Funds’ gains (losses) related to these derivatives and their indicative volumes for the fiscal year ended October 31, 2020. These gains (losses) should be considered in the context that these derivative contracts may have been executed to create investment opportunities and/or economically hedge certain investments, and accordingly, certain gains (losses) on such derivative contracts may offset certain (losses) gains attributable to investments. These gains (losses) are included in “Net realized gain (loss)” or “Net change in unrealized gain (loss)” on the Statements of Operations:
| Risk | Fund | Net Realized Gain (Loss) from Futures Contracts | Net Change in Futures Contracts | Average Number of Contracts(a) | ||||||||||||||
| Equity | Large Cap Growth Insights | $ | 1,151,295 | $ | 6,645 | 20 | ||||||||||||
| Equity | Large Cap Value Insights | 299,068 | — | 3 | ||||||||||||||
| Equity | Small Cap Equity Insights | (2,606,855 | ) | 141,112 | 65 | |||||||||||||
| Equity | Small Cap Growth Insights | 4,724,182 | 234,858 | 102 | ||||||||||||||
| Equity | Small Cap Value Insights | (1,174,911 | ) | (735,645 | ) | 130 | ||||||||||||
| Equity | U.S. Equity Insights | 255,674 | — | 10 | ||||||||||||||
| (a) | Average number of contracts is based on the month end balances for the fiscal year ended October 31, 2020. |
111
GOLDMAN SACHS DOMESTIC EQUITY INSIGHTS FUNDS
Notes to Financial Statements (continued)
October 31, 2020
| 5. AGREEMENTS AND AFFILIATED TRANSACTIONS |
A. Management Agreement — Under the Agreement, GSAM manages the Funds, subject to the general supervision of the Trustees.
As compensation for the services rendered pursuant to the Agreement, the assumption of the expenses related thereto and administration of the Funds’ business affairs, including providing facilities, GSAM is entitled to a management fee, accrued daily and paid monthly, equal to an annual percentage rate of each Fund’s average daily net assets.
For the fiscal year ended October 31, 2020, contractual and effective net management fees with GSAM were at the following rates:
| Contractual Management Rate | Effective Net Management Rate^ | |||||||||||||||||||||||||||||||
| Fund | First $1 billion | Next $1 billion | Next $3 billion | Next $3 billion | Over $8 billion | Effective Rate | ||||||||||||||||||||||||||
Large Cap Growth Insights | 0.52 | % | 0.47 | % | 0.44 | % | 0.44 | % | 0.43 | % | 0.50 | % | 0.50 | % | ||||||||||||||||||
Large Cap Value Insights | 0.52 | 0.47 | 0.44 | 0.44 | 0.43 | 0.52 | 0.52 | |||||||||||||||||||||||||
Small Cap Equity Insights | 0.80 | 0.80 | 0.72 | 0.68 | 0.67 | 0.80 | 0.80 | |||||||||||||||||||||||||
Small Cap Growth Insights | 0.80 | 0.80 | 0.72 | 0.68 | 0.67 | 0.80 | 0.80 | |||||||||||||||||||||||||
Small Cap Value Insights | 0.80 | 0.80 | 0.72 | 0.68 | 0.67 | 0.80 | 0.80 | |||||||||||||||||||||||||
U.S. Equity Insights | 0.52 | 0.47 | 0.44 | 0.44 | 0.43 | 0.52 | 0.52 | |||||||||||||||||||||||||
| ^ | Effective Net Management Rate includes the impact of management fee waivers of affiliated underlying funds, if any. |
The Large Cap Growth Insights, Large Cap Value Insights, Small Cap Equity Insights, Small Cap Growth Insights, Small Cap Value Insights and U.S. Equity Insights Funds invest in Institutional Shares of the Government Money Market Fund, which is an affiliated Underlying Fund. GSAM has agreed to waive a portion of its management fee payable by the Funds in an amount equal to the management fee it earns as an investment adviser to the affiliated Underlying Funds in which the Funds invest, except those management fees it earns from the Fund’s investments of cash collateral received in connection with securities lending transactions in the Underlying Fund. For the fiscal year ended October 31, 2020, the management fee waived by GSAM for each Fund was as follows:
| Fund | Management Fee Waived | |||||
Large Cap Growth Insights | $ | 995 | ||||
Large Cap Value Insights | 215 | |||||
Small Cap Equity Insights | 5,044 | |||||
Small Cap Growth Insights | 3,980 | |||||
Small Cap Value Insights | 9,568 | |||||
U.S. Equity Insights | 755 | |||||
B. Distribution and/or Service (12b-1) Plans — The Trust, on behalf of Class A and Class R Shares of each applicable Fund, has adopted Distribution and Service Plans subject to Rule 12b-1 under the Act. Under the Distribution and Service Plans, Goldman Sachs, which serves as distributor (the “Distributor”), is entitled to a fee accrued daily and paid monthly for distribution services and personal and account maintenance services, which may then be paid by Goldman Sachs to authorized dealers. These fees are equal to an annual percentage rate of the average daily net assets attributable to Class A or Class R Shares of the Funds, as applicable, as set forth below.
112
GOLDMAN SACHS DOMESTIC EQUITY INSIGHTS FUNDS
| 5. AGREEMENTS AND AFFILIATED TRANSACTIONS (continued) |
The Trust, on behalf of Class C Shares of each applicable Fund, has adopted a Distribution Plan subject to Rule 12b-1 under the Act. Under the Distribution Plan, Goldman Sachs as Distributor is entitled to a fee accrued daily and paid monthly for distribution services, which may then be paid by Goldman Sachs to authorized dealers. These fees are equal to an annual percentage rate of the average daily net assets attributable to Class C Shares of the Funds, as set forth below.
The Trust, on behalf of Service Shares of each applicable Fund, has adopted a Service Plan subject to Rule 12b-1 under the Act to allow Service Shares to compensate service organizations (including Goldman Sachs) for providing personal and account maintenance services to their customers who are beneficial owners of such shares. The Service Plan provides for compensation to the service organizations equal to an annual percentage rate of the average daily net assets attributable to Service Shares of the Funds as set forth below.
| Distribution and/or Service Plan Rates | ||||||||||||||||
| Class A* | Class C | Service Shares | Class R* | |||||||||||||
Distribution and/or Service Plan | 0.25 | % | 0.75 | % | 0.25 | % | 0.50 | % | ||||||||
| * | With respect to Class A and Class R Shares, the Distributor at its discretion may use compensation for distribution services paid under the Distribution and/or Service Plan to compensate service organizations for personal and account maintenance services and expenses as long as such total compensation does not exceed the maximum cap on “service fees” imposed by the Financial Industry Regulatory Authority. |
C. Distribution Agreement — Goldman Sachs, as Distributor of the shares of the Funds pursuant to a Distribution Agreement, may retain a portion of the Class A Shares’ front end sales charge and Class C Shares’ CDSC. For the fiscal year ended October 31, 2020, Goldman Sachs retained the following amounts:
| Front End Sales Charge | Contingent Deferred Sales Charge | |||||||||
| Fund | Class A | Class C | ||||||||
Large Cap Growth Insights | $ | 22,982 | $ | 74 | ||||||
Large Cap Value Insights | 4,324 | 590 | ||||||||
Small Cap Equity Insights | 2,844 | 365 | ||||||||
Small Cap Growth Insights | 4,649 | 54 | ||||||||
Small Cap Value Insights | 5,900 | 13 | ||||||||
U.S. Equity Insights | 11,322 | 755 | ||||||||
D. Service and/or Shareholder Administration Plans — The Trust, on behalf of each applicable Fund, has adopted Service Plans to allow Class C Shares and Shareholder Administration Plans to allow Service Shares, respectively, to compensate service organizations (including Goldman Sachs) for providing varying levels of personal and account maintenance or shareholder administration services to their customers who are beneficial owners of such shares. The Service and Shareholder Administration Plans each provide for compensation to the service organizations equal to an annual percentage rate of 0.25% of the average daily net assets attributable to Class C and Service Shares of the Funds.
E. Transfer Agency Agreement — Goldman Sachs also serves as the transfer agent of the Funds for a fee pursuant to the Transfer Agency Agreement. The fees charged for such transfer agency services are accrued daily and paid monthly at annual rates as follows: 0.16% of the average daily net assets of Class A, Class C, Investor and Class R Shares; 0.03% of the average daily net assets of Class R6 and Class P Shares; and 0.04% of the average daily net assets of Institutional and Service Shares. Prior to July 1, 2020, the fee rate for such transfer agency services was 0.17% of the average daily net assets of Class A, Class C, Investor and Class R Shares.
F. Other Expense Agreements and Affiliated Transactions — GSAM has agreed to reduce or limit certain “Other Expenses” of the Funds (excluding acquired fund fees and expenses, transfer agency fees and expenses, service fees and
113
GOLDMAN SACHS DOMESTIC EQUITY INSIGHTS FUNDS
Notes to Financial Statements (continued)
October 31, 2020
| 5. AGREEMENTS AND AFFILIATED TRANSACTIONS (continued) |
shareholder administration fees (as applicable), taxes, interest, brokerage fees, expenses of shareholder meetings, litigation and indemnification, and extraordinary expenses) to the extent such expenses exceed, on an annual basis, a percentage rate of the average daily net assets of each Fund. Such Other Expense reimbursements, if any, are accrued daily and paid monthly. In addition, the Funds are not obligated to reimburse GSAM for prior fiscal year expense reimbursements, if any. The Other Expense limitations as an annual percentage rate of average daily net assets are 0.004%. These Other Expense limitations will remain in place through at least February 28, 2021, and prior to such date GSAM may not terminate the arrangements without the approval of the Trustees. In addition, the Funds have entered into certain offset arrangements with the transfer agent, which may result in a reduction of the Funds’ expenses and are received irrespective of the application of the “Other Expense” limitations described above.
For the fiscal year ended October 31, 2020, these expense reductions, including any fee waivers and Other Expense reimbursements, were as follows:
| Fund | Management Fee Waiver | Other Expense | Total Expense | |||||||||||
Large Cap Growth Insights | $ | 995 | $ | 671,662 | $ | 672,657 | ||||||||
Large Cap Value Insights | 215 | 401,652 | 401,867 | |||||||||||
Small Cap Equity Insights | 5,044 | 485,995 | 491,039 | |||||||||||
Small Cap Growth Insights | 3,980 | 853,633 | 857,613 | |||||||||||
Small Cap Value Insights | 9,568 | 602,334 | 611,902 | |||||||||||
U.S. Equity Insights | 755 | 536,888 | 537,643 | |||||||||||
G. Line of Credit Facility — As of October 31, 2020, the Funds participated in a $700,000,000 committed, unsecured revolving line of credit facility (the “facility”) together with other funds of the Trust and certain registered investment companies having management agreements with GSAM or its affiliates. This facility is to be used for temporary emergency purposes, or to allow for an orderly liquidation of securities to meet redemption requests. The interest rate on borrowings is based on the federal funds rate. The facility also requires a fee to be paid by the Funds based on the amount of the commitment that has not been utilized. For the fiscal year ended October 31, 2020, the Funds did not have any borrowings under the facility. Prior to April 28, 2020, the facility was $580,000,000.
H. Other Transactions with Affiliates — For the fiscal year ended October 31, 2020, Goldman Sachs earned $84 in brokerage commissions from portfolio transactions, including futures transactions executed with Goldman Sachs as the Futures Commission Merchant, on behalf of the Small Cap Value Insights Fund.
As of October 31, 2020, the following Goldman Sachs Dynamic Global Equity Fund and Goldman Sachs Enhanced Dividend Global Equity Portfolio were beneficial owners of 5% or more of total outstanding shares of the following Funds:
| Fund | Goldman Sachs Dynamic Global Equity | Goldman Sachs Enhanced Dividend Global Equity | ||||||||
Large Cap Value Insights | 14 | % | — | % | ||||||
Small Cap Equity Insights | — | 6 | ||||||||
114
GOLDMAN SACHS DOMESTIC EQUITY INSIGHTS FUNDS
| 5. AGREEMENTS AND AFFILIATED TRANSACTIONS (continued) |
The following table provides information about the Funds’ investments in the Underlying Fund as of and for the fiscal year ended October 31, 2020:
| Fund | Market Value as of October 31, 2019 | Purchased at Cost | Proceeds from Sales | Market Value as of October 31, 2020 | Shares as of October 31, 2020 | Dividend Income from Affiliated Investment Companies | ||||||||||||||||||
Large Cap Growth Insights | $ | — | $ | 105,234,208 | $ | (105,234,208 | ) | $ | — | — | $ | 1,262 | ||||||||||||
Large Cap Value Insights | — | 6,916,772 | (6,916,772 | ) | — | — | 1,558 | |||||||||||||||||
Small Cap Equity Insights | 7,203,961 | 55,890,011 | (63,093,972 | ) | — | — | 41,763 | |||||||||||||||||
Small Cap Growth Insights | 10,845,477 | 55,947,309 | (66,792,786 | ) | — | 31,922 | ||||||||||||||||||
Small Cap Value Insights | 10,633,890 | 193,845,356 | (203,779,312 | ) | 699,934 | 699,934 | 71,062 | |||||||||||||||||
U.S. Equity Insights | — | 37,296,467 | (34,376,784 | ) | 2,919,683 | 2,919,683 | 7,986 | |||||||||||||||||
| 6. PORTFOLIO SECURITIES TRANSACTIONS |
The cost of purchases and proceeds from sales and maturities of long-term securities for the fiscal year ended October 31, 2020 were as follows:
| Fund | Purchases | Sales and Maturities | ||||||
Large Cap Growth Insights | $4,077,576,294 | $ | 4,539,896,989 | |||||
Large Cap Value Insights | 793,522,724 | 882,849,996 | ||||||
Small Cap Equity Insights | 862,973,909 | 936,311,097 | ||||||
Small Cap Growth Insights | 1,527,333,504 | 1,676,207,655 | ||||||
Small Cap Value Insights | 1,278,398,179 | 992,251,645 | ||||||
U.S. Equity Insights | 2,018,124,371 | 2,166,655,236 | ||||||
| 7. SECURITIES LENDING |
Pursuant to exemptive relief granted by the Securities and Exchange Commission (“SEC”) and the terms and conditions contained therein, the Large Cap Growth Insights, Large Cap Value Insights, Small Cap Equity Insights, Small Cap Growth Insights, Small Cap Value Insights and U.S. Equity Insights Funds may lend their securities through a securities lending agent, Goldman Sachs Agency Lending (“GSAL”), a wholly-owned subsidiary of Goldman Sachs, to certain qualified borrowers including Goldman Sachs and affiliates. In accordance with the Funds’ securities lending procedures, the Funds receive cash collateral at least equal to the market value of the securities on loan. The market value of the loaned securities is determined at the close of business of the Funds at their last sale price or official closing price on the principal exchange or system on which they are traded, and any additional required collateral is delivered to the Funds on the next business day. As with other extensions of credit, the Funds may experience delay in the recovery of their securities or incur a loss should the borrower of the securities breach its agreement with the Funds or become insolvent at a time when the collateral is insufficient to cover the cost of repurchasing securities on loan. Dividend income received from securities on loan may not be subject to withholding taxes and therefore withholding taxes paid
115
GOLDMAN SACHS DOMESTIC EQUITY INSIGHTS FUNDS
Notes to Financial Statements (continued)
October 31, 2020
| 7. SECURITIES LENDING (continued) |
may differ from the amounts listed in the Statements of Operations. Loans of securities are terminable at any time and as such 1) the remaining contractual maturities of the outstanding securities lending transactions are considered to be overnight and continuous and 2) the borrower, after notice, is required to return borrowed securities within the standard time period for settlement of securities transactions.
The Funds invest the cash collateral received in connection with securities lending transactions in the Goldman Sachs Financial Square Government Fund (“Government Money Market Fund”), an affiliated series of the Goldman Sachs Trust. The Government Money Market Fund is registered under the Act as an open end investment company, is subject to Rule 2a-7 under the Act, and is managed by GSAM, for which GSAM may receive a management fee of up to 0.16% on an annualized basis of the average daily net assets of the Government Money Market Fund.
In the event of a default by a borrower with respect to any loan, GSAL will exercise any and all remedies provided under the applicable borrower agreement to make the Funds whole. These remedies include purchasing replacement securities by applying the collateral held from the defaulting broker against the purchase cost of the replacement securities. If GSAL is unable to purchase replacement securities, GSAL will indemnify the Funds by paying the Funds an amount equal to the market value of the securities loaned minus the value of cash collateral received from the borrower for the loan, subject to an exclusion for any shortfalls resulting from a loss of value in such cash collateral due to reinvestment risk. The Funds’ master netting agreements with certain borrowers provide the right, in the event of a default (including bankruptcy or insolvency), for the non-defaulting party to liquidate the collateral and calculate net exposure to the defaulting party or request additional collateral. However, in the event of a default by a borrower, a resolution authority could determine that such rights are not enforceable due to the restrictions or prohibitions against the right of set-off that may be imposed in accordance with a particular jurisdiction’s bankruptcy or insolvency laws. The Funds’ loaned securities were all subject to enforceable Securities Lending Agreements and the value of the collateral was at least equal to the value of the cash received. The amounts of the Funds’ overnight and continuous agreements, which represent the gross amounts of recognized liabilities for securities lending transactions outstanding as of October 31, 2020, are disclosed as “Payable upon return of securities loaned” on the Statements of Assets and Liabilities, where applicable. The U.S. Equity Insights Fund did not have securities on loan as of October 31, 2020.
Both the Funds and GSAL received compensation relating to the lending of the Funds’ securities. The amounts earned, if any, by the Funds for the fiscal year ended October 31, 2020, are reported under Investment Income on the Statements of Operations.
The table below details securities lending activity with affiliates of Goldman Sachs:
| For the Fiscal Year Ended October 31, 2020 | Amounts Payable to Goldman Sachs Upon Return of Securities Loaned as of October 31, 2020 | |||||||||||||
| Fund | Earnings of GSAL Relating to Securities Loaned | Amounts Received by the Funds from Lending to Goldman Sachs | ||||||||||||
Large Cap Growth Insights | $ | 6,772 | $ | 11,806 | $ | — | ||||||||
Large Cap Value Insights | 199 | 57 | — | |||||||||||
Small Cap Equity Insights | 22,900 | 29,591 | 872,100 | |||||||||||
Small Cap Growth Insights | 60,577 | 94,478 | 1,740,876 | |||||||||||
Small Cap Value Insights | 13,230 | 14,363 | — | |||||||||||
U.S. Equity Insights | 512 | — | — | |||||||||||
116
GOLDMAN SACHS DOMESTIC EQUITY INSIGHTS FUNDS
| 7. SECURITIES LENDING (continued) |
The following table provides information about the Funds’ investments in the Government Money Market Fund for the fiscal year ended October 31, 2020.
| Fund | Beginning value as of October 31, 2019 | Purchases at Cost | Proceeds from Sales | Ending value as of October 31, 2020 | ||||||||||||||
Large Cap Growth Insights | $ | — | $ | 57,526,763 | $ | (57,526,763 | ) | $ | — | |||||||||
Large Cap Value Insights | — | 7,445,584 | (7,445,584 | ) | — | |||||||||||||
Small Cap Equity Insights | 1,732,225 | 65,288,745 | (61,907,757 | ) | 5,113,213 | |||||||||||||
Small Cap Growth Insights | — | 130,446,448 | (119,290,110 | ) | 11,156,338 | |||||||||||||
Small Cap Value Insights | 2,300,481 | 74,455,138 | (73,386,197 | ) | 3,369,422 | |||||||||||||
U.S. Equity Insights | — | 23,080,625 | (23,080,625 | ) | — | |||||||||||||
| 8. TAX INFORMATION |
The tax character of distributions paid during the fiscal year ended October 31, 2020 were as follows:
| Large Cap Growth Insights | Large Cap Value Insights | Small Cap Equity Insights | Small Cap Growth Insights | Small Cap Value Insights | U.S. Equity Insights | |||||||||||||||||||
Distributions paid from: | ||||||||||||||||||||||||
Ordinary Income | $ | 11,521,608 | $ | 5,874,965 | $ | 3,560,988 | $ | — | $ | 4,330,080 | $ | 15,684,604 | ||||||||||||
Net long-term capital gains | 66,785,470 | — | — | 14,469,214 | — | — | ||||||||||||||||||
Total taxable distributions | $ | 78,307,078 | $ | 5,874,965 | $ | 3,560,988 | $ | 14,469,214 | $ | 4,330,080 | $ | 15,684,604 | ||||||||||||
The tax character of distributions paid during the fiscal year ended October 31, 2019 were as follows:
Large Cap Insights | Large Cap Insights | Small Cap Insights | Small Cap Insights | Small Cap Insights | U.S. Equity | |||||||||||||||||||
Distributions paid from: | ||||||||||||||||||||||||
Ordinary Income | $ | 123,336,193 | $ | 28,355,963 | $ | 15,104,381 | $ | 46,614,425 | $ | 10,386,975 | $ | 38,805,040 | ||||||||||||
Net long-term capital gains | 52,936,690 | 4,774,298 | 15,861,672 | 39,004,631 | 12,696,156 | 21,706,757 | ||||||||||||||||||
Total taxable distributions | $ | 176,272,883 | $ | 33,130,261 | $ | 30,966,053 | $ | 85,619,056 | $ | 23,083,131 | $ | 60,511,797 | ||||||||||||
117
GOLDMAN SACHS DOMESTIC EQUITY INSIGHTS FUNDS
Notes to Financial Statements (continued)
October 31, 2020
| 8. TAX INFORMATION (continued) |
As of October 31, 2020, the components of accumulated earnings (losses) on a tax basis were as follows:
| Large Cap Growth Insights | Large Cap Value Insights | Small Cap Equity Insights | Small Cap Growth Insights | Small Cap Value Insights | U.S. Equity Insights | |||||||||||||||||||
Undistributed ordinary income — net | $ | 62,112,810 | $ | 161,025 | $ | 1,281,002 | $ | 3,088,011 | $ | 3,905,911 | $ | 5,511,957 | ||||||||||||
Undistributed long-term capital gains | 122,310,677 | — | — | 31,999,566 | — | 39,248,969 | ||||||||||||||||||
Total undistributed earnings | $ | 184,423,487 | $ | 161,025 | $ | 1,281,002 | $ | 35,087,577 | $ | 3,905,911 | $ | 44,760,926 | ||||||||||||
Capital loss carryforwards: | ||||||||||||||||||||||||
Perpetual Short-Term | $ | — | $ | (23,316,941 | ) | $ | (21,895,922 | ) | $ | — | $ | (10,349,273 | ) | $ | — | |||||||||
Perpetual Long-Term | — | (3,524,388 | ) | — | — | (7,285,429 | ) | — | ||||||||||||||||
Timing differences (Qualified Late Year Loss Deferral) | $ | — | $ | — | $ | — | $ | (1,517,473 | ) | $ | — | $ | — | |||||||||||
Unrealized gains (losses) — net | 551,375,934 | 3,755,587 | (16,598,541 | ) | 37,072,011 | (31,892,979 | ) | 153,635,358 | ||||||||||||||||
Total accumulated earnings (losses) — net | $ | 735,799,421 | $ | (22,924,717 | ) | $ | (37,213,461 | ) | $ | 70,642,115 | $ | (45,621,770 | ) | $ | 198,396,284 | |||||||||
As of October 31, 2020, the Funds’ aggregate security unrealized gains and losses based on cost for U.S. federal income tax purposes were as follows:
Large Cap Growth | Large Cap Value Insights | Small Cap Equity Insights | Small Cap Insights | Small Cap Value Insights | U.S. Equity Insights | |||||||||||||||||||
Tax Cost | $ | 1,316,718,421 | $ | 313,577,987 | $ | 560,853,778 | $ | 951,828,069 | $ | 791,272,036 | $ | 788,149,083 | ||||||||||||
Gross unrealized gain | 584,203,748 | 17,329,359 | 55,241,352 | 135,891,168 | 69,354,702 | 180,880,337 | ||||||||||||||||||
Gross unrealized loss | (32,827,815 | ) | (13,573,772 | ) | (71,839,893 | ) | (98,819,157 | ) | (101,247,681 | ) | (27,244,979 | ) | ||||||||||||
Net unrealized gain (loss) | $ | 551,375,933 | $ | 3,755,587 | $ | (16,598,541 | ) | $ | 37,072,011 | $ | (31,892,979 | ) | $ | 153,635,358 | ||||||||||
The difference between GAAP-basis and tax basis unrealized gains (losses) is attributable primarily to wash sales, net mark to market gains (losses) on regulated futures contracts, and passive foreign investment companies.
During the year ended October 31, 2020 the U.S. Equity Insights Fund utilized $8,094,808 in prior year capital loss carryforwards.
The Small Cap Growth Insights Fund reclassed $392,366 from distributable earnings to paid in capital for the year ending October 31, 2020. In order to present certain components of the Fund’s capital accounts on a tax-basis, certain reclassifications have been recorded to the Fund’s accounts. These reclassifications have no impact on the net asset value of the Fund’s and result primarily from net operating losses and redemptions utilized as distributions.
GSAM has reviewed the Funds’ tax positions for all open tax years (the current and prior three years, as applicable) and has concluded that no provision for income tax is required in the Funds’ financial statements. Such open tax years remain subject to examination and adjustment by tax authorities.
| 9. OTHER RISKS |
The Funds’ risks include, but are not limited to, the following:
Derivatives Risk — The Funds’ use of derivatives may result in loss. Derivative instruments, which may pose risks in addition to and greater than those associated with investing directly in securities, currencies or other instruments, may be illiquid or less liquid, volatile, difficult to price and leveraged so that small changes in the value of the underlying instruments may produce disproportionate losses to the Funds. Derivatives are also subject to counterparty risk, which is the risk that the other party in the transaction will not fulfill its contractual obligation. The use of derivatives is a highly specialized activity that involves investment
118
GOLDMAN SACHS DOMESTIC EQUITY INSIGHTS FUNDS
| 9. OTHER RISKS (continued) |
techniques and risks different from those associated with investments in more traditional securities and instruments. Losses from derivatives can also result from a lack of correlation between changes in the value of derivative instruments and the portfolio assets (if any) being hedged.
Dividend-Paying Investments Risk — A Fund’s investments in dividend-paying securities could cause a Fund to underperform other funds. Securities that pay dividends, as a group, can fall out of favor with the market, causing such securities to underperform securities that do not pay dividends. Depending upon market conditions and political and legislative responses to such conditions, dividend-paying securities that meet a Fund’s investment criteria may not be widely available and/or may be highly concentrated in only a few market sectors. In addition, issuers that have paid regular dividends or distributions to shareholders may not continue to do so at the same level or at all in the future. This may limit the ability of a Fund to produce current income.
Foreign Custody Risk — If a Fund invests in foreign securities, the Fund may hold such securities and cash with foreign banks, agents, and securities depositories appointed by the Fund’s custodian (each a “Foreign Custodian”). Some foreign custodians may be recently organized or new to the foreign custody business. In some countries, Foreign Custodians may be subject to little or no regulatory oversight over, or independent evaluation of, their operations. Further, the laws of certain countries may place limitations on a Fund’s ability to recover its assets if a Foreign Custodian enters bankruptcy.
Large Shareholder Transactions Risk — A Fund may experience adverse effects when certain large shareholders, such as other funds, institutional investors (including those trading by use of non-discretionary mathematical formulas), financial intermediaries (who may make investment decisions on behalf of underlying clients and/or include a Fund in their investment model), individuals, accounts and Goldman Sachs affiliates, purchase or redeem large amounts of shares of a Fund. Such large shareholder redemptions, which may occur rapidly or unexpectedly, may cause a Fund to sell portfolio securities at times when it would not otherwise do so, which may negatively impact a Fund’s NAV and liquidity. These transactions may also accelerate the realization of taxable income to shareholders if such sales of investments resulted in gains, and may also increase transaction costs. In addition, a large redemption could result in a Fund’s current expenses being allocated over a smaller asset base, leading to an increase in the Fund’s expense ratio. Similarly, large Fund share purchases may adversely affect a Fund’s performance to the extent that the Fund is delayed in investing new cash or otherwise maintains a larger cash position than it ordinarily would.
Liquidity Risk — A Fund may make investments that are illiquid or that may become less liquid in response to market developments or adverse investor perceptions. Illiquid investments may be more difficult to value. Liquidity risk may also refer to the risk that a Fund will not be able to pay redemption proceeds within the allowable time period or without significant dilution to remaining investors’ interests because of unusual market conditions, an unusually high volume of redemption requests, or other reasons. To meet redemption requests, a Fund may be forced to sell investments at an unfavorable time and/or under unfavorable conditions. If a Fund is forced to sell securities at an unfavorable time and/or under unfavorable conditions, such sales may adversely affect the Fund’s NAV and dilute remaining investors’ interests. Redemptions by large shareholders may have a negative impact on a Fund’s liquidity.
Market and Credit Risks — In the normal course of business, a Fund trades financial instruments and enters into financial transactions where risk of potential loss exists due to changes in the market (market risk). The value of the securities in which a Fund invests may go up or down in response to the prospects of individual companies, particular sectors or governments and/or general economic conditions throughout the world due to increasingly interconnected global economies and financial markets. Events such as war, acts of terrorism, social unrest, natural disasters, the spread of infectious illness or other public health threats could also significantly impact a Fund and its investments. Additionally, a Fund may also be exposed to credit risk in the event that an issuer or guarantor fails to perform or that an institution or entity with which the Fund has unsettled or open transactions defaults.
Non-Diversification Risk — The Large Cap Growth Insights Fund is non-diversified, meaning that it is permitted to invest a larger percentage of its assets in fewer issuers than diversified mutual funds. Thus, the Fund may be more susceptible to adverse developments affecting any single issuer held in its portfolio, and may be more susceptible to greater losses because of these developments.
119
GOLDMAN SACHS DOMESTIC EQUITY INSIGHTS FUNDS
Notes to Financial Statements (continued)
October 31, 2020
| 10. INDEMNIFICATIONS |
Under the Trust’s organizational documents, its Trustees, officers, employees and agents are indemnified, to the extent permitted by the Act and state law, against certain liabilities that may arise out of performance of their duties to the Funds. Additionally, in the course of business, the Funds enter into contracts that contain a variety of indemnification clauses. The Funds’ maximum exposure under these arrangements is unknown, as this would involve future claims that may be made against the Funds that have not yet occurred. However, GSAM believes the risk of loss under these arrangements to be remote.
| 11. OTHER MATTERS |
On October 22, 2020, Goldman Sachs announced a settlement of matters involving 1Malaysia Development Bhd. (1MDB), a Malaysian sovereign wealth fund, with the United States Department of Justice as well as criminal and civil authorities in the UK, Singapore and Hong Kong. Further information regarding the 1MDB settlement can be found at https://www.goldmansachs.com/media-relations/press-releases/current/goldman-sachs-2020-10-22.html. The 1MDB settlement will not materially adversely affect GSAM’s ability to serve as investment manager.
| 12. SUBSEQUENT EVENTS |
Subsequent events after the Statements of Assets and Liabilities date have been evaluated, and GSAM has concluded that there is no impact requiring adjustment or disclosure in the financial statements.
120
GOLDMAN SACHS DOMESTIC EQUITY INSIGHTS FUNDS
| 13. SUMMARY OF SHARE TRANSACTIONS |
| Large Cap Growth Insights Fund | ||||||||||||||||
|
| |||||||||||||||
| For the Fiscal Year Ended October 31, 2020 | For the Fiscal Year Ended October 31, 2019 | |||||||||||||||
|
| |||||||||||||||
| Shares | Dollars | Shares | Dollars | |||||||||||||
|
| |||||||||||||||
| Class A Shares | ||||||||||||||||
Shares sold | 1,526,224 | $ | 50,423,999 | 2,578,365 | $ | 76,171,954 | ||||||||||
Reinvestment of distributions | 290,606 | 9,214,122 | 839,624 | 22,972,444 | ||||||||||||
Shares redeemed | (3,754,917 | ) | (124,491,810 | ) | (4,081,407 | ) | (121,582,504 | ) | ||||||||
| (1,938,087 | ) | (64,853,689 | ) | (663,418 | ) | (22,438,106 | ) | |||||||||
| Class C Shares | ||||||||||||||||
Shares sold | 194,519 | 5,763,740 | 353,072 | 8,870,934 | ||||||||||||
Reinvestment of distributions | 55,088 | 1,529,789 | 171,082 | 4,147,030 | ||||||||||||
Shares redeemed | (487,899 | ) | (14,149,700 | ) | (1,030,728 | ) | (26,741,128 | ) | ||||||||
| (238,292 | ) | (6,856,171 | ) | (506,574 | ) | (13,723,164 | ) | |||||||||
| Institutional Shares | ||||||||||||||||
Shares sold | 5,627,401 | 193,729,922 | 8,260,634 | 249,994,999 | ||||||||||||
Reinvestment of distributions | 774,752 | 25,568,185 | 2,021,752 | 57,355,849 | ||||||||||||
Shares redeemed | (10,656,739 | ) | (358,525,610 | ) | (12,141,151 | ) | (372,578,159 | ) | ||||||||
| (4,254,586 | ) | (139,227,503 | ) | (1,858,765 | ) | (65,227,311 | ) | |||||||||
| Service Shares | ||||||||||||||||
Shares sold | 397,977 | 13,315,866 | 706,347 | 19,913,545 | ||||||||||||
Reinvestment of distributions | 47,340 | 1,474,770 | 158,528 | 4,265,164 | ||||||||||||
Shares redeemed | (791,476 | ) | (25,198,611 | ) | (986,078 | ) | (28,691,006 | ) | ||||||||
| (346,159 | ) | (10,407,975 | ) | (121,203 | ) | (4,512,297 | ) | |||||||||
| Investor Shares | ||||||||||||||||
Shares sold | 2,308,187 | 73,989,672 | 4,093,644 | 116,918,081 | ||||||||||||
Reinvestment of distributions | 531,837 | 16,642,893 | 1,328,599 | 35,834,532 | ||||||||||||
Shares redeemed | (7,442,672 | ) | (238,975,464 | ) | (6,065,761 | ) | (177,715,416 | ) | ||||||||
| (4,602,648 | ) | (148,342,899 | ) | (643,518 | ) | (24,962,803 | ) | |||||||||
| Class R6 Shares | ||||||||||||||||
Shares sold | 4,074,176 | 145,115,420 | 5,501,572 | 166,533,446 | ||||||||||||
Reinvestment of distributions | 375,798 | 12,394,764 | 1,076,243 | 30,512,669 | ||||||||||||
Shares redeemed | (4,487,194 | ) | (156,333,132 | ) | (7,710,537 | ) | (238,369,630 | ) | ||||||||
| (37,220 | ) | 1,177,052 | (1,132,722 | ) | (41,323,515 | ) | ||||||||||
| Class R Shares | ||||||||||||||||
Shares sold | 280,165 | 9,203,859 | 778,072 | 23,164,660 | ||||||||||||
Reinvestment of distributions | 27,541 | 849,696 | 24,918 | 665,049 | ||||||||||||
Shares redeemed | (680,301 | ) | (21,864,855 | ) | (538,455 | ) | (15,874,791 | ) | ||||||||
| (372,595 | ) | (11,811,300 | ) | 264,535 | 7,954,918 | |||||||||||
| Class P Shares | ||||||||||||||||
Shares sold | 269,182 | 8,251,686 | 457,690 | 13,187,898 | ||||||||||||
Reinvestment of distributions | 62,937 | 2,075,071 | 117,890 | 3,340,204 | ||||||||||||
Shares redeemed | (316,163 | ) | (10,405,430 | ) | (318,316 | ) | (9,349,058 | ) | ||||||||
| 15,956 | (78,673 | ) | 257,264 | 7,179,044 | ||||||||||||
NET DECREASE | (11,773,631 | ) | $ | (380,401,158 | ) | (4,404,401 | ) | $ | (157,053,234 | ) | ||||||
121
GOLDMAN SACHS DOMESTIC EQUITY INSIGHTS FUNDS
Notes to Financial Statements (continued)
October 31, 2020
| 13. SUMMARY OF SHARE TRANSACTIONS (continued) |
| Large Cap Value Insights Fund | ||||||||||||||||
|
| |||||||||||||||
| For the Fiscal Year Ended October 31, 2020 | For the Fiscal Year Ended October 31, 2019 | |||||||||||||||
|
| |||||||||||||||
| Shares | Dollars | Shares | Dollars | |||||||||||||
|
| |||||||||||||||
| Class A Shares | ||||||||||||||||
Shares sold | 405,990 | $ | 7,834,859 | 1,078,518 | $ | 21,990,268 | ||||||||||
Reinvestment of distributions | 33,200 | 630,382 | 183,901 | 3,664,612 | ||||||||||||
Shares redeemed | (1,070,789 | ) | (20,722,483 | ) | (1,068,564 | ) | (21,978,819 | ) | ||||||||
| (631,599 | ) | $ | (12,257,242 | ) | 193,855 | 3,676,061 | ||||||||||
| Class C Shares | ||||||||||||||||
Shares sold | 94,196 | 1,804,205 | 349,252 | 6,992,702 | ||||||||||||
Reinvestment of distributions | 2,745 | 51,295 | 30,361 | 597,860 | ||||||||||||
Shares redeemed | (239,161 | ) | (4,555,034 | ) | (247,041 | ) | (5,052,720 | ) | ||||||||
| (142,220 | ) | (2,699,534 | ) | 132,572 | 2,537,842 | |||||||||||
| Institutional Shares | ||||||||||||||||
Shares sold | 1,495,342 | 29,655,521 | 5,286,811 | 107,719,818 | ||||||||||||
Reinvestment of distributions | 82,753 | 1,573,573 | 351,295 | 7,006,599 | ||||||||||||
Shares redeemed | (2,638,882 | ) | (51,782,152 | ) | (5,653,571 | ) | (114,141,291 | ) | ||||||||
| (1,060,787 | ) | (20,553,058 | ) | (15,465 | ) | 585,126 | ||||||||||
| Service Shares | ||||||||||||||||
Shares sold | 68,790 | 1,358,700 | 79,120 | 1,644,632 | ||||||||||||
Reinvestment of distributions | 3,777 | 72,153 | 29,623 | 591,853 | ||||||||||||
Shares redeemed | (155,484 | ) | (3,130,168 | ) | (225,687 | ) | (4,695,199 | ) | ||||||||
| (82,917 | ) | (1,699,315 | ) | (116,944 | ) | (2,458,714 | ) | |||||||||
| Investor Shares | ||||||||||||||||
Shares sold | 1,640,678 | 32,282,857 | 3,812,155 | 78,553,524 | ||||||||||||
Reinvestment of distributions | 82,792 | 1,570,377 | 326,191 | 6,496,411 | ||||||||||||
Shares redeemed | (4,381,056 | ) | (85,637,629 | ) | (1,755,954 | ) | (35,924,975 | ) | ||||||||
| (2,657,586 | ) | (51,784,395 | ) | 2,382,392 | 49,124,960 | |||||||||||
| Class R6 Shares | ||||||||||||||||
Shares sold | 357,095 | 6,929,811 | 3,956,938 | 80,014,855 | ||||||||||||
Reinvestment of distributions | 57,418 | 1,088,196 | 492,877 | 9,780,671 | ||||||||||||
Shares redeemed | (475,699 | ) | (9,584,792 | ) | (7,888,267 | ) | (162,215,118 | ) | ||||||||
| (61,186 | ) | (1,566,785 | ) | (3,438,452 | ) | (72,419,592 | ) | |||||||||
| Class R Shares | ||||||||||||||||
Shares sold | 54,674 | 1,016,484 | 50,087 | 1,018,472 | ||||||||||||
Reinvestment of distributions | 2,806 | 52,688 | 17,212 | 340,328 | ||||||||||||
Shares redeemed | (47,341 | ) | (873,801 | ) | (85,122 | ) | (1,731,114 | ) | ||||||||
| 10,139 | 195,371 | (17,823 | ) | (372,314 | ) | |||||||||||
| Class P Shares | ||||||||||||||||
Shares sold | 387,576 | 6,726,631 | 798,187 | 15,252,281 | ||||||||||||
Reinvestment of distributions | 28,230 | 534,539 | 99,454 | 1,984,309 | ||||||||||||
Shares redeemed | (430,537 | ) | (7,758,509 | ) | (612,512 | ) | (12,240,790 | ) | ||||||||
| (14,731 | ) | (497,339 | ) | 285,129 | 4,995,800 | |||||||||||
NET DECREASE | (4,640,887 | ) | $ | (90,862,297 | ) | (594,736 | ) | $ | (14,330,831 | ) | ||||||
122
GOLDMAN SACHS DOMESTIC EQUITY INSIGHTS FUNDS
| 13. SUMMARY OF SHARE TRANSACTIONS (continued) |
| Small Cap Equity Insights Fund | ||||||||||||||||
|
| |||||||||||||||
| For the Fiscal Year Ended October 31, 2020 | For the Fiscal Year Ended October 31, 2019 | |||||||||||||||
|
| |||||||||||||||
| Shares | Dollars | Shares | Dollars | |||||||||||||
|
| |||||||||||||||
| Class A Shares | ||||||||||||||||
Shares sold | 376,203 | $ | 8,465,614 | 568,989 | $ | 13,714,526 | ||||||||||
Reinvestment of distributions | 3,912 | 104,831 | 125,799 | 2,866,956 | ||||||||||||
Shares redeemed | (984,978 | ) | (21,441,662 | ) | (761,578 | ) | (18,374,675 | ) | ||||||||
| (604,863 | ) | (12,871,217 | ) | (66,790 | ) | (1,793,193 | ) | |||||||||
| Class C Shares | ||||||||||||||||
Shares sold | 73,308 | 1,463,071 | 177,041 | 3,568,562 | ||||||||||||
Reinvestment of distributions | – | – | 23,381 | 455,454 | ||||||||||||
Shares redeemed | (124,274 | ) | (2,383,566 | ) | (163,619 | ) | (3,359,695 | ) | ||||||||
| (50,966 | ) | (920,495 | ) | 36,803 | 664,321 | |||||||||||
| Institutional Shares | ||||||||||||||||
Shares sold | 3,188,221 | 74,302,685 | 5,235,766 | 131,485,651 | ||||||||||||
Reinvestment of distributions | 57,789 | 1,611,728 | 476,089 | 11,287,686 | ||||||||||||
Shares redeemed | (5,096,069 | ) | (122,869,653 | ) | (2,771,991 | ) | (69,865,556 | ) | ||||||||
| (1,850,059 | ) | (46,955,240 | ) | 2,939,864 | 72,907,781 | |||||||||||
| Service Shares | ||||||||||||||||
Shares sold | 97,493 | 2,072,484 | 91,926 | 2,205,781 | ||||||||||||
Reinvestment of distributions | 109 | 2,866 | 4,673 | 104,730 | ||||||||||||
Shares redeemed | (95,305 | ) | (2,121,367 | ) | (51,949 | ) | (1,230,710 | ) | ||||||||
| 2,297 | (46,017 | ) | 44,650 | 1,079,801 | ||||||||||||
| Investor Shares | ||||||||||||||||
Shares sold | 1,915,020 | 42,756,096 | 2,111,112 | 51,466,887 | ||||||||||||
Reinvestment of distributions | 14,081 | 374,689 | 107,128 | 2,425,323 | ||||||||||||
Shares redeemed | (2,033,871 | ) | (42,194,190 | ) | (1,037,135 | ) | (25,425,896 | ) | ||||||||
| (104,770 | ) | 936,595 | 1,181,105 | 28,466,314 | ||||||||||||
| Class R6 Shares | ||||||||||||||||
Shares sold | 1,120,145 | 25,078,093 | 4,301,945 | 106,589,803 | ||||||||||||
Reinvestment of distributions | 28,665 | 799,462 | 399,759 | 9,476,064 | ||||||||||||
Shares redeemed | (1,891,989 | ) | (42,708,570 | ) | (5,443,120 | ) | (138,390,631 | ) | ||||||||
| (743,179 | ) | (16,831,015 | ) | (741,416 | ) | (22,324,764 | ) | |||||||||
| Class R Shares | ||||||||||||||||
Shares sold | 194,580 | 4,286,190 | 271,701 | 6,483,888 | ||||||||||||
Reinvestment of distributions | – | – | 33,918 | 755,025 | ||||||||||||
Shares redeemed | (240,251 | ) | (5,518,059 | ) | (223,024 | ) | (5,325,434 | ) | ||||||||
| (45,671 | ) | (1,231,869 | ) | 82,595 | 1,913,479 | |||||||||||
| Class P Shares | ||||||||||||||||
Shares sold | 2,037,782 | 40,341,140 | 2,896,062 | 66,645,917 | ||||||||||||
Reinvestment of distributions | 21,405 | 596,984 | 138,422 | 3,278,915 | ||||||||||||
Shares redeemed | (2,389,514 | ) | (49,315,484 | ) | (1,565,207 | ) | (38,912,996 | ) | ||||||||
| (330,327 | ) | (8,377,360 | ) | 1,469,277 | 31,011,836 | |||||||||||
NET INCREASE (DECREASE) | (3,727,538 | ) | $ | (86,296,618 | ) | 4,946,088 | $ | 111,925,575 | ||||||||
123
GOLDMAN SACHS DOMESTIC EQUITY INSIGHTS FUNDS
Notes to Financial Statements (continued)
October 31, 2020
| 13. SUMMARY OF SHARE TRANSACTIONS (continued) |
| Small Cap Growth Insights Fund | ||||||||||||||||
|
| |||||||||||||||
| For the Fiscal Year Ended October 31, 2020 | For the Fiscal Year Ended October 31, 2019 | |||||||||||||||
|
| |||||||||||||||
| Shares | Dollars | Shares | Dollars | |||||||||||||
|
| |||||||||||||||
| Class A Shares | ||||||||||||||||
Shares sold | 306,649 | $ | 9,891,218 | 592,484 | $ | 20,113,595 | ||||||||||
Reinvestment of distributions | 31,355 | 1,142,271 | 281,405 | 8,799,530 | ||||||||||||
Shares redeemed | (1,264,717 | ) | (43,192,152 | ) | (834,841 | ) | (28,043,840 | ) | ||||||||
| (926,713 | ) | (32,158,663 | ) | 39,048 | 869,285 | |||||||||||
| Class C Shares | ||||||||||||||||
Shares sold | 51,837 | 1,229,438 | 73,157 | 1,836,124 | ||||||||||||
Reinvestment of distributions | 5,520 | 149,101 | 44,452 | 1,043,280 | ||||||||||||
Shares redeemed | (119,799 | ) | (2,842,443 | ) | (82,422 | ) | (2,101,668 | ) | ||||||||
| (62,442 | ) | (1,463,904 | ) | 35,187 | 777,736 | |||||||||||
| Institutional Shares | ||||||||||||||||
Shares sold | 1,978,454 | 75,168,576 | 3,227,816 | 127,361,435 | ||||||||||||
Reinvestment of distributions | 89,256 | 3,895,156 | 718,806 | 26,768,316 | ||||||||||||
Shares redeemed | (5,545,375 | ) | (219,431,392 | ) | (2,661,680 | ) | (106,449,391 | ) | ||||||||
| (3,477,665 | ) | (140,367,660 | ) | 1,284,942 | 47,680,360 | |||||||||||
| Investor Shares | ||||||||||||||||
Shares sold | 4,890,826 | 161,785,147 | 3,840,487 | 134,252,383 | ||||||||||||
Reinvestment of distributions | 136,767 | 5,138,365 | 964,429 | 31,016,030 | ||||||||||||
Shares redeemed | (3,011,559 | ) | (101,466,885 | ) | (2,406,524 | ) | (83,691,568 | ) | ||||||||
| 2,016,034 | 65,456,627 | 2,398,392 | 81,576,845 | |||||||||||||
| Class R6 Shares | ||||||||||||||||
Shares sold | 2,469,112 | 93,553,475 | 6,482,593 | 253,736,476 | ||||||||||||
Reinvestment of distributions | 76,050 | 3,321,119 | 378,454 | 14,097,427 | ||||||||||||
Shares redeemed | (3,506,052 | ) | (139,512,618 | ) | (2,246,884 | ) | (88,998,158 | ) | ||||||||
| (960,890 | ) | (42,638,024 | ) | 4,614,163 | 178,835,745 | |||||||||||
| Class R Shares | ||||||||||||||||
Shares sold | 91,999 | 2,952,427 | 191,155 | 6,202,346 | ||||||||||||
Reinvestment of distributions | 7,390 | 257,387 | 59,954 | 1,798,021 | ||||||||||||
Shares redeemed | (436,624 | ) | (14,364,619 | ) | (221,227 | ) | (7,312,754 | ) | ||||||||
| (337,235 | ) | (11,154,805 | ) | 29,882 | 687,613 | |||||||||||
| Class P Shares | ||||||||||||||||
Shares sold | 55,270 | 2,137,376 | 146,086 | 5,834,292 | ||||||||||||
Reinvestment of distributions | 3,337 | 145,698 | 20,911 | 778,940 | ||||||||||||
Shares redeemed | (109,095 | ) | (3,766,238 | ) | (117,790 | ) | (4,759,537 | ) | ||||||||
| (50,488 | ) | (1,483,164 | ) | 49,207 | 1,853,695 | |||||||||||
NET INCREASE (DECREASE) | (3,799,399 | ) | $ | (163,809,593 | ) | 8,450,821 | $ | 312,281,279 | ||||||||
124
GOLDMAN SACHS DOMESTIC EQUITY INSIGHTS FUNDS
| 13. SUMMARY OF SHARE TRANSACTIONS (continued) |
| Small Cap Value Insights Fund | ||||||||||||||||
|
| |||||||||||||||
| For the Fiscal Year Ended October 31, 2020 | For the Fiscal Year Ended October 31, 2019 | |||||||||||||||
|
| |||||||||||||||
| Shares | Dollars | Shares | Dollars | |||||||||||||
|
| |||||||||||||||
| Class A Shares | ||||||||||||||||
Shares sold | 577,824 | $ | 18,546,458 | 1,050,768 | $ | 38,541,580 | ||||||||||
Reinvestment of distributions | 19,063 | 787,894 | 287,947 | 10,340,127 | ||||||||||||
Shares redeemed | (953,407 | ) | (32,328,215 | ) | (644,168 | ) | (24,334,368 | ) | ||||||||
| (356,520 | ) | (12,993,863 | ) | 694,547 | 24,547,339 | |||||||||||
| Class C Shares | ||||||||||||||||
Shares sold | 49,527 | 1,234,005 | 127,462 | 3,310,457 | ||||||||||||
Reinvestment of distributions | 1,135 | 32,225 | 33,399 | 826,636 | ||||||||||||
Shares redeemed | (106,526 | ) | (2,331,115 | ) | (96,061 | ) | (2,520,272 | ) | ||||||||
| (55,864 | ) | (1,064,885 | ) | 64,800 | 1,616,821 | |||||||||||
| Institutional Shares | ||||||||||||||||
Shares sold | 2,934,092 | 133,075,373 | 3,054,255 | 151,801,030 | ||||||||||||
Reinvestment of distributions | 24,938 | 1,394,771 | 97,074 | 4,698,255 | ||||||||||||
Shares redeemed | (2,285,652 | ) | (98,004,673 | ) | (649,663 | ) | (32,690,060 | ) | ||||||||
| 673,378 | 36,465,471 | 2,501,666 | 123,809,225 | |||||||||||||
| Investor Shares | ||||||||||||||||
Shares sold | 8,990,233 | 264,507,680 | 1,447,937 | 53,566,402 | ||||||||||||
Reinvestment of distributions | 16,896 | 693,587 | 53,407 | 1,907,349 | ||||||||||||
Shares redeemed | (2,173,164 | ) | (70,697,436 | ) | (421,221 | ) | (15,930,853 | ) | ||||||||
| 6,833,965 | 194,503,831 | 1,080,123 | 39,542,898 | |||||||||||||
| Class R6 Shares | ||||||||||||||||
Shares sold | 2,188,196 | 101,489,097 | 2,033,658 | 99,067,064 | ||||||||||||
Reinvestment of distributions | 15,950 | 891,762 | 39,496 | 1,908,993 | ||||||||||||
Shares redeemed | (864,093 | ) | (38,945,495 | ) | (273,958 | ) | (14,003,900 | ) | ||||||||
| 1,340,053 | 63,435,364 | 1,799,196 | 86,972,157 | |||||||||||||
| Class R Shares | ||||||||||||||||
Shares sold | 299,488 | 10,183,998 | 193,683 | 7,197,157 | ||||||||||||
Reinvestment of distributions | 1,459 | 59,099 | 4,075 | 143,841 | ||||||||||||
Shares redeemed | (83,592 | ) | (2,877,443 | ) | (34,966 | ) | (1,291,159 | ) | ||||||||
| 217,355 | 7,365,654 | 162,792 | 6,049,839 | |||||||||||||
| Class P Shares | ||||||||||||||||
Shares sold | 356,779 | 14,596,906 | 393,971 | 19,494,828 | ||||||||||||
Reinvestment of distributions | 6,414 | 358,606 | 59,484 | 2,877,391 | ||||||||||||
Shares redeemed | (618,388 | ) | (24,891,739 | ) | (317,399 | ) | (15,579,917 | ) | ||||||||
| (255,195 | ) | (9,936,227 | ) | 136,056 | 6,792,302 | |||||||||||
NET INCREASE | 8,397,172 | $ | 277,775,345 | 6,439,180 | $ | 289,330,581 | ||||||||||
125
GOLDMAN SACHS DOMESTIC EQUITY INSIGHTS FUNDS
Notes to Financial Statements (continued)
October 31, 2020
| 13. SUMMARY OF SHARE TRANSACTIONS (continued) |
| U.S. Equity Insights Fund | ||||||||||||||||
|
| |||||||||||||||
| For the Fiscal Year Ended October 31, 2020 | For the Fiscal Year Ended October 31, 2019 | |||||||||||||||
|
| |||||||||||||||
| Shares | Dollars | Shares | Dollars | |||||||||||||
|
| |||||||||||||||
| Class A Shares | ||||||||||||||||
Shares sold | 310,371 | $ | 15,097,613 | 496,152 | $ | 22,850,037 | ||||||||||
Reinvestment of distributions | 77,068 | 3,932,787 | 247,236 | 10,881,031 | ||||||||||||
Shares redeemed | (957,270 | ) | (48,175,749 | ) | (1,018,418 | ) | (47,836,906 | ) | ||||||||
| (569,831 | ) | (29,145,349 | ) | (275,030 | ) | (14,105,838 | ) | |||||||||
| Class C Shares | ||||||||||||||||
Shares sold | 84,868 | 3,811,053 | 148,922 | 5,994,935 | ||||||||||||
Reinvestment of distributions | 2,946 | 134,360 | 13,896 | 548,621 | ||||||||||||
Shares redeemed | (106,681 | ) | (4,780,882 | ) | (136,446 | ) | (5,655,834 | ) | ||||||||
| (18,867 | ) | (835,469 | ) | 26,372 | 887,722 | |||||||||||
| Institutional Shares | ||||||||||||||||
Shares sold | 872,840 | 45,446,386 | 5,561,162 | 252,475,763 | ||||||||||||
Reinvestment of distributions | 88,673 | 4,667,759 | 755,380 | 34,167,885 | ||||||||||||
Shares redeemed | (2,146,316 | ) | (112,593,380 | ) | (17,635,422 | ) | (854,571,457 | ) | ||||||||
| (1,184,803 | ) | (62,479,235 | ) | (11,318,880 | ) | (567,927,809 | ) | |||||||||
| Service Shares | ||||||||||||||||
Shares sold | 26,719 | 1,326,671 | 30,525 | 1,372,352 | ||||||||||||
Reinvestment of distributions | 1,819 | 92,349 | 4,689 | 205,533 | ||||||||||||
Shares redeemed | (56,824 | ) | (2,853,936 | ) | (23,962 | ) | (1,120,436 | ) | ||||||||
| (28,286 | ) | (1,434,916 | ) | 11,252 | 457,449 | |||||||||||
| Investor Shares | ||||||||||||||||
Shares sold | 435,432 | 22,519,991 | 1,320,028 | 60,005,258 | ||||||||||||
Reinvestment of distributions | 37,411 | 1,879,914 | 103,871 | 4,499,108 | ||||||||||||
Shares redeemed | (1,183,792 | ) | (56,624,715 | ) | (1,224,326 | ) | (56,455,932 | ) | ||||||||
| (710,949 | ) | (32,224,810 | ) | 199,573 | 8,048,434 | |||||||||||
| Class R6 Shares | ||||||||||||||||
Shares sold | 80,970 | 4,450,947 | 189,729 | 8,892,870 | ||||||||||||
Reinvestment of distributions | 3,227 | 169,754 | 29,892 | 1,352,886 | ||||||||||||
Shares redeemed | (160,557 | ) | (8,178,893 | ) | (631,325 | ) | (30,710,320 | ) | ||||||||
| (76,360 | ) | (3,558,192 | ) | (411,704 | ) | (20,464,564 | ) | |||||||||
| Class R Shares | ||||||||||||||||
Shares sold | 233,270 | 11,676,345 | 219,851 | 10,041,364 | ||||||||||||
Reinvestment of distributions | 10,083 | 505,157 | 38,936 | 1,684,599 | ||||||||||||
Shares redeemed | (383,387 | ) | (19,038,149 | ) | (409,091 | ) | (18,891,773 | ) | ||||||||
| (140,034 | ) | (6,856,647 | ) | (150,304 | ) | (7,165,810 | ) | |||||||||
| Class P Shares | ||||||||||||||||
Shares sold | 1,222,980 | 62,247,699 | 2,522,934 | 114,163,961 | ||||||||||||
Reinvestment of distributions | 76,672 | 4,032,946 | 135,300 | 6,101,132 | ||||||||||||
Shares redeemed | (1,295,558 | ) | (62,192,850 | ) | (2,371,343 | ) | (113,078,993 | ) | ||||||||
| 4,094 | 4,087,795 | 286,891 | 7,186,100 | |||||||||||||
NET DECREASE | (2,725,036 | ) | $ | (132,446,823 | ) | (11,631,830 | ) | $ | (593,084,316 | ) | ||||||
126
Report of Independent Registered Public
Accounting Firm
To the Board of Trustees of Goldman Sachs Trust and Shareholders of Goldman Sachs Large Cap Growth Insights Fund, Goldman Sachs Large Cap Value Insights Fund, Goldman Sachs Small Cap Equity Insights Fund, Goldman Sachs Small Cap Growth Insights Fund, Goldman Sachs Small Cap Value Insights Fund, and Goldman Sachs U.S. Equity Insights Fund
Opinions on the Financial Statements
We have audited the accompanying statements of assets and liabilities, including the schedules of investments, of Goldman Sachs Large Cap Growth Insights Fund, Goldman Sachs Large Cap Value Insights Fund, Goldman Sachs Small Cap Equity Insights Fund, Goldman Sachs Small Cap Growth Insights Fund, Goldman Sachs Small Cap Value Insights Fund, and Goldman Sachs U.S. Equity Insights Fund (six of the funds constituting Goldman Sachs Trust, hereafter collectively referred to as the “Funds”) as of October 31, 2020, the related statements of operations for the year ended October 31, 2020, the statements of changes in net assets for each of the two years in the period ended October 31, 2020, including the related notes, and the financial highlights for each of the periods indicated therein (collectively referred to as the “financial statements”). In our opinion, the financial statements present fairly, in all material respects, the financial position of each of the Funds as of October 31, 2020, the results of each of their operations for the year then ended, the changes in each of their net assets for each of the two years in the period ended October 31, 2020 and each of the financial highlights for each of the periods indicated therein in conformity with accounting principles generally accepted in the United States of America.
Basis for Opinions
These financial statements are the responsibility of the Funds’ management. Our responsibility is to express an opinion on the Funds’ financial statements based on our audits. We are a public accounting firm registered with the Public Company Accounting Oversight Board (United States) (PCAOB) and are required to be independent with respect to the Funds in accordance with the U.S. federal securities laws and the applicable rules and regulations of the Securities and Exchange Commission and the PCAOB.
We conducted our audits of these financial statements in accordance with the standards of the PCAOB. Those standards require that we plan and perform the audit to obtain reasonable assurance about whether the financial statements are free of material misstatement, whether due to error or fraud.
Our audits included performing procedures to assess the risks of material misstatement of the financial statements, whether due to error or fraud, and performing procedures that respond to those risks. Such procedures included examining, on a test basis, evidence regarding the amounts and disclosures in the financial statements. Our audits also included evaluating the accounting principles used and significant estimates made by management, as well as evaluating the overall presentation of the financial statements. Our procedures included confirmation of securities owned as of October 31, 2020 by correspondence with the custodian, transfer agent and brokers; when replies were not received from brokers, we performed other auditing procedures. We believe that our audits provide a reasonable basis for our opinions.
/s/PricewaterhouseCoopers LLP
Boston, Massachusetts
December 23, 2020
We have served as the auditor of one or more investment companies in the Goldman Sachs fund complex since 2000.
127
GOLDMAN SACHS DOMESTIC EQUITY INSIGHTS FUNDS
Voting Results of Special Meeting of Shareholders (Unaudited)
A Special Meeting (the “Meeting”) of the Goldman Sachs Trust (“GST”) was held on January 23, 2020 to consider and act upon the proposals below. The Funds have amortized their respective share of the proxy, shareholder meeting and other related costs and GSAM has agreed to reimburse the Funds to the extent such expenses exceed a specified percentage of each Funds’ net assets.
At the Meeting, Dwight L. Bush, Kathryn A. Cassidy, Joaquin Delgado and Gregory G. Weaver were elected to the Trust’s Board of Trustees. In electing the trustees, the Trust’s shareholders voted as follows:
Proposal 1. Election of Trustees | For | Against | Withheld | Broker Non-Votes | ||||||||||||
Dwight L. Bush | 94,278,961,728.065 | 0 | 349,026,343.365 | 0 | ||||||||||||
Kathryn A. Cassidy | 94,310,850,789.164 | 0 | 317,137,282.266 | 0 | ||||||||||||
Joaquin Delgado | 94,282,646,444.727 | 0 | 345,341,626.703 | 0 | ||||||||||||
Gregory G. Weaver | 94,306,589,873.348 | 0 | 321,398,198.082 | 0 | ||||||||||||
128
GOLDMAN SACHS DOMESTIC EQUITY INSIGHTS FUNDS
Fund Expenses — Six Month Period Ended October 31, 2020 (Unaudited)
As a shareholder of Class A, Class C, Institutional, Service, Investor, Class R6, Class R and Class P Shares of a Fund, you incur two types of costs: (1) transaction costs, including sales charges on purchase payments (with respect to Class A Shares), contingent deferred sales charges on redemptions (with respect to Class C Shares), and (2) ongoing costs, including management fees; distribution and/or service (12b-1) fees (with respect to Class A, Class C, Service and Class R Shares); and other Fund expenses. This Example is intended to help you understand your ongoing costs (in dollars) of investing in Class A, Class C, Institutional, Service, Investor, Class R6, Class R and Class P Shares of the Funds and to compare these costs with the ongoing costs of investing in other mutual funds.
The Example is based on an investment of $1,000 invested at the beginning of the period and held for the entire period from May 1, 2020 through October 31, 2020, which represents a period of 184 days in a 366 day year. This projection assumes that annualized expense ratios were in effect during the period.
Actual Expenses — The first line under each share class in the table below provides information about actual account values and actual expenses. You may use the information in this line, together with the amount you invested, to estimate the expenses that you paid over the period. Simply divide your account value by $1,000 (for example, an $8,600 account value divided by $1,000=8.6), then multiply the result by the number in the first line under the heading entitled “Expenses Paid” to estimate the expenses you paid on your account during this period.
Hypothetical Example for Comparison Purposes — The second line under each share class in the table below provides information about hypothetical account values and hypothetical expenses based on the Funds’ actual net expense ratios and an assumed rate of return of 5% per year before expenses, which is not the Funds’ actual return. The hypothetical account values and expenses may not be used to estimate the actual ending account balance or expenses you paid for the period. You may use this information to compare the ongoing costs of investing in the Funds and other funds. To do so, compare this 5% hypothetical example with the 5% hypothetical examples that appear in the shareholder reports of the other funds.
Please note that the expenses shown in the table are meant to highlight your ongoing costs only and do not reflect any transactional costs, such as sales charges, redemption fees, or exchange fees. Therefore, the second line of the table is useful in comparing ongoing costs only, and will not help you determine the relative total costs of owning different funds. In addition, if these transactional costs were included, your costs would have been higher:
| Large Cap Growth Insights Fund | Large Cap Value Insights Fund | Small Cap Equity Insights Fund | ||||||||||||||||||||||||||||||||||
| Share Class | Beginning Account Value 5/1/20 | Ending Account Value 10/31/20 | Expenses Paid for the 6 months ended 10/31/2020* | Beginning Account Value 5/1/20 | Ending Account Value 10/31/20 | Expenses Paid for the 6 months ended 10/31/2020* | Beginning Account Value 5/1/20 | Ending Account Value 10/31/20 | Expenses Paid for the 6 months ended 10/31/2020* | |||||||||||||||||||||||||||
| Class A | ||||||||||||||||||||||||||||||||||||
Actual | $ | 1,000.00 | $ | 1,206.86 | $ | 5.05 | $ | 1,000.00 | $ | 1,070.94 | $ | 4.89 | $ | 1,000.00 | $ | 1,124.94 | $ | 6.52 | ||||||||||||||||||
Hypothetical 5% return | 1,000.00 | 1,020.56 | + | 4.62 | 1,000.00 | 1,020.41 | + | 4.77 | 1,000.00 | 1,019.00 | + | 6.19 | ||||||||||||||||||||||||
| Class C | ||||||||||||||||||||||||||||||||||||
Actual | 1,000.00 | 1,202.27 | 9.19 | 1,000.00 | 1,066.93 | 8.78 | 1,000.00 | 1,121.46 | 10.51 | |||||||||||||||||||||||||||
Hypothetical 5% return | 1,000.00 | 1,016.79 | + | 8.42 | 1,000.00 | 1,016.64 | + | 8.57 | 1,000.00 | 1,015.23 | + | 9.98 | ||||||||||||||||||||||||
| Institutional | ||||||||||||||||||||||||||||||||||||
Actual | 1,000.00 | 1,209.02 | 3.00 | 1,000.00 | 1,073.11 | 2.92 | 1,000.00 | 1,127.41 | 4.49 | |||||||||||||||||||||||||||
Hypothetical 5% return | 1,000.00 | 1,022.42 | + | 2.75 | 1,000.00 | 1,022.32 | + | 2.85 | 1,000.00 | 1,020.91 | + | 4.27 | ||||||||||||||||||||||||
| Service | ||||||||||||||||||||||||||||||||||||
Actual | 1,000.00 | 1,205.74 | 5.77 | 1,000.00 | 1,070.50 | 5.52 | 1,000.00 | 1,124.13 | 7.15 | |||||||||||||||||||||||||||
Hypothetical 5% return | 1,000.00 | 1,019.91 | + | 5.28 | 1,000.00 | 1,019.81 | + | 5.38 | 1,000.00 | 1,018.40 | + | 6.80 | ||||||||||||||||||||||||
| Investor | ||||||||||||||||||||||||||||||||||||
Actual | 1,000.00 | 1,208.33 | 3.66 | 1,000.00 | 1,072.56 | 3.59 | 1,000.00 | 1,126.73 | 5.19 | |||||||||||||||||||||||||||
Hypothetical 5% return | 1,000.00 | 1,021.82 | + | 3.35 | 1,000.00 | 1,021.67 | + | 3.51 | 1,000.00 | 1,020.26 | + | 4.93 | ||||||||||||||||||||||||
| Class R6 | ||||||||||||||||||||||||||||||||||||
Actual | 1,000.00 | 1,209.14 | 2.94 | 1,000.00 | 1,073.16 | 2.87 | 1,000.00 | 1,127.41 | 4.44 | |||||||||||||||||||||||||||
Hypothetical 5% return | 1,000.00 | 1,022.47 | + | 2.69 | 1,000.00 | 1,022.37 | + | 2.80 | 1,000.00 | 1,020.96 | + | 4.22 | ||||||||||||||||||||||||
| Class R | ||||||||||||||||||||||||||||||||||||
Actual | 1,000.00 | 1,205.27 | 6.43 | 1,000.00 | 1,069.70 | 6.19 | 1,000.00 | 1,123.62 | 7.85 | |||||||||||||||||||||||||||
Hypothetical 5% return | 1,000.00 | 1,019.30 | + | 5.89 | 1,000.00 | 1,019.15 | + | 6.04 | 1,000.00 | 1,017.75 | + | 7.46 | ||||||||||||||||||||||||
| Class P | ||||||||||||||||||||||||||||||||||||
Actual | 1,000.00 | 1,209.27 | 2.94 | 1,000.00 | 1,073.21 | 2.87 | 1,000.00 | 1,127.41 | 4.44 | |||||||||||||||||||||||||||
Hypothetical 5% return | 1,000.00 | 1,022.47 | + | 2.69 | 1,000.00 | 1,022.37 | + | 2.80 | 1,000.00 | 1,020.96 | + | 4.22 | ||||||||||||||||||||||||
| * | Expenses for each share class are calculated using each Fund’s annualized net expense ratio for each class, which represents the ongoing expenses as a percentage of net assets for the six months ended October 31, 2020. Expenses are calculated by multiplying the annualized net expense ratio by the average account value for the period; then multiplying the result by the number of days in the most recent fiscal half year; and then dividing that result by the number of days in the fiscal year. |
129
GOLDMAN SACHS DOMESTIC EQUITY INSIGHTS FUNDS
Fund Expenses — Six Month Period Ended October 31, 2020 (Unaudited) (continued)
| Small Cap Growth Insights Fund | Small Cap Value Insights Fund | U.S. Equity Insights Fund | ||||||||||||||||||||||||||||||||||
| Share Class | Beginning Account Value 5/1/20 | Ending Account Value 10/31/20 | Expenses Paid for the 6 months ended 10/31/2020* | Beginning Account Value 5/1/20 | Ending Account Value 10/31/20 | Expenses Paid for the 6 months ended 10/31/2020* | Beginning Account Value 5/1/20 | Ending Account Value 10/31/20 | Expenses Paid for the 6 months ended 10/31/2020* | |||||||||||||||||||||||||||
| Class A | ||||||||||||||||||||||||||||||||||||
Actual | $ | 1,000.00 | $ | 1,156.10 | $ | 6.61 | $ | 1,000.00 | $ | 1,110.25 | $ | 6.47 | $ | 1,000.00 | $ | 1,137.17 | $ | 5.05 | ||||||||||||||||||
Hypothetical 5% return | 1,000.00 | 1,019.00 | + | 6.19 | 1,000.00 | 1,019.00 | + | 6.19 | 1,000.00 | 1,020.41 | + | 4.77 | ||||||||||||||||||||||||
| Class C | ||||||||||||||||||||||||||||||||||||
Actual | 1,000.00 | 1,151.85 | 10.66 | 1,000.00 | 1,106.30 | 10.43 | 1,000.00 | 1,132.72 | 9.06 | |||||||||||||||||||||||||||
Hypothetical 5% return | 1,000.00 | 1,015.23 | + | 9.98 | 1,000.00 | 1,015.23 | + | 9.98 | 1,000.00 | 1,016.64 | + | 8.57 | ||||||||||||||||||||||||
| Institutional | ||||||||||||||||||||||||||||||||||||
Actual | 1,000.00 | 1,158.19 | 4.56 | 1,000.00 | 1,112.22 | 4.46 | 1,000.00 | 1,139.11 | 3.01 | |||||||||||||||||||||||||||
Hypothetical 5% return | 1,000.00 | 1,020.91 | + | 4.27 | 1,000.00 | 1,020.91 | + | 4.27 | 1,000.00 | 1,022.32 | + | 2.85 | ||||||||||||||||||||||||
| Service | ||||||||||||||||||||||||||||||||||||
Actual | — | — | — | — | — | — | 1,000.00 | 1,136.47 | 5.69 | |||||||||||||||||||||||||||
Hypothetical 5% return | — | — | — | — | — | — | 1,000.00 | 1,019.81 | + | 5.38 | ||||||||||||||||||||||||||
| Investor | ||||||||||||||||||||||||||||||||||||
Actual | 1,000.00 | 1,157.41 | 5.26 | 1,000.00 | 1,111.60 | 5.15 | 1,000.00 | 1,138.50 | 3.71 | |||||||||||||||||||||||||||
Hypothetical 5% return | 1,000.00 | 1,020.26 | + | 4.93 | 1,000.00 | 1,020.26 | + | 4.93 | 1,000.00 | 1,021.67 | + | 3.51 | ||||||||||||||||||||||||
| Class R6 | ||||||||||||||||||||||||||||||||||||
Actual | 1,000.00 | 1,209.14 | 2.94 | 1,000.00 | 1,073.16 | 2.87 | 1,000.00 | 1,127.41 | 4.44 | |||||||||||||||||||||||||||
Hypothetical 5% return | 1,000.00 | 1,022.47 | + | 2.69 | 1,000.00 | 1,022.37 | + | 2.80 | 1,000.00 | 1,020.96 | + | 4.22 | ||||||||||||||||||||||||
| Class R | ||||||||||||||||||||||||||||||||||||
Actual | 1,000.00 | 1,205.27 | 6.43 | 1,000.00 | 1,069.70 | 6.19 | 1,000.00 | 1,123.62 | 7.85 | |||||||||||||||||||||||||||
Hypothetical 5% return | 1,000.00 | 1,019.30 | + | 5.89 | 1,000.00 | 1,019.15 | + | 6.04 | 1,000.00 | 1,017.75 | + | 7.46 | ||||||||||||||||||||||||
| Class P | ||||||||||||||||||||||||||||||||||||
Actual | 1,000.00 | 1,209.27 | 2.94 | 1,000.00 | 1,073.21 | 2.87 | 1,000.00 | 1,127.41 | 4.44 | |||||||||||||||||||||||||||
Hypothetical 5% return | 1,000.00 | 1,022.47 | + | 2.69 | 1,000.00 | 1,022.37 | + | 2.80 | 1,000.00 | 1,020.96 | + | 4.22 | ||||||||||||||||||||||||
| * | Expenses for each share class are calculated using each Fund’s annualized net expense ratio for each class, which represents the ongoing expenses as a percentage of net assets for the six months ended October 31, 2020. Expenses are calculated by multiplying the annualized net expense ratio by the average account value for the period; then multiplying the result by the number of days in the most recent fiscal half year; and then dividing that result by the number of days in the fiscal year. The annualized net expense ratios for the period were as follows: |
| Fund | Class A Shares | Class C Shares | Institutional Shares | Service Shares | Investor Shares | Class R6 Shares | Class R Shares | Class P Shares | ||||||||||||||||||||||||
Large Cap Growth Insights | 0.91 | % | 1.66 | % | 0.54 | % | 1.04 | % | 0.66 | % | 0.53 | % | 1.16 | % | 0.53 | % | ||||||||||||||||
Large Cap Value Insights | 0.94 | 1.69 | 0.56 | 1.06 | 0.69 | 0.55 | 1.19 | 0.55 | ||||||||||||||||||||||||
Small Cap Equity Insights | 1.22 | 1.97 | 0.84 | 1.34 | 0.97 | 0.83 | 1.47 | 0.83 | ||||||||||||||||||||||||
Small Cap Growth Insights | 1.22 | 1.97 | 0.84 | N/A | 0.97 | 0.83 | 1.47 | 0.83 | ||||||||||||||||||||||||
Small Cap Value Insights | 1.22 | 1.97 | 0.84 | N/A | 0.97 | 0.83 | 1.47 | 0.83 | ||||||||||||||||||||||||
U.S. Equity Insights | 0.94 | 1.69 | 0.56 | 1.06 | 0.69 | 0.55 | 1.19 | 0.55 | ||||||||||||||||||||||||
| + | Hypothetical expenses are based on each Fund’s actual annualized net expense ratios and an assumed rate of return of 5% per year before expenses. |
130
GOLDMAN SACHS DOMESTIC EQUITY INSIGHTS FUNDS
Statement Regarding Basis for Approval of Management Agreement (Unaudited)
Background
The Goldman Sachs Large Cap Growth Insights Fund, Goldman Sachs Large Cap Value Insights Fund, Goldman Sachs Small Cap Equity Insights Fund, Goldman Sachs Small Cap Growth Insights Fund, Goldman Sachs Small Cap Value Insights Fund, and Goldman Sachs U.S. Equity Insights Fund (the “Funds”) are investment portfolios of Goldman Sachs Trust (the “Trust”). The Board of Trustees oversees the management of the Trust and reviews the investment performance and expenses of the Funds at regularly scheduled meetings held throughout the year. In addition, the Board of Trustees determines annually whether to approve the continuance of the Trust’s investment management agreement (the “Management Agreement”) with Goldman Sachs Asset Management, L.P. (the “Investment Adviser”) on behalf of the Funds.
The Management Agreement was most recently approved for continuation until June 30, 2021 by the Board of Trustees, including those Trustees who are not parties to the Management Agreement or “interested persons” (as defined in the Investment Company Act of 1940, as amended) of any party thereto (the “Independent Trustees”), at a meeting held on June 16-17, 2020 (the “Annual Meeting”).
The review process undertaken by the Trustees spans the course of the year and culminates with the Annual Meeting. To assist the Trustees in their deliberations, the Trustees have established a Contract Review Committee (the “Committee”), comprised of the Independent Trustees. The Committee held two meetings over the course of the year since the Management Agreement was last approved. At those Committee meetings, regularly scheduled Board or other committee meetings, and/or the Annual Meeting, matters relevant to the renewal of the Management Agreement were considered by the Board, or the Independent Trustees, as applicable. With respect to each Fund, such matters included:
| (a) | the nature and quality of the advisory, administrative, and other services provided to the Fund by the Investment Adviser and its affiliates, including information about: |
| (i) | the structure, staff, and capabilities of the Investment Adviser and its portfolio management teams; |
| (ii) | the groups within the Investment Adviser and its affiliates that support the portfolio management teams or provide other types of necessary services, including fund services groups (e.g., accounting and financial reporting, tax, shareholder services, and operations); controls and risk management groups (e.g., legal, compliance, valuation oversight, credit risk management, internal audit, compliance testing, market risk analysis, finance, and central funding); sales and distribution support groups, and others (e.g., information technology and training); |
| (iii) | trends in employee headcount; |
| (iv) | the Investment Adviser’s financial resources and ability to hire and retain talented personnel and strengthen its operations; and |
| (v) | the parent company’s support of the Investment Adviser and its mutual fund business, as expressed by the firm’s senior management; |
| (b) | information on the investment performance of the Fund, including comparisons to the performance of similar mutual funds, as provided by a third-party mutual fund data provider engaged as part of the contract review process (the “Outside Data Provider”), a benchmark performance index, and (in the case of the Large Cap Growth Insights Fund, Small Cap Growth Insights Fund, and U.S. Equity Insights Fund) a composite of accounts with comparable investment strategies managed by the Investment Adviser; and information on general investment outlooks in the markets in which the Fund invests; |
| (c) | information provided by the Investment Adviser indicating the Investment Adviser’s views on whether the Fund’s peer group and/or benchmark index had high, medium, or low relevance given the Fund’s particular investment strategy; |
| (d) | the terms of the Management Agreement and other agreements with affiliated service providers entered into by the Trust on behalf of the Fund; |
| (e) | fee and expense information for the Fund, including: |
| (i) | the relative management fee and expense levels of the Fund as compared to those of comparable funds managed by other advisers, as provided by the Outside Data Provider; |
| (ii) | the Fund’s expense trends over time; and |
| (iii) | to the extent the Investment Adviser manages other types of accounts (such as bank collective trusts, private wealth management accounts, institutional separate accounts, sub-advised mutual funds, and non-U.S. funds) having investment objectives and policies similar to those of the Fund, comparative information on the advisory fees charged and services provided to those accounts by the Investment Adviser; |
| (f) | with respect to the extensive investment performance and expense comparison data provided by the Outside Data Provider, its processes in producing that data for the Fund; |
| (g) | the undertakings of the Investment Adviser and its affiliates to implement fee waivers and/or expense limitations; |
131
GOLDMAN SACHS DOMESTIC EQUITY INSIGHTS FUNDS
Statement Regarding Basis for Approval of Management Agreement (Unaudited) (continued)
| (h) | information relating to the profitability of the Management Agreement and the transfer agency and distribution and service arrangements of the Fund to the Investment Adviser and its affiliates; |
| (i) | whether the Fund’s existing management fee schedule adequately addressed any economies of scale; |
| (j) | a summary of the “fall-out” benefits derived by the Investment Adviser and its affiliates from their relationships with the Fund, including the fees received by the Investment Adviser’s affiliates from the Fund for transfer agency, securities lending, portfolio trading, distribution and other services; |
| (k) | a summary of potential benefits derived by the Fund as a result of its relationship with the Investment Adviser; |
| (l) | information regarding commissions paid by the Fund and broker oversight, other information regarding portfolio trading, and how the Investment Adviser carries out its duty to seek best execution; |
| (m) | portfolio manager ownership of Fund shares; the manner in which portfolio manager compensation is determined; and the number and types of accounts managed by the portfolio managers; |
| (n) | the nature and quality of the services provided to the Fund by its unaffiliated service providers, and the Investment Adviser’s general oversight and evaluation (including reports on due diligence) of those service providers as part of the administrative services provided under the Management Agreement; and |
| (o) | the Investment Adviser’s processes and policies addressing various types of potential conflicts of interest; its approach to risk management; the annual review of the effectiveness of the Fund’s compliance program; and periodic compliance reports. |
The Trustees also received an overview of the Funds’ distribution arrangements. They received information regarding the Funds’ assets, share purchase and redemption activity, and payment of distribution, service, and shareholder administration fees, as applicable. Information was also provided to the Trustees relating to revenue sharing payments made by and services provided by the Investment Adviser and its affiliates to intermediaries that promote the sale, distribution, and/or servicing of Fund shares. The Independent Trustees also discussed the broad range of other investment choices that are available to Fund investors, including the availability of comparable funds managed by other advisers.
The presentations made at the Board and Committee meetings and at the Annual Meeting encompassed the Funds and other mutual funds for which the Board of Trustees has responsibility. In evaluating the Management Agreement at the Annual Meeting, the Trustees relied upon their knowledge, resulting from their meetings and other interactions throughout the year, of the Investment Adviser and its affiliates, their services, and the Funds. In conjunction with these meetings, the Trustees received written materials and oral presentations on the topics covered, and the Investment Adviser addressed the questions and concerns of the Trustees, including concerns regarding the investment performance of certain of the funds they oversee. The Independent Trustees were advised by their independent legal counsel regarding their responsibilities and other regulatory requirements related to the approval and continuation of mutual fund investment management agreements under applicable law. In addition, the Investment Adviser and its affiliates provided the Independent Trustees with a written response to a formal request for information sent on behalf of the Independent Trustees by their independent legal counsel. During the course of their deliberations, the Independent Trustees met in executive sessions with their independent legal counsel, without representatives of the Investment Adviser or its affiliates present.
Nature, Extent, and Quality of the Services Provided Under the Management Agreement
As part of their review, the Trustees considered the nature, extent, and quality of the services provided to the Funds by the Investment Adviser. In this regard, the Trustees considered both the investment advisory services and non-advisory services that are provided by the Investment Adviser and its affiliates. The Trustees noted the transition in the leadership and changes in personnel of various of the Investment Adviser’s portfolio management teams that had occurred in recent periods, and the ongoing recruitment efforts aimed at bringing high quality investment talent to the Investment Adviser. They also noted the Investment Adviser’s commitment to maintaining high quality systems and expending substantial resources to respond to ongoing changes to the market, regulatory and control environment in which the Funds and their service providers operate, including changes associated with the COVID-19 pandemic, as well as the efforts of the Investment Adviser and its affiliates to combat cyber security risks. The Trustees also considered information regarding the Investment Adviser’s business continuity planning and remote operations in the current environment. The Trustees concluded that the Investment Adviser continued to commit substantial financial and operational resources to the Funds and expressed confidence that the Investment Adviser would continue to do so in the future. The Trustees also recognized that the Investment Adviser had made significant commitments to address regulatory compliance requirements applicable to the Funds and the Investment Adviser and its affiliates.
132
GOLDMAN SACHS DOMESTIC EQUITY INSIGHTS FUNDS
Statement Regarding Basis for Approval of Management Agreement (Unaudited) (continued)
Investment Performance
The Trustees also considered the investment performance of the Funds. In this regard, they compared the investment performance of each Fund to its peers using rankings and ratings compiled by the Outside Data Provider as of December 31, 2019, and updated performance information prepared by the Investment Adviser using the peer group identified by the Outside Data Provider as of March 31, 2020. The information on each Fund’s investment performance was provided for the one-, three-, five-, and ten-year periods ending on the applicable dates. The Trustees also reviewed each Fund’s investment performance relative to its performance benchmark. As part of this review, they considered the investment performance trends of the Funds over time, and reviewed the investment performance of each Fund in light of its investment objective and policies and market conditions. The Trustees also received information comparing the Large Cap Growth Insights Fund’s, Small Cap Growth Insights Fund’s, and U.S. Equity Insights Fund’s performance to that of composites of accounts with comparable investment strategies managed by the Investment Adviser.
In addition, the Trustees considered materials prepared and presentations made by the Investment Adviser’s senior management and portfolio management personnel in which Fund performance was assessed. The Trustees also considered the Investment Adviser’s periodic reports with respect to the Funds’ risk profiles, and how the Investment Adviser’s approach to risk monitoring and management influences portfolio management. They noted the efforts of the Funds’ portfolio management team to continue to enhance the investment models used in managing the Funds.
The Trustees noted that the Large Cap Growth Insights Fund’s Institutional Shares had placed in the top half of the Fund’s peer group for the ten-year period and in the third quartile for the one-, three-, and five-year periods, and had underperformed the Fund’s benchmark index for the one-, three-, five-, and ten-year periods ended March 31, 2020. They observed that the Large Cap Value Insights Fund’s Institutional Shares had placed in the top half of the Fund’s peer group for the ten-year period, in the third quartile for the three- and five-year periods, and in the fourth quartile for the one-year period, and had outperformed the Fund’s benchmark index for the ten-year period and underperformed for the one-, three-, and five-year periods ended March 31, 2020. The Trustees noted that the Small Cap Equity Insights Fund’s Institutional Shares had placed in the top half of the Fund’s peer group for the three-, five-, and ten-year periods and in the third quartile for the one-year period, and had outperformed the Fund’s benchmark index for the ten-year period and underperformed for the one-, three-, and five-year periods ended March 31, 2020. They observed that the Small Cap Growth Insights Fund’s Institutional Shares had placed in the third quartile of the Fund’s peer group for the three- and ten-year periods and in the fourth quartile for the one- and five-year periods, and had underperformed the Fund’s benchmark index for the one-, three-, five-, and ten-year periods ended March 31, 2020. The Trustees noted that the Small Cap Value Insights Fund’s Institutional Shares had placed in the top half of the Fund’s peer group for the one-, three-, five-, and ten-year periods, and had outperformed the Fund’s benchmark index for the three-, five-, and ten-year periods and underperformed for the one-year period ended March 31, 2020. They observed that the U.S. Equity Insights Fund’s Institutional Shares had placed in the top half of the Fund’s peer group for the five- and ten-year periods and in the third quartile for the one- and three-year periods, and had underperformed the Fund’s benchmark index for the one-, three-, five-, and ten-year periods ended March 31, 2020.
Costs of Services Provided and Competitive Information
The Trustees considered the contractual terms of the Management Agreement and the fee rates payable by each Fund thereunder. In this regard, the Trustees considered information on the services rendered by the Investment Adviser to the Funds, which included both advisory and administrative services that were directed to the needs and operations of the Funds as registered mutual funds.
In particular, the Trustees reviewed analyses prepared by the Outside Data Provider regarding the expense rankings of the Funds. The analyses provided a comparison of each Fund’s management fee and breakpoints to those of a relevant peer group and category universe; an expense analysis which compared each Fund’s overall net and gross expenses to a peer group and a category universe; and data comparing each Fund’s net expenses to the peer and category medians. The analyses also compared each Fund’s other expenses and fee waivers/reimbursements to those of the peer group and category medians. The Trustees concluded that the comparisons provided by the Outside Data Provider were useful in evaluating the reasonableness of the management fees and total expenses paid by the Funds.
In addition, the Trustees considered the Investment Adviser’s undertakings to implement fee waivers and/or expense limitations. They also considered, to the extent that the Investment Adviser manages other types of accounts having investment objectives and policies similar to those of the Funds, comparative fee information for services provided by the Investment Adviser to those accounts, and information that indicated that services provided to the Funds differed in various significant respects from the services provided to other types of accounts which, in many cases, operated under less stringent legal and regulatory structures, required fewer services from the Investment Adviser to a smaller number of client contact points, and were less time-intensive.
133
GOLDMAN SACHS DOMESTIC EQUITY INSIGHTS FUNDS
Statement Regarding Basis for Approval of Management Agreement (Unaudited) (continued)
In addition, the Trustees noted that shareholders are able to redeem their Fund shares at any time if shareholders believe that the Fund fees and expenses are too high or if they are dissatisfied with the performance of the Fund.
Profitability
The Trustees reviewed each Fund’s contribution to the Investment Adviser’s revenues and pre-tax profit margins. In this regard the Trustees noted that they had received, among other things, profitability analyses and summaries, revenue and expense schedules by Fund and by function (i.e., investment management, transfer agency and distribution and service), and information on the Investment Adviser’s expense allocation methodology. They observed that the profitability and expense figures are substantially similar to those used by the Investment Adviser for many internal purposes, including compensation decisions among various business groups, and are thus subject to a vigorous internal debate about how certain revenue and expenses should be allocated. The Trustees also noted that the internal audit group within the Goldman Sachs organization periodically audits the expense allocation methodology and that the internal audit group was satisfied with the reasonableness, consistency, and accuracy of the Investment Adviser’s expense allocation methodology. Profitability data for each Fund was provided for 2019 and 2018, and the Trustees considered this information in relation to the Investment Adviser’s overall profitability.
Economies of Scale
The Trustees considered the information that had been provided regarding whether there have been economies of scale with respect to the management of the Funds. The Trustees also considered the breakpoints in the fee rate payable under the Management Agreement for each of the Funds at the following annual percentage rates of the average daily net assets of the Funds:
Average Daily | Large Cap Growth Insights Fund | Large Cap Value Insights Fund | Small Cap Equity Insights Fund | Small Cap Growth Insights Fund | Small Cap Value Insights Fund | U.S. Equity Insights Fund | ||||||||||||||||||
| First $1 billion | 0.52 | % | 0.52 | % | 0.80 | % | 0.80 | % | 0.80 | % | 0.52 | % | ||||||||||||
| Next $1 billion | 0.47 | 0.47 | 0.80 | 0.80 | 0.80 | 0.47 | ||||||||||||||||||
| Next $3 billion | 0.44 | 0.44 | 0.72 | 0.72 | 0.72 | 0.44 | ||||||||||||||||||
| Next $3 billion | 0.44 | 0.44 | 0.68 | 0.68 | 0.68 | 0.44 | ||||||||||||||||||
| Over $8 billion | 0.43 | 0.43 | 0.67 | 0.67 | 0.67 | 0.43 | ||||||||||||||||||
The Trustees noted that the breakpoints were designed to share potential economies of scale, if any, with the Funds and their shareholders as assets under management reach those asset levels. The Trustees considered the amounts of assets in the Funds; the Funds’ recent share purchase and redemption activity; the information provided by the Investment Adviser relating to the costs of the services provided by the Investment Adviser and its affiliates and their realized profits; information comparing fee rates charged by the Investment Adviser with fee rates charged to other funds in the peer groups; and the Investment Adviser’s undertaking to limit certain expenses of the Funds that exceed specified levels. Upon reviewing these matters at the Annual Meeting, the Trustees concluded that the fee breakpoints represented a means of assuring that benefits of scalability, if any, would be passed along to shareholders at the specified asset levels. They also noted that the Investment Adviser had passed along savings to shareholders of the Large Cap Growth Insights Fund, which had asset levels above at least the first breakpoint during the prior fiscal year.
Other Benefits to the Investment Adviser and Its Affiliates
The Trustees also considered the other benefits derived by the Investment Adviser and its affiliates from their relationships with the Funds as stated above, including: (a) transfer agency fees received by Goldman Sachs & Co. LLC (“Goldman Sachs”); (b) brokerage and futures commissions earned by Goldman Sachs for executing securities and futures transactions on behalf of the Funds; (c) trading efficiencies resulting from aggregation of orders of the Funds with those for other funds or accounts managed by the Investment Adviser; (d) fees earned by Goldman Sachs Agency Lending (“GSAL”), an affiliate of the Investment Adviser, as securities lending agent (and fees earned by the Investment Adviser for managing the fund in which the Funds’ cash collateral is invested); (e) the Investment Adviser’s ability to leverage the infrastructure designed to service the Funds on behalf of its other clients; (f) the Investment Adviser’s ability to cross-market other products and services to Fund shareholders; (g) Goldman Sachs’ retention of certain fees as Fund Distributor; (h) the Investment Adviser’s ability to negotiate better pricing with custodians on behalf of its other clients, as a result of the relationship with the Funds; (i) the investment of cash and cash collateral in money market funds managed by the Investment Adviser that will result in increased assets under management for those money market funds; (j) the investment in exchange-traded funds (“ETFs”) managed by the Investment Adviser that will result in increased assets under management for those ETFs and may facilitate the development of the Investment Adviser’s ETF advisory business; and
134
GOLDMAN SACHS DOMESTIC EQUITY INSIGHTS FUNDS
Statement Regarding Basis for Approval of Management Agreement (Unaudited) (continued)
(k) the possibility that the working relationship between the Investment Adviser and the Funds’ third-party service providers may cause those service providers to be more likely to do business with other areas of Goldman Sachs. In the course of considering the foregoing, the Independent Trustees requested and received further information quantifying certain of these fall-out benefits.
Other Benefits to the Funds and Their Shareholders
The Trustees also noted that the Funds receive certain other potential benefits as a result of their relationship with the Investment Adviser, including: (a) trading efficiencies resulting from aggregation of orders of the Funds with those of other funds or accounts managed by the Investment Adviser; (b) enhanced servicing from vendors due to the volume of business generated by the Investment Adviser and its affiliates; (c) enhanced servicing from broker-dealers due to the volume of business generated by the Investment Adviser and its affiliates; (d) the Investment Adviser’s ability to negotiate favorable terms with derivatives counterparties on behalf of the Funds as a result of the size and reputation of the Goldman Sachs organization; (e) the advantages received from the Investment Adviser’s knowledge and experience gained from managing other accounts and products; (f) the Investment Adviser’s ability to hire and retain qualified personnel to provide services to the Funds because of the reputation of the Goldman Sachs organization; (g) the Funds’ access, through the Investment Adviser, to certain firm-wide resources (e.g., proprietary risk management systems and databases), subject to certain restrictions; (h) the Funds’ ability to participate in the securities lending program administered by GSAL, as measured by the revenue received by the Funds in connection with the program; and (i) the Funds’ access to certain affiliated distribution channels. In addition, the Trustees noted the competitive nature of the mutual fund marketplace, and considered that many of the Funds’ shareholders invested in the Funds in part because of the Funds’ relationship with the Investment Adviser and that those shareholders have a general expectation that the relationship will continue.
Conclusion
In connection with their consideration of the Management Agreement, the Trustees gave weight to each of the factors described above, but did not identify any particular factor as controlling their decision. After deliberation and consideration of all of the information provided, including the factors described above, the Trustees concluded, in the exercise of their business judgment, that the management fees paid by each of the Funds were reasonable in light of the services provided to it by the Investment Adviser, the Investment Adviser’s costs and each Fund’s current and reasonably foreseeable asset levels. The Trustees unanimously concluded that the Investment Adviser’s continued management likely would benefit each Fund and its shareholders and that the Management Agreement should be approved and continued with respect to each Fund until June 30, 2021.
135
GOLDMAN SACHS DOMESTIC EQUITY INSIGHTS FUNDS
Trustees and Officers (Unaudited)
Independent Trustees
Name, Address and Age1 | Position(s) Held with the Trust | Term of Office and Length of Time Served2 | Principal Occupation(s) During Past 5 Years | Number of Portfolios in Fund Complex Overseen by Trustee3 | Other Directorships Held by Trustee4 | |||||
Jessica Palmer Age: 71 | Chair of the Board of Trustees | Since 2018 (Trustee since 2007) | Ms. Palmer is retired. She was formerly Consultant, Citigroup Human Resources Department (2007-2008); Managing Director, Citigroup Corporate and Investment Banking (previously, Salomon Smith Barney/Salomon Brothers) (1984-2006). Ms. Palmer was a Member of the Board of Trustees of Indian Mountain School (private elementary and secondary school) (2004-2009).
Chair of the Board of Trustees — Goldman Sachs Trust and Goldman Sachs Variable Insurance Trust. | 105 | None | |||||
Dwight L. Bush Age: 63 | Trustee | Since 2020 | Ambassador Bush is President and CEO of D.L. Bush & Associates (a financial advisory and private investment firm) (2002-2014 and 2017- present); and was formerly U.S. Ambassador to the Kingdom of Morocco (2014-2017) and a Member of the Board of Directors of Santander Bank, N.A. (2018-2019). Previously, Ambassador Bush served as an Advisory Board Member of Goldman Sachs Trust and Goldman Sachs Variable Insurance Trust (October 2019-January 2020).
Trustee — Goldman Sachs Trust and Goldman Sachs Variable Insurance Trust. | 105 | None | |||||
Kathryn A. Cassidy Age: 66 | Trustee | Since 2015 | Ms. Cassidy is retired. Formerly, she was Advisor to the Chairman (May 2014-December 2014); and Senior Vice President and Treasurer (2008-2014), General Electric Company & General Electric Capital Corporation (technology and financial services companies).
Trustee — Goldman Sachs Trust and Goldman Sachs Variable Insurance Trust. | 105 | None | |||||
Diana M. Daniels Age: 71 | Trustee | Since 2007 | Ms. Daniels is retired. Formerly, she was Vice President, General Counsel and Secretary, The Washington Post Company (1991-2006). Ms. Daniels is a Trustee Emeritus and serves as a Presidential Councillor of Cornell University (2013-Present); former Member of the Legal Advisory Board, New York Stock Exchange (2003-2006) and of the Corporate Advisory Board, Standish Mellon Management Advisors (2006-2007).
Trustee — Goldman Sachs Trust and Goldman Sachs Variable Insurance Trust. | 105 | None | |||||
Joaquin Delgado Age: 60 | Trustee | Since 2020 | Dr. Delgado is retired. He is Director, Hexion Inc. (a specialty chemical manufacturer) (2019-present); and Director, Stepan Company (a specialty chemical manufacturer) (2011-present); and was formerly Executive Vice President, Consumer Business Group of 3M Company (July 2016-July 2019); and Executive Vice President, Health Care Business Group of 3M Company (October 2012-July 2016). Previously, Dr. Delgado served as an Advisory Board Member of Goldman Sachs Trust and Goldman Sachs Variable Insurance Trust (October 2019-January 2020).
Trustee — Goldman Sachs Trust and Goldman Sachs Variable Insurance Trust. | 105 | Stepan Company (a specialty chemical manufacturer) | |||||
Roy W. Templin Age: 60 | Trustee | Since 2013 | Mr. Templin is retired. He is Director, Armstrong World Industries, Inc. (a designer and manufacturer of ceiling, wall and suspension system solutions) (2016-Present); and was formerly Chairman of the Board of Directors, Con- Way Incorporated (a transportation, logistics and supply chain management service company) (2014-2015); Executive Vice President and Chief Financial Officer, Whirlpool Corporation (an appliance manufacturer and marketer) (2004-2012).
Trustee — Goldman Sachs Trust and Goldman Sachs Variable Insurance Trust. | 105 | Armstrong World Industries, Inc. (a ceiling, wall and suspension systems solutions manufacturer) | |||||
Gregory G. Weaver Age: 69 | Trustee | Since 2015 | Mr. Weaver is retired. He is Director, Verizon Communications Inc. (2015-Present); and was formerly Chairman and Chief Executive Officer, Deloitte & Touche LLP (a professional services firm) (2001-2005 and 2012-2014); and Member of the Board of Directors, Deloitte & Touche LLP (2006-2012).
Trustee — Goldman Sachs Trust and Goldman Sachs Variable Insurance Trust. | 105 | Verizon Communications Inc. | |||||
136
GOLDMAN SACHS DOMESTIC EQUITY INSIGHTS FUNDS
Trustees and Officers (Unaudited) (continued)
Interested Trustee*
Name, Address and Age1 | Position(s) Held with the Trust | Term of Office and Length of Time Served2 | Principal Occupation(s) During Past 5 Years | Number of Portfolios in Fund Complex Overseen by Trustee3 | Other Directorships Held by Trustee4 | |||||
James A. McNamara Age: 58 | President and Trustee | Since 2007 | Advisory Director, Goldman Sachs (January 2018 — Present); Managing Director, Goldman Sachs (January 2000-December 2017); Director of Institutional Fund Sales, GSAM (April 1998- December 2000); and Senior Vice President and Manager, Dreyfus Institutional Service Corporation (January 1993-April 1998).
President and Trustee — Goldman Sachs Trust; Goldman Sachs Variable Insurance Trust; Goldman Sachs Trust II; Goldman Sachs MLP and Energy Renaissance Fund; Goldman Sachs ETF Trust; Goldman Sachs Credit Income Fund; and Goldman Sachs Real Estate Diversified Income Fund. | 170 | None | |||||
| * | Mr. McNamara is considered to be an “Interested Trustee” because he holds positions with Goldman Sachs and owns securities issued by The Goldman Sachs Group, Inc. Mr. McNamara holds comparable positions with certain other companies of which Goldman Sachs, GSAM or an affiliate thereof is the investment adviser, administrator and/or distributor. |
| 1 | Each Trustee may be contacted by writing to the Trustee, c/o Goldman Sachs, 200 West Street, New York, New York, 10282, Attn: Caroline Kraus. Information is provided as of October 31, 2020. |
| 2 | Subject to such policies as may be adopted by the Board from time-to-time, each Trustee holds office for an indefinite term, until the earliest of: (a) the election of his or her successor; (b) the date the Trustee resigns or is removed by the Board or shareholders, in accordance with the Trust’s Declaration of Trust; or (c) the termination of the Trust. The Board has adopted policies which provide that each Independent Trustee shall retire as of December 31st of the calendar year in which he or she reaches (a) his or her 75th birthday or (b) the 15th anniversary of the date he or she became a Trustee, whichever is earlier, unless a waiver of such requirements shall have been adopted by a majority of the other Trustees. These policies may be changed by the Trustees without shareholder vote. |
| 3 | The Goldman Sachs Fund Complex includes certain other companies listed above for each respective Trustee. As of October 31, 2020, Goldman Sachs Trust consisted of 92 portfolios (90 of which offered shares to the public); Goldman Sachs Variable Insurance Trust consisted of 13 portfolios; Goldman Sachs Trust II consisted of 19 portfolios (17 of which offered shares to the public); Goldman Sachs ETF Trust consisted of 42 portfolios (24 of which offered shares to the public); and Goldman Sachs MLP and Energy Renaissance Fund, Goldman Sachs Credit Income Fund and Goldman Sachs Real Estate Diversified Income Fund each consisted of one portfolio. Goldman Sachs Credit Income Fund did not offer shares to the public. |
| 4 | This column includes only directorships of companies required to report to the Securities and Exchange Commission under the Securities Exchange Act of 1934 (i.e., “public companies”) or other investment companies registered under the Act. |
Additional information about the Trustees is available in the Funds’ Statement of Additional Information, which can be obtained from Goldman Sachs free of charge by calling this toll-free number (in the United States of America): 1-800-526-7384.
137
GOLDMAN SACHS DOMESTIC EQUITY INSIGHTS FUNDS
Trustees and Officers (Unaudited) (continued)
Officers of the Trust*
| Name, Address and Age1 | Positions Held with the Trust | Term of Office and Length of Time Served2 | Principal Occupation(s) During Past 5 Years | |||
James A. McNamara 200 West Street New York, NY 10282 Age: 58 | Trustee and President | Since 2014 | Advisory Director, Goldman Sachs (January 2018-Present); Managing Director, Goldman Sachs (January 2000-December 2017); Director of Institutional Fund Sales, GSAM (April 1998-December 2000); and Senior Vice President and Manager, Dreyfus Institutional Service Corporation (January 1993-April 1998).
President and Trustee — Goldman Sachs Trust; Goldman Sachs Variable Insurance Trust; Goldman Sachs Trust II; Goldman Sachs MLP and Energy Renaissance Fund; Goldman Sachs ETF Trust; Goldman Sachs Credit Income Fund; and Goldman Sachs Real Estate Diversified Income Fund. | |||
Caroline L. Kraus 200 West Street New York, NY 10282 Age: 43 | Secretary | Since 2014 | Managing Director, Goldman Sachs (January 2016-Present); Vice President, Goldman Sachs (August 2006-December 2015); Senior Counsel, Goldman Sachs (January 2020–Present); Associate General Counsel, Goldman Sachs (2012-December 2019); Assistant General Counsel, Goldman Sachs (August 2006-December 2011); and Associate, Weil, Gotshal & Manges, LLP (2002-2006).
Secretary — Goldman Sachs Trust (previously Assistant Secretary (2012)); Goldman Sachs Variable Insurance Trust (previously Assistant Secretary (2012)); Goldman Sachs Trust II; Goldman Sachs BDC, Inc.; Goldman Sachs Private Middle Market Credit LLC; Goldman Sachs Private Middle Market Credit II LLC; Goldman Sachs Middle Market Lending Corp.; Goldman Sachs MLP and Energy Renaissance Fund; Goldman Sachs ETF Trust; Goldman Sachs ETF Trust; Goldman Sachs Credit Income Fund; and Goldman Sachs Real Estate Diversified Income Fund. | |||
Joseph F. DiMaria 30 Hudson Street Jersey City, NJ 07302 Age: 52 | Treasurer, Principal Financial Officer and Principal Accounting Officer | Since 2017 (Treasurer and Principal Financial Officer since 2019) | Managing Director, Goldman Sachs (November 2015-Present) and Vice President — Mutual Fund Administration, Columbia Management Investment Advisers, LLC (May 2010- October 2015).
Treasurer, Principal Financial Officer and Principal Accounting Officer — Goldman Sachs Trust (previously Assistant Treasurer (2016)); Goldman Sachs Variable Insurance Trust (previously Assistant Treasurer (2016)); Goldman Sachs Trust II (previously Assistant Treasurer (2017)); Goldman Sachs MLP and Energy Renaissance Fund (previously Assistant Treasurer (2017)); Goldman Sachs ETF Trust (previously Assistant Treasurer (2017)); Goldman Sachs Credit Income Fund; and Goldman Sachs Real Estate Diversified Income Fund. | |||
| * | Represents a partial list of officers of the Trust. Additional information about all the officers is available in the Funds’ Statement of Additional Information, which can be obtained from Goldman Sachs free of charge by calling this toll-free number (in the United States): 1-800-526-7384. |
| 1 | Information is provided as of October 31, 2020. |
| 2 | Officers hold office at the pleasure of the Board of Trustees or until their successors are duly elected and qualified. Each officer holds comparable positions with certain other companies of which Goldman Sachs, GSAM or an affiliate thereof is the investment adviser, administrator and/or distributor. |
Goldman Sachs Trust — Domestic Equity Insights Funds — Tax Information (Unaudited)
For the year ended October 31, 2020, 93.37%, 100%, 100%, 100%, 100%, and 100% of the dividends paid from net investment company taxable income by the Large Cap Growth Insights, Large Cap Value Insights, Small Cap Equity Insights, Small Cap Growth Insights, Small Cap Value Insights, and U.S. Equity Insights Funds, respectively, qualify for the dividends received deduction available to corporations.
For the year ended October 31, 2020, 100%, 100%, 100%, 100%, and 100% of the dividends paid from net investment company taxable income by the Large Cap Growth Insights, Large Cap Value Insights, Small Cap Equity Insights, Small Cap Value Insights, and U.S. Equity Insights Funds, respectively, qualify for the reduced tax rate under the Jobs and Growth Tax Relief and Reconciliation Act of 2003.
Pursuant to Section 852 of the Internal Revenue Code, the Large Cap Growth Insights and Small Cap Growth Insights Funds designate $66,785,470 and $14,457,173 respectively, or if different, the maximum amount allowable, as capital gain dividends paid during the fiscal year ended October 31, 2020.
During the fiscal year ended October 31, 2020, the Small Cap Growth Insights Fund designates $12,041 as short-term capital gain dividends pursuant to Section 871(k) of the Internal Revenue Code.
138
FUNDS PROFILE
Goldman Sachs Funds
Goldman Sachs is a premier financial services firm, known since 1869 for creating thoughtful and customized investment solutions in complex global markets.
Today, the Consumer and Investment Management Division of Goldman Sachs serves a diverse set of clients worldwide, including private institutions, public entities and individuals. With approximately $1.86 trillion in assets under supervision as of September 30, 2020, Goldman Sachs Asset Management (“GSAM”) has portfolio management teams located around the world and our investment professionals bring firsthand knowledge of local markets to every investment decision. Assets under supervision includes assets under management and other client assets for which Goldman Sachs does not have full discretion. GSAM leverages the resources of Goldman Sachs & Co. LLC subject to legal, internal and regulatory restrictions.
Money Market
Financial Square FundsSM
| ∎ | Financial Square Treasury Solutions Fund1 |
| ∎ | Financial Square Government Fund1 |
| ∎ | Financial Square Money Market Fund2 |
| ∎ | Financial Square Prime Obligations Fund2 |
| ∎ | Financial Square Treasury Instruments Fund1 |
| ∎ | Financial Square Treasury Obligations Fund1 |
| ∎ | Financial Square Federal Instruments Fund1 |
Investor FundsSM
| ∎ | Investor Money Market Fund3 |
| ∎ | Investor Tax-Exempt Money Market Fund3 |
Fixed Income
Short Duration and Government
| ∎ | Enhanced Income Fund |
| ∎ | High Quality Floating Rate Fund |
| ∎ | Short-Term Conservative Income Fund |
| ∎ | Short Duration Government Fund |
| ∎ | Short Duration Income Fund |
| ∎ | Government Income Fund |
| ∎ | Inflation Protected Securities Fund |
Multi-Sector
| ∎ | Bond Fund |
| ∎ | Core Fixed Income Fund |
| ∎ | Global Core Fixed Income Fund4 |
| ∎ | Income Fund |
| ∎ | Strategic Income Fund |
Municipal and Tax-Free
| ∎ | High Yield Municipal Fund |
| ∎ | Dynamic Municipal Income Fund |
| ∎ | Municipal Income Completion Fund |
| ∎ | Short Duration Tax-Free Fund |
Single Sector
| ∎ | Investment Grade Credit Fund |
| ∎ | U.S. Mortgages Fund |
| ∎ | High Yield Fund |
| ∎ | High Yield Floating Rate Fund |
| ∎ | Emerging Markets Debt Fund |
| ∎ | Local Emerging Markets Debt Fund |
Fixed Income Alternatives
| ∎ | Long Short Credit Strategies Fund |
Fundamental Equity
| ∎ | Equity Income Fund |
| ∎ | Small Cap Growth Fund |
| ∎ | Small Cap Value Fund |
| ∎ | Small/Mid Cap Value Fund |
| ∎ | Mid Cap Value Fund |
| ∎ | Large Cap Value Fund |
| ∎ | Focused Value Fund |
| ∎ | Capital Growth Fund |
| ∎ | Strategic Growth Fund |
| ∎ | Small/Mid Cap Growth Fund |
| ∎ | Flexible Cap Fund |
| ∎ | Concentrated Growth Fund |
| ∎ | Technology Opportunities Fund |
| ∎ | Growth Opportunities Fund |
| ∎ | Rising Dividend Growth Fund |
| ∎ | U.S. Equity ESG Fund5 |
| ∎ | Income Builder Fund |
| ∎ | Defensive Equity Fund |
Tax-Advantaged Equity
| ∎ | U.S. Tax-Managed Equity Fund |
| ∎ | International Tax-Managed Equity Fund |
| ∎ | U.S. Equity Dividend and Premium Fund |
| ∎ | International Equity Dividend and Premium Fund |
Equity Insights
| ∎ | Small Cap Equity Insights Fund |
| ∎ | U.S. Equity Insights Fund |
| ∎ | Small Cap Growth Insights Fund |
| ∎ | Large Cap Growth Insights Fund |
| ∎ | Large Cap Value Insights Fund |
| ∎ | Small Cap Value Insights Fund |
| ∎ | International Small Cap Insights Fund |
| ∎ | International Equity Insights Fund |
| ∎ | Emerging Markets Equity Insights Fund |
Fundamental Equity International
| ∎ | International Equity Income Fund |
| ∎ | International Equity ESG Fund |
| ∎ | China Equity Fund6 |
| ∎ | Emerging Markets Equity Fund |
| ∎ | Imprint Emerging Markets Opportunities Fund |
| ∎ | ESG Emerging Markets Equity Fund |
Alternative
| ∎ | Clean Energy Income Fund |
| ∎ | Real Estate Securities Fund |
| ∎ | International Real Estate Securities Fund |
| ∎ | Commodity Strategy Fund |
| ∎ | Global Real Estate Securities Fund |
| ∎ | Alternative Premia Fund |
| ∎ | Absolute Return Tracker Fund |
| ∎ | Managed Futures Strategy Fund |
| ∎ | MLP Energy Infrastructure Fund |
| ∎ | Energy Infrastructure Fund7 |
| ∎ | Multi-Manager Alternatives Fund |
| ∎ | Global Infrastructure Fund |
Total Portfolio Solutions
| ∎ | Global Managed Beta Fund |
| ∎ | Multi-Manager Non-Core Fixed Income Fund |
| ∎ | Multi-Manager U.S. Dynamic Equity Fund |
| ∎ | Multi-Manager Global Equity Fund |
| ∎ | Multi-Manager International Equity Fund |
| ∎ | Tactical Tilt Overlay Fund |
| ∎ | Balanced Strategy Portfolio |
| ∎ | Multi-Manager U.S. Small Cap Equity Fund |
| ∎ | Multi-Manager Real Assets Strategy Fund |
| ∎ | Growth and Income Strategy Portfolio |
| ∎ | Growth Strategy Portfolio |
| ∎ | Dynamic Global Equity Fund |
| ∎ | Satellite Strategies Portfolio |
| ∎ | Enhanced Dividend Global Equity Portfolio |
| ∎ | Tax-Advantaged Global Equity Portfolio |
| ∎ | Strategic Factor Allocation Fund |
| ∎ | Target Date Retirement Portfolio8 |
| ∎ | Target Date 2025 Portfolio |
| ∎ | Target Date 2030 Portfolio |
| ∎ | Target Date 2035 Portfolio |
| ∎ | Target Date 2040 Portfolio |
| ∎ | Target Date 2045 Portfolio |
| ∎ | Target Date 2050 Portfolio |
| ∎ | Target Date 2055 Portfolio |
| ∎ | Target Date 2060 Portfolio |
| ∎ | GQG Partners International Opportunities Fund |
| 1 | You could lose money by investing in the Fund. Although the Fund seeks to preserve the value of your investment at $1.00 per share, it cannot guarantee it will do so. An investment in the Fund is not a deposit of a bank and is not insured or guaranteed by the Federal Deposit Insurance Corporation or any other government agency. The Fund’s sponsor has no legal obligation to provide financial support to the Fund, and you should not expect that the sponsor will provide financial support to the Fund at any time. |
| 2 | You could lose money by investing in the Fund. Because the share price of the Fund will fluctuate, when you sell your shares they may be worth more or less than what you originally paid for them. The Fund may impose a fee upon sale of your shares or may temporarily suspend your ability to sell shares if the Fund’s liquidity falls below required minimums because of market conditions or other factors. An investment in the Fund is not a deposit of a bank and is not insured or guaranteed by the Federal Deposit Insurance Corporation or any other government agency. The Fund’s sponsor has no legal obligation to provide financial support to the Fund, and you should not expect that the sponsor will provide financial support to the Fund at any time. |
| 3 | You could lose money by investing in the Fund. Although the Fund seeks to preserve the value of your investment at $1.00 per share, it cannot guarantee it will do so. The Fund may impose a fee upon sale of your shares or may temporarily suspend your ability to sell shares if the Fund’s liquidity falls below required minimums because of market conditions or other factors. An investment in the Fund is not a deposit of a bank and is not insured or guaranteed by the Federal Deposit Insurance Corporation or any other government agency. The Fund’s sponsor has no legal obligation to provide financial support to the Fund, and you should not expect that the sponsor will provide financial support to the Fund at any time. |
| 4 | Effective after the close of business on April 30, 2020, the Goldman Sachs Global Income Fund was renamed the Goldman Sachs Global Core Fixed Income Fund. |
| 5 | Effective after the close of business on August 30, 2020, the Goldman Sachs Blue Chip Fund was renamed the Goldman Sachs U.S. Equity ESG Fund. |
| 6 | Effective after the close of business on November 20, 2019, the Goldman Sachs Asia Equity Fund was renamed the Goldman Sachs China Equity Fund. |
| 7 | Effective after the close of business on June 26, 2020, the Goldman Sachs MLP & Energy Fund was renamed the Goldman Sachs Energy Infrastructure Fund. |
| 8 | Effective December 27, 2019, the Goldman Sachs Target Date 2020 Portfolio was renamed the Goldman Sachs Target Date Retirement Portfolio. |
| Financial Square FundsSM and Investor FundsSM are registered service marks of Goldman Sachs & Co. LLC. |
| * | This list covers open-end funds only. Please visit our website at www.GSAMFUNDS.com to learn about our closed-end funds and exchange-traded funds. |
TRUSTEES Jessica Palmer, Chair Dwight L. Bush Kathryn A. Cassidy Diana M. Daniels Joaquin Delgado James A. McNamara Roy W. Templin Gregory G. Weaver | OFFICERS James A. McNamara, President Joseph F. DiMaria, Principal Financial Officer, Principal Accounting Officer and Treasurer Caroline L. Kraus, Secretary | |
GOLDMAN SACHS & CO. LLC Distributor and Transfer Agent | GOLDMAN SACHS ASSET MANAGEMENT, L.P. Investment Adviser | |
Visit our web site at www.GSAMFUNDS.com to obtain the most recent month-end returns.
Goldman Sachs Asset Management, L.P., 200 West Street, New York, New York 10282
The reports concerning the Funds included in this shareholder report may contain certain forward-looking statements about the factors that may affect the performance of the Funds in the future. These statements are based on Fund management’s predictions and expectations concerning certain future events and their expected impact on the Funds, such as performance of the economy as a whole and of specific industry sectors, changes in the levels of interest rates, the impact of developing world events, and other factors that may influence the future performance of the Funds. Management believes these forward-looking statements to be reasonable, although they are inherently uncertain and difficult to predict. Actual events may cause adjustments in portfolio management strategies from those currently expected to be employed.
A description of the policies and procedures that the Funds use to determine how to vote proxies relating to portfolio securities and information regarding how a Fund voted proxies relating to portfolio securities during the most recent 12-month period ended June 30 is available (i) without charge, upon request by calling 1-800-526-7384 (for Retail Shareholders) or 1-800-621-2550 (for Institutional Shareholders); and (ii) on the Securities and Exchange Commission (“SEC”) web site at http://www.sec.gov.
The Funds will file their portfolio holdings for each month in a fiscal quarter within 60 days after the end of the relevant fiscal quarter on Form N-PORT. Portfolio holdings information for the third month of each fiscal quarter will be made available on the SEC’s web site at http://www.sec.gov. Portfolio holdings information may be obtained upon request and without charge by calling 1-800-526-7384 (for Retail Shareholders) or 1-800-621-2550 (for Institutional Shareholders).
Fund holdings and allocations shown are unaudited, and may not be representative of current or future investments. Fund holdings and allocations may not include the Fund’s entire investment portfolio, which may change at any time. Fund holdings should not be relied on in making investment decisions and should not be construed as research or investment advice regarding particular securities. Current and future holdings are subject to risk.
Economic and market forecasts presented herein reflect our judgment as of the date of this presentation and are subject to change without notice. These forecasts do not take into account the specific investment objectives, restrictions, tax and financial situation or other needs of any specific client. Actual data will vary and may not be reflected here. These forecasts are subject to high levels of uncertainty that may affect actual performance. Accordingly, these forecasts should be viewed as merely representative of a broad range of possible outcomes. These forecasts are estimated, based on assumptions, and are subject to significant revision and may change materially as economic and market conditions change. Goldman Sachs has no obligation to provide updates or changes to these forecasts. Case studies and examples are for illustrative purposes only.
The Global Industry Classification Standard (GICS) was developed by and is the exclusive property and a service mark of Morgan Stanley Capital International Inc. (MSCI) and Standard & Poor’s, a division of The McGraw-Hill Companies, Inc. (S&P) and is licensed for use by Goldman Sachs. Neither MSCI, S&P nor any other party involved in making or compiling the GICS or any GICS classifications makes any express or implied warranties or representations with respect to such standard or classification (or the results to be obtained by the use thereof), and all such parties hereby expressly disclaim all warranties of originality, accuracy, completeness, merchantability or fitness for a particular purpose with respect to any of such standard or classification. Without limiting any of the foregoing, in no event shall MSCI, S&P, any of their affiliates or any third party involved in making or compiling the GICS or any GICS classifications have any liability for any direct, indirect, special, punitive, consequential or any other damages (including lost profits) even if notified of the possibility of such damages.
The portfolio risk management process includes an effort to monitor and manage risk, but does not imply low risk.
This material is not authorized for distribution to prospective investors unless preceded or accompanied by a current prospectus or summary prospectus, if applicable. Investors should consider a Fund’s objective, risks, and charges and expenses, and read the summary prospectus, if available, and/or the prospectus carefully before investing or sending money. The summary prospectus, if available, and the prospectus contain this and other information about a Fund and may be obtained from your authorized dealer or from Goldman Sachs & Co. LLC by calling (retail – 1-800-526-7384) (institutional – 1-800-621-2550).
© 2020 Goldman Sachs. All rights reserved. 224091-OTU-1322328 DOMINSAR-20
Goldman Sachs Funds

| Annual Report | October 31, 2020 | |||
Fundamental Equity International Funds | ||||
China Equity* | ||||
Emerging Markets Equity | ||||
ESG Emerging Markets Equity | ||||
Imprint Emerging Markets Opportunities | ||||
International Equity ESG | ||||
International Equity Income | ||||
| * | Effective after the close of business on November 20, 2019, the Goldman Sachs Asia Equity Fund was renamed the Goldman Sachs China Equity Fund. |
It is our intention that beginning on January 1, 2021, paper copies of the Funds’ annual and semi-annual shareholder reports will no longer be sent by mail, unless you specifically request paper copies of the reports from a Fund or from your financial intermediary. Instead, the reports will be made available on a website, and you will be notified by mail each time a report is posted and provided with a website link to access the report.
If you already elected to receive shareholder reports electronically, you will not be affected by this change and you need not take any action. At any time, you may elect to receive reports and certain communications from a Fund electronically by calling the applicable toll-free number below or by contacting your financial intermediary.
You may elect to receive all future shareholder reports in paper free of charge. If you hold shares of a Fund directly with the Fund’s transfer agent, you can inform the transfer agent that you wish to receive paper copies of reports by calling toll-free 800-621-2550 for Institutional, Service, Class R6 and Class P shareholders or 800-526-7384 for all other shareholders. If you hold shares of a Fund through a financial intermediary, please contact your financial intermediary to make this election. Your election to receive reports in paper will apply to all Goldman Sachs Funds held in your account if you invest through your financial intermediary or all Goldman Sachs Funds held with the Funds’ transfer agent if you invest directly with the transfer agent.

Goldman Sachs Fundamental Equity International Funds
| ∎ | CHINA EQUITY |
| ∎ | EMERGING MARKETS EQUITY |
| ∎ | ESG EMERGING MARKETS EQUITY |
| ∎ | IMPRINT EMERGING MARKETS OPPORTUNITIES |
| ∎ | INTERNATIONAL EQUITY ESG |
| ∎ | INTERNATIONAL EQUITY INCOME |
| 1 | ||||
| 7 | ||||
| 38 | ||||
| 50 | ||||
| 57 | ||||
| 57 | ||||
| 63 | ||||
| 70 | ||||
| 77 | ||||
| 83 | ||||
| 90 | ||||
| 97 | ||||
| 117 | ||||
| 119 | ||||
| NOT FDIC-INSURED | May Lose Value | No Bank Guarantee | ||
MARKET REVIEW
Goldman Sachs Fundamental Equity International Funds
International Equities
International equities struggled during the 12-month period ended October 31, 2020 (the “Reporting Period”). The MSCI Europe, Australasia, Far East (EAFE) Index (Net, USD, Unhedged) (the “MSCI EAFE Index”) posted a return of -6.85%.*
As the Reporting Period began in November 2019, international equities were rallying, mainly driven by the accommodative stance of various central banks. Also supporting international equities toward the end of 2019 was anticipation of a resolution to the U.S.-China trade war, as each of the two countries reached an agreement in principle on a “Phase One” trade deal in mid-December 2019. Additionally, Brexit negotiations took a turn for the better when the Conservative party won a comfortable majority in the mid-December 2019 U.K. Parliamentary elections, clearing the way for the U.K. Prime Minister’s Brexit deal to be ratified before a January 31, 2020 deadline. (Brexit indicates the U.K.’s path out of the European Union.) Japanese equities were supported by a recovering economy, stronger capital spending and an increase in domestic demand. In a bid to ensure fair and reciprocal trade, the U.S. and Japan had signed a limited trade deal on agriculture and digital trade in October 2019, just before the start of the Reporting Period.
While international equities continued to rally in January 2020, the MSCI EAFE Index ended the first quarter of 2020 with a return of -22.83%.* From mid-February through March 2020, we saw COVID-19 wreak havoc across countries, communities and industries alike, potentially on the path to bring about a global recession. By the end of the first quarter, the pandemic was on its way to becoming the worst health care crisis the world had seen since the Spanish flu in 1918, as it disrupted global supply chains, international trade and private consumption patterns across the world. While different countries took varied degrees of measures in an effort to combat the pandemic, containment through social distancing and lockdowns was the broader theme of the season. Seen from an economic standpoint, the remedy was widely viewed to be as bad as the disease. With more than 100 countries closing borders in March, the movement of people, tourism flows and virtually all economic activities came to a screeching halt. Amid these conditions, March 2020 was a historic month for all asset classes and for equities in particular, with all leading markets across the world experiencing one of the largest single-month declines since October 2008. Many equity markets — in economies large and small — went into a tailspin, enduring declines of 30% or more at the trough. Exacerbating matters was the failure of OPEC+ to agree to oil production cuts, which resulted in Saudi Arabia ramping up supply, and thereby applying downward pressure on oil prices. (OPEC is the Organization of the Petroleum Exporting Countries. OPEC+ is composed of OPEC countries and non-OPEC oil producing countries, most notably Russia.) Volatility spiked, in some cases to levels last seen during the global financial crisis of 2008-2009, with market liquidity deteriorating significantly. Dispersion among industry returns skyrocketed in March 2020.
In yet another sharp reversal, international equities rebounded strongly in the second quarter of 2020, with the MSCI EAFE Index up 14.88%* for the quarter. Equity markets around the world gained on optimism around a global economic recovery, as lockdown measures began to ease, even as many markets faced some headwinds from weak macroeconomic data, fear of a second wave of COVID-19 and a bleak U.S. economic outlook from the U.S. Federal Reserve (the “Fed”). Investors largely looked past first quarter 2020 earnings, as company outlooks for then-upcoming quarters amid COVID-19 took precedent. The European equity market was supported by a larger than consensus expected stimulus boost from the European Central Bank’s (“ECB”) Pandemic Emergency Purchase Programme (“PEPP”) and the European Union’s proposed €750 billion COVID-19 recovery plan. In June 2020, the ECB increased its PEPP to €1.35 trillion and extended purchases through June 2021. The ECB also announced it would begin offering euro liquidity to non-euro area central banks in response to the COVID-19 crisis. In Europe, June’s composite Purchasing Managers’ Index rebounded 15.5 points to 47.5, consistent with the easing of lockdown measures and improvements in high frequency activity data. Japanese equity markets rallied in April and May, recovering from the downturn that had started in February 2020. Its market recovery was driven by a rebound in valuations, particularly in cyclical sectors that bore most of the brunt during the prior quarter’s sell-off.
| * | All index returns are expressed in U.S. dollar terms. |
1
MARKET REVIEW
International equity markets continued to rally in July and August before declining in September. For the third quarter of 2020, the MSCI EAFE Index posted a return of 4.80%.* In July and August, international equity market performance was buoyed by supporting industrial and labor data, optimism surrounding COVID-19 vaccine testing and ongoing policy support from governments and central banks. September’s decline was based largely on a spike in COVID-19 cases globally, a pullback in information technology sector performance and the U.S. Fed’s perspective on further policy support. European equities ended the third quarter rather flat. While major earnings beats of consensus expectations provided some support, European stock markets were pressured by rising worries around a second wave of COVID-19. The direction of Brexit negotiations also remained a key concern. In Europe, the composite Purchasing Managers’ Index fell to a three-month low in September. The region’s manufacturing sector, however, saw growth, led by Germany’s surge in manufacturing output. The U.K. presented an Internal Market Bill to its Parliament containing provisions that conflicted with the European Union-U.K. Withdrawal Agreement reached earlier in 2020. Still, in September, the U.K. and Japan finalized a free-trade agreement, the U.K.’s first major post-Brexit accord. The Japanese equity market slowed in September from its calendar year-to-date high in August 2020 amidst increasing U.S.-China tensions and ongoing strength of the yen. However, the downside was limited by better than consensus expected Japan Gross Domestic Product numbers, lowering of the COVID-19 alert in Tokyo and easing of restrictions in Japan broadly. Yoshihide Suga was elected as Japan’s Prime Minister in mid-September, becoming the country’s first new leader in nearly eight years following Shinzo Abe’s abrupt resignation. In September, the Bank of Japan upgraded its assessment of Japan’s economy, stating it had started to pick up after a difficult span caused by the pandemic.
In October 2020, the MSCI EAFE Index returned -1.68%.* International equity markets declined, as the then-upcoming U.S. elections and rising COVID-19 cases in many countries, most notably across Europe, were the main focus for investors. A number of countries, including France, Germany and Belgium, were forced to reintroduce national lockdown measures. Japan’s equity market also declined. Though Japan had been rather successful in containing the virus, its equity market was affected by renewed uncertainty in other regions around the world. These concerns around much of the globe outweighed the fact that corporate earnings releases in October for the third quarter of 2020 were largely positive, with many companies beating consensus expectations.
For the Reporting Period as a whole, information technology was the strongest performing sector in the MSCI EAFE Index, followed by health care and materials, each producing a positive absolute return. The weakest performing sector in the MSCI EAFE Index was energy, followed at some distance by real estate and financials, with each generating a double-digit negative absolute return during the Reporting Period.
From a country perspective, Denmark, New Zealand and Sweden were the strongest performing constituents of the MSCI EAFE Index during the Reporting Period, each posting a strong gain. Spain, Singapore and the U.K. were the weakest individual country constituents of the MSCI EAFE Index during the Reporting Period, each of which posted a double-digit negative absolute return.
Emerging Markets Equities
Emerging markets equities rallied during the 12-month period ended October 31, 2020 (the “Reporting Period”). The MSCI Emerging Markets Index (Net, USD, Unhedged) (the “MSCI EM Index”) posted a return of 8.23%.* Emerging markets equities significantly outperformed developed markets equities on a relative basis, as measured by the MSCI Europe, Australasia, Far East (EAFE) Index, which returned -6.85% for the same time period.
As the Reporting Period began in the last two months of 2019, emerging markets equities advanced, supported by accommodative global monetary policy and improved trade developments. In Asia, Chinese equities surged amid renewed trade optimism. The U.S. had agreed to halt new tariffs in exchange for larger Chinese purchases of U.S. goods — most notably, agricultural products — and the U.S. President announced in December that the U.S. and China had agreed in principle to a “Phase One” trade deal. Although the details of the agreement were unclear, emerging markets equities were encouraged. South Korea also advanced, with companies broadly benefiting from interest rate cuts. Taiwan gained on strength in semiconductors. Despite faltering growth and lingering unrest surrounding India’s controversial citizenship law, its equity market rallied amid cuts in interest rates and lower
| * | All index returns are expressed in U.S. dollar terms. |
2
MARKET REVIEW
corporate taxes. In Latin America, Argentina was the top performer, bolstered by greater transparency into its new government’s plan to renegotiate public debt and alleviate pressing social issues. Brazilian equities advanced on signs of declining inflation and accommodative monetary policy. Elsewhere, Hungary and Russia performed especially well. Hungary benefited from robust growth in domestic demand, double-digit wage growth and declining unemployment, while Russia advanced amid improving inflation expectations and rising oil prices.
In a sharp reversal, emerging markets equities fell dramatically during the first quarter of 2020, with the MSCI EM Index returning -23.60%*. Emerging markets equities declined as global equity markets were overtaken by the fear of a global recession as a consequence of the COVID-19 outbreak. The extent of the spread of what had clearly become a pandemic caused global equity markets to reprice to reflect lower expectations for global economic growth and corporate earnings. Countries around the world implemented lockdowns to try and flatten the curve of new infections, with largely all but essential businesses being forced to close. Aside from COVID-19, equities also faced adverse effects from the start of an oil price dispute between Russia and Saudi Arabia. On March 8, 2020, a week after the Organization of the Petroleum Exporting Countries (“OPEC”) failed to strike a deal with its allies about production cuts, Saudi Arabia announced it would ramp up its production, which caused global oil prices to drop approximately 25% in a single day. China was the best performing country among the emerging markets equity markets in March, with the MSCI China Index dropping only 6.59%*, as it continued to benefit from the first-in/first-out effect with regard to the COVID-19 outbreak. Economic activity in China was able to somewhat normalize throughout the month, as the number of daily new local cases fell to nearly zero. Elsewhere, Indian equities dropped sharply in March, as its economy, which had been showing strong signs of recovery in the two prior months, was set back by growing concerns about COVID-19 cases in that country.
The MSCI EM Index then rose 18.08%* in the second quarter of 2020. Emerging markets equities rebounded significantly, as markets saw improved economic conditions even as the COVID-19 pandemic persisted. During the quarter, many governments bolstered their respective economic recoveries through large stimulus packages. Several emerging markets countries made progress in re-opening their economies, as the strict lockdowns implemented earlier had helped in slowing the spread of new cases. China continued to be on the forefront of the recovery, with the MSCI China Index returning 8.98%* in June 2020 alone and 22.72%* for the second calendar quarter, as its economic activity largely returned to normal levels. In fact, industrial activity in China rebounded meaningfully, though its consumer sentiment remained volatile due to the threat of a second wave of infections. In May 2020, the National People’s Congress, which is the highest organ of state power and the national legislature of China, called for a targeted stimulus package, with potential for further adjustments. In India, normalization seemed somewhat further out, as the country had yet to hit its peak in new cases. However, the country started to lift its strict lockdown measures in June in an attempt to get its economy back on its feet. In contrast to emerging markets’ healthy rebound, many developed market countries were having to reverse the opening of their economies in the wake of a second wave of COVID-19 cases.
The MSCI EM Index fell 1.60%* in September 2020 but rose 9.56%* for the third quarter of 2020. Overall, emerging markets equities maintained their recovery during the quarter, as investor optimism grew around the potential discovery and distribution of a viable vaccine against COVID-19. In September, however, emerging markets equities saw a slight drawback following an uptick in global COVID-19 cases and increased uncertainty around the then-upcoming U.S. elections. Still, parts of emerging Asia continued to be the bright spot of the emerging markets equities universe, with the equity markets of South Korea and Taiwan being the top performing countries for the quarter. South Korea had handled the outbreak of the pandemic comparatively well, partially due to extensive testing efforts. The country subsequently benefited from a strong economic recovery, and the MSCI Korea Index returned 3.08%* in September. Taiwan, somewhat insulated from the full impact of the pandemic due to its geographical location, strengthened ties with the U.S. via a new bilateral economic dialogue that has a focus on technology. India’s equity market was also a strong performer during the quarter, as it saw lower levels of unemployment and positive economic implications from its government’s sizeable stimulus package. While COVID-19 cases rose significantly in India, its government was moving ahead with some long-awaited reforms and initiatives in an effort to further propel its economic recovery. With elevated volatility linked to the then-upcoming U.S. elections, China’s equity market fell in September but remained a top
| * | All index returns are expressed in U.S. dollar terms. |
3
MARKET REVIEW
performing country during the quarter, with a 12.50%* return for the MSCI China Index. Brazil’s equity market also declined in September, as it continued to struggle to contain the spread of the coronavirus.
The MSCI EM Index rose 2.06%* in October 2020, bringing total year-to-date returns to 0.87%*. Overall, emerging markets equities resumed their recovery during October, as investor optimism grew around the potential discovery and distribution of a viable vaccine, despite an uptick in global COVID-19 cases and heightened uncertainty around the then-upcoming U.S. elections. China’s equity market rose, with the MSCI China Index returning 5.29%*. During the month, the Communist Party of China met to discuss its 14th Five-Year Plan, including key policies designed to support domestic consumption, innovation, sustainability and the continued opening of Chinese financial markets. China’s corporate earnings growth was expected, according to the Five-Year Plan, to be in the high teens for 2021, with valuations attractive relative to developed markets and its own history, all of which to be supported by the ongoing opening and growth of the Chinese economy. Elsewhere in Asia, the equity markets of Taiwan and South Korea were also top performers, as each continued to benefit from relative insulation from the U.S.-China trade tensions and the COVID-19 pandemic. India’s equity market performed strongly, as its government continued to prioritize economic recovery through stimulus and factor market reforms. Though the number of COVID-19 cases in India continued to rise, the recovery rate there was comparatively good. The equity markets of eastern Europe countries, including Poland and Russia, struggled in October, as COVID-19 cases rose and geopolitical conflict came to a head in the region. In Latin America, Brazil’s equity market was rather weak, as the nation dealt with a large wildfire, the end of emergency government payments and an increase in COVID-19 cases.
For the Reporting Period as a whole, consumer discretionary, information technology, communication services and health care were the strongest sectors in the MSCI EM Index during the Reporting Period. Energy, utilities, financials and real estate were the worst performing sectors in the MSCI EM Index during the Reporting Period.
From a country perspective, China was the best performing individual constituent of the MSCI EM Index for the Reporting Period, followed by Taiwan, South Korea and Argentina, each of which posted a robust double-digit absolute gain — and the only constituents of the MSCI EM Index to post positive returns for the Reporting Period overall. Conversely, Greece was the weakest individual country constituent of the MSCI EM Index, followed by Colombia, Brazil, Poland and Turkey, each of which posted a double-digit decline during the Reporting Period.
Looking Ahead
International Equities
At the end of the Reporting Period, we expected a modest recovery in global economic growth during the remainder of 2020. Investors appeared to have largely looked past first half of the calendar year corporate earnings, as company outlooks for upcoming quarters amid the COVID-19 pandemic took precedent. While risks of rising COVID-19 cases and renewed volatility around the U.S. elections and its potential outcomes continued to pose risks at the end of the Reporting Period, economic optimism around stabilizing manufacturing data and early signs of recovery in cyclical industries buoyed investor sentiment. Even with the dip in October 2020, we expected this trend to continue, especially should optimism persist that there may be a viable COVID-19 vaccine ready by early 2021.
Still, we can be reasonably confident that volatility is here to stay. In our opinion, volatility may ultimately provide opportunity. We are always cognizant of the fact that the companies the Funds own will have to face challenging economic times at some point, predictable or not. We selected those companies because of our confidence in their ability to grow and prosper relative to their competitors — over the long term.
As always, we maintain our focus on seeking companies with durable businesses that we believe will generate long-term growth in today’s ever-changing market conditions.
| * | All index returns are expressed in U.S. dollar terms. |
4
MARKET REVIEW
Emerging Markets Equities
With the world still fighting the COVID-19 pandemic, most emerging markets economies either had already found themselves in or were nearing a technical recession at the end of the Reporting Period. However, some countries had proven that an orderly reversal of the draconian lockdown measures was achievable and could lead to a strong bounce in business activity. In this context, China was leading the pack, not only among emerging markets countries but globally, as its domestic economy was approaching normal levels of activity. Further, central banks were continuing to drive monetary stimulus in the highest gear to combat the negative economic implications of COVID-19. In our view, this backdrop provided a supportive environment for corporate earnings growth to recover once more countries follow China to a certain level of normalization. In fact, we remained constructive at the end of the Reporting Period on the economic fundamentals for the vast majority of emerging markets countries, especially when contrasted against the challenges of the post-Taper Tantrum period. (Taper Tantrum refers to the 2013 collective reactionary panic that triggered a spike in U.S. Treasury yields, after investors learned that the U.S. Federal Reserve was slowly putting the brakes on its quantitative easing program. The tapering of the Fed’s quantitative easing program led to a significant sell-off in some emerging markets equities markets, as many felt those economies with the largest balance sheet imbalances and who had become most reliant on foreign capital, i.e., emerging markets, would not see the level of investing they sought.) Also, at the end of the Reporting Period, markets appeared to believe in a recovery of corporate earnings in 2021, with consensus estimates pointing to 20% to 30% earnings per share growth. This is important, we believe, as company earnings are ultimately the long-term driver of public equity returns.
In being the first affected country, China led the charge in introducing new ways to 1) constrain the outbreak of COVID-19 and 2) prevent and de-escalate a potential second wave, while 3) thoughtfully lifting lockdown measures to gradually open its economy. China’s industrial sector was first to reach normalization back in late March/early April 2020, and its service sector also since picked up as well, with China’s economy operating at the end of the Reporting Period close to full capacity. Still, in the run-up to the U.S. elections in November 2020, we expected elevated volatility in Chinese equities. It is important to note that having had an on-the-ground presence in China since 2004, we have seen many of these episodes. While markets can be choppy over the short term, more pointed rhetoric typically does not interfere with China’s bigger picture growth trajectory. Over the next five years or so, we believe equity earnings in China will likely be driven by three main trends — 1) the consolidation of “old economy” sectors; 2) online/offline fusion; and 3) technological catch-up via genuine innovation. Regardless of U.S.-China tensions, China will rely, in our opinion, on these key areas to boost economic growth for the foreseeable future. This gives us confidence that these secular themes can survive potential short-term headwinds.
As the emerging markets equities universe is typically highly diverse, we saw significant divergence with respect to economic recovery at the country level at the end of the Reporting Period. In addition to China, South Korea and Taiwan also were making good progress in constraining the COVID-19 outbreak and reopening their economies, while Latin America appeared to have somewhat mixed results. Brazil and Mexico were struggling to contain the spread of the pandemic compared to some smaller economies that have been more centralized and decisive in their actions. The Latin America region has also been negatively affected by the steep drop in oil prices earlier in 2020, as many countries here are net exporters. This compares to many Asian economies being net importers and, hence, net beneficiaries of lower crude oil prices, which, in turn, helps to finance large stimulus packages. At the same time, we note that disadvantaged economies seen at the end of the Reporting Period can serve as crucial diversifiers from an investment perspective if the tide turns. Indeed, generally speaking, mismanagement of today’s crisis at the country level does not imply a lack of investment opportunities, in our view. Quite the contrary, in our opinion, a difficult operating environment tends to widen the gap between winners and losers, potentially shaping an investment landscape where picking the right stock really matters.
As such, in our role as active investors, it is apparent to us that dispersion within countries, sectors and industries has returned with a vengeance. During the last several years, investors have grown accustomed, perhaps, to talk about countries or sectors as homogenous parts of the broader market. But we believe we have entered a new paradigm where this way of thinking no longer applies. The S&P 500 Index, a broad measure of U.S. equities, has become the “poster child” of this evolution, wherein a small number of big information technology stocks were single-handedly driving market returns. The picture in the emerging markets equities markets is somewhat less extreme, but we found it best not to lose ourselves in the exuberance around certain pockets of
5
MARKET REVIEW
the market and rather to approach each investment decision on a company-by-company basis. That said, there were certain themes we have identified, which we believe may structurally benefit from changes in consumption patterns as a result of the COVID-19 pandemic. These include adoption of automation, millennial consumption, environmental sustainability and genomics and personalized health care, the latter preferably offered online.
Turning to valuations, the emerging markets equities complex as a whole was screening as attractive versus developed markets equities, in our view, at the end of the Reporting Period, trading at a discount of more than 30%. We would argue that emerging markets equities were also trading relatively inexpensively compared to their own history when adjusted for structural changes at the sector level. The emerging markets equities universe used to be dominated by the “old economy,” but this has changed dramatically, with technology and consumer-centric sectors crowding out commodity-heavy industries. As the global recovery unfolds and the gap in economic growth between emerging markets and developed markets widens, this represents, in our view, a potentially compelling entry point into a multi-year growth story for emerging markets equities.
As always, we maintain our focus on seeking high-quality equity investments trading at compelling valuations and intend to stay true to our long-term discipline as we seek to achieve long-term capital appreciation and navigate potentially volatile markets ahead.
6
PORTFOLIO RESULTS
Goldman Sachs China Equity Fund
Investment Objective
The Fund seeks long-term capital appreciation.
Portfolio Management Discussion and Analysis
Effective after the close of business on November 20, 2019, the Goldman Sachs Asia Equity Fund was renamed the Goldman Sachs China Equity Fund and certain changes were made to its principal investment strategy and benchmark. The Fund’s investment objective did not change. Below, the Goldman Sachs Fundamental Asia ex-Japan Equity Portfolio Management Team discusses the Goldman Sachs China Equity Fund’s (the “Fund”) performance for the 12-month period ended October 31, 2020 and its positioning for the period from its shift in strategy through October 31, 2020 (the “Reporting Period”).
| Q | How did the Fund perform during the Reporting Period? |
| A | During the Reporting Period, the Fund’s Class A, Class C, Institutional, Investor, Class R6 and Class P Shares generated average annual total returns, without sales charges, of 43.67%, 42.60%, 44.13%, 44.01%, 44.15% and 44.17%, respectively. These returns compare to the 34.28% average annual total return of the Fund’s new benchmark, the MSCI China All Shares Index (Net, USD, Unhedged) (the “Index”). The Fund’s former benchmark, the MSCI All Country Asia ex-Japan Index (Net, USD, Unhedged), returned 15.81% during the same time period. |
| Q | What changes were made to the Fund’s investment strategy effective after the close of business on November 20, 2019? |
| A | Effective after the close of business on November 20, 2019, the Fund invests, under normal circumstances, at least 80% of its net assets plus any borrowings for investment purposes (measured at the time of purchase) in a diversified portfolio of equity investments in issuers economically tied to China. The Fund expects to invest primarily in common stocks, but may also invest in preferred stocks, securities convertible into common or preferred stocks, and depositary receipts. This may include securities that trade in local Chinese, Hong Kong or other foreign exchanges and securities that trade in renminbi, the official currency of China. |
| Q | What key factors were responsible for the Fund’s performance during the Reporting Period? |
| A | The Fund outperformed the Index on a relative basis during the Reporting Period, primarily attributable to individual stock selection. Sector allocation also contributed positively to the Fund’s relative results during the Reporting Period. |
| Q | What were some of the Fund’s best-performing individual stocks? |
| A | The Fund benefited most relative to the Index from holdings in Shenzhen Inovance Technology, Contemporary Amperex Technology and Xinyi Solar Holdings, each a new position in the Fund’s portfolio during the Reporting Period. |
Shenzhen Inovance Technology, of the industrials sector, develops, manufactures and sells automation control products. Its strong growth during the Reporting Period was mainly driven by a robust general automation business segment and margin expansion driven by an improved product mix. |
Contemporary Amperex Technology operates as a battery products manufacturing company within the renewable energy industry. Its stock performed well during the Reporting Period as the market viewed the company as a well-positioned pure electric vehicle (“EV”) lithium-ion battery maker supplying the global markets. The company was the largest EV batter producer in terms of shipments in 2019 with a 52% share of the market in China. |
Xinyi Solar Holdings is a manufacturer of renewable energy products, including various types of solar glass. Its shares rose as tight solar glass supply led the average selling price of the product to reach a historical high. At the end of the Reporting Period, we continued to expect solid demand growth for solar glass over the long term. |
7
PORTFOLIO RESULTS
| Q | Which stocks detracted significantly from the Fund’s performance during the Reporting Period? |
| A | Detracting most from the Fund’s results relative to the Index were positions in China Vanke, NARI Technology and Jiangsu Changshu Rural Commercial Bank. |
China Vanke, a new position in the Fund during the Reporting Period, operates real estate development businesses. Its shares gained only modestly during the Reporting Period. Though the company has been relatively steady in its property development and land replenishment process, it lagged its peers in recovering from the nation’s COVID-19-driven economic slowdown. At the end of the Reporting Period, we believed the company remained a good value given what we view as its steady operations, strong balance sheet and undervalued non-development business segments. |
NARI Technology, of the industrials sector, develops and manufactures power grid automation and industrial control products. Its shares declined, as the annual investment target of State Grid, for which NARI Technology supplies products, was set lower than market expectations. (The State Grid Corporation of China, commonly known as the State Grid, is a Chinese state-owned electric utility corporation and is the largest utility company in the world.) We eliminated the Fund’s position in NARI Technology by the end of the Reporting Period. |
Jiangsu Changshu Rural Commercial Bank was a new position in the Fund during the Reporting Period. The commercial bank is a leading local bank in the Jiangsu province, which has one of the most active private-owned economies in China. The bank specializes in micro-lending, which has been a niche market overlooked by large national banks, in our view. With its proprietary customer acquisition model, risk management system and extensive local branches, we believe the bank has devised a profitable model to service local small-to-medium-sized enterprise clients. However, its shares declined during the Reporting Period given the persistent impact of COVID-19 on the province’s economy. |
| Q | Which equity market sectors most significantly affected Fund performance during the Reporting Period? |
| A | The sectors that contributed most positively to the Fund’s performance relative to the Index were industrials, health care and financials, where stock selection in each boosted relative results most. Only one sector detracted from the Fund’s relative results during the Reporting Period — consumer discretionary, wherein stock selection was weak. Having an allocation to cash, albeit modest, during a Reporting Period when the Index rallied, also dampened the Fund’s relative results. |
| Q | How did the Fund use derivatives and similar instruments during the Reporting Period? |
| A | The Fund did not use derivatives or similar instruments during the Reporting Period. |
| Q | Did the Fund make any significant purchases or sales during the Reporting Period? |
| A | During the Reporting Period, there were a number of new purchases and sales made as the Fund transitioned to its new investment strategy. |
To name just a couple, in addition to those new positions mentioned earlier, we initiated a Fund position in Alibaba Group Holding, the multinational technology company specializing in e-commerce, retail, Internet and technology. We added the position because we see faster offline to online migration of retailers and faster digital transformation in China, which, in our view, is favorable to the company’s long-term growth potential in e-commerce, cloud and other services. |
We also established a Fund position in Meituan, which operates as a web-based shopping platform for local consumer products and retail services businesses. Meituan offers deals of the day by selling vouchers for local services and entertainment, dining, delivery and more. During the Reporting Period, Meituan proved to be a top contributor to the Fund’s relative results, enjoying especially strong demand recovery for both food delivery and in-store services. |
Conversely, in addition to the sale of NARI Technology already mentioned, we eliminated the Fund’s position in AIA Group, the Hong Kong-based insurance and financial services company. The company reported weak operating performance during the Reporting Period, as disruptions from COVID-19 and social distancing measures weighed on its new sales. We also sold the Fund’s position in Taiwan Semiconductor Manufacturing, as the Fund transitioned to a China-focused portfolio and this company is a Taiwan-listed company. |
8
PORTFOLIO RESULTS
| Q | Were there any notable changes in the Fund’s weightings during the Reporting Period? |
| A | Most sector weights are usually established within a relatively narrow range from the Index, as our team prefers to make decisions at the individual stock level, where we believe we can generate more added value. That said, during the Reporting Period, relative to the Index, the Fund’s exposure to industrials, health care and consumer staples increased, and its allocations to information technology and financials decreased. Exposure was newly-established in the real estate and energy sectors during the Reporting Period. The Fund’s allocation to cash decreased during the Reporting Period. |
| Q | Were there any changes to the Fund’s portfolio management team during the Reporting Period? |
| A | In light of the changes made to the Fund, Shao Ping Guan, Vice President, and Christine Pu, CFA, Vice President, became portfolio managers for the Fund. Basak Yavuz, Managing Director, and Hiren Dasani, CFA, Managing Director, also continued to manage the Fund. Sumit Mangal no longer serves as a portfolio manager for the Fund. |
| Q | How was the Fund positioned relative to the Index at the end of the Reporting Period? |
| A | At the end of the Reporting Period, the Fund had overweighted positions relative to the Index in the industrials and health care sectors. On the same date, the Fund had underweighted positions compared to the Index in the communication services and financials sectors and was relatively neutrally weighted compared to the Index in information technology, consumer staples, consumer discretionary, materials, real estate and energy. The Fund had no exposure to the utilities sector at the end of the Reporting Period. |
As always, we remained focused on individual stock selection, with sector positioning being a secondary, closely-monitored effect. |
9
FUND BASICS
China Equity Fund
as of October 31, 2020
| TOP TEN HOLDINGS AS OF 10/31/201,2,3 | ||||||||||
| Holding | % of Net Assets | Line of Business | Country | |||||||
| Tencent Holdings Ltd. | 10.7 | % | Media & Entertainment | China | ||||||
| Alibaba Group Holding Ltd. ADR | 6.9 | Retailing | China | |||||||
| Alibaba Group Holding Ltd. | 6.8 | Retailing | China | |||||||
| Kweichow Moutai Co. Ltd. Class A | 4.3 | Food Products | China | |||||||
| Meituan Class B | 4.2 | Retailing | China | |||||||
| China Merchants Bank Co. Ltd. Class H | 2.7 | Banks | China | |||||||
| Contemporary Amperex Technology Co. Ltd. Class A | 2.6 | Capital Goods | China | |||||||
| Ping An Insurance Group Co. of China Ltd. Class H | 2.5 | Insurance | China | |||||||
| Shenzhen Inovance Technology Co. Ltd. Class A | 2.0 | Capital Goods | China | |||||||
| China Life Insurance Co. Ltd. Class H | 2.0 | Insurance | China | |||||||
| 1 | The top 10 holdings may not be representative of the Fund’s future investments. |
| 2 | The Fund’s overall top 10 holdings differ from the table above due to the exclusion of the Goldman Sachs Financial Square Government Fund (a short-term investment fund), which represents approximately 2.5% of the Fund’s net assets as of 10/31/20. |
| 3 | The line of business for each holding is reported at the industry or sub-industry level. |
| FUND VS. BENCHMARK SECTOR ALLOCATIONS4 |
| As of October 31, 2020 |
| 4 | The Fund is actively managed and, as such, its composition may differ over time. Consequently, the Fund’s overall sector allocations may differ from percentages contained in the graph above. The graph categorizes investments using Global Industry Classification Standard (“GICS”); however, the sector classifications used by the portfolio management team may differ from GICS. The percentage shown for each investment category reflects the value of investments in that category as a percentage of market value. Underlying sector allocations of exchange traded funds and investment companies held by the Fund are not reflected in the graph above. |
For more information about your Fund, please refer to www.GSAMFUNDS.com. There, you can learn more about your Fund’s investment strategies, holdings, and performance.
10
GOLDMAN SACHS CHINA EQUITY FUND
Performance Summary
October 31, 2020
The following graph shows the value, as of October 31, 2020, of a $1,000,000 investment made on November 1, 2010 in Institutional Shares at NAV. For comparative purposes, the performance of the Fund’s current and former benchmarks, the MSCI® China All Shares Index (Net, USD, Unhedged), and MSCI All Country Asia ex-Japan Index (Net, USD, Unhedged; reflects no deduction for fees or expenses), are shown. The MSCI® China All Shares Index commenced operations in 2014. Since the MSCI® China All Shares Index has not been in existence for 10 full calendar years as of the end of the Reporting Period, 10 year returns are not available. Performance reflects applicable fee waivers and/or expense limitations in effect during the periods shown and in their absence, performance would be reduced. Returns do not reflect the deduction of taxes that a shareholder would pay on Fund distributions or the redemption of Fund shares. The returns set forth below represent past performance. Past performance does not guarantee future results. The Fund’s investment return and principal value will fluctuate so that an investor’s shares, when redeemed, may be worth more or less than their original cost. Current performance may be lower or higher than the performance quoted below. Please visit our web site at www.GSAMFUNDS.com to obtain the most recent month-end returns.
| Fund’s 10 Year Performance |
Performance of a $1,000,000 Investment, with distributions reinvested, from November 1, 2010 through October 31, 2020.
| Average Annual Total Return through October 31, 2020* | One Year | Five Years | Ten Years | Since Inception | ||||||||||
Class A | ||||||||||||||
Excluding sales charges | 43.67% | 14.71% | 8.02% | — | ||||||||||
Including sales charges | 35.77% | 13.42% | 7.41% | — | ||||||||||
| ||||||||||||||
Class C | ||||||||||||||
Excluding contingent deferred sales charges | 42.60% | 13.86% | 7.22% | — | ||||||||||
Including contingent deferred sales charges | 41.60% | 13.86% | 7.22% | — | ||||||||||
| ||||||||||||||
Institutional | 44.13% | 15.14% | 8.44% | — | ||||||||||
| ||||||||||||||
Investor (Commenced February 28, 2014) | 44.01% | 15.00% | N/A | 11.50% | ||||||||||
| ||||||||||||||
Class R6 (Commenced February 28, 2018) | 44.15% | N/A | N/A | 12.77% | ||||||||||
| ||||||||||||||
Class P (Commenced April 16, 2018) | 44.17% | N/A | N/A | 13.79% | ||||||||||
| ||||||||||||||
| * | These returns assume reinvestment of all distributions at NAV and reflect a maximum initial sales charge of 5.50% for Class A and the assumed contingent deferred sales charge for Class C Shares (1% if redeemed within 12 months of purchase). Because Institutional, Investor, Class R6 and Class P Shares do not involve a sales charge, such a charge is not applied to their Average Annual Total Returns. |
11
PORTFOLIO RESULTS
Goldman Sachs Emerging Markets Equity Fund
Investment Objective
The Fund seeks long-term capital appreciation.
Portfolio Management Discussion and Analysis
Below, the Goldman Sachs Fundamental Emerging Markets Equity Portfolio Management Team discusses the Goldman Sachs Emerging Markets Equity Fund’s (the “Fund”) performance and positioning for the 12-month period ended October 31, 2020 (the “Reporting Period”).
| Q | How did the Fund perform during the Reporting Period? |
| A | During the Reporting Period, the Fund’s Class A, Class C, Institutional, Service, Investor, Class R6 and Class P Shares generated average annual total returns, without sales charges, of 17.77%, 16.85%, 18.11%, 17.55%, 18.02%, 18.13% and 18.14%, respectively. These returns compare to the 8.23% average annual total return of the Fund’s benchmark, the MSCI Emerging Markets Index (Net, USD, Unhedged) (the “Index”), during the same period. |
| Q | What key factors were responsible for the Fund’s performance during the Reporting Period? |
| A | The Fund outperformed the Index on a relative basis during the Reporting Period, primarily attributable to individual stock selection. From a country perspective, effective stock selection in China, Taiwan and Brazil contributed most positively to the Fund’s performance. These positive contributors were only partially offset by a combination of weaker stock selection and allocation positioning in Peru, Indonesia and the Czech Republic, which detracted. The Fund’s relative results were further dampened by having an exposure, albeit modest, to cash during a Reporting Period when the Index posted a solid positive return. |
| Q | What were some of the Fund’s best-performing individual stocks? |
| A | The strongest contributors to the Fund’s performance during the Reporting Period were MercadoLibre, Tencent Holdings and Sea Ltd. |
| MercadoLibre, an out-of-Index holding, is an e-commerce marketplace and financial technology platform in Brazil. As such, the company benefited from the accelerated shift from physical to digital commerce. New users and sales on its marketplace grew at a strong pace during the Reporting Period. Additionally, the company has been building out its own logistics network in the delivery mix, which helped support a more efficient cost structure and shopping experience for buyers. MercadoLibre has also been capitalizing on the shift to more online commerce through its digital payments and wallet offerings. By using the company’s financial technology arm, wallet holders can conduct almost all day-to-day transactions, such as bill payments, peer-to-peer transfers and credit from the convenience of their phones. While it is fair to say the environment brought on by the COVID-19 pandemic boosted the demand for MercadoLibre’s offerings, we believed at the end of the Reporting Period that these changes in consumption patterns are here to stay and MercadoLibre’s penetration of the market would likely continue to grow. |
| Tencent Holdings, a Chinese Internet company, saw its share price increase during the Reporting Period, as the company benefited from robust revenue growth driven by multiple catalysts, including a strong gaming pipeline, online advertising and digital payments. The COVID-19 pandemic pushed China into a nationwide lockdown and triggered the extension of the Chinese New Year. Both events proved favorable for the performance of Tencent Holdings’ various business segments. At the end of the Reporting Period, we remained positive on the long-term investment case for Tencent Holdings, partially driven by the expectation of improving advertising revenues and partly by the monetization of the multipurpose chat app WeChat, which Tencent Holdings owns. |
Sea Ltd., an out-of-Index holding, is a Singapore-based information technology services provider. Its gaming division, Garena, surprised investors during the Reporting Period with the large base of gamers it had built, now more than 500 million players on average per quarter. Its community-building capabilities around Free Fire, one of its most successful games; its deepening penetration in the emerging markets; and its improved monetization power |
12
PORTFOLIO RESULTS
have transformed the company into a franchise game developer in the emerging markets. On the e-commerce side of its business, its subsidiary Shopee, the leading e-commerce online shopping platform in Southeast Asia and Taiwan, has widened its leadership in terms of orders and users, boosted by the stay-at-home environment generated by the COVID-19 pandemic, as more consumers and merchants have been forced to go online for their shopping needs. The company has also been making inroads in the financial technology business through payments, or e-wallet, and consumer lending services. In our view, financial technology represents an upside opportunity for Sea Ltd., given its presence in such large unbanked regions. |
| Q | Which stocks detracted significantly from the Fund’s performance during the Reporting Period? |
| A | Detracting most from the Fund’s results relative to the Index were positions in three banks — Axis Bank, Banco Bradesco and Intercorp Financial Services. |
| Axis Bank is the third largest private bank in India, as measured by loans and profitability. However, during the Reporting Period, it was struggling due to corporate loan quality issues, with its earnings being impacted by increases in the provisions for estimated loan losses. We had initiated a position in Axis Bank in early 2019 on the basis of factors such as expectations for the asset quality cycle to bottom, expected management changes in the near term and what we considered to be a strong liability franchise trading at attractive valuations. During the Reporting Period, the bank did report sharp improvements across profitability metrics along with healthy loan growth. However, a higher slippage rate and related provisioning, as well as some exposure to Yes Bank, proved headwinds to its stock’s performance. (Slippage refers to the difference between the expected price of a trade and the price at which the trade is executed. Yes Bank is an Indian private sector bank and one of the country’s biggest banks, which was taken over by the Reserve Bank of India in March 2020 to shore up confidence in the financial system, citing a “serious deterioration” in its financial position. India’s central bank indicated it had to act quickly to restore confidence in Yes Bank, as its customers had been withdrawing their deposits.) As such, we ultimately decided to exit the Fund’s position in Axis Bank and allocate the proceeds to what we saw as more compelling opportunities from a risk/return perspective. |
| Banco Bradesco is a Brazilian bank. At the end of 2019, its stock had recovered from previously weaker performance and reached its highest price of the calendar year. There was no incremental news flow specific to Banco Bradesco, but its shares subsequently declined along with the broad financials sector. The banking industry in particular was largely affected by policy measures, such as social distancing and domestic lockdowns, directed to fight the COVID-19 pandemic. |
| Intercorp Financial Services, an out-of-Index holding, is a Peru-based bank. Its weak performance during the Reporting Period was due to two primary factors. First, COVID-19 significantly affected the Peruvian economy. The country’s second quarter 2020 Gross Domestic Product (“GDP”) was approximately -16% and its calendar year 2020 GDP was expected by many economists to be approximately -11%. Second, there were more than 20 proposals in Peru’s Congress to discuss additional help to borrowers affected by COVID-19, such as extension of relief for an additional 90 days without charging interest. Other proposals were looking at a cap on loans. Its shares also fell on the fact that Intercorp Financial Services has more exposure to the retail sector, mainly via credit cards, than some of its peers. |
| Q | Which equity market sectors most significantly affected Fund performance during the Reporting Period? |
| A | Relative to the Index, strong stock selection within the communication services, industrials and consumer staples sectors contributed most positively to the Fund’s performance. Having underweighted allocations to energy, real estate and financials and no exposure to utilities, each of which underperformed the Index during the Reporting Period, also proved beneficial. Conversely, weak stock selection in consumer discretionary and information technology detracted from the Fund’s performance. To a more modest degree, having underweighted exposures to materials and health care also dampened the Fund’s relative results. |
| Q | How did the Fund use derivatives and similar instruments during the Reporting Period? |
| A | During the Reporting Period, we did not use derivatives as part of our active management strategy. |
| Q | Did the Fund make any significant purchases or sales during the Reporting Period? |
| A | During the Reporting Period, we added to the Fund’s position in Alibaba Group Holding within the consumer discretionary sector. Alibaba Group Holding is a China-based technology company specializing in e-commerce, |
13
PORTFOLIO RESULTS
retail, Internet and technology. We added to the position because we see faster offline to online migration of retailers and faster digital transformation in China, which, in our view, is favorable to the company’s long-term growth potential in e-commerce, cloud and other services. |
| We initiated a Fund position in Kotak Mahindra Bank, one of the private sector banks in India, within the financials sector. We believed that Kotak Mahindra Bank’s conservatism and improving liability franchise, coupled with what we see as a strong capital position, made it a compelling investment, especially in the environment seen in India’s financial sector during the Reporting Period. |
| Conversely, we eliminated the Fund’s position in LG Chem, a South Korean chemical company in the materials sector. The company’s share price was approaching our target price estimate, which gave us the opportunity to sell the position and allocate the proceeds toward companies within the materials sector with a higher exposure to the electric vehicle industry and less legacy business in traditional chemical segments. Against this backdrop, our decision to lock in long-term profits was triggered in May 2020 when LG Chem reported a gas leak incident at one of its plants in India. |
| We trimmed the Fund’s position in AIA Group, a Hong Kong-based insurance and financial services company. We like AIA Group’s well diversified Asian footprint and what we consider to be its strong management. Its onshore China business has shown sustained growth momentum with a niche premium agent model targeting high-end customers. In our view, its growth opportunity has been enhanced by its expectations of full license across all provinces in China. Its southeast Asia local businesses have also been rather steadily improving with expanded distribution capabilities and better margins, reinforcing its positive earnings and value creation outlook for the medium term. All that said, the company saw weaker operating performance during the Reporting Period due to disruptions from COVID-19 and social distancing measures. This weighed on its new sales in the first half of 2020. Thus, we trimmed some exposure to hedge against downside risk. However, we maintained exposure to AIA Group because we still viewed the firm at the end of the Reporting Period as a long-term quality holding in the life insurance industry in China specifically and in Asia more broadly. |
| Q | Were there any notable changes in the Fund’s weightings during the Reporting Period? |
| A | Fund weightings at a sector level are driven by bottom-up stock selection. That said, during the Reporting Period, the Fund’s exposure relative to the Index to consumer discretionary and communication services increased, and its allocations relative to the Index to financials decreased. |
| Similarly, allocations to countries are directly the result of various stock selection decisions. As such, the Fund’s exposure relative to the Index in Taiwan increased. Its allocation to China also increased largely in line with the Index’s increased exposure to China during the Reporting Period and for risk management purposes. |
| Q | Were there any changes to the Fund’s portfolio management team during the Reporting Period? |
| A | There were no changes to the Fund’s portfolio management team during the Reporting Period. |
| Q | How was the Fund positioned relative to the Index at the end of the Reporting Period? |
| A | At the end of the Reporting Period, the Fund had overweighted exposure to India and Brazil and underweighted exposure to Taiwan, Thailand and South Africa relative to the Index. On the same date, the Fund was relatively neutrally weighted to the Index in the remaining components of the Index, with the exceptions of Pakistan, Egypt, Argentina, Colombia, Hungary, Chile, United Arab Emirates, Qatar, Malaysia and Saudi Arabia, where the Fund had no exposure at the end of the Reporting Period. The Fund also had exposure to equity markets that are not components of the Index, including Vietnam and Singapore. |
| From a sector allocation perspective, the Fund had overweighted positions relative to the Index in consumer staples, communication services, consumer discretionary, information technology and industrials at the end of the Reporting Period. The Fund had underweighted positions compared to the Index in the materials, financials, energy and real estate sectors at the end of the Reporting Period. The Fund was relatively neutral on the health care sector at the end of the Reporting Period. The Fund had no allocation to the utilities sector at the end of the Reporting Period. |
| As always, we remained focused on individual stock selection, with sector and country positioning being a secondary, closely-monitored effect. |
14
FUND BASICS
Emerging Markets Equity Fund
as of October 31, 2020
| TOP TEN HOLDINGS AS OF 10/31/201,2 | ||||||||||
| Holding | % of Net Assets | Line of Business | Country | |||||||
| Tencent Holdings Ltd. | 9.2 | % | Media & Entertainment | China | ||||||
| Alibaba Group Holding Ltd. ADR | 9.0 | Retailing | China | |||||||
| Taiwan Semiconductor Manufacturing Co. Ltd. | 6.7 | Semiconductors & Semiconductor Equipment | Taiwan | |||||||
| Samsung Electronics Co. Ltd. | 4.7 | Technology Hardware & Equipment | South Korea | |||||||
| Kweichow Moutai Co. Ltd. Class A | 2.9 | Food Products | China | |||||||
| Meituan Class B | 2.4 | Retailing | China | |||||||
| MercadoLibre, Inc. | 2.0 | Retailing | China | |||||||
| China Merchants Bank Co. Ltd. Class H | 1.7 | Banks | Argentina | |||||||
| Ping An Insurance Group Co. of China Ltd. Class H | 1.7 | Insurance | China | |||||||
| SK Hynix, Inc. | 1.6 | Semiconductors & Semiconductor Equipment | South Korea | |||||||
| 1 | The top 10 holdings may not be representative of the Fund’s future investments. |
| 2 | The line of business for each holding is reported at the industry or sub-industry level. |
| FUND VS. BENCHMARK SECTOR ALLOCATIONS3 |
| As of October 31, 2020 |
| 3 | The Fund is actively managed and, as such, its composition may differ over time. Consequently, the Fund’s overall sector allocations may differ from percentages contained in the graph above. The graph categorizes investments using Global Industry Classification Standard (“GICS”); however, the sector classifications used by the portfolio management team may differ from GICS. The percentage shown for each investment category reflects the value of investments in that category as a percentage of market value (excluding investments in the securities lending reinvestment vehicle, if any). Underlying sector allocations of exchange traded funds and investment companies held by the Fund are not reflected in the graph above. Investments in the securities lending reinvestment vehicle represented 0.8% of the Fund’s net assets at October 31, 2020. |
For more information about your Fund, please refer to www.GSAMFUNDS.com. There, you can learn more about your Fund’s investment strategies, holdings, and performance.
15
GOLDMAN SACHS EMERGING MARKETS EQUITY FUND
Performance Summary
October 31, 2020
The following graph shows the value, as of October 31, 2020, of a $1,000,000 investment made on November 1, 2010 in Institutional Shares at NAV. For comparative purposes, the performance of the Fund’s benchmark, the MSCI® Emerging Markets Index (Net, USD, Unhedged), is shown. Performance reflects applicable fee waivers and/or expense limitations in effect during the periods shown and in their absence, performance would be reduced. Returns do not reflect the deduction of taxes that a shareholder would pay on Fund distributions or the redemption of Fund shares. The returns set forth below represent past performance. Past performance does not guarantee future results. The Fund’s investment return and principal value will fluctuate so that an investor’s shares, when redeemed, may be worth more or less than their original cost. Current performance may be lower or higher than the performance quoted below. Please visit our web site at www.GSAMFUNDS.com to obtain the most recent month-end returns.
| Emerging Markets Equity Fund’s 10 Year Performance |
Performance of a $1,000,000 Investment, with distributions reinvested, from November 1, 2010 through October 31, 2020.
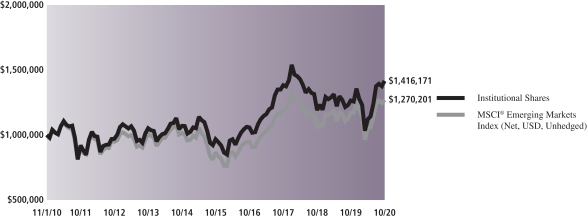
| Average Annual Total Return through October 31, 2020* | One Year | Five Years | Ten Years | Since Inception | ||||||||||
Class A | ||||||||||||||
Excluding sales charges | 17.77% | 10.60% | 4.18% | — | ||||||||||
Including sales charges | 11.34% | 9.36% | 3.60% | — | ||||||||||
| ||||||||||||||
Class C | ||||||||||||||
Excluding contingent deferred sales charges | 16.85% | 9.77% | 3.40% | — | ||||||||||
Including contingent deferred sales charges | 15.85% | 9.77% | 3.40% | — | ||||||||||
| ||||||||||||||
Institutional | 18.11% | 11.02% | 4.59% | — | ||||||||||
| ||||||||||||||
Service | 17.55% | 10.47% | 4.07% | — | ||||||||||
| ||||||||||||||
Investor | 18.02% | 10.87% | 4.43% | — | ||||||||||
| ||||||||||||||
Class R6 (Commenced July 31, 2015) | 18.13% | 11.05% | N/A | 9.23% | ||||||||||
| ||||||||||||||
Class P (Commenced April 16, 2018) | 18.14% | N/A | N/A | 4.35% | ||||||||||
| ||||||||||||||
| * | These returns assume reinvestment of all distributions at NAV and reflect a maximum initial sales charge of 5.50% for Class A and the assumed contingent deferred sales charge for Class C Shares (1% if redeemed within 12 months of purchase). Because Institutional, Service, Investor, Class R6 and Class P Shares do not involve a sales charge, such a charge is not applied to their Average Annual Total Returns. |
16
PORTFOLIO RESULTS
Goldman Sachs ESG Emerging Markets Equity Fund
Investment Objective
The Fund seeks long-term capital appreciation.
Portfolio Management Discussion and Analysis
Below, the Goldman Sachs Fundamental Emerging Markets Equity Portfolio Management Team discusses the Goldman Sachs ESG Emerging Markets Equity Fund (the “Fund”) performance and positioning for the 12-month period ended October 31, 2020 (the “Reporting Period”).
| Q | How did the Fund perform during the Reporting Period? |
| A | During the Reporting Period, the Fund’s Class A, Class C, Institutional, Investor, Class R6 and Class R Shares generated average annual total returns, without sales charges, of 18.46%, 17.58%, 18.91%, 18.79%, 18.92% and 18.11%, respectively. These returns compare to the 8.23% average annual total return of the Fund’s benchmark, the MSCI Emerging Markets Index (Net, USD, Unhedged) (the “Index”), during the same period. During the period from their inception on January 21, 2020 through October 31, 2020, the Fund’s Class P Shares generated a cumulative total return, without sales charge, of 8.28%. This return compares to the -0.24% cumulative total return of the Index during the same period. |
| Q | What key factors were responsible for the Fund’s performance during the Reporting Period? |
| A | The Fund outperformed the Index on a relative basis during the Reporting Period, primarily attributable to individual stock selection. From a country perspective, effective stock selection in China, Taiwan and Brazil contributed most positively to the Fund’s relative performance. These positive contributors were only partially offset by a combination of weaker stock selection and allocation positioning in India, Peru and the Czech Republic, which detracted. The Fund’s relative results were further dampened by having an exposure, albeit modest, to cash during a Reporting Period when the Index posted a solid positive return. |
| Q | What were some of the Fund’s best-performing individual stocks? |
| A | The strongest contributors to the Fund’s performance during the Reporting Period were MercadoLibre, Tencent Holdings and Sea Ltd. |
| MercadoLibre, an out-of-Index holding, is an e-commerce marketplace and financial technology platform in Brazil. As such, the company benefited from the accelerated shift from physical to digital commerce. New users and sales on its marketplace grew at a strong pace during the Reporting Period. Additionally, the company has been building out its own logistics network in the delivery mix, which helped support a more efficient cost structure and shopping experience for buyers. MercadoLibre has also been capitalizing on the shift to more online commerce through its digital payments and wallet offerings. By using the company’s financial technology arm, wallet holders can conduct almost all day-to-day transactions, such as bill payments, peer-to-peer transfers and credit from the convenience of their phones. While it is fair to say the environment brought on by the COVID-19 pandemic boosted the demand for MercadoLibre’s offerings, we believed at the end of the Reporting Period that these changes in consumption patterns are here to stay and MercadoLibre’s penetration of the market would likely continue to grow. |
| Tencent Holdings, a Chinese Internet company, saw its share price increase during the Reporting Period, as the company benefited from robust revenue growth driven by multiple catalysts, including a strong gaming pipeline, online advertising and digital payments. The COVID-19 pandemic pushed China into a nationwide lockdown and triggered the extension of the Chinese New Year. Both events proved favorable for the performance of Tencent Holdings’ various business segments. At the end of the Reporting Period, we remained positive on the long-term investment case for Tencent Holdings, partially driven by the expectation of improving advertising revenues and partly by the monetization of the multipurpose chat app WeChat, which Tencent Holdings owns. |
Sea Ltd., an out-of-Index holding, is a Singapore-based information technology services provider. Its gaming |
17
PORTFOLIO RESULTS
division, Garena, surprised investors during the Reporting Period with the large base of gamers it had built, now more than 500 million players on average per quarter. Its community-building capabilities around Free Fire, one of its most successful games; its deepening penetration in the emerging markets; and its improved monetization power have transformed the company into a franchise game developer in the emerging markets. On the e-commerce side of its business, its subsidiary Shopee, the leading e-commerce online shopping platform in Southeast Asia and Taiwan, has widened its leadership in terms of orders and users, boosted by the stay-at-home environment generated by the COVID-19 pandemic, as more consumers and merchants have been forced to go online for their shopping needs. The company has also been making inroads in the financial technology business through payments, or e-wallet, and consumer lending services. In our view, financial technology represents an upside opportunity for Sea Ltd., given its presence in such large unbanked regions. |
| Q | Which stocks detracted significantly from the Fund’s performance during the Reporting Period? |
| A | Among those stocks detracting most from the Fund’s results relative to the Index were positions in three financials companies — Axis Bank, Banco Bradesco and IRB Brazil Resseguros. |
| Axis Bank is the third largest private bank in India, as measured by loans and profitability. However, during the Reporting Period, it was struggling due to corporate loan quality issues, with its earnings being impacted by loan loss provisions. (A loan loss provision is an income statement expense set aside as an allowance for uncollected loans and loan payments.) We had initiated a position in Axis Bank in early 2019 on the basis of factors such as expectations for the asset quality cycle to bottom, expected management changes in the near term and what we considered to be a strong liability franchise trading at attractive valuations. During the Reporting Period, the bank did report sharp improvements across profitability metrics along with healthy loan growth. However, a higher slippage rate and related provisioning, as well as some exposure to Yes Bank, proved headwinds to its stock’s performance. (Slippage refers to the difference between the expected price of a trade and the price at which the trade is executed. Yes Bank is an Indian private sector bank and one of the country’s biggest banks, which was taken over by the Reserve Bank of India in March 2020 to shore up confidence in the financial system, citing a “serious deterioration” in its financial position. India’s central bank indicated it had to act quickly to restore confidence in Yes Bank, as its customers had been withdrawing their deposits.) As such, we ultimately decided to exit the Fund’s position in Axis Bank and allocate the proceeds to what we saw as more compelling opportunities from a risk/return perspective. |
| Banco Bradesco is a Brazilian bank. At the end of 2019, its stock had recovered from previously weaker performance and reached its highest price of the calendar year. There was no incremental news flow specific to Banco Bradesco, but its shares subsequently declined along with the broad financials sector. The banking industry in particular was largely affected by policy measures, such as social distancing and domestic lockdowns, directed to fight the COVID-19 pandemic. |
| IRB Brasil Resseguros is a Brazilian reinsurance company. Its shares declined significantly during the Reporting Period as accusations over financial irregularities by a short seller led to volatilities in its share price. (Short selling is an investment or trading strategy that speculates on the decline in a stock or other securities price.) The hedge fund doing the short selling questioned the sustainability of IRB Brasil Resseguros’ profitability and specifically criticized the reinsurance company’s estimates around recovery of past claims as well as the accounting of capital gains from real estate sales as recurring items. Despite the company publishing detailed financial notes and disclosures audited by high profile accounting firms, its share price suffered. Further, some reshuffling of top leadership took place during the Reporting Period, which also dampened investor sentiment. On a conference call on which the firm was set to explain the reasoning behind the personnel changes, IRB Brasil Resseguros claimed Berkshire Hathaway to be an investor and in the process of appointing a new member to its Board. Berkshire Hathaway denied this the next day, which undermined, in our view, IRB Brasil Resseguros’ credibility and prompted us to sell the Fund’s position in its stock. |
| Q | Which equity market sectors most significantly affected Fund performance during the Reporting Period? |
| A | Relative to the Index, strong stock selection in communication services and industrials contributed most positively to the Fund’s relative results. Having overweighted allocations to information technology and consumer discretionary, each of which outperformed the Index during the Reporting Period, also boosted the Fund’s relative performance. |
| Conversely, weaker stock selection in consumer staples, materials and financials detracted from the Fund’s relative results during the Reporting Period. Having an overweighted allocation, on average, to financials during the Reporting Period, also dampened results, as the sector substantially underperformed the Index. |
18
PORTFOLIO RESULTS
| Q | How did the Fund use derivatives and similar instruments during the Reporting Period? |
| A | During the Reporting Period, we did not use derivatives as part of our active management strategy. |
| Q | Did the Fund make any significant purchases or sales during the Reporting Period? |
| A | During the Reporting Period, we added to the Fund’s position in Alibaba Group Holding within the consumer discretionary sector. Alibaba Group Holding is a China-based technology company specializing in e-commerce, retail, Internet and technology. We added to the position because we see faster offline to online migration of retailers and faster digital transformation in China, which, in our view, is favorable to the company’s long-term growth potential in e-commerce, cloud and other services. |
| We initiated a Fund position in Kotak Mahindra Bank, one of the private sector banks in India, within the financials sector. We believed that Kotak Mahindra Bank’s conservatism and improving liability franchise, coupled with what we see as a strong capital position, made it a compelling investment, especially in the environment seen in India’s financial sector during the Reporting Period. |
| Conversely, we eliminated the Fund’s position in LG Chem, a South Korean chemical company in the materials sector. The company’s share price was approaching our target price estimate, which gave us the opportunity to sell the position and allocate the proceeds toward companies within the materials sector with a higher exposure to the electric vehicle industry and less legacy business in traditional chemical segments. Against this backdrop, our decision to lock in long-term profits was triggered in May 2020 when LG Chem reported a gas leak incident at one of its plants in India. |
| We exited the Fund’s position in Orange Life Insurance, a South Korean financials company, early in the Reporting Period. On November 14, 2019, Shihan Financial Group announced its acquisition of the remaining shares of Orange Life Insurance. Based on the announced share swap ratio, we saw limited upside potential in the stock and thus sold the Fund’s position. (A share swap ratio is a ratio at which an acquiring company will offer its own shares in exchange for the target company’s shares during a merger or acquisition.) |
| Q | Were there any notable changes in the Fund’s weightings during the Reporting Period? |
| A | Fund weightings at a sector level are driven by bottom-up stock selection. That said, during the Reporting Period, the Fund’s exposure relative to the Index to consumer discretionary and communication services increased, and its allocations relative to the Index to materials and financials decreased. |
| Similarly, allocations to countries are directly the result of various stock selection decisions. As such, the Fund’s exposure relative to the Index in China increased and in Brazil decreased, largely in line with the Index’s moves in these weights during the Reporting Period and for risk management purposes. |
| Q | Were there any changes to the Fund’s portfolio management team during the Reporting Period? |
| A | There were no changes to the Fund’s portfolio management team during the Reporting Period. |
| Q | How was the Fund positioned relative to the Index at the end of the Reporting Period? |
| A | At the end of the Reporting Period, the Fund had overweighted exposures to India and Brazil and underweighted exposures to South Africa and Thailand relative to the Index. On the same date, the Fund was relatively neutrally weighted to the Index in the remaining components of the Index, with the exceptions of Pakistan, Egypt, Argentina, Colombia, Hungary, Chile, United Arab Emirates, Qatar, Malaysia and Saudi Arabia, where the Fund had no exposure at all. |
| From a sector allocation perspective, the Fund had overweighted positions relative to the Index in communication services, information technology, consumer discretionary and financials at the end of the Reporting Period. The Fund had an underweighted position compared to the Index in the health care sector at the end of the Reporting Period. The Fund had rather neutral exposure to the consumer staples and industrials sectors and no allocations to the utilities, real estate, energy and materials sectors at the end of the Reporting Period. |
| We remained focused on individual stock selection, with sector and country positioning being a secondary, closely-monitored effect. We believe our ongoing engagement efforts with companies in the Fund’s portfolio is helping to drive improvements in environmental, social and corporate governance practices for these businesses, which may not only help unlock shareholder value over time, but may also help encourage these businesses to operate in an even more sustainable fashion in the future. |
19
FUND BASICS
ESG Emerging Markets Equity Fund
| TOP TEN HOLDINGS AS OF 10/31/201,2 | ||||||||||
| Holding | % of Net Assets | Line of Business | Country | |||||||
| Alibaba Group Holding Ltd. ADR | 9.7 | % | Retailing | China | ||||||
| Tencent Holdings Ltd. | 9.2 | Media & Entertainment | China | |||||||
| Taiwan Semiconductor Manufacturing Co. Ltd. | 7.4 | Semiconductors & Semiconductor Equipment | Taiwan | |||||||
| Samsung Electronics Co. Ltd. | 4.6 | Technology Hardware & Equipment | South Korea | |||||||
| MercadoLibre, Inc. | 2.9 | Retailing | Argentina | |||||||
| Meituan Class B | 2.8 | Retailing | China | |||||||
| Ping An Insurance Group Co. of China Ltd. Class H | 2.4 | Insurance | China | |||||||
| China Merchants Bank Co. Ltd. Class H | 2.1 | Banks | China | |||||||
| AIA Group Ltd. | 2.0 | Insurance | Hong Kong | |||||||
| NAVER Corp. | 1.9 | Media & Entertainment | South Korea | |||||||
| 1 | The top 10 holdings may not be representative of the Fund’s future investments. |
| 2 | The line of business for each holding is reported at the industry or sub-industry level. |
| FUND VS. BENCHMARK SECTOR ALLOCATIONS3 |
| As of October 31, 2020 |
| 3 | The Fund is actively managed and, as such, its composition may differ over time. Consequently, the Fund’s overall sector allocations may differ from percentages contained in the graph above. The graph categorizes investments using Global Industry Classification Standard (“GICS”); however, the sector classifications used by the portfolio management team may differ from GICS. The percentage shown for each investment category reflects the value of investments in that category as a percentage of market value. Underlying sector allocations of exchange traded funds and investment companies held by the Fund are not reflected in the graph above. |
For more information about your Fund, please refer to www.GSAMFUNDS.com. There, you can learn more about your Fund’s investment strategies, holdings, and performance.
20
GOLDMAN SACHS ESG EMERGING MARKETS EQUITY FUND
Performance Summary
October 31, 2020
The following graph shows the value, as of October 31, 2020, of a $1,000,000 investment made on May 31, 2018 (commencement of operations) in Institutional Shares at NAV. For comparative purposes, the performance of the Fund’s benchmark, the MSCI® Emerging Markets Index (Net, USD, Unhedged), is shown. Performance reflects applicable fee waivers and/or expense limitations in effect during the periods shown and in their absence, performance would be reduced. Returns do not reflect the deduction of taxes that a shareholder would pay on Fund distributions or the redemption of Fund shares. The returns set forth below represent past performance. Past performance does not guarantee future results. The Fund’s investment return and principal value will fluctuate so that an investor’s shares, when redeemed, may be worth more or less than their original cost. Current performance may be lower or higher than the performance quoted below. Please visit our web site at www.GSAMFUNDS.com to obtain the most recent month-end returns.
| ESG Emerging Markets Equity Fund’s Lifetime Performance |
Performance of a $1,000,000 Investment, with distributions reinvested, from May 31, 2018 through October 31, 2020.
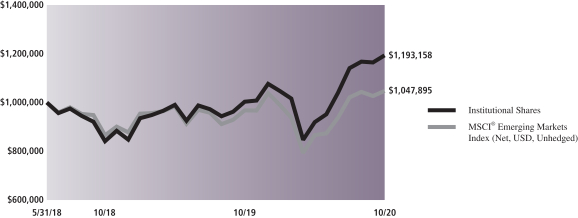
| Average Annual Total Return through October 31, 2020* | One Year | Since Inception | ||||||||||||
Class A (Commenced May 31, 2018) | ||||||||||||||
Excluding sales charges | 18.46% | 7.14% | ||||||||||||
Including sales charges | 11.95% | 4.68% | ||||||||||||
| ||||||||||||||
Class C (Commenced May 31, 2018) | ||||||||||||||
Excluding contingent deferred sales charges | 17.58% | 6.35% | ||||||||||||
Including contingent deferred sales charges | 16.58% | 6.35% | ||||||||||||
| ||||||||||||||
Institutional (Commenced May 31, 2018) | 18.91% | 7.56% | ||||||||||||
| ||||||||||||||
Investor (Commenced May 31, 2018) | 18.79% | 7.42% | ||||||||||||
| ||||||||||||||
Class R6 (Commenced May 31, 2018) | 18.92% | 7.56% | ||||||||||||
| ||||||||||||||
Class R (Commenced May 31, 2018) | 18.11% | 6.90% | ||||||||||||
| ||||||||||||||
Class P** (Commenced January 21, 2020) | N/A | 8.28% | ||||||||||||
| ||||||||||||||
| * | These returns assume reinvestment of all distributions at NAV and reflect a maximum initial sales charge of 5.50% for Class A and the assumed contingent deferred sales charge for Class C Shares (1% if redeemed within 12 months of purchase). Because Institutional, Investor, Class R6, Class R and Class P Shares do not involve a sales charge, such a charge is not applied to their Average Annual Total Returns. |
| ** | Total return for periods of less than one year represents cumulative total return. |
21
PORTFOLIO RESULTS
Goldman Sachs Imprint Emerging Markets Opportunities Fund
Investment Objective
The Fund seeks long-term capital appreciation.
Portfolio Management Discussion and Analysis
Below, the Goldman Sachs Fundamental Emerging Markets Equity Portfolio Management Team discusses the Goldman Sachs Imprint Emerging Markets Opportunities Fund’s (the “Fund”) performance and positioning for the 12-month period ended October 31, 2020 (the “Reporting Period”).
| Q | How did the Fund perform during the Reporting Period? |
| A | During the Reporting Period, the Fund’s Class A, Class C, Institutional, Investor, Class R6 and Class P Shares generated average annual total returns, without sales charges, of 5.95%, 5.09%, 6.31%, 6.10%, 6.24% and 6.38%, respectively. These returns compare to the 8.23% average annual total return of the Fund’s benchmark, the MSCI Emerging Markets Index (Net, USD, Unhedged) (the “Index”), during the Reporting Period. |
| Q | What key factors were responsible for the Fund’s performance during the Reporting Period? |
| A | While the Fund generated solid positive absolute returns, it underperformed the Index on a relative basis during the Reporting Period, attributable primarily to individual stock selection and country allocation. Sector allocation contributed positively. From a country perspective, stock selection and allocation positioning in the United Arab Emirates, Slovenia and Egypt detracted most. Having a position in cash, albeit modest, during a Reporting Period when the Index rose, also dampened the Fund’s relative results. These detractors were partially offset by effective stock selection in South Africa, Russia, South Korea, Poland and Taiwan, which contributed positively to the Fund’s relative results during the Reporting Period. |
| Q | Which stocks detracted most significantly from the Fund’s performance during the Reporting Period? |
| A | Detracting most from the Fund’s results relative to the Index during the Reporting Period were NMC Health, a diversified health care company based in the United Arab Emirates; IRB Brasil Resseguros, a Brazilian reinsurance company; and Emirates NBD Bank, Dubai, United Arab Emirate’s largest and highest quality bank and one of the largest banking groups in the Middle East. The share price of each of these companies fell during the time they were held in the Fund’s portfolio, and each was sold out of the Fund’s portfolio by the end of the Reporting Period. |
| Q | What were the Fund’s best-performing individual stocks during the Reporting Period? |
| A | The strongest contributors to the Fund’s performance during the Reporting Period were Naspers, a South Africa-based media communications company; Haier Smart Home, a China-based appliances manufacturer; and LG Chem, a South Korean chemical manufacturer. Each of these companies experienced a robust share price increase during the Reporting Period, and each was still held in the Fund’s portfolio at the end of the Reporting Period. |
| Q | Which equity market sectors most significantly affected Fund performance during the Reporting Period? |
| A | Relative to the Index, weak stock selection in health care, financials and consumer discretionary detracted most from the Fund’s performance during the Reporting Period. Having underweights to communication services and information technology, which each outperformed the Index during the Reporting Period, and having an overweight, on average, to financials, which underperformed the Index during the Reporting Period, also hurt. Conversely, effective stock selection within the materials, industrials, consumer staples and information technology sectors contributed most positively to the Fund’s relative performance. Having no exposure to the energy, utilities and real estate sectors, each of which underperformed the Index during the Reporting Period, and having an overweight to consumer discretionary, which outperformed the Index during the Reporting Period, also helped. |
22
PORTFOLIO RESULTS
| Q | How did the Fund use derivatives and similar instruments during the Reporting Period? |
| A | During the Reporting Period, the Fund did not use derivatives or similar instruments. |
| Q | Did the Fund make any significant purchases or sales during the Reporting Period? |
| A | The Board of Trustees of the Goldman Sachs Trust (“Board”) has approved an Agreement and Plan of Reorganization (the “Plan”), which contemplates the reorganization of the Fund with and into the Goldman Sachs ESG Emerging Markets Equity Fund (the “Surviving Fund” and, together with the Fund, the “Funds”). The reorganization was recommended by the Funds’ investment adviser, Goldman Sachs Asset Management, L.P. (the “Investment Adviser”), because it believes that the reorganization: (i) would rationalize Funds that have the same investment objective and similar investment strategies (albeit with some notable differences): (ii) may provide enhanced opportunities to realize greater efficiencies in the form of lower total operating expenses over time; and (iii) would enable the combined Fund to be better positioned for asset growth. |
| As of the close of business on October 16, 2020, the Fund was able to and did depart from its stated investment objectives and policies as it prepared to reorganize with and into the Surviving Fund. Thus, given the repositioning of the Fund under way toward the end of the Reporting Period, the number of purchases and sales, i.e. trading activity, was higher than usual as we implemented the changes to the Fund’s investment strategy. |
| The reorganization is expected to close during January 2021 or on such other date as the parties to the reorganization shall agree. |
| Q | Were there any notable changes in the Fund’s weightings during the Reporting Period? |
| A | Fund weightings at a sector level are driven by bottom-up stock selection as are allocations to countries. That said, during the Reporting Period, the Fund’s changes in sector and country weightings were directly the result of the repositioning of the Fund to its new investment strategy. |
| Q | Were there any changes to the Fund’s portfolio management team during the Reporting Period? |
| A | Effective September 30, 2020, Basak Yavuz, Managing Director, and Hiren Dasani, CFA, Managing Director, became co-portfolio managers of the Fund. Effective October 31, 2020, Jamieson Odell, Vice President, and Lee Gao, Vice President, will no longer serve as portfolio managers for the Fund. Ms. Yavuz is the co-head of GSAM’s Emerging Markets Equity team and a portfolio manager for GSAM’s Emerging Markets Equity strategy. Ms. Yavuz joined the Investment Adviser in September 2011. Mr. Dasani is the co-head of GSAM’s Emerging Markets Equity team and a portfolio manager for GSAM’s Emerging Markets Equity and India Equity strategies. Mr. Dasani joined GSAM’s India Equity Research team in January 2007. Ms. Yavuz and Mr. Dasani also serve as portfolio managers of Goldman Sachs China Equity Fund, Goldman Sachs Emerging Markets Equity Fund and Goldman Sachs ESG Emerging Markets Equity Fund. We believe the repositioning of the Fund and of our portfolio management talent will help to further broaden our already strong range of emerging market equity capabilities and enhance our approach to Environmental, Social and Governance integration across our Fundamental Equity Funds. |
| Q | How was the Fund positioned relative to the Index at the end of the Reporting Period? |
| A | As of October 16, 2020 through the end of the Reporting Period, repositioning of the Fund was underway given the Plan discussed above. That said, at the end of the Reporting Period, the Fund was overweight relative to the Index in South Africa and the Philippines and was underweight relative to the Index in China, South Korea, Brazil and Saudi Arabia. On the same date, the Fund was relatively neutrally weighted to the Index in the remaining country constituents of the Index, with the exceptions of Pakistan, Czech Republic, Greece, Argentina, Colombia, Hungary, Peru, Turkey, Chile, United Arab Emirates, Qatar, Mexico, Malaysia and Thailand, where the Fund held no exposure at all. The Fund also had exposure to the U.S., South Vietnam and Bangladesh, which are not constituents of the Index, at the end of the Reporting Period. |
| From a sector allocation perspective, the Fund had overweighted positions relative to the Index in consumer discretionary and had underweighted positions compared to the Index in communication services, materials, information technology, health care and financials at the end of the Reporting Period. The Fund was relatively neutrally weighted to the Index in consumer staples and industrials and had no exposure at all to the utilities, real estate and energy sectors at the end of the Reporting Period. |
| As always, we remained focused on individual stock selection, with sector and country positioning being a secondary, closely-monitored effect. |
23
FUND BASICS
Imprint Emerging Markets Opportunities
as of October 31, 2020
| TOP TEN HOLDINGS AS OF 10/31/201,2 | ||||||||||
| Holding | % of Net Assets | Line of Business | Country | |||||||
| Naspers Ltd. Class N | 11.6 | % | Retailing | South Africa | ||||||
| Alibaba Group Holding Ltd. ADR | 8.1 | Retailing | China | |||||||
| iShares, Inc. iShares ESG Aware MSCI EM ETF | 6.6 | Exchange Traded Fund | United States | |||||||
| Delta Electronics, Inc. | 4.9 | Technology Hardware & Equipment | Taiwan | |||||||
| FPT Corp. | 4.1 | Technology Hardware & Equipment | Vietnam | |||||||
| HDFC Bank Ltd. ADR | 4.0 | Banks | India | |||||||
| ICICI Bank Ltd. ADR | 3.9 | Banks | India | |||||||
| Merida Industry Co. Ltd. | 3.9 | Consumer Durables & Apparel | Taiwan | |||||||
| Flat Glass Group Co. Ltd. Class H | 3.8 | Semiconductors & Semiconductor Equipment | China | |||||||
| Taiwan Semiconductor Manufacturing Co. Ltd. | 3.4 | Semiconductors & Semiconductor Equipment | Taiwan | |||||||
| 1 | The top 10 holdings may not be representative of the Fund’s future investments. |
| 2 | The Fund’s overall top 10 holdings differ from the table above due to the exclusion of the Goldman Sachs Financial Square Government Fund (a short-term investment fund), which represents approximately 5.9% of the Fund’s net assets as of 10/31/20. |
| FUND VS. BENCHMARK SECTOR ALLOCATIONS3 |
| As of October 31, 2020 |
| 3 | The Fund is actively managed and, as such, its composition may differ over time. Consequently, the Fund’s overall sector allocations may differ from percentages contained in the graph above. The graph categorizes investments using Global Industry Classification Standard (“GICS”); however, the sector classifications used by the portfolio management team may differ from GICS. The percentage shown for each investment category reflects the value of investments in that category as a percentage of market value (excluding investments in the securities lending reinvestment vehicle, if any). Underlying sector allocations of exchange traded funds and investment companies held by the Fund are not reflected in the graph above. Investments in the securities lending reinvestment vehicle represented 5.9% of the Fund’s net assets at October 31, 2020. |
For more information about your Fund, please refer to www.GSAMFUNDS.com. There, you can learn more about your Fund’s investment strategies, holdings, and performance.
24
GOLDMAN SACHS IMPRINT EMERGING MARKETS OPPORTUNITIES FUND
Performance Summary
October 31, 2020
The following graph shows the value, as of October 31, 2020, of a $1,000,000 investment made on February 28, 2011 (commencement of operations) in Institutional Shares at NAV. For comparative purposes, the performance of the Fund’s benchmark, the MSCI Emerging Markets Index (Net, USD, Unhedged), is shown. Performance reflects applicable fee waivers and/or expense limitations in effect during the periods shown and in their absence, performance would be reduced. Returns do not reflect the deduction of taxes that a shareholder would pay on Fund distributions or the redemption of Fund shares. The returns set forth below represent past performance. Past performance does not guarantee future results. The Fund’s investment return and principal value will fluctuate so that an investor’s shares, when redeemed, may be worth more or less than their original cost. Current performance may be lower or higher than the performance quoted below. Please visit our web site at www.GSAMFUNDS.com to obtain the most recent month-end returns.
| Imprint Emerging Markets Opportunities Fund’s Lifetime Performance |
Performance of a $1,000,000 Investment from February 28, 2011 through October 31, 2020.
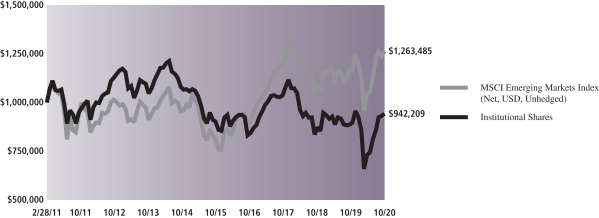
| Average Annual Total Return through October 31, 2020* | One Year | Five Years | Since Inception | |||||||||||
Class A (Commenced February 28, 2011) | ||||||||||||||
Excluding sales charges | 5.95% | -0.51% | -0.99% | |||||||||||
Including sales charges | 0.15% | -1.63% | -1.57% | |||||||||||
| ||||||||||||||
Class C (Commenced February 28, 2011) | ||||||||||||||
Excluding contingent deferred sales charges | 5.09% | -1.26% | -1.74% | |||||||||||
Including contingent deferred sales charges | 4.06% | -1.26% | -1.74% | |||||||||||
| ||||||||||||||
Institutional (Commenced February 28, 2011) | 6.31% | -0.13% | -0.61% | |||||||||||
| ||||||||||||||
Investor (Commenced February 28, 2011) | 6.10% | -0.28% | -0.76% | |||||||||||
| ||||||||||||||
Class R6 (Commenced February 28, 2018) | 6.24% | N/A | -4.75% | |||||||||||
| ||||||||||||||
Class P (Commenced April 16, 2018) | 6.38% | N/A | -4.47% | |||||||||||
| ||||||||||||||
| * | These returns assume reinvestment of all distributions at NAV and reflect a maximum initial sales charge of 5.50% for Class A and the assumed contingent deferred sales charge for Class C Shares (1% if redeemed within 12 months of purchase). Because Institutional, Investor, Class R6 and Class P Shares do not involve a sales charge, such a charge is not applied to their Average Annual Total Returns. |
25
PORTFOLIO RESULTS
Goldman Sachs International Equity ESG Fund
Investment Objective
The Fund seeks long-term capital appreciation.
Portfolio Management Discussion and Analysis
Below, the Goldman Sachs Global Equity Team discusses Goldman Sachs International Equity ESG Fund (the “Fund”) performance and positioning for the 12-month period ended October 31, 2020 (the “Reporting Period”).
The Fund uses a proprietary framework to identify and invest in a selective portfolio of companies that satisfy the Fund’s Environmental, Social and Governance (“ESG”) criteria. By incorporating ESG criteria and an active ownership approach, the Fund seeks to manage risk from an ESG perspective and invest in sustainable businesses trading at attractive valuations that may generate excess returns over the benchmark.
| Q | How did the Fund perform during Reporting Period? |
| A | During the Reporting Period, the Fund’s Class A, Class C, Institutional, Service, Investor, Class R6 and Class P Shares generated average annual total returns, without sales charges, of 3.30%, 2.53%, 3.62%, 3.16%, 3.56%, 3.63% and 3.67%, respectively. These returns compare to the -6.85% average annual total return of the Fund’s benchmark, the MSCI EAFE Index (Net, USD, Unhedged) (the “MSCI EAFE Index”), during the same period. |
| Q | What key factors were responsible for the Fund’s performance during the Reporting Period? |
| A | The Fund outperformed the MSCI EAFE Index during the Reporting Period, attributable primarily to individual stock selection. Country allocation and sector allocation also contributed positively, albeit more modestly, to the Fund’s relative performance during the Reporting Period. |
| Q | What were some of the Fund’s best-performing individual stocks? |
| A | Among the greatest contributors to Fund performance relative to the MSCI EAFE Index during the Reporting Period were Taiwan Semiconductor, Cellnex Telcom and Infineon Technologies. |
| Taiwan Semiconductor is an out-of-MSCI EAFE Index position that outperformed the MSCI EAFE Index during the Reporting Period. Its revenue growth was strong year-to-date through October 2020, driven by continuing fifth-generation (“5G”) penetration and increasing high-performance computer demand. Also, investor concerns regarding its loss of technology company Huawei as a customer were reduced given its strong performance in the third quarter of 2020 as other customers quickly replaced Huawei. Further, volume production of its five-nanometer node solidified Taiwan Semiconductor’s position as the leading process technology provider, which should translate, in our view, to increased market share and higher pricing power going forward. Its shares also rose as higher capacity utilization from elevated demand led to an impressive uptick in its margins. At the end of the Reporting Period, we believed Taiwan Semiconductor’s leadership in process technology may well give the company the ability to maintain its margins at elevated levels in the months ahead. |
| Cellnex Telecom, based in Spain, operates infrastructure for wireless telecommunications in Spain, Italy, the Netherlands, France, Switzerland and elsewhere. During the Reporting Period, Cellnex Telecom delivered on its strategy of consolidating and optimizing the telecommunications tower infrastructure market in Europe. This market remains under-developed compared to that of the U.S., with phone carriers still largely owning their mobile towers. However, financial pressures and strategic decisions have been pushing operators to sell their infrastructure, and Cellnex Telecom has been one of the main beneficiaries of this trend given its existing position as the largest independent mast owner in Europe. In October 2019, just before the start of the Reporting Period, Cellnex Telecom had announced a $2.5 billion deal to acquire 7,400 mobile towers in the U.K. |
Infineon Technologies is a German semiconductor company. Its acquisition of California-based Cypress Semiconductor, completed in April 2020, was widely seen as adding to Infineon Technologies’ margin growth potential. The |
26
PORTFOLIO RESULTS
acquisition also provides scale and enables Infineon Technologies to be a full system supplier of power semiconductors, thus widening its total addressable market. We believe Infineon Technologies, along with Cypress Semiconductor, has the scale to profitably invest and manufacture new technology power semiconductors, potentially leading to sustainable market share growth going forward. Further boosting sentiment around Infineon Technologies was the improved outlook for the auto industry, where the company has a significant exposure, following a severe hit from the pandemic. In our view, Infineon Technologies is well placed to benefit from higher power semiconductor content in electric vehicles and advanced driver assistance systems. Subsidies on electric vehicles, especially in Europe and China, should be supportive, in our opinion, of Infineon Technologies’ auto revenue growth. |
| Q | Which stocks detracted significantly from the Fund’s performance during the Reporting Period? |
| A | Among the biggest detractors from Fund performance relative to the MSCI EAFE Index during the Reporting Period were Compass Group, Informa and Banco Bilbao Vizcaya Argentaria (“BBVA”). |
| Compass Group is a U.K. catering and food support services provider, mostly to business/industry, health care, education, sports and leisure sites. Its stock fell sharply in the COVID-19-induced sell-off, primarily due to heavy exposure to the away-from-home economy. At the end of the Reporting Period, we believed most of the company’s end-markets would come back strongly once the economy reopens in the post-COVID-19 era and its business impairment would be limited mostly to its exposure in the business/industry segment. We also believed its stock was trading below its fundamental value at levels seen at the end of the Reporting Period. Finally, in our view, Compass Group, with what we consider to be a strong balance sheet, industry leading competitive positioning and good management team, is likely to emerge as a stronger company coming out of the crisis, able to create value for its shareholders over the long term. |
| Informa, a U.K. communication services company, engages in publishing, business intelligence and business events/exhibitions services. Informa’s shares declined dramatically during the Reporting Period due to the pandemic’s impact on the occurrence of physical exhibitions and conventions. At the end of the Reporting Period, we were encouraged by the performance of the company’s other business segments and its progress on the monetization of virtual events and found its outlook and valuation to be relatively attractive. |
| BBVA, a new position for the Fund during the Reporting Period, is a Spanish bank. BBVA experienced a double-digit share price decline during the Reporting Period primarily due to the effects of the pandemic’s impact on the economy. Because of the pandemic, central banks have cut interest rates, and loan growth has declined. This, in turn, put pressure on BBVA’s revenues. Also, the bank had to take higher precautionary loan loss provisions due to worsening economic conditions. Lower revenue and higher provisioning caused BBVA’s profits to decline year over year. Finally, regulators have prohibited banks, including BBVA, from distributing dividends in 2020, even though BBVA has sufficient capital to do so. This put further pressure on BBVA’s share price as well as on the broad banking industry during the Reporting Period. |
| Q | Which equity market sectors most significantly affected Fund performance during the Reporting Period? |
| A | The sectors that contributed most positively to the Fund’s relative results during the Reporting Period were information technology, energy and consumer staples, each due primarily to effective stock selection. |
| The sectors that detracted most from the Fund’s relative results were consumer discretionary and financials, each hurt by weak stock selection. Having an underweighted allocation to utilities, which outperformed the Index during the Reporting Period, also detracted. |
| Q | Which countries most affected the Fund’s performance during the Reporting Period? |
| A | Typically, the Fund’s individual stock holdings will significantly influence the Fund’s performance within a particular country or region relative to the MSCI EAFE Index. This effect may be even more pronounced in a concentrated portfolio or in countries that represent only a modest proportion of the MSCI EAFE Index. |
That said, effective stock selection in the U.K., Japan and Spain boosted the Fund’s relative returns most. Having exposure to Taiwan, which is not a constituent of the MSCI EAFE Index but which outperformed the MSCI EAFE Index during the Reporting Period, also helped. Conversely, the countries that detracted most from the Fund’s relative results during the Reporting Period were France and Switzerland, where stock selection overall hurt. Also, having no exposure |
27
PORTFOLIO RESULTS
to Ireland, which outperformed the MSCI EAFE Index during the Reporting Period, dampened the Fund’s relative results. |
| Q | How did the Fund use derivatives and similar instruments during the Reporting Period? |
| A | During the Reporting Period, the Fund did not use derivatives or similar instruments. |
| Q | Did the Fund make any significant purchases or sales during the Reporting Period? |
| A | During the Reporting Period, we initiated a Fund position in Genmab, a Danish biotechnology company. Genmab is a competitive oncology platform company that specializes in differentiated antibody therapeutics. In our view, Genmab’s base business and market franchise have not yet been fully appreciated but offer compelling upside potential. Among the factors we like about Genmab are what we consider to be its growing opportunities for royalties through its market franchises and its significant pipeline opportunities through its partnerships with other industry-leading innovators that may support its free cash flow. At the time of purchase, we believed Genmab had an attractive valuation profile and potential for long-term growth. |
| We established a Fund position in Intercontinental Hotels Group (“IHG”), which operates a predominantly franchised hotel network. Its biggest brands include Holiday Inn, InterContinental and Crown Plaza. Travel is a structural growth industry, and while the pandemic has disrupted the travel industry short term, we do not believe this changes the landscape with a three- to five-year view. We expect IHG to benefit from consumers’ move from unbranded to branded hotels, as small independent hotels struggle to compete and see the benefits of belonging to a branded hotel network. IHG operates an asset-light model, which means approximately 95% of its earnings before interest and taxes comes from franchise fees. This model, in our view, is scalable, results in higher margins, high returns on capital and high free cash flow generation. IHG’s management has, in our opinion, successfully executed a $125 million savings program, which it used to fund new concepts, such as Voco, an international lifestyle hotel brand, and Avid, a midscale hotel brand. Both of these brands had performed well, pre-COVID, which, we see as demonstration of the company’s ability to innovate and fund that innovation organically. |
| Conversely, we exited the Fund’s position in Novartis, a Swiss health care company. We liked the pharmaceutical company’s diversified growth story as well as its potential for margin expansion. Those factors drove both top- and bottom-line growth, which, in turn, served as catalysts for its stock’s strong performance through mid-2019. From that point on, however, Novartis experienced increased execution risk following the disappointment and delay of its new product pipeline, driving downward revision of its earnings. Against this backdrop, we believed Novartis had appreciated in valuation, and we felt there were better opportunities elsewhere in the sector. |
| We eliminated the Fund’s position in Grifols, a Spanish pharmaceutical company that produces blood plasma-based products and operates as a supplier of devices, instruments and reagents for clinical testing. Our investment thesis on Grifols had been centered around its top-line growth acceleration due to a tight supply and a resilient demand for its products. However, its stock performed poorly amid fallout from COVID-19, which hurt its supply chain. Grifols also experienced increased competition for some its best-selling products in areas where it derives much of its competitive differentiation. As a result, these factors hurt both the company’s top-line revenue sustainability and growth outlook. Heightened investor skepticism and its challenged price/earnings ratio also hurt our conviction in the company, and so we sold the position. |
| Q | Were there any notable changes in the Fund’s weightings during the Reporting Period? |
| A | In this Fund, both sector weightings and country allocations are largely the result of our bottom-up stock selection process rather than any top-down macroeconomic views or regional, country, sector or industry bets. We seek to outpace the MSCI EAFE Index by overweighting stocks that we expect to outperform and underweighting those we think may lag. Consequently, changes in its sector or country weightings are generally the direct result of individual stock selection or of stock appreciation or depreciation. That said, during the Reporting Period, the Fund’s exposure to information technology, industrials, energy, utilities, financials, materials and consumer discretionary increased relative to the MSCI EAFE Index during the Reporting Period, while its relative exposure to communication services, health care, consumer staples and real estate decreased. The Fund’s position in cash increased during the Reporting Period. |
From a country perspective, the Fund’s exposure to the U.K., Switzerland and Denmark increased relative to the MSCI EAFE Index, while its relative exposure to Japan, France, |
28
PORTFOLIO RESULTS
New Zealand and Norway decreased during the Reporting Period. |
| Q | How was the Fund positioned relative to the MSCI EAFE Index at the end of the Reporting Period? |
| A | At the end of the Reporting Period, the Fund had more exposure to the U.K., Spain, Denmark and the Netherlands and less exposure to Japan, France and Germany relative to the MSCI EAFE Index. At the end of the Reporting Period, the Fund held a rather neutral position relative to the MSCI EAFE Index in Switzerland, Sweden, Finland and Singapore and held no exposure to the remaining components of the MSCI EAFE Index. The Fund also had positions in Taiwan and China, which are not constituents of the MSCI EAFE Index. |
| From a sector allocation perspective, the Fund had overweight positions relative to the MSCI EAFE Index in information technology, industrials and communication services at the end of the Reporting Period. On the same date, the Fund had underweighted positions compared to the MSCI EAFE Index in consumer discretionary and consumer staples. The Fund was rather neutrally weighted relative to the MSCI EAFE Index in health care, materials, financials, energy and utilities and had no exposure to the real estate sector at the end of the Reporting Period. |
| As always, we remained focused on individual stock selection, with sector and country positioning being a secondary, closely-monitored effect. |
29
FUND BASICS
International Equity ESG Fund
as of October 31, 2020
| TOP TEN HOLDINGS AS OF 10/31/201,2 | ||||||||||
| Holding | % of Net Assets | Line of Business | Country | |||||||
| Nestle SA (Registered) | 4.7 | % | Food Products | Switzerland | ||||||
| Taiwan Semiconductor Manufacturing Co. Ltd. ADR | 4.3 | Semiconductors & Semiconductor Equipment | Taiwan | |||||||
| Zurich Insurance Group AG | 4.0 | Insurance | Switzerland | |||||||
| Ferguson plc | 3.6 | Capital Goods | United States | |||||||
| Infineon Technologies AG | 3.3 | Semiconductors & Semiconductor Equipment | Germany | |||||||
| AstraZeneca plc | 3.3 | Pharmaceuticals, Biotechnology & Life Sciences | United Kingdom | |||||||
| Koninklijke DSM NV | 3.2 | Materials | Netherlands | |||||||
| DS Smith plc | 3.2 | Materials | United Kingdom | |||||||
| Cellnex Telecom SA | 3.1 | Telecommunication Services | Spain | |||||||
| Rentokil Initial plc | 3.1 | Commercial & Professional Services | United Kingdom | |||||||
| 1 | The top 10 holdings may not be representative of the Fund’s future investments. |
| 2 | The line of business for each holding is reported at the industry or sub-industry level. |
| FUND VS. BENCHMARK SECTOR ALLOCATIONS3 |
| As of October 31, 2020 |
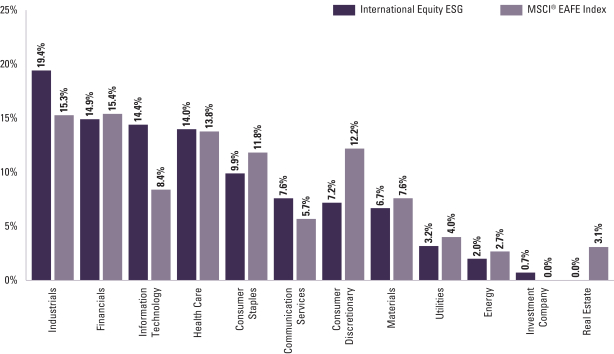
| 3 | The Fund is actively managed and, as such, its composition may differ over time. Consequently, the Fund’s overall sector allocations may differ from percentages contained in the graph above. The graph categorizes investments using Global Industry Classification Standard (“GICS”); however, the sector classifications used by the portfolio management team may differ from GICS. The percentage shown for each investment category reflects the value of investments in that category as a percentage of market value. Underlying sector allocations of exchange traded funds and investment companies held by the Fund are not reflected in the graph above. |
For more information about your Fund, please refer to www.GSAMFUNDS.com. There, you can learn more about your Fund’s investment strategies, holdings, and performance.
30
GOLDMAN SACHS INTERNATIONAL EQUITY ESG FUND
Performance Summary
October 31, 2020
The following graph shows the value, as of October 31, 2020, of a $1,000,000 investment made on November 1, 2010 in Institutional Shares at NAV. For comparative purposes, the performance of the Fund’s benchmark, the MSCI® EAFE Index (Net, USD, Unhedged), is shown. Performance reflects applicable fee waivers and/or expense limitations in effect during the periods shown and in their absence, performance would be reduced. Returns do not reflect the deduction of taxes that a shareholder would pay on Fund distributions or the redemption of Fund shares. The returns set forth below represent past performance. Past performance does not guarantee future results. The Fund’s investment return and principal value will fluctuate so that an investor’s shares, when redeemed, may be worth more or less than their original cost. Current performance may be lower or higher than the performance quoted below. Please visit our web site at www.GSAMFUNDS.com to obtain the most recent month-end returns.
| International Equity ESG Fund’s 10 Year Performance |
Performance of a $1,000,000 Investment, with distributions reinvested, from November 1, 2010 through October 31, 2020.
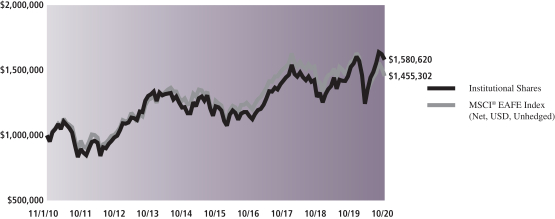
| Average Annual Total Return through October 31, 2020* | One Year | Five Years | Ten Years | Since Inception | ||||||||||
Class A | ||||||||||||||
Excluding sales charges | 3.30% | 4.88% | 4.28% | — | ||||||||||
Including sales charges | -2.36% | 3.69% | 3.69% | — | ||||||||||
| ||||||||||||||
Class C | ||||||||||||||
Excluding contingent deferred sales charges | 2.53% | 4.10% | 3.50% | — | ||||||||||
Including contingent deferred sales charges | 1.52% | 4.10% | 3.50% | — | ||||||||||
| ||||||||||||||
Institutional | 3.62% | 5.26% | 4.68% | — | ||||||||||
| ||||||||||||||
Service | 3.16% | 4.77% | 4.17% | — | ||||||||||
| ||||||||||||||
Investor | 3.56% | 5.13% | 4.52% | — | ||||||||||
| ||||||||||||||
Class R6 (Commenced February 26, 2016) | 3.63% | N/A | N/A | 8.59% | ||||||||||
| ||||||||||||||
Class P (Commenced April 16, 2018) | 3.67% | N/A | N/A | 2.61% | ||||||||||
| ||||||||||||||
| * | These returns assume reinvestment of all distributions at NAV and reflect a maximum initial sales charge of 5.50% for Class A and the assumed contingent deferred sales charge for Class C Shares (1% if redeemed within 12 months of purchase). Because Institutional, Service, Investor, Class R6 and Class P Shares do not involve a sales charge, such a charge is not applied to their Average Annual Total Returns. |
31
PORTFOLIO RESULTS
Goldman Sachs International Equity Income Fund
Investment Objective
The Fund seeks long-term capital appreciation and growth of income.
Portfolio Management Discussion and Analysis
Below, the Goldman Sachs Global Equity Team discusses Goldman Sachs International Equity Income Fund (the “Fund”) performance and positioning for the 12-month period ended October 31, 2020 (the “Reporting Period”).
| Q | How did the Fund perform during the Reporting Period? |
| A | During the Reporting Period, the Fund’s Class A, Class C, Institutional, Investor, Class R6, Class R and Class P Shares generated average annual total returns, without sales charges, of -11.23%, -11.88%, -10.86%, -10.99%, -10.93%, -11.44% and -10.89%, respectively. These returns compare to the -6.85% average annual total return of the Fund’s benchmark, the MSCI EAFE Index (Net, USD, Unhedged) (the “MSCI EAFE Index”), during the same period. |
| Q | What key factors were responsible for the Fund’s performance during the Reporting Period? |
| A | The Fund underperformed the MSCI EAFE Index during the Reporting Period, attributable primarily to sector and country allocation, which detracted. Individual stock selection contributed positively to relative results during the Reporting Period. |
| Q | What were some of the Fund’s best-performing individual stocks? |
| A | Among the greatest contributors to Fund performance relative to the MSCI EAFE Index during the Reporting Period were Taiwan Semiconductor, Schneider Electric and Rio Tinto. |
| Taiwan Semiconductor is an out-of-MSCI EAFE Index position that outperformed the MSCI EAFE Index during the Reporting Period. Its revenue growth was strong year-to-date through October 2020, driven by continuing fifth-generation (“5G”) penetration and increasing high-performance computer demand. Also, investor concerns regarding its loss of technology company Huawei as a customer were reduced given its strong performance in the third quarter of 2020 as other customers quickly replaced Huawei. Further, volume production of its five-nanometer node solidified Taiwan Semiconductor’s position as the leading process technology provider, which should translate, in our view, to increased market share and higher pricing power going forward. Its shares also rose as higher capacity utilization from elevated demand led to an impressive uptick in its margins. At the end of the Reporting Period, we believed Taiwan Semiconductor’s leadership in process technology may well give the company the ability to maintain its margins at elevated levels in the months ahead. |
| Schneider Electric, a French information technology company, is exposed to structural growth trends through leading positions in both of its end-markets — energy management and industrial automation. Schneider Electric has built a strong software portfolio, which, in our view, should enable it to benefit from secular themes, like industrial Internet of Things and digitalization across its end markets. (The Internet of things describes the network of physical objects — “things” — that are embedded with sensors, software, and other technologies for the purpose of connecting and exchanging data with other devices and systems over the Internet.) Schneider Electric also has strong Environmental, Social and Governance (“ESG”) credentials, as its offerings help customers to achieve higher energy efficiency and cost savings. During the Reporting Period, the company demonstrated strong cost execution through portfolio rationalization and improved productivity. At the end of the Reporting Period, we believed it could continue to deliver margin expansion. We also continued to like Schneider Electric with a long term perspective given what we see as its exposure to attractive growth opportunities and good execution capabilities. |
Rio Tinto, a British mineral resources company, remained a leader within the global mining industry during the Reporting Period. Operationally, its focus on Tier 1 assets and leadership within automation drove a span of strong profitability and free cash flow generation even with a weak commodity market and the difficulties COVID-19 brought to many of Rio Tinto’s peers. From a product portfolio perspective, we believed, at the end of the Reporting Period, |
32
PORTFOLIO RESULTS
that Rio Tinto had an attractive mix of base metals that should benefit from the global trend of electrification and no exposure to carbon fuels following its 2018 exit from the coal business. These base metals saw a larger and faster recovery in price and demand than many carbon-based energy commodities during the Reporting Period, given the stronger supply/demand dynamics for those products. |
| Q | Which stocks detracted significantly from the Fund’s performance during the Reporting Period? |
| A | Among the biggest detractors from Fund performance relative to the MSCI EAFE Index during the Reporting Period were Klepierre, BP and Royal Dutch Shell. |
| Klepierre, a French real estate company, is a leader across European ownership, management and development of shopping malls. Its stock detracted from Fund results during the Reporting Period due to the impact of the COVID-19 pandemic on real estate broadly and on the retail sector especially. At the end of the Reporting Period, we felt the quality of Klepierre’s portfolio was resilient and the company would prove a long-term competitor as the growth of e-commerce leads retailers to become more selective in their store footprints. We were also encouraged by what we considered to be the company’s strong fundamentals and improving sales and activity quarter over quarter through the third quarter of 2020. |
| BP is a U.K.-based international energy company with expertise in the exploration and production of oil and natural gas, and Royal Dutch Shell is a Netherlands-based integrated energy company with expertise in the exploration and production of oil and natural gas. During the Reporting Period, the energy sector broadly underperformed the MSCI EAFE Index significantly, largely due to weakened oil demand amid the COVID-19-induced lockdowns, acceleration of electric vehicle adoption and ESG considerations. More specific to BP and Royal Dutch Shell, each company was negatively affected by its need to cut its dividend distributions as a result of lower oil prices and the resulting reduced cash flows. Given that both energy companies are largely held by dividend-focused investors, the dividend cuts caused share price weakness. |
| Q | Which equity market sectors most significantly affected Fund performance during the Reporting Period? |
| A | The sectors that detracted from the Fund’s results most during the Reporting Period were energy, health care and real estate. Weak stock selection in energy and health care hurt. Having overweighted allocations to energy and real estate, each of which underperformed the MSCI EAFE Index during the Reporting Period, also dampened the Fund’s relative results. |
| The sectors that contributed most positively to the Fund’s performance relative to the MSCI EAFE Index were consumer staples, utilities and information technology. Stock selection in all three sectors proved effective during the Reporting Period. |
| Q | Which countries most affected the Fund’s performance during the Reporting Period? |
| A | Typically, the Fund’s individual stock holdings will significantly influence the Fund’s performance within a particular country or region relative to the MSCI EAFE Index. This effect may be even more pronounced in countries that represent only a modest proportion of the MSCI EAFE Index. |
| That said, the countries that detracted most from the Fund’s relative performance were Japan, France and the Netherlands, where stock selection overall hurt. Having an underweighted allocation to Japan, which outpaced the MSCI EAFE Index during the Reporting Period, also dampened the Fund’s relative results. Conversely, effective stock selection in Germany and Spain and having exposure to Taiwan, which is not a constituent of the MSCI EAFE but which outperformed the MSCI EAFE Index during the Reporting Period, contributed most positively to the Fund’s results relative to the MSCI EAFE Index during the Reporting Period. |
| Q | How did the Fund use derivatives and similar instruments during the Reporting Period? |
| A | During the Reporting Period, the Fund did not use derivatives or similar instruments. |
| Q | Did the Fund make any significant purchases or sales during the Reporting Period? |
| A | During the Reporting Period, we initiated a Fund position in National Grid. National Grid operates regulated utilities businesses in the U.K. and in the U.S. It is the systems operator in the U.K., operating the electricity and gas transmission networks, where it gets compensated based on a regulated return on its asset base. In the U.S., it operates gas and electricity distribution networks in the northeast. In the U.S., it gets compensated on a regulated return on equity invested basis. National Grid’s businesses are highly regulated and its earnings are, in our view, quite predictable. |
33
PORTFOLIO RESULTS
Based on our analysis, its earnings are growing amid improved investor sentiment, which is, in turn, being driven by the increasing robustness of its networks and the energy transition toward less carbon intensive sources. We also like National Grid because given the predictable nature of its cash flows, National Grid has historically paid out a significant portion of its growing earnings as dividends. |
| We established a Fund position in Trend Micro. Trend Micro is a Japan-based company that develops and sells consumer and enterprise antivirus and other security software worldwide. We purchased its shares primarily because we are optimistic on market growth of global security software, particularly in cloud security where Trend Micro is relatively competitive. |
| Conversely, we exited the Fund’s position in Inditex. While Inditex remained, in our view, a best-in-class apparel retailer with Zara as its biggest brand, we became concerned about the health of the apparel industry as COVID-19-induced lockdowns forced store closures around the world. Inditex has, in our opinion, a strong liquidity position, especially relative to its peers, but we felt this would cause long-lasting disruption to the apparel industry, likely leading to substantial discounts by others, which would, in turn, be disruptive to the Inditex business for some time. Given the volatility in the market, we felt we had better opportunities for the capital elsewhere, and so we sold the position. |
| We eliminated the Fund’s position in Sumitomo Mitsui Financial Group, a Japanese financials firm. We decided to sell the position as the ongoing low interest environment in Japan has not been helpful to the financials sector. |
| Q | Were there any notable changes in the Fund’s weightings during the Reporting Period? |
| A | In this Fund, both sector weightings and country allocations are largely the result of our bottom-up stock selection process rather than any top-down macroeconomic views or regional, country, sector or industry bets. We seek to outpace the MSCI EAFE Index by overweighting stocks that we expect to outperform and underweighting those we think may lag. Consequently, changes in its sector or country weightings are generally the direct result of individual stock selection or of stock appreciation or depreciation. That said, during the Reporting Period, the Fund’s exposure to utilities, financials and consumer staples increased relative to the MSCI EAFE Index during the Reporting Period, while its relative exposure to health care, communication services and consumer discretionary decreased. The Fund’s position in cash also decreased during the Reporting Period. |
| From a country perspective, the Fund’s exposure to the U.K., Switzerland and Italy increased relative to the MSCI EAFE Index, while its relative exposure to Japan, Spain and Denmark decreased during the Reporting Period. |
| Q | How was the Fund positioned relative to the MSCI EAFE Index at the end of the Reporting Period? |
| A | At the end of the Reporting Period, the Fund had more exposure to the U.K., Switzerland, France, Spain, Italy, and Singapore relative to the MSCI EAFE Index and less exposure to Japan, Germany and Australia relative to the MSCI EAFE Index. At the end of the Reporting Period, the Fund had neutral exposure relative to the MSCI EAFE Index in the Netherlands, Denmark and Sweden and had no exposure to several other components of the MSCI EAFE Index, including Austria, Belgium, Finland, Hong Kong, Ireland, Israel, New Zealand, Norway and Portugal. The Fund also held a position in Taiwan, which is not a component of the MSCI EAFE Index. |
| From a sector allocation perspective, the Fund had overweight positions relative to the MSCI EAFE Index in real estate, utilities, financials and energy at the end of the Reporting Period. On the same date, the Fund had underweighted positions compared to the MSCI EAFE Index in communication services, information technology and industrials and rather neutral positions relative to the MSCI EAFE Index in consumer staples, health care and materials. The Fund had no exposure to the consumer discretionary sector at the end of the Reporting Period. |
| As always, we remained focused on individual stock selection, with sector and country positioning being a secondary, closely-monitored effect. |
34
FUND BASICS
International Equity Income Fund
as of October 31, 2020
| TOP TEN HOLDINGS AS OF 10/31/201,2 | ||||||||||
| Holding | % of Net Assets | Line of Business | Country | |||||||
| Nestle SA (Registered) | 5.6 | % | Food Products | Switzerland | ||||||
| AstraZeneca plc | 4.3 | Pharmaceuticals, Biotechnology & Life Sciences | United Kingdom | |||||||
| Rio Tinto plc | 4.3 | Materials | Australia | |||||||
| Vonovia SE | 4.1 | Real Estate | Germany | |||||||
| Zurich Insurance Group AG | 4.1 | Insurance | Switzerland | |||||||
| Enel SpA | 4.1 | Utilities | Italy | |||||||
| Taiwan Semiconductor Manufacturing Co. Ltd. | 4.0 | Semiconductors & Semiconductor Equipment | Taiwan | |||||||
| Schneider Electric SE | 4.0 | Capital Goods | France | |||||||
| Gecina SA (REIT) | 3.8 | Real Estate | France | |||||||
| Ferguson plc | 3.5 | Capital Goods | United States | |||||||
| 1 | The top 10 holdings may not be representative of the Fund’s future investments. |
| 2 | The line of business for each holding is reported at the industry or sub-industry level. |
| FUND VS. BENCHMARK SECTOR ALLOCATIONS3 |
| As of October 31, 2020 |
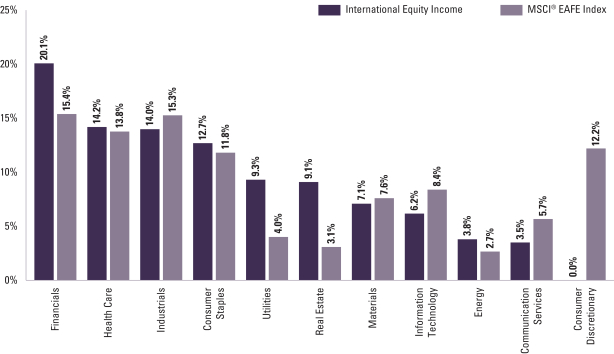
| 3 | The Fund is actively managed and, as such, its composition may differ over time. Consequently, the Fund’s overall sector allocations may differ from percentages contained in the graph above. The graph categorizes investments using Global Industry Classification Standard (“GICS”); however, the sector classifications used by the portfolio management team may differ from GICS. The percentage shown for each investment category reflects the value of investments in that category as a percentage of market value. |
For more information about your Fund, please refer to www.GSAMFUNDS.com. There, you can learn more about your Fund’s investment strategies, holdings, and performance.
35
GOLDMAN SACHS INTERNATIONAL EQUITY INCOME FUND
Performance Summary
October 31, 2020
The following graph shows the value, as of October 31, 2020, of a $1,000,000 investment made on November 1, 2010 in Institutional Shares at NAV. For comparative purposes, the performance of the Fund’s benchmark, the MSCI® EAFE Index (Net, USD, Unhedged), is shown. Performance reflects applicable fee waivers and/or expense limitations in effect during the periods shown and in their absence, performance would be reduced. Returns do not reflect the deduction of taxes that a shareholder would pay on Fund distributions or the redemption of Fund shares. The returns set forth below represent past performance. Past performance does not guarantee future results. The Fund’s investment return and principal value will fluctuate so that an investor’s shares, when redeemed, may be worth more or less than their original cost. Current performance may be lower or higher than the performance quoted below. Please visit our web site at www.GSAMFUNDS.com to obtain the most recent month-end returns.
| International Equity Income Fund’s 10 Year Performance |
Performance of a $1,000,000 Investment, with distributions reinvested, from November 1, 2010 through October 31, 2020.
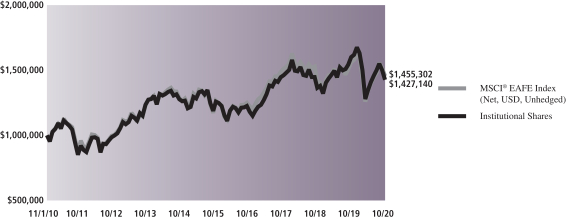
| Average Annual Total Return through October 31, 2020* | One Year | Five Years | Ten Years | Since Inception | ||||||||||
Class A | ||||||||||||||
Excluding sales charges | -11.23% | 2.13% | 3.21% | — | ||||||||||
Including sales charges | -16.12% | 0.99% | 2.63% | — | ||||||||||
| ||||||||||||||
Class C | ||||||||||||||
Excluding contingent deferred sales charges | -11.88% | 1.38% | 2.45% | — | ||||||||||
Including contingent deferred sales charges | -12.76% | 1.38% | 2.45% | — | ||||||||||
| ||||||||||||||
Institutional | -10.86% | 2.53% | 3.62% | — | ||||||||||
| ||||||||||||||
Investor | -10.99% | 2.40% | 3.53% | — | ||||||||||
| ||||||||||||||
Class R6 (Commenced February 26, 2016) | -10.93% | N/A | N/A | 5.45% | ||||||||||
| ||||||||||||||
Class R | -11.44% | 1.87% | 2.95% | — | ||||||||||
| ||||||||||||||
Class P (Commenced April 16, 2018) | -10.89% | N/A | N/A | -2.69% | ||||||||||
| ||||||||||||||
| * | These returns assume reinvestment of all distributions at NAV and reflect a maximum initial sales charge of 5.50% for Class A and the assumed contingent deferred sales charge for Class C Shares (1% if redeemed within 12 months of purchase). Because Institutional, Investor, Class R6, Class R and Class P Shares do not involve a sales charge, such a charge is not applied to their Average Annual Total Returns. |
36
FUND BASICS
Index Definition
The MSCI® EAFE Index (Net, USD, Unhedged) is a market capitalization-weighted composite of securities in 21 developed markets. The MSCI® EAFE Index approximates the minimum possible dividend reinvestment. The dividend is reinvested after deduction for withholding tax, applying the rate to non-resident individuals who do not benefit from double taxation treaties. MSCI® Inc. uses withholding tax rates applicable to Luxembourg holding companies, as Luxembourg applies the highest rates. The MSCI® EAFE Index is unmanaged and the figures for the MSCI® EAFE Index do not include any deduction for fees or expenses. It is not possible to invest directly in an index.
The MSCI® All Country Asia ex-Japan Index (Net, USD, Unhedged) is a free float adjusted market capitalization weighted index that is designed to measure the equity market performance of Asia, excluding Japan. As of November 30, 2020, the MSCI All Country Asia ex-Japan Index consisted of the following 11 developed and emerging market country indices: China, Hong Kong, India, Indonesia, Korea, Malaysia, Pakistan, Philippines, Singapore, Taiwan, and Thailand. The series of returns reflected by the MSCI All Country Asia ex-Japan Index approximates the minimum possible dividend reinvestment. The dividend is reinvested after deduction of withholding tax, applying the rate to non-resident individuals who do not benefit from double taxation treaties. MSCI Barra uses withholding tax rates applicable to Luxembourg holding companies, as Luxembourg applies the highest rates. It is not possible to invest directly in an index.
The MSCI China All Shares Index captures large and mid-cap representation across China A-shares, B-shares, H-shares, Red-chips, P-chips and foreign listings (e.g. ADRs). The index aims to reflect the opportunity set of China share classes listed in Hong Kong, Shanghai, Shenzhen and outside of China. It is based on the concept of the integrated MSCI China equity universe with China A-shares included. It is not possible to invest directly in an index.
The MSCI® Emerging Markets Index (Net, USD, Unhedged) is a free float-adjusted market capitalization index that is designed to measure equity market performance of emerging markets. As of November 30, 2020 the MSCI® Emerging Markets Index consists of the following 26 emerging market country indexes: Argentina, Brazil, Chile, China, Colombia, Czech Republic, Egypt, Greece, Hungary, India, Indonesia, Korea, Malaysia, Mexico, Pakistan, Peru, Philippines, Poland, Qatar, Russia, Saudi Arabia, South Africa, Taiwan, Thailand, Turkey and United Arab Emirates. For this Index, the dividend is reinvested after deduction of withholding tax, applying the rate to nonresident individuals who do not benefit from double taxation treaties. MSCI Barra uses withholding tax rates applicable to Luxembourg holding companies, as Luxembourg applies the highest rates. The MSCI Emerging Markets Index does not reflect any deductions of expenses associated with mutual funds such as management fees and other expenses. It is not possible to invest directly in an index.
It is not possible to invest directly in an unmanaged index.
37
GOLDMAN SACHS CHINA EQUITY FUND
October 31, 2020
| Shares | Description | Value | ||||||
| Common Stocks – 96.8% | ||||||||
| China – 92.5% | ||||||||
| 108,204 | Aier Eye Hospital Group Co. Ltd. Class A (Health Care Equipment & Services) | $ | 1,007,909 | |||||
| 158,400 | Alibaba Group Holding Ltd. (Retailing)* | 6,002,389 | ||||||
| 20,040 | Alibaba Group Holding Ltd. ADR (Retailing)* | 6,105,988 | ||||||
| 70,000 | Alibaba Health Information Technology Ltd. (Health Care Equipment & Services)* | 183,570 | ||||||
| 148,300 | Anhui Conch Cement Co. Ltd. Class H (Materials) | 927,689 | ||||||
| 270,256 | Bank of Ningbo Co. Ltd. Class A (Banks) | 1,373,187 | ||||||
| 175,300 | Budweiser Brewing Co. APAC Ltd. (Food Products)(a) | 516,979 | ||||||
| 815,000 | China Life Insurance Co. Ltd. Class H (Insurance) | 1,778,269 | ||||||
| 348,000 | China Mengniu Dairy Co. Ltd. (Food Products)* | 1,640,582 | ||||||
| 81,000 | China Merchants Bank Co. Ltd. Class A (Banks) | 482,020 | ||||||
| 455,500 | China Merchants Bank Co. Ltd. Class H (Banks) | 2,372,670 | ||||||
| 560,000 | China Resources Cement Holdings Ltd. (Materials) | 733,281 | ||||||
| 170,000 | China Resources Land Ltd. (Real Estate) | 695,243 | ||||||
| 34,725 | China Tourism Group Duty Free Corp. Ltd. Class A (Retailing) | 1,035,185 | ||||||
| 265,400 | China Vanke Co. Ltd. Class A (Real Estate) | 1,094,440 | ||||||
| 195,600 | China Vanke Co. Ltd. Class H (Real Estate) | 607,136 | ||||||
| 102,059 | CITIC Securities Co. Ltd. Class A (Diversified Financials) | 437,774 | ||||||
| 63,198 | Contemporary Amperex Technology Co. Ltd. Class A (Capital Goods) | 2,321,015 | ||||||
| 422,000 | Geely Automobile Holdings Ltd. (Automobiles & Components) | 867,150 | ||||||
| 40,965 | Gree Electric Appliances, Inc. of Zhuhai Class A (Consumer Durables & Apparel) | 359,141 | ||||||
| 86,800 | Hangzhou Robam Appliances Co. Ltd. Class A (Consumer Durables & Apparel) | 475,191 | ||||||
| 35,300 | Hangzhou Tigermed Consulting Co. Ltd. Class H (Pharmaceuticals, Biotechnology & Life Sciences)*(a) | 566,895 | ||||||
| 774,247 | Jiangsu Changshu Rural Commercial Bank Co. Ltd. Class A (Banks) | 783,907 | ||||||
| 110,645 | Jiangsu Hengrui Medicine Co. Ltd. Class A (Pharmaceuticals, Biotechnology & Life Sciences) | 1,471,637 | ||||||
| 71,536 | Juewei Food Co. Ltd. Class A (Food Products) | 866,221 | ||||||
| 387,000 | Kingdee International Software Group Co. Ltd. (Software & Services)* | 1,021,780 | ||||||
| 15,040 | Kweichow Moutai Co. Ltd. Class A (Food Products) | 3,757,700 | ||||||
| 176,174 | Luxshare Precision Industry Co. Ltd. Class A (Technology Hardware & Equipment) | 1,443,030 | ||||||
|
| |||||||
| Common Stocks – (continued) | ||||||||
| China – (continued) | ||||||||
| 99,200 | Meituan Class B (Retailing)* | 3,698,095 | ||||||
| 64,600 | Midea Group Co. Ltd. Class A (Consumer Durables & Apparel) | 753,895 | ||||||
| 386,000 | Minth Group Ltd. (Automobiles & Components) | 1,597,268 | ||||||
| 5,207 | Pinduoduo, Inc. ADR (Retailing)* | 468,526 | ||||||
| 277,960 | Ping An Bank Co. Ltd. Class A (Banks) | 737,636 | ||||||
| 10,200 | Ping An Insurance Group Co. of China Ltd. Class A (Insurance) | 118,703 | ||||||
| 216,000 | Ping An Insurance Group Co. of China Ltd. Class H (Insurance) | 2,233,370 | ||||||
| 325,201 | Sany Heavy Industry Co. Ltd. Class A (Capital Goods) | 1,263,788 | ||||||
| 70,100 | SF Holding Co. Ltd. Class A (Transportation) | 868,315 | ||||||
| 18,829 | Shanghai Putailai New Energy Technology Co. Ltd. Class A (Materials) | 314,319 | ||||||
| 186,452 | Shenzhen Inovance Technology Co. Ltd. Class A (Capital Goods) | 1,792,412 | ||||||
| 38,900 | Shenzhen Kangtai Biological Products Co. Ltd. Class A (Pharmaceuticals, Biotechnology & Life Sciences) | 1,055,949 | ||||||
| 17,700 | Shenzhen Mindray Bio-Medical Electronics Co. Ltd. Class A (Health Care Equipment & Services) | 1,024,582 | ||||||
| 104,174 | Shenzhen Sunway Communication Co. Ltd. Class A (Technology Hardware & Equipment) | 740,513 | ||||||
| 178,165 | Songcheng Performance Development Co. Ltd. Class A (Consumer Services) | 442,520 | ||||||
| 73,900 | Sunny Optical Technology Group Co. Ltd. (Technology Hardware & Equipment) | 1,226,970 | ||||||
| 15,571 | TAL Education Group ADR (Consumer Services)* | 1,034,849 | ||||||
| 123,600 | Tencent Holdings Ltd. (Media & Entertainment) | 9,443,739 | ||||||
| 619,000 | Topsports International Holdings Ltd. (Retailing)(a) | 848,767 | ||||||
| 52,000 | Tsingtao Brewery Co. Ltd. Class H (Food Products) | 430,881 | ||||||
| 270,706 | Universal Scientific Industrial Shanghai Co. Ltd. Class A (Technology Hardware & Equipment) | 886,363 | ||||||
| 431,000 | Weichai Power Co. Ltd. Class H (Capital Goods) | 817,298 | ||||||
| 84,540 | WuXi AppTec Co. Ltd. Class H (Pharmaceuticals, Biotechnology & Life Sciences)(a) | 1,351,651 | ||||||
| 47,000 | Wuxi Biologics Cayman, Inc. (Pharmaceuticals, Biotechnology & Life Sciences)*(a) | 1,319,935 | ||||||
| 786,000 | Xinyi Solar Holdings Ltd. (Semiconductors & Semiconductor Equipment) | 1,435,901 | ||||||
| 41,224 | XPeng, Inc. ADR (Automobiles & Components)* | 798,921 | ||||||
|
| |||||||
| 38 | The accompanying notes are an integral part of these financial statements. |
GOLDMAN SACHS CHINA EQUITY FUND
| Shares | Description | Value | ||||||
| Common Stocks – (continued) | ||||||||
| China – (continued) | ||||||||
| 148,278 | Yantai Jereh Oilfield Services Group Co. Ltd. Class A (Energy) | $ | 594,498 | |||||
| 36,480 | Yifeng Pharmacy Chain Co. Ltd. Class A (Food & Staples Retailing) | 555,633 | ||||||
| 71,320 | Yunnan Energy New Material Co. Ltd. (Materials) | 1,066,731 | ||||||
| 456,419 | Zhejiang Sanhua Intelligent Controls Co. Ltd. Class A (Capital Goods) | 1,672,663 | ||||||
|
| |||||||
| 81,522,669 | ||||||||
|
| |||||||
| Hong Kong – 2.8% | ||||||||
| 23,901 | Hong Kong Exchanges & Clearing Ltd. (Diversified Financials) | 1,145,305 | ||||||
| 628,500 | Sino Biopharmaceutical Ltd. (Pharmaceuticals, Biotechnology & Life Sciences) | 636,667 | ||||||
| 53,000 | Techtronic Industries Co. Ltd. (Capital Goods) | 713,875 | ||||||
|
| |||||||
| 2,495,847 | ||||||||
|
| |||||||
| Taiwan – 1.5% | ||||||||
| 54,000 | MediaTek, Inc. (Semiconductors & Semiconductor Equipment) | 1,283,595 | ||||||
|
| |||||||
| Vietnam – 0.0% | ||||||||
| 7 | Vietnam Dairy Products JSC (Food Products) | 33 | ||||||
|
| |||||||
| TOTAL COMMON STOCKS | ||||||||
| (Cost $58,073,146) | $ | 85,302,144 | ||||||
|
| |||||||
| Shares | Dividend Rate | Value | ||||
| Investment Company(b) – 2.5% | ||||||
Goldman Sachs Financial Square Government Fund – Institutional Shares |
| |||||
| 2,236,989 | 0.028% | $ | 2,236,989 | |||
| (Cost $2,236,989) | ||||||
| ||||||
| TOTAL INVESTMENTS – 99.3% |
| |||||
| (Cost $60,310,135) | $ | 87,539,133 | ||||
| ||||||
OTHER ASSETS IN EXCESS OF LIABILITIES – 0.7% | 613,130 | |||||
| ||||||
| NET ASSETS – 100.0% | $ | 88,152,263 | ||||
| ||||||
| The percentage shown for each investment category reflects the value of investments in that category as a percentage of net assets. | ||
* | Security is currently in default and/or non-income producing. | |
(a) | Exempt from registration under Rule 144A of the Securities Act of 1933. | |
(b) | Represents an Affiliated Issuer. | |
| ||
Investment Abbreviation: | ||
ADR | —American Depositary Receipt | |
| ||
| The accompanying notes are an integral part of these financial statements. | 39 |
GOLDMAN SACHS EMERGING MARKETS EQUITY FUND
Schedule of Investments
October 31, 2020
| Shares | Description | Value | ||||||
| Common Stocks – 98.3% | ||||||||
| Argentina – 2.0% | ||||||||
| 40,885 | MercadoLibre, Inc. (Retailing)* | $ | 49,636,434 | |||||
|
| |||||||
| Brazil – 3.7% | ||||||||
| 3,311,000 | Atacadao SA (Food & Staples Retailing)* | 10,646,302 | ||||||
| 1,058,800 | B3 SA – Brasil Bolsa Balcao (Diversified Financials) | 9,420,044 | ||||||
| 304,430 | Banco Bradesco SA ADR (Banks) | 1,065,505 | ||||||
| 3,006,768 | Banco Bradesco SA (Preference) (Banks)(a) | 10,564,129 | ||||||
| 4,774,462 | Banco Pan SA (Preference) (Banks)(a) | 6,207,354 | ||||||
| 5,121,024 | Boa Vista Servicos SA (Commercial & Professional Services)* | 12,110,997 | ||||||
| 2,234,100 | Fleury SA (Health Care Equipment & Services) | 10,648,861 | ||||||
| 1,913,000 | Iochpe Maxion SA (Capital Goods) | 4,427,477 | ||||||
| 195,670 | Pagseguro Digital Ltd. Class A (Software & Services)* | 7,163,479 | ||||||
| 1,563,500 | Qualicorp Consultoria e Corretora de Seguros SA (Health Care Equipment & Services) | 8,673,168 | ||||||
| 1,177,800 | TOTVS SA (Software & Services) | 5,542,154 | ||||||
| 2,895,783 | Wiz Solucoes e Corretagem de Seguros SA (Insurance) | 4,511,768 | ||||||
|
| |||||||
| 90,981,238 | ||||||||
|
| |||||||
| China – 39.9% | ||||||||
| 725,802 | Alibaba Group Holding Ltd. ADR (Retailing)* | 221,144,611 | ||||||
| 2,281,000 | Anhui Conch Cement Co. Ltd. Class H (Materials) | 14,268,776 | ||||||
| 1,580,000 | ANTA Sports Products Ltd. (Consumer Durables & Apparel) | 17,539,821 | ||||||
| 3,272,000 | China Mengniu Dairy Co. Ltd. (Food Products)* | 15,425,246 | ||||||
| 8,161,000 | China Merchants Bank Co. Ltd. Class H (Banks) | 42,510,114 | ||||||
| 848,232 | Contemporary Amperex Technology Co. Ltd. Class A (Capital Goods) | 31,152,232 | ||||||
| 1,119,977 | Gree Electric Appliances, Inc. of Zhuhai Class A (Consumer Durables & Apparel) | 9,818,860 | ||||||
| 2,529,578 | Hangzhou Robam Appliances Co. Ltd. Class A (Consumer Durables & Apparel) | 13,848,305 | ||||||
| 527,311 | Huami Corp. ADR (Technology Hardware & Equipment)* | 6,158,993 | ||||||
| 284,281 | Kweichow Moutai Co. Ltd. Class A (Food Products) | 71,026,784 | ||||||
| 1,552,900 | Meituan Class B (Retailing)* | 57,890,850 | ||||||
| 3,958,000 | Minth Group Ltd. (Automobiles & Components) | 16,378,199 | ||||||
| 98,398 | New Oriental Education & Technology Group, Inc. ADR (Consumer Services)* | 15,781,071 | ||||||
| 4,915,000 | Nexteer Automotive Group Ltd. (Automobiles & Components) | 4,104,529 | ||||||
|
| |||||||
| Common Stocks – (continued) | ||||||||
| China – (continued) | ||||||||
| 4,876,000 | Ping An Insurance Group Co. of China Ltd. Class H (Insurance) | 50,390,046 | ||||||
| 1,004,369 | SF Holding Co. Ltd. Class A (Transportation) | 12,440,927 | ||||||
| 372,497 | Silergy Corp. (Semiconductors & Semiconductor Equipment) | 22,965,513 | ||||||
| 1,174,400 | Sunny Optical Technology Group Co. Ltd. (Technology Hardware & Equipment) | 19,498,694 | ||||||
| 366,631 | TAL Education Group ADR (Consumer Services)* | 24,366,296 | ||||||
| 2,948,400 | Tencent Holdings Ltd. (Media & Entertainment) | 225,274,430 | ||||||
| 7,527,000 | Topsports International Holdings Ltd. (Retailing)(b) | 10,320,957 | ||||||
| 1,534,312 | WuXi AppTec Co. Ltd. Class H (Pharmaceuticals, Biotechnology & Life Sciences)(b) | 24,531,040 | ||||||
| 12,470,000 | Xinyi Solar Holdings Ltd. (Semiconductors & Semiconductor Equipment) | 22,780,777 | ||||||
| 602,037 | XPeng, Inc. ADR (Automobiles & Components)* | 11,667,477 | ||||||
| 4,321,002 | Zhejiang Sanhua Intelligent Controls Co. Ltd. Class A (Capital Goods) | 15,835,410 | ||||||
|
| |||||||
| 977,119,958 | ||||||||
|
| |||||||
| Czech Republic – 0.4% | ||||||||
| 4,310,014 | Moneta Money Bank A/S (Banks)(b) | 9,784,158 | ||||||
|
| |||||||
| Greece – 1.0% | ||||||||
| 979,358 | Hellenic Exchanges – Athens Stock Exchange SA (Diversified Financials)* | 2,916,768 | ||||||
| 668,719 | JUMBO SA (Retailing) | 9,372,992 | ||||||
| 1,222,711 | Sarantis SA (Household & Personal Products) | 12,033,057 | ||||||
|
| |||||||
| 24,322,817 | ||||||||
|
| |||||||
| Hong Kong – 4.2% | ||||||||
| 3,718,800 | AIA Group Ltd. (Insurance) | 35,392,476 | ||||||
| 679,313 | Hong Kong Exchanges & Clearing Ltd. (Diversified Financials) | 32,551,807 | ||||||
| 14,746,500 | Sino Biopharmaceutical Ltd. (Pharmaceuticals, Biotechnology & Life Sciences) | 14,938,124 | ||||||
| 1,444,000 | Techtronic Industries Co. Ltd. (Capital Goods) | 19,449,730 | ||||||
|
| |||||||
| 102,332,137 | ||||||||
|
| |||||||
| India – 11.5% | ||||||||
| 28,850 | Abbott India Ltd. (Pharmaceuticals, Biotechnology & Life Sciences) | 5,953,491 | ||||||
| 400,891 | AIA Engineering Ltd. (Capital Goods) | 9,178,704 | ||||||
| 505,742 | Amber Enterprises India Ltd. (Consumer Durables & Apparel) | 14,878,103 | ||||||
|
| |||||||
| 40 | The accompanying notes are an integral part of these financial statements. |
GOLDMAN SACHS EMERGING MARKETS EQUITY FUND
| Shares | Description | Value | ||||||
| Common Stocks – (continued) | ||||||||
| India – (continued) | ||||||||
| 97,517 | Atul Ltd. (Materials) | $ | 7,901,807 | |||||
| 487,147 | Avenue Supermarts Ltd. (Food & Staples Retailing)*(b) | 14,727,774 | ||||||
| 2,019,597 | Bharti Airtel Ltd. (Telecommunication Services) | 11,808,648 | ||||||
| 345,552 | Computer Age Management Services Ltd. (Software & Services)* | 6,047,014 | ||||||
| 2,146,286 | Crompton Greaves Consumer Electricals Ltd. (Consumer Durables & Apparel)* | 8,667,235 | ||||||
| 334,649 | Divi’s Laboratories Ltd. (Pharmaceuticals, Biotechnology & Life Sciences) | 14,181,731 | ||||||
| 826,579 | ICICI Lombard General Insurance Co. Ltd. (Insurance)*(b) | 13,776,913 | ||||||
| 487,330 | Info Edge India Ltd. (Media & Entertainment) | 23,326,766 | ||||||
| 1,667,757 | Infosys Ltd. (Software & Services) | 23,894,209 | ||||||
| 403,559 | Infosys Ltd. ADR (Software & Services) | 5,758,787 | ||||||
| 1,303,470 | Kotak Mahindra Bank Ltd. (Banks)* | 27,201,527 | ||||||
| 257,852 | Larsen & Toubro Infotech Ltd. (Software & Services)(b) | 10,174,361 | ||||||
| 220,964 | Maruti Suzuki India Ltd. (Automobiles & Components) | 20,753,784 | ||||||
| 639,054 | Navin Fluorine International Ltd. (Materials) | 19,312,449 | ||||||
| 2,449,458 | Prestige Estates Projects Ltd. (Real Estate) | 8,272,503 | ||||||
| 800,908 | Route Mobile Ltd. (Software & Services)* | 10,777,121 | ||||||
| 838,224 | SBI Life Insurance Co. Ltd. (Insurance)*(b) | 8,695,397 | ||||||
| 731,874 | Tata Consumer Products Ltd. (Food Products) | 4,863,031 | ||||||
| 342,202 | TeamLease Services Ltd. (Commercial & Professional Services)* | 10,282,824 | ||||||
|
| |||||||
| 280,434,179 | ||||||||
|
| |||||||
| Indonesia – 2.1% | ||||||||
| 14,904,800 | Bank Central Asia Tbk. PT (Banks) | 29,327,516 | ||||||
| 242,783,900 | BFI Finance Indonesia Tbk. PT (Diversified Financials) | 6,311,698 | ||||||
| 11,974,200 | Map Aktif Adiperkasa PT (Retailing)* | 1,681,046 | ||||||
| 203,560,200 | Pakuwon Jati Tbk. PT (Real Estate)* | 5,690,613 | ||||||
| 12,387,700 | Semen Indonesia Persero Tbk. PT (Materials) | 8,024,903 | ||||||
|
| |||||||
| 51,035,776 | ||||||||
|
| |||||||
| Mexico – 1.5% | ||||||||
| 2,216,700 | Arca Continental SAB de CV (Food Products) | 9,651,003 | ||||||
|
| |||||||
| Common Stocks – (continued) | ||||||||
| Mexico – (continued) | ||||||||
| 3,605,910 | Bolsa Mexicana de Valores SAB de CV (Diversified Financials) | 7,330,308 | ||||||
| 3,323,199 | Kimberly-Clark de Mexico SAB de CV Class A (Household & Personal Products) | 4,939,795 | ||||||
| 5,722,700 | Wal-Mart de Mexico SAB de CV (Food & Staples Retailing) | 13,826,857 | ||||||
|
| |||||||
| 35,747,963 | ||||||||
|
| |||||||
| Peru – 0.8% | ||||||||
| 2,416,454 | Alicorp SAA (Food Products) | 4,678,517 | ||||||
| 5,276,613 | Banco BBVA Peru SA (Banks) | 3,006,451 | ||||||
| 30,896 | Credicorp Ltd. (Banks) | 3,543,153 | ||||||
| 425,560 | Intercorp Financial Services, Inc. (Banks) | 8,843,298 | ||||||
|
| |||||||
| 20,071,419 | ||||||||
|
| |||||||
| Philippines – 0.4% | ||||||||
| 2,988,300 | Jollibee Foods Corp. (Consumer Services) | 10,480,414 | ||||||
|
| |||||||
| Poland – 1.0% | ||||||||
| 47,866 | Allegro.eu SA (Retailing)*(b) | 972,773 | ||||||
| 326,004 | Dino Polska SA (Food & Staples Retailing)*(b) | 17,923,516 | ||||||
| 1,014,240 | Powszechna Kasa Oszczednosci Bank Polski SA (Banks)* | 4,865,515 | ||||||
|
| |||||||
| 23,761,804 | ||||||||
|
| |||||||
| Russia – 3.2% | ||||||||
| 9,287,200 | Detsky Mir PJSC (Retailing)(b) | 12,879,001 | ||||||
| 334,779 | LUKOIL PJSC (Energy) | 17,114,264 | ||||||
| 3,424,947 | Moscow Exchange MICEX-RTS PJSC (Diversified Financials) | 5,784,508 | ||||||
| 7,800,843 | Sberbank of Russia PJSC (Banks) | 19,770,909 | ||||||
| 413,770 | Yandex NV Class A (Media & Entertainment)* | 23,820,739 | ||||||
|
| |||||||
| 79,369,421 | ||||||||
|
| |||||||
| Singapore – 0.3% | ||||||||
| 3,171,593 | Nanofilm Technologies International Ltd. (Capital Goods)* | 6,756,716 | ||||||
|
| |||||||
| South Africa – 1.5% | ||||||||
| 310,633 | Bid Corp. Ltd. (Food & Staples Retailing) | 4,276,745 | ||||||
| 708,270 | Clicks Group Ltd. (Food & Staples Retailing) | 10,269,072 | ||||||
| 1,387,591 | JSE Ltd. (Diversified Financials) | 9,268,370 | ||||||
| 350,472 | Santam Ltd. (Insurance) | 5,287,112 | ||||||
| 6,796,685 | Transaction Capital Ltd. (Diversified Financials) | 8,300,373 | ||||||
|
| |||||||
| 37,401,672 | ||||||||
|
| |||||||
| South Korea – 12.2% | ||||||||
| 211,955 | Fila Holdings Corp. (Consumer Durables & Apparel) | 7,232,280 | ||||||
| 373,363 | Hankook Tire & Technology Co. Ltd. (Automobiles & Components) | 10,459,475 | ||||||
|
| |||||||
| The accompanying notes are an integral part of these financial statements. | 41 |
GOLDMAN SACHS EMERGING MARKETS EQUITY FUND
Schedule of Investments (continued)
October 31, 2020
| Shares | Description | Value | ||||||
| Common Stocks – (continued) | ||||||||
| South Korea – (continued) | ||||||||
| 266,687 | LG Electronics, Inc. (Consumer Durables & Apparel) | $ | 19,825,371 | |||||
| 144,379 | NAVER Corp. (Media & Entertainment) | 36,942,397 | ||||||
| 48,109 | NCSoft Corp. (Media & Entertainment) | 33,054,932 | ||||||
| 170,958 | Orion Corp. (Food Products) | 16,380,981 | ||||||
| 40,588 | Pearl Abyss Corp. (Media & Entertainment)* | 7,218,366 | ||||||
| 109,967 | Samsung Electro-Mechanics Co. Ltd. (Technology Hardware & Equipment) | 13,070,469 | ||||||
| 2,296,932 | Samsung Electronics Co. Ltd. (Technology Hardware & Equipment) | 115,456,730 | ||||||
| 537,543 | SK Hynix, Inc. (Semiconductors & Semiconductor Equipment) | 38,134,847 | ||||||
|
| |||||||
| 297,775,848 | ||||||||
|
| |||||||
| Taiwan – 10.8% | ||||||||
| 2,773,680 | Chailease Holding Co. Ltd. (Diversified Financials) | 13,474,230 | ||||||
| 13,901,203 | FIT Hon Teng Ltd. (Technology Hardware & Equipment)*(b) (c) | 5,452,686 | ||||||
| 144,000 | Largan Precision Co. Ltd. (Technology Hardware & Equipment) | 15,292,645 | ||||||
| 323,000 | momo.com, Inc. (Retailing) | 7,729,843 | ||||||
| 713,000 | Nien Made Enterprise Co. Ltd. (Consumer Durables & Apparel) | 8,038,458 | ||||||
| 119,592 | Sea Ltd. ADR (Media & Entertainment)* | 18,859,658 | ||||||
| 10,908,883 | Taiwan Semiconductor Manufacturing Co. Ltd. (Semiconductors & Semiconductor Equipment) | 165,047,854 | ||||||
| 1,417,000 | Taiwan Union Technology Corp. (Technology Hardware & Equipment) | 4,721,130 | ||||||
| 2,207,390 | Tong Hsing Electronic Industries Ltd. (Technology Hardware & Equipment) | 9,743,416 | ||||||
| 1,539,000 | Win Semiconductors Corp. (Semiconductors & Semiconductor Equipment) | 16,789,414 | ||||||
|
| |||||||
| 265,149,334 | ||||||||
|
| |||||||
| Thailand – 0.4% | ||||||||
| 6,579,100 | Airports of Thailand PCL (Transportation) | 10,908,425 | ||||||
|
| |||||||
| Turkey – 0.4% | ||||||||
| 1,062,973 | Mavi Giyim Sanayi ve Ticaret A/S Class B (Consumer Durables & Apparel)*(b) | 4,782,395 | ||||||
| 3,414,508 | Sok Marketler Ticaret A/S (Food & Staples Retailing)* | 4,607,634 | ||||||
|
| |||||||
| 9,390,029 | ||||||||
|
| |||||||
| Common Stocks – (continued) | ||||||||
| Vietnam – 1.0% | ||||||||
| 5,017,083 | Vietnam Dairy Products JSC (Food Products) | 23,441,348 | ||||||
|
| |||||||
| TOTAL COMMON STOCKS | ||||||||
| (Cost $1,879,984,346) | $ | 2,405,901,090 | ||||||
|
| |||||||
| Exchange-Traded Funds – 1.5% | ||||||||
| 388,120 | iShares MSCI Emerging Markets ETF | $ | 17,352,845 | |||||
| 536,820 | iShares, Inc. iShares ESG Aware MSCI EM ETF(c) | 19,454,357 | ||||||
|
| |||||||
| TOTAL EXCHANGE-TRADED FUNDS | ||||||||
| (Cost $37,148,116) | $ | 36,807,202 | ||||||
|
| |||||||
| Shares | Dividend Rate | Value | ||||
| Investment Company(d) – 0.5% | ||||||
Goldman Sachs Financial Square Government Fund – Institutional Shares |
| |||||
| 12,529,663 | 0.028% | $ | 12,529,663 | |||
| (Cost $12,529,663) | ||||||
| ||||||
| TOTAL INVESTMENTS BEFORE SECURITIES LENDING REINVESTMENT VEHICLE |
| |||||
| (Cost $1,929,662,125) | $ | 2,455,237,955 | ||||
| ||||||
| Securities Lending Reinvestment Vehicle(d) – 0.8% | ||||||
Goldman Sachs Financial Square Government Fund – Institutional Shares |
| |||||
| 20,507,250 | 0.028% | $ | 20,507,250 | |||
| (Cost $20,507,250) | ||||||
| ||||||
| TOTAL INVESTMENTS – 101.1% |
| |||||
| (Cost $1,950,169,375) | $ | 2,475,745,205 | ||||
| ||||||
| LIABILITIES IN EXCESS OF OTHER ASSETS – (1.1)% | (25,867,387 | ) | ||||
| ||||||
| NET ASSETS – 100.0% | $ | 2,449,877,818 | ||||
| ||||||
| The percentage shown for each investment category reflects the value of investments in that category as a percentage of net assets. | ||
* | Security is currently in default and/or non-income producing. | |
(a) | Preference Shares are a special type of equity investment that shares in the earnings of the company, has limited voting rights, and receives a greater dividend than applicable Common Shares. | |
(b) | Exempt from registration under Rule 144A of the Securities Act of 1933. | |
(c) | All or a portion of security is on loan. | |
(d) | Represents an Affiliated Issuer. | |
| ||
Investment Abbreviation: | ||
ADR | —American Depositary Receipt | |
| ||
| 42 | The accompanying notes are an integral part of these financial statements. |
GOLDMAN SACHS ESG EMERGING MARKETS EQUITY FUND
Schedule of Investments
October 31, 2020
| Shares | Description | Value | ||||||
| Common Stocks – 97.6% | ||||||||
| Argentina – 2.9% | ||||||||
| 224 | MercadoLibre, Inc. (Retailing)* | $ | 271,947 | |||||
|
| |||||||
| Brazil – 3.2% | ||||||||
| 23,200 | Atacadao SA (Food & Staples Retailing)* | 74,598 | ||||||
| 5,900 | B3 SA – Brasil Bolsa Balcao (Diversified Financials) | 52,492 | ||||||
| 18,283 | Banco Bradesco SA ADR (Banks) | 63,990 | ||||||
| 8,100 | Fleury SA (Health Care Equipment & Services) | 38,609 | ||||||
| 1,697 | Pagseguro Digital Ltd. Class A (Software & Services)* | 62,127 | ||||||
|
| |||||||
| 291,816 | ||||||||
|
| |||||||
| China – 39.1% | ||||||||
| 2,943 | Alibaba Group Holding Ltd. ADR (Retailing)* | 896,704 | ||||||
| 7,000 | ANTA Sports Products Ltd. (Consumer Durables & Apparel) | 77,708 | ||||||
| 18,000 | China Mengniu Dairy Co. Ltd. (Food Products)* | 84,858 | ||||||
| 36,500 | China Merchants Bank Co. Ltd. Class H (Banks) | 190,126 | ||||||
| 4,300 | Contemporary Amperex Technology Co. Ltd. Class A (Capital Goods) | 157,922 | ||||||
| 4,500 | Gree Electric Appliances, Inc. of Zhuhai Class A (Consumer Durables & Apparel) | 39,452 | ||||||
| 9,600 | Hangzhou Robam Appliances Co. Ltd. Class A (Consumer Durables & Apparel) | 52,556 | ||||||
| 6,900 | Meituan Class B (Retailing)* | 257,226 | ||||||
| 621 | New Oriental Education & Technology Group, Inc. ADR (Consumer Services)* | 99,596 | ||||||
| 20,000 | Nexteer Automotive Group Ltd. (Automobiles & Components) | 16,702 | ||||||
| 21,500 | Ping An Insurance Group Co. of China Ltd. Class H (Insurance) | 222,303 | ||||||
| 4,100 | SF Holding Co. Ltd. Class A (Transportation) | 50,786 | ||||||
| 1,000 | Silergy Corp. (Semiconductors & Semiconductor Equipment) | 61,653 | ||||||
| 6,600 | Sunny Optical Technology Group Co. Ltd. (Technology Hardware & Equipment) | 109,580 | ||||||
| 1,454 | TAL Education Group ADR (Consumer Services)* | 96,633 | ||||||
| 11,100 | Tencent Holdings Ltd. (Media & Entertainment) | 848,103 | ||||||
| 33,000 | Topsports International Holdings Ltd. (Retailing)(a) | 45,249 | ||||||
| 6,424 | WuXi AppTec Co. Ltd. Class H (Pharmaceuticals, Biotechnology & Life Sciences)(a) | 102,709 | ||||||
| 60,000 | Xinyi Solar Holdings Ltd. (Semiconductors & Semiconductor Equipment) | 109,611 | ||||||
| 2,251 | XPeng, Inc. ADR (Automobiles & Components)* | 43,624 | ||||||
| 14,950 | Zhejiang Sanhua Intelligent Controls Co. Ltd. Class A (Capital Goods) | 54,788 | ||||||
|
| |||||||
| 3,617,889 | ||||||||
|
| |||||||
| Common Stocks – (continued) | ||||||||
| Czech Republic – 0.5% | ||||||||
| 22,231 | Moneta Money Bank A/S (Banks)(a) | 50,467 | ||||||
|
| |||||||
| Greece – 0.9% | ||||||||
| 6,245 | JUMBO SA (Retailing) | 87,532 | ||||||
|
| |||||||
| Hong Kong – 5.2% | ||||||||
| 19,800 | AIA Group Ltd. (Insurance) | 188,440 | ||||||
| 2,967 | Hong Kong Exchanges & Clearing Ltd. (Diversified Financials) | 142,175 | ||||||
| 69,000 | Sino Biopharmaceutical Ltd. (Pharmaceuticals, Biotechnology & Life Sciences) | 69,897 | ||||||
| 6,000 | Techtronic Industries Co. Ltd. (Capital Goods) | 80,816 | ||||||
|
| |||||||
| 481,328 | ||||||||
|
| |||||||
| India – 10.6% | ||||||||
| 2,095 | Avenue Supermarts Ltd. (Food & Staples Retailing)*(a) | 63,338 | ||||||
| 9,051 | Bharti Airtel Ltd. (Telecommunication Services) | 52,921 | ||||||
| 1,273 | Divi’s Laboratories Ltd. (Pharmaceuticals, Biotechnology & Life Sciences) | 53,947 | ||||||
| 5,610 | ICICI Lombard General Insurance Co. Ltd. (Insurance)*(a) | 93,504 | ||||||
| 2,383 | Info Edge India Ltd. (Media & Entertainment) | 114,066 | ||||||
| 8,862 | Infosys Ltd. (Software & Services) | 126,967 | ||||||
| 4,438 | Infosys Ltd. ADR (Software & Services) | 63,330 | ||||||
| 7,325 | Kotak Mahindra Bank Ltd. (Banks)* | 152,862 | ||||||
| 1,859 | Larsen & Toubro Infotech Ltd. (Software & Services)(a) | 73,353 | ||||||
| 1,410 | Maruti Suzuki India Ltd. (Automobiles & Components) | 132,433 | ||||||
| 5,163 | SBI Life Insurance Co. Ltd. (Insurance)*(a) | 53,559 | ||||||
|
| |||||||
| 980,280 | ||||||||
|
| |||||||
| Indonesia – 1.5% | ||||||||
| 69,700 | Bank Central Asia Tbk. PT (Banks) | 137,146 | ||||||
|
| |||||||
| Mexico – 2.1% | ||||||||
| 10,800 | Arca Continental SAB de CV (Food Products) | 47,021 | ||||||
| 21,865 | Kimberly-Clark de Mexico SAB de CV Class A (Household & Personal Products) | 32,501 | ||||||
| 46,300 | Wal-Mart de Mexico SAB de CV (Food & Staples Retailing) | 111,867 | ||||||
|
| |||||||
| 191,389 | ||||||||
|
| |||||||
| Peru – 0.8% | ||||||||
| 336 | Credicorp Ltd. (Banks) | 38,532 | ||||||
| 1,753 | Intercorp Financial Services, Inc. (Banks) | 36,410 | ||||||
|
| |||||||
| 74,942 | ||||||||
|
| |||||||
| Philippines – 0.3% | ||||||||
| 8,820 | Jollibee Foods Corp. (Consumer Services) | 30,933 | ||||||
|
| |||||||
| The accompanying notes are an integral part of these financial statements. | 43 |
GOLDMAN SACHS ESG EMERGING MARKETS EQUITY FUND
Schedule of Investments (continued)
October 31, 2020
| Shares | Description | Value | ||||||
| Common Stocks – (continued) | ||||||||
| Poland – 0.4% | ||||||||
| 178 | Allegro.eu SA (Retailing)*(a) | $ | 3,618 | |||||
| 7,470 | Powszechna Kasa Oszczednosci Bank Polski SA (Banks)* | 35,835 | ||||||
|
| |||||||
| 39,453 | ||||||||
|
| |||||||
| Russia – 3.6% | ||||||||
| 28,650 | Moscow Exchange MICEX-RTS PJSC (Diversified Financials) | 48,388 | ||||||
| 11,875 | Sberbank of Russia PJSC ADR (Banks) | 120,056 | ||||||
| 2,800 | Yandex NV Class A (Media & Entertainment)* | 161,196 | ||||||
|
| |||||||
| 329,640 | ||||||||
|
| |||||||
| South Africa – 1.6% | ||||||||
| 2,286 | Bid Corp. Ltd. (Food & Staples Retailing) | 31,473 | ||||||
| 5,096 | Clicks Group Ltd. (Food & Staples Retailing) | 73,886 | ||||||
| 2,646 | Santam Ltd. (Insurance) | 39,917 | ||||||
|
| |||||||
| 145,276 | ||||||||
|
| |||||||
| South Korea – 12.3% | ||||||||
| 1,216 | LG Electronics, Inc. (Consumer Durables & Apparel) | 90,397 | ||||||
| 698 | NAVER Corp. (Media & Entertainment) | 178,598 | ||||||
| 199 | NCSoft Corp. (Media & Entertainment) | 136,730 | ||||||
| 751 | Orion Corp. (Food Products) | 71,960 | ||||||
| 196 | Pearl Abyss Corp. (Media & Entertainment)* | 34,857 | ||||||
| 379 | Samsung Electro-Mechanics Co. Ltd. (Technology Hardware & Equipment) | 45,047 | ||||||
| 8,530 | Samsung Electronics Co. Ltd. (Technology Hardware & Equipment) | 428,766 | ||||||
| 2,074 | SK Hynix, Inc. (Semiconductors & Semiconductor Equipment) | 147,135 | ||||||
|
| |||||||
| 1,133,490 | ||||||||
|
| |||||||
| Taiwan – 11.6% | ||||||||
| 15,440 | Chailease Holding Co. Ltd. (Diversified Financials) | 75,006 | ||||||
| 1,000 | Largan Precision Co. Ltd. (Technology Hardware & Equipment) | 106,199 | ||||||
| 3,000 | Nien Made Enterprise Co. Ltd. (Consumer Durables & Apparel) | 33,822 | ||||||
| 680 | Sea Ltd. ADR (Media & Entertainment)* | 107,236 | ||||||
| 45,000 | Taiwan Semiconductor Manufacturing Co. Ltd. (Semiconductors & Semiconductor Equipment) | 680,835 | ||||||
| 6,000 | Win Semiconductors Corp. (Semiconductors & Semiconductor Equipment) | 65,456 | ||||||
|
| |||||||
| 1,068,554 | ||||||||
|
| |||||||
| Thailand – 0.5% | ||||||||
| 27,000 | Airports of Thailand PCL (Transportation) | 44,767 | ||||||
|
| |||||||
| Common Stocks – (continued) | ||||||||
| Turkey – 0.5% | ||||||||
| 31,596 | Sok Marketler Ticaret A/S (Food & Staples Retailing)* | 42,636 | ||||||
|
| |||||||
| TOTAL COMMON STOCKS | ||||||||
| (Cost $7,101,669) | $ | 9,019,485 | ||||||
|
| |||||||
| Shares | Dividend Rate | Value | ||||
| Investment Company(b) – 1.3% | ||||||
Goldman Sachs Financial Square Government Fund – Institutional Shares |
| |||||
| 122,590 | 0.028% | $ | 122,590 | |||
| (Cost $122,590) | ||||||
| ||||||
| TOTAL INVESTMENTS – 98.9% |
| |||||
| (Cost $7,224,259) | $ | 9,142,075 | ||||
| ||||||
| OTHER ASSETS IN EXCESS OF LIABILITIES – 1.1% | 105,376 | |||||
| ||||||
| NET ASSETS – 100.0% | $ | 9,247,451 | ||||
| ||||||
| The percentage shown for each investment category reflects the value of investments in that category as a percentage of net assets. | ||
* | Security is currently in default and/or non-income producing. | |
(a) | Exempt from registration under Rule 144A of the Securities Act of 1933. | |
(b) | Represents an Affiliated Issuer. | |
| ||
Investment Abbreviation: | ||
ADR | —American Depositary Receipt | |
| ||
| 44 | The accompanying notes are an integral part of these financial statements. |
GOLDMAN SACHS IMPRINT EMERGING MARKETS OPPORTUNITIES FUND
Schedule of Investments
October 31, 2020
| Shares | Description | Value | ||||||
| Common Stocks – 88.8% | ||||||||
| Bangladesh – 1.5% | ||||||||
| 653,285 | BRAC Bank Ltd. (Banks) | $ | 321,738 | |||||
|
| |||||||
| Brazil – 1.7% | ||||||||
| 112,600 | Atacadao SA (Food & Staples Retailing)* | 362,058 | ||||||
|
| |||||||
| China – 28.7% | ||||||||
| 5,747 | Alibaba Group Holding Ltd. ADR (Retailing)* | 1,751,053 | ||||||
| 132,000 | Alibaba Health Information Technology Ltd. (Health Care Equipment & Services)* | 346,161 | ||||||
| 14,627 | Baozun, Inc. ADR (Retailing)*(a) | 535,202 | ||||||
| 275,000 | Flat Glass Group Co. Ltd. Class H (Semiconductors & Semiconductor Equipment) | 821,574 | ||||||
| 162,800 | Haier Smart Home Co. Ltd. Class A (Consumer Durables & Apparel) | 605,768 | ||||||
| 116,500 | Li Ning Co. Ltd. (Consumer Durables & Apparel) | 607,191 | ||||||
| 104,000 | Minth Group Ltd. (Automobiles & Components) | 430,352 | ||||||
| 7,453 | TAL Education Group ADR (Consumer Services)* | 495,326 | ||||||
| 11,367 | XPeng, Inc. ADR (Automobiles & Components)* | 220,293 | ||||||
| 118,800 | Zhuzhou CRRC Times Electric Co. Ltd. Class H (Capital Goods) | 365,844 | ||||||
|
| |||||||
| 6,178,764 | ||||||||
|
| |||||||
| Egypt – 0.6% | ||||||||
| 467,953 | Cleopatra Hospital (Health Care Equipment & Services)* | 141,876 | ||||||
|
| |||||||
| Hong Kong – 3.4% | ||||||||
| 76,200 | AIA Group Ltd. (Insurance) | 725,209 | ||||||
|
| |||||||
| India – 7.9% | ||||||||
| 15,083 | HDFC Bank Ltd. ADR (Banks)* | 866,367 | ||||||
| 79,069 | ICICI Bank Ltd. ADR (Banks)* | 834,178 | ||||||
|
| |||||||
| 1,700,545 | ||||||||
|
| |||||||
| Indonesia – 0.5% | ||||||||
| 55,600 | Bank Central Asia Tbk. PT (Banks) | 109,402 | ||||||
|
| |||||||
| Philippines – 2.3% | ||||||||
| 320,730 | Bank of the Philippine Islands (Banks) | 486,439 | ||||||
|
| |||||||
| Poland – 1.1% | ||||||||
| 4,346 | Dino Polska SA (Food & Staples Retailing)*(b) | 238,941 | ||||||
|
| |||||||
| Russia – 2.8% | ||||||||
| 10,520 | Yandex NV Class A (Media & Entertainment)* | 605,636 | ||||||
|
| |||||||
| Saudi Arabia – 1.7% | ||||||||
| 21,659 | Leejam Sports Co. JSC (Consumer Services) | 357,489 | ||||||
|
| |||||||
| South Africa – 11.6% | ||||||||
| 12,817 | Naspers Ltd. Class N (Retailing)* | 2,502,232 | ||||||
|
| |||||||
| Common Stocks – (continued) | ||||||||
| South Korea – 8.3% | ||||||||
| 7,291 | Cosmax, Inc. (Household & Personal Products) | 679,096 | ||||||
| 1,084 | LG Chem Ltd. (Materials) | 591,085 | ||||||
| 8,559 | LG Corp. (Capital Goods) | 512,505 | ||||||
|
| |||||||
| 1,782,686 | ||||||||
|
| |||||||
| Taiwan – 12.6% | ||||||||
| 159,000 | Delta Electronics, Inc. (Technology Hardware & Equipment) | 1,057,894 | ||||||
| 85,000 | Merida Industry Co. Ltd. (Consumer Durables & Apparel) | 828,707 | ||||||
| 577 | Sea Ltd. ADR (Media & Entertainment)* | 90,993 | ||||||
| 49,000 | Taiwan Semiconductor Manufacturing Co. Ltd. (Semiconductors & Semiconductor Equipment) | 741,354 | ||||||
|
| |||||||
| 2,718,948 | ||||||||
|
| |||||||
| Vietnam – 4.1% | ||||||||
| 396,613 | FPT Corp. (Technology Hardware & Equipment) | 882,682 | ||||||
|
| |||||||
| TOTAL COMMON STOCKS | ||||||||
| (Cost $16,295,035) | $ | 19,114,645 | ||||||
|
| |||||||
| Exchange Traded Fund(a) – 6.6% | ||||||||
| 39,040 | iShares, Inc. iShares ESG Aware MSCI EM ETF | $ | 1,414,810 | |||||
| (Cost $1,455,015) | ||||||||
|
| |||||||
| | TOTAL INVESTMENTS BEFORE SECURITIES LENDING REINVESTMENT VEHICLE | | ||||||
| (Cost $17,750,050) | $ | 20,529,455 | ||||||
|
| |||||||
| Shares | Dividend Rate | Value | ||||
| Securities Lending Reinvestment Vehicle(c) – 5.9% | ||||||
Goldman Sachs Financial Square Government Fund – Institutional Shares |
| |||||
| 1,270,175 | 0.028% | $ | 1,270,175 | |||
| (Cost $1,270,175) | ||||||
| ||||||
| TOTAL INVESTMENTS – 101.3% |
| |||||
| (Cost $19,020,225) | $ | 21,799,630 | ||||
| ||||||
LIABILITIES IN EXCESS OF OTHER ASSETS – (1.3)% | (284,633 | ) | ||||
| ||||||
| NET ASSETS – 100.0% | $ | 21,514,997 | ||||
| ||||||
| The accompanying notes are an integral part of these financial statements. | 45 |
GOLDMAN SACHS IMPRINT EMERGING MARKETS OPPORTUNITIES FUND
Schedule of Investments (continued)
October 31, 2020
| The percentage shown for each investment category reflects the value of investments in that category as a percentage of net assets. | ||
* | Security is currently in default and/or non-income producing. | |
(a) | All or a portion of security is on loan. | |
(b) | Exempt from registration under Rule 144A of the Securities Act of 1933. | |
(c) | Represents an Affiliated Issuer. | |
| ||
Investment Abbreviation: | ||
ADR | —American Depositary Receipt | |
| ||
| 46 | The accompanying notes are an integral part of these financial statements. |
GOLDMAN SACHS INTERNATIONAL EQUITY ESG FUND
Schedule of Investments
October 31, 2020
| Shares | Description | Value | ||||||
| Common Stocks – 95.6% | ||||||||
| China – 2.2% | ||||||||
| 152,464 | XPeng, Inc. ADR (Automobiles & Components)* | $ | 2,954,752 | |||||
|
| |||||||
| Denmark – 5.2% | ||||||||
| 11,919 | Genmab A/S (Pharmaceuticals, Biotechnology & Life Sciences)* | 3,981,245 | ||||||
| 47,799 | Novo Nordisk A/S Class B (Pharmaceuticals, Biotechnology & Life Sciences) | 3,047,935 | ||||||
|
| |||||||
| 7,029,180 | ||||||||
|
| |||||||
| Finland – 1.9% | ||||||||
| 49,997 | Neste OYJ (Energy) | 2,607,521 | ||||||
|
| |||||||
| France – 5.2% | ||||||||
| 105,376 | BNP Paribas SA (Banks)* | 3,674,965 | ||||||
| 41,215 | Vinci SA (Capital Goods) | 3,255,372 | ||||||
|
| |||||||
| 6,930,337 | ||||||||
|
| |||||||
| Germany – 5.4% | ||||||||
| 63,002 | CTS Eventim AG & Co. KGaA (Media & Entertainment)* | 2,792,714 | ||||||
| 161,034 | Infineon Technologies AG (Semiconductors & Semiconductor Equipment) | 4,483,377 | ||||||
|
| |||||||
| 7,276,091 | ||||||||
|
| |||||||
| Japan – 15.8% | ||||||||
| 33,200 | Hoya Corp. (Health Care Equipment & Services) | 3,746,850 | ||||||
| 6,700 | Keyence Corp. (Technology Hardware & Equipment) | 3,040,611 | ||||||
| 38,200 | Nidec Corp. (Capital Goods) | 3,858,279 | ||||||
| 14,600 | Obic Co. Ltd. (Software & Services) | 2,584,828 | ||||||
| 197,500 | ORIX Corp. (Diversified Financials) | 2,309,809 | ||||||
| 45,200 | Shiseido Co. Ltd. (Household & Personal Products) | 2,798,198 | ||||||
| 92,973 | Takeda Pharmaceutical Co. Ltd. (Pharmaceuticals, Biotechnology & Life Sciences) | 2,873,109 | ||||||
|
| |||||||
| 21,211,684 | ||||||||
|
| |||||||
| Netherlands – 6.0% | ||||||||
| 112,708 | Aalberts NV (Capital Goods) | 3,781,253 | ||||||
| 27,200 | Koninklijke DSM NV (Materials) | 4,350,028 | ||||||
|
| |||||||
| 8,131,281 | ||||||||
|
| |||||||
| Singapore – 1.6% | ||||||||
| 142,480 | DBS Group Holdings Ltd. (Banks) | 2,122,362 | ||||||
|
| |||||||
| Spain – 8.5% | ||||||||
| 1,051,637 | Banco Bilbao Vizcaya Argentaria SA (Banks) | 3,034,134 | ||||||
| 65,850 | Cellnex Telecom SA (Telecommunication Services)(a) | 4,226,974 | ||||||
| 348,851 | Iberdrola SA (Utilities) | 4,119,085 | ||||||
|
| |||||||
| 11,380,193 | ||||||||
|
| |||||||
| Common Stocks – (continued) | ||||||||
| Sweden – 3.9% | ||||||||
| 114,340 | Assa Abloy AB Class B (Capital Goods) | 2,450,588 | ||||||
| 37,252 | Hexagon AB Class B (Technology Hardware & Equipment) | 2,730,467 | ||||||
|
| |||||||
| 5,181,055 | ||||||||
|
| |||||||
| Switzerland – 10.8% | ||||||||
| 308,086 | Credit Suisse Group AG (Registered) (Diversified Financials) | 2,905,676 | ||||||
| 56,451 | Nestle SA (Registered) (Food Products) | 6,349,492 | ||||||
| 15,991 | Zurich Insurance Group AG (Insurance) | 5,311,341 | ||||||
|
| |||||||
| 14,566,509 | ||||||||
|
| |||||||
| Taiwan – 4.3% | ||||||||
| 68,795 | Taiwan Semiconductor Manufacturing Co. Ltd. ADR (Semiconductors & Semiconductor Equipment) | 5,769,837 | ||||||
|
| |||||||
| United Kingdom – 21.2% | ||||||||
| 44,284 | AstraZeneca plc (Pharmaceuticals, Biotechnology & Life Sciences) | 4,446,357 | ||||||
| 172,358 | Compass Group plc (Consumer Services) | 2,359,193 | ||||||
| 1,167,073 | DS Smith plc (Materials) | 4,281,059 | ||||||
| 74,131 | Experian plc (Commercial & Professional Services) | 2,715,708 | ||||||
| 522,383 | Informa plc (Media & Entertainment) | 2,834,261 | ||||||
| 78,517 | InterContinental Hotels Group plc (Consumer Services) | 3,989,466 | ||||||
| 42,411 | Reckitt Benckiser Group plc (Household & Personal Products) | 3,735,923 | ||||||
| 611,164 | Rentokil Initial plc (Commercial & Professional Services) | 4,160,934 | ||||||
|
| |||||||
| 28,522,901 | ||||||||
|
| |||||||
| United States – 3.6% | ||||||||
| 49,193 | Ferguson plc (Capital Goods) | 4,885,897 | ||||||
|
| |||||||
| TOTAL COMMON STOCKS | ||||||||
| (Cost $124,933,746) | $ | 128,569,600 | ||||||
|
| |||||||
| Shares | Dividend Rate | Value | ||||
| Investment Company(b) – 0.7% | ||||||
Goldman Sachs Financial Square Government Fund – Institutional Shares |
| |||||
| 1,007,817 | 0.028% | $ | 1,007,817 | |||
| (Cost $1,007,817) |
| |||||
| ||||||
| TOTAL INVESTMENTS – 96.3% |
| |||||
| (Cost $125,941,563) | $ | 129,577,417 | ||||
| ||||||
| OTHER ASSETS IN EXCESS OF LIABILITIES – 3.7% | 4,976,929 | |||||
| ||||||
| NET ASSETS – 100.0% | $ | 134,554,346 | ||||
| ||||||
| The accompanying notes are an integral part of these financial statements. | 47 |
GOLDMAN SACHS INTERNATIONAL EQUITY ESG FUND
Schedule of Investments (continued)
October 31, 2020
| The percentage shown for each investment category reflects the value of investments in that category as a percentage of net assets. | ||
* | Security is currently in default and/or non-income producing. | |
(a) | Exempt from registration under Rule 144A of the Securities Act of 1933. | |
(b) | Represents an Affiliated Issuer. | |
| ||
Investment Abbreviation: | ||
ADR | —American Depositary Receipt | |
| ||
| 48 | The accompanying notes are an integral part of these financial statements. |
GOLDMAN SACHS INTERNATIONAL EQUITY INCOME FUND
Schedule of Investments
October 31, 2020
| Shares | Description | Value | ||||||
| Common Stocks – 99.5% | ||||||||
| Australia – 6.2% | ||||||||
| 43,559 | Rio Tinto plc (Materials) | $ | 2,463,759 | |||||
| 291,144 | Sydney Airport (Transportation) | 1,116,270 | ||||||
|
| |||||||
| 3,580,029 | ||||||||
|
| |||||||
| Denmark – 2.6% | ||||||||
| 22,994 | Novo Nordisk A/S Class B (Pharmaceuticals, Biotechnology & Life Sciences) | 1,466,228 | ||||||
|
| |||||||
| Finland – 2.3% | ||||||||
| 177,589 | Nordea Bank Abp (Banks) | 1,332,853 | ||||||
|
| |||||||
| France – 14.4% | ||||||||
| 43,458 | BNP Paribas SA (Banks)* | 1,515,588 | ||||||
| 17,542 | Gecina SA (REIT) | 2,177,717 | ||||||
| 52,596 | Klepierre SA (REIT) | 666,397 | ||||||
| 18,992 | Schneider Electric SE (Capital Goods) | 2,307,652 | ||||||
| 20,578 | Vinci SA (Capital Goods) | 1,625,356 | ||||||
|
| |||||||
| 8,292,710 | ||||||||
|
| |||||||
| Germany – 4.1% | ||||||||
| 37,261 | Vonovia SE (Real Estate) | 2,379,619 | ||||||
|
| |||||||
| Italy – 4.1% | ||||||||
| 293,556 | Enel SpA (Utilities) | 2,333,919 | ||||||
|
| |||||||
| Japan – 6.5% | ||||||||
| 84,800 | ORIX Corp. (Diversified Financials) | 991,756 | ||||||
| 49,300 | Takeda Pharmaceutical Co. Ltd. (Pharmaceuticals, Biotechnology & Life Sciences) | 1,523,499 | ||||||
| 21,800 | Trend Micro, Inc. (Software & Services) | 1,221,130 | ||||||
|
| |||||||
| 3,736,385 | ||||||||
|
| |||||||
| Netherlands – 5.6% | ||||||||
| 712,728 | Koninklijke KPN NV (Telecommunication Services) | 1,924,923 | ||||||
| 100,202 | Royal Dutch Shell plc Class A (Energy) | 1,260,490 | ||||||
|
| |||||||
| 3,185,413 | ||||||||
|
| |||||||
| Singapore – 3.4% | ||||||||
| 64,000 | DBS Group Holdings Ltd. (Banks) | 953,335 | ||||||
| 159,800 | Singapore Exchange Ltd. (Diversified Financials) | 1,013,508 | ||||||
|
| |||||||
| 1,966,843 | ||||||||
|
| |||||||
| Spain – 4.7% | ||||||||
| 41,895 | Ferrovial SA (Capital Goods) | 907,343 | ||||||
| 151,629 | Iberdrola SA (Utilities) | 1,790,371 | ||||||
|
| |||||||
| 2,697,714 | ||||||||
|
| |||||||
| Switzerland – 18.3% | ||||||||
| 28,395 | Nestle SA (Registered) (Food Products) | 3,193,811 | ||||||
| 20,603 | Novartis AG (Registered) (Pharmaceuticals, Biotechnology & Life Sciences) | 1,605,439 | ||||||
|
| |||||||
| Common Stocks – (continued) | ||||||||
| Switzerland – (continued) | ||||||||
| 23,170 | Swiss Re AG (Insurance) | 1,662,693 | ||||||
| 142,382 | UBS Group AG (Registered) (Diversified Financials) | 1,657,608 | ||||||
| 7,163 | Zurich Insurance Group AG (Insurance) | 2,379,159 | ||||||
|
| |||||||
| 10,498,710 | ||||||||
|
| |||||||
| Taiwan – 4.0% | ||||||||
| 153,000 | Taiwan Semiconductor Manufacturing Co. Ltd. (Semiconductors & Semiconductor Equipment) | 2,314,840 | ||||||
|
| |||||||
| United Kingdom – 19.8% | ||||||||
| 24,726 | AstraZeneca plc (Pharmaceuticals, Biotechnology & Life Sciences) | 2,482,626 | ||||||
| 364,901 | BP plc (Energy) | 930,748 | ||||||
| 31,019 | Coca-Cola European Partners plc (Food Products) | 1,107,688 | ||||||
| 442,361 | DS Smith plc (Materials) | 1,622,669 | ||||||
| 62,919 | GlaxoSmithKline plc (Pharmaceuticals, Biotechnology & Life Sciences) | 1,050,653 | ||||||
| 101,354 | National Grid plc (Utilities) | 1,205,656 | ||||||
| 13,294 | Reckitt Benckiser Group plc (Household & Personal Products) | 1,171,049 | ||||||
| 31,528 | Unilever plc (Household & Personal Products) | 1,796,745 | ||||||
|
| |||||||
| 11,367,834 | ||||||||
|
| |||||||
| United States – 3.5% | ||||||||
| 20,362 | Ferguson plc (Capital Goods) | 2,022,374 | ||||||
|
| |||||||
| TOTAL INVESTMENTS – 99.5% | ||||||||
| (Cost $63,087,760) | $ | 57,175,471 | ||||||
|
| |||||||
| | OTHER ASSETS IN EXCESS OF LIABILITIES – 0.5% | 293,880 | ||||||
|
| |||||||
| NET ASSETS – 100.0% | $ | 57,469,351 | ||||||
|
| |||||||
| The percentage shown for each investment category reflects the value of investments in that category as a percentage of net assets. | ||
* | Security is currently in default and/or non-income producing. | |
| ||
Investment Abbreviation: | ||
REIT | —Real Estate Investment Trust | |
| ||
| The accompanying notes are an integral part of these financial statements. | 49 |
GOLDMAN SACHS FUNDAMENTAL EQUITY INTERNATIONAL FUNDS
Statements of Assets and Liabilities
October 31, 2020
China Equity Fund | Emerging Markets Equity Fund | ESG Emerging Markets Equity Fund | ||||||||||||
| Assets: | ||||||||||||||
Investments in unaffiliated issuers, at value (cost $58,073,146, $1,917,132,462 and $7,101,669)(a) | $ | 85,302,144 | $ | 2,442,708,292 | $ | 9,019,485 | ||||||||
Investments in affiliated issuers, at value (cost $2,236,989, $12,529,663 and $122,590) | 2,236,989 | 12,529,663 | 122,590 | |||||||||||
Investments in affiliated securities lending reinvestment vehicle, at value (cost $0, $20,507,250 and $0) | — | 20,507,250 | — | |||||||||||
Cash | 508,422 | 5,000,149 | 63,594 | |||||||||||
Foreign currencies, at value (cost $71,235, $5,948,507 and $40,369) | 69,758 | 5,942,235 | 39,788 | |||||||||||
Receivables: | ||||||||||||||
Fund shares sold | 874,135 | 3,395,759 | 264 | |||||||||||
Reimbursement from investment adviser | 50,273 | 123,880 | 53,270 | |||||||||||
Dividends | 42,620 | 1,418,344 | 4,620 | |||||||||||
Investments sold | — | 205,450 | — | |||||||||||
Foreign tax reclaims | — | 153,521 | 1,610 | |||||||||||
Securities lending income | — | 10,614 | — | |||||||||||
Other assets | 30,632 | 74,719 | 31,384 | |||||||||||
| Total assets | 89,114,973 | 2,492,069,876 | 9,336,605 | |||||||||||
| Liabilities: | ||||||||||||||
Payables: | ||||||||||||||
Investments purchased | 769,247 | 12,673,726 | — | |||||||||||
Management fees | 72,309 | 2,079,795 | 7,658 | |||||||||||
Distribution and Service fees and Transfer Agency fees | 7,464 | 175,077 | 509 | |||||||||||
Fund shares redeemed | 117 | 2,191,269 | — | |||||||||||
Payable upon return of securities loaned | — | 20,507,250 | — | |||||||||||
Foreign capital gains taxes | — | 3,936,781 | 1,209 | |||||||||||
Accrued expenses | 113,573 | 628,160 | 79,778 | |||||||||||
| Total liabilities | 962,710 | 42,192,058 | 89,154 | |||||||||||
| Net Assets: | ||||||||||||||
Paid-in capital | 55,890,720 | 2,145,751,429 | 7,758,996 | |||||||||||
Total distributable earnings (loss) | 32,261,543 | 304,126,389 | 1,488,455 | |||||||||||
| NET ASSETS | $ | 88,152,263 | $ | 2,449,877,818 | $ | 9,247,451 | ||||||||
Net Assets: | ||||||||||||||
Class A | $ | 18,617,149 | $ | 247,764,847 | $ | 92,402 | ||||||||
Class C | 973,093 | 23,424,552 | 58,050 | |||||||||||
Institutional | 10,824,245 | 1,479,859,098 | 8,630,976 | |||||||||||
Service | — | 26,329,372 | — | |||||||||||
Investor | 761,850 | 147,385,920 | 59,467 | |||||||||||
Class R6 | 631,343 | 53,424,465 | 65,221 | |||||||||||
Class R | — | — | 254,861 | |||||||||||
Class P | 56,344,583 | 471,689,564 | 86,474 | |||||||||||
Total Net Assets | $ | 88,152,263 | $ | 2,449,877,818 | $ | 9,247,451 | ||||||||
Shares outstanding $0.001 par value (unlimited shares authorized): | ||||||||||||||
Class A | 503,353 | 10,425,919 | 7,879 | |||||||||||
Class C | 29,460 | 1,106,949 | 5,000 | |||||||||||
Institutional | 273,910 | 57,952,313 | 733,562 | |||||||||||
Service | — | 1,146,266 | — | |||||||||||
Investor | 19,396 | 5,818,465 | 5,058 | |||||||||||
Class R6 | 16,029 | 2,082,884 | 5,542 | |||||||||||
Class R | — | — | 21,824 | |||||||||||
Class P | 1,430,019 | 18,390,436 | 7,348 | |||||||||||
Net asset value, offering and redemption price per share:(b) | ||||||||||||||
Class A | $36.99 | $23.76 | $11.73 | |||||||||||
Class C | 33.03 | 21.16 | 11.61 | |||||||||||
Institutional | 39.52 | 25.54 | 11.77 | |||||||||||
Service | — | 22.97 | — | |||||||||||
Investor | 39.28 | 25.33 | 11.76 | |||||||||||
Class R6 | 39.39 | 25.65 | 11.77 | |||||||||||
Class R | — | — | 11.68 | |||||||||||
Class P | 39.40 | 25.65 | 11.77 | |||||||||||
| (a) | Includes loaned securities having a market value of $19,709,784 for the Emerging Markets Equity Fund. |
| (b) | Maximum public offering price per share for Class A Shares of the China Equity, Emerging Markets Equity and ESG Emerging Markets Equity Funds is $39.14, $25.14 and 12.41, respectively. At redemption, Class C Shares may be subject to a contingent deferred sales charge assessed on the amount equal to the lesser of the current NAV or the original purchase price of the shares. |
| 50 | The accompanying notes are an integral part of these financial statements. |
GOLDMAN SACHS FUNDAMENTAL EQUITY INTERNATIONAL FUNDS
Statements of Assets and Liabilities (continued)
October 31, 2020
| Imprint Emerging Markets Opportunities Fund | International Equity ESG Fund | International Equity Income Fund | ||||||||||||
| Assets: | ||||||||||||||
Investments in unaffiliated issuers, at value (cost $17,750,050, $124,933,746 and $63,087,760)(a) | $ | 20,529,455 | $ | 128,569,600 | $ | 57,175,471 | ||||||||
Investments in affiliated issuers, at value (cost $0, $1,007,817 and $0) | — | 1,007,817 | — | |||||||||||
Investments in affiliated securities lending reinvestment vehicle, at value (cost $1,270,175, $0 and $0) | 1,270,175 | — | — | |||||||||||
Cash | — | 500,000 | 4,266 | |||||||||||
Foreign currencies, at value (cost $720,650, $29,520 and $23,001) | 721,521 | 27,565 | 22,747 | |||||||||||
Receivables: | ||||||||||||||
Investments sold | 998,401 | 3,937,941 | — | |||||||||||
Reimbursement from investment adviser | 59,945 | 62,121 | 44,844 | |||||||||||
Dividends | 16,937 | 209,283 | 145,524 | |||||||||||
Foreign tax reclaims | 7,963 | 478,871 | 308,003 | |||||||||||
Securities lending income | 5,025 | 31 | 501 | |||||||||||
Fund shares sold | — | 172,285 | 26,907 | |||||||||||
Other assets | 21,181 | 54,330 | 44,004 | |||||||||||
| Total assets | 23,630,603 | 135,019,844 | 57,772,267 | |||||||||||
| Liabilities: | ||||||||||||||
Payables: | ||||||||||||||
Payable upon return of securities loaned | 1,270,175 | — | — | |||||||||||
Due to custodian | 662,444 | — | — | |||||||||||
Management fees | 19,455 | 97,483 | 43,090 | |||||||||||
Foreign capital gains taxes | 7,465 | — | — | |||||||||||
Distribution and Service fees and Transfer Agency fees | 2,535 | 21,593 | 9,448 | |||||||||||
Investments purchased | 204 | 51 | — | |||||||||||
Fund shares redeemed | — | 78,028 | 87,354 | |||||||||||
Accrued expenses | 153,328 | 268,343 | 163,024 | |||||||||||
| Total liabilities | 2,115,606 | 465,498 | 302,916 | |||||||||||
| Net Assets: | ||||||||||||||
Paid-in capital | 79,751,044 | 136,413,899 | 66,380,751 | |||||||||||
Total distributable earnings (loss) | (58,236,047 | ) | (1,859,553 | ) | (8,911,400 | ) | ||||||||
| NET ASSETS | $ | 21,514,997 | $ | 134,554,346 | $ | 57,469,351 | ||||||||
Net Assets: | ||||||||||||||
Class A | $ | 3,256,143 | $ | 33,927,268 | $ | 13,669,475 | ||||||||
Class C | 782,082 | 9,369,241 | 1,513,708 | |||||||||||
Institutional | 3,407,614 | 23,137,174 | 10,050,950 | |||||||||||
Service | — | 4,256 | — | |||||||||||
Investor | 1,021,229 | 1,298,167 | 8,958,379 | |||||||||||
Class R6 | 8,783 | 1,980,683 | 2,304,310 | |||||||||||
Class R | — | — | 173,386 | |||||||||||
Class P | 13,039,146 | 64,837,557 | 20,799,143 | |||||||||||
Total Net Assets | $ | 21,514,997 | $ | 134,554,346 | $ | 57,469,351 | ||||||||
Shares outstanding $0.001 par value (unlimited shares authorized): | ||||||||||||||
Class A | 381,021 | 1,614,470 | 1,184,445 | |||||||||||
Class C | 96,288 | 481,925 | 149,228 | |||||||||||
Institutional | 397,246 | 1,074,471 | 824,000 | |||||||||||
Service | — | 193 | — | |||||||||||
Investor | 118,822 | 60,632 | 777,958 | |||||||||||
Class R6 | 1,024 | 92,498 | 189,202 | |||||||||||
Class R | — | — | 14,950 | |||||||||||
Class P | 1,522,286 | 3,027,631 | 1,708,935 | |||||||||||
Net asset value, offering and redemption price per share:(b) | ||||||||||||||
Class A | $8.55 | $21.01 | $11.54 | |||||||||||
Class C | 8.12 | 19.44 | 10.14 | |||||||||||
Institutional | 8.58 | 21.53 | 12.20 | |||||||||||
Service | — | 22.00 | (c) | — | ||||||||||
Investor | 8.59 | 21.41 | 11.52 | |||||||||||
Class R6 | 8.57 | (c) | 21.41 | 12.18 | ||||||||||
Class R | — | — | 11.60 | |||||||||||
Class P | 8.57 | 21.42 | 12.17 | |||||||||||
| (a) | Includes loaned securities having a market value of $1,222,885 for the Imprint Emerging Markets Opportunities Fund. |
| (b) | Maximum public offering price per share for Class A Shares of the Imprint Emerging Markets Opportunities, International Equity ESG and International Equity Income Funds is $9.05, $22.22 and $12.21, respectively. At redemption, Class C Shares may be subject to a contingent deferred sales charge assessed on the amount equal to the lesser of the current NAV or the original purchase price of the shares. |
| (c) | Net asset value may not recalculate due to rounding of fractional shares. |
| The accompanying notes are an integral part of these financial statements. | 51 |
GOLDMAN SACHS FUNDAMENTAL EQUITY INTERNATIONAL FUNDS
Statements of Operations
For the Fiscal Year Ended October 31, 2020
| China Equity Fund | Emerging Markets Equity Fund | ESG Emerging Markets Equity Fund | ||||||||||||
| Investment income: |
| |||||||||||||
Dividends — unaffiliated issuers (net of foreign taxes withheld of $71,255, $4,793,274 and $14,861) | $ | 860,705 | $ | 41,562,890 | $ | 109,499 | ||||||||
Dividends — affiliated issuers | 2,620 | 121,109 | 92 | |||||||||||
Securities lending income — affiliated issuer | 1,666 | 150,780 | — | |||||||||||
Interest | — | 2,155 | — | |||||||||||
| Total investment income | 864,991 | 41,836,934 | 109,591 | |||||||||||
| Expenses: |
| |||||||||||||
Management fees | 717,697 | 20,748,819 | 76,743 | |||||||||||
Professional fees | 166,102 | 118,433 | 137,922 | |||||||||||
Custody, accounting and administrative services | 100,745 | 1,491,187 | 74,001 | |||||||||||
Registration fees | 88,276 | 219,899 | 96,243 | |||||||||||
Printing and mailing costs | 49,429 | 292,525 | 26,039 | |||||||||||
Distribution and Service (12b-1) fees(a) | 44,800 | 836,980 | 1,553 | |||||||||||
Transfer Agency fees(a) | 44,425 | 1,281,933 | 3,598 | |||||||||||
Trustee fees | 20,003 | 22,934 | 19,909 | |||||||||||
Service fees — Class C | 2,444 | 64,390 | 129 | |||||||||||
Shareholder administration fees — Service Shares | — | 60,786 | — | |||||||||||
Other | 68,738 | 124,896 | 23,253 | |||||||||||
| Total expenses | 1,302,659 | 25,262,782 | 459,390 | |||||||||||
Less — expense reductions | (423,399 | ) | (340,438 | ) | (367,874 | ) | ||||||||
| Net expenses | 879,260 | 24,922,344 | 91,516 | |||||||||||
| NET INVESTMENT INCOME (LOSS) | (14,269 | ) | 16,914,590 | 18,075 | ||||||||||
| Realized and unrealized gain (loss): |
| |||||||||||||
Net realized gain (loss) from: | ||||||||||||||
Investments — unaffiliated issuers | 6,777,741 | (68,017,428 | ) | (164,155 | ) | |||||||||
Foreign currency transactions | (66,475 | ) | (11,374,385 | ) | (9,067 | ) | ||||||||
Net change in unrealized gain (loss) on: | ||||||||||||||
Investments — unaffiliated issuers (including the effects of the net change in the foreign capital gains tax liability of $411,517, $939,193 and $11,902) | 20,502,820 | 437,571,065 | 1,651,794 | |||||||||||
Foreign currency translation | (156,025 | ) | (1,458,627 | ) | (7,098 | ) | ||||||||
| Net realized and unrealized gain | 27,058,061 | 356,720,625 | 1,471,474 | |||||||||||
| NET INCREASE (DECREASE) IN NET ASSETS RESULTING FROM OPERATIONS | $ | 27,043,792 | $ | 373,635,215 | $ | 1,489,549 | ||||||||
| (a) | Class specific Distribution and/or Service, and Transfer Agency fees were as follows: |
| Distribution and/or Service (12b-1) Fees | Transfer Agency Fees | |||||||||||||||||||||||||||||||||||||||||||||||
Fund | Class A | Class C | Service | Class R | Class A | Class C | Institutional | Service | Investor | Class R6 | Class R | Class P | ||||||||||||||||||||||||||||||||||||
China Equity | $ | 37,467 | $ | 7,333 | $ | — | $ | — | $ | 24,896 | $ | 1,630 | $ | 3,084 | $ | — | $ | 472 | $ | 122 | $ | — | $ | 14,221 | ||||||||||||||||||||||||
Emerging Markets Equity | 583,024 | 193,170 | 60,786 | — | 388,083 | 43,035 | 475,205 | 9,697 | 235,892 | 7,108 | — | 122,913 | ||||||||||||||||||||||||||||||||||||
ESG Emerging Markets Equity | 190 | 384 | — | 979 | 126 | 85 | 2,955 | — | 87 | 16 | 325 | 4 | (b) | |||||||||||||||||||||||||||||||||||
| (b) | Commenced operations on January 21, 2020. |
| 52 | The accompanying notes are an integral part of these financial statements. |
GOLDMAN SACHS FUNDAMENTAL EQUITY INTERNATIONAL FUNDS
Statements of Operations (continued)
For the Fiscal Year Ended October 31, 2020
Imprint Emerging Opportunities Fund | International Equity ESG Fund | International Income Fund | ||||||||||||
| Investment income: |
| |||||||||||||
Dividends — unaffiliated issuers (net of foreign taxes withheld of $26,280, $254,744 and $292,252) | $ | 225,545 | $ | 1,804,068 | $ | 2,095,384 | ||||||||
Securities lending income — affiliated issuer | 14,700 | 847 | 2,594 | |||||||||||
Interest | 2,786 | — | — | |||||||||||
Dividends — affiliated issuers | 135 | 21,136 | 14,109 | |||||||||||
| Total investment income | 243,166 | 1,826,051 | 2,112,087 | |||||||||||
| Expenses: |
| |||||||||||||
Management fees | 218,296 | 1,081,563 | 530,237 | |||||||||||
Professional fees | 215,395 | 145,205 | 131,436 | |||||||||||
Custody, accounting and administrative services | 113,800 | 109,174 | 112,338 | |||||||||||
Registration fees | 86,714 | 117,924 | 107,868 | |||||||||||
Printing and mailing costs | 32,571 | 93,364 | 65,574 | |||||||||||
Trustee fees | 19,926 | 20,082 | 19,998 | |||||||||||
Distribution and Service (12b-1) fees(a) | 14,993 | 156,354 | 51,738 | |||||||||||
Transfer Agency fees(a) | 13,685 | 100,116 | 57,760 | |||||||||||
Service fees — Class C | 2,390 | 24,064 | 4,282 | |||||||||||
Shareholder administration fees — Service Shares | — | 9 | — | |||||||||||
Other | 71,925 | 52,272 | 27,522 | |||||||||||
| Total expenses | 789,695 | 1,900,127 | 1,108,753 | |||||||||||
Less — expense reductions | (506,714 | ) | (585,593 | ) | (457,984 | ) | ||||||||
| Net expenses | 282,981 | 1,314,534 | 650,769 | |||||||||||
| NET INVESTMENT INCOME (LOSS) | (39,815 | ) | 511,517 | 1,461,318 | ||||||||||
| Realized and unrealized gain (loss): |
| |||||||||||||
Net realized gain (loss) from: | ||||||||||||||
Investments — unaffiliated issuers | (2,542,061 | ) | 8,240,437 | (518,987 | ) | |||||||||
Foreign currency transactions | (26,475 | ) | 32,813 | 8,463 | ||||||||||
Net change in unrealized gain (loss) on: | ||||||||||||||
Investments — unaffiliated issuers | 2,573,642 | (2,547,120 | ) | (9,068,687 | ) | |||||||||
Foreign currency translation | 1,335 | 18,716 | 18,017 | |||||||||||
| Net realized and unrealized gain (loss) | 6,441 | 5,744,846 | (9,561,194 | ) | ||||||||||
| NET INCREASE (DECREASE) IN NET ASSETS RESULTING FROM OPERATIONS | $ | (33,374 | ) | $ | 6,256,363 | $ | (8,099,876 | ) | ||||||
| (a) | Class specific Distribution and/or Service, and Transfer Agency fees were as follows: |
| Distribution and/or Service (12b-1) Fees | Transfer Agency Fees | |||||||||||||||||||||||||||||||||||||||||||
Fund | Class A | Class C | Service | Class R | Class A | Class C | Institutional | Investor | Class R6 | Class R | Class P | |||||||||||||||||||||||||||||||||
Imprint Emerging Markets Opportunities | $ | 7,822 | $ | 7,171 | $ | — | $ | — | $ | 5,213 | $ | 1,599 | $ | 1,338 | $ | 1,860 | $ | 4 | $ | — | $ | 3,671 | ||||||||||||||||||||||
International Equity ESG | 84,150 | 72,193 | 11 | — | 56,052 | 16,058 | 7,152 | 1,264 | 351 | — | 19,239 | |||||||||||||||||||||||||||||||||
International Equity Income | 38,139 | 12,846 | — | 753 | 25,436 | 2,856 | 4,129 | 16,417 | 397 | 250 | 8,275 | |||||||||||||||||||||||||||||||||
| The accompanying notes are an integral part of these financial statements. | 53 |
GOLDMAN SACHS FUNDAMENTAL EQUITY INTERNATIONAL FUNDS
Statements of Changes in Net Assets
| China Equity Fund | Emerging Markets Equity Fund | |||||||||||||||||||||
| For the Fiscal Year Ended October 31, 2020 | For the Fiscal Year Ended October 31, 2019 | For the Fiscal Year Ended October 31, 2020 | For the Fiscal Year Ended October 31, 2019 | |||||||||||||||||||
| From operations: |
| |||||||||||||||||||||
Net investment income (loss) | $ | (14,269 | ) | $ | 331,276 | $ | 16,914,590 | $ | 11,647,844 | |||||||||||||
Net realized gain (loss) | 6,711,266 | (1,370,912 | ) | (79,391,813 | ) | (45,923,674 | ) | |||||||||||||||
Net change in unrealized gain | 20,346,795 | 13,831,545 | 436,112,438 | 301,566,373 | ||||||||||||||||||
| Net increase in net assets resulting from operations | 27,043,792 | 12,791,909 | 373,635,215 | 267,290,543 | ||||||||||||||||||
| Distributions to shareholders: |
| |||||||||||||||||||||
From distributable earnings: | ||||||||||||||||||||||
Class A Shares | (80,753 | ) | (889,921 | ) | (2,087,916 | ) | (673,495 | ) | ||||||||||||||
Class C Shares | — | (72,137 | ) | (31,816 | ) | — | ||||||||||||||||
Institutional Shares | (54,582 | ) | (433,817 | ) | (11,063,936 | ) | (5,268,709 | ) | ||||||||||||||
Service Shares | — | — | (191,831 | ) | (49,751 | ) | ||||||||||||||||
Investor Shares | (1,881 | ) | (17,126 | ) | (1,412,911 | ) | (901,707 | ) | ||||||||||||||
Class R6 Shares | (3,753 | ) | (539 | ) | (290,245 | ) | (296,454 | ) | ||||||||||||||
Class P Shares | (459,995 | ) | (3,162,940 | ) | (4,624,350 | ) | (2,644,053 | ) | ||||||||||||||
| Total distributions to shareholders | (600,964 | ) | (4,576,480 | ) | (19,703,005 | ) | (9,834,169 | ) | ||||||||||||||
| From share transactions: |
| |||||||||||||||||||||
Proceeds from sales of shares | 13,135,019 | 5,319,738 | 1,041,975,752 | 780,205,137 | ||||||||||||||||||
Reinvestment of distributions | 595,251 | 4,525,522 | 17,567,215 | 8,902,639 | ||||||||||||||||||
Cost of shares redeemed | (25,971,258 | ) | (14,323,926 | ) | (738,651,137 | ) | (644,514,588 | ) | ||||||||||||||
| Net increase (decrease) in net assets resulting from share transactions | (12,240,988 | ) | (4,478,666 | ) | 320,891,830 | 144,593,188 | ||||||||||||||||
| TOTAL INCREASE | 14,201,840 | 3,736,763 | 674,824,040 | 402,049,562 | ||||||||||||||||||
| Net Assets: |
| |||||||||||||||||||||
Beginning of year | 73,950,423 | 70,213,660 | 1,775,053,778 | 1,373,004,216 | ||||||||||||||||||
End of year | $ | 88,152,263 | $ | 73,950,423 | $ | 2,449,877,818 | $ | 1,775,053,778 | ||||||||||||||
| 54 | The accompanying notes are an integral part of these financial statements. |
GOLDMAN SACHS FUNDAMENTAL EQUITY INTERNATIONAL FUNDS
Statements of Changes in Net Assets (continued)
| ESG Emerging Markets Equity Fund | Imprint Emerging Markets Opportunities Fund | |||||||||||||||||||||
| For the Fiscal Year Ended October 31, 2020 | For the Fiscal Year Ended October 31, 2019 | For the Fiscal Year Ended October 31, 2020 | For the Fiscal Year Ended October 31, 2019 | |||||||||||||||||||
| From operations: |
| |||||||||||||||||||||
Net investment income (loss) | $ | 18,075 | $ | 59,539 | $ | (39,815 | ) | $ | 1,290,158 | |||||||||||||
Net realized gain (loss) | (173,222 | ) | (138,804 | ) | (2,568,536 | ) | 2,721,312 | |||||||||||||||
Net change in unrealized gain (loss) | 1,644,696 | 1,276,626 | 2,574,977 | (1,640,699 | ) | |||||||||||||||||
| Net increase (decrease) in net assets resulting from operations | 1,489,549 | 1,197,361 | (33,374 | ) | 2,370,771 | |||||||||||||||||
| Distributions to shareholders: |
| |||||||||||||||||||||
From distributable earnings: | ||||||||||||||||||||||
Class A Shares | (280 | ) | (100 | ) | (164,432 | ) | (43,316 | ) | ||||||||||||||
Class C Shares | — | — | (46,762 | ) | — | |||||||||||||||||
Institutional Shares | (64,061 | ) | (27,540 | ) | (204,776 | ) | (148,258 | ) | ||||||||||||||
Investor Shares | (400 | ) | (167 | ) | (72,847 | ) | (18,320 | ) | ||||||||||||||
Class R6 Shares | (471 | ) | (206 | ) | (446 | ) | (117 | ) | ||||||||||||||
Class R Shares | (1,009 | ) | (34 | ) | — | — | ||||||||||||||||
Class P Shares | — | (a) | — | (733,414 | ) | (211,532 | ) | |||||||||||||||
| Total distributions to shareholders | (66,221 | ) | (28,047 | ) | (1,222,677 | ) | (421,543 | ) | ||||||||||||||
| From share transactions: |
| |||||||||||||||||||||
Proceeds from sales of shares | 728,979 | 1,219,951 | 5,681,621 | 1,128,191 | ||||||||||||||||||
Reinvestment of distributions | 66,221 | 28,047 | 1,214,908 | 414,427 | ||||||||||||||||||
Cost of shares redeemed | (249,783 | ) | (1,027,311 | ) | (7,867,646 | ) | (20,612,037 | ) | ||||||||||||||
| Net increase (decrease) in net assets resulting from share transactions | 545,417 | 220,687 | (971,117 | ) | (19,069,419 | ) | ||||||||||||||||
| TOTAL INCREASE (DECREASE) | 1,968,745 | 1,390,001 | (2,227,168 | ) | (17,120,191 | ) | ||||||||||||||||
| Net Assets: |
| |||||||||||||||||||||
Beginning of year | 7,278,706 | 5,888,705 | 23,742,165 | 40,862,356 | ||||||||||||||||||
End of year | $ | 9,247,451 | $ | 7,278,706 | $ | 21,514,997 | $ | 23,742,165 | ||||||||||||||
| (a) | Commenced operations on January 21, 2020. |
| The accompanying notes are an integral part of these financial statements. | 55 |
GOLDMAN SACHS FUNDAMENTAL EQUITY INTERNATIONAL FUNDS
Statements of Changes in Net Assets (continued)
| International Equity ESG Fund | International Equity Income Fund | |||||||||||||||||||||
| For the Fiscal Year Ended October 31, 2020 | For the Fiscal Year Ended October 31, 2019 | For the Fiscal Year Ended October 31, 2020 | For the Fiscal Year Ended October 31, 2019 | |||||||||||||||||||
| From operations: |
| |||||||||||||||||||||
Net investment income | $ | 511,517 | $ | 2,251,874 | $ | 1,461,318 | $ | 1,651,593 | ||||||||||||||
Net realized gain (loss) | 8,273,250 | (5,757,963 | ) | (510,524 | ) | (2,811,033 | ) | |||||||||||||||
Net change in unrealized gain (loss) | (2,528,404 | ) | 24,154,912 | (9,050,670 | ) | 9,472,790 | ||||||||||||||||
| Net increase (decrease) in net assets resulting from operations | 6,256,363 | 20,648,823 | (8,099,876 | ) | 8,313,350 | |||||||||||||||||
| Distributions to shareholders: |
| |||||||||||||||||||||
From distributable earnings: | ||||||||||||||||||||||
Class A Shares | (607,729 | ) | (465,302 | ) | (609,078 | ) | (1,987,104 | ) | ||||||||||||||
Class C Shares | (117,372 | ) | (23,970 | ) | (54,686 | ) | (225,027 | ) | ||||||||||||||
Institutional Shares | (161,245 | ) | (86,276 | ) | (341,933 | ) | (318,215 | ) | ||||||||||||||
Service Shares | (65 | ) | (43 | ) | — | — | ||||||||||||||||
Investor Shares | (12,522 | ) | (5,613 | ) | (303,964 | ) | (47,321 | ) | ||||||||||||||
Class R6 Shares | (9,509 | ) | (196 | ) | (32,808 | ) | (8,522 | ) | ||||||||||||||
Class R Shares | — | — | (3,596 | ) | (10,840 | ) | ||||||||||||||||
Class P Shares | (1,391,936 | ) | (1,603,197 | ) | (1,237,682 | ) | (3,790,562 | ) | ||||||||||||||
| Total distributions to shareholders | (2,300,378 | ) | (2,184,597 | ) | (2,583,747 | ) | (6,387,591 | ) | ||||||||||||||
| From share transactions: |
| |||||||||||||||||||||
Proceeds from sales of shares | 30,746,192 | 29,120,933 | 40,928,620 | 9,295,378 | ||||||||||||||||||
Reinvestment of distributions | 2,269,283 | 2,160,928 | 2,561,342 | 6,309,522 | ||||||||||||||||||
Cost of shares redeemed | (25,612,098 | ) | (73,381,271 | ) | (35,481,004 | ) | (9,001,452 | ) | ||||||||||||||
| Net increase (decrease) in net assets resulting from share transactions | 7,403,377 | (42,099,410 | ) | 8,008,958 | 6,603,448 | |||||||||||||||||
| TOTAL INCREASE (DECREASE) | 11,359,362 | (23,635,184 | ) | (2,674,665 | ) | 8,529,207 | ||||||||||||||||
| Net Assets: |
| |||||||||||||||||||||
Beginning of year | 123,194,984 | 146,830,168 | 60,144,016 | 51,614,809 | ||||||||||||||||||
End of year | $ | 134,554,346 | $ | 123,194,984 | $ | 57,469,351 | $ | 60,144,016 | ||||||||||||||
| 56 | The accompanying notes are an integral part of these financial statements. |
GOLDMAN SACHS CHINA EQUITY FUND
Selected Data for a Share Outstanding Throughout Each Year
| (a) | Calculated based on the average shares outstanding methodology. |
| (b) | Reflects income recognized from special dividends which amounted to $0.04 per share and 0.17% of average net assets. |
| (c) | Assumes investment at the net asset value at the beginning of the year, reinvestment of all distributions, a complete redemption of the investment at the net asset value at the end of the year and no sales or redemption charges (if any). Total returns would be reduced if a sales or redemption charge was taken into account. Returns do not reflect the impact of taxes to shareholders relating to Fund distributions or the redemption of Fund shares. |
| (d) | The Fund’s portfolio turnover rate is calculated in accordance with regulatory requirements, without regard to transactions involving short term investments. If such transactions were included, the Fund’s portfolio turnover rate may be higher. |
| The accompanying notes are an integral part of these financial statements. | 57 |
GOLDMAN SACHS CHINA EQUITY FUND
Financial Highlights (continued)
Selected Data for a Share Outstanding Throughout Each Year
| Goldman Sachs China Equity Fund | ||||||||||||||||||||||
| Class C Shares | ||||||||||||||||||||||
| Year Ended October 31, | ||||||||||||||||||||||
| 2020 | 2019 | 2018 | 2017 | 2016 | ||||||||||||||||||
| Per Share Data | ||||||||||||||||||||||
Net asset value, beginning of year | $ | 23.14 | $ | 20.95 | $ | 25.31 | $ | 19.41 | $ | 18.81 | ||||||||||||
Net investment loss(a) | (0.26 | ) | (0.14 | ) | (0.13 | ) | (0.17 | )(b) | (0.15 | ) | ||||||||||||
Net realized and unrealized gain (loss) | 10.15 | 3.82 | (3.84 | ) | 6.07 | 0.75 | ||||||||||||||||
Total from investment operations | 9.89 | 3.68 | (3.97 | ) | 5.90 | 0.60 | ||||||||||||||||
Distributions to shareholders from net realized gains | — | (1.49 | ) | (0.39 | ) | — | — | |||||||||||||||
Net asset value, end of year | $ | 33.03 | $ | 23.14 | $ | 20.95 | $ | 25.31 | $ | 19.41 | ||||||||||||
| Total return(c) | 42.60 | % | 18.66 | % | (15.94 | )% | 30.35 | % | 3.18 | % | ||||||||||||
Net assets, end of year (in 000s) | $ | 973 | $ | 896 | $ | 1,318 | $ | 1,732 | $ | 1,810 | ||||||||||||
Ratio of net expenses to average net assets | 2.21 | % | 2.27 | % | 2.29 | % | 2.30 | % | 2.35 | % | ||||||||||||
Ratio of total expenses to average net assets | 2.85 | % | 2.85 | % | 2.66 | % | 2.78 | % | 2.93 | % | ||||||||||||
Ratio of net investment loss to average net assets | (0.98 | )% | (0.63 | )% | (0.52 | )% | (0.79 | )%(b) | (0.83 | )% | ||||||||||||
Portfolio turnover rate(d) | 106 | % | 20 | % | 39 | % | 89 | % | 111 | % | ||||||||||||
| (a) | Calculated based on the average shares outstanding methodology. |
| (b) | Reflects income recognized from special dividends which amounted to $0.04 per share and 0.17% of average net assets. |
| (c) | Assumes investment at the net asset value at the beginning of the year, reinvestment of all distributions, a complete redemption of the investment at the net asset value at the end of the year and no sales or redemption charges (if any). Total returns would be reduced if a sales or redemption charge was taken into account. Returns do not reflect the impact of taxes to shareholders relating to Fund distributions or the redemption of Fund shares. |
| (d) | The Fund’s portfolio turnover rate is calculated in accordance with regulatory requirements, without regard to transactions involving short term investments. If such transactions were included, the Fund’s portfolio turnover rate may be higher. |
| 58 | The accompanying notes are an integral part of these financial statements. |
GOLDMAN SACHS CHINA EQUITY FUND
Financial Highlights (continued)
Selected Data for a Share Outstanding Throughout Each Year
| Goldman Sachs China Equity Fund | ||||||||||||||||||||||
| Institutional Shares | ||||||||||||||||||||||
| Year Ended October 31, | ||||||||||||||||||||||
| 2020 | 2019 | 2018 | 2017 | 2016 | ||||||||||||||||||
| Per Share Data | ||||||||||||||||||||||
Net asset value, beginning of year | $ | 27.63 | $ | 24.56 | $ | 29.28 | $ | 22.20 | $ | 21.27 | ||||||||||||
Net investment income(a) | 0.05 | 0.14 | 0.19 | 0.09 | (b) | 0.07 | ||||||||||||||||
Net realized and unrealized gain (loss) | 12.09 | 4.50 | (4.51 | ) | 6.99 | 0.86 | ||||||||||||||||
Total from investment operations | 12.14 | 4.64 | (4.32 | ) | 7.08 | 0.93 | ||||||||||||||||
Distributions to shareholders from net investment income | (0.25 | ) | (0.08 | ) | (0.01 | ) | — | — | ||||||||||||||
Distributions to shareholders from net realized gains | — | (1.49 | ) | (0.39 | ) | — | — | |||||||||||||||
Total distributions | (0.25 | ) | (1.57 | ) | (0.40 | ) | — | — | ||||||||||||||
Net asset value, end of year | $ | 39.52 | $ | 27.63 | $ | 24.56 | $ | 29.28 | $ | 22.20 | ||||||||||||
| Total return(c) | 44.13 | % | 19.98 | % | (14.98 | )% | 31.91 | % | 4.31 | % | ||||||||||||
Net assets, end of year (in 000s) | $ | 10,824 | $ | 6,327 | $ | 6,997 | $ | 62,843 | $ | 56,077 | ||||||||||||
Ratio of net expenses to average net assets | 1.15 | % | 1.15 | % | 1.15 | % | 1.15 | % | 1.20 | % | ||||||||||||
Ratio of total expenses to average net assets | 1.74 | % | 1.71 | % | 1.47 | % | 1.63 | % | 1.78 | % | ||||||||||||
Ratio of net investment income to average net assets | 0.17 | % | 0.54 | % | 0.63 | % | 0.36 | %(b) | 0.32 | % | ||||||||||||
Portfolio turnover rate(d) | 106 | % | 20 | % | 39 | % | 89 | % | 111 | % | ||||||||||||
| (a) | Calculated based on the average shares outstanding methodology. |
| (b) | Reflects income recognized from special dividends which amounted to $0.04 per share and 0.17% of average net assets. |
| (c) | Assumes investment at the net asset value at the beginning of the year, reinvestment of all distributions, a complete redemption of the investment at the net asset value at the end of the year and no sales or redemption charges (if any). Total returns would be reduced if a sales or redemption charge was taken into account. Returns do not reflect the impact of taxes to shareholders relating to Fund distributions or the redemption of Fund shares. |
| (d) | The Fund’s portfolio turnover rate is calculated in accordance with regulatory requirements, without regard to transactions involving short term investments. If such transactions were included, the Fund’s portfolio turnover rate may be higher. |
| The accompanying notes are an integral part of these financial statements. | 59 |
GOLDMAN SACHS CHINA EQUITY FUND
Financial Highlights (continued)
Selected Data for a Share Outstanding Throughout Each Year
| Goldman Sachs China Equity Fund | ||||||||||||||||||||||
| Investor Shares(a) | ||||||||||||||||||||||
| Year Ended October 31, | ||||||||||||||||||||||
| 2020 | 2019 | 2018 | 2017 | 2016 | ||||||||||||||||||
| Per Share Data | ||||||||||||||||||||||
Net asset value, beginning of year | $ | 27.46 | $ | 24.41 | $ | 29.14 | $ | 22.12 | $ | 21.23 | ||||||||||||
Net investment income(b) | 0.01 | 0.09 | 0.15 | 0.06 | (c) | 0.06 | ||||||||||||||||
Net realized and unrealized gain (loss) | 12.03 | 4.50 | (4.48 | ) | 6.96 | 0.83 | ||||||||||||||||
Total from investment operations | 12.04 | 4.59 | (4.33 | ) | 7.02 | 0.89 | ||||||||||||||||
Distributions to shareholders from net investment income | (0.22 | ) | (0.05 | ) | (0.01 | ) | — | — | ||||||||||||||
Distributions to shareholders from net realized gains | — | (1.49 | ) | (0.39 | ) | — | — | |||||||||||||||
Total distributions | (0.22 | ) | (1.54 | ) | (0.40 | ) | — | — | ||||||||||||||
Net asset value, end of year | $ | 39.28 | $ | 27.46 | $ | 24.41 | $ | 29.14 | $ | 22.12 | ||||||||||||
| Total return(d) | 44.01 | % | 19.86 | % | (15.11 | )% | 31.74 | % | 4.18 | % | ||||||||||||
Net assets, end of year (in 000s) | $ | 762 | $ | 226 | $ | 392 | $ | 136 | $ | 57 | ||||||||||||
Ratio of net expenses to average net assets | 1.22 | % | 1.27 | % | 1.29 | % | 1.30 | % | 1.34 | % | ||||||||||||
Ratio of total expenses to average net assets | 1.86 | % | 1.85 | % | 1.63 | % | 1.78 | % | 1.93 | % | ||||||||||||
Ratio of net investment income to average net assets | 0.04 | % | 0.35 | % | 0.52 | % | 0.24 | %(c) | 0.27 | % | ||||||||||||
Portfolio turnover rate(e) | 106 | % | 20 | % | 39 | % | 89 | % | 111 | % | ||||||||||||
| (a) | Effective August 15, 2017, Class IR changed its name to Investor Shares. |
| (b) | Calculated based on the average shares outstanding methodology. |
| (c) | Reflects income recognized from special dividends which amounted to $0.04 per share and 0.17% of average net assets. |
| (d) | Assumes investment at the net asset value at the beginning of the year, reinvestment of all distributions, a complete redemption of the investment at the net asset value at the end of the year and no sales or redemption charges (if any). Total returns would be reduced if a sales or redemption charge was taken into account. Returns do not reflect the impact of taxes to shareholders relating to Fund distributions or the redemption of Fund shares. |
| (e) | The Fund’s portfolio turnover rate is calculated in accordance with regulatory requirements, without regard to transactions involving short term investments. If such transactions were included, the Fund’s portfolio turnover rate may be higher. |
| 60 | The accompanying notes are an integral part of these financial statements. |
GOLDMAN SACHS CHINA EQUITY FUND
Financial Highlights (continued)
Selected Data for a Share Outstanding Throughout Each Period
| Goldman Sachs China Equity Fund | ||||||||||||||||||
| Class R6 Shares | ||||||||||||||||||
| Year Ended October 31, | February 28, 2018* to October 31, 2018 | |||||||||||||||||
| 2020 | 2019 | |||||||||||||||||
| Per Share Data | ||||||||||||||||||
Net asset value, beginning of period | $ | 27.54 | $ | 24.56 | $ | 30.83 | ||||||||||||
Net investment income (loss)(a) | (0.02 | ) | 0.15 | 0.19 | ||||||||||||||
Net realized and unrealized gain (loss) | 12.13 | 4.48 | (6.46 | ) | ||||||||||||||
Total from investment operations | 12.11 | 4.63 | (6.27 | ) | ||||||||||||||
Distributions to shareholders from net investment income | (0.26 | ) | (0.16 | ) | — | |||||||||||||
Distributions to shareholders from net realized gains | — | (1.49 | ) | — | ||||||||||||||
Total distributions | (0.26 | ) | (1.65 | ) | — | |||||||||||||
Net asset value, end of period | $ | 39.39 | $ | 27.54 | $ | 24.56 | ||||||||||||
| Total return(b) | 44.15 | % | 19.96 | % | (20.34 | )% | ||||||||||||
Net assets, end of period (in 000s) | $ | 631 | $ | 432 | $ | 8 | ||||||||||||
Ratio of net expenses to average net assets | 1.14 | % | 1.15 | % | 1.15 | %(c) | ||||||||||||
Ratio of total expenses to average net assets | 1.71 | % | 1.70 | % | 1.55 | %(c) | ||||||||||||
Ratio of net investment income (loss) to average net assets | (0.07 | )% | 0.57 | % | 1.00 | %(c) | ||||||||||||
Portfolio turnover rate(d) | 106 | % | 20 | % | 39 | % | ||||||||||||
| * | Commencement of operations. |
| (a) | Calculated based on the average shares outstanding methodology. |
| (b) | Assumes investment at the net asset value at the beginning of the period, reinvestment of all distributions, a complete redemption of the investment at the net asset value at the end of the period and no sales or redemption charges (if any). Total returns would be reduced if a sales or redemption charge was taken into account. Returns do not reflect the impact of taxes to shareholders relating to Fund distributions or the redemption of Fund shares. Total returns for periods less than one full year are not annualized. |
| (c) | Annualized. |
| (d) | The Fund’s portfolio turnover rate is calculated in accordance with regulatory requirements, without regard to transactions involving short term investments. If such transactions were included, the Fund’s portfolio turnover rate may be higher. |
| The accompanying notes are an integral part of these financial statements. | 61 |
GOLDMAN SACHS CHINA EQUITY FUND
Financial Highlights (continued)
Selected Data for a Share Outstanding Throughout Each Period
| Goldman Sachs China Equity Fund | ||||||||||||||||||
| Class P Shares | ||||||||||||||||||
| Year Ended October 31, | April 16, 2018* to October 31, 2018 | |||||||||||||||||
| 2020 | 2019 | |||||||||||||||||
| Per Share Data | ||||||||||||||||||
Net asset value, beginning of period | $ | 27.55 | $ | 24.57 | $ | 30.61 | ||||||||||||
Net investment income(a) | 0.01 | 0.14 | 0.09 | |||||||||||||||
Net realized and unrealized gain (loss) | 12.10 | 4.49 | (6.13 | ) | ||||||||||||||
Total from investment operations | 12.11 | 4.63 | (6.04 | ) | ||||||||||||||
Distributions to shareholders from net investment income | (0.26 | ) | (0.16 | ) | — | |||||||||||||
Distributions to shareholders from net realized gains | — | (1.49 | ) | — | ||||||||||||||
Total distributions | (0.26 | ) | (1.65 | ) | — | |||||||||||||
Net asset value, end of period | $ | 39.40 | $ | 27.55 | $ | 24.57 | ||||||||||||
| Total return(b) | 44.17 | % | 19.98 | % | (19.73 | )% | ||||||||||||
Net assets, end of period (in 000s) | $ | 56,345 | $ | 52,673 | $ | 47,901 | ||||||||||||
Ratio of net expenses to average net assets | 1.14 | % | 1.15 | % | 1.14 | %(c) | ||||||||||||
Ratio of total expenses to average net assets | 1.71 | % | 1.70 | % | 1.77 | %(c) | ||||||||||||
Ratio of net investment income to average net assets | 0.04 | % | 0.55 | % | 0.59 | %(c) | ||||||||||||
Portfolio turnover rate(d) | 106 | % | 20 | % | 39 | % | ||||||||||||
| * | Commencement of operations. |
| (a) | Calculated based on the average shares outstanding methodology. |
| (b) | Assumes investment at the net asset value at the beginning of the period, reinvestment of all distributions, a complete redemption of the investment at the net asset value at the end of the period and no sales or redemption charges (if any). Total returns would be reduced if a sales or redemption charge was taken into account. Returns do not reflect the impact of taxes to shareholders relating to Fund distributions or the redemption of Fund shares. Total returns for periods less than one full year are not annualized. |
| (c) | Annualized. |
| (d) | The Fund’s portfolio turnover rate is calculated in accordance with regulatory requirements, without regard to transactions involving short term investments. If such transactions were included, the Fund’s portfolio turnover rate may be higher. |
| 62 | The accompanying notes are an integral part of these financial statements. |
GOLDMAN SACHS EMERGING MARKETS EQUITY FUND
Financial Highlights (continued)
Selected Data for a Share Outstanding Throughout Each Year
| (a) | Calculated based on the average shares outstanding methodology. |
| (b) | Reflects income recognized from special dividends which amounted to $0.04 per share and 0.19% of average net assets. |
| (c) | Assumes investment at the net asset value at the beginning of the year, reinvestment of all distributions, a complete redemption of the investment at the net asset value at the end of the year and no sales or redemption charges (if any). Total returns would be reduced if a sales or redemption charge was taken into account. Returns do not reflect the impact of taxes to shareholders relating to Fund distributions or the redemption of Fund shares. |
| (d) | The Fund’s portfolio turnover rate is calculated in accordance with regulatory requirements, without regard to transactions involving short term investments. If such transactions were included, the Fund’s portfolio turnover rate may be higher. |
| The accompanying notes are an integral part of these financial statements. | 63 |
GOLDMAN SACHS EMERGING MARKETS EQUITY FUND
Financial Highlights (continued)
Selected Data for a Share Outstanding Throughout Each Year
| Goldman Sachs Emerging Markets Equity Fund | ||||||||||||||||||||||
| Class C Shares | ||||||||||||||||||||||
| Year Ended October 31, | ||||||||||||||||||||||
| 2020 | 2019 | 2018 | 2017 | 2016 | ||||||||||||||||||
| Per Share Data | ||||||||||||||||||||||
Net asset value, beginning of year | $ | 18.12 | $ | 15.34 | $ | 18.72 | $ | 14.53 | $ | 13.31 | ||||||||||||
Net investment loss(a) | (0.06 | ) | (0.06 | ) | (0.05 | ) | (0.09 | )(b) | (0.06 | ) | ||||||||||||
Net realized and unrealized gain (loss) | 3.12 | 2.84 | (3.30 | ) | 4.28 | 1.28 | ||||||||||||||||
Total from investment operations | 3.06 | 2.78 | (3.35 | ) | 4.19 | 1.22 | ||||||||||||||||
Distributions to shareholders from net investment income | (0.02 | ) | — | (0.03 | ) | — | — | |||||||||||||||
Net asset value, end of year | $ | 21.16 | $ | 18.12 | $ | 15.34 | $ | 18.72 | $ | 14.53 | ||||||||||||
| Total return(c) | 16.85 | % | 18.12 | % | (17.91 | )% | 28.84 | % | 9.14 | % | ||||||||||||
Net assets, end of year (in 000s) | $ | 23,425 | $ | 30,115 | $ | 33,252 | $ | 36,286 | $ | 30,104 | ||||||||||||
Ratio of net expenses to average net assets | 2.24 | % | 2.30 | % | 2.31 | % | 2.32 | % | 2.40 | % | ||||||||||||
Ratio of total expenses to average net assets | 2.29 | % | 2.33 | % | 2.39 | % | 2.50 | % | 2.65 | % | ||||||||||||
Ratio of net investment loss to average net assets | (0.34 | )% | (0.33 | )% | (0.25 | )% | (0.55 | )%(b) | (0.48 | )% | ||||||||||||
Portfolio turnover rate(d) | 31 | % | 33 | % | 52 | % | 113 | % | 92 | % | ||||||||||||
| (a) | Calculated based on the average shares outstanding methodology. |
| (b) | Reflects income recognized from special dividends which amounted to $0.04 per share and 0.19% of average net assets. |
| (c) | Assumes investment at the net asset value at the beginning of the year, reinvestment of all distributions, a complete redemption of the investment at the net asset value at the end of the year and no sales or redemption charges (if any). Total returns would be reduced if a sales or redemption charge was taken into account. Returns do not reflect the impact of taxes to shareholders relating to Fund distributions or the redemption of Fund shares. |
| (d) | The Fund’s portfolio turnover rate is calculated in accordance with regulatory requirements, without regard to transactions involving short term investments. If such transactions were included, the Fund’s portfolio turnover rate may be higher. |
| 64 | The accompanying notes are an integral part of these financial statements. |
GOLDMAN SACHS EMERGING MARKETS EQUITY FUND
Financial Highlights (continued)
Selected Data for a Share Outstanding Throughout Each Year
| Goldman Sachs Emerging Markets Equity Fund | ||||||||||||||||||||||
| Institutional Shares | ||||||||||||||||||||||
| Year Ended October 31, | ||||||||||||||||||||||
| 2020 | 2019 | 2018 | 2017 | 2016 | ||||||||||||||||||
| Per Share Data | ||||||||||||||||||||||
Net asset value, beginning of year | $ | 21.85 | $ | 18.43 | $ | 22.40 | $ | 17.38 | $ | 15.75 | ||||||||||||
Net investment income(a) | 0.21 | 0.17 | 0.20 | 0.12 | (b) | 0.11 | ||||||||||||||||
Net realized and unrealized gain (loss) | 3.73 | 3.40 | (3.96 | ) | 5.07 | 1.54 | ||||||||||||||||
Total from investment operations | 3.94 | 3.57 | (3.76 | ) | 5.19 | 1.65 | ||||||||||||||||
Distributions to shareholders from net investment income | (0.25 | ) | (0.15 | ) | (0.21 | ) | (0.17 | ) | (0.02 | ) | ||||||||||||
Net asset value, end of year | $ | 25.54 | $ | 21.85 | $ | 18.43 | $ | 22.40 | $ | 17.38 | ||||||||||||
| Total return(c) | 18.11 | % | 19.51 | % | (16.99 | )% | 30.31 | % | 10.43 | % | ||||||||||||
Net assets, end of year (in 000s) | $ | 1,479,859 | $ | 940,632 | $ | 678,197 | $ | 664,085 | $ | 445,019 | ||||||||||||
Ratio of net expenses to average net assets | 1.16 | % | 1.17 | % | 1.17 | % | 1.18 | % | 1.25 | % | ||||||||||||
Ratio of total expenses to average net assets | 1.17 | % | 1.19 | % | 1.24 | % | 1.36 | % | 1.50 | % | ||||||||||||
Ratio of net investment income to average net assets | 0.93 | % | 0.84 | % | 0.91 | % | 0.63 | %(b) | 0.69 | % | ||||||||||||
Portfolio turnover rate(d) | 31 | % | 33 | % | 52 | % | 113 | % | 92 | % | ||||||||||||
| (a) | Calculated based on the average shares outstanding methodology. |
| (b) | Reflects income recognized from special dividends which amounted to $0.04 per share and 0.19% of average net assets. |
| (c) | Assumes investment at the net asset value at the beginning of the year, reinvestment of all distributions, a complete redemption of the investment at the net asset value at the end of the year and no sales or redemption charges (if any). Total returns would be reduced if a sales or redemption charge was taken into account. Returns do not reflect the impact of taxes to shareholders relating to Fund distributions or the redemption of Fund shares. |
| (d) | The Fund’s portfolio turnover rate is calculated in accordance with regulatory requirements, without regard to transactions involving short term investments. If such transactions were included, the Fund’s portfolio turnover rate may be higher. |
| The accompanying notes are an integral part of these financial statements. | 65 |
GOLDMAN SACHS EMERGING MARKETS EQUITY FUND
Financial Highlights (continued)
Selected Data for a Share Outstanding Throughout Each Year
| Goldman Sachs Emerging Markets Equity Fund | ||||||||||||||||||||||
| Service Shares | ||||||||||||||||||||||
| Year Ended October 31, | ||||||||||||||||||||||
| 2020 | 2019 | 2018 | 2017 | 2016 | ||||||||||||||||||
| Per Share Data | ||||||||||||||||||||||
Net asset value, beginning of year | $ | 19.68 | $ | 16.60 | $ | 20.21 | $ | 15.71 | $ | 14.29 | ||||||||||||
Net investment income(a) | 0.07 | 0.06 | 0.07 | 0.02 | (b) | 0.02 | ||||||||||||||||
Net realized and unrealized gain (loss) | 3.38 | 3.06 | (3.56 | ) | 4.59 | 1.40 | ||||||||||||||||
Total from investment operations | 3.45 | 3.12 | (3.49 | ) | 4.61 | 1.42 | ||||||||||||||||
Distributions to shareholders from net investment income | (0.16 | ) | (0.04 | ) | (0.12 | ) | (0.11 | ) | — | |||||||||||||
Net asset value, end of year | $ | 22.97 | $ | 19.68 | $ | 16.60 | $ | 20.21 | $ | 15.71 | ||||||||||||
| Total return(c) | 17.55 | % | 18.85 | % | (17.38 | )% | 29.65 | % | 9.91 | % | ||||||||||||
Net assets, end of year (in 000s) | $ | 26,329 | $ | 24,183 | $ | 19,922 | $ | 26,049 | $ | 19,069 | ||||||||||||
Ratio of net expenses to average net assets | 1.65 | % | 1.67 | % | 1.67 | % | 1.68 | % | 1.75 | % | ||||||||||||
Ratio of total expenses to average net assets | 1.67 | % | 1.69 | % | 1.75 | % | 1.86 | % | 2.00 | % | ||||||||||||
Ratio of net investment income to average net assets | 0.35 | % | 0.32 | % | 0.36 | % | 0.11 | %(b) | 0.17 | % | ||||||||||||
Portfolio turnover rate(d) | 31 | % | 33 | % | 52 | % | 113 | % | 92 | % | ||||||||||||
| (a) | Calculated based on the average shares outstanding methodology. |
| (b) | Reflects income recognized from special dividends which amounted to $0.04 per share and 0.19% of average net assets. |
| (c) | Assumes investment at the net asset value at the beginning of the year, reinvestment of all distributions, a complete redemption of the investment at the net asset value at the end of the year and no sales or redemption charges (if any). Total returns would be reduced if a sales or redemption charge was taken into account. Returns do not reflect the impact of taxes to shareholders relating to Fund distributions or the redemption of Fund shares. |
| (d) | The Fund’s portfolio turnover rate is calculated in accordance with regulatory requirements, without regard to transactions involving short term investments. If such transactions were included, the Fund’s portfolio turnover rate may be higher. |
| 66 | The accompanying notes are an integral part of these financial statements. |
GOLDMAN SACHS EMERGING MARKETS EQUITY FUND
Financial Highlights (continued)
Selected Data for a Share Outstanding Throughout Each Year
| Goldman Sachs Emerging Markets Equity Fund | ||||||||||||||||||||||
| Investor Shares(a) | ||||||||||||||||||||||
| Year Ended October 31, | ||||||||||||||||||||||
| 2020 | 2019 | 2018 | 2017 | 2016 | ||||||||||||||||||
| Per Share Data | ||||||||||||||||||||||
Net asset value, beginning of year | $ | 21.66 | $ | 18.28 | $ | 22.24 | $ | 17.27 | $ | 15.67 | ||||||||||||
Net investment income(b) | 0.16 | 0.12 | 0.17 | 0.13 | (c) | 0.08 | ||||||||||||||||
Net realized and unrealized gain (loss) | 3.73 | 3.38 | (3.94 | ) | 5.01 | 1.53 | ||||||||||||||||
Total from investment operations | 3.89 | 3.50 | (3.77 | ) | 5.14 | 1.61 | ||||||||||||||||
Distributions to shareholders from net investment income | (0.22 | ) | (0.12 | ) | (0.19 | ) | (0.17 | ) | (0.01 | ) | ||||||||||||
Net asset value, end of year | $ | 25.33 | $ | 21.66 | $ | 18.28 | $ | 22.24 | $ | 17.27 | ||||||||||||
| Total return(d) | 18.02 | % | 19.31 | % | (17.07 | )% | 30.11 | % | 10.26 | % | ||||||||||||
Net assets, end of year (in 000s) | $ | 147,386 | $ | 135,484 | $ | 139,726 | $ | 62,974 | $ | 5,263 | ||||||||||||
Ratio of net expenses to average net assets | 1.24 | % | 1.30 | % | 1.31 | % | 1.31 | % | 1.40 | % | ||||||||||||
Ratio of total expenses to average net assets | 1.29 | % | 1.33 | % | 1.38 | % | 1.49 | % | 1.64 | % | ||||||||||||
Ratio of net investment income to average net assets | 0.70 | % | 0.58 | % | 0.79 | % | 0.67 | %(c) | 0.52 | % | ||||||||||||
Portfolio turnover rate(e) | 31 | % | 33 | % | 52 | % | 113 | % | 92 | % | ||||||||||||
| (a) | Effective August 15, 2017, Class IR changed its name to Investor Shares. |
| (b) | Calculated based on the average shares outstanding methodology. |
| (c) | Reflects income recognized from special dividends which amounted to $0.04 per share and 0.19% of average net assets. |
| (d) | Assumes investment at the net asset value at the beginning of the year, reinvestment of all distributions, a complete redemption of the investment at the net asset value at the end of the year and no sales or redemption charges (if any). Total returns would be reduced if a sales or redemption charge was taken into account. Returns do not reflect the impact of taxes to shareholders relating to Fund distributions or the redemption of Fund shares. |
| (e) | The Fund’s portfolio turnover rate is calculated in accordance with regulatory requirements, without regard to transactions involving short term investments. If such transactions were included, the Fund’s portfolio turnover rate may be higher. |
| The accompanying notes are an integral part of these financial statements. | 67 |
GOLDMAN SACHS EMERGING MARKETS EQUITY FUND
Financial Highlights (continued)
Selected Data for a Share Outstanding Throughout Each Year
| Goldman Sachs Emerging Markets Equity Fund | ||||||||||||||||||||||
| Class R6 Shares | ||||||||||||||||||||||
| Year Ended October 31, | ||||||||||||||||||||||
| 2020 | 2019 | 2018 | 2017 | 2016 | ||||||||||||||||||
| Per Share Data | ||||||||||||||||||||||
Net asset value, beginning of year | $ | 21.94 | $ | 18.51 | $ | 22.41 | $ | 17.38 | $ | 15.74 | ||||||||||||
Net investment income(a) | 0.16 | 0.17 | 0.21 | 0.16 | (b) | 0.10 | ||||||||||||||||
Net realized and unrealized gain (loss) | 3.80 | 3.41 | (4.00 | ) | 5.05 | 1.56 | ||||||||||||||||
Total from investment operations | 3.96 | 3.58 | (3.79 | ) | 5.21 | 1.66 | ||||||||||||||||
Distributions to shareholders from net investment income | (0.25 | ) | (0.15 | ) | (0.11 | ) | (0.18 | ) | (0.02 | ) | ||||||||||||
Net asset value, end of year | $ | 25.65 | $ | 21.94 | $ | 18.51 | $ | 22.41 | $ | 17.38 | ||||||||||||
| Total return(c) | 18.13 | % | 19.52 | % | (16.96 | )% | 30.35 | % | 10.52 | % | ||||||||||||
Net assets, end of year (in 000s) | $ | 53,424 | $ | 25,387 | $ | 37,865 | $ | 245 | $ | 5,012 | ||||||||||||
Ratio of net expenses to average net assets | 1.15 | % | 1.16 | % | 1.16 | % | 1.17 | % | 1.23 | % | ||||||||||||
Ratio of total expenses to average net assets | 1.16 | % | 1.18 | % | 1.21 | % | 1.35 | % | 1.44 | % | ||||||||||||
Ratio of net investment income to average net assets | 0.71 | % | 0.82 | % | 0.99 | % | 0.88 | %(b) | 0.57 | % | ||||||||||||
Portfolio turnover rate(d) | 31 | % | 33 | % | 52 | % | 113 | % | 92 | % | ||||||||||||
| (a) | Calculated based on the average shares outstanding methodology. |
| (b) | Reflects income recognized from special dividends which amounted to $0.04 per share and 0.19% of average net assets. |
| (c) | Assumes investment at the net asset value at the beginning of the year, reinvestment of all distributions, a complete redemption of the investment at the net asset value at the end of the year and no sales or redemption charges (if any). Total returns would be reduced if a sales or redemption charge was taken into account. Returns do not reflect the impact of taxes to shareholders relating to Fund distributions or the redemption of Fund shares. |
| (d) | The Fund’s portfolio turnover rate is calculated in accordance with regulatory requirements, without regard to transactions involving short term investments. If such transactions were included, the Fund’s portfolio turnover rate may be higher. |
| 68 | The accompanying notes are an integral part of these financial statements. |
GOLDMAN SACHS EMERGING MARKETS EQUITY FUND
Financial Highlights (continued)
Selected Data for a Share Outstanding Throughout Each Period
| Goldman Sachs Emerging Markets Equity Fund | ||||||||||||||||||
| Class P Shares | ||||||||||||||||||
| Year Ended October 31, | April 16, 2018* to October 31, 2018 | |||||||||||||||||
| 2020 | 2019 | |||||||||||||||||
| Per Share Data | ||||||||||||||||||
Net asset value, beginning of period | $ | 21.94 | $ | 18.51 | $ | 23.46 | ||||||||||||
Net investment income(a) | 0.19 | 0.17 | 0.10 | |||||||||||||||
Net realized and unrealized gain (loss) | 3.77 | 3.41 | (5.05 | ) | ||||||||||||||
Total from investment operations | 3.96 | 3.58 | (4.95 | ) | ||||||||||||||
Distributions to shareholders from net investment income | (0.25 | ) | (0.15 | ) | — | |||||||||||||
Net asset value, end of period | $ | 25.65 | $ | 21.94 | $ | 18.51 | ||||||||||||
| Total return(b) | 18.14 | % | 19.47 | % | (21.06 | )% | ||||||||||||
Net assets, end of period (in 000s) | $ | 471,690 | $ | 389,019 | $ | 311,447 | ||||||||||||
Ratio of net expenses to average net assets | 1.15 | % | 1.16 | % | 1.15 | %(c) | ||||||||||||
Ratio of total expenses to average net assets | 1.15 | % | 1.18 | % | 1.24 | %(c) | ||||||||||||
Ratio of net investment income to average net assets | 0.86 | % | 0.82 | % | 0.94 | %(c) | ||||||||||||
Portfolio turnover rate(d) | 31 | % | 33 | % | 52 | % | ||||||||||||
| * | Commencement of operations. |
| (a) | Calculated based on the average shares outstanding methodology. |
| (b) | Assumes investment at the net asset value at the beginning of the period, reinvestment of all distributions, a complete redemption of the investment at the net asset value at the end of the period and no sales or redemption charges (if any). Total returns would be reduced if a sales or redemption charge was taken into account. Returns do not reflect the impact of taxes to shareholders relating to Fund distributions or the redemption of Fund shares. Total returns for periods less than one full year are not annualized. |
| (c) | Annualized. |
| (d) | The Fund’s portfolio turnover rate is calculated in accordance with regulatory requirements, without regard to transactions involving short term investments. If such transactions were included, the Fund’s portfolio turnover rate may be higher. |
| The accompanying notes are an integral part of these financial statements. | 69 |
GOLDMAN SACHS ESG EMERGING MARKETS EQUITY FUND
Financial Highlights (continued)
Selected Data for a Share Outstanding Throughout Each Period
| * | Commencement of operations. |
| (a) | Calculated based on the average shares outstanding methodology. |
| (b) | Amount is less than $0.005 per share. |
| (c) | Assumes investment at the net asset value at the beginning of the period, reinvestment of all distributions, a complete redemption of the investment at the net asset value at the end of the period and no sales or redemption charges (if any). Total returns would be reduced if a sales or redemption charge was taken into account. Returns do not reflect the impact of taxes to shareholders relating to Fund distributions or the redemption of Fund shares. Total returns for periods less than one full year are not annualized. |
| (d) | Annualized. |
| (e) | The Fund’s portfolio turnover rate is calculated in accordance with regulatory requirements, without regard to transactions involving short term investments. If such transactions were included, the Fund’s portfolio turnover rate may be higher. |
| 70 | The accompanying notes are an integral part of these financial statements. |
GOLDMAN SACHS ESG EMERGING MARKETS EQUITY FUND
Financial Highlights (continued)
Selected Data for a Share Outstanding Throughout Each Period
| Goldman Sachs ESG Emerging Markets Equity Fund | ||||||||||||||||||
| Class C Shares | ||||||||||||||||||
| Year Ended October 31, | May 31, 2018* to October 31, 2018 | |||||||||||||||||
| 2020 | 2019 | |||||||||||||||||
| Per Share Data | ||||||||||||||||||
Net asset value, beginning of period | $ | 9.87 | $ | 8.37 | $ | 10.00 | ||||||||||||
Net investment loss(a) | (0.09 | ) | (0.03 | ) | — | (b) | ||||||||||||
Net realized and unrealized gain (loss) | 1.83 | 1.53 | (1.63 | ) | ||||||||||||||
Total from investment operations | 1.74 | 1.50 | (1.63 | ) | ||||||||||||||
Net asset value, end of period | $ | 11.61 | $ | 9.87 | $ | 8.37 | ||||||||||||
| Total return(c) | 17.58 | % | 17.92 | % | (16.30 | )% | ||||||||||||
Net assets, end of period (in 000s) | $ | 58 | $ | 49 | $ | 42 | ||||||||||||
Ratio of net expenses to average net assets | 2.24 | % | 2.35 | % | 2.28 | %(d) | ||||||||||||
Ratio of total expenses to average net assets | 6.94 | % | 8.49 | % | 11.03 | %(d) | ||||||||||||
Ratio of net investment loss to average net assets | (0.84 | )% | (0.31 | )% | (0.11 | )%(d) | ||||||||||||
Portfolio turnover rate(e) | 28 | % | 57 | % | 23 | % | ||||||||||||
| * | Commencement of operations. |
| (a) | Calculated based on the average shares outstanding methodology. |
| (b) | Amount is less than $0.005 per share. |
| (c) | Assumes investment at the net asset value at the beginning of the period, reinvestment of all distributions, a complete redemption of the investment at the net asset value at the end of the period and no sales or redemption charges (if any). Total returns would be reduced if a sales or redemption charge was taken into account. Returns do not reflect the impact of taxes to shareholders relating to Fund distributions or the redemption of Fund shares. Total returns for periods less than one full year are not annualized. |
| (d) | Annualized. |
| (e) | The Fund’s portfolio turnover rate is calculated in accordance with regulatory requirements, without regard to transactions involving short term investments. If such transactions were included, the Fund’s portfolio turnover rate may be higher. |
| The accompanying notes are an integral part of these financial statements. | 71 |
GOLDMAN SACHS ESG EMERGING MARKETS EQUITY FUND
Financial Highlights (continued)
Selected Data for a Share Outstanding Throughout Each Period
| Goldman Sachs ESG Emerging Markets Equity Fund | ||||||||||||||||||
| Institutional Shares | ||||||||||||||||||
| Year Ended October 31, | May 31, 2018* to October 31, 2018 | |||||||||||||||||
| 2020 | 2019 | |||||||||||||||||
| Per Share Data | ||||||||||||||||||
Net asset value, beginning of period | $ | 9.98 | $ | 8.41 | $ | 10.00 | ||||||||||||
Net investment income(a) | 0.03 | 0.08 | 0.04 | |||||||||||||||
Net realized and unrealized gain (loss) | 1.85 | 1.53 | (1.63 | ) | ||||||||||||||
Total from investment operations | 1.88 | 1.61 | (1.59 | ) | ||||||||||||||
Distributions to shareholders from net investment income | (0.09 | ) | (0.04 | ) | — | |||||||||||||
Net asset value, end of period | $ | 11.77 | $ | 9.98 | $ | 8.41 | ||||||||||||
| Total return(b) | 18.91 | % | 19.26 | % | (15.90 | )% | ||||||||||||
Net assets, end of period (in 000s) | $ | 8,631 | $ | 6,912 | $ | 5,679 | ||||||||||||
Ratio of net expenses to average net assets | 1.14 | % | 1.21 | % | 1.14 | %(c) | ||||||||||||
Ratio of total expenses to average net assets | 5.83 | % | 7.31 | % | 9.89 | %(c) | ||||||||||||
Ratio of net investment income to average net assets | 0.26 | % | 0.85 | % | 1.03 | %(c) | ||||||||||||
Portfolio turnover rate(d) | 28 | % | 57 | % | 23 | % | ||||||||||||
| * | Commencement of operations. |
| (a) | Calculated based on the average shares outstanding methodology. |
| (b) | Assumes investment at the net asset value at the beginning of the period, reinvestment of all distributions, a complete redemption of the investment at the net asset value at the end of the period and no sales or redemption charges (if any). Total returns would be reduced if a sales or redemption charge was taken into account. Returns do not reflect the impact of taxes to shareholders relating to Fund distributions or the redemption of Fund shares. Total returns for periods less than one full year are not annualized. |
| (c) | Annualized. |
| (d) | The Fund’s portfolio turnover rate is calculated in accordance with regulatory requirements, without regard to transactions involving short term investments. If such transactions were included, the Fund’s portfolio turnover rate may be higher. |
| 72 | The accompanying notes are an integral part of these financial statements. |
GOLDMAN SACHS ESG EMERGING MARKETS EQUITY FUND
Financial Highlights (continued)
Selected Data for a Share Outstanding Throughout Each Period
| Goldman Sachs ESG Emerging Markets Equity Fund | ||||||||||||||||||
| Investor Shares | ||||||||||||||||||
| Year Ended October 31, | May 31, 2018* to October 31, 2018 | |||||||||||||||||
| 2020 | 2019 | |||||||||||||||||
| Per Share Data | ||||||||||||||||||
Net asset value, beginning of period | $ | 9.97 | $ | 8.41 | $ | 10.00 | ||||||||||||
Net investment income(a) | 0.02 | 0.06 | 0.03 | |||||||||||||||
Net realized and unrealized gain (loss) | 1.85 | 1.53 | (1.62 | ) | ||||||||||||||
Total from investment operations | 1.87 | 1.59 | (1.59 | ) | ||||||||||||||
Distributions to shareholders from net investment income | (0.08 | ) | (0.03 | ) | — | |||||||||||||
Net asset value, end of period | $ | 11.76 | $ | 9.97 | $ | 8.41 | ||||||||||||
| Total return(b) | 18.79 | % | 19.03 | % | (15.90 | )% | ||||||||||||
Net assets, end of period (in 000s) | $ | 59 | $ | 50 | $ | 42 | ||||||||||||
Ratio of net expenses to average net assets | 1.24 | % | 1.35 | % | 1.28 | %(c) | ||||||||||||
Ratio of total expenses to average net assets | 5.94 | % | 7.49 | % | 10.03 | %(c) | ||||||||||||
Ratio of net investment income to average net assets | 0.15 | % | 0.69 | % | 0.89 | %(c) | ||||||||||||
Portfolio turnover rate(d) | 28 | % | 57 | % | 23 | % | ||||||||||||
| * | Commencement of operations. |
| (a) | Calculated based on the average shares outstanding methodology. |
| (b) | Assumes investment at the net asset value at the beginning of the period, reinvestment of all distributions, a complete redemption of the investment at the net asset value at the end of the period and no sales or redemption charges (if any). Total returns would be reduced if a sales or redemption charge was taken into account. Returns do not reflect the impact of taxes to shareholders relating to Fund distributions or the redemption of Fund shares. Total returns for periods less than one full year are not annualized. |
| (c) | Annualized. |
| (d) | The Fund’s portfolio turnover rate is calculated in accordance with regulatory requirements, without regard to transactions involving short term investments. If such transactions were included, the Fund’s portfolio turnover rate may be higher. |
| The accompanying notes are an integral part of these financial statements. | 73 |
GOLDMAN SACHS ESG EMERGING MARKETS EQUITY FUND
Financial Highlights (continued)
Selected Data for a Share Outstanding Throughout Each Period
| Goldman Sachs ESG Emerging Markets Equity Fund | ||||||||||||||||||
| Class R6 Shares | ||||||||||||||||||
| Year Ended October 31, | May 31, 2018* to October 31, 2018 | |||||||||||||||||
| 2020 | 2019 | |||||||||||||||||
| Per Share Data | ||||||||||||||||||
Net asset value, beginning of period | $ | 9.98 | $ | 8.41 | $ | 10.00 | ||||||||||||
Net investment income(a) | 0.03 | 0.08 | 0.04 | |||||||||||||||
Net realized and unrealized gain (loss) | 1.85 | 1.53 | (1.63 | ) | ||||||||||||||
Total from investment operations | 1.88 | 1.61 | (1.59 | ) | ||||||||||||||
Distributions to shareholders from net investment income | (0.09 | ) | (0.04 | ) | — | |||||||||||||
Net asset value, end of period | $ | 11.77 | $ | 9.98 | $ | 8.41 | ||||||||||||
| Total return(b) | 18.92 | % | 19.26 | % | (15.90 | )% | ||||||||||||
Net assets, end of period (in 000s) | $ | 65 | $ | 50 | $ | 42 | ||||||||||||
Ratio of net expenses to average net assets | 1.13 | % | 1.20 | % | 1.13 | %(c) | ||||||||||||
Ratio of total expenses to average net assets | 5.84 | % | 7.34 | % | 9.88 | %(c) | ||||||||||||
Ratio of net investment income to average net assets | 0.26 | % | 0.84 | % | 1.04 | %(c) | ||||||||||||
Portfolio turnover rate(d) | 28 | % | 57 | % | 23 | % | ||||||||||||
| * | Commencement of operations. |
| (a) | Calculated based on the average shares outstanding methodology. |
| (b) | Assumes investment at the net asset value at the beginning of the period, reinvestment of all distributions, a complete redemption of the investment at the net asset value at the end of the period and no sales or redemption charges (if any). Total returns would be reduced if a sales or redemption charge was taken into account. Returns do not reflect the impact of taxes to shareholders relating to Fund distributions or the redemption of Fund shares. Total returns for periods less than one full year are not annualized. |
| (c) | Annualized. |
| (d) | The Fund’s portfolio turnover rate is calculated in accordance with regulatory requirements, without regard to transactions involving short term investments. If such transactions were included, the Fund’s portfolio turnover rate may be higher. |
| 74 | The accompanying notes are an integral part of these financial statements. |
GOLDMAN SACHS ESG EMERGING MARKETS EQUITY FUND
Financial Highlights (continued)
Selected Data for a Share Outstanding Throughout Each Period
| Goldman Sachs ESG Emerging Markets Equity Fund | ||||||||||||||||||
| Class R Shares | ||||||||||||||||||
| Year Ended October 31, | May 31, 2018* to October 31, 2018 | |||||||||||||||||
| 2020 | 2019 | |||||||||||||||||
| Per Share Data | ||||||||||||||||||
Net asset value, beginning of period | $ | 9.94 | $ | 8.39 | $ | 10.00 | ||||||||||||
Net investment income (loss)(a) | (0.03 | ) | 0.01 | 0.02 | ||||||||||||||
Net realized and unrealized gain (loss) | 1.83 | 1.55 | (1.63 | ) | ||||||||||||||
Total from investment operations | 1.80 | 1.56 | (1.61 | ) | ||||||||||||||
Distributions to shareholders from net investment income | (0.06 | ) | (0.01 | ) | — | |||||||||||||
Net asset value, end of period | $ | 11.68 | $ | 9.94 | $ | 8.39 | ||||||||||||
| Total return(b) | 18.11 | % | 18.57 | % | (16.10 | )% | ||||||||||||
Net assets, end of period (in 000s) | $ | 255 | $ | 167 | $ | 42 | ||||||||||||
Ratio of net expenses to average net assets | 1.74 | % | 1.92 | % | 1.78 | %(c) | ||||||||||||
Ratio of total expenses to average net assets | 6.53 | % | 7.68 | % | 10.53 | %(c) | ||||||||||||
Ratio of net investment income (loss) to average net assets | (0.34 | )% | 0.06 | % | 0.39 | %(c) | ||||||||||||
Portfolio turnover rate(d) | 28 | % | 57 | % | 23 | % | ||||||||||||
| * | Commencement of operations. |
| (a) | Calculated based on the average shares outstanding methodology. |
| (b) | Assumes investment at the net asset value at the beginning of the period, reinvestment of all distributions, a complete redemption of the investment at the net asset value at the end of the period and no sales or redemption charges (if any). Total returns would be reduced if a sales or redemption charge was taken into account. Returns do not reflect the impact of taxes to shareholders relating to Fund distributions or the redemption of Fund shares. Total returns for periods less than one full year are not annualized. |
| (c) | Annualized. |
| (d) | The Fund’s portfolio turnover rate is calculated in accordance with regulatory requirements, without regard to transactions involving short term investments. If such transactions were included, the Fund’s portfolio turnover rate may be higher. |
| The accompanying notes are an integral part of these financial statements. | 75 |
GOLDMAN SACHS ESG EMERGING MARKETS EQUITY FUND
Financial Highlights (continued)
Selected Data for a Share Outstanding Throughout The Period
| Goldman Sachs ESG Emerging Markets Equity Fund | ||||||
| Class P Shares | ||||||
January 21, 2020* to | ||||||
| Per Share Data | ||||||
Net asset value, beginning of period | $ | 10.87 | ||||
Net investment income(a) | 0.03 | |||||
Net realized and unrealized gain | 0.87 | |||||
Total from investment operations | 0.90 | |||||
Net asset value, end of period | $ | 11.77 | ||||
| Total return(b) | 8.28 | % | ||||
Net assets, end of period (in 000s) | $ | 86 | ||||
Ratio of net expenses to average net assets | 1.08 | %(c) | ||||
Ratio of total expenses to average net assets | 6.51 | %(c) | ||||
Ratio of net investment income to average net assets | 0.30 | %(c) | ||||
Portfolio turnover rate(d) | 28 | % | ||||
| * | Commencement of operations. |
| (a) | Calculated based on the average shares outstanding methodology. |
| (b) | Assumes investment at the net asset value at the beginning of the period, reinvestment of all distributions, a complete redemption of the investment at the net asset value at the end of the period and no sales or redemption charges (if any). Total returns would be reduced if a sales or redemption charge was taken into account. Returns do not reflect the impact of taxes to shareholders relating to Fund distributions or the redemption of Fund shares. Total returns for periods less than one full year are not annualized. |
| (c) | Annualized. |
| (d) | The Fund’s portfolio turnover rate is calculated in accordance with regulatory requirements, without regard to transactions involving short term investments. If such transactions were included, the Fund’s portfolio turnover rate may be higher. |
| 76 | The accompanying notes are an integral part of these financial statements. |
GOLDMAN SACHS IMPRINT EMERGING MARKETS OPPORTUNITIES FUND
Financial Highlights (continued)
Selected Data for a Share Outstanding Throughout Each Year
| (a) | Calculated based on the average shares outstanding methodology. |
| (b) | Reflects income recognized from a corporate action which amounted to $0.25 per share and 2.90% of average net assets. |
| (c) | Amount is less than $0.005 per share. |
| (d) | Assumes investment at the net asset value at the beginning of the year, reinvestment of all distributions, a complete redemption of the investment at the net asset value at the end of the year and no sales or redemption charges (if any). Total returns would be reduced if a sales or redemption charge was taken into account. Returns do not reflect the impact of taxes to shareholders relating to Fund distributions or the redemption of Fund shares. |
| (e) | The Fund’s portfolio turnover rate is calculated in accordance with regulatory requirements, without regard to transactions involving short term investments. If such transactions were included, the Fund’s portfolio turnover rate may be higher. |
| The accompanying notes are an integral part of these financial statements. | 77 |
GOLDMAN SACHS IMPRINT EMERGING MARKETS OPPORTUNITIES FUND
Financial Highlights (continued)
Selected Data for a Share Outstanding Throughout Each Year
| Goldman Sachs Imprint Emerging Markets Opportunities Fund | ||||||||||||||||||||||
| Class C Shares | ||||||||||||||||||||||
| Year Ended October 31, | ||||||||||||||||||||||
| 2020 | 2019 | 2018 | 2017 | 2016 | ||||||||||||||||||
| Per Share Data | ||||||||||||||||||||||
Net asset value, beginning of year | $ | 8.02 | $ | 7.64 | $ | 9.51 | $ | 8.66 | $ | 8.98 | ||||||||||||
Net investment income (loss)(a) | (0.09 | ) | 0.23 | (b) | (0.01 | ) | (0.01 | ) | (0.01 | ) | ||||||||||||
Net realized and unrealized gain (loss) | 0.51 | 0.15 | (1.86 | ) | 0.86 | (0.31 | ) | |||||||||||||||
Total from investment operations | 0.42 | 0.38 | (1.87 | ) | 0.85 | (0.32 | ) | |||||||||||||||
Distributions to shareholders from net investment income | (0.32 | ) | — | — | — | — | ||||||||||||||||
Net asset value, end of year | $ | 8.12 | $ | 8.02 | $ | 7.64 | $ | 9.51 | $ | 8.66 | ||||||||||||
| Total return(c) | 5.09 | % | 4.97 | % | (19.66 | )% | 9.82 | % | (3.55 | )% | ||||||||||||
Net assets, end of year (in 000s) | $ | 782 | $ | 1,249 | $ | 2,082 | $ | 3,854 | $ | 5,642 | ||||||||||||
Ratio of net expenses to average net assets | 2.37 | % | 2.48 | % | 2.47 | % | 2.48 | % | 2.49 | % | ||||||||||||
Ratio of total expenses to average net assets | 4.78 | % | 3.87 | % | 3.10 | % | 2.84 | % | 3.14 | % | ||||||||||||
Ratio of net investment income (loss) to average net assets | (1.18 | )% | 2.84 | %(b) | (0.11 | )% | (0.15 | )% | (0.07 | )% | ||||||||||||
Portfolio turnover rate(d) | 91 | % | 85 | % | 11 | % | 26 | % | 27 | % | ||||||||||||
| (a) | Calculated based on the average shares outstanding methodology. |
| (b) | Reflects income recognized from a corporate action which amounted to $0.25 per share and 2.90% of average net assets. |
| (c) | Assumes investment at the net asset value at the beginning of the year, reinvestment of all distributions, a complete redemption of the investment at the net asset value at the end of the year and no sales or redemption charges (if any). Total returns would be reduced if a sales or redemption charge was taken into account. Returns do not reflect the impact of taxes to shareholders relating to Fund distributions or the redemption of Fund shares. |
| (d) | The Fund’s portfolio turnover rate is calculated in accordance with regulatory requirements, without regard to transactions involving short term investments. If such transactions were included, the Fund’s portfolio turnover rate may be higher. |
| 78 | The accompanying notes are an integral part of these financial statements. |
GOLDMAN SACHS IMPRINT EMERGING MARKETS OPPORTUNITIES FUND
Financial Highlights (continued)
Selected Data for a Share Outstanding Throughout Each Year
| Goldman Sachs Imprint Emerging Markets Opportunities Fund | ||||||||||||||||||||||
| Institutional Shares | ||||||||||||||||||||||
| Year Ended October 31, | ||||||||||||||||||||||
| 2020 | 2019 | 2018 | 2017 | 2016 | ||||||||||||||||||
| Per Share Data |
| |||||||||||||||||||||
Net asset value, beginning of year | $ | 8.49 | $ | 8.12 | $ | 10.02 | $ | 9.02 | $ | 9.33 | ||||||||||||
Net investment income (loss)(a) | (0.01 | ) | 0.28 | (b) | 0.12 | 0.09 | 0.10 | |||||||||||||||
Net realized and unrealized gain (loss) | 0.55 | 0.20 | (1.99 | ) | 0.91 | (0.33 | ) | |||||||||||||||
Total from investment operations | 0.54 | 0.48 | (1.87 | ) | 1.00 | (0.23 | ) | |||||||||||||||
Distributions to shareholders from net investment income | (0.45 | ) | (0.11 | ) | (0.03 | ) | — | (c) | (0.08 | ) | ||||||||||||
Net asset value, end of year | $ | 8.58 | $ | 8.49 | $ | 8.12 | $ | 10.02 | $ | 9.02 | ||||||||||||
| Total return(d) | 6.31 | % | 6.02 | % | (18.62 | )% | 11.02 | % | (2.46 | )% | ||||||||||||
Net assets, end of year (in 000s) | $ | 3,408 | $ | 4,082 | $ | 12,270 | $ | 50,730 | $ | 58,958 | ||||||||||||
Ratio of net expenses to average net assets | 1.25 | % | 1.34 | % | 1.33 | % | 1.33 | % | 1.33 | % | ||||||||||||
Ratio of total expenses to average net assets | 3.70 | % | 2.71 | % | 1.91 | % | 1.67 | % | 1.99 | % | ||||||||||||
Ratio of net investment income (loss) to average net assets | (0.06 | )% | 3.29 | %(b) | 1.24 | % | 0.94 | % | 1.08 | % | ||||||||||||
Portfolio turnover rate(e) | 91 | % | 85 | % | 11 | % | 26 | % | 27 | % | ||||||||||||
| (a) | Calculated based on the average shares outstanding methodology. |
| (b) | Reflects income recognized from a corporate action which amounted to $0.25 per share and 2.90% of average net assets. |
| (c) | Amount is less than $0.005 per share. |
| (d) | Assumes investment at the net asset value at the beginning of the year, reinvestment of all distributions, a complete redemption of the investment at the net asset value at the end of the year and no sales or redemption charges (if any). Total returns would be reduced if a sales or redemption charge was taken into account. Returns do not reflect the impact of taxes to shareholders relating to Fund distributions or the redemption of Fund shares. |
| (e) | The Fund’s portfolio turnover rate is calculated in accordance with regulatory requirements, without regard to transactions involving short term investments. If such transactions were included, the Fund’s portfolio turnover rate may be higher. |
| The accompanying notes are an integral part of these financial statements. | 79 |
GOLDMAN SACHS IMPRINT EMERGING MARKETS OPPORTUNITIES FUND
Financial Highlights (continued)
Selected Data for a Share Outstanding Throughout Each Year
| Goldman Sachs Imprint Emerging Markets Opportunities Fund | ||||||||||||||||||||||
| Investor Shares(a) | ||||||||||||||||||||||
| Year Ended October 31, | ||||||||||||||||||||||
| 2020 | 2019 | 2018 | 2017 | 2016 | ||||||||||||||||||
| Per Share Data |
| |||||||||||||||||||||
Net asset value, beginning of year | $ | 8.50 | $ | 8.09 | $ | 9.98 | $ | 9.00 | $ | 9.30 | ||||||||||||
Net investment income (loss)(b) | (0.02 | ) | 0.27 | (c) | 0.08 | 0.08 | 0.08 | |||||||||||||||
Net realized and unrealized gain (loss) | 0.55 | 0.21 | (1.95 | ) | 0.90 | (0.32 | ) | |||||||||||||||
Total from investment operations | 0.53 | 0.48 | (1.87 | ) | 0.98 | (0.24 | ) | |||||||||||||||
Distributions to shareholders from net investment income | (0.44 | ) | (0.07 | ) | (0.02 | ) | — | (0.06 | ) | |||||||||||||
Net asset value, end of year | $ | 8.59 | $ | 8.50 | $ | 8.09 | $ | 9.98 | $ | 9.00 | ||||||||||||
| Total return(d) | 6.10 | % | 6.00 | % | (18.82 | )% | 10.89 | % | (2.59 | )% | ||||||||||||
Net assets, end of year (in 000s) | $ | 1,021 | $ | 1,465 | $ | 5,633 | $ | 8,613 | $ | 9,436 | ||||||||||||
Ratio of net expenses to average net assets | 1.38 | % | 1.49 | % | 1.47 | % | 1.48 | % | 1.48 | % | ||||||||||||
Ratio of total expenses to average net assets | 3.77 | % | 2.85 | % | 2.11 | % | 1.80 | % | 2.14 | % | ||||||||||||
Ratio of net investment income (loss) to average net assets | (0.23 | )% | 3.21 | %(c) | 0.86 | % | 0.91 | % | 0.90 | % | ||||||||||||
Portfolio turnover rate(e) | 91 | % | 85 | % | 11 | % | 26 | % | 27 | % | ||||||||||||
| (a) | Effective August 15, 2017, Class IR changed its name to Investor Shares. |
| (b) | Calculated based on the average shares outstanding methodology. |
| (c) | Reflects income recognized from a corporate action which amounted to $0.25 per share and 2.90% of average net assets. |
| (d) | Assumes investment at the net asset value at the beginning of the year, reinvestment of all distributions, a complete redemption of the investment at the net asset value at the end of the year and no sales or redemption charges (if any). Total returns would be reduced if a sales or redemption charge was taken into account. Returns do not reflect the impact of taxes to shareholders relating to Fund distributions or the redemption of Fund shares. |
| (e) | The Fund’s portfolio turnover rate is calculated in accordance with regulatory requirements, without regard to transactions involving short term investments. If such transactions were included, the Fund’s portfolio turnover rate may be higher. |
| 80 | The accompanying notes are an integral part of these financial statements. |
GOLDMAN SACHS IMPRINT EMERGING MARKETS OPPORTUNITIES FUND
Financial Highlights (continued)
Selected Data for a Share Outstanding Throughout Each Period
| Goldman Sachs Imprint Emerging Markets Opportunities Fund | ||||||||||||||
| Class R6 Shares | ||||||||||||||
| Year Ended October 31, | February 28, 2018* to October 31, 2018 | |||||||||||||
| 2020 | 2019 | |||||||||||||
| Per Share Data |
| |||||||||||||
Net asset value, beginning of period | $ | 8.49 | $ | 8.12 | $ | 10.43 | ||||||||
Net investment income(a) | — | (b) | 0.44 | (c) | 0.08 | |||||||||
Net realized and unrealized gain (loss) | 0.54 | 0.05 | (2.39 | ) | ||||||||||
Total from investment operations | 0.54 | 0.49 | (2.31 | ) | ||||||||||
Distributions to shareholders from net investment income | (0.46 | ) | (0.12 | ) | — | |||||||||
Net asset value, end of period | $ | 8.57 | $ | 8.49 | $ | 8.12 | ||||||||
| Total return(d) | 6.24 | % | 6.12 | % | (22.15 | )% | ||||||||
Net assets, end of period (in 000s) | $ | 9 | $ | 8 | $ | 8 | ||||||||
Ratio of net expenses to average net assets | 1.25 | % | 1.35 | % | 1.34 | %(e) | ||||||||
Ratio of total expenses to average net assets | 3.75 | % | 2.76 | % | 2.00 | %(e) | ||||||||
Ratio of net investment income (loss) to average net assets | (0.03 | )% | 5.05 | %(c) | 1.33 | %(e) | ||||||||
Portfolio turnover rate(f) | 91 | % | 85 | % | 11 | % | ||||||||
| * | Commencement of operations. |
| (a) | Calculated based on the average shares outstanding methodology. |
| (b) | Amount is less than $0.005 per share. |
| (c) | Reflects income recognized from a corporate action which amounted to $0.25 per share and 2.90% of average net assets. |
| (d) | Assumes investment at the net asset value at the beginning of the period, reinvestment of all distributions, a complete redemption of the investment at the net asset value at the end of the period and no sales or redemption charges (if any). Total returns would be reduced if a sales or redemption charge was taken into account. Returns do not reflect the impact of taxes to shareholders relating to Fund distributions or the redemption of Fund shares. Total returns for periods less than one full year are not annualized. |
| (e) | Annualized. |
| (f) | The Fund’s portfolio turnover rate is calculated in accordance with regulatory requirements, without regard to transactions involving short term investments. If such transactions were included, the Fund’s portfolio turnover rate may be higher. |
| The accompanying notes are an integral part of these financial statements. | 81 |
GOLDMAN SACHS IMPRINT EMERGING MARKETS OPPORTUNITIES FUND
Financial Highlights (continued)
Selected Data for a Share Outstanding Throughout Each Period
| Goldman Sachs Imprint Emerging Markets Opportunities Fund | ||||||||||||||
| Class P Shares | ||||||||||||||
| Year Ended October 31, | April 16, 2018* to October 31, 2018 | |||||||||||||
| 2020 | 2019 | |||||||||||||
| Per Share Data |
| |||||||||||||
Net asset value, beginning of period | $ | 8.48 | $ | 8.11 | $ | 10.29 | ||||||||
Net investment income (loss)(a) | (0.01 | ) | 0.41 | (b) | (0.01 | ) | ||||||||
Net realized and unrealized gain (loss) | 0.56 | 0.08 | (2.17 | ) | ||||||||||
Total from investment operations | 0.55 | 0.49 | (2.18 | ) | ||||||||||
Distributions to shareholders from net investment income | (0.46 | ) | (0.12 | ) | — | |||||||||
Net asset value, end of period | $ | 8.57 | $ | 8.48 | $ | 8.11 | ||||||||
| Total return(c) | 6.38 | % | 6.15 | % | (21.19 | )% | ||||||||
Net assets, end of period (in 000s) | $ | 13,039 | $ | 13,375 | $ | 14,524 | ||||||||
Ratio of net expenses to average net assets | 1.24 | % | 1.34 | % | 1.32 | %(d) | ||||||||
Ratio of total expenses to average net assets | 3.68 | % | 2.74 | % | 2.28 | %(d) | ||||||||
Ratio of net investment income (loss) to average net assets | (0.09 | )% | 4.79 | %(b) | (0.18 | )%(d) | ||||||||
Portfolio turnover rate(e) | 91 | % | 85 | % | 11 | % | ||||||||
| * | Commencement of operations. |
| (a) | Calculated based on the average shares outstanding methodology. |
| (b) | Reflects income recognized from a corporate action which amounted to $0.25 per share and 2.90% of average net assets. |
| (c) | Assumes investment at the net asset value at the beginning of the period, reinvestment of all distributions, a complete redemption of the investment at the net asset value at the end of the period and no sales or redemption charges (if any). Total returns would be reduced if a sales or redemption charge was taken into account. Returns do not reflect the impact of taxes to shareholders relating to Fund distributions or the redemption of Fund shares. Total returns for periods less than one full year are not annualized. |
| (d) | Annualized. |
| (e) | The Fund’s portfolio turnover rate is calculated in accordance with regulatory requirements, without regard to transactions involving short term investments. If such transactions were included, the Fund’s portfolio turnover rate may be higher. |
| 82 | The accompanying notes are an integral part of these financial statements. |
GOLDMAN SACHS INTERNATIONAL EQUITY ESG FUND
Financial Highlights (continued)
Selected Data for a Share Outstanding Throughout Each Year
| (a) | Calculated based on the average shares outstanding methodology. |
| (b) | Reflects income recognized from a corporate action which amounted to $0.28 per share and 1.63% of average net assets. |
| (c) | Assumes investment at the net asset value at the beginning of the year, reinvestment of all distributions, a complete redemption of the investment at the net asset value at the end of the year and no sales or redemption charges (if any). Total returns would be reduced if a sales or redemption charge was taken into account. Returns do not reflect the impact of taxes to shareholders relating to Fund distributions or the redemption of Fund shares. |
| (d) | The Fund’s portfolio turnover rate is calculated in accordance with regulatory requirements, without regard to transactions involving short term investments. If such transactions were included, the Fund’s portfolio turnover rate may be higher. |
| The accompanying notes are an integral part of these financial statements. | 83 |
GOLDMAN SACHS INTERNATIONAL EQUITY ESG FUND
Financial Highlights (continued)
Selected Data for a Share Outstanding Throughout Each Year
| Goldman Sachs International Equity ESG Fund | ||||||||||||||||||||||
| Class C Shares | ||||||||||||||||||||||
| Year Ended October 31, | ||||||||||||||||||||||
| 2020 | 2019 | 2018 | 2017 | 2016 | ||||||||||||||||||
| Per Share Data |
| |||||||||||||||||||||
Net asset value, beginning of year | $ | 19.16 | $ | 16.49 | $ | 18.39 | $ | 15.37 | $ | 16.67 | ||||||||||||
Net investment income (loss)(a) | (0.10 | ) | 0.13 | 0.07 | 0.02 | 0.32 | (b) | |||||||||||||||
Net realized and unrealized gain (loss) | 0.60 | 2.58 | (1.86 | ) | 3.35 | (1.53 | ) | |||||||||||||||
Total from investment operations | 0.50 | 2.71 | (1.79 | ) | 3.37 | (1.21 | ) | |||||||||||||||
Distributions to shareholders from net investment income | (0.22 | ) | (0.04 | ) | (0.11 | ) | (0.35 | ) | (0.09 | ) | ||||||||||||
Net asset value, end of year | $ | 19.44 | $ | 19.16 | $ | 16.49 | $ | 18.39 | $ | 15.37 | ||||||||||||
| Total return(c) | 2.53 | % | 16.49 | % | (9.79 | )% | 22.40 | % | (7.27 | )% | ||||||||||||
Net assets, end of year (in 000s) | $ | 9,369 | $ | 10,400 | $ | 9,985 | $ | 15,681 | $ | 15,577 | ||||||||||||
Ratio of net expenses to average net assets | 1.95 | % | 2.01 | % | 2.04 | % | 2.05 | % | 2.05 | % | ||||||||||||
Ratio of total expenses to average net assets | 2.44 | % | 2.44 | % | 2.33 | % | 2.37 | % | 2.37 | % | ||||||||||||
Ratio of net investment income (loss) to average net assets | (0.54 | )% | 0.78 | % | 0.40 | % | 0.12 | % | 2.05 | %(b) | ||||||||||||
Portfolio turnover rate(d) | 55 | % | 41 | % | 38 | % | 116 | % | 78 | % | ||||||||||||
| (a) | Calculated based on the average shares outstanding methodology. |
| (b) | Reflects income recognized from a corporate action which amounted to $0.28 per share and 1.63% of average net assets. |
| (c) | Assumes investment at the net asset value at the beginning of the year, reinvestment of all distributions, a complete redemption of the investment at the net asset value at the end of the year and no sales or redemption charges (if any). Total returns would be reduced if a sales or redemption charge was taken into account. Returns do not reflect the impact of taxes to shareholders relating to Fund distributions or the redemption of Fund shares. |
| (d) | The Fund’s portfolio turnover rate is calculated in accordance with regulatory requirements, without regard to transactions involving short term investments. If such transactions were included, the Fund’s portfolio turnover rate may be higher. |
| 84 | The accompanying notes are an integral part of these financial statements. |
GOLDMAN SACHS INTERNATIONAL EQUITY ESG FUND
Financial Highlights (continued)
Selected Data for a Share Outstanding Throughout Each Year
| Goldman Sachs International Equity ESG Fund | ||||||||||||||||||||||
| Institutional Shares | ||||||||||||||||||||||
| Year Ended October 31, | ||||||||||||||||||||||
| 2020 | 2019 | 2018 | 2017 | 2016 | ||||||||||||||||||
| Per Share Data |
| |||||||||||||||||||||
Net asset value, beginning of year | $ | 21.17 | $ | 18.23 | $ | 20.30 | $ | 16.93 | $ | 18.34 | ||||||||||||
Net investment income(a) | 0.15 | 0.29 | 0.40 | 0.22 | 0.47 | (b) | ||||||||||||||||
Net realized and unrealized gain (loss) | 0.63 | 2.89 | (2.14 | ) | 3.69 | (1.60 | ) | |||||||||||||||
Total from investment operations | 0.78 | 3.18 | (1.74 | ) | 3.91 | (1.13 | ) | |||||||||||||||
Distributions to shareholders from net investment income | (0.42 | ) | (0.24 | ) | (0.33 | ) | (0.54 | ) | (0.28 | ) | ||||||||||||
Net asset value, end of year | $ | 21.53 | $ | 21.17 | $ | 18.23 | $ | 20.30 | $ | 16.93 | ||||||||||||
| Total return(c) | 3.62 | % | 17.76 | % | (8.76 | )% | 23.78 | % | (6.21 | )% | ||||||||||||
Net assets, end of year (in 000s) | $ | 23,137 | $ | 7,660 | $ | 6,835 | $ | 127,403 | $ | 201,746 | ||||||||||||
Ratio of net expenses to average net assets | 0.86 | % | 0.90 | % | 0.90 | % | 0.90 | % | 0.90 | % | ||||||||||||
Ratio of total expenses to average net assets | 1.33 | % | 1.31 | % | 1.17 | % | 1.22 | % | 1.21 | % | ||||||||||||
Ratio of net investment income to average net assets | 0.72 | % | 1.49 | % | 1.94 | % | 1.22 | % | 2.76 | %(b) | ||||||||||||
Portfolio turnover rate(d) | 55 | % | 41 | % | 38 | % | 116 | % | 78 | % | ||||||||||||
| (a) | Calculated based on the average shares outstanding methodology. |
| (b) | Reflects income recognized from a corporate action which amounted to $0.28 per share and 1.63% of average net assets. |
| (c) | Assumes investment at the net asset value at the beginning of the year, reinvestment of all distributions, a complete redemption of the investment at the net asset value at the end of the year and no sales or redemption charges (if any). Total returns would be reduced if a sales or redemption charge was taken into account. Returns do not reflect the impact of taxes to shareholders relating to Fund distributions or the redemption of Fund shares. |
| (d) | The Fund’s portfolio turnover rate is calculated in accordance with regulatory requirements, without regard to transactions involving short term investments. If such transactions were included, the Fund’s portfolio turnover rate may be higher. |
| The accompanying notes are an integral part of these financial statements. | 85 |
GOLDMAN SACHS INTERNATIONAL EQUITY ESG FUND
Financial Highlights (continued)
Selected Data for a Share Outstanding Throughout Each Year
| Goldman Sachs International Equity ESG Fund | ||||||||||||||||||||||
| Service Shares | ||||||||||||||||||||||
| Year Ended October 31, | ||||||||||||||||||||||
| 2020 | 2019 | 2018 | 2017 | 2016 | ||||||||||||||||||
| Per Share Data |
| |||||||||||||||||||||
Net asset value, beginning of year | $ | 21.63 | $ | 18.70 | $ | 20.68 | $ | 16.79 | $ | 18.05 | ||||||||||||
Net investment income(a) | 0.01 | 0.28 | 0.22 | 0.13 | 0.47 | (b) | ||||||||||||||||
Net realized and unrealized gain (loss) | 0.70 | 2.88 | (2.10 | ) | 3.76 | (1.67 | ) | |||||||||||||||
Total from investment operations | 0.71 | 3.16 | (1.88 | ) | 3.89 | (1.20 | ) | |||||||||||||||
Distributions to shareholders from net investment income | (0.34 | ) | (0.23 | ) | (0.10 | ) | — | (0.06 | ) | |||||||||||||
Net asset value, end of year | $ | 22.00 | $ | 21.63 | $ | 18.70 | $ | 20.68 | $ | 16.79 | ||||||||||||
| Total return(c) | 3.16 | % | 17.20 | % | (9.14 | )% | 23.17 | % | (6.66 | )% | ||||||||||||
Net assets, end of year (in 000s) | $ | 4 | $ | 4 | $ | 4 | $ | 4 | $ | 32 | ||||||||||||
Ratio of net expenses to average net assets | 1.34 | % | 1.36 | % | 1.34 | % | 1.39 | % | 1.41 | % | ||||||||||||
Ratio of total expenses to average net assets | 1.79 | % | 1.75 | % | 1.58 | % | 1.66 | % | 1.72 | % | ||||||||||||
Ratio of net investment income to average net assets | 0.07 | % | 1.44 | % | 1.07 | % | 0.71 | % | 2.77 | %(b) | ||||||||||||
Portfolio turnover rate(d) | 55 | % | 41 | % | 38 | % | 116 | % | 78 | % | ||||||||||||
| (a) | Calculated based on the average shares outstanding methodology. |
| (b) | Reflects income recognized from a corporate action which amounted to $0.28 per share and 1.63% of average net assets. |
| (c) | Assumes investment at the net asset value at the beginning of the year, reinvestment of all distributions, a complete redemption of the investment at the net asset value at the end of the year and no sales or redemption charges (if any). Total returns would be reduced if a sales or redemption charge was taken into account. Returns do not reflect the impact of taxes to shareholders relating to Fund distributions or the redemption of Fund shares. |
| (d) | The Fund’s portfolio turnover rate is calculated in accordance with regulatory requirements, without regard to transactions involving short term investments. If such transactions were included, the Fund’s portfolio turnover rate may be higher. |
| 86 | The accompanying notes are an integral part of these financial statements. |
GOLDMAN SACHS INTERNATIONAL EQUITY ESG FUND
Financial Highlights (continued)
Selected Data for a Share Outstanding Throughout Each Year
| Goldman Sachs International Equity ESG Fund | ||||||||||||||||||||||
| Investor Shares(a) | ||||||||||||||||||||||
| Year Ended October 31, | ||||||||||||||||||||||
| 2020 | 2019 | 2018 | 2017 | 2016 | ||||||||||||||||||
| Per Share Data |
| |||||||||||||||||||||
Net asset value, beginning of year | $ | 21.06 | $ | 18.20 | $ | 20.23 | $ | 16.86 | $ | 18.25 | ||||||||||||
Net investment income(b) | 0.09 | 0.36 | 0.24 | 0.27 | 0.45 | (c) | ||||||||||||||||
Net realized and unrealized gain (loss) | 0.68 | 2.78 | (2.02 | ) | 3.60 | (1.60 | ) | |||||||||||||||
Total from investment operations | 0.77 | 3.14 | (1.78 | ) | 3.87 | (1.15 | ) | |||||||||||||||
Distributions to shareholders from net investment income | (0.42 | ) | (0.28 | ) | (0.25 | ) | (0.50 | ) | (0.24 | ) | ||||||||||||
Net asset value, end of year | $ | 21.41 | $ | 21.06 | $ | 18.20 | $ | 20.23 | $ | 16.86 | ||||||||||||
| Total return(d) | 3.56 | % | 17.64 | % | (8.92 | )% | 23.63 | % | (6.34 | )% | ||||||||||||
Net assets, end of year (in 000s) | $ | 1,298 | $ | 492 | $ | 421 | $ | 1,009 | $ | 749 | ||||||||||||
Ratio of net expenses to average net assets | 0.95 | % | 1.00 | % | 1.04 | % | 1.05 | % | 1.05 | % | ||||||||||||
Ratio of total expenses to average net assets | 1.44 | % | 1.44 | % | 1.34 | % | 1.39 | % | 1.36 | % | ||||||||||||
Ratio of net investment income to average net assets | 0.44 | % | 1.87 | % | 1.20 | % | 1.50 | % | 2.62 | %(c) | ||||||||||||
Portfolio turnover rate(e) | 55 | % | 41 | % | 38 | % | 116 | % | 78 | % | ||||||||||||
| (a) | Effective August 15, 2017, Class IR changed its name to Investor Shares. |
| (b) | Calculated based on the average shares outstanding methodology. |
| (c) | Reflects income recognized from a corporate action which amounted to $0.28 per share and 1.63% of average net assets. |
| (d) | Assumes investment at the net asset value at the beginning of the year, reinvestment of all distributions, a complete redemption of the investment at the net asset value at the end of the year and no sales or redemption charges (if any). Total returns would be reduced if a sales or redemption charge was taken into account. Returns do not reflect the impact of taxes to shareholders relating to Fund distributions or the redemption of Fund shares. |
| (e) | The Fund’s portfolio turnover rate is calculated in accordance with regulatory requirements, without regard to transactions involving short term investments. If such transactions were included, the Fund’s portfolio turnover rate may be higher. |
| The accompanying notes are an integral part of these financial statements. | 87 |
GOLDMAN SACHS INTERNATIONAL EQUITY ESG FUND
Financial Highlights (continued)
Selected Data for a Share Outstanding Throughout Each Period
| Goldman Sachs International Equity ESG Fund | ||||||||||||||||||||||
| Class R6 Shares | ||||||||||||||||||||||
| Year Ended October 31, | February 26, 2016* to October 31, 2016 | |||||||||||||||||||||
| 2020 | 2019 | 2018 | 2017 | |||||||||||||||||||
| Per Share Data |
| |||||||||||||||||||||
Net asset value, beginning of period | $ | 21.06 | $ | 18.23 | $ | 20.30 | $ | 16.93 | $ | 15.87 | ||||||||||||
Net investment income(a) | 0.14 | 0.45 | 0.31 | 0.22 | 0.21 | (b) | ||||||||||||||||
Net realized and unrealized gain (loss) | 0.64 | 2.71 | (2.05 | ) | 3.69 | 0.85 | ||||||||||||||||
Total from investment operations | 0.78 | 3.16 | (1.74 | ) | 3.91 | 1.06 | ||||||||||||||||
Distributions to shareholders from net investment income | (0.43 | ) | (0.33 | ) | (0.33 | ) | (0.54 | ) | — | |||||||||||||
Net asset value, end of period | $ | 21.41 | $ | 21.06 | $ | 18.23 | $ | 20.30 | $ | 16.93 | ||||||||||||
| Total return(c) | 3.63 | % | 17.76 | % | (8.74 | )% | 23.80 | % | 6.68 | % | ||||||||||||
Net assets, end of period (in 000s) | $ | 1,981 | $ | 470 | $ | 11 | $ | 12 | $ | 11 | ||||||||||||
Ratio of net expenses to average net assets | 0.85 | % | 0.90 | % | 0.89 | % | 0.89 | % | 0.89 | %(d) | ||||||||||||
Ratio of total expenses to average net assets | 1.32 | % | 1.31 | % | 1.18 | % | 1.22 | % | 1.19 | %(d) | ||||||||||||
Ratio of net investment income to average net assets | 0.69 | % | 2.35 | % | 1.53 | % | 1.21 | % | 1.83 | %(b)(d) | ||||||||||||
Portfolio turnover rate(e) | 55 | % | 41 | % | 38 | % | 116 | % | 78 | % | ||||||||||||
| * | Commencement of operations. |
| (a) | Calculated based on the average shares outstanding methodology. |
| (b) | Reflects income recognized from a corporate action which amounted to $0.28 per share and 1.63% of average net assets. |
| (c) | Assumes investment at the net asset value at the beginning of the period, reinvestment of all distributions, a complete redemption of the investment at the net asset value at the end of the period and no sales or redemption charges (if any). Total returns would be reduced if a sales or redemption charge was taken into account. Returns do not reflect the impact of taxes to shareholders relating to Fund distributions or the redemption of Fund shares. Total returns for periods less than one full year are not annualized. |
| (d) | Annualized. |
| (e) | The Fund’s portfolio turnover rate is calculated in accordance with regulatory requirements, without regard to transactions involving short term investments. If such transactions were included, the Fund’s portfolio turnover rate may be higher. |
| 88 | The accompanying notes are an integral part of these financial statements. |
GOLDMAN SACHS INTERNATIONAL EQUITY ESG FUND
Financial Highlights (continued)
Selected Data for a Share Outstanding Throughout Each Period
| Goldman Sachs International Equity ESG Fund | ||||||||||||||
| Class P Shares | ||||||||||||||
| Year Ended October 31, | April 16, 2018* to October 31, 2018 | |||||||||||||
| 2020 | 2019 | |||||||||||||
| Per Share Data |
| |||||||||||||
Net asset value, beginning of period | $ | 21.05 | $ | 18.23 | $ | 20.84 | ||||||||
Net investment income(a) | 0.11 | 0.36 | 0.06 | |||||||||||
Net realized and unrealized gain (loss) | 0.69 | 2.79 | (2.67 | ) | ||||||||||
Total from investment operations | 0.80 | 3.15 | (2.61 | ) | ||||||||||
Distributions to shareholders from net investment income | (0.43 | ) | (0.33 | ) | — | |||||||||
Net asset value, end of period | $ | 21.42 | $ | 21.05 | $ | 18.23 | ||||||||
| Total return(b) | 3.67 | % | 17.73 | % | (12.52 | )% | ||||||||
Net assets, end of period (in 000s) | $ | 64,838 | $ | 68,987 | $ | 94,972 | ||||||||
Ratio of net expenses to average net assets | 0.86 | % | 0.89 | % | 0.89 | %(c) | ||||||||
Ratio of total expenses to average net assets | 1.30 | % | 1.29 | % | 1.22 | %(c) | ||||||||
Ratio of net investment income to average net assets | 0.55 | % | 1.88 | % | 0.59 | %(c) | ||||||||
Portfolio turnover rate(d) | 55 | % | 41 | % | 38 | % | ||||||||
| * | Commencement of operations. |
| (a) | Calculated based on the average shares outstanding methodology. |
| (b) | Assumes investment at the net asset value at the beginning of the period, reinvestment of all distributions, a complete redemption of the investment at the net asset value at the end of the period and no sales or redemption charges (if any). Total returns would be reduced if a sales or redemption charge was taken into account. Returns do not reflect the impact of taxes to shareholders relating to Fund distributions or the redemption of Fund shares. Total returns for periods less than one full year are not annualized. |
| (c) | Annualized. |
| (d) | The Fund’s portfolio turnover rate is calculated in accordance with regulatory requirements, without regard to transactions involving short term investments. If such transactions were included, the Fund’s portfolio turnover rate may be higher. |
| The accompanying notes are an integral part of these financial statements. | 89 |
GOLDMAN SACHS INTERNATIONAL EQUITY INCOME FUND
Financial Highlights (continued)
Selected Data for a Share Outstanding Throughout Each Year
| (a) | Calculated based on the average shares outstanding methodology. |
| (b) | Assumes investment at the net asset value at the beginning of the year, reinvestment of all distributions, a complete redemption of the investment at the net asset value at the end of the year and no sales or redemption charges (if any). Total returns would be reduced if a sales or redemption charge was taken into account. Returns do not reflect the impact of taxes to shareholders relating to Fund distributions or the redemption of Fund shares. |
| (c) | The Fund’s portfolio turnover rate is calculated in accordance with regulatory requirements, without regard to transactions involving short term investments. If such transactions were included, the Fund’s portfolio turnover rate may be higher. |
| 90 | The accompanying notes are an integral part of these financial statements. |
GOLDMAN SACHS INTERNATIONAL EQUITY INCOME FUND
Financial Highlights (continued)
Selected Data for a Share Outstanding Throughout Each Year
| Goldman Sachs International Equity Income Fund | ||||||||||||||||||||||
| Class C Shares | ||||||||||||||||||||||
| Year Ended October 31, | ||||||||||||||||||||||
| 2020 | 2019 | 2018 | 2017 | 2016 | ||||||||||||||||||
| Per Share Data |
| |||||||||||||||||||||
Net asset value, beginning of year | $ | 11.89 | $ | 11.88 | $ | 12.98 | $ | 10.75 | $ | 11.62 | ||||||||||||
Net investment income(a) | 0.13 | 0.25 | 0.25 | 0.07 | 0.08 | |||||||||||||||||
Net realized and unrealized gain (loss) | (1.50 | ) | 1.34 | (1.22 | ) | 2.31 | (0.94 | ) | ||||||||||||||
Total from investment operations | (1.37 | ) | 1.59 | (0.97 | ) | 2.38 | (0.86 | ) | ||||||||||||||
Distributions to shareholders from net investment income | (0.38 | ) | (0.29 | ) | (0.13 | ) | (0.15 | ) | (0.01 | ) | ||||||||||||
Distributions to shareholders from net realized gains | — | (1.29 | ) | — | — | — | ||||||||||||||||
Total distributions | (0.38 | ) | (1.58 | ) | (0.13 | ) | (0.15 | ) | (0.01 | ) | ||||||||||||
Net asset value, end of year | $ | 10.14 | $ | 11.89 | $ | 11.88 | $ | 12.98 | $ | 10.75 | ||||||||||||
| Total return(b) | (11.88 | )% | 16.01 | % | (7.59 | )% | 22.44 | % | (7.37 | )% | ||||||||||||
Net assets, end of year (in 000s) | $ | 1,514 | $ | 1,638 | $ | 1,673 | $ | 3,770 | $ | 3,974 | ||||||||||||
Ratio of net expenses to average net assets | 1.97 | % | 2.00 | % | 2.01 | % | 2.05 | % | 2.05 | % | ||||||||||||
Ratio of total expenses to average net assets | 2.67 | % | 2.91 | % | 2.63 | % | 2.63 | % | 2.51 | % | ||||||||||||
Ratio of net investment income to average net assets | 1.19 | % | 2.24 | % | 1.89 | % | 0.58 | % | 0.74 | % | ||||||||||||
Portfolio turnover rate(c) | 51 | % | 27 | % | 87 | % | 32 | % | 68 | % | ||||||||||||
| (a) | Calculated based on the average shares outstanding methodology. |
| (b) | Assumes investment at the net asset value at the beginning of the year, reinvestment of all distributions, a complete redemption of the investment at the net asset value at the end of the year and no sales or redemption charges (if any). Total returns would be reduced if a sales or redemption charge was taken into account. Returns do not reflect the impact of taxes to shareholders relating to Fund distributions or the redemption of Fund shares. |
| (c) | The Fund’s portfolio turnover rate is calculated in accordance with regulatory requirements, without regard to transactions involving short term investments. If such transactions were included, the Fund’s portfolio turnover rate may be higher. |
| The accompanying notes are an integral part of these financial statements. | 91 |
GOLDMAN SACHS INTERNATIONAL EQUITY INCOME FUND
Financial Highlights (continued)
Selected Data for a Share Outstanding Throughout Each Year
| Goldman Sachs International Equity Income Fund | ||||||||||||||||||||||
| Institutional Shares | ||||||||||||||||||||||
| Year Ended October 31, | ||||||||||||||||||||||
| 2020 | 2019 | 2018 | 2017 | 2016 | ||||||||||||||||||
| Per Share Data |
| |||||||||||||||||||||
Net asset value, beginning of year | $ | 14.26 | $ | 13.88 | $ | 15.20 | $ | 12.56 | $ | 13.56 | ||||||||||||
Net investment income(a) | 0.31 | 0.42 | 0.49 | 0.23 | 0.23 | |||||||||||||||||
Net realized and unrealized gain (loss) | (1.80 | ) | 1.63 | (1.46 | ) | 2.70 | (1.08 | ) | ||||||||||||||
Total from investment operations | (1.49 | ) | 2.05 | (0.97 | ) | 2.93 | (0.85 | ) | ||||||||||||||
Distributions to shareholders from net investment income | (0.57 | ) | (0.38 | ) | (0.35 | ) | (0.29 | ) | (0.15 | ) | ||||||||||||
Distributions to shareholders from net realized gains | — | (1.29 | ) | — | — | — | ||||||||||||||||
Total distributions | (0.57 | ) | (1.67 | ) | (0.35 | ) | (0.29 | ) | (0.15 | ) | ||||||||||||
Net asset value, end of year | $ | 12.20 | $ | 14.26 | $ | 13.88 | $ | 15.20 | $ | 12.56 | ||||||||||||
| Total return(b) | (10.86 | )% | 17.29 | % | (6.59 | )% | 23.88 | % | (6.31 | )% | ||||||||||||
Net assets, end of year (in 000s) | $ | 10,051 | $ | 5,232 | $ | 2,666 | $ | 40,667 | $ | 42,191 | ||||||||||||
Ratio of net expenses to average net assets | 0.85 | % | 0.88 | % | 0.87 | % | 0.90 | % | 0.90 | % | ||||||||||||
Ratio of total expenses to average net assets | 1.55 | % | 1.79 | % | 1.42 | % | 1.49 | % | 1.36 | % | ||||||||||||
Ratio of net investment income to average net assets | 2.36 | % | 3.13 | % | 3.19 | % | 1.71 | % | 1.84 | % | ||||||||||||
Portfolio turnover rate(c) | 51 | % | 27 | % | 87 | % | 32 | % | 68 | % | ||||||||||||
| (a) | Calculated based on the average shares outstanding methodology. |
| (b) | Assumes investment at the net asset value at the beginning of the year, reinvestment of all distributions, a complete redemption of the investment at the net asset value at the end of the year and no sales or redemption charges (if any). Total returns would be reduced if a sales or redemption charge was taken into account. Returns do not reflect the impact of taxes to shareholders relating to Fund distributions or the redemption of Fund shares. |
| (c) | The Fund’s portfolio turnover rate is calculated in accordance with regulatory requirements, without regard to transactions involving short term investments. If such transactions were included, the Fund’s portfolio turnover rate may be higher. |
| 92 | The accompanying notes are an integral part of these financial statements. |
GOLDMAN SACHS INTERNATIONAL EQUITY INCOME FUND
Financial Highlights (continued)
Selected Data for a Share Outstanding Throughout Each Year
| Goldman Sachs International Equity Income Fund | ||||||||||||||||||||||
| Investor Shares(a) | ||||||||||||||||||||||
| Year Ended October 31, | ||||||||||||||||||||||
| 2020 | 2019 | 2018 | 2017 | 2016 | ||||||||||||||||||
| Per Share Data |
| |||||||||||||||||||||
Net asset value, beginning of year | $ | 13.51 | $ | 13.25 | $ | 14.51 | $ | 12.00 | $ | 12.97 | ||||||||||||
Net investment income(b) | 0.29 | 0.34 | 0.40 | 0.24 | 0.21 | |||||||||||||||||
Net realized and unrealized gain (loss) | (1.72 | ) | 1.59 | (1.35 | ) | 2.54 | (1.04 | ) | ||||||||||||||
Total from investment operations | (1.43 | ) | 1.93 | (0.95 | ) | 2.78 | (0.83 | ) | ||||||||||||||
Distributions to shareholders from net investment income | (0.56 | ) | (0.38 | ) | (0.31 | ) | (0.27 | ) | (0.14 | ) | ||||||||||||
Distributions to shareholders from net realized gains | — | (1.29 | ) | — | — | — | ||||||||||||||||
Total distributions | (0.56 | ) | (1.67 | ) | (0.31 | ) | (0.27 | ) | (0.14 | ) | ||||||||||||
Net asset value, end of year | $ | 11.52 | $ | 13.51 | $ | 13.25 | $ | 14.51 | $ | 12.00 | ||||||||||||
| Total return(c) | (10.99 | )% | 17.21 | % | (6.74 | )% | 23.75 | % | (6.43 | )% | ||||||||||||
Net assets, end of year (in 000s) | $ | 8,958 | $ | 3,515 | $ | 349 | $ | 426 | $ | 471 | ||||||||||||
Ratio of net expenses to average net assets | 0.98 | % | 1.09 | % | 1.01 | % | 1.05 | % | 1.05 | % | ||||||||||||
Ratio of total expenses to average net assets | 1.71 | % | 1.98 | % | 1.65 | % | 1.64 | % | 1.51 | % | ||||||||||||
Ratio of net investment income to average net assets | 2.39 | % | 2.67 | % | 2.78 | % | 1.85 | % | 1.71 | % | ||||||||||||
Portfolio turnover rate(d) | 51 | % | 27 | % | 87 | % | 32 | % | 68 | % | ||||||||||||
| (a) | Effective August 15, 2017, Class IR changed its name to Investor Shares. |
| (b) | Calculated based on the average shares outstanding methodology. |
| (c) | Assumes investment at the net asset value at the beginning of the year, reinvestment of all distributions, a complete redemption of the investment at the net asset value at the end of the year and no sales or redemption charges (if any). Total returns would be reduced if a sales or redemption charge was taken into account. Returns do not reflect the impact of taxes to shareholders relating to Fund distributions or the redemption of Fund shares. |
| (d) | The Fund’s portfolio turnover rate is calculated in accordance with regulatory requirements, without regard to transactions involving short term investments. If such transactions were included, the Fund’s portfolio turnover rate may be higher. |
| The accompanying notes are an integral part of these financial statements. | 93 |
GOLDMAN SACHS INTERNATIONAL EQUITY INCOME FUND
Financial Highlights (continued)
Selected Data for a Share Outstanding Throughout Each Period
| Goldman Sachs International Equity Income Fund | ||||||||||||||||||||||
| Class R6 Shares | ||||||||||||||||||||||
| Year Ended October 31, | February 26, 2016* to October 31, 2016 | |||||||||||||||||||||
| 2020 | 2019 | 2018 | 2017 | |||||||||||||||||||
| Per Share Data |
| |||||||||||||||||||||
Net asset value, beginning of period | $ | 14.25 | $ | 13.87 | $ | 15.20 | $ | 12.56 | $ | 11.85 | ||||||||||||
Net investment income(a) | 0.28 | 0.49 | 0.45 | 0.16 | 0.20 | |||||||||||||||||
Net realized and unrealized gain (loss) | (1.78 | ) | 1.57 | (1.43 | ) | 2.77 | 0.51 | |||||||||||||||
Total from investment operations | (1.50 | ) | 2.06 | (0.98 | ) | 2.93 | 0.71 | |||||||||||||||
Distributions to shareholders from net investment income | (0.57 | ) | (0.39 | ) | (0.35 | ) | (0.29 | ) | — | |||||||||||||
Distributions to shareholders from net realized gains | — | (1.29 | ) | — | — | — | ||||||||||||||||
Total distributions | (0.57 | ) | (1.68 | ) | (0.35 | ) | (0.29 | ) | — | |||||||||||||
Net asset value, end of period | $ | 12.18 | $ | 14.25 | $ | 13.87 | $ | 15.20 | $ | 12.56 | ||||||||||||
| Total return(b) | (10.93 | )% | 17.41 | % | (6.62 | )% | 23.91 | % | 5.99 | % | ||||||||||||
Net assets, end of period (in 000s) | $ | 2,304 | $ | 332 | $ | 68 | $ | 72 | $ | 11 | ||||||||||||
Ratio of net expenses to average net assets | 0.84 | % | 0.86 | % | 0.86 | % | 0.89 | % | 0.89 | %(c) | ||||||||||||
Ratio of total expenses to average net assets | 1.59 | % | 1.80 | % | 1.51 | % | 1.43 | % | 1.35 | %(c) | ||||||||||||
Ratio of net investment income to average net assets | 2.22 | % | 3.74 | % | 2.99 | % | 1.16 | % | 2.33 | %(c) | ||||||||||||
Portfolio turnover rate(d) | 51 | % | 27 | % | 87 | % | 32 | % | 68 | % | ||||||||||||
| * | Commencement of operations. |
| (a) | Calculated based on the average shares outstanding methodology. |
| (b) | Assumes investment at the net asset value at the beginning of the period, reinvestment of all distributions, a complete redemption of the investment at the net asset value at the end of the period and no sales or redemption charges (if any). Total returns would be reduced if a sales or redemption charge was taken into account. Returns do not reflect the impact of taxes to shareholders relating to Fund distributions or the redemption of Fund shares. Total returns for periods less than one full year are not annualized. |
| (c) | Annualized. |
| (d) | The Fund’s portfolio turnover rate is calculated in accordance with regulatory requirements, without regard to transactions involving short term investments. If such transactions were included, the Fund’s portfolio turnover rate may be higher. |
| 94 | The accompanying notes are an integral part of these financial statements. |
GOLDMAN SACHS INTERNATIONAL EQUITY INCOME FUND
Financial Highlights (continued)
Selected Data for a Share Outstanding Throughout Each Year
| Goldman Sachs International Equity Income Fund | ||||||||||||||||||||||
| Class R Shares | ||||||||||||||||||||||
| Year Ended October 31, | ||||||||||||||||||||||
| 2020 | 2019 | 2018 | 2017 | 2016 | ||||||||||||||||||
| Per Share Data |
| |||||||||||||||||||||
Net asset value, beginning of year | $ | 13.55 | $ | 13.32 | $ | 14.59 | $ | 12.08 | $ | 13.00 | ||||||||||||
Net investment income(a) | 0.24 | 0.36 | 0.34 | 0.14 | 0.12 | |||||||||||||||||
Net realized and unrealized gain (loss) | (1.74 | ) | 1.52 | (1.37 | ) | 2.59 | (1.01 | ) | ||||||||||||||
Total from investment operations | (1.50 | ) | 1.88 | (1.03 | ) | 2.73 | (0.89 | ) | ||||||||||||||
Distributions to shareholders from net investment income | (0.45 | ) | (0.36 | ) | (0.24 | ) | (0.22 | ) | (0.03 | ) | ||||||||||||
Distributions to shareholders from net realized gains | — | (1.29 | ) | — | — | — | ||||||||||||||||
Total distributions | (0.45 | ) | (1.65 | ) | (0.24 | ) | (0.22 | ) | (0.03 | ) | ||||||||||||
Net asset value, end of year | $ | 11.60 | $ | 13.55 | $ | 13.32 | $ | 14.59 | $ | 12.08 | ||||||||||||
| Total return(b) | (11.44 | )% | 16.63 | % | (7.19 | )% | 22.99 | % | (6.87 | )% | ||||||||||||
Net assets, end of year (in 000s) | $ | 173 | $ | 73 | $ | 84 | $ | 44 | $ | 28 | ||||||||||||
Ratio of net expenses to average net assets | 1.48 | % | 1.50 | % | 1.51 | % | 1.55 | % | 1.55 | % | ||||||||||||
Ratio of total expenses to average net assets | 2.19 | % | 2.40 | % | 2.18 | % | 2.12 | % | 2.01 | % | ||||||||||||
Ratio of net investment income to average net assets | 1.96 | % | 2.90 | % | 2.38 | % | 1.05 | % | 0.99 | % | ||||||||||||
Portfolio turnover rate(c) | 51 | % | 27 | % | 87 | % | 32 | % | 68 | % | ||||||||||||
| (a) | Calculated based on the average shares outstanding methodology. |
| (b) | Assumes investment at the net asset value at the beginning of the year, reinvestment of all distributions, a complete redemption of the investment at the net asset value at the end of the year and no sales or redemption charges (if any). Total returns would be reduced if a sales or redemption charge was taken into account. Returns do not reflect the impact of taxes to shareholders relating to Fund distributions or the redemption of Fund shares. |
| (c) | The Fund’s portfolio turnover rate is calculated in accordance with regulatory requirements, without regard to transactions involving short term investments. If such transactions were included, the Fund’s portfolio turnover rate may be higher. |
| The accompanying notes are an integral part of these financial statements. | 95 |
GOLDMAN SACHS INTERNATIONAL EQUITY INCOME FUND
Financial Highlights (continued)
Selected Data for a Share Outstanding Throughout Each Period
| Goldman Sachs International Equity Income Fund | ||||||||||||||
| Class P Shares | ||||||||||||||
| Year Ended October 31, | April 16, 2018* to October 31, 2018 | |||||||||||||
| 2020 | 2019 | |||||||||||||
| Per Share Data |
| |||||||||||||
Net asset value, beginning of period | $ | 14.23 | $ | 13.86 | $ | 15.62 | ||||||||
Net investment income(a) | 0.30 | 0.44 | 0.16 | |||||||||||
Net realized and unrealized gain (loss) | (1.79 | ) | 1.61 | (1.84 | ) | |||||||||
Total from investment operations | (1.49 | ) | 2.05 | (1.68 | ) | |||||||||
Distributions to shareholders from net investment income | (0.57 | ) | (0.39 | ) | (0.08 | ) | ||||||||
Distributions to shareholders from net realized gains | — | (1.29 | ) | — | ||||||||||
Total distributions | (0.57 | ) | (1.68 | ) | (0.08 | ) | ||||||||
Net asset value, end of period | $ | 12.17 | $ | 14.23 | $ | 13.86 | ||||||||
| Total return(b) | (10.89 | )% | 17.34 | % | (10.76 | )% | ||||||||
Net assets, end of period (in 000s) | $ | 20,799 | $ | 32,643 | $ | 30,930 | ||||||||
Ratio of net expenses to average net assets | 0.84 | % | 0.85 | % | 0.84 | %(c) | ||||||||
Ratio of total expenses to average net assets | 1.51 | % | 1.76 | % | 1.84 | %(c) | ||||||||
Ratio of net investment income to average net assets | 2.33 | % | 3.37 | % | 2.00 | %(c) | ||||||||
Portfolio turnover rate(d) | 51 | % | 27 | % | 87 | % | ||||||||
| * | Commencement of operations. |
| (a) | Calculated based on the average shares outstanding methodology. |
| (b) | Assumes investment at the net asset value at the beginning of the period, reinvestment of all distributions, a complete redemption of the investment at the net asset value at the end of the period and no sales or redemption charges (if any). Total returns would be reduced if a sales or redemption charge was taken into account. Returns do not reflect the impact of taxes to shareholders relating to Fund distributions or the redemption of Fund shares. Total returns for periods less than one full year are not annualized. |
| (c) | Annualized. |
| (d) | The Fund’s portfolio turnover rate is calculated in accordance with regulatory requirements, without regard to transactions involving short term investments. If such transactions were included, the Fund’s portfolio turnover rate may be higher. |
| 96 | The accompanying notes are an integral part of these financial statements. |
GOLDMAN SACHS FUNDAMENTAL EQUITY INTERNATIONAL FUNDS
October 31, 2020
| 1. ORGANIZATION |
Goldman Sachs Trust (the “Trust”) is a Delaware statutory trust registered under the Investment Company Act of 1940, as amended (the “Act”), as an open-end management investment company. The following table lists those series of the Trust that are included in this report (collectively, the “Funds” or individually a “Fund”), along with their corresponding share classes and respective diversification status under the Act:
| Fund | Share Classes Offered | Diversified/ Non-diversified | ||
China Equity(a) | A, C, Institutional, Investor, R6 and P | Diversified | ||
Emerging Markets Equity | A, C, Institutional, Service, Investor, R6 and P | Diversified | ||
ESG Emerging Markets Equity | A, C, Institutional, Investor, R6, R and P(b) | Diversified | ||
Imprint Emerging Markets Opportunities | A, C, Institutional, Investor, R6 and P | Diversified | ||
International Equity ESG | A, C, Institutional, Service, Investor, R6 and P | Diversified | ||
International Equity Income | A, C, Institutional, Investor, R6, R and P | Diversified |
| (a) | Formerly, the Goldman Sachs Asia Equity Fund. Effective at the close of business on November 20, 2019, the Fund’s name changed to Goldman Sachs China Equity Fund. |
| (b) | Commenced operations on January 21, 2020. |
Class A Shares are sold with a front-end sales charge of up to 5.50%. Class C Shares are sold with a contingent deferred sales charge (“CDSC”) of 1.00%, which is imposed on redemptions made within 12 months of purchase. Institutional, Service, Investor, Class R6, Class R and Class P Shares are not subject to a sales charge.
Goldman Sachs Asset Management, L.P. (“GSAM”), an affiliate of Goldman Sachs & Co. LLC (“Goldman Sachs”), serves as investment adviser to the Funds pursuant to a management agreement (the “Agreement”) with the Trust.
| 2. SIGNIFICANT ACCOUNTING POLICIES |
The financial statements have been prepared in accordance with accounting principles generally accepted in the United States of America (“GAAP”) and require management to make estimates and assumptions that may affect the reported amounts and disclosures. Actual results may differ from those estimates and assumptions. Each Fund is an investment company under GAAP and follows the accounting and reporting guidance applicable to investment companies.
A. Investment Valuation — The Funds’ valuation policy is to value investments at fair value.
B. Investment Income and Investments — Investment income includes interest income, dividend income, and securities lending income, if any. Interest income is accrued daily and adjusted for amortization of premiums and accretion of discounts. Dividend income is recognized on ex-dividend date or, for certain foreign securities, as soon as such information is obtained subsequent to the ex-dividend date. Non-cash dividends, if any, are recorded at the fair market value of the securities received. Investment transactions are reflected on trade date. Realized gains and losses are calculated using identified cost. Investment transactions are recorded on the following business day for daily net asset value (“NAV”) calculations. Investment income is recorded net of any foreign withholding taxes, less any amounts reclaimable. The Funds may file withholding tax reclaims in certain jurisdictions to recover a portion of amounts previously withheld. Any foreign capital gains tax is accrued daily based upon net unrealized gains, and is payable upon sale of such investments.
C. Class Allocations and Expenses — Investment income, realized and unrealized gain (loss), if any, and non-class specific expenses of each Fund are allocated daily based upon the proportion of net assets of each class. Non-class specific expenses directly incurred by a Fund are charged to that Fund, while such expenses incurred by the Trust are allocated across the applicable Funds on a straight-line and/or pro-rata basis depending upon the nature of the expenses. Class specific expenses, where applicable, are borne by the respective share classes and include Distribution and Service, Transfer Agency and Service and Shareholder Administration fees.
97
GOLDMAN SACHS FUNDAMENTAL EQUITY INTERNATIONAL FUNDS
Notes to Financial Statements (continued)
October 31, 2020
| 2. SIGNIFICANT ACCOUNTING POLICIES (continued) |
D. Federal Taxes and Distributions to Shareholders — It is each Fund’s policy to comply with the requirements of the Internal Revenue Code of 1986, as amended (the “Code”), applicable to regulated investment companies and to distribute each year substantially all of its investment company taxable income and capital gains to its shareholders. Accordingly, each Fund is not required to make any provisions for the payment of federal income tax. Distributions to shareholders are recorded on the ex-dividend date. Income and capital gains distributions, if any, are declared and paid according to following schedule.
| Portfolio | Income Distributions Declared/Paid | Capital Gains Distributions Declared/Paid | ||||
China Equity | Annually | Annually | ||||
Emerging Markets Equity | Annually | Annually | ||||
ESG Emerging Markets Equity | Annually | Annually | ||||
Imprint Emerging Markets Opportunities | Annually | Annually | ||||
International Equity ESG | Annually | Annually | ||||
International Equity Income | Semi-Annually | Annually |
Net capital losses, if any, are carried forward to future fiscal years and may be used to the extent allowed by the Code to offset any future capital gains. Losses that are carried forward will retain their character as either short-term or long-term capital losses. Utilization of capital loss carryforwards will reduce the requirement of future capital gains distributions.
The characterization of distributions to shareholders for financial reporting purposes is determined in accordance with federal income tax rules, which may differ from GAAP. The source of each Fund’s distributions may be shown in the accompanying financial statements as either from distributable earnings or capital. Certain components of the Funds’ net assets on the Statements of Assets and Liabilities reflect permanent GAAP/tax differences based on the appropriate tax character.
E. Foreign Currency Translation — The accounting records and reporting currency of a Fund are maintained in United States (“U.S.”) dollars. Assets and liabilities denominated in foreign currencies are translated into U.S. dollars using the current exchange rates at the close of each business day. The effect of changes in foreign currency exchange rates on investments is included within net realized and unrealized gain (loss) on investments. Changes in the value of other assets and liabilities as a result of fluctuations in foreign exchange rates are included in the Statements of Operations within net change in unrealized gain (loss) on foreign currency translation. Transactions denominated in foreign currencies are translated into U.S. dollars on the date the transaction occurred, the effects of which are included within net realized gain (loss) on foreign currency transactions.
| 3. INVESTMENTS AND FAIR VALUE MEASUREMENTS |
U.S. GAAP defines the fair value of a financial instrument as the amount that would be received to sell an asset or paid to transfer a liability in an orderly transaction between market participants at the measurement date (i.e., the exit price); the Funds’ policy is to use the market approach. GAAP establishes a fair value hierarchy that prioritizes the inputs to valuation techniques used to measure fair value. The hierarchy gives the highest priority to unadjusted quoted prices in active markets for identical assets or liabilities (Level 1 measurements) and the lowest priority to unobservable inputs (Level 3 measurements). The level in the fair value hierarchy within which the fair value measurement in its entirety falls shall be determined based on the lowest level input that is significant to the fair value measurement in its entirety. The levels used for classifying investments are not necessarily an indication of the risk associated with investing in these investments. The three levels of the fair value hierarchy are described below:
Level 1 — Unadjusted quoted prices in active markets that are accessible at the measurement date for identical, unrestricted assets or liabilities;
98
GOLDMAN SACHS FUNDAMENTAL EQUITY INTERNATIONAL FUNDS
| 3. INVESTMENTS AND FAIR VALUE MEASUREMENTS (continued) |
Level 2 — Quoted prices in markets that are not active or financial instruments for which significant inputs are observable (including, but not limited to, quoted prices for similar investments, interest rates, foreign exchange rates, volatility and credit spreads), either directly or indirectly;
Level 3 — Prices or valuations that require significant unobservable inputs (including GSAM’s assumptions in determining fair value measurement).
The Board of Trustees (“Trustees”) has approved Valuation Procedures that govern the valuation of the portfolio investments held by the Funds, including investments for which market quotations are not readily available. The Trustees have delegated to GSAM day-to-day responsibility for implementing and maintaining internal controls and procedures related to the valuation of the Funds’ investments. To assess the continuing appropriateness of pricing sources and methodologies, GSAM regularly performs price verification procedures and issues challenges as necessary to third party pricing vendors or brokers, and any differences are reviewed in accordance with the Valuation Procedures.
A. Level 1 and Level 2 Fair Value Investments — The valuation techniques and significant inputs used in determining the fair values for investments classified as Level 1 and Level 2 are as follows:
Equity Securities — Equity securities traded on a U.S. securities exchange or the NASDAQ system, or those located on certain foreign exchanges, including but not limited to the Americas, are valued daily at their last sale price or official closing price on the principal exchange or system on which they are traded. If there is no sale or official closing price or such price is believed by GSAM to not represent fair value, equity securities will be valued at the valid closing bid price for long positions and at the valid closing ask price for short positions (i.e. where there is sufficient volume, during normal exchange trading hours). If no valid bid/ask price is available, the equity security will be valued pursuant to the Valuation Procedures approved by the Trustees and consistent with applicable regulatory guidance. To the extent these investments are actively traded, they are classified as Level 1 of the fair value hierarchy, otherwise they are generally classified as Level 2. Certain equity securities containing unique attributes may be classified as Level 2.
Unlisted equity securities for which market quotations are available are valued at the last sale price on the valuation date, or if no sale occurs, at the last bid price for long positions or the last ask price for short positions, and are generally classified as Level 2. Securities traded on certain foreign securities exchanges are valued daily at fair value determined by an independent fair value service (if available) under Fair Valuation Procedures approved by the Trustees and consistent with applicable regulatory guidance. The independent fair value service takes into account multiple factors including, but not limited to, movements in the securities markets, certain depositary receipts, futures contracts and foreign currency exchange rates that have occurred subsequent to the close of the foreign securities exchange. These investments are generally classified as Level 2 of the fair value hierarchy.
Underlying Funds (including Money Market Funds) — Underlying funds (“Underlying Funds”) include other investment companies and exchange-traded funds (“ETFs”). Investments in the Underlying Funds (except ETFs) are valued at the NAV per share on the day of valuation. ETFs are valued daily at the last sale price or official closing price on the principal exchange or system on which the investment is traded. Because the Funds invest in Underlying Funds that fluctuate in value, the Funds’ shares will correspondingly fluctuate in value. To the extent these investments are actively traded, they are classified as Level 1 of the fair value hierarchy, otherwise they are generally classified as Level 2. For information regarding an Underlying Fund’s accounting policies and investment holdings, please see the Underlying Fund’s shareholder report.
B. Level 3 Fair Value Investments — To the extent that significant inputs to valuation models and other alternative pricing sources are unobservable, or if quotations are not readily available, or if GSAM believes that such quotations do not accurately reflect fair value, the fair value of a Fund’s investments may be determined under Valuation Procedures approved by the Trustees. GSAM, consistent with its procedures and applicable regulatory guidance, may make an adjustment to the most recent valuation prices of either domestic or foreign securities in light of significant events to reflect what it believes to be the fair value of the securities at the time of determining a Fund’s NAV. To the extent investments are valued using single source broker quotations obtained directly from the broker or passed through from third party pricing vendors, such investments are classified as Level 3 investments.
99
GOLDMAN SACHS FUNDAMENTAL EQUITY INTERNATIONAL FUNDS
Notes to Financial Statements (continued)
October 31, 2020
| 3. INVESTMENTS AND FAIR VALUE MEASUREMENTS (continued) |
C. Fair Value Hierarchy — The following is a summary of the Funds’ investments classified in the fair value hierarchy as of October 31, 2020:
| CHINA EQUITY |
| |||||||||||
| Investment Type | Level 1 | Level 2 | Level 3 | |||||||||
| Assets | ||||||||||||
Common Stock and/or Other Equity Investments(a) | ||||||||||||
Asia | $ | 8,975,179 | $ | 76,326,965 | $ | — | ||||||
Investment Company | 2,236,989 | — | — | |||||||||
| Total | $ | 11,212,168 | $ | 76,326,965 | $ | — | ||||||
| EMERGING MARKETS EQUITY |
| |||||||||||
| Investment Type | Level 1 | Level 2 | Level 3 | |||||||||
| Assets | ||||||||||||
Common Stock and/or Other Equity Investments(a) | ||||||||||||
Africa | $ | 19,537,442 | $ | 17,864,230 | $ | — | ||||||
Asia | 355,920,878 | 1,758,272,707 | — | |||||||||
Europe | 13,005,830 | 44,862,949 | — | |||||||||
North America | 35,747,963 | — | — | |||||||||
South America | 143,917,608 | 16,771,483 | — | |||||||||
Exchange Traded Funds | 36,807,202 | — | — | |||||||||
Investment Company | 12,529,663 | — | — | |||||||||
Securities Lending Reinvestment Vehicle | 20,507,250 | — | — | |||||||||
| Total | $ | 637,973,836 | $ | 1,837,771,369 | $ | — | ||||||
| ESG EMERGING MARKETS EQUITY |
| |||||||||||
| Investment Type | Level 1 | Level 2 | Level 3 | |||||||||
| Assets | ||||||||||||
Common Stock and/or Other Equity Investments(a) | ||||||||||||
Africa | $ | 73,886 | $ | 71,390 | $ | — | ||||||
Asia | 1,588,375 | 6,278,288 | — | |||||||||
Europe | 3,618 | 173,834 | — | |||||||||
North America | 191,389 | — | — | |||||||||
South America | 638,705 | — | — | |||||||||
Investment Company | 122,590 | — | — | |||||||||
| Total | $ | 2,618,563 | $ | 6,523,512 | $ | — | ||||||
| (a) | Amounts are disclosed by continent to highlight the impact of time zone differences between local market close and the calculation of NAV. Security valuations are based on the principal exchange or system on which they are traded, which may differ from country of domicile. The Funds utilize fair value model prices provided by an independent fair value service for certain international equity securities, resulting in a Level 2 classification. |
100
GOLDMAN SACHS FUNDAMENTAL EQUITY INTERNATIONAL FUNDS
| 3. INVESTMENTS AND FAIR VALUE MEASUREMENTS (continued) |
| IMPRINT EMERGING MARKETS OPPORTUNITIES |
| |||||||||||
| Investment Type | Level 1 | Level 2 | Level 3 | |||||||||
| Assets | ||||||||||||
Common Stock and/or Other Equity Investments(a) | ||||||||||||
Africa | $ | 141,876 | $ | 2,502,232 | $ | — | ||||||
Asia | 5,756,537 | 10,113,001 | — | |||||||||
Europe | — | 238,941 | — | |||||||||
South America | 362,058 | — | — | |||||||||
Exchange Traded Fund | 1,414,810 | — | — | |||||||||
Securities Lending Reinvestment Vehicle | 1,270,175 | — | — | |||||||||
| Total | $ | 8,945,456 | $ | 12,854,174 | $ | — | ||||||
| INTERNATIONAL EQUITY ESG |
| |||||||||||
| Investment Type | Level 1 | Level 2 | Level 3 | |||||||||
| Assets | ||||||||||||
Common Stock and/or Other Equity Investments(a) | ||||||||||||
Asia | $ | 8,724,589 | $ | 23,334,046 | $ | — | ||||||
Europe | — | 91,625,068 | — | |||||||||
North America | — | 4,885,897 | — | |||||||||
Investment Company | 1,007,817 | — | — | |||||||||
| Total | $ | 9,732,406 | $ | 119,845,011 | $ | — | ||||||
| INTERNATIONAL EQUITY INCOME |
| |||||||||||
| Investment Type | Level 1 | Level 2 | Level 3 | |||||||||
| Assets | ||||||||||||
Common Stock and/or Other Equity Investments(a) | ||||||||||||
Asia | $ | — | $ | 8,018,068 | $ | — | ||||||
Australia and Oceania | — | 3,580,029 | — | |||||||||
Europe | 1,107,688 | 42,447,312 | — | |||||||||
North America | — | 2,022,374 | — | |||||||||
Total | $ | 1,107,688 | $ | 56,067,783 | $ | — | ||||||
| (a) | Amounts are disclosed by continent to highlight the impact of time zone differences between local market close and the calculation of NAV. Security valuations are based on the principal exchange or system on which they are traded, which may differ from country of domicile. The Funds utilize fair value model prices provided by an independent fair value service for certain international equity securities, resulting in a Level 2 classification. |
For further information regarding security characteristics, see the Schedules of Investments.
| 4. AGREEMENTS AND AFFILIATED TRANSACTIONS |
A. Management Agreement — Under the Agreement, GSAM manages the Funds, subject to the general supervision of the Trustees.
As compensation for the services rendered pursuant to the Agreement, the assumption of the expenses related thereto and administration of the Funds’ business affairs, including providing facilities, GSAM is entitled to a management fee, accrued daily and paid monthly, equal to an annual percentage rate of each Fund’s average daily net assets.
101
GOLDMAN SACHS FUNDAMENTAL EQUITY INTERNATIONAL FUNDS
Notes to Financial Statements (continued)
October 31, 2020
| 4. AGREEMENTS AND AFFILIATED TRANSACTIONS (continued) |
For the fiscal year ended October 31, 2020, contractual and effective net management fees with GSAM were at the following rates:
| Contractual Management Rate | Effective Net Management | |||||||||||||||||||||||||||||
| Fund | First $1 billion | Next $1 billion | Next $3 billion | Next $3 billion | Over $8 billion | Effective Rate | ||||||||||||||||||||||||
China Equity | 1.00 | % | 0.90 | % | 0.86 | % | 0.84 | % | 0.82 | % | 1.00 | % | 1.00 | % | ||||||||||||||||
Emerging Markets Equity | 1.02 | 1.02 | 0.92 | 0.87 | 0.85 | 1.01 | 1.01 | |||||||||||||||||||||||
ESG Emerging Markets Equity | 0.98 | 0.98 | 0.88 | 0.84 | 0.82 | 0.98 | 0.98 | |||||||||||||||||||||||
Imprint Emerging Markets Opportunities | 1.05 | 1.05 | 0.95 | 0.90 | 0.88 | 1.05 | 1.05 | |||||||||||||||||||||||
International Equity ESG | 0.85 | 0.77 | 0.73 | 0.71 | 0.70 | 0.85 | 0.83 | (1) | ||||||||||||||||||||||
International Equity Income | 0.80 | 0.72 | 0.68 | 0.67 | 0.66 | 0.80 | 0.80 | |||||||||||||||||||||||
| ^ | Effective Net Management Rate includes the impact of management fee waivers of affiliated underlying funds, if any. |
| (1) | GSAM agreed to waive a portion of its management fee equal to 0.03% as an annual percentage of average daily net assets of the Fund. This waiver will be effective through at least February 28, 2021, and prior to such date GSAM may not terminate the arrangement without approval of the Trustees. |
The China Equity, Emerging Markets Equity, ESG Emerging Markets Equity, Imprint Emerging Markets Opportunities, International Equity ESG and International Equity Income Funds invest in Institutional Shares of the Goldman Sachs Financial Square Government Fund, which is an affiliated Underlying Fund. GSAM has agreed to waive a portion of its management fee payable by the Funds in an amount equal to the management fee it earns as an investment adviser to the affiliated Underlying Fund in which the Funds invest, except those management fees it earns from the Funds’ investments of cash collateral received in connection with securities lending transactions in the Goldman Sachs Financial Square Government Fund. For the fiscal year ended October 31, 2020, GSAM waived $889, $24,640, $43, $95, $5,156 and $2,296 of the China Equity, Emerging Markets Equity, ESG Emerging Markets Equity, Imprint Emerging Markets Opportunities, International Equity ESG and International Equity Income Funds’ management fees, respectively.
B. Distribution and/or Service (12b-1) Plans — The Trust, on behalf of Class A and Class R Shares of each applicable Fund, has adopted Distribution and Service Plans subject to Rule 12b-1 under the Act. Under the Distribution and Service Plans, Goldman Sachs, which serves as distributor (the “Distributor”), is entitled to a fee accrued daily and paid monthly for distribution services and personal and account maintenance services, which may then be paid by Goldman Sachs to authorized dealers. These fees are equal to an annual percentage rate of the average daily net assets attributable to Class A or Class R Shares of the Funds, as applicable, as set forth below.
The Trust, on behalf of Class C Shares of each applicable Fund, has adopted a Distribution Plan subject to Rule 12b-1 under the Act. Under the Distribution Plan, Goldman Sachs as Distributor is entitled to a fee accrued daily and paid monthly for distribution services, which may then be paid by Goldman Sachs to authorized dealers. These fees are equal to an annual percentage rate of the average daily net assets attributable to Class C Shares of the Funds, as set forth below.
The Trust, on behalf of Service Shares of each applicable Fund, has adopted a Service Plan subject to Rule 12b-1 under the Act to allow Service Shares to compensate service organizations (including Goldman Sachs) for providing personal and account maintenance services to their customers who are beneficial owners of such shares. The Service Plan provides for compensation to
102
GOLDMAN SACHS FUNDAMENTAL EQUITY INTERNATIONAL FUNDS
| 4. AGREEMENTS AND AFFILIATED TRANSACTIONS (continued) |
the service organizations equal to an annual percentage rate of the average daily net assets attributable to Service Shares of the Funds, as set forth below.
| Distribution and/or Service Plan Rates | ||||||||||||||||||
| Class A* | Class C | Service | Class R* | |||||||||||||||
Distribution and/or Service Plan | 0.25 | % | 0.75 | % | 0.25 | % | 0.50 | % | ||||||||||
| * | With respect to Class A and Class R Shares, the Distributor at its discretion may use compensation for distribution services paid under the Distribution and Service Plans to compensate service organizations for personal and account maintenance services and expenses as long as such total compensation does not exceed the maximum cap on “service fees” imposed by the Financial Industry Regulatory Authority. |
C. Distribution Agreement — Goldman Sachs, as Distributor of the shares of the Funds pursuant to a Distribution Agreement, may retain a portion of the Class A Shares’ front end sales charge and Class C Shares’ CDSC. During the fiscal year ended October 31, 2020, Goldman Sachs retained the following amounts:
| Front End Sales Charge | Contingent Deferred Sales Charge | |||||||||
| Fund | Class A | Class C | ||||||||
China Equity | $ | 912 | $ | — | ||||||
Emerging Markets Equity | 7,410 | 2 | ||||||||
Imprint Emerging Markets Opportunities | 3 | — | ||||||||
International Equity ESG | 1,051 | 309 | ||||||||
International Equity Income | 690 | 18 | ||||||||
D. Service and Shareholder Administration Plans — The Trust, on behalf of each applicable Fund, has adopted Service Plans to allow Class C Shares and Shareholder Administration Plans to allow Service Shares, respectively, to compensate service organizations (including Goldman Sachs) for providing varying levels of personal and account maintenance or shareholder administration services to their customers who are beneficial owners of such shares. The Service and Shareholder Administration Plans each provide for compensation to the service organizations equal to an annual percentage rate of 0.25% of the average daily net assets attributable to Class C and Service Shares of the Funds, respectively.
E. Transfer Agency Agreement — Goldman Sachs also serves as the transfer agent of the Funds for a fee pursuant to the Transfer Agency Agreement. The fees charged for such transfer agency services are accrued daily and paid monthly at annual rates as follows: 0.16% of the average daily net assets of Class A, Class C, Investor and Class R Shares; 0.03% of the average daily net assets of Class R6 and Class P Shares; and 0.04% of the average daily net assets of Institutional and Service Shares. Prior to July 1, 2020, such fee was 0.17% of the average daily net assets of the Class A, Class C, Investor and Class R Shares. Effective February 28, 2020, Goldman Sachs agreed to waive a portion of its transfer agency fee equal to 0.07%, 0.06% and 0.04% as an annual percentage rate of the average daily net assets attributable to Class A, Class C, Investor and Class R Shares, as applicable, of the China Equity Fund, Emerging Markets Equity Fund and ESG Emerging Markets Equity Fund, respectively. Goldman Sachs also agreed to waive a portion of its transfer agency fee equal to 0.05% as an annual percentage rate of the average daily net assets attributable to Class A, Class C and Investor Shares of the International Equity ESG Fund through at least February 28, 2021, and prior to such date the Investment Adviser and Goldman Sachs may not terminate the arrangement without the approval of the Board of Trustees. Prior to February 28, 2020, Goldman Sachs agreed to waive a portion of the transfer agency fee equal to 0.04% as an annual percentage rate of the average daily net assets attributable to Class A, Class C and Investor Shares of the China Equity Fund.
F. Other Expense Agreements and Affiliated Transactions — GSAM has agreed to reduce or limit certain “Other Expenses” of the Funds (excluding acquired fund fees and expenses, transfer agency fees and expenses, service fees and shareholder administration fees (as applicable), taxes, interest, brokerage fees, expenses of shareholder meetings, litigation and
103
GOLDMAN SACHS FUNDAMENTAL EQUITY INTERNATIONAL FUNDS
Notes to Financial Statements (continued)
October 31, 2020
| 4. AGREEMENTS AND AFFILIATED TRANSACTIONS (continued) |
indemnification, and extraordinary expenses) to the extent such expenses exceed, on an annual basis, a percentage rate of the average daily net assets of each Fund. Such Other Expense reimbursements, if any, are accrued daily and paid monthly. In addition, the Funds are not obligated to reimburse GSAM for prior fiscal year expense reimbursements, if any. The Other Expense limitations as an annual percentage rate of average daily net assets for the China Equity, Emerging Markets Equity, ESG Emerging Markets Equity, Imprint Emerging Markets Opportunities, International Equity ESG and International Equity Income Funds are 0.114%, 0.104%, 0.124%, 0.164%, 0.004% and 0.014%, respectively. Prior to February 28, 2020, the other expense limitation was 0.014% for the International Equity ESG Fund. These Other Expense limitations will remain in place through at least February 28, 2021 and prior to such date GSAM may not terminate the arrangements without the approval of the Trustees. In addition, the Funds have entered into certain offset arrangements with the custodian and the transfer agent, which may result in a reduction of the Funds’ expenses and are received irrespective of the application of the “Other Expense” limitations described above.
For the fiscal year ended October 31, 2020, these expense reductions, including any fee waivers and Other Expense reimbursements, were as follows:
| Fund | Management Fee Waiver | Custody Fee Credits | Transfer Agency Waiver/Credits | Other Expense Reimbursement | Total Expense Reductions | |||||||||||||||||
China Equity | $ | 889 | $ | 1,140 | $ | 9,885 | $ | 411,485 | $ | 423,399 | ||||||||||||
Emerging Markets Equity | 24,640 | 13,559 | 157,615 | 144,624 | 340,438 | |||||||||||||||||
ESG Emerging Markets Equity | 43 | 65 | 107 | 367,659 | 367,874 | |||||||||||||||||
Imprint Emerging Markets Opportunities | 95 | 312 | — | 506,307 | 506,714 | |||||||||||||||||
International Equity ESG | 30,863 | 1,175 | 22,030 | 531,525 | 585,593 | |||||||||||||||||
International Equity Income | 2,296 | 147 | — | 455,541 | 457,984 | |||||||||||||||||
G. Line of Credit Facility — As of October 31, 2020, the Funds participated in a $700,000,000 committed, unsecured revolving line of credit facility (the “facility”) together with other funds of the Trust and certain registered investment companies having management agreements with GSAM or its affiliates. This facility is to be used for temporary emergency purposes, or to allow for an orderly liquidation of securities to meet redemption requests. The interest rate on borrowings is based on the federal funds rate. The facility also requires a fee to be paid by the Funds based on the amount of the commitment that has not been utilized. For the fiscal year ended October 31, 2020, the Funds did not have any borrowings under the facility. Prior to April 28, 2020, the facility was $580,000,000.
H. Other Transactions with Affiliates —The following table provides information about the Funds’ investments in the Goldman Sachs Financial Square Government Fund as of and for the fiscal year ended October 31, 2020:
| Fund | Beginning Value as of October 31, 2019 | Purchases at Cost | Proceeds from Sales | Ending Value as of October 31, 2020 | Shares as of October 31, 2020 | Dividend Income From Affiliated Investment Company | ||||||||||||||||||||
China Equity | $ | 461,147 | $ | 25,178,499 | $ | (23,402,657 | ) | $ | 2,236,989 | 2,236,989 | $ | 2,620 | ||||||||||||||
Emerging Markets Equity | 6,059,064 | 588,093,874 | (581,623,275 | ) | 12,529,663 | 12,529,663 | 121,109 | |||||||||||||||||||
ESG Emerging Markets Equity | — | 1,308,144 | (1,185,554 | ) | 122,590 | 122,590 | 92 | |||||||||||||||||||
Imprint Emerging Markets Opportunities | — | 3,260,059 | (3,260,059 | ) | — | — | 135 | |||||||||||||||||||
International Equity ESG | 992,989 | 44,272,464 | (44,257,636 | ) | 1,007,817 | 1,007,817 | 21,136 | |||||||||||||||||||
International Equity Income | 1,609,740 | 31,006,032 | (32,615,772 | ) | — | — | 14,109 | |||||||||||||||||||
104
GOLDMAN SACHS FUNDAMENTAL EQUITY INTERNATIONAL FUNDS
| 4. AGREEMENTS AND AFFILIATED TRANSACTIONS (continued) |
As of October 31, 2020, The Goldman Sachs Group, Inc. was the beneficial owner of the following Funds:
| Fund | Class A | Class C | Institutional | Service | Investor | Class R6 | Class R | Class P | ||||||||||||||||||||||||||||
China Equity | — | % | — | % | — | % | — | % | 7 | % | — | % | — | % | — | % | ||||||||||||||||||||
ESG Emerging Markets Equity | 64 | 100 | 93 | — | 100 | 91 | 23 | 13 | ||||||||||||||||||||||||||||
Imprint Emerging Markets Opportunities | — | — | — | — | — | 100 | — | — | ||||||||||||||||||||||||||||
International Equity ESG | — | — | — | 32 | — | — | — | — | ||||||||||||||||||||||||||||
International Equity Income | — | — | — | — | — | — | 5 | — | ||||||||||||||||||||||||||||
| 5. PORTFOLIO SECURITIES TRANSACTIONS |
The cost of purchases and proceeds from sales and maturities of long-term securities for the fiscal year ended October 31, 2020, were as follows:
| Fund | Purchases | Sales and Maturities | ||||||||
China Equity | $ | 74,367,468 | $ | 89,223,872 | ||||||
Emerging Markets Equity | 926,177,970 | 615,314,948 | ||||||||
ESG Emerging Markets Equity | 2,448,575 | 2,108,596 | ||||||||
Imprint Emerging Markets Opportunities | 18,496,932 | 21,148,392 | ||||||||
International Equity ESG | 69,538,649 | 67,397,606 | ||||||||
International Equity Income | 41,248,636 | 32,202,023 | ||||||||
| 6. SECURITIES LENDING |
Pursuant to exemptive relief granted by the Securities and Exchange Commission (“SEC”) and the terms and conditions contained therein the China Equity, Emerging Markets Equity, Imprint Emerging Markets Opportunities, International Equity ESG and International Equity Income Funds may lend their securities through a securities lending agent, Goldman Sachs Agency Lending (“GSAL”), a wholly-owned subsidiary of Goldman Sachs, to certain qualified borrowers including Goldman Sachs and affiliates. In accordance with the Funds’ securities lending procedures, the Funds receive cash collateral at least equal to the market value of the securities on loan. The market value of the loaned securities is determined at the close of business of the Funds, at their last sale price or official closing price on the principal exchange or system on which they are traded, and any additional required collateral is delivered to the Funds on the next business day. As with other extensions of credit, the Funds may experience delay in the recovery of their securities or incur a loss should the borrower of the securities breach its agreement with the Funds or become insolvent at a time when the collateral is insufficient to cover the cost of repurchasing securities on loan. Dividend income received from securities on loan may not be subject to withholding taxes and therefore withholding taxes paid may differ from the amounts listed in the Statements of Operations. Loans of securities are terminable at any time and as such 1) the remaining contractual maturities of the outstanding securities lending transactions are considered to be overnight and continuous and 2) the borrower, after notice, is required to return borrowed securities within the standard time period for settlement of securities transactions.
The China Equity, Emerging Markets Equity, Imprint Emerging Markets Opportunities, International Equity ESG and International Equity Income Funds invest the cash collateral received in connection with securities lending transactions in the Goldman Sachs Financial Square Government Fund (“Government Money Market Fund”), an affiliated series of the Goldman Sachs Trust. The Government Money Market Fund is registered under the Act as an open end investment company, is subject to
105
GOLDMAN SACHS FUNDAMENTAL EQUITY INTERNATIONAL FUNDS
Notes to Financial Statements (continued)
October 31, 2020
| 6. SECURITIES LENDING (continued) |
Rule 2a-7 under the Act, and is managed by GSAM, for which GSAM may receive a management fee of up to 0.16% on an annualized basis of the average daily net assets of the Government Money Market Fund.
In the event of a default by a borrower with respect to any loan, GSAL will exercise any and all remedies provided under the applicable borrower agreement to make the Funds whole. These remedies include purchasing replacement securities by applying the collateral held from the defaulting broker against the purchase cost of the replacement securities. If GSAL is unable to purchase replacement securities, GSAL will indemnify the Funds by paying the Funds an amount equal to the market value of the securities loaned minus the value of cash collateral received from the borrower for the loan, subject to an exclusion for any shortfalls resulting from a loss of value in such cash collateral due to reinvestment risk. The Funds’ master netting agreements with certain borrowers provide the right, in the event of a default (including bankruptcy or insolvency), for the non-defaulting party to liquidate the collateral and calculate net exposure to the defaulting party or request additional collateral. However, in the event of a default by a borrower, a resolution authority could determine that such rights are not enforceable due to the restrictions or prohibitions against the right of set-off that may be imposed in accordance with a particular jurisdiction’s bankruptcy or insolvency laws. The Funds’ loaned securities were all subject to enforceable Securities Lending Agreements and the value of the collateral was at least equal to the value of the cash received. The amounts of the Funds’ overnight and continuous agreements, which represent the gross amounts of recognized liabilities for securities lending transactions outstanding as of October 31, 2020, are disclosed as “Payable upon return of securities loaned” on the Statements of Assets and Liabilities, where applicable.
Each of the China Equity, Emerging Markets Equity, Imprint Emerging Markets Opportunities, International Equity ESG and International Equity Income Funds and GSAL received compensation relating to the lending of the Funds’ securities. The amounts earned, if any, by the Funds for the fiscal year ended October 31, 2020, are reported under Investment Income on the Statements of Operations.
The table below details securities lending activity with affiliates of Goldman Sachs:
| For the fiscal year ended October 31, 2020 | Amount Payable to Goldman Sachs upon Return of Securities Loaned as of October 31, 2020 | |||||||||||||
| Fund | Earnings of GSAL Relating to Securites Loaned | Amounts Received by the Funds from Lending to Goldman Sachs | ||||||||||||
China Equity | $ | 190 | $ | — | $ | — | ||||||||
Emerging Markets Equity | 16,982 | 55,404 | — | |||||||||||
Imprint Emerging Markets Opportunities | 1,641 | 1,967 | 170,375 | |||||||||||
International Equity ESG | 69 | — | — | |||||||||||
International Equity Income | 288 | 1,097 | — | |||||||||||
The following table provides information about the Funds’ investment in the Government Money Market Fund for the fiscal year ended October 31, 2020.
| Fund | Beginning Value as of October 31, 2019 | Purchases at Cost | Proceeds from Sales | Ending Value as of October 31, 2020 | ||||||||||||||
China Equity | $ | 1,018,700 | $ | 6,761,425 | $ | (7,780,125 | ) | $ | — | |||||||||
Emerging Markets Equity | 43,343,504 | 541,382,807 | (564,219,061 | ) | 20,507,250 | |||||||||||||
Imprint Emerging Markets Opportunities | — | 10,265,182 | (8,995,007 | ) | 1,270,175 | |||||||||||||
International Equity ESG | — | 9,079,872 | (9,079,872 | ) | — | |||||||||||||
International Equity Income | — | 5,156,101.00 | (5,156,101.00 | ) | — | |||||||||||||
106
GOLDMAN SACHS FUNDAMENTAL EQUITY INTERNATIONAL FUNDS
| 7. TAX INFORMATION |
The tax character of distributions paid during the fiscal year ended October 31, 2020 was as follows:
| China Equity | Emerging Markets Equity | ESG Emerging Markets Equity | Imprint Emerging Markets Opportunities | International Equity ESG | International Equity Income | |||||||||||||||||||
Distributions paid from: | ||||||||||||||||||||||||
Ordinary income | $ | 600,964 | $ | 19,703,005 | $ | 66,221 | $ | 1,222,677 | $ | 2,300,378 | $ | 2,583,747 | ||||||||||||
The tax character of distributions paid during the fiscal year ended October 31, 2019 was as follows:
| China Equity | Emerging Markets Equity | ESG Emerging Markets Equity | Imprint Emerging Markets Opportunities | International Equity ESG | International Equity Income | |||||||||||||||||||
Distributions paid from: | ||||||||||||||||||||||||
Ordinary income | $ | 362,857 | $ | 9,834,169 | $ | 28,047 | $ | 421,543 | $ | 2,184,597 | $ | 2,158,291 | ||||||||||||
Net long-term capital gains | 4,213,623 | — | — | — | — | 4,229,300 | ||||||||||||||||||
Total | $ | 4,576,480 | $ | 9,834,169 | $ | 28,047 | $ | 421,543 | $ | 2,184,597 | $ | 6,387,591 | ||||||||||||
As of October 31, 2020, the components of accumulated earnings (losses) on a tax-basis were as follows:
| China Equity | Emerging Markets Equity | ESG Emerging Markets Equity | Imprint Emerging Markets Opportunities | International Equity ESG | International Equity Income | |||||||||||||||||||
Undistributed ordinary income — net | $ | 1,494,882 | $ | 8,231,673 | $ | 22,918 | $ | — | $ | 311,482 | $ | 354,905 | ||||||||||||
Undistributed long-term capital gains | 3,548,949 | — | — | — | — | — | ||||||||||||||||||
Total undistributed earnings | $ | 5,043,831 | $ | 8,231,673 | $ | 22,918 | $ | — | $ | 311,482 | $ | 354,905 | ||||||||||||
Capital loss carryforwards(1): | ||||||||||||||||||||||||
Perpetual long-term | $ | — | $ | (96,750,777 | ) | $ | (25,954 | ) | $ | (27,116,250 | ) | $ | (5,741,444 | ) | $ | (739,157 | ) | |||||||
Perpetual short-term | — | (121,438,569 | ) | (404,822 | ) | (33,678,788 | ) | — | (2,526,997 | ) | ||||||||||||||
Total capital loss carryforwards | $ | — | $ | (218,189,346 | ) | $ | (430,776 | ) | $ | (60,795,038 | ) | $ | (5,741,444 | ) | $ | (3,266,154 | ) | |||||||
Timing differences (Post October Loss Deferral) | — | — | — | (20,023 | ) | — | — | |||||||||||||||||
Unrealized gains (losses) — net | 27,217,712 | 514,084,062 | 1,896,313 | 2,579,014 | 3,570,409 | (6,000,151 | ) | |||||||||||||||||
Total accumulated earnings (losses) — net | $ | 32,261,543 | $ | 304,126,389 | $ | 1,488,455 | $ | (58,236,047 | ) | $ | (1,859,553 | ) | $ | (8,911,400 | ) | |||||||||
| (1) | The China Equity and International Equity ESG Funds utilized $1,379,153 and $8,184,962, respectively, of capital loss carryforwards during the fiscal year. |
As of October 31, 2020, the Funds’ aggregate security unrealized gains and losses based on cost for U.S. federal income tax purposes were as follows:
| China Equity | Emerging Markets Equity | ESG Emerging Markets Equity | Imprint Emerging Markets Opportunities | International Equity ESG | International Equity Income | |||||||||||||||||||||
Tax cost | $ | 60,336,915 | $ | 1,957,518,580 | $ | 7,243,991 | $ | 19,382,309 | $ | 126,019,835 | $ | 63,188,980 | ||||||||||||||
Gross unrealized gain | 28,058,528 | 675,908,290 | 2,380,978 | 3,103,839 | 19,216,704 | 4,538,196 | ||||||||||||||||||||
Gross unrealized loss | (840,816 | ) | (161,824,228 | ) | (484,665 | ) | (524,825 | ) | (15,646,295 | ) | (10,538,347 | ) | ||||||||||||||
Net unrealized gain (loss) | $ | 27,217,712 | $ | 514,084,062 | $ | 1,896,313 | $ | 2,579,014 | $ | 3,570,409 | $ | (6,000,151 | ) | |||||||||||||
107
GOLDMAN SACHS FUNDAMENTAL EQUITY INTERNATIONAL FUNDS
Notes to Financial Statements (continued)
October 31, 2020
| 7. TAX INFORMATION (continued) |
The difference between GAAP-basis and tax-basis unrealized gains (losses) is attributable primarily to wash sales and differences in the tax treatment of passive foreign investment company investments.
The Imprint Emerging Markets Opportunities Fund reclassified $4,989 from paid in capital to distributable earnings for the year ending October 31, 2020. In order to present certain components of the Fund’s capital accounts on a tax-basis, certain reclassifications have been recorded to the Fund’s accounts. These reclassifications have no impact on the NAV of the Fund and result primarily from taxable overdistributions and net operating losses.
GSAM has reviewed the Funds’ tax positions for all open tax years (the current and prior three years, as applicable) and has concluded that no provision for income tax is required in the Funds’ financial statements. Such open tax years remain subject to examination and adjustment by tax authorities.
| 8. OTHER RISKS |
The Funds’ risks include, but are not limited to, the following:
Dividend-Paying Investments Risk — A Fund’s investments in dividend-paying securities could cause a Fund to underperform other funds. Securities that pay dividends, as a group, can fall out of favor with the market, causing such securities to underperform securities that do not pay dividends. Depending upon market conditions and political and legislative responses to such conditions, dividend-paying securities that meet a Fund’s investment criteria may not be widely available and/or may be highly concentrated in only a few market sectors. In addition, issuers that have paid regular dividends or distributions to shareholders may not continue to do so at the same level or at all in the future. This may limit the ability of a Fund to produce current income.
ESG Standards Risk — The ESG Emerging Markets Equity and International Equity ESG Funds’ adherence to their environmental, social and governance (“ESG”) criteria and the application of GSAM’s supplemental ESG analysis when selecting investments may affect the Funds’ exposure to certain companies, sectors, regions, and countries and may affect the Funds’ performance depending on whether such investments are in or out of favor. For example, the Funds will not seek to invest in companies that GSAM believes have adverse social or environmental impacts (i.e., gambling, alcohol, tobacco, coal or weapons companies), and the Funds will not seek to invest in companies that GSAM believes show inadequate governance standards (e.g., certain state-owned enterprises).
Foreign and Emerging Countries Risk — Investing in foreign markets may involve special risks and considerations not typically associated with investing in the U.S. Foreign securities may be subject to risk of loss because of more or less foreign government regulation, less public information and less economic, political and social stability in the countries in which a Fund invests. The imposition of exchange controls (including repatriation restrictions), confiscation of assets and property, trade restrictions (including tariffs) and other government restrictions by the U.S. or other governments, or from problems in share registration, settlement or custody, may also result in losses. Foreign risk also involves the risk of negative foreign currency rate fluctuations, which may cause the value of securities denominated in such foreign currency (or other instruments through which a Fund has exposure to foreign currencies) to decline in value. Currency exchange rates may fluctuate significantly over short periods of time. To the extent that a Fund also invests in securities of issuers located in emerging markets, these risks may be more pronounced.
Foreign Custody Risk — If a Fund invests in foreign securities, the Fund may hold such securities and cash with foreign banks, agents, and securities depositories appointed by the Fund’s custodian (each a “Foreign Custodian”). Some foreign custodians may be recently organized or new to the foreign custody business. In some countries, Foreign Custodians may be subject to little or no regulatory oversight over, or independent evaluation of, their operations. Further, the laws of certain countries may place limitations on a Fund’s ability to recover its assets if a Foreign Custodian enters bankruptcy. Investments in emerging markets may be subject to even greater custody risks than investments in more developed markets. Custody services in emerging market countries are very often undeveloped and may be considerably less well regulated than in more developed countries, and thus may not afford the same level of investor protection as would apply in developed countries.
108
GOLDMAN SACHS FUNDAMENTAL EQUITY INTERNATIONAL FUNDS
| 8. OTHER RISKS (continued) |
Geographic Risk — If a Fund focuses its investments in securities of issuers located in a particular country or geographic region, the Fund may be subjected, to a greater extent than if its investments were less focused, to the risks of volatile economic cycles and/or conditions and developments that may be particular to that country or region, such as: adverse securities markets; adverse exchange rates; adverse social, political, regulatory, economic, business, environmental or other developments; or natural disasters.
Investments in Other Investment Companies Risk — As a shareholder of another investment company, including an ETF, a Fund will indirectly bear its proportionate share of any net management fees and other expenses paid by such other investment companies, in addition to the fees and expenses regularly borne by the Fund. ETFs are subject to risks that do not apply to conventional mutual funds, including but not limited to the following: (i) the market price of the ETF’s shares may trade at a premium or a discount to their NAV; and (ii) an active trading market for an ETF’s shares may not develop or be maintained.
Issuer Concentration Risk— The Funds may invest in a relatively small number of issuers. As a result, they may be subject to greater risks than a fund that invests in a greater number of issuers. A change in the value of any single investment held by the Funds may affect the overall value of the Funds more than it would affect a mutual fund that holds more investments. In particular, the Funds may be more susceptible to adverse developments affecting any single issuer in the Funds and may be susceptible to greater losses because of these developments.
Large Shareholder Transactions Risk — A Fund may experience adverse effects when certain large shareholders, such as other funds, institutional investors (including those trading by use of non-discretionary mathematical formulas), financial intermediaries (who may make investment decisions on behalf of underlying clients and/or include a Fund in their investment model), individuals, accounts and Goldman Sachs affiliates, purchase or redeem large amounts of shares of a Fund. Such large shareholder redemptions, which may occur rapidly or unexpectedly, may cause a Fund to sell portfolio securities at times when it would not otherwise do so, which may negatively impact a Fund’s NAV and liquidity. These transactions may also accelerate the realization of taxable income to shareholders if such sales of investments resulted in gains, and may also increase transaction costs. In addition, a large redemption could result in a Fund’s current expenses being allocated over a smaller asset base, leading to an increase in the Fund’s expense ratio. Similarly, large Fund share purchases may adversely affect a Fund’s performance to the extent that the Fund is delayed in investing new cash or otherwise maintains a larger cash position than it ordinarily would.
Liquidity Risk — A Fund may make investments that are illiquid or that may become less liquid in response to market developments or adverse investor perceptions. Illiquid investments may be more difficult to value. Liquidity risk may also refer to the risk that a Fund will not be able to pay redemption proceeds within the allowable time period or without significant dilution to remaining investors’ interests because of unusual market conditions, an unusually high volume of redemption requests, or other reasons. To meet redemption requests, a Fund may be forced to sell investments at an unfavorable time and/or under unfavorable conditions. If a Fund is forced to sell securities at an unfavorable time and/or under unfavorable conditions, such sales may adversely affect the Fund’s NAV and dilute remaining investors’ interests. These risks may be more pronounced in connection with the Funds’ investments in securities of issuers located in emerging market countries. Redemptions by large shareholders may have a negative impact on a Fund’s liquidity.
Market and Credit Risks — In the normal course of business, a Fund trades financial instruments and enters into financial transactions where risk of potential loss exists due to changes in the market (market risk). The value of the securities in which a Fund invests may go up or down in response to the prospects of individual companies, particular sectors or governments and/or general economic conditions throughout the world due to increasingly interconnected global economies and financial markets. Events such as war, acts of terrorism, social unrest, natural disasters, the spread of infectious illness or other public health threats could also significantly impact a Fund and its investments. Additionally, a Fund may also be exposed to credit risk in the event that an issuer or guarantor fails to perform or that an institution or entity with which the Fund has unsettled or open transactions defaults.
109
GOLDMAN SACHS FUNDAMENTAL EQUITY INTERNATIONAL FUNDS
Notes to Financial Statements (continued)
October 31, 2020
| 9. INDEMNIFICATIONS |
Under the Trust’s organizational documents, its Trustees, officers, employees and agents are indemnified, to the extent permitted by the Act and state law, against certain liabilities that may arise out of performance of their duties to the Funds. Additionally, in the course of business, the Funds enter into contracts that contain a variety of indemnification clauses. The Funds’ maximum exposure under these arrangements is unknown, as this would involve future claims that may be made against the Funds that have not yet occurred. However, GSAM believes the risk of loss under these arrangements to be remote.
| 10. OTHER MATTERS |
At a meeting held on September 16, 2020, the Trustees approved a change to the Goldman Sachs Emerging Markets Equity Fund’s sub-classification under the Investment Company Act of 1940 from “diversified” to “non-diversified” and the elimination of any related fundamental investment restrictions. This change is subject to approval by the shareholders of the Goldman Sachs Emerging Markets Equity Fund at a meeting to be held on or about January 8, 2021.
On October 16, 2020, the Trustees approved an Agreement and Plan of Reorganization which contemplates the reorganization of the Goldman Sachs Imprint Emerging Markets Opportunities Fund (the “Acquired Fund”) with and into the Goldman Sachs ESG Emerging Markets Equity Fund (the “Surviving Fund”). The reorganization is expected to close during January 2021 or on such other date as the parties to the reorganization shall agree. The reorganization is intended to qualify as a tax-free reorganization for federal income tax purposes.
As of the close of business on October 16, 2020, the Acquired Fund may depart from its stated investment objectives and policies as it prepares to reorganize with and into the Surviving Fund. After the close of business on November 13, 2020, the Acquired Fund discontinued accepting orders for the purchase of Acquired Fund shares or exchanges into the Acquired Fund from other Goldman Sachs Funds; however, existing shareholders of the Acquired Fund may continue to reinvest dividends and distributions, if any.
On October 22, 2020, Goldman Sachs announced a settlement of matters involving 1Malaysia Development Bhd. (1MDB), a Malaysian sovereign wealth fund, with the United States Department of Justice as well as criminal and civil authorities in the UK, Singapore and Hong Kong. Further information regarding the 1MDB settlement can be found at https://www.goldmansachs.com/media-relations/press-releases/current/goldman-sachs-2020-10-22.html. The 1MDB settlement will not materially adversely affect GSAM’s ability to serve as investment manager.
| 11. SUBSEQUENT EVENTS |
Subsequent events after the Statements of Assets and Liabilities date have been evaluated, and GSAM has concluded that there is no impact requiring adjustment or disclosure in the financial statements.
110
GOLDMAN SACHS FUNDAMENTAL EQUITY INTERNATIONAL FUNDS
| 12. SUMMARY OF SHARE TRANSACTIONS |
Share activity is as follows:
| China Equity Fund | ||||||||||||||||
|
| |||||||||||||||
| For the Fiscal Year Ended October 31, 2020 | For the Fiscal Year Ended October 31, 2019 | |||||||||||||||
|
| |||||||||||||||
| Shares | Dollars | Shares | Dollars | |||||||||||||
|
| |||||||||||||||
| Class A Shares | ||||||||||||||||
Shares sold | 126,767 | $ | 3,726,193 | 100,472 | $ | 2,465,209 | ||||||||||
Reinvestment of distributions | 2,829 | 77,404 | 38,407 | 858,528 | ||||||||||||
Shares redeemed | (144,100 | ) | (4,115,802 | ) | (208,987 | ) | (5,053,525 | ) | ||||||||
| (14,504 | ) | (312,205 | ) | (70,108 | ) | (1,729,788 | ) | |||||||||
| Class C Shares | ||||||||||||||||
Shares sold | 7,071 | 201,260 | 6,183 | 131,992 | ||||||||||||
Reinvestment of distributions | — | — | 3,328 | 66,890 | ||||||||||||
Shares redeemed | (16,327 | ) | (473,003 | ) | (33,688 | ) | (735,710 | ) | ||||||||
| (9,256 | ) | (271,743 | ) | (24,177 | ) | (536,828 | ) | |||||||||
| Institutional Shares | ||||||||||||||||
Shares sold | 171,199 | 5,264,520 | 56,003 | 1,438,836 | ||||||||||||
Reinvestment of distributions | 1,791 | 52,218 | 17,609 | 419,499 | ||||||||||||
Shares redeemed | (128,069 | ) | (3,966,257 | ) | (129,539 | ) | (3,261,359 | ) | ||||||||
| 44,921 | 1,350,481 | (55,927 | ) | (1,403,024 | ) | |||||||||||
| Investor Shares | ||||||||||||||||
Shares sold | 13,372 | 508,441 | 2,795 | 74,498 | ||||||||||||
Reinvestment of distributions | 65 | 1,881 | 724 | 17,126 | ||||||||||||
Shares redeemed | (2,262 | ) | (75,838 | ) | (11,360 | ) | (283,760 | ) | ||||||||
| 11,175 | 434,484 | (7,841 | ) | (192,136 | ) | |||||||||||
| Class R6 Shares | ||||||||||||||||
Shares sold | 11,308 | 379,882 | 24,436 | 597,278 | ||||||||||||
Reinvestment of distributions | 129 | 3,753 | 23 | 539 | ||||||||||||
Shares redeemed | (11,089 | ) | (320,448 | ) | (9,102 | ) | (237,071 | ) | ||||||||
| 348 | 63,187 | 15,357 | 360,746 | |||||||||||||
| Class P Shares | ||||||||||||||||
Shares sold | 86,171 | 3,054,723 | 23,591 | 611,925 | ||||||||||||
Reinvestment of distributions | 15,824 | 459,995 | 132,977 | 3,162,940 | ||||||||||||
Shares redeemed | (583,781 | ) | (17,019,910 | ) | (194,578 | ) | (4,752,501 | ) | ||||||||
| (481,786 | ) | (13,505,192 | ) | (38,010 | ) | (977,636 | ) | |||||||||
NET DECREASE | (449,102 | ) | $ | (12,240,988 | ) | (180,706 | ) | $ | (4,478,666 | ) | ||||||
111
GOLDMAN SACHS FUNDAMENTAL EQUITY INTERNATIONAL FUNDS
Notes to Financial Statements (continued)
October 31, 2020
| 12. SUMMARY OF SHARE TRANSACTIONS (continued) |
Share activity is as follows:
| Emerging Markets Equity Fund | ||||||||||||||||
|
| |||||||||||||||
| For the Fiscal Year Ended October 31, 2020 | For the Fiscal Year Ended October 31, 2019 | |||||||||||||||
|
| |||||||||||||||
| Shares | Dollars | Shares | Dollars | |||||||||||||
|
| |||||||||||||||
| Class A Shares | ||||||||||||||||
Shares sold | 2,462,958 | $ | 48,455,389 | 6,814,401 | $ | 132,500,133 | ||||||||||
Reinvestment of distributions | 93,742 | 2,010,764 | 37,945 | 644,306 | ||||||||||||
Shares redeemed | (3,442,074 | ) | (71,345,232 | ) | (4,421,848 | ) | (82,650,999 | ) | ||||||||
| (885,374 | ) | (20,879,079 | ) | 2,430,498 | 50,493,440 | |||||||||||
| Class C Shares | ||||||||||||||||
Shares sold | 167,066 | 3,138,281 | 475,915 | 7,954,572 | ||||||||||||
Reinvestment of distributions | 1,430 | 27,481 | — | — | ||||||||||||
Shares redeemed | (723,449 | ) | (13,083,010 | ) | (981,996 | ) | (16,512,774 | ) | ||||||||
| (554,953 | ) | (9,917,248 | ) | (506,081 | ) | (8,558,202 | ) | |||||||||
| Institutional Shares | ||||||||||||||||
Shares sold | 35,242,475 | 734,989,856 | 21,184,595 | 429,740,047 | ||||||||||||
Reinvestment of distributions | 392,564 | 9,021,135 | 240,543 | 4,370,669 | ||||||||||||
Shares redeemed | (20,736,403 | ) | (433,521,965 | ) | (15,168,077 | ) | (301,279,401 | ) | ||||||||
| 14,898,636 | 310,489,026 | 6,257,061 | 132,831,315 | |||||||||||||
| Service Shares | ||||||||||||||||
Shares sold | 113,209 | 2,233,782 | 265,718 | 4,913,041 | ||||||||||||
Reinvestment of distributions | 9,144 | 189,825 | 2,995 | 49,234 | ||||||||||||
Shares redeemed | (204,734 | ) | (4,190,686 | ) | (240,524 | ) | (4,530,984 | ) | ||||||||
| (82,381 | ) | (1,767,079 | ) | 28,189 | 431,291 | |||||||||||
| Investor Shares | ||||||||||||||||
Shares sold | 3,533,113 | 78,698,214 | 4,372,238 | 87,269,385 | ||||||||||||
Reinvestment of distributions | 61,914 | 1,412,269 | 49,984 | 901,707 | ||||||||||||
Shares redeemed | (4,030,866 | ) | (84,519,615 | ) | (5,812,117 | ) | (118,938,935 | ) | ||||||||
| (435,839 | ) | (4,409,132 | ) | (1,389,895 | ) | (30,767,843 | ) | |||||||||
| Class R6 Shares | ||||||||||||||||
Shares sold | 1,428,465 | 36,234,602 | 456,009 | 9,148,907 | ||||||||||||
Reinvestment of distributions | 12,192 | 281,391 | 16,045 | 292,670 | ||||||||||||
Shares redeemed | (514,852 | ) | (11,661,753 | ) | (1,360,524 | ) | (26,616,360 | ) | ||||||||
| 925,805 | 24,854,240 | (888,470 | ) | (17,174,783 | ) | |||||||||||
| Class P Shares | ||||||||||||||||
Shares sold | 6,573,745 | 138,225,628 | 5,473,674 | 108,679,052 | ||||||||||||
Reinvestment of distributions | 200,362 | 4,624,350 | 144,959 | 2,644,053 | ||||||||||||
Shares redeemed | (6,114,209 | ) | (120,328,876 | ) | (4,710,104 | ) | (93,985,135 | ) | ||||||||
| 659,898 | 22,521,102 | 908,529 | 17,337,970 | |||||||||||||
NET INCREASE | 14,525,792 | $ | 320,891,830 | 6,839,831 | $ | 144,593,188 | ||||||||||
112
GOLDMAN SACHS FUNDAMENTAL EQUITY INTERNATIONAL FUNDS
| 12. SUMMARY OF SHARE TRANSACTIONS (continued) |
Share activity is as follows:
| ESG Emerging Markets Equity Fund | ||||||||||||||||
|
| |||||||||||||||
| For the Fiscal Year Ended October 31, 2020 | For the Fiscal Year Ended October 31, 2019 | |||||||||||||||
|
| |||||||||||||||
| Shares | Dollars | Shares | Dollars | |||||||||||||
|
| |||||||||||||||
| Class A Shares | ||||||||||||||||
Shares sold | 10,017 | $ | 98,475 | 22 | $ | 209 | ||||||||||
Reinvestment of distributions | 26 | 280 | 12 | 100 | ||||||||||||
Shares redeemed | (7,198 | ) | (80,289 | ) | — | — | ||||||||||
| 2,845 | 18,466 | 34 | 309 | |||||||||||||
| Institutional Shares | ||||||||||||||||
Shares sold | 52,136 | 490,982 | 118,634 | 1,104,801 | ||||||||||||
Reinvestment of distributions | 6,049 | 64,061 | 3,343 | 27,540 | ||||||||||||
Shares redeemed | (17,033 | ) | (168,319 | ) | (104,567 | ) | (1,027,258 | ) | ||||||||
| 41,152 | 386,724 | 17,410 | 105,083 | |||||||||||||
| Investor Shares | ||||||||||||||||
Reinvestment of distributions | 38 | 400 | 20 | 167 | ||||||||||||
| 38 | 400 | 20 | 167 | |||||||||||||
| Class R6 Shares | ||||||||||||||||
Shares sold | 475 | 5,046 | — | — | ||||||||||||
Reinvestment of distributions | 44 | 471 | 25 | 206 | ||||||||||||
Shares redeemed | (2 | ) | (23 | ) | — | — | ||||||||||
| 517 | 5,494 | 25 | 206 | |||||||||||||
| Class R Shares | ||||||||||||||||
Shares sold | 4,997 | 50,471 | 11,843 | 114,941 | ||||||||||||
Reinvestment of distributions | 96 | 1,009 | 4 | 34 | ||||||||||||
Shares redeemed | (110 | ) | (1,147 | ) | (6 | ) | (53 | ) | ||||||||
| 4,983 | 50,333 | 11,841 | 114,922 | |||||||||||||
| Class P Shares(a) | ||||||||||||||||
Shares sold | 7,349 | 84,005 | — | — | ||||||||||||
Reinvestment of distributions | — | — | — | — | ||||||||||||
Shares redeemed | (1 | ) | (5 | ) | — | — | ||||||||||
| 7,348 | 84,000 | — | — | |||||||||||||
NET INCREASE | 56,883 | $ | 545,417 | 29,330 | $ | 220,687 | ||||||||||
| (a) | Commenced operations on January 21, 2020. |
113
GOLDMAN SACHS FUNDAMENTAL EQUITY INTERNATIONAL FUNDS
Notes to Financial Statements (continued)
October 31, 2020
| 12. SUMMARY OF SHARE TRANSACTIONS (continued) |
Share activity is as follows:
| Imprint Emerging Markets Opportunities Fund | ||||||||||||||||
|
| |||||||||||||||
| For the Fiscal Year Ended October 31, 2020 | For the Fiscal Year Ended October 31, 2019 | |||||||||||||||
|
| |||||||||||||||
| Shares | Dollars | Shares | Dollars | |||||||||||||
|
| |||||||||||||||
| Class A Shares | ||||||||||||||||
Shares sold | 29,004 | $ | 231,285 | 54,373 | $ | 462,086 | ||||||||||
Reinvestment of distributions | 18,647 | 162,419 | 5,314 | 43,152 | ||||||||||||
Shares redeemed | (88,592 | ) | (713,102 | ) | (426,689 | ) | (3,637,862 | ) | ||||||||
| (40,941 | ) | (319,398 | ) | (367,002 | ) | (3,132,624 | ) | |||||||||
| Class C Shares | ||||||||||||||||
Shares sold | 1,956 | 15,474 | 871 | 7,085 | ||||||||||||
Reinvestment of distributions | 5,595 | 46,603 | — | — | ||||||||||||
Shares redeemed | (66,888 | ) | (494,120 | ) | (117,652 | ) | (964,642 | ) | ||||||||
| (59,337 | ) | (432,043 | ) | (116,781 | ) | (957,557 | ) | |||||||||
| Institutional Shares | ||||||||||||||||
Shares sold | 49,812 | 410,262 | 43,062 | 384,696 | ||||||||||||
Reinvestment of distributions | 22,841 | 199,179 | 17,360 | 141,306 | ||||||||||||
Shares redeemed | (156,103 | ) | (1,234,571 | ) | (1,091,629 | ) | (9,349,452 | ) | ||||||||
| (83,450 | ) | (625,130 | ) | (1,031,207 | ) | (8,823,450 | ) | |||||||||
| Investor Shares | ||||||||||||||||
Shares sold | 624 | 4,800 | 6,747 | 56,324 | ||||||||||||
Reinvestment of distributions | 8,335 | 72,847 | 2,245 | 18,320 | ||||||||||||
Shares redeemed | (62,498 | ) | (488,836 | ) | (532,724 | ) | (4,404,839 | ) | ||||||||
| (53,539 | ) | (411,189 | ) | (523,732 | ) | (4,330,195 | ) | |||||||||
| Class R6 Shares | ||||||||||||||||
Reinvestment of distributions | 51 | 446 | 14 | 117 | ||||||||||||
| 51 | 446 | 14 | 117 | |||||||||||||
| Class P Shares | ||||||||||||||||
Shares sold | 600,833 | 5,019,800 | 25,721 | 218,000 | ||||||||||||
Reinvestment of distributions | 84,204 | 733,414 | 26,019 | 211,532 | ||||||||||||
Shares redeemed | (739,056 | ) | (4,937,017 | ) | (265,388 | ) | (2,255,242 | ) | ||||||||
| (54,019 | ) | 816,197 | (213,648 | ) | (1,825,710 | ) | ||||||||||
NET DECREASE | (291,235 | ) | $ | (971,117 | ) | (2,252,356 | ) | $ | (19,069,419 | ) | ||||||
114
GOLDMAN SACHS FUNDAMENTAL EQUITY INTERNATIONAL FUNDS
| 12. SUMMARY OF SHARE TRANSACTIONS (continued) |
Share activity is as follows:
| International Equity ESG Fund | ||||||||||||||||
|
| |||||||||||||||
| For the Fiscal Year Ended October 31, 2020 | For the Fiscal Year Ended October 31, 2019 | |||||||||||||||
|
| |||||||||||||||
| Shares | Dollars | Shares | Dollars | |||||||||||||
|
| |||||||||||||||
| Class A Shares | ||||||||||||||||
Shares sold | 133,274 | $ | 2,734,925 | 64,610 | $ | 1,182,838 | ||||||||||
Reinvestment of distributions | 27,677 | 588,138 | 27,075 | 449,717 | ||||||||||||
Shares redeemed | (248,525 | ) | (4,878,188 | ) | (325,180 | ) | (6,007,245 | ) | ||||||||
| (87,574 | ) | (1,555,125 | ) | (233,495 | ) | (4,374,690 | ) | |||||||||
| Class C Shares | ||||||||||||||||
Shares sold | 19,627 | 367,338 | 46,331 | 788,954 | ||||||||||||
Reinvestment of distributions | 5,908 | 116,869 | 1,542 | 23,885 | ||||||||||||
Shares redeemed | (86,523 | ) | (1,656,334 | ) | (110,589 | ) | (1,926,146 | ) | ||||||||
| (60,988 | ) | (1,172,127 | ) | (62,716 | ) | (1,113,307 | ) | |||||||||
| Institutional Shares | ||||||||||||||||
Shares sold | 1,052,903 | 19,020,799 | 1,084,979 | 20,862,777 | ||||||||||||
Reinvestment of distributions | 6,917 | 150,244 | 4,615 | 78,277 | ||||||||||||
Shares redeemed | (347,165 | ) | (7,495,026 | ) | (1,102,693 | ) | (22,012,585 | ) | ||||||||
| 712,655 | 11,676,017 | (13,099 | ) | (1,071,531 | ) | |||||||||||
| Service Shares | ||||||||||||||||
Reinvestment of distributions | 2 | 65 | 3 | 43 | ||||||||||||
| 2 | 65 | 3 | 43 | |||||||||||||
| Investor Shares | ||||||||||||||||
Shares sold | 66,005 | 1,397,732 | 18,990 | 370,134 | ||||||||||||
Reinvestment of distributions | 580 | 12,522 | 332 | 5,613 | ||||||||||||
Shares redeemed | (29,298 | ) | (530,767 | ) | (19,093 | ) | (366,160 | ) | ||||||||
| 37,287 | 879,487 | 229 | 9,587 | |||||||||||||
| Class R6 Shares | ||||||||||||||||
Shares sold | 84,465 | 1,603,333 | 25,890 | 469,704 | ||||||||||||
Reinvestment of distributions | 441 | 9,509 | 12 | 196 | ||||||||||||
Shares redeemed | (14,745 | ) | (302,157 | ) | (4,165 | ) | (82,165 | ) | ||||||||
| 70,161 | 1,310,685 | 21,737 | 387,735 | |||||||||||||
| Class P Shares | ||||||||||||||||
Shares sold | 270,153 | 5,622,065 | 293,748 | 5,446,526 | ||||||||||||
Reinvestment of distributions | 64,471 | 1,391,936 | 95,089 | 1,603,197 | ||||||||||||
Shares redeemed | (583,528 | ) | (10,749,626 | ) | (2,322,307 | ) | (42,986,970 | ) | ||||||||
| (248,904 | ) | (3,735,625 | ) | (1,933,470 | ) | (35,937,247 | ) | |||||||||
NET INCREASE (DECREASE) | 422,639 | $ | 7,403,377 | (2,220,811 | ) | $ | (42,099,410 | ) | ||||||||
115
GOLDMAN SACHS FUNDAMENTAL EQUITY INTERNATIONAL FUNDS
Notes to Financial Statements (continued)
October 31, 2020
| 12. SUMMARY OF SHARE TRANSACTIONS (continued) |
Share activity is as follows:
| International Equity Income Fund | ||||||||||||||||
|
| |||||||||||||||
| For the Fiscal Year Ended October 31, 2020 | For the Fiscal Year Ended October 31, 2019 | |||||||||||||||
|
| |||||||||||||||
| Shares | Dollars | Shares | Dollars | |||||||||||||
|
| |||||||||||||||
| Class A Shares | ||||||||||||||||
Shares sold | 182,716 | $ | 2,311,853 | 125,432 | $ | 1,595,783 | ||||||||||
Reinvestment of distributions | 45,006 | 589,936 | 167,381 | 1,917,576 | ||||||||||||
Shares redeemed | (281,009 | ) | (3,466,530 | ) | (250,762 | ) | (3,126,327 | ) | ||||||||
| (53,287 | ) | (564,741 | ) | 42,051 | 387,032 | |||||||||||
| Class C Shares | ||||||||||||||||
Shares sold | 71,007 | 804,995 | 14,593 | 159,836 | ||||||||||||
Reinvestment of distributions | 4,588 | 52,816 | 21,731 | 220,807 | ||||||||||||
Shares redeemed | (64,144 | ) | (659,312 | ) | (39,466 | ) | (432,297 | ) | ||||||||
| 11,451 | 198,499 | (3,142 | ) | (51,654 | ) | |||||||||||
| Institutional Shares | ||||||||||||||||
Shares sold | 896,612 | 12,181,396 | 220,491 | 2,992,011 | ||||||||||||
Reinvestment of distributions | 25,127 | 341,008 | 26,135 | 315,581 | ||||||||||||
Shares redeemed | (464,524 | ) | (5,770,660 | ) | (71,950 | ) | (902,125 | ) | ||||||||
| 457,215 | 6,751,744 | 174,676 | 2,405,467 | |||||||||||||
| Investor Shares | ||||||||||||||||
Shares sold | 1,087,266 | 13,736,169 | 247,942 | 3,267,774 | ||||||||||||
Reinvestment of distributions | 24,347 | 303,964 | 4,131 | 47,320 | ||||||||||||
Shares redeemed | (593,946 | ) | (7,217,787 | ) | (18,145 | ) | (229,025 | ) | ||||||||
| 517,667 | 6,822,346 | 233,928 | 3,086,069 | |||||||||||||
| Class R6 Shares | ||||||||||||||||
Shares sold | 193,200 | 2,347,482 | 21,177 | 275,372 | ||||||||||||
Reinvestment of distributions | 2,506 | 32,808 | 708 | 8,522 | ||||||||||||
Shares redeemed | (29,776 | ) | (375,534 | ) | (3,528 | ) | (46,349 | ) | ||||||||
| 165,930 | 2,004,756 | 18,357 | 237,545 | |||||||||||||
| Class R Shares | ||||||||||||||||
Shares sold | 16,916 | 181,068 | 2,282 | 28,441 | ||||||||||||
Reinvestment of distributions | 249 | 3,128 | 794 | 9,154 | ||||||||||||
Shares redeemed | (7,586 | ) | (83,968 | ) | (4,006 | ) | (50,618 | ) | ||||||||
| 9,579 | 100,228 | (930 | ) | (13,023 | ) | |||||||||||
| Class P Shares | ||||||||||||||||
Shares sold | 829,756 | 9,365,657 | 76,129 | 976,161 | ||||||||||||
Reinvestment of distributions | 89,109 | 1,237,682 | 314,791 | 3,790,562 | ||||||||||||
Shares redeemed | (1,503,307 | ) | (17,907,213 | ) | (329,004 | ) | (4,214,711 | ) | ||||||||
| (584,442 | ) | (7,303,874 | ) | 61,916 | 552,012 | |||||||||||
NET INCREASE | 524,113 | $ | 8,008,958 | 526,856 | $ | 6,603,448 | ||||||||||
116
Report of Independent Registered Public
Accounting Firm
To the Board of Trustees of Goldman Sachs Trust and Shareholders of Goldman Sachs China Equity Fund (formerly Goldman Sachs Asia Equity Fund), Goldman Sachs Emerging Markets Equity Fund, Goldman Sachs ESG Emerging Markets Equity Fund, Goldman Sachs Imprint Emerging Markets Opportunities Fund, Goldman Sachs International Equity ESG Fund, and Goldman Sachs International Equity Income Fund
Opinions on the Financial Statements
We have audited the accompanying statements of assets and liabilities, including the schedules of investments, of Goldman Sachs China Equity Fund (formerly Goldman Sachs Asia Equity Fund), Goldman Sachs Emerging Markets Equity Fund, Goldman Sachs ESG Emerging Markets Equity Fund, Goldman Sachs Imprint Emerging Markets Opportunities Fund, Goldman Sachs International Equity ESG Fund, and Goldman Sachs International Equity Income Fund (six of the funds constituting Goldman Sachs Trust, hereafter collectively referred to as the “Funds”) as of October 31, 2020, the related statements of operations for the year ended October 31, 2020, the statements of changes in net assets for each of the two years in the period ended October 31, 2020, including the related notes, and the financial highlights for each of the periods indicated therein (collectively referred to as the “financial statements”). In our opinion, the financial statements present fairly, in all material respects, the financial position of each of the Funds as of October 31, 2020, the results of each of their operations for the year then ended, the changes in each of their net assets for each of the two years in the period ended October 31, 2020 and each of the financial highlights for each of the periods indicated therein in conformity with accounting principles generally accepted in the United States of America.
Basis for Opinions
These financial statements are the responsibility of the Funds’ management. Our responsibility is to express an opinion on the Funds’ financial statements based on our audits. We are a public accounting firm registered with the Public Company Accounting Oversight Board (United States) (PCAOB) and are required to be independent with respect to the Funds in accordance with the U.S. federal securities laws and the applicable rules and regulations of the Securities and Exchange Commission and the PCAOB.
We conducted our audits of these financial statements in accordance with the standards of the PCAOB. Those standards require that we plan and perform the audit to obtain reasonable assurance about whether the financial statements are free of material misstatement, whether due to error or fraud.
Our audits included performing procedures to assess the risks of material misstatement of the financial statements, whether due to error or fraud, and performing procedures that respond to those risks. Such procedures included examining, on a test basis, evidence regarding the amounts and disclosures in the financial statements. Our audits also included evaluating the accounting principles used and significant estimates made by management, as well as evaluating the overall presentation of the financial statements. Our procedures included confirmation of securities owned as of October 31, 2020 by correspondence with the custodian, transfer agent and brokers; when replies were not received from brokers, we performed other auditing procedures. We believe that our audits provide a reasonable basis for our opinions.
/s/PricewaterhouseCoopers LLP
Boston, Massachusetts
December 23, 2020
We have served as the auditor of one or more investment companies in the Goldman Sachs fund complex since 2000.
117
GOLDMAN SACHS FUNDAMENTAL EQUITY INTERNATIONAL FUNDS
Voting Results of Special Meeting of Shareholders (Unaudited)
A Special Meeting (the “Meeting”) of the Goldman Sachs Trust (“GST”) was held on January 23, 2020 to consider and act upon the proposals below. The Funds have amortized their respective share of the proxy, shareholder meeting and other related costs and GSAM has agreed to reimburse each Fund to the extent such expenses exceed a specified percentage of the Fund’s net assets.
At the Meeting, Dwight L. Bush, Kathryn A. Cassidy, Joaquin Delgado and Gregory G. Weaver were elected to the Trust’s Board of Trustees. In electing trustees, the Trust’s shareholders voted as follows:
Proposal 1. Election of Trustees | For | Against | Withheld | Broker Non-Votes | ||||||||||||
Dwight L. Bush | 94,278,961,728.065 | 0 | 349,026,343,365 | 0 | ||||||||||||
Kathryn A. Cassidy | 94,310,850,789.164 | 0 | 317,137,282.266 | 0 | ||||||||||||
Joaquin Delgado | 94,282,646,444.727 | 0 | 345,341,626.703 | 0 | ||||||||||||
Gregory G. Weaver | 94,306,589,873.348 | 0 | 321,398,198.082 | 0 | ||||||||||||
118
GOLDMAN SACHS FUNDAMENTAL EQUITY INTERNATIONAL FUNDS
Fund Expenses — Six Month Period Ended October 31, 2020 (Unaudited) | ||
As a shareholder of Class A, Class C, Institutional, Service, Investor, Class R6, Class R or Class P Shares of a Fund you incur two types of costs: (1) transaction costs, including sales charges on purchase payments (with respect to Class A Shares) and contingent deferred sales charges on redemptions (with respect to Class C Shares); and (2) ongoing costs, including management fees; distribution and/or service (12b-1) fees (with respect to Class A, Class C and Service Shares); and other Fund expenses. This example is intended to help you understand your ongoing costs (in dollars) of investing in Class A, Class C, Institutional, Service, Investor, Class R6, Class R and Class P Shares of the Funds and to compare these costs with the ongoing costs of investing in other mutual funds.
The example is based on an investment of $1,000 invested at the beginning of the period and held for the entire period from May 1, 2020 through Ocotber 31, 2020, which represents a period of 184 days of a 366 day year.
Actual Expenses — The first line under each share class in the table below provides information about actual account values and actual expenses. You may use the information in this line, together with the amount you invested, to estimate the expenses that you paid over the period. Simply divide your account value by $1,000 (for example, an $8,600 account value divided by $1,000=8.6), then multiply the result by the number in the first line under the heading entitled “Expenses Paid” to estimate the expenses you paid on your account during this period.
Hypothetical Example for Comparison Purposes — The second line under each share class in the table below provides information about hypothetical account values and hypothetical expenses based on the Funds’ actual net expense ratio and an assumed rate of return of 5% per year before expenses, which is not the Funds’ actual return. The hypothetical account values and expenses may not be used to estimate the actual ending account balance or expenses you paid for the period. You may use this information to compare the ongoing costs of investing in the Funds and other funds. To do so, compare this 5% hypothetical example with the 5% hypothetical examples that appear in the shareholder reports of the other funds.
Please note that the expenses shown in the table are meant to highlight your ongoing costs only and do not reflect any transactional costs, such as sales charges, redemption fee or exchange fees. Therefore, the second line of the table is useful in comparing ongoing costs only, and will not help you determine the relative total costs of owning different funds. In addition, if these transactional costs were included, your costs would have been higher.
| China Equity Fund | Emerging Markets Equity Fund | ESG Emerging Markets Equity Fund | Imprint Emerging Markets Opportunities | International Equity ESG Fund | International Equity Income Fund | |||||||||||||||||||||||||||||||||||||||||||||||||||||||||||||||||||
| Share Class | Beginning Account Value 05/01/2020 | Ending Account Value 10/31/2020 | Expenses Paid for the 6 Months Ended 10/31/2020* | Beginning Account Value 05/01/2020 | Ending Account Value 10/31/2020 | Expenses Paid for the 6 Months Ended 10/31/2020* | Beginning Account Value 05/01/2020 | Ending Account Value 10/31/2020 | Expenses Paid for the 6 Months Ended 10/31/2020* | Beginning Account Value 05/01/2020 | Ending Account Value 10/31/2020 | Expenses Paid for the 6 Months Ended 10/31/2020* | Beginning Account Value 05/01/2020 | Ending Account Value 10/31/2020 | Expenses Paid for the 6 Months Ended 10/31/2020* | Beginning Account Value 05/01/2020 | Ending Account Value 10/31/2020 | Expenses Paid for the 6 Months Ended 10/31/2020* | ||||||||||||||||||||||||||||||||||||||||||||||||||||||
| Class A | ||||||||||||||||||||||||||||||||||||||||||||||||||||||||||||||||||||||||
Actual | $ | 1,000 | $ | 1,394.30 | $ | 8.73 | $ | 1,000 | $ | 1,298.20 | $ | 8.61 | $ | 1,000 | $ | 1,294.70 | $ | 8.48 | $ | 1,000 | $ | 1,291.50 | $ | 9.33 | $ | 1,000 | $ | 1,168.60 | $ | 6.43 | $ | 1,000 | $ | 1,057.30 | $ | 6.31 | ||||||||||||||||||||||||||||||||||||
Hypothetical 5% return | 1,000 | 1,017.85 | + | 7.35 | 1,000 | 1,017.65 | + | 7.56 | 1,000 | 1,017.75 | + | 7.46 | 1,000 | 1,016.99 | + | 8.21 | 1,000 | 1,019.20 | + | 5.99 | 1,000 | 1,019.00 | + | 6.19 | ||||||||||||||||||||||||||||||||||||||||||||||||
| Class C | ||||||||||||||||||||||||||||||||||||||||||||||||||||||||||||||||||||||||
Actual | 1,000 | 1,389.00 | 13.15 | 1,000 | 1,293.40 | 12.86 | 1,000 | 1,290.00 | 12.72 | 1,000 | 1,284.80 | 13.55 | 1,000 | 1,164.20 | 10.44 | 1,000 | 1,052.30 | 10.11 | ||||||||||||||||||||||||||||||||||||||||||||||||||||||
Hypothetical 5% return | 1,000 | 1,014.13 | + | 11.09 | 1,000 | 1,013.93 | + | 11.29 | 1,000 | 1,014.03 | + | 11.19 | 1,000 | 1,013.27 | + | 11.94 | 1,000 | 1,015.48 | + | 9.73 | 1,000 | 1,015.28 | + | 9.93 | ||||||||||||||||||||||||||||||||||||||||||||||||
| Institutional | ||||||||||||||||||||||||||||||||||||||||||||||||||||||||||||||||||||||||
Actual | 1,000 | 1,396.00 | 6.93 | 1,000 | 1,300.40 | 6.77 | 1,000 | 1,297.70 | 6.58 | 1,000 | 1,292.20 | 7.20 | 1,000 | 1,170.20 | 4.69 | 1,000 | 1,059.60 | 4.40 | ||||||||||||||||||||||||||||||||||||||||||||||||||||||
Hypothetical 5% return | 1,000 | 1,019.36 | + | 5.84 | 1,000 | 1,019.25 | + | 5.94 | 1,000 | 1,019.41 | + | 5.79 | 1,000 | 1,018.85 | + | 6.34 | 1,000 | 1,020.81 | + | 4.37 | 1,000 | 1,020.86 | + | 4.32 | ||||||||||||||||||||||||||||||||||||||||||||||||
| Service | ||||||||||||||||||||||||||||||||||||||||||||||||||||||||||||||||||||||||
Actual | N/A | N/A | N/A | 1,000 | 1,297.00 | 9.58 | N/A | N/A | N/A | N/A | N/A | N/A | 1,000 | 1,167.30 | 7.14 | N/A | N/A | N/A | ||||||||||||||||||||||||||||||||||||||||||||||||||||||
Hypothetical 5% return | N/A | N/A | N/A | 1,000 | 1,016.79 | + | 8.42 | N/A | N/A | N/A | N/A | N/A | N/A | 1,000 | 1,018.55 | + | 6.65 | N/A | N/A | N/A | ||||||||||||||||||||||||||||||||||||||||||||||||||||
| Investor | ||||||||||||||||||||||||||||||||||||||||||||||||||||||||||||||||||||||||
Actual | 1,000 | 1,395.90 | 7.23 | 1,000 | 1,299.60 | 7.17 | 1,000 | 1,296.60 | 7.10 | 1,000 | 1,291.70 | 7.89 | 1,000 | 1,169.40 | 5.07 | 1,000 | 1,059.00 | 5.02 | ||||||||||||||||||||||||||||||||||||||||||||||||||||||
Hypothetical 5% return | 1,000 | 1,019.10 | + | 6.09 | 1,000 | 1,018.90 | + | 6.29 | 1,000 | 1,018.95 | + | 6.24 | 1,000 | 1,018.25 | + | 6.95 | 1,000 | 1,020.46 | + | 4.72 | 1,000 | 1,020.26 | + | 4.93 | ||||||||||||||||||||||||||||||||||||||||||||||||
| Class R6 | ||||||||||||||||||||||||||||||||||||||||||||||||||||||||||||||||||||||||
Actual | 1,000 | 1,396.30 | 6.87 | 1,000 | 1,300.10 | 6.71 | 1,000 | 1,297.70 | 6.53 | 1,000 | 1,292.60 | 7.20 | 1,000 | 1,170.00 | 4.64 | 1,000 | 1,058.90 | 4.35 | ||||||||||||||||||||||||||||||||||||||||||||||||||||||
Hypothetical 5% return | 1,000 | 1,019.41 | + | 5.79 | 1,000 | 1,019.30 | + | 5.89 | 1,000 | 1,019.46 | + | 5.74 | 1,000 | 1,018.85 | + | 6.34 | 1,000 | 1,020.86 | + | 4.32 | 1,000 | 1,020.91 | + | 4.27 | ||||||||||||||||||||||||||||||||||||||||||||||||
| Class R | ||||||||||||||||||||||||||||||||||||||||||||||||||||||||||||||||||||||||
Actual | N/A | N/A | N/A | N/A | N/A | N/A | 1,000 | 1,293.50 | 9.92 | N/A | N/A | N/A | N/A | N/A | N/A | 1,000 | 1,056.30 | 7.60 | ||||||||||||||||||||||||||||||||||||||||||||||||||||||
Hypothetical 5% return | N/A | N/A | N/A | N/A | N/A | N/A | 1,000 | 1,016.49 | + | 8.72 | N/A | N/A | N/A | N/A | N/A | N/A | 1,000 | 1,017.75 | + | 7.46 | ||||||||||||||||||||||||||||||||||||||||||||||||||||
| Class P | ||||||||||||||||||||||||||||||||||||||||||||||||||||||||||||||||||||||||
Actual | 1,000 | 1,396.50 | 6.87 | 1,000 | 1,300.10 | 6.71 | 1,000 | 1,297.70 | 7.68 | 1,000 | 1,292.60 | 7.15 | 1,000 | 1,170.00 | 4.58 | 1,000 | 1,058.80 | 4.35 | ||||||||||||||||||||||||||||||||||||||||||||||||||||||
Hypothetical 5% return | 1,000 | 1,019.41 | + | 5.79 | 1,000 | 1,019.30 | + | 5.89 | 1,000 | 1,018.45 | + | 6.75 | 1,000 | 1,018.90 | + | 6.29 | 1,000 | 1,020.91 | + | 4.27 | 1,000 | 1,020.91 | + | 4.27 | ||||||||||||||||||||||||||||||||||||||||||||||||
| + | Hypothetical expenses are based on each Fund’s actual annualized net expense ratios and an assumed rate of return of 5% per year before expenses. |
| * | Expenses are calculated using each Fund’s annualized net expense ratio for each class, which represents the ongoing expenses as a percentage of net assets for the year ended October 31, 2020. Expenses are calculated by multiplying the annualized net expense ratio by the average account value for the period; then multiplying the result by the number of days in the most recent fiscal half year; and then dividing that result by the number of days in the fiscal year. The annualized net expense ratios for the period were as follows: |
| Fund | Class A | Class C | Institutional | Service | Investor | Class R6 | Class R | Class P | ||||||||||||||||||||||||
China Equity | 1.45 | % | 2.19 | % | 1.15 | % | N/A | 1.20 | % | 1.14 | % | N/A | 1.14 | % | ||||||||||||||||||
Emerging Markets Equity | 1.49 | 2.23 | 1.17 | 1.66 | % | 1.24 | 1.16 | N/A | 1.16 | |||||||||||||||||||||||
ESG Emerging Markets Equity | 1.47 | 2.21 | 1.14 | N/A | 1.23 | 1.13 | 1.72 | % | 1.33 | |||||||||||||||||||||||
Imprint Emerging Markets Opportunities | 1.62 | 2.36 | 1.25 | N/A | 1.37 | 1.25 | N/A | 1.24 | ||||||||||||||||||||||||
International Equity ESG | 1.18 | 1.92 | 0.86 | 1.31 | 0.93 | 0.85 | N/A | 0.84 | ||||||||||||||||||||||||
International Equity Income | 1.22 | 1.96 | 0.85 | N/A | 0.97 | 0.84 | 1.47 | 0.84 | ||||||||||||||||||||||||
119
GOLDMAN SACHS FUNDAMENTAL EQUITY INTERNATIONAL FUNDS
Statement Regarding Basis for Approval of Management Agreement (Unaudited)
Background
The Goldman Sachs China Equity Fund, Goldman Sachs Emerging Markets Equity Fund, Goldman Sachs ESG Emerging Markets Equity Fund Goldman Sachs Imprint Emerging Markets Opportunities Fund, Goldman Sachs International Equity ESG Fund, and Goldman Sachs International Equity Income Fund (the “Funds”) are investment portfolios of Goldman Sachs Trust (the “Trust”). The Board of Trustees oversees the management of the Trust and reviews the investment performance and expenses of the Funds at regularly scheduled meetings held throughout the year. In addition, the Board of Trustees determines annually whether to approve the continuance of the Trust’s investment management agreement (the “Management Agreement”) with Goldman Sachs Asset Management, L.P. (the “Investment Adviser”) on behalf of the Funds.
The Management Agreement was most recently approved for continuation until June 30, 2021 by the Board of Trustees, including those Trustees who are not parties to the Management Agreement or “interested persons” (as defined in the Investment Company Act of 1940, as amended) of any party thereto (the “Independent Trustees”), at a meeting held on June 16-17, 2020 (the “Annual Meeting”).
The review process undertaken by the Trustees spans the course of the year and culminates with the Annual Meeting. To assist the Trustees in their deliberations, the Trustees have established a Contract Review Committee (the “Committee”), comprised of the Independent Trustees. The Committee held two meetings over the course of the year since the Management Agreement was last approved. At those Committee meetings, regularly scheduled Board or other committee meetings, and/or the Annual Meeting, matters relevant to the renewal of the Management Agreement were considered by the Board, or the Independent Trustees, as applicable. With respect to each Fund, such matters included:
| (a) | the nature and quality of the advisory, administrative, and other services provided to the Fund by the Investment Adviser and its affiliates, including information about: |
| (i) | the structure, staff, and capabilities of the Investment Adviser and its portfolio management teams; |
| (ii) | the groups within the Investment Adviser and its affiliates that support the portfolio management teams or provide other types of necessary services, including fund services groups (e.g., accounting and financial reporting, tax, shareholder services, and operations); controls and risk management groups (e.g., legal, compliance, valuation oversight, credit risk management, internal audit, compliance testing, market risk analysis, finance, and central funding); sales and distribution support groups, and others (e.g., information technology and training); |
| (iii) | trends in employee headcount; |
| (iv) | the Investment Adviser’s financial resources and ability to hire and retain talented personnel and strengthen its operations; and |
| (v) | the parent company’s support of the Investment Adviser and its mutual fund business, as expressed by the firm’s senior management; |
| (b) | information on the investment performance of the Fund, including comparisons to the performance of similar mutual funds, as provided by a third-party mutual fund data provider engaged as part of the contract review process (the “Outside Data Provider”), a benchmark performance index, and (in the case of the Emerging Markets Equity Fund) a composite of accounts with comparable investment strategies managed by the Investment Adviser; and information on general investment outlooks in the markets in which the Fund invests; |
| (c) | information provided by the Investment Adviser indicating the Investment Adviser’s views on whether the Fund’s peer group and/or benchmark index had high, medium, or low relevance given the Fund’s particular investment strategy; |
| (d) | the terms of the Management Agreement and other agreements with affiliated service providers entered into by the Trust on behalf of the Fund; |
| (e) | fee and expense information for the Fund, including: |
| (i) | the relative management fee and expense levels of the Fund as compared to those of comparable funds managed by other advisers, as provided by the Outside Data Provider; |
| (ii) | the Fund’s expense trends over time; and |
| (iii) | to the extent the Investment Adviser manages other types of accounts (such as bank collective trusts, private wealth management accounts, institutional separate accounts, sub-advised mutual funds, and non-U.S. funds) having investment objectives and policies similar to those of the Fund, comparative information on the advisory fees charged and services provided to those accounts by the Investment Adviser; |
| (f) | with respect to the extensive investment performance and expense comparison data provided by the Outside Data Provider, its processes in producing that data for the Fund; |
| (g) | the undertakings of the Investment Adviser and its affiliates to implement fee waivers and/or expense limitations; |
| (h) | information relating to the profitability of the Management Agreement and the transfer agency and distribution and service arrangements of the Fund to the Investment Adviser and its affiliates; |
120
GOLDMAN SACHS FUNDAMENTAL EQUITY INTERNATIONAL FUNDS
Statement Regarding Basis for Approval of Management Agreement (Unaudited) (continued)
| (i) | whether the Fund’s existing management fee schedule adequately addressed any economies of scale; |
| (j) | a summary of the “fall-out” benefits derived by the Investment Adviser and its affiliates from their relationships with the Fund, including the fees received by the Investment Adviser’s affiliates from the Fund for transfer agency, securities lending, portfolio trading, distribution and other services; |
| (k) | a summary of potential benefits derived by the Fund as a result of its relationship with the Investment Adviser; |
| (l) | information regarding commissions paid by the Fund and broker oversight, an update on the Investment Adviser’s soft dollars practices, other information regarding portfolio trading, and how the Investment Adviser carries out its duty to seek best execution; |
| (m) | portfolio manager ownership of Fund shares; the manner in which portfolio manager compensation is determined; and the number and types of accounts managed by the portfolio managers; |
| (n) | the nature and quality of the services provided to the Fund by its unaffiliated service providers, and the Investment Adviser’s general oversight and evaluation (including reports on due diligence) of those service providers as part of the administrative services provided under the Management Agreement; and |
| (o) | the Investment Adviser’s processes and policies addressing various types of potential conflicts of interest; its approach to risk management; the annual review of the effectiveness of the Fund’s compliance program; and periodic compliance reports. |
The Trustees also received an overview of the Funds’ distribution arrangements. They received information regarding the Funds’ assets, share purchase and redemption activity, and payment of distribution, service, and shareholder administration fees, as applicable. Information was also provided to the Trustees relating to revenue sharing payments made by and services provided by the Investment Adviser and its affiliates to intermediaries that promote the sale, distribution, and/or servicing of Fund shares. The Independent Trustees also discussed the broad range of other investment choices that are available to Fund investors, including the availability of comparable funds managed by other advisers.
The presentations made at the Board and Committee meetings and at the Annual Meeting encompassed the Funds and other mutual funds for which the Board of Trustees has responsibility. In evaluating the Management Agreement at the Annual Meeting, the Trustees relied upon their knowledge, resulting from their meetings and other interactions throughout the year, of the Investment Adviser and its affiliates, their services, and the Funds. In conjunction with these meetings, the Trustees received written materials and oral presentations on the topics covered, and the Investment Adviser addressed the questions and concerns of the Trustees, including concerns regarding the investment performance of certain of the funds they oversee. The Independent Trustees were advised by their independent legal counsel regarding their responsibilities and other regulatory requirements related to the approval and continuation of mutual fund investment management agreements under applicable law. In addition, the Investment Adviser and its affiliates provided the Independent Trustees with a written response to a formal request for information sent on behalf of the Independent Trustees by their independent legal counsel. During the course of their deliberations, the Independent Trustees met in executive sessions with their independent legal counsel, without representatives of the Investment Adviser or its affiliates present.
Nature, Extent, and Quality of the Services Provided Under the Management Agreement
As part of their review, the Trustees considered the nature, extent, and quality of the services provided to the Funds by the Investment Adviser. In this regard, the Trustees considered both the investment advisory services and non-advisory services that are provided by the Investment Adviser and its affiliates. The Trustees noted the transition in the leadership and changes in personnel of various of the Investment Adviser’s portfolio management teams that had occurred in recent periods, and the ongoing recruitment efforts aimed at bringing high quality investment talent to the Investment Adviser. They also noted the Investment Adviser’s commitment to maintaining high quality systems and expending substantial resources to respond to ongoing changes to the market, regulatory and control environment in which the Funds and their service providers operate, including changes associated with the COVID-19 pandemic, as well as the efforts of the Investment Adviser and its affiliates to combat cyber security risks. The Trustees also considered information regarding the Investment Adviser’s business continuity planning and remote operations in the current environment. The Trustees concluded that the Investment Adviser continued to commit substantial financial and operational resources to the Funds and expressed confidence that the Investment Adviser would continue to do so in the future. The Trustees also recognized that the Investment Adviser had made significant commitments to address regulatory compliance requirements applicable to the Funds and the Investment Adviser and its affiliates.
Investment Performance
The Trustees also considered the investment performance of the Funds. In this regard, they compared the investment performance of each Fund to its peers using rankings and (except in the case of the ESG Emerging Markets Equity Fund) ratings
121
GOLDMAN SACHS FUNDAMENTAL EQUITY INTERNATIONAL FUNDS
Statement Regarding Basis for Approval of Management Agreement (Unaudited) (continued)
compiled by the Outside Data Provider as of December 31, 2019, and updated performance information prepared by the Investment Adviser using the peer group identified by the Outside Data Provider as of March 31, 2020. The information on each Fund’s investment performance was provided for the one-, three-, five-, and ten-year periods ending on the applicable dates, to the extent that each Fund had been in existence for those periods. The Trustees also reviewed each Fund’s investment performance relative to its performance benchmark. As part of this review, they considered the investment performance trends of the Funds over time, and reviewed the investment performance of each Fund in light of its investment objective and policies and market conditions. The Trustees also received information comparing the Emerging Markets Equity Fund’s performance to that of a composite of accounts with comparable investment strategies managed by the Investment Adviser.
In addition, the Trustees considered materials prepared and presentations made by the Investment Adviser’s senior management and portfolio management personnel in which Fund performance was assessed. The Trustees also considered the Investment Adviser’s periodic reports with respect to the Funds’ risk profiles, and how the Investment Adviser’s approach to risk monitoring and management influences portfolio management.
The Trustees noted that the China Equity Fund’s Institutional Shares had placed in the top half of the Fund’s peer group and had outperformed the Fund’s benchmark index for the one-, three-, five-, and ten-year periods ended March 31, 2020. They observed that in November 2019, the Fund had been repositioned from the Goldman Sachs Asia Equity Fund, which involved changes to the Fund’s principal investment strategy and benchmark index. The Trustees also noted that the China Equity Fund had experienced certain portfolio management changes in the first half of 2019. They observed that the Emerging Markets Equity Fund’s Institutional Shares had placed in the top half of the Fund’s peer group and had outperformed the Fund’s benchmark index for the one-, three-, five-, and ten-year periods ended March 31, 2020. The Trustees noted that the ESG Emerging Markets Equity Fund had placed in the top half of the Fund’s peer group and had outperformed the Fund’s benchmark index for the one-year period ended March 31, 2020. They observed that the Imprint Emerging Markets Opportunities Fund’s Institutional Shares had placed in the fourth quartile of the Fund’s peer group and had underperformed the Fund’s benchmark index for the one-, three-, and five-year periods ended March 31, 2020. The Trustees noted that the Fund had been repositioned from the Goldman Sachs N-11 Equity Fund in August 2019, which involved changes to the Fund’s investment strategy and benchmark index. They further observed that the Fund had experienced certain portfolio management changes in the second half of 2019. The Trustees noted that the International Equity ESG Fund’s Institutional Shares had placed in the top half of the Fund’s peer group for the one-, three-, five-, and ten-year periods, and had outperformed the Fund’s benchmark index for the one-, three-, and five-year periods and underperformed for the ten-year period ended March 31, 2020. They also observed that in February 2018, the Fund had been repositioned from the Goldman Sachs Focused International Equity Fund, which involved changes to the Fund’s investment strategy. The Trustees noted that the International Equity Income Fund’s Institutional Shares had placed in the top half of the Fund’s peer group and had outperformed the Fund’s benchmark index for the one-, three-, five-, and ten-year periods ended March 31, 2020. They also observed that in February 2018 the Fund had been repositioned from the Goldman Sachs Strategic International Equity Fund, which involved changes to the Fund’s investment objective and investment strategy.
Costs of Services Provided and Competitive Information
The Trustees considered the contractual terms of the Management Agreement and the fee rates payable by each Fund thereunder. In this regard, the Trustees considered information on the services rendered by the Investment Adviser to the Funds, which included both advisory and administrative services that were directed to the needs and operations of the Funds as registered mutual funds.
In particular, the Trustees reviewed analyses prepared by the Outside Data Provider regarding the expense rankings of the Funds. The analyses provided a comparison of each Fund’s management fee and breakpoints to those of a relevant peer group and category universe; an expense analysis which compared each Fund’s overall net and gross expenses to a peer group and a category universe; and data comparing each Fund’s net expenses to the peer and category medians. The analyses also compared each Fund’s other expenses and fee waivers/reimbursements to those of the peer group and category medians. The Trustees concluded that the comparisons provided by the Outside Data Provider were useful in evaluating the reasonableness of the management fees and total expenses paid by the Funds.
In addition, the Trustees considered the Investment Adviser’s undertakings to implement fee waivers and/or expense limitations. The Trustees also noted that certain changes were being made to existing fee waiver or expense limitation arrangements of the Emerging Markets Equity Fund, Imprint Emerging Markets Opportunities Fund, and International Equity Income Fund that would have the effect of decreasing total Fund expenses, with such changes taking effect in connection with each Fund’s next annual registration statement update. They also considered, to the extent that the Investment Adviser manages other types of accounts having investment objectives and policies similar to those of the Funds, comparative fee information for services provided by the Investment Adviser to those accounts, and information that indicated that services provided to the Funds differed
122
GOLDMAN SACHS FUNDAMENTAL EQUITY INTERNATIONAL FUNDS
Statement Regarding Basis for Approval of Management Agreement (Unaudited) (continued)
in various significant respects from the services provided to other types of accounts which, in many cases, operated under less stringent legal and regulatory structures, required fewer services from the Investment Adviser to a smaller number of client contact points, and were less time-intensive.
In addition, the Trustees noted that shareholders are able to redeem their Fund shares at any time if shareholders believe that the Fund fees and expenses are too high or if they are dissatisfied with the performance of the Fund.
Profitability
The Trustees reviewed each Fund’s contribution to the Investment Adviser’s revenues and pre-tax profit margins. In this regard the Trustees noted that they had received, among other things, profitability analyses and summaries, revenue and expense schedules by Fund and by function (i.e., investment management, transfer agency and distribution and service), and information on the Investment Adviser’s expense allocation methodology. They observed that the profitability and expense figures are substantially similar to those used by the Investment Adviser for many internal purposes, including compensation decisions among various business groups, and are thus subject to a vigorous internal debate about how certain revenue and expenses should be allocated. The Trustees also noted that the internal audit group within the Goldman Sachs organization periodically audits the expense allocation methodology and that the internal audit group was satisfied with the reasonableness, consistency, and accuracy of the Investment Adviser’s expense allocation methodology. Profitability data for each Fund was provided for 2019 and 2018, and the Trustees considered this information in relation to the Investment Adviser’s overall profitability.
Economies of Scale
The Trustees considered the information that had been provided regarding whether there have been economies of scale with respect to the management of the Funds. The Trustees also considered the breakpoints in the fee rate payable under the Management Agreement for each of the Funds at the following annual percentage rates of the average daily net assets of the Funds:
| China Equity Fund | Emerging Markets Equity Fund | ESG Emerging Markets Equity Fund | Imprint Emerging Markets Opportunities Fund | International Equity ESG Fund | International Equity Income Fund | |||||||||||||||||||
| First $1 billion | 1.00 | % | 1.02 | % | 0.98 | % | 1.05 | % | 0.85 | % | 0.80 | % | ||||||||||||
| Next $1 billion | 0.90 | 1.02 | 0.98 | 1.05 | 0.77 | 0.72 | ||||||||||||||||||
| Next $3 billion | 0.86 | 0.92 | 0.88 | 0.95 | 0.73 | 0.68 | ||||||||||||||||||
| Next $3 billion | 0.84 | 0.87 | 0.84 | 0.90 | 0.71 | 0.67 | ||||||||||||||||||
| Over $8 billion | 0.82 | 0.85 | 0.82 | 0.88 | 0.70 | 0.66 | ||||||||||||||||||
The Trustees noted that the breakpoints were designed to share potential economies of scale, if any, with the Funds and their shareholders as assets under management reach those asset levels. The Trustees considered the amounts of assets in the Funds; the Funds’ recent share purchase and redemption activity; the information provided by the Investment Adviser relating to the costs of the services provided by the Investment Adviser and its affiliates and their realized profits; information comparing fee rates charged by the Investment Adviser with fee rates charged to other funds in the peer groups; and the Investment Adviser’s undertakings to limit certain expenses of the Funds that exceed specified levels, as well as Goldman Sachs & Co. LLC’s (“Goldman Sachs”) undertaking to waive a portion of the transfer agency fees paid by the China Equity and International Equity ESG Fund’s Class A, Class C, and Investor Shares. Upon reviewing these matters at the Annual Meeting, the Trustees concluded that the fee breakpoints represented a means of assuring that benefits of scalability, if any, would be passed along to shareholders at the specified asset levels.
Other Benefits to the Investment Adviser and Its Affiliates
The Trustees also considered the other benefits derived by the Investment Adviser and its affiliates from their relationships with the Funds as stated above, including: (a) transfer agency fees received by Goldman Sachs; (b) brokerage and futures commissions earned by Goldman Sachs for executing securities and futures transactions on behalf of the Funds; (c) research received by the Investment Adviser from broker-dealers in exchange for executing certain transactions on behalf of the Funds; (d) trading efficiencies resulting from aggregation of orders of the Funds with those for other funds or accounts managed by the Investment Adviser; (e) fees earned by Goldman Sachs Agency Lending (“GSAL”), an affiliate of the Investment Adviser, as securities lending agent (and fees earned by the Investment Adviser for managing the fund in which the Funds’ cash collateral is invested); (f) the Investment Adviser’s ability to leverage the infrastructure designed to service the Funds on behalf of its other clients; (g) the Investment Adviser’s ability to cross-market other products and services to Fund shareholders; (h) Goldman Sachs’
123
GOLDMAN SACHS FUNDAMENTAL EQUITY INTERNATIONAL FUNDS
Statement Regarding Basis for Approval of Management Agreement (Unaudited) (continued)
retention of certain fees as Fund Distributor; (i) the Investment Adviser’s ability to negotiate better pricing with custodians on behalf of its other clients, as a result of the relationship with the Funds; (j) the investment of cash and cash collateral in money market funds managed by the Investment Adviser that will result in increased assets under management for those money market funds; (k) the investment in exchange-traded funds (“ETFs”) managed by the Investment Adviser that will result in increased assets under management for those ETFs and may facilitate the development of the Investment Adviser’s ETF advisory business; and (l) the possibility that the working relationship between the Investment Adviser and the Funds’ third-party service providers may cause those service providers to be more likely to do business with other areas of Goldman Sachs. In the course of considering the foregoing, the Independent Trustees requested and received further information quantifying certain of these fall-out benefits.
Other Benefits to the Funds and Their Shareholders
The Trustees also noted that the Funds receive certain other potential benefits as a result of their relationship with the Investment Adviser, including: (a) trading efficiencies resulting from aggregation of orders of the Funds with those of other funds or accounts managed by the Investment Adviser; (b) enhanced servicing from vendors due to the volume of business generated by the Investment Adviser and its affiliates; (c) enhanced servicing from broker-dealers due to the volume of business generated by the Investment Adviser and its affiliates; (d) the Investment Adviser’s ability to negotiate favorable terms with derivatives counterparties on behalf of the Funds as a result of the size and reputation of the Goldman Sachs organization; (e) the advantages received from the Investment Adviser’s knowledge and experience gained from managing other accounts and products; (f) the Investment Adviser’s ability to hire and retain qualified personnel to provide services to the Funds because of the reputation of the Goldman Sachs organization; (g) the Funds’ access, through the Investment Adviser, to certain firm-wide resources (e.g., proprietary risk management systems and databases), subject to certain restrictions; (h) the Funds’ ability to participate in the securities lending program administered by GSAL, as measured by the revenue received by the Funds in connection with the program; and (i) the Funds’ access to certain affiliated distribution channels. In addition, the Trustees noted the competitive nature of the mutual fund marketplace, and considered that many of the Funds’ shareholders invested in the Funds in part because of the Funds’ relationship with the Investment Adviser and that those shareholders have a general expectation that the relationship will continue.
Conclusion
In connection with their consideration of the Management Agreement, the Trustees gave weight to each of the factors described above, but did not identify any particular factor as controlling their decision. After deliberation and consideration of all of the information provided, including the factors described above, the Trustees concluded, in the exercise of their business judgment, that the management fees paid by each of the Funds were reasonable in light of the services provided to it by the Investment Adviser, the Investment Adviser’s costs and each Fund’s current and reasonably foreseeable asset levels. The Trustees unanimously concluded that the Investment Adviser’s continued management likely would benefit each Fund and its shareholders and that the Management Agreement should be approved and continued with respect to each Fund until June 30, 2021.
124
GOLDMAN SACHS FUNDAMENTAL EQUITY INTERNATIONAL FUNDS
Trustees and Officers (Unaudited)
Independent Trustees
| Name, Address and Age1 | Position(s) Held with the Trust | Term of Office and | Principal Occupation(s) During Past 5 Years | Number of Portfolios in Fund Complex Overseen by Trustee3 | Other Directorships Held by Trustee4 | |||||
Jessica Palmer Age: 71 | Chair of the Board of Trustees | Since 2018 (Trustee since 2007) | Ms. Palmer is retired. She was formerly Consultant, Citigroup Human Resources Department (2007-2008); Managing Director, Citigroup Corporate and Investment Banking (previously, Salomon Smith Barney/Salomon Brothers) (1984-2006). Ms. Palmer was a Member of the Board of Trustees of Indian Mountain School (private elementary and secondary school) (2004-2009).
Chair of the Board of Trustees — Goldman Sachs Trust and Goldman Sachs Variable Insurance Trust. | 105 | None | |||||
Dwight L. Bush Age: 63 | Trustee | Since 2020 | Ambassador Bush is President and CEO of D.L. Bush & Associates (a financial advisory and private investment firm) (2002-2014 and 2017-present); and was formerly U.S. Ambassador to the Kingdom of Morocco (2014-2017) and a Member of the Board of Directors of Santander Bank, N.A. (2018-2019). Previously, Ambassador Bush served as an Advisory Board Member of Goldman Sachs Trust and Goldman Sachs Variable Insurance Trust (October 2019-January 2020).
Trustee — Goldman Sachs Trust and Goldman Sachs Variable Insurance Trust. | 105 | None | |||||
Kathryn A. Cassidy Age: 66 | Trustee | Since 2015 | Ms. Cassidy is retired. Formerly, she was Advisor to the Chairman (May 2014-December 2014); and Senior Vice President and Treasurer (2008-2014), General Electric Company & General Electric Capital Corporation (technology and financial services companies).
Trustee — Goldman Sachs Trust and Goldman Sachs Variable Insurance Trust. | 105 | None | |||||
Diana M. Daniels Age: 71 | Trustee | Since 2007 | Ms. Daniels is retired. Formerly, she was Vice President, General Counsel and Secretary, The Washington Post Company (1991-2006). Ms. Daniels is a Trustee Emeritus and serves as a Presidential Councillor of Cornell University (2013-Present); former Member of the Legal Advisory Board, New York Stock Exchange (2003-2006) and of the Corporate Advisory Board, Standish Mellon Management Advisors (2006-2007).
Trustee — Goldman Sachs Trust and Goldman Sachs Variable Insurance Trust. | 105 | None | |||||
Joaquin Delgado Age: 60 | Trustee | Since 2020 | Dr. Delgado is retired. He is Director, Hexion Inc. (a specialty chemical manufacturer) (2019-present); and Director, Stepan Company (a specialty chemical manufacturer) (2011-present); and was formerly Executive Vice President, Consumer Business Group of 3M Company (July 2016-July 2019); and Executive Vice President, Health Care Business Group of 3M Company (October 2012-July 2016). Previously, Dr. Delgado served as an Advisory Board Member of Goldman Sachs Trust and Goldman Sachs Variable Insurance Trust (October 2019-January 2020).
Trustee — Goldman Sachs Trust and Goldman Sachs Variable Insurance Trust. | 105 | Stepan Company (a specialty chemical manufacturer) | |||||
125
GOLDMAN SACHS FUNDAMENTAL EQUITY INTERNATIONAL FUNDS
Trustees and Officers (Unaudited) (continued)
Independent Trustees
| Name, Address and Age1 | Position(s) Held with the Trust | Term of Office and | Principal Occupation(s) During Past 5 Years | Number of Portfolios in Fund Complex Overseen by Trustee3 | Other Directorships Held by Trustee4 | |||||
Roy W. Templin Age: 60 | Trustee | Since 2013 | Mr. Templin is retired. He is Director, Armstrong World Industries, Inc. (a designer and manufacturer of ceiling, wall and suspension system solutions) (2016-Present); and was formerly Chairman of the Board of Directors, Con-Way Incorporated (a transportation, logistics and supply chain management service company) (2014-2015); Executive Vice President and Chief Financial Officer, Whirlpool Corporation (an appliance manufacturer and marketer) (2004-2012).
Trustee — Goldman Sachs Trust and Goldman Sachs Variable Insurance Trust. | 105 | Armstrong World Industries, Inc. (a ceiling, wall and suspension systems solutions manufacturer) | |||||
Gregory G. Weaver Age: 69 | Trustee | Since 2015 | Mr. Weaver is retired. He is Director, Verizon Communications Inc. (2015-Present); and was formerly Chairman and Chief Executive Officer, Deloitte & Touche LLP (a professional services firm) (2001-2005 and 2012-2014); and Member of the Board of Directors, Deloitte & Touche LLP (2006-2012).
Trustee — Goldman Sachs Trust and Goldman Sachs Variable Insurance Trust. | 105 | Verizon Communications Inc. | |||||
126
GOLDMAN SACHS FUNDAMENTAL EQUITY INTERNATIONAL FUNDS
Trustees and Officers (Unaudited) (continued)
Interested Trustee*
| Name, Address and Age1 | Position(s) Held with the Trust | Term of Office and | Principal Occupation(s) During Past 5 Years | Number of Portfolios in Fund Complex Overseen by Trustee3 | Other Directorships Held by Trustee4 | |||||
James A. McNamara Age: 58 | Trustee and President | Since 2007 | Advisory Director, Goldman Sachs (January 2018-Present); Managing Director, Goldman Sachs (January 2000-December 2017); Director of Institutional Fund Sales, GSAM (April 1998-December 2000); and Senior Vice President and Manager, Dreyfus Institutional Service Corporation (January 1993-April 1998).
President and Trustee — Goldman Sachs Trust; Goldman Sachs Variable Insurance Trust; Goldman Sachs Trust II; Goldman Sachs MLP and Energy Renaissance Fund; Goldman Sachs ETF Trust; Goldman Sachs Credit Income Fund; and Goldman Sachs Real Estate Diversified Income Fund. | 170 | None | |||||
| * | Mr. McNamara is considered to be an “Interested Trustee” because he holds positions with Goldman Sachs and owns securities issued by The Goldman Sachs Group, Inc. Mr. McNamara holds comparable positions with certain other companies of which Goldman Sachs, GSAM or an affiliate thereof is the investment adviser, administrator and/or distributor. |
| 1 | Each Trustee may be contacted by writing to the Trustee, c/o Goldman Sachs, 200 West Street, New York, New York, 10282, Attn: Caroline Kraus. Information is provided as of October 31, 2020. |
| 2 | Subject to such policies as may be adopted by the Board from time-to-time, each Trustee holds office for an indefinite term, until the earliest of: (a) the election of his or her successor; (b) the date the Trustee resigns or is removed by the Board or shareholders, in accordance with the Trust’s Declaration of Trust; or (c) the termination of the Trust. The Board has adopted policies which provide that each Independent Trustee shall retire as of December 31st of the calendar year in which he or she reaches (a) his or her 75th birthday or (b) the 15th anniversary of the date he or she became a Trustee, whichever is earlier, unless a waiver of such requirements shall have been adopted by a majority of the other Trustees. These policies may be changed by the Trustees without shareholder vote. |
| 3 | The Goldman Sachs Fund Complex includes certain other companies listed above for each respective Trustee. As of October 31, 2020, Goldman Sachs Trust consisted of 92 portfolios (90 of which offered shares to the public); Goldman Sachs Variable Insurance Trust consisted of 13 portfolios; Goldman Sachs Trust II consisted of 19 portfolios (17 of which offered shares to the public); Goldman Sachs ETF Trust consisted of 42 portfolios (24 of which offered shares to the public); and Goldman Sachs MLP and Energy Renaissance Fund, Goldman Sachs Credit Income Fund and Goldman Sachs Real Estate Diversified Income Fund each consisted of one portfolio. Goldman Sachs Credit Income Fund did not offer shares to the public. |
| 4 | This column includes only directorships of companies required to report to the Securities and Exchange Commission under the Securities Exchange Act of 1934 (i.e., “public companies”) or other investment companies registered under the Act. |
Additional information about the Trustees is available in the Funds’ Statement of Additional Information, which can be obtained from Goldman Sachs free of charge by calling this toll-free number (in the United States of America): 1-800-526-7384.
127
GOLDMAN SACHS FUNDAMENTAL EQUITY INTERNATIONAL FUNDS
Trustees and Officers (Unaudited) (continued)
Officers of the Trust*
| Name, Address and Age1 | Position(s) Held with the Trust | Term of Office and | Principal Occupation(s) During Past 5 Years | |||
James A. McNamara 200 West Street New York, NY 10282 Age: 58 | Trustee and President | Since 2007 | Advisory Director, Goldman Sachs (January 2018-Present); Managing Director, Goldman Sachs (January 2000-December 2017); Director of Institutional Fund Sales, GSAM (April 1998-December 2000); and Senior Vice President and Manager, Dreyfus Institutional Service Corporation (January 1993-April 1998).
President and Trustee — Goldman Sachs Trust; Goldman Sachs Variable Insurance Trust; Goldman Sachs Trust II; Goldman Sachs MLP and Energy Renaissance Fund; Goldman Sachs ETF Trust; Goldman Sachs Credit Income Fund; and Goldman Sachs Real Estate Diversified Income Fund. | |||
Caroline L. Kraus 200 West Street New York, NY 10282 Age: 43 | Secretary | Since 2012 | Managing Director, Goldman Sachs (January 2016-Present); Vice President, Goldman Sachs (August 2006-December 2015); Senior Counsel, Goldman Sachs (January 2020-Present); Associate General Counsel, Goldman Sachs (2012-December 2019); Assistant General Counsel, Goldman Sachs (August 2006-December 2011); and Associate, Weil, Gotshal & Manges, LLP (2002-2006).
Secretary — Goldman Sachs Trust (previously Assistant Secretary (2012)); Goldman Sachs Variable Insurance Trust (previously Assistant Secretary (2012)); Goldman Sachs Trust II; Goldman Sachs BDC, Inc.; Goldman Sachs Private Middle Market Credit LLC; Goldman Sachs Private Middle Market Credit II LLC; Goldman Sachs Middle Market Lending Corp.; Goldman Sachs MLP and Energy Renaissance Fund; Goldman Sachs ETF Trust; Goldman Sachs Credit Income Fund; and Goldman Sachs Real Estate Diversified Income Fund. | |||
Joseph F. DiMaria 30 Hudson Street Jersey City, NJ 07302 Age: 52 | Treasurer, Principal Financial Officer and Principal Accounting Officer | Since 2017 (Treasurer and Principal Financial Officer since 2019) | Managing Director, Goldman Sachs (November 2015-Present) and Vice President — Mutual Fund Administration, Columbia Management Investment Advisers, LLC (May 2010-October 2015).
Treasurer, Principal Financial Officer and Principal Accounting Officer — Goldman Sachs Trust (previously Assistant Treasurer (2016)); Goldman Sachs Variable Insurance Trust (previously Assistant Treasurer (2016)); Goldman Sachs Trust II (previously Assistant Treasurer (2017)); Goldman Sachs MLP and Energy Renaissance Fund (previously Assistant Treasurer (2017)); Goldman Sachs ETF Trust (previously Assistant Treasurer (2017)); Goldman Sachs Credit Income Fund; and Goldman Sachs Real Estate Diversified Income Fund. | |||
| * | Represents a partial list of officers of the Trust. Additional information about all the officers is available in the Funds’ Statement of Additional Information, which can be obtained from Goldman Sachs free of charge by calling this toll-free number (in the United States): 1-800-526-7384. |
| 1 | Information is provided as of October 31, 2020. |
| 2 | Officers hold office at the pleasure of the Board of Trustees or until their successors are duly elected and qualified. Each officer holds comparable positions with certain other companies of which Goldman Sachs, GSAM or an affiliate thereof is the investment adviser, administrator and/or distributor. |
128
GOLDMAN SACHS FUNDAMENTAL EQUITY INTERNATIONAL FUNDS
Goldman Sachs Trust — Fundamental Equity International Funds — Tax Information (Unaudited)
From distributions paid during the year ended October 31, 2020, the total amount of income received by the China Equity, Emerging Markets Equity, ESG Emerging Markets Equity, Imprint Emerging Markets Opportunities Funds, International Equity ESG and International Equity Income Funds from sources within foreign countries and possessions of the United States was $0.2242, $0.2019, $0.1050, $0.5050, $0.3637 and $0.3739 per share, all of which is attributable to qualified passive income. The percentage of net investment income dividends paid from foreign sources by the China Equity, Emerging Markets Equity, ESG Emerging Markets Equity, Imprint Emerging Markets Opportunities Funds, International Equity ESG and International Equity Income Funds was 78.15%, 75.17%, 93.92%, 99.74%, 86.76% and 88.06%. The total amount of taxes paid by the China Equity, Emerging Markets Equity, ESG Emerging Markets Equity, Imprint Emerging Markets Opportunities Funds, International Equity ESG and International Equity Income Funds to such countries was $0.0532, $0.0343, $0.0211, 0.0636, $0.0387 and $0.0306 per share.
For the year ended October 31, 2020, 97.12%, 74.32%, 100%, 56.15%, 100% and 100% of the dividends paid from net investment company taxable income by the China Equity, Emerging Markets Equity, ESG Emerging Markets Equity, Imprint Emerging Markets Opportunities Funds, International Equity ESG and International Equity Income Funds, respectively, qualify for the reduced tax rate under the Jobs and Growth Tax Relief and Reconciliation Act of 2003.
129
FUNDS PROFILE
Goldman Sachs Funds
Goldman Sachs is a premier financial services firm, known since 1869 for creating thoughtful and customized investment solutions in complex global markets.
Today, the Consumer and Investment Management Division of Goldman Sachs serves a diverse set of clients worldwide, including private institutions, public entities and individuals. With approximately $1.86 trillion in assets under supervision as of September 30, 2020, Goldman Sachs Asset Management (“GSAM”) has portfolio management teams located around the world and our investment professionals bring firsthand knowledge of local markets to every investment decision. Assets under supervision includes assets under management and other client assets for which Goldman Sachs does not have full discretion. GSAM leverages the resources of Goldman Sachs & Co. LLC subject to legal, internal and regulatory restrictions.
Money Market
Financial Square FundsSM
| ∎ | Financial Square Treasury Solutions Fund1 |
| ∎ | Financial Square Government Fund1 |
| ∎ | Financial Square Money Market Fund2 |
| ∎ | Financial Square Prime Obligations Fund2 |
| ∎ | Financial Square Treasury Instruments Fund1 |
| ∎ | Financial Square Treasury Obligations Fund1 |
| ∎ | Financial Square Federal Instruments Fund1 |
Investor FundsSM
| ∎ | Investor Money Market Fund3 |
| ∎ | Investor Tax-Exempt Money Market Fund3 |
Fixed Income
Short Duration and Government
| ∎ | Enhanced Income Fund |
| ∎ | High Quality Floating Rate Fund |
| ∎ | Short-Term Conservative Income Fund |
| ∎ | Short Duration Government Fund |
| ∎ | Short Duration Income Fund |
| ∎ | Government Income Fund |
| ∎ | Inflation Protected Securities Fund |
Multi-Sector
| ∎ | Bond Fund |
| ∎ | Core Fixed Income Fund |
| ∎ | Global Core Fixed Income Fund4 |
| ∎ | Strategic Income Fund |
| ∎ | Income Fund |
Municipal and Tax-Free
| ∎ | High Yield Municipal Fund |
| ∎ | Dynamic Municipal Income Fund |
| ∎ | Short Duration Tax-Free Fund |
| ∎ | Municipal Income Completion Fund |
Single Sector
| ∎ | Investment Grade Credit Fund |
| ∎ | U.S. Mortgages Fund |
| ∎ | High Yield Fund |
| ∎ | High Yield Floating Rate Fund |
| ∎ | Emerging Markets Debt Fund |
| ∎ | Local Emerging Markets Debt Fund |
Fixed Income Alternatives
| ∎ | Long Short Credit Strategies Fund |
Fundamental Equity
| ∎ | Equity Income Fund |
| ∎ | Small Cap Growth Fund |
| ∎ | Small Cap Value Fund |
| ∎ | Small/Mid Cap Value Fund |
| ∎ | Mid Cap Value Fund |
| ∎ | Large Cap Value Fund |
| ∎ | Focused Value Fund |
| ∎ | Capital Growth Fund |
| ∎ | Strategic Growth Fund |
| ∎ | Small/Mid Cap Growth Fund |
| ∎ | Flexible Cap Fund |
| ∎ | Concentrated Growth Fund |
| ∎ | Technology Opportunities Fund |
| ∎ | Growth Opportunities Fund |
| ∎ | Rising Dividend Growth Fund |
| ∎ | U.S. Equity ESG Fund5 |
| ∎ | Income Builder Fund |
| ∎ | Defensive Equity Fund |
Tax-Advantaged Equity
| ∎ | U.S. Tax-Managed Equity Fund |
| ∎ | International Tax-Managed Equity Fund |
| ∎ | U.S. Equity Dividend and Premium Fund |
| ∎ | International Equity Dividend and Premium Fund |
Equity Insights
| ∎ | Small Cap Equity Insights Fund |
| ∎ | U.S. Equity Insights Fund |
| ∎ | Small Cap Growth Insights Fund |
| ∎ | Large Cap Growth Insights Fund |
| ∎ | Large Cap Value Insights Fund |
| ∎ | Small Cap Value Insights Fund |
| ∎ | International Small Cap Insights Fund |
| ∎ | International Equity Insights Fund |
| ∎ | Emerging Markets Equity Insights Fund |
Fundamental Equity International
| ∎ | International Equity Income Fund |
| ∎ | International Equity ESG Fund |
| ∎ | China Equity Fund6 |
| ∎ | Emerging Markets Equity Fund |
| ∎ | Imprint Emerging Markets Opportunities Fund |
| ∎ | ESG Emerging Markets Equity Fund |
Alternative
| ∎ | Clean Energy Income Fund |
| ∎ | Real Estate Securities Fund |
| ∎ | International Real Estate Securities Fund |
| ∎ | Commodity Strategy Fund |
| ∎ | Global Real Estate Securities Fund |
| ∎ | Alternative Premia Fund |
| ∎ | Absolute Return Tracker Fund |
| ∎ | Managed Futures Strategy Fund |
| ∎ | MLP Energy Infrastructure Fund |
| ∎ | Energy Infrastructure Fund7 |
| ∎ | Multi-Manager Alternatives Fund |
| ∎ | Global Infrastructure Fund |
Total Portfolio Solutions
| ∎ | Global Managed Beta Fund |
| ∎ | Multi-Manager Non-Core Fixed Income Fund |
| ∎ | Multi-Manager U.S. Dynamic Equity Fund |
| ∎ | Multi-Manager Global Equity Fund |
| ∎ | Multi-Manager International Equity Fund |
| ∎ | Tactical Tilt Overlay Fund |
| ∎ | Balanced Strategy Portfolio |
| ∎ | Multi-Manager U.S. Small Cap Equity Fund |
| ∎ | Multi-Manager Real Assets Strategy Fund |
| ∎ | Growth and Income Strategy Portfolio |
| ∎ | Growth Strategy Portfolio |
| ∎ | Dynamic Global Equity Fund |
| ∎ | Satellite Strategies Portfolio |
| ∎ | Enhanced Dividend Global Equity Portfolio |
| ∎ | Tax-Advantaged Global Equity Portfolio |
| ∎ | Strategic Factor Allocation Fund |
| ∎ | Target Date Retirement Portfolio8 |
| ∎ | Target Date 2025 Portfolio |
| ∎ | Target Date 2030 Portfolio |
| ∎ | Target Date 2035 Portfolio |
| ∎ | Target Date 2040 Portfolio |
| ∎ | Target Date 2045 Portfolio |
| ∎ | Target Date 2050 Portfolio |
| ∎ | Target Date 2055 Portfolio |
| ∎ | Target Date 2060 Portfolio |
| ∎ | GQG Partners International Opportunities Fund |
| 1 | You could lose money by investing in the Fund. Although the Fund seeks to preserve the value of your investment at $1.00 per share, it cannot guarantee it will do so. An investment in the Fund is not a deposit of a bank and is not insured or guaranteed by the Federal Deposit Insurance Corporation or any other government agency. The Fund’s sponsor has no legal obligation to provide financial support to the Fund, and you should not expect that the sponsor will provide financial support to the Fund at any time. |
| 2 | You could lose money by investing in the Fund. Because the share price of the Fund will fluctuate, when you sell your shares they may be worth more or less than what you originally paid for them. The Fund may impose a fee upon sale of your shares or may temporarily suspend your ability to sell shares if the Fund’s liquidity falls below required minimums because of market conditions or other factors. An investment in the Fund is not a deposit of a bank and is not insured or guaranteed by the Federal Deposit Insurance Corporation or any other government agency. The Fund’s sponsor has no legal obligation to provide financial support to the Fund, and you should not expect that the sponsor will provide financial support to the Fund at any time. |
| 3 | You could lose money by investing in the Fund. Although the Fund seeks to preserve the value of your investment at $1.00 per share, it cannot guarantee it will do so. The Fund may impose a fee upon sale of your shares or may temporarily suspend your ability to sell shares if the Fund’s liquidity falls below required minimums because of market conditions or other factors. An investment in the Fund is not a deposit of a bank and is not insured or guaranteed by the Federal Deposit Insurance Corporation or any other government agency. The Fund’s sponsor has no legal obligation to provide financial support to the Fund, and you should not expect that the sponsor will provide financial support to the Fund at any time. |
| 4 | Effective after the close of business on April 30, 2020, the Goldman Sachs Global Income Fund was renamed the Goldman Sachs Global Core Fixed Income Fund. |
| 5Effective | after the close of business on August 30, 2020, the Goldman Sachs Blue Chip Fund was renamed the Goldman Sachs U.S. Equity ESG Fund. |
| 6 | Effective after the close of business on November 20, 2019, the Goldman Sachs Asia Equity Fund was renamed the Goldman Sachs China Equity Fund. |
| 7 | Effective after the close of business on June 26, 2020, the Goldman Sachs MLP & Energy Fund was renamed the Goldman Sachs Energy Infrastructure Fund. |
| 8 | Effective December 27, 2019, the Goldman Sachs Target Date 2020 Portfolio was renamed the Goldman Sachs Target Date Retirement Portfolio. |
| Financial Square FundsSM and Investor FundsSM are registered service marks of Goldman Sachs & Co. LLC. |
| * | This list covers open-end funds only. Please visit our website at www.GSAMFUNDS.com to learn about our closed-end funds and exchange-traded funds. |
TRUSTEES Jessica Palmer, Chair Dwight L. Bush Kathryn A. Cassidy Diana M. Daniels Joaquin Delgado James A. McNamara Roy W. Templin Gregory G. Weaver | OFFICERS James A. McNamara, President Joseph F. DiMaria, Principal Financial Officer, Principal Accounting Officer and Treasurer Caroline L. Kraus, Secretary | |
GOLDMAN SACHS & CO. LLC Distributor and Transfer Agent | GOLDMAN SACHS ASSET MANAGEMENT, L.P. Investment Adviser | |
Visit our website at www.GSAMFUNDS.com to obtain the most recent month-end returns.
Goldman Sachs Asset Management, L.P., 200 West Street, New York, New York 10282
The reports concerning the Funds included in this shareholder report may contain certain forward-looking statements about the factors that may affect the performance of the Funds in the future. These statements are based on Fund management’s predictions and expectations concerning certain future events and their expected impact on the Funds, such as performance of the economy as a whole and of specific industry sectors, changes in the levels of interest rates, the impact of developing world events, and other factors that may influence the future performance of the Funds. Management believes these forward-looking statements to be reasonable, although they are inherently uncertain and difficult to predict. Actual events may cause adjustments in portfolio management strategies from those currently expected to be employed.
A description of the policies and procedures that the Funds use to determine how to vote proxies relating to portfolio securities and information regarding how a Fund voted proxies relating to portfolio securities during the most recent 12-month period ended June 30 is available (i) without charge, upon request by calling 1-800-526-7384 (for Retail Shareholders) or 1-800-621-2550 (for Institutional Shareholders); and (ii) on the Securities and Exchange Commission (“SEC”) web site at http://www.sec.gov.
The Funds will file portfolio holdings information for each month in a fiscal quarter within 60 days after the end of the relevant fiscal quarter on Form N-PORT. Portfolio holdings information for the third month of each fiscal quarter will be made available on the SEC’s web site at http://www.sec.gov. Portfolio holdings information may be obtained upon request and without charge by calling 1-800-526-7384 (for Retail Shareholders) or 1-800-621-2550 (for Institutional Shareholders).
Fund holdings and allocations shown are as of October 31, 2019 and may not be representative of future investments. Fund holdings should not be relied on in making investment decisions and should not be construed as research or investment advice regarding particular securities. Current and future holdings are subject to risk.
The Global Industry Classification Standard (GICS) was developed by and is the exclusive property and a service mark of Morgan Stanley Capital International Inc. (MSCI) and Standard & Poor’s, a division of The McGraw-Hill Companies, Inc. (S&P) and is licensed for use by Goldman Sachs. Neither MSCI, S&P nor any other party involved in making or compiling the GICS or any GICS classifications makes any express or implied warranties or representations with respect to such standard or classification (or the results to be obtained by the use thereof), and all such parties hereby expressly disclaim all warranties of originality, accuracy, completeness, merchantability or fitness for a particular purpose with respect to any of such standard or classification. Without limiting any of the foregoing, in no event shall MSCI, S&P, any of their affiliates or any third party involved in making or compiling the GICS or any GICS classifications have any liability for any direct, indirect, special, punitive, consequential or any other damages (including lost profits) even if notified of the possibility of such damages.
The portfolio risk management process includes an effort to monitor and manage risk, but does not imply low risk.
This material is not authorized for distribution to prospective investors unless preceded or accompanied by a current Prospectus or summary prospectus, if applicable. Investors should consider a Fund’s objective, risks, and charges and expenses, and read the summary prospectus, if available, and/or the Prospectus carefully before investing or sending money. The summary prospectus, if available, and the Prospectus contain this and other information about a Fund and may be obtained from your authorized dealer or from Goldman Sachs & Co. LLC by calling (retail – 1-800-526-7384) (institutional – 1-800-621-2550).
© 2020 Goldman Sachs. All rights reserved. 224113-OTU-1321754 EQINTEMEAR-20
Goldman Sachs Funds

| Annual Report | October 31, 2020 | |||
International Equity Insights Funds | ||||
Emerging Markets Equity Insights | ||||
International Equity Insights | ||||
International Small Cap Insights | ||||
It is our intention that beginning on January 1, 2021, paper copies of the Funds’ annual and semi-annual shareholder reports will no longer be sent by mail, unless you specifically request paper copies of the reports from a Fund or from your financial intermediary. Instead, the reports will be made available on a website, and you will be notified by mail each time a report is posted and provided with a website link to access the report.
If you already elected to receive shareholder reports electronically, you will not be affected by this change and you need not take any action. At any time, you may elect to receive reports and certain communications from a Fund electronically by calling the applicable toll-free number below or by contacting your financial intermediary.
You may elect to receive all future shareholder reports in paper free of charge. If you hold shares of a Fund directly with the Fund’s transfer agent, you can inform the transfer agent that you wish to receive paper copies of reports by calling toll-free 800-621-2550 for Institutional, Service, Class R6 and Class P shareholders or 800-526-7384 for all other shareholders. If you hold shares of a Fund through a financial intermediary, please contact your financial intermediary to make this election. Your election to receive reports in paper will apply to all Goldman Sachs Funds held in your account if you invest through your financial intermediary or all Goldman Sachs Funds held with the Funds’ transfer agent if you invest directly with the transfer agent.

Goldman Sachs International Equity
Insights Funds
| ∎ | EMERGING MARKETS EQUITY INSIGHTS |
| ∎ | INTERNATIONAL EQUITY INSIGHTS |
| ∎ | INTERNATIONAL SMALL CAP INSIGHTS |
| 1 | ||||
| 2 | ||||
| 6 | ||||
| 21 | ||||
| 42 | ||||
| 46 | ||||
| 46 | ||||
| 53 | ||||
| 61 | ||||
| 67 | ||||
| 83 | ||||
| 85 | ||||
| NOT FDIC-INSURED | May Lose Value | No Bank Guarantee | ||
GOLDMAN SACHS INTERNATIONAL EQUITY INSIGHTS FUNDS
Enhancements Made to Proprietary Quantitative Model during the 12-Month Period Ended October 31, 2020
We continuously look for ways to improve our investment process. Accordingly, we introduced a number of enhancements to our proprietary quantitative model during the 12-month period ended October 31, 2020 (the “Reporting Period”).
During the last months of 2019, in most investment regions, we introduced a new metric within our High-Quality Business Models investment theme that identifies companies with longer executive management tenure, as we believe this is indicative of sustainable, high-quality business models. Within our Sentiment Analysis investment theme, we added a signal in the Japan investment region that uses natural language processing and machine learning techniques to help capture sell-side research analyst sentiment in Japanese language reports. We also added a contrarian signal in the European, U.K. and emerging markets investment regions that uses market microstructure data to help predict short-term stock reversals. Within our country selection models, we introduced a signal within our Momentum investment theme where we use linkages derived from news articles to identify common trends. We also introduced a signal within the Macro investment theme where we use current account forecasts and short-term external debt to assess external vulnerability in the emerging markets.
During the first half of 2020, in all investment regions, we introduced a signal within our Fundamental Mispricings investment theme that seeks to test investors’ under-reaction to a company’s short-term deviation in its fundamentals by simultaneously looking at a set of key profitability metrics that could point to a company’s long-term growth prospects. Within our country selection models, we introduced a signal within our Momentum investment theme that seeks to identify which countries have strong business relationships and may grow together. The signal uses linkages inferred from company-level supply chain data. Within developed markets regions, we introduced an additional new signal within our Momentum investment theme that parses through news articles about central bank activity or statements, seeking information that may impact the attractiveness of markets.
1
MARKET REVIEW
Goldman Sachs International Equity
Insights Funds
During the 12-month period ended October 31, 2020 (the “Reporting Period”), emerging markets equities and international equities were most influenced by the spread of COVID-19, contraction in global economic growth and historic financial stimulus by central banks and governments around the world. Emerging markets equities generated positive absolute returns, while international equities recorded negative absolute returns.
Emerging Markets Equities
Emerging markets equities rallied during the Reporting Period, with the MSCI Emerging Markets Index (Net, USD, Unhedged) (the “MSCI EM Index”) posting a positive absolute return of 8.23%.1
As the Reporting Period began in the last two months of 2019, emerging markets equities advanced, supported by accommodative global monetary policy and improved trade developments. In Asia, Chinese equities surged amid renewed trade optimism. The U.S. had agreed to halt new tariffs in exchange for larger Chinese purchases of U.S. goods — most notably, agricultural products — and the U.S. President announced in December that the U.S. and China had agreed in principle to a “Phase One” trade deal. Although the details of the agreement were unclear, emerging markets equities strengthened on the news. South Korean stocks rose, as companies broadly benefited from interest rate cuts. Taiwanese stocks gained on strength in semiconductors. Despite faltering economic growth and lingering unrest surrounding a controversial citizenship law, India’s equity market rallied amid cuts in interest rates and lower corporate taxes. In Latin America, Argentina was the top performer, bolstered by the greater transparency offered by its new government’s plan to renegotiate public debt and alleviate pressing social issues. Brazilian equities advanced on signs of declining inflation and accommodative monetary policy. Elsewhere, Hungarian and Russian equities performed especially well. Hungary benefited from robust growth in domestic demand, double-digit wage growth and declining unemployment, while Russia advanced amid improving inflation expectations and rising crude oil prices.
In a sharp reversal, emerging markets equities fell dramatically during the first quarter of 2020, with the MSCI EM Index returning -23.60%. Emerging markets equities declined as global equity markets were overtaken by the fear of a global recession as a consequence of the COVID-19 outbreak. The extent of the spread of what had clearly become a pandemic caused global equity markets to reprice to reflect lower investor expectations for global economic growth and corporate earnings. Countries around the world implemented lockdowns to try and flatten the curve of new infections, with largely all but essential businesses being forced to close. Aside from COVID-19, equities also faced adverse effects from the start of an oil price dispute between Russia and Saudi Arabia. On March 8, 2020, a week after the Organization of the Petroleum Exporting Countries failed to strike a deal with its allies about production cuts, Saudi Arabia announced it would ramp up its production, which caused global oil prices to drop approximately 25% in a single day. China was the best performing country within emerging markets equities during March, with the MSCI China Index dropping only 6.59%, as it continued to benefit from the first-in/first-out effect with regard to the COVID-19 outbreak. Economic activity in China was able to normalize somewhat throughout the month, as the number of daily new local cases fell to nearly zero. Elsewhere, Indian equities dropped sharply in March, as that country’s economy, which had been showing strong signs of recovery in the two prior months, was set back by growing concerns about domestic COVID-19 cases.
During the second quarter of 2020, the MSCI EM Index rose 18.08%. Emerging markets equities rebounded significantly as markets saw improved economic conditions even as the COVID-19 pandemic persisted. Many governments bolstered their respective economic recoveries through large stimulus packages. Several emerging markets countries made progress in reopening their economies, as the strict lockdowns implemented earlier had helped in slowing the number of new cases. China continued to be at the forefront of the recovery, with the MSCI China Index returning 8.98% in June 2020 alone and 22.72% for the second calendar quarter, as the country’s economic activity largely returned to normal levels. In fact, industrial activity in China rebounded meaningfully, though its consumer sentiment remained volatile due to the threat of a second wave of infections. In May 2020, the National People’s Congress, which is the highest organ of state power and the national legislature of China, called for a targeted stimulus package, with potential for further adjustments. In India, normalization seemed somewhat further out, as the country had yet to hit its peak in new cases. However, the country started to lift its strict lockdown measures in June in an attempt
| 1 | All Index returns are expressed in U.S. dollar terms. |
2
MARKET REVIEW
to get its economy back on track. In contrast to the healthy rebound in emerging countries, many developed markets countries were having to reverse the reopening of their economies in the wake of a second wave of COVID-19 cases.
The MSCI EM Index declined modestly during September 2020 but rose 9.56% for the third calendar quarter overall, as investor optimism grew around the potential discovery and distribution of a viable vaccine against COVID-19. In September, emerging markets equities retreated following an uptick in global COVID-19 cases and increased uncertainty around the then-upcoming U.S. elections. Still, emerging Asia continued to be a bright spot, with the equity markets of South Korea and Taiwan being the top performers for the quarter overall. South Korea had handled the outbreak of the pandemic comparatively well, partially due to extensive testing efforts. The country subsequently benefited from a strong economic recovery. Taiwan, somewhat insulated from the full impact of the pandemic due to its geographical location, strengthened ties with the U.S. via a new bilateral economic dialogue that has a focus on technology. India’s equity market was also a strong performer during the third quarter of 2020, as it saw lower levels of unemployment and positive economic implications from its government’s sizeable stimulus package. While COVID-19 cases rose significantly in India, its government was moving ahead with some long-awaited reforms and initiatives in an effort to further propel its economic recovery. With elevated volatility linked to the then-upcoming U.S. elections, China’s equity market fell in September but remained a top performing country during the third calendar quarter overall, with a 12.50% return for the MSCI China Index. Brazil’s equity market also declined in September, as it continued to struggle to contain the spread of the coronavirus.
The MSCI EM Index rose 2.06% in October 2020, benefiting from continuing investor optimism about a potential COVID-19 vaccine, despite rising global COVID-19 cases and ongoing uncertainty around the then-upcoming November U.S. elections. Chinese equities appreciated, with the MSCI China Index returning 5.29% in October. That month, the Communist Party of China met to discuss its 14th Five-Year Plan, including key policies designed to support domestic consumption, innovation, sustainability and the continued opening of Chinese financial markets. China’s corporate earnings growth was expected, according to the Five-Year Plan, to be in the high teens for 2021, with valuations attractive relative to developed markets and China’s own history, and were to be supported by the ongoing opening and growth of the Chinese economy. Elsewhere in Asia, the equity markets of Taiwan and South Korea were also top performers, as each continued to benefit from relative insulation from U.S.-China trade tensions and the COVID-19 pandemic. India’s equity market performed strongly, as its government continued to prioritize the country’s economic recovery. Though the number of COVID-19 cases in India continued to rise, the recovery rate there was comparatively good. The equity markets of eastern European countries, including Poland and Russia, struggled in October, as COVID-19 cases rose and geopolitical conflict came to a head in the region. In Latin America, Brazil’s equity market was rather weak, as the nation dealt with a large wildfire, the end of emergency government payments and an increase in COVID-19 cases.
For the Reporting Period as a whole, consumer discretionary, information technology, communication services and health care were the strongest performing sectors in the MSCI EM Index. Energy, utilities, financials and real estate were the worst performing sectors in the MSCI EM Index during the Reporting Period.
From a country perspective, China was the best performing individual constituent of the MSCI EM Index for the Reporting Period, followed by Taiwan, South Korea and Argentina, each of which posted a robust double-digit gain — and the only constituents of the MSCI EM Index to post positive absolute returns for the Reporting Period overall. Greece was the weakest individual country constituent of the MSCI EM Index, followed by Colombia, Brazil, Poland and Turkey, each of which posted a double-digit decline during the Reporting Period.
International Equities
International equities retreated during the Reporting Period, with the MSCI Europe, Australasia, Far East (EAFE) Standard Index (Net, USD, Unhedged) (the “MSCI EAFE Index”) returning -6.85%.1
As the Reporting Period began in November 2019, international equities were rallying, mainly driven by the accommodative stance of various central banks. Also supporting international equities toward the end of 2019 was anticipation of a resolution to the U.S.-China trade war, as each of the two countries reached an agreement in principle on a “Phase One” trade deal in
| 1 | All Index returns are expressed in U.S. dollar terms. |
3
MARKET REVIEW
mid-December 2019. Additionally, Brexit negotiations took a turn for the better when the Conservative party won a comfortable majority in the mid-December U.K. Parliamentary elections, clearing the way for the U.K. Prime Minister’s Brexit deal to be ratified before a January 31, 2020 deadline. (Brexit indicates the U.K.’s path out of the European Union.) Japanese equities were supported by a recovering economy, stronger capital spending and an increase in domestic demand. In a bid to ensure fair and reciprocal trade, the U.S. and Japan had signed a limited trade deal on agriculture and digital trade in October 2019, just before the start of the Reporting Period.
While international equities continued to rally in January 2020, the MSCI EAFE Index ended the first quarter of 2020 with a return of -22.83%. From mid-February through March 2020, investors saw COVID-19 wreak havoc across countries, communities and industries alike, which had the potential to bring about a global recession. By the end of the first quarter, the pandemic was on its way to becoming the worst health care crisis the world had seen since the 1918 flu pandemic, as it disrupted global supply chains, international trade and private consumption patterns across the world. While different countries took varied degrees of measures in an effort to combat the pandemic, containment through social distancing and lockdowns was the broader theme. Seen from an economic standpoint, the remedy was widely viewed to be as bad as the disease. With more than 100 countries closing borders in March 2020, the movement of people, tourism flows and virtually all economic activities came to a screeching halt. Amid these conditions, March was a historic month for all asset classes and for equities in particular, with all leading markets across the world experiencing one of their largest single-month declines since October 2008. Many equity markets — in economies large and small — went into a tailspin, enduring declines of 30% or more at the trough. Exacerbating matters was the failure of OPEC+ to agree to oil production cuts, which resulted in Saudi Arabia ramping up supply, and thereby applying downward pressure on oil prices. (OPEC is the Organization of the Petroleum Exporting Countries. OPEC+ is composed of OPEC countries and non-OPEC oil producing countries, most notably Russia.) Volatility spiked, in some cases to levels last seen during the global financial crisis of 2008-2009, with market liquidity deteriorating significantly. Dispersion among industry returns skyrocketed in March 2020.
In a sharp reversal, international equities rebounded strongly in the second quarter of 2020, with the MSCI EAFE Index up 14.88% for the quarter. Equity markets around the world gained on investor optimism around a global economic recovery, as lockdown measures began to ease, even as many markets faced some headwinds from weak macroeconomic data, fear of a second wave of COVID-19 and a bleak U.S. economic outlook from the U.S. Fed. Investors largely looked past first quarter 2020 earnings, as company outlooks for then-upcoming quarters amid COVID-19 took precedent. The European equity market was supported by a larger than consensus expected stimulus boost from the European Central Bank’s (“ECB”) Pandemic Emergency Purchase Programme (“PEPP”) and the European Union’s proposed €750 billion COVID-19 recovery plan. In June 2020, the ECB increased its PEPP to €1.35 trillion and extended purchases through June 2021. The ECB also announced it would begin offering euro liquidity to non-euro area central banks in response to the COVID-19 crisis. In Europe, June’s composite Purchasing Managers’ Index rebounded 15.5 points to 47.5, consistent with the easing of lockdown measures and improvements in high frequency activity data. Japanese equity markets rallied in April and May, recovering from the downturn that had started in February 2020. The recovery was driven by a rebound in valuations, particularly in cyclical sectors that bore most of the brunt during the first calendar quarter sell-off.
International equity markets continued to rally in July and August 2020 before declining in September. For the third calendar quarter, the MSCI EAFE Index posted a return of 4.80%. In July and August, international equity market performance was buoyed by industrial and labor data, optimism surrounding COVID-19 vaccine testing and ongoing policy support from governments and central banks. September’s decline was based largely on a spike in COVID-19 cases globally, a pullback in information technology sector performance and the U.S. Fed’s perspective on further policy support. European equities ended the third calendar quarter rather flat. While major earnings beats of consensus expectations provided some support, European stock markets were pressured by rising worries around a second wave of COVID-19. The direction of Brexit negotiations also remained a key concern. In Europe, the composite Purchasing Managers’ Index fell to a three-month low in September. The region’s manufacturing sector, however, saw growth, led by Germany’s surge in manufacturing output. The U.K. presented an Internal Market Bill to its Parliament containing provisions that conflicted with the European Union-U.K. Withdrawal Agreement reached earlier in 2020. Still, in September, the U.K. and Japan finalized a free-trade agreement, the U.K.’s first major post-Brexit accord. The Japanese equity market slowed in September from its calendar year-to-date high in August 2020 amidst increasing U.S.-China tensions and the ongoing strength of the Japanese yen. However, the downside was limited by better than consensus expected Japan Gross
4
MARKET REVIEW
Domestic Product numbers, lowering of the COVID-19 alert in Tokyo and easing of restrictions in Japan broadly. The country elected a new Prime Minister in mid-September, the first new leader in nearly eight years, following the previous Prime Minister’s abrupt resignation. In September, the Bank of Japan upgraded its assessment of Japan’s economy, stating it had started to pick up after a difficult span caused by the pandemic.
In October 2020, the MSCI EAFE Index returned -1.68%. International equity markets declined, as investors focused on the then-upcoming November U.S. elections and the rising COVID-19 cases in many countries, most notably across Europe. A number of countries, including France, Germany and Belgium, were forced to reintroduce national lockdown measures. Meanwhile, though Japan had been rather successful in containing COVID-19, its equity market retreated on the renewed uncertainty about other regions in the world. These concerns around much of the globe outweighed the fact that third quarter 2020 corporate earnings, released in October, were largely positive, with many companies beating consensus expectations.
For the Reporting Period as a whole, information technology was the strongest performing sector in the MSCI EAFE Index, followed by health care and materials, each producing a positive absolute return. The weakest performing sector in the MSCI EAFE Index was energy, followed at some distance by real estate and financials, with each recording a double-digit loss during the Reporting Period.
From a country perspective, Denmark, New Zealand and Sweden were the strongest performing constituents of the MSCI EAFE Index during the Reporting Period, each generating a strong gain. Spain, Singapore and the U.K. were the weakest individual country constituents of the MSCI EAFE Index during the Reporting Period, each posting a double-digit negative absolute return.
Looking Ahead
At the end of the Reporting Period, we continued to believe that less expensive stocks should outpace more expensive stocks. In addition, we expected stocks with good momentum to outperform those with poor momentum. We plan to focus on seeking companies about which fundamental research analysts are becoming more positive as well as profitable companies with what we view as sustainable earnings and a track record of using their capital to enhance shareholder value. As such, we anticipate remaining fully invested, with long-term performance likely to be the result of stock selection rather than sector or capitalization allocations.
We stand behind our investment philosophy that sound economic investment principles, coupled with a disciplined quantitative approach, can provide strong, uncorrelated returns over the long term. Our research agenda is robust, and we continue to enhance our existing models, add new proprietary forecasting signals and improve our trading execution as we seek to provide the most value to our shareholders.
5
PORTFOLIO RESULTS
Goldman Sachs Emerging Markets Equity
Insights Fund
Investment Objective
The Fund seeks long-term growth of capital.
Portfolio Management Discussion and Analysis
Below, the Goldman Sachs Quantitative Investment Strategies Team discusses the Goldman Sachs Emerging Markets Equity Insights Fund’s (the “Fund”) performance and positioning for the 12-month period ended October 31, 2020 (the “Reporting Period”).
| Q | How did the Fund perform during the Reporting Period? |
| A | During the Reporting Period, the Fund’s Class A, Class C, Institutional, Investor, Class R6, Class R and Class P Shares generated average annual total returns, without sales charges, of 11.56%, 10.65%, 11.90%, 11.76%, 11.81%, 11.19% and 11.80%, respectively. These returns compare to the 8.23% average annual total return of the Fund’s benchmark, the MSCI Emerging Markets Standard Index (Net, USD, Unhedged) (the “Index”), during the same period. |
| Q | What key factors were most responsible for the Fund’s performance during the Reporting Period? |
| A | The Fund uses a quantitative style of management, in combination with a qualitative overlay, that emphasizes fundamentally-based stock and country/currency selection, careful portfolio construction and efficient implementation. To manage the Fund, we use two distinct strategies — a bottom-up stock selection strategy and a top-down country/currency selection strategy. These strategies are uncorrelated, that is, they tend to perform independently of each other over time, which enables us to greater diversify the portfolio. |
During the Reporting Period, the Fund outperformed the Index, with our stock selection strategy adding to results. Our country/currency strategy detracted slightly from relative returns. |
| Q | Which investment themes helped and which hurt within the Team’s stock selection strategy? |
| A | In keeping with our investment approach, we use our quantitative model and four investment themes to take a long-term view of market patterns and look for inefficiencies, selecting stocks for the Fund and overweighting or underweighting the ones chosen by the model. Over time and by design, the performance of any one |
| of the model’s investment themes tends to have a low correlation with the model’s other themes, demonstrating the diversification benefit of the Fund’s theme-driven quantitative model. The variance in performance supports our research indicating that the diversification provided by our different investment themes is a significant investment advantage over the long term, even though the Fund may experience underperformance in the short term. Of course, diversification does not protect an investor from market risk nor does it ensure a profit. |
During the Reporting Period, two of our investment themes contributed positively to the Fund’s relative performance. Market Themes & Trends was our best-performing investment theme, adding significantly to the Fund’s returns. The Sentiment Analysis investment also bolstered returns, albeit to a much lesser extent. Market Themes & Trends seeks to identify companies positively positioned to benefit from themes and trends in the market and macroeconomic environment. Sentiment Analysis seeks to identify stocks experiencing improvements in their overall market sentiment. |
Our Fundamental Mispricings investment theme detracted from relative results during the Reporting Period, followed at a distance by High Quality Business Models. Fundamental Mispricings seeks to identify high quality businesses trading at a fair price, which we believe may lead to strong performance over the long run. High Quality Business Models seeks to identify companies that are generating high quality revenues with sustainable business models and aligned management incentives. |
| Q | How did the Fund’s sector and industry allocations affect relative results? |
| A | In constructing the portfolio, we focus on picking stocks rather than on making sector or industry bets. Consequently, |
6
PORTFOLIO RESULTS
the Fund is similar to the Index in terms of its sector and industry allocations and its style. Changes in its sector or industry weights generally do not have a meaningful impact on relative returns. |
| Q | Did stock selection help or hurt Fund performance during the Reporting Period? |
| A | We seek to outpace the Index by overweighting stocks we expect to outperform and underweighting those we think may lag. At the same time, we strive to maintain a risk profile similar to the Index. The Fund’s investments are selected using fundamental research and a variety of quantitative techniques based on our investment themes. For example, the Fund aims to hold a basket of stocks with better Fundamental Mispricings characteristics than the Index. |
During the Reporting Period, stock selection added to the Fund’s relative returns, led by holdings in the real estate, information technology and financials sectors. Selection in two sectors — consumer discretionary and consumer staples — dampened relative performance. |
| Q | Which individual stock positions contributed most to the Fund’s relative returns during the Reporting Period? |
| A | In terms of individual stock positions, the Fund benefited from its overweight positions versus the Index in Taiwan Semiconductor Manufacturing, a Taiwan-based integrated circuits manufacturer; NAVER, a South Korean online platform; and NetEase, a China-based Internet technology company. Our Market Themes & Trends and High Quality Business Models investment themes led to the overweights in all three stocks. |
| Q | Which individual stock positions detracted most from the Fund’s relative returns during the Reporting Period? |
| A | During the Reporting Period, the Fund was hindered by its overweights in Petrobras Distribuidora and PICC Property & Casualty. An underweight in Meituan-Dianping also detracted from relative performance. We established the overweight in Petrobras Distribuidora, the largest distributor and marketer of petroleum derivatives and biofuels in Brazil and Latin America, based on our Fundamental Mispricings, Market Themes & Trends and High Quality Business Models investment themes. The overweight in China-based insurance company PICC Property & Casualty was largely the result of our Fundamental Mispricings investment theme. Our Fundamental Mispricings and High Quality Business Models investment themes resulted in the Fund’s underweight in Meituan-Dianping, a China-based on-line shopping platform for locally found consumer products and retail services, including entertainment, dining, delivery, travel and other services. |
| Q | What impact did the Team’s country/currency selection strategy have on the Fund’s relative performance during the Reporting Period? |
| A | Our country/currency strategy detracted modestly from the Fund’s relative returns. During the Reporting Period, the Fund’s performance was held back by its overweight compared to the Index in China and, to a lesser extent, by its overweight in Indonesia and its underweight in South Africa. On the positive side, the Fund benefited from an underweight in Taiwan and from its overweights in Brazil and Thailand. |
We made our picks using our proprietary models, which, during the Reporting Period, were based on three investment themes specific to our country/currency strategy — Valuation, Risk Premium and Macro. Valuation favors equity and currency markets that appear cheap relative to accounting measures of value and purchasing power. Risk Premium evaluates whether a country is overcompensating investors for various types of risk. Macro assesses a market’s macroeconomic environment and growth prospects. |
| Q | How did the Fund use derivatives and similar instruments during the Reporting Period? |
| A | During the Reporting Period, we used futures contracts to equitize the Fund’s cash holdings. In other words, we put the Fund’s cash holdings to work by using them as collateral for the purchase of futures contracts. The use of these derivatives did not have a material impact on Fund results during the Reporting Period. |
| Q | What changes did you make to the Fund’s country weightings during the Reporting Period? |
| A | During the Reporting Period, we shifted the Fund from an overweight position relative to the Index in China to an underweight position. We reduced the size of the Fund’s overweight in Indonesia and increased the size of its overweight in South Korea. Compared to the Index, we changed within the Fund from rather neutral positions in Peru and India to overweight positions. We also moved the Fund from overweight positions in Mexico and Turkey to relatively neutral positions compared to the Index. |
7
PORTFOLIO RESULTS
| Q | What were the Fund’s sector and country weightings at the end of the Reporting Period? |
| A | At the end of the Reporting Period, the Fund was overweight relative to the Index in the communication services, consumer discretionary, information technology, materials and health care sectors. Compared to the Index, the Fund was underweight the energy, consumer staples, financials, real estate and utilities sectors. It was rather neutral versus the Index in the industrials sector at the conclusion of the Reporting Period. |
In terms of countries, the Fund was overweight relative to the Index in South Korea, Indonesia, India, Peru and Taiwan at the end of the Reporting Period. Compared to the Index, the Fund was underweight Saudi Arabia, Malaysia, China and South Africa. The Fund was relatively neutral in Brazil, the Philippines, Turkey, Mexico, Russia, Chile, United Arab Emirates, Qatar, Poland, Hungary, Thailand, Pakistan, Greece, Czech Republic, Egypt, Argentina and Colombia at the end of the Reporting Period. |
8
FUND BASICS
Emerging Markets Equity Insights Fund
as of October 31, 2020
| TOP TEN HOLDINGS AS OF 10/31/201 | ||||||||||
| Holding | % of Net Assets | Line of Business | Country | |||||||
| Alibaba Group Holding Ltd. ADR | 10.1 | % | Retailing | China | ||||||
| Tencent Holdings Ltd. | 8.1 | Media & Entertainment | China | |||||||
| Taiwan Semiconductor Manufacturing Co. Ltd. ADR | 6.4 | Semiconductors & Semiconductor Equipment | Taiwan | |||||||
| Samsung Electronics Co. Ltd. | 4.0 | Technology Hardware & Equipment | South Korea | |||||||
| JD.com, Inc. ADR | 2.6 | Retailing | China | |||||||
| Meituan Class B | 2.3 | Retailing | China | |||||||
| LG Chem Ltd. | 1.8 | Materials | South Korea | |||||||
| Sberbank of Russia PJSC | 1.8 | Banks | Russia | |||||||
| Vipshop Holdings Ltd. ADR | 1.7 | Retailing | China | |||||||
| NAVER Corp. | 1.7 | Media & Entertainment | South Korea | |||||||
| 1 | The top 10 holdings may not be representative of the Fund’s future investments. |
| FUND VS. BENCHMARK SECTOR ALLOCATIONS2 |
| As of October 31, 2020 |
| 2 | The Fund is actively managed and, as such, its composition may differ over time. Consequently, the Fund’s overall sector allocations may differ from percentages contained in the graph above. The graph categorizes investments using Global Industry Classification Standard (“GICS”); however, the sector classifications used by the portfolio management team may differ from GICS. The percentage shown for each investment category reflects the value of investments in that category as a percentage of market value (excluding investments in the securities lending reinvestment vehicle, if any). Investments in the securities lending reinvestment vehicle represented 0.0% of the Fund’s net assets at October 31, 2020. The graph depicts the Fund’s investments but may not represent the Fund’s market exposure due to the exclusion of certain derivatives, if any, as listed in the Additional Investment Information section of the Schedule of Investments. Percentages may not sum to 100% due to rounding. |
For more information about your Fund, please refer to www.GSAMFUNDS.com. There, you can learn more about your Fund’s investment strategies, holdings, and performance.
9
GOLDMAN SACHS EMERGING MARKETS EQUITY INSIGHTS FUND
Performance Summary
October 31, 2020
The following graph shows the value, as of October 31, 2020, of a $1,000,000 investment made on November 1, 2010 in Institutional Shares at NAV. For comparative purposes, the performance of the Fund’s benchmark, the MSCI® Emerging Markets Standard Index (the “MSCI® EM Index”) (Net, USD, unhedged), is shown. Performance reflects applicable fee waivers and/or expense limitations in effect during the periods shown and in their absence, performance would be reduced. Returns do not reflect the deduction of taxes that a shareholder would pay on Fund distributions or the redemption of Fund shares. The returns set forth below represent past performance. Past performance does not guarantee future results. The Fund’s investment return and principal value will fluctuate so that an investor’s shares, when redeemed, may be worth more or less than their original cost. Current performance may be lower or higher than the performance quoted below. Please visit our web site at www.GSAMFUNDS.com to obtain the most recent month-end returns.
| Emerging Markets Equity Insights Fund’s 10 Year Performance |
Performance of a $1,000,000 Investment, with distributions reinvested, from November 1, 2010 through October 31, 2020.
| Average Annual Total Return through October 31, 2020* | One Year | Five Years | Ten Years | Since Inception | ||||||||||
Class A | ||||||||||||||
Excluding sales charges | 11.56% | 7.48% | 3.15% | — | ||||||||||
Including sales charges | 5.47% | 6.28% | 2.56% | — | ||||||||||
| ||||||||||||||
Class C | ||||||||||||||
Excluding contingent deferred sales charges | 10.65% | 6.69% | 2.37% | — | ||||||||||
Including contingent deferred sales charges | 9.64% | 6.69% | 2.37% | — | ||||||||||
| ||||||||||||||
Institutional | 11.90% | 7.91% | 3.54% | — | ||||||||||
| ||||||||||||||
Investor | 11.76% | 7.76% | 3.38% | — | ||||||||||
| ||||||||||||||
Class R6 (Commenced July 31, 2015) | 11.81% | 7.91% | N/A | 6.29% | ||||||||||
| ||||||||||||||
Class R (Commenced February 28, 2014) | 11.19% | 7.22% | N/A | 4.94% | ||||||||||
| ||||||||||||||
Class P (Commenced April 16, 2018) | 11.80% | N/A | N/A | -0.59% | ||||||||||
| ||||||||||||||
| * | These returns assume reinvestment of all distributions at NAV and reflect a maximum initial sales charge of 5.50% for Class A and the assumed contingent deferred sales charge for Class C Shares (1% if redeemed within 12 months of purchase). Because Institutional, Investor, Class R6, Class R and Class P Shares do not involve a sales charge, such a charge is not applied to their Average Annual Total Returns. |
10
PORTFOLIO RESULTS
Goldman Sachs International Equity Insights Fund
Investment Objective
The Fund seeks long-term growth of capital.
Portfolio Management Discussion and Analysis
Below, the Goldman Sachs Quantitative Investment Strategies Team discusses the Goldman Sachs International Equity Insights Fund’s (the “Fund”) performance and positioning for the 12-month period ended October 31, 2020 (the “Reporting Period”).
| Q | How did the Fund perform during the Reporting Period? |
| A | During the Reporting Period, the Fund’s Class A, Class C, Institutional, Service, Investor, Class R6, Class R and Class P Shares generated average annual total returns, without sales charges, of -6.44%, -7.08%, -6.07%, -6.50%, -6.21%, -6.06%, -6.69% and -6.06%, respectively. These returns compare to the -6.85% average annual total return of the Fund’s benchmark, the MSCI EAFE Standard Index (Net, USD, Unhedged) (the “Index”), during the same period. |
| Q | What key factors were most responsible for the Fund’s performance during the Reporting Period? |
| A | The Fund uses a quantitative style of management, in combination with a qualitative overlay, that emphasizes fundamentally-based stock and country/currency selection, careful portfolio construction and efficient implementation. To manage the Fund, we use two distinct strategies — a bottom-up stock selection strategy and a top-down country/currency selection strategy. These strategies are uncorrelated, that is, they tend to perform independently of each other over time, which enables us to greater diversify the portfolio. |
During the Reporting Period, the Fund generated mixed results versus the Index, with some share classes outperforming and others underperforming. Within our stock selection strategy, certain individual investments detracted from relative performance. Our country/currency strategy added marginally to results. |
| Q | Which investment themes helped and which hurt within the Team’s stock selection strategy? |
| A | In keeping with our investment approach, we use our quantitative model and four investment themes to take a long-term view of market patterns and look for inefficiencies, selecting stocks for the Fund and overweighting or underweighting the ones chosen by the model. Over time and by design, the performance of any one of the model’s investment themes tends to have a low correlation with the model’s other themes, demonstrating the diversification benefit of the Fund’s theme-driven quantitative model. The variance in performance supports our research indicating that the diversification provided by our different investment themes is a significant investment advantage over the long term, even though the Fund may experience underperformance in the short term. Of course, diversification does not protect an investor from market risk nor does it ensure a profit. |
During the Reporting Period, three of our investment themes added to the Fund’s relative performance. Market Themes & Trends was our best performing theme, followed at some distance by Sentiment Analysis and High Quality Business Models. Market Themes & Trends seeks to identify companies positively positioned to benefit from themes and trends in the market and macroeconomic environment. Sentiment Analysis seeks to identify stocks experiencing improvements in their overall market sentiment. High Quality Business Models seeks to identify companies that are generating high quality revenues with sustainable business models and aligned management incentives. |
Our Fundamental Mispricings theme detracted from the Fund’s relative returns during the Reporting Period. Fundamental Mispricings seeks to identify high quality businesses trading at a fair price, which we believe may lead to strong performance over the long run. |
| Q | How did the Fund’s sector and industry allocations affect relative results? |
| A | In constructing the portfolio, we focus on picking stocks rather than on making sector or industry bets. Consequently, |
11
PORTFOLIO RESULTS
the Fund is similar to the Index in terms of its sector and industry allocations and its style. Changes in its sector or industry weights generally do not have a meaningful impact on relative returns. |
| Q | Did stock selection help or hurt Fund performance during the Reporting Period? |
| A | We seek to outpace the Index by overweighting stocks we expect to outperform and underweighting those we think may lag. At the same time, we strive to maintain a risk profile similar to the Index. The Fund’s investments are selected using fundamental research and a variety of quantitative techniques based on our investment themes. For example, the Fund aims to hold a basket of stocks with better Fundamental Mispricings characteristics than the Index. |
During the Reporting Period, the Fund was hurt by certain individual stock positions. Investments in the consumer discretionary, utilities and industrials sectors detracted from relative performance. On the positive side, the Fund benefited from stock selection in the health care, information technology and energy sectors during the Reporting Period. |
| Q | Which individual stock positions detracted most from the Fund’s relative returns during the Reporting Period? |
| A | In terms of individual stock positions, the Fund was hindered during the Reporting Period by underweights versus the Index in U.K.-headquartered tobacco company British American Tobacco and French luxury goods company LVMH Moet Hennessy Louis Vuitton and by an overweight in Italian investment bank Mediobanca Banca di Credito Finanziario. The underweight in British American Tobacco was largely due to our Market Themes & Trends and High Quality Business Models investment themes. The Fund was underweight LVMH Moet Hennessy Louis Vuitton mostly because of our Fundamental Mispricings and High Quality Business Models investment themes. We established the overweight in Mediobanca Banca di Credito Finanziario based on our High Quality Business Models and Market Themes & Trends investment themes. |
| Q | Which individual stock positions contributed most to the Fund’s relative returns during the Reporting Period? |
| A | During the Reporting Period, the Fund was helped by underweight positions in U.K.-based BP and Netherlands-based Royal Dutch Shell, both integrated oil and gas companies. An overweight position in Schneider Electric, a France-based provider of energy and automation digital solutions, also added to relative performance. We adopted the underweight in BP primarily because of our Market Themes & Trends investment theme, while the underweight in Royal Dutch Shell was mainly because of our Market Themes & Trends and Sentiment Analysis investment themes. Our High Quality Business Models investment theme drove our decision to overweight Schneider Electric. |
| Q | What impact did the Team’s country/currency selection strategy have on the Fund’s relative performance during the Reporting Period? |
| A | Our country/currency selection strategy added slightly to the Fund’s relative returns during the Reporting Period. Compared to the Index, the Fund was aided by underweights in the U.K. and France as well as by a modest overweight in Australia. Conversely, overweight positions in Italy, Japan and Switzerland detracted from the Fund’s relative performance during the Reporting Period. |
We made our picks using our proprietary models, which, during the Reporting Period, were based on five investment themes specific to our country/currency strategy—Valuation, Momentum, Risk Premium, Fund Flows and Macro. Valuation favors equity and currency markets that appear cheap relative to accounting measures of value and purchasing power. Momentum favors countries and currencies that have had strong recent outperformance. Risk Premium evaluates whether a country is overcompensating investors for various types of risk, while Fund Flows evaluates the strength of capital market inflows. Finally, Macro assesses a market’s macroeconomic environment and growth prospects. |
| Q | How did the Fund use derivatives and similar instruments during the Reporting Period? |
| A | During the Reporting Period, we used futures contracts to equitize the Fund’s cash holdings. In other words, we put the Fund’s cash holdings to work by using them as collateral for the purchase of futures contracts. The use of these derivatives did not have a material impact on Fund results during the Reporting Period. |
| Q | What changes did you make to the Fund’s country weightings during the Reporting Period? |
| A | During the Reporting Period, we moved the Fund from an underweight position relative to the Index in Japan to an overweight position. We reduced the size of the Fund’s overweight in the Netherlands and increased the size of its |
12
PORTFOLIO RESULTS
overweight position in Switzerland. In addition, we increased the Fund’s underweight in the U.K. We changed within the Fund from an overweight in Sweden and an underweight in Hong Kong to a rather neutral position in each versus the Index. We also shifted the Fund from a rather neutral position in France to an underweight position during the Reporting Period. |
| Q | What were the Fund’s sector and country weightings at the end of the Reporting Period? |
| A | At the end of the Reporting Period, the Fund was overweight relative to the Index in the health care, information technology, consumer discretionary and industrials sectors. Compared to the Index, the Fund was underweight the utilities, financials and energy sectors. The Fund was relatively neutral versus the Index in the consumer staples, communication services, real estate and materials sectors at the end of the Reporting Period. |
In terms of countries, the Fund was overweight relative to the Index in Switzerland, the Netherlands, Japan, Italy and Norway at the end of the Reporting Period. Compared to the Index, the Fund was underweight the U.K., France and Spain. The Fund was relatively neutral versus the Index in Ireland, Hong Kong, Israel, Belgium, Germany, Sweden, Singapore, Denmark, Finland, Austria, Portugal, New Zealand and Australia at the end of the Reporting Period. |
13
FUND BASICS
International Equity Insights Fund
as of October 31, 2020
| TOP TEN HOLDINGS AS OF 10/31/201,2 | ||||||||||
| Holding | % of Net Assets | Line of Business | Country | |||||||
| Nestle SA (Registered) | 3.3 | % | Food, Beverage & Tobacco | Switzerland | ||||||
| Roche Holding AG | 2.6 | Pharmaceuticals, Biotechnology & Life Sciences | Switzerland | |||||||
| Novartis AG (Registered) | 2.1 | Pharmaceuticals, Biotechnology & Life Sciences | Switzerland | |||||||
| Toyota Motor Corp. | 1.7 | Automobiles & Components | Japan | |||||||
| Schneider Electric SE | 1.4 | Capital Goods | France | |||||||
| ASML Holding NV | 1.3 | Semiconductors & Semiconductor Equipment | Netherlands | |||||||
| Novo Nordisk A/S Class B | 1.3 | Pharmaceuticals, Biotechnology & Life Sciences | Denmark | |||||||
| Rio Tinto plc ADR | 1.2 | Materials | Australia | |||||||
| Deutsche Post AG (Registered) | 1.2 | Transportation | Germany | |||||||
| Zurich Insurance Group AG | 1.1 | Insurance | Switzerland | |||||||
| 1 | The top 10 holdings may not be representative of the Fund’s future investments. |
| 2 | The Fund’s overall top 10 holdings differ from the table above due to the exclusion of the Goldman Sachs Financial Square Government Fund (a short-term investment fund), which represents approximately 1.2% of the Fund’s net assets as of 10/31/20. |
| FUND VS. BENCHMARK SECTOR ALLOCATIONS3 |
| As of October 31, 2020 |
| 3 | The Fund is actively managed and, as such, its composition may differ over time. Consequently, the Fund’s overall sector allocations may differ from percentages contained in the graph above. The graph categorizes investments using Global Industry Classification Standard (“GICS”); however, the sector classifications used by the portfolio management team may differ from GICS. The percentage shown for each investment category reflects the value of investments in that category as a percentage of market value (excluding investments in the securities lending reinvestment vehicle, if any). Investments in the securities lending reinvestment vehicle represented 1.2% of the Fund’s net assets at October 31, 2020. The graph depicts the Fund’s investments but may not represent the Fund’s market exposure due to the exclusion of certain derivatives, if any, as listed in the Additional Investment Information section of the Schedule of Investments. Percentages may not sum to 100% due to rounding. |
For more information about your Fund, please refer to www.GSAMFUNDS.com. There, you can learn more about your Fund’s investment strategies, holdings, and performance.
14
GOLDMAN SACHS INTERNATIONAL EQUITY INSIGHTS FUND
Performance Summary
October 31, 2020
The following graph shows the value, as of October 31, 2020, of a $1,000,000 investment made on November 1, 2010 in Institutional Shares at NAV. For comparative purposes, the performance of the Fund’s benchmark, the MSCI® EAFE Standard Index (Net, USD, Unhedged), is shown. Performance reflects applicable fee waivers and/or expense limitations in effect during the periods shown and in their absence, performance would be reduced. Returns do not reflect the deduction of taxes that a shareholder would pay on Fund distributions or the redemption of Fund shares. The returns set forth below represent past performance. Past performance does not guarantee future results. The Fund’s investment return and principal value will fluctuate so that an investor’s shares, when redeemed, may be worth more or less than their original cost. Current performance may be lower or higher than the performance quoted below. Please visit our web site at www.GSAMFUNDS.com to obtain the most recent month-end returns.
| International Equity Insights Fund’s 10 Year Performance |
Performance of a $1,000,000 Investment, with distributions reinvested, from November 1, 2010 through October 31, 2020.
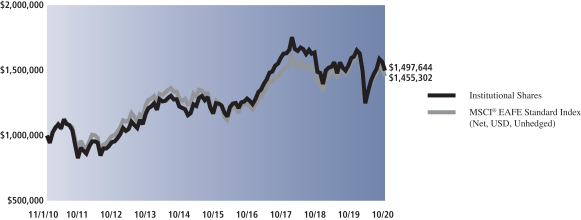
| Average Annual Total Return through October 31, 2020* | One Year | Five Years | Ten Years | Since Inception | ||||||||||
Class A | ||||||||||||||
Excluding sales charges | -6.44% | 3.31% | 3.71% | — | ||||||||||
Including sales charges | -11.61% | 2.15% | 3.13% | — | ||||||||||
| ||||||||||||||
Class C | ||||||||||||||
Excluding contingent deferred sales charges | -7.08% | 2.54% | 2.94% | — | ||||||||||
Including contingent deferred sales charges | -8.01% | 2.54% | 2.94% | — | ||||||||||
| ||||||||||||||
Institutional | -6.07% | 3.69% | 4.12% | — | ||||||||||
| ||||||||||||||
Service | -6.50% | 3.17% | 3.60% | — | ||||||||||
| ||||||||||||||
Investor | -6.21% | 3.57% | 3.98% | — | ||||||||||
| ||||||||||||||
Class R6 (Commenced July 31, 2015) | -6.06% | 3.70% | N/A | 2.81% | ||||||||||
| ||||||||||||||
Class R | -6.69% | 3.04% | 3.47% | — | ||||||||||
| ||||||||||||||
Class P (Commenced April 16, 2018) | -6.06% | N/A | N/A | -4.47% | ||||||||||
| ||||||||||||||
| * | These returns assume reinvestment of all distributions at NAV and reflect a maximum initial sales charge of 5.50% for Class A and the assumed contingent deferred sales charge for Class C Shares (1% if redeemed within 12 months of purchase). Because Institutional, Service, Investor, Class R6, Class R and Class P Shares do not involve a sales charge, such a charge is not applied to their Average Annual Total Returns. |
15
PORTFOLIO RESULTS
Goldman Sachs International Small Cap Insights Fund
Investment Objective
The Fund seeks long-term growth of capital.
Portfolio Management Discussion and Analysis
Below, the Goldman Sachs Quantitative Investment Strategies Team discusses the Goldman Sachs International Small Cap Insights Fund’s (the “Fund”) performance and positioning for the 12-month period ended October 31, 2020 (the “Reporting Period”).
| Q | How did the Fund perform during the Reporting Period? |
| A | During the Reporting Period, the Fund’s Class A, Class C, Institutional, Investor, Class R6 and Class P Shares generated average annual total returns, without sales charges, of -3.98%, -4.71%, -3.61%, -3.72%, -3.60% and -3.60%, respectively. These returns compare to the -1.36% average annual total return of the Fund’s benchmark, the MSCI EAFE Small Cap Index (Net, USD, Unhedged) (the “Index”), during the same period. |
| Q | What key factors were most responsible for the Fund’s performance during the Reporting Period? |
| A | The Fund uses a quantitative style of management, in combination with a qualitative overlay, that emphasizes fundamentally-based stock selection, careful portfolio construction and efficient implementation. The Fund’s investments are selected using fundamental research and a variety of quantitative techniques based on certain investment themes, including Fundamental Mispricings, High Quality Business Models, Sentiment Analysis and Market Themes & Trends. |
During the Reporting Period, the Fund underperformed the Index, with two of our quantitative model’s four investment themes detracting from results. Stock selection driven by these investment themes diminished relative returns. |
| Q | What impact did the Fund’s investment themes have on performance during the Reporting Period? |
| A | In keeping with our investment approach, we use our quantitative model and four investment themes to take a long-term view of market patterns and look for inefficiencies, selecting stocks for the Fund and overweighting or underweighting the ones chosen by the model. Over time and by design, the performance of any one of the model’s investment themes tends to have a low correlation with the model’s other themes, demonstrating the diversification benefit of the Fund’s theme-driven quantitative model. The variance in performance supports our research indicating that the diversification provided by our different investment themes is a significant investment advantage over the long term, even though the Fund may experience underperformance in the short term. Of course, diversification does not protect an investor from market risk nor does it ensure a profit. |
During the Reporting Period, two of our investment themes detracted from the Fund’s relative performance. Fundamental Mispricings was our worst-performing investment theme, followed at some distance by High Quality Business Models. Fundamental Mispricings seeks to identify high quality businesses trading at a fair price, which we believe may lead to strong performance over the long run. High Quality Business Models seeks to identify companies that are generating high quality revenues with sustainable business models and aligned management incentives. |
Our Market Themes & Trends and Sentiment Analysis investment themes added to the Fund’s relative returns during the Reporting Period. Market Themes and Trends seeks to identify companies positively positioned to benefit from themes and trends in the market and macroeconomic environment. Sentiment Analysis seeks to identify stocks experiencing improvements in their overall market sentiment. |
| Q | How did the Fund’s sector and industry allocations affect relative results? |
| A | In constructing the portfolio, we focus on picking stocks rather than on making sector or industry bets. Consequently, the Fund is similar to the Index in terms of its sector and industry allocations and its style. Changes in its sector or industry weights generally do not have a meaningful impact on relative returns. |
| Q | Did stock selection help or hurt Fund performance during the Reporting Period? |
| A | We seek to outpace the Index by overweighting stocks we expect to outperform and underweighting those we think may lag. At the same time, we strive to maintain a risk profile similar to the Index. The Fund’s investments are selected |
16
PORTFOLIO RESULTS
using fundamental research and a variety of quantitative techniques based on our investment themes. For example, the Fund aims to hold a basket of stocks with better Fundamental Mispricings characteristics than the Index. |
During the Reporting Period, stock selection hurt the Fund’s relative performance. The negative results were led by investments in the materials, real estate and consumer discretionary sectors. Contributing positively were the Fund’s holdings in the energy, financials and health care sectors. |
| Q | Which individual stock positions detracted most from the Fund’s relative returns during the Reporting Period? |
| A | In terms of individual stock positions, the Fund was hampered during the Reporting Period by overweight positions relative to the Index in MERLIN Properties SOCIMI, a Spain-based real estate investment trust; Beach Energy, an Australian oil and gas exploration company; and NET One Systems, a Japanese information technology service management company. The overweight in MERLIN Properties SOCIMI was largely due to our High Quality Business Models and Fundamental Mispricings investment themes. Our High Quality Business Models and Market Themes & Trends drove the Fund’s overweight in Beach Energy. We chose to overweight NET One Systems mainly because of our Market Themes & Trends and Fundamental Mispricings investment themes. |
| Q | Which individual stock positions contributed most to the Fund’s relative results during the Reporting Period? |
| A | During the Reporting Period, the Fund was helped by its overweight positions in Plus500, a British international financial firm providing online trading services in contracts for differences; Tecan Group, a Swiss company providing laboratory instruments and solutions; and ASM International, a Netherlands-based supplier of semiconductor process equipment for wafer processing. (A contract for differences is an agreement between two parties to exchange the difference in the value of a financial product between the time the contract opens and closes.) The Fund’s overweight in Plus500 was primarily due to our High Quality Business Models investment theme. Our Market Themes & Trends, Sentiment Analysis and High Quality Business Models investment themes led us to overweight Tecan Group. The overweight in ASM International was largely the result of our Market Themes & Trends and High Quality Business Models investment themes. |
| Q | What impact did country selection have on the Fund’s relative performance during the Reporting Period? |
| A | To construct the portfolio, we focus on security selection rather than on making country bets. As a result, the Fund is similar to the Index in terms of its country allocation; changes in its country weightings are generally the result of our stock picking. |
| Q | How did the Fund use derivatives and similar instruments during the Reporting Period? |
| A | During the Reporting Period, we used futures contracts to equitize the Fund’s cash holdings. In other words, we put the Fund’s cash holdings to work by using them as collateral for the purchase of futures contracts. The use of these derivatives did not have a material impact on Fund results during the Reporting Period. |
| Q | What changes did you make to the Fund’s country weightings during the Reporting Period? |
| A | As mentioned previously, changes in the Fund’s country weightings are generally the result of our stock picking. During the Reporting Period, the Fund’s overweight in Japan compared to the Index decreased, and its overweight in the Netherlands increased. Its neutral position relative to the Index in Italy changed to an overweight position, while its overweight in Germany became a rather neutral position. In addition, the Fund’s underweights in the U.K. and Israel increased during the Reporting Period. |
| Q | What were the Fund’s sector and country weightings at the end of the Reporting Period? |
| A | At the end of the Reporting Period, the Fund was overweight relative to the Index in the consumer discretionary, health care, information technology and materials sectors. Compared to the Index, the Fund was underweight the real estate, financials, industrials, utilities and energy sectors. The Fund was relatively neutral compared to the Index in the consumer staples and communication services sectors at the end of the Reporting Period. |
In terms of countries, the Fund was overweight the Netherlands, Japan and Italy relative to the Index at the end of the Reporting Period. Compared to the Index, the Fund was underweight the U.K., Israel, Denmark, Sweden, New Zealand and Singapore. It was relatively neutral compared to the Index in Finland, Norway, France, Germany, Belgium, Ireland, Portugal, Australia, Austria, Switzerland and Spain. The Fund had no exposure to Hong Kong at the end of the Reporting Period. |
17
FUND BASICS
International Small Cap Insights Fund
as of October 31, 2020
| TOP TEN HOLDINGS AS OF 10/31/201 | ||||||||||
| Holding | % of Net Assets | Line of Business | Country | |||||||
| Kesko OYJ Class B | 1.4 | % | Food & Staples Retailing | Finland | ||||||
| Tecan Group AG (Registered) | 1.3 | Pharmaceuticals, Biotechnology & Life Sciences | Switzerland | |||||||
| ASM International NV | 1.3 | Semiconductors & Semiconductor Equipment | Netherlands | |||||||
| Signify NV | 1.1 | Capital Goods | Netherlands | |||||||
| DeNA Co. Ltd. | 1.1 | Media & Entertainment | Japan | |||||||
| Plus500 Ltd. | 1.1 | Diversified Financials | Israel | |||||||
| IG Group Holdings plc | 1.1 | Diversified Financials | United Kingdom | |||||||
| Warehouses De Pauw CVA (REIT) | 1.1 | Real Estate | Belgium | |||||||
| JB Hi-Fi Ltd. | 1.1 | Retailing | Australia | |||||||
| Interpump Group SpA | 1.0 | Capital Goods | Italy | |||||||
| 1 | The top 10 holdings may not be representative of the Fund’s future investments. |
| FUND VS. BENCHMARK SECTOR ALLOCATIONS2 |
| As of October 31, 2020 |

| 2 | The Fund is actively managed and, as such, its composition may differ over time. Consequently, the Fund’s overall sector allocations may differ from percentages contained in the graph above. The graph categorizes investments using Global Industry Classification Standard (“GICS”); however, the sector classifications used by the portfolio management team may differ from GICS. The percentage shown for each investment category reflects the value of investments in that category as a percentage of market value (excluding investments in the securities lending reinvestment vehicle, if any). Investments in the securities lending reinvestment vehicle represented 1.0% of the Fund’s net assets at October 31, 2020. The graph depicts the Fund’s investments but may not represent the Fund’s market exposure due to the exclusion of certain derivatives, if any, as listed in the Additional Investment Information section of the Schedule of Investments. Percentages may not sum to 100% due to rounding. |
For more information about your Fund, please refer to www.GSAMFUNDS.com. There, you can learn more about your Fund’s investment strategies, holdings, and performance.
18
GOLDMAN SACHS INTERNATIONAL SMALL CAP INSIGHTS FUND
Performance Summary
October 31, 2020
The following graph shows the value, as of October 31, 2020, of a $1,000,000 investment made on November 1, 2010 in Institutional Shares at NAV. For comparative purposes, the performance of the Fund’s benchmark, the MSCI® EAFE Small Cap Index (Net, USD, Unhedged), is shown. Performance reflects applicable fee waivers and/or expense limitations in effect during the periods shown and in their absence, performance would be reduced. Returns do not reflect the deduction of taxes that a shareholder would pay on Fund distributions or the redemption of Fund shares. The returns set forth below represent past performance. Past performance does not guarantee future results. The Fund’s investment return and principal value will fluctuate so that an investor’s shares, when redeemed, may be worth more or less than their original cost. Current performance may be lower or higher than the performance quoted below. Please visit our web site at www.GSAMFUNDS.com to obtain the most recent month-end returns.
| International Small Cap Insights Fund’s 10 Year Performance |
Performance of a $1,000,000 Investment, with distributions reinvested, from November 1, 2010 through October 31, 2020.
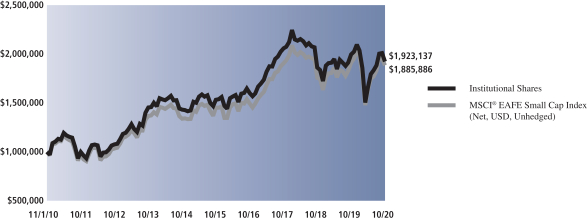
| Average Annual Total Return through October 31, 2020* | One Year | Five Years | Ten Years | Since Inception | ||||||||||
Class A | ||||||||||||||
Excluding sales charges | -3.98% | 4.24% | 6.32% | — | ||||||||||
Including sales charges | -9.28% | 3.06% | 5.71% | — | ||||||||||
| ||||||||||||||
Class C | ||||||||||||||
Excluding contingent deferred sales charges | -4.71% | 3.46% | 5.53% | — | ||||||||||
Including contingent deferred sales charges | -5.66% | 3.46% | 5.53% | — | ||||||||||
| ||||||||||||||
Institutional | -3.61% | 4.64% | 6.75% | — | ||||||||||
| ||||||||||||||
Investor | -3.72% | 4.51% | 6.60% | — | ||||||||||
| ||||||||||||||
Class R6 (Commenced July 31, 2015) | -3.60% | 4.70% | N/A | 3.88% | ||||||||||
| ||||||||||||||
Class P (Commenced April 16, 2018) | -3.60% | N/A | N/A | -4.69% | ||||||||||
| ||||||||||||||
| * | These returns assume reinvestment of all distributions at NAV and reflect a maximum initial sales charge of 5.50% for Class A and the assumed contingent deferred sales charge for Class C Shares (1% if redeemed within 12 months of purchase). Because Institutional, Investor, Class R6 and Class P Shares do not involve a sales charge, such a charge is not applied to their Average Annual Total Returns. |
19
FUND BASICS
Index Definitions
MSCI China Index captures large and mid cap representation across China H shares, B shares, Red chips, P chips and foreign listings.
The MSCI Emerging Markets Standard Index (Net, USD, Unhedged) is a free float-adjusted market capitalization index that is designed to measure equity market performance of emerging markets. As of October 31, 2020, the MSCI® Emerging Markets Standard Index (Net, USD, Unhedged) consists of the following 26 emerging market country indices: Argentina, Brazil, Chile, China, Colombia, Czech Republic, Egypt, Greece, Hungary, India, Indonesia, Korea, Malaysia, Mexico, Pakistan, Peru, Philippines, Poland, Qatar, Russia, Saudi Arabia, South Africa, Taiwan, Thailand, Turkey and United Arab Emirates. The MSCI® Emerging Markets Standard Index (Net, USD, Unhedged) figures do not reflect any deduction for fees, expenses or taxes. It is not possible to invest directly in an index.
The MSCI® EAFE Standard Index (Net, USD, Unhedged) is a market capitalization weighted composite of securities in 21 developed markets. As of October 31, 2020, the MSCI® EAFE Standard Index (Net, USD, Unhedged) consists of the following 21 developed countries: Australia, Austria, Belgium, Denmark, Finland, France, Germany, Hong Kong, Ireland, Israel, Italy, Japan, the Netherlands, New Zealand, Norway, Portugal, Singapore, Spain, Sweden, Switzerland and the United Kingdom. The MSCI® EAFE Standard Index (Net, USD, Unhedged) figures do not reflect any deduction for fees, expenses or taxes. It is not possible to invest directly in an index.
The MSCI® EAFE Small Cap Index (Net, USD, Unhedged) is a free float-adjusted market capitalization index that is designed to measure developed market equity performance, excluding the U.S. and Canada. The MSCI® EAFE Small Cap Index (Net, USD, Unhedged) selects the most liquid securities across developed markets relative to their market capitalization, and targets for index inclusion 40% of the full market capitalization of the eligible small cap universe within each industry group, within each country. Its returns include net reinvested dividends but, unlike Fund returns, do not reflect the payment of sales commissions or other expenses incurred in the purchase or sale of the securities included in the MSCI® EAFE Small Cap Index (Net, USD, Unhedged). It is not possible to invest directly in an index.
It is not possible to invest directly in an unmanaged index.
20
GOLDMAN SACHS EMERGING MARKETS EQUITY INSIGHTS FUND
October 31, 2020
| Shares | Description | Value | ||||||
| Common Stocks – 98.5% | ||||||||
| Brazil – 3.6% | ||||||||
| 87,600 | AES Tiete Energia SA (Utilities)* | $ | 224,422 | |||||
| 3,104,400 | B3 SA – Brasil Bolsa Balcao (Diversified Financials) | 27,619,554 | ||||||
| 150,600 | Cia Paranaense de Energia (Preference) (Utilities)*(a) | 1,620,972 | ||||||
| 769,400 | Duratex SA (Materials)* | 2,570,500 | ||||||
| 442,200 | Klabin SA (Materials) | 1,829,543 | ||||||
| 224,300 | Lojas Americanas SA (Preference) (Retailing)*(a) | 908,075 | ||||||
| 4,190,928 | Petrobras Distribuidora SA (Retailing) | 14,008,836 | ||||||
| 522,400 | Sao Martinho SA (Food, Beverage & Tobacco) | 1,916,454 | ||||||
| 906,700 | WEG SA (Capital Goods) | 11,982,513 | ||||||
|
| |||||||
| 62,680,869 | ||||||||
|
| |||||||
| China – 40.9% | ||||||||
| 569,500 | Alibaba Group Holding Ltd. ADR (Retailing)* | 173,520,955 | ||||||
| 100,787 | Anhui Conch Cement Co. Ltd. Class A (Materials) | 767,501 | ||||||
| 795,500 | Anhui Conch Cement Co. Ltd. Class H (Materials) | 4,976,244 | ||||||
| 216,700 | Baidu, Inc. ADR (Media & Entertainment)* | 28,831,935 | ||||||
| 86,000 | Bank of Communications Co. Ltd. Class H (Banks) | 42,311 | ||||||
| 3,088,000 | Brilliance China Automotive Holdings Ltd. (Automobiles & Components) | 2,665,599 | ||||||
| 166,326 | BYD Co. Ltd. Class A (Automobiles & Components) | 3,968,441 | ||||||
| 7,049,000 | China Lesso Group Holdings Ltd. (Capital Goods) | 11,428,026 | ||||||
| 2,070,000 | China Life Insurance Co. Ltd. Class H (Insurance) | 4,516,586 | ||||||
| 723,000 | China Longyuan Power Group Corp. Ltd. Class H (Utilities) | 495,552 | ||||||
| 10,305,000 | China Medical System Holdings Ltd. (Pharmaceuticals, Biotechnology & Life Sciences) | 10,836,511 | ||||||
| 20,500 | China Minsheng Banking Corp. Ltd. Class H (Banks) | 11,219 | ||||||
| 368,347 | China Shenhua Energy Co. Ltd. Class A (Energy) | 917,099 | ||||||
| 2,282,500 | China Shenhua Energy Co. Ltd. Class H (Energy) | 3,954,753 | ||||||
| 2,086,975 | China South Publishing & Media Group Co. Ltd. Class A (Media & Entertainment) | 3,273,393 | ||||||
| 1,113,000 | China Yongda Automobiles Services Holdings Ltd. (Retailing) | 1,585,855 | ||||||
| 13,107,652 | Chinese Universe Publishing and Media Group Co. Ltd. Class A (Media & Entertainment) | 22,682,430 | ||||||
|
| |||||||
| Common Stocks – (continued) | ||||||||
| China – (continued) | ||||||||
| 2,026,436 | Chongqing Changan Automobile Co. Ltd. Class A (Automobiles & Components)* | 5,014,730 | ||||||
| 2,308,500 | COSCO SHIPPING Holdings Co. Ltd. Class A (Transportation)* | 2,259,391 | ||||||
| 464,000 | COSCO SHIPPING Holdings Co. Ltd. Class H (Transportation)* | 296,907 | ||||||
| 48,000 | Far East Horizon Ltd. (Diversified Financials) | 47,344 | ||||||
| 4,267,215 | Focus Media Information Technology Co. Ltd. Class A (Media & Entertainment) | 5,967,888 | ||||||
| 136,141 | Foshan Haitian Flavouring & Food Co. Ltd. Class A (Food, Beverage & Tobacco) | 3,258,348 | ||||||
| 5,753,000 | Great Wall Motor Co. Ltd. Class H (Automobiles & Components) | 9,314,513 | ||||||
| 158,400 | Guangzhou Wondfo Biotech Co. Ltd. Class A (Health Care Equipment & Services) | 1,803,010 | ||||||
| 120,000 | Hisense Home Appliances Group Co. Ltd. Class H (Consumer Durables & Apparel) | 172,562 | ||||||
| 26,277,000 | Industrial & Commercial Bank of China Ltd. Class H (Banks) | 14,921,777 | ||||||
| 540,800 | JD.com, Inc. ADR (Retailing)* | 44,086,016 | ||||||
| 2,772,163 | Jiangsu Yuyue Medical Equipment & Supply Co. Ltd. Class A (Health Care Equipment & Services) | 12,798,527 | ||||||
| 563,500 | Liaoning Cheng Da Co. Ltd. Class A (Retailing) | 1,902,881 | ||||||
| 1,063,000 | Logan Group Co. Ltd. (Real Estate) | 1,667,830 | ||||||
| 1,078,800 | Meituan Class B (Retailing)* | 40,216,788 | ||||||
| 318,500 | NetEase, Inc. ADR (Media & Entertainment) | 27,642,615 | ||||||
| 117,600 | NIO, Inc. ADR (Automobiles & Components)* | 3,596,208 | ||||||
| 27,200 | Pinduoduo, Inc. ADR (Retailing)* | 2,447,456 | ||||||
| 1,977,000 | Powerlong Real Estate Holdings Ltd. (Real Estate) | 1,331,073 | ||||||
| 381,981 | SF Holding Co. Ltd. Class A (Transportation) | 4,731,526 | ||||||
| 259,511 | Shenzhen Mindray Bio-Medical Electronics Co. Ltd. Class A (Health Care Equipment & Services) | 15,022,049 | ||||||
| 3,832,500 | Sinotruk Hong Kong Ltd. (Capital Goods) | 9,802,973 | ||||||
| 3,439,000 | SITC International Holdings Co. Ltd. (Transportation) | 5,312,071 | ||||||
| 128,200 | Suofeiya Home Collection Co. Ltd. Class A (Consumer Durables & Apparel) | 541,204 | ||||||
| 600 | TAL Education Group ADR (Consumer Services)* | 39,876 | ||||||
|
| |||||||
| The accompanying notes are an integral part of these financial statements. | 21 |
GOLDMAN SACHS EMERGING MARKETS EQUITY INSIGHTS FUND
Schedule of Investments (continued)
October 31, 2020
| Shares | Description | Value | ||||||
| Common Stocks – (continued) | ||||||||
| China – (continued) | ||||||||
| 1,816,300 | Tencent Holdings Ltd. (Media & Entertainment) | $ | 138,775,589 | |||||
| 668,000 | Tianneng Power International Ltd. (Automobiles & Components)(b) | 1,088,282 | ||||||
| 1,363,300 | Vipshop Holdings Ltd. ADR (Retailing)* | 29,174,620 | ||||||
| 1,558,788 | Weichai Power Co. Ltd. Class A (Capital Goods) | 3,527,590 | ||||||
| 2,961,000 | Weichai Power Co. Ltd. Class H (Capital Goods) | 5,614,897 | ||||||
| 1,422,453 | Wuhu Sanqi Interactive Entertainment Network Technology Group Co. Ltd. Class A (Media & Entertainment) | 6,305,728 | ||||||
| 2,321,000 | Zhongsheng Group Holdings Ltd. (Retailing) | 16,549,297 | ||||||
| 17,412,000 | Zijin Mining Group Co. Ltd. Class H (Materials) | 12,693,576 | ||||||
|
| |||||||
| 702,399,552 | ||||||||
|
| |||||||
| Greece – 0.1% | ||||||||
| 21,083 | JUMBO SA (Retailing) | 295,506 | ||||||
| 52,070 | Terna Energy SA (Utilities) | 693,760 | ||||||
|
| |||||||
| 989,266 | ||||||||
|
| |||||||
| Hong Kong – 0.1% | ||||||||
| 2,023,000 | China High Speed Transmission Equipment Group Co. Ltd. (Capital Goods) | 1,500,451 | ||||||
|
| |||||||
| Hungary – 0.4% | ||||||||
| 113,713 | OTP Bank Nyrt. (Banks)* | 3,547,228 | ||||||
| 132,591 | Richter Gedeon Nyrt. (Pharmaceuticals, Biotechnology & Life Sciences) | 2,707,173 | ||||||
|
| |||||||
| 6,254,401 | ||||||||
|
| |||||||
| India – 9.5% | ||||||||
| 201,109 | Adani Ports & Special Economic Zone Ltd. (Transportation) | 975,508 | ||||||
| 5,893 | Atul Ltd. (Materials) | 477,510 | ||||||
| 610,694 | Aurobindo Pharma Ltd. (Pharmaceuticals, Biotechnology & Life Sciences) | 6,364,276 | ||||||
| 40,454 | Bajaj Holdings & Investment Ltd. (Diversified Financials) | 1,258,510 | ||||||
| 33,194 | Cipla Ltd. (Pharmaceuticals, Biotechnology & Life Sciences) | 337,752 | ||||||
| 274,590 | Divi’s Laboratories Ltd. (Pharmaceuticals, Biotechnology & Life Sciences) | 11,636,555 | ||||||
| 12,990 | Dr Lal PathLabs Ltd. (Health Care Equipment & Services)(c) | 402,357 | ||||||
| 164,810 | Dr Reddy’s Laboratories Ltd. ADR (Pharmaceuticals, Biotechnology & Life Sciences) | 10,681,336 | ||||||
|
| |||||||
| Common Stocks – (continued) | ||||||||
| India – (continued) | ||||||||
| 41,455 | Escorts Ltd. (Capital Goods) | 671,165 | ||||||
| 197,306 | FDC Ltd. (Pharmaceuticals, Biotechnology & Life Sciences) | 917,938 | ||||||
| 386,340 | Gujarat State Petronet Ltd. (Utilities) | 1,006,391 | ||||||
| 1,285,111 | HCL Technologies Ltd. (Software & Services) | 14,621,490 | ||||||
| 317,701 | Hero MotoCorp Ltd. (Automobiles & Components) | 11,986,095 | ||||||
| 220,286 | ICICI Lombard General Insurance Co. Ltd. (Insurance)*(c) | 3,671,592 | ||||||
| 476,360 | ICICI Securities Ltd. (Diversified Financials)(c) | 2,976,895 | ||||||
| 1,828,299 | Infosys Ltd. ADR (Software & Services) | 26,089,827 | ||||||
| 5,885 | Ipca Laboratories Ltd. (Pharmaceuticals, Biotechnology & Life Sciences) | 183,629 | ||||||
| 468,446 | Jindal Steel & Power Ltd. (Materials)* | 1,214,043 | ||||||
| 21,763 | Larsen & Toubro Infotech Ltd. (Software & Services)(c) | 858,728 | ||||||
| 142,186 | LIC Housing Finance Ltd. (Banks) | 542,402 | ||||||
| 1,000,208 | Manappuram Finance Ltd. (Diversified Financials) | 2,095,512 | ||||||
| 193,170 | Mindtree Ltd. (Software & Services) | 3,469,155 | ||||||
| 23,709 | Mphasis Ltd. (Software & Services) | 441,721 | ||||||
| 590,242 | Muthoot Finance Ltd. (Diversified Financials) | 9,799,675 | ||||||
| 6,445 | Pfizer Ltd. (Pharmaceuticals, Biotechnology & Life Sciences) | 433,371 | ||||||
| 6,521,335 | Power Finance Corp. Ltd. (Diversified Financials) | 7,661,275 | ||||||
| 6,235,167 | REC Ltd. (Diversified Financials) | 8,648,508 | ||||||
| 1,754 | Reliance Industries Ltd. (Energy) | 48,629 | ||||||
| 3,062 | Sanofi India Ltd. (Pharmaceuticals, Biotechnology & Life Sciences) | 330,452 | ||||||
| 78,306 | Sun TV Network Ltd. (Media & Entertainment) | 445,625 | ||||||
| 678,313 | Tata Consultancy Services Ltd. (Software & Services) | 24,446,721 | ||||||
| 169,621 | Tata Steel Ltd. (Materials) | 942,218 | ||||||
| 1,762,916 | Torrent Power Ltd. (Utilities) | 7,424,769 | ||||||
|
| |||||||
| 163,061,630 | ||||||||
|
| |||||||
| Indonesia – 2.9% | ||||||||
| 54,604,900 | Adaro Energy Tbk. PT (Energy) | 4,139,247 | ||||||
| 9,281,300 | Bank Central Asia Tbk. PT (Banks) | 18,262,404 | ||||||
| 11,924,100 | Bank Mandiri Persero Tbk. PT (Banks) | 4,644,805 | ||||||
| 63,789,900 | Bank Rakyat Indonesia Persero Tbk. PT (Banks) | 14,440,246 | ||||||
| 44,397,900 | Bukit Asam Tbk. PT (Energy) | 5,817,196 | ||||||
| 1,380,500 | United Tractors Tbk. PT (Energy) | 1,972,309 | ||||||
|
| |||||||
| 49,276,207 | ||||||||
|
| |||||||
| 22 | The accompanying notes are an integral part of these financial statements. |
GOLDMAN SACHS EMERGING MARKETS EQUITY INSIGHTS FUND
| Shares | Description | Value | ||||||
| Common Stocks – (continued) | ||||||||
| Mexico – 2.1% | ||||||||
| 1,035,813 | Bolsa Mexicana de Valores SAB de CV (Diversified Financials) | $ | 2,105,662 | |||||
| 931,164 | Gruma SAB de CV Class B (Food, Beverage & Tobacco) | 9,904,057 | ||||||
| 4,549,371 | Grupo Mexico SAB de CVSeries B (Materials) | 12,922,217 | ||||||
| 5,590,774 | Kimberly-Clark de Mexico SAB de CV Class A (Household & Personal Products) | 8,310,450 | ||||||
| 107,158 | Orbia Advance Corp. SAB de CV (Materials) | 189,496 | ||||||
| 798,258 | Qualitas Controladora SAB de CV (Insurance) | 3,187,914 | ||||||
|
| |||||||
| 36,619,796 | ||||||||
|
| |||||||
| Peru – 1.6% | ||||||||
| 514,700 | Southern Copper Corp. (Materials) | 26,939,398 | ||||||
|
| |||||||
| Philippines – 0.1% | ||||||||
| 724,490 | International Container Terminal Services, Inc. (Transportation) | 1,718,168 | ||||||
|
| |||||||
| Poland – 0.2% | ||||||||
| 206,341 | Asseco Poland SA (Software & Services) | 3,344,220 | ||||||
| 651 | CD Projekt SA (Media & Entertainment)* | 55,277 | ||||||
| 138,171 | Powszechny Zaklad Ubezpieczen SA (Insurance)* | 755,186 | ||||||
|
| |||||||
| 4,154,683 | ||||||||
|
| |||||||
| Qatar – 0.3% | ||||||||
| 123,750 | Commercial Bank PSQC (The) (Banks) | 145,032 | ||||||
| 2,227,201 | Masraf Al Rayan QSC (Banks) | 2,624,863 | ||||||
| 1,359,933 | Qatar Gas Transport Co. Ltd. (Energy) | 1,004,730 | ||||||
| 122,512 | Qatar Islamic Bank SAQ (Banks) | 545,619 | ||||||
| 251,429 | Qatar National Bank QPSC (Banks) | 1,220,722 | ||||||
|
| |||||||
| 5,540,966 | ||||||||
|
| |||||||
| Russia – 3.2% | ||||||||
| 184,853 | LUKOIL PJSC ADR (Energy) | 9,444,140 | ||||||
| 398,080 | MMC Norilsk Nickel PJSC ADR (Materials) | 9,454,400 | ||||||
| 2,227,300 | Moscow Exchange MICEX-RTS PJSC (Diversified Financials) | 3,761,761 | ||||||
| 40,469,000 | RusHydro PJSC (Utilities) | 368,431 | ||||||
| 12,116,410 | Sberbank of Russia PJSC (Banks) | 30,708,531 | ||||||
| 29,631 | Severstal PAO GDR (Materials) | 405,041 | ||||||
|
| |||||||
| 54,142,304 | ||||||||
|
| |||||||
| Saudi Arabia – 0.7% | ||||||||
| 20,371 | Abdullah Al Othaim Markets Co. (Food & Staples Retailing) | 708,087 | ||||||
|
| |||||||
| Common Stocks – (continued) | ||||||||
| Saudi Arabia – (continued) | ||||||||
| 95,665 | Advanced Petrochemical Co. (Materials) | 1,475,131 | ||||||
| 420,972 | Al Rajhi Bank (Banks) | 7,386,065 | ||||||
| 24,980 | Bupa Arabia for Cooperative Insurance Co. (Insurance)* | 760,350 | ||||||
| 19,087 | National Agriculture Development Co. (The) (Food, Beverage & Tobacco)* | 143,874 | ||||||
| 27,755 | Samba Financial Group (Banks) | 203,895 | ||||||
| 78,280 | Saudi Ceramic Co. (Capital Goods)* | 808,856 | ||||||
| 28,768 | Savola Group (The) (Food, Beverage & Tobacco) | 351,231 | ||||||
|
| |||||||
| 11,837,489 | ||||||||
|
| |||||||
| Singapore – 0.2% | ||||||||
| 3,842,000 | IGG, Inc. (Media & Entertainment) | 4,158,928 | ||||||
|
| |||||||
| South Africa – 2.1% | ||||||||
| 110,189 | African Rainbow Minerals Ltd. (Materials) | 1,549,883 | ||||||
| 239,668 | Anglo American Platinum Ltd. (Materials) | 15,869,610 | ||||||
| 58,637 | Naspers Ltd. Class N (Retailing)* | 11,447,559 | ||||||
| 32,514 | Remgro Ltd. (Diversified Financials) | 173,445 | ||||||
| 1,160,850 | Standard Bank Group Ltd. (Banks) | 7,590,672 | ||||||
|
| |||||||
| 36,631,169 | ||||||||
|
| |||||||
| South Korea – 14.1% | ||||||||
| 15,673 | Chong Kun Dang Pharmaceutical Corp. (Pharmaceuticals, Biotechnology & Life Sciences) | 2,118,887 | ||||||
| 12,503 | Chongkundang Holdings Corp. (Pharmaceuticals, Biotechnology & Life Sciences) | 1,076,668 | ||||||
| 11,408 | Coway Co. Ltd. (Consumer Durables & Apparel)* | 698,541 | ||||||
| 43,473 | COWELL FASHION Co. Ltd. (Consumer Durables & Apparel) | 222,366 | ||||||
| 160,055 | Daou Data Corp. (Diversified Financials) | 1,530,704 | ||||||
| 290,999 | DB HiTek Co. Ltd. (Semiconductors & Semiconductor Equipment) | 8,262,162 | ||||||
| 128,396 | DongKook Pharmaceutical Co. Ltd. (Pharmaceuticals, Biotechnology & Life Sciences) | 2,746,996 | ||||||
| 313,826 | Hana Financial Group, Inc. (Banks) | 8,477,219 | ||||||
| 28,436 | Hancom, Inc. (Software & Services)* | 432,170 | ||||||
| 38,931 | Hanjin Transportation Co. Ltd. (Transportation) | 1,625,164 | ||||||
| 46,668 | Hansol Chemical Co. Ltd. (Materials) | 5,822,147 | ||||||
| 28,758 | Huons Global Co. Ltd. (Pharmaceuticals, Biotechnology & Life Sciences) | 717,255 | ||||||
|
| |||||||
| The accompanying notes are an integral part of these financial statements. | 23 |
GOLDMAN SACHS EMERGING MARKETS EQUITY INSIGHTS FUND
Schedule of Investments (continued)
October 31, 2020
| Shares | Description | Value | ||||||
| Common Stocks – (continued) | ||||||||
| South Korea – (continued) | ||||||||
| 195,713 | KB Financial Group, Inc. (Banks) | $ | 7,000,616 | |||||
| 39,164 | Kginicis Co. Ltd. (Software & Services) | 654,539 | ||||||
| 27,397 | Kia Motors Corp. (Automobiles & Components) | 1,228,733 | ||||||
| 18,882 | KIWOOM Securities Co. Ltd. (Diversified Financials) | 1,727,240 | ||||||
| 35,475 | LabGenomics Co. Ltd. (Pharmaceuticals, Biotechnology & Life Sciences)* | 928,534 | ||||||
| 44,682 | LEENO Industrial, Inc. (Semiconductors & Semiconductor Equipment) | 4,806,146 | ||||||
| 57,769 | LG Chem Ltd. (Materials) | 31,500,355 | ||||||
| 3,214,268 | Mirae Asset Daewoo Co. Ltd. (Diversified Financials) | 23,947,598 | ||||||
| 435,126 | Mirae Asset Daewoo Co. Ltd. (Preference) (Diversified Financials)(a) | 1,742,908 | ||||||
| 113,072 | NAVER Corp. (Media & Entertainment) | 28,931,844 | ||||||
| 34,290 | Neowiz (Media & Entertainment)* | 636,617 | ||||||
| 19,035 | NICE Information Service Co. Ltd. (Commercial & Professional Services) | 327,747 | ||||||
| 68,731 | Posco International Corp. (Capital Goods) | 811,765 | ||||||
| 10,842 | Samsung Biologics Co. Ltd. (Pharmaceuticals, Biotechnology & Life Sciences)*(c) | 6,551,788 | ||||||
| 1,350,930 | Samsung Electronics Co. Ltd. (Technology Hardware & Equipment) | 67,905,345 | ||||||
| 232,051 | Samsung Electronics Co. Ltd. (Preference) (Technology Hardware & Equipment)(a) | 10,322,768 | ||||||
| 78,937 | Samsung Life Insurance Co. Ltd. (Insurance) | 4,418,276 | ||||||
| 12,805 | SK Chemicals Co. Ltd. (Materials) | 3,929,168 | ||||||
| 21,884 | SK Gas Ltd. (Energy) | 2,038,671 | ||||||
| 7,088 | SK Hynix, Inc. (Semiconductors & Semiconductor Equipment) | 502,843 | ||||||
| 92,800 | Suheung Co. Ltd. (Health Care Equipment & Services) | 4,029,951 | ||||||
| 2,920 | Tokai Carbon Korea Co. Ltd. (Semiconductors & Semiconductor Equipment) | 238,803 | ||||||
| 70,907 | Yuhan Corp. (Pharmaceuticals, Biotechnology & Life Sciences) | 3,731,491 | ||||||
|
| |||||||
| 241,644,025 | ||||||||
|
| |||||||
| Taiwan – 13.6% | ||||||||
| 126,000 | Alchip Technologies Ltd. (Semiconductors & Semiconductor Equipment) | 2,138,235 | ||||||
| 2,798,000 | Ardentec Corp. (Semiconductors & Semiconductor Equipment) | 3,274,975 | ||||||
|
| |||||||
| Common Stocks – (continued) | ||||||||
| Taiwan – (continued) | ||||||||
| 5,082,000 | Cheng Loong Corp. (Materials) | 6,038,024 | ||||||
| 1,671,000 | Chicony Power Technology Co. Ltd. (Capital Goods) | 3,908,435 | ||||||
| 667,000 | ChipMOS Technologies, Inc. (Semiconductors & Semiconductor Equipment) | 657,343 | ||||||
| 3,466,000 | CTBC Financial Holding Co. Ltd. (Banks) | 2,188,814 | ||||||
| 209,000 | Delta Electronics, Inc. (Technology Hardware & Equipment) | 1,390,565 | ||||||
| 616,000 | Dynapack International Technology Corp. (Technology Hardware & Equipment) | 1,719,555 | ||||||
| 68,000 | Elan Microelectronics Corp. (Semiconductors & Semiconductor Equipment) | 321,214 | ||||||
| 1,773,000 | Everlight Electronics Co. Ltd. (Semiconductors & Semiconductor Equipment) | 2,354,183 | ||||||
| 225,000 | Fubon Financial Holding Co. Ltd. (Insurance) | 320,525 | ||||||
| 69,000 | Giant Manufacturing Co. Ltd. (Consumer Durables & Apparel) | 681,642 | ||||||
| 2,605,000 | Gigabyte Technology Co. Ltd. (Technology Hardware & Equipment) | 6,554,734 | ||||||
| 145,000 | Global Mixed Mode Technology, Inc. (Semiconductors & Semiconductor Equipment) | 757,125 | ||||||
| 413,000 | Ho Tung Chemical Corp. (Materials)* | 152,557 | ||||||
| 13,000 | Hotai Motor Co. Ltd. (Retailing) | 273,994 | ||||||
| 329,000 | International Games System Co. Ltd. (Media & Entertainment) | 8,657,580 | ||||||
| 160,000 | momo.com, Inc. (Retailing) | 3,829,025 | ||||||
| 194,000 | Pan Jit International, Inc. (Semiconductors & Semiconductor Equipment) | 244,913 | ||||||
| 6,000 | Parade Technologies Ltd. (Semiconductors & Semiconductor Equipment) | 229,283 | ||||||
| 1,540,000 | Quanta Computer, Inc. (Technology Hardware & Equipment) | 3,885,824 | ||||||
| 529,000 | Sanyang Motor Co. Ltd. (Automobiles & Components) | 417,121 | ||||||
| 873,000 | Simplo Technology Co. Ltd. (Technology Hardware & Equipment) | 9,737,762 | ||||||
| 275,000 | Soft-World International Corp. (Media & Entertainment) | 782,639 | ||||||
| 514,000 | Sonix Technology Co. Ltd. (Semiconductors & Semiconductor Equipment) | 1,199,869 | ||||||
| 4,707,000 | Synnex Technology International Corp. (Technology Hardware & Equipment) | 6,995,508 | ||||||
|
| |||||||
| 24 | The accompanying notes are an integral part of these financial statements. |
GOLDMAN SACHS EMERGING MARKETS EQUITY INSIGHTS FUND
| Shares | Description | Value | ||||||
| Common Stocks – (continued) | ||||||||
| Taiwan – (continued) | ||||||||
| 374,000 | Systex Corp. (Software & Services) | $ | 1,060,698 | |||||
| 179,000 | TaiDoc Technology Corp. (Health Care Equipment & Services) | 1,449,352 | ||||||
| 1,342,200 | Taiwan Semiconductor Manufacturing Co. Ltd. ADR (Semiconductors & Semiconductor Equipment) | 112,570,314 | ||||||
| 6,572,000 | Teco Electric and Machinery Co. Ltd. (Capital Goods) | 6,873,398 | ||||||
| 982,000 | Topco Scientific Co. Ltd. (Semiconductors & Semiconductor Equipment) | 3,937,079 | ||||||
| 6,414,000 | Tung Ho Steel Enterprise Corp. (Materials) | 6,782,082 | ||||||
| 19,210,000 | United Microelectronics Corp. (Semiconductors & Semiconductor Equipment) | 20,645,961 | ||||||
| 259,000 | Vanguard International Semiconductor Corp. (Semiconductors & Semiconductor Equipment) | 846,165 | ||||||
| 2,449,000 | Walsin Lihwa Corp. (Capital Goods) | 1,521,803 | ||||||
| 3,682,000 | Youngtek Electronics Corp. (Semiconductors & Semiconductor Equipment) | 6,766,113 | ||||||
| 1,123,000 | YungShin Global Holding Corp. (Pharmaceuticals, Biotechnology & Life Sciences) | 1,685,324 | ||||||
|
| |||||||
| 232,849,733 | ||||||||
|
| |||||||
| Thailand – 1.8% | ||||||||
| 11,849,700 | Charoen Pokphand Foods PCL (Food, Beverage & Tobacco) | 9,591,993 | ||||||
| 5,673,000 | Com7 PCL Class F (Retailing) | 7,432,000 | ||||||
| 69,500 | Polyplex Thailand PCL (Materials) | 53,696 | ||||||
| 912,100 | RS PCL (Media & Entertainment) | 538,103 | ||||||
| 237,500 | Siam Cement PCL (The) (Registered) (Materials) | 2,573,476 | ||||||
| 278,200 | Siam Commercial Bank PCL (The) (Banks) | 579,249 | ||||||
| 107,900 | Siam Global House PCL (Retailing) | 54,974 | ||||||
| 269,800 | SPCG PCL (Utilities) | 171,387 | ||||||
| 6,299,800 | Sri Trang Agro-Industry PCL (Automobiles & Components)* | 7,219,811 | ||||||
| 3,389,100 | Thanachart Capital PCL (Banks) | 2,988,409 | ||||||
|
| |||||||
| 31,203,098 | ||||||||
|
| |||||||
| Turkey – 0.9% | ||||||||
| 1,678,844 | BIM Birlesik Magazalar A/S (Food & Staples Retailing) | 13,273,727 | ||||||
| 127,086 | Enka Insaat ve Sanayi A/S (Capital Goods) | 109,759 | ||||||
| 63,217 | Ford Otomotiv Sanayi A/S (Automobiles & Components) | 817,867 | ||||||
|
| |||||||
| Common Stocks – (continued) | ||||||||
| Turkey – (continued) | ||||||||
| 310,097 | Haci Omer Sabanci Holding A/S (Diversified Financials) | 305,103 | ||||||
| 76,133 | Turk Traktor ve Ziraat Makineleri A/S (Capital Goods) | 1,030,188 | ||||||
|
| |||||||
| 15,536,644 | ||||||||
|
| |||||||
| United Arab Emirates – 0.1% | ||||||||
| 457,936 | Emirates NBD Bank PJSC (Banks) | 1,173,743 | ||||||
|
| |||||||
| | TOTAL INVESTMENTS BEFORE SECURITIES LENDING REINVESTMENT VEHICLE | | ||||||
| (Cost $1,329,211,212) | $ | 1,690,312,520 | ||||||
|
| |||||||
| Shares | Dividend Rate | Value | ||||||
| Securities Lending Reinvestment Vehicle(d) – 0.0% | ||||||||
| | Goldman Sachs Financial Square Government Fund – | | ||||||
| 500,400 | 0.028% | $ | 500,400 | |||||
| (Cost $500,400) | ||||||||
|
| |||||||
| TOTAL INVESTMENTS – 98.5% | ||||||||
| (Cost $1,329,711,612) | $ | 1,690,812,920 | ||||||
|
| |||||||
| | OTHER ASSETS IN EXCESS OF LIABILITIES – 1.5% | 25,321,001 | ||||||
|
| |||||||
| NET ASSETS – 100.0% | $ | 1,716,133,921 | ||||||
|
| |||||||
| The percentage shown for each investment category reflects the value of investments in that category as a percentage of net assets. | ||
* | Security is currently in default and/or non-income producing. | |
(a) | Preference Shares are a special type of equity investment that shares in the earnings of the company, has limited voting rights, and receives a greater dividend than applicable Common Shares. | |
(b) | All or a portion of security is on loan. | |
(c) | Exempt from registration under Rule 144A of the Securities Act of 1933. | |
(d) | Represents an Affiliated Issuer. | |
| ||
Investment Abbreviations: | ||
ADR | —American Depositary Receipt | |
GDR | —Global Depositary Receipt | |
| ||
| The accompanying notes are an integral part of these financial statements. | 25 |
GOLDMAN SACHS EMERGING MARKETS EQUITY INSIGHTS FUND
Schedule of Investments (continued)
October 31, 2020
| ADDITIONAL INVESTMENT INFORMATION |
FUTURES CONTRACTS — At October 31, 2020, the Fund had the following futures contracts:
| Description | Number of Contracts | Expiration Date | Notional Amount | Unrealized Appreciation/ (Depreciation) | ||||||||||||
Long position contracts: | ||||||||||||||||
MSCI Emerging Markets E-Mini Index | 159 | 12/18/2020 | $ | 8,760,105 | $ | 32,269 | ||||||||||
| 26 | The accompanying notes are an integral part of these financial statements. |
GOLDMAN SACHS INTERNATIONAL EQUITY INSIGHTS FUND
Schedule of Investments
October 31, 2020
| Shares | Description | Value | ||||||
| Common Stocks – 98.6% | ||||||||
| Australia – 7.6% | ||||||||
| 1,358,446 | Adairs Ltd. (Retailing) | $ | 3,627,612 | |||||
| 53,157 | Ansell Ltd. (Health Care Equipment & Services) | 1,503,125 | ||||||
| 15,003 | ASX Ltd. (Diversified Financials) | 840,087 | ||||||
| 2,262,663 | Brambles Ltd. (Commercial & Professional Services) | 15,260,122 | ||||||
| 49,182 | Breville Group Ltd. (Consumer Durables & Apparel) | 911,211 | ||||||
| 16,926 | Commonwealth Bank of Australia (Banks) | 821,783 | ||||||
| 1,501,784 | Fortescue Metals Group Ltd. (Materials) | 18,372,058 | ||||||
| 66,081 | Genworth Mortgage Insurance Australia Ltd. (Banks) | 79,285 | ||||||
| 1,341,726 | Goodman Group (REIT) | 17,366,164 | ||||||
| 386,226 | JB Hi-Fi Ltd. (Retailing) | 12,905,921 | ||||||
| 211,652 | Mineral Resources Ltd. (Materials) | 3,716,568 | ||||||
| 78,381 | Premier Investments Ltd. (Retailing) | 1,175,566 | ||||||
| 21,487 | Pro Medicus Ltd. (Health Care Equipment & Services) | 490,460 | ||||||
| 18,791 | REA Group Ltd. (Media & Entertainment) | 1,562,697 | ||||||
| 269,785 | Rio Tinto Ltd. (Materials) | 17,550,559 | ||||||
| 464,825 | Rio Tinto plc ADR (Materials)(a) | 26,388,115 | ||||||
| 2,540,327 | Santos Ltd. (Energy) | 8,445,029 | ||||||
| 672,548 | Sonic Healthcare Ltd. (Health Care Equipment & Services) | 16,472,744 | ||||||
| 664,696 | Wesfarmers Ltd. (Retailing) | 21,515,963 | ||||||
|
| |||||||
| 169,005,069 | ||||||||
|
| |||||||
| Belgium – 0.6% | ||||||||
| 168,323 | bpost SA (Transportation) | 1,491,576 | ||||||
| 9,435 | D’ieteren SA/NV (Retailing) | 472,693 | ||||||
| 232,123 | KBC Group NV (Banks) | 11,468,457 | ||||||
|
| |||||||
| 13,432,726 | ||||||||
|
| |||||||
| Cambodia – 0.1% | ||||||||
| 1,370,000 | NagaCorp Ltd. (Consumer Services) | 1,417,055 | ||||||
|
| |||||||
| China – 0.8% | ||||||||
| 950,000 | Alibaba Health Information Technology Ltd. (Health Care Equipment & Services)* | 2,491,310 | ||||||
| 2,593,000 | Chow Tai Fook Jewellery Group Ltd. (Retailing) | 3,313,987 | ||||||
| 370,700 | ENN Energy Holdings Ltd. (Utilities) | 4,691,619 | ||||||
| 264,000 | SITC International Holdings Co. Ltd. (Transportation) | 407,789 | ||||||
| 3,762,000 | Tingyi Cayman Islands Holding Corp. (Food, Beverage & Tobacco) | 6,884,165 | ||||||
|
| |||||||
| 17,788,870 | ||||||||
|
| |||||||
| Denmark – 2.3% | ||||||||
| 168 | AP Moller – Maersk A/S Class B (Transportation) | 269,243 | ||||||
|
| |||||||
| Common Stocks – (continued) | ||||||||
| Denmark – (continued) | ||||||||
| 117,751 | DSV PANALPINA A/S (Transportation) | 19,104,098 | ||||||
| 455,080 | Novo Nordisk A/S Class B (Pharmaceuticals, Biotechnology & Life Sciences) | 29,018,476 | ||||||
| 43,801 | Pandora A/S (Consumer Durables & Apparel) | 3,474,710 | ||||||
|
| |||||||
| 51,866,527 | ||||||||
|
| |||||||
| Finland – 0.8% | ||||||||
| 538,400 | Kesko OYJ Class B (Food & Staples Retailing) | 13,815,660 | ||||||
| 186,089 | Valmet OYJ (Capital Goods) | 4,441,374 | ||||||
|
| |||||||
| 18,257,034 | ||||||||
|
| |||||||
| France – 7.0% | ||||||||
| 5,765 | Albioma SA (Utilities) | 268,773 | ||||||
| 44,515 | Arkema SA (Materials) | 4,359,791 | ||||||
| 587,253 | BNP Paribas SA (Banks)* | 20,480,320 | ||||||
| 71,170 | Capgemini SE (Software & Services) | 8,217,849 | ||||||
| 99,002 | Cie de Saint-Gobain (Capital Goods)* | 3,856,477 | ||||||
| 22,006 | Cie Generale des Etablissements Michelin SCA (Automobiles & Components) | 2,376,671 | ||||||
| 95,782 | Gecina SA (REIT) | 11,890,671 | ||||||
| 189,863 | Legrand SA (Capital Goods) | 14,053,531 | ||||||
| 9,776 | Nexans SA (Capital Goods)* | 474,747 | ||||||
| 960,173 | Rexel SA (Capital Goods)* | 10,109,340 | ||||||
| 165,344 | Sanofi (Pharmaceuticals, Biotechnology & Life Sciences) | 14,929,471 | ||||||
| 38,032 | Sartorius Stedim Biotech (Pharmaceuticals, Biotechnology & Life Sciences) | 14,422,116 | ||||||
| 260,241 | Schneider Electric SE (Capital Goods) | 31,620,977 | ||||||
| 59,424 | Teleperformance (Commercial & Professional Services) | 17,838,081 | ||||||
| 5,284 | Trigano SA (Automobiles & Components) | 702,173 | ||||||
|
| |||||||
| 155,600,988 | ||||||||
|
| |||||||
| Germany – 8.3% | ||||||||
| 133,466 | Allianz SE (Registered) (Insurance) | 23,510,652 | ||||||
| 69,992 | Aurubis AG (Materials) | 4,477,633 | ||||||
| 17,660 | Bechtle AG (Software & Services) | 3,032,518 | ||||||
| 23,073 | Daimler AG (Registered) (Automobiles & Components) | 1,192,609 | ||||||
| 19,181 | Deutsche Boerse AG (Diversified Financials) | 2,826,389 | ||||||
| 583,063 | Deutsche Post AG (Registered) (Transportation) | 25,851,836 | ||||||
| 366,040 | Deutsche Telekom AG (Registered) (Telecommunication Services) | 5,563,349 | ||||||
| 285,284 | Deutsche Wohnen SE (Real Estate) | 14,399,125 | ||||||
| 83,098 | Fresenius Medical Care AG & Co. KGaA (Health Care Equipment & Services) | 6,345,543 | ||||||
|
| |||||||
| The accompanying notes are an integral part of these financial statements. | 27 |
GOLDMAN SACHS INTERNATIONAL EQUITY INSIGHTS FUND
Schedule of Investments (continued)
October 31, 2020
| Shares | Description | Value | ||||||
| Common Stocks – (continued) | ||||||||
| Germany – (continued) | ||||||||
| 165,699 | Fresenius SE & Co. KGaA (Health Care Equipment & Services) | $ | 6,146,346 | |||||
| 53,640 | Gerresheimer AG (Pharmaceuticals, Biotechnology & Life Sciences) | 5,392,130 | ||||||
| 77,869 | Henkel AG & Co. KGaA (Preference) (Household & Personal Products)(b) | 7,577,477 | ||||||
| 143,575 | Porsche Automobil Holding SE (Preference) (Automobiles & Components)(b) | 7,691,651 | ||||||
| 77,501 | SAP SE (Software & Services) | 8,268,167 | ||||||
| 187,403 | Scout24 AG (Media & Entertainment)(c) | 15,118,858 | ||||||
| 130,536 | Siemens AG (Registered) (Capital Goods) | 15,313,972 | ||||||
| 82,092 | Siemens Energy AG (Capital Goods)* | 1,797,439 | ||||||
| 29,646 | Siemens Healthineers AG (Health Care Equipment & Services)(c) | 1,272,667 | ||||||
| 75,677 | Siltronic AG (Semiconductors & Semiconductor Equipment) | 7,161,720 | ||||||
| 141,709 | Software AG (Software & Services) | 5,076,673 | ||||||
| 114,300 | Volkswagen AG (Preference) (Automobiles & Components)(b) | 16,649,412 | ||||||
| 1,758 | zooplus AG (Retailing)* | 282,549 | ||||||
|
| |||||||
| 184,948,715 | ||||||||
|
| |||||||
| Hong Kong – 1.9% | ||||||||
| 54,400 | AIA Group Ltd. (Insurance) | 517,734 | ||||||
| 378,500 | CLP Holdings Ltd. (Utilities) | 3,487,708 | ||||||
| 321,200 | Hong Kong Exchanges & Clearing Ltd. (Diversified Financials) | 15,391,492 | ||||||
| 1,509,600 | Man Wah Holdings Ltd. (Consumer Durables & Apparel) | 2,106,855 | ||||||
| 1,284,500 | Sun Hung Kai Properties Ltd. (Real Estate) | 16,533,853 | ||||||
| 318,500 | Techtronic Industries Co. Ltd. (Capital Goods) | 4,289,985 | ||||||
|
| |||||||
| 42,327,627 | ||||||||
|
| |||||||
| Ireland – 0.4% | ||||||||
| 34,043 | Flutter Entertainment plc (Consumer Services) | 5,897,981 | ||||||
| 57,682 | Smurfit Kappa Group plc (Materials) | 2,173,407 | ||||||
|
| |||||||
| 8,071,388 | ||||||||
|
| |||||||
| Israel – 0.2% | ||||||||
| 256,249 | Plus500 Ltd. (Diversified Financials) | 4,910,937 | ||||||
|
| |||||||
| Italy – 3.0% | ||||||||
| 351,374 | Azimut Holding SpA (Diversified Financials) | 5,922,857 | ||||||
| 273,027 | Buzzi Unicem SpA (Materials) | 5,907,701 | ||||||
| 16,693 | De’ Longhi SpA (Consumer Durables & Apparel)* | 533,871 | ||||||
|
| |||||||
| Common Stocks – (continued) | ||||||||
| Italy – (continued) | ||||||||
| 1,776,125 | Enel SpA (Utilities) | 14,121,091 | ||||||
| 43,044 | Ferrari NV (Automobiles & Components) | 7,678,701 | ||||||
| 12,067,798 | Intesa Sanpaolo SpA (Banks)* | 20,033,811 | ||||||
| 440,128 | Prysmian SpA (Capital Goods) | 11,976,945 | ||||||
|
| |||||||
| 66,174,977 | ||||||||
|
| |||||||
| Japan – 28.1% | ||||||||
| 187,700 | AGC, Inc. (Capital Goods) | 5,861,113 | ||||||
| 17,800 | Aisin Seiki Co. Ltd. (Automobiles & Components) | 539,306 | ||||||
| 84,700 | Alps Alpine Co. Ltd. (Technology Hardware & Equipment) | 1,221,996 | ||||||
| 21,800 | ASKUL Corp. (Retailing) | 837,258 | ||||||
| 947,600 | Astellas Pharma, Inc. (Pharmaceuticals, Biotechnology & Life Sciences) | 12,994,383 | ||||||
| 400,200 | Benesse Holdings, Inc. (Consumer Services) | 9,435,039 | ||||||
| 53,500 | Bridgestone Corp. (Automobiles & Components) | 1,743,833 | ||||||
| 103,200 | Chubu Electric Power Co., Inc. (Utilities) | 1,156,027 | ||||||
| 527,100 | Dai Nippon Printing Co. Ltd. (Commercial & Professional Services) | 9,819,571 | ||||||
| 398,900 | Dai-ichi Life Holdings, Inc. (Insurance) | 5,957,742 | ||||||
| 39,500 | DCM Holdings Co. Ltd. (Retailing) | 489,432 | ||||||
| 1,000,400 | DeNA Co. Ltd. (Media & Entertainment) | 17,068,930 | ||||||
| 352,500 | Dentsu Group, Inc. (Media & Entertainment) | 10,161,877 | ||||||
| 9,200 | Dowa Holdings Co. Ltd. (Materials) | 263,294 | ||||||
| 37,100 | Ebara Corp. (Capital Goods) | 1,031,249 | ||||||
| 68,100 | EDION Corp. (Retailing) | 670,770 | ||||||
| 32,900 | Eiken Chemical Co. Ltd. (Health Care Equipment & Services) | 629,418 | ||||||
| 48,500 | FANUC Corp. (Capital Goods) | 10,244,405 | ||||||
| 190,500 | Fujitsu Ltd. (Software & Services) | 22,538,938 | ||||||
| 56,600 | Gumi, Inc. (Media & Entertainment) | 461,249 | ||||||
| 25,600 | H.U. Group Holdings, Inc. (Health Care Equipment & Services) | 651,323 | ||||||
| 23,500 | Hikari Tsushin, Inc. (Retailing) | 5,511,801 | ||||||
| 31,700 | Hitachi Metals Ltd. (Materials) | 420,382 | ||||||
| 889,900 | Honda Motor Co. Ltd. (Automobiles & Components) | 21,048,756 | ||||||
| 28,900 | Hoya Corp. (Health Care Equipment & Services) | 3,261,566 | ||||||
| 164,900 | Ibiden Co. Ltd. (Technology Hardware & Equipment) | 6,723,550 | ||||||
| 89,000 | Inpex Corp. (Energy) | 422,074 | ||||||
| 27,300 | Izumi Co. Ltd. (Retailing) | 925,846 | ||||||
|
| |||||||
| 28 | The accompanying notes are an integral part of these financial statements. |
GOLDMAN SACHS INTERNATIONAL EQUITY INSIGHTS FUND
| Shares | Description | Value | ||||||
| Common Stocks – (continued) | ||||||||
| Japan – (continued) | ||||||||
| 1,880 | Japan Retail Fund Investment Corp. (REIT) | $ | 2,709,847 | |||||
| 735,200 | Japan Tobacco, Inc. (Food, Beverage & Tobacco) | 13,841,740 | ||||||
| 215,500 | Kansai Electric Power Co., Inc. (The) (Utilities) | 1,961,132 | ||||||
| 61,400 | KDDI Corp. (Telecommunication Services) | 1,661,176 | ||||||
| 29,600 | Kohnan Shoji Co. Ltd. (Retailing) | 1,010,721 | ||||||
| 492,300 | Konami Holdings Corp. (Media & Entertainment) | 19,267,786 | ||||||
| 743,000 | K’s Holdings Corp. (Retailing) | 9,488,751 | ||||||
| 339,700 | M3, Inc. (Health Care Equipment & Services) | 22,941,887 | ||||||
| 1,010,900 | Marubeni Corp. (Capital Goods) | 5,278,121 | ||||||
| 26,800 | McDonald’s Holdings Co. Japan Ltd. (Consumer Services) | 1,270,893 | ||||||
| 1,199,000 | Mitsubishi Chemical Holdings Corp. (Materials) | 6,748,162 | ||||||
| 1,420,000 | Mitsubishi Electric Corp. (Capital Goods) | 18,288,017 | ||||||
| 147,000 | Mitsubishi Materials Corp. (Materials) | 2,697,340 | ||||||
| 526,200 | Mitsubishi UFJ Financial Group, Inc. (Banks) | 2,074,230 | ||||||
| 345,800 | NEC Corp. (Software & Services) | 17,418,013 | ||||||
| 489,200 | Nexon Co. Ltd. (Media & Entertainment) | 13,634,450 | ||||||
| 28,500 | Nihon M&A Center, Inc. (Commercial & Professional Services) | 1,673,565 | ||||||
| 506,600 | Nippon Telegraph & Telephone Corp. (Telecommunication Services) | 10,656,760 | ||||||
| 60,200 | Nitori Holdings Co. Ltd. (Retailing) | 12,374,512 | ||||||
| 238,400 | Nitto Denko Corp. (Materials) | 16,748,981 | ||||||
| 239,900 | Nomura Research Institute Ltd. (Software & Services) | 7,071,653 | ||||||
| 199,000 | Omron Corp. (Technology Hardware & Equipment) | 14,369,002 | ||||||
| 1,557,200 | ORIX Corp. (Diversified Financials) | 18,211,823 | ||||||
| 236,100 | Pan Pacific International Holdings Corp. (Retailing) | 5,009,674 | ||||||
| 13,300 | PeptiDream, Inc. (Pharmaceuticals, Biotechnology & Life Sciences)* | 614,634 | ||||||
| 181,500 | Rohm Co. Ltd. (Semiconductors & Semiconductor Equipment) | 13,954,977 | ||||||
| 32,200 | Rohto Pharmaceutical Co. Ltd. (Household & Personal Products) | 1,006,668 | ||||||
| 121,000 | Sankyo Co. Ltd. (Consumer Durables & Apparel) | 3,083,952 | ||||||
| 34,500 | Sawai Pharmaceutical Co. Ltd. (Pharmaceuticals, Biotechnology & Life Sciences) | 1,662,887 | ||||||
| 1,474,800 | Sega Sammy Holdings, Inc. (Consumer Durables & Apparel) | 18,481,574 | ||||||
|
| |||||||
| Common Stocks – (continued) | ||||||||
| Japan – (continued) | ||||||||
| 26,400 | Seino Holdings Co. Ltd. (Transportation) | 341,150 | ||||||
| 508,100 | Sekisui House Ltd. (Consumer Durables & Apparel) | 8,441,224 | ||||||
| 230,900 | Seven & i Holdings Co. Ltd. (Food & Staples Retailing) | 7,018,132 | ||||||
| 22,700 | Shinko Electric Industries Co. Ltd. (Semiconductors & Semiconductor Equipment) | 396,021 | ||||||
| 119,900 | Shionogi & Co. Ltd. (Pharmaceuticals, Biotechnology & Life Sciences) | 5,655,677 | ||||||
| 11,700 | Ship Healthcare Holdings, Inc. (Health Care Equipment & Services) | 555,193 | ||||||
| 178,800 | SoftBank Group Corp. (Telecommunication Services) | 11,645,925 | ||||||
| 27,500 | Square Enix Holdings Co. Ltd. (Media & Entertainment) | 1,597,827 | ||||||
| 855,800 | Subaru Corp. (Automobiles & Components) | 15,706,483 | ||||||
| 269,000 | Sumitomo Corp. (Capital Goods) | 2,943,015 | ||||||
| 62,600 | Sumitomo Dainippon Pharma Co. Ltd. (Pharmaceuticals, Biotechnology & Life Sciences) | 733,736 | ||||||
| 93,500 | Sumitomo Electric Industries Ltd. (Automobiles & Components) | 1,032,247 | ||||||
| 19,900 | Sumitomo Mitsui Financial Group, Inc. (Banks) | 550,870 | ||||||
| 32,300 | Sumitomo Mitsui Trust Holdings, Inc. (Banks) | 868,464 | ||||||
| 544,700 | T&D Holdings, Inc. (Insurance) | 5,443,776 | ||||||
| 698,500 | Takeda Pharmaceutical Co. Ltd. (Pharmaceuticals, Biotechnology & Life Sciences) | 21,585,475 | ||||||
| 383,200 | Teijin Ltd. (Materials) | 5,869,843 | ||||||
| 656,500 | TIS, Inc. (Software & Services) | 12,555,656 | ||||||
| 63,900 | Tokyo Electron Ltd. (Semiconductors & Semiconductor Equipment) | 17,151,455 | ||||||
| 731,400 | Toppan Printing Co. Ltd. (Commercial & Professional Services) | 9,300,778 | ||||||
| 36,300 | Toyo Seikan Group Holdings Ltd. (Materials) | 339,130 | ||||||
| 583,900 | Toyota Motor Corp. (Automobiles & Components) | 38,331,229 | ||||||
| 15,700 | Ulvac, Inc. (Semiconductors & Semiconductor Equipment) | 575,082 | ||||||
| 3,143,600 | Yamada Holdings Co. Ltd. (Retailing) | 15,327,553 | ||||||
| 20,700 | Yamaha Motor Co. Ltd. (Automobiles & Components) | 295,969 | ||||||
| 170,400 | Yamato Holdings Co. Ltd. (Transportation) | 4,510,567 | ||||||
| 2,888,500 | Z Holdings Corp. (Media & Entertainment) | 20,141,684 | ||||||
|
| |||||||
| 626,218,217 | ||||||||
|
| |||||||
| The accompanying notes are an integral part of these financial statements. | 29 |
GOLDMAN SACHS INTERNATIONAL EQUITY INSIGHTS FUND
Schedule of Investments (continued)
October 31, 2020
| Shares | Description | Value | ||||||
| Common Stocks – (continued) | ||||||||
| Luxembourg – 0.8% | ||||||||
| 54,257 | Aperam SA (Materials) | $ | 1,456,077 | |||||
| 21,223 | Eurofins Scientific SE (Pharmaceuticals, Biotechnology & Life Sciences)* | 16,900,311 | ||||||
|
| |||||||
| 18,356,388 | ||||||||
|
| |||||||
| Netherlands – 5.7% | ||||||||
| 16,819 | Akzo Nobel NV (Materials) | 1,617,791 | ||||||
| 122,484 | ASM International NV (Semiconductors & Semiconductor Equipment) | 17,494,504 | ||||||
| 81,297 | ASML Holding NV (Semiconductors & Semiconductor Equipment) | 29,413,508 | ||||||
| 161,260 | BE Semiconductor Industries NV (Semiconductors & Semiconductor Equipment) | 6,497,765 | ||||||
| 48,376 | Flow Traders (Diversified Financials)(c) | 1,585,655 | ||||||
| 800,840 | Koninklijke Ahold Delhaize NV (Food & Staples Retailing) | 21,955,649 | ||||||
| 645,412 | PostNL NV (Transportation)* | 2,140,655 | ||||||
| 190,760 | Randstad NV (Commercial & Professional Services)* | 9,518,263 | ||||||
| 484,238 | Signify NV (Capital Goods)*(c) | 17,188,194 | ||||||
| 234,277 | Wolters Kluwer NV (Commercial & Professional Services) | 18,968,625 | ||||||
|
| |||||||
| 126,380,609 | ||||||||
|
| |||||||
| New Zealand – 0.7% | ||||||||
| 34,366 | a2 Milk Co. Ltd. (The) (Food, Beverage & Tobacco)* | 332,772 | ||||||
| 164,792 | Fisher & Paykel Healthcare Corp. Ltd. (Health Care Equipment & Services) | 3,812,362 | ||||||
| 140,943 | Meridian Energy Ltd. (Utilities) | 493,981 | ||||||
| 136,874 | Xero Ltd. (Software & Services)* | 10,618,477 | ||||||
|
| |||||||
| 15,257,592 | ||||||||
|
| |||||||
| Norway – 1.5% | ||||||||
| 594,657 | DNB ASA (Banks) | 8,030,717 | ||||||
| 1,843,862 | Norsk Hydro ASA (Materials)* | 5,181,929 | ||||||
| 1,639,623 | Orkla ASA (Food, Beverage & Tobacco) | 15,477,733 | ||||||
| 109,703 | Salmar ASA (Food, Beverage & Tobacco)* | 5,570,766 | ||||||
|
| |||||||
| 34,261,145 | ||||||||
|
| |||||||
| Portugal – 0.0% | ||||||||
| 202,764 | EDP – Energias de Portugal SA (Utilities) | 1,000,168 | ||||||
|
| |||||||
| Singapore – 0.8% | ||||||||
| 1,125,700 | DBS Group Holdings Ltd. (Banks) | 16,768,268 | ||||||
| 254,000 | Singapore Exchange Ltd. (Diversified Financials) | 1,610,958 | ||||||
|
| |||||||
| 18,379,226 | ||||||||
|
| |||||||
| Common Stocks – (continued) | ||||||||
| South Africa – 0.7% | ||||||||
| 715,715 | Anglo American plc (Materials) | 16,792,959 | ||||||
|
| |||||||
| Spain – 1.2% | ||||||||
| 73,026 | Acerinox SA (Materials)* | 579,701 | ||||||
| 383,657 | ACS Actividades de Construccion y Servicios SA (Capital Goods) | 9,119,803 | ||||||
| 1,207,787 | Banco Santander SA (Banks) | 2,418,663 | ||||||
| 152,514 | Cellnex Telecom SA (Telecommunication Services)(c) | 9,790,019 | ||||||
| 49,233 | Grifols SA (Pharmaceuticals, Biotechnology & Life Sciences) | 1,330,482 | ||||||
| 140,298 | Siemens Gamesa Renewable Energy SA (Capital Goods) | 3,981,559 | ||||||
|
| |||||||
| 27,220,227 | ||||||||
|
| |||||||
| Sweden – 3.0% | ||||||||
| 109,099 | Betsson AB (Consumer Services)* | 831,281 | ||||||
| 548,567 | Boliden AB (Materials) | 14,958,935 | ||||||
| 530,806 | Essity AB Class B (Household & Personal Products)(d) | 15,363,286 | ||||||
| 86,399 | Evolution Gaming Group AB (Consumer Services)(c) | 6,408,236 | ||||||
| 318,717 | Husqvarna AB Class B (Consumer Durables & Apparel) | 3,286,484 | ||||||
| 33,235 | Investor AB Class A (Diversified Financials) | 1,987,305 | ||||||
| 360,227 | Investor AB Class B (Diversified Financials) | 21,591,635 | ||||||
| 178,022 | Nobia AB (Consumer Durables & Apparel)* | 1,073,012 | ||||||
| 105,109 | Volvo AB Class B (Capital Goods)* | 2,043,024 | ||||||
|
| |||||||
| 67,543,198 | ||||||||
|
| |||||||
| Switzerland – 14.3% | ||||||||
| 299,168 | Adecco Group AG (Registered) (Commercial & Professional Services) | 14,669,391 | ||||||
| 10,383 | Bachem Holding AG (Registered) Class B (Pharmaceuticals, Biotechnology & Life Sciences) | 4,197,323 | ||||||
| 90 | Chocoladefabriken Lindt & Spruengli AG (Food, Beverage & Tobacco) | 713,562 | ||||||
| 25,534 | Lonza Group AG (Registered) (Pharmaceuticals, Biotechnology & Life Sciences) | 15,471,311 | ||||||
| 645,959 | Nestle SA (Registered) (Food, Beverage & Tobacco) | 72,656,134 | ||||||
| 591,632 | Novartis AG (Registered) (Pharmaceuticals, Biotechnology & Life Sciences) | 46,101,497 | ||||||
| 180,832 | Roche Holding AG (Pharmaceuticals, Biotechnology & Life Sciences) | 58,107,024 | ||||||
| 36,198 | Sika AG (Registered) (Materials) | 8,904,887 | ||||||
|
| |||||||
| 30 | The accompanying notes are an integral part of these financial statements. |
GOLDMAN SACHS INTERNATIONAL EQUITY INSIGHTS FUND
| Shares | Description | Value | ||||||
| Common Stocks – (continued) | ||||||||
| Switzerland – (continued) | ||||||||
| 75,844 | Sonova Holding AG (Registered) (Health Care Equipment & Services)* | $ | 18,002,941 | |||||
| 339,509 | STMicroelectronics NV (Semiconductors & Semiconductor Equipment) | 10,357,432 | ||||||
| 31,407 | Swiss Life Holding AG (Registered) (Insurance)* | 10,564,960 | ||||||
| 34,939 | Tecan Group AG (Registered) (Pharmaceuticals, Biotechnology & Life Sciences) | 16,579,559 | ||||||
| 1,698,159 | UBS Group AG (Registered) (Diversified Financials) | 19,769,923 | ||||||
| 71,703 | Zurich Insurance Group AG (Insurance) | 23,815,841 | ||||||
|
| |||||||
| 319,911,785 | ||||||||
|
| |||||||
| United Kingdom – 8.8% | ||||||||
| 367,824 | 3i Group plc (Diversified Financials) | 4,594,013 | ||||||
| 111,133 | Associated British Foods plc (Food, Beverage & Tobacco) | 2,444,009 | ||||||
| 11,550 | AstraZeneca plc ADR (Pharmaceuticals, Biotechnology & Life Sciences) | 579,348 | ||||||
| 4,786,086 | Aviva plc (Insurance) | 15,964,358 | ||||||
| 822,429 | Barratt Developments plc (Consumer Durables & Apparel) | 5,140,665 | ||||||
| 1,393,336 | boohoo Group plc (Retailing)* | 4,883,231 | ||||||
| 539,511 | BP plc ADR (Energy) | 8,351,630 | ||||||
| 2,804,014 | BT Group plc (Telecommunication Services) | 3,682,654 | ||||||
| 481,391 | CNH Industrial NV (Capital Goods)* | 3,732,550 | ||||||
| 449,604 | Diageo plc (Food, Beverage & Tobacco) | 14,530,248 | ||||||
| 194,115 | Dialog Semiconductor plc (Semiconductors & Semiconductor Equipment)* | 7,400,421 | ||||||
| 2,347,819 | Direct Line Insurance Group plc (Insurance) | 8,023,457 | ||||||
| 593,727 | Experian plc (Commercial & Professional Services) | 21,750,535 | ||||||
| 34,890 | Games Workshop Group plc (Consumer Durables & Apparel) | 4,690,489 | ||||||
| 109,770 | GlaxoSmithKline plc ADR (Pharmaceuticals, Biotechnology & Life Sciences) | 3,668,513 | ||||||
| 649,433 | GVC Holdings plc (Consumer Services) | 8,135,471 | ||||||
| 91,420 | IG Group Holdings plc (Diversified Financials) | 902,179 | ||||||
| 893,972 | Imperial Brands plc (Food, Beverage & Tobacco) | 14,149,526 | ||||||
| 466,209 | JD Sports Fashion plc (Retailing) | 4,485,156 | ||||||
| 360,109 | Kingfisher plc (Retailing)* | 1,339,241 | ||||||
| 2,067,795 | Legal & General Group plc (Insurance) | 4,957,761 | ||||||
| 32,838 | London Stock Exchange Group plc (Diversified Financials) | 3,539,868 | ||||||
|
| |||||||
| Common Stocks – (continued) | ||||||||
| United Kingdom – (continued) | ||||||||
| 358,823 | Moneysupermarket.com Group plc (Retailing) | 1,133,321 | ||||||
| 12,034 | Reckitt Benckiser Group plc (Household & Personal Products) | 1,060,058 | ||||||
| 778,451 | RELX plc (Commercial & Professional Services) | 15,403,922 | ||||||
| 561,475 | Rentokil Initial plc (Commercial & Professional Services) | 3,822,641 | ||||||
| 151,139 | Tate & Lyle plc (Food, Beverage & Tobacco) | 1,165,098 | ||||||
| 279,380 | Unilever NV (Household & Personal Products) | 15,749,698 | ||||||
| 181,521 | Unilever plc ADR (Household & Personal Products)(d) | 10,315,838 | ||||||
|
| |||||||
| 195,595,899 | ||||||||
|
| |||||||
| United States – 0.0% | ||||||||
| 10,954 | Ferguson plc (Capital Goods) | 1,087,962 | ||||||
|
| |||||||
| | TOTAL INVESTMENTS BEFORE SECURITIES LENDING REINVESTMENT VEHICLE | | ||||||
| (Cost $2,086,125,309) | $ | 2,201,807,288 | ||||||
|
| |||||||
| Shares | Dividend Rate | Value | ||||||
| Securities Lending Reinvestment Vehicle(e) – 1.2% | ||||||||
| | Goldman Sachs Financial Square Government Fund – | | ||||||
| 25,795,600 | 0.028% | $ | 25,795,600 | |||||
| (Cost $25,795,600) | ||||||||
|
| |||||||
| TOTAL INVESTMENTS – 99.8% | ||||||||
| (Cost $2,111,920,909) | $ | 2,227,602,888 | ||||||
|
| |||||||
| | OTHER ASSETS IN EXCESS OF LIABILITIES – 0.2% | 4,502,060 | ||||||
|
| |||||||
| NET ASSETS – 100.0% | $ | 2,232,104,948 | ||||||
|
| |||||||
| The percentage shown for each investment category reflects the value of investments in that category as a percentage of net assets. | ||
* | Security is currently in default and/or non-income producing. | |
(a) | All or a portion of security is segregated as collateral for initial margin requirements on futures transactions. | |
(b) | Preference Shares are a special type of equity investment that shares in the earnings of the company, has limited voting rights, and receives a greater dividend than applicable Common Shares. | |
(c) | Exempt from registration under Rule 144A of the Securities Act of 1933. | |
(d) | All or a portion of security is on loan. | |
(e) | Represents an Affiliated Issuer. | |
| ||
Investment Abbreviations: | ||
ADR | —American Depositary Receipt | |
REIT | —Real Estate Investment Trust | |
| ||
| The accompanying notes are an integral part of these financial statements. | 31 |
GOLDMAN SACHS INTERNATIONAL EQUITY INSIGHTS FUND
Schedule of Investments (continued)
October 31, 2020
| ADDITIONAL INVESTMENT INFORMATION |
FUTURES CONTRACTS — At October 31, 2020, the Fund had the following futures contracts:
| Description | Number of Contracts | Expiration Date | Notional Amount | Unrealized Appreciation/ (Depreciation) | ||||||||||||
Long position contracts: | ||||||||||||||||
EURO STOXX 50 Index | 6 | 12/18/2020 | $ | 206,772 | $ | (15,440 | ) | |||||||||
FTSE 100 Index | 1 | 12/18/2020 | 72,075 | (2,981 | ) | |||||||||||
| Total Futures Contracts | $ | (18,421 | ) | |||||||||||||
| 32 | The accompanying notes are an integral part of these financial statements. |
GOLDMAN SACHS INTERNATIONAL SMALL CAP INSIGHTS FUND
Schedule of Investments
October 31, 2020
| Shares | Description | Value | ||||||
| Common Stocks – 97.2% | ||||||||
| Australia – 8.0% | ||||||||
| 69,110 | Accent Group Ltd. (Retailing) | $ | 81,139 | |||||
| 171,609 | Ansell Ltd. (Health Care Equipment & Services) | 4,852,601 | ||||||
| 85,035 | ARB Corp. Ltd. (Automobiles & Components) | 1,841,945 | ||||||
| 1,139,147 | Breville Group Ltd. (Consumer Durables & Apparel) | 21,105,344 | ||||||
| 1,122,851 | BWP Trust (REIT) | 3,165,405 | ||||||
| 1,806,712 | carsales.com Ltd. (Media & Entertainment) | 26,395,666 | ||||||
| 3,435,999 | Charter Hall Group (REIT) | 29,791,923 | ||||||
| 259,033 | Credit Corp. Group Ltd. (Diversified Financials) | 3,335,902 | ||||||
| 1,978,165 | Data#3 Ltd. (Software & Services) | 8,681,807 | ||||||
| 1,110,717 | Genworth Mortgage Insurance Australia Ltd. (Banks) | 1,332,654 | ||||||
| 1,198,172 | Harvey Norman Holdings Ltd. (Retailing) | 3,748,178 | ||||||
| 1,128,520 | IPH Ltd. (Commercial & Professional Services) | 5,230,528 | ||||||
| 925,129 | JB Hi-Fi Ltd. (Retailing) | 30,913,614 | ||||||
| 47,217 | Kogan.com Ltd. (Retailing) | 683,515 | ||||||
| 69,376 | McMillan Shakespeare Ltd. (Commercial & Professional Services) | 456,368 | ||||||
| 1,677,852 | Mineral Resources Ltd. (Materials) | 29,462,752 | ||||||
| 173,220 | Netwealth Group Ltd. (Diversified Financials) | 2,103,856 | ||||||
| 496,328 | OZ Minerals Ltd. (Materials) | 5,184,834 | ||||||
| 2,025,840 | Pendal Group Ltd. (Diversified Financials) | 9,216,586 | ||||||
| 450,846 | Perseus Mining Ltd. (Materials)* | 389,929 | ||||||
| 390,303 | Premier Investments Ltd. (Retailing) | 5,853,804 | ||||||
| 792,574 | Pro Medicus Ltd. (Health Care Equipment & Services) | 18,091,198 | ||||||
| 4,579,478 | Regis Resources Ltd. (Materials) | 13,441,343 | ||||||
| 814,834 | Sandfire Resources Ltd. (Materials) | 2,535,661 | ||||||
| 211,762 | Seven Group Holdings Ltd. (Capital Goods) | 2,891,586 | ||||||
| 315,557 | SmartGroup Corp. Ltd. (Commercial & Professional Services) | 1,207,507 | ||||||
| 41,968 | Super Retail Group Ltd. (Retailing) | 330,292 | ||||||
|
| |||||||
| 232,325,937 | ||||||||
|
| |||||||
| Austria – 0.7% | ||||||||
| 366,421 | BAWAG Group AG (Banks)(a) | 13,456,885 | ||||||
| 159,795 | Oesterreichische Post AG (Transportation)(b) | 5,074,754 | ||||||
| 35,503 | Semperit AG Holding (Capital Goods)* | 911,551 | ||||||
| 29,414 | Zumtobel Group AG (Capital Goods)* | 164,434 | ||||||
|
| |||||||
| 19,607,624 | ||||||||
|
| |||||||
| Common Stocks – (continued) | ||||||||
| Belgium – 1.9% | ||||||||
| 91,881 | Bekaert SA (Materials) | 1,954,334 | ||||||
| 747,666 | bpost SA (Transportation) | 6,625,359 | ||||||
| 186,060 | D’ieteren SA/NV (Retailing) | 9,321,593 | ||||||
| 39,560 | Gimv NV (Diversified Financials) | 2,065,832 | ||||||
| 44,811 | KBC Ancora (Diversified Financials)* | 1,270,078 | ||||||
| 69,617 | Orange Belgium SA (Telecommunication Services) | 1,160,165 | ||||||
| 23,220 | Tessenderlo Group SA (Materials)* | 790,396 | ||||||
| 923,309 | Warehouses De Pauw CVA (REIT) | 30,933,880 | ||||||
|
| |||||||
| 54,121,637 | ||||||||
|
| |||||||
| China – 1.1% | ||||||||
| 15,175,000 | CITIC Telecom International Holdings Ltd. (Telecommunication Services) | 4,820,459 | ||||||
| 4,000,000 | Kerry Logistics Network Ltd. (Transportation) | 8,353,945 | ||||||
| 8,771,000 | SITC International Holdings Co. Ltd. (Transportation) | 13,548,176 | ||||||
| 7,948,710 | Yanlord Land Group Ltd. (Real Estate) | 6,112,933 | ||||||
|
| |||||||
| 32,835,513 | ||||||||
|
| |||||||
| Denmark – 0.5% | ||||||||
| 74,949 | Chemometec A/S (Pharmaceuticals, Biotechnology & Life Sciences) | 4,342,815 | ||||||
| 162,955 | Per Aarsleff Holding A/S (Capital Goods) | 6,233,182 | ||||||
| 81,757 | Scandinavian Tobacco Group A/S Class A (Food, Beverage & Tobacco)(a) | 1,154,803 | ||||||
| 30,465 | Schouw & Co. A/S (Food, Beverage & Tobacco) | 2,652,952 | ||||||
|
| |||||||
| 14,383,752 | ||||||||
|
| |||||||
| Finland – 2.5% | ||||||||
| 34,033 | Huhtamaki OYJ (Materials) | 1,662,428 | ||||||
| 1,528,598 | Kesko OYJ Class B (Food & Staples Retailing) | 39,224,724 | ||||||
| 344,745 | Rovio Entertainment OYJ (Media & Entertainment)(a)(b) | 2,060,033 | ||||||
| 149,947 | Tokmanni Group Corp. (Retailing) | 2,385,525 | ||||||
| 390,949 | Uponor OYJ (Capital Goods) | 7,289,096 | ||||||
| 878,104 | Valmet OYJ (Capital Goods) | 20,957,649 | ||||||
|
| |||||||
| 73,579,455 | ||||||||
|
| |||||||
| France – 2.6% | ||||||||
| 172,084 | Albioma SA (Utilities) | 8,022,801 | ||||||
| 16,793 | Alten SA (Software & Services)* | 1,344,591 | ||||||
| 14,075 | Chargeurs SA (Consumer Durables & Apparel) | 274,349 | ||||||
| 773,538 | Coface SA (Insurance)* | 6,043,790 | ||||||
| 476,147 | Elis SA (Commercial & Professional Services)* | 5,222,296 | ||||||
|
| |||||||
| The accompanying notes are an integral part of these financial statements. | 33 |
GOLDMAN SACHS INTERNATIONAL SMALL CAP INSIGHTS FUND
Schedule of Investments (continued)
October 31, 2020
| Shares | Description | Value | ||||||
| Common Stocks – (continued) | ||||||||
| France – (continued) | ||||||||
| 25,468 | Gaztransport Et Technigaz SA (Energy) | $ | 2,441,279 | |||||
| 41,218 | IPSOS (Media & Entertainment) | 1,013,080 | ||||||
| 82,182 | Kaufman & Broad SA (Consumer Durables & Apparel) | 2,928,695 | ||||||
| 56,226 | Mersen SA (Capital Goods)* | 1,458,767 | ||||||
| 163,353 | Nexans SA (Capital Goods)* | 7,932,829 | ||||||
| 32,204 | Nexity SA (Real Estate) | 903,904 | ||||||
| 303,484 | Quadient SA (Technology Hardware & Equipment) | 3,955,135 | ||||||
| 2,517,594 | Rexel SA (Capital Goods)* | 26,506,905 | ||||||
| 89,596 | Rubis SCA (Utilities) | 2,945,901 | ||||||
| 17,954 | Sopra Steria Group (Software & Services)* | 2,134,940 | ||||||
| 10,998 | Trigano SA (Automobiles & Components) | 1,461,486 | ||||||
| 32,577 | Vicat SA (Materials) | 1,001,637 | ||||||
| 885 | Virbac SA (Pharmaceuticals, Biotechnology & Life Sciences)* | 205,937 | ||||||
|
| |||||||
| 75,798,322 | ||||||||
|
| |||||||
| Germany – 4.2% | ||||||||
| 166,674 | ADVA Optical Networking SE (Technology Hardware & Equipment)* | 1,279,628 | ||||||
| 334,235 | Aurubis AG (Materials) | 21,382,180 | ||||||
| 3,340 | Cewe Stiftung & Co. KGAA (Commercial & Professional Services) | 318,378 | ||||||
| 102,121 | Duerr AG (Capital Goods) | 2,936,835 | ||||||
| 216,529 | Eckert & Ziegler Strahlen- und Medizintechnik AG (Health Care Equipment & Services) | 9,910,694 | ||||||
| 38,092 | Elmos Semiconductor SE (Semiconductors & Semiconductor Equipment) | 842,479 | ||||||
| 288,962 | Gerresheimer AG (Pharmaceuticals, Biotechnology & Life Sciences) | 29,047,735 | ||||||
| 215,922 | Hamburger Hafen und Logistik AG (Transportation) | 3,619,704 | ||||||
| 11,901 | Hornbach Baumarkt AG (Retailing) | 469,871 | ||||||
| 7,292 | Hornbach Holding AG & Co. KGaA (Retailing) | 702,340 | ||||||
| 108,418 | Jungheinrich AG (Preference) (Capital Goods)(c) | 3,941,767 | ||||||
| 18,599 | New Work SE (Media & Entertainment) | 4,841,306 | ||||||
| 119,521 | Siltronic AG (Semiconductors & Semiconductor Equipment) | 11,310,913 | ||||||
| 33,800 | Sixt SE (Preference) (Transportation)(c) | 1,600,328 | ||||||
| 442,260 | Software AG (Software & Services) | 15,843,803 | ||||||
| 143 | STO SE & Co. KGaA (Preference) (Materials)(c) | 17,887 | ||||||
| 108,483 | TAG Immobilien AG (Real Estate)* | 3,196,954 | ||||||
| 526,261 | Takkt AG (Retailing) | 5,592,482 | ||||||
|
| |||||||
| Common Stocks – (continued) | ||||||||
| Germany – (continued) | ||||||||
| 20,608 | zooplus AG (Retailing)* | 3,312,153 | ||||||
|
| |||||||
| 120,167,437 | ||||||||
|
| |||||||
| Hong Kong – 1.5% | ||||||||
| 1,771,000 | Hang Lung Group Ltd. (Real Estate) | 3,931,285 | ||||||
| 670,500 | Johnson Electric Holdings Ltd. (Automobiles & Components) | 1,387,335 | ||||||
| 9,933,000 | K Wah International Holdings Ltd. (Real Estate) | 4,713,748 | ||||||
| 1,182,000 | Luk Fook Holdings International Ltd. (Retailing) | 2,890,186 | ||||||
| 17,590,400 | Man Wah Holdings Ltd. (Consumer Durables & Apparel) | 24,549,832 | ||||||
| 5,217,000 | Pacific Basin Shipping Ltd. (Transportation) | 762,089 | ||||||
| 80,500 | Stella International Holdings Ltd. (Consumer Durables & Apparel) | 82,492 | ||||||
| 653,000 | Sun Hung Kai & Co. Ltd. (Diversified Financials) | 254,053 | ||||||
| 4,002,000 | United Laboratories International Holdings Ltd. (The) (Pharmaceuticals, Biotechnology & Life Sciences) | 3,441,249 | ||||||
| 2,560,000 | VPower Group International Holdings Ltd. (Capital Goods)(a) | 918,812 | ||||||
|
| |||||||
| 42,931,081 | ||||||||
|
| |||||||
| India – 0.0% | ||||||||
| 34,908 | RHI Magnesita NV (Materials) | 1,158,267 | ||||||
|
| |||||||
| Ireland – 0.2% | ||||||||
| 598,478 | C&C Group plc (Food, Beverage & Tobacco)* | 1,253,918 | ||||||
| 4,372,789 | Greencore Group plc (Food, Beverage & Tobacco) | 5,119,408 | ||||||
|
| |||||||
| 6,373,326 | ||||||||
|
| |||||||
| Israel – 1.1% | ||||||||
| 1,617 | Blue Square Real Estate Ltd. (Real Estate) | 65,965 | ||||||
| 1,631,211 | Plus500 Ltd. (Diversified Financials) | 31,261,679 | ||||||
|
| |||||||
| 31,327,644 | ||||||||
|
| |||||||
| Italy – 4.6% | ||||||||
| 294,773 | Anima Holding SpA (Diversified Financials)(a) | 1,104,447 | ||||||
| 130,617 | Arnoldo Mondadori Editore SpA (Media & Entertainment)* | 168,295 | ||||||
| 220,805 | ASTM SpA (Transportation)* | 4,109,456 | ||||||
| 1,609,088 | Azimut Holding SpA (Diversified Financials) | 27,123,229 | ||||||
| 774,476 | Banca Mediolanum SpA (Diversified Financials) | 5,291,308 | ||||||
| 441,280 | Biesse SpA (Capital Goods)* | 7,626,290 | ||||||
| 1,082,783 | Buzzi Unicem SpA (Materials) | 23,429,030 | ||||||
|
| |||||||
| 34 | The accompanying notes are an integral part of these financial statements. |
GOLDMAN SACHS INTERNATIONAL SMALL CAP INSIGHTS FUND
| Shares | Description | Value | ||||||
| Common Stocks – (continued) | ||||||||
| Italy – (continued) | ||||||||
| 121,357 | De’ Longhi SpA (Consumer Durables & Apparel)* | $ | 3,881,207 | |||||
| 59,045 | ERG SpA (Utilities) | 1,337,203 | ||||||
| 944,722 | Falck Renewables SpA (Utilities) | 5,123,020 | ||||||
| 790,806 | Interpump Group SpA (Capital Goods) | 29,869,914 | ||||||
| 144,104 | Reply SpA (Software & Services) | 15,482,073 | ||||||
| 39,275 | Sesa SpA (Technology Hardware & Equipment)* | 3,679,714 | ||||||
| 268,374 | Tinexta Spa (Commercial & Professional Services)* | 5,766,760 | ||||||
|
| |||||||
| 133,991,946 | ||||||||
|
| |||||||
| Japan – 33.1% | ||||||||
| 2,818 | Activia Properties, Inc. (REIT) | 10,181,483 | ||||||
| 1,800 | ADEKA Corp. (Materials) | 23,277 | ||||||
| 6,100 | Aichi Steel Corp. (Materials) | 146,830 | ||||||
| 1,157,400 | Alps Alpine Co. Ltd. (Technology Hardware & Equipment) | 16,698,205 | ||||||
| 32,900 | Altech Corp. (Commercial & Professional Services) | 607,809 | ||||||
| 295,400 | Arcland Sakamoto Co. Ltd. (Retailing) | 5,691,056 | ||||||
| 100,600 | Arcs Co. Ltd. (Food & Staples Retailing) | 2,227,035 | ||||||
| 36,800 | Argo Graphics, Inc. (Software & Services) | 1,132,014 | ||||||
| 260,600 | ASKUL Corp. (Retailing) | 10,008,687 | ||||||
| 209,800 | Autobacs Seven Co. Ltd. (Retailing) | 2,685,748 | ||||||
| 68,300 | BayCurrent Consulting, Inc. (Commercial & Professional Services) | 8,837,358 | ||||||
| 30,900 | Belc Co. Ltd. (Food & Staples Retailing) | 1,896,810 | ||||||
| 28,700 | Bic Camera, Inc. (Retailing) | 316,976 | ||||||
| 349,000 | Bunka Shutter Co. Ltd. (Capital Goods) | 2,740,128 | ||||||
| 98,200 | Cawachi Ltd. (Food & Staples Retailing) | 2,785,253 | ||||||
| 54,600 | Central Glass Co. Ltd. (Capital Goods) | 1,171,637 | ||||||
| 14,300 | Chiyoda Integre Co. Ltd. (Capital Goods) | 210,993 | ||||||
| 152,700 | Chugoku Marine Paints Ltd. (Materials) | 1,457,742 | ||||||
| 34,300 | CI Takiron Corp. (Materials) | 219,143 | ||||||
| 228,800 | CKD Corp. (Capital Goods) | 3,808,114 | ||||||
| 92,600 | cocokara fine, Inc. (Food & Staples Retailing) | 6,083,480 | ||||||
| 277,800 | Computer Engineering & Consulting Ltd. (Software & Services) | 3,963,261 | ||||||
| 97,000 | CONEXIO Corp. (Technology Hardware & Equipment) | 1,167,749 | ||||||
| 57,100 | Cosel Co. Ltd. (Capital Goods) | 546,605 | ||||||
| 33,900 | Create SD Holdings Co. Ltd. (Food & Staples Retailing) | 1,093,273 | ||||||
| 76,900 | Cybozu, Inc. (Software & Services) | 2,219,032 | ||||||
|
| |||||||
| Common Stocks – (continued) | ||||||||
| Japan – (continued) | ||||||||
| 6,300 | Dai-Dan Co. Ltd. (Capital Goods) | 154,411 | ||||||
| 30,500 | Daiichi Jitsugyo Co. Ltd. (Capital Goods) | 1,085,529 | ||||||
| 17,400 | Daikyonishikawa Corp. (Automobiles & Components) | 96,447 | ||||||
| 2,099,700 | DCM Holdings Co. Ltd. (Retailing) | 26,016,698 | ||||||
| 131,000 | Demae-Can Co. Ltd. (Retailing)* | 3,884,305 | ||||||
| 1,836,500 | DeNA Co. Ltd. (Media & Entertainment) | 31,334,556 | ||||||
| 365,900 | DIC Corp. (Materials) | 8,908,140 | ||||||
| 209,800 | Dip Corp. (Media & Entertainment) | 4,030,962 | ||||||
| 146,100 | Doshisha Co. Ltd. (Retailing) | 2,688,289 | ||||||
| 269,800 | Dowa Holdings Co. Ltd. (Materials) | 7,721,369 | ||||||
| 410,500 | DTS Corp. (Software & Services) | 7,983,817 | ||||||
| 102,800 | Earth Corp. (Household & Personal Products) | 6,529,997 | ||||||
| 199,200 | Ebara Corp. (Capital Goods) | 5,537,058 | ||||||
| 793,800 | EDION Corp. (Retailing) | 7,818,757 | ||||||
| 393,600 | Eiken Chemical Co. Ltd. (Health Care Equipment & Services) | 7,530,059 | ||||||
| 5,100 | Eizo Corp. (Technology Hardware & Equipment) | 192,498 | ||||||
| 299,700 | EPS Holdings, Inc. (Pharmaceuticals, Biotechnology & Life Sciences) | 2,715,074 | ||||||
| 13,100 | Exedy Corp. (Automobiles & Components) | 165,152 | ||||||
| 135,100 | FAN Communications, Inc. (Media & Entertainment) | 605,013 | ||||||
| 601,100 | Financial Products Group Co. Ltd. (Diversified Financials) | 2,613,774 | ||||||
| 87,000 | Fujibo Holdings, Inc. (Consumer Durables & Apparel) | 3,024,005 | ||||||
| 207,900 | Fujimi, Inc. (Materials) | 7,401,873 | ||||||
| 5,306 | Fukuoka REIT Corp. (REIT) | 6,432,202 | ||||||
| 31,500 | Fuyo General Lease Co. Ltd. (Diversified Financials) | 1,808,671 | ||||||
| 120,400 | Gakken Holdings Co. Ltd. (Media & Entertainment) | 1,626,429 | ||||||
| 775,500 | Glory Ltd. (Capital Goods) | 16,346,335 | ||||||
| 289,900 | GMO internet, Inc. (Software & Services) | 7,732,287 | ||||||
| 11,600 | Godo Steel Ltd. (Materials) | 212,317 | ||||||
| 430,900 | Goldcrest Co. Ltd. (Real Estate) | 5,505,781 | ||||||
| 2,315,600 | Gree, Inc. (Media & Entertainment) | 12,074,724 | ||||||
| 531,200 | H.U. Group Holdings, Inc. (Health Care Equipment & Services) | 13,514,943 | ||||||
| 33,300 | Hachijuni Bank Ltd. (The) (Banks) | 122,979 | ||||||
| 57,600 | Hamakyorex Co. Ltd. (Transportation) | 1,634,241 | ||||||
| 3,671 | Hankyu Hanshin REIT, Inc. (REIT) | 4,056,386 | ||||||
| 45,700 | Hanwa Co. Ltd. (Capital Goods) | 886,017 | ||||||
| 13,259 | Heiwa Real Estate REIT, Inc. (REIT) | 14,334,899 | ||||||
| 329,300 | Hogy Medical Co. Ltd. (Health Care Equipment & Services) | 9,662,032 | ||||||
| 1,684,700 | Hokuetsu Corp. (Materials) | 5,565,057 | ||||||
|
| |||||||
| The accompanying notes are an integral part of these financial statements. | 35 |
GOLDMAN SACHS INTERNATIONAL SMALL CAP INSIGHTS FUND
Schedule of Investments (continued)
October 31, 2020
| Shares | Description | Value | ||||||
| Common Stocks – (continued) | ||||||||
| Japan – (continued) | ||||||||
| 179,100 | Hokuto Corp. (Food, Beverage & Tobacco) | $ | 3,766,761 | |||||
| 31,100 | Horiba Ltd. (Technology Hardware & Equipment) | 1,529,853 | ||||||
| 830 | Hoshino Resorts REIT, Inc. (REIT) | 3,917,818 | ||||||
| 32,200 | Hosiden Corp. (Technology Hardware & Equipment) | 285,466 | ||||||
| 11,860 | Ichigo Office REIT Investment Corp. (REIT) | 7,669,427 | ||||||
| 4,500 | Inaba Denki Sangyo Co. Ltd. (Capital Goods) | 108,331 | ||||||
| 317,900 | Ines Corp. (Software & Services) | 4,539,020 | ||||||
| 5,400 | Internet Initiative Japan, Inc. (Telecommunication Services) | 241,599 | ||||||
| 16,267 | Invesco Office J-Reit, Inc. (REIT) | 2,018,046 | ||||||
| 700 | IR Japan Holdings Ltd. (Commercial & Professional Services) | 77,502 | ||||||
| 14,600 | Itoham Yonekyu Holdings, Inc. (Food, Beverage & Tobacco) | 97,748 | ||||||
| 44,100 | Itokuro, Inc. (Media & Entertainment)* | 629,742 | ||||||
| 68,000 | Izumi Co. Ltd. (Retailing) | 2,306,137 | ||||||
| 100,300 | JAC Recruitment Co. Ltd. (Commercial & Professional Services) | 1,200,800 | ||||||
| 75,600 | JAFCO Group Co. Ltd. (Diversified Financials) | 3,419,087 | ||||||
| 34,000 | Japan Aviation Electronics Industry Ltd. (Technology Hardware & Equipment) | 468,231 | ||||||
| 667 | Japan Excellent, Inc. (REIT) | 733,891 | ||||||
| 8,786 | Japan Hotel REIT Investment Corp. (REIT) | 4,254,729 | ||||||
| 478,700 | Japan Investment Adviser Co. Ltd. (Diversified Financials)(b) | 5,750,778 | ||||||
| 361,700 | Japan Lifeline Co. Ltd. (Health Care Equipment & Services) | 4,667,436 | ||||||
| 5,292 | Japan Logistics Fund, Inc. (REIT) | 14,871,979 | ||||||
| 17,100 | J-Oil Mills, Inc. (Food, Beverage & Tobacco) | 604,025 | ||||||
| 18,700 | JSP Corp. (Materials) | 266,209 | ||||||
| 31,500 | Justsystems Corp. (Software & Services) | 2,060,215 | ||||||
| 4,457,600 | JVCKenwood Corp. (Consumer Durables & Apparel) | 6,031,011 | ||||||
| 69,800 | Kaga Electronics Co. Ltd. (Technology Hardware & Equipment) | 1,349,720 | ||||||
| 573,300 | Kandenko Co. Ltd. (Capital Goods) | 4,302,208 | ||||||
| 106,600 | Kaneka Corp. (Materials) | 2,983,119 | ||||||
| 157,900 | Kanematsu Corp. (Capital Goods) | 1,872,277 | ||||||
| 80,900 | Kanematsu Electronics Ltd. (Software & Services) | 3,270,359 | ||||||
| 3,373 | Kenedix Retail REIT Corp. (REIT) | 6,455,602 | ||||||
| 27,600 | Kenedix, Inc. (Real Estate) | 143,025 | ||||||
|
| |||||||
| Common Stocks – (continued) | ||||||||
| Japan – (continued) | ||||||||
| 222,100 | Kintetsu World Express, Inc. (Transportation) | 4,721,416 | ||||||
| 45,500 | Kissei Pharmaceutical Co. Ltd. (Pharmaceuticals, Biotechnology & Life Sciences) | 895,397 | ||||||
| 7,500 | Koei Tecmo Holdings Co. Ltd. (Media & Entertainment) | 366,424 | ||||||
| 757,700 | Kohnan Shoji Co. Ltd. (Retailing) | 25,872,397 | ||||||
| 478,000 | Kokuyo Co. Ltd. (Commercial & Professional Services) | 6,494,902 | ||||||
| 279,900 | Komeri Co. Ltd. (Retailing) | 8,240,783 | ||||||
| 49,700 | Konoike Transport Co. Ltd. (Transportation) | 519,584 | ||||||
| 113,300 | Koshidaka Holdings Co. Ltd. (Consumer Services) | 423,836 | ||||||
| 1,744,700 | K’s Holdings Corp. (Retailing) | 22,281,325 | ||||||
| 50,700 | Kurabo Industries Ltd. (Consumer Durables & Apparel) | 912,703 | ||||||
| 209,500 | Kureha Corp. (Materials) | 8,893,355 | ||||||
| 65,700 | Kyoei Steel Ltd. (Materials) | 827,189 | ||||||
| 163,200 | Kyokuto Kaihatsu Kogyo Co. Ltd. (Capital Goods) | 2,013,294 | ||||||
| 12,300 | KYORIN Holdings, Inc. (Pharmaceuticals, Biotechnology & Life Sciences) | 222,437 | ||||||
| 425,200 | LIFULL Co. Ltd. (Media & Entertainment) | 1,598,389 | ||||||
| 43,200 | Lintec Corp. (Materials) | 957,650 | ||||||
| 460,100 | Macnica Fuji Electronics Holdings, Inc. (Technology Hardware & Equipment) | 8,228,289 | ||||||
| 20,300 | Makino Milling Machine Co. Ltd. (Capital Goods) | 698,733 | ||||||
| 5,300 | Mani, Inc. (Health Care Equipment & Services) | 132,589 | ||||||
| 3,600 | Maruzen Showa Unyu Co. Ltd. (Transportation) | 105,536 | ||||||
| 59,300 | Marvelous, Inc. (Media & Entertainment) | 445,545 | ||||||
| 790,800 | Matsui Securities Co. Ltd. (Diversified Financials) | 6,329,965 | ||||||
| 125,800 | Maxell Holdings Ltd. (Technology Hardware & Equipment) | 1,315,194 | ||||||
| 709,900 | MCJ Co. Ltd. (Technology Hardware & Equipment) | 6,542,381 | ||||||
| 4,800 | Medley, Inc. (Health Care Equipment & Services)* | 269,614 | ||||||
| 288,600 | Megachips Corp. (Semiconductors & Semiconductor Equipment) | 7,677,481 | ||||||
| 235,700 | Meiko Network Japan Co. Ltd. (Consumer Services) | 1,363,581 | ||||||
| 3,015 | Mirai Corp. (REIT) | 1,041,931 | ||||||
| 53,100 | Mirait Holdings Corp. (Capital Goods) | 755,939 | ||||||
|
| |||||||
| 36 | The accompanying notes are an integral part of these financial statements. |
GOLDMAN SACHS INTERNATIONAL SMALL CAP INSIGHTS FUND
| Shares | Description | Value | ||||||
| Common Stocks – (continued) | ||||||||
| Japan – (continued) | ||||||||
| 8,700 | Mitsubishi Pencil Co. Ltd. (Commercial & Professional Services) | $ | 111,998 | |||||
| 74,700 | Mitsubishi Research Institute, Inc. (Software & Services) | 2,708,364 | ||||||
| 146,000 | Mitsui Sugar Co. Ltd. (Food, Beverage & Tobacco) | 2,538,167 | ||||||
| 698,800 | Mixi, Inc. (Media & Entertainment) | 19,231,580 | ||||||
| 205,400 | Nagase & Co. Ltd. (Capital Goods) | 2,678,444 | ||||||
| 992,700 | NEC Networks & System Integration Corp. (Software & Services) | 17,213,815 | ||||||
| 158,200 | Nihon Chouzai Co. Ltd. (Food & Staples Retailing) | 2,555,937 | ||||||
| 358,500 | Nihon Unisys Ltd. (Software & Services) | 10,567,305 | ||||||
| 466,800 | Nikkon Holdings Co. Ltd. (Transportation) | 8,933,936 | ||||||
| 524,400 | Nippon Electric Glass Co. Ltd. (Technology Hardware & Equipment) | 10,313,887 | ||||||
| 284,600 | Nippon Flour Mills Co. Ltd. (Food, Beverage & Tobacco) | 4,564,935 | ||||||
| 205,800 | Nippon Kayaku Co. Ltd. (Materials) | 1,771,060 | ||||||
| 1,233,220 | Nippon Light Metal Holdings Co. Ltd. (Materials) | 19,477,945 | ||||||
| 2,502 | NIPPON REIT Investment Corp. (REIT) | 8,033,459 | ||||||
| 1,029,000 | Nippon Suisan Kaisha Ltd. (Food, Beverage & Tobacco) | 3,963,910 | ||||||
| 106,000 | Nipro Corp. (Health Care Equipment & Services) | 1,115,351 | ||||||
| 73,000 | Nishio Rent All Co. Ltd. (Capital Goods) | 1,416,793 | ||||||
| 120,700 | Nissha Co. Ltd. (Technology Hardware & Equipment) | 1,421,103 | ||||||
| 383,200 | Nisshin Oillio Group Ltd. (The) (Food, Beverage & Tobacco) | 11,015,055 | ||||||
| 22,700 | Nitta Corp. (Capital Goods) | 478,658 | ||||||
| 61,700 | Nitto Kogyo Corp. (Capital Goods) | 1,139,773 | ||||||
| 177,200 | Nojima Corp. (Retailing) | 4,973,122 | ||||||
| 13,100 | Noritake Co. Ltd. (Capital Goods) | 385,363 | ||||||
| 354,700 | NSD Co. Ltd. (Software & Services) | 6,230,183 | ||||||
| 215,617 | Okinawa Electric Power Co., Inc. (The) (Utilities) | 3,146,214 | ||||||
| 119,000 | Okuwa Co. Ltd. (Food & Staples Retailing) | 1,594,117 | ||||||
| 873 | One REIT, Inc. (REIT) | 2,017,964 | ||||||
| 522,500 | Open House Co. Ltd. (Real Estate) | 17,792,253 | ||||||
| 54,200 | Osaka Soda Co. Ltd. (Materials) | 1,291,106 | ||||||
| 74,900 | Paramount Bed Holdings Co. Ltd. (Health Care Equipment & Services) | 2,885,736 | ||||||
| 129,100 | Pasona Group, Inc. (Commercial & Professional Services) | 1,976,789 | ||||||
| 6,371 | Premier Investment Corp. (REIT) | 7,007,937 | ||||||
| 230,300 | Prima Meat Packers Ltd. (Food, Beverage & Tobacco) | 6,571,190 | ||||||
|
| |||||||
| Common Stocks – (continued) | ||||||||
| Japan – (continued) | ||||||||
| 23,200 | Proto Corp. (Media & Entertainment) | 249,853 | ||||||
| 303,700 | Rakus Co. Ltd. (Software & Services) | 5,968,216 | ||||||
| 2,063,000 | Riso Kyoiku Co. Ltd. (Consumer Services) | 6,030,135 | ||||||
| 199,500 | Rohto Pharmaceutical Co. Ltd. (Household & Personal Products) | 6,236,968 | ||||||
| 4,700 | RS Technologies Co. Ltd. (Semiconductors & Semiconductor Equipment) | 158,512 | ||||||
| 12,900 | Sakata Seed Corp. (Food, Beverage & Tobacco) | 455,194 | ||||||
| 49,800 | SanBio Co. Ltd. (Pharmaceuticals, Biotechnology & Life Sciences)*(b) | 794,497 | ||||||
| 170,600 | Sankyu, Inc. (Transportation) | 6,111,172 | ||||||
| 8,100 | Sanyo Special Steel Co. Ltd. (Materials) | 79,420 | ||||||
| 23,000 | Sapporo Holdings Ltd. (Food, Beverage & Tobacco) | 375,566 | ||||||
| 82,500 | Sato Holdings Corp. (Commercial & Professional Services) | 1,570,936 | ||||||
| 364,300 | Sawai Pharmaceutical Co. Ltd. (Pharmaceuticals, Biotechnology & Life Sciences) | 17,559,124 | ||||||
| 271,800 | SBS Holdings, Inc. (Transportation) | 6,194,670 | ||||||
| 394,300 | Seiko Holdings Corp. (Consumer Durables & Apparel) | 4,966,542 | ||||||
| 1,344,700 | Seino Holdings Co. Ltd. (Transportation) | 17,376,702 | ||||||
| 970,400 | Senko Group Holdings Co. Ltd. (Transportation) | 8,678,349 | ||||||
| 10,200 | Shindengen Electric Manufacturing Co. Ltd. (Semiconductors & Semiconductor Equipment) | 194,387 | ||||||
| 169,600 | Shin-Etsu Polymer Co. Ltd. (Materials) | 1,510,065 | ||||||
| 576,400 | Shinko Electric Industries Co. Ltd. (Semiconductors & Semiconductor Equipment) | 10,055,787 | ||||||
| 14,800 | Ship Healthcare Holdings, Inc. (Health Care Equipment & Services) | 702,295 | ||||||
| 54,400 | Sintokogio Ltd. (Capital Goods) | 375,423 | ||||||
| 1,856,200 | SKY Perfect JSAT Holdings, Inc. (Media & Entertainment) | 7,924,098 | ||||||
| 9,100 | ST Corp. (Household & Personal Products) | 174,199 | ||||||
| 162,200 | St Marc Holdings Co. Ltd. (Consumer Services) | 2,311,856 | ||||||
| 3,881 | Star Asia Investment Corp. (REIT) | 1,646,325 | ||||||
| 79,700 | Starts Corp., Inc. (Real Estate) | 1,853,820 | ||||||
| 13,700 | Strike Co. Ltd. (Diversified Financials) | 735,961 | ||||||
| 15,000 | Studio Alice Co. Ltd. (Consumer Services) | 276,791 | ||||||
| 25,100 | Sumitomo Seika Chemicals Co. Ltd. (Materials) | 799,019 | ||||||
|
| |||||||
| The accompanying notes are an integral part of these financial statements. | 37 |
GOLDMAN SACHS INTERNATIONAL SMALL CAP INSIGHTS FUND
Schedule of Investments (continued)
October 31, 2020
| Shares | Description | Value | ||||||
| Common Stocks – (continued) | ||||||||
| Japan – (continued) | ||||||||
| 264,200 | Sumitomo Warehouse Co. Ltd. (The) (Transportation) | $ | 3,090,336 | |||||
| 44,800 | Sun Frontier Fudousan Co. Ltd. (Real Estate) | 360,113 | ||||||
| 183,500 | Taiko Pharmaceutical Co. Ltd. (Pharmaceuticals, Biotechnology & Life Sciences) | 3,295,923 | ||||||
| 1,277,400 | Takara Leben Co. Ltd. (Real Estate) | 3,565,836 | ||||||
| 11,900 | Tatsuta Electric Wire and Cable Co. Ltd. (Capital Goods) | 64,149 | ||||||
| 7,500 | Tenma Corp. (Materials) | 131,148 | ||||||
| 60,500 | T-Gaia Corp. (Retailing) | 1,112,306 | ||||||
| 149,400 | Toa Corp. (Capital Goods) | 2,667,261 | ||||||
| 273,600 | Tokyo Ohka Kogyo Co. Ltd. (Materials) | 16,199,780 | ||||||
| 56,200 | Tokyo Seimitsu Co. Ltd. (Semiconductors & Semiconductor Equipment) | 1,896,271 | ||||||
| 23,200 | Tokyotokeiba Co. Ltd. (Consumer Services) | 1,154,903 | ||||||
| 2,748 | Tokyu REIT, Inc. (REIT) | 3,736,505 | ||||||
| 217,200 | Tosei Corp. (Real Estate) | 2,176,492 | ||||||
| 153,200 | Tosho Co. Ltd. (Consumer Services) | 1,778,602 | ||||||
| 432,400 | Towa Pharmaceutical Co. Ltd. (Pharmaceuticals, Biotechnology & Life Sciences) | 8,008,353 | ||||||
| 33,800 | Toyo Ink SC Holdings Co. Ltd. (Materials) | 628,013 | ||||||
| 1,238,300 | Toyo Seikan Group Holdings Ltd. (Materials) | 11,568,720 | ||||||
| 381,600 | Toyo Tanso Co. Ltd. (Capital Goods) | 6,438,531 | ||||||
| 359,600 | Transcosmos, Inc. (Software & Services) | 9,809,904 | ||||||
| 12,600 | UACJ Corp. (Materials) | 199,597 | ||||||
| 1,300 | Uchida Yoko Co. Ltd. (Commercial & Professional Services) | 64,169 | ||||||
| 154,600 | Ulvac, Inc. (Semiconductors & Semiconductor Equipment) | 5,662,908 | ||||||
| 148,300 | United Super Markets Holdings, Inc. (Food & Staples Retailing) | 1,595,300 | ||||||
| 28,600 | UNITED, Inc. (Software & Services) | 393,114 | ||||||
| 393,300 | Universal Entertainment Corp. (Consumer Durables & Apparel)* | 6,707,181 | ||||||
| 129,900 | Ushio, Inc. (Capital Goods) | 1,451,067 | ||||||
| 451,700 | Valor Holdings Co. Ltd. (Food & Staples Retailing) | 11,127,615 | ||||||
| 341,500 | Wakita & Co. Ltd. (Capital Goods) | 3,535,145 | ||||||
| 5,600 | Warabeya Nichiyo Holdings Co. Ltd. (Food, Beverage & Tobacco) | 80,107 | ||||||
| 7,200 | Weathernews, Inc. (Commercial & Professional Services) | 380,274 | ||||||
| 27,100 | World Holdings Co. Ltd. (Commercial & Professional Services) | 550,072 | ||||||
|
| |||||||
| Common Stocks – (continued) | ||||||||
| Japan – (continued) | ||||||||
| 33,900 | YAMABIKO Corp. (Capital Goods) | 425,306 | ||||||
| 136,900 | Yellow Hat Ltd. (Retailing) | 2,246,842 | ||||||
| 16,200 | Yokogawa Bridge Holdings Corp. (Capital Goods) | 286,748 | ||||||
| 8,900 | Yokowo Co. Ltd. (Technology Hardware & Equipment) | 225,143 | ||||||
| 132,400 | Yumeshin Holdings Co. Ltd. (Commercial & Professional Services) | 929,117 | ||||||
| 136,700 | Zenkoku Hosho Co. Ltd. (Diversified Financials) | 5,391,168 | ||||||
| 25,700 | Zuken, Inc. (Software & Services) | 650,705 | ||||||
|
| |||||||
| 957,586,846 | ||||||||
|
| |||||||
| Jersey – 0.0% | ||||||||
| 95,717 | Sanne Group plc (Diversified Financials) | 752,160 | ||||||
|
| |||||||
| Kazakhstan – 0.3% | ||||||||
| 929,696 | KAZ Minerals plc (Materials) | 7,585,492 | ||||||
|
| |||||||
| Luxembourg – 0.3% | ||||||||
| 358,415 | Aperam SA (Materials) | 9,618,665 | ||||||
|
| |||||||
| Netherlands – 5.0% | ||||||||
| 76,355 | Aalberts NV (Capital Goods) | 2,561,642 | ||||||
| 254,545 | ASM International NV (Semiconductors & Semiconductor Equipment) | 36,356,901 | ||||||
| 320,446 | BE Semiconductor Industries NV (Semiconductors & Semiconductor Equipment) | 12,911,960 | ||||||
| 14,291 | Brunel International NV (Commercial & Professional Services)* | 101,362 | ||||||
| 47,354 | Euronext NV (Diversified Financials)(a) | 4,930,572 | ||||||
| 695,686 | Flow Traders (Diversified Financials)(a) | 22,803,001 | ||||||
| 8,505,002 | PostNL NV (Transportation)* | 28,208,765 | ||||||
| 897,798 | Signify NV (Capital Goods)*(a) | 31,867,647 | ||||||
| 181,599 | TKH Group NV CVA (Capital Goods) | 5,847,266 | ||||||
|
| |||||||
| 145,589,116 | ||||||||
|
| |||||||
| Norway – 2.6% | ||||||||
| 258,438 | Atea ASA (Software & Services)* | 3,002,742 | ||||||
| 423,422 | Austevoll Seafood ASA (Food, Beverage & Tobacco) | 2,884,140 | ||||||
| 7,267 | Borregaard ASA (Materials) | 97,347 | ||||||
| 4,505,240 | Elkem ASA (Materials)(a) | 9,582,153 | ||||||
| 338,825 | Entra ASA (Real Estate)(a) | 4,429,461 | ||||||
| 2,013,539 | Europris ASA (Retailing)(a) | 10,466,058 | ||||||
| 178,092 | Fjordkraft Holding ASA (Utilities)(a) | 1,466,730 | ||||||
| 14,641 | Kongsberg Gruppen ASA (Capital Goods) | 237,907 | ||||||
| 430,041 | Salmar ASA (Food, Beverage & Tobacco)* | 21,837,669 | ||||||
|
| |||||||
| 38 | The accompanying notes are an integral part of these financial statements. |
GOLDMAN SACHS INTERNATIONAL SMALL CAP INSIGHTS FUND
| Shares | Description | Value | ||||||
| Common Stocks – (continued) | ||||||||
| Norway – (continued) | ||||||||
| 422,050 | Scatec Solar ASA (Utilities)(a) | $ | 9,336,457 | |||||
| 237,953 | Selvaag Bolig ASA (Real Estate) | 1,185,197 | ||||||
| 516,071 | SpareBank 1 SMN (Banks) | 4,451,880 | ||||||
| 121,942 | Storebrand ASA (Insurance)* | 643,531 | ||||||
| 15,855 | TOMRA Systems ASA (Commercial & Professional Services) | 640,331 | ||||||
| 362,110 | Veidekke ASA (Capital Goods)* | 4,173,296 | ||||||
| 173,742 | Wallenius Wilhelmsen ASA (Transportation) | 331,518 | ||||||
|
| |||||||
| 74,766,417 | ||||||||
|
| |||||||
| Portugal – 0.1% | ||||||||
| 396,629 | CTT-Correios de Portugal SA (Transportation)* | 970,442 | ||||||
| 1,650,561 | Sonae SGPS SA (Food & Staples Retailing) | 972,891 | ||||||
|
| |||||||
| 1,943,333 | ||||||||
|
| |||||||
| Singapore – 0.6% | ||||||||
| 90,500 | AIMS APAC REIT (REIT) | 78,263 | ||||||
| 1,387,900 | China Aviation Oil Singapore Corp. Ltd. (Energy) | 934,748 | ||||||
| 4,005,200 | ESR-REIT (REIT) | 1,028,512 | ||||||
| 1,126,861 | Frasers Logistics & Commercial Trust (REIT) | 1,016,131 | ||||||
| 3,384,500 | Keppel DC REIT (REIT) | 7,186,027 | ||||||
| 1,794,500 | Parkway Life REIT (REIT) | 5,319,746 | ||||||
| 556,300 | Sabana Shari’ah Compliant Industrial REIT (REIT) | 142,601 | ||||||
| 4,340,800 | Singapore Post Ltd. (Transportation) | 2,116,402 | ||||||
|
| |||||||
| 17,822,430 | ||||||||
|
| |||||||
| South Africa – 0.0% | ||||||||
| 118,446 | Investec plc (Diversified Financials) | 220,415 | ||||||
|
| |||||||
| Spain – 1.6% | ||||||||
| 1,189,040 | Acerinox SA (Materials)* | 9,438,934 | ||||||
| 1,583,593 | Applus Services SA (Commercial & Professional Services)* | 12,412,981 | ||||||
| 625,167 | Cia de Distribucion Integral Logista Holdings SA (Transportation) | 10,554,980 | ||||||
| 16,468 | Euskaltel SA (Telecommunication Services)(a) | 156,696 | ||||||
| 192,559 | Faes Farma SA (Pharmaceuticals, Biotechnology & Life Sciences) | 725,674 | ||||||
| 261,673 | Global Dominion Access SA (Software & Services)*(a) | 931,034 | ||||||
| 161,835 | Merlin Properties Socimi SA (REIT) | 1,089,319 | ||||||
| 53,664 | Pharma Mar SA (Pharmaceuticals, Biotechnology & Life Sciences) | 7,204,236 | ||||||
| 196,128 | Solaria Energia y Medio Ambiente SA (Utilities)* | 3,815,814 | ||||||
| 19,096 | Viscofan SA (Food, Beverage & Tobacco) | 1,288,817 | ||||||
|
| |||||||
| 47,618,485 | ||||||||
|
| |||||||
| Common Stocks – (continued) | ||||||||
| Sweden – 6.1% | ||||||||
| 1,711,546 | Arjo AB Class B (Health Care Equipment & Services) | 12,165,702 | ||||||
| 215,467 | Atrium Ljungberg AB Class B (Real Estate) | 3,480,896 | ||||||
| 37,867 | Avanza Bank Holding AB (Diversified Financials) | 721,227 | ||||||
| 2,122,902 | Betsson AB (Consumer Services)* | 16,175,480 | ||||||
| 404,207 | Bilia AB Class A (Retailing) | 5,376,601 | ||||||
| 181,944 | BillerudKorsnas AB (Materials)* | 2,842,160 | ||||||
| 670,975 | Biotage AB (Pharmaceuticals, Biotechnology & Life Sciences)* | 11,182,414 | ||||||
| 72,090 | Bravida Holding AB (Commercial & Professional Services)(a) | 832,020 | ||||||
| 41,473 | Castellum AB (Real Estate) | 863,495 | ||||||
| 306,885 | Clas Ohlson AB Class B (Retailing)*(b) | 2,715,406 | ||||||
| 130,687 | Coor Service Management Holding AB (Commercial & Professional Services)*(a) | 839,717 | ||||||
| 855,795 | Dustin Group AB (Retailing)(a) | 5,442,574 | ||||||
| 1,143,437 | Fabege AB (Real Estate) | 14,438,068 | ||||||
| 914,911 | Getinge AB Class B (Health Care Equipment & Services) | 17,913,940 | ||||||
| 234,016 | Granges AB (Materials)*(b) | 2,110,860 | ||||||
| 1,814,049 | Hexpol AB (Materials) | 15,977,012 | ||||||
| 929,592 | Inwido AB (Capital Goods)* | 9,836,901 | ||||||
| 290,624 | Kungsleden AB (Real Estate) | 2,466,178 | ||||||
| 361,122 | LeoVegas AB (Consumer Services)(a) | 1,208,167 | ||||||
| 635,386 | Lindab International AB (Capital Goods) | 9,808,814 | ||||||
| 339,614 | Loomis AB (Commercial & Professional Services)* | 7,583,532 | ||||||
| 922,553 | Nobia AB (Consumer Durables & Apparel)* | 5,560,607 | ||||||
| 944,879 | Nobina AB (Transportation)*(a) | 5,181,381 | ||||||
| 148,741 | Nolato AB Class B (Capital Goods)* | 12,371,692 | ||||||
| 30,737 | Paradox Interactive AB (Media & Entertainment) | 952,578 | ||||||
| 591,647 | Resurs Holding AB (Diversified Financials)(a) | 2,704,743 | ||||||
| 253,861 | Wihlborgs Fastigheter AB (Real Estate) | 4,575,706 | ||||||
|
| |||||||
| 175,327,871 | ||||||||
|
| |||||||
| Switzerland – 5.4% | ||||||||
| 10,336 | Allreal Holding AG (Registered) (Real Estate) | 2,189,159 | ||||||
| 81,766 | ALSO Holding AG (Registered) (Technology Hardware & Equipment)* | 19,130,522 | ||||||
| 9,017 | Ascom Holding AG (Registered) (Health Care Equipment & Services)* | 108,110 | ||||||
| 49,440 | Bachem Holding AG (Registered) Class B (Pharmaceuticals, Biotechnology & Life Sciences) | 19,986,095 | ||||||
|
| |||||||
| The accompanying notes are an integral part of these financial statements. | 39 |
GOLDMAN SACHS INTERNATIONAL SMALL CAP INSIGHTS FUND
Schedule of Investments (continued)
October 31, 2020
| Shares | Description | Value | ||||||
| Common Stocks – (continued) | ||||||||
| Switzerland – (continued) | ||||||||
| 429 | Belimo Holding AG (Registered) (Capital Goods) | $ | 3,190,349 | |||||
| 32,342 | Bucher Industries AG (Registered) (Capital Goods) | 12,468,559 | ||||||
| 436 | Conzzeta AG (Registered) (Capital Goods) | 439,479 | ||||||
| 236 | Forbo Holding AG (Registered) (Consumer Durables & Apparel) | 361,338 | ||||||
| 388,780 | Galenica AG (Health Care Equipment & Services)(a) | 24,517,225 | ||||||
| 3,473 | Gurit Holding AG (Materials) | 7,273,625 | ||||||
| 222,521 | Huber + Suhner AG (Registered) (Capital Goods) | 16,047,096 | ||||||
| 4,041 | Interroll Holding AG (Registered) (Capital Goods) | 10,857,477 | ||||||
| 3,335 | Kardex Holding AG (Registered) (Capital Goods) | 588,828 | ||||||
| 205 | Schweiter Technologies AG (Capital Goods) | 279,984 | ||||||
| 79,063 | Tecan Group AG (Registered) (Pharmaceuticals, Biotechnology & Life Sciences) | 37,517,664 | ||||||
| 40,917 | Zehnder Group AG (Capital Goods) | 1,956,930 | ||||||
|
| |||||||
| 156,912,440 | ||||||||
|
| |||||||
| Ukraine – 0.1% | ||||||||
| 931,354 | Ferrexpo plc (Materials) | 2,298,404 | ||||||
|
| |||||||
| United Kingdom – 12.8% | ||||||||
| 2,202,535 | Assura plc (REIT) | 2,174,279 | ||||||
| 52,489 | Big Yellow Group plc (REIT) | 748,017 | ||||||
| 5,470,948 | boohoo Group plc (Retailing)*(b) | 19,174,056 | ||||||
| 492,147 | Central Asia Metals plc (Materials)* | 1,074,514 | ||||||
| 105,952 | Civitas Social Housing plc (REIT) | 142,763 | ||||||
| 450,229 | Computacenter plc (Software & Services) | 13,298,384 | ||||||
| 29,653 | Cranswick plc (Food, Beverage & Tobacco) | 1,236,088 | ||||||
| 120,264 | Derwent London plc (REIT) | 4,141,472 | ||||||
| 331,433 | Dialog Semiconductor plc (Semiconductors & Semiconductor Equipment)* | 12,635,519 | ||||||
| 345,053 | Diploma plc (Capital Goods) | 9,935,966 | ||||||
| 25,045 | DS Smith plc (Materials) | 91,870 | ||||||
| 379,791 | Dunelm Group plc (Retailing) | 6,420,720 | ||||||
| 22,707 | EMIS Group plc (Health Care Equipment & Services) | 292,992 | ||||||
| 34,517 | Frasers Group plc (Retailing)* | 167,448 | ||||||
| 4,678 | Frontier Developments plc (Media & Entertainment)* | 158,175 | ||||||
| 170,524 | Games Workshop Group plc (Consumer Durables & Apparel) | 22,924,646 | ||||||
| 20,323 | GB Group plc (Software & Services)* | 234,060 | ||||||
| 239,274 | GCP Student Living plc (REIT) | 347,203 | ||||||
| 564,288 | Grainger plc (Real Estate) | 2,044,317 | ||||||
| 637,298 | Greggs plc (Consumer Services)* | 10,643,429 | ||||||
|
| |||||||
| Common Stocks – (continued) | ||||||||
| United Kingdom – (continued) | ||||||||
| 126,119 | Halfords Group plc (Retailing) | 392,946 | ||||||
| 546,628 | Hays plc (Commercial & Professional Services) | 754,818 | ||||||
| 14,984 | Hill & Smith Holdings plc (Materials) | 233,031 | ||||||
| 355,680 | HomeServe plc (Commercial & Professional Services) | 5,097,399 | ||||||
| 1,061,360 | Howden Joinery Group plc (Capital Goods) | 8,762,430 | ||||||
| 3,162,024 | IG Group Holdings plc (Diversified Financials) | 31,204,449 | ||||||
| 1,083,944 | IMI plc (Capital Goods) | 14,534,128 | ||||||
| 2,317,915 | Inchcape plc (Retailing) | 14,868,782 | ||||||
| 26,872 | ITM Power plc (Capital Goods)*(b) | 80,453 | ||||||
| 22,581,798 | ITV plc (Media & Entertainment)* | 21,104,150 | ||||||
| 1,442 | Judges Scientific plc (Capital Goods) | 100,878 | ||||||
| 877,519 | Jupiter Fund Management plc (Diversified Financials) | 2,639,710 | ||||||
| 226,291 | Just Group plc (Insurance)* | 123,533 | ||||||
| 392,058 | Kainos Group plc (Software & Services) | 6,288,130 | ||||||
| 13,629,552 | Man Group plc (Diversified Financials) | 19,019,576 | ||||||
| 964,348 | Marshalls plc (Materials)* | 8,354,973 | ||||||
| 6,371,204 | Moneysupermarket.com Group plc (Retailing) | 20,123,062 | ||||||
| 105,887 | Morgan Sindall Group plc (Capital Goods) | 1,512,953 | ||||||
| 191,780 | NCC Group plc (Software & Services) | 455,119 | ||||||
| 474,413 | Ninety One plc (Diversified Financials)* | 1,275,327 | ||||||
| 380,361 | OneSavings Bank plc (Banks) | 1,517,242 | ||||||
| 1,161,925 | Pagegroup plc (Commercial & Professional Services) | 5,382,928 | ||||||
| 1,429,163 | Paragon Banking Group plc (Banks) | 5,483,891 | ||||||
| 115,865 | Picton Property Income Ltd. (The) (REIT) | 93,514 | ||||||
| 619,379 | Playtech plc (Consumer Services) | 2,731,080 | ||||||
| 161,396 | Provident Financial plc (Diversified Financials) | 486,017 | ||||||
| 1,273,232 | Rightmove plc (Media & Entertainment) | 10,189,911 | ||||||
| 1,558,644 | Royal Mail plc (Transportation) | 4,587,742 | ||||||
| 1,464,751 | Safestore Holdings plc (REIT) | 15,248,028 | ||||||
| 62,970 | Savills plc (Real Estate) | 678,205 | ||||||
| 523,703 | Softcat plc (Software & Services) | 7,634,357 | ||||||
| 239,244 | Spectris plc (Technology Hardware & Equipment) | 7,678,607 | ||||||
| 3,290,878 | Spirent Communications plc (Technology Hardware & Equipment) | 12,354,762 | ||||||
| 2,903,658 | Tate & Lyle plc (Food, Beverage & Tobacco) | 22,383,678 | ||||||
|
| |||||||
| 40 | The accompanying notes are an integral part of these financial statements. |
GOLDMAN SACHS INTERNATIONAL SMALL CAP INSIGHTS FUND
| Shares | Description | Value | ||||||
| Common Stocks – (continued) | ||||||||
| United Kingdom – (continued) | ||||||||
| 124,619 | TP ICAP plc (Diversified Financials) | $ | 308,591 | |||||
| 6,858 | Travis Perkins plc (Capital Goods)* | 94,190 | ||||||
| 595,048 | UNITE Group plc (The) (REIT) | 6,421,589 | ||||||
| 101,620 | Vesuvius plc (Capital Goods) | 525,638 | ||||||
| 186,404 | Watkin Jones plc (Real Estate) | 323,109 | ||||||
| 79,449 | Workspace Group plc (REIT) | 635,128 | ||||||
|
| |||||||
| 369,569,972 | ||||||||
|
| |||||||
| United States – 0.3% | ||||||||
| 3,413,034 | Reliance Worldwide Corp. Ltd. (Capital Goods) | 9,852,530 | ||||||
|
| |||||||
| TOTAL COMMON STOCKS | ||||||||
| (Cost $2,617,126,993) | $ | 2,816,066,517 | ||||||
|
| |||||||
| Units | Description | Expiration Month | Value | |||||||
| Right* – 0.0% | ||||||||||
| United Kingdom – 0.0% | ||||||||||
| 167 | ITM Power plc (Capital Goods) | 11/2020 | $ | — | ||||||
| (Cost $0) | ||||||||||
| ||||||||||
| TOTAL INVESTMENTS BEFORE SECURITIES LENDING REINVESTMENT VEHICLE |
| |||||||||
| (Cost $2,617,126,993) |
| $ | 2,816,066,517 | |||||||
| ||||||||||
| Shares | Dividend Rate | Value | ||||
| Securities Lending Reinvestment Vehicle(d) – 1.0% | ||||||
Goldman Sachs Financial Square Government Fund – Institutional Shares |
| |||||
| 29,274,156 | 0.028% | $ | 29,274,156 | |||
| (Cost $29,274,156) |
| |||||
| ||||||
| TOTAL INVESTMENTS – 98.2% |
| |||||
| (Cost $2,646,401,149) | $ | 2,845,340,673 | ||||
| ||||||
OTHER ASSETS IN EXCESS OF LIABILITIES – 1.8% | 51,655,673 | |||||
| ||||||
| NET ASSETS – 100.0% | $ | 2,896,996,346 | ||||
| ||||||
| The percentage shown for each investment category reflects the value of investments in that category as a percentage of net assets. | ||
* | Security is currently in default and/or non-income producing. | |
(a) | Exempt from registration under Rule 144A of the Securities Act of 1933. | |
(b) | All or a portion of security is on loan. | |
(c) | Preference Shares are a special type of equity investment that shares in the earnings of the company, has limited voting rights, and receives a greater dividend than applicable Common Shares. | |
(d) | Represents an Affiliated Issuer. | |
| ||
Investment Abbreviations: | ||
CVA | —Dutch Certification | |
REIT | —Real Estate Investment Trust | |
| ||
| ADDITIONAL INVESTMENT INFORMATION |
FUTURES CONTRACTS — At October 31, 2020, the Fund had the following futures contracts:
| Description | Number of Contracts | Expiration Date | Notional Amount | Unrealized Appreciation/ (Depreciation) | ||||||||||||
Long position contracts: | ||||||||||||||||
EURO STOXX 50 Index | 398 | 12/18/2020 | $ | 13,715,873 | $ | (1,052,615 | ) | |||||||||
FTSE 100 Index | 89 | 12/18/2020 | 6,414,688 | (273,618 | ) | |||||||||||
Hang Seng Index | 5 | 11/27/2020 | 779,007 | (16,999 | ) | |||||||||||
MSCI Singapore Index | 33 | 11/27/2020 | 665,943 | (25,633 | ) | |||||||||||
SPI 200 Index | 32 | 12/17/2020 | 3,312,065 | (155,138 | ) | |||||||||||
TOPIX Index | 74 | 12/10/2020 | 11,118,200 | (344,793 | ) | |||||||||||
| Total Futures Contracts | $ | (1,868,796 | ) | |||||||||||||
| The accompanying notes are an integral part of these financial statements. | 41 |
GOLDMAN SACHS INTERNATIONAL EQUITY INSIGHTS FUNDS
Statements of Assets and Liabilities
October 31, 2020
| Emerging Markets Equity Insights Fund | International Equity Insights Fund | International Small Cap Insights Fund | ||||||||||||
| Assets: |
| |||||||||||||
Investments in unaffiliated issuers, at value (cost $1,329,211,212, $2,086,125,309 and $2,617,126,993)(a) | $ | 1,690,312,520 | $ | 2,201,807,288 | $ | 2,816,066,517 | ||||||||
Investments in affiliated securities lending reinvestment vehicle, at value (cost $500,400, $25,795,600 and $29,274,156) | 500,400 | 25,795,600 | 29,274,156 | |||||||||||
Cash | 24,863,000 | 9,632,037 | 36,739,441 | |||||||||||
Foreign currencies, at value (cost $1,882,691, $14,980,117 and $25,859,027) | 1,884,990 | 14,918,832 | 25,843,596 | |||||||||||
Receivables: | ||||||||||||||
Investments sold | 29,543,282 | 22,313 | 42,385,386 | |||||||||||
Dividends | 3,354,244 | 6,139,446 | 8,861,686 | |||||||||||
Collateral on certain derivative contracts(b) | 758,430 | — | 3,390,903 | |||||||||||
Fund shares sold | 427,800 | 1,990,771 | 3,937,212 | |||||||||||
Foreign tax reclaims | 92,358 | 5,041,497 | 6,494,215 | |||||||||||
Reimbursement from investment adviser | 20,192 | 175,754 | 217,402 | |||||||||||
Securities lending income | 4,050 | 5,049 | 46,201 | |||||||||||
Due from custodian | — | 2,727,672 | 7,338,742 | |||||||||||
Variation margin on futures | — | 643 | — | |||||||||||
Other assets | 50,849 | 74,293 | 60,232 | |||||||||||
| Total assets | 1,751,812,115 | 2,268,331,195 | 2,980,655,689 | |||||||||||
| Liabilities: |
| |||||||||||||
Variation margin on futures | 109,710 | — | 262,084 | |||||||||||
Payables: | ||||||||||||||
Investments purchased | 30,649,423 | 2,727,672 | 47,673,684 | |||||||||||
Management fees | 1,459,900 | 1,528,285 | 2,132,140 | |||||||||||
Foreign capital gains taxes | 1,379,813 | — | — | |||||||||||
Fund shares redeemed | 904,153 | 5,538,403 | 3,219,871 | |||||||||||
Payable upon return of securities loaned | 500,400 | 25,795,600 | 29,274,156 | |||||||||||
Distribution and Service fees and Transfer Agency fees | 100,684 | 197,875 | 178,609 | |||||||||||
Accrued expenses | 574,111 | 438,412 | 918,799 | |||||||||||
| Total liabilities | 35,678,194 | 36,226,247 | 83,659,343 | |||||||||||
| Net Assets: | ||||||||||||||
Paid-in capital | 1,585,039,965 | 2,456,091,798 | 3,239,221,681 | |||||||||||
Total distributable earnings (loss) | 131,093,956 | (223,986,850 | ) | (342,225,335 | ) | |||||||||
| NET ASSETS | $ | 1,716,133,921 | $ | 2,232,104,948 | $ | 2,896,996,346 | ||||||||
Net Assets: | ||||||||||||||
Class A | $ | 52,067,879 | $ | 204,087,140 | $ | 120,602,011 | ||||||||
Class C | 5,905,139 | 13,483,779 | 29,189,999 | |||||||||||
Institutional | 961,138,097 | 810,509,503 | 1,608,195,146 | |||||||||||
Service | — | 3,675,267 | — | |||||||||||
Investor | 89,555,543 | 311,445,654 | 131,558,140 | |||||||||||
Class R6 | 465,603,687 | 522,706,897 | 963,820,525 | |||||||||||
Class R | 29,634,823 | 8,321,356 | — | |||||||||||
Class P | 112,228,753 | 357,875,352 | 43,630,525 | |||||||||||
Total Net Assets | $ | 1,716,133,921 | $ | 2,232,104,948 | $ | 2,896,996,346 | ||||||||
Shares outstanding $0.001 par value (unlimited shares authorized): | ||||||||||||||
Class A | 5,081,669 | 17,896,054 | 11,001,771 | |||||||||||
Class C | 584,891 | 1,211,511 | 2,763,872 | |||||||||||
Institutional | 93,860,160 | 68,933,311 | 146,588,704 | |||||||||||
Service | — | 319,101 | — | |||||||||||
Investor | 8,761,744 | 27,829,768 | 12,048,915 | |||||||||||
Class R6 | 45,506,435 | 44,489,028 | 87,664,406 | |||||||||||
Class R | 2,939,931 | 751,363 | — | |||||||||||
Class P | 10,968,354 | 30,483,358 | 3,968,401 | |||||||||||
Net asset value, offering and redemption price per share:(c) | ||||||||||||||
Class A | $10.25 | $11.40 | $10.96 | |||||||||||
Class C | 10.10 | 11.13 | 10.56 | |||||||||||
Institutional | 10.24 | 11.76 | 10.97 | |||||||||||
Service | — | 11.52 | — | |||||||||||
Investor | 10.22 | 11.19 | 10.92 | |||||||||||
Class R6 | 10.23 | 11.75 | 10.99 | |||||||||||
Class R | 10.08 | 11.08 | — | |||||||||||
Class P | 10.23 | 11.74 | 10.99 | |||||||||||
| (a) | Includes loaned securities having a market value of $452,493, $24,400,279 and $28,131,035, for the Emerging Markets Equity Insights, International Equity Insights and International Small Cap Insights Funds, respectively. |
| (b) | Includes amount segregated for initial margin and/or collateral on futures transactions for Emerging Markets Equity Insights and International Small Cap Insights Funds, respectively. |
| (c) | Maximum public offering price per share for Class A Shares of the Emerging Markets Equity Insights, International Equity Insights and International Small Cap Insights Funds is $10.85, $12.06 and $11.60, respectively. At redemption, Class C Shares may be subject to a contingent deferred sales charge assessed on the amount equal to the lesser of the current NAV or the original purchase price of the shares. |
| 42 | The accompanying notes are an integral part of these financial statements. |
GOLDMAN SACHS INTERNATIONAL EQUITY INSIGHTS FUNDS
Statements of Operations
For the Fiscal Year Ended October 31, 2020
| Emerging Markets Equity Insights Fund | International Equity Insights Fund | International Small Cap Insights Fund | ||||||||||||
| Investment income: |
| |||||||||||||
Dividends — unaffiliated issuers (net of foreign taxes withheld of $4,982,542, $5,705,154 and $6,922,848) | $ | 43,052,697 | $ | 58,717,399 | $ | 65,520,330 | ||||||||
Securities lending income — affiliated issuer | 66,802 | 260,752 | 610,019 | |||||||||||
Dividends — affiliated issuers | 13,155 | 26,937 | 456 | |||||||||||
Income from non-cash dividends | — | 3,185,344 | — | |||||||||||
| Total investment income | 43,132,654 | 62,190,432 | 66,130,805 | |||||||||||
| Expenses: |
| |||||||||||||
Management fees | 16,506,328 | 19,782,283 | 26,892,347 | |||||||||||
Custody, accounting and administrative services | 1,214,501 | 831,916 | 1,181,261 | |||||||||||
Transfer Agency fees(a) | 847,740 | 1,894,768 | 1,655,933 | |||||||||||
Distribution and Service (12b-1) fees(a) | 334,164 | 768,142 | 630,999 | |||||||||||
Printing and mailing costs | 220,586 | 328,949 | 815,113 | |||||||||||
Registration fees | 156,663 | 216,218 | 159,417 | |||||||||||
Professional fees | 121,816 | 115,527 | 114,088 | |||||||||||
Trustee fees | 22,224 | 23,816 | 24,783 | |||||||||||
Service fees — Class C | 16,781 | 43,706 | 96,926 | |||||||||||
Shareholder administration fees — Service Shares | — | 10,704 | — | |||||||||||
Other | 196,721 | 99,954 | 130,569 | |||||||||||
| Total expenses | 19,637,524 | 24,115,983 | 31,701,436 | |||||||||||
Less — expense reductions | (1,067,343 | ) | (1,563,602 | ) | (1,981,293 | ) | ||||||||
| Net expenses | 18,570,181 | 22,552,381 | 29,720,143 | |||||||||||
| NET INVESTMENT INCOME | 24,562,473 | 39,638,051 | 36,410,662 | |||||||||||
| Realized and unrealized gain (loss): |
| |||||||||||||
Net realized gain (loss) from: | ||||||||||||||
Investments — unaffiliated issuers | (62,500,009 | ) | (146,510,347 | ) | (212,747,666 | ) | ||||||||
Futures contracts | 5,971,537 | 6,902,118 | 4,353,779 | |||||||||||
Foreign currency transactions | (2,690,576 | ) | 1,398,436 | (1,429,786 | ) | |||||||||
Net change in unrealized gain (loss) on: |
| |||||||||||||
Investments — unaffiliated issuers (including the effects of the net change in the foreign capital gains tax liability of $1,758,072, $0 and $0) | 200,548,171 | (66,882,378 | ) | (34,125,254 | ) | |||||||||
Futures contracts | 32,269 | (18,421 | ) | (1,877,027 | ) | |||||||||
Foreign currency translation | 573,351 | 163,277 | 75,751 | |||||||||||
| Net realized and unrealized gain (loss) | 141,934,743 | (204,947,315 | ) | (245,750,203 | ) | |||||||||
| NET INCREASE (DECREASE) IN NET ASSETS RESULTING FROM OPERATIONS | $ | 166,497,216 | $ | (165,309,264 | ) | $ | (209,339,541 | ) | ||||||
| (a) | Class specific Distribution and/or Service, and Transfer Agency fees were as follows: |
| Distribution and/or Service (12b-1) Fees | Transfer Agency Fees | |||||||||||||||||||||||||||||||||||||||||||||||
Fund | Class A | Class C | Service | Class R | Class A | Class C | Institutional | Service | Investor | Class R6 | Class R | Class P | ||||||||||||||||||||||||||||||||||||
Emerging Markets Equity Insights | $ | 147,566 | $ | 50,342 | $ | — | $ | 136,256 | $ | 98,559 | $ | 11,214 | $ | 367,299 | $ | — | $ | 162,762 | $ | 130,329 | $ | 45,347 | $ | 32,230 | ||||||||||||||||||||||||
International Equity Insights | 583,069 | 131,120 | 10,704 | 43,249 | 389,100 | 29,244 | 391,837 | 1,708 | 793,395 | 168,405 | 14,405 | 106,674 | ||||||||||||||||||||||||||||||||||||
International Small Cap Insights | 340,223 | 290,776 | — | — | 227,062 | 64,884 | 714,886 | — | 307,454 | 324,929 | — | 16,718 | ||||||||||||||||||||||||||||||||||||
| The accompanying notes are an integral part of these financial statements. | 43 |
GOLDMAN SACHS INTERNATIONAL EQUITY INSIGHTS FUNDS
Statements of Changes in Net Assets
| Emerging Markets Equity Insights Fund | International Equity Insights Fund | |||||||||||||||||||||
| For the Fiscal Year Ended October 31, 2020 | For the Fiscal Year Ended October 31, 2019 | For the Fiscal Year Ended October 31, 2020 | For the Fiscal Year Ended October 31, 2019 | |||||||||||||||||||
| From operations: |
| |||||||||||||||||||||
Net investment income | $ | 24,562,473 | $ | 37,179,379 | $ | 39,638,051 | $ | 68,116,968 | ||||||||||||||
Net realized loss | (59,219,048 | ) | (155,271,349 | ) | (138,209,793 | ) | (211,846,876 | ) | ||||||||||||||
Net change in unrealized gain (loss) | 201,153,791 | 228,850,921 | (66,737,522 | ) | 344,013,406 | |||||||||||||||||
| Net increase (decrease) in net assets resulting from operations | 166,497,216 | 110,758,951 | (165,309,264 | ) | 200,283,498 | |||||||||||||||||
| Distributions to shareholders: |
| |||||||||||||||||||||
From distributable earnings: | ||||||||||||||||||||||
Class A Shares | (1,170,011 | ) | (1,382,695 | ) | (6,053,941 | ) | (2,441,498 | ) | ||||||||||||||
Class C Shares | (56,474 | ) | (82,497 | ) | (273,424 | ) | (230,590 | ) | ||||||||||||||
Institutional Shares | (19,988,850 | ) | (21,025,697 | ) | (30,508,959 | ) | (21,903,837 | ) | ||||||||||||||
Service Shares | — | — | (105,545 | ) | (64,202 | ) | ||||||||||||||||
Investor Shares | (2,202,457 | ) | (2,145,536 | ) | (14,717,983 | ) | (7,168,724 | ) | ||||||||||||||
Class R6 Shares | (9,800,344 | ) | (11,923,948 | ) | (15,101,395 | ) | (8,467,600 | ) | ||||||||||||||
Class R Shares | (438,620 | ) | (318,449 | ) | (176,443 | ) | (107,227 | ) | ||||||||||||||
Class P Shares | (2,563,794 | ) | (3,090,275 | ) | (9,256,226 | ) | (5,642,654 | ) | ||||||||||||||
| Total distributions to shareholders | (36,220,550 | ) | (39,969,097 | ) | (76,193,916 | ) | (46,026,332 | ) | ||||||||||||||
| From share transactions: |
| |||||||||||||||||||||
Proceeds from sales of shares | 518,724,358 | 878,269,720 | 948,110,037 | 1,976,021,453 | ||||||||||||||||||
Reinvestment of distributions | 33,859,109 | 37,448,911 | 61,919,453 | 36,692,122 | ||||||||||||||||||
Cost of shares redeemed | (749,322,930 | ) | (1,146,688,181 | ) | (1,585,726,253 | ) | (1,724,995,996 | ) | ||||||||||||||
| Net increase (decrease) in net assets resulting from share transactions | (196,739,463 | ) | (230,969,550 | ) | (575,696,763 | ) | 287,717,579 | |||||||||||||||
| TOTAL INCREASE (DECREASE) | (66,462,797 | ) | (160,179,696 | ) | (817,199,943 | ) | 441,974,745 | |||||||||||||||
| Net Assets: |
| |||||||||||||||||||||
Beginning of year | 1,782,596,718 | 1,942,776,414 | 3,049,304,891 | 2,607,330,146 | ||||||||||||||||||
End of year | $ | 1,716,133,921 | $ | 1,782,596,718 | $ | 2,232,104,948 | $ | 3,049,304,891 | ||||||||||||||
| 44 | The accompanying notes are an integral part of these financial statements. |
GOLDMAN SACHS INTERNATIONAL EQUITY INSIGHTS FUNDS
Statements of Changes in Net Assets (continued)
| International Small Cap Insights Fund | ||||||||||
| For the Fiscal Year Ended October 31, 2020 | For the Fiscal Year Ended October 31, 2019 | |||||||||
| From operations: |
| |||||||||
Net investment income | $ | 36,410,662 | $ | 75,247,934 | ||||||
Net realized loss | (209,823,673 | ) | (264,294,218 | ) | ||||||
Net change in unrealized gain (loss) | (35,926,530 | ) | 427,695,952 | |||||||
| Net increase (decrease) in net assets resulting from operations | (209,339,541 | ) | 238,649,668 | |||||||
| Distributions to shareholders: |
| |||||||||
From distributable earnings: | ||||||||||
Class A Shares | (5,023,326 | ) | (1,847,569 | ) | ||||||
Class C Shares | (1,160,269 | ) | (140,227 | ) | ||||||
Institutional Shares | (75,418,332 | ) | (35,596,707 | ) | ||||||
Investor Shares | (8,589,904 | ) | (5,911,450 | ) | ||||||
Class R6 Shares | (41,125,645 | ) | (16,511,878 | ) | ||||||
Class P Shares | (2,779,660 | ) | (1,347,821 | ) | ||||||
| Total distributions to shareholders | (134,097,136 | ) | (61,355,652 | ) | ||||||
| From share transactions: |
| |||||||||
Proceeds from sales of shares | 839,452,474 | 1,411,878,385 | ||||||||
Reinvestment of distributions | 123,448,591 | 56,353,633 | ||||||||
Cost of shares redeemed | (1,619,152,181 | ) | (1,960,823,746 | ) | ||||||
| Net decrease in net assets resulting from share transactions | (656,251,116 | ) | (492,591,728 | ) | ||||||
| TOTAL DECREASE | (999,687,793 | ) | (315,297,712 | ) | ||||||
| Net Assets: |
| |||||||||
Beginning of year | 3,896,684,139 | 4,211,981,851 | ||||||||
End of year | $ | 2,896,996,346 | $ | 3,896,684,139 | ||||||
| The accompanying notes are an integral part of these financial statements. | 45 |
GOLDMAN SACHS EMERGING MARKETS EQUITY INSIGHTS FUND
Selected Data for a Share Outstanding Throughout Each Year
| (a) | Calculated based on the average shares outstanding methodology. |
| (b) | Assumes investment at the net asset value at the beginning of the year, reinvestment of all distributions, a complete redemption of the investment at the net asset value at the end of the year and no sales or redemption charges (if any). Total returns would be reduced if a sales or redemption charge was taken into account. Returns do not reflect the impact of taxes to shareholders relating to Fund distributions or the redemption of Fund shares. |
| (c) | The Fund’s portfolio turnover rate is calculated in accordance with regulatory requirements, without regard to transactions involving short term investments and certain derivatives. If such transactions were included, the Fund’s portfolio turnover rate may be higher. |
| 46 | The accompanying notes are an integral part of these financial statements. |
GOLDMAN SACHS EMERGING MARKETS EQUITY INSIGHTS FUND
Financial Highlights (continued)
Selected Data for a Share Outstanding Throughout Each Year
| Goldman Sachs Emerging Markets Equity Insights Fund | ||||||||||||||||||||||
| Class C Shares | ||||||||||||||||||||||
| Year Ended October 31, | ||||||||||||||||||||||
| 2020 | 2019 | 2018 | 2017 | 2016 | ||||||||||||||||||
| Per Share Data |
| |||||||||||||||||||||
Net asset value, beginning of year | $ | 9.19 | $ | 8.83 | $ | 10.88 | $ | 8.45 | $ | 7.84 | ||||||||||||
Net investment income(a) | 0.04 | 0.08 | 0.10 | 0.07 | 0.04 | |||||||||||||||||
Net realized and unrealized gain (loss) | 0.94 | 0.36 | (1.64 | ) | 2.39 | 0.58 | ||||||||||||||||
Total from investment operations | 0.98 | 0.44 | (1.54 | ) | 2.46 | 0.62 | ||||||||||||||||
Distributions to shareholders from net investment income | (0.07 | ) | (0.08 | ) | (0.09 | ) | (0.03 | ) | (0.01 | ) | ||||||||||||
Distributions to shareholders from net realized gains | — | — | (0.42 | ) | — | — | ||||||||||||||||
Total distributions | (0.07 | ) | (0.08 | ) | (0.51 | ) | (0.03 | ) | (0.01 | ) | ||||||||||||
Net asset value, end of year | $ | 10.10 | $ | 9.19 | $ | 8.83 | $ | 10.88 | $ | 8.45 | ||||||||||||
| Total return(b) | 10.65 | % | 5.09 | % | (14.80 | )% | 29.20 | % | 7.97 | % | ||||||||||||
Net assets, end of year (in 000s) | $ | 5,905 | $ | 8,303 | $ | 8,975 | $ | 7,563 | $ | 1,132 | ||||||||||||
Ratio of net expenses to average net assets | 2.21 | % | 2.23 | % | 2.23 | % | 2.26 | % | 2.31 | % | ||||||||||||
Ratio of total expenses to average net assets | 2.28 | % | 2.31 | % | 2.29 | % | 2.29 | % | 2.39 | % | ||||||||||||
Ratio of net investment income to average net assets | 0.41 | % | 0.85 | % | 0.98 | % | 0.72 | % | 0.47 | % | ||||||||||||
Portfolio turnover rate(c) | 178 | % | 165 | % | 147 | % | 172 | % | 216 | % | ||||||||||||
| (a) | Calculated based on the average shares outstanding methodology. |
| (b) | Assumes investment at the net asset value at the beginning of the year, reinvestment of all distributions, a complete redemption of the investment at the net asset value at the end of the year and no sales or redemption charges (if any). Total returns would be reduced if a sales or redemption charge was taken into account. Returns do not reflect the impact of taxes to shareholders relating to Fund distributions or the redemption of Fund shares. |
| (c) | The Fund’s portfolio turnover rate is calculated in accordance with regulatory requirements, without regard to transactions involving short term investments and certain derivatives. If such transactions were included, the Fund’s portfolio turnover rate may be higher. |
| The accompanying notes are an integral part of these financial statements. | 47 |
GOLDMAN SACHS EMERGING MARKETS EQUITY INSIGHTS FUND
Financial Highlights (continued)
Selected Data for a Share Outstanding Throughout Each Year
| Goldman Sachs Emerging Markets Equity Insights Fund | ||||||||||||||||||||||
| Institutional Shares | ||||||||||||||||||||||
| Year Ended October 31, | ||||||||||||||||||||||
| 2020 | 2019 | 2018 | 2017 | 2016 | ||||||||||||||||||
| Per Share Data |
| |||||||||||||||||||||
Net asset value, beginning of year | $ | 9.33 | $ | 8.99 | $ | 11.01 | $ | 8.54 | $ | 7.91 | ||||||||||||
Net investment income(a) | 0.14 | 0.19 | 0.19 | 0.17 | 0.13 | |||||||||||||||||
Net realized and unrealized gain (loss) | 0.96 | 0.35 | (1.64 | ) | 2.41 | 0.60 | ||||||||||||||||
Total from investment operations | 1.10 | 0.54 | (1.45 | ) | 2.58 | 0.73 | ||||||||||||||||
Distributions to shareholders from net investment income | (0.19 | ) | (0.20 | ) | (0.15 | ) | (0.11 | ) | (0.10 | ) | ||||||||||||
Distributions to shareholders from net realized gains | — | — | (0.42 | ) | — | — | ||||||||||||||||
Total distributions | (0.19 | ) | (0.20 | ) | (0.57 | ) | (0.11 | ) | (0.10 | ) | ||||||||||||
Net asset value, end of year | $ | 10.24 | $ | 9.33 | $ | 8.99 | $ | 11.01 | $ | 8.54 | ||||||||||||
| Total return(b) | 11.90 | % | 6.18 | % | (13.83 | )% | 30.67 | % | 9.35 | % | ||||||||||||
Net assets, end of year (in 000s) | $ | 961,138 | $ | 938,157 | $ | 981,091 | $ | 1,488,246 | $ | 852,853 | ||||||||||||
Ratio of net expenses to average net assets | 1.09 | % | 1.10 | % | 1.10 | % | 1.15 | % | 1.16 | % | ||||||||||||
Ratio of total expenses to average net assets | 1.16 | % | 1.18 | % | 1.14 | % | 1.15 | % | 1.22 | % | ||||||||||||
Ratio of net investment income to average net assets | 1.53 | % | 2.01 | % | 1.84 | % | 1.74 | % | 1.70 | % | ||||||||||||
Portfolio turnover rate(c) | 178 | % | 165 | % | 147 | % | 172 | % | 216 | % | ||||||||||||
| (a) | Calculated based on the average shares outstanding methodology. |
| (b) | Assumes investment at the net asset value at the beginning of the year, reinvestment of all distributions, a complete redemption of the investment at the net asset value at the end of the year and no sales or redemption charges (if any). Total returns would be reduced if a sales or redemption charge was taken into account. Returns do not reflect the impact of taxes to shareholders relating to Fund distributions or the redemption of Fund shares. |
| (c) | The Fund’s portfolio turnover rate is calculated in accordance with regulatory requirements, without regard to transactions involving short term investments and certain derivatives. If such transactions were included, the Fund’s portfolio turnover rate may be higher. |
| 48 | The accompanying notes are an integral part of these financial statements. |
GOLDMAN SACHS EMERGING MARKETS EQUITY INSIGHTS FUND
Financial Highlights (continued)
Selected Data for a Share Outstanding Throughout Each Year
| Goldman Sachs Emerging Markets Equity Insights Fund | ||||||||||||||||||||||
| Investor Shares(a) | ||||||||||||||||||||||
| Year Ended October 31, | ||||||||||||||||||||||
| 2020 | 2019 | 2018 | 2017 | 2016 | ||||||||||||||||||
| Per Share Data |
| |||||||||||||||||||||
Net asset value, beginning of year | $ | 9.32 | $ | 8.97 | $ | 10.99 | $ | 8.53 | $ | 7.91 | ||||||||||||
Net investment income(b) | 0.13 | 0.18 | 0.21 | 0.18 | 0.12 | |||||||||||||||||
Net realized and unrealized gain (loss) | 0.95 | 0.36 | (1.66 | ) | 2.38 | 0.59 | ||||||||||||||||
Total from investment operations | 1.08 | 0.54 | (1.45 | ) | 2.56 | 0.71 | ||||||||||||||||
Distributions to shareholders from net investment income | (0.18 | ) | (0.19 | ) | (0.15 | ) | (0.10 | ) | (0.09 | ) | ||||||||||||
Distributions to shareholders from net realized gains | — | — | (0.42 | ) | — | — | ||||||||||||||||
Total distributions | (0.18 | ) | (0.19 | ) | (0.57 | ) | (0.10 | ) | (0.09 | ) | ||||||||||||
Net asset value, end of year | $ | 10.22 | $ | 9.32 | $ | 8.97 | $ | 10.99 | $ | 8.53 | ||||||||||||
| Total return(c) | 11.76 | % | 6.06 | % | (13.90 | )% | 30.47 | % | 9.13 | % | ||||||||||||
Net assets, end of year (in 000s) | $ | 89,556 | $ | 118,727 | $ | 96,779 | $ | 67,068 | $ | 2,565 | ||||||||||||
Ratio of net expenses to average net assets | 1.22 | % | 1.23 | % | 1.23 | % | 1.26 | % | 1.31 | % | ||||||||||||
Ratio of total expenses to average net assets | 1.28 | % | 1.31 | % | 1.29 | % | 1.29 | % | 1.37 | % | ||||||||||||
Ratio of net investment income to average net assets | 1.39 | % | 1.92 | % | 1.99 | % | 1.81 | % | 1.53 | % | ||||||||||||
Portfolio turnover rate(d) | 178 | % | 165 | % | 147 | % | 172 | % | 216 | % | ||||||||||||
| (a) | Effective August 15, 2017, Class IR changed its name to Investor Shares. |
| (b) | Calculated based on the average shares outstanding methodology. |
| (c) | Assumes investment at the net asset value at the beginning of the year, reinvestment of all distributions, a complete redemption of the investment at the net asset value at the end of the year and no sales or redemption charges (if any). Total returns would be reduced if a sales or redemption charge was taken into account. Returns do not reflect the impact of taxes to shareholders relating to Fund distributions or the redemption of Fund shares. |
| (d) | The Fund’s portfolio turnover rate is calculated in accordance with regulatory requirements, without regard to transactions involving short term investments and certain derivatives. If such transactions were included, the Fund’s portfolio turnover rate may be higher. |
| The accompanying notes are an integral part of these financial statements. | 49 |
GOLDMAN SACHS EMERGING MARKETS EQUITY INSIGHTS FUND
Financial Highlights (continued)
Selected Data for a Share Outstanding Throughout Each Year
| Goldman Sachs Emerging Markets Equity Insights Fund | ||||||||||||||||||||||
| Class R6 Shares | ||||||||||||||||||||||
| Year Ended October 31, | ||||||||||||||||||||||
| 2020 | 2019 | 2018 | 2017 | 2016 | ||||||||||||||||||
| Per Share Data |
| |||||||||||||||||||||
Net asset value, beginning of year | $ | 9.33 | $ | 8.98 | $ | 11.00 | $ | 8.53 | $ | 7.91 | ||||||||||||
Net investment income(a) | 0.14 | 0.17 | 0.29 | 0.19 | 0.10 | |||||||||||||||||
Net realized and unrealized gain (loss) | 0.95 | 0.38 | (1.73 | ) | 2.39 | 0.62 | ||||||||||||||||
Total from investment operations | 1.09 | 0.55 | (1.44 | ) | 2.58 | 0.72 | ||||||||||||||||
Distributions to shareholders from net investment income | (0.19 | ) | (0.20 | ) | (0.16 | ) | (0.11 | ) | (0.10 | ) | ||||||||||||
Distributions to shareholders from net realized gains | — | — | (0.42 | ) | — | — | ||||||||||||||||
Total distributions | (0.19 | ) | (0.20 | ) | (0.58 | ) | (0.11 | ) | (0.10 | ) | ||||||||||||
Net asset value, end of year | $ | 10.23 | $ | 9.33 | $ | 8.98 | $ | 11.00 | $ | 8.53 | ||||||||||||
| Total return(b) | 11.81 | % | 6.32 | % | (13.84 | )% | 30.74 | % | 9.27 | % | ||||||||||||
Net assets, end of year (in 000s) | $ | 465,604 | $ | 491,306 | $ | 621,590 | $ | 13,164 | $ | 1,637 | ||||||||||||
Ratio of net expenses to average net assets | 1.08 | % | 1.09 | % | 1.08 | % | 1.13 | % | 1.13 | % | ||||||||||||
Ratio of total expenses to average net assets | 1.15 | % | 1.17 | % | 1.15 | % | 1.13 | % | 1.16 | % | ||||||||||||
Ratio of net investment income to average net assets | 1.53 | % | 1.89 | % | 2.78 | % | 1.87 | % | 1.26 | % | ||||||||||||
Portfolio turnover rate(c) | 178 | % | 165 | % | 147 | % | 172 | % | 216 | % | ||||||||||||
| (a) | Calculated based on the average shares outstanding methodology. |
| (b) | Assumes investment at the net asset value at the beginning of the year, reinvestment of all distributions, a complete redemption of the investment at the net asset value at the end of the year and no sales or redemption charges (if any). Total returns would be reduced if a sales or redemption charge was taken into account. Returns do not reflect the impact of taxes to shareholders relating to Fund distributions or the redemption of Fund shares. |
| (c) | The Fund’s portfolio turnover rate is calculated in accordance with regulatory requirements, without regard to transactions involving short term investments and certain derivatives. If such transactions were included, the Fund’s portfolio turnover rate may be higher. |
| 50 | The accompanying notes are an integral part of these financial statements. |
GOLDMAN SACHS EMERGING MARKETS EQUITY INSIGHTS FUND
Financial Highlights (continued)
Selected Data for a Share Outstanding Throughout Each Year
| Goldman Sachs Emerging Markets Equity Insights Fund | ||||||||||||||||||||||
| Class R Shares | ||||||||||||||||||||||
| Year Ended October 31, | ||||||||||||||||||||||
| 2020 | 2019 | 2018 | 2017 | 2016 | ||||||||||||||||||
| Per Share Data |
| |||||||||||||||||||||
Net asset value, beginning of year | $ | 9.20 | $ | 8.86 | $ | 10.87 | $ | 8.44 | $ | 7.84 | ||||||||||||
Net investment income(a) | 0.08 | 0.12 | 0.15 | 0.10 | 0.08 | |||||||||||||||||
Net realized and unrealized gain (loss) | 0.95 | 0.36 | (1.64 | ) | 2.40 | 0.59 | ||||||||||||||||
Total from investment operations | 1.03 | 0.48 | (1.49 | ) | 2.50 | 0.67 | ||||||||||||||||
Distributions to shareholders from net investment income | (0.15 | ) | (0.14 | ) | (0.10 | ) | (0.07 | ) | (0.07 | ) | ||||||||||||
Distributions to shareholders from net realized gains | — | — | (0.42 | ) | — | — | ||||||||||||||||
Total distributions | (0.15 | ) | (0.14 | ) | (0.52 | ) | (0.07 | ) | (0.07 | ) | ||||||||||||
Net asset value, end of year | $ | 10.08 | $ | 9.20 | $ | 8.86 | $ | 10.87 | $ | 8.44 | ||||||||||||
| Total return(b) | 11.19 | % | 5.52 | % | (14.34 | )% | 29.86 | % | 8.57 | % | ||||||||||||
Net assets, end of year (in 000s) | $ | 29,635 | $ | 27,790 | $ | 20,852 | $ | 19,243 | $ | 9,363 | ||||||||||||
Ratio of net expenses to average net assets | 1.72 | % | 1.73 | % | 1.73 | % | 1.77 | % | 1.81 | % | ||||||||||||
Ratio of total expenses to average net assets | 1.78 | % | 1.82 | % | 1.79 | % | 1.79 | % | 1.88 | % | ||||||||||||
Ratio of net investment income to average net assets | 0.91 | % | 1.27 | % | 1.46 | % | 1.06 | % | 1.01 | % | ||||||||||||
Portfolio turnover rate(c) | 178 | % | 165 | % | 147 | % | 172 | % | 216 | % | ||||||||||||
| (a) | Calculated based on the average shares outstanding methodology. |
| (b) | Assumes investment at the net asset value at the beginning of the year, reinvestment of all distributions, a complete redemption of the investment at the net asset value at the end of the year and no sales or redemption charges (if any). Total returns would be reduced if a sales or redemption charge was taken into account. Returns do not reflect the impact of taxes to shareholders relating to Fund distributions or the redemption of Fund shares. |
| (c) | The Fund’s portfolio turnover rate is calculated in accordance with regulatory requirements, without regard to transactions involving short term investments and certain derivatives. If such transactions were included, the Fund’s portfolio turnover rate may be higher. |
| The accompanying notes are an integral part of these financial statements. | 51 |
GOLDMAN SACHS EMERGING MARKETS EQUITY INSIGHTS FUND
Financial Highlights (continued)
Selected Data for a Share Outstanding Throughout Each Period
| Goldman Sachs Emerging Markets Equity Insights Fund | ||||||||||||||
| Class P Shares | ||||||||||||||
| Year Ended October 31, | April 16, 2018* to | |||||||||||||
| 2020 | 2019 | |||||||||||||
| Per Share Data |
| |||||||||||||
Net asset value, beginning of period | $ | 9.33 | $ | 8.98 | $ | 10.84 | ||||||||
Net investment income(a) | 0.14 | 0.18 | 0.18 | |||||||||||
Net realized and unrealized gain (loss) | 0.95 | 0.37 | (2.04 | ) | ||||||||||
Total from investment operations | 1.09 | 0.55 | (1.86 | ) | ||||||||||
Distributions to shareholders from net investment income | (0.19 | ) | (0.20 | ) | — | |||||||||
Net asset value, end of period | $ | 10.23 | $ | 9.33 | $ | 8.98 | ||||||||
| Total return(b) | 11.80 | % | 6.33 | % | (17.16 | )% | ||||||||
Net assets, end of period (in 000s) | $ | 112,229 | $ | 125,429 | $ | 130,763 | ||||||||
Ratio of net expenses to average net assets | 1.08 | % | 1.09 | % | 1.08 | %(c) | ||||||||
Ratio of total expenses to average net assets | 1.15 | % | 1.17 | % | 1.17 | %(c) | ||||||||
Ratio of net investment income to average net assets | 1.48 | % | 1.96 | % | 3.36 | %(c) | ||||||||
Portfolio turnover rate(d) | 178 | % | 165 | % | 147 | % | ||||||||
| * | Commencement of operations. |
| (a) | Calculated based on the average shares outstanding methodology. |
| (b) | Assumes investment at the net asset value at the beginning of the period, reinvestment of all distributions, a complete redemption of the investment at the net asset value at the end of the period and no sales or redemption charges (if any). Total returns would be reduced if a sales or redemption charge was taken into account. Returns do not reflect the impact of taxes to shareholders relating to Fund distributions or the redemption of Fund shares. Total returns for periods less than one full year are not annualized. |
| (c) | Annualized. |
| (d) | The Fund’s portfolio turnover rate is calculated in accordance with regulatory requirements, without regard to transactions involving short term investments and certain derivatives. If such transactions were included, the Fund’s portfolio turnover rate may be higher. |
| 52 | The accompanying notes are an integral part of these financial statements. |
GOLDMAN SACHS INTERNATIONAL EQUITY INSIGHTS FUND
Financial Highlights (continued)
Selected Data for a Share Outstanding Throughout Each Year
| (a) | Calculated based on the average shares outstanding methodology. |
| (b) | Assumes investment at the net asset value at the beginning of the year, reinvestment of all distributions, a complete redemption of the investment at the net asset value at the end of the year and no sales or redemption charges (if any). Total returns would be reduced if a sales or redemption charge was taken into account. Returns do not reflect the impact of taxes to shareholders relating to Fund distributions or the redemption of Fund shares. |
| (c) | The Fund’s portfolio turnover rate is calculated in accordance with regulatory requirements, without regard to transactions involving short term investments and certain derivatives. If such transactions were included, the Fund’s portfolio turnover rate may be higher. |
| The accompanying notes are an integral part of these financial statements. | 53 |
GOLDMAN SACHS INTERNATIONAL EQUITY INSIGHTS FUND
Financial Highlights (continued)
Selected Data for a Share Outstanding Throughout Each Year
| Goldman Sachs International Equity Insights Fund | ||||||||||||||||||||||
| Class C Shares | ||||||||||||||||||||||
| Year Ended October 31, | ||||||||||||||||||||||
| 2020 | 2019 | 2018 | 2017 | 2016 | ||||||||||||||||||
| Per Share Data |
| |||||||||||||||||||||
Net asset value, beginning of year | $ | 12.13 | $ | 11.56 | $ | 12.91 | $ | 10.32 | $ | 10.36 | ||||||||||||
Net investment income(a) | 0.05 | 0.14 | 0.14 | 0.09 | 0.10 | |||||||||||||||||
Net realized and unrealized gain (loss) | (0.90 | ) | 0.52 | (1.34 | ) | 2.66 | (0.08 | ) | ||||||||||||||
Total from investment operations | (0.85 | ) | 0.66 | (1.20 | ) | 2.75 | 0.02 | |||||||||||||||
Distributions to shareholders from net investment income | (0.15 | ) | (0.09 | ) | (0.15 | ) | (0.16 | ) | (0.06 | ) | ||||||||||||
Net asset value, end of year | $ | 11.13 | $ | 12.13 | $ | 11.56 | $ | 12.91 | $ | 10.32 | ||||||||||||
| Total return(b) | (7.08 | )% | 5.79 | % | (9.45 | )% | 27.11 | % | 0.22 | % | ||||||||||||
Net assets, end of year (in 000s) | $ | 13,484 | $ | 22,427 | $ | 32,338 | $ | 14,886 | $ | 6,164 | ||||||||||||
Ratio of net expenses to average net assets | 1.92 | % | 1.91 | % | 1.89 | % | 1.95 | % | 2.00 | % | ||||||||||||
Ratio of total expenses to average net assets | 1.98 | % | 1.99 | % | 2.01 | % | 2.09 | % | 2.14 | % | ||||||||||||
Ratio of net investment income to average net assets | 0.42 | % | 1.25 | % | 1.11 | % | 0.79 | % | 1.02 | % | ||||||||||||
Portfolio turnover rate(c) | 160 | % | 136 | % | 124 | % | 161 | % | 176 | % | ||||||||||||
| (a) | Calculated based on the average shares outstanding methodology. |
| (b) | Assumes investment at the net asset value at the beginning of the year, reinvestment of all distributions, a complete redemption of the investment at the net asset value at the end of the year and no sales or redemption charges (if any). Total returns would be reduced if a sales or redemption charge was taken into account. Returns do not reflect the impact of taxes to shareholders relating to Fund distributions or the redemption of Fund shares. |
| (c) | The Fund’s portfolio turnover rate is calculated in accordance with regulatory requirements, without regard to transactions involving short term investments and certain derivatives. If such transactions were included, the Fund’s portfolio turnover rate may be higher. |
| 54 | The accompanying notes are an integral part of these financial statements. |
GOLDMAN SACHS INTERNATIONAL EQUITY INSIGHTS FUND
Financial Highlights (continued)
Selected Data for a Share Outstanding Throughout Each Year
| Goldman Sachs International Equity Insights Fund | ||||||||||||||||||||||
| Institutional Shares | ||||||||||||||||||||||
| Year Ended October 31, | ||||||||||||||||||||||
| 2020 | 2019 | 2018 | 2017 | 2016 | ||||||||||||||||||
| Per Share Data |
| |||||||||||||||||||||
Net asset value, beginning of year | $ | 12.83 | $ | 12.22 | $ | 13.57 | $ | 10.82 | $ | 10.83 | ||||||||||||
Net investment income(a) | 0.18 | 0.29 | 0.28 | 0.23 | 0.24 | |||||||||||||||||
Net realized and unrealized gain (loss) | (0.93 | ) | 0.54 | (1.41 | ) | 2.79 | (0.10 | ) | ||||||||||||||
Total from investment operations | (0.75 | ) | 0.83 | (1.13 | ) | 3.02 | 0.14 | |||||||||||||||
Distributions to shareholders from net investment income | (0.32 | ) | (0.22 | ) | (0.22 | ) | (0.27 | ) | (0.15 | ) | ||||||||||||
Net asset value, end of year | $ | 11.76 | $ | 12.83 | $ | 12.22 | $ | 13.57 | $ | 10.82 | ||||||||||||
| Total return(b) | (6.07 | )% | 7.07 | % | (8.48 | )% | 28.57 | % | 1.34 | % | ||||||||||||
Net assets, end of year (in 000s) | $ | 810,510 | $ | 1,256,782 | $ | 1,323,745 | $ | 1,012,010 | $ | 500,930 | ||||||||||||
Ratio of net expenses to average net assets | 0.79 | % | 0.79 | % | 0.81 | % | 0.85 | % | 0.85 | % | ||||||||||||
Ratio of total expenses to average net assets | 0.85 | % | 0.85 | % | 0.87 | % | 0.94 | % | 0.99 | % | ||||||||||||
Ratio of net investment income to average net assets | 1.54 | % | 2.41 | % | 2.08 | % | 1.92 | % | 2.25 | % | ||||||||||||
Portfolio turnover rate(c) | 160 | % | 136 | % | 124 | % | 161 | % | 176 | % | ||||||||||||
| (a) | Calculated based on the average shares outstanding methodology. |
| (b) | Assumes investment at the net asset value at the beginning of the year, reinvestment of all distributions, a complete redemption of the investment at the net asset value at the end of the year and no sales or redemption charges (if any). Total returns would be reduced if a sales or redemption charge was taken into account. Returns do not reflect the impact of taxes to shareholders relating to Fund distributions or the redemption of Fund shares. |
| (c) | The Fund’s portfolio turnover rate is calculated in accordance with regulatory requirements, without regard to transactions involving short term investments and certain derivatives. If such transactions were included, the Fund’s portfolio turnover rate may be higher. |
| The accompanying notes are an integral part of these financial statements. | 55 |
GOLDMAN SACHS INTERNATIONAL EQUITY INSIGHTS FUND
Financial Highlights (continued)
Selected Data for a Share Outstanding Throughout Each Year
| Goldman Sachs International Equity Insights Fund | ||||||||||||||||||||||
| Service Shares | ||||||||||||||||||||||
| Year Ended October 31, | ||||||||||||||||||||||
| 2020 | 2019 | 2018 | 2017 | 2016 | ||||||||||||||||||
| Per Share Data |
| |||||||||||||||||||||
Net asset value, beginning of year | $ | 12.57 | $ | 11.98 | $ | 13.32 | $ | 10.63 | $ | 10.64 | ||||||||||||
Net investment income(a) | 0.12 | 0.23 | 0.21 | 0.18 | 0.17 | |||||||||||||||||
Net realized and unrealized gain (loss) | (0.91 | ) | 0.52 | (1.38 | ) | 2.73 | (0.08 | ) | ||||||||||||||
Total from investment operations | (0.79 | ) | 0.75 | (1.17 | ) | 2.91 | 0.09 | |||||||||||||||
Distributions to shareholders from net investment income | (0.26 | ) | (0.16 | ) | (0.17 | ) | (0.22 | ) | (0.10 | ) | ||||||||||||
Net asset value, end of year | $ | 11.52 | $ | 12.57 | $ | 11.98 | $ | 13.32 | $ | 10.63 | ||||||||||||
| Total return(b) | (6.50 | )% | 6.45 | % | (8.92 | )% | 27.89 | % | 0.87 | % | ||||||||||||
Net assets, end of year (in 000s) | $ | 3,675 | $ | 5,386 | $ | 4,538 | $ | 4,073 | $ | 1,898 | ||||||||||||
Ratio of net expenses to average net assets | 1.29 | % | 1.29 | % | 1.31 | % | 1.35 | % | 1.35 | % | ||||||||||||
Ratio of total expenses to average net assets | 1.35 | % | 1.35 | % | 1.37 | % | 1.45 | % | 1.49 | % | ||||||||||||
Ratio of net investment income to average net assets | 1.03 | % | 1.93 | % | 1.57 | % | 1.51 | % | 1.60 | % | ||||||||||||
Portfolio turnover rate(c) | 160 | % | 136 | % | 124 | % | 161 | % | 176 | % | ||||||||||||
| (a) | Calculated based on the average shares outstanding methodology. |
| (b) | Assumes investment at the net asset value at the beginning of the year, reinvestment of all distributions, a complete redemption of the investment at the net asset value at the end of the year and no sales or redemption charges (if any). Total returns would be reduced if a sales or redemption charge was taken into account. Returns do not reflect the impact of taxes to shareholders relating to Fund distributions or the redemption of Fund shares. |
| (c) | The Fund’s portfolio turnover rate is calculated in accordance with regulatory requirements, without regard to transactions involving short term investments and certain derivatives. If such transactions were included, the Fund’s portfolio turnover rate may be higher. |
| 56 | The accompanying notes are an integral part of these financial statements. |
GOLDMAN SACHS INTERNATIONAL EQUITY INSIGHTS FUND
Financial Highlights (continued)
Selected Data for a Share Outstanding Throughout Each Year
| Goldman Sachs International Equity Insights Fund | ||||||||||||||||||||||
| Investor Shares(a) | ||||||||||||||||||||||
| Year Ended October 31, | ||||||||||||||||||||||
| 2020 | 2019 | 2018 | 2017 | 2016 | ||||||||||||||||||
| Per Share Data |
| |||||||||||||||||||||
Net asset value, beginning of year | $ | 12.23 | $ | 11.67 | $ | 12.97 | $ | 10.36 | $ | 10.38 | ||||||||||||
Net investment income(b) | 0.16 | 0.27 | 0.27 | 0.23 | 0.17 | |||||||||||||||||
Net realized and unrealized gain (loss) | (0.89 | ) | 0.50 | (1.35 | ) | 2.64 | (0.05 | ) | ||||||||||||||
Total from investment operations | (0.73 | ) | 0.77 | (1.08 | ) | 2.87 | 0.12 | |||||||||||||||
Distributions to shareholders from net investment income | (0.31 | ) | (0.21 | ) | (0.22 | ) | (0.26 | ) | (0.14 | ) | ||||||||||||
Net asset value, end of year | $ | 11.19 | $ | 12.23 | $ | 11.67 | $ | 12.97 | $ | 10.36 | ||||||||||||
| Total return(c) | (6.21 | )% | 6.90 | % | (8.52 | )% | 28.44 | % | 1.22 | % | ||||||||||||
Net assets, end of year (in 000s) | $ | 311,446 | $ | 549,732 | $ | 393,993 | $ | 147,186 | $ | 6,639 | ||||||||||||
Ratio of net expenses to average net assets | 0.92 | % | 0.91 | % | 0.89 | % | 0.94 | % | 1.00 | % | ||||||||||||
Ratio of total expenses to average net assets | 0.98 | % | 0.99 | % | 1.01 | % | 1.07 | % | 1.14 | % | ||||||||||||
Ratio of net investment income to average net assets | 1.42 | % | 2.29 | % | 2.09 | % | 1.87 | % | 1.65 | % | ||||||||||||
Portfolio turnover rate(d) | 160 | % | 136 | % | 124 | % | 161 | % | 176 | % | ||||||||||||
| (a) | Effective August 15, 2017, Class IR changed its name to Investor Shares. |
| (b) | Calculated based on the average shares outstanding methodology. |
| (c) | Assumes investment at the net asset value at the beginning of the year, reinvestment of all distributions, a complete redemption of the investment at the net asset value at the end of the year and no sales or redemption charges (if any). Total returns would be reduced if a sales or redemption charge was taken into account. Returns do not reflect the impact of taxes to shareholders relating to Fund distributions or the redemption of Fund shares. |
| (d) | The Fund’s portfolio turnover rate is calculated in accordance with regulatory requirements, without regard to transactions involving short term investments and certain derivatives. If such transactions were included, the Fund’s portfolio turnover rate may be higher. |
| The accompanying notes are an integral part of these financial statements. | 57 |
GOLDMAN SACHS INTERNATIONAL EQUITY INSIGHTS FUND
Financial Highlights (continued)
Selected Data for a Share Outstanding Throughout Each Year
| Goldman Sachs International Equity Insights Fund | ||||||||||||||||||||||
| Class R6 Shares | ||||||||||||||||||||||
| Year Ended October 31, | ||||||||||||||||||||||
| 2020 | 2019 | 2018 | 2017 | 2016 | ||||||||||||||||||
| Per Share Data |
| |||||||||||||||||||||
Net asset value, beginning of year | $ | 12.82 | $ | 12.22 | $ | 13.56 | $ | 10.82 | $ | 10.83 | ||||||||||||
Net investment income(a) | 0.19 | 0.30 | 0.33 | 0.23 | 0.14 | |||||||||||||||||
Net realized and unrealized gain (loss) | (0.94 | ) | 0.52 | (1.45 | ) | 2.78 | 0.01 | |||||||||||||||
Total from investment operations | (0.75 | ) | 0.82 | (1.12 | ) | 3.01 | 0.15 | |||||||||||||||
Distributions to shareholders from net investment income | (0.32 | ) | (0.22 | ) | (0.22 | ) | (0.27 | ) | (0.16 | ) | ||||||||||||
Net asset value, end of year | $ | 11.75 | $ | 12.82 | $ | 12.22 | $ | 13.56 | $ | 10.82 | ||||||||||||
| Total return(b) | (6.06 | )% | 7.10 | % | (8.48 | )% | 28.51 | % | 1.37 | % | ||||||||||||
Net assets, end of year (in 000s) | $ | 522,707 | $ | 595,264 | $ | 415,327 | $ | 80,686 | $ | 46,707 | ||||||||||||
Ratio of net expenses to average net assets | 0.78 | % | 0.78 | % | 0.79 | % | 0.83 | % | 0.83 | % | ||||||||||||
Ratio of total expenses to average net assets | 0.84 | % | 0.84 | % | 0.86 | % | 0.93 | % | 0.96 | % | ||||||||||||
Ratio of net investment income to average net assets | 1.61 | % | 2.49 | % | 2.45 | % | 1.96 | % | 1.32 | % | ||||||||||||
Portfolio turnover rate(c) | 160 | % | 136 | % | 124 | % | 161 | % | 176 | % | ||||||||||||
| (a) | Calculated based on the average shares outstanding methodology. |
| (b) | Assumes investment at the net asset value at the beginning of the year, reinvestment of all distributions, a complete redemption of the investment at the net asset value at the end of the year and no sales or redemption charges (if any). Total returns would be reduced if a sales or redemption charge was taken into account. Returns do not reflect the impact of taxes to shareholders relating to Fund distributions or the redemption of Fund shares. |
| (c) | The Fund’s portfolio turnover rate is calculated in accordance with regulatory requirements, without regard to transactions involving short term investments and certain derivatives. If such transactions were included, the Fund’s portfolio turnover rate may be higher. |
| 58 | The accompanying notes are an integral part of these financial statements. |
GOLDMAN SACHS INTERNATIONAL EQUITY INSIGHTS FUND
Financial Highlights (continued)
Selected Data for a Share Outstanding Throughout Each Year
| Goldman Sachs International Equity Insights Fund | ||||||||||||||||||||||
| Class R Shares | ||||||||||||||||||||||
| Year Ended October 31, | ||||||||||||||||||||||
| 2020 | 2019 | 2018 | 2017 | 2016 | ||||||||||||||||||
| Per Share Data |
| |||||||||||||||||||||
Net asset value, beginning of year | $ | 12.10 | $ | 11.54 | $ | 12.85 | $ | 10.29 | $ | 10.34 | ||||||||||||
Net investment income(a) | 0.11 | 0.21 | 0.19 | 0.16 | 0.13 | |||||||||||||||||
Net realized and unrealized gain (loss) | (0.89 | ) | 0.50 | (1.33 | ) | 2.64 | (0.06 | ) | ||||||||||||||
Total from investment operations | (0.78 | ) | 0.71 | (1.14 | ) | 2.80 | 0.07 | |||||||||||||||
Distributions to shareholders from net investment income | (0.24 | ) | (0.15 | ) | (0.17 | ) | (0.24 | ) | (0.12 | ) | ||||||||||||
Net asset value, end of year | $ | 11.08 | $ | 12.10 | $ | 11.54 | $ | 12.85 | $ | 10.29 | ||||||||||||
| Total return(b) | (6.69 | )% | 6.36 | % | (9.01 | )% | 27.81 | % | 0.67 | % | ||||||||||||
Net assets, end of year (in 000s) | $ | 8,321 | $ | 9,281 | $ | 7,548 | $ | 7,071 | $ | 2,152 | ||||||||||||
Ratio of net expenses to average net assets | 1.42 | % | 1.41 | % | 1.40 | % | 1.45 | % | 1.50 | % | ||||||||||||
Ratio of total expenses to average net assets | 1.48 | % | 1.49 | % | 1.51 | % | 1.59 | % | 1.64 | % | ||||||||||||
Ratio of net investment income to average net assets | 0.99 | % | 1.79 | % | 1.49 | % | 1.39 | % | 1.28 | % | ||||||||||||
Portfolio turnover rate(c) | 160 | % | 136 | % | 124 | % | 161 | % | 176 | % | ||||||||||||
| (a) | Calculated based on the average shares outstanding methodology. |
| (b) | Assumes investment at the net asset value at the beginning of the year, reinvestment of all distributions, a complete redemption of the investment at the net asset value at the end of the year and no sales or redemption charges (if any). Total returns would be reduced if a sales or redemption charge was taken into account. Returns do not reflect the impact of taxes to shareholders relating to Fund distributions or the redemption of Fund shares. |
| (c) | The Fund’s portfolio turnover rate is calculated in accordance with regulatory requirements, without regard to transactions involving short term investments and certain derivatives. If such transactions were included, the Fund’s portfolio turnover rate may be higher. |
| The accompanying notes are an integral part of these financial statements. | 59 |
GOLDMAN SACHS INTERNATIONAL EQUITY INSIGHTS FUND
Financial Highlights (continued)
Selected Data for a Share Outstanding Throughout Each Period
| Goldman Sachs International Equity Insights Fund | ||||||||||||||
| Class P Shares | ||||||||||||||
| Year Ended October 31, | April 16, 2018* to | |||||||||||||
| 2020 | 2019 | |||||||||||||
| Per Share Data |
| |||||||||||||
Net asset value, beginning of period | $ | 12.81 | $ | 12.21 | $ | 13.79 | ||||||||
Net investment income(a) | 0.19 | 0.30 | 0.12 | |||||||||||
Net realized and unrealized gain (loss) | (0.94 | ) | 0.52 | (1.70 | ) | |||||||||
Total from investment operations | (0.75 | ) | 0.82 | (1.58 | ) | |||||||||
Distributions to shareholders from net investment income | (0.32 | ) | (0.22 | ) | — | |||||||||
Net asset value, end of period | $ | 11.74 | $ | 12.81 | $ | 12.21 | ||||||||
| Total return(b) | (6.06 | )% | 7.03 | % | (11.46 | )% | ||||||||
Net assets, end of period (in 000s) | $ | 357,875 | $ | 372,536 | $ | 245,618 | ||||||||
Ratio of net expenses to average net assets | 0.78 | % | 0.78 | % | 0.78 | %(c) | ||||||||
Ratio of total expenses to average net assets | 0.84 | % | 0.84 | % | 0.87 | %(c) | ||||||||
Ratio of net investment income to average net assets | 1.62 | % | 2.43 | % | 1.65 | %(c) | ||||||||
Portfolio turnover rate(d) | 160 | % | 136 | % | 124 | % | ||||||||
| * | Commencement of operations. |
| (a) | Calculated based on the average shares outstanding methodology. |
| (b) | Assumes investment at the net asset value at the beginning of the period, reinvestment of all distributions, a complete redemption of the investment at the net asset value at the end of the period and no sales or redemption charges (if any). Total returns would be reduced if a sales or redemption charge was taken into account. Returns do not reflect the impact of taxes to shareholders relating to Fund distributions or the redemption of Fund shares. Total returns for periods less than one full year are not annualized. |
| (c) | Annualized. |
| (d) | The Fund’s portfolio turnover rate is calculated in accordance with regulatory requirements, without regard to transactions involving short term investments and certain derivatives. If such transactions were included, the Fund’s portfolio turnover rate may be higher. |
| 60 | The accompanying notes are an integral part of these financial statements. |
GOLDMAN SACHS INTERNATIONAL SMALL CAP INSIGHTS FUND
Financial Highlights (continued)
Selected Data for a Share Outstanding Throughout Each Year
| (a) | Calculated based on the average shares outstanding methodology. |
| (b) | Assumes investment at the net asset value at the beginning of the year, reinvestment of all distributions, a complete redemption of the investment at the net asset value at the end of the year and no sales or redemption charges (if any). Total returns would be reduced if a sales or redemption charge was taken into account. Returns do not reflect the impact of taxes to shareholders relating to Fund distributions or the redemption of Fund shares. |
| (c) | The Fund’s portfolio turnover rate is calculated in accordance with regulatory requirements, without regard to transactions involving short term investments and certain derivatives. If such transactions were included, the Fund’s portfolio turnover rate may be higher. |
| The accompanying notes are an integral part of these financial statements. | 61 |
GOLDMAN SACHS INTERNATIONAL SMALL CAP INSIGHTS FUND
Financial Highlights (continued)
Selected Data for a Share Outstanding Throughout Each Year
| Goldman Sachs International Small Cap Insights Fund | ||||||||||||||||||||||
| Class C Shares | ||||||||||||||||||||||
| Year Ended October 31, | ||||||||||||||||||||||
| 2020 | 2019 | 2018 | 2017 | 2016 | ||||||||||||||||||
| Per Share Data |
| |||||||||||||||||||||
Net asset value, beginning of year | $ | 11.34 | $ | 10.73 | $ | 12.95 | $ | 10.35 | $ | 10.11 | ||||||||||||
Net investment income(a) | — | (b) | 0.09 | 0.08 | 0.07 | 0.08 | ||||||||||||||||
Net realized and unrealized gain (loss) | (0.51 | ) | 0.54 | (1.35 | ) | 2.70 | 0.25 | |||||||||||||||
Total from investment operations | (0.51 | ) | 0.63 | (1.27 | ) | 2.77 | 0.33 | |||||||||||||||
Distributions to shareholders from net investment income | (0.27 | ) | (0.02 | ) | (0.12 | ) | (0.17 | ) | (0.09 | ) | ||||||||||||
Distributions to shareholders from net realized gains | — | — | (0.83 | ) | — | — | ||||||||||||||||
Total distributions | (0.27 | ) | (0.02 | ) | (0.95 | ) | (0.17 | ) | (0.09 | ) | ||||||||||||
Net asset value, end of year | $ | 10.56 | $ | 11.34 | $ | 10.73 | $ | 12.95 | $ | 10.35 | ||||||||||||
| Total return(c) | (4.71 | )% | 5.94 | % | (10.59 | )% | 27.20 | % | 3.27 | % | ||||||||||||
Net assets, end of year (in 000s) | $ | 29,190 | $ | 51,728 | $ | 68,767 | $ | 65,194 | $ | 44,643 | ||||||||||||
Ratio of net expenses to average net assets | 2.00 | % | 2.01 | % | 2.01 | % | 2.04 | % | 2.05 | % | ||||||||||||
Ratio of total expenses to average net assets | 2.06 | % | 2.08 | % | 2.06 | % | 2.09 | % | 2.14 | % | ||||||||||||
Ratio of net investment income (loss) to average net assets | (0.01 | )% | 0.82 | % | 0.61 | % | 0.60 | % | 0.83 | % | ||||||||||||
Portfolio turnover rate(d) | 149 | % | 131 | % | 110 | % | 129 | % | 140 | % | ||||||||||||
| (a) | Calculated based on the average shares outstanding methodology. |
| (b) | Amount is less than $0.005 per share. |
| (c) | Assumes investment at the net asset value at the beginning of the year, reinvestment of all distributions, a complete redemption of the investment at the net asset value at the end of the year and no sales or redemption charges (if any). Total returns would be reduced if a sales or redemption charge was taken into account. Returns do not reflect the impact of taxes to shareholders relating to Fund distributions or the redemption of Fund shares. |
| (d) | The Fund’s portfolio turnover rate is calculated in accordance with regulatory requirements, without regard to transactions involving short term investments and certain derivatives. If such transactions were included, the Fund’s portfolio turnover rate may be higher. |
| 62 | The accompanying notes are an integral part of these financial statements. |
GOLDMAN SACHS INTERNATIONAL SMALL CAP INSIGHTS FUND
Financial Highlights (continued)
Selected Data for a Share Outstanding Throughout Each Year
| Goldman Sachs International Small Cap Insights Fund | ||||||||||||||||||||||
| Institutional Shares | ||||||||||||||||||||||
| Year Ended October 31, | ||||||||||||||||||||||
| 2020 | 2019 | 2018 | 2017 | 2016 | ||||||||||||||||||
| Per Share Data |
| |||||||||||||||||||||
Net asset value, beginning of year | $ | 11.78 | $ | 11.19 | $ | 13.42 | $ | 10.73 | $ | 10.44 | ||||||||||||
Net investment income(a) | 0.12 | 0.22 | 0.21 | 0.21 | 0.21 | |||||||||||||||||
Net realized and unrealized gain (loss) | (0.52 | ) | 0.54 | (1.38 | ) | 2.77 | 0.26 | |||||||||||||||
Total from investment operations | (0.40 | ) | 0.76 | (1.17 | ) | 2.98 | 0.47 | |||||||||||||||
Distributions to shareholders from net investment income | (0.41 | ) | (0.17 | ) | (0.23 | ) | (0.29 | ) | (0.18 | ) | ||||||||||||
Distributions to shareholders from net realized gains | — | — | (0.83 | ) | — | — | ||||||||||||||||
Total distributions | (0.41 | ) | (0.17 | ) | (1.06 | ) | (0.29 | ) | (0.18 | ) | ||||||||||||
Net asset value, end of year | $ | 10.97 | $ | 11.78 | $ | 11.19 | $ | 13.42 | $ | 10.73 | ||||||||||||
| Total return(b) | (3.61 | )% | 7.10 | % | (9.53 | )% | 28.59 | % | 4.50 | % | ||||||||||||
Net assets, end of year (in 000s) | $ | 1,608,195 | $ | 2,134,382 | $ | 2,250,288 | $ | 1,796,887 | $ | 1,118,478 | ||||||||||||
Ratio of net expenses to average net assets | 0.87 | % | 0.87 | % | 0.87 | % | 0.90 | % | 0.90 | % | ||||||||||||
Ratio of total expenses to average net assets | 0.93 | % | 0.95 | % | 0.92 | % | 0.94 | % | 0.98 | % | ||||||||||||
Ratio of net investment income to average net assets | 1.13 | % | 1.96 | % | 1.67 | % | 1.77 | % | 1.98 | % | ||||||||||||
Portfolio turnover rate(c) | 149 | % | 131 | % | 110 | % | 129 | % | 140 | % | ||||||||||||
| (a) | Calculated based on the average shares outstanding methodology. |
| (b) | Assumes investment at the net asset value at the beginning of the year, reinvestment of all distributions, a complete redemption of the investment at the net asset value at the end of the year and no sales or redemption charges (if any). Total returns would be reduced if a sales or redemption charge was taken into account. Returns do not reflect the impact of taxes to shareholders relating to Fund distributions or the redemption of Fund shares. |
| (c) | The Fund’s portfolio turnover rate is calculated in accordance with regulatory requirements, without regard to transactions involving short term investments and certain derivatives. If such transactions were included, the Fund’s portfolio turnover rate may be higher. |
| The accompanying notes are an integral part of these financial statements. | 63 |
GOLDMAN SACHS INTERNATIONAL SMALL CAP INSIGHTS FUND
Financial Highlights (continued)
Selected Data for a Share Outstanding Throughout Each Year
| Goldman Sachs International Small Cap Insights Fund | ||||||||||||||||||||||
| Investor Shares(a) | ||||||||||||||||||||||
| Year Ended October 31, | ||||||||||||||||||||||
| 2020 | 2019 | 2018 | 2017 | 2016 | ||||||||||||||||||
| Per Share Data |
| |||||||||||||||||||||
Net asset value, beginning of year | $ | 11.72 | $ | 11.12 | $ | 13.36 | $ | 10.68 | $ | 10.40 | ||||||||||||
Net investment income(b) | 0.10 | 0.19 | 0.21 | 0.21 | 0.19 | |||||||||||||||||
Net realized and unrealized gain (loss) | (0.51 | ) | 0.56 | (1.40 | ) | 2.75 | 0.26 | |||||||||||||||
Total from investment operations | (0.41 | ) | 0.75 | (1.19 | ) | 2.96 | 0.45 | |||||||||||||||
Distributions to shareholders from net investment income | (0.39 | ) | (0.15 | ) | (0.22 | ) | (0.28 | ) | (0.17 | ) | ||||||||||||
Distributions to shareholders from net realized gains | — | — | (0.83 | ) | — | — | ||||||||||||||||
Total distributions | (0.39 | ) | (0.15 | ) | (1.05 | ) | (0.28 | ) | (0.17 | ) | ||||||||||||
Net asset value, end of year | $ | 10.92 | $ | 11.72 | $ | 11.12 | $ | 13.36 | $ | 10.68 | ||||||||||||
| Total return(c) | (3.72 | )% | 7.01 | % | (9.72 | )% | 28.48 | % | 4.33 | % | ||||||||||||
Net assets, end of year (in 000s) | $ | 131,558 | $ | 274,079 | $ | 532,484 | $ | 344,700 | $ | 99,365 | ||||||||||||
Ratio of net expenses to average net assets | 1.00 | % | 1.01 | % | 1.01 | % | 1.04 | % | 1.05 | % | ||||||||||||
Ratio of total expenses to average net assets | 1.06 | % | 1.08 | % | 1.06 | % | 1.09 | % | 1.13 | % | ||||||||||||
Ratio of net investment income to average net assets | 0.95 | % | 1.74 | % | 1.68 | % | 1.76 | % | 1.83 | % | ||||||||||||
Portfolio turnover rate(d) | 149 | % | 131 | % | 110 | % | 129 | % | 140 | % | ||||||||||||
| (a) | Effective August 15, 2017, Class IR changed its name to Investor Shares. |
| (b) | Calculated based on the average shares outstanding methodology. |
| (c) | Assumes investment at the net asset value at the beginning of the year, reinvestment of all distributions, a complete redemption of the investment at the net asset value at the end of the year and no sales or redemption charges (if any). Total returns would be reduced if a sales or redemption charge was taken into account. Returns do not reflect the impact of taxes to shareholders relating to Fund distributions or the redemption of Fund shares. |
| (d) | The Fund’s portfolio turnover rate is calculated in accordance with regulatory requirements, without regard to transactions involving short term investments and certain derivatives. If such transactions were included, the Fund’s portfolio turnover rate may be higher. |
| 64 | The accompanying notes are an integral part of these financial statements. |
GOLDMAN SACHS INTERNATIONAL SMALL CAP INSIGHTS FUND
Financial Highlights (continued)
Selected Data for a Share Outstanding Throughout Each Year
| Goldman Sachs International Small Cap Insights Fund | ||||||||||||||||||||||
| Class R6 Shares | ||||||||||||||||||||||
| Year Ended October 31, | ||||||||||||||||||||||
| 2020 | 2019 | 2018 | 2017 | 2016 | ||||||||||||||||||
| Per Share Data |
| |||||||||||||||||||||
Net asset value, beginning of year | $ | 11.80 | $ | 11.21 | $ | 13.45 | $ | 10.75 | $ | 10.44 | ||||||||||||
Net investment income(a) | 0.13 | 0.22 | 0.22 | 0.20 | 0.26 | |||||||||||||||||
Net realized and unrealized gain (loss) | (0.52 | ) | 0.54 | (1.40 | ) | 2.79 | 0.23 | |||||||||||||||
Total from investment operations | (0.39 | ) | 0.76 | (1.18 | ) | 2.99 | 0.49 | |||||||||||||||
Distributions to shareholders from net investment income | (0.42 | ) | (0.17 | ) | (0.23 | ) | (0.29 | ) | (0.18 | ) | ||||||||||||
Distributions to shareholders from net realized gains | — | — | (0.83 | ) | — | — | ||||||||||||||||
Total distributions | (0.42 | ) | (0.17 | ) | (1.06 | ) | (0.29 | ) | (0.18 | ) | ||||||||||||
Net asset value, end of year | $ | 10.99 | $ | 11.80 | $ | 11.21 | $ | 13.45 | $ | 10.75 | ||||||||||||
| Total return(b) | (3.60 | )% | 7.11 | % | (9.57 | )% | 28.67 | % | 4.72 | % | ||||||||||||
Net assets, end of year (in 000s) | $ | 963,821 | $ | 1,192,142 | $ | 1,076,035 | $ | 116,788 | $ | 18,566 | ||||||||||||
Ratio of net expenses to average net assets | 0.86 | % | 0.86 | % | 0.85 | % | 0.88 | % | 0.88 | % | ||||||||||||
Ratio of total expenses to average net assets | 0.92 | % | 0.94 | % | 0.92 | % | 0.92 | % | 0.97 | % | ||||||||||||
Ratio of net investment income to average net assets | 1.19 | % | 2.01 | % | 1.72 | % | 1.58 | % | 2.39 | % | ||||||||||||
Portfolio turnover rate(c) | 149 | % | 131 | % | 110 | % | 129 | % | 140 | % | ||||||||||||
| (a) | Calculated based on the average shares outstanding methodology. |
| (b) | Assumes investment at the net asset value at the beginning of the year, reinvestment of all distributions, a complete redemption of the investment at the net asset value at the end of the year and no sales or redemption charges (if any). Total returns would be reduced if a sales or redemption charge was taken into account. Returns do not reflect the impact of taxes to shareholders relating to Fund distributions or the redemption of Fund shares. |
| (c) | The Fund’s portfolio turnover rate is calculated in accordance with regulatory requirements, without regard to transactions involving short term investments and certain derivatives. If such transactions were included, the Fund’s portfolio turnover rate may be higher. |
| The accompanying notes are an integral part of these financial statements. | 65 |
GOLDMAN SACHS INTERNATIONAL SMALL CAP INSIGHTS FUND
Financial Highlights (continued)
Selected Data for a Share Outstanding Throughout Each Period
| Goldman Sachs International Small Cap Insights Fund | ||||||||||||||
| Class P Shares | ||||||||||||||
| Year Ended October 31, | April 16, 2018* to October 31, 2018 | |||||||||||||
| 2020 | 2019 | |||||||||||||
| Per Share Data |
| |||||||||||||
Net asset value, beginning of period | $ | 11.80 | $ | 11.21 | $ | 13.08 | ||||||||
Net investment income(a) | 0.12 | 0.22 | 0.08 | |||||||||||
Net realized and unrealized gain (loss) | (0.51 | ) | 0.54 | (1.95 | ) | |||||||||
Total from investment operations | (0.39 | ) | 0.76 | (1.87 | ) | |||||||||
Distributions to shareholders from net investment income | (0.42 | ) | (0.17 | ) | — | |||||||||
Net asset value, end of period | $ | 10.99 | $ | 11.80 | $ | 11.21 | ||||||||
| Total return(b) | (3.60 | )% | 7.11 | % | (14.30 | )% | ||||||||
Net assets, end of period (in 000s) | $ | 43,631 | $ | 80,926 | $ | 90,943 | ||||||||
Ratio of net expenses to average net assets | 0.86 | % | 0.86 | % | 0.85 | %(c) | ||||||||
Ratio of total expenses to average net assets | 0.92 | % | 0.94 | % | 0.93 | %(c) | ||||||||
Ratio of net investment income to average net assets | 1.08 | % | 1.96 | % | 1.20 | %(c) | ||||||||
Portfolio turnover rate(d) | 149 | % | 131 | % | 110 | % | ||||||||
| * | Commencement of operations. |
| (a) | Calculated based on the average shares outstanding methodology. |
| (b) | Assumes investment at the net asset value at the beginning of the period, reinvestment of all distributions, a complete redemption of the investment at the net asset value at the end of the period and no sales or redemption charges (if any). Total returns would be reduced if a sales or redemption charge was taken into account. Returns do not reflect the impact of taxes to shareholders relating to Fund distributions or the redemption of Fund shares. Total returns for periods less than one full year are not annualized. |
| (c) | Annualized. |
| (d) | The Fund’s portfolio turnover rate is calculated in accordance with regulatory requirements, without regard to transactions involving short term investments and certain derivatives. If such transactions were included, the Fund’s portfolio turnover rate may be higher. |
| 66 | The accompanying notes are an integral part of these financial statements. |
GOLDMAN SACHS INTERNATIONAL EQUITY INSIGHTS FUNDS
October 31, 2020
| 1. ORGANIZATION |
Goldman Sachs Trust (the “Trust”) is a Delaware statutory trust registered under the Investment Company Act of 1940, as amended (the “Act”), as an open-end management investment company. The following table lists those series of the Trust that are included in this report (collectively, the “Funds” or individually a “Fund”), along with their corresponding share classes and respective diversification status under the Act:
| Fund | Share Classes Offered | Diversified/ Non-diversified | ||
Emerging Markets Equity Insights | A, C, Institutional, Investor, R6, R and P | Diversified | ||
International Equity Insights | A, C, Institutional, Service, Investor, R6, R and P | Diversified | ||
International Small Cap Insights | A, C, Institutional, Investor, R6 and P | Diversified |
Class A Shares are sold with a front-end sales charge of up to 5.50%. Class C Shares are sold with a contingent deferred sales charge (“CDSC”) of 1.00%, which is imposed on redemptions made within 12 months of purchase. Institutional, Service, Investor, Class R6, Class R and Class P Shares are not subject to a sales charge.
Goldman Sachs Asset Management, L.P. (“GSAM”), an affiliate of Goldman Sachs & Co. LLC (“Goldman Sachs”), serves as investment adviser to the Funds pursuant to a management agreement (the “Agreement”) with the Trust.
| 2. SIGNIFICANT ACCOUNTING POLICIES |
The financial statements have been prepared in accordance with accounting principles generally accepted in the United States of America (“GAAP”) and require management to make estimates and assumptions that may affect the reported amounts and disclosures. Actual results may differ from those estimates and assumptions. Each Fund is an investment company under GAAP and follows the accounting and reporting guidance applicable to investment companies.
A. Investment Valuation — The Funds’ valuation policy is to value investments at fair value.
B. Investment Income and Investments — Investment income includes interest income, dividend income, and securities lending income, if any. Interest income is accrued daily and adjusted for amortization of premiums and accretion of discounts. Dividend income is recognized on ex-dividend date or, for certain foreign securities, as soon as such information is obtained subsequent to the ex-dividend date. Non-cash dividends, if any, are recorded at the fair market value of the securities received. Investment transactions are reflected on trade date. Realized gains and losses are calculated using identified cost. Investment transactions are recorded on the following business day for daily net asset value (“NAV”) calculations. Investment income is recorded net of any foreign withholding taxes, less any amounts reclaimable. The Funds may file withholding tax reclaims in certain jurisdictions to recover a portion of amounts previously withheld. Any foreign capital gains tax is accrued daily based upon net unrealized gains, and is payable upon sale of such investments.
For derivative contracts, realized gains and losses are recorded upon settlement of the contract.
C. Class Allocations and Expenses — Investment income, realized and unrealized gain (loss), if any, and non-class specific expenses of each Fund are allocated daily based upon the proportion of net assets of each class. Non-class specific expenses directly incurred by a Fund are charged to that Fund, while such expenses incurred by the Trust are allocated across the applicable Funds on a straight-line and/or pro-rata basis depending upon the nature of the expenses. Class specific expenses, where applicable, are borne by the respective share classes and include Distribution and Service, Transfer Agency and Service and Shareholder Administration fees.
D. Federal Taxes and Distributions to Shareholders — It is each Fund’s policy to comply with the requirements of the Internal Revenue Code of 1986, as amended (the “Code”), applicable to regulated investment companies and to distribute each year substantially all of its investment company taxable income and capital gains to its shareholders. Accordingly, each Fund is not required to make any provisions for the payment of federal income tax. Distributions to shareholders are recorded on the ex-dividend date. Income and capital gains distributions, if any, are declared and paid at least annually.
67
GOLDMAN SACHS INTERNATIONAL EQUITY INSIGHTS FUNDS
Notes to Financial Statements (continued)
October 31, 2020
| 2. SIGNIFICANT ACCOUNTING POLICIES (continued) |
Net capital losses, if any, are carried forward to future fiscal years and may be used to the extent allowed by the Code to offset any future capital gains. Losses that are carried forward will retain their character as either short-term or long-term capital losses. Utilization of capital loss carryforwards will reduce the requirement of future capital gains distributions.
The characterization of distributions to shareholders for financial reporting purposes is determined in accordance with federal income tax rules, which may differ from GAAP. The source of each Fund’s distributions may be shown in the accompanying financial statements as either from distributable earnings or capital. Certain components of the Funds’ net assets on the Statements of Assets and Liabilities reflect permanent GAAP/tax differences based on the appropriate tax character.
E. Foreign Currency Translation — The accounting records and reporting currency of a Fund are maintained in United States (“U.S.”) dollars. Assets and liabilities denominated in foreign currencies are translated into U.S. dollars using the current exchange rates at the close of each business day. The effect of changes in foreign currency exchange rates on investments is included within net realized and unrealized gain (loss) on investments. Changes in the value of other assets and liabilities as a result of fluctuations in foreign exchange rates are included in the Statements of Operations within net change in unrealized gain (loss) on foreign currency translation. Transactions denominated in foreign currencies are translated into U.S. dollars on the date the transaction occurred, the effects of which are included within net realized gain (loss) on foreign currency transactions.
| 3. INVESTMENTS AND FAIR VALUE MEASUREMENTS |
U.S. GAAP defines the fair value of a financial instrument as the amount that would be received to sell an asset or paid to transfer a liability in an orderly transaction between market participants at the measurement date (i.e., the exit price); the Funds’ policy is to use the market approach. GAAP establishes a fair value hierarchy that prioritizes the inputs to valuation techniques used to measure fair value. The hierarchy gives the highest priority to unadjusted quoted prices in active markets for identical assets or liabilities (Level 1 measurements) and the lowest priority to unobservable inputs (Level 3 measurements). The level in the fair value hierarchy within which the fair value measurement in its entirety falls shall be determined based on the lowest level input that is significant to the fair value measurement in its entirety .The levels used for classifying investments are not necessarily an indication of the risk associated with investing in these investments. The three levels of the fair value hierarchy are described below:
Level 1 — Unadjusted quoted prices in active markets that are accessible at the measurement date for identical, unrestricted assets or liabilities;
Level 2 — Quoted prices in markets that are not active or financial instruments for which significant inputs are observable (including, but not limited to, quoted prices for similar investments, interest rates, foreign exchange rates, volatility and credit spreads), either directly or indirectly;
Level 3 — Prices or valuations that require significant unobservable inputs (including GSAM’s assumptions in determining fair value measurement).
The Board of Trustees (“Trustees”) has approved Valuation Procedures that govern the valuation of the portfolio investments held by the Funds, including investments for which market quotations are not readily available. The Trustees have delegated to GSAM day-to-day responsibility for implementing and maintaining internal controls and procedures related to the valuation of the Funds’ investments. To assess the continuing appropriateness of pricing sources and methodologies, GSAM regularly performs price verification procedures and issues challenges as necessary to third party pricing vendors or brokers, and any differences are reviewed in accordance with the Valuation Procedures.
A. Level 1 and Level 2 Fair Value Investments — The valuation techniques and significant inputs used in determining the fair values for investments classified as Level 1 and Level 2 are as follows:
Equity Securities — Equity securities traded on a U.S. securities exchange or the NASDAQ system, or those located on certain foreign exchanges, including but not limited to the Americas, are valued daily at their last sale price or official closing price on the principal exchange or system on which they are traded. If there is no sale or official closing price or such price is believed by
68
GOLDMAN SACHS INTERNATIONAL EQUITY INSIGHTS FUNDS
| 3. INVESTMENTS AND FAIR VALUE MEASUREMENTS (continued) |
GSAM to not represent fair value, equity securities will be valued at the valid closing bid price for long positions and at the valid closing ask price for short positions (i.e. where there is sufficient volume, during normal exchange trading hours). If no valid bid/ask price is available, the equity security will be valued pursuant to the Valuation Procedures approved by the Trustees and consistent with applicable regulatory guidance. To the extent these investments are actively traded, they are classified as Level 1 of the fair value hierarchy, otherwise they are generally classified as Level 2. Certain equity securities containing unique attributes may be classified as Level 2.
Unlisted equity securities for which market quotations are available are valued at the last sale price on the valuation date, or if no sale occurs, at the last bid price for long positions or the last ask price for short positions, and are generally classified as Level 2. Securities traded on certain foreign securities exchanges are valued daily at fair value determined by an independent fair value service (if available) under Fair Valuation Procedures approved by the Trustees and consistent with applicable regulatory guidance. The independent fair value service takes into account multiple factors including, but not limited to, movements in the securities markets, certain depositary receipts, futures contracts and foreign currency exchange rates that have occurred subsequent to the close of the foreign securities exchange. These investments are generally classified as Level 2 of the fair value hierarchy.
Money Market Funds — Investments in the Goldman Sachs Financial Square Government Fund (“Underlying Fund”) are valued at the NAV per share of the Institutional Share class on the day of valuation. These investments are generally classified as Level 1 of the fair value hierarchy. For information regarding the Underlying Fund’s accounting policies and investment holdings, please see the Underlying Fund’s shareholder report.
Derivative Contracts — A derivative is an instrument whose value is derived from underlying assets, indices, reference rates or a combination of these factors. A Fund enters into derivative transactions to hedge against changes in interest rates, securities prices, and/or currency exchange rates, to increase total return, or to gain access to certain markets or attain exposure to other underliers. For financial reporting purposes, cash collateral that has been pledged to cover obligations of a Fund and cash collateral received, if any, is reported separately on the Statements of Assets and Liabilities as receivables/payables for collateral on certain derivatives contracts. Non-cash collateral pledged by a Fund, if any, is noted in the Schedules of Investments.
Exchange-traded derivatives, including futures and options contracts, are generally valued at the last sale or settlement price on the exchange where they are principally traded. Exchange-traded options without settlement prices are generally valued at the midpoint of the bid and ask prices on the exchange where they are principally traded (or, in the absence of two-way trading, at the last bid price for long positions and the last ask price for short positions). Exchange-traded derivatives typically fall within Level 1 of the fair value hierarchy. Over-the-counter (“OTC”) and centrally cleared derivatives are valued using market transactions and other market evidence, including market-based inputs to models, calibration to market-clearing transactions, broker or dealer quotations, or other alternative pricing sources. Where models are used, the selection of a particular model to value OTC and centrally cleared derivatives depends upon the contractual terms of, and specific risks inherent in, the instrument, as well as the availability of pricing information in the market. Valuation models require a variety of inputs, including contractual terms, market prices, yield curves, credit curves, measures of volatility, voluntary and involuntary prepayment rates, loss severity rates and correlations of such inputs. For OTC and centrally cleared derivatives that trade in liquid markets, model inputs can generally be verified and model selection does not involve significant management judgment. OTC and centrally cleared derivatives are classified within Level 2 of the fair value hierarchy when significant inputs are corroborated by market evidence.
i. Futures Contracts — Futures contracts are contracts to buy or sell a standardized quantity of a specified commodity or security. Upon entering into a futures contract, a Fund deposits cash or securities in an account on behalf of the broker in an amount sufficient to meet the initial margin requirement. Subsequent payments are made or received by a Fund equal to the daily change in the contract value and are recorded as variation margin receivable or payable with a corresponding offset to unrealized gains or losses.
B. Level 3 Fair Value Investments — To the extent that significant inputs to valuation models and other alternative pricing sources are unobservable, or if quotations are not readily available, or if GSAM believes that such quotations do not accurately reflect fair value, the fair value of a Fund’s investments may be determined under Valuation Procedures approved by the Trustees. GSAM, consistent with its procedures and applicable regulatory guidance, may make an adjustment to the most recent valuation
69
GOLDMAN SACHS INTERNATIONAL EQUITY INSIGHTS FUNDS
Notes to Financial Statements (continued)
October 31, 2020
| 3. INVESTMENTS AND FAIR VALUE MEASUREMENTS (continued) |
prices of either domestic or foreign securities in light of significant events to reflect what it believes to be the fair value of the securities at the time of determining a Fund’s NAV. To the extent investments are valued using single source broker quotations obtained directly from the broker or passed through from third party pricing vendors, such investments are classified as Level 3 investments.
C. Fair Value Hierarchy — The following is a summary of the Funds’ investments and derivatives classified in the fair value hierarchy as of October 31, 2020:
| EMERGING MARKETS EQUITY INSIGHTS |
| |||||||||||
| Investment Type | Level 1 | Level 2 | Level 3 | |||||||||
| Assets | ||||||||||||
Common Stock and/or Other Equity Investments(a) | ||||||||||||
Africa | $ | — | $ | 36,631,169 | $ | — | ||||||
Asia | 488,399,478 | 1,027,643,460 | — | |||||||||
Europe | 693,760 | 10,704,590 | — | |||||||||
North America | 36,619,796 | — | — | |||||||||
South America | 87,091,220 | 2,529,047 | — | |||||||||
Securities Lending Reinvestment Vehicle | 500,400 | — | — | |||||||||
| Total | $ | 613,304,654 | $ | 1,077,508,266 | $ | — | ||||||
| Derivative Type | ||||||||||||
| Assets(b) | ||||||||||||
Futures Contracts | $ | 32,269 | $ | — | $ | — | ||||||
| INTERNATIONAL EQUITY INSIGHTS | ||||||||||||
| Investment Type | Level 1 | Level 2 | Level 3 | |||||||||
| Assets | ||||||||||||
Common Stock and/or Other Equity Investments(a) | ||||||||||||
Africa | $ | — | $ | 16,792,959 | $ | — | ||||||
Asia | — | 711,041,932 | — | |||||||||
Australia and Oceania | 26,388,115 | 157,874,546 | — | |||||||||
Europe | 45,196,279 | 1,243,425,495 | — | |||||||||
North America | — | 1,087,962 | — | |||||||||
Securities Lending Reinvestment Vehicle | 25,795,600 | — | — | |||||||||
| Total | $ | 97,379,994 | $ | 2,130,222,894 | $ | — | ||||||
| Derivative Type | ||||||||||||
| Liabilities(b) | ||||||||||||
Futures Contracts | $ | (18,421 | ) | $ | — | $ | — | |||||
| (a) | Amounts are disclosed by continent to highlight the impact of time zone differences between local market close and the calculation of NAV. Security valuations are based on the principal exchange or system on which they are traded, which may differ from country of domicile. The Funds utilize fair value model prices provided by an independent fair value service for certain international equity securities, resulting in a Level 2 classification. |
| (b) | Amount shown represents unrealized gain (loss) at fiscal year end. |
70
GOLDMAN SACHS INTERNATIONAL EQUITY INSIGHTS FUNDS
| 3. INVESTMENTS AND FAIR VALUE MEASUREMENTS (continued) |
| INTERNATIONAL SMALL CAP INSIGHTS | ||||||||||||
| Investment Type | Level 1 | Level 2 | Level 3 | |||||||||
| Assets | ||||||||||||
Common Stock and/or Other Equity Investments(a) | ||||||||||||
Africa | $ | — | $ | 220,415 | $ | — | ||||||
Asia | — | 1,091,247,273 | — | |||||||||
Australia and Oceania | — | 232,325,937 | — | |||||||||
Europe | 93,227,844 | 1,389,192,518 | — | |||||||||
North America | — | 9,852,530 | — | |||||||||
Securities Lending Reinvestment Vehicle | 29,274,156 | — | — | |||||||||
| Total | $ | 122,502,000 | $ | 2,722,838,673 | $ | — | ||||||
| Derivative Type | ||||||||||||
| Liabilities(b) | ||||||||||||
Futures Contracts | $ | (1,868,796 | ) | $ | — | $ | — | |||||
| (a) | Amounts are disclosed by continent to highlight the impact of time zone differences between local market close and the calculation of NAV. Security valuations are based on the principal exchange or system on which they are traded, which may differ from country of domicile. The Fund utilizes fair value model prices provided by an independent fair value service for certain international equity securities, resulting in a Level 2 classification. |
| (b) | Amount shown represents unrealized gain (loss) at fiscal year end. |
For further information regarding security characteristics, see the Schedules of Investments.
| 4. INVESTMENTS IN DERIVATIVES |
The following table sets forth, by certain risk types, the gross value of derivative contracts (not considered to be hedging instruments for accounting disclosure purposes) as of October 31, 2020. These instruments were used as part of the Funds’ investment strategies and to obtain and/or manage exposure related to the risks below. The values in the tables below exclude the effects of cash collateral received or posted pursuant to these derivative contracts, and therefore are not representative of the Funds’ net exposure:
| Fund | Risk | Statements of Assets and Liabilities | Assets(a) | Statements of Assets and Liabilities | Liabilities(a) | |||||||||
Emerging Markets Equity Insights | Equity | Variation margin on futures contracts | $ | 32,269 | — | $ | — | |||||||
International Equity Insights | Equity | — | — | Variation margin on futures contracts | (18,421) | |||||||||
International Small Cap Insights | Equity | — | — | Variation margin on futures contracts | (1,868,796) | |||||||||
| (a) | Includes unrealized gain (loss) on futures contracts described in the Additional Investment Information sections of the Schedules of Investments. Only the variation margin as of October 31, 2020 is reported within the Statements of Assets and Liabilities. |
The following table sets forth, by certain risk types, the Funds’ gains (losses) related to these derivatives and their indicative volumes for the fiscal year ended October 31, 2020. These gains (losses) should be considered in the context that these derivative contracts may have been executed to create investment opportunities and/or economically hedge certain investments, and
71
GOLDMAN SACHS INTERNATIONAL EQUITY INSIGHTS FUNDS
Notes to Financial Statements (continued)
October 31, 2020
| 4. INVESTMENTS IN DERIVATIVES (continued) |
accordingly, certain gains (losses) on such derivative contracts may offset certain (losses) gains attributable to investments. These gains (losses) are included in “Net realized gain (loss)” or “Net change in unrealized gain (loss)” on the Statements of Operations:
| Fund | Risk | Statements of Operations | Net Realized Gain (Loss) | Net Change in Unrealized Gain (Loss) | Average Number of Contracts(a) | |||||||||||
Emerging Markets Equity Insights | Equity | Net realized gain (loss) from futures contracts/Net change in unrealized gain (loss) on futures contracts | $ | 5,971,537 | $ | 32,269 | 323 | |||||||||
International Equity Insights | Equity | Net realized gain (loss) from futures contracts/Net change in unrealized gain (loss) on futures contracts | 6,902,118 | (18,421 | ) | 200 | ||||||||||
International Small Cap Insights | Equity | Net realized gain (loss) from futures contracts/Net change in unrealized gain (loss) on futures contracts | 4,353,779 | (1,877,027 | ) | 260 | ||||||||||
| (a) | Average number of contracts is based on the average of month end balances for the fiscal year ended October 31, 2020. |
| 5. AGREEMENTS AND AFFILIATED TRANSACTIONS |
A. Management Agreement — Under the Agreement, GSAM manages the Funds, subject to the general supervision of the Trustees.
As compensation for the services rendered pursuant to the Agreement, the assumption of the expenses related thereto and administration of the Funds’ business affairs, including providing facilities, GSAM is entitled to a management fee, accrued daily and paid monthly, equal to an annual percentage rate of each Fund’s average daily net assets.
For the fiscal year ended October 31, 2020, contractual and effective net management fees with GSAM were at the following rates:
| Contractual Management Rate | Effective Net Management Rate^ | |||||||||||||||||||||||||||||||
| Fund | First $1 billion | Next $1 billion | Next $3 billion | Next $3 billion | Over $8 billion | Effective Rate | ||||||||||||||||||||||||||
Emerging Markets Equity Insights | 1.00 | % | 1.00 | % | 0.90 | % | 0.86 | % | 0.84 | % | 1.00 | % | 1.00 | % | ||||||||||||||||||
International Equity Insights | 0.81 | 0.73 | 0.69 | 0.68 | 0.67 | 0.75 | 0.75 | |||||||||||||||||||||||||
International Small Cap Insights | 0.85 | 0.85 | 0.77 | 0.73 | 0.72 | 0.82 | 0.82 | |||||||||||||||||||||||||
| ^ | Effective Net Management Rate includes the impact of management fee waivers of affiliated underlying funds, if any. |
The Emerging Markets Equity Insights, International Equity Insights and International Small Cap Insights Funds invest in Institutional Shares of the Goldman Sachs Financial Square Government Fund, which is an affiliated Underlying Fund. GSAM has agreed to waive a portion of its management fee payable by the Funds in an amount equal to the management fee it earns as an investment adviser to the affiliated Underlying Fund in which the Funds invest, except those management fees it earns from the Funds’ investments of cash collateral received in connection with securities lending transactions in the Goldman Sachs Financial Square Government Fund. For the fiscal year ended October 31, 2020, GSAM waived $3,092, $3,894 and $336 of the Emerging Markets Equity Insights, International Equity Insights and International Small Cap Insights Funds’ management fees, respectively.
B. Distribution and/or Service (12b-1) Plans — The Trust, on behalf of Class A and Class R Shares of each applicable Fund, has adopted Distribution and Service Plans subject to Rule 12b-1 under the Act. Under the Distribution and Service Plans, Goldman Sachs, which serves as distributor (the “Distributor”), is entitled to a fee accrued daily and paid monthly for distribution services and personal and account maintenance services, which may then be paid by Goldman Sachs to authorized dealers. These fees are equal to an annual percentage rate of the average daily net assets attributable to Class A or Class R Shares of the Funds, as applicable, as set forth below.
72
GOLDMAN SACHS INTERNATIONAL EQUITY INSIGHTS FUNDS
| 5. AGREEMENTS AND AFFILIATED TRANSACTIONS (continued) |
The Trust, on behalf of Class C Shares of each applicable Fund, has adopted a Distribution Plan subject to Rule 12b-1 under the Act. Under the Distribution Plan, Goldman Sachs as Distributor is entitled to a fee accrued daily and paid monthly for distribution services, which may then be paid by Goldman Sachs to authorized dealers. These fees are equal to an annual percentage rate of the average daily net assets attributable to Class C Shares of the Funds, as set forth below.
The Trust, on behalf of Service Shares of each applicable Fund, has adopted a Service Plan subject to Rule 12b-1 under the Act to allow Service Shares to compensate service organizations (including Goldman Sachs) for providing personal and account maintenance services to their customers who are beneficial owners of such shares. The Service Plan provides for compensation to the service organizations equal to an annual percentage rate of the average daily net assets attributable to Service Shares of the Funds, as set forth below.
| Distribution and/or Service Plan Rates | ||||||||||||||||
| Class A* | Class C | Service | Class R* | |||||||||||||
Distribution and/or Service Plan | 0.25 | % | 0.75 | % | 0.25 | % | 0.50 | % | ||||||||
| * | With respect to Class A and Class R Shares, the Distributor at its discretion may use compensation for distribution services paid under the Distribution and Service Plans to compensate service organizations for personal and account maintenance services and expenses as long as such total compensation does not exceed the maximum cap on “service fees” imposed by the Financial Industry Regulatory Authority. |
C. Distribution Agreement — Goldman Sachs, as Distributor of the shares of the Funds pursuant to a Distribution Agreement, may retain a portion of the Class A Shares’ front end sales charge and Class C Shares’ CDSC. During the fiscal year ended October 31, 2020, Goldman Sachs retained the following amounts:
| Front End Sales Charge | Contingent Deferred Sales Charge | |||||||||
| Fund | Class A | Class C | ||||||||
Emerging Markets Equity Insights | $ | 2,537 | $ | — | ||||||
International Equity Insights | 4,214 | 21 | ||||||||
International Small Cap Insights | 1,550 | — | ||||||||
D. Service and Shareholder Administration Plans — The Trust, on behalf of each applicable Fund, has adopted Service Plans to allow Class C Shares and Shareholder Administration Plans to allow Service Shares, respectively, to compensate service organizations (including Goldman Sachs) for providing varying levels of personal and account maintenance or shareholder administration services to their customers who are beneficial owners of such shares. The Service and Shareholder Administration Plans each provide for compensation to the service organizations equal to an annual percentage rate of 0.25% of the average daily net assets attributable to Class C and Service Shares of the Funds, respectively.
E. Transfer Agency Agreement — Goldman Sachs also serves as the transfer agent of the Funds for a fee pursuant to the Transfer Agency Agreement. The fees charged for such transfer agency services are accrued daily and paid monthly at annual rates as follows: 0.16% of the average daily net assets of Class A, Class C, Investor and Class R Shares; 0.03% of the average daily net assets of Class R6 and Class P Shares; and 0.04% of the average daily net assets of Institutional and Service Shares. Prior to July 1, 2020, such fee was 0.17% of the average daily net assets of the Class A, Class C, Investor and Class R Shares.
F. Other Expense Agreements and Affiliated Transactions — GSAM has agreed to reduce or limit certain “Other Expenses” of the Funds (excluding acquired fund fees and expenses, transfer agency fees and expenses, service fees and shareholder administration fees (as applicable), taxes, interest, brokerage fees, expenses of shareholder meetings, litigation and indemnification, and extraordinary expenses) to the extent such expenses exceed, on an annual basis, a percentage rate of the average daily net assets of each Fund. Such Other Expense reimbursements, if any, are accrued daily and paid monthly. In addition, the Funds are not obligated to reimburse GSAM for prior fiscal year expense reimbursements, if any. The Other Expense limitations as an annual percentage rate of average daily net assets for Emerging Markets Equity Insights, International Equity
73
GOLDMAN SACHS INTERNATIONAL EQUITY INSIGHTS FUNDS
Notes to Financial Statements (continued)
October 31, 2020
| 5. AGREEMENTS AND AFFILIATED TRANSACTIONS (continued) |
Insights and International Small Cap Insights Funds are 0.054%, 0.004% and 0.014%, respectively. These Other Expense limitations will remain in place through at least February 28, 2021, and prior to such date GSAM may not terminate the arrangements without the approval of the Trustees. In addition, the Funds have entered into certain offset arrangements with the custodian and the transfer agent, which may result in a reduction of the Funds’ expenses and are received irrespective of the application of the “Other Expense” limitations described above.
For the fiscal year ended October 31, 2020, these expense reductions, including any fee waivers and Other Expense reimbursements, were as follows:
| Fund | Management Fee Waiver | Custody Fee Credits | Other Expense Reimbursement | Total Expense Reductions | ||||||||||||||
Emerging Markets Equity Insights | $ | 3,092 | $ | 22,509 | $ | 1,041,742 | $ | 1,067,343 | ||||||||||
International Equity Insights | 3,894 | 47,822 | 1,511,886 | 1,563,602 | ||||||||||||||
International Small Cap Insights | 336 | 13,791 | 1,967,166 | 1,981,293 | ||||||||||||||
G. Line of Credit Facility — As of October 31, 2020, the Funds participated in a $700,000,000 committed, unsecured revolving line of credit facility (the “facility”) together with other funds of the Trust and certain registered investment companies having management agreements with GSAM or its affiliates. This facility is to be used for temporary emergency purposes, or to allow for an orderly liquidation of securities to meet redemption requests. The interest rate on borrowings is based on the federal funds rate. The facility also requires a fee to be paid by the Funds based on the amount of the commitment that has not been utilized. For the fiscal year ended October 31, 2020, the Funds did not have any borrowings under the facility. Prior to April 28, 2020, the facility was $580,000,000.
H. Other Transactions with Affiliates — For the fiscal year ended October 31, 2020, Goldman Sachs earned $800 and $1,046 in brokerage commissions from portfolio transactions, including futures transactions executed with Goldman Sachs as the Futures Commission Merchant, on behalf of the International Equity Insights and International Small Cap Insights Funds, respectively.
The following table provides information about the Funds’ investments in the Goldman Sachs Financial Square Government Fund as of and for the fiscal year ended October 31, 2020:
| Fund | Beginning Value as of October 31, 2019 | Purchases at Cost | Proceeds from Sales | Ending Value as of October 31, 2020 | Shares as of October 31, 2020 | Dividend Income from Affiliated Investment Company | ||||||||||||||||||||
Emerging Markets Equity Insights | $ | — | $ | 233,938,341 | $ | (233,938,341 | ) | $ | — | — | $ | 13,155 | ||||||||||||||
International Equity Insights | — | 141,962,756 | (141,962,756 | ) | — | — | 26,937 | |||||||||||||||||||
International Small Cap Insights | — | 53,306,217 | (53,306,217 | ) | — | — | 456 | |||||||||||||||||||
As of October 31, 2020, the following Goldman Sachs Global Tax-Aware Equity Portfolio was a beneficial owner of 5% or more of total outstanding shares of the following Fund:
| Fund | Goldman Sachs Tax-Advantaged Global Equity Portfolio | |||||
Emerging Markets Equity Insights | 8 | % | ||||
74
GOLDMAN SACHS INTERNATIONAL EQUITY INSIGHTS FUNDS
| 6. PORTFOLIO SECURITIES TRANSACTIONS |
The cost of purchases and proceeds from sales and maturities of long-term securities for the fiscal year ended October 31, 2020, were as follows:
| Fund | Purchases | Sales and Maturities | ||||||||
Emerging Markets Equity Insights | $ | 2,886,816,534 | $ | 3,115,706,193 | ||||||
International Equity Insights | 4,117,664,129 | 4,709,272,083 | ||||||||
International Small Cap Insights | 4,811,865,850 | 5,593,644,970 | ||||||||
| 7. SECURITIES LENDING |
Pursuant to exemptive relief granted by the Securities and Exchange Commission (“SEC”) and the terms and conditions contained therein, the Funds may lend their securities through a securities lending agent, Goldman Sachs Agency Lending (“GSAL”), a wholly-owned subsidiary of Goldman Sachs, to certain qualified borrowers including Goldman Sachs and affiliates. In accordance with the Funds’ securities lending procedures, the Funds receive cash collateral at least equal to the market value of the securities on loan. The market value of the loaned securities is determined at the close of business of the Funds, at their last sale price or official closing price on the principal exchange or system on which they are traded, and any additional required collateral is delivered to the Funds on the next business day. As with other extensions of credit, the Funds may experience delay in the recovery of their securities or incur a loss should the borrower of the securities breach its agreement with the Funds or become insolvent at a time when the collateral is insufficient to cover the cost of repurchasing securities on loan. Dividend income received from securities on loan may not be subject to withholding taxes and therefore withholding taxes paid may differ from the amounts listed in the Statements of Operations. Loans of securities are terminable at any time and as such 1) the remaining contractual maturities of the outstanding securities lending transactions are considered to be overnight and continuous and 2) the borrower, after notice, is required to return borrowed securities within the standard time period for settlement of securities transactions.
The Funds invest the cash collateral received in connection with securities lending transactions in the Goldman Sachs Financial Square Government Fund (“Government Money Market Fund”), an affiliated series of the Goldman Sachs Trust. The Government Money Market Fund is registered under the Act as an open end investment company, is subject to Rule 2a-7 under the Act, and is managed by GSAM, for which GSAM may receive a management fee of up to 0.16% on an annualized basis of the average daily net assets of the Government Money Market Fund.
In the event of a default by a borrower with respect to any loan, GSAL will exercise any and all remedies provided under the applicable borrower agreement to make the Funds whole. These remedies include purchasing replacement securities by applying the collateral held from the defaulting broker against the purchase cost of the replacement securities. If GSAL is unable to purchase replacement securities, GSAL will indemnify the Funds by paying the Funds an amount equal to the market value of the securities loaned minus the value of cash collateral received from the borrower for the loan, subject to an exclusion for any shortfalls resulting from a loss of value in such cash collateral due to reinvestment risk. The Funds’ master netting agreements with certain borrowers provide the right, in the event of a default (including bankruptcy or insolvency), for the non-defaulting party to liquidate the collateral and calculate net exposure to the defaulting party or request additional collateral. However, in the event of a default by a borrower, a resolution authority could determine that such rights are not enforceable due to the restrictions or prohibitions against the right of set-off that may be imposed in accordance with a particular jurisdiction’s bankruptcy or insolvency laws. The Funds’ loaned securities were all subject to enforceable Securities Lending Agreements and the value of the collateral was at least equal to the value of the cash received. The amounts of the Funds’ overnight and continuous agreements, which represent the gross amounts of recognized liabilities for securities lending transactions outstanding as of October 31, 2020, are disclosed as “Payable upon return of securities loaned” on the Statements of Assets and Liabilities, where applicable.
Each of the Funds and GSAL received compensation relating to the lending of the Funds’ securities. The amounts earned, if any, by the Funds for the fiscal year ended October 31, 2020, are reported under Investment Income on the Statements of Operations.
75
GOLDMAN SACHS INTERNATIONAL EQUITY INSIGHTS FUNDS
Notes to Financial Statements (continued)
October 31, 2020
| 7. SECURITIES LENDING (continued) |
The table below details securities lending activity with affiliates of Goldman Sachs:
| For the ficsal year ended October 31, 2020 | Amount Payable to Goldman Sachs upon Return of Securities Loaned as of October 31, 2020 | |||||||||||||
| Fund | Earnings of GSAL Relating to Securities Loaned | Amounts Received by the Funds from Lending to Goldman Sachs | ||||||||||||
Emerging Markets Equity Insights | $ | 7,523 | $ | 6,372 | $ | — | ||||||||
International Equity Insights | 29,108 | 4,167 | — | |||||||||||
International Small Cap Insights | 68,329 | 85,236 | 1,255,325 | |||||||||||
The following table provides information about the Funds’ investment in the Government Money Market Fund for the fiscal year ended October 31, 2020:
| Fund | Beginning Value as of October 31, 2019 | Purchases at Cost | Proceeds from Sales | Ending Value as of October 31, 2020 | ||||||||||||||
Emerging Markets Equity Insights | $ | 121,709 | $ | 137,619,519 | $ | (137,240,828 | ) | $ | 500,400 | |||||||||
International Equity Insights | 30,387,872 | 362,958,212 | (367,550,484 | ) | 25,795,600 | |||||||||||||
International Small Cap Insights | 32,107,743 | 426,896,528 | (429,730,115 | ) | 29,274,156 | |||||||||||||
| 8. TAX INFORMATION |
The tax character of distributions paid during the fiscal year ended October 31, 2020, was as follows:
| Emerging Markets Equity Insights | International Equity Insights | International Small Cap Insights | ||||||||||
Distributions paid from: | ||||||||||||
Ordinary income | $ | 36,220,550 | $ | 76,193,916 | $ | 134,097,136 | ||||||
The tax character of distributions paid during the fiscal year ended October 31, 2019, was as follows:
| Emerging Markets Equity Insights | International Equity Insights | International Small Cap Insights | ||||||||||
Distributions paid from: | ||||||||||||
Ordinary income | $ | 39,969,097 | $ | 46,026,332 | $ | 61,355,652 | ||||||
76
GOLDMAN SACHS INTERNATIONAL EQUITY INSIGHTS FUNDS
| 8. TAX INFORMATION (continued) |
As of October 31, 2020, the components of accumulated earnings (losses) on a tax-basis were as follows:
Emerging Markets | International | International | ||||||||||
Undistributed ordinary income — net | $ | 20,816,972 | $ | 37,956,237 | $ | 47,361,524 | ||||||
Capital loss carryforwards: | ||||||||||||
Perpetual long-term | $ | (3,908,312 | ) | $ | (74,057,447 | ) | $ | (102,120,936 | ) | |||
Perpetual short-term | (231,483,761 | ) | (287,762,244 | ) | (434,432,928 | ) | ||||||
Total capital loss carryforwards | $ | (235,392,073 | ) | $ | (361,819,691 | ) | $ | (536,553,864 | ) | |||
Unrealized gains — net | 345,669,057 | 99,876,604 | 146,967,005 | |||||||||
Total accumulated earnings (losses) — net | $ | 131,093,956 | $ | (223,986,850 | ) | $ | (342,225,335 | ) | ||||
As of October 31, 2020, the Funds’ aggregate security unrealized gains and losses based on cost for U.S. federal income tax purposes were as follows:
Emerging Markets | International | International | ||||||||||
Tax cost | $ | 1,344,008,927 | $ | 2,127,921,883 | $ | 2,696,762,881 | ||||||
Gross unrealized gain | 410,409,030 | 222,977,277 | 327,189,361 | |||||||||
Gross unrealized loss | (64,739,973 | ) | (123,100,673 | ) | (180,222,356 | ) | ||||||
Net unrealized gain | $ | 345,669,057 | $ | 99,876,604 | $ | 146,967,005 | ||||||
The difference between GAAP-basis and tax-basis unrealized gains (losses) is attributable primarily to wash sales, net mark to market gains (losses) on regulated futures, net mark to market gains (losses) on foreign currency contracts and differences in the tax treatment of passive foreign investment company investments.
GSAM has reviewed the Funds’ tax positions for all open tax years (the current and prior three years, as applicable) and has concluded that no provision for income tax is required in the Funds’ financial statements. Such open tax years remain subject to examination and adjustment by tax authorities.
| 9. OTHER RISKS |
The Funds’ risks include, but are not limited to, the following:
Derivatives Risk — The Funds’ use of derivatives may result in loss. Derivative instruments, which may pose risks in addition to and greater than those associated with investing directly in securities, currencies or other instruments, may be illiquid or less liquid, volatile, difficult to price and leveraged so that small changes in the value of the underlying instruments may produce disproportionate losses to the Funds. Derivatives are also subject to counterparty risk, which is the risk that the other party in the transaction will not fulfill its contractual obligation. The use of derivatives is a highly specialized activity that involves investment techniques and risks different from those associated with investments in more traditional securities and instruments. Losses from derivatives can also result from a lack of correlation between changes in the value of derivative instruments and the portfolio assets (if any) being hedged.
Foreign and Emerging Countries Risk — Investing in foreign markets may involve special risks and considerations not typically associated with investing in the U.S. Foreign securities may be subject to risk of loss because of more or less foreign government regulation, less public information and less economic, political and social stability in the countries in which a Fund
77
GOLDMAN SACHS INTERNATIONAL EQUITY INSIGHTS FUNDS
Notes to Financial Statements (continued)
October 31, 2020
| 9. OTHER RISKS (continued) |
invests. The imposition of exchange controls (including repatriation restrictions), confiscation of assets and property, trade restrictions (including tariffs) and other government restrictions by the U.S. or other governments, or from problems in share registration, settlement or custody, may also result in losses. Foreign risk also involves the risk of negative foreign currency rate fluctuations, which may cause the value of securities denominated in such foreign currency (or other instruments through which a Fund has exposure to foreign currencies) to decline in value. Currency exchange rates may fluctuate significantly over short periods of time. To the extent that a Fund also invests in securities of issuers located in emerging markets, these risks may be more pronounced.
Foreign Custody Risk — If a Fund invests in foreign securities, the Fund may hold such securities and cash with foreign banks, agents, and securities depositories appointed by the Fund’s custodian (each a “Foreign Custodian”). Some foreign custodians may be recently organized or new to the foreign custody business. In some countries, Foreign Custodians may be subject to little or no regulatory oversight over, or independent evaluation of, their operations. Further, the laws of certain countries may place limitations on a Fund’s ability to recover its assets if a Foreign Custodian enters bankruptcy. Investments in emerging markets may be subject to even greater custody risks than investments in more developed markets. Custody services in emerging market countries are very often undeveloped and may be considerably less well regulated than in more developed countries, and thus may not afford the same level of investor protection as would apply in developed countries.
Investments in Other Investment Companies Risk — As a shareholder of another investment company, a Fund will indirectly bear its proportionate share of any net management fees and other expenses paid by such other investment companies, in addition to the fees and expenses regularly borne by the Fund.
Large Shareholder Transactions Risk — A Fund may experience adverse effects when certain large shareholders, such as other funds, institutional investors (including those trading by use of non-discretionary mathematical formulas), financial intermediaries (who may make investment decisions on behalf of underlying clients and/or include a Fund in their investment model), individuals, accounts and Goldman Sachs affiliates, purchase or redeem large amounts of shares of a Fund. Such large shareholder redemptions, which may occur rapidly or unexpectedly, may cause a Fund to sell portfolio securities at times when it would not otherwise do so, which may negatively impact a Fund’s NAV and liquidity. These transactions may also accelerate the realization of taxable income to shareholders if such sales of investments resulted in gains, and may also increase transaction costs. In addition, a large redemption could result in a Fund’s current expenses being allocated over a smaller asset base, leading to an increase in the Fund’s expense ratio. Similarly, large Fund share purchases may adversely affect a Fund’s performance to the extent that the Fund is delayed in investing new cash or otherwise maintains a larger cash position than it ordinarily would.
Liquidity Risk — A Fund may make investments that are illiquid or that may become less liquid in response to market developments or adverse investor perceptions. Illiquid investments may be more difficult to value. Liquidity risk may also refer to the risk that a Fund will not be able to pay redemption proceeds within the allowable time period or without significant dilution to remaining investors’ interests because of unusual market conditions, an unusually high volume of redemption requests, or other reasons. To meet redemption requests, a Fund may be forced to sell investments at an unfavorable time and/or under unfavorable conditions. If a Fund is forced to sell securities at an unfavorable time and/or under unfavorable conditions, such sales may adversely affect the Fund’s NAV and dilute remaining investors’ interests. These risks may be more pronounced in connection with the Funds’ investments in securities of issuers located in emerging market countries. Redemptions by large shareholders may have a negative impact on a Fund’s liquidity.
Market and Credit Risks — In the normal course of business, a Fund trades financial instruments and enters into financial transactions where risk of potential loss exists due to changes in the market (market risk). The value of the securities in which a Fund invests may go up or down in response to the prospects of individual companies, particular sectors or governments and/or general economic conditions throughout the world due to increasingly interconnected global economies and financial markets. Events such as war, acts of terrorism, social unrest, natural disasters, the spread of infectious illness or other public health threats could also significantly impact a Fund and its investments. Additionally, a Fund may also be exposed to credit risk in the event that
78
GOLDMAN SACHS INTERNATIONAL EQUITY INSIGHTS FUNDS
| 9. OTHER RISKS (continued) |
an issuer or guarantor fails to perform or that an institution or entity with which the Fund has unsettled or open transactions defaults.
| 10. INDEMNIFICATIONS |
Under the Trust’s organizational documents, its Trustees, officers, employees and agents are indemnified, to the extent permitted by the Act and state law, against certain liabilities that may arise out of performance of their duties to the Funds. Additionally, in the course of business, the Funds enter into contracts that contain a variety of indemnification clauses. The Funds’ maximum exposure under these arrangements is unknown, as this would involve future claims that may be made against the Funds that have not yet occurred. However, GSAM believes the risk of loss under these arrangements to be remote.
| 11. OTHER MATTERS |
On October 16, 2020, a definitive proxy statement (“proxy”) was filed with the U.S. Securities and Exchange Commission to change the Emerging Markets Equity Insights Fund’s sub-classification under the Act from “diversified” to “non-diversified” and to eliminate any related fundamental investment restriction. GSAM has agreed to pay the expenses associated with the proxy, shareholder solicitation and other related costs.
On October 22, 2020, Goldman Sachs announced a settlement of matters involving 1Malaysia Development Bhd. (1MDB), a Malaysian sovereign wealth fund, with the United States Department of Justice as well as criminal and civil authorities in the UK, Singapore and Hong Kong. Further information regarding the 1MDB settlement can be found at https://www.goldmansachs.com/media-relations/press-releases/current/goldman-sachs-2020-10-22.html. The 1MDB settlement will not materially adversely affect GSAM’s ability to serve as investment manager.
| 12. SUBSEQUENT EVENTS |
Subsequent events after the Statements of Assets and Liabilities date have been evaluated, and GSAM has concluded that there is no impact requiring adjustment or disclosure in the financial statements.
79
GOLDMAN SACHS INTERNATIONAL EQUITY INSIGHTS FUNDS
Notes to Financial Statements (continued)
October 31, 2020
| 13. SUMMARY OF SHARE TRANSACTIONS |
Share activity is as follows:
| Emerging Markets Equity Insights Fund | ||||||||||||||||
|
| |||||||||||||||
| For the Fiscal Year Ended October 31, 2020 | For the Fiscal Year Ended October 31, 2019 | |||||||||||||||
|
| |||||||||||||||
| Shares | Dollars | Shares | Dollars | |||||||||||||
|
| |||||||||||||||
| Class A Shares | ||||||||||||||||
Shares sold | 1,401,438 | $ | 12,758,250 | 2,966,653 | $ | 27,441,781 | ||||||||||
Reinvestment of distributions | 118,920 | 1,159,473 | 158,620 | 1,368,888 | ||||||||||||
Shares redeemed | (4,245,371 | ) | (38,963,400 | ) | (4,534,826 | ) | (41,438,386 | ) | ||||||||
| (2,725,013 | ) | (25,045,677 | ) | (1,409,553 | ) | (12,627,717 | ) | |||||||||
| Class C Shares | ||||||||||||||||
Shares sold | 48,145 | 455,875 | 256,648 | 2,349,700 | ||||||||||||
Reinvestment of distributions | 5,799 | 56,079 | 9,579 | 81,900 | ||||||||||||
Shares redeemed | (372,569 | ) | (3,394,246 | ) | (379,019 | ) | (3,461,810 | ) | ||||||||
| (318,625 | ) | (2,882,292 | ) | (112,792 | ) | (1,030,210 | ) | |||||||||
| Institutional Shares | ||||||||||||||||
Shares sold | 38,269,703 | 338,251,447 | 52,061,873 | 482,572,337 | ||||||||||||
Reinvestment of distributions | 1,872,307 | 18,180,104 | 2,189,583 | 18,830,413 | ||||||||||||
Shares redeemed | (46,792,105 | ) | (409,780,368 | ) | (62,919,172 | ) | (577,944,922 | ) | ||||||||
| (6,650,095 | ) | (53,348,817 | ) | (8,667,716 | ) | (76,542,172 | ) | |||||||||
| Investor Shares | ||||||||||||||||
Shares sold | 2,339,668 | 20,910,745 | 10,841,603 | 100,200,063 | ||||||||||||
Reinvestment of distributions | 226,625 | 2,198,257 | 249,709 | 2,145,005 | ||||||||||||
Shares redeemed | (6,550,280 | ) | (57,883,865 | ) | (9,135,724 | ) | (84,201,328 | ) | ||||||||
| (3,983,987 | ) | (34,774,863 | ) | 1,955,588 | 18,143,740 | |||||||||||
| Class R6 Shares | ||||||||||||||||
Shares sold | 11,869,424 | 108,770,757 | 21,229,915 | 194,592,630 | ||||||||||||
Reinvestment of distributions | 954,926 | 9,262,782 | 1,352,035 | 11,613,981 | ||||||||||||
Shares redeemed | (19,995,919 | ) | (178,540,794 | ) | (39,121,967 | ) | (360,316,512 | ) | ||||||||
| (7,171,569 | ) | (60,507,255 | ) | (16,540,017 | ) | (154,109,901 | ) | |||||||||
| Class R Shares | ||||||||||||||||
Shares sold | 673,190 | 5,988,282 | 1,277,600 | 11,619,066 | ||||||||||||
Reinvestment of distributions | 45,642 | 438,620 | 37,333 | 318,449 | ||||||||||||
Shares redeemed | (798,602 | ) | (7,249,768 | ) | (649,444 | ) | (5,943,448 | ) | ||||||||
| (79,770 | ) | (822,866 | ) | 665,489 | 5,994,067 | |||||||||||
| Class P Shares | ||||||||||||||||
Shares sold | 3,768,611 | 31,589,002 | 6,605,230 | 59,494,143 | ||||||||||||
Reinvestment of distributions | 264,309 | 2,563,794 | 359,752 | 3,090,275 | ||||||||||||
Shares redeemed | (6,512,741 | ) | (53,510,489 | ) | (8,075,477 | ) | (73,381,775 | ) | ||||||||
| (2,479,821 | ) | (19,357,693 | ) | (1,110,495 | ) | (10,797,357 | ) | |||||||||
NET DECREASE | (23,408,880 | ) | $ | (196,739,463 | ) | (25,219,496 | ) | $ | (230,969,550 | ) | ||||||
80
GOLDMAN SACHS INTERNATIONAL EQUITY INSIGHTS FUNDS
| 13. SUMMARY OF SHARE TRANSACTIONS (continued) |
| International Equity Insights Fund | ||||||||||||||||
|
| |||||||||||||||
| For the Fiscal Year Ended October 31, 2020 | For the Fiscal Year Ended October 31, 2019 | |||||||||||||||
|
| |||||||||||||||
| Shares | Dollars | Shares | Dollars | |||||||||||||
|
| |||||||||||||||
| Class A Shares | ||||||||||||||||
Shares sold | 7,926,994 | $ | 89,401,590 | 13,259,688 | $ | 159,153,653 | ||||||||||
Reinvestment of distributions | 440,242 | 5,547,046 | 204,537 | 2,186,506 | ||||||||||||
Shares redeemed | (9,566,000 | ) | (103,652,103 | ) | (9,882,575 | ) | (116,821,278 | ) | ||||||||
| (1,198,764 | ) | (8,703,467 | ) | 3,581,650 | 44,518,881 | |||||||||||
| Class C Shares | ||||||||||||||||
Shares sold | 143,956 | 1,656,858 | 456,513 | 5,141,424 | ||||||||||||
Reinvestment of distributions | 19,114 | 236,629 | 19,962 | 209,198 | ||||||||||||
Shares redeemed | (800,332 | ) | (8,829,816 | ) | (1,425,650 | ) | (16,400,371 | ) | ||||||||
| (637,262 | ) | (6,936,329 | ) | (949,175 | ) | (11,049,749 | ) | |||||||||
| Institutional Shares | ||||||||||||||||
Shares sold | 23,320,158 | 271,120,005 | 54,720,178 | 657,831,323 | ||||||||||||
Reinvestment of distributions | 1,453,083 | 18,817,424 | 1,221,357 | 13,398,286 | ||||||||||||
Shares redeemed | (53,834,133 | ) | (629,253,649 | ) | (66,250,331 | ) | (798,357,316 | ) | ||||||||
| (29,060,892 | ) | (339,316,220 | ) | (10,308,796 | ) | (127,127,707 | ) | |||||||||
| Service Shares | ||||||||||||||||
Shares sold | 48,006 | 557,250 | 142,546 | 1,698,529 | ||||||||||||
Reinvestment of distributions | 7,944 | 101,205 | 5,670 | 61,236 | ||||||||||||
Shares redeemed | (165,325 | ) | (1,972,728 | ) | (98,679 | ) | (1,177,739 | ) | ||||||||
| (109,375 | ) | (1,314,273 | ) | 49,537 | 582,026 | |||||||||||
| Investor Shares | ||||||||||||||||
Shares sold | 18,708,329 | 204,405,376 | 38,817,614 | 453,063,492 | ||||||||||||
Reinvestment of distributions | 1,192,705 | 14,717,983 | 684,659 | 7,168,380 | ||||||||||||
Shares redeemed | (37,036,531 | ) | (417,050,165 | ) | (28,303,390 | ) | (326,016,478 | ) | ||||||||
| (17,135,497 | ) | (197,926,806 | ) | 11,198,883 | 134,215,394 | |||||||||||
| Class R6 Shares | ||||||||||||||||
Shares sold | 12,481,283 | 149,814,870 | 34,080,931 | 412,901,400 | ||||||||||||
Reinvestment of distributions | 1,011,031 | 13,082,737 | 724,784 | 7,943,638 | ||||||||||||
Shares redeemed | (15,450,179 | ) | (185,491,737 | ) | (22,360,220 | ) | (272,988,934 | ) | ||||||||
| (1,957,865 | ) | (22,594,130 | ) | 12,445,495 | 147,856,104 | |||||||||||
| Class R Shares | ||||||||||||||||
Shares sold | 264,386 | 2,684,056 | 363,618 | 4,188,056 | ||||||||||||
Reinvestment of distributions | 13,067 | 160,204 | 7,899 | 82,224 | ||||||||||||
Shares redeemed | (293,188 | ) | (3,307,807 | ) | (258,509 | ) | (2,987,023 | ) | ||||||||
| (15,735 | ) | (463,547 | ) | 113,008 | 1,283,257 | |||||||||||
| Class P Shares | ||||||||||||||||
Shares sold | 22,761,785 | 228,470,032 | 24,463,775 | 282,043,576 | ||||||||||||
Reinvestment of distributions | 715,872 | 9,256,225 | 514,841 | 5,642,654 | ||||||||||||
Shares redeemed | (22,083,845 | ) | (236,168,248 | ) | (16,007,445 | ) | (190,246,857 | ) | ||||||||
| 1,393,812 | 1,558,009 | 8,971,171 | 97,439,373 | |||||||||||||
NET INCREASE (DECREASE) | (48,721,578 | ) | $ | (575,696,763 | ) | 25,101,773 | $ | 287,717,579 | ||||||||
81
GOLDMAN SACHS INTERNATIONAL EQUITY INSIGHTS FUNDS
Notes to Financial Statements (continued)
October 31, 2020
| 13. SUMMARY OF SHARE TRANSACTIONS (continued) |
| International Small Cap Insights Fund | ||||||||||||||||
|
| |||||||||||||||
| For the Fiscal Year Ended October 31, 2020 | For the Fiscal Year Ended October 31, 2019 | |||||||||||||||
|
| |||||||||||||||
| Shares | Dollars | Shares | Dollars | |||||||||||||
|
| |||||||||||||||
| Class A Shares | ||||||||||||||||
Shares sold | 2,509,564 | $ | 25,278,690 | 5,084,350 | $ | 57,542,690 | ||||||||||
Reinvestment of distributions | 391,583 | 4,659,839 | 174,144 | 1,724,026 | ||||||||||||
Shares redeemed | (5,785,416 | ) | (59,662,985 | ) | (8,714,983 | ) | (95,912,370 | ) | ||||||||
| (2,884,269 | ) | (29,724,456 | ) | (3,456,489 | ) | (36,645,654 | ) | |||||||||
| Class C Shares | ||||||||||||||||
Shares sold | 67,454 | 728,845 | 166,083 | 1,768,839 | ||||||||||||
Reinvestment of distributions | 96,844 | 1,117,582 | 14,011 | 134,359 | ||||||||||||
Shares redeemed | (1,963,466 | ) | (20,056,232 | ) | (2,026,719 | ) | (21,560,049 | ) | ||||||||
| (1,799,168 | ) | (18,209,805 | ) | (1,846,625 | ) | (19,656,851 | ) | |||||||||
| Institutional Shares | ||||||||||||||||
Shares sold | 54,461,158 | 554,649,638 | 88,905,949 | 988,567,614 | ||||||||||||
Reinvestment of distributions | 5,638,318 | 66,926,830 | 3,192,108 | 31,506,109 | ||||||||||||
Shares redeemed | (94,722,054 | ) | (932,342,859 | ) | (112,062,966 | ) | (1,226,702,768 | ) | ||||||||
| (34,622,578 | ) | (310,766,391 | ) | (19,964,909 | ) | (206,629,045 | ) | |||||||||
| Investor Shares | ||||||||||||||||
Shares sold | 1,891,399 | 19,680,694 | 6,007,193 | 66,017,326 | ||||||||||||
Reinvestment of distributions | 726,038 | 8,589,026 | 601,289 | 5,910,668 | ||||||||||||
Shares redeemed | (13,956,319 | ) | (145,994,812 | ) | (31,099,022 | ) | (340,121,004 | ) | ||||||||
| (11,338,882 | ) | (117,725,092 | ) | (24,490,540 | ) | (268,193,010 | ) | |||||||||
| Class R6 Shares | ||||||||||||||||
Shares sold | 22,721,529 | 235,744,909 | 26,323,470 | 291,256,574 | ||||||||||||
Reinvestment of distributions | 3,311,662 | 39,375,654 | 1,590,561 | 15,730,650 | ||||||||||||
Shares redeemed | (39,367,794 | ) | (427,706,335 | ) | (22,908,629 | ) | (255,148,086 | ) | ||||||||
| (13,334,603 | ) | (152,585,772 | ) | 5,005,402 | 51,839,138 | |||||||||||
| Class P Shares | ||||||||||||||||
Shares sold | 294,571 | 3,369,698 | 593,597 | 6,725,342 | ||||||||||||
Reinvestment of distributions | 233,781 | 2,779,660 | 136,281 | 1,347,821 | ||||||||||||
Shares redeemed | (3,416,736 | ) | (33,388,958 | ) | (1,986,467 | ) | (21,379,469 | ) | ||||||||
| (2,888,384 | ) | (27,239,600 | ) | (1,256,589 | ) | (13,306,306 | ) | |||||||||
NET DECREASE | (66,867,884 | ) | $ | (656,251,116 | ) | (46,009,750 | ) | $ | (492,591,728) | |||||||
82
Report of Independent Registered Public
Accounting Firm
To the Board of Trustees of Goldman Sachs Trust and Shareholders of Goldman Sachs Emerging Markets Equity Insights Fund, Goldman Sachs International Equity Insights Fund, and Goldman Sachs International Small Cap Insights Fund
Opinions on the Financial Statements
We have audited the accompanying statements of assets and liabilities, including the schedules of investments, of Goldman Sachs Emerging Markets Equity Insights Fund, Goldman Sachs International Equity Insights Fund, and Goldman Sachs International Small Cap Insights Fund (three of the funds constituting Goldman Sachs Trust, hereafter collectively referred to as the “Funds”) as of October 31, 2020, the related statements of operations for the year ended October 31, 2020, the statements of changes in net assets for each of the two years in the period ended October 31, 2020, including the related notes, and the financial highlights for each of the periods indicated therein (collectively referred to as the “financial statements”). In our opinion, the financial statements present fairly, in all material respects, the financial position of each of the Funds as of October 31, 2020, the results of each of their operations for the year then ended, the changes in each of their net assets for each of the two years in the period ended October 31, 2020 and each of the financial highlights for each of the periods indicated therein in conformity with accounting principles generally accepted in the United States of America.
Basis for Opinions
These financial statements are the responsibility of the Funds’ management. Our responsibility is to express an opinion on the Funds’ financial statements based on our audits. We are a public accounting firm registered with the Public Company Accounting Oversight Board (United States) (PCAOB) and are required to be independent with respect to the Funds in accordance with the U.S. federal securities laws and the applicable rules and regulations of the Securities and Exchange Commission and the PCAOB.
We conducted our audits of these financial statements in accordance with the standards of the PCAOB. Those standards require that we plan and perform the audit to obtain reasonable assurance about whether the financial statements are free of material misstatement, whether due to error or fraud.
Our audits included performing procedures to assess the risks of material misstatement of the financial statements, whether due to error or fraud, and performing procedures that respond to those risks. Such procedures included examining, on a test basis, evidence regarding the amounts and disclosures in the financial statements. Our audits also included evaluating the accounting principles used and significant estimates made by management, as well as evaluating the overall presentation of the financial statements. Our procedures included confirmation of securities owned as of October 31, 2020 by correspondence with the custodian, transfer agent and brokers; when replies were not received from brokers, we performed other auditing procedures. We believe that our audits provide a reasonable basis for our opinions.
/s/PricewaterhouseCoopers LLP
Boston, Massachusetts
December 23, 2020
We have served as the auditor of one or more investment companies in the Goldman Sachs fund complex since 2000.
83
GOLDMAN SACHS INTERNATIONAL EQUITY INSIGHTS FUNDS
Voting Results of Special Meeting of Shareholders (Unaudited)
A Special Meeting (the “Meeting”) of the Goldman Sachs Trust (“GST”) was held on January 23, 2020 to consider and act upon the proposals below. The Funds have amortized their respective share of the proxy, shareholder meeting and other related costs and GSAM has agreed to reimburse each Fund to the extent such expenses exceed a specified percentage of the Fund’s net assets.
At the Meeting, Dwight L. Bush, Kathryn A. Cassidy, Joaquin Delgado and Gregory G. Weaver were elected to the Trust’s Board of Trustees. In electing trustees, the Trust’s shareholders voted as follows:
Proposal 1. Election of Trustees | For | Against | Withheld | Broker Non-Votes | ||||||||||||
Dwight L. Bush | 94,278,961,728.065 | 0 | 349,026,343,365 | 0 | ||||||||||||
Kathryn A. Cassidy | 94,310,850,789.164 | 0 | 317,137,282.266 | 0 | ||||||||||||
Joaquin Delgado | 94,282,646,444.727 | 0 | 345,341,626.703 | 0 | ||||||||||||
Gregory G. Weaver | 94,306,589,873.348 | 0 | 321,398,198.082 | 0 | ||||||||||||
84
GOLDMAN SACHS INTERNATIONAL EQUITY INSIGHTS FUNDS
Fund Expenses — Six Month Period Ended October 31, 2020 (Unaudited)
As a shareholder of Class A, Class C, Institutional, Service, Investor, Class R6, Class R or Class P Shares of a Fund you incur two types of costs: (1) transaction costs, including sales charges on purchase payments (with respect to Class A Shares) and contingent deferred sales charges on redemptions (with respect to Class C Shares); and (2) ongoing costs, including management fees; distribution and/or service (12b-1) fees (with respect to Class A, Class C, Service and Class R Shares); and other Fund expenses. This example is intended to help you understand your ongoing costs (in dollars) of investing in Class A, Class C, Institutional, Service, Investor, Class R6, Class R and Class P Shares of the Funds and to compare these costs with the ongoing costs of investing in other mutual funds.
The example is based on an investment of $1,000 invested at the beginning of the period and held for the entire period from May 01, 2020 through October 31, 2020, which represents a period of 184 days of a 365 day year.
Actual Expenses — The first line under each share class in the table below provides information about actual account values and actual expenses. You may use the information in this line, together with the amount you invested, to estimate the expenses that you paid over the period. Simply divide your account value by $1,000 (for example, an $8,600 account value divided by $1,000=8.6), then multiply the result by the number in the first line under the heading entitled “Expenses Paid” to estimate the expenses you paid on your account during this period.
Hypothetical Example for Comparison Purposes — The second line under each share class in the table below provides information about hypothetical account values and hypothetical expenses based on the Funds’ actual net expense ratio and an assumed rate of return of 5% per year before expenses, which is not the Funds’ actual return. The hypothetical account values and expenses may not be used to estimate the actual ending account balance or expenses you paid for the period. You may use this information to compare the ongoing costs of investing in the Funds and other funds. To do so, compare this 5% hypothetical example with the 5% hypothetical examples that appear in the shareholder reports of the other funds.
Please note that the expenses shown in the table are meant to highlight your ongoing costs only and do not reflect any transactional costs, such as sales charges, redemption fees or exchange fees. Therefore, the second line of the table is useful in comparing ongoing costs only, and will not help you determine the relative total costs of owning different funds. In addition, if these transactional costs were included, your costs would have been higher.
| Emerging Markets Equity Insights Fund | International Equity Insights Fund | International Small Cap Insights Fund | ||||||||||||||||||||||||||||||||||
| Share Class | Beginning Account Value 05/01/2020 | Ending Account Value 10/31/2020 | Expenses Paid for the 6 Months Ended 10/31/2020* | Beginning Account Value 05/01/2020 | Ending Account Value 10/31/2020 | Expenses Paid for the 6 Months Ended 10/31/2020* | Beginning Account Value 05/01/2020 | Ending Account Value 10/31/2020 | Expenses Paid for the 6 Months Ended 10/31/2020* | |||||||||||||||||||||||||||
| Class A | ||||||||||||||||||||||||||||||||||||
Actual | $ | 1,000 | $ | 1,262.30 | $ | 8.36 | $ | 1,000 | $ | 1,114.40 | $ | 6.22 | $ | 1,000 | $ | 1,157.30 | $ | 6.78 | ||||||||||||||||||
Hypothetical 5% return | 1,000 | 1,017.75 | + | 7.46 | 1,000 | 1,019.25 | + | 5.94 | 1,000 | 1,018.85 | + | 6.34 | ||||||||||||||||||||||||
| Class C | ||||||||||||||||||||||||||||||||||||
Actual | 1,000 | 1,257.80 | 12.49 | 1,000 | 1,110.80 | 10.13 | 1,000 | 1,154.10 | 10.78 | |||||||||||||||||||||||||||
Hypothetical 5% return | 1,000 | 1,014.08 | + | 11.14 | 1,000 | 1,015.53 | + | 9.68 | 1,000 | 1,015.13 | + | 10.08 | ||||||||||||||||||||||||
| Institutional | ||||||||||||||||||||||||||||||||||||
Actual | 1,000 | 1,264.20 | 6.20 | 1,000 | 1,116.80 | 4.26 | 1,000 | 1,159.60 | 4.78 | |||||||||||||||||||||||||||
Hypothetical 5% return | 1,000 | 1,019.66 | + | 5.53 | 1,000 | 1,021.11 | + | 4.06 | 1,000 | 1,020.71 | + | 4.47 | ||||||||||||||||||||||||
| Service | ||||||||||||||||||||||||||||||||||||
Actual | N/A | N/A | N/A | 1,000 | 1,114.10 | 6.86 | N/A | N/A | N/A | |||||||||||||||||||||||||||
Hypothetical 5% return | N/A | N/A | N/A | 1,000 | 1,018.65 | + | 6.55 | N/A | N/A | N/A | ||||||||||||||||||||||||||
| Investor | ||||||||||||||||||||||||||||||||||||
Actual | 1,000 | 1,263.30 | 6.94 | 1,000 | 1,115.70 | 4.89 | 1,000 | 1,159.20 | 5.43 | |||||||||||||||||||||||||||
Hypothetical 5% return | 1,000 | 1,019.00 | + | 6.19 | 1,000 | 1,020.51 | + | 4.67 | 1,000 | 1,020.11 | + | 5.08 | ||||||||||||||||||||||||
| Class R6 | ||||||||||||||||||||||||||||||||||||
Actual | 1,000 | 1,264.50 | 6.15 | 1,000 | 1,116.90 | 4.20 | 1,000 | 1,159.30 | 4.72 | |||||||||||||||||||||||||||
Hypothetical 5% return | 1,000 | 1,019.71 | + | 5.48 | 1,000 | 1,021.17 | + | 4.01 | 1,000 | 1,020.76 | + | 4.42 | ||||||||||||||||||||||||
| Class R | ||||||||||||||||||||||||||||||||||||
Actual | 1,000 | 1,260.00 | 9.71 | 1,000 | 1,112.60 | 7.54 | N/A | N/A | N/A | |||||||||||||||||||||||||||
Hypothetical 5% return | 1,000 | 1,016.54 | + | 8.67 | 1,000 | 1,018.00 | + | 7.20 | N/A | N/A | N/A | |||||||||||||||||||||||||
| Class P | ||||||||||||||||||||||||||||||||||||
Actual | 1,000 | 1,264.50 | 6.15 | 1,000 | 1,116.00 | 4.20 | 1,000 | 1,159.30 | 4.72 | |||||||||||||||||||||||||||
Hypothetical 5% return | 1,000 | 1,019.71 | + | 5.48 | 1,000 | 1,021.17 | + | 4.01 | 1,000 | 1,020.76 | + | 4.42 | ||||||||||||||||||||||||
| + | Hypothetical expenses are based on each Fund’s actual annualized net expense ratios and an assumed rate of return of 5% per year before expenses. |
| * | Expenses are calculated using each Fund’s annualized net expense ratio for each class, which represents the ongoing expenses as a percentage of net assets for the six months ended October 31, 2020. Expenses are calculated by multiplying the annualized net expense ratio by the average account value for the period; then multiplying the result by the number of days in the most recent fiscal half year; and then dividing that result by the number of days in the fiscal year. The annualized net expense ratios for the period were as follows: |
| Fund | Class A | Class C | Institutional | Service | Investor | Class R6 | Class R | Class P | ||||||||||||||||||||||||
Emerging Markets Equity Insights | 1.47 | % | 2.20 | % | 1.09 | % | N/A | 1.22 | % | 1.08 | % | 1.71 | % | 1.08 | % | |||||||||||||||||
International Equity Insights | 1.17 | 1.91 | 0.80 | 1.29 | % | 0.92 | 0.79 | 1.42 | 0.79 | |||||||||||||||||||||||
International Small Cap Insights | 1.25 | 1.99 | 0.88 | N/A | 1.00 | 0.87 | N/A | 0.87 | ||||||||||||||||||||||||
85
GOLDMAN SACHS INTERNATIONAL EQUITY INSIGHTS FUNDS
Statement Regarding Basis for Approval of Management Agreement (Unaudited)
Background
The Goldman Sachs Emerging Markets Equity Insights Fund, Goldman Sachs International Equity Insights Fund, and Goldman Sachs International Small Cap Insights Fund (the “Funds”) are investment portfolios of Goldman Sachs Trust (the “Trust”). The Board of Trustees oversees the management of the Trust and reviews the investment performance and expenses of the Funds at regularly scheduled meetings held throughout the year. In addition, the Board of Trustees determines annually whether to approve the continuance of the Trust’s investment management agreement (the “Management Agreement”) with Goldman Sachs Asset Management, L.P. (the “Investment Adviser”) on behalf of the Funds.
The Management Agreement was most recently approved for continuation until June 30, 2021 by the Board of Trustees, including those Trustees who are not parties to the Management Agreement or “interested persons” (as defined in the Investment Company Act of 1940, as amended) of any party thereto (the “Independent Trustees”), at a meeting held on June 16-17, 2020 (the “Annual Meeting”).
The review process undertaken by the Trustees spans the course of the year and culminates with the Annual Meeting. To assist the Trustees in their deliberations, the Trustees have established a Contract Review Committee (the “Committee”), comprised of the Independent Trustees. The Committee held two meetings over the course of the year since the Management Agreement was last approved. At those Committee meetings, regularly scheduled Board or other committee meetings, and/or the Annual Meeting, matters relevant to the renewal of the Management Agreement were considered by the Board, or the Independent Trustees, as applicable. With respect to each Fund, such matters included:
| (a) | the nature and quality of the advisory, administrative, and other services provided to the Fund by the Investment Adviser and its affiliates, including information about: |
| (i) | the structure, staff, and capabilities of the Investment Adviser and its portfolio management teams; |
| (ii) | the groups within the Investment Adviser and its affiliates that support the portfolio management teams or provide other types of necessary services, including fund services groups (e.g., accounting and financial reporting, tax, shareholder services, and operations); controls and risk management groups (e.g., legal, compliance, valuation oversight, credit risk management, internal audit, compliance testing, market risk analysis, finance, and central funding); sales and distribution support groups, and others (e.g., information technology and training); |
| (iii) | trends in employee headcount; |
| (iv) | the Investment Adviser’s financial resources and ability to hire and retain talented personnel and strengthen its operations; and |
| (v) | the parent company’s support of the Investment Adviser and its mutual fund business, as expressed by the firm’s senior management; |
| (b) | information on the investment performance of the Fund, including comparisons to the performance of similar mutual funds, as provided by a third-party mutual fund data provider engaged as part of the contract review process (the “Outside Data Provider”), a benchmark performance index, and (in the case of the Emerging Markets Equity Insights Fund and International Small Cap Insights Fund) a composite of accounts with comparable investment strategies managed by the Investment Adviser; and information on general investment outlooks in the markets in which the Fund invests; |
| (c) | information provided by the Investment Adviser indicating the Investment Adviser’s views on whether the Fund’s peer group and/or benchmark index had high, medium, or low relevance given the Fund’s particular investment strategy; |
| (d) | the terms of the Management Agreement and other agreements with affiliated service providers entered into by the Trust on behalf of the Fund; |
| (e) | fee and expense information for the Fund, including: |
| (i) | the relative management fee and expense levels of the Fund as compared to those of comparable funds managed by other advisers, as provided by the Outside Data Provider; |
| (ii) | the Fund’s expense trends over time; and |
| (iii) | to the extent the Investment Adviser manages other types of accounts (such as bank collective trusts, private wealth management accounts, institutional separate accounts, sub-advised mutual funds, and non-U.S. funds) having investment objectives and policies similar to those of the Fund, comparative information on the advisory fees charged and services provided to those accounts by the Investment Adviser; |
| (f) | with respect to the extensive investment performance and expense comparison data provided by the Outside Data Provider, its processes in producing that data for the Fund; |
| (g) | the undertakings of the Investment Adviser and its affiliates to implement fee waivers and/or expense limitations; |
| (h) | information relating to the profitability of the Management Agreement and the transfer agency and distribution and service arrangements of the Fund to the Investment Adviser and its affiliates; |
86
GOLDMAN SACHS INTERNATIONAL EQUITY INSIGHTS FUNDS
Statement Regarding Basis for Approval of Management Agreement (Unaudited) (continued)
| (i) | whether the Fund’s existing management fee schedule adequately addressed any economies of scale; |
| (j) | a summary of the “fall-out” benefits derived by the Investment Adviser and its affiliates from their relationships with the Fund, including the fees received by the Investment Adviser’s affiliates from the Fund for transfer agency, securities lending, portfolio trading, distribution and other services; |
| (k) | a summary of potential benefits derived by the Fund as a result of its relationship with the Investment Adviser; |
| (l) | information regarding commissions paid by the Fund and broker oversight, other information regarding portfolio trading, and how the Investment Adviser carries out its duty to seek best execution; |
| (m) | portfolio manager ownership of Fund shares; the manner in which portfolio manager compensation is determined; and the number and types of accounts managed by the portfolio managers; |
| (n) | the nature and quality of the services provided to the Fund by its unaffiliated service providers, and the Investment Adviser’s general oversight and evaluation (including reports on due diligence) of those service providers as part of the administrative services provided under the Management Agreement; and |
| (o) | the Investment Adviser’s processes and policies addressing various types of potential conflicts of interest; its approach to risk management; the annual review of the effectiveness of the Fund’s compliance program; and periodic compliance reports. |
The Trustees also received an overview of the Funds’ distribution arrangements. They received information regarding the Funds’ assets, share purchase and redemption activity, and payment of distribution, service, and shareholder administration fees, as applicable. Information was also provided to the Trustees relating to revenue sharing payments made by and services provided by the Investment Adviser and its affiliates to intermediaries that promote the sale, distribution, and/or servicing of Fund shares. The Independent Trustees also discussed the broad range of other investment choices that are available to Fund investors, including the availability of comparable funds managed by other advisers.
The presentations made at the Board and Committee meetings and at the Annual Meeting encompassed the Funds and other mutual funds for which the Board of Trustees has responsibility. In evaluating the Management Agreement at the Annual Meeting, the Trustees relied upon their knowledge, resulting from their meetings and other interactions throughout the year, of the Investment Adviser and its affiliates, their services, and the Funds. In conjunction with these meetings, the Trustees received written materials and oral presentations on the topics covered, and the Investment Adviser addressed the questions and concerns of the Trustees, including concerns regarding the investment performance of certain of the funds they oversee. The Independent Trustees were advised by their independent legal counsel regarding their responsibilities and other regulatory requirements related to the approval and continuation of mutual fund investment management agreements under applicable law. In addition, the Investment Adviser and its affiliates provided the Independent Trustees with a written response to a formal request for information sent on behalf of the Independent Trustees by their independent legal counsel. During the course of their deliberations, the Independent Trustees met in executive sessions with their independent legal counsel, without representatives of the Investment Adviser or its affiliates present.
Nature, Extent, and Quality of the Services Provided Under the Management Agreement
As part of their review, the Trustees considered the nature, extent, and quality of the services provided to the Funds by the Investment Adviser. In this regard, the Trustees considered both the investment advisory services and non-advisory services that are provided by the Investment Adviser and its affiliates. The Trustees noted the transition in the leadership and changes in personnel of various of the Investment Adviser’s portfolio management teams that had occurred in recent periods, and the ongoing recruitment efforts aimed at bringing high quality investment talent to the Investment Adviser. They also noted the Investment Adviser’s commitment to maintaining high quality systems and expending substantial resources to respond to ongoing changes to the market, regulatory and control environment in which the Funds and their service providers operate, including changes associated with the COVID-19 pandemic, as well as the efforts of the Investment Adviser and its affiliates to combat cyber security risks. The Trustees also considered information regarding the Investment Adviser’s business continuity planning and remote operations in the current environment. The Trustees concluded that the Investment Adviser continued to commit substantial financial and operational resources to the Funds and expressed confidence that the Investment Adviser would continue to do so in the future. The Trustees also recognized that the Investment Adviser had made significant commitments to address regulatory compliance requirements applicable to the Funds and the Investment Adviser and its affiliates.
Investment Performance
The Trustees also considered the investment performance of the Funds. In this regard, they compared the investment performance of each Fund to its peers using rankings and ratings compiled by the Outside Data Provider as of December 31, 2019, and updated performance information prepared by the Investment Adviser using the peer group identified by the Outside Data
87
GOLDMAN SACHS INTERNATIONAL EQUITY INSIGHTS FUNDS
Statement Regarding Basis for Approval of Management Agreement (Unaudited) (continued)
Provider as of March 31, 2020. The information on each Fund’s investment performance was provided for the one-, three-, five-, and ten-year periods ending on the applicable dates. The Trustees also reviewed each Fund’s investment performance relative to its performance benchmark. As part of this review, they considered the investment performance trends of the Funds over time, and reviewed the investment performance of each Fund in light of its investment objective and policies and market conditions. The Trustees also received information comparing the Emerging Markets Equity Insights Fund’s and International Small Cap Insights Fund’s performance to that of composites of accounts with comparable investment strategies managed by the Investment Adviser.
In addition, the Trustees considered materials prepared and presentations made by the Investment Adviser’s senior management and portfolio management personnel in which Fund performance was assessed. The Trustees also considered the Investment Adviser’s periodic reports with respect to the Funds’ risk profiles, and how the Investment Adviser’s approach to risk monitoring and management influences portfolio management. They noted the efforts of the Funds’ portfolio management team to continue to enhance the investment models used in managing the Funds.
The Trustees observed that the Emerging Markets Equity Insights Fund’s Institutional Shares had placed in the top half of the Fund’s peer group for the three-, five-, and ten-year periods and in the third quartile for the one-year period, and had outperformed the Fund’s benchmark index for the ten-year period and underperformed for the one-, three-, and five-year periods ended March 31, 2020. They noted that the International Equity Insights Fund’s Institutional Shares had placed in the top half of the Fund’s peer group for the five- and ten-year periods, in the third quartile for the three-year period, and in the fourth quartile for the one-year period, and had outperformed the Fund’s benchmark index for the five-year period and underperformed for the one-, three-, and ten-year periods ended March 31, 2020. The Trustees observed that the International Small Cap Insights Fund’s Institutional Shares had placed in the top half of the Fund’s peer group for the one-, three-, five-, and ten-year periods, and had underperformed the Fund’s benchmark index for the one-, three-, and five-year periods and outperformed for the ten-year period ended March 31, 2020.
Costs of Services Provided and Competitive Information
The Trustees considered the contractual terms of the Management Agreement and the fee rates payable by each Fund thereunder. In this regard, the Trustees considered information on the services rendered by the Investment Adviser to the Funds, which included both advisory and administrative services that were directed to the needs and operations of the Funds as registered mutual funds.
In particular, the Trustees reviewed analyses prepared by the Outside Data Provider regarding the expense rankings of the Funds. The analyses provided a comparison of each Fund’s management fee and breakpoints to those of a relevant peer group and category universe; an expense analysis which compared each Fund’s overall net and gross expenses to a peer group and a category universe; and data comparing each Fund’s net expenses to the peer and category medians. The analyses also compared each Fund’s other expenses and fee waivers/reimbursements to those of the peer group and category medians. The Trustees concluded that the comparisons provided by the Outside Data Provider were useful in evaluating the reasonableness of the management fees and total expenses paid by the Funds.
In addition, the Trustees considered the Investment Adviser’s undertakings to implement fee waivers and/or expense limitations. They also considered, to the extent that the Investment Adviser manages other types of accounts having investment objectives and policies similar to those of the Funds, comparative fee information for services provided by the Investment Adviser to those accounts, and information that indicated that services provided to the Funds differed in various significant respects from the services provided to other types of accounts which, in many cases, operated under less stringent legal and regulatory structures, required fewer services from the Investment Adviser to a smaller number of client contact points, and were less time-intensive.
In addition, the Trustees noted that shareholders are able to redeem their Fund shares at any time if shareholders believe that the Fund fees and expenses are too high or if they are dissatisfied with the performance of the Fund.
Profitability
The Trustees reviewed each Fund’s contribution to the Investment Adviser’s revenues and pre-tax profit margins. In this regard the Trustees noted that they had received, among other things, profitability analyses and summaries, revenue and expense schedules by Fund and by function (i.e., investment management, transfer agency and distribution and service), and information on the Investment Adviser’s expense allocation methodology. They observed that the profitability and expense figures are substantially similar to those used by the Investment Adviser for many internal purposes, including compensation decisions among various business groups, and are thus subject to a vigorous internal debate about how certain revenue and expenses should be allocated. The Trustees also noted that the internal audit group within the Goldman Sachs organization periodically audits the expense allocation methodology and that the internal audit group was satisfied with the reasonableness, consistency, and accuracy
88
GOLDMAN SACHS INTERNATIONAL EQUITY INSIGHTS FUNDS
Statement Regarding Basis for Approval of Management Agreement (Unaudited) (continued)
of the Investment Adviser’s expense allocation methodology. Profitability data for each Fund was provided for 2019 and 2018, and the Trustees considered this information in relation to the Investment Adviser’s overall profitability.
Economies of Scale
The Trustees considered the information that had been provided regarding whether there have been economies of scale with respect to the management of the Funds. The Trustees also considered the breakpoints in the fee rate payable under the Management Agreement for each of the Funds at the following annual percentage rates of the average daily net assets of the Funds:
| Emerging Markets Equity Insights Fund | International Equity Insights Fund | International Small Cap Insights Fund | ||||||||||
| First $1 billion | 1.00 | % | 0.81 | % | 0.85 | % | ||||||
| Next $1 billion | 1.00 | 0.73 | 0.85 | |||||||||
| Next $3 billion | 0.90 | 0.69 | 0.77 | |||||||||
| Next $3 billion | 0.86 | 0.68 | 0.73 | |||||||||
| Over $8 billion | 0.84 | 0.67 | 0.72 | |||||||||
The Trustees noted that the breakpoints were designed to share potential economies of scale, if any, with the Funds and their shareholders as assets under management reach those asset levels. The Trustees considered the amounts of assets in the Funds; the Funds’ recent share purchase and redemption activity; the information provided by the Investment Adviser relating to the costs of the services provided by the Investment Adviser and its affiliates and their realized profits; information comparing fee rates charged by the Investment Adviser with fee rates charged to other funds in the peer groups; and the Investment Adviser’s undertaking to limit certain expenses of the Funds that exceed specified levels. Upon reviewing these matters at the Annual Meeting, the Trustees concluded that the fee breakpoints represented a means of assuring that benefits of scalability, if any, would be passed along to shareholders at the specified asset levels. They also noted that the Investment Adviser had passed along savings to shareholders of the Funds, each of which had asset levels above at least the first breakpoint during the prior fiscal year.
Other Benefits to the Investment Adviser and Its Affiliates
The Trustees also considered the other benefits derived by the Investment Adviser and its affiliates from their relationships with the Funds as stated above, including: (a) transfer agency fees received by Goldman Sachs & Co. LLC (“Goldman Sachs”); (b) brokerage and futures commissions earned by Goldman Sachs for executing securities and futures transactions on behalf of the Funds; (c) trading efficiencies resulting from aggregation of orders of the Funds with those for other funds or accounts managed by the Investment Adviser; (d) fees earned by Goldman Sachs Agency Lending (“GSAL”), an affiliate of the Investment Adviser, as securities lending agent (and fees earned by the Investment Adviser for managing the fund in which the Funds’ cash collateral is invested); (e) the Investment Adviser’s ability to leverage the infrastructure designed to service the Funds on behalf of its other clients; (f) the Investment Adviser’s ability to cross-market other products and services to Fund shareholders; (g) Goldman Sachs’ retention of certain fees as Fund Distributor; (h) the Investment Adviser’s ability to negotiate better pricing with custodians on behalf of its other clients, as a result of the relationship with the Funds; (i) the investment of cash and cash collateral in money market funds managed by the Investment Adviser that will result in increased assets under management for those money market funds; (j) the investment in exchange-traded funds (“ETFs”) managed by the Investment Adviser that will result in increased assets under management for those ETFs and may facilitate the development of the Investment Adviser’s ETF advisory business; and (k) the possibility that the working relationship between the Investment Adviser and the Funds’ third-party service providers may cause those service providers to be more likely to do business with other areas of Goldman Sachs. In the course of considering the foregoing, the Independent Trustees requested and received further information quantifying certain of these fall-out benefits.
Other Benefits to the Funds and Their Shareholders
The Trustees also noted that the Funds receive certain other potential benefits as a result of their relationship with the Investment Adviser, including: (a) trading efficiencies resulting from aggregation of orders of the Funds with those of other funds or accounts managed by the Investment Adviser; (b) enhanced servicing from vendors due to the volume of business generated by the Investment Adviser and its affiliates; (c) enhanced servicing from broker-dealers due to the volume of business generated by the Investment Adviser and its affiliates; (d) the Investment Adviser’s ability to negotiate favorable terms with derivatives counterparties on behalf of the Funds as a result of the size and reputation of the Goldman Sachs organization; (e) the advantages received from the Investment Adviser’s knowledge and experience gained from managing other accounts and products; (f) the Investment Adviser’s ability to hire and retain qualified personnel to provide services to the Funds because of the reputation of the
89
GOLDMAN SACHS INTERNATIONAL EQUITY INSIGHTS FUNDS
Statement Regarding Basis for Approval of Management Agreement (Unaudited) (continued)
Goldman Sachs organization; (g) the Funds’ access, through the Investment Adviser, to certain firm-wide resources (e.g., proprietary risk management systems and databases), subject to certain restrictions; (h) the Funds’ ability to participate in the securities lending program administered by GSAL, as measured by the revenue received by the Funds in connection with the program; and (i) the Funds’ access to certain affiliated distribution channels. In addition, the Trustees noted the competitive nature of the mutual fund marketplace, and considered that many of the Funds’ shareholders invested in the Funds in part because of the Funds’ relationship with the Investment Adviser and that those shareholders have a general expectation that the relationship will continue.
Conclusion
In connection with their consideration of the Management Agreement, the Trustees gave weight to each of the factors described above, but did not identify any particular factor as controlling their decision. After deliberation and consideration of all of the information provided, including the factors described above, the Trustees concluded, in the exercise of their business judgment, that the management fees paid by each of the Funds were reasonable in light of the services provided to it by the Investment Adviser, the Investment Adviser’s costs and each Fund’s current and reasonably foreseeable asset levels. The Trustees unanimously concluded that the Investment Adviser’s continued management likely would benefit each Fund and its shareholders and that the Management Agreement should be approved and continued with respect to each Fund until June 30, 2021.
90
GOLDMAN SACHS INTERNATIONAL EQUITY INSIGHTS FUNDS
Trustees and Officers (Unaudited)
Independent Trustees
| Name, Address and Age1 | Position(s) Held with the Trust | Term of Office and | Principal Occupation(s) During Past 5 Years | Number of Portfolios in Fund Complex Overseen by Trustee3 | Other Directorships Held by Trustee4 | |||||
Jessica Palmer Age: 71 | Chair of the Board of Trustees | Since 2018 (Trustee since 2007) | Ms. Palmer is retired. She was formerly Consultant, Citigroup Human Resources Department (2007-2008); Managing Director, Citigroup Corporate and Investment Banking (previously, Salomon Smith Barney/Salomon Brothers) (1984-2006). Ms. Palmer was a Member of the Board of Trustees of Indian Mountain School (private elementary and secondary school) (2004-2009).
Chair of the Board of Trustees — Goldman Sachs Trust and Goldman Sachs Variable Insurance Trust. | 105 | None | |||||
Dwight L. Bush Age: 63 | Trustee | Since 2020 | Ambassador Bush is President and CEO of D.L. Bush & Associates (a financial advisory and private investment firm) (2002-2014 and 2017-present); and was formerly U.S. Ambassador to the Kingdom of Morocco (2014-2017) and a Member of the Board of Directors of Santander Bank, N.A. (2018-2019). Previously, Ambassador Bush served as an Advisory Board Member of Goldman Sachs Trust and Goldman Sachs Variable Insurance Trust (October 2019-January 2020).
Trustee — Goldman Sachs Trust and Goldman Sachs Variable Insurance Trust. | 105 | None | |||||
Kathryn A. Cassidy Age: 66 | Trustee | Since 2015 | Ms. Cassidy is retired. Formerly, she was Advisor to the Chairman (May 2014-December 2014); and Senior Vice President and Treasurer (2008-2014), General Electric Company & General Electric Capital Corporation (technology and financial services companies).
Trustee — Goldman Sachs Trust and Goldman Sachs Variable Insurance Trust. | 105 | None | |||||
Diana M. Daniels Age: 71 | Trustee | Since 2007 | Ms. Daniels is retired. Formerly, she was Vice President, General Counsel and Secretary, The Washington Post Company (1991-2006). Ms. Daniels is a Trustee Emeritus and serves as a Presidential Councillor of Cornell University (2013-Present); former Member of the Legal Advisory Board, New York Stock Exchange (2003-2006) and of the Corporate Advisory Board, Standish Mellon Management Advisors (2006-2007).
Trustee — Goldman Sachs Trust and Goldman Sachs Variable Insurance Trust. | 105 | None | |||||
Joaquin Delgado Age: 60 | Trustee | Since 2020 | Dr. Delgado is retired. He is Director, Hexion Inc. (a specialty chemical manufacturer) (2019-present); and Director, Stepan Company (a specialty chemical manufacturer) (2011-present); and was formerly Executive Vice President, Consumer Business Group of 3M Company (July 2016-July 2019); and Executive Vice President, Health Care Business Group of 3M Company (October 2012-July 2016). Previously, Dr. Delgado served as an Advisory Board Member of Goldman Sachs Trust and Goldman Sachs Variable Insurance Trust (October 2019-January 2020).
Trustee — Goldman Sachs Trust and Goldman Sachs Variable Insurance Trust. | 105 | Stepan Company (a specialty chemical manufacturer) | |||||
91
GOLDMAN SACHS INTERNATIONAL EQUITY INSIGHTS FUNDS
Trustees and Officers (Unaudited) (continued)
Independent Trustees
| Name, Address and Age1 | Position(s) Held with the Trust | Term of Office and | Principal Occupation(s) During Past 5 Years | Number of Portfolios in Fund Complex Overseen by Trustee3 | Other Directorships Held by Trustee4 | |||||
Roy W. Templin Age: 60 | Trustee | Since 2013 | Mr. Templin is retired. He is Director, Armstrong World Industries, Inc. (a designer and manufacturer of ceiling, wall and suspension system solutions) (2016-Present); and was formerly Chairman of the Board of Directors, Con-Way Incorporated (a transportation, logistics and supply chain management service company) (2014-2015); Executive Vice President and Chief Financial Officer, Whirlpool Corporation (an appliance manufacturer and marketer) (2004-2012).
Trustee — Goldman Sachs Trust and Goldman Sachs Variable Insurance Trust. | 105 | Armstrong World Industries, Inc. (a ceiling, wall and suspension systems solutions manufacturer) | |||||
Gregory G. Weaver Age: 69 | Trustee | Since 2015 | Mr. Weaver is retired. He is Director, Verizon Communications Inc. (2015-Present); and was formerly Chairman and Chief Executive Officer, Deloitte & Touche LLP (a professional services firm) (2001-2005 and 2012-2014); and Member of the Board of Directors, Deloitte & Touche LLP (2006-2012).
Trustee — Goldman Sachs Trust and Goldman Sachs Variable Insurance Trust. | 105 | Verizon Communications Inc. | |||||
92
GOLDMAN SACHS INTERNATIONAL EQUITY INSIGHTS FUNDS
Trustees and Officers (Unaudited) (continued)
Interested Trustee*
| Name, Address and Age1 | Position(s) Held with the Trust | Term of Office and | Principal Occupation(s) During Past 5 Years | Number of Portfolios in Fund Complex Overseen by Trustee3 | Other Directorships Held by Trustee4 | |||||
James A. McNamara Age: 58 | Trustee and President | Since 2007 | Advisory Director, Goldman Sachs (January 2018-Present); Managing Director, Goldman Sachs (January 2000-December 2017); Director of Institutional Fund Sales, GSAM (April 1998-December 2000); and Senior Vice President and Manager, Dreyfus Institutional Service Corporation (January 1993-April 1998).
President and Trustee — Goldman Sachs Trust; Goldman Sachs Variable Insurance Trust; Goldman Sachs Trust II; Goldman Sachs MLP and Energy Renaissance Fund; Goldman Sachs ETF Trust; Goldman Sachs Credit Income Fund; and Goldman Sachs Real Estate Diversified Income Fund. | 170 | None | |||||
| * | Mr. McNamara is considered to be an “Interested Trustee” because he holds positions with Goldman Sachs and owns securities issued by The Goldman Sachs Group, Inc. Mr. McNamara holds comparable positions with certain other companies of which Goldman Sachs, GSAM or an affiliate thereof is the investment adviser, administrator and/or distributor. |
| 1 | Each Trustee may be contacted by writing to the Trustee, c/o Goldman Sachs, 200 West Street, New York, New York, 10282, Attn: Caroline Kraus. Information is provided as of October 31, 2020. |
| 2 | Subject to such policies as may be adopted by the Board from time-to-time, each Trustee holds office for an indefinite term, until the earliest of: (a) the election of his or her successor; (b) the date the Trustee resigns or is removed by the Board or shareholders, in accordance with the Trust’s Declaration of Trust; or (c) the termination of the Trust. The Board has adopted policies which provide that each Independent Trustee shall retire as of December 31st of the calendar year in which he or she reaches (a) his or her 75th birthday or (b) the 15th anniversary of the date he or she became a Trustee, whichever is earlier, unless a waiver of such requirements shall have been adopted by a majority of the other Trustees. These policies may be changed by the Trustees without shareholder vote. |
| 3 | The Goldman Sachs Fund Complex includes certain other companies listed above for each respective Trustee. As of October 31, 2020, Goldman Sachs Trust consisted of 92 portfolios (90 of which offered shares to the public); Goldman Sachs Variable Insurance Trust consisted of 13 portfolios; Goldman Sachs Trust II consisted of 19 portfolios (17 of which offered shares to the public); Goldman Sachs ETF Trust consisted of 42 portfolios (24 of which offered shares to the public); and Goldman Sachs MLP and Energy Renaissance Fund, Goldman Sachs Credit Income Fund and Goldman Sachs Real Estate Diversified Income Fund each consisted of one portfolio. Goldman Sachs Credit Income Fund did not offer shares to the public. |
| 4 | This column includes only directorships of companies required to report to the Securities and Exchange Commission under the Securities Exchange Act of 1934 (i.e., “public companies”) or other investment companies registered under the Act. |
Additional information about the Trustees is available in the Funds’ Statement of Additional Information, which can be obtained from Goldman Sachs free of charge by calling this toll-free number (in the United States of America): 1-800-526-7384.
93
GOLDMAN SACHS INTERNATIONAL EQUITY INSIGHTS FUNDS
Trustees and Officers (Unaudited) (continued)
Officers of the Trust*
| Name, Address and Age1 | Position(s) Held with the Trust | Term of Office and | Principal Occupation(s) During Past 5 Years | |||
James A. McNamara 200 West Street New York, NY 10282 Age: 58 | Trustee and President | Since 2007 | Advisory Director, Goldman Sachs (January 2018-Present); Managing Director, Goldman Sachs (January 2000-December 2017); Director of Institutional Fund Sales, GSAM (April 1998-December 2000); and Senior Vice President and Manager, Dreyfus Institutional Service Corporation (January 1993-April 1998).
President and Trustee — Goldman Sachs Trust; Goldman Sachs Variable Insurance Trust; Goldman Sachs Trust II; Goldman Sachs MLP and Energy Renaissance Fund; Goldman Sachs ETF Trust; Goldman Sachs Credit Income Fund; and Goldman Sachs Real Estate Diversified Income Fund. | |||
Caroline L. Kraus 200 West Street New York, NY 10282 Age: 43 | Secretary | Since 2012 | Managing Director, Goldman Sachs (January 2016-Present); Vice President, Goldman Sachs (August 2006-December 2015); Senior Counsel, Goldman Sachs (January 2020-Present); Associate General Counsel, Goldman Sachs (2012-December 2019); Assistant General Counsel, Goldman Sachs (August 2006-December 2011); and Associate, Weil, Gotshal & Manges, LLP (2002-2006).
Secretary — Goldman Sachs Trust (previously Assistant Secretary (2012)); Goldman Sachs Variable Insurance Trust (previously Assistant Secretary (2012)); Goldman Sachs Trust II; Goldman Sachs BDC, Inc.; Goldman Sachs Private Middle Market Credit LLC; Goldman Sachs Private Middle Market Credit II LLC; Goldman Sachs Middle Market Lending Corp.; Goldman Sachs MLP and Energy Renaissance Fund; Goldman Sachs ETF Trust; Goldman Sachs Credit Income Fund; and Goldman Sachs Real Estate Diversified Income Fund. | |||
Joseph F. DiMaria 30 Hudson Street Jersey City, NJ 07302 Age: 52 | Treasurer, Principal Financial Officer and Principal Accounting Officer | Since 2017 (Treasurer and Principal Financial Officer since 2019) | Managing Director, Goldman Sachs (November 2015-Present) and Vice President — Mutual Fund Administration, Columbia Management Investment Advisers, LLC (May 2010-October 2015).
Treasurer, Principal Financial Officer and Principal Accounting Officer — Goldman Sachs Trust (previously Assistant Treasurer (2016)); Goldman Sachs Variable Insurance Trust (previously Assistant Treasurer (2016)); Goldman Sachs Trust II (previously Assistant Treasurer (2017)); Goldman Sachs MLP and Energy Renaissance Fund (previously Assistant Treasurer (2017)); Goldman Sachs ETF Trust (previously Assistant Treasurer (2017)); Goldman Sachs Credit Income Fund; and Goldman Sachs Real Estate Diversified Income Fund. | |||
| * | Represents a partial list of officers of the Trust. Additional information about all the officers is available in the Funds’ Statement of Additional Information, which can be obtained from Goldman Sachs free of charge by calling this toll-free number (in the United States): 1-800-526-7384. |
| 1 | Information is provided as of October 31, 2020. |
| 2 | Officers hold office at the pleasure of the Board of Trustees or until their successors are duly elected and qualified. Each officer holds comparable positions with certain other companies of which Goldman Sachs, GSAM or an affiliate thereof is the investment adviser, administrator and/or distributor. |
Goldman Sachs Trust — International Equity Insights Funds — Tax Information (Unaudited)
From distributions paid during the year ended October 31, 2020, the total amount of income received by the Emerging Markets Equity Insights, International Equity Insights, and International Small Cap Insights Funds from sources within foreign countries and possessions of the United States was $0.2197, $0.2785, and $0.2568 per share, respectively, all of which is attributable to qualified passive income. The percentage of net investment income dividends paid from foreign sources by the Emerging Markets Equity Insights, International Equity Insights, and International Small Cap Insights Funds were 93.01%, 80.47%, and 58.01%, respectively. The total amount of taxes paid by the Emerging Markets Equity Insights, International Equity Insights and International Small Cap Insights Funds to such countries was $0.0407, $0.0287, and $0.0276 per share, respectively.
For the year ended October 31, 2020, 70.37%, 89.40%, and 60.24% of the dividends paid from net investment company taxable income by the Emerging Markets Equity Insights, International Equity Insights, and International Small Cap Insights Funds, respectively, qualify for the reduced tax rate under the Jobs and Growth Tax Relief and Reconciliation Act of 2003.
94
FUNDS PROFILE
Goldman Sachs Funds
Goldman Sachs is a premier financial services firm, known since 1869 for creating thoughtful and customized investment solutions in complex global markets.
Today, the Consumer and Investment Management Division of Goldman Sachs serves a diverse set of clients worldwide, including private institutions, public entities and individuals. With approximately $1.86 trillion in assets under supervision as of September 30, 2020, Goldman Sachs Asset Management (“GSAM”) has portfolio management teams located around the world and our investment professionals bring firsthand knowledge of local markets to every investment decision. Assets under supervision includes assets under management and other client assets for which Goldman Sachs does not have full discretion. GSAM leverages the resources of Goldman Sachs & Co. LLC subject to legal, internal and regulatory restrictions.
Money Market
Financial Square FundsSM
| ∎ | Financial Square Treasury Solutions Fund1 |
| ∎ | Financial Square Government Fund1 |
| ∎ | Financial Square Money Market Fund2 |
| ∎ | Financial Square Prime Obligations Fund2 |
| ∎ | Financial Square Treasury Instruments Fund1 |
| ∎ | Financial Square Treasury Obligations Fund1 |
| ∎ | Financial Square Federal Instruments Fund1 |
Investor FundsSM
| ∎ | Investor Money Market Fund3 |
| ∎ | Investor Tax-Exempt Money Market Fund3 |
Fixed Income
Short Duration and Government
| ∎ | Enhanced Income Fund |
| ∎ | High Quality Floating Rate Fund |
| ∎ | Short-Term Conservative Income Fund |
| ∎ | Short Duration Government Fund |
| ∎ | Short Duration Income Fund |
| ∎ | Government Income Fund |
| ∎ | Inflation Protected Securities Fund |
Multi-Sector
| ∎ | Bond Fund |
| ∎ | Core Fixed Income Fund |
| ∎ | Global Core Fixed Income Fund4 |
| ∎ | Strategic Income Fund |
| ∎ | Income Fund |
Municipal and Tax-Free
| ∎ | High Yield Municipal Fund |
| ∎ | Dynamic Municipal Income Fund |
| ∎ | Short Duration Tax-Free Fund |
| ∎ | Municipal Income Completion Fund |
Single Sector
| ∎ | Investment Grade Credit Fund |
| ∎ | U.S. Mortgages Fund |
| ∎ | High Yield Fund |
| ∎ | High Yield Floating Rate Fund |
| ∎ | Emerging Markets Debt Fund |
| ∎ | Local Emerging Markets Debt Fund |
Fixed Income Alternatives
| ∎ | Long Short Credit Strategies Fund |
Fundamental Equity
| ∎ | Equity Income Fund |
| ∎ | Small Cap Growth Fund |
| ∎ | Small Cap Value Fund |
| ∎ | Small/Mid Cap Value Fund |
| ∎ | Mid Cap Value Fund |
| ∎ | Large Cap Value Fund |
| ∎ | Focused Value Fund |
| ∎ | Capital Growth Fund |
| ∎ | Strategic Growth Fund |
| ∎ | Small/Mid Cap Growth Fund |
| ∎ | Flexible Cap Fund |
| ∎ | Concentrated Growth Fund |
| ∎ | Technology Opportunities Fund |
| ∎ | Growth Opportunities Fund |
| ∎ | Rising Dividend Growth Fund |
| ∎ | U.S. Equity ESG Fund5 |
| ∎ | Income Builder Fund |
| ∎ | Defensive Equity Fund |
Tax-Advantaged Equity
| ∎ | U.S. Tax-Managed Equity Fund |
| ∎ | International Tax-Managed Equity Fund |
| ∎ | U.S. Equity Dividend and Premium Fund |
| ∎ | International Equity Dividend and Premium Fund |
Equity Insights
| ∎ | Small Cap Equity Insights Fund |
| ∎ | U.S. Equity Insights Fund |
| ∎ | Small Cap Growth Insights Fund |
| ∎ | Large Cap Growth Insights Fund |
| ∎ | Large Cap Value Insights Fund |
| ∎ | Small Cap Value Insights Fund |
| ∎ | International Small Cap Insights Fund |
| ∎ | International Equity Insights Fund |
| ∎ | Emerging Markets Equity Insights Fund |
Fundamental Equity International
| ∎ | International Equity Income Fund |
| ∎ | International Equity ESG Fund |
| ∎ | China Equity Fund6 |
| ∎ | Emerging Markets Equity Fund |
| ∎ | Imprint Emerging Markets Opportunities Fund |
| ∎ | ESG Emerging Markets Equity Fund |
Alternative
| ∎ | Clean Energy Income Fund |
| ∎ | Real Estate Securities Fund |
| ∎ | International Real Estate Securities Fund |
| ∎ | Commodity Strategy Fund |
| ∎ | Global Real Estate Securities Fund |
| ∎ | Alternative Premia Fund |
| ∎ | Absolute Return Tracker Fund |
| ∎ | Managed Futures Strategy Fund |
| ∎ | MLP Energy Infrastructure Fund |
| ∎ | Energy Infrastructure Fund7 |
| ∎ | Multi-Manager Alternatives Fund |
| ∎ | Global Infrastructure Fund |
Total Portfolio Solutions
| ∎ | Global Managed Beta Fund |
| ∎ | Multi-Manager Non-Core Fixed Income Fund |
| ∎ | Multi-Manager U.S. Dynamic Equity Fund |
| ∎ | Multi-Manager Global Equity Fund |
| ∎ | Multi-Manager International Equity Fund |
| ∎ | Tactical Tilt Overlay Fund |
| ∎ | Balanced Strategy Portfolio |
| ∎ | Multi-Manager U.S. Small Cap Equity Fund |
| ∎ | Multi-Manager Real Assets Strategy Fund |
| ∎ | Growth and Income Strategy Portfolio |
| ∎ | Growth Strategy Portfolio |
| ∎ | Dynamic Global Equity Fund |
| ∎ | Satellite Strategies Portfolio |
| ∎ | Enhanced Dividend Global Equity Portfolio |
| ∎ | Tax-Advantaged Global Equity Portfolio |
| ∎ | Strategic Factor Allocation Fund |
| ∎ | Target Date Retirement Portfolio8 |
| ∎ | Target Date 2025 Portfolio |
| ∎ | Target Date 2030 Portfolio |
| ∎ | Target Date 2035 Portfolio |
| ∎ | Target Date 2040 Portfolio |
| ∎ | Target Date 2045 Portfolio |
| ∎ | Target Date 2050 Portfolio |
| ∎ | Target Date 2055 Portfolio |
| ∎ | Target Date 2060 Portfolio |
| ∎ | GQG Partners International Opportunities Fund |
| 1 | You could lose money by investing in the Fund. Although the Fund seeks to preserve the value of your investment at $1.00 per share, it cannot guarantee it will do so. An investment in the Fund is not a deposit of a bank and is not insured or guaranteed by the Federal Deposit Insurance Corporation or any other government agency. The Fund’s sponsor has no legal obligation to provide financial support to the Fund, and you should not expect that the sponsor will provide financial support to the Fund at any time. |
| 2 | You could lose money by investing in the Fund. Because the share price of the Fund will fluctuate, when you sell your shares they may be worth more or less than what you originally paid for them. The Fund may impose a fee upon sale of your shares or may temporarily suspend your ability to sell shares if the Fund’s liquidity falls below required minimums because of market conditions or other factors. An investment in the Fund is not a deposit of a bank and is not insured or guaranteed by the Federal Deposit Insurance Corporation or any other government agency. The Fund’s sponsor has no legal obligation to provide financial support to the Fund, and you should not expect that the sponsor will provide financial support to the Fund at any time. |
| 3 | You could lose money by investing in the Fund. Although the Fund seeks to preserve the value of your investment at $1.00 per share, it cannot guarantee it will do so. The Fund may impose a fee upon sale of your shares or may temporarily suspend your ability to sell shares if the Fund’s liquidity falls below required minimums because of market conditions or other factors. An investment in the Fund is not a deposit of a bank and is not insured or guaranteed by the Federal Deposit Insurance Corporation or any other government agency. The Fund’s sponsor has no legal obligation to provide financial support to the Fund, and you should not expect that the sponsor will provide financial support to the Fund at any time. |
| 4 | Effective after the close of business on April 30, 2020, the Goldman Sachs Global Income Fund was renamed the Goldman Sachs Global Core Fixed Income Fund. |
| 5 | Effective after the close of business on August 30, 2020, the Goldman Sachs Blue Chip Fund was renamed the Goldman Sachs U.S. Equity ESG Fund. |
| 6 | Effective after the close of business on November 20, 2019, the Goldman Sachs Asia Equity Fund was renamed the Goldman Sachs China Equity Fund. |
| 7 | Effective after the close of business on June 26, 2020, the Goldman Sachs MLP & Energy Fund was renamed the Goldman Sachs Energy Infrastructure Fund. |
| 8 | Effective December 27, 2019, the Goldman Sachs Target Date 2020 Portfolio was renamed the Goldman Sachs Target Date Retirement Portfolio. |
| Financial Square FundsSM and Investor FundsSM are registered service marks of Goldman Sachs & Co. LLC. |
| * | This list covers open-end funds only. Please visit our website at www.GSAMFUNDS.com to learn about our closed-end funds and exchange-traded funds. |
TRUSTEES Jessica Palmer, Chair Dwight L. Bush Kathryn A. Cassidy Diana M. Daniels Joaquin Delgado James A. McNamara Roy W. Templin Gregory G. Weaver | OFFICERS James A. McNamara, President Joseph F. DiMaria, Principal Financial Officer, Principal Accounting Officer and Treasurer Caroline L. Kraus, Secretary | |
GOLDMAN SACHS & CO. LLC Distributor and Transfer Agent | GOLDMAN SACHS ASSET MANAGEMENT, L.P. Investment Adviser | |
Visit our Website at www.GSAMFUNDS.com to obtain the most recent month-end returns.
Goldman Sachs Asset Management, L.P., 200 West Street, New York, New York 10282
The reports concerning the Funds included in this shareholder report may contain certain forward-looking statements about the factors that may affect the performance of the Funds in the future. These statements are based on Fund management’s predictions and expectations concerning certain future events and their expected impact on the Funds, such as performance of the economy as a whole and of specific industry sectors, changes in the levels of interest rates, the impact of developing world events, and other factors that may influence the future performance of the Funds. Management believes these forward-looking statements to be reasonable, although they are inherently uncertain and difficult to predict. Actual events may cause adjustments in portfolio management strategies from those currently expected to be employed.
A description of the policies and procedures that the Funds use to determine how to vote proxies relating to portfolio securities and information regarding how a Fund voted proxies relating to portfolio securities during the most recent 12-month period ended June 30 is available (i) without charge, upon request by calling 1-800-526-7384 (for Retail Shareholders) or 1-800-621-2550 (for Institutional Shareholders); and (ii) on the Securities and Exchange Commission web site at http://www.sec.gov.
Economic and market forecasts presented herein reflect a series of assumptions and judgments as of the date of this presentation and are subject to change without notice. These forecasts do not take into account the specific investment objectives, restrictions, tax and financial situation or other needs of any specific client. Actual data will vary and may not be reflected here. These forecasts are subject to high levels of uncertainty that may affect actual performance. Accordingly, these forecasts should be viewed as merely representative of a broad range of possible outcomes. These forecasts are estimated, based on assumptions, and are subject to significant revision and may change materially as economic and market conditions change. Goldman Sachs has no obligation to provide updates or changes to these forecasts. Case studies and examples are for illustrative purposes only.
The Global Industry Classification Standard (GICS) was developed by and is the exclusive property and a service mark of Morgan Stanley Capital International Inc. (MSCI) and Standard & Poor’s, a division of The McGraw-Hill Companies, Inc. (S&P) and is licensed for use by Goldman Sachs. Neither MSCI, S&P nor any other party involved in making or compiling the GICS or any GICS classifications makes any express or implied warranties or representations with respect to such standard or classification (or the results to be obtained by the use thereof), and all such parties hereby expressly disclaim all warranties of originality, accuracy, completeness, merchantability or fitness for a particular purpose with respect to any of such standard or classification. Without limiting any of the foregoing, in no event shall MSCI, S&P, any of their affiliates or any third party involved in making or compiling the GICS or any GICS classifications have any liability for any direct, indirect, special, punitive, consequential or any other damages (including lost profits) even if notified of the possibility of such damages.
The Funds will file their portfolio holdings for each month in a fiscal quarter within 60 days after the end of the relevant fiscal quarter on Form N-PORT. Portfolio holdings information for the third month of each fiscal quarter will be made available on the SEC’s web site at http://www.sec.gov. Portfolio holdings information may be obtained upon request and without charge by calling 1-800-526-7384 (for Retail Shareholders) or 1-800-621-2550 (for Institutional Shareholders).
Fund holdings and allocations shown are unaudited, and may not be representative of current or future investments. Fund holdings and allocations may not include the Fund’s entire investment portfolio, which may change at any time. Fund holdings should not be relied on in making investment decisions and should not be construed as research or investment advice regarding particular securities. Current and future holdings are subject to risk.
The portfolio risk management process includes an effort to monitor and manage risk, but does not imply low risk. Diversification does not protect an investor from market risk and does not ensure a profit.
This material is not authorized for distribution to prospective investors unless preceded or accompanied by a current Prospectus or summary prospectus, if applicable. Investors should consider a Fund’s objective, risks, and charges and expenses, and read the summary prospectus, if available, and/or the Prospectus carefully before investing or sending money. The summary prospectus, if available, and the Prospectus contain this and other information about a Fund and may be obtained from your authorized dealer or from Goldman Sachs & Co. LLC by calling (retail – 1-800-526-7384) (institutional – 1-800-621-2550).
© 2020 Goldman Sachs. All rights reserved. 224223-OTU-1322329 INTINSAR-20
| ITEM 2. | CODE OF ETHICS. |
| (a) | As of the end of the period covered by this report, the registrant has adopted a code of ethics that applies to the registrant’s principal executive officer, principal financial officer, principal accounting officer or controller, or persons performing similar functions, regardless of whether these individuals are employed by the registrant or a third party (the “Code of Ethics”). |
| (b) | Not applicable. |
| (c) | During the period covered by this report, no amendments were made to the provisions of the Code of Ethics. |
| (d) | During the period covered by this report, the registrant did not grant any waivers, including an implicit waiver, from any provision of the Code of Ethics. |
| (e) | Not applicable. |
| (f) | copy of the Code of Ethics is available as provided in Item 13(a)(1) of this report. |
| ITEM 3. | AUDIT COMMITTEE FINANCIAL EXPERT. |
The registrant’s board of trustees has determined that the registrant has at least one “audit committee financial expert” (as defined in Item 3 of Form N-CSR) serving on its audit committee. Gregory G. Weaver is the “audit committee financial expert” and is “independent” (as each term is defined in Item 3 of Form N-CSR). |
| ITEM 4. | PRINCIPAL ACCOUNTANT FEES AND SERVICES. |
Table 1 — Items 4(a) - 4(d). The accountant fees below reflect the aggregate fees billed by all of the Funds of the Goldman Sachs Trust and includes the Goldman Sachs Funds to which this certified shareholder report relates.
| 2020 | 2019 | Description of Services Rendered | ||||||||||
|
|
|
|
| ||||||||
Audit Fees: | ||||||||||||
| • PricewaterhouseCoopers LLP (“PwC”) | $ | 3,805,935 | $ | 4,119,730 | Financial Statement audits. | |||||||
Audit-Related Fees: | ||||||||||||
• PwC | $ | 201,647 | $ | 262,194 | Other attest services. | |||||||
Tax Fees: | ||||||||||||
• PwC | $ | 58,347 | $ | 1,171,431 | Tax compliance services provided in connection with the preparation and review of registrant’s tax returns and certain other tax-related services. | |||||||
Table 2 — Items 4(b)(c) & (d). Non-Audit Services to the Goldman Sachs Trust’s service affiliates * that were pre-approved by the Audit Committee of the Goldman Sachs Trust pursuant to Rule 2-01(c)(7)(ii) of Regulation S-X.
| 2020 | 2019 | Description of Services Rendered | ||||||||||
|
|
|
|
| ||||||||
Audit-Related Fees: | ||||||||||||
• PwC | $ | 2,000,617 | $ | 2,000,617 | Internal control review performed in accordance with Statement on Standards for Attestation Engagements No. 16 and semi annual updates relating to withholding tax accrual for non-US jurisdictions. These fees are borne by the Funds’ Adviser. | |||||||
| * | These include the advisor (excluding sub-advisors) and any entity controlling, controlled by or under common control with the advisor that provides ongoing services to the registrant (hereinafter referred to as “service affiliates”). |
Item 4(e)(1) — Audit Committee Pre-Approval Policies and Procedures
Pre-Approval of Audit and Non-Audit Services Provided to the Funds of the Goldman Sachs Trust. The Audit and Non-Audit Services Pre-Approval Policy (the “Policy”) adopted by the Audit Committee of Goldman Sachs Trust (“GST”) sets forth the procedures and the conditions pursuant to which services performed by an independent auditor for GST may be pre-approved. Services may be pre-approved specifically by the Audit Committee as a whole or, in certain circumstances, by the Audit Committee Chairman or the person designated as the Audit Committee Financial Expert. In addition, subject to specified cost limitations, certain services may be pre-approved under the provisions of the Policy. The Policy provides that the Audit Committee will consider whether the services provided by an independent auditor are consistent with the Securities and Exchange Commission’s rules on auditor independence. The Policy provides for periodic review and pre-approval by the Audit Committee of the services that may be provided by the independent auditor.
De Minimis Waiver. The pre-approval requirements of the Policy may be waived with respect to the provision of non-audit services that are permissible for an independent auditor to perform, provided (1) the aggregate amount of all such services provided constitutes no more than five percent of the total amount of revenues subject to pre-approval that was paid to the independent auditors during the fiscal year in which the services are provided; (2) such services were not recognized by GST at the time of the engagement to be non-audit services; and (3) such services are promptly brought to the attention of the Audit Committee and approved prior to the completion of the audit by the Audit Committee or by one or more members of the Audit Committee to whom authority to grant such approvals has been delegated by the Audit Committee, pursuant to the pre-approval provisions of the Policy.
Pre-Approval of Non-Audit Services Provided to GST’s Investment Advisers. The Policy provides that, in addition to requiring pre-approval of audit and non-audit services provided to GST, the Audit Committee will pre-approve those non-audit services provided to GST’s investment advisers (and entities controlling, controlled by or under common control with the investment advisers that provide ongoing services to GST) where the engagement relates directly to the operations or financial reporting of GST.
Item 4(e)(2) – 0% of the audit-related fees, tax fees and other fees listed in Table 1 were approved by GST’s Audit Committee pursuant to the “de minimis” exception of Rule 2-01(c)(7)(i)(C) of Regulation S-X. In addition, 0% of the non-audit services to the GST’s service affiliates listed in Table 2 were approved by GST’s Audit Committee pursuant to the “de minimis” exception of Rule 2-01(c)(7)(i)(C) of Regulation S-X.
Item 4(f) – Not applicable.
Item 4(g) Aggregate Non-Audit Fees Disclosure
The aggregate non-audit fees billed to GST by PwC for the twelve months ended October 31, 2020 and October 31, 2019 were approximately $259,994 and $1,433,614, respectively. The aggregate non-audit fees billed to GST’s adviser and service affiliates by PwC for non-audit services for the twelve months ended December 31, 2019 and December 31, 2018 were approximately $14.7 million and $12.3 million, respectively. The figures for these entities are not yet available for the twelve months ended December 31, 2020. With regard to the aggregate non-audit fees billed to GST’s adviser and service affiliates, the 2019 and 2018 amounts include fees for non-audit services required to be pre-approved [see Table 2] and fees for non-audit services that did not require pre-approval since they did not directly relate to GST’s operations or financial reporting.
Item 4(h) — GST’s Audit Committee has considered whether the provision of non-audit services to GST’s investment adviser and service affiliates that did not require pre-approval pursuant to paragraph (c)(7)(ii) of Rule 2-01 of Regulation S-X is compatible with maintaining the auditors’ independence.
| ITEM 5. | AUDIT COMMITTEE OF LISTED REGISTRANTS. |
Not applicable. |
| ITEM 6. | SCHEDULE OF INVESTMENTS. |
Schedule of Investments is included as part of the Report to Shareholders filed under Item 1. |
| ITEM 7. | DISCLOSURE OF PROXY VOTING POLICIES AND PROCEDURES FOR CLOSED-END MANAGEMENT INVESTMENT COMPANIES. |
Not applicable. |
| ITEM 8. | PORTFOLIO MANAGERS OF CLOSED-END MANAGEMENT INVESTMENT COMPANIES. |
Not applicable. |
| ITEM 9. | PURCHASES OF EQUITY SECURITIES BY CLOSED-END MANAGEMENT INVESTMENT COMPANY AND AFFILIATED PURCHASERS. |
Not applicable. |
| ITEM 10. | SUBMISSION OF MATTERS TO A VOTE OF SECURITY HOLDERS. |
There have been no material changes to the procedures by which shareholders may recommend nominees to the registrant’s board of trustees. |
| ITEM 11. | CONTROLS AND PROCEDURES. |
| (a) | The registrant’s principal executive and principal financial officers, or persons performing similar functions have concluded that the registrant’s disclosure controls and procedures (as defined in Rule 30a-3(c) under the Investment Company Act of 1940, as amended (the “1940 Act”)) are effective as of a date within 90 days of the filing of this report that includes the disclosure required by this paragraph, based on the evaluation of these controls and procedures required by Rule 30a-3(b) under the 1940 Act and 15d-15(b) under the Securities Exchange Act of 1934, as amended. |
| (b) | There were no changes in the registrant’s internal control over financial reporting (as defined in Rule 30a-3(d) under the 1940 Act) that occurred during the period covered by this report that have materially affected, or are reasonably likely to materially affect, the registrant’s internal control over financial reporting. |
| ITEM 12. | DISCLOSURE OF SECURITIES LENDING ACTIVITIES FOR CLOSED-END MANAGEMENT INVESTMENT COMPANIES |
Not applicable. |
| ITEM 13. | EXHIBITS. |
| (a)(1) | Goldman Sachs Trust’s Code of Ethics for Principal Executive and Senior Financial Officers is incorporated by reference to Exhibit 13(a)(1) of the registrant’s Form N-CSR filed on May 5, 2020. | |||
| (a)(2) | Exhibit 99.CERT | Certifications pursuant to Section 302 of the Sarbanes-Oxley Act of 2002 filed herewith. | ||
| (a)(3) | Not applicable to open-end investment companies. | |||
| (a)(4) | There was no change in the registrant’s independent public accountant for the period covered by this report. | |||
| (b) | Exhibit 99.906CERT | Certifications pursuant to Section 906 of the Sarbanes-Oxley Act of 2002 filed herewith. | ||
SIGNATURES
Pursuant to the requirements of the Securities Exchange Act of 1934 and the Investment Company Act of 1940, the registrant has duly caused this report to be signed on its behalf by the undersigned, thereunto duly authorized.
| Goldman Sachs Trust | ||
| By: | /s/ James A. McNamara | |
| ||
James A. McNamara | ||
| President/Chief Executive Officer | ||
| Goldman Sachs Trust | ||
| Date: | January 7, 2021 | |
Pursuant to the requirements of the Securities Exchange Act of 1934 and the Investment Company Act of 1940, this report has been signed below by the following persons on behalf of the registrant and in the capacities and on the dates indicated.
| By: | /s/ James A. McNamara | |
| ||
James A. McNamara | ||
| President/Chief Executive Officer | ||
| Goldman Sachs Trust | ||
| Date: | January 7, 2021 | |
| By: | /s/ Joseph F. DiMaria | |
| ||
Joseph F. DiMaria | ||
| Principal Financial Officer | ||
| Goldman Sachs Trust | ||
| Date: | January 7, 2021 | |